


Abstract
Dissolved oxygen (DO) remaining in radioactive waste repositories after backfilling is expected to be consumed by Fe(II)-bearing geological media, limiting redox-sensitive radionuclide migration into groundwater. However, DO consumption rates have been primarily evaluated using crushed samples, with limited research on intact rock samples comprising Fe(II)-bearing primary and clay minerals. To address this limitation, this study developed a simple experimental apparatus using a non-consumptive luminescence-based oxygen sensor that enables high-precision DO measurements with minimal artifacts. For validation, DO diffusion and consumption experiments were conducted using Kimachi tuffaceous sandstone (Japan) (porosity, 21.2%; smectite content, 29 wt.%) to evaluate the swelling effect of smectite. In this laboratory-scale study, the newly obtained rate constant was (6.55 ± 7.52) × 10−3 L mol−1 s−1, which was comparable to previously reported values of (1.57 ± 4.05) × 10−3 L mol−1 s−1. This result provides empirical support for the previously proposed mechanism that smectite swelling, which could potentially alter DO consumption, is constrained by the rigid rock structure, thereby maintaining a consumption rate similar to that of other Fe(II)-bearing geological media. Furthermore, by integrating previous findings indicating that effective DO diffusion coefficients (3.2 × 10⁻¹² to 2.3 × 10⁻⁹ m2 s−1) depend on geological media porosity (21.2%–81.5%), these empirical laboratory parameters can be used to model and predict the transition from oxic to anoxic conditions in full-scale geological repository systems.
1. Introduction
After the closure of radioactive waste repositories, the fate of atmospheric oxygen is a key factor in overall safety because it influences redox conditions. Under oxic conditions induced by atmospheric oxygen intrusion, certain redox-sensitive radionuclides exhibit high solubility and mobility. Conversely, reducing conditions decrease their solubility, thus limiting their mobility [1]. Backfilling a repository causes oxygen trapped underground to dissolve into groundwater. This dissolved oxygen (DO) then diffuses from the repository into the surrounding rock, where it is eventually consumed by reducing agents, namely Fe(II)-bearing minerals, which exist in nearly all crystalline and sedimentary rocks [2] considered as potential geological repositories. This underscores the need to investigate the fate of DO consumed by Fe(II)-bearing minerals in repository environments.
DO consumption by Fe(II)-bearing minerals or rocks has been investigated using crushed [3,4,5,6,7,8,9,10,11,12,13,14,15] and block samples [5,13,16,17]. However, studies using block samples remain limited, particularly for rocks containing Fe(II)-bearing primary and clay minerals. Powder sample-based experiments have shown that clay swelling and dispersion can alter the number of available Fe(II) sites for DO consumption, thereby affecting the rate constants for Fe(II)-bearing geologic media [13]. Therefore, experiments using intact rocks are necessary to more comprehensively evaluate DO consumption. In addition, conventional electrochemical techniques for DO measurements in closed systems face limitations such as junction leakage caused by apparatus complexity [15], underscoring technical issues that must be addressed.
To overcome potential leakage and intrusion issues, this study developed an experimental apparatus with a simplified diffusion–consumption cell design for intact rock samples by reducing the number of components and joints. A luminescence-based DO measurement system that enables non-consumptive DO monitoring was employed to avoid disturbing the reaction field. This enabled the determination of the DO consumption rate constant and effective diffusion coefficient in rocks with Fe(II)-bearing minerals with minimal artifacts. Using the above experimental system, validation experiments were performed for intact Kimachi tuffaceous sandstone samples using one-dimensional (1–D) DO reactive transport to simultaneously evaluate the DO consumption rate and diffusion coefficient. This highly porous and weatherable rock was selected because its Fe(II)-bearing mineral content provided a suitable medium for evaluating the reactive transport of DO. The obtained rate constant was consistent with previously reported rate values. Excluding the coefficients obtained in this study, reported data indicate that the effective diffusion coefficients of DO in geological media correlate with porosity. These findings enable the transport modeling of the transition from oxic to anoxic conditions in geological formations, providing valuable insights into the fate of atmospheric oxygen after repository closure. In geological formations, oxic conditions may offer certain advantages for iron passivation; however, they also induce the rapid degradation and alteration of engineered barriers as well as increased radionuclide mobility. Conversely, while anoxic conditions suppress barrier degradation and are expected to decrease radionuclide solubility and enhance sorption, they also entail the risk of pressure buildup within the engineered barriers due to gas generation, such as that resulting from metal corrosion.
However, the broader applicability of the proposed reactive transport model must be evaluated in light of environmental variations in deep geological settings. Specifically, fluctuations in temperature, groundwater chemistry (e.g., pH, ionic strength, and competing redox-active species), mineralogical heterogeneity within the rock matrix, and temporal/spatial variations in initial oxygen concentrations can significantly alter both the DO consumption rate constant and the effective diffusion coefficient of DO. Integrating these variable boundary and thermodynamic conditions into the model is essential for accurately predicting long-term redox transitions and evaluating the reliability of engineered barrier systems.
2. Materials and Methods
2.1. DO Diffusion–Consumption Experiments on Intact Sandstone Cores
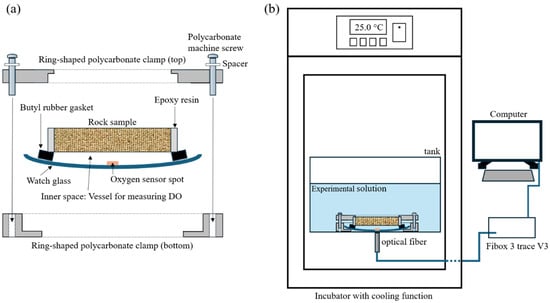
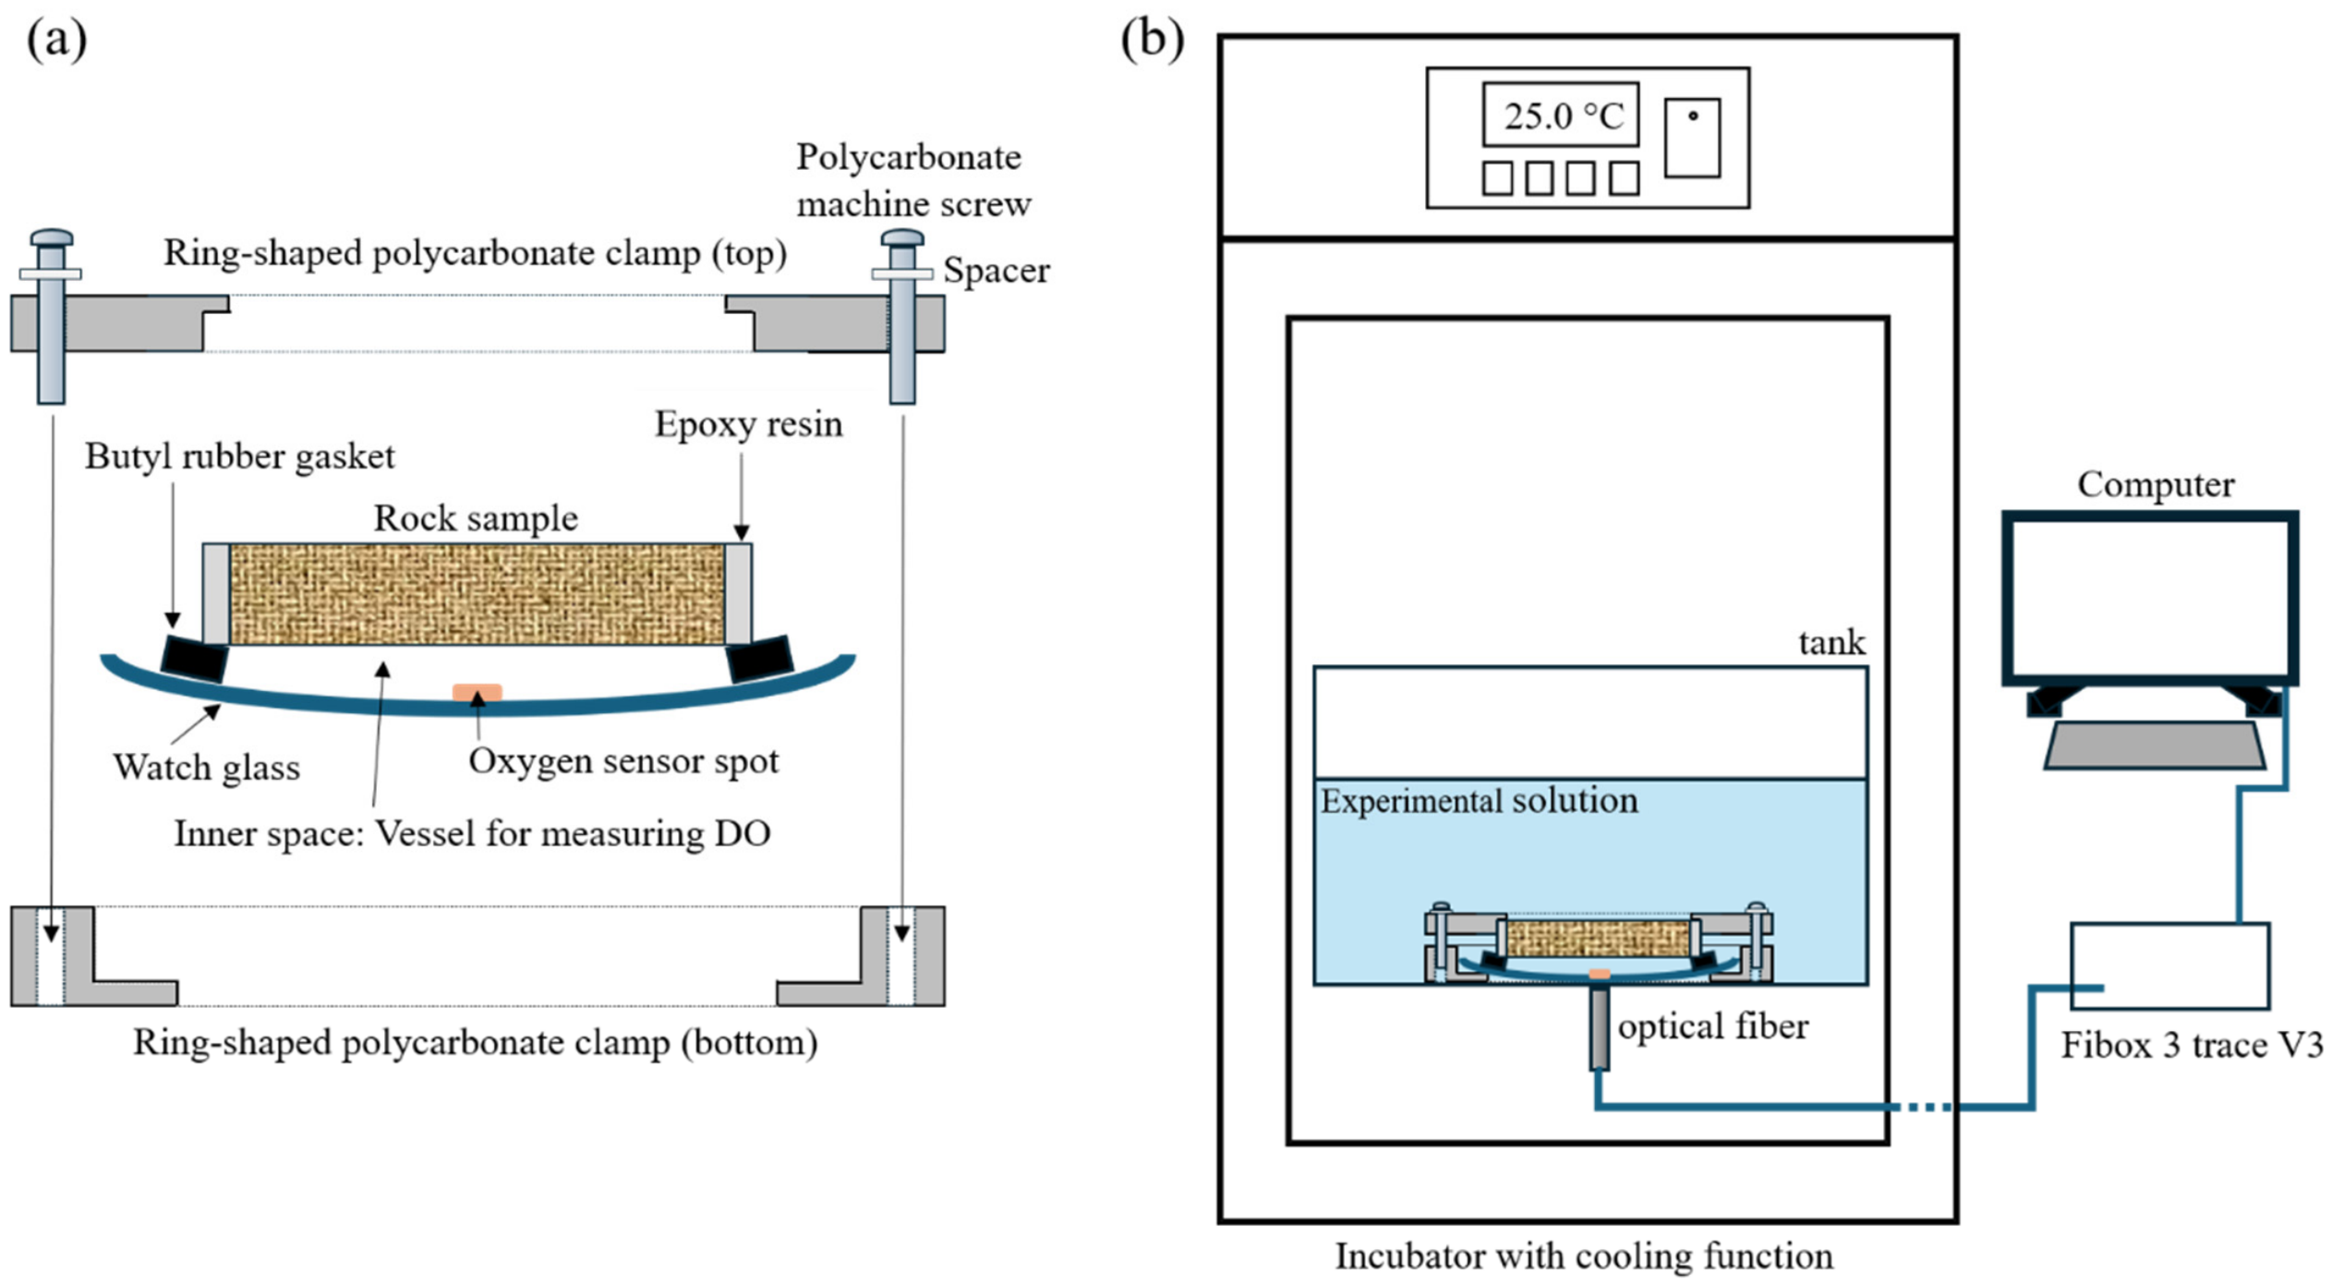
Figure 1 shows the experimental setup for evaluating DO diffusion and consumption in an intact sandstone sample. The system consists of a diffusion–consumption cell, an air-saturated water tank with a constant DO concentration, a data acquisition system, and an incubator accommodating the cell and tank. The diffusion–consumption cell comprises a watch glass, a disc-shaped sample with resin-coated sides, and ring-shaped polycarbonate clamps. The cell has a 2 mm thick butyl rubber gasket to prevent content leakage and intrusion from the tank. The inner space enclosed by the watch glass and disc-shaped sample serves as the DO measurement vessel, with a volume of 8.37 mL.
Figure 1.
Schematic illustration of the experimental setup for measuring dissolved oxygen (DO) diffusion and consumption in Kimachi sandstone: (a) Diffusion–consumption cell assembly. (b) Experimental setup for diffusion–consumption experiment.
Disc-shaped samples were prepared as follows: A cylindrical sample (diameter: 50 mm; height: 100 mm) was cored from a sandstone block, cut to a height of 80 mm, and its entire surface was coated with epoxy resin (Araldite Rapid, Huntsman Japan, Kobe, Japan). The coated sample was placed at the center of an acrylic pipe (inner diameter: 55 mm; height: 90 mm), and the gap between the pipe and sample was filled with another epoxy resin (Crystal Resin NEO, NISSIN RESIN Co., Ltd., Yokohama, Japan). After curing, the resin-filled pipe was cut into 10 mm thick discs, and one of these discs with sides coated with Crystal Resin NEO was extracted for the 1-D DO reactive transport experiment.
The pore spaces of the sandstone sample and the diffusion–consumption cell were filled with a low-DO solution via vacuum impregnation. The low-DO solution was prepared by bubbling N2 gas through the solution. After impregnation, a disk-shaped acrylic cap was placed on the sample and submerged in water to prevent pore water leakage during setup. The diffusion–consumption cell was then placed at the base of the constant-DO tank. During the experimental period, the tank DO concentration was maintained at a constant level through continuous gentle aeration. After the setup, the acrylic cap was removed, and DO measurements were initiated simultaneously.
A single experiment was performed as follows: The DO concentration in the vessel was monitored using a Fibox 3 trace V3 system with a 2 mm polymer optical fiber and a PSt3 oxygen sensor spot (PreSens Precision Sensing GmbH, Regensburg, Germany). The measurement principle is based on oxygen-induced luminescence quenching. Upon excitation at a defined wavelength through the fiber, the oxygen sensor spot, composed of a fluorescent material, emits a signal whose intensity and duration decrease as the oxygen concentration increases, enabling precise determination of the oxygen concentration from the measured signal changes. Prior to the experiment, the sensor spot was attached to the inner bottom of the watch glass using a silicone adhesive sealant (TSE382C; Momentive Performance Materials Japan, Tokyo, Japan). During the experiment, a fiber connected to the Fibox 3 trace V3 system was aligned with the sensor spot outside the tank. The DO was monitored until the concentration stabilized. The water tank temperature inside the incubator was measured using the system’s built-in temperature sensor and maintained at 25 ± 0.2 °C throughout the experiment. All experiments were conducted at a constant atmospheric pressure of 1 atm, assuming that the effects of pressure fluctuations on gas solubility and the diffusion coefficient are negligible within the scope of this study.
A weakly alkaline solution (initial pH: 9.3) was used to simulate the chemical environment of radioactive waste repositories, using bentonite as the candidate buffer material. The solution was buffered with a mixture of sodium bicarbonate (NaHCO3) and sodium carbonate (Na2CO3) and then air-saturated by bubbling with air for >24 h. The solution pH in the tank was measured before and after the experiment using a pH meter (LAQUAtwin-pH-33B; HORIBA, Kyoto, Japan) calibrated using standard buffer solutions (pH: 6.86 and 10.0 at 25 °C), with a measurement precision of ±0.01 pH units.
Two types of blank experiments were conducted using the same procedure but replacing the sandstone sample with an acrylic disc (diameter: 55 mm; thickness: 10 mm). In the first blank experiment, in which the DO concentration was low, the initial DO concentration of 2.00 × 10⁻⁴ mol L−1 decreased to 1.99 × 10⁻⁴ mol L−1 after 9 d and 1.97 × 10⁻⁴ mol L−1 after 18 d, indicating negligible leakage. In the second blank experiment, an air-saturated buffer solution and an acrylic disc were used. Here, the initial DO concentration of 2.55 × 10⁻⁴ mol L−1 changed to 2.56 × 10⁻⁴ mol L−1 after 4 d and 2.54 × 10⁻⁴ mol L−1 after 7 d. This confirmed that the experimental materials, including the watch glass, butyl rubber, sealant, and sensor spots, did not contribute to DO consumption. Therefore, the DO diffusion–consumption experiment was performed with negligible experimental artifacts.
2.2. Kimachi Sandstone Sample Characterization and Preparation
For the validation experiments, Kimachi sandstone, a Miocene tuffaceous sandstone from Shimane Prefecture, Japan [18], was selected as the model rock because of its relatively high porosity and abundance of Fe(II)-bearing minerals such as amphibole, pyroxene, and smectite [18,19,20]. Its high porosity makes it susceptible to weathering, enabling the acquisition of kinetic data within laboratory timescales. Notably, the presence of smectite provides an opportunity to investigate the inherent behavior of clay minerals during DO consumption [13,14]. Specifically, the Kimachi sandstone block used in this study was light yellowish-brown, indicating moderate weathering, and the fresh sandstone samples were greenish gray. In general, Kimachi sandstone is characterized by a dense and uniform grain structure, which supports high experimental reproducibility. Consequently, it has been widely used as a standard rock sample in petrophysical research investigating the permeability of deep underground formations and the effects of stress-induced changes in pore structure [19].
All characterizations and analyses in this study were performed on subsamples prepared from a single sandstone core sample. The porosity, dry bulk density, and pore area of the sandstone sample were determined using the mercury intrusion method (Autopore V 9620, Micromeritics, Norcross, GA, USA), measuring 21.2 ± 0.4%, 2 ± 0 g cm−3, and 7.0 ± 0.5 m2 g−1, respectively. Measurements were performed on five independent subsamples (n = 5) at a confidence level of 95%. In addition, the intrinsic permeability and effective NaCl diffusion coefficient were determined using another subsample (n = 1), yielding values of 6.32 × 10⁻¹⁸ m2 and 1.55 × 10⁻¹¹ m2 s−1, respectively, according to the method described in [21]. Following these characterizations, the subsamples were crushed and powdered for X-ray powder diffraction and whole-rock analyses.
The bulk-rock powder and clay fractions were analyzed using an X-ray powder diffractometer (RINT2500, Rigaku, Tokyo, Japan) at GSJ-Lab, AIST, with monochromatic CuKα radiation operated at 40 kV and 100 mA; the step size was 0.02°, and the scan speed was 2° min−1 (bulk sample) or 1° min−1 (clay fraction). The oriented aggregates of the <2 μm clay fraction were separated according to Stokes’ law and prepared following a previous study [22]. Clay minerals were identified by analyzing the d-spacing expansion and/or contraction observed between air-dried and ethylene glycol-solvated specimens. The sandstone sample comprised plagioclase, smectite, heulandite, clinoptilolite, and quartz, consistent with previously reported compositions [19,20].
The powdered sample was digested with a nitric–perchloric–hydrofluoric acid mixture, and the major elemental components, except SiO2 and FeO, were determined using inductively coupled plasma–atomic emission spectrometry (Thermo iCAP 6300 Duo; Thermo Fisher Scientific K.K., Tokyo, Japan). The SiO2 content was determined by a combination of gravimetry and inductively coupled plasma–atomic emission spectrometry, and the FeO content was determined via titration with potassium dichromate. The sample was 58.38 wt.% SiO2, 0.66 wt.% TiO2, 0.118 wt.% MnO, 2.42 wt.% MgO, 4.85 wt.% CaO, 3.65 wt.% Na2O, 1.45 wt.% K2O, 0.152 wt.% P2O5, 1.02 wt.% FeO, and 5.18 wt.% Fe2O3. The analytical uncertainty was <0.5% (SiO2 < 0.01%, FeO < 0.00%), and the loss on ignition was 6.84 wt.%.
The sandstone mineralogy was determined by combining whole-rock geochemical data with X-ray diffraction analysis, based on the normative calculations described in [23]. The constituent minerals were plagioclase (33 wt.%), smectite (29 wt.%), heulandite–clinoptilolite (19 wt.%), and quartz (3 wt.%). The total surface Fe(II) site concentration was estimated by multiplying four parameters: (i) surface site density (2.31 sites nm−2) [10,24]; (ii) fractional Fe(II) content; (iii) total surface area; and (iv) the reciprocal of the pore-filled solution volume. Considering measurement uncertainty, the initial total Fe(II) surface site concentration (ST) of the sandstone sample was estimated to be (2.01 ± 0.17) × 10−3 mol L−1. These surface Fe(II) sites can be progressively depleted through oxidation reactions with DO in the pore fluid.
2.3. Analytical Model for DO Diffusion–Consumption
The oxidation of Fe(II)-bearing silicates by DO has been attributed to electron transfer reactions [3,4]. This can be described as a stoichiometric surface reaction in which O2 is reduced to H2O.
where M is a cation of charge z, and [Fe2+, 1/zMz+] and [Fe3+] refer to the structural Fe at the mineral surface reacting with aqueous species. Wehrli [25] reviewed the redox reactions at mineral surfaces to interpret the oxidation rates of dissolved and adsorbed Fe(II) species and developed a second-order rate law:
where C is the DO concentration per unit volume of pore water (mol L−1) at time t (s), k is the second-order rate constant (L mol−1 s−1), and S is the concentration of unreacted Fe(II) sites on the mineral surface, expressed per unit volume of pore water (mol L−1) at time t (s). Although Equation (2) assumes a first-order dependence on Fe and O without explicitly treating proton concentration as a limiting parameter, Equation (1) shows that protons affect the oxygen consumption reaction. Because the proton concentration is buffered in this system, it can be considered constant; therefore, Equation (2) remains applicable, with the proton contribution incorporated into the apparent rate constant. Analogous to the DO time-series behavior, the partial derivative of S with respect to t (∂S/∂t) was modeled as a function of k, S, and C, based on the dependence of S on both the S and C concentrations in an open system with respect to DO, as follows:
where the coefficient of 4 is determined by the stoichiometric ratio of [Fe2+, 1/zMz+] to O2 (4:1) in Equation (1). Furthermore, if S decreases to zero and Equation (1) is the sole driver of DO consumption, the reaction ceases, causing the DO concentration to increase from its current level to the air-saturated concentration.
In this study, the reaction kinetic law from Equation (2) is incorporated into the 1-D DO reactive transport equation. To ensure rigorous consistency in the dominant mass balance, all transport and reaction terms are formulated on the basis of a unit bulk volume of the sandstone sample. Because both C and S are expressed per unit volume of pore water, the total amounts of these species per unit bulk volume of the porous medium are represented as εC and εS, respectively, where ε denotes the porosity of the sandstone. The effective diffusion coefficient of DO, De (m2 s−1), is defined with respect to the gross bulk cross-sectional area, implicitly incorporating physical constraints of the pore network, such as tortuosity and porosity.
By applying the conservation of mass within a representative elementary volume, the 1-D reactive transport equation for DO and the solid-phase reaction kinetic equation are consistently expressed on a unit bulk volume basis as
Assuming that the porosity ε remains constant over time and is uniform throughout the space, dividing both sides of Equation (5) by ε yields the final governing equation for the solid phase:
where the coordinate x (m) represents the distance from the DO source within a sample of thickness L (m) (0 < x < L, t > 0). The DO concentration in the pore water, C(x,t) (mol L−1), and the concentration of unreacted Fe(II) sites on the mineral surface, S(x,t) (mol L−1), are both defined as a function of the distance x and time t.
During the experiments, one surface of the sample was exposed to an air-saturated solution, which was modeled as a boundary condition:
where C0 is the DO concentration at saturation. DO diffuses through the sandstone sample and accumulates in the vessel over time; thus, the concentration at the opposite boundary is a time-dependent function:
where Cm(t) is the time-varying DO concentration (mol m−3) in the vessel, which evolves according to the cumulative diffusive flux entering from the sample over time. The initial DO concentration in the sample was assumed to match that of the low-DO solution condition, as it was impregnated during setup.
where Ci is the initial DO concentration (mol m−3) in the pore water. The initial S concentration in the sample is assumed to be ST.
The governing equations (Equations (4)–(10)) were numerically solved using the finite element method to obtain the temporal DO concentration distribution within the sample.
2.4. Experimental Data Interpretation
In the diffusion–consumption experiments, the measured quantity was the DO concentration, which represents temporal variation in the measurement cell. For interpretation, this study adopted a nonlinear least squares regression analysis using the following expression:
where Ssq is the sum of the squares of the weighted residuals between the measured and calculated data (Yi* and Yi, respectively), p is the vector of the parameters to be identified, wi is the standard deviation of the i-th measurement data point, and M is the number of measured data points. The parameters to be identified were De and k. The uncertainties reported with the parameter estimates represent the 95% confidence intervals derived from the covariance matrix of the nonlinear least-squares fit.
3. Results and Discussion
3.1. Evaluation of the Experimental Method
Oxygen intrusion is a crucial and often underestimated factor affecting the determination of DO diffusion and consumption kinetics in intact rocks containing Fe(II)-bearing minerals. In the DO diffusion and/or consumption experiments, atmospheric oxygen intrusion into the system can artificially increase the DO concentration, complicating data interpretation. In this study, this was minimized by employing a simplified diffusion–consumption cell with a reduced number of components and joints, as evidenced by the blank experiment conducted using a low-DO solution demonstrating negligible leakage. This validates the assumption that temporal changes in DO concentration were primarily attributable to diffusion and consumption within the rock samples.
The use of conventional electrochemical electrodes for DO measurements, which consume DO during operation, may decrease the solution DO concentration [11]. This can lead to the overestimation of the kinetic parameters for both DO consumption and diffusion. To prevent this effect, this study used a non-consumptive luminescence-based DO sensor. A second blank experiment using an air-saturated DO solution indicated negligible oxygen intrusion, helping minimize the artificial decrease in DO concentration caused by experimental components (i.e., watch glass, butyl rubber, sealant, and sensor spot). Therefore, the DO concentration measurements generally satisfied the assumptions mentioned above.
Temperature fluctuations can also complicate the interpretation of experimental data because kinetic parameters vary significantly with changes in temperature [1]. In this study, the ambient temperature fluctuations were minimized by immersing the diffusion–consumption cell in a constant-DO water tank within an incubator. This mitigated the effects of temperature variations on DO measurements, thereby ensuring the isothermal assumptions required by the analytical solutions.
The analytical solutions for the diffusion–consumption experiment initially required four unknown parameters: ε, De, k, and S. Measurements of ε and S from petrophysical characterization and whole-rock chemistry, respectively, reduced the parameter estimation to De and k. In this study, the value of ε was set to 0.212. Given that the estimated S (2.01 × 10⁻³ mol L−1) is applicable only for intact rock samples [13], the proposed experimental and analytical framework provides a viable approach for determining De and k for modeling DO diffusion and consumption in sedimentary rocks.
3.2. Diffusion and Consumption of DO in Kimachi Sandstone
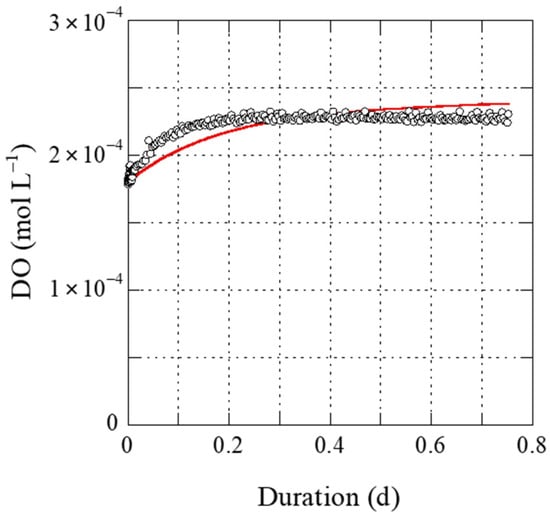
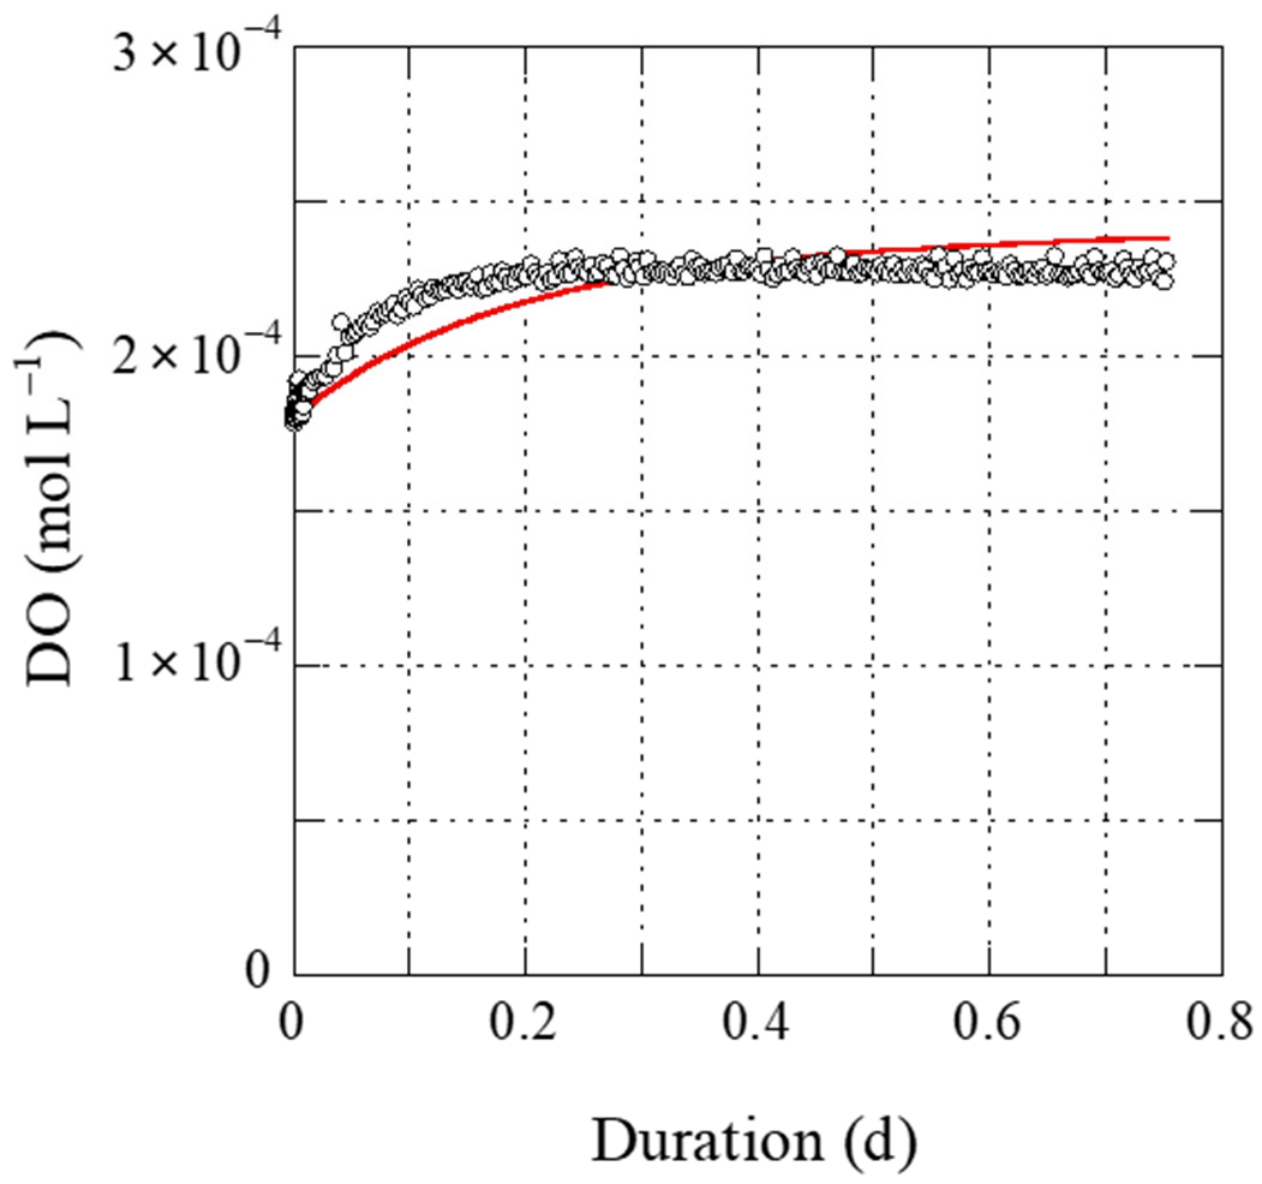
Upon retrieval of the diffusion–consumption cell at the end of the experiment, an air bubble was observed in the vessel, indicating that vacuum impregnation did not completely replace air with water. Nevertheless, DO concentration was successfully monitored. Figure 2 shows the change in DO concentration diffusing through the intact Kimachi sandstone sample, exhibiting a breakthrough profile before reaching a constant value after approximately 6 h. Note that the pH of the tank solution remained unchanged at approximately 9.3, owing to the carbonate buffer effect, with the final pH of the vessel solution being identical to that in the tank.
Figure 2.
Time-dependent concentration changes of DO diffusing through an intact Kimachi sandstone sample. Symbols and the solid line represent measured data and the fitted curve, respectively.
Figure 2 shows the fitted curve derived from Equations (4) and (5), which agrees well with the measured DO concentration. The parameter estimation was performed through a systematic manual grid search by iteratively executing the forward simulation in MATLAB (R2014a, The MathWorks, Inc., Natick, MA, USA) across a range of trial diffusion coefficients. For each iteration, the time-dependent DO profile was simulated using the pdepe solver, which dynamically controls the time-step sizes governed by its default convergence criteria (a relative error tolerance of 1.0 × 10⁻³ and an absolute error tolerance of 1.0 × 10⁻⁶). Uniform weighting was applied across all experimental data points. The optimal parameter values were determined by identifying the specific configuration that minimized the standard error between the simulated and measured values. Initial parameter estimates were selected based on the order of magnitude of the expected physical values (e.g., De = 1.0 × 10⁻⁹ m2 s−1 and k = 1.0 × 10⁻³ L mol−1 s−1).
The estimated De was (2.32 ± 0.84) × 10−9 m2 s−1 and k was (6.55 ± 7.52) × 10−3 L mol−1 s−1, corresponding mathematically to a 95% confidence interval ranging from −0.97 × 10⁻³ to 14.07 × 10⁻³ L mol−1 s−1. Note that although the mathematical lower bound extends into negative values because of parameter uncertainty, k is physically non-negative. However, these two parameters exhibited relatively large 95% confidence intervals. These confidence intervals were derived from the covariance matrix obtained through nonlinear least-squares regression, in which the experimental uncertainties (i.e., dissolved oxygen sensor precision and time-series sampling deviations) were propagated into the parameter estimates.
This can be attributed to two reasons. First, the two parameters exhibited a strong interdependency in the analytical solutions of Equations (4) and (5), as indicated by a near-perfect correlation coefficient (r = 0.982) and a cross-covariance (1.55 × 10⁻¹² m2 L mol−1 s−2). Because of this strong parameter trade-off, it was mathematically difficult to identify both parameters uniquely and independently using only the available transient DO concentration data; hence, the fitted value of k is highly sensitive to and strongly dependent on the estimated value of De or the assumptions made about De. This parameter trade-off arises because both diffusion (governed by De) and consumption (governed by k) simultaneously influence the breakthrough time and the slope of the DO concentration curve. Second, residual air bubbles in the DO measuring vessel likely caused deviations from the assumptions of the proposed analytical model, thereby increasing the residual sum of squares and the resulting parameter uncertainties. Note that the volume of these residual air bubbles was neither measured nor estimated quantitatively during the experiment; the bubbles were only visually confirmed upon retrieval. Consequently, their potential contribution to dissolved oxygen dynamics could not be rigorously quantified. Physically, the presence of these bubbles alters the mass balance and the boundary conditions assumed in the model. Specifically, gas–liquid phase partitioning (i.e., oxygen dissolution from or stripping into the bubbles) introduces an unmodeled source/sink term into the vessel’s mass balance. Furthermore, if bubbles were attached to the sandstone outlet or the sensor surface, they would disrupt the assumption of a spatially uniform boundary condition and reduce the effective solution volume, leading to local deviations of the DO concentration profile from the ideal analytical solution.
Despite these artifacts and the resulting wide confidence intervals, the fitted rate constant (k) is considered to provide a meaningful estimate. First, the chemical environment governing the oxygen consumption reaction was highly stable, as evidenced by the unchanged pH (approximately 9.3) maintained by the carbonate buffering effect throughout the experiment. Second, the observed DO concentration reached a constant, steady-state value after approximately 6 h. In this steady-state regime, the DO profile is predominantly governed by the balance between the diffusion rate and the consumption rate, thereby minimizing the transient perturbations caused by the residual air bubbles. Furthermore, as discussed in detail in Section 3.4, the estimated k value is in excellent agreement with previously reported values for similar sandstone conditions, suggesting that the experimental artifact did not fundamentally alter the underlying reaction kinetics.
Nevertheless, the authors acknowledge that the inability to completely eliminate residual air bubbles represents a technical limitation of the current experimental setup. Because additional experiments using a bubble-free vessel were not feasible within the scope of this study, the quantitative impact of this artifact on the transient dissolution kinetics remains a source of uncertainty. Therefore, although the measured DO concentration profiles provide a reasonable approximation of the breakthrough behavior and steady-state consumption kinetics, the reported parameter values, which have wide confidence intervals, should be interpreted with caution. Future investigations using improved vacuum impregnation and fluid-delivery systems are required to prevent bubble formation completely and further refine the precision of the diffusion and consumption parameters.
3.3. Comparison of Effective DO Diffusion Coefficient (De)
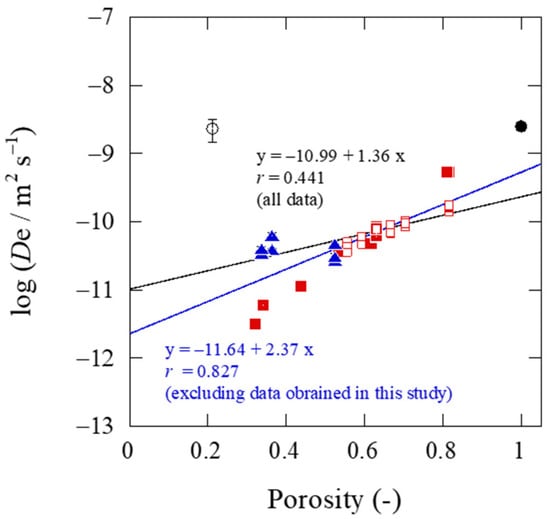
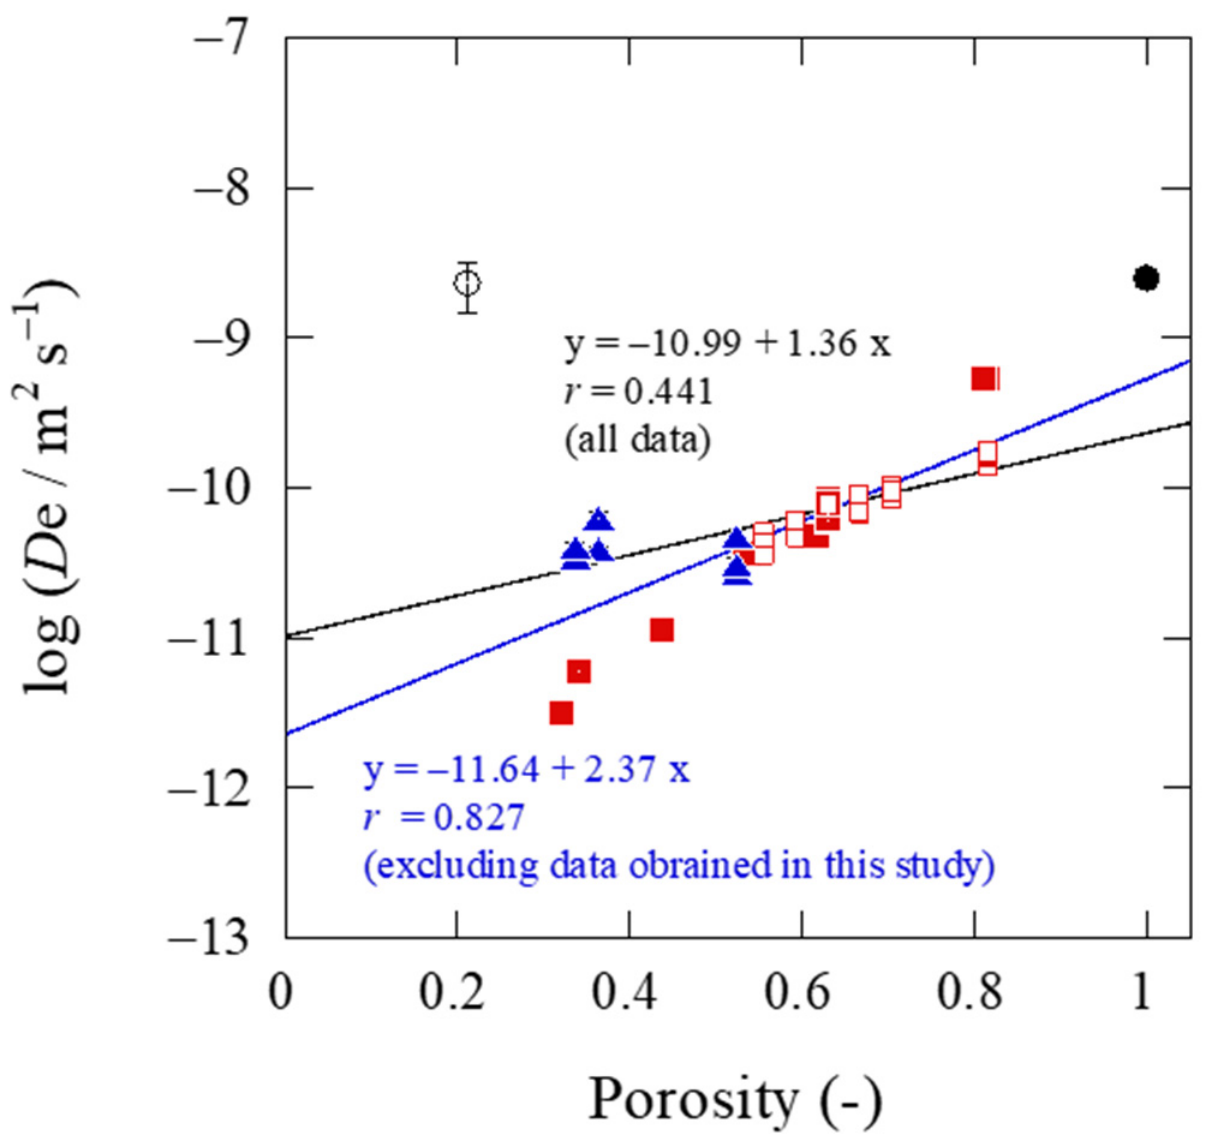
Figure 3 compares the effective DO diffusion coefficients obtained in this study with previously reported values. The results demonstrated a significant positive correlation (n = 50, r = 0.441, p < 0.01), indicating that the DO diffusion coefficient increased with porosity. However, one data point deviated significantly from the black regression line, which was attributable to air bubbles present in the measurement vessel. Because oxygen from any existing bubble can rapidly dissolve into the liquid, its presence inadvertently alters the overall DO concentration. This caused the estimated De to approach the DO diffusion coefficient in free water (2.50 × 10⁻⁹ m2 s−1) [26,27].
Figure 3.
Relationships between the effective diffusion coefficient of DO and the porosity of geological media. The effective diffusion coefficients (De; m2 s−1) of DO are shown by the symbols: red squares represent compacted purified sodium bentonite (closed, [7]; open, [8]), and triangles represent Mizunami sedimentary rocks [13]. The open circle represents Kimachi sandstone (this study), for which the value was determined by fitting Equations (4) and (5) to the experimental data (Figure 2). The solid black circle represents the diffusion coefficient of DO in free water [26,27]. Error bars represent 2σ uncertainty (approximately 95% confidence interval).
The relationship between the De values and porosity was re-evaluated using only available literature data (n = 49, r = 0.827, p < 0.001), intentionally excluding the datasets obtained in this study. This exclusion was justified by two distinct statistical and physical considerations to ensure independent validation of the trend. First, this approach established a robust, unbiased baseline derived solely from external literature and entirely independent of the experimental parameters obtained in this study. Second, separating the two datasets allowed for a rigorous evaluation of the reliability of the experimental data against this independent benchmark. The results showed that the experimental value obtained in this study deviated significantly from the literature-derived blue regression line by approximately three orders of magnitude. This substantial discrepancy did not invalidate the literature trend but instead provided a statistical justification for excluding the experimental data point. This finding indicated that the specific data point was an extreme outlier, potentially affected by the aforementioned experimental artifact: the unintended trapping of air bubbles on and near the rock surface inside the measurement cell.
Physically, the diffusion coefficient of oxygen in the gas phase (approximately 2 × 10⁻⁵ m2 s−1) [28] is approximately four orders of magnitude higher than that in the aqueous phase (approximately 2 × 10⁻⁹ m2 s−1). When these residual air bubbles adhered to the rock–fluid interface, they replaced the liquid boundary layer with a highly diffusive gas phase. This localized shortcut substantially reduced mass-transfer resistance at the rock entry and accelerated the overall oxygen flux into the measurement domain. Because the parameter estimation algorithm assumes a uniform liquid-phase boundary layer on the rock surface, it mathematically misinterpreted this anomalous, gas-enhanced flux as evidence of intrinsically high permeability of the rock matrix. Consequently, this interface-specific artifact artificially inflated the estimated De value by approximately three orders of magnitude, rendering it unsuitable for representing the rock’s true transport properties. Thus, the independent literature model served as a critical diagnostic tool for distinguishing the artifact-affected data point from the underlying physical relationship.
Using this modified regression, the De for the Kimachi sandstone sample was estimated to be 7.28 × 10⁻¹² m2 s−1. To provide a mathematically complete constraint that accounts for both parameter-estimation uncertainty and material-specific heterogeneity, the evaluation was extended from the regression confidence interval to the 95% prediction interval. While the 95% confidence interval (3.36 × 10⁻¹² to 1.58 × 10⁻¹¹ m2 s−1) bounds the mean regression curve, the 95% prediction interval (2.50 × 10⁻¹² to 2.12 × 10⁻¹¹ m2 s−1) incorporates the inherent data scatter and microstructural variability characteristic of Kimachi sandstone, including high porosity and pore-network tortuosity, thereby providing a physically and statistically robust constraint for literature-based predictions.
It should be noted, however, that although the modified regression model demonstrates a strong baseline correlation between porosity and De, porosity alone cannot fully account for the gas diffusion coefficient because of the structural and compositional heterogeneity inherent in geological media. Specifically, variations in mineral composition can alter pore-surface properties and grain-size distribution, which in turn influence gas–solid interactions. Furthermore, the degree of compaction and tectonic consolidation can narrow pore throats, thereby directly modifying the internal geometry. Crucially, pore connectivity and tortuosity play dominant roles in regulating effective diffusion pathways. Even at comparable total porosity, lower connectivity (e.g., due to isolated pores) or higher tortuosity (i.e., longer, more winding pore networks) can substantially impede oxygen transport and decrease the De value. Therefore, such intrinsic microstructural variations must be carefully considered when applying this empirical model to different types of geological media.
Assuming that the ratio of De to its free-solution diffusion coefficient is equal to the ratio of the effective diffusion coefficient of NaCl to its free-solution diffusion coefficient (1.61 × 10⁻⁹ m2 s−1) [29], the De for the Kimachi sandstone sample was estimated as 2.41 × 10⁻¹¹ m2 s−1. This assumption is physically justified by the principle that the ratio of the effective diffusion coefficient to the bulk fluid diffusion coefficient, often conceptualized as the inverse of the formation factor (1/F), is governed primarily by the intrinsic pore geometry of the rock matrix (e.g., porosity, connectivity, and tortuosity) rather than by the chemical properties of the diffusing solute itself. This geometric dominance explains why both the porosity-based regression analysis and the NaCl analogy are suitable for estimating oxygen diffusion in Kimachi sandstone. Because the value derived from the modified regression line was comparable to the estimate obtained using the NaCl analogy, the agreement between the two estimates provided mutual support for the hypothesis that the geometric effects of tortuosity in the Kimachi sandstone matrix affect the diffusion of dissolved oxygen and ionic solutes similarly. Therefore, the two approaches were considered equivalent. Consequently, the modified blue regression line in Figure 3 enables the straightforward estimation of the De value, provided that the porosity and microstructural characteristics of the geological media under investigation are known.
3.4. Comparison of the Second-Order Rate Constant (k)
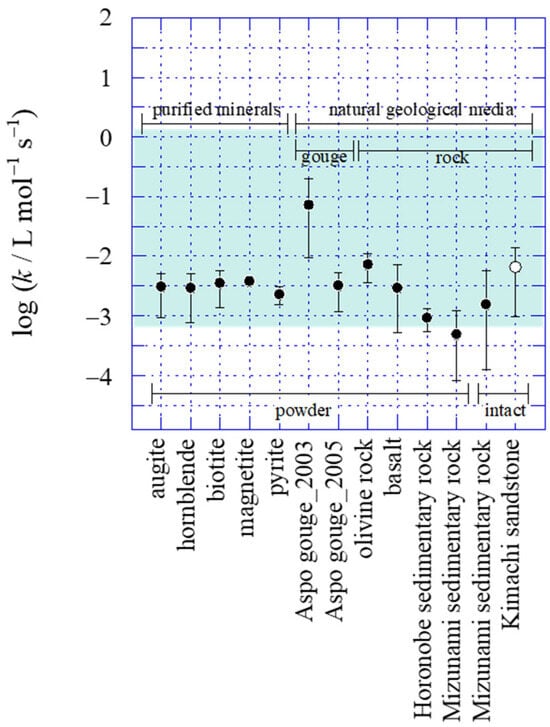
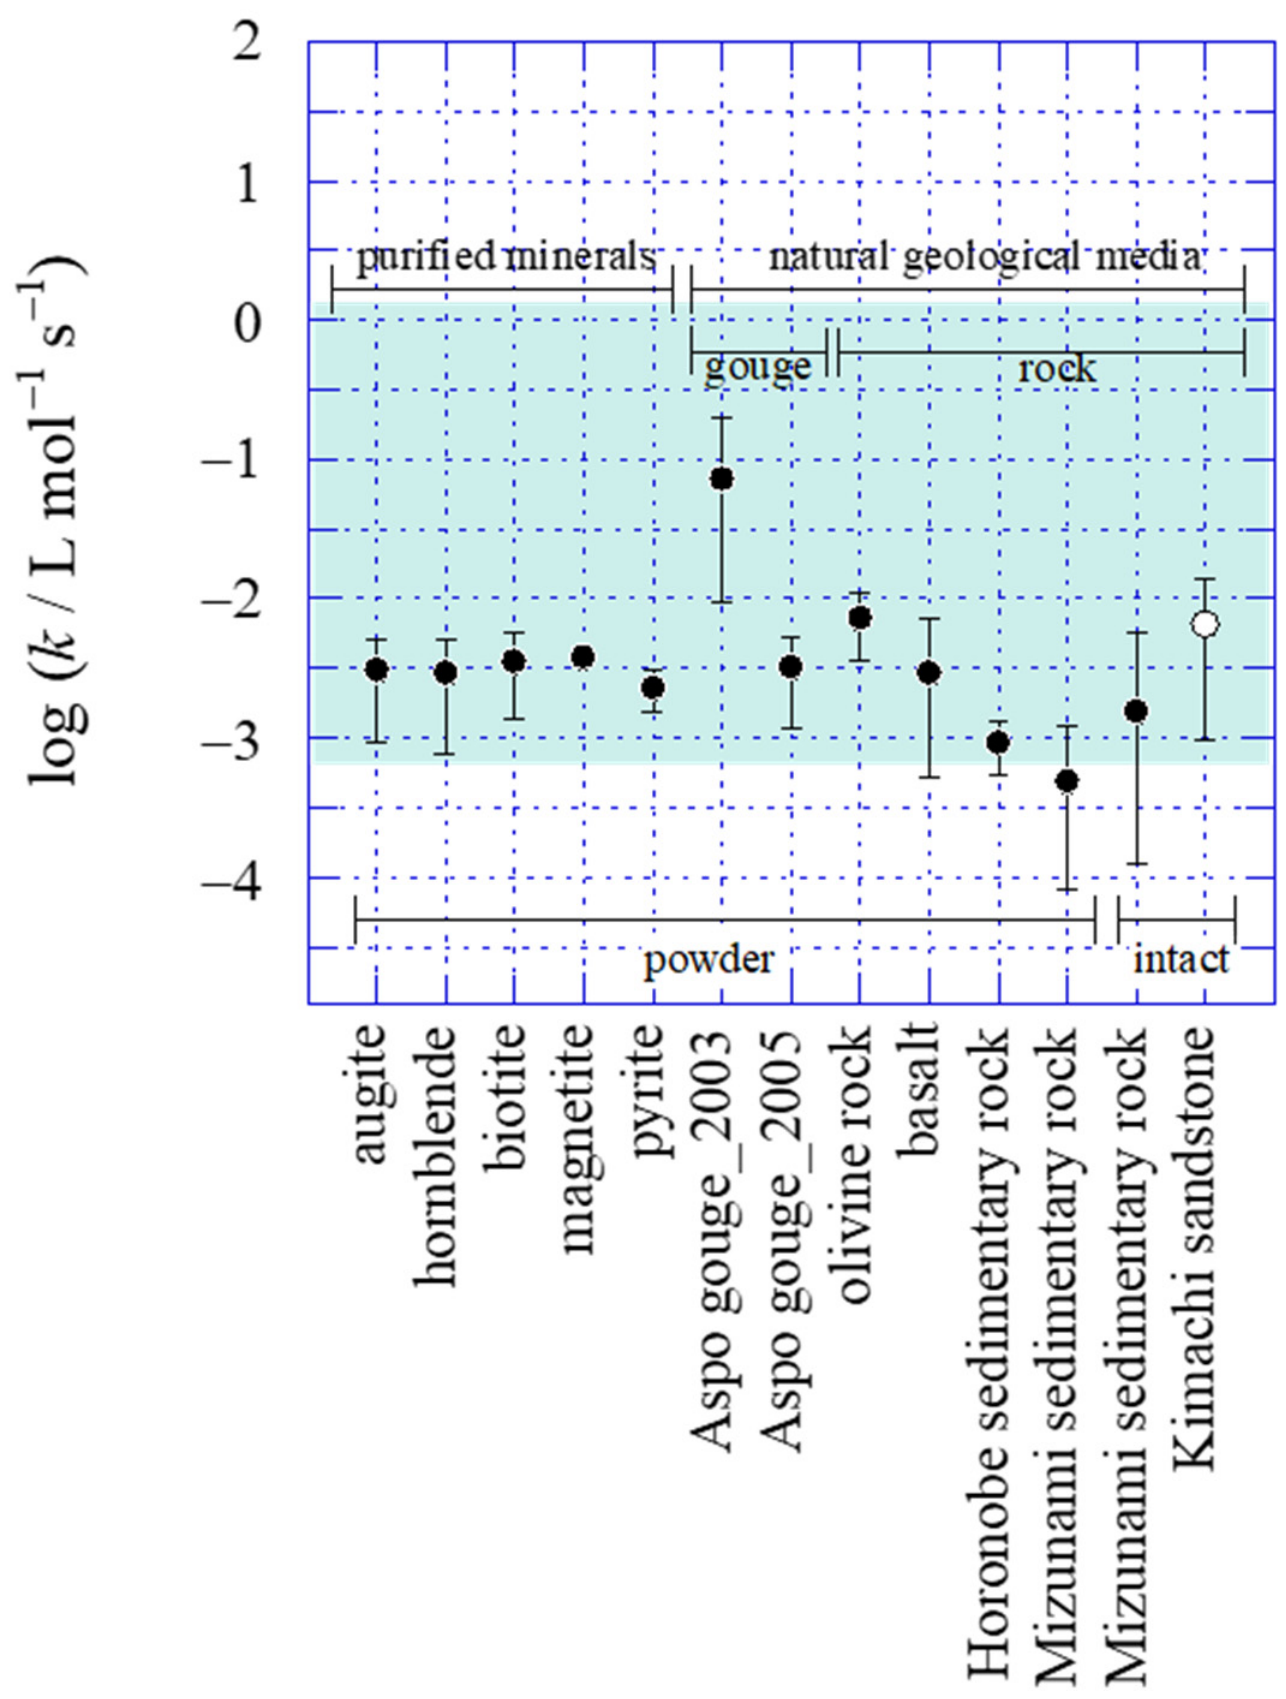
Figure 4 compares the k value obtained in this study with those from previous studies. The k value for intact Kimachi sandstone was consistent with earlier estimations [3,4,7,9,10,11,12,13,14,15]. However, the k values between intact and powdered rocks containing smectite (Mizunami sedimentary rocks) differed. This discrepancy can be explained by the inherent behavior of clay fragments in geological media [13,14]. The swelling of clay minerals, such as smectite, alters the number of reactive Fe(II) sites depending on the degree of swelling, leading to large variations in DO consumption rates. Furthermore, variations in mineral composition and degree of weathering strongly influence this kinetic behavior. In weathered rocks, the transformation of primary Fe(II)-bearing silicates into secondary smectite or amorphous iron phases alters the speciation and lability of reactive iron. Regarding reaction surface area, mechanical crushing (powdering) increases the geometric surface area but can structurally damage clays or artificially expose unweathered internal microfractures, whereas intact rock fragments preserve the natural pore network, in which the accessible reactive surface area is governed by fluid infiltration and layer expansion rather than by particle size alone. Although a comprehensive understanding of the underlying mechanism is currently limited by a limited dataset, the average k value for smectite-rich rocks (e.g., Kimachi sandstone and Mizunami sedimentary rock) is estimated to be (2.20 ± 5.14) × 10−3 L mol−1 s−1, which is consistent with the k value reported by Manaka and Takeda ((1.57 ± 4.05) × 10−3 L mol−1 s−1) [13]. The intact Kimachi sandstone reported values comparable to those for intact Mizunami sedimentary rocks, consistent with the trend implied by the hypothesis. However, this numerical consistency does not independently confirm that rock structure or clay swelling behavior is the sole factor governing the observed reaction rates. Accordingly, the summary of known k values compiled by Manaka and Takeda [14] was updated, as shown in Figure 4. These findings suggest that for experiments investigating the oxidation rate of swelling clays, rock fragments may provide different insights from powdered samples, although further independent validation is required to distinguish structural effects from other physicochemical factors.
Figure 4.
Updated second-order rate constants (k; L mol−1 s−1) from [14,15]. The open circle represents the Kimachi sandstone obtained in this study. The other symbols represent data from the literature: augite [3,4], hornblende [3], biotite [3], magnetite [4], pyrite [7,12], Äspö gouge [9,10], olivine rock [11], basalt [4], Horonobe sedimentary rock [14], and Mizunami sedimentary rock [13,15]. Points and error bars indicate the means and 2σ uncertainties for each mineral and medium type. The light blue region denotes the rate constants estimated for structural Fe(II) on the surface of silicate minerals by [3,13].
The k value for smectite-rich rocks was close to the fixed k value of 10−3 L mol−1 s−1 reported by Manaka and Takeda [14], who suggested that only surface Fe(II) sites in silicate minerals are involved in DO consumption, regardless of the mineral type or sample form. This agreement supports the use of this fixed value for preliminary predictions of DO evolution in groundwater around radioactive waste repositories, further demonstrating its practical utility.
3.5. Numerical Simulation of DO Diffusion Using Intact Kimachi Sandstone
To examine the temporal evolution of DO, numerical simulations were performed by solving Equations (4) and (5) using the pdepe solver in MATLAB. The governing partial differential equations were spatially discretized using a piecewise linear method on a one-dimensional mesh consisting of 50 nodes, thereby transforming the PDE system into a set of ordinary differential equations. For temporal integration, the variable-step ode15s solver was employed to ensure numerical stability when solving stiff equations.
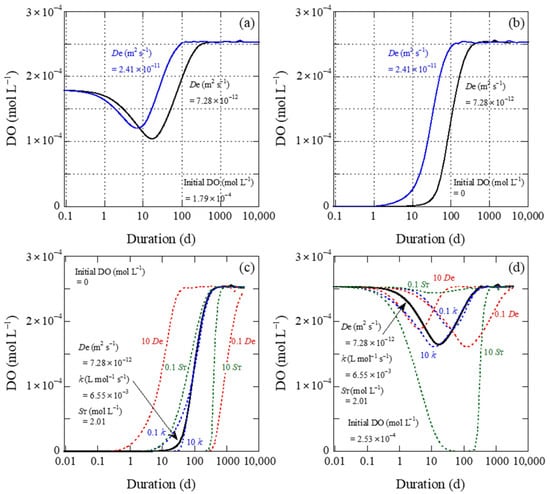
The initial and boundary conditions for the numerical model were selected to accurately reflect the physical setup and experimental scenarios. For the initial conditions, two distinct scenarios were evaluated to examine the impact of initial DO concentration within the rock matrix: (i) a zero-initial concentration profile (C(x, 0) = 0), representing a completely deoxygenated core sample, and (ii) a uniform initial concentration profile (C(x, 0) = 1.79 × 10⁻⁴ mol L−1 based on the experimentally measured DO baseline. The boundary conditions were established based on the mass transport physics at the boundaries: a constant concentration condition (C(0, t) = C0) was enforced at the upstream boundary (x = 0), whereas a dynamic, time-dependent flux condition based on the mass balance was applied at the material–vessel interface (x = L).
Simulations were performed using the estimated De (7.28 × 10⁻¹² or 2.41 × 10⁻¹¹ m2 s−1) and k (6.55 × 10⁻³ L mol−1 s−1) values, as the original DO data could not be obtained due to interference from air bubbles. The convergence criteria for adaptive time-stepping were governed by the solver’s default parameters, with a relative error tolerance of 1.0 × 10⁻³ and an absolute error tolerance of 1.0 × 10⁻⁶, thereby ensuring mass conservation and numerical stability.
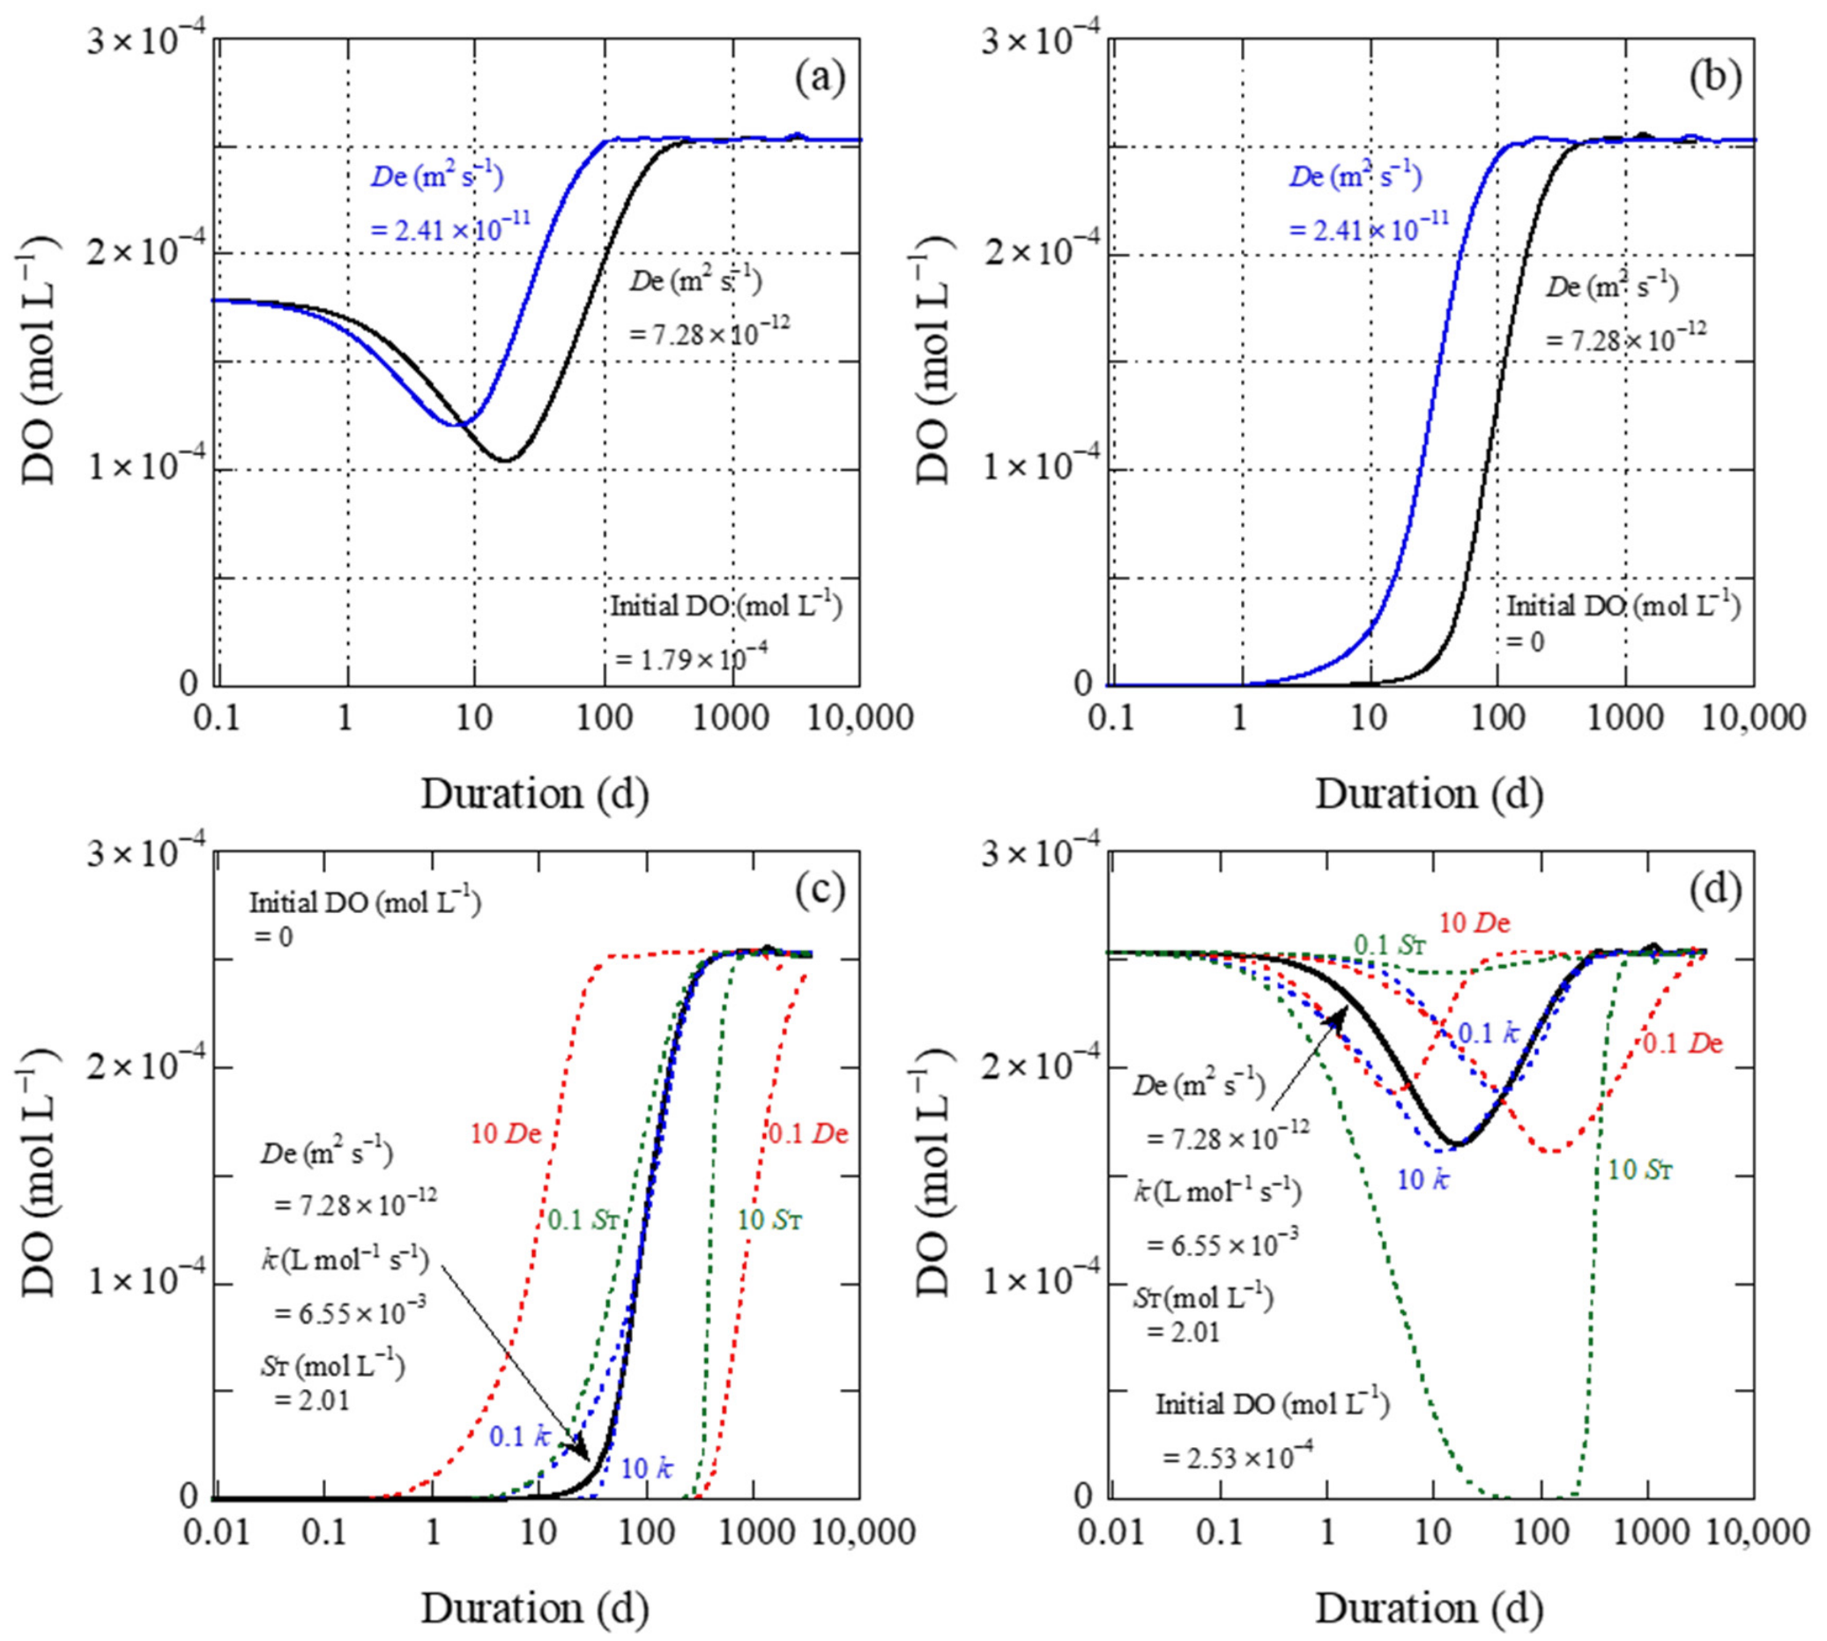
Figure 5a shows the DO concentration change in a virtual material representing Kimachi sandstone. Figure 5b presents the corresponding concentration profiles under identical conditions, except for the initial DO concentration set to zero. The DO concentration profile strongly depended on the initial concentration. At zero initial concentration, a breakthrough-type increase was observed, whereas an initial concentration of 1.79 × 10⁻⁴ mol L−1 exhibited a decreasing-then-increasing DO concentration trend. This behavior reflects the initial decrease in the downstream sample DO concentration owing to consumption of Fe(II)-bearing minerals, which induced further DO diffusion from the vessel.
Figure 5.
Simulation-based analysis of DO diffusion in a virtual material mimicking intact Kimachi sandstone, with initial DO concentrations of (a) 1.79 × 10⁻⁴ mol L−1 and (b) 0 mol L−1. A DO effective diffusion coefficient of 7.28 × 10⁻¹² m2 s−1 was obtained using the modified regression line (Figure 3). For comparison, a value of 2.41 × 10⁻¹¹ m2 s−1 was estimated by assuming that the ratio of effective to free-solution diffusion coefficients is equal to that of NaCl. (c,d) Sensitivity analysis of the parameters De, k, and ST with each parameter increased or decreased by a factor of 10 relative to its baseline value and initial DO concentrations of (c) 0 mol L−1 and (d) 2.53 × 10⁻⁴ mol L−1. In (c,d), the solid and dashed lines represent the results obtained when each parameter was increased tenfold and decreased to 0.1 times its baseline value, respectively.
The discrepancy between the experimentally observed early-stage breakthrough profiles and the much longer time required to reach the complete steady state predicted by the model (100–300 d) can be attributed to the multi-scale nature of the coupled diffusion–consumption process. Although initial breakthrough via interconnected macropores occurs rapidly, achieving a true steady state takes significantly longer because of the ongoing, slow chemical consumption of Fe(II)-bearing minerals embedded deep within the tight rock matrix. Regardless of the initial concentration, the model predicted that the DO concentration reached a steady state after approximately 300 d at a De of 7.28 × 10⁻¹² m2 s−1 and approximately 100 d at a De of 2.41 × 10⁻¹¹ m2 s−1.
To evaluate the robustness of the model predictions to parameter uncertainty, a sensitivity analysis was conducted. In this analysis, De, k, the initial DO concentration, and ST were each varied independently over one order of magnitude, whereas the initial DO concentration ranged from zero to atmospheric saturation. Figure 5c,d indicate that the predicted breakthrough time and the time required to reach a steady state were highly sensitive to De and ST. An increase in De significantly accelerated DO transport, thereby reducing the breakthrough time. Conversely, higher k values and greater ST prolonged the transient phase, extending the time required to reach a steady state because of enhanced DO consumption within the rock matrix. The initial DO concentration primarily influenced the early-stage transient behavior (i.e., the depth of the initial concentration dip) but had only a minor impact on the time required to reach a true steady state. This comprehensive sensitivity analysis confirms that, although specific timelines vary depending on the exact mineralogical and transport parameters, the recommendation for a long-term testing period remains robust.
These simulation results indicate that, under the specific mineralogical and geometric configurations evaluated in this study, a minimum period of 100 d is estimated to be necessary for the transient system to approach a steady state. Therefore, rather than establishing a universal requirement, these model-based estimates suggest that an operating period of approximately 100 d is recommended to ensure data reliability in experiments using similar diffusion–consumption configurations and sandstone characteristics.
3.6. Limitations and Future Prospects
The proposed experimental apparatus provided reliable DO concentration data with minimal artifacts, enabling the calculation of the k value despite the preliminary nature of the tests. However, this study had several limitations. First, replacing the air in the vessel with water via vacuum impregnation resulted in residual air bubbles, which precluded the estimation of the De in the intact Kimachi sandstone. Second, because the results were obtained using only Kimachi sandstone samples, these findings cannot be generalized to other smectite-bearing rocks. Finally, owing to the limited data acquisition period, long-term changes in DO concentrations could not be evaluated, including those from blank tests. Although these limitations highlight the preliminary scope of the present work, independent validation experiments incorporating extended monitoring periods, alternative rock types, and repository-relevant temperatures will substantially enhance the overall validity of the proposed apparatus and analytical methodology.
Nevertheless, the findings of the present study have several practical advantages. First, the calculated k value was consistent with previously reported values. Second, this approach allowed for data expansion, leading to better generalization. Furthermore, the experimental results were within the acceptable blank range, indicating no significant interference. Therefore, future studies should focus on two key areas. First, optimization of the vessel-filling procedure to ensure that testing conducted in low-DO water is completely free of air bubbles. Slowly saturating the rock sample with water from the bottom to the top may ensure full saturation and minimize the trapped air. Second, the DO diffusion–consumption experiments should be expanded. Specifically, monitoring DO concentrations for at least 100 d alongside a parallel blank test would help account for potential experimental artifacts. As the temperature in radioactive waste repositories is expected to be higher than 25 °C, experiments simulating this temperature are also necessary. Addressing these steps will provide valuable insight into the temporal evolution of underground DO in radioactive waste repositories following closure.
To extrapolate these laboratory parameters to natural geological formations, several key assumptions must be acknowledged: Applying the laboratory-derived rate parameter (k) to natural geological formations requires assuming spatial homogeneity at a larger scale. In deep underground environments, mineral distributions, microfractures, and flow paths are heterogeneous, meaning that the effective reaction rate in the field may be controlled by mass-transfer limitations rather than by intrinsic reaction kinetics. Furthermore, extrapolating these parameters to a natural repository host rock assumes that DO transport is governed purely by diffusion, as observed in the static experimental setup. In situ, groundwater advection and local hydraulic gradients may dominate over molecular diffusion, thereby altering the spatial extent of the oxygenated zone. In addition, applying k to natural settings assumes that potential microbially mediated oxygen consumption or secondary redox reactions involving reduced minerals (such as pyrite or Fe(II)-bearing silicates) remain constant over long geological timescales, independent of local microenvironments. Finally, transferring k and De to a post-closure repository environment relies on the assumption that temperature-induced changes in reaction kinetics follow a predictable Arrhenius relationship without triggering secondary mineral transformations or microstructural cracking in smectite-bearing matrices.
4. Conclusions
Using a straightforward experimental technique in an open system, this study developed a diffusion–consumption cell equipped with an optical oxygen sensor to obtain reliable DO concentration data. During the experiment, the cumulative concentration of the DO diffusing through an intact Kimachi tuffaceous sandstone sample was continuously monitored with minimal artifacts. Based on the preliminary results and previously reported data, the key findings and interpretations are summarized as follows:
The k value for the oxidation of the sandstone sample was approximately 10−3 L mol−1 s−1, consistent with those reported for intact smectite-rich rocks in previous studies. This rate constant also aligned with the proposed fixed k value (10−3 L mol−1 s−1) for silicate minerals. In addition, the De increased in geological media with higher porosities. Given the porosity of the target geological medium, the temporal evolution of DO around radioactive waste repositories can be evaluated by using the De (calculated from the porosity and diffusion coefficient) with the fixed k value.
Although the findings provide valuable insights, the present study was constrained by the limited number of trials and a small sample size, hindering the generalizability of the results. Consequently, until further evidence supports broader generalization, practical conclusions from this work remain limited to preliminary modeling applications. Therefore, future studies should perform intact rock experiments under various temperature conditions as well as longer experimental periods to comprehensively determine the redox characteristics of repository far-field environments in the context of geological disposal. Nevertheless, the present findings are expected to contribute to the understanding of the fate of atmospheric oxygen after repository closure.
Author Contributions
Conceptualization, M.M.; methodology, M.M. and M.T.; software, M.M. and M.T.; validation, M.M. and M.T.; formal analysis, M.M. and M.T.; investigation, M.M.; resources, M.M.; data curation, M.M.; writing—original draft preparation, M.M.; writing—review and editing, M.M. and M.T.; visualization, M.M.; supervision, M.M. All authors have read and agreed to the published version of the manuscript.
Funding
This research received no external funding.
Data Availability Statement
The original contributions presented in this study are included in the article. Further inquiries can be directed to the corresponding author.
Acknowledgments
The authors thank Takashi Okai for the sandstone chemical composition analysis. This research did not receive any specific grant from funding agencies in the public, commercial, or not-for-profit sectors.
Conflicts of Interest
The authors declare no conflicts of interest.
References
- Langmuir, D. Aqueous Environmental Geochemistry; Prentice Hall: Upper Saddle River, NJ, USA, 1997. [Google Scholar]
- Deer, W.A.; Howie, R.A.; Zussman, J. An Introduction to the Rock-Forming Minerals, 2nd ed.; Longman Scientific & Technical: London, UK, 1992. [Google Scholar]
- White, A.F.; Yee, A. Aqueous oxidation-reduction kinetics associated with coupled electron transfer from iron-containing silicates at 25 °C. Geochim. Cosmochim. Acta 1985, 49, 1263–1275. [Google Scholar] [CrossRef] [Scilit]
- White, A.F.; Yee, A.; Flexser, S. Surface oxidation-reduction kinetics associated with experimental basalt water reaction at 25 °C. Chem. Geol. 1985, 49, 73–86. [Google Scholar] [CrossRef] [Scilit]
- Pirhonen, V.; Pitkänen, P. Redox Capacity of Crystalline Rocks: Laboratory Studies Under 100 Bar Oxygen Gas Pressure; Technical Report, TR-91-55; Swedish Nuclear Fuel and Waste Management Co.: Stockholm, Sweden, 1991. [Google Scholar]
- Kamei, G.; Ohmoto, H. The kinetics of reactions between pyrite and O2-bearing water revealed from in situ monitoring of DO, Eh and pH in a closed system. Geochim. Cosmochim. Acta 2000, 64, 2585–2601. [Google Scholar] [CrossRef] [Scilit]
- Manaka, M.; Kawasaki, M.; Honda, A. Measurements of the effective diffusion coefficient of dissolved oxygen and oxidation rate of pyrite by dissolved oxygen in compacted sodium bentonite. Nucl. Technol. 2000, 130, 206–217. [Google Scholar] [CrossRef] [Scilit]
- Manaka, M. The effective diffusion coefficient of dissolved oxygen and oxidation rate of pyrite by dissolved oxygen in compacted purified and crude sodium bentonites in carbonate buffered solution. Nucl. Technol. 2003, 143, 335–346. [Google Scholar] [CrossRef] [Scilit]
- Rivas-Perez, J.; Tullborg, E.-L.; Banwart, S.A. The kinetics of O2(aq) reduction during oxidative weathering of naturally occurring fracture minerals in groundwater. Mineral. Mag. 2003, 67, 399–414. [Google Scholar] [CrossRef] [Scilit]
- Perez, J.R.; Banwart, S.A.; Puigdomenech, I. The kinetics of O2(aq) reduction by structural ferrous iron in naturally occurring ferrous silicate minerals. Appl. Geochem. 2005, 20, 2003–2016. [Google Scholar] [CrossRef] [Scilit]
- Giménez, J.; Rovira, M.; Clarens, F.; Casas, I.; Duro, L.; Grivé, M.; Bruno, J.; de Pablo, J. The use of a high-FeO olivine rock as a redox buffer in a nuclear waste repository. J. Contam. Hydrol. 2006, 83, 42–52. [Google Scholar] [CrossRef] [Scilit] [PubMed]
- Manaka, M. Comparison of rates of pyrite oxidation by dissolved oxygen in aqueous solution and in compacted bentonite. J. Miner. Petrol. Sci. 2009, 104, 59–68. [Google Scholar] [CrossRef] [Scilit]
- Manaka, M.; Takeda, M. Consumption and diffusion of dissolved oxygen in sedimentary rocks. J. Contam. Hydro. 2016, 193, 35–47. [Google Scholar] [CrossRef] [Scilit] [PubMed]
- Manaka, M.; Takeda, M. Applicability of the second-order rate law for modeling dissolved O2 consumption by Fe(II)-bearing geologic media. Appl. Geochem. 2021, 131, 105034. [Google Scholar] [CrossRef] [Scilit]
- Manaka, M.; Takeda, M. Application of a luminescence-based oxygen measuring system for quantifying dissolved O2 consumption by Fe(II)-bearing geologic media. Appl. Geochem. 2026, 209, 107052. [Google Scholar] [CrossRef] [Scilit]
- Grenthe, I.; Stumm, W.; Laaksuharju, M.; Nilsson, A.-C.; Wikberg, P. Redox potentials and redox reactions in deep groundwater systems. Chem. Geol. 1992, 98, 131–150. [Google Scholar] [CrossRef] [Scilit]
- Trotignon, L.; Michaud, V.; Lartigue, J.-E.; Ambrosi, J.-P.; Eisenlohr, L.; Griffault, L.; de Combarieu, M.; Daumas, S. Laboratory simulation of an oxidizing perturbation in a deep granite environment. Geochim. Cosmochim. Acta 2002, 66, 2583–2601. [Google Scholar] [CrossRef] [Scilit]
- Kano, K.; Takeuchi, K.; Matsuura, H. Geology of the Imaichi District. With Geological Sheet Map at 1:50,000; Geological Survey of Japan: Tsukuba, Japan, 1991; (In Japanese with English abstract). [Google Scholar]
- Dhakal, G.; Yoneda, T.; Kato, M.; Kaneko, K. Slake durability and mineralogical properties of some pyroclastic and sedimentary rocks. Eng. Geol. 2002, 65, 31–45. [Google Scholar] [CrossRef] [Scilit]
- Nakamura, D.; Goto, T.; Suzuki, T.; Ito, Y.; Yamashita, S. Basic study on frost susceptibility of rock-Understanding the mechanism of frost heave based on comparison of the internal structure and physical properties of rock. J. MMIJ 2008, 124, 231–239, (In Japanese with English abstract). [Google Scholar] [CrossRef] [Scilit]
- Takeda, M.; Hiratsuka, T.; Manaka, M.; Finsterle, S.; Ito, K. Experimental examination of the relationships among chemico-osmotic, hydraulic, and diffusion parameters of Wakkanai mudstone. J. Geophys. Res. Solid. Earth 2014, 119, 4178–4201. [Google Scholar] [CrossRef] [Scilit]
- Moore, D.M.; Reynolds, R.C. X-Ray Diffraction and the Identification and Analysis of Clay Minerals, 2nd ed.; Oxford University Press: Oxford, UK, 1997. [Google Scholar]
- Igarashi, T. Estimation by clay mineral norm calculation (N88-BASIC program). Chishitsu News 1984, 353, 37–47. (In Japanese) [Google Scholar]
- Davis, J.A.; Kent, D.B. Surface complexation modeling in aqueous geochemistry. In Mineral–Water Interface Geochemistry; Hochella, M., White, A.F., Eds.; Mineralogical Society of America: Washington, DC, USA, 1990; Volume 23, pp. 177–248. [Google Scholar]
- Wehrli, B. Redox reactions of metal ions at mineral surfaces. In Aquatic Chemical Kinetics: Reaction Rates of Processes in Natural Waters; Stumm, W., Ed.; Wiley: New York, NY, USA, 1990; pp. 311–336. [Google Scholar]
- Himmelblau, D.M. Diffusion of dissolved gases in liquids. Chem. Rev. 1964, 64, 527–550. [Google Scholar] [CrossRef] [Scilit]
- Wise, D.L.; Houghton, G. The diffusion coefficients of ten slightly soluble gases in water at 10–60 °C. Chem. Eng. Sci. 1966, 21, 999–1010. [Google Scholar] [CrossRef] [Scilit]
- The Chemical Society of Japan (Ed.) Handbook of Chemistry: Pure Chemistry; Maruzen: Tokyo, Japan, 2021. (In Japanese) [Google Scholar]
- Shackelford, C.D.; Daniel, D.E. Diffusion in saturated soil: I. Background. J. Geotech. Eng. ASCE 1991, 117, 467–484. [Google Scholar] [CrossRef] [Scilit]
Disclaimer/Publisher’s Note: The statements, opinions and data contained in all publications are solely those of the individual author(s) and contributor(s) and not of MDPI and/or the editor(s). MDPI and/or the editor(s) disclaim responsibility for any injury to people or property resulting from any ideas, methods, instructions or products referred to in the content. |
© 2026 by the authors. Licensee MDPI, Basel, Switzerland. This article is an open access article distributed under the terms and conditions of the Creative Commons Attribution (CC BY) license.