


Abstract
The behavior of ions at the electric double layer interfacial region between solid and liquid phases is well known in surface and material science. However, this is not fully the case in soil science, where the electric double layer develops due to the inherent complexity and diversity of negatively charged soil organic matter molecules that sorb at the mineral surface. This lack of knowledge opens questions regarding the interaction mechanisms at the molecular scale that lead to the stabilization of such soil building blocks, the so-called organo-mineral aggregates. By using classical molecular dynamics simulations, we studied the interactions between Kaolinite and four standardized soil organic matter samples with different aromatic and carboxylic content and Ca2+ cations clustering OM molecules and stabilizing them to the surface. We assessed the influence of (i) organic content, (ii) water content, and (iii) competing Cl− ions. Cluster aggregates are favored in soils with a high aliphatic fraction at low-water content, whereas aggregation is favored in soils with high aromatic fraction at high-water content and in the presence of Cl− ions. Moreover, samples with a low acid fraction favor clustering due to non-bonded interactions and hydrogen bonds. All of these environments are reflected as unique charge-density “fingerprints” and surface coverage for each OM sample. This work represents a step towards the characterization and study of natural soils tunable to specific local conditions.
1. Introduction
Soils are formed from heterogeneous complex mixtures of mineral and organic compounds, living organisms, and liquid and gaseous phases, spanning different scales dependent on parent materials, weathering, climate, topography, organisms, and time [1]. To have a better understanding of their macroscopic functions and behavior, we need to refine our understanding of the interactions at the microscopic level of organo-mineral aggregates and their interfaces [2]. However, this task becomes difficult due to the lack of well-defined and specific molecules in the organic fraction, leading to a big debate among the scientific community regarding validity and even existence of, for example, humic substances [3,4]. For sure, soils are a collection of diverse molecules and species at different decomposition stages interacting with each other [5]. However, this does not exclude the hypothesis that some molecules resist degradation due to protection mechanisms inherent to them or due to external sources [6].
Each soil component plays a specific key role in the formation of micro-aggregates. Soil minerals, for instance, serve as base for aggregation of smaller species which build up hierarchically [7,8]. They influence the interfacial properties of soil, such as dispersion, flocculation, coagulation, colloidal stability, solubility, adsorption, and transport of substances, such as nutrient ions, toxic heavy metals, metalloids, organic molecules, and pesticides [9]. On the other hand, organic matter (OM) derives mostly from lignocellulose materials at some decompositional stage and represents one of the largest carbon pools involved in the storage of carbon and nitrogen [10]. Organo-mineral aggregates (OMAs), also referred to in the literature as mineral-associated organic matter (MAOM) [11], are key to improving soil properties, developing bioremediation methods, and ultimately contributing to the mitigation of climate change [12].
The interaction of these components at the microscopic level results in the development of a region of electrostatic transition between two phases, such as the solid–liquid, or the gas–liquid interface, each with unique properties, known in surface science as the electric double layer (EDL). The double-layer concept refers to the distribution of ionic species over a surface, driven by electrostatic interactions, where a first layer of ions in the solution adsorbs directly on the surface and a second layer neutralizes charges of the first layer [13].
In previous works, the adsorption mechanism of individual species in minerals has been elucidated [14,15,16], and some others have studied individually either the organic fraction or the inorganic fraction [17,18,19,20,21,22,23]. Only a few works have dedicated efforts to modeling simple representations of OMAs and correlating models with experimental observables [24,25,26]. On the other hand, although the most realistic OMA models can describe structural details, to the best of our knowledge, they still lack thermodynamic information needed to elucidate interactions within the EDL [27,28]. In 2021, we described the mechanism of Leonardite humic acid adsorption to Kaolinite and how it is affected by different environments [29]. The results provided an explanation on the formation of big clusters of OM in the outermost part of mineral particles, thus explaining the role of OM as a glueing agent between mineral particles. Within mineral cavities, on the other hand, both a strong adsorption and dispersion were observed.
In this work, we performed a systematic study of representative OM samples by extending our previously reported database [22] OM samples with different aromatic and aliphatic content. We study these samples in cavities under different environmental conditions by using classical molecular dynamics (MD) simulations. We used Kaolinite as a representative clay mineral to form the cavity, as it is one of the most common minerals found in many soil types. We assessed the effect of organic composition, water content, and the presence of competing Cl− on the aggregation and stabilization mechanisms in terms of complex structures, electrostatic properties, and surface occupancy of the clay mineral.
2. Materials and Methods
2.1. Initial Configurations
Kaolinite has a net charge of zero at circumneutral conditions. It has a layered 1:1 octahedral:tetrahedral structure formed by a positively charged sheet (aluminol) and a negatively charged sheet (siloxane), resulting in a natural dipole moment [30]. This, plus the uneven rugosity of the dioctahedral surface, leads to the adsorption and distribution of species over the surface. We generated a Kaolinite cavity with the basal surface (001) exposing the aluminol and siloxane surfaces to the solvent, as this plane represents most of the mineral particle’s surface [31]. From the unit cell reported by Bish [32], we generated a Kaolinite cavity model of 16 × 16 × 1 unit cells equivalent to a volume of 8.2 × 14.3 × 0.7 nm3. To simulate a cavity pore, we increased the height of the simulation box 10 nm in the z-direction.
On the other hand, OM is modeled starting from four standardized organic matter samples from the International Humic Substances Society [33]: Suwannee River III fulvic acid (sfa; 3S101F), Suwannee River III humic acid (sha; 3S101H), Pony Lake fulvic acid (pnl; 1R109F), and Leonardite humic acid (leo; 1S104H) (Table 1). OM samples’ compositions were passed as input to the VSOMM modeler at neutral pH [34,35]. The simulation of generated models followed the same previously established protocols [29,36]. These new samples were added to the principal component analysis of Escalona et al. [22] in Figure A1, with the principal components PC1 and PC2 dominated by aromaticity and acidity, respectively. From the selected samples, Leonardite humic acid exhibited the biggest aromaticity (PC1 value), while Pony Lake is rather aliphatic. On the other hand, although both Suwannee River samples exhibit the highest PC2 scores within this work, associated in previous works with carboxyl composition [22], this does not necessarily indicate higher carboxyl content. All generated models were placed inside the cavity space.
Table 1.
Elemental and organic composition and principal components PC1 and PC2 from principal component analysis (PCA) of Suwannee River III fulvic acid (sfa), Suwannee River III humic acid (sha), Pony Lake fulvic acid (pnl), and Leonardite humic acid (leo).
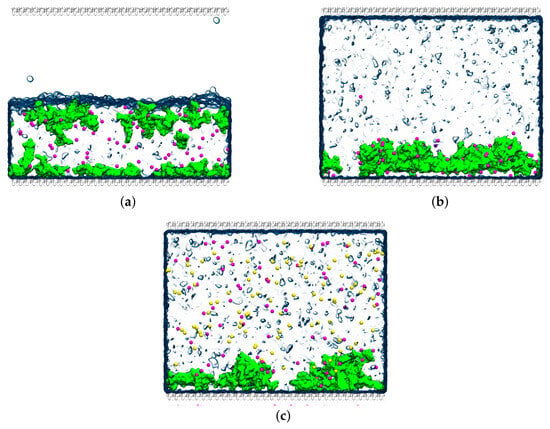
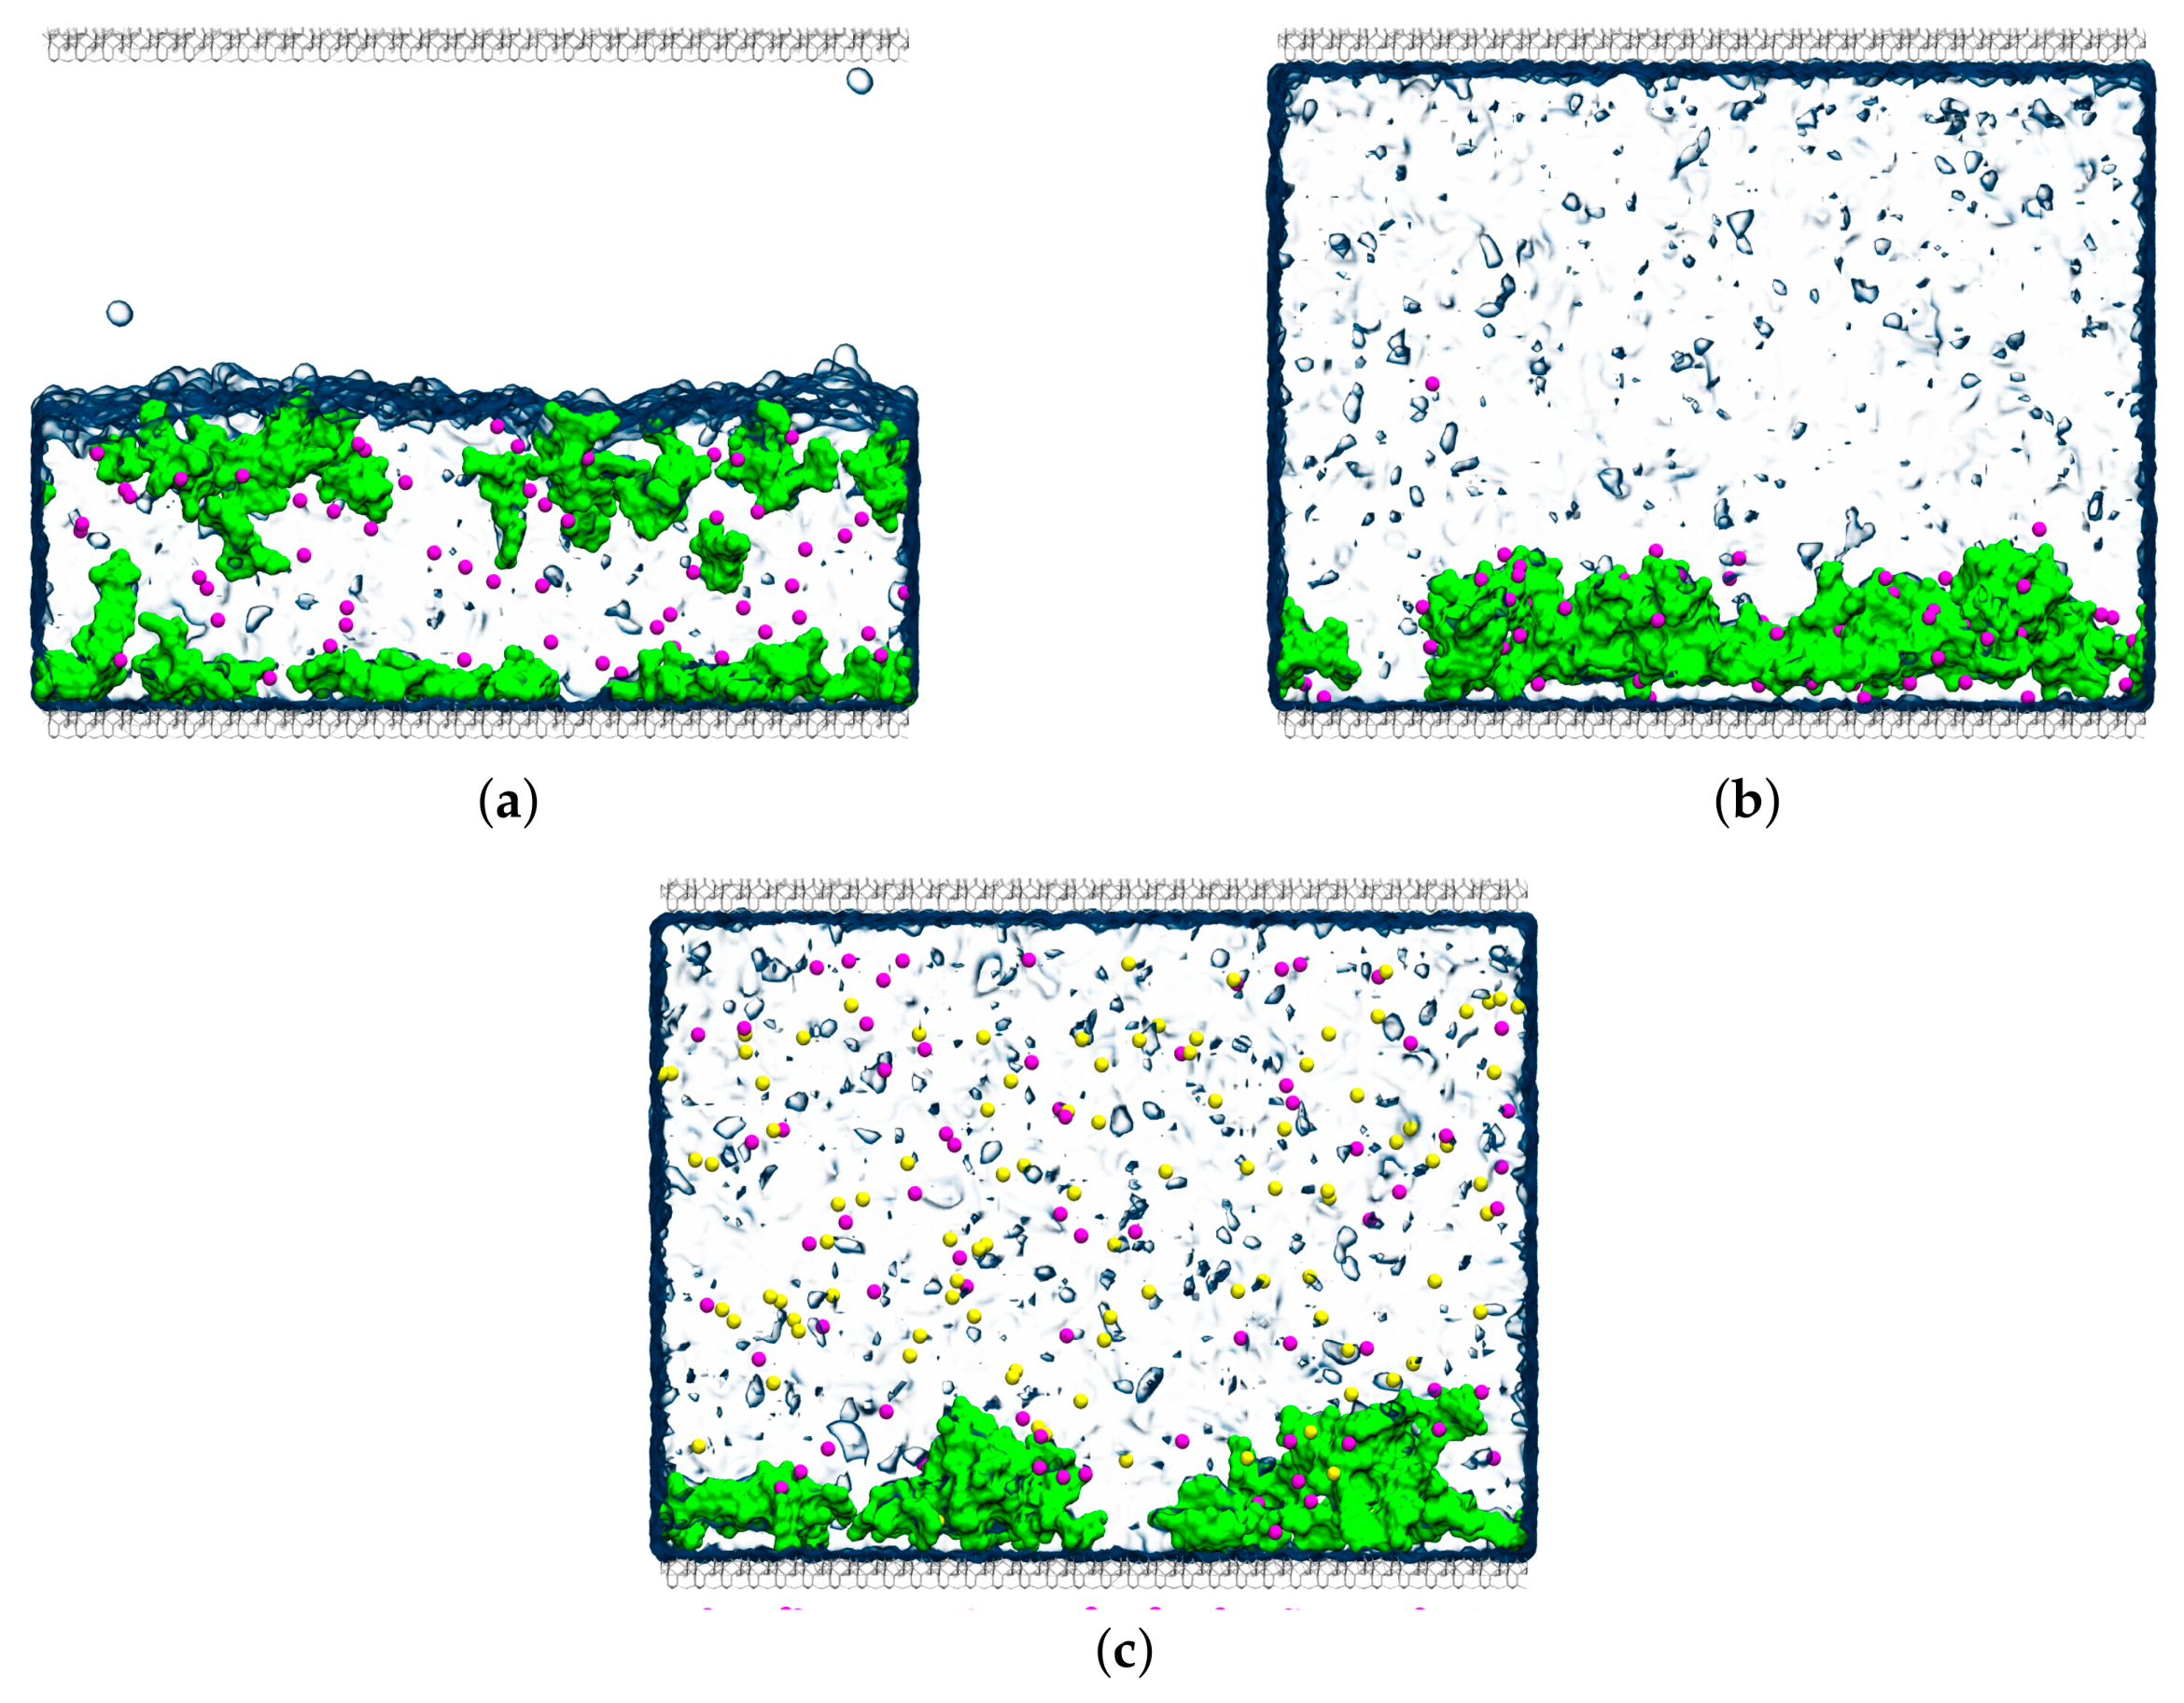
Different environments were created by changing the water content of the cavity and adding extra ions (CaCl2) to assess the influence of Cl− ions. Low- and high-water content conditions were simulated by (i) partially filling the cavity at around half of the simulation box height with water molecules with a density of 1 g cm−3, exposing the aluminol surface to the soil solution (Figure 1a) in agreement with its hydrophilic behavior [31]; and (ii) fully filling the cavity with water molecules at the same density (Figure 1b). Cl− ions were added in the fully filled cavity with the respective counterions Ca2+ to neutralize the charges corresponding to a concentration of 0.1 N (Figure 1c).
Figure 1.
Snapshot of cavities: (a) partially filled, (b) fully filled by water, and (c) fully filled by water and extra ions (CaCl2 solution). The cavity is represented by the periodic image of the Kaolinite basal surface in the z-direction. OM is represented by the green surface, Ca2+ ions by magenta spheres, and Cl− ions by yellow spheres.
Molecular interactions of OM and ions were described according to the GROMOS force field parameters 54a8 [37], whereas, for Kaolinite, the ClayFF force field was used [38]. Water molecules were described by the simple point charge (SPC) model, which is compatible with both force fields [39].
2.2. Simulation Settings
We used the GROMACS package [40] (version 2023), using the leap-frog algorithm to solve the equations of motion with a time step ∆t = 2 fs. The temperature and pressure were kept constant at 300 K and a relaxation time constant of τT = 0.5 ps, whereas the V-rescale thermostat for the production was τT = 2.0 ps [41,42]. For all non-bonded interactions, we used a cutoff radius of rcut = 1.4 nm with energy and pressure corrections. Long–range electrostatic interactions were treated using the smooth particle mesh Ewald (SPME) method with a grid spacing of 0.12 nm and a cubic polynomial [43]. The SETTLE algorithm was used to constrain bond lengths and angles of water molecules [44], and the remaining bond lengths were constrained with the linear constraint solver (LINCS) algorithm [45]. For Kaolinite, we restrained the positions of the heavy atoms with a force constant of 3000 kJ mol−1 for two reasons: (i) to fix the reference position of the layer and avoid the virtual displacement of the cavity in the z-direction; and (ii) to prevent the artificial dissociation of hydroxyl groups into solution in environments with low polarization, as reported in previous works [46,47,48].
The simulation protocol consisted of several stages: (i) equilibration of the OM model; (ii) minimization of the cavity pore with OM (dry-OMA) inserted in the middle; (iii) minimization of OMA after adding the appropriate water content (wet-OMA); (iv) equilibration of wet-OMA; and (v) production stage of wet-OMA. In all cases, we followed energy minimization, equilibration, and production steps, similar to previous protocols [29,36]. For the minimization stem, we used an energy tolerance of 1000 kJ mol−1 nm−1. The equilibration step was performed at constant pressure for 100 ns, and the production step for 400 ns, due to the slow dynamics of the systems. Three replicas were prepared for each individual system, with different random seeds in the temperature to increase sampling. All the molecular coordinates and energies were stored every 10 ps. All images were created by using the VMD software [49] (version 2.0.0a7).
2.3. Occupancy Probability
The occupancy probability map, θij, represents the percentage of simulation frames that an ij grid-cell is occupied by a particle. Only heavy atoms of OM molecules and Ca2+ ions within a distance of 0 > z > 1 nm from the aluminol surface are considered as particles. The xy surface of the mineral is divided into 28 × 48 bins corresponding to the x- and y-axes, respectively.
2.4. Surface Inequality (Gini Coefficient)
To complement the occupancy distribution, we quantified the spatial heterogeneity over the surface of heavy atoms of OM molecules and Ca2+ ions within a distance of 0 > z > 1 nm from the aluminol surface with a metric often used in economics, the so-called Gini coefficient [50], G, defined as follows:
where pk is the flattened occupancy probability map, θij, over the previously defined mineral surface grid occupying the k-position of the flattened grid, and N is the total number of grid cells. G = 0 corresponds to an equal distribution of the particles over the mineral surface, whereas G → 1 suggests the formation of a cluster at a specific region.
3. Results
3.1. Charge-Density Profile
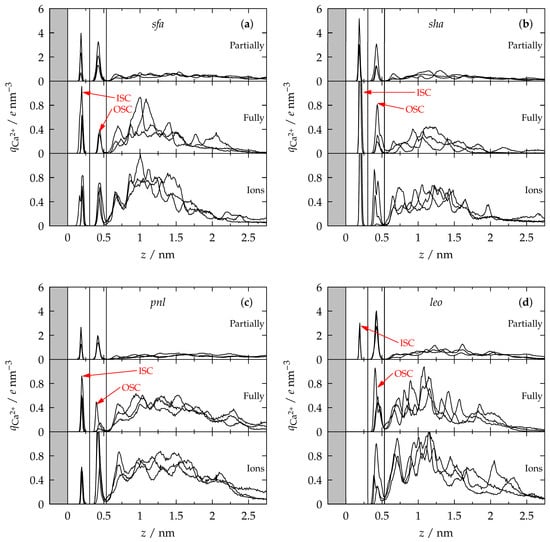
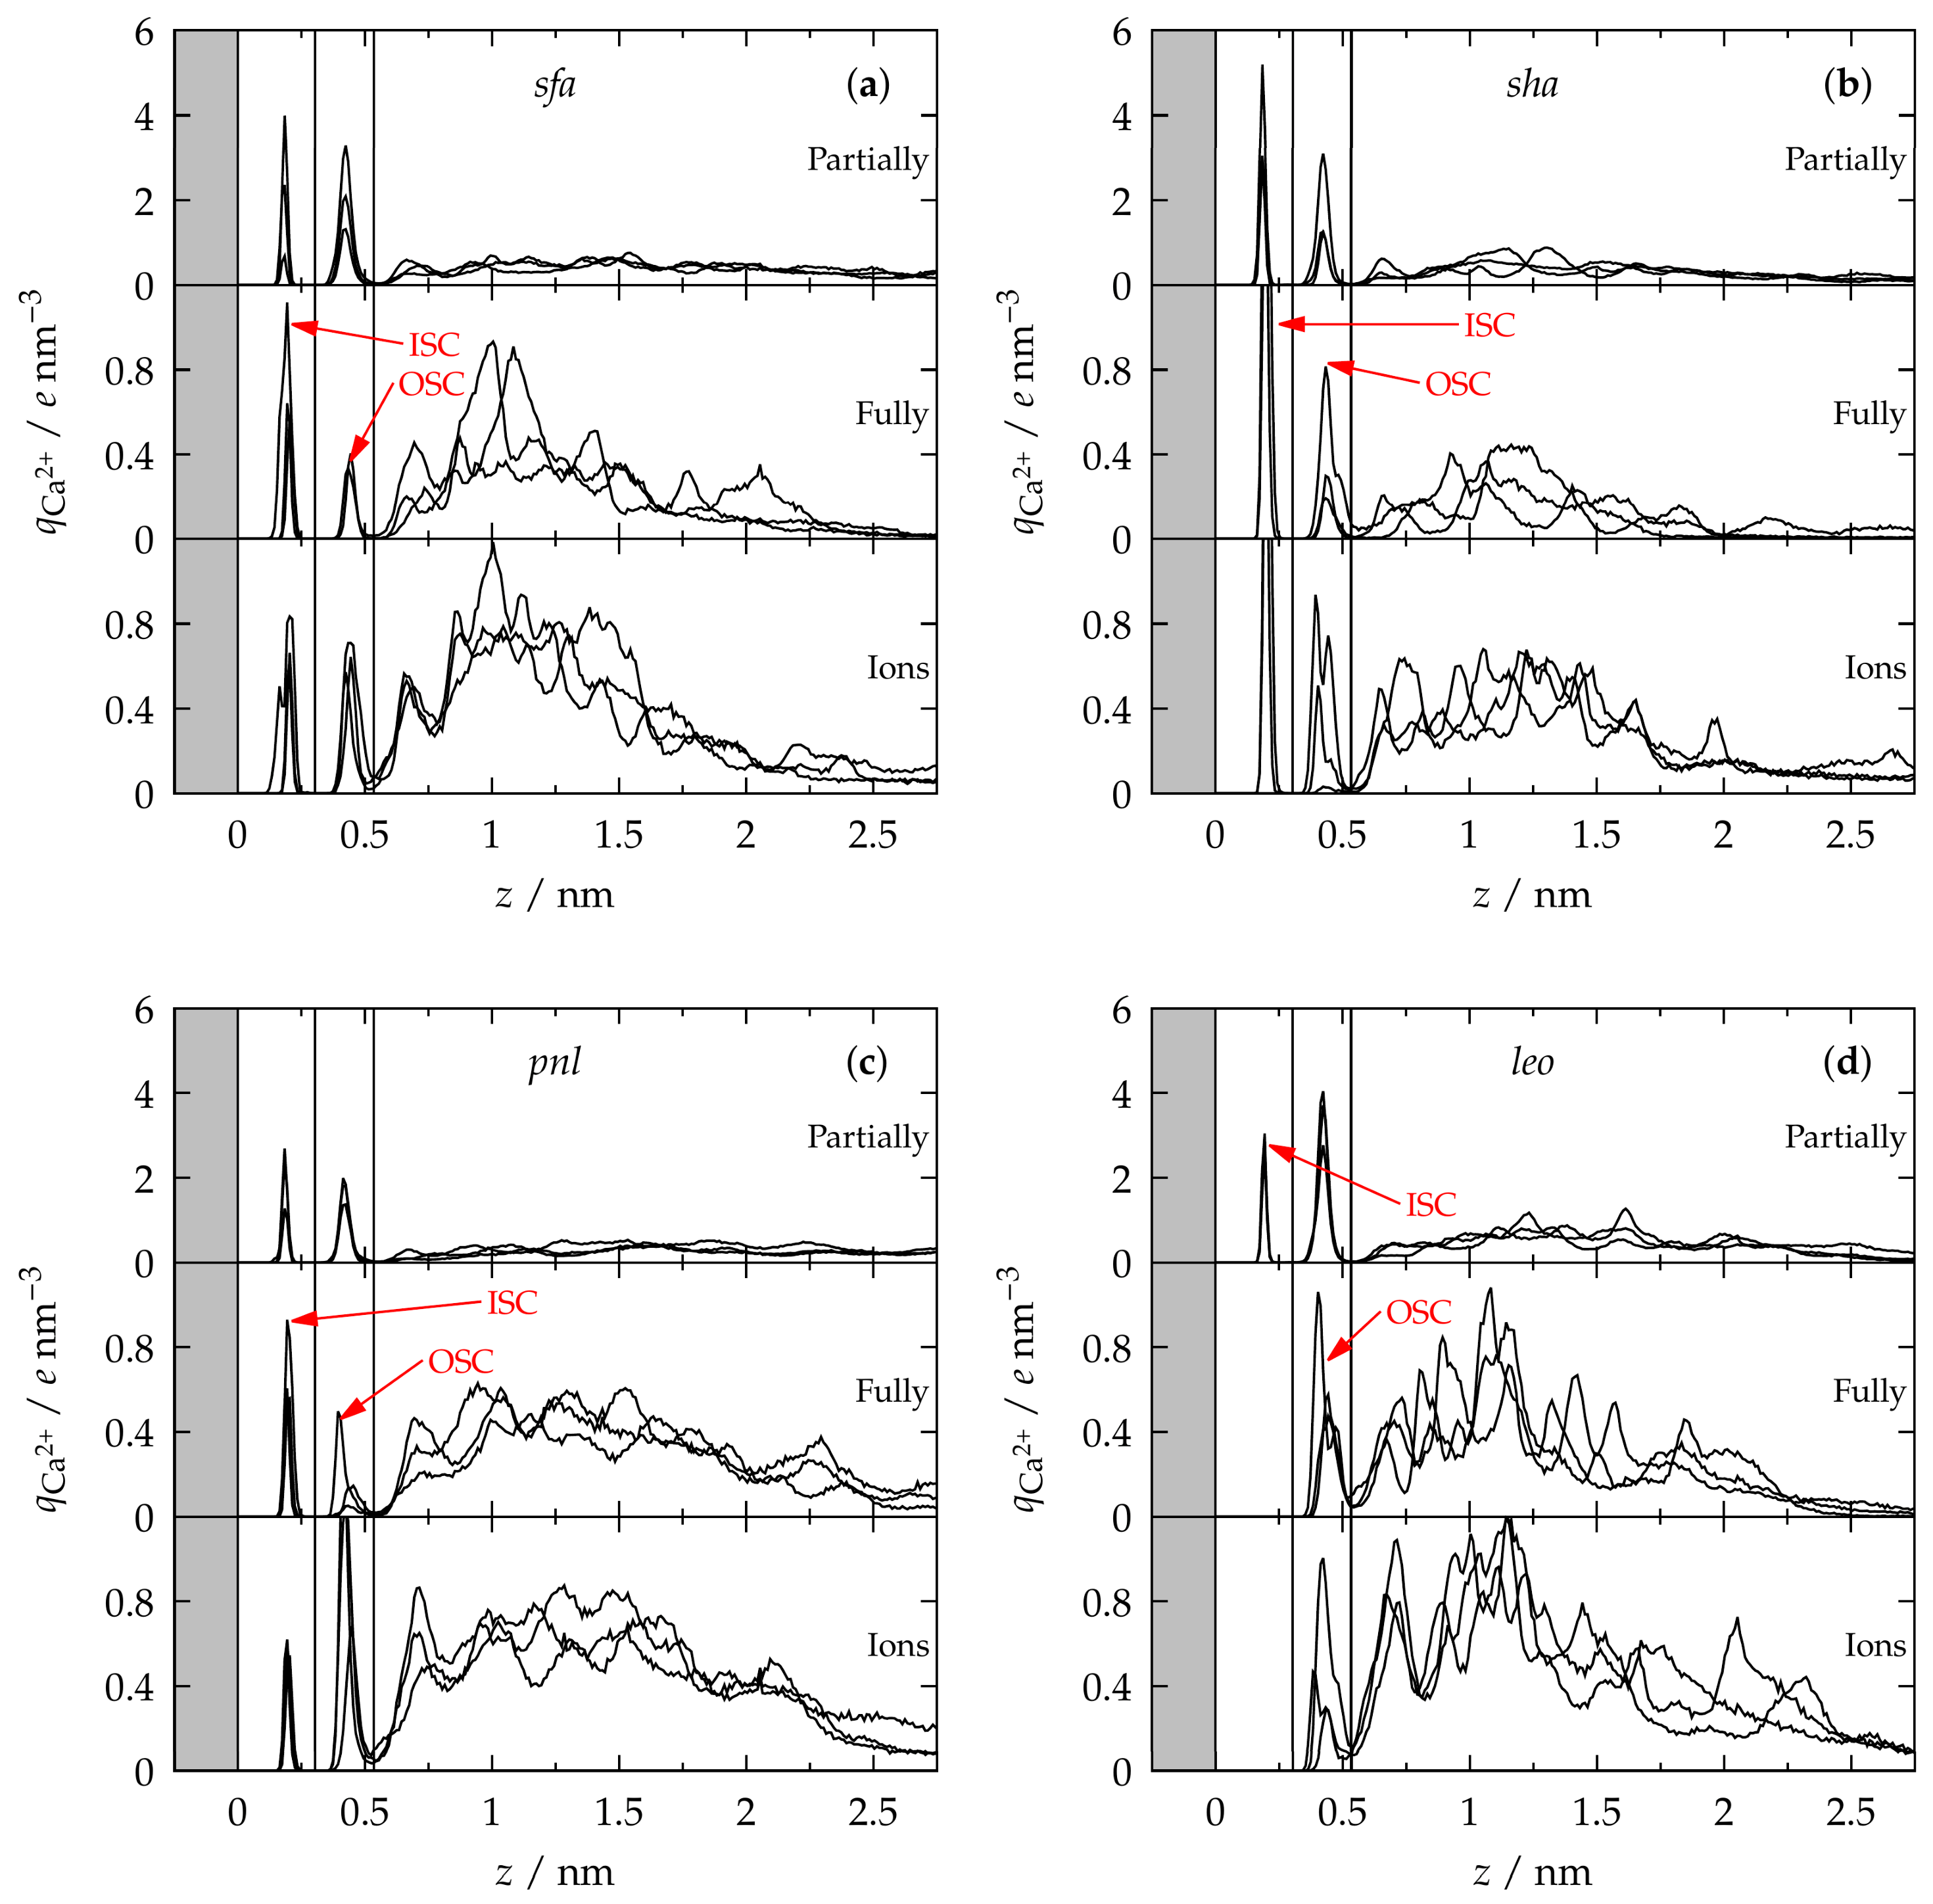
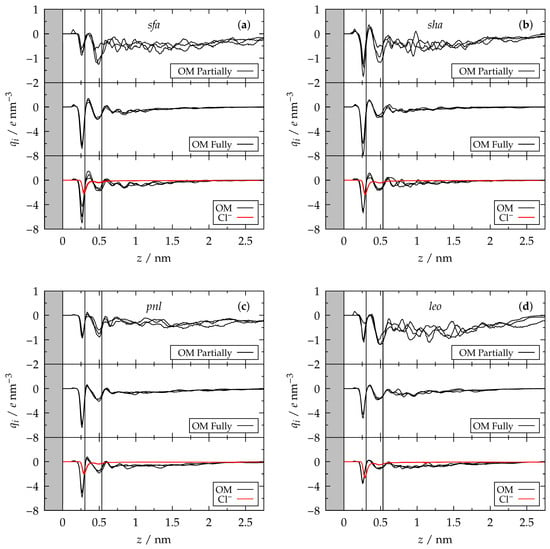
Figure 2 shows the charge-density profile of Ca2+ ions as a function of the perpendicular distance (z) from the Kaolinite aluminol surface. The water content and presence of competing ionic species within the cavity results in an environment which uniquely influences the behavior of OM. This behavior leads to electrostatic fingerprints with OM distributed over the clay mineral surface, consistent with previous results [29]. Overall, the first two peaks close to the mineral surface (at z = 0 nm, surface aluminol oxygens) exhibit the accumulation of Ca2+ positive charges. The short distance of the first peak (z = 0.19 nm) from the mineral surface indicates a direct contact of cations and surface hydroxyls (–OH) in the formed inner-sphere complexes (ISCs), whereas the second peak (z = 0.42 nm) represents the solvent-separated outer-sphere complexes (OSCs).
Figure 2.
Charge-density profile of Ca2+ in OM samples: (a) Suwannee River III fulvic acid (sfa), (b) Suwannee River III humic acid (sha), (c) Pony Lake fulvic acid (pnl), and (d) Leonardite humic acid (leo) within cavities partially filled (top panels), fully filled (middle panels), and fully filled with extra ions (CaCl2 solution) (bottom panels) in three replicas and relative to the aluminol surface. The gray region represents the mineral surface. The peaks corresponding to Ca2+ inner-sphere complex (ISC) and outer-sphere complex (OSC) are pointed with arrows and separated by vertical lines.
Samples with high PC2 values (sfa and sha) exhibited the highest peaks in the ISC region (Figure 2a,b) in all environments, whereas samples with low PC2 (pnl) (Figure 2c) and leo (Figure 2d; top panel) show the lowest peaks, with no ISC structures in fully filled cavities of leo samples (Figure 2d; middle and bottom panels).
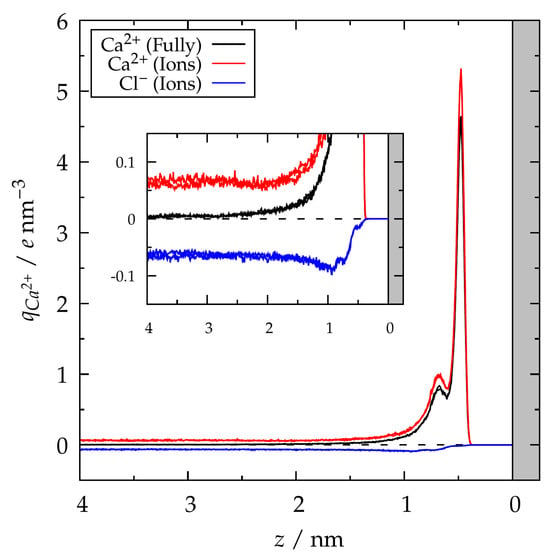
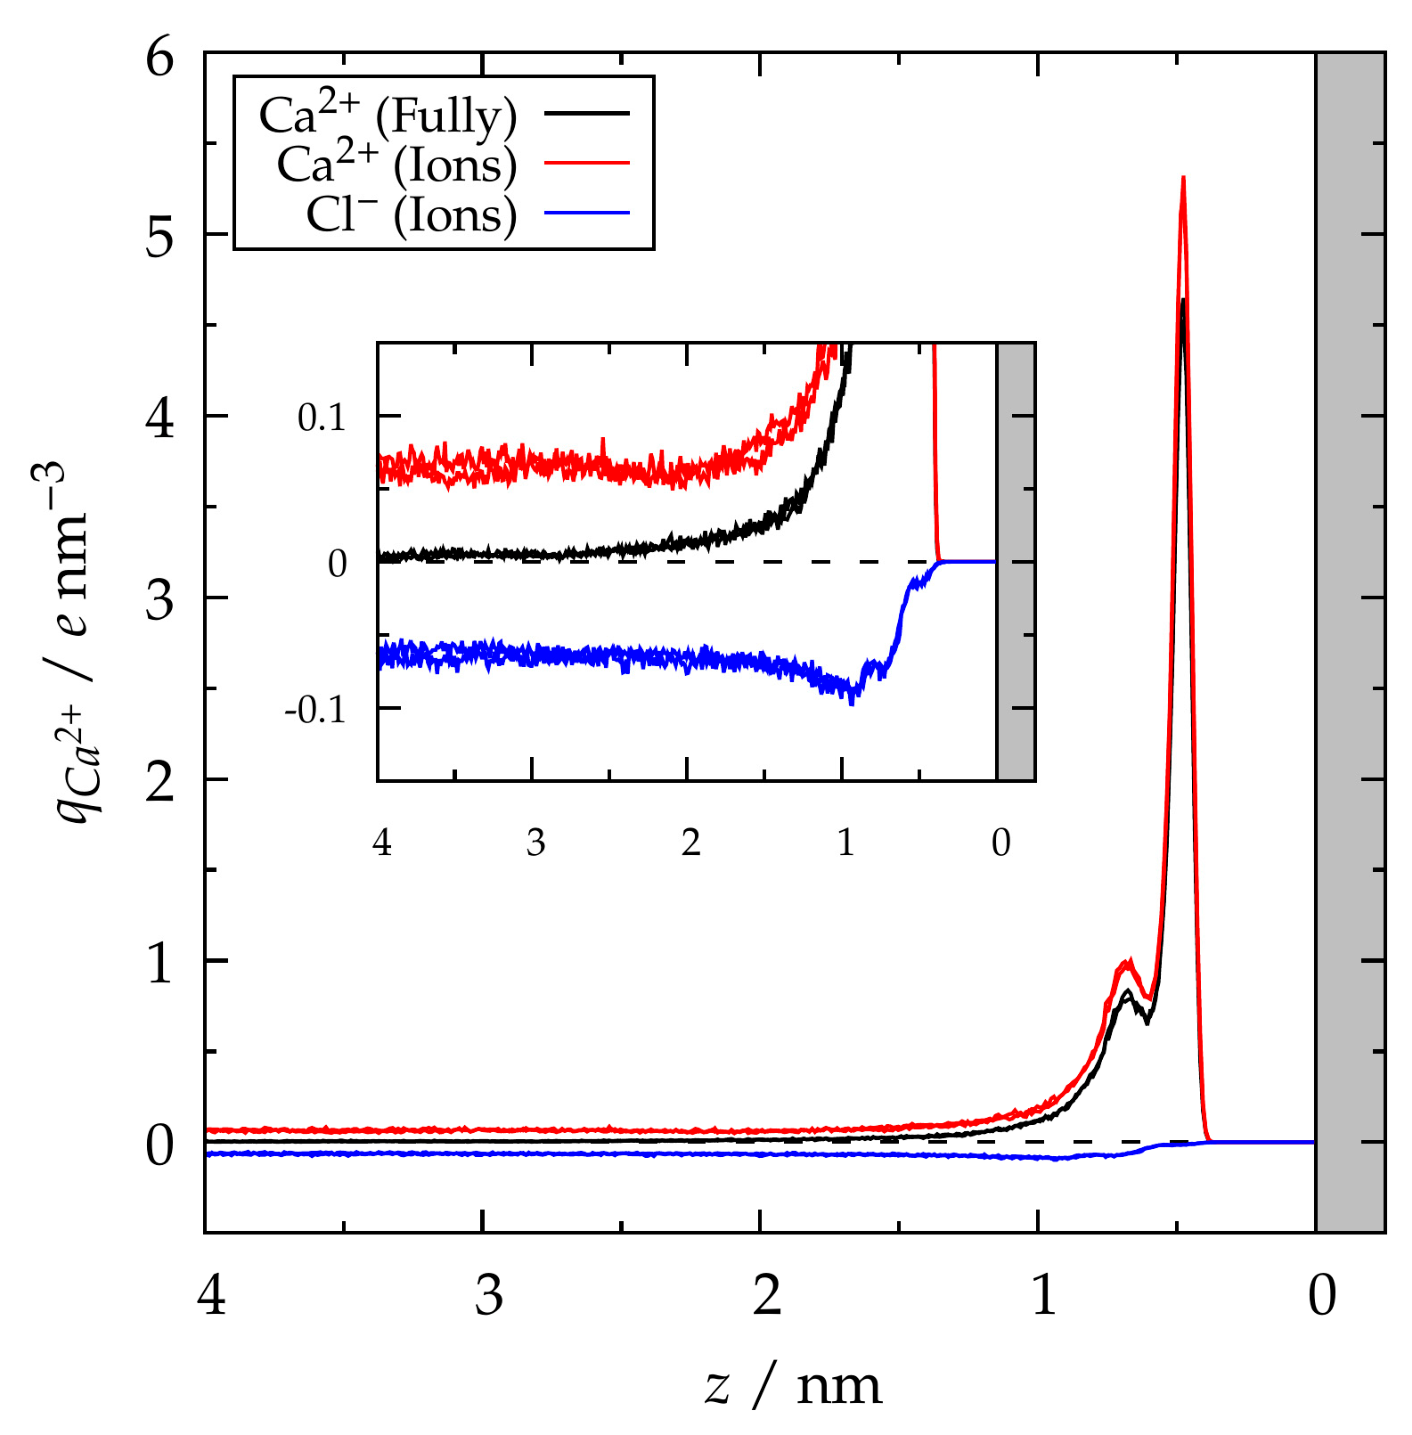
It is known that Ca2+ ions connect OM to the mineral surface through the so-called cation bridges [19,36,51]. This behavior is particularly enhanced in partially filled cavities (Figure 2; top panels); meanwhile, fully filled cavities allow the partial migration of Ca2+ ions onto the siloxane surface of the cavity, as shown in Figure 3 and evidenced by a peak and a shoulder close to the siloxane surface oxygens position (z = 0 nm), with no significant difference observed between any of the soil samples, and in agreement with our previous works [29,46]. This accumulation of Ca2+ on the siloxane side explains the lower content of Ca2+ on the aluminol side in fully filled cavities (Figure 2; middle and bottom panels). Although cations are attracted quite strongly to the siloxane surface, the peak appears at a distance of z = 0.5 nm from the siloxane surface, which is longer than the distance of ISC and OSC structures on the aluminol side. This behavior is attributed to the known hydrophobicity of siloxane surfaces [31].
Figure 3.
Charge-density profile of Ca2+ ions in Suwanee River III fulvic acid sfa within fully filled cavities (black line) and fully filled cavities with ions (red line) in three replicas and relative to the siloxane surface. The gray region represents the mineral surface.
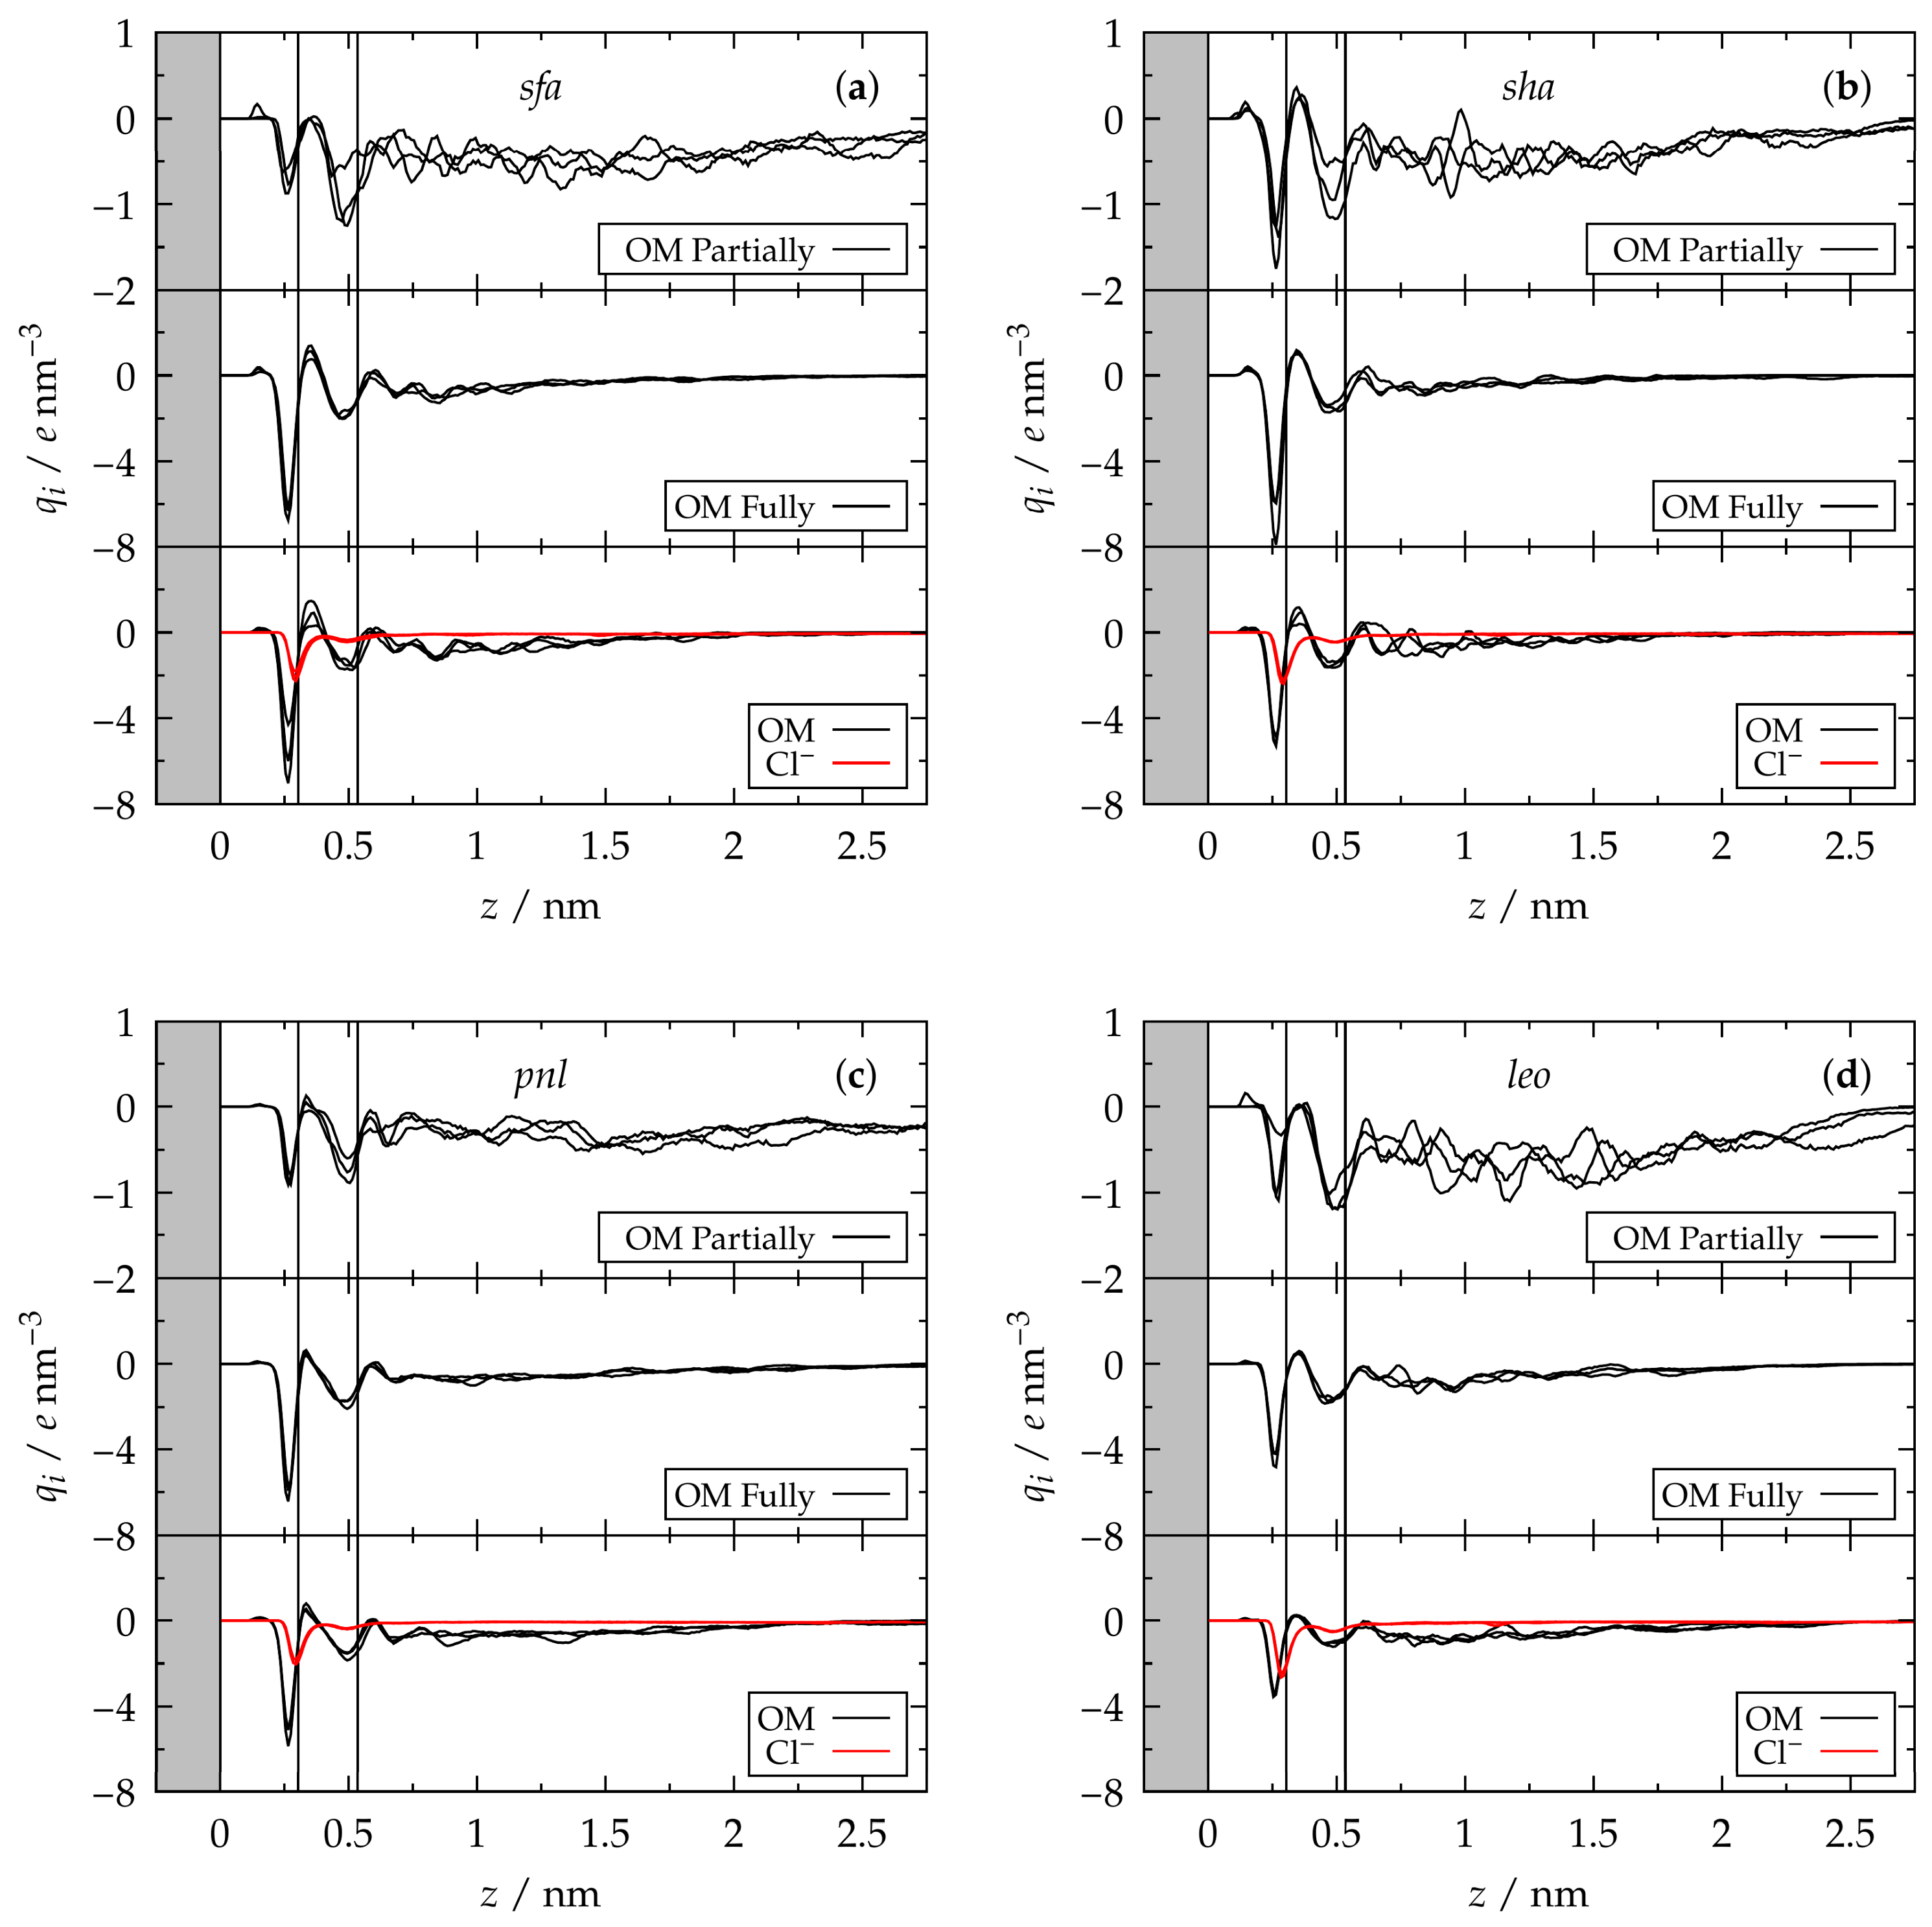
In contrast to the cations, the polyanionic nature of OM results in a more complex interaction with other OM molecules and the mineral. Partially filled cavities exhibit the lowest concentration of negative OM charges on the aluminol side (Figure 4; top panels), with the first OM minimum located in the ISC region of Ca2+ ions. This behavior reinforces the idea of Ca2+ forming bridges that hold OM to the mineral. However, the increased concentration of negative charges of OM in fully filled cavities with low Ca2+ content on the aluminol side suggests that another mechanism drives the adsorption.
Figure 4.
Charge-density profile of i-species in OM samples: (a) Suwannee River III fulvic acid (sfa), (b) Suwannee River III humic acid (sha), (c) Pony Lake fulvic acid (pnl), and (d) Leonardite humic acid (leo) within partially filled cavities (top panels), fully filled cavities (middle panels), and fully filled cavities with extra ions (CaCl2 solution) (bottom panels) in three replicas and relative to the aluminol surface. The gray region represents the mineral surface. The regions corresponding to Ca2+ inner-sphere complex (ISC) and outer-sphere complex (OSC) structures are separated by vertical lines.
In simulations of cavities in the presence of Cl− ions, these adsorb on the aluminol side, similar to OM, although to a lesser degree (Figure 4; bottom panels), with some of the Cl− ions forming ionic pairs with Ca2+ ions in the middle region of the cavity. Unlike Ca2+ and OM, Cl− ions show consistent distribution profiles across replicas, while their profiles differ among OM samples. Together, these results indicate that each soil sample exerts a unique electrostatic fingerprint dependent on the organic composition. On the other hand, with the appearance of Cl− ions, the peak of OM in the ISC region decreased its intensity in all the samples, suggesting that anions replace OM from the surface by squeezing it out.
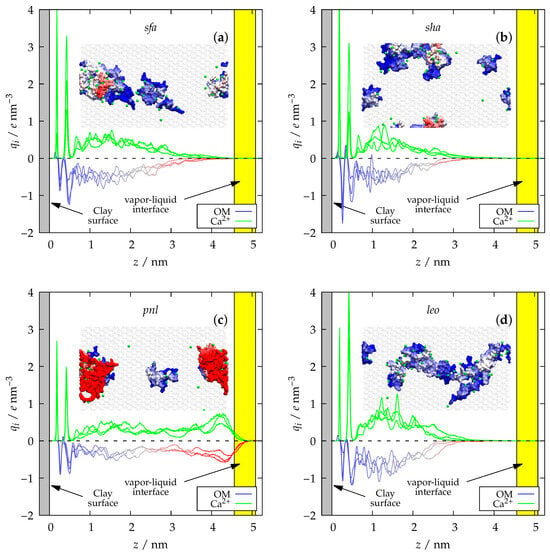
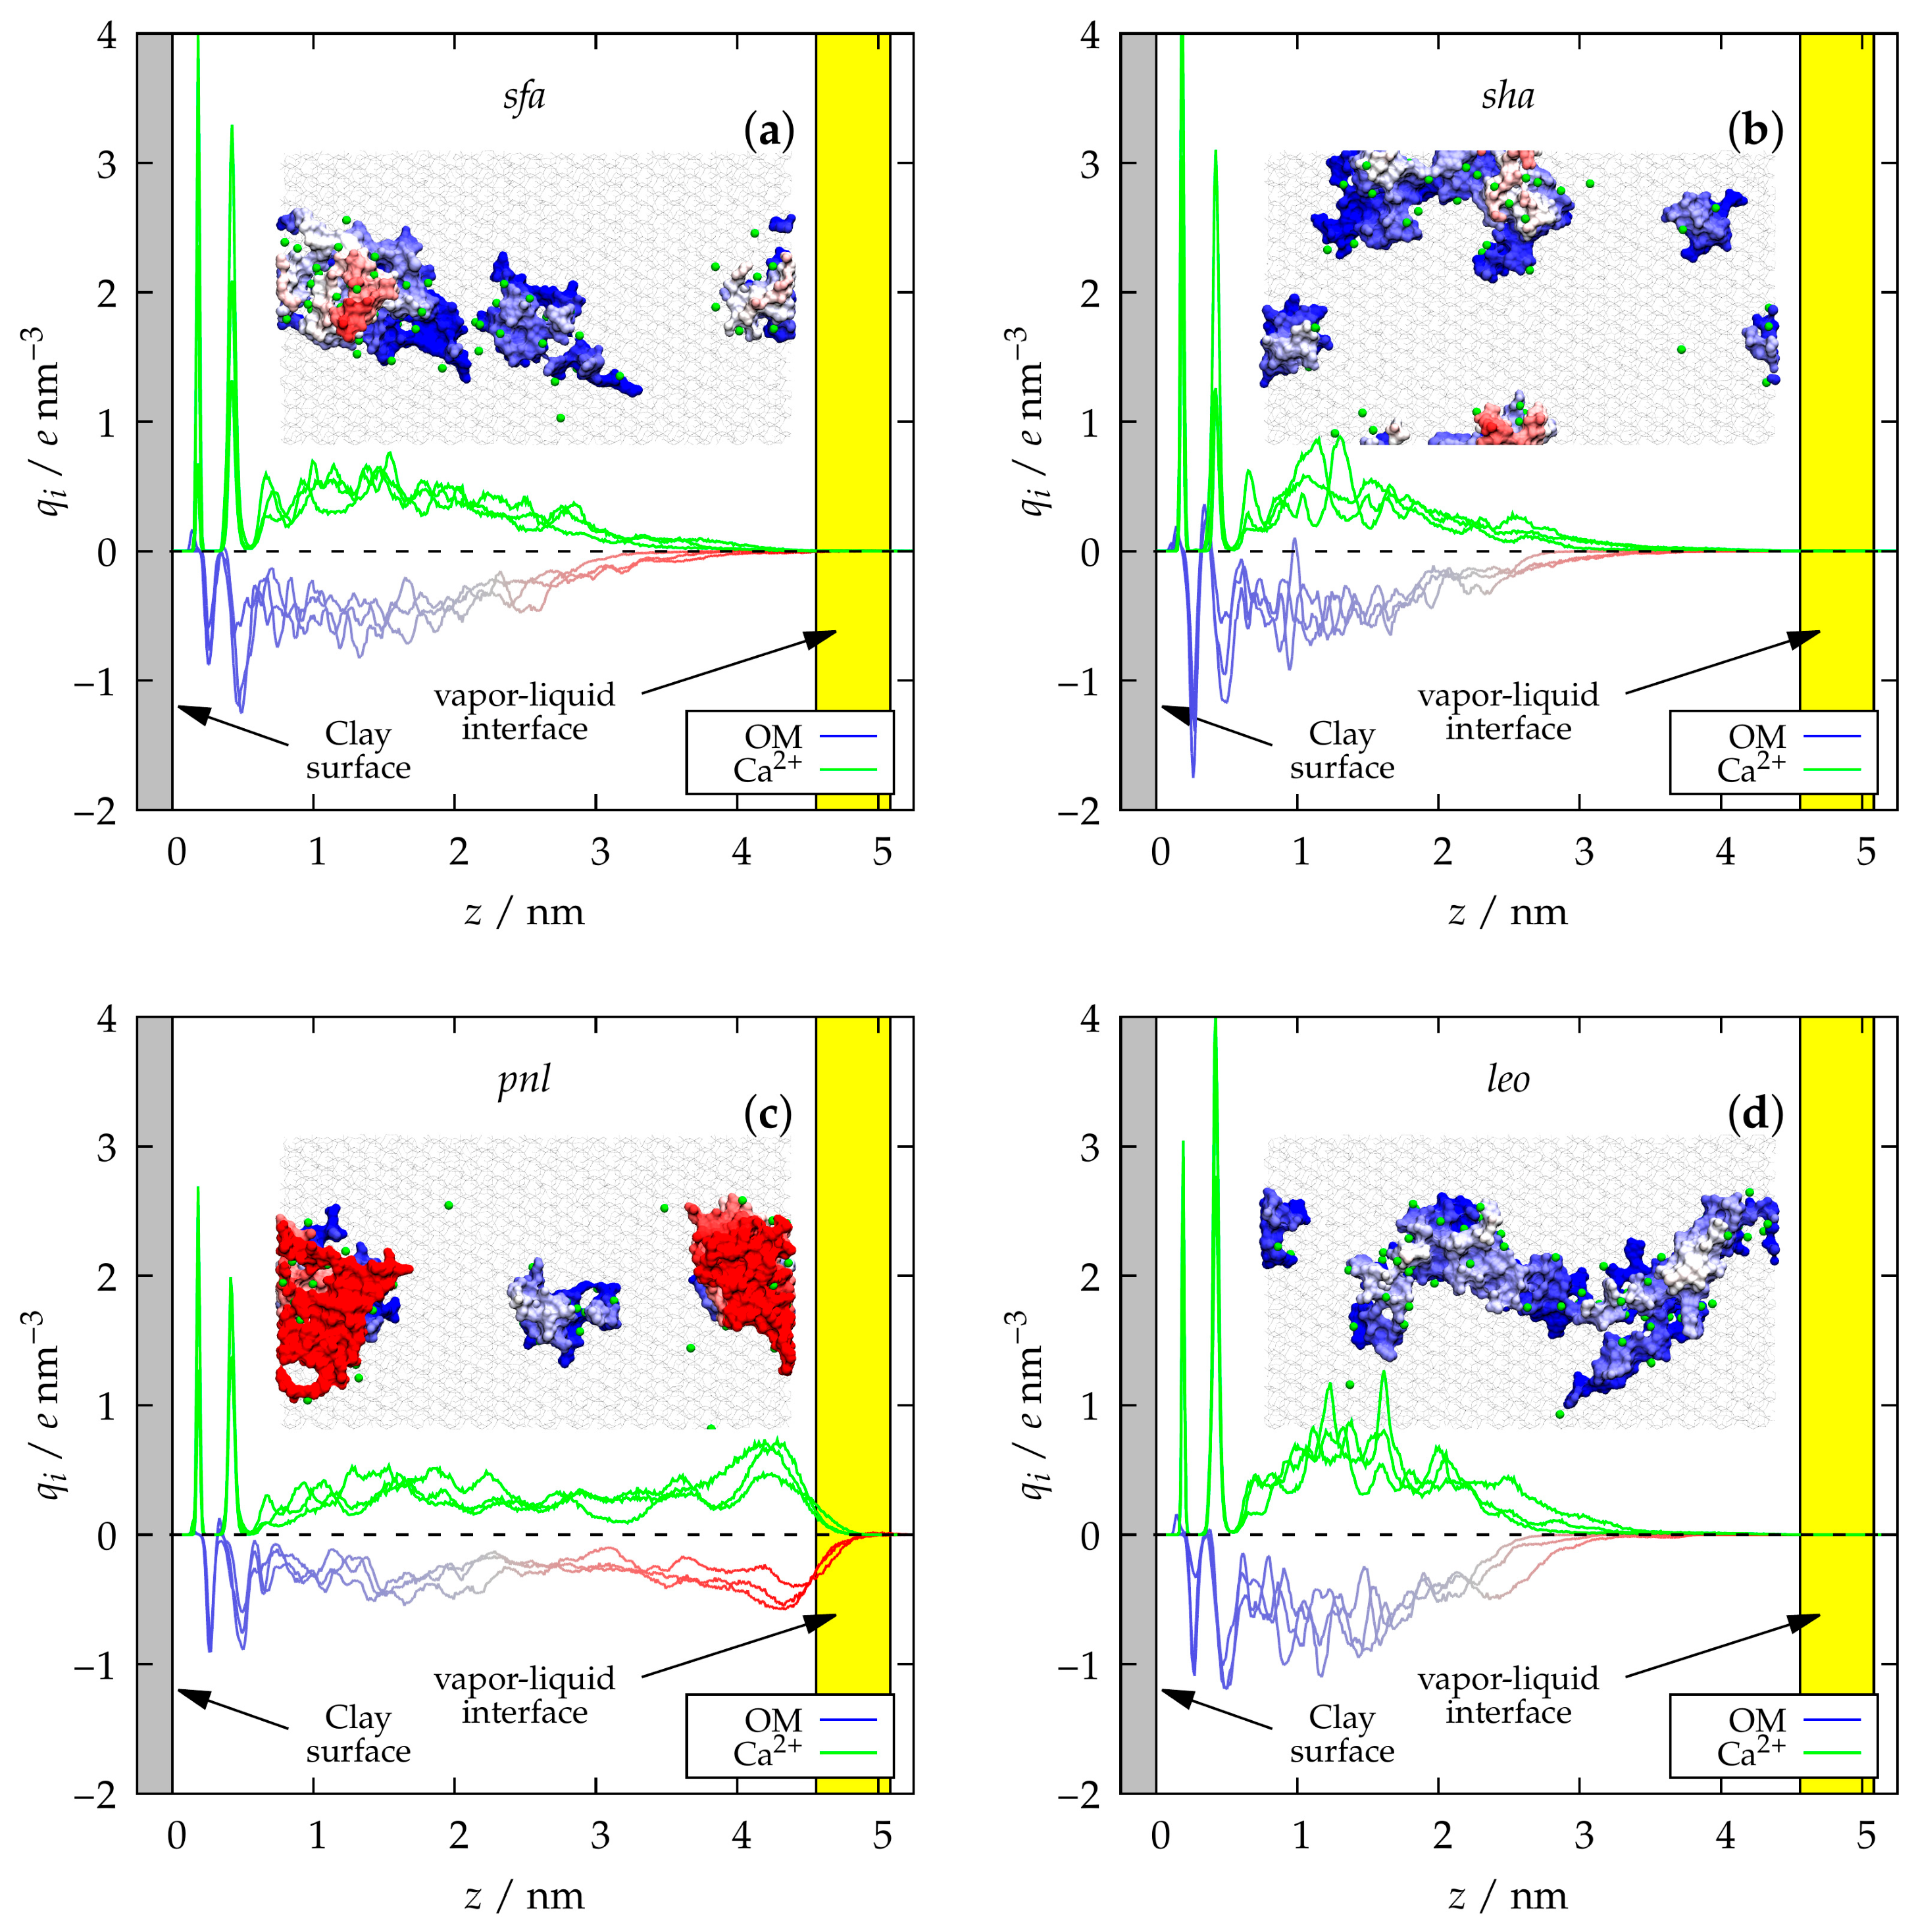
Comparing the OM and Ca2+ profiles in the partially filled cavities, in which all Ca2+ ions are absorbed on the aluminol surface, we observed an intercalating behavior with both Ca2+ neutralizing the negatively charged OM by mirroring its profile after the OSC region (Figure 5). Among the electrostatic fingerprints of OM samples, it can be observed that most of the molecules in the OM samples with high PC2 values (sfa and sha) (Figure 5a,b) are adsorbed close to the mineral, leaving few molecules exposed to the solvent. On the other hand, in Figure 5c, part of pnl adsorbed on the surface, whereas the most hydrophobic molecules, due to its high content of aliphatic groups (see Table 1), are located preferentially at the vapor–liquid interface (yellow region). Finally, leo molecules exhibited the closest proximity to the surface (Figure 5d) of all OM samples due to strong charge accumulation in the region 1 < z < 3 nm, placing its molecules far from the vapor–liquid interface.
Figure 5.
Charge-density profile of i-species in OM samples (a) Suwannee River III fulvic acid (sfa), (b) Suwannee River III humic acid (sha), (c) Pony Lake fulvic acid (pnl), and (d) Leonardite humic acid (leo) within partially filled cavities in three replicas and relative to the aluminol surface. The gray and yellow regions represent the mineral surface and the vapor–liquid interface within the cavity, respectively. The insets display a snapshot from the top point of view of the cavity. The blue–white–red gradient corresponds to the z-position of OM, relative to the clay mineral. The green color represents the Ca2+.
3.2. Order Parameter
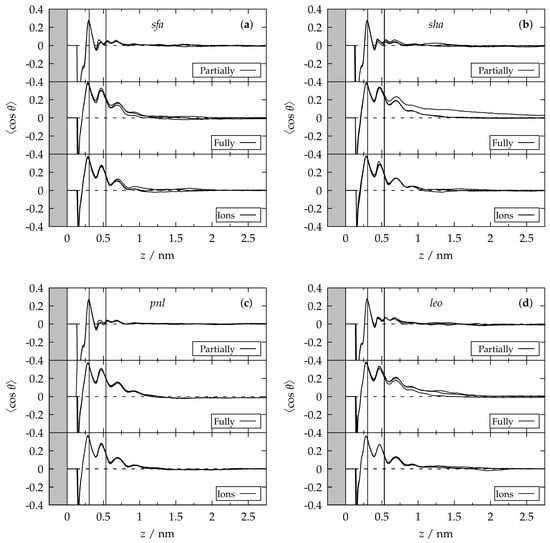
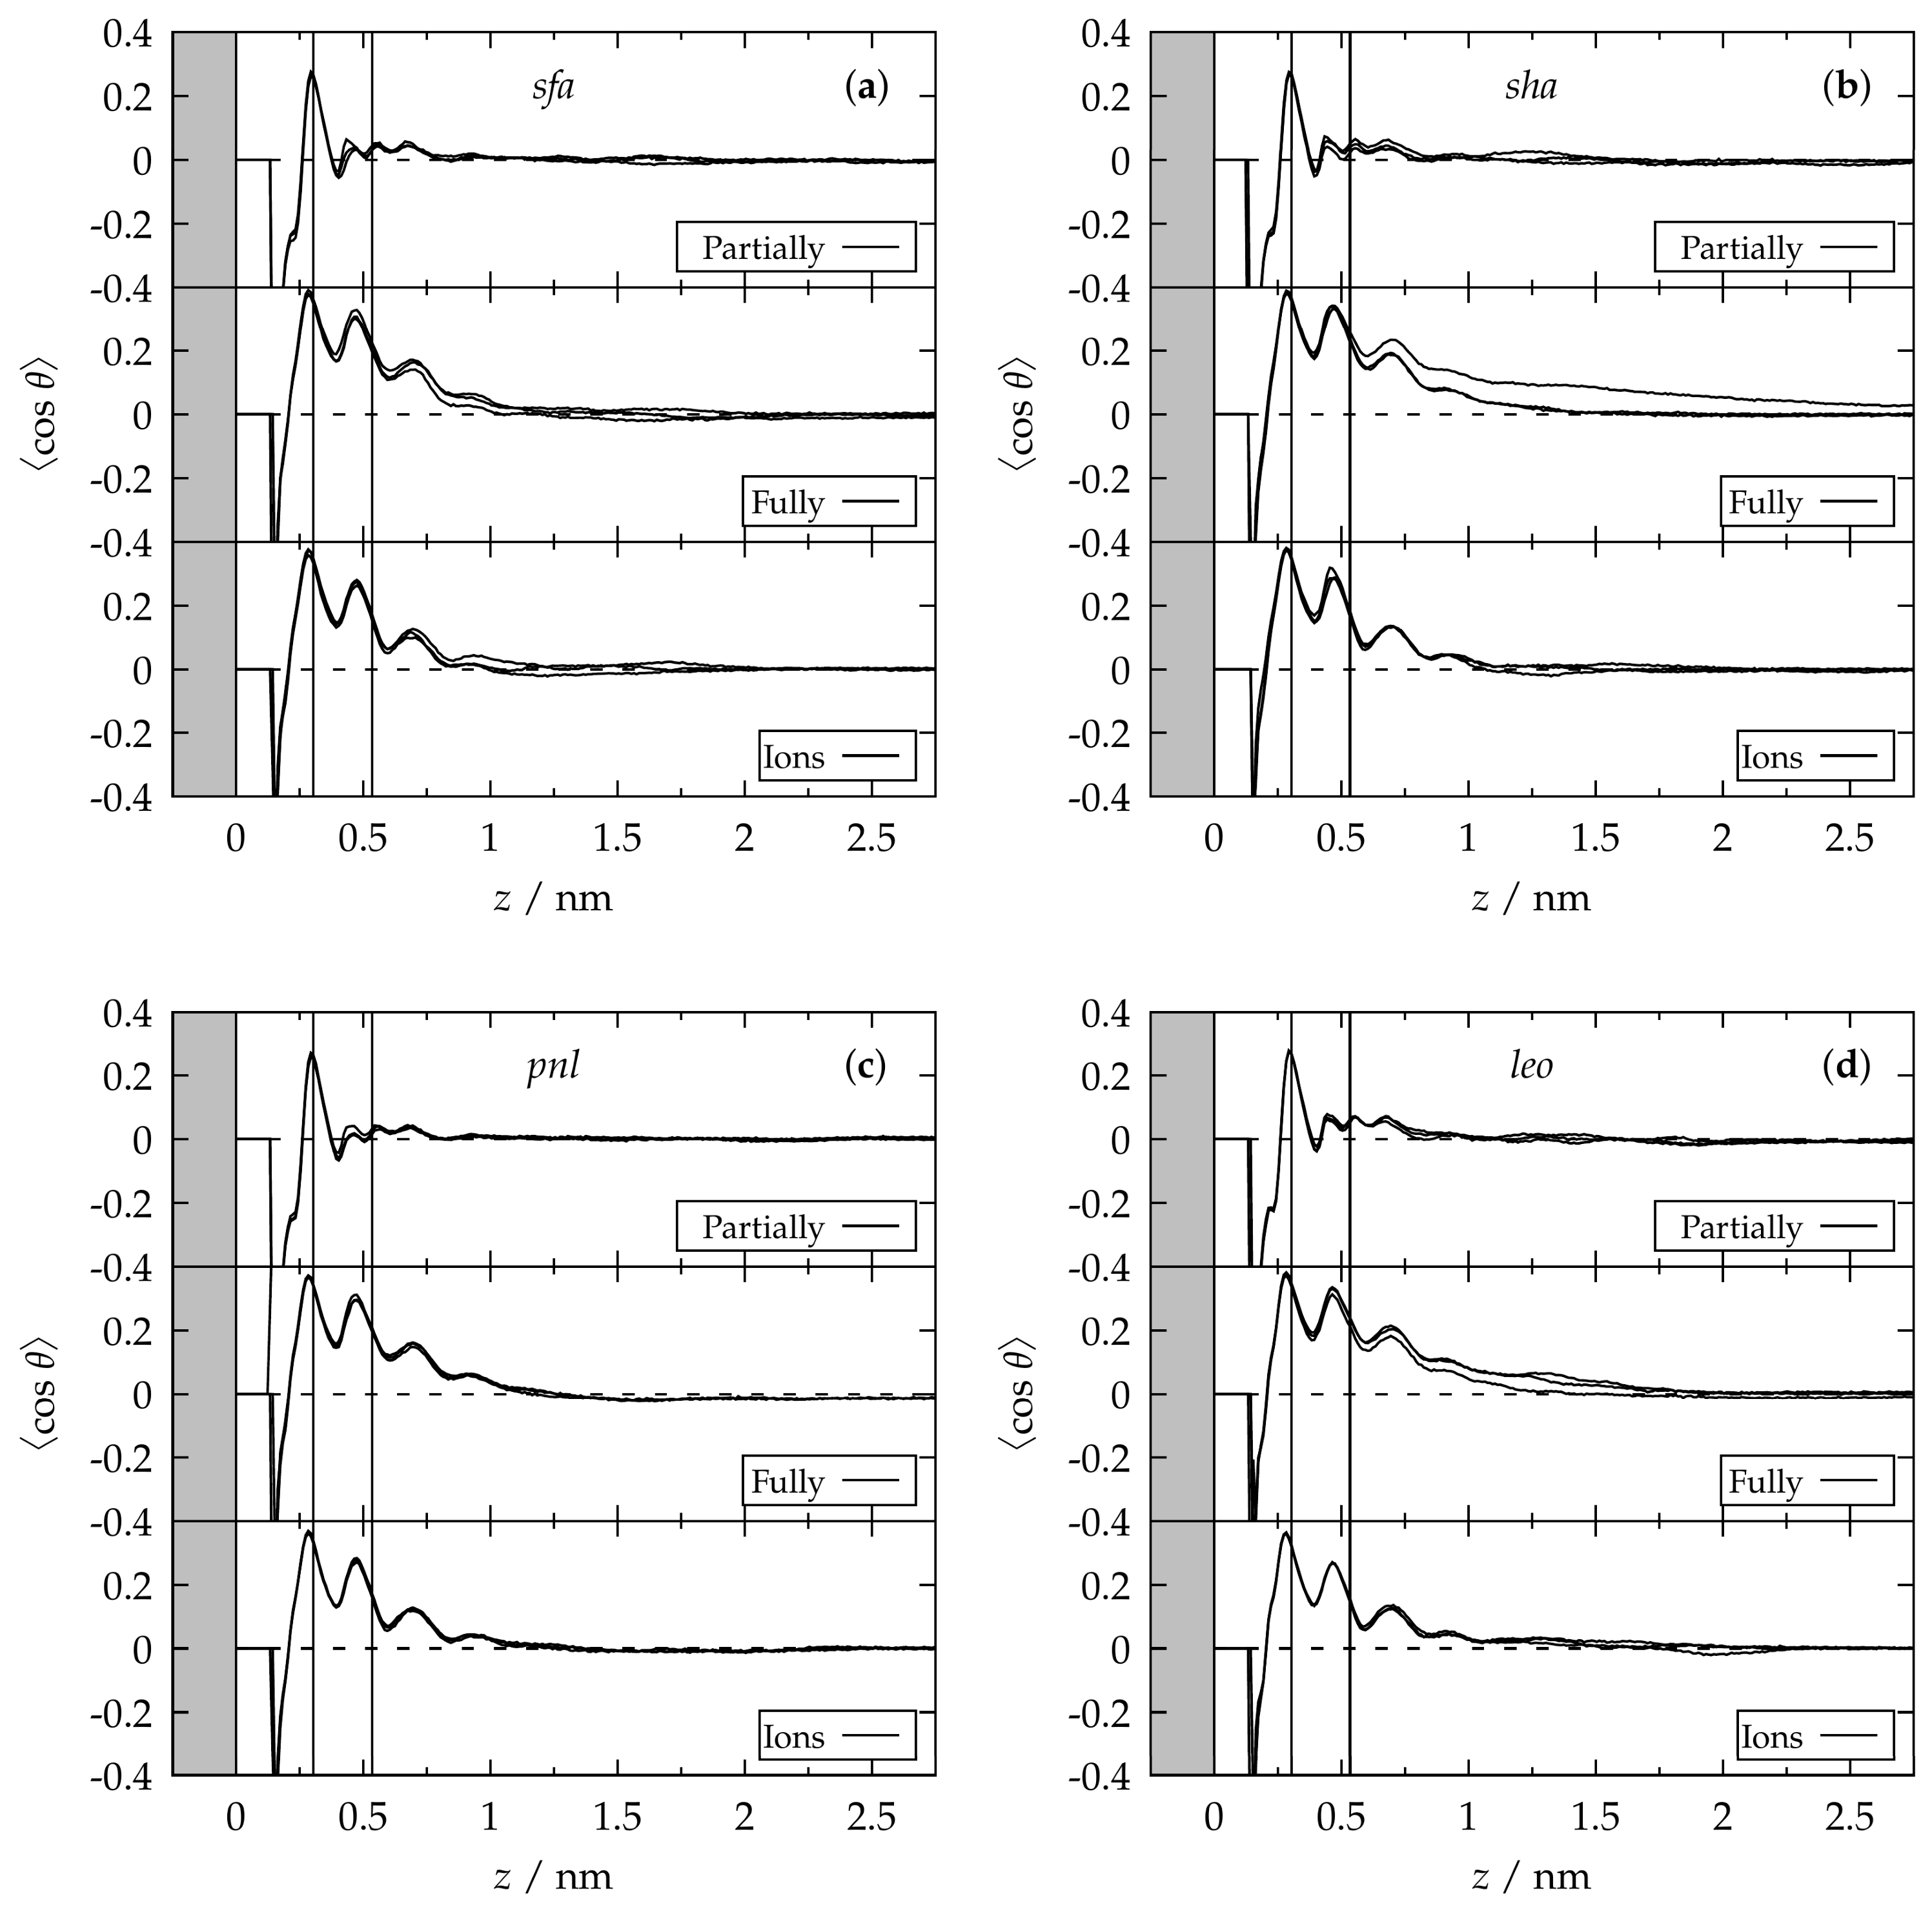
Although OM molecules define fingerprints, this feature is also reflected on the electrostatic response of the surrounding environment, namely the solvent. We assessed the electrostatic response of the solvent with the order parameter profile of the water dipole moment (Figure 6). Close to the mineral surface, a strong polarization was observed; however, far from it, at z > 1 nm, the order parameter converges to zero in all samples, evidencing the random orientation of the water’s dipole moment that is typical for bulk phase.
Figure 6.
Order parameter profile of water’s dipole moment relative to the surface norm in OM samples: (a) Suwannee River III fulvic acid (sfa), (b) Suwannee River III humic acid (sha), (c) Pony Lake fulvic acid (pnl), and (d) Leonardite humic acid (leo) within partially filled cavities (top panels), fully filled cavities (middle panels), and fully filled cavities with extra ions (CaCl2 solution) (bottom panels) in three replicas and relative to the aluminol surface. The gray region represents the mineral surface. The regions corresponding to Ca2+ inner-sphere complex (ISC) and outer-sphere complex (OSC) structures are separated by vertical lines.
In all partially filled cavities, after the first peak at z = 0.19 nm, small perturbations were observed; then, after z = 0.82 nm, the water oriented randomly closer to the surface (top panels) in comparison to fully filled cavities. No difference was observed among different OM samples, suggesting that although the soil solution has a unique fingerprint, the water orients similarly. Moreover, the similarity between fully filled cavities with and without CaCl2 implies that addition of extra ions has no impact on the solvent ordering.
3.3. Electrostatic Potential
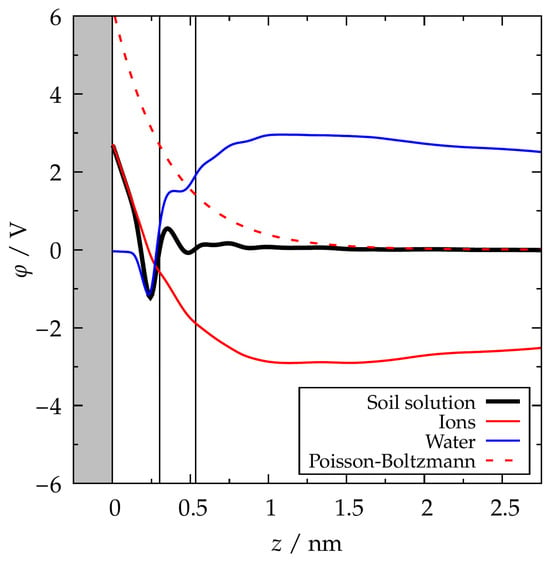
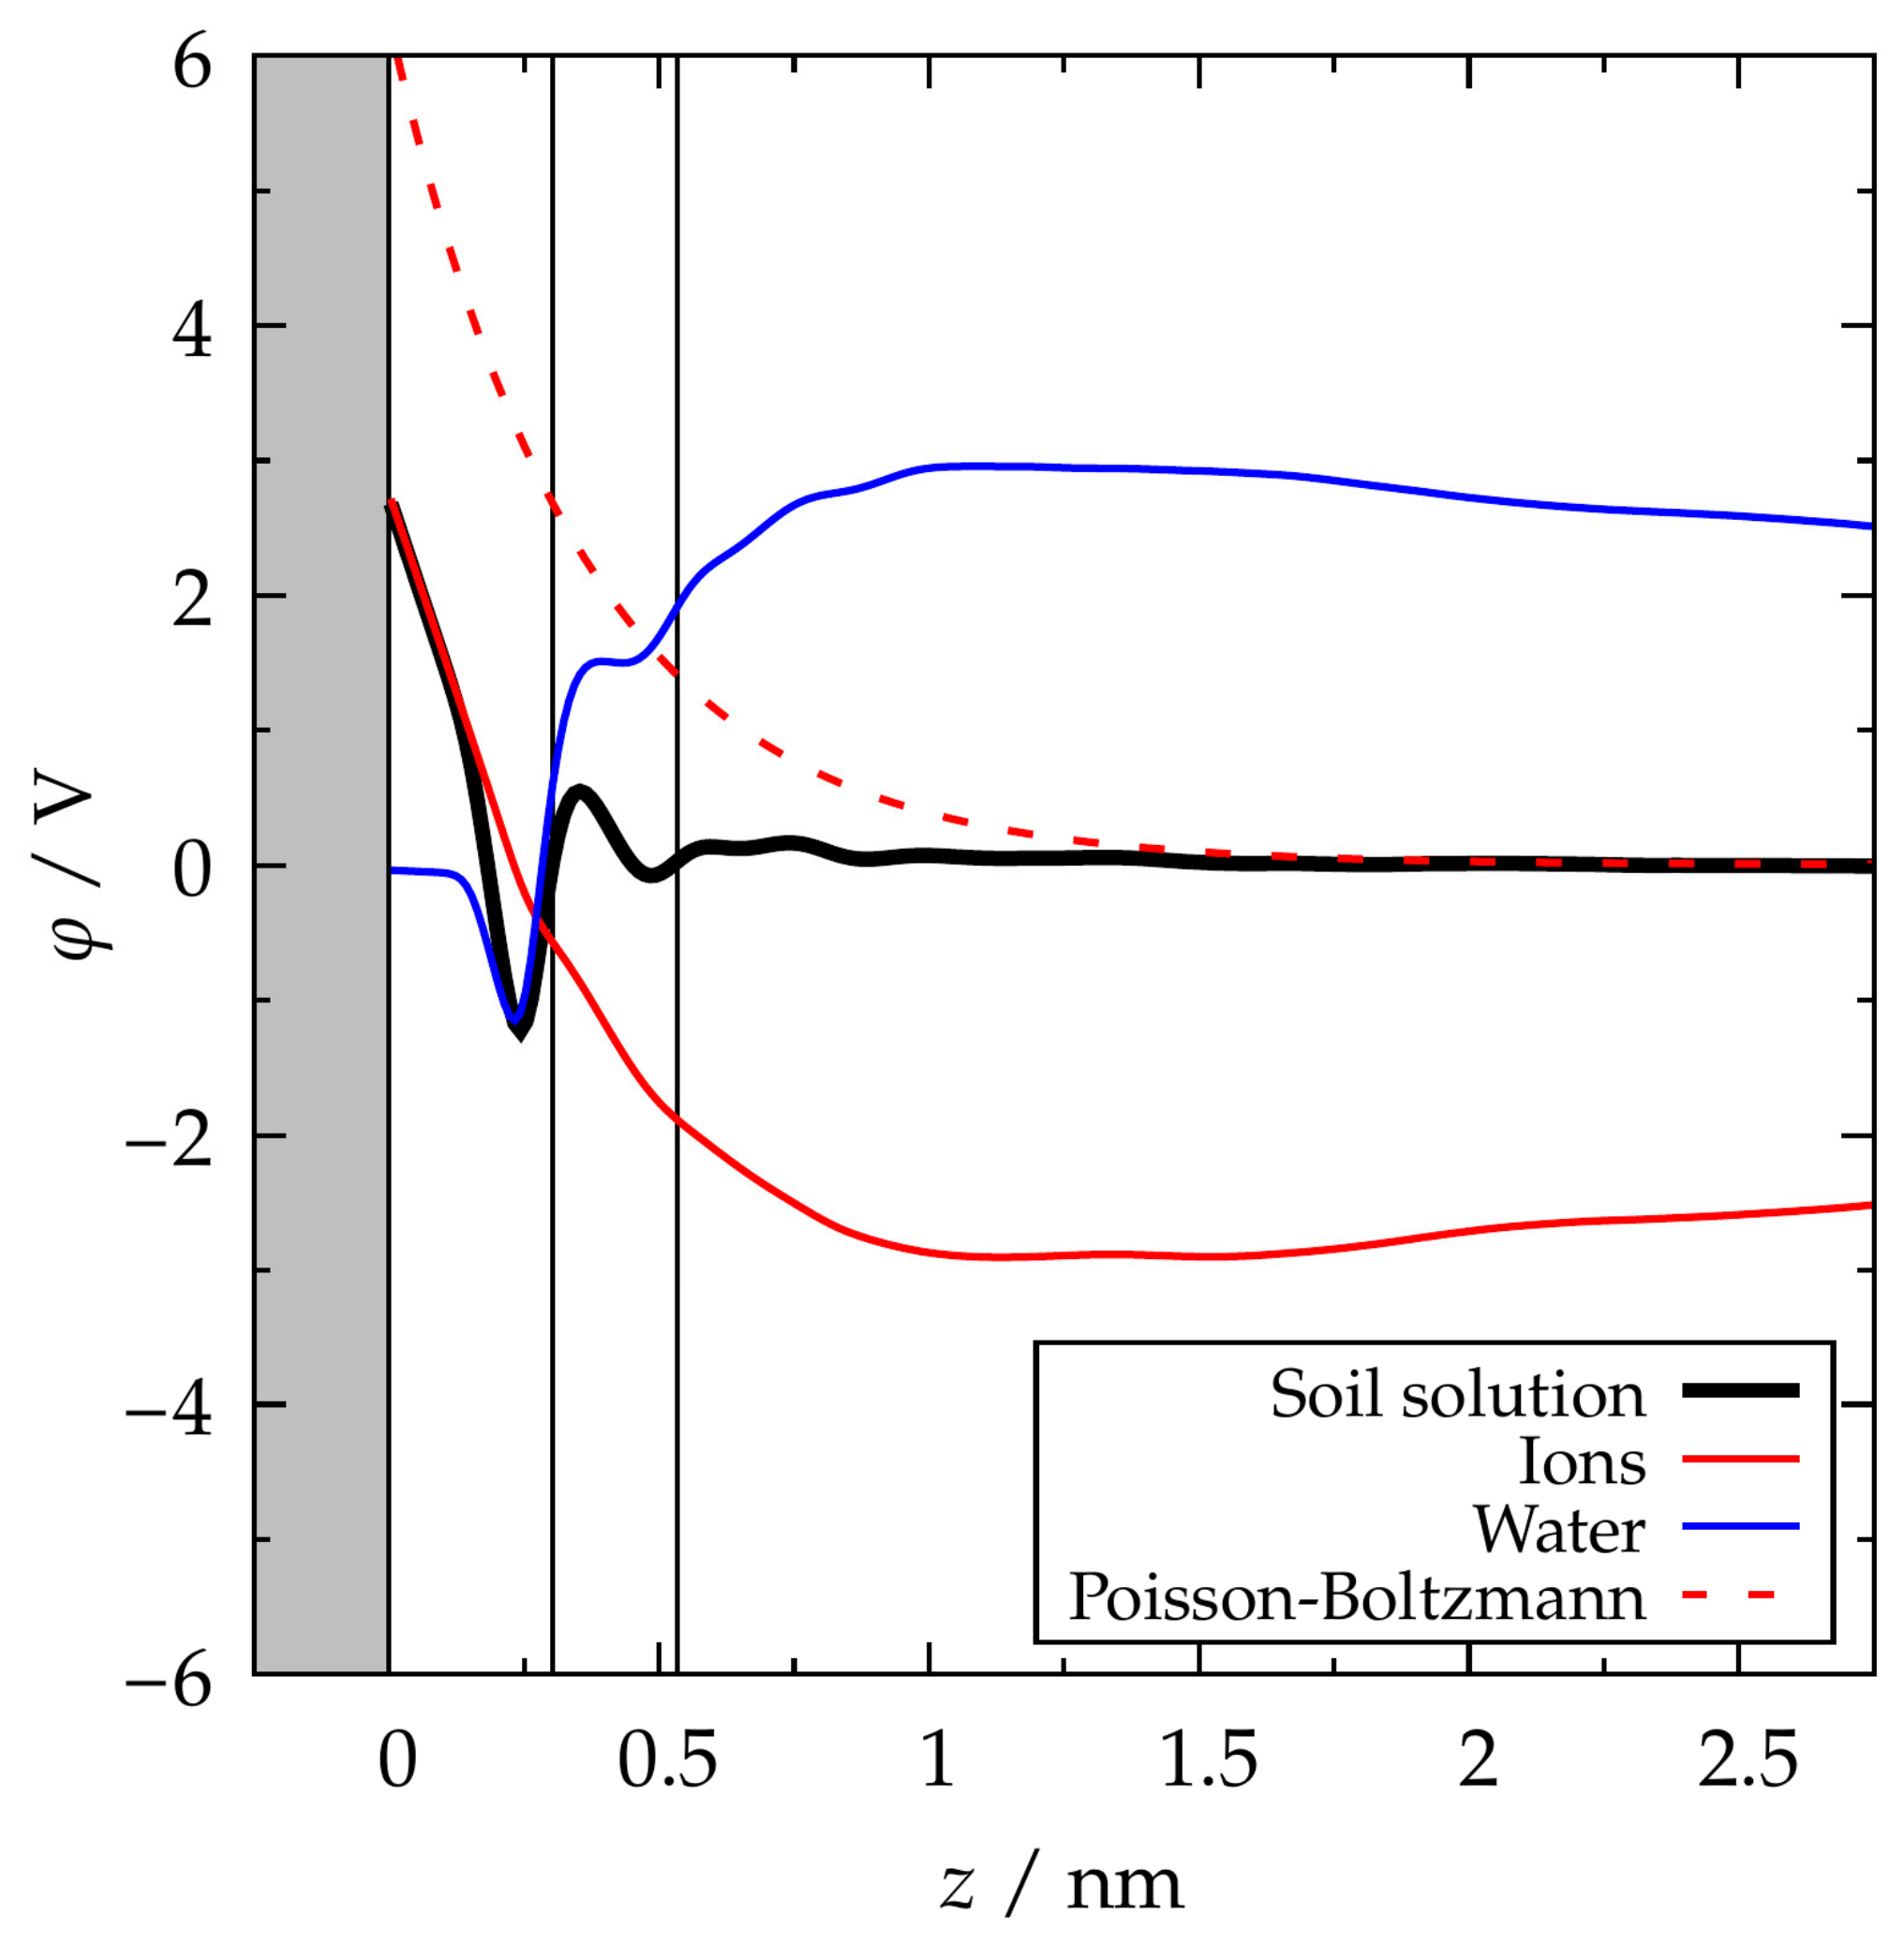
The electrostatic potential profile of the OM in water solution is given by the black curve in Figure 7. Theoretically, the electrostatic potential at the solid–liquid interface is represented by the Poisson–Boltzmann potential (Figure 7; red dashed curve). This curve is indeed similar to the one obtained from the contributions of the ionic species in the simulation box (OM and Ca2+; red curve). The structure in the black curve emerges from the contributions of the solvent (blue curve). The water (blue curve) influences the slope of the contributions of the Ca2+ ions at z < 0.2 nm, while at z > 1 nm, the potential of water is equal and opposite to the ionic potential, resulting in a total potential with zero value, confirming the behavior of the soil solution as a bulk phase at distances greater than 1 nm from the aluminol surface.
Figure 7.
Electrostatic potential profile in Suwannee River III fulvic acid (sfa) sample within a fully filled cavity of the soil solution (water + Ca2+ + OM; black curve) relative to the aluminol surface. The contributions to the electrostatic potential due to ions (Ca2+ + OM; solid red curve) and water molecules (blue curve) were computed separately. A typical Poisson–Boltzmann potential is displayed as dashed lines. The regions corresponding to Ca2+ inner-sphere complex (ISC) and outer-sphere complex (OSC) structures are separated by vertical lines. The gray region represents the mineral surface.
3.4. Complex Structures Across the EDL
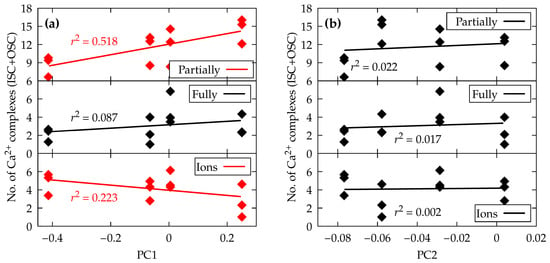
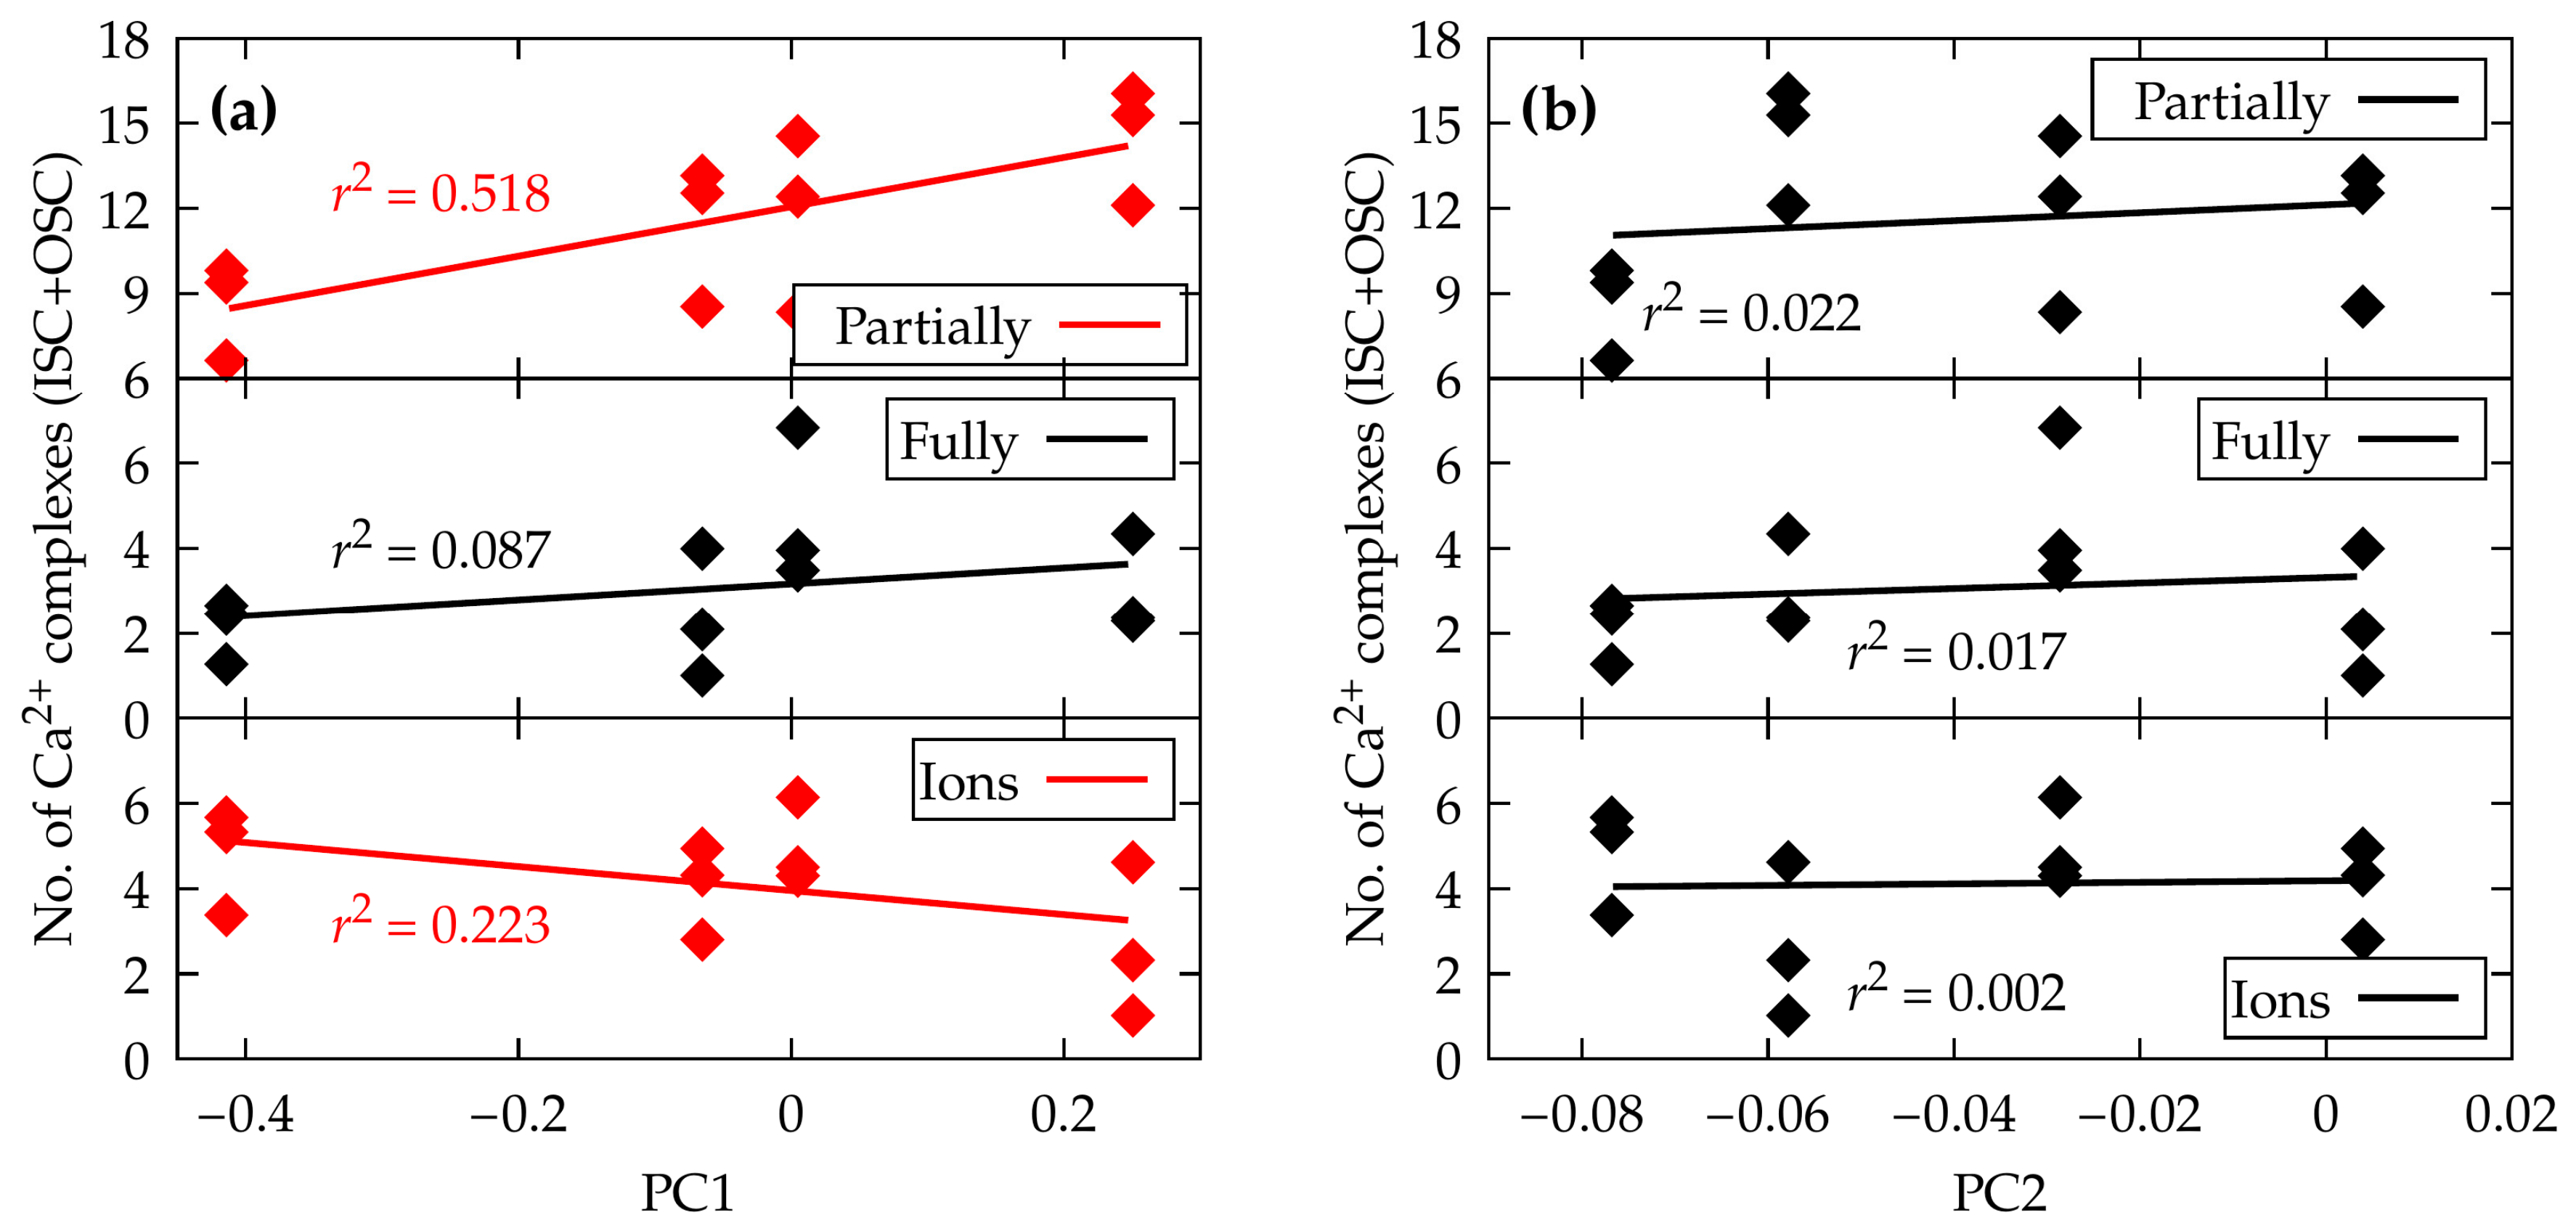
We computed the total number of Ca2+ ions forming complex structures (ISC + OSC) and found a higher correlation (r2 > 0.2) with PC1 than with PC2 (Figure 8). Overall, OM samples with high aromaticity, such as leo, favor the formation of cation bridges between OM and the mineral (Figure 8a top and middle panels). The number of Ca2+ sites is the highest in partially filled cavities, as the cations are confined within the slab of water—more specifically, in the OSC region (see Figure A2)—whereas, in fully filled cavities, they are not correlated. On the other hand, the presence of Cl− ions changes the trend favoring bridging OM in samples with low aromaticity, such as the pnl sample.
Figure 8.
Linear correlation of the principal components (a) PC1 and (b) PC2 with the total number of Ca2+ ions forming complex structures (ISC + OSC) of OM samples within cavities partially filled (top panels), fully filled (middle panels), and fully filled with extra ions (CaCl2 solution) (bottom panels). Curves in red indicate a high r2 value, i.e., greater than 0.2.
3.5. Non-Bonding Interactions
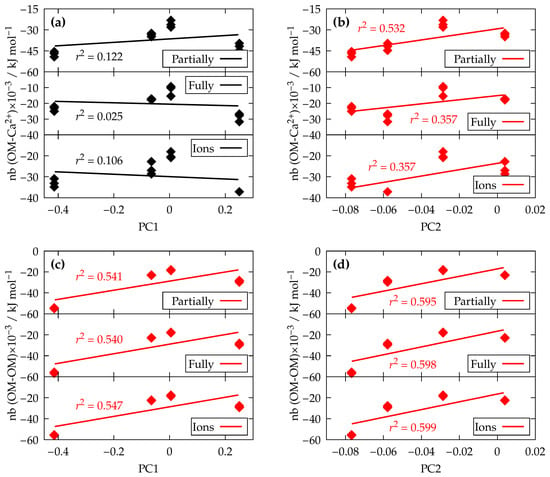
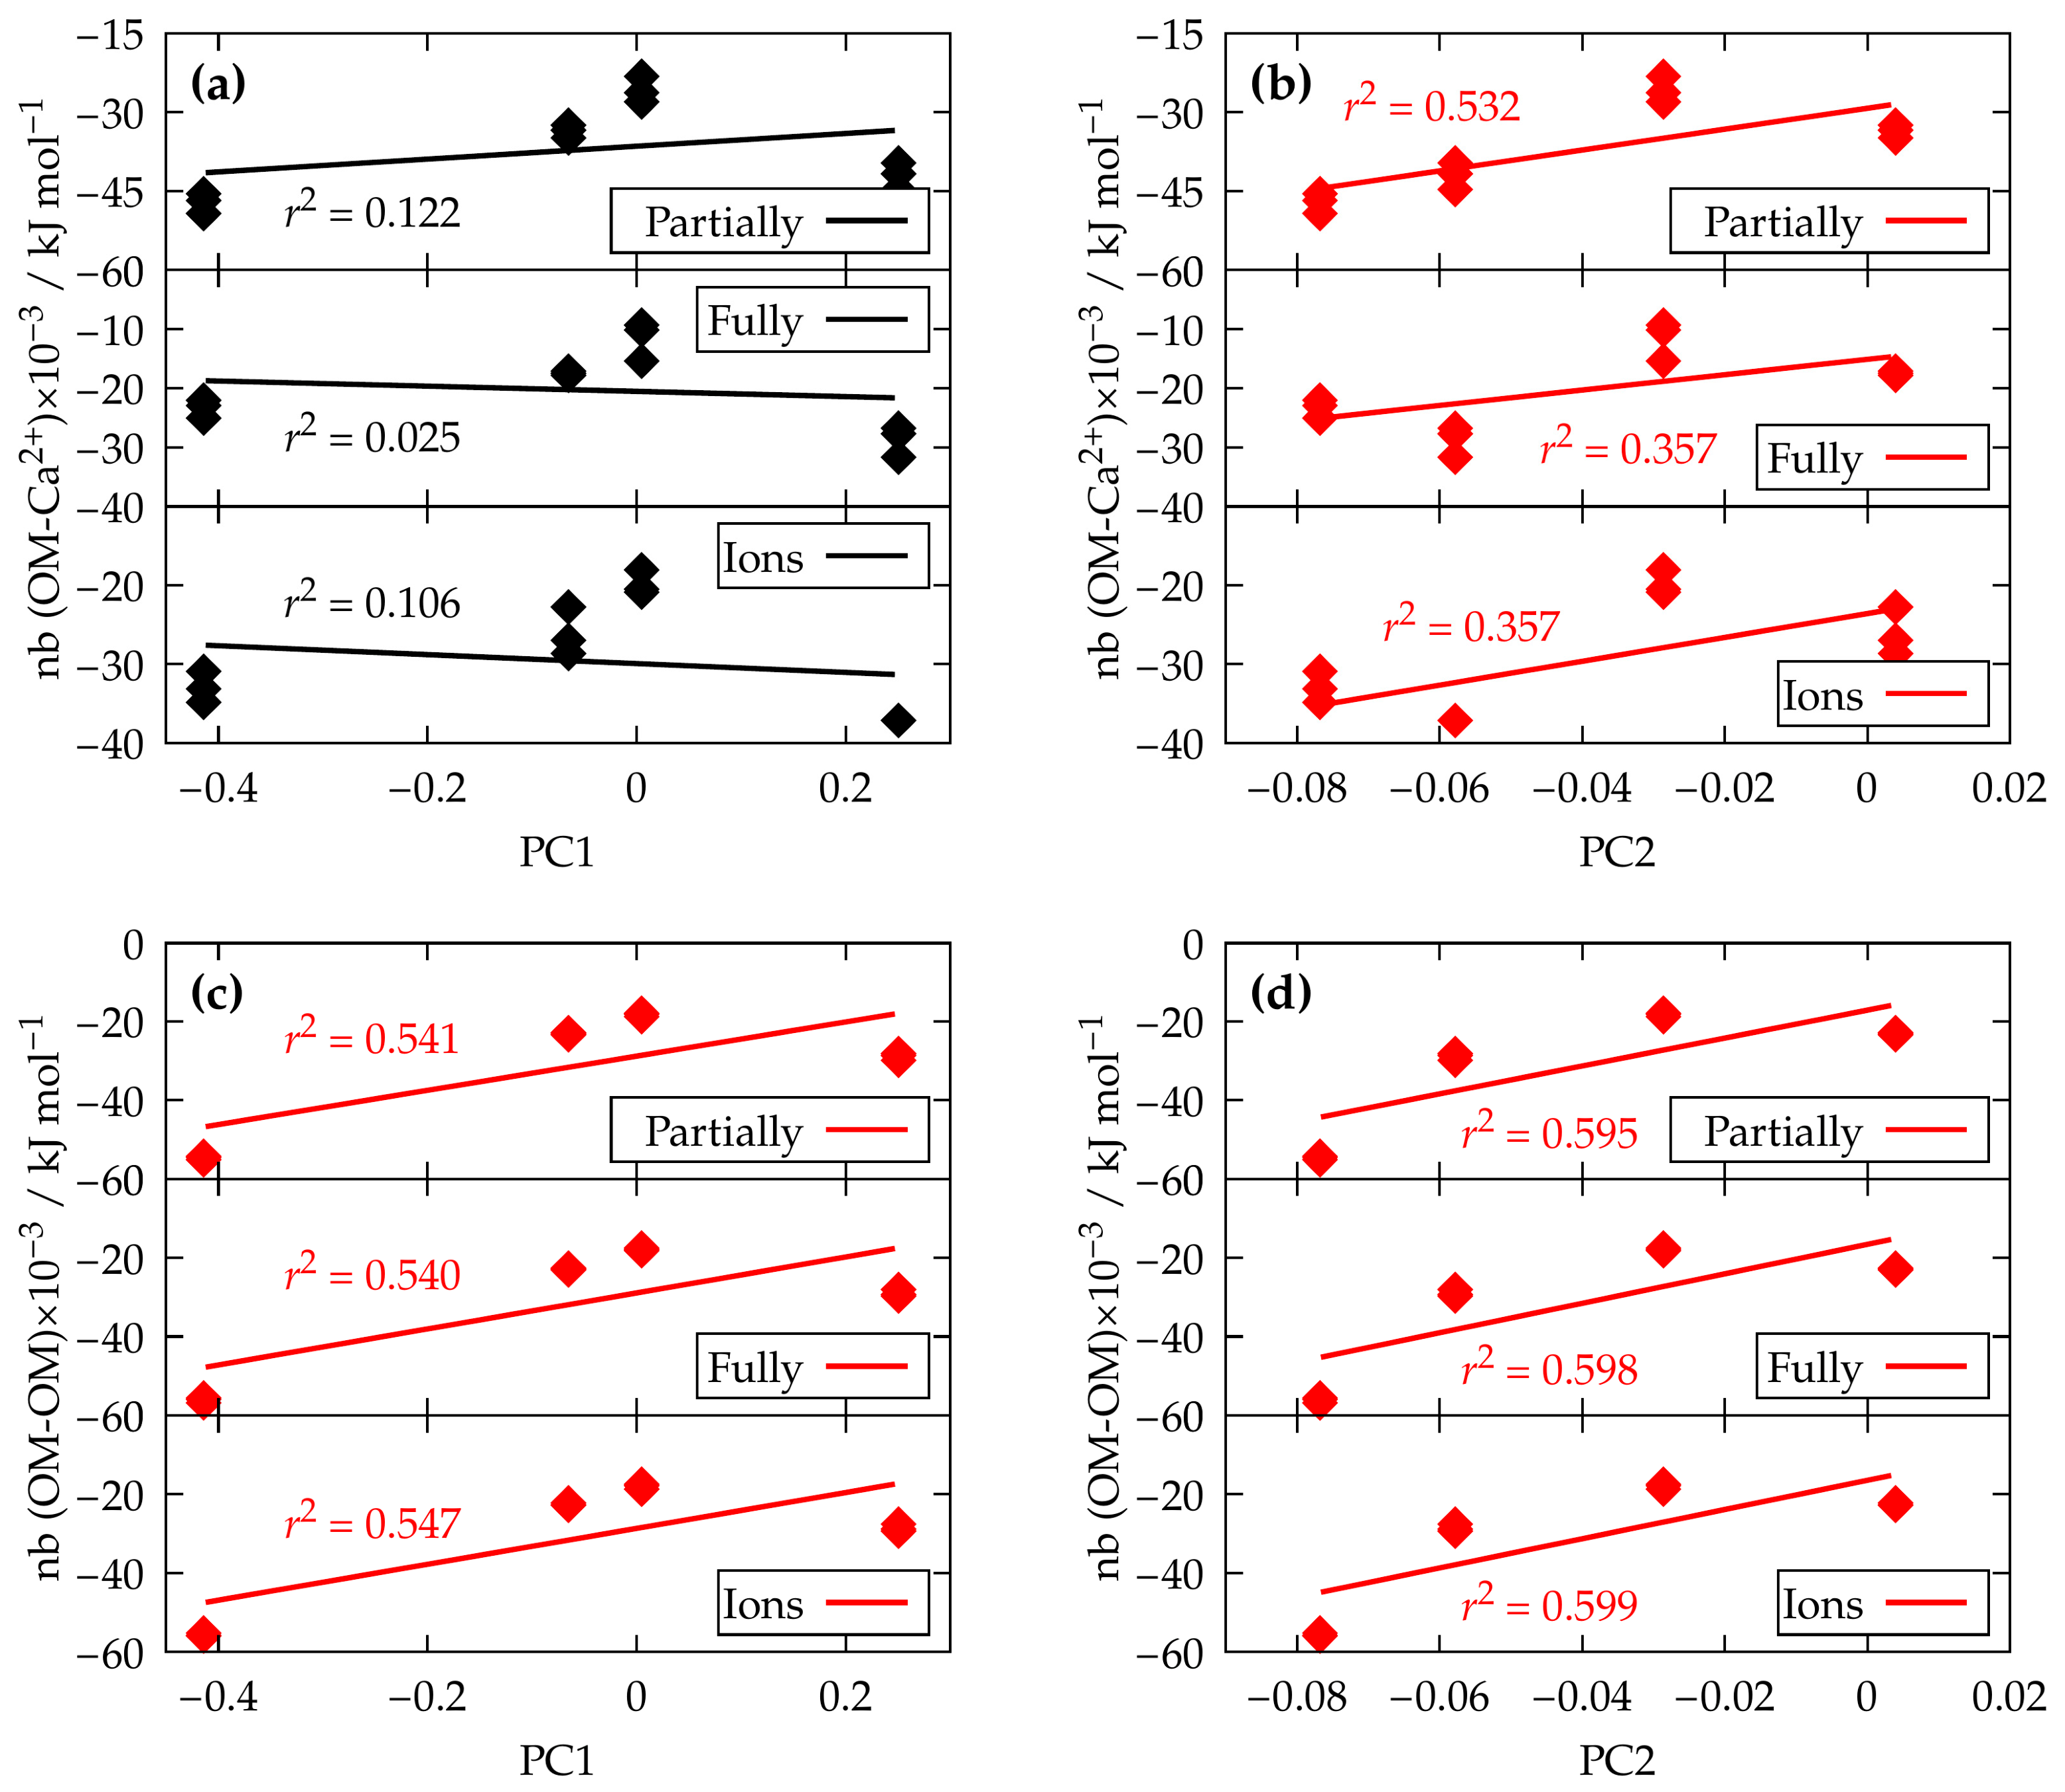
We quantified favorable clustering in terms of non-bonded pairwise interaction energies for OM-Ca2+, correlated strongly to PC2 (Figure 9b), and OM-OM, correlated strongly to PC1 and PC2 (Figure 9c,d). These interactions are mostly due the electrostatic contribution, and the dispersion is smaller with the same range of values over all simulated systems (Figure A3a,b). From these interactions, we infer that cation bridges are favored in samples with low PC2 values (Table 1); moreover, OM aggregates are favored in samples with low aromatic content (Figure 9c). In samples such as pnl, the high aliphatic content promotes aggregation by clustering together hydrophobic groups of different molecules and embedding them within structures while leaving carboxyl groups exposed to surrounding water (see Figure A3c). Furthermore, Ca2+ ions join aggregates via cation bridges between carboxyl groups.
Figure 9.
Linear correlation of the principal components PC1 and PC2 with non-bonding pairwise interactions OM-Ca2+ (a,b) and OM-OM (c,d) of OM samples within partially filled cavities (top panels), fully filled cavities (middle panels), and fully filled cavities with extra ions (CaCl2 solution) (bot-tom panels) in three replicas. Curves in red indicate a high r2 value, i.e., greater than 0.2.
3.6. Hydrogen Bonds
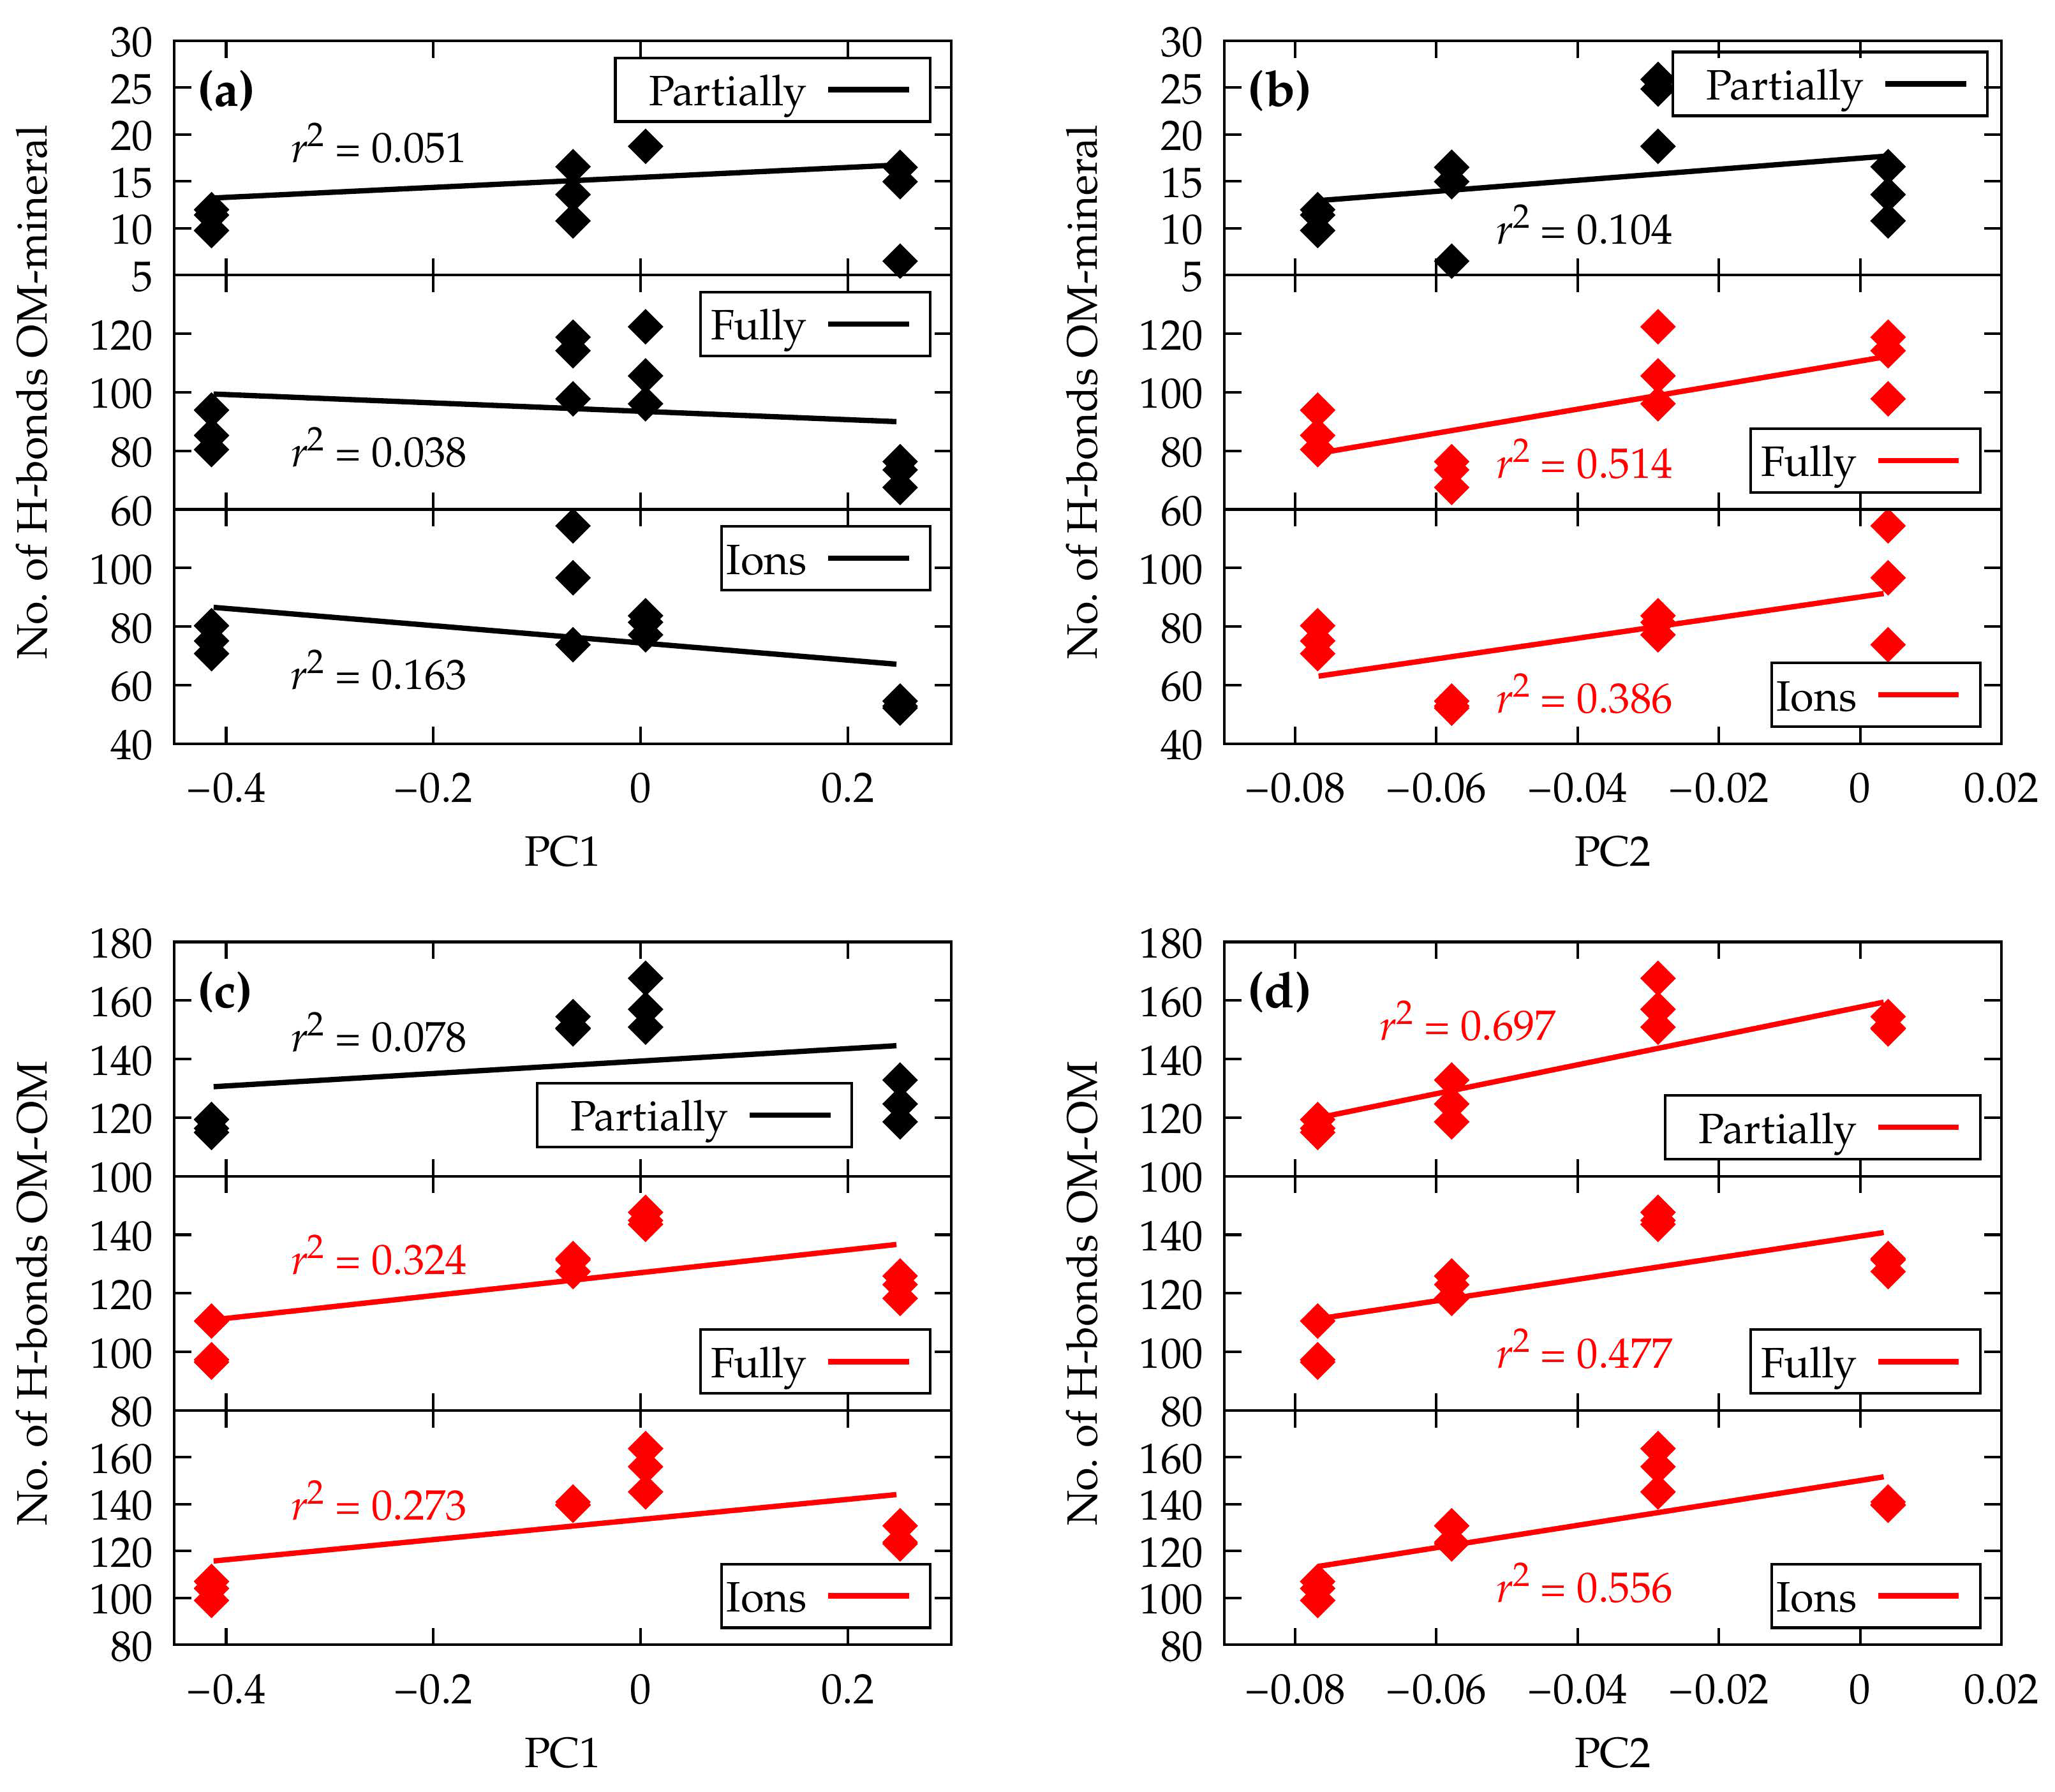
The number of H-bonds OM–mineral correlates stronger with the PC2 (Figure 10b) and OM-OM with PC1 and PC2 (Figure 10c,d). Essentially, the higher the value of PC2 in the sample (Table 1), the larger the number of H-bonding with the surface, resulting in the increased capacity to adsorb to the surface (Figure 10b) in fully filled cavities. In partially filled cavities, a reduced capacity to form H-bonds is observed due to the prominent role that cations bridges have to hold OM to the surface (Figure A4). On the other hand, the number of OM-OM H-bonds increase for samples with high PC1, suggesting that samples with high aliphatic fractions exhibit a lower degree of aggregation through H-bonds. Moreover, the presence of Cl− ions increases the number of H-bonds, suggesting that Cl− favors OM clustering (Figure 10c,d; bottom panels).
Figure 10.
Linear correlation of the principal components PC1 and PC2 with the number of average hydrogen bonds OM–mineral (a,b) and OM-OM (c,d) of OM samples within partially filled cavities (top panels), fully filled cavities (middle panels), and fully filled cavities with extra ions (CaCl2 solution) (bottom panels) in three replicas. Curves in red indicate a high r2 value, i.e., greater than 0.2.
3.7. Surface Occupancy
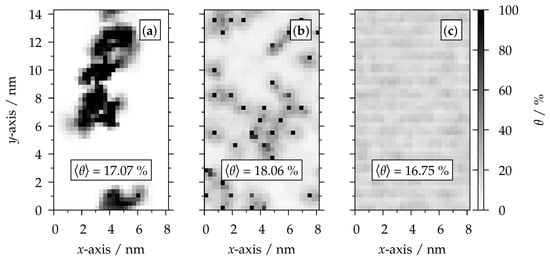
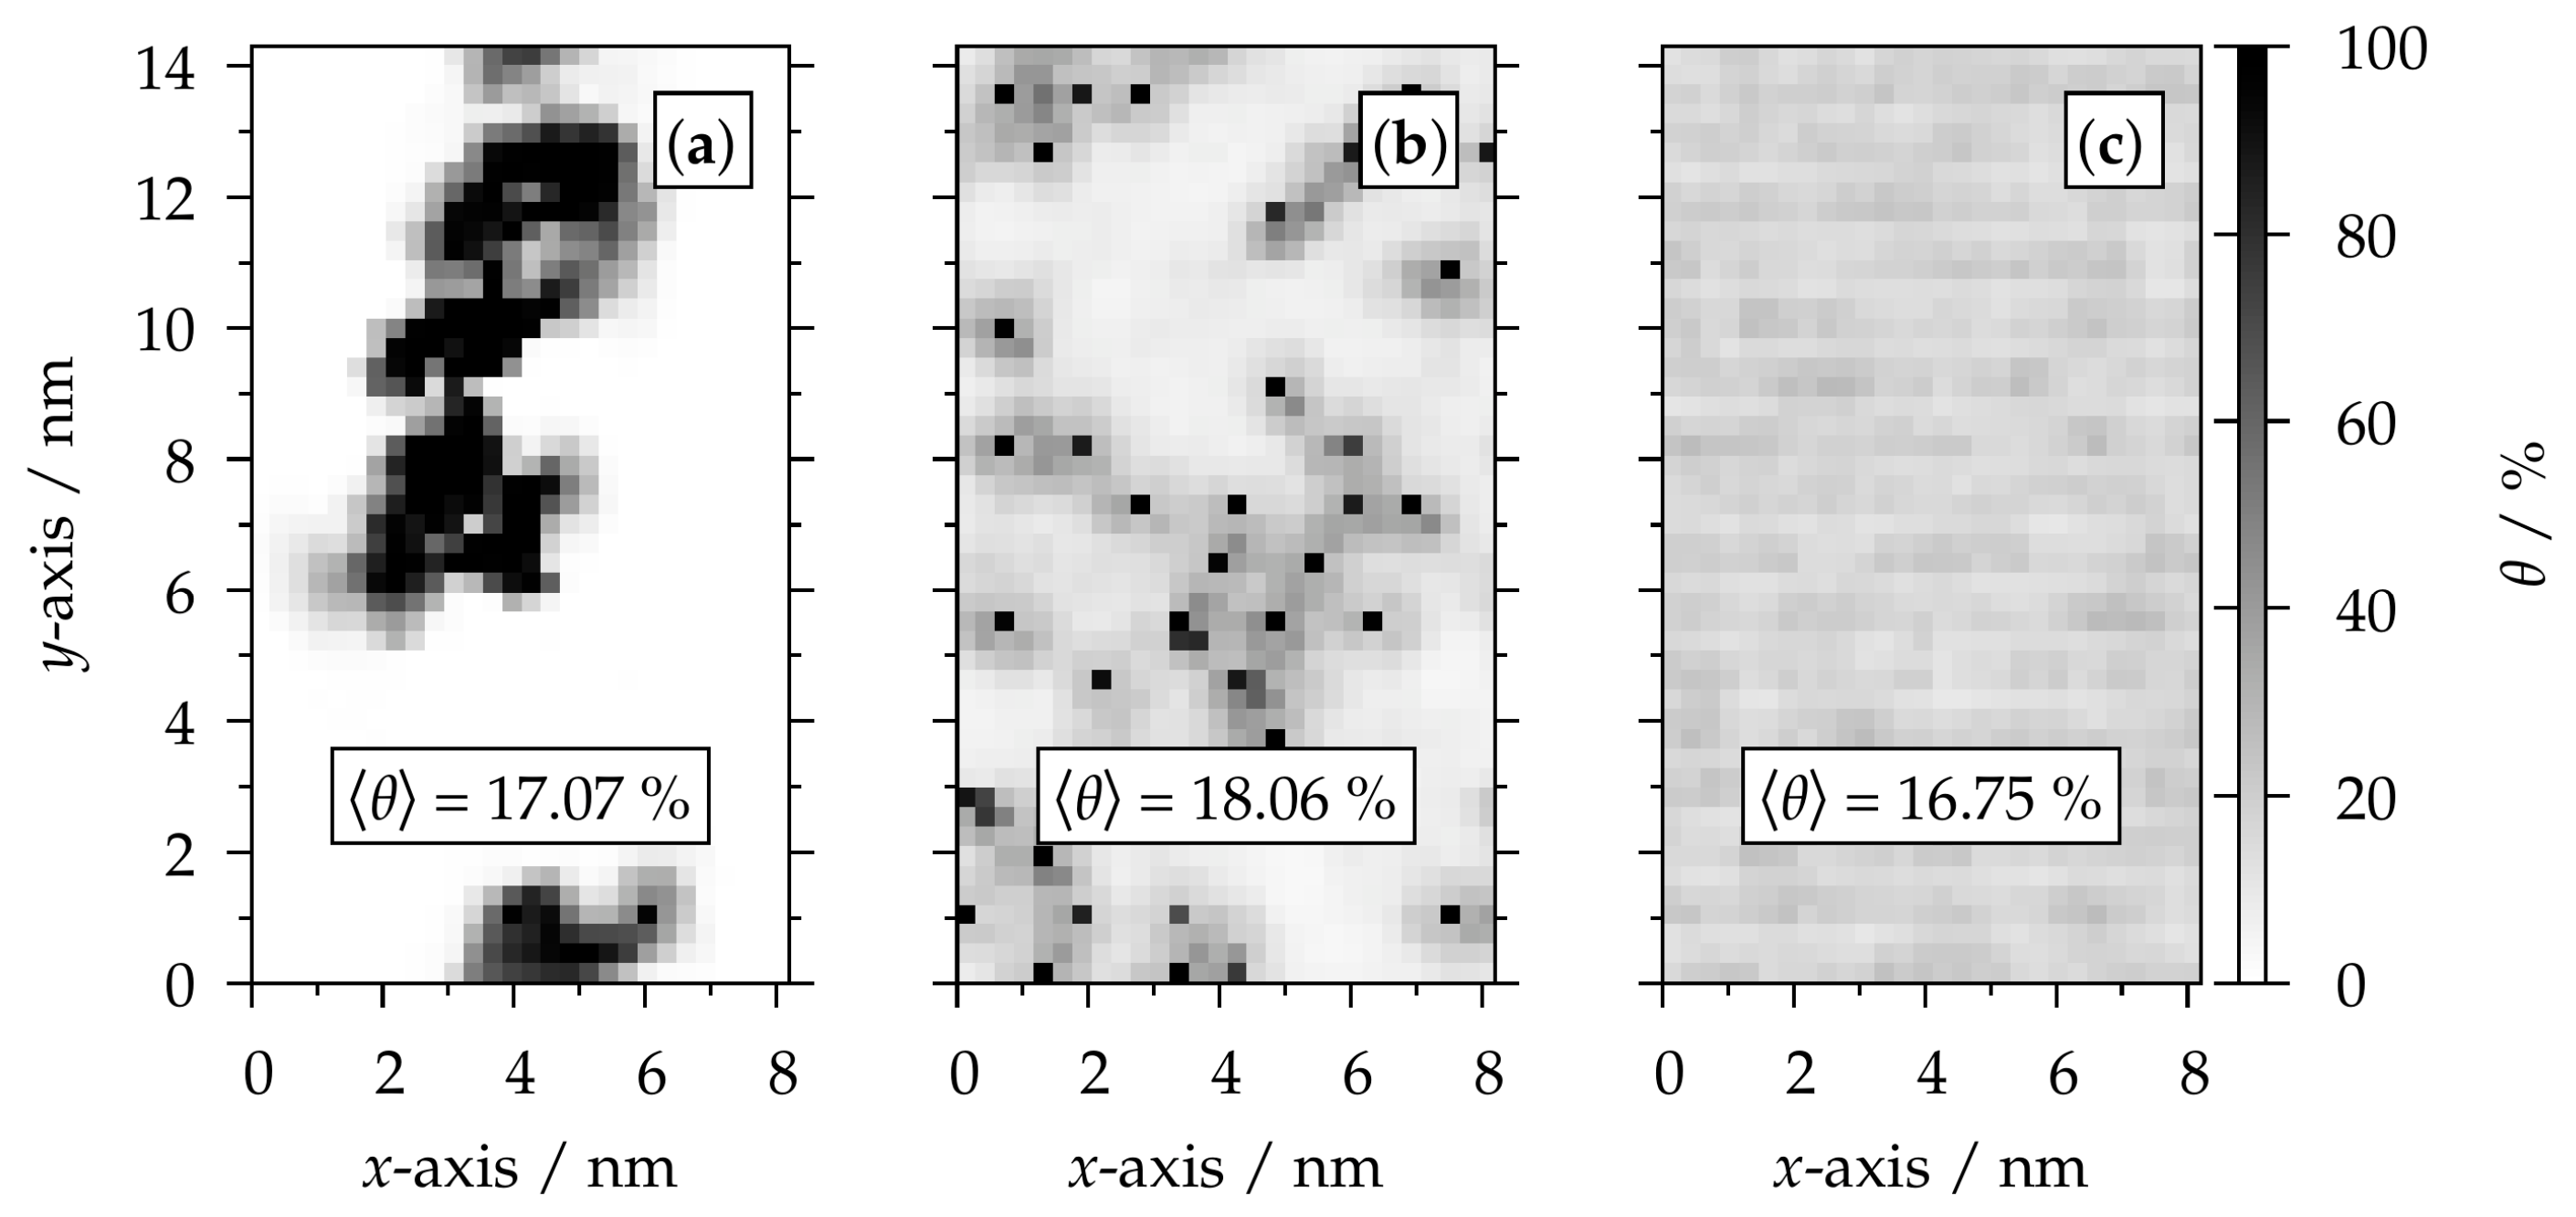
To quantify clustering of OM molecules on the aluminol surface, we assessed the occupancy probability of OM and Ca2+ ions, θ, on the mineral surface with a heatmap (Figure 11). In Figure 11a, the occupancy probability heatmap of sfa on the surface of a partially filled cavity shows that OM close to the surface is fixed to the surface (dark color) and only a small amount is more mobile (gray color). For comparison, we prepared a calcium benzoate (bzo) sample in a partially filled cavity containing 200 benzoate molecules (Figure 11b) under similar conditions as OM samples. This figure displays Ca2+ bridging benzoate to the aluminol surface. However, benzoate molecules do not form clusters; instead, they are evenly distributed over the whole surface. Moreover, benzoate molecules are more mobile around the Ca2+ binding sites due to their smaller size compared with OM. Lastly, in Figure 11c, bzo in a fully filled cavity distributes equally over the entire surface, with no specific adsorption sites observed. Interestingly, the different scenarios in Figure 11 provide similar probability occupancy averages (indicated with the average values of θij, ⟨θ⟩), which suggest the need for another metric to complement the occupancy information.
Figure 11.
Occupancy probability heatmap of Ca2+ and organic molecules’ heavy atoms of (a) Suwannee River III fulvic acid (sfa) in a partially filled cavity, (b) benzoate (bzo) in a partially filled cavity, and (c) benzoate (bzo) within a distance of 0 > z > 1 nm from the aluminol surface in a fully filled cavity. The value of ⟨θ⟩ indicates the average occupancy probability over the entire surface.
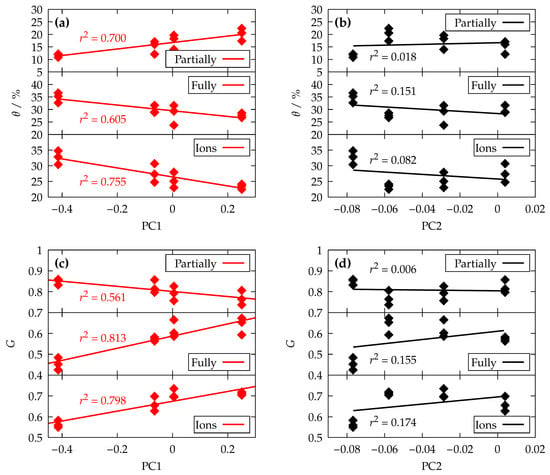
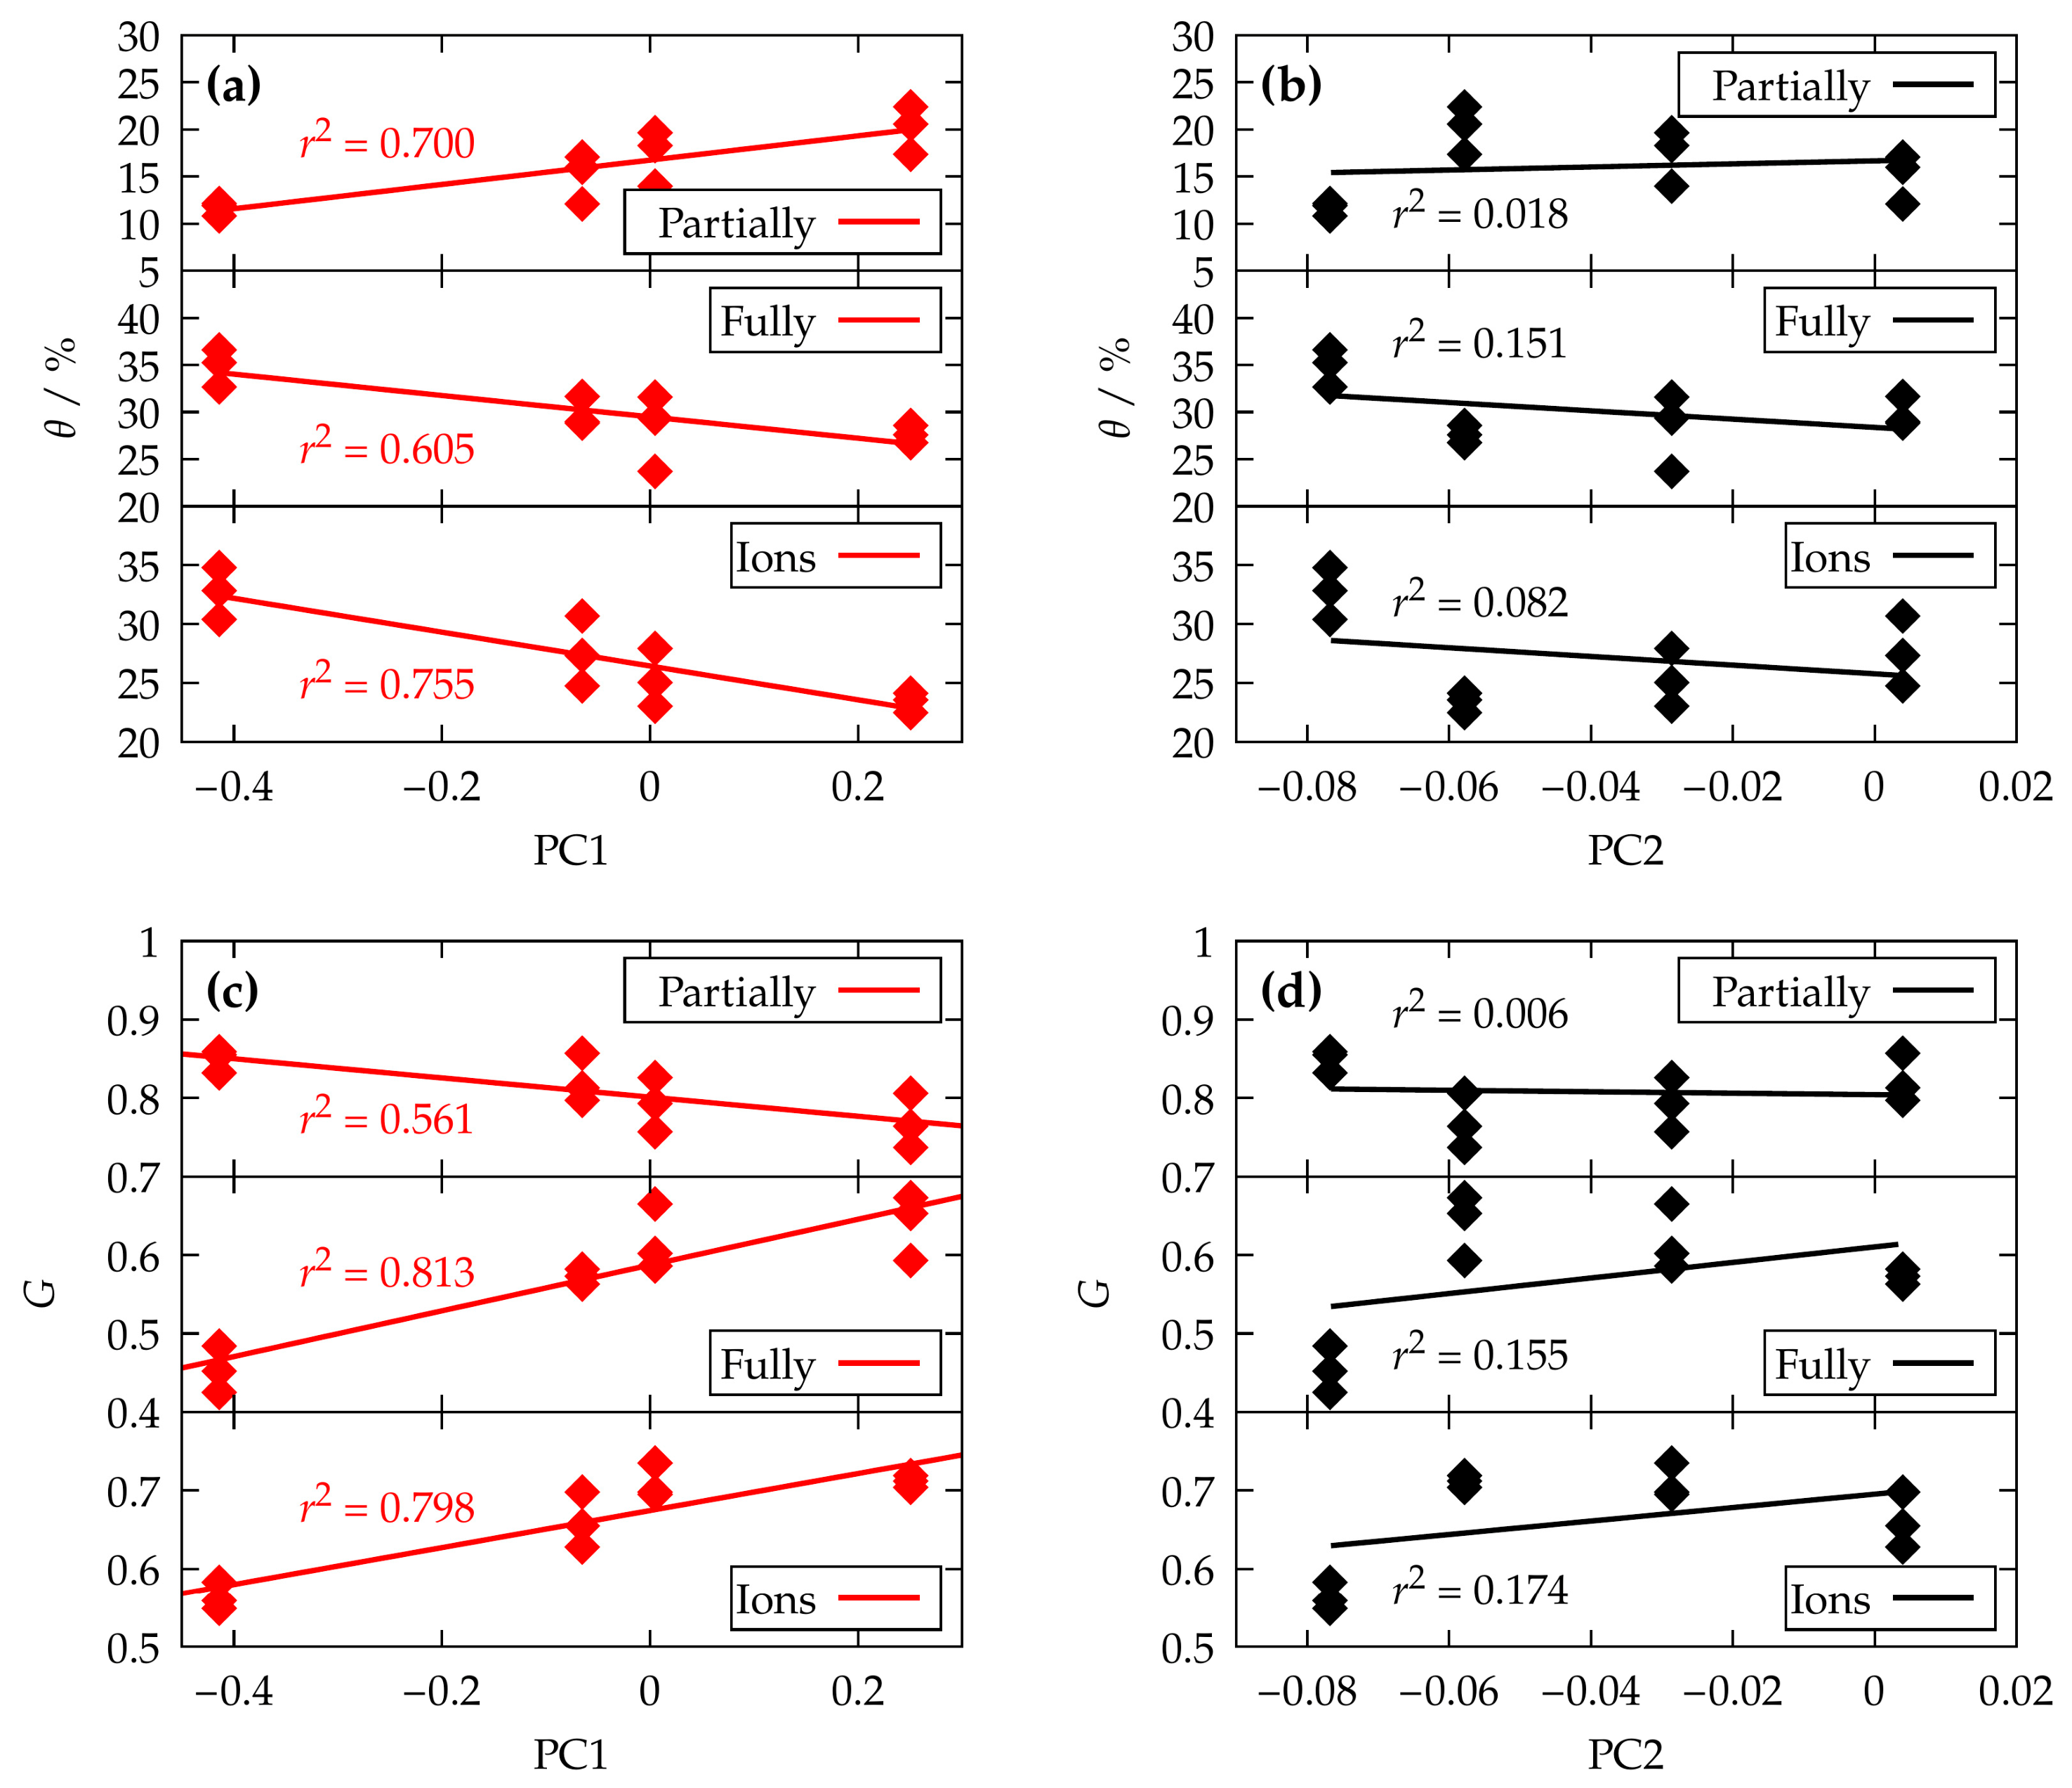
By plotting the dependence of the average probability occupancy, θ, and the Gini coefficient, G, to complement the occupancy distribution with respect to the organic content, a significant correlation was observed to the aromaticity of the sample (Figure 12). By increasing aromaticity, cavities with low-water content exhibit an increase in θ and a decrease in G (Figure 12a,c; top panels). These results evidence that OM samples with low aromaticity have low surface coverage, with molecules clustering at such specific sites, whereas more aromatic samples cover more of the mineral surface and are more evenly distributed. Contrarily, in cavities with high-water content, increasing aromaticity results in a decrease in θ and an increase in G. This inversion of the trend favors an even distribution of OM samples with low aromaticity over most of the surface area, whereas aromatic samples are clustered. Additionally, we observed that the presence of Cl− ions decreases the coverage of the minerals surface and favors clustering by increasing its range (Figure 12a,b). Average values of the surface coverage of all OM samples in different environments are summarized in Table 2 and visualized in Figure A5.
Figure 12.
Linear correlation of the principal components PC1 and PC2 with the occupancy probability distribution, θ, (a,b) and the Gini coefficient, G, (c,d) of OM samples within partially filled cavities (top panels), fully filled cavities (middle panels), and fully filled cavities with extra ions (CaCl2 solution) (bottom panels) in three replicas. Curves in red indicate a high r2 value, i.e., greater than 0.2.
Table 2.
Summary of occupancy probability distribution, θ, and Gini coefficient, G, of OM samples Suwannee River III fulvic acid (sfa), Suwannee River III humic acid (sha), Pony Lake fulvic acid (pnl), Leonardite humic acid (leo), and benzoate (bzo) in partially filled cavities (Partially), fully filled cavities (Fully), and fully filled cavities with extra ions (CaCl2 solution) (Ions).
4. Discussion
The polyanionic nature of OM (and aggregates) leads to a stronger adsorption of its molecules on the aluminol surface. Hence, available Ca2+ ions move to interact favorably with OM, and not the other way around [47]. Ca2+ ions play a key role by bridging OM to the surface (Figure 5), mostly through OSC structures (Figure A2); however, the ISC region shows the most intense charge-density profile peaks (Figure 2). This is the result of a low number of highly stabilized Ca2+ in ISC which most likely form bridges between OM and the mineral surface. The number of Ca2+ in OSC is much bigger, but those are more mobile within this region, therefore leading to broader peaks with low intensity. In all the simulations, the ISC and OSC structures with Ca2+ ions bridging to Kaolinite were observed at the same frequency, except for the leo sample, where the ISC configuration was largely absent in cavities with high-water content (Figure 2). This behavior implies that, depending on the type of soil organic matter, the magnitude of attractive (OM-Ca, clay–Ca, clay–OM, and hydrophilic OM–water) and repelling (OM-OM and hydrophobic OM–water) interactions differs, leading to a different distribution of OM over the surface (Figure 4) and, therefore, a unique electric double-layer fingerprint [29].
4.1. Organic Content
The four OM samples studied in this work cover different organic compositions related to the aromatic fraction content (PC1), ranging from the lowest (pnl) to the highest values (leo), and with different PC2 values (Figure A1).
Our results suggest that OM samples with a high content of aromatic fractions favor the adsorption of OM to the mineral surface through cation bridges, particularly in cavities with low-water content (Figure 8a). Moreover, the high surface occupancy, θ, and relatively low G values (Figure 12a,c) in such cavities suggest that OM achieves the maximum distribution over the mineral of all samples. Although increasing the water content seems to weakly increase the adsorption of OM to the mineral, the coverage decreases, and there is less distribution over the surface (Figure A5). The change in the environment promotes clustering of aromatic samples, while keeping OM adsorbed to the surface.
Regarding OM samples with the high PC2 values, in general, OM-OM and OM-Ca2+ non-bonded interactions have the highest values. Although this implies that cation bridges between OM molecules and with the surface are weak, the high number of H-bonds compensates for this effect, resulting in a moderate clustering of molecules (Figure 12). This agrees with our previous results, where H-bonds stabilize and strength OM aggregates. Furthermore, it is tempting to extend our results from earlier findings and propose that, like in our prior work, simulating these systems under acidic conditions would yield stable aggregates through H-bonds formed by protonated carboxyl groups [23,36].
4.2. Water Content
Cavities formed by periodic copies of surfaces with electrostatic properties, i.e., inherent charge or dipole moment, lead to an artificial polarization of the solvent by orienting its dipole moment according to the electrostatic nature of the layer [46,52,53]. However, such artifacts can be avoided either by (i) removing the electrostatic periodicity; (ii) imposing a vacuum in between the periodic copies, such that the electrostatic periodicity is not propagated; or (iii) adding ions that effectively screen the electrostatic interactions at long range. In agreement with previous results, we showed that OM within cavities with low-water content portray a similar behavior as when bulk solutions interact with the outermost part of a mineral particle [47].
In this work, no evidence of an over-polarized environment was observed, as water dipole moments far from the interface exhibited random orientations (Figure 6), mostly due to the screening effect of ionic species (polyanionic OM molecules, Ca2+, and Cl−) [46]. Cavities with high-water content promote cation migration to the siloxane surface, especially when they were weakly adsorbed in the OSC aluminol surface (Figure 3). Surprisingly, this behavior does not decrease the adsorption of OM on the aluminol surface; instead, it increases it due to the polarization. As the polarization drives the Ca2+ ions towards the siloxane surface, it drives the anionic parts of the OM towards the aluminol surface, leading to an increase in H-bonds between OM and the mineral surface (Figure A4). As a side effect, the lack of Ca2+ ions nearby the aluminol surface leads to the mutual repulsion of OM molecules [29], in turn leading to a better dispersion. Overall, the charge separation within the cavity screens the polarization in the bulk (Figure 6).
Cavities with high-water content exhibited the biggest average values of θ (Table 2), corroborating an increased adsorption, with pnl being the highest of all OM samples. Although pnl exhibited the lowest affinity for the surface, the migration of Ca2+ ions to the siloxane region increased its affinity significantly. In general, all cavities with high-water content exhibit an even distribution along the surface, which, together with the increased adsorption of OM, suggests that molecules are better dispersed over the surface.
4.3. Prescence of Cl− Ions
By adding CaCl2 to cavities with high-water content, Cl− ions replace some of the OM molecules adsorbed on the surface (Figure A6), contributing to screening within the EDL but without influencing the solvent environment (water’s dipole moment orientation). This change in the adsorption inverts the dependence on aromaticity, by decreasing the number OM cation bridges with the mineral surface in samples with high content of aromatic fractions and increasing it for aliphatic rich samples. Furthermore, the presence of Cl− ions promotes the OM clustering effect, as is also observed in aromatic systems.
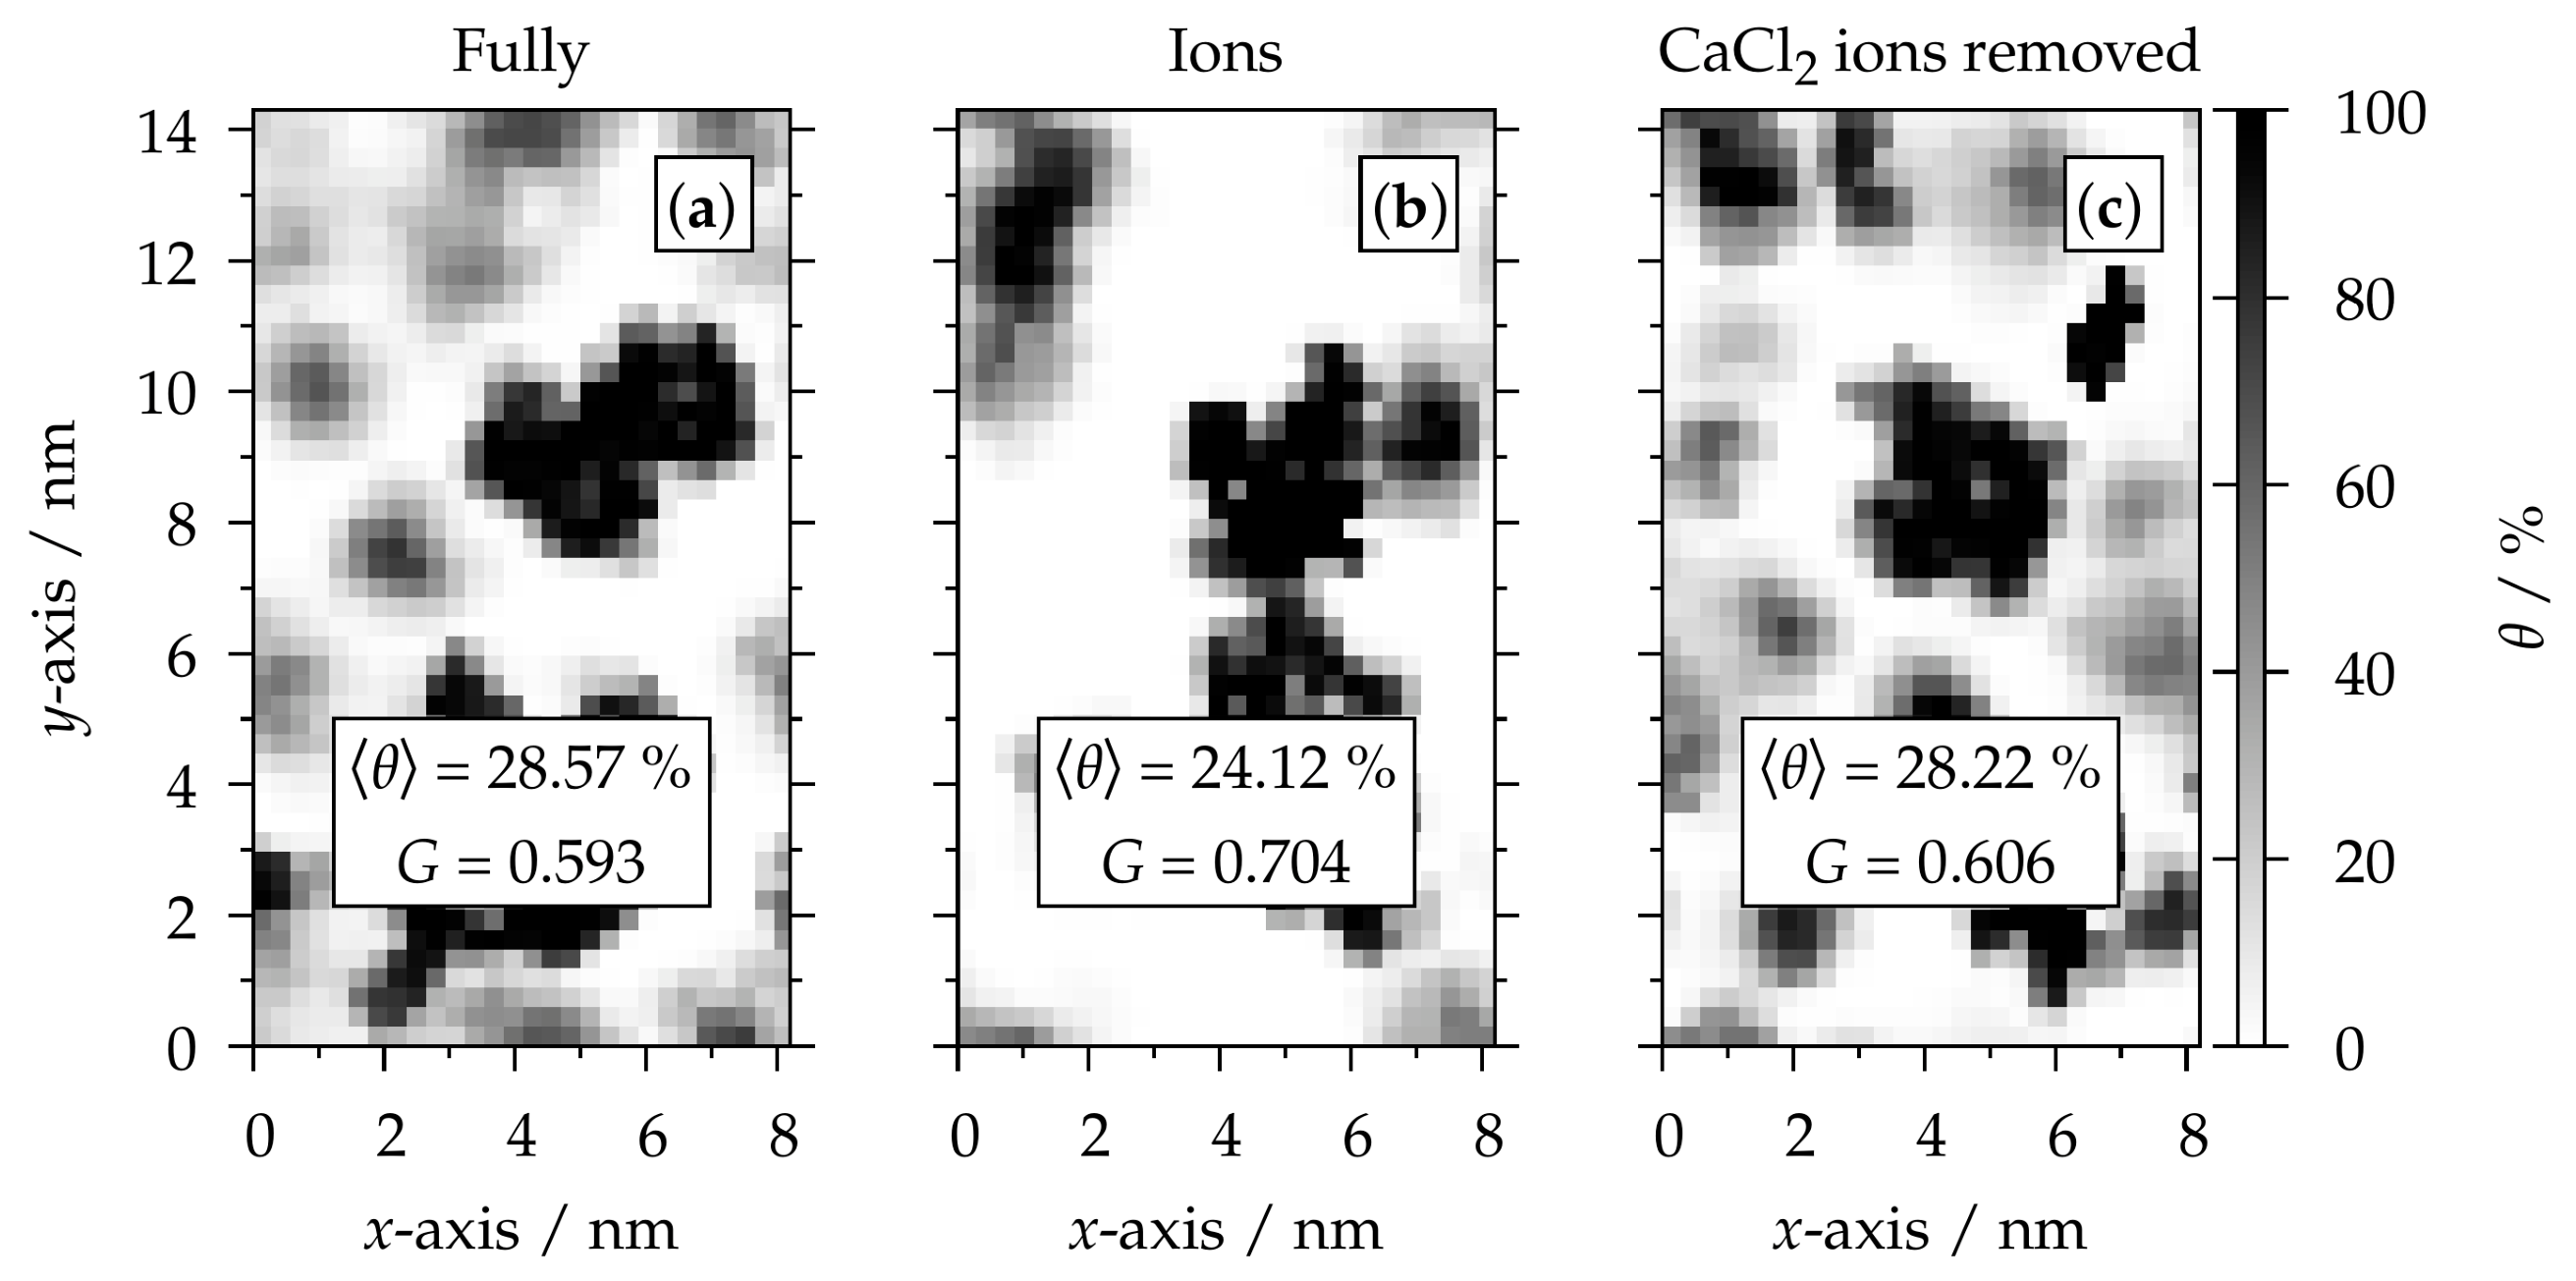
Additionally, it is worth noting that weakly coordinating Cl− ions, competing with OM molecules, exhibit high mobility over the aluminol surface. Thus, Cl− ions are distributed across the available mineral surface that is not occupied by OM molecules. We performed additional simulations to verify if OM molecules replaced by Cl− ions could be re-adsorbed on the mineral surface reversibly by removing all Cl− ions with their respective counterions. As Cl− ions only contribute to the charged species of the EDL, without disturbing the water environment, removal of them allow adsorption reversibility, achieving OM coverage recovery of 98% (see Figure A7).
5. Conclusions
The adsorption of organic matter to mineral surfaces is a process driven mainly by the electrostatic phenomena. Standardized soil samples with different organic composition show a unique electrostatic “fingerprint” at the solid–liquid interface, leading to the clustering and distribution of sorbate species due to the formation of the electric double layer. Occupancy of the mineral surface is strongly affected by the aromatic content of soil organic matter samples; although not directly assessed, the findings indicate that acidic composition also exerts an influence. On the other hand, cations like Ca2+ are essential in the aggregation and adsorption mechanisms forming cation bridges, being responsible of clustering OM molecules and holding OM to Kaolinite’s surface. Similarly, H-bonds are responsible for holding OM together and to the mineral surface through charged species exposed to the environment.
The water content influences the adsorption mechanism of OM within cavities by polarizing ionic species. Low-water content favors the formation of big clusters of OM molecules and the adsorption to the mineral surface via cation bridges. High-water content, on the other hand, promotes the polarization inside the cavity, driving cations to the siloxane mineral’s side, facilitates a breakdown of supramolecular structures and distributes the OM molecules over the mineral surface, ultimately leading to the formation of hydrogen bonds between the mineral’s interfacial protons and OM molecules.
Conversely, OM clustering can be promoted in cavities with high-water content by increasing the ionic strength of the solution, which reforms aggregates and occupies the mineral surface with monovalent anions; or increasing the aliphatic content of SOM samples, stabilizing OM aggregates by embedding aliphatic groups inside OM structures and exposing soluble groups to the surrounding environment. To the best of our knowledge, this is the first time the electric double-layer interface of refined models of soil is described with atomistic resolution by varying the solvent environment and organic input composition. Moreover, this behavior suggests how specific OM-OM and OM–mineral interactions vary in different environments during the formation and stabilization of organo-mineral aggregates. This level of tuning represents a major improvement in soil modeling, allowing us to develop the scientific basis for specific targeting methods for bioremediation, carbon sequestration, or mitigation of global changes in particular soils.
Author Contributions
Conceptualization, E.G.-A., M.G., C.O. and D.T.; methodology, E.G.-A.; software, E.G.-A.; validation, E.G.-A., C.O. and D.T.; formal analysis, E.G.-A.; data curation, E.G.-A.; writing—original draft preparation, E.G.-A.; writing—review and editing, E.G.-A., M.G., C.O. and D.T.; visualization, E.G.-A.; supervision, E.G.-A.; project administration, E.G.-A. and C.O.; funding acquisition, C.O. All authors have read and agreed to the published version of the manuscript.
Funding
This project was funded by “FWF Cluster of Excellence COE 17, Circular Bioengineering (Funding DOI: https://doi.org/10.55776/COE17)”.
Data Availability Statement
The input files required to run the MD simulations of the organo-mineral interfaces are openly available on Zenodo at https://doi.org/10.5281/zenodo.22023675 (accessed on 25 August 2026). These files include topologies, coordinates, and input files for all molecular simulations, as well as the scripts used for the analyses described in this work.
Acknowledgments
The authors thank the members of the Institute of Molecular Modeling and Simulation and the Institute of Soil Research for fruitful discussions. For open-access purposes, the author has applied a CC BY public copyright license to any author-accepted manuscript version arising from this submission.
Conflicts of Interest
The authors declare no conflicts of interest. The funders had no role in the design of the study; in the collection, analyses, or interpretation of data; in the writing of the manuscript; or in the decision to publish the results.
Abbreviations
The following abbreviations are used in this manuscript:
| bzo | Benzoate |
| EDL | Electric double layer |
| H-bond | Hydrogen bond |
| ISC | Inner-sphere complex |
| leo | Leonardite humic acid |
| MAOM | Minera-associated organic matter |
| MD | Molecular dynamics |
| Nb | Non-bonded interactions |
| OM | Organic matter |
| OMA | Organo-mineral aggregate |
| OSC | Outer-sphere complex |
| PCA | Principal component analysis |
| pnl | Pony Lake fulvic acid |
| Rdf | Radial distribution function |
| sfa | Suwannee river III fulvic acid |
| sha | Suwannee river III humic acid |
Appendix A
Figure A1.
(a) Principal component analysis of the humic substances according to their organic composition. The percentage of total variance by each principal component is given in parentheses. Each point represents a different soil sample. Humic and fulvic acids are represented by black and blue diamonds, whereas the ones used in this work are represented by red diamonds. (b) Principal component analysis weights of the organic composition to the principal components PC1 (aromaticity; left panel) and PC2 (acidity; right panel).
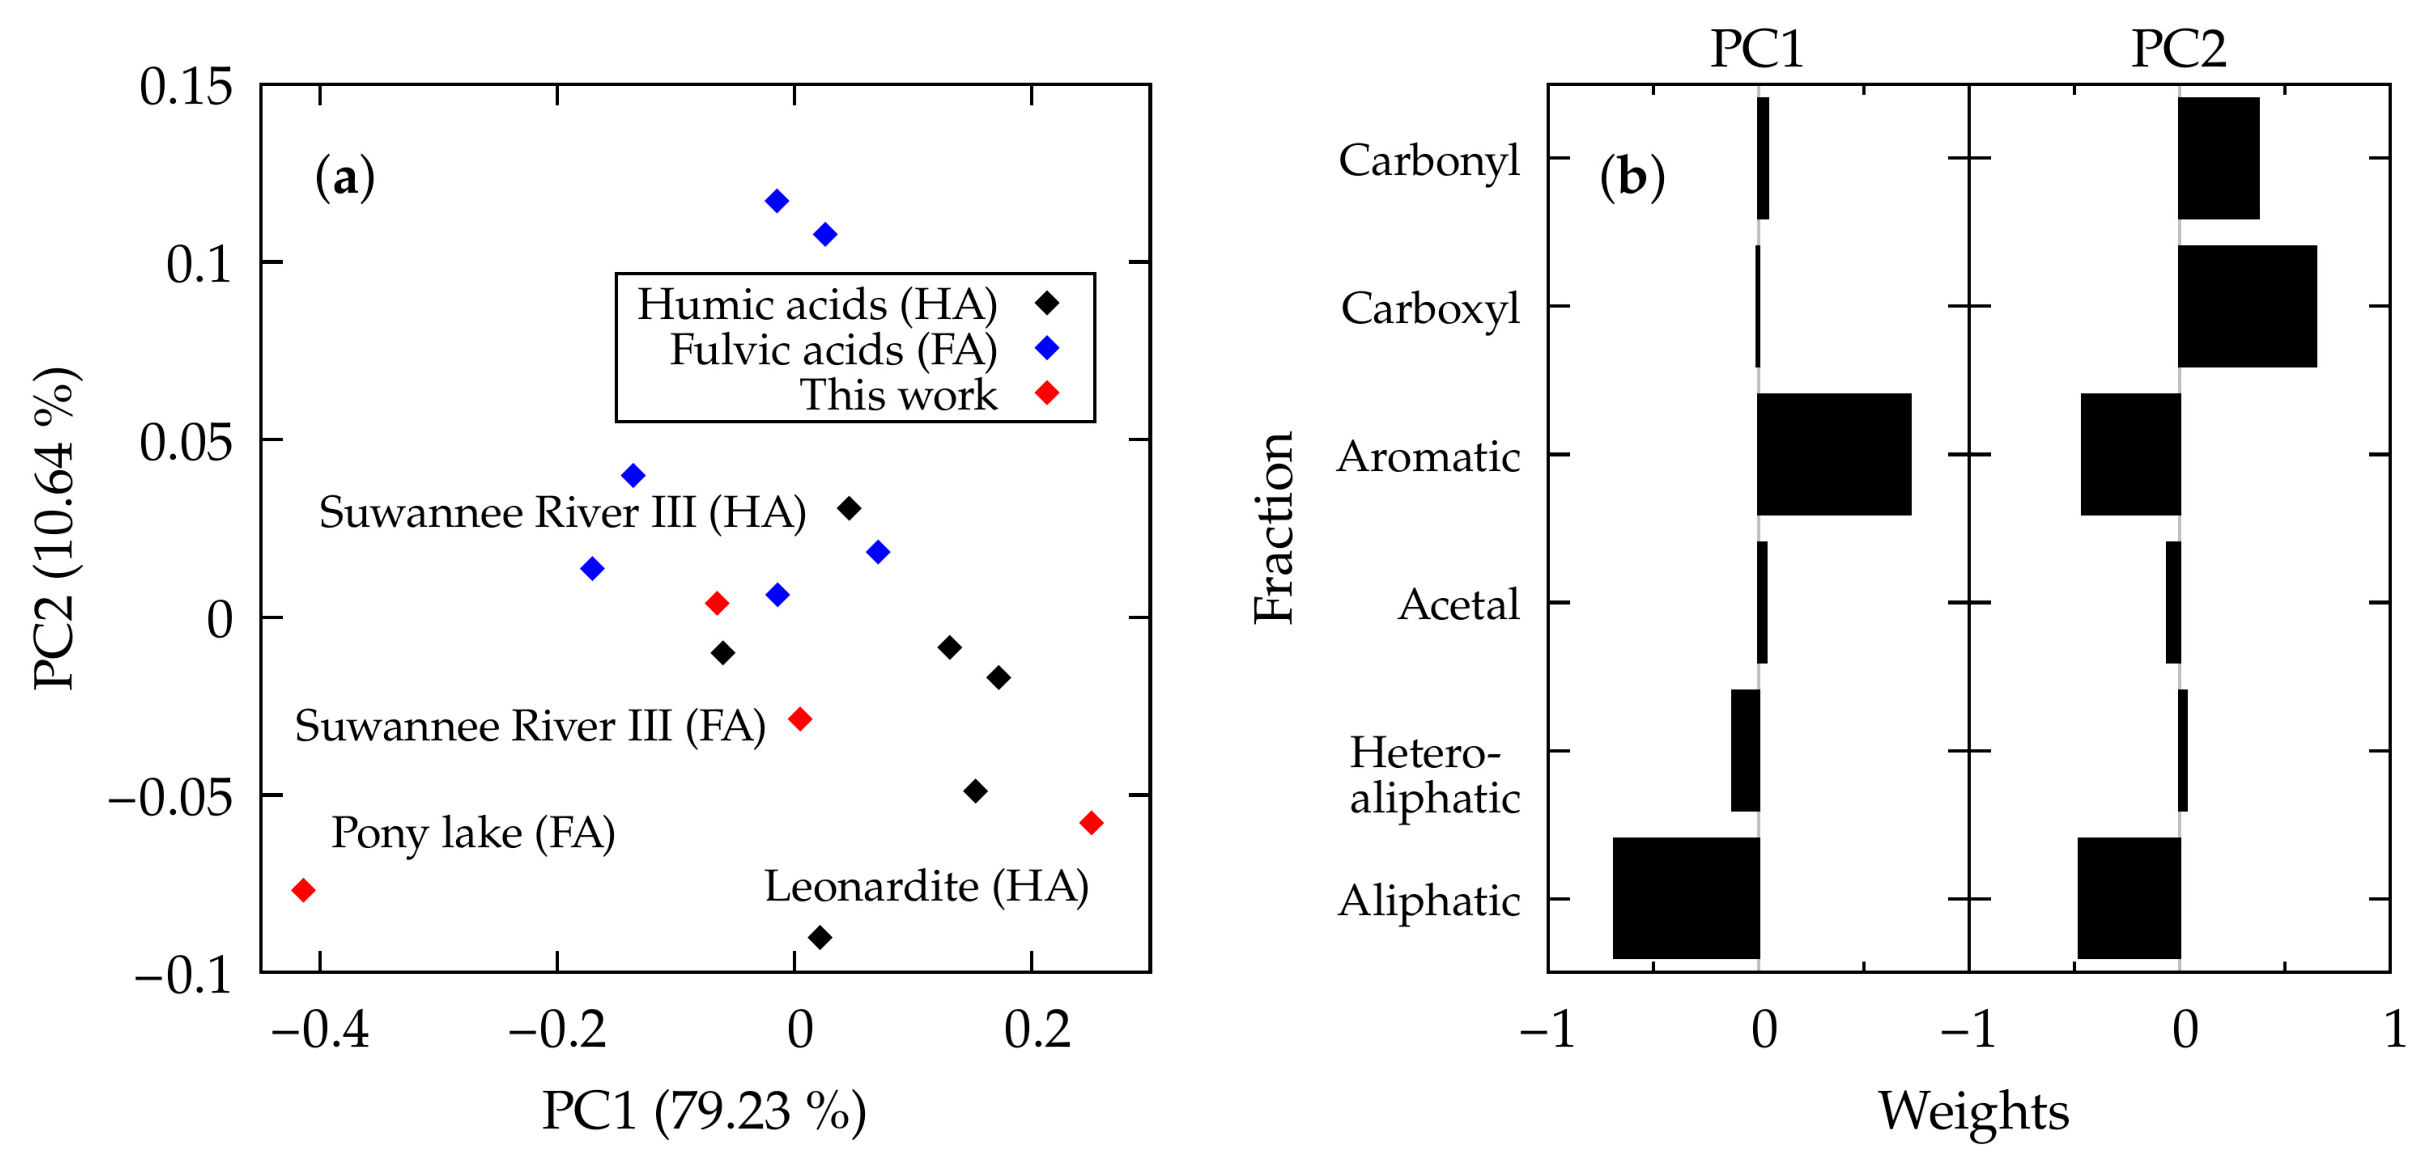
Figure A2.
Number of Ca2+ ions forming inner-sphere complex (ISC) and outer-sphere complex (OSC) structures on the aluminol surface in presence of OM samples: Suwannee River III fulvic acid (sfa; black color), Suwannee River III humic acid (sha; red color), Pony Lake fulvic acid (pnl; blue color), and Leonardite humic acid (leo; green color) within partially filled cavities (left panel), fully filled cavities (center panel), and fully filled cavities with extra ions (CaCl2 solution) (right panel) in three replicas. Standard deviations over the simulations are shown as whiskers.
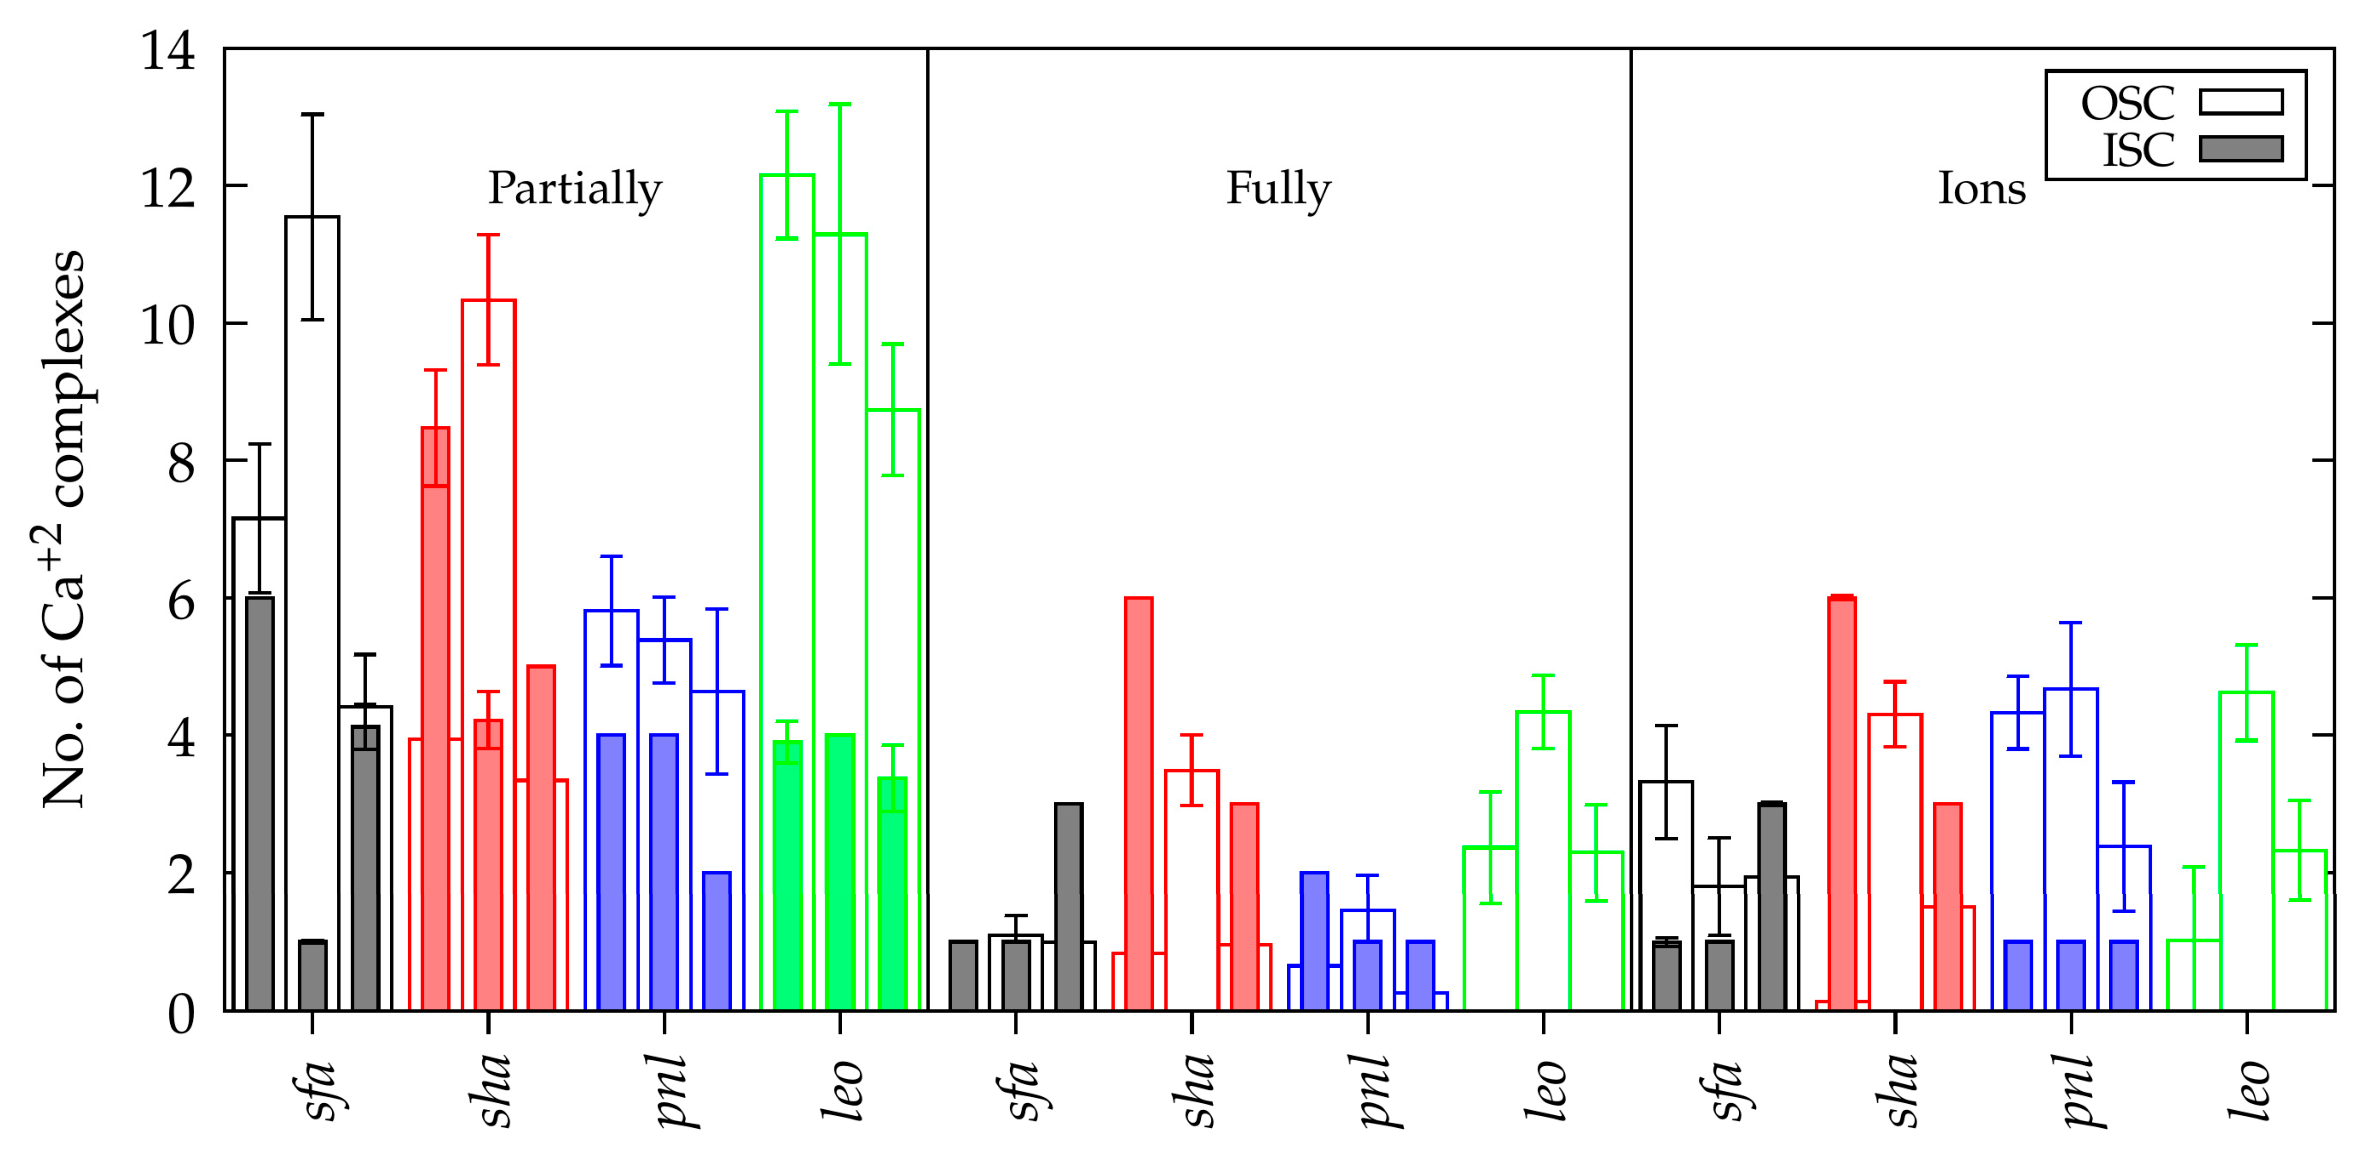
Figure A3.
Non-bonding pairwise interactions (a) OM-Ca2+ and (b) OM-OM of OM samples: Suwannee River III fulvic acid (sfa; black color), Suwannee River III humic acid (sha; red color), Pony Lake humic acid (pnl; blue color), and Leonardite fulvic acid (leo; green color) within partially filled cavities (left panel), fully filled cavities (center panel), and fully filled cavities with extra ions (CaCl2 solution) (right panel) in three replicas. (c) Top-view snapshot of pnl sample with OM aggregates (gray surface) adsorbed on the aluminol surface (gray sticks) in a fully filled cavity exhibiting aliphatic atoms (blue surfaces) and charged groups (red and green sticks) and Ca2+ ions (magenta spheres). Water molecules are not shown for clarity.
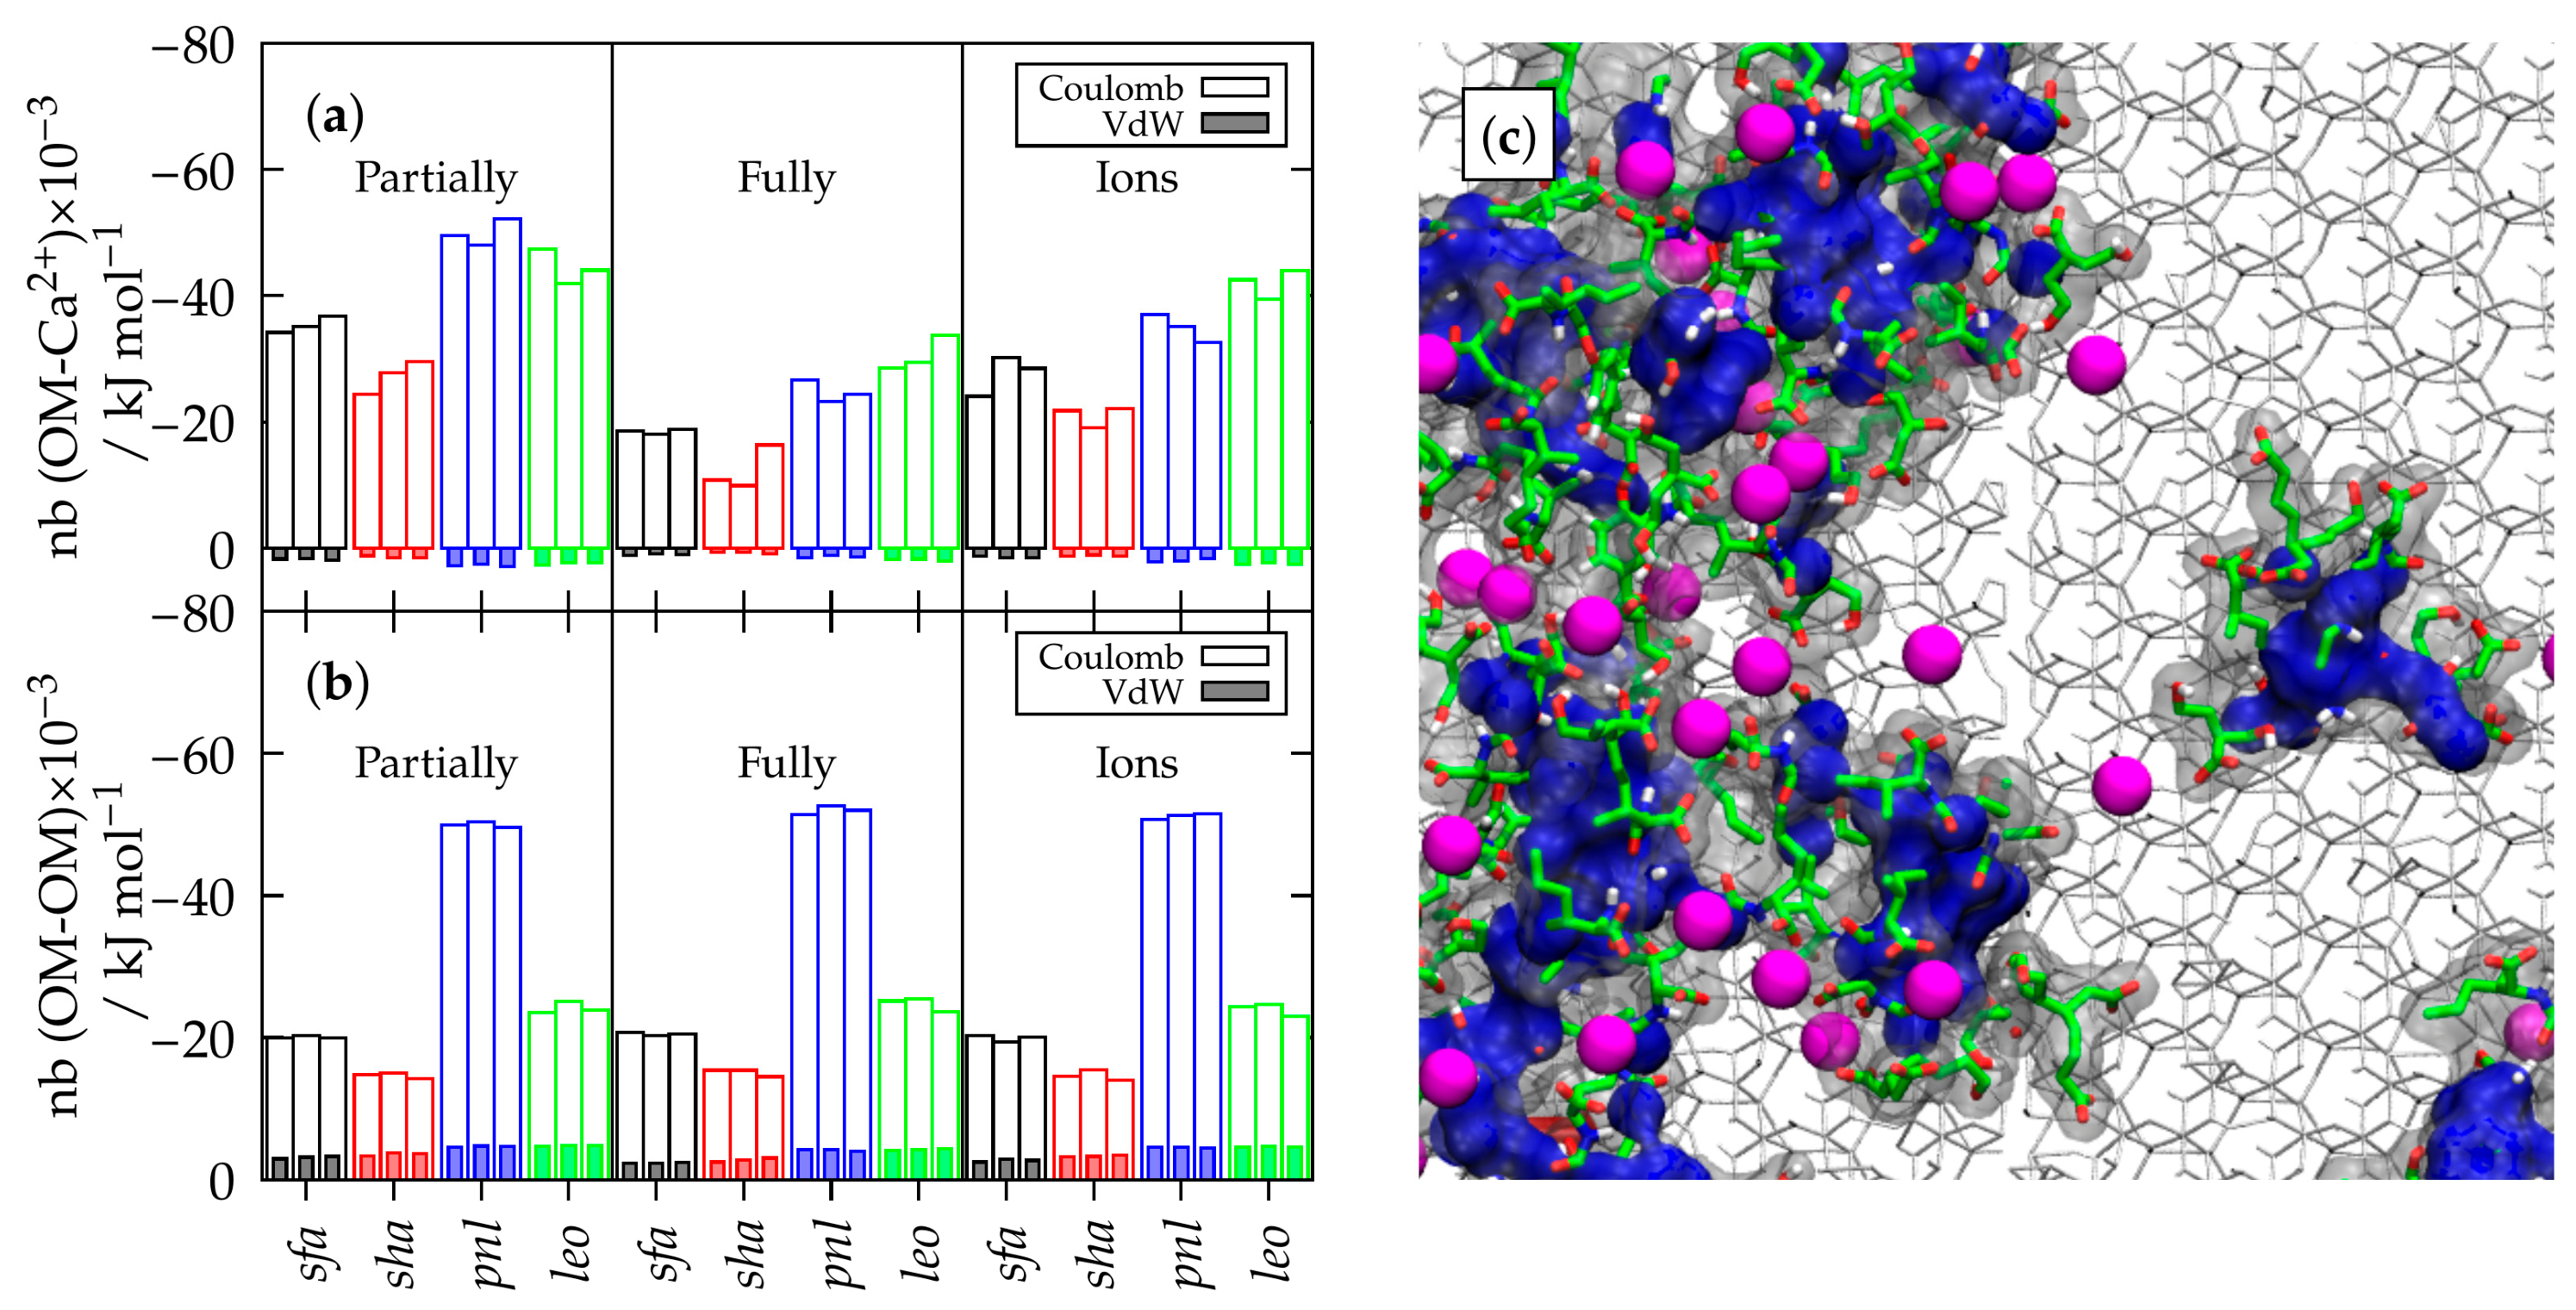
Figure A4.
Number of average hydrogen bonds of OM samples: Suwannee River III fulvic acid (sfa; black color), Suwannee River III humic acid (sha; red color), Pony Lake fulvic acid (pnl; blue color), and Leonardite humic acid (leo; green color) between OM-OM (empty box) and clay–OM (filled box) within cavities partially filled, fully filled, and fully filled with extra ions (CaCl2 solution) in three replicas. Standard deviations over the simulations are shown as whiskers.
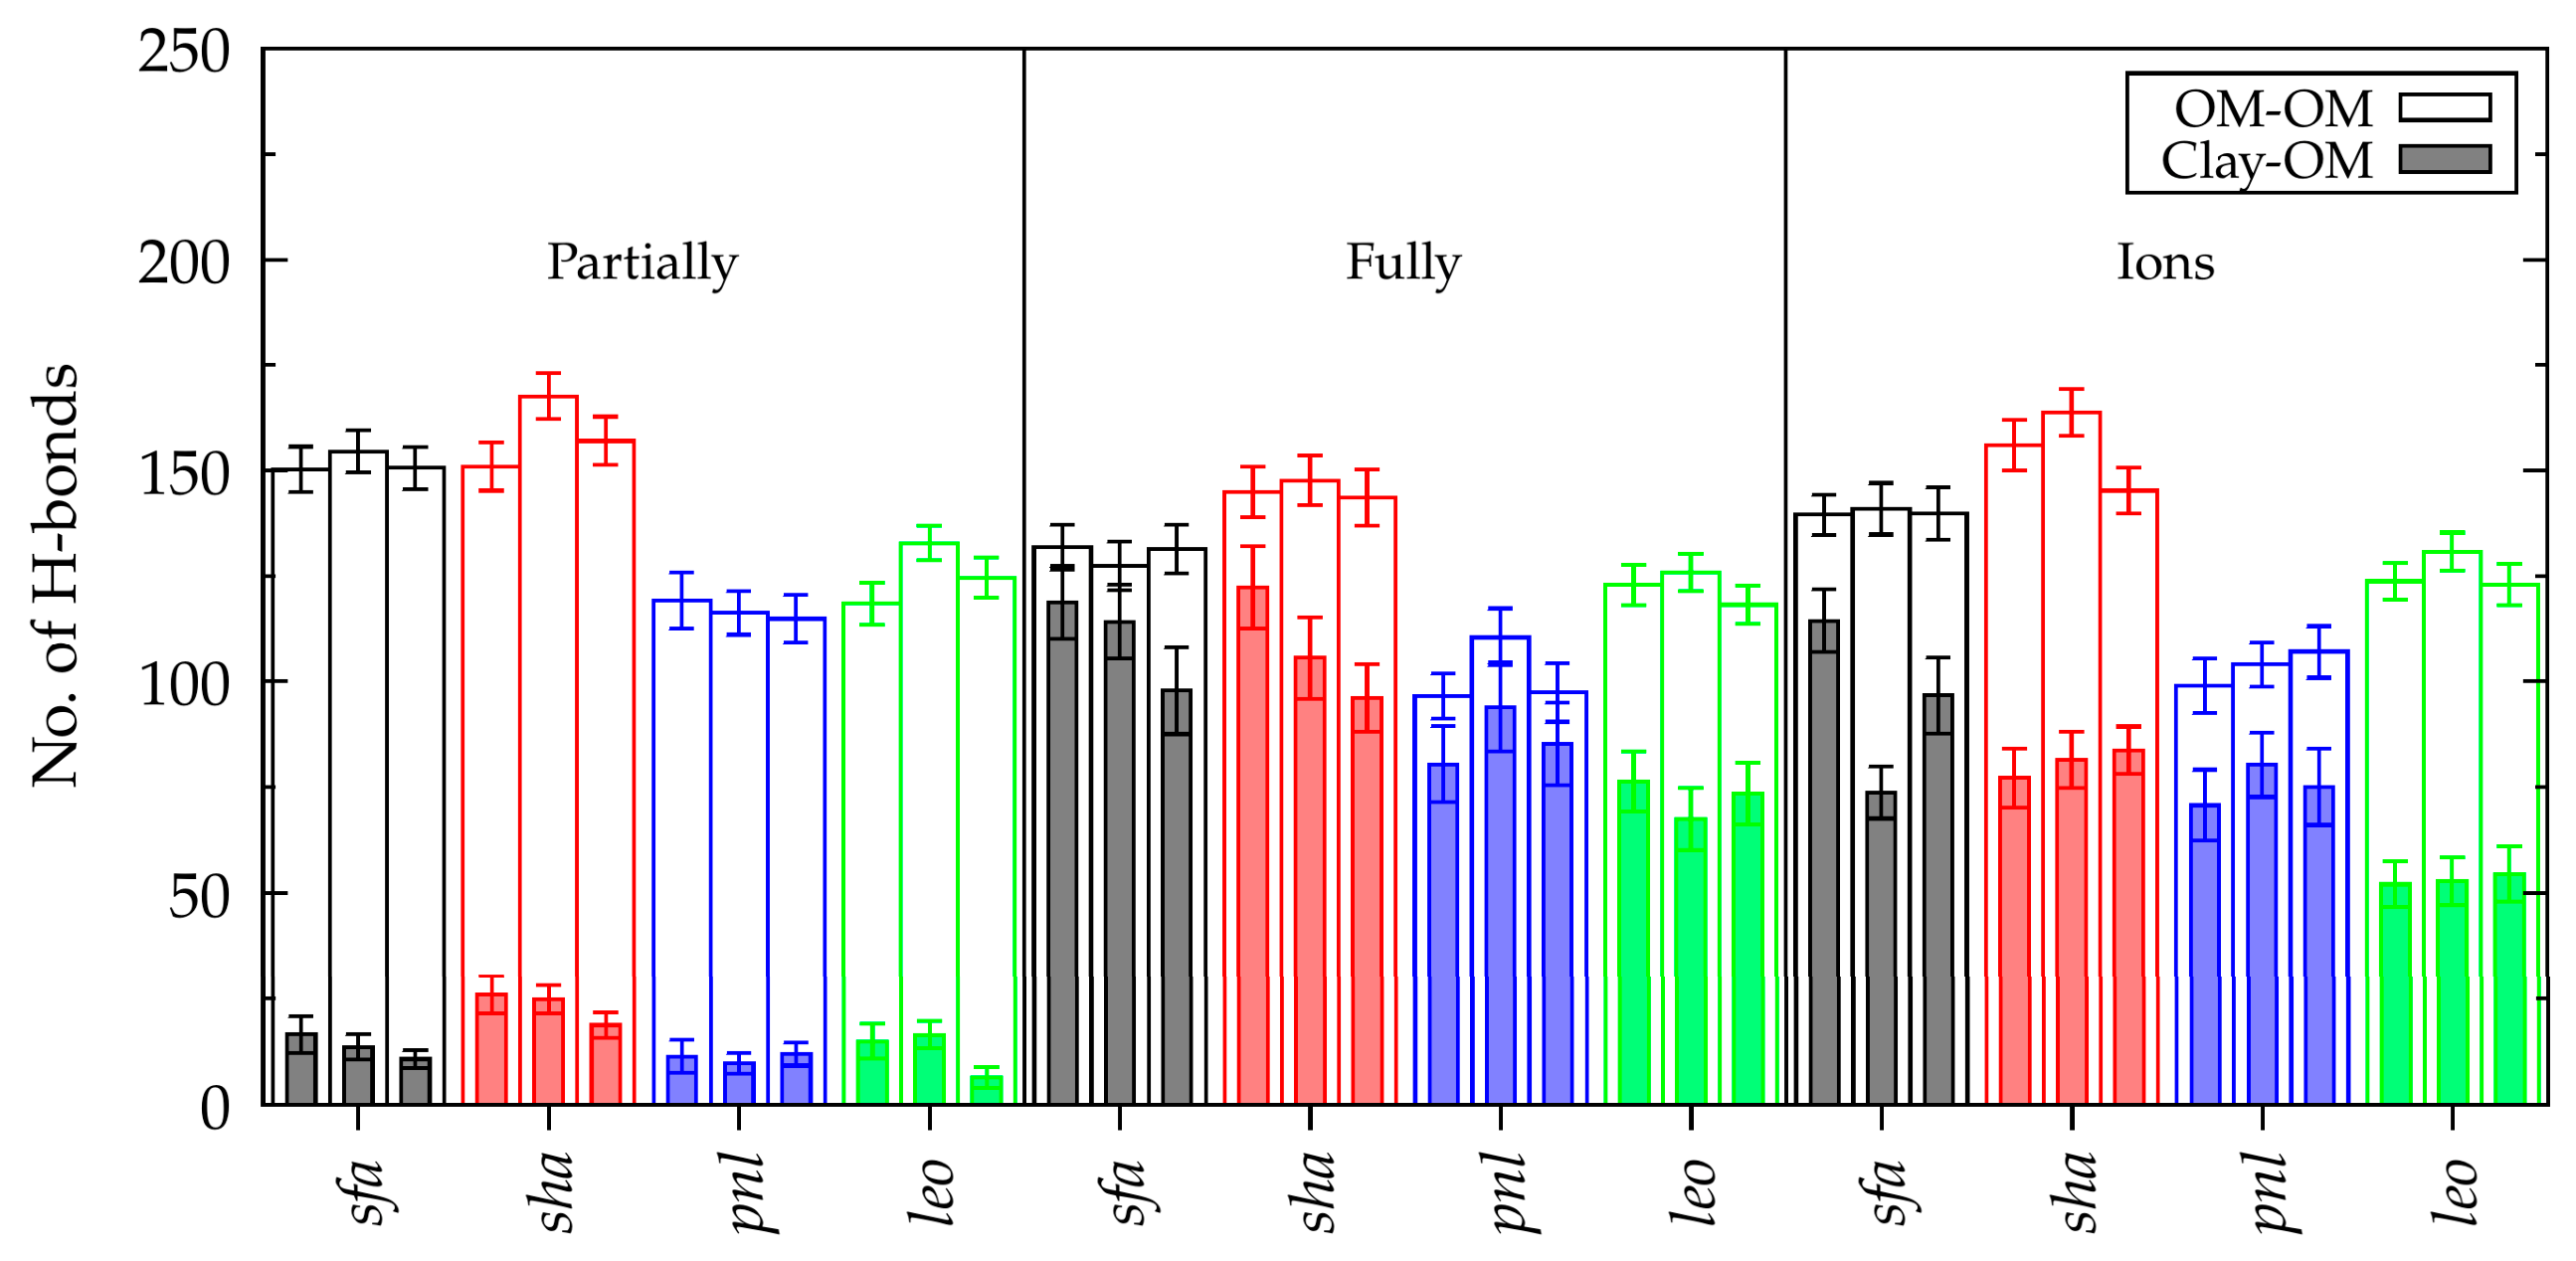
Figure A5.
Occupancy probability percentage of OM samples: Suwannee River III fulvic acid (sfa), Suwannee River III humic acid (sha), Pony Lake fulvic acid (pnl), and Leonardite humic acid (leo) and Ca2+ ions within a distance of 0 > z > 1 nm from the aluminol surface in the partially filled cavity (top row), fully filled cavity (middle row), and fully filled cavity with extra ions (CaCl2 solution) (bottom row).
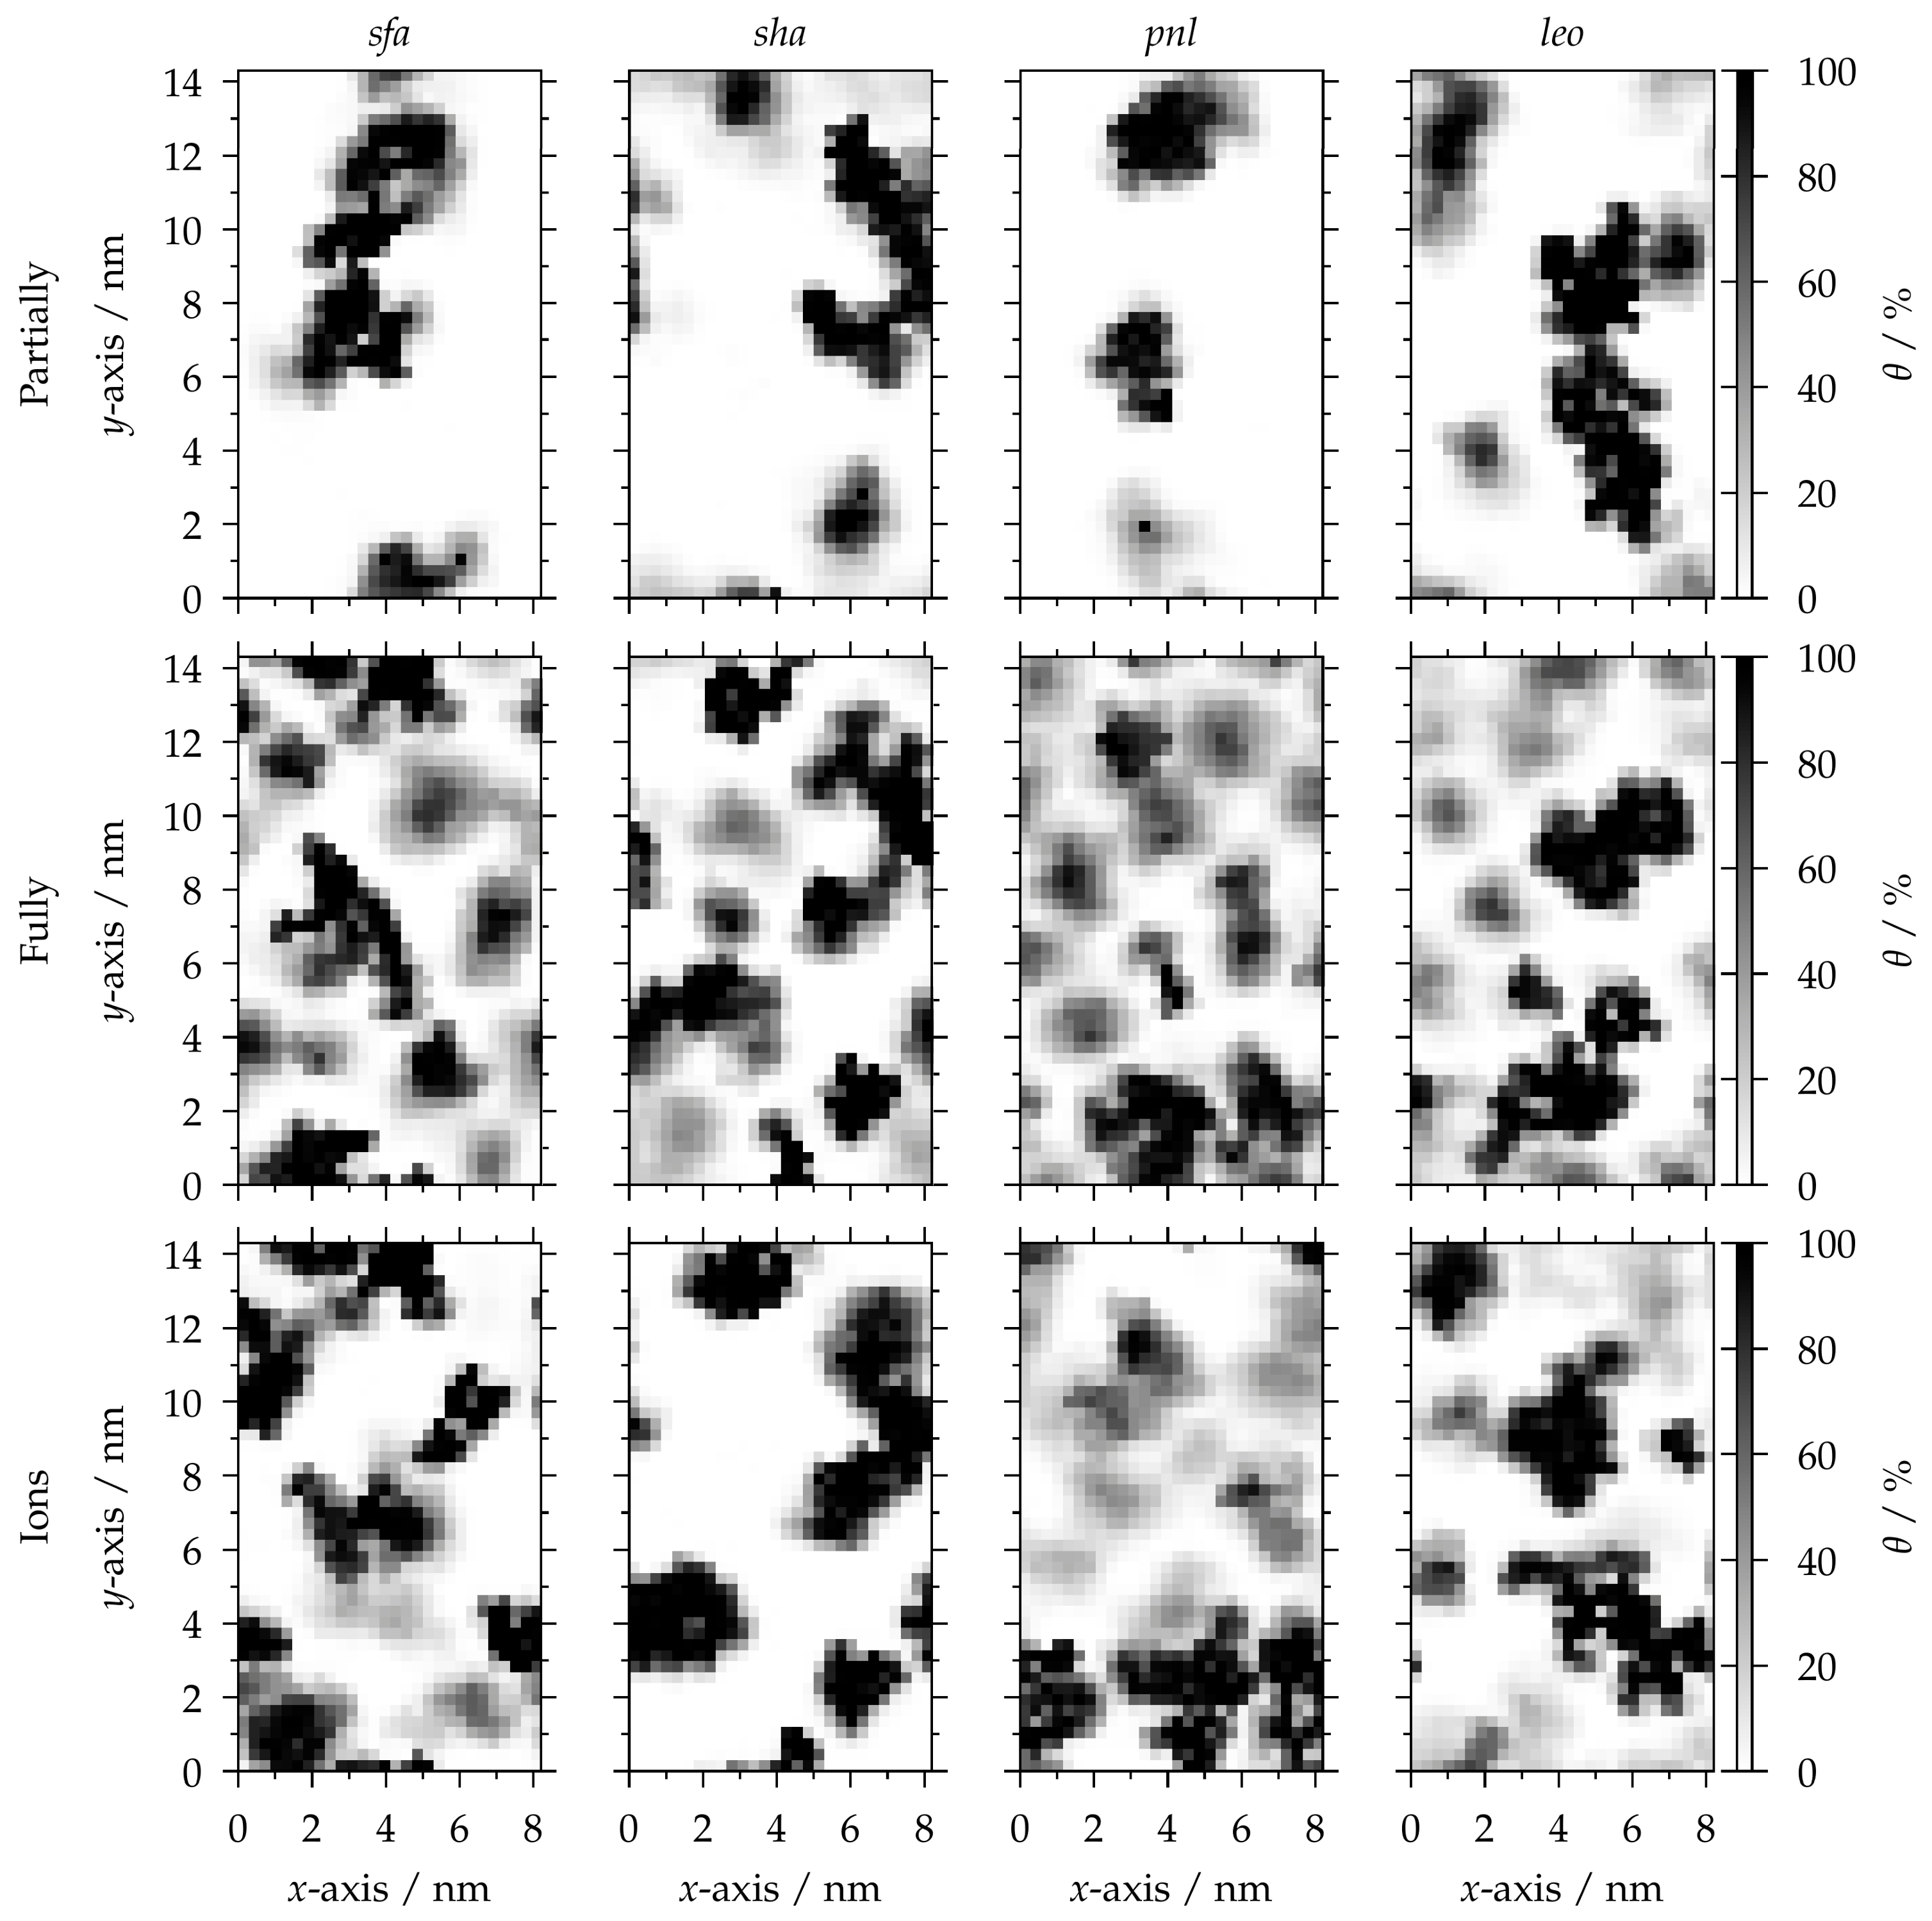
Figure A6.
Occupancy probability percentage of Cl− ions in OM samples: (a) Suwannee River III fulvic acid (sfa), (b) Suwannee River III humic acid (sha), (c) Pony Lake fulvic acid (pnl), and (d) Leonardite humic acid (leo) within a distance of 0 > z > 1 nm from the aluminol surface in fully filled cavity with extra ions (CaCl2 solution). The values of ⟨θ⟩ and G indicate the average occupancy probability over the entire surface and the Gini coefficient, respectively.
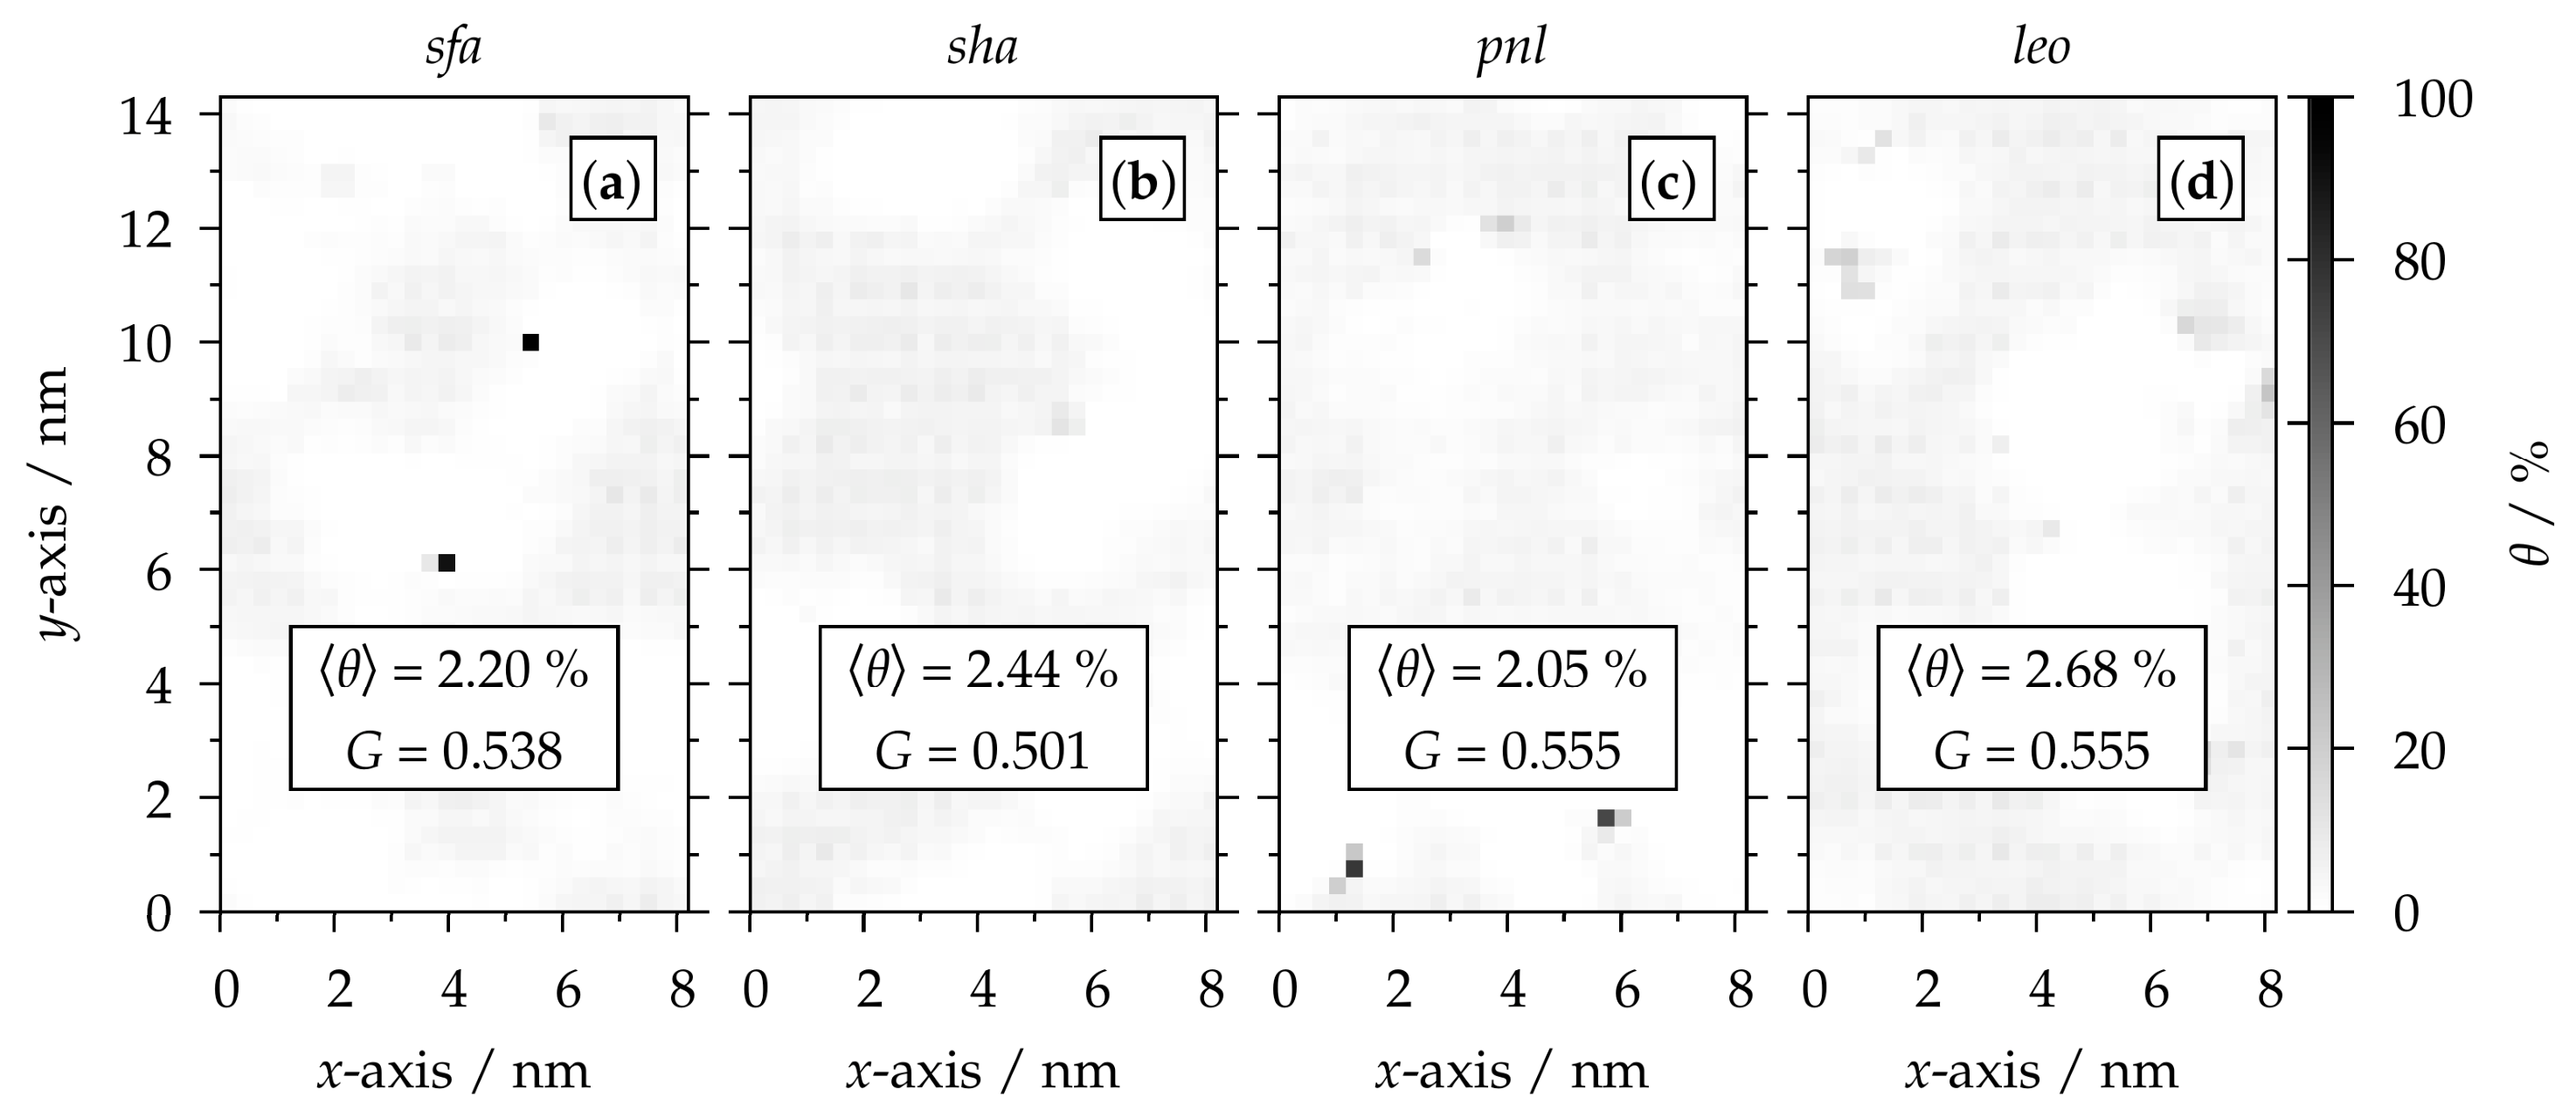
Figure A7.
Occupancy probability heatmap of Ca2+ and organic molecules’ heavy atoms of Leonardite (leo) within a distance of 0 > z > 1 nm from the aluminol surface in (a) fully filled cavity, (b) fully filled cavity with extra ions (CaCl2 solution), and (c) configuration “Ions” after removal of Ca2+ and Cl− ions. The values of ⟨θ⟩ and G indicate the average occupancy probability over the entire surface and the Gini coefficient, respectively.
References
- Sposito, G. The Chemistry of Soils; Oxford University Press: Oxford, UK, 2016. [Google Scholar]
- Totsche, K.U.; Rennert, T.; Gerzabek, M.H.; Kögel-Knabner, I.; Smalla, K.; Spiteller, M.; Vogel, H.-J. Biogeochemical interfaces in soil: The interdisciplinary challenge for soil science. J. Plant Nutr. Soil Sci. 2010, 173, 88–99. [Google Scholar] [CrossRef] [Scilit]
- Kleber, M.; Johnson, M.G. Advances in Understanding the Molecular Structure of Soil Organic Matter. In Advances in Agronomy; Academic Press: Cambridge, MA, USA, 2010; pp. 77–142. [Google Scholar]
- Kögel-Knabner, I.; Rumpel, C. Advances in Molecular Approaches for Understanding Soil Organic Matter Composition, Origin, and Turnover: A Historical Overview. In Advances in Agronomy; Academic Press Inc.: Cambridge, MA, USA, 2018; Volume 149, pp. 1–48. [Google Scholar]
- Lehmann, J.; Kleber, M. The contentious nature of soil organic matter. Nature 2015, 528, 60–68. [Google Scholar] [CrossRef] [Scilit] [PubMed]
- Six, J.; Conant, R.T.; Paul, E.A.; Paustian, K. Stabilization mechanisms of soil organic matter: Implications for C-saturation of soils. Plant Soil 2002, 241, 155–176. [Google Scholar] [CrossRef] [Scilit]
- Tisdall, J.M.; Oades, J.M. Organic matter and water-stable aggregates in soils. J. Soil Sci. 1982, 33, 141–163. [Google Scholar] [CrossRef] [Scilit]
- Totsche, K.U.; Amelung, W.; Gerzabek, M.H.; Guggenberger, G.; Klumpp, E.; Knief, C.; Lehndorff, E.; Mikutta, R.; Peth, S.; Prechtel, A.; et al. Microaggregates in soils. J. Plant Nutr. Soil Sci. 2018, 181, 104–136. [Google Scholar] [CrossRef] [Scilit]
- Essington, M.E. Soil and Water Chemistry: An Integrative Approach; CRC Press: Boca Raton, FL, USA, 2015; pp. 790–791. [Google Scholar] [CrossRef] [Scilit]
- Davidson, E.A.; Janssens, I.A. Temperature sensitivity of soil carbon decomposition and feedbacks to climate change. Nature 2006, 440, 165–173. [Google Scholar] [CrossRef] [Scilit] [PubMed]
- Sokol, N.W.; Whalen, E.D.; Jilling, A.; Kallenbach, C.; Pett-Ridge, J.; Georgiou, K. Global distribution, formation and fate of mineral-associated soil organic matter under a changing climate: A trait-based perspective. Funct. Ecol. 2022, 36, 1411–1429. [Google Scholar] [CrossRef] [Scilit]
- Kögel-Knabner, I.; Guggenberger, G.; Kleber, M.; Kandeler, E.; Kalbitz, K.; Scheu, S.; Eusterhues, K.; Leinweber, P. Organo-mineral associations in temperate soils: Integrating biology, mineralogy, and organic matter chemistry. J. Plant Nutr. Soil Sci. 2008, 171, 61–82. [Google Scholar] [CrossRef] [Scilit]
- Schmickler, W.; Santos, E. Interfacial Electrochemistry; Springer: Berlin/Heidelberg, Germany, 2010. [Google Scholar]
- Ahmed, A.A.; Leinweber, P.; Kühn, O. Unravelling the nature of glyphosate binding to goethite surfaces by ab initio molecular dynamics simulations. Phys. Chem. Chem. Phys. 2018, 20, 1531–1539. [Google Scholar] [CrossRef] [Scilit] [PubMed]
- Galicia-Andrés, E.; Tunega, D.; Gerzabek, M.H.; Oostenbrink, C. On glyphosate–kaolinite surface interactions. A molecular dynamic study. Eur. J. Soil Sci. 2021, 72, 1231–1242. [Google Scholar] [CrossRef] [Scilit] [PubMed]
- Tunega, D.; Gerzabek, M.H.; Haberhauer, G.; Lischka, H.; Aquino, A.J.A. Organic and Contaminant Geochemistry. In Molecular Modeling of Geochemical Reactions; John Wiley & Sons, Ltd.: Chichester, UK, 2016; pp. 177–243. [Google Scholar]
- Davies, G.; Fataftah, A.; Cherkasskiy, A.; Ghabbour, E.A.; Radwan, A.; Jansen, S.A.; Kolla, S.; Paciolla, M.D.; Sein, L.T.; Buermann, W.; et al. Tight metal binding by humic acids and its role in biomineralization. J. Chem. Soc. Dalton Trans. 1997, 26, 4047–4060. [Google Scholar] [CrossRef] [Scilit]
- Schulten, H.-R.; Schnitzer, M. A state of the art structural concept for humic substances. Naturwissenschaften 1993, 80, 29–30. [Google Scholar] [CrossRef] [Scilit]
- Underwood, T.R.; Bourg, I.C.; Rosso, K.M. Mineral-associated organic matter is heterogeneous and structured by hydrophobic, charged, and polar interactions. Proc. Natl. Acad. Sci. USA 2024, 121, e2413216121. [Google Scholar] [CrossRef] [Scilit] [PubMed]
- Cygan, R.T.; Greathouse, J.A.; Kalinichev, A.G. Advances in Clayff Molecular Simulation of Layered and Nanoporous Materials and Their Aqueous Interfaces. J. Phys. Chem. C 2021, 125, 17573–17589. [Google Scholar] [CrossRef] [Scilit]
- Pouvreau, M.; Greathouse, J.A.; Cygan, R.T.; Kalinichev, A.G. Structure of Hydrated Kaolinite Edge Surfaces: DFT Results and Further Development of the ClayFF Classical Force Field with Metal–O–H Angle Bending Terms. J. Phys. Chem. C 2019, 123, 11628–11638. [Google Scholar] [CrossRef] [Scilit]
- Escalona, Y.; Petrov, D.; Galicia-Andrés, E.; Oostenbrink, C. Exploring the Macroscopic Properties of Humic Substances Using Modeling and Molecular Simulations. Agronomy 2023, 13, 1044. [Google Scholar] [CrossRef] [Scilit]
- Borisover, M.; Petrov, D.; Oostenbrink, C.; Galicia-Andrés, E. Diluting humic substances in water in molecular dynamics simulations: Are aggregates stable? Colloids Surf. A Physicochem. Eng. Asp. 2025, 704, 135507. [Google Scholar] [CrossRef] [Scilit]
- Kalinichev, A.G.; Kirkpatrick, R.J. Molecular dynamics simulation of cationic complexation with natural organic matter. Eur. J. Soil Sci. 2007, 58, 909–917. [Google Scholar] [CrossRef] [Scilit]
- Iskrenova-Tchoukova, E.; Kalinichev, A.G.; Kirkpatrick, R.J. Metal cation complexation with natural organic matter in aqueous solutions: Molecular dynamics simulations and potentials of mean force. Langmuir 2010, 26, 15909–15919. [Google Scholar] [CrossRef] [Scilit] [PubMed]
- Kalinichev, A.G.; Iskrenova-Tchoukova, E.; Ahn, W.Y.; Clark, M.M.; Kirkpatrick, R.J. Effects of Ca2+ on supramolecular aggregation of natural organic matter in aqueous solutions: A comparison of molecular modeling approaches. Geoderma 2011, 169, 27–32. [Google Scholar] [CrossRef] [Scilit]
- Zhang, Y.; Liu, X.; Zhang, C.; Lu, X. A combined first principles and classical molecular dynamics study of clay-soil organic matters (SOMs) interactions. Geochim. Cosmochim. Acta 2020, 291, 110–125. [Google Scholar] [CrossRef] [Scilit]
- Jiang, S.; Tian, G.; Xing, Y.; Xu, C.; Zhang, J.; Li, X. Molecular fingerprints of vegetation-derived organic matter regulate pH-dependent adsorption on clay mineral: Implications for soil carbon persistence. Environ. Technol. Innov. 2026, 42, 104952. [Google Scholar] [CrossRef] [Scilit]
- Galicia-Andrés, E.; Oostenbrink, C.; Gerzabek, M.H.; Tunega, D. On the adsorption mechanism of humic substances on kaolinite and their microscopic structure. Minerals 2021, 11, 1138. [Google Scholar] [CrossRef] [Scilit]
- Gupta, V.; Miller, J.D. Surface force measurements at the basal planes of ordered kaolinite particles. J. Colloid Interface Sci. 2010, 344, 362–371. [Google Scholar] [CrossRef] [Scilit] [PubMed]
- Šolc, R.; Gerzabek, M.H.; Lischka, H.; Tunega, D. Wettability of kaolinite (001) surfaces—Molecular dynamic study. Geoderma 2011, 169, 47–54. [Google Scholar] [CrossRef] [Scilit]
- Bish, D.L. Rietveld refinement of the kaolinite structure at 1.5 K. Clays Clay Miner. 1993, 41, 738–744. [Google Scholar] [CrossRef] [Scilit]
- International Humic Substances Society. What Are Humic Substances? Available online: https://humic-substances.org/ (accessed on 25 August 2026).
- Escalona, Y.; Petrov, D.; Oostenbrink, C. Vienna soil organic matter modeler 2 (VSOMM2). J. Mol. Graph. Model. 2021, 103, 107817. [Google Scholar] [CrossRef] [Scilit] [PubMed]
- Sündermann, A.; Solc, R.; Tunega, D.; Haberhauer, G.; Gerzabek, M.H.; Oostenbrink, C. Vienna Soil-Organic-Matter Modeler—Generating condensed-phase models of humic substances. J. Mol. Graph. Model. 2015, 62, 253–261. [Google Scholar] [CrossRef] [Scilit] [PubMed]
- Galicia-Andrés, E.; Escalona, Y.; Oostenbrink, C.; Tunega, D.; Gerzabek, M.H. Soil organic matter stabilization at molecular scale: The role of metal cations and hydrogen bonds. Geoderma 2021, 401, 115237. [Google Scholar] [CrossRef] [Scilit]
- Reif, M.M.; Hünenberger, P.H.; Oostenbrink, C. New Interaction Parameters for Charged Amino Acid Side Chains in the GROMOS Force Field. J. Chem. Theory Comput. 2012, 8, 3705–3723. [Google Scholar] [CrossRef] [Scilit] [PubMed]
- Cygan, R.T.; Liang, J.-J.; Kalinichev, A.G. Molecular models of hydroxide, oxyhydroxide, and clay phases and the development of a general force field. J. Phys. Chem. B 2004, 108, 1255–1266. [Google Scholar] [CrossRef] [Scilit]
- Berendsen, H.J.C.; Postma, J.P.M.; van Gunsteren, W.F.; Hermans, J. Interaction models for water in relation to protein hydration. In Intermolecular Forces: Proceedings of the Fourteenth Jerusalem Symposium on Quantum Chemistry and Biochemistry Held in Jerusalem, Israel, April 13–16, 1981; Pullman, B., Ed.; Springer: Dordrecht, The Netherlands, 1981; pp. 331–342. [Google Scholar]
- Abraham, M.J.; Murtola, T.; Schulz, R.; Páll, S.; Smith, J.C.; Hess, B.; Lindahl, E. GROMACS: High performance molecular simulations through multi-level parallelism from laptops to supercomputers. SoftwareX 2015, 1–2, 19–25. [Google Scholar] [CrossRef] [Scilit]
- Bussi, G.; Donadio, D.; Parrinello, M. Canonical sampling through velocity rescaling. J. Chem. Phys. 2007, 126, 014101. [Google Scholar] [CrossRef] [Scilit] [PubMed]
- Berendsen, H.J.C.; Postma, J.P.M.; van Gunsteren, W.F.; DiNola, A.; Haak, J.R. Molecular dynamics with coupling to an external bath. J. Chem. Phys. 1984, 81, 3684–3690. [Google Scholar] [CrossRef] [Scilit]
- Essmann, U.; Perera, L.; Berkowitz, M.L.; Darden, T.; Lee, H.; Pedersen, L.G. A smooth particle mesh Ewald method. J. Chem. Phys. 1995, 103, 8577–8593. [Google Scholar] [CrossRef] [Scilit]
- Miyamoto, S.; Kollman, P.A. Settle: An analytical version of the SHAKE and RATTLE algorithm for rigid water models. J. Comput. Chem. 1992, 13, 952–962. [Google Scholar] [CrossRef] [Scilit]
- Hess, B.; Bekker, H.; Berendsen, H.J.C.; Fraaije, J.G.E.M. LINCS: A linear constraint solver for molecular simulations. J. Comput. Chem. 1997, 18, 1463–1472. [Google Scholar] [CrossRef]
- Galicia-Andrés, E.; Petrov, D.; Gerzabek, M.H.; Oostenbrink, C.; Tunega, D. Polarization effects in simulations of kaolinite-water interfaces. Langmuir 2019, 35, 15086–15099. [Google Scholar] [CrossRef] [Scilit] [PubMed]
- Gerzabek, M.H.; Aquino, A.J.A.; Balboa, Y.I.E.; Galicia-Andrés, E.; Grančič, P.; Oostenbrink, C.; Petrov, D.; Tunega, D. A contribution of molecular modeling to supramolecular structures in soil organic matter. J. Plant Nutr. Soil Sci. 2022, 185, 44–59. [Google Scholar] [CrossRef] [Scilit]
- Galicia–Andrés, E.; Escalona, Y.; Gotsmy, M.; Oostenbrink, C.; Petrov, D. Molecular Dynamics Simulations up to Earth: Modeling of Soil Organic Matter. In Comprehensive Computational Chemistry; Elsevier: Amsterdam, The Netherlands, 2024; pp. 987–999. [Google Scholar]
- Humphrey, W.; Dalke, A.; Schulten, K. VMD: Visual molecular dynamics. J. Mol. Graph. 1996, 14, 33–38. [Google Scholar] [CrossRef] [Scilit] [PubMed]
- Damgaard, C.; Weiner, J. Describing inequality in plant size or fecundity. Ecology 2000, 81, 1139–1142. [Google Scholar] [CrossRef]
- Tunega, D.; Aquino, A.J.A.; Haberhauer, G.; Lischka, H.; Schaumann, G.E.; Gerzabek, M.H. Molecular models of cation and water molecule bridges in humic substances. In Soil Carbon; Hartemink, A., McSweeney, K., Eds.; Springer International Publishing: Berlin/Heidelberg, Germany, 2014; pp. 107–115. [Google Scholar]
- Spohr, E. Effect of electrostatic boundary conditions and system size on the interfacial properties of water and aqueous solutions. J. Chem. Phys. 1997, 107, 6342–6348. [Google Scholar] [CrossRef] [Scilit]
- Yeh, I.-C.; Berkowitz, M.L. Ewald summation for systems with slab geometry. J. Chem. Phys. 1999, 111, 3155–3162. [Google Scholar] [CrossRef] [Scilit]

Disclaimer/Publisher’s Note: The statements, opinions and data contained in all publications are solely those of the individual author(s) and contributor(s) and not of MDPI and/or the editor(s). MDPI and/or the editor(s) disclaim responsibility for any injury to people or property resulting from any ideas, methods, instructions or products referred to in the content. |
© 2026 by the authors. Licensee MDPI, Basel, Switzerland. This article is an open access article distributed under the terms and conditions of the Creative Commons Attribution (CC BY) license.