


Abstract
Natural flake graphite is a critical anode material for lithium-ion batteries, demanding both ultrahigh chemical purity and preserved large-flake microstructural integrity. However, conventional bulk assays (e.g., chemical titration and combustion) are destructive, time-lagged, and obscure localized impurity distributions. While commercial automated mineralogy systems (e.g., MLA and QEMSCAN) have long enabled routine modal analysis, their application to high-purity graphite is constrained by low backscattered electron contrast in light-element matrices, high detection limits, and an inability to quantify intra-flake mechanical cleavage damage. This perspective review conceptualizes an end-to-end, dual-track paradigm for nondestructive graphite quality screening that decouples microstructural damage evaluation from chemical impurity identification. First, we review the physicochemical baseline of low-temperature plasma modification via Raman and X-ray photoelectron spectroscopy to confirm bulk sp2 lattice preservation. Second, to quantify morphological degradation without conflating voids with mineral inclusions, we propose two mechanics-inspired geometric indicators—the Defect Area Ratio (DAR) and Structural Damage Index (SDI)—as segmentation targets for lightweight CNN–Transformer networks. Third, to resolve Z-contrast ambiguity and topographic noise during mid-stream purification screening (90.0–99.8 wt.% C), we outline the Spatial Image-Spectrum Transformation and Interactive Fusion Design (SISTIFD) framework, followed by a high-dimensional vector database roadmap and quantitative validation protocols.
1. Introduction
Owing to its exceptional electrical conductivity, thermal properties, and chemical stability, natural flake graphite serves as a critical material in strategic fields, including lithium-ion battery (LIB) anodes, flexible thermal management devices, and the nuclear industry [1,2,3,4,5,6]. Driven by the rapid expansion of the electric vehicle (EV) market, demand for high-grade natural graphite beneficiation and spent-LIB graphite recycling has surged, becoming a central focus of sustainable development and the circular economy [7,8,9,10,11]. Advanced applications impose stringent standards on both graphite chemical purity—typically requiring a fixed carbon content exceeding 99.9% or 99.95%—and flake structural integrity, highlighting the technical bottlenecks of conventional purification and evaluation systems [12,13,14,15,16,17,18,19,20,21,22,23,24,25,26,27,28,29,30].
Over the past decades, both industry and academia have investigated various graphite purification processes. Traditional physical beneficiation approaches, such as multi-stage grinding and ultrasound-assisted froth flotation, typically achieve only medium-grade carbon enrichment (90.0%–95.0% C) because fine silicate gangue minerals remain closely intergrown between graphite layers [7,8,9,10,11]. To achieve battery-grade or nuclear-grade purity, high-intensity chemical or thermophysical treatments—including hydrofluoric acid (HF) leaching, alkali-roasting acid leaching, high-pressure hydrothermal processing, and high-temperature chlorination roasting—are extensively utilized [12,13,14,15,16,17,18,19,20,21,22,23,24,25,26,27,28,29,30,31,32,33,34,35,36,37,38,39,40]. Although effective at dissolving silicate, aluminosilicate, and sulfide impurities, these aggressive approaches consume substantial energy and generate severe hazardous liquid effluents. More critically, violent physicochemical reactions and intensive mechanical comminution cause irreversible brittle fracture and interlayer exfoliation to the natural large-flake structure of graphite (especially the −1.0 to +0.3 mm super-large flakes) and its internal sp2 carbon network [19,28,31,32,33,34,35,36,37,38,39,40].
Concurrently, existing industrial frameworks for evaluating graphite purity rely heavily on macroscopic physicochemical assays, such as chemical titration, loss-on-ignition (LOI) combustion, and fixed-carbon ash testing. Inherently destructive and time-lagged (requiring hours to days), these bulk techniques cannot facilitate rapid, nondestructive feedback loops for batch-wise purification optimization. Furthermore, bulk assays obscure the microscopic spatial distribution of residual impurities on basal surfaces or within interlayer microcracks, making it difficult to diagnose process bottlenecks such as acid-leaching blind spots.
To achieve spatially resolved characterization, commercial automated mineralogy platforms based on scanning electron microscopy coupled with energy-dispersive X-ray spectroscopy (SEM–EDS)—most notably QEMSCAN, Mineral Liberation Analyser (MLA), TESCAN Integrated Mineral Analyzer (TIMA), and ZEISS Mineralogic—have been deployed across the mineral processing, metallurgy, and coal industries for decades [41,42,43,44,45]. Equipped with motorized stages and automated beam control, these established systems routinely perform modal mineralogy, particle-size distribution, mineral association, liberation analysis, and porosity quantification. Building upon these automated microscopy foundations, recent advances in computer vision and deep learning have further accelerated automated mineral segmentation, pore network extraction, and ore grade recognition in geometallurgy [46,47,48,49,50,51,52,53,54,55,56,57,58,59,60,61]. Nevertheless, directly deploying either conventional rule-based commercial platforms (e.g., MLA/QEMSCAN) or off-the-shelf deep learning models for high-purity flake graphite screening encounters three fundamental challenges:
(1) Z-Contrast Ambiguity and Light-Element Matrix Effects: Commercial automated mineralogy relies primarily on backscattered electron (BSE) grayscale thresholding to segment mineral phases prior to EDS acquisition [41,43]. Because graphite is a low-atomic-number matrix (Z = 6) with high electrical conductivity, whereas embedded gangue inclusions (e.g., quartz, muscovite, and feldspar) are nonconductive dielectrics presenting overlapping mean atomic numbers, severe Z-contrast ambiguity and localized electrostatic charging occur on unpolished, rough flake surfaces.
(2) SEM–EDS Detection Limit Constraints: The bulk chemical detection limit of standard SEM–EDS typically ranges from 0.1 to 1.0 wt.% (i.e., 1000–10,000 ppm), and X-ray signals from trace light-element silicates are heavily masked by the dominant carbon peak [41,43]. At ultrahigh graphite purities of 99.9%–99.95% C, total impurities drop to 500–1000 ppm. Consequently, SEM–EDS cannot directly replace bulk chemical assays (e.g., ICP-OES or ash combustion) for certifying final 99.95% battery-grade purity; rather, its applicable operational window lies in rapid batch screening of mid-stream purification products (90.0%–99.8% C) and localized anomaly detection of residual inclusion clusters in high-purity batches.
(3) Conflation of Structural Voids and Chemical Impurities: Existing automated protocols do not mathematically decouple physical microstructural damage (such as empty pores, cleavage delaminations, and grinding microcracks) from solid impurity inclusions. A flake with severe mechanical microcracking does not necessarily exhibit lower chemical purity, yet open cleavage cracks frequently act as capillary traps for insoluble ash or lead to structural collapse during anode calendering.
From a materials science perspective, establishing reliable morphological and compositional screening also depends on preserving the pristine carbon matrix during upstream surface cleaning. Conventional high-intensity thermochemical leaching induces chaotic lattice fragmentation, complicating quantitative damage tracking. In contrast, emerging non-equilibrium low-temperature plasma (NTP) processing offers a gentle, dry modification route that selectively removes superficial amorphous carbon and trace contaminants while preserving the bulk sp2 carbon matrix and native large-flake geometry. Reviewing the lattice-scale nondestructiveness of NTP modification therefore establishes a clean physical baseline for distinguishing intrinsic mechanical defects from surface modification effects.
To bridge these gaps between mineral physics and computer vision, this perspective review conceptualizes an end-to-end, dual-track paradigm for automated, nondestructive graphite quality screening that explicitly separates microstructural damage evaluation from chemical impurity estimation. Following a systematic review methodology (Section 2), we first synthesize the physicochemical baseline of low-temperature plasma processing using micro-Raman and X-ray photoelectron spectroscopy (XPS) evidence (Section 3). Second, for the microstructural integrity track, we formulate two mechanics-inspired heuristic geometric indicators—the Defect Area Ratio (DAR) and Structural Damage Index (SDI)—to quantify physical void and microcrack severity via lightweight CNN–Transformer segmentation without conflating voids with chemical impurities (Section 4). Third, for the chemical purity track within the SEM–EDS detection window, we propose the Spatial Image-Spectrum Transformation and Interactive Fusion Design (SISTIFD) framework, combining spatial attention and mutual information constraints to mitigate cross-modal misalignment and topographic noise (Section 5). Finally, we outline a high-dimensional vector database architecture alongside a quantitative validation protocol (MAE, RMSE, and R2) to guide empirical benchmarking across diverse graphite deposits (Section 6 and Section 7).
A comparative analysis of traditional chemical assays, commercial automated mineralogy systems, and the conceptualized dual-track paradigm is provided in Table 1. Crucially, rather than reporting empirical data from a single localized deposit, this review is structured as a critical methodological synthesis and conceptual roadmap, clearly distinguishing published experimental evidence from newly proposed mathematical formalisms.
Table 1.
Comparison matrix among traditional physicochemical assays, established commercial automated mineralogy platforms, and the conceptualized dual-track machine vision quality evaluation paradigm.
2. Review Methodology and Structural Scope
2.1. Literature Search Strategy and Selection Criteria
To ensure a rigorous, transparent, and reproducible synthesis of the interdisciplinary literature bridging graphite beneficiation, automated mineralogy, and computer vision, a structured bibliographic search was conducted across four major scientific databases: Web of Science Core Collection, Scopus, ScienceDirect, and IEEE Xplore, supplemented by Google Scholar for foundational technical reports. The primary review window spanned from January 2000 to March 2026, while classical continuum mechanics formulations (e.g., Inglis’ stress concentration theory) and pioneering automated mineralogy developments from 1983 to 1999 were retained to establish historical and theoretical foundations.
Boolean search strings were constructed across three intersecting thematic domains:
(1) Graphite Purification and Plasma Modification: (“natural flake graphite” OR “aphanitic graphite” OR “spent LIB graphite”) AND (“purification” OR “beneficiation” OR “froth flotation” OR “acid leaching” OR “alkali roasting” OR “low-temperature plasma” OR “dielectric barrier discharge”).
(2) Automated Mineralogy and Microstructural Characterization: (“automated mineralogy” OR “Mineral Liberation Analyser” OR “MLA” OR “QEMSCAN” OR “TIMA” OR “SEM-EDS” OR “X-ray computed tomography” OR “XCT”) AND (“graphite” OR “liberation” OR “porosity” OR “microcrack” OR “Z-contrast”).
(3) Deep Learning and Multimodal Image–Spectrum Fusion: (“deep learning” OR “convolutional neural network” OR “Vision Transformer” OR “TransUNet” OR “SegFormer”) AND (“multimodal fusion” OR “pansharpening” OR “SEM” OR “EDS” OR “defect segmentation” OR “vector database”).
Studies were screened according to strict inclusion and exclusion criteria. The inclusion criteria encompassed: (i) peer-reviewed journal articles and conference proceedings investigating physical, thermochemical, or plasma-based graphite purification and their impact on lattice integrity; (ii) empirical studies utilizing optical microscopy, SEM–EDS, Raman, XPS, or XCT to characterize mineral inclusions and structural defects; and (iii) methodological papers introducing segmentation architectures, statistical pansharpening (e.g., AB-PLS-DA), or feature indexing transferable to geometallurgy. Conversely, the exclusion criteria eliminated: (i) studies exclusively addressing bottom-up synthetic graphene chemical vapor deposition (CVD) unrelated to natural mineral processing; (ii) purely commercial market forecasts lacking experimental or algorithmic metadata; and (iii) duplicate records or non-peer-reviewed preprints without validated mathematical formulations (with the exception of foundational open-source architecture baselines such as TransUNet). Ultimately, 112 representative publications were selected and synthesized.
2.2. Delineation Between Published Empirical Evidence and Conceptual Proposals
Because this article functions as a perspective review that bridges existing experimental literature with a forward-looking methodological blueprint, we explicitly delineate published empirical findings from the authors’ conceptual proposals to prevent methodological ambiguity:
(1) Synthesized Published Experimental Results (Section 3 and Literature Baselines in Section 4 and Section 5): All spectroscopic, morphological, and tomographic evidence regarding graphite purification and mechanical grinding originates strictly from peer-reviewed empirical studies. Specifically, the comparative reaction metrics of hydrometallurgical, pyrometallurgical, and flotation routes (Table 2) are compiled from established beneficiation literature; the micro-Raman ID/IG lattice stability and XPS C 1s surface functionalization profiles under low-temperature plasma treatment (Figure 1) are adapted from published plasma modification studies detailed in Section 3; the SEM surface delamination progressions and 3D XCT internal pore reconstructions during comminution (Figures 2 and 3) are adapted from empirical grinding studies detailed in Section 4.1; and the statistical pansharpening baseline (AB-PLS-DA) reflects the published chemometric benchmark detailed in Section 5.2.
(2) Authors’ Conceptual Proposals and Theoretical Formulations (Section 4, Section 5, Section 6 and Section 7): Building upon the physical bottlenecks identified in the literature, the dual-track automated quality assessment framework represents the authors’ original conceptual contribution. Specifically, this encompasses: (i) the formulation of the regularized heuristic geometric indicators—Defect Area Ratio (DAR) and Structural Damage Index (SDI)—for quantifying 2D morphological damage (Equations (1)–(5) and Figure 4); (ii) the comparative taxonomy matching lightweight CNN–Transformer hybrids to graphite defect topologies (Table 3); (iii) the dual-stream Spatial Image-Spectrum Transformation and Interactive Fusion Design (SISTIFD) architecture incorporating nonlinear gating, spatial attention, and InfoNCE mutual information constraints (Equations (6)–(8) and Figure 5); and (iv) the HNSW-indexed vector database architecture alongside the standardized quantitative validation protocol (Section 6 and Section 7).
3. Nondestructive Mechanisms of Low-Temperature Plasma in Graphite Purification
Establishing a robust, vision-based quality evaluation framework relies heavily on a comprehensive physicochemical understanding of how purification and surface modification processes impact the graphite microstructure. Whereas conventional hydrometallurgical and pyrometallurgical methods achieve high purity at the expense of severe lattice degradation, nonequilibrium low-temperature plasma modification represents a promising nondestructive paradigm capable of targeted surface reconstruction and trace ash elimination while preserving the underlying sp2 carbon matrix. Reviewing these microscopic mechanisms establishes an essential physical benchmark for correlating microstructural preservation with macroscopic quality metrics.
3.1. Kinetic and Thermodynamic Comparison with Traditional Leaching
Traditional strong-acid liquid-phase oxidation and alkali-fusion acid-leaching processes are constrained by classical thermodynamic barriers, generally requiring high concentrations of corrosive reagents (e.g., H2SO4, HNO3, NaOH), prolonged processing cycles, and high-temperature/high-pressure environments. Such intense isotropic corrosion leads to severe degradation of the physical properties of carbon materials and the uncontrollable proliferation of lattice defects. In contrast, low-frequency, low-temperature plasma technologies such as dielectric barrier discharge (DBD) or radio frequency (RF) excitation utilize collisions between high-energy electrons and neutral molecules under non-equilibrium conditions. This interaction generates highly reactive radicals within a very short timeframe, enabling rapid surface reconstruction. Because the macroscopic temperature of the system remains extremely low, this thermal stress modification is strictly confined to the material’s outermost layer, theoretically averting mechanical destruction of the bulk structure of large graphite flakes.
A comprehensive comparison of thermodynamic conditions, purification efficiencies, and lattice degradation mechanisms across conventional and emerging graphite purification methods is provided in Table 2. This overview illustrates how non-equilibrium plasma processing avoids the severe interlayer exfoliation and sp2 carbon matrix disintegration caused by traditional thermochemical treatments, thereby establishing a necessary physical baseline for nondestructive morphological assessment.
Table 2.
Comprehensive comparison of typical graphite purification technologies: Reaction conditions, lattice damage, and structural preservation capabilities.
3.2. Microstructural Lattice Integrity Evaluated by Micro-Raman Spectroscopy
To corroborate the nondestructive hypothesis of plasma treatment, micro-Raman spectroscopy provides the most direct physical criteria in the literature [62]. In the spectra of carbon materials, the intensity ratio of the defect peak (D band) to the graphitization peak (G band), denoted as ID/IG, is a core parameter for assessing the integrity of the sp2 carbon skeleton. Extensive research confirms that regardless of the gas used for low-temperature plasma treatment, the ID/IG ratio of the modified graphite samples remains nearly constant compared to pristine samples. Conversely, traditional high-temperature thermal treatments or strong acid intercalations typically cause a significant spike in this ratio. This minimal spectral shift conclusively indicates that the high-energy particle bombardment effect of the plasma is precisely arrested at the nanoscale surface layer, without triggering deep lattice distortions [62].
3.3. Surface Chemical Evolution and Boundary Localization via XPS
XPS analysis further unravels the underlying nature of localized chemical reactions induced by plasma [63]. Previous studies demonstrate that brief exposure to oxygen or argon plasma can double the surface oxygen atomic concentration of natural flake graphite. Deconvolution fitting reveals that plasma treatment not only removes amorphous carbon from the surface but also introduces polar oxygen-containing functional groups at the basal planes and edges [63]. Spectroscopic profiling derived from preceding studies substantiates this localized etching mechanism. Detailed examinations combining Raman stability analyses with high-resolution XPS (Figure 1) confirm that whereas polar functional groups are successfully grafted onto the graphite surface, the fundamental sp2 carbon lattice remains unaffected by deep, bombardment-induced distortions.
Figure 1.
Spectroscopic characteristics of low-temperature plasma modification reported in the literature: (a) Raman spectra confirming the high stability of the ID/IG ratio before and after low-temperature plasma treatment (adapted from [62]); (b) In high-resolution XPS, the C 1s spectrum demonstrates localized introduction of oxygen-containing functional groups on the surface (adapted from [63]).
Controlled surface modification using low-temperature plasma not only enhances the interfacial separation characteristics between graphite and impurities but also chemically verifies the surface-confined nature of the etching process [65,66,67,68,69,70,71,72,73]. Crucially, within our proposed dual-track quality assessment framework, establishing this nondestructive plasma baseline serves a vital diagnostic role: unlike violent acid-alkali leaching that induces chaotic secondary lattice fragmentation, NTP processing preserves the native bulk flake geometry. Consequently, any micrometer-scale pores, cleavage steps, or microcracks subsequently detected under SEM can be unambiguously attributed to upstream mechanical comminution (grinding and flotation) rather than chemical etching artifacts, providing a clean physical baseline for decoupled morphological damage quantification and residual impurity phase mapping.
4. Automated Microstructural Integrity Pipeline: Heuristic Defect Quantification and Segmentation Architectures
Transitioning the nondestructive evaluation of flake graphite (via SEM and optical microscopy) from qualitative observation to a rigorous engineering framework requires both physically meaningful geometric indicators and automated deep-learning feature extraction. Crucially, to resolve the conceptual boundary between structural degradation and chemical contamination, this section focuses exclusively on microstructural integrity evaluation—quantifying physical voids, cleavage steps, and mechanical microcracks—while the identification of solid mineral inclusions is addressed separately via multimodal image–spectrum fusion in Section 5.
4.1. Proposed Heuristic Geometric Indicators: Defect Area Ratio (DAR) and Structural Damage Index (SDI)
The mechanical vulnerability of natural flake graphite during beneficiation and downstream processing fundamentally depends on its internal microstructural defects. Recent three-dimensional analyses using X-ray computed tomography (XCT) demonstrate that natural flake graphite inherently contains randomly distributed pores and microcracks, with 3D porosity reaching up to 12.73% [74,75]. Under external mechanical shear during multi-stage grinding or thermal shock during roasting, these intrinsic microscopic voids act as local stress concentrators, triggering rapid cleavage propagation and irreversible structural delamination of the carbon matrix [75]. Correlating the two-dimensional surface exfoliation patterns observed under SEM (Figure 2) with the three-dimensional internal pore networks reconstructed via XCT (Figure 3) establishes a direct physical link between comminution-induced microdefects and the structural collapse of super-large flakes.
Figure 2.
SEM images illustrating the surface morphological evolution of flake graphite under mechanical stress: (a–f) Progressive particle size reduction and structural delamination across increasing milling intervals (adapted from [75]).
Figure 3.
Three-dimensional pore and microcrack spatial distribution inside super-large flake graphite reconstructed via XCT scanning: (a) Top, front, right, and 3D volumetric rendering of internal void pathways; (b) Transverse cross-sectional slices highlighting internal damage propagation (adapted from [75]).
To translate this 3D microstructural vulnerability into 2D computable features for automated microscopy [9,76,77,78,79,80,81,82], we propose two complementary heuristic geometric indicators: the Defect Area Ratio (DAR) and the Structural Damage Index (SDI).
Before formulating these equations, it is essential to clarify what DAR and SDI physically measure and how they relate to graphite purification:
(1) Decoupling Physical Voids from Solid Impurity Phases: In our framework, DAR and SDI strictly quantify physical structural voids and morphological disruptions—specifically comminution-induced microcracks, dissolution pores, and basal plane exfoliation craters—rather than solid non-carbon mineral inclusions. Although microcracks and pores are empty cavities that do not directly lower chemical carbon purity by themselves, they govern product quality through two vital mechanisms. First, from a battery-material perspective, preserving uncracked large-flake morphology is a mandatory physical specification alongside chemical purity to prevent electrode particle pulverization during anode calendering. Second, from a hydrometallurgical perspective, deep interlayer microcracks and incomplete cleavage delaminations act as capillary blind spots that shield intergrown silicate gangue (e.g., quartz and muscovite) from leachant penetration or trap insoluble ash residues during washing. Thus, quantifying structural damage provides an indirect physical indicator of leaching accessibility.
(2) Scale Separation Between Plasma Etching and Mechanical Damage: As established in Section 3 via micro-Raman ID/IG stability and XPS profiling, non-equilibrium low-temperature plasma (NTP) etching is strictly confined to the outermost few nanometers of the graphite basal plane. Under standard SEM magnifications used for flake screening (where pixel resolutions typically span 0.1–1.0 μm), nanoscale NTP surface functionalization does not generate micrometer-scale cracks or macro-pores. Consequently, the defect contours extracted in this pipeline selectively reflect micrometer-scale mechanical comminution and cleavage damage without interference from gentle plasma surface cleaning.
Based on this physical definition, the baseline morphological loss of an individual graphite flake is quantified by the Defect Area Ratio (DAR), defined as the ratio of the integrated pixel area of all segmented structural void/crack regions to the total projected area of the flake extracted from a 2D binary segmentation mask:
where represents the total integrated pixel area summed across all M discrete segmented surface exfoliation craters, pores, and microcracks on the flake (with Ai denoting the pixel area of the i-th individual defect contour), and Aflake denotes the overall projected cross-sectional area of the specific graphite flake.
However, a singular area fraction cannot distinguish between benign blunt pores and mechanically catastrophic sharp microcracks. In processed flake graphite, segmented morphological defects typically follow a bimodal geometric distribution: (i) quasi-equiaxed dissolution or gas pores characterized by aspect ratios of κ ∈ [0.40,1.00], and (ii) elongated interlayer cleavage microcracks and shear delaminations (typically 10–100 μm in length with sub-micrometer apertures of 0.1–1.5 μm), which exhibit acute aspect ratios of κ ∈ [0.01,0.20] [74,75]. To capture this topological distinction, we incorporate the morphological aspect ratio, κ ∈ (0,1], defined from the bounding geometry of each segmented defect contour as:
where Lshort and Llong represent the short (aperture) and long (length) axes of a given defect boundary, respectively. For the i-th segmented defect contour, its individual aspect ratio is denoted as κi = Lshort,i/Llong,i. According to Inglis’ classical continuum solution for an isolated elliptical hole in an infinite, homogeneous, isotropic plate under far-field uniaxial tension, the localized stress concentration factor Kt at the sharp boundary tip is governed by this aspect ratio [83]:
To justify applying an Inglis-type scaling to natural flake graphite, its theoretical applicability boundaries and anisotropy-induced deviations must be explicitly defined. Natural graphite is a strongly orthotropic layered crystal, wherein in-plane covalent sp2 bonding (elastic modulus E|| ≈ 1000 GPa) is orders of magnitude stiffer than interlayer van der Waals interactions (E⊥ ≈ 36 GPa) [84], and fracture propagates predominantly via Mode-I/Mode-II interlayer cleavage rather than isotropic tensile rupture. Furthermore, 2D SEM micrographs capture surface projections rather than full 3D crack-tip stress fields. According to Lekhnitskii’s anisotropic elasticity theory for orthotropic laminates [85], the stress concentration factor around an elliptical opening aligned with the principal material axes follows the generalized form Kt,aniso = 1 + Cortho/κ, where Cortho is a material-specific constant governed by the ratios of longitudinal, transverse, and shear moduli. Because Cortho remains constant for a given mineral phase, the fundamental inverse scaling relationship (∝1/κ) is preserved despite elastic anisotropy. Therefore, adopting the isotropic coefficient (2/κ) introduces a constant multiplicative offset in absolute stress magnitude but strictly preserves the relative rank ordering of defect severity across flakes. Accordingly, prior to experimental micromechanical calibration, our formulation is presented not as an exact continuum stress solver, but as a mechanics-inspired proposed geometric indicator.
To establish a mathematical bridge between digital image segmentation and this inverse aspect-ratio scaling while ensuring numerical stability during discrete pixel processing, we propose a regularized structural penalty function, f(κ). Benchmarked against a stable circular pore (κ = 1, where theoretical isotropic Kt = 3), f(κ) is formulated as:
where ϵ > 0 is a dimensionless pixel-discretization regularizer. Rather than an arbitrary empirical constant, ϵ is physically and mathematically grounded in the spatial resolution limit of digital microscopy. Because κ = Lshort/Llong is a dimensionless ratio of pixel lengths, ϵ must also be strictly dimensionless to maintain dimensional homogeneity. In a discrete 2D binary segmentation mask, the minimum resolvable microcrack aperture is bounded by the Nyquist pixel grid limit (Lshort,min = 1 to 2 pixels), whereas a representative microcrack spans a characteristic length of Llong,char ≈ 20 to 50 pixels. The resulting dimensionless discretization floor is Δκmin = Lshort,min/Llong,char ≈ 1/20 = 0.05. Setting ϵ = 0.05 thus provides a physically meaningful resolution cutoff that prevents single-pixel boundary quantization noise in hairline slits (κ < 0.05) from causing unphysical numerical divergence.
By applying this notch-severity penalty function to each segmented defect contour i ∈ {1,2, …, M} and aggregating across the entire flake via per-defect area-weighted summation, the flake-level regularized Structural Damage Index (SDI) is formally defined as:
which naturally reduces to the single-defect form when M = 1 or when evaluated at an effective ensemble aspect ratio κ.
To substantiate the mathematical robustness of SDI, we evaluate its local sensitivity, asymptotic behavior, and order-preservation under multi-defect aggregation. For an individual defect contour, in the blunt-pore regime (κi ∈ [0.40,1.00]), the sensitivity gradient remains small (0.60 to 3.29 for ϵ = 0.05), and f(κi) approaches unity (f(1.0) = 0.97 ≈ 1). Under these conditions, microdefects act primarily as volumetric voids where structural deterioration scales linearly with defect area (). Conversely, in the acute cleavage-microcrack regime (κi ∈ [0.01,0.20]), f(κi) nonlinearly amplifies the damage weight, converging toward a finite physical upper bound of as κi → 0 (for ϵ = 0.05) rather than diverging to infinity.
Crucially, the order-preservation (ranking) property holds strictly under the multi-defect summation rule in Equation (5). First, because each area weight wi = Ai/Aflake > 0 is strictly positive and independent of ϵ, and each penalty term f(κi) is a strictly decreasing function of κi (∂f(κi)/∂κi < 0), the positive linear combination strictly preserves partial-order dominance: for any two flakes with identical total defect area DAR and matched defect area weights wi, if flake A contains sharper microcracks than flake B ( for all i, with strict inequality for at least one defect), then SDI(A) > SDI(B) holds unconditionally for any ϵ > 0. Second, in real micrographs containing hundreds of bimodal defects, the summation in Equation (5) can be grouped into a pore sub-ensemble (total area fraction , mean penalty with ) and a microcrack sub-ensemble (total area fraction , mean penalty with ), yielding . Evaluating Equation (4) across ϵ ∈ {0.01,0.05,0.10} for representative defect topologies yields: (i) for ϵ = 0.01, f(0.80) = 1.16, f(0.15) = 4.50, and f(0.02) = 22.56; (ii) for the baseline ϵ = 0.05, f(0.80) = 1.12, f(0.15) = 3.67, and f(0.02) = 9.86; and (iii) for ϵ = 0.10, f(0.80) = 1.07, f(0.15) = 3.00, and f(0.02) = 5.89. Consequently, whether comparing single defects or multi-defect bimodal populations with varying crack-to-pore area fractions (e.g., 10%, 30%, and 60% DARcrack), the monotonic severity ordering remains 100% invariant (Spearman’s rank correlation ρ = 1.0) across the entire parameter range. This confirms that the aggregated SDI serves as a mathematically consistent, order-preserving geometric indicator for batch-wise flake quality ranking.
To systematically translate these heuristic geometric derivations into a deployable computational architecture, a conceptualized algorithmic blueprint is delineated in Figure 4. This theoretical flowchart outlines the end-to-end processing logic, progressing sequentially from raw microscopic image acquisition and edge-preserving denoising to lightweight CNN–Transformer segmentation, followed by the automated extraction of the proposed geometric damage indicators (DAR and SDI) and downstream multimodal integration.
Figure 4.
Conceptual flowchart of the proposed automated analysis pipeline for segmenting microscopic defects and quantifying the mechanics-inspired heuristic geometric damage indicators (DAR and SDI) of flake graphite.
4.2. Lightweight CNN–Transformer Hybrids for High-Throughput Microscopic Segmentation
Once theoretical models like DAR and SDI are established, the core algorithmic challenge shifts to extracting microdefect features accurately and efficiently from massive microscopic datasets. Prior to deep network ingestion, robust image preprocessing is essential for high-fidelity feature extraction. Utilizing advanced filters, such as nonlocal means filtering to suppress high-frequency detector noise without blurring pore edges, together with watershed algorithms to separate overlapping graphite flakes will ensure the generation of high-quality 2D binary masks. Following this initial preprocessing stage, the primary algorithmic challenge shifts to extracting microdefect features efficiently from massive, microscopic datasets.
The morphological span of defects in complex graphite imagery is vast. Traditional fully convolutional networks (e.g., FCN or standard U-Net) are inherently constrained by their localized receptive fields and struggle to capture long-range contextual dependencies across large flake boundaries [86,87]. Conversely, pure Vision Transformers (ViT), despite their exceptional global modeling capabilities, are prone to losing high-frequency local details critical for identifying minute microcracks during the patch partitioning process.
To address these limitations, lightweight CNN-Transformer hybrid architectures have recently emerged in mineral and materials informatics, as exemplified by TransUNet [88] and SegFormer [89]. This hybrid paradigm offers an optimal theoretical framework for automating graphite defect segmentation [90,91,92,93,94,95,96]. When deployed in industrial workflows, these architectures offer three core advantages:
4.2.1. Seamless Synergy of Local Features and Global Context
By introducing convolution-enhanced patch embeddings at the front end of the Transformer encoder, hybrid architectures lock onto critical low-level boundary cues early in the feature extraction phase. Fusing global self-attention with local depthwise convolutions allows the network to macroscopically understand the topological structure of the graphite flake while precisely delineating the sharp edges of pores at the microscopic level, thereby significantly overcoming boundary blurring phenomena.
4.2.2. Hybrid Loss Optimization for Extreme Class Imbalance
In nondestructive evaluation, defect pixels such as microcracks account for an extremely small proportion of the entire micrograph, presenting a severe class imbalance challenge. Future implementations can utilize hybrid loss functions under deep supervision, combining generalized Dice loss to mitigate global background interference with focal loss to force the network to focus on blurred boundaries [97]. This approach could significantly improve the recall rate of minute damages while suppressing high-intensity background noise.
4.2.3. Industrial Adaptability for High-Throughput Screening
Compared to heavy traditional segmentation networks, lightweight hybrid architectures drastically compress model volume through skip connections and depthwise separable convolutions [89]. The ability to maintain excellent segmentation precision while sharply reducing computational latency ensures that this analytical pipeline can be deployed on edge computing units of automated lab-stationed SEMs, transforming the characterization of purified graphite from a time-consuming manual task into an automated, high-throughput batch-wise screening workflow.
To provide a structured taxonomic perspective on architectural selection for microscopic defect segmentation, Table 3 benchmarks mainstream deep learning paradigms across localized boundary sensitivity, global topological modeling, class imbalance resilience, and at-line deployment feasibility. As summarized in the table, lightweight CNN-Transformer hybrids uniquely resolve the trade-off between localized edge sharpness (crucial for microcrack DAR and SDI quantification) and global morphological modeling, establishing them as the optimal algorithmic engine for automated at-line SEM characterization platforms.
Table 3.
Comparative Taxonomy of Deep Learning Paradigms for Microscopic Defect Segmentation in Materials Metrology (Synthesized from Literature Benchmarks).
5. Multimodal SEM–EDS Fusion: Overcoming Analytical Limitations, Topographic Noise, and Spatial Misalignment
Having established the automated segmentation pipeline for microstructural defect quantification (DAR and SDI) in Section 4, the second track of our framework addresses chemical impurity evaluation via multimodal data integration. Accurately fusing high-resolution morphological SEM images with elemental distribution maps from energy-dispersive X-ray spectroscopy (EDS) serves as a core prerequisite for separating solid gangue inclusions from physical voids. Due to fundamental differences in electron–matter interaction physics, single modalities possess inherent representational blind spots when characterizing natural flake graphite. Conversely, executing multimodal fusion requires careful consideration of analytical limitations, sample preparation artifacts, and nonlinear spatial misalignment.
5.1. Physical and Analytical Limitations of SEM–EDS: Sample Preparation, Accelerating Voltage, Point-Specificity, and Detection Limits
To deploy SEM–EDS responsibly in graphite quality assessment, its physical constraints—specifically interaction volume asymmetry, accelerating voltage trade-offs, sample preparation effects, semi-quantitative point-specificity, and minimum detection limits (MDL)—must be rigorously specified [98,99,100,101,102]:
(1) Interaction Volume Disparity and Accelerating Voltage Trade-Offs: In single-modality backscattered electron (BSE) imaging, sub-micrometer spatial resolution is achieved, but pixel grayscale intensities are governed strictly by the local mean atomic number (Z). Consequently, BSE imaging fails to resolve distinct gangue phases exhibiting overlapping Z-contrast (e.g., intergrown quartz, muscovite, and albite inclusions). While EDS provides elemental specificity, its spatial resolution is bounded by the pear-shaped electron–matter interaction volume (typically 1–5 μm in depth) rather than the nanometer-scale incident probe diameter [98,99,100,101,102]. Furthermore, selecting the accelerating voltage (Vacc) introduces an unavoidable physical trade-off: a sufficiently high overvoltage (typically Vacc = 15–20 kV) is required to efficiently excite characteristic Kα X-ray lines of heavier impurity elements (e.g., Fe, Ca, Ti, and S). However, because graphite is a low-density, low-Z matrix (ρ ≈ 2.26 g/cm3, Z = 6), high-energy electrons penetrate deeply into the subsurface (3–5 μm), causing severe spatial blurring and integrating X-ray signals from buried layers [103]. Conversely, lowering Vacc to 3–5 kV confines the excitation volume to the sub-micrometer surface but fails to excite higher-energy diagnostic X-ray lines and exacerbates signal-to-noise degradation.
(2) Sample Preparation, Surface Topography, and Charging Artifacts: In conventional automated mineralogy (e.g., MLA and QEMSCAN), mineral particulates are embedded in epoxy resin and polished into flat cross-sections to satisfy the plane-geometry assumptions of standard ZAF or Φ(ρz) matrix corrections [41,103]. For high-purity graphite, however, carbon-based epoxy mounting introduces severe matrix interference, making it nearly impossible to distinguish resin-filled pores from the carbon flake edges. Rapid at-line screening therefore requires direct imaging of loose, unpolished graphite flakes mounted on conductive substrates (e.g., Ag or Al stubs). Without resin polishing, two severe physical artifacts arise. First, while the sp2 carbon matrix is highly conductive, exposed silicate and oxide inclusions are dielectric insulators; under electron bombardment without a conductive coating, these inclusions accumulate localized electrostatic charge, deflecting the primary beam and causing bright edge blooming in SEM alongside distorted Bremsstrahlung backgrounds in EDS. Second, micron-scale cleavage steps, curled flake edges, and deep pores alter the local X-ray take-off angle, inducing topographic shadowing (absorption of low-energy X-rays by adjacent pore walls) and spiked spectral noise.
(3) Point-Specific Semi-Quantitative Nature vs. Bulk Chemical Purity: Crucially, conventional standardless SEM–EDS is a localized, point-specific (or micro-domain), semi-quantitative analytical technique. Because EDS measures relative X-ray photon counts within shallow superficial excitation zones and relies on internal normalization (typically assuming stoichiometric oxides or normalizing total detected elements to 100 wt.%), it does not provide a direct gravimetric measurement of the overall bulk carbon purity of a macroscopic graphite batch. Surface-to-bulk heterogeneity—such as acid-resistant silicate inclusions encapsulated deep within thick (+100 mesh) flakes beyond the 3 μm X-ray escape depth—cannot be directly quantified by single-surface EDS scanning.
(4) Minimum Detection Limit (MDL) Analysis and Applicable Purity Regimes: A rigorous detection-limit analysis is essential to define the operational boundaries of the proposed framework. In wavelength-uncalibrated, high-throughput SEM–EDS, the bulk minimum detection limit for minor elements typically ranges from 0.1 to 1.0 wt.% (i.e., 1000 to 10,000 ppm), depending on beam current, detector solid angle, and dwell time [103]. Moreover, for trace light-element silicates (O, Mg, Al, Si), characteristic low-energy X-ray peaks (<2.0 keV) suffer from high mass absorption within the carbon matrix and severe peak-tail masking from the dominant C Kα peak (0.277 keV) [103]. At battery-grade ultrahigh purities of 99.9%–99.95% C, total bulk impurities drop to 500–1000 ppm (0.05–0.10 wt.%), falling below the homogeneous bulk detection limit of standard EDS. Accordingly, the applicability of the proposed SEM–EDS fusion framework is explicitly divided into two distinct industrial regimes:
Regime I (Quantitative Impurity Screening Window: 90.0–99.8 wt.% C, or 2000–100,000 ppm Impurities): Across froth flotation concentrates, alkaline roasting intermediates, and primary acid/plasma leaching stages (which routinely fall within the 99.5–99.8 wt.% C range), residual gangue minerals exceed the practical EDS detection floor (~0.1–0.2 wt.%). Within this window, multimodal SEM–EDS fusion provides rapid, semi-quantitative batch estimation of impurity liberation and modal ash content.
Regime II (Transitional Zone at 99.8–99.9 wt.% C and Ultrahigh-Purity Anomaly Screening Window at >99.9–99.95 wt.% C, or <2000 ppm Impurities): The narrow 99.8–99.9 wt.% C interval (1000–2000 ppm ash) represents a transitional analytical zone where bulk impurity levels approach the homogeneous EDS detection limit, shifting the evaluation from bulk modal regression to discrete particle counting. In final ultrahigh-purity products (>99.9 wt.% C), residual ash rarely exists as a homogeneous atomic solid solution; instead, it persists as sparse, discrete micrometer-sized refractory inclusion particles (e.g., un-leached quartz or pyrite grains trapped in cleavage blind spots). Within the 1–3 μm excitation volume centered on such an individual inclusion particle, the local point concentration of Si, Al, or Fe remains high (20–50 wt.%), well above the point-specific EDS detection limit [103]. Thus, across the ≥99.8–99.9 wt.% C transition and ultrahigh-purity regimes, the framework is not intended to replace bulk ICP-OES or combustion assays for certifying trace ash; rather, it operates as a statistical anomaly detector to flag localized inclusion clusters alongside continuous DAR/SDI flake integrity monitoring.
5.2. Statistical Benchmark: Adaptive Binning Partial Least Squares (AB-PLS-DA)
Even with topological noise successfully filtered, complex nonlinear spatial misalignments persist between SEM morphology and EDS chemical signals. In multicomponent graphite impurity systems, distinct mineral compounds frequently exhibit identical average atomic numbers, yielding identical grayscale intensities in BSE micrographs, despite possessing entirely different elemental combinations in EDS spectra. This classic atomic number contrast ambiguity (or Z-contrast overlap) is the primary culprit behind cross-modal feature misalignment.
Within traditional statistical fusion paradigms, Adaptive Binning Partial Least Squares Discriminant Analysis (AB-PLS-DA) provides a classic mathematical benchmark for resolving this spatial misalignment [99]. Developed for pansharpening SEM and EDS data, this algorithm divides the SEM image into different intensity bins and calculates the mean square error (MSE) between the reconstructed and original bands. When the MSE of a local pixel group exceeds an empirical threshold, the algorithm accurately identifies uncaptured overlapping features embedded within the Z-contrast ambiguity. AB-PLS-DA then adaptively splits these conflicting intensity bins, dynamically expands the response matrix, and re-executes model calibration and generalized matrix inversion, thereby mathematically isolating and aligning overlapping compound features [99].
5.3. Dual-Stream SISTIFD Architecture: Deep Learning Multimodal Fusion and Impurity–Void Decoupling
Although statistical chemometric methods like AB-PLS-DA demonstrate mathematical rigor in local intensity binning, their cubic computational complexity creates a severe throughput bottleneck during high-volume screening, and linear latent projections struggle to model complex 3D topographic shadowing [99]. To overcome these constraints, deep learning multimodal interaction paradigms from materials and medical informatics provide scalable nonlinear solutions [104].
To physically bridge the resolution gap between superficial SEM morphology and volumetric EDS elemental maps while explicitly decoupling physical structural voids from chemical impurity inclusions, we conceptualize a dedicated dual-stream neural architecture: the Spatial Image-Spectrum Transformation and Interactive Fusion Design (SISTIFD). Rather than performing naive pixel-level concatenation, SISTIFD couples high-frequency structural morphology with elemental semantics through four sequential stages: multi-scale feature encoding, nonlinear interactive gating, cross-modal spatial attention alignment, and mutual information-constrained representation learning.
Prior to feature fusion, resolving the spatial scale disparity between the high-resolution SEM micrograph (XSEM ∈ ℝH×W×1) and the coarse, sparse EDS spectral cube (, where Heds ≪ H, Weds ≪ W, and E denotes the number of selected diagnostic energy channels such as C, O, Si, Al, Fe, Ca, S, and K) is mandatory. In the morphological stream, XSEM is processed through a hierarchical CNN–Transformer encoder to extract multi-scale spatial feature maps while preserving sharp crack boundaries, yielding FSEM ∈ ℝH×W×C. Concurrently, in the spectral stream, XEDS is transformed via a series of Transformer encoder blocks coupled with transposed convolutions and coordinate-guided spatial interpolation. This projects the low-resolution elemental semantics into a spatially aligned feature tensor FEDS ∈ ℝH×W×C matching the exact spatial dimensions of FSEM.
First, to dynamically suppress nonconductive electrostatic charging artifacts and rough surface topological noise while distinguishing empty voids from solid mineral inclusions, a Nonlinear Interactive Feature Extraction (NIFE) multiplicative gating mechanism is applied:
where ⊙ denotes the element-wise Hadamard product, Wg ∈ ℝC×C represents a learnable projection tensor implemented via 1 × 1 convolutions, bg is a bias term, and σ(⋅) denotes the sigmoid activation function. Physically, this gating tensor G ∈ ℝH×W×C acts as a spatial–spectral mask that executes pixel-wise semantic decoupling across three microstructural scenarios:
G = σ(Wg ⋅ (FSEM⊙FEDS) + bg),
(i) True Solid Impurity Inclusions: Where localized morphological anomalies in FSEM spatially coincide with elevated non-carbon elemental activations (e.g., Si, Al, Fe) in FEDS, the Hadamard product yields strong positive activations (G → 1), amplifying the inclusion signature for downstream impurity quantification.
(ii) Empty Structural Voids and Microcracks: Where sharp morphological edges in FSEM (such as grinding microcracks or cleavage pores) correspond to pure carbon background or X-ray absorption shadows in FEDS (absence of gangue elemental peaks), the multiplicative gate suppresses the compositional impurity response (G → 0). These features are routed exclusively to the morphological DAR/SDI branch (Section 4), preventing physical cracks from being misclassified as chemical impurities.
(iii) Electrostatic Charging and Topographic Noise: Where spurious BSE brightness blooming or isolated Bremsstrahlung background spikes occur without correlated structural–compositional support, G attenuates the unaligned noise prior to feature aggregation.
Second, to compensate for the spatial mismatch between nanoscale SEM surface boundaries and the micrometer-scale pear-shaped EDS excitation volume, a cross-modal Transformer-Enhanced Global Modeling (TEGM) spatial attention matrix Aspatial is formulated:
where QSEM = FSEMWQ and KEDS = FEDSWK represent linear query and key projections, respectively, and dk is the projection channel dimension serving as a scaling factor to stabilize softmax gradient propagation. Multiplying Aspatial by the value projection allows each superficial morphological query token to attend to surrounding EDS tokens within a receptive window proportional to the 1–3 μm electron interaction radius, deconvolving subsurface elemental spreading and re-centering diffused X-ray halos onto sharp inclusion boundaries [105].
Third, to prevent the loss of latent chemical signatures during non-affine spatial transformations, a Mutual Information Maximization (MIM) objective is enforced across the dual streams. Because direct estimation of mutual information in high-dimensional continuous spaces is computationally intractable, we formulate the objective via a contrastive lower-bound proxy based on the InfoNCE formulation [106]:
where B denotes the batch size, and are normalized latent vector embeddings projected from deep representations F′SEM and F′EDS, measures cosine similarity, and τ > 0 represents a temperature hyperparameter. Minimizing MIM rigorously maximizes the theoretical mutual information lower bound (F′SEM;F′EDS), ensuring that morphological features and elemental purity indicators remain tightly aligned during joint embedding [106].
The systematic processing pipeline and topological data flow of this conceptualized SISTIFD framework are delineated in Figure 5. As illustrated, the parallel morphology and elemental streams independently extract high-frequency microdefects and global compositional distributions, respectively [75]. Rather than performing naive visual overlays, this interactive convergence yields a standardized, high-dimensional fused tensor that separately outputs localized structural damage indices (DAR and SDI) and chemical impurity estimates for subsequent batch-wise screening.
Figure 5.
Schematic topology of the proposed Spatial Image-Spectrum Transformation and Interactive Fusion Design (SISTIFD) framework. The dual-path pipeline mathematically reconciles the grayscale indistinguishability in backscattered electron morphology (FSEM) and the topography-induced noise in element distributions (FEDS) via nonlinear cross-modal gating, spatial attention alignment, and mutual information constraints.
6. Construction and Retrieval Paradigms of Graphite Feature Databases
Following the theoretical formulation of high-precision defect segmentation and multimodal image-spectrum fusion, the generated feature tensors inherently exhibit extreme dimensionality and nonlinear complexity. Converting these high-dimensional microscopic features into a standardized purity evaluation benchmark for engineering retrieval forms the final deployment phase of this nondestructive evaluation paradigm. To construct a robust graphite purity feature database, the architecture must adhere strictly to three core principles: data standardization, high-dimensional database design, and intelligent spatial matching [107,108,109,110,111].
6.1. Feature Standardization, Dimensionality Reduction, and Joint Embedding
Microscopic images acquired across diverse graphite batches, electron microscopes, and accelerating voltages frequently display pronounced domain shifts and background noise. Consequently, data standardization and cleaning are mandatory prior to database ingestion to establish a reliable benchmark. In the conceptualized preprocessing stage, background removal and histogram-based median filtering must be rigorously executed to eliminate spiked pixel distortions caused by topological structures.
Subsequently, 2D geometric topological descriptors, such as DAR and SDI, extracted from hybrid network segmentation masks must be strictly aligned with high-dimensional spectral feature tensors produced by nonlinear interactive fusion mechanisms. Through L2 norm normalization, morphological parameters and chemical composition information can be compressed and embedded into a Joint Feature Space with a unified scale. This dimensionality reduction and cleaning process would not only eliminate redundant noise that contributes minimally to purity prediction but also ensure absolute mathematical consistency of cross-modal features.
6.2. Vector and Graph Database Architectures for Process Geometallurgy
Traditional low-dimensional relational databases suffer from severe retrieval bottlenecks and the risk of feature loss when handling multimodal data with complex topological and spectral dependencies. Drawing on the top-level design philosophy of the “Materials Genome Initiative,” future graphite purity feature databases should abandon traditional tabular storage in favor of Graph Database or Vector Database architectures.
In this innovative architecture, each graphite sample is defined as a core node within the high-dimensional feature space. Its edge attributes are no longer isolated numerical values but direct mappings to its corresponding morphology-spectrum fused feature subspace, utilizing macroscopic chemical purity (e.g., highly accurate fixed carbon content obtained via traditional titration) as the ground truth for that node. This three-dimensional associative mapping of “microscopic morphology-chemical spectrum-macroscopic purity” breaks down the silos between structure and performance. It ensures that highly nonlinear fused features can be rapidly called and clustered in milliseconds by underlying vector indexing systems, such as approximate nearest neighbor search based on the Hierarchical Navigable Small World (HNSW) algorithm [112].
The ultimate scientific objective of constructing a high-dimensional feature database is to achieve high-confidence, nondestructive screening of both batch-wise graphite impurity levels and microstructural integrity. In a conceptual high-throughput batch-wise screening workflow stationed in a laboratory or near-line testing node, harvested graphite samples from a specific purification run are placed under an automated electron microscope to sequentially capture representative SEM images and sparse EDS spectra. The analytical pipeline then automatically computes the heuristic geometric indicators (DAR and SDI) from the morphological branch and the fused multimodal feature tensors via the SISTIFD framework.
By executing high-dimensional vector matching, the system evaluates cosine similarity through distance-weighted k-NN regression within the latent embedding space calibrated against certified reference baselines (where ground-truth chemical purity is predetermined via standard LOI combustion and ICP-OES assays). Within the 90.0–99.8 wt.% C operational window, this process rapidly estimates semi-quantitative carbon purity without requiring destructive acid digestion, while across the 99.8–99.9 wt.% C transitional zone and >99.9 wt.% C ultrahigh-purity regime it flags localized inclusion anomalies alongside flake damage grades. Crucially, this cross-scale mapping framework yields a Digital Twin reference standard that provides rapid post-purification feedback, establishing a data-driven foundation for offline closed-loop optimization of operational parameters (e.g., grinding intensity, reagent dosage, or plasma discharge power).
7. Industrial Bottlenecks, Quantitative Validation Protocols, and Future Perspectives
7.1. Domain Shift, Dust Interference, and Generalization in Mineral Processing
While lightweight CNN–Transformer hybrid architectures offer strong theoretical potential for high-precision defect segmentation under controlled conditions, translating these conceptual models to operational graphite purification lines presents substantial challenges. Factors such as high dust levels, intense vibrations, and random fluctuations in light sources frequently lead to severe degradation of acquired microscopic images. Current models generally exhibit insufficient fault tolerance against extreme noise and lack robust generalization capabilities across different mineral sources. Therefore, developing robust algorithms based on self-supervised learning or Domain Adaptation remains a primary task to overcome the bottlenecks of online monitoring [87,90].
7.2. Hardware–Software Synergy for High-Throughput Automated Mineralogy
The theoretical upper limit and statistical confidence of the nondestructive purity evaluation paradigm are fundamentally governed by the throughput efficiency and spatial alignment accuracy of automated microcharacterization platforms. Rather than pursuing direct in situ physical integration within harsh plasma environments, which presents substantial hurdles in mechanical anti-vibration and optical isolation, future technical efforts should pivot toward engineering high-throughput, near-line or laboratory-stationed automated mineralogy screening hubs. From a physical standpoint, achieving this throughput requires seamless coordination among motorized multi-axis sample stages, high-sensitivity electron detectors, and intelligent focus-tracking algorithms to sequentially scan large batches of graphite flakes without human intervention. At the algorithmic level, rather than relying on prolonged beam dwell times required for traditional full-field EDS mapping, advanced deep learning frameworks must be developed to interpret sparse spectral samplings or perform intelligent super-resolution reconstruction on low-dose frames. Only through such close hardware-software co-design can the intrinsic trade-off between imaging electron-dwell time and cross-scale statistical representativeness be effectively resolved, establishing a viable pathway for routine product quality control. Furthermore, from an upstream processing perspective, reconciling the high-tonnage continuous throughput required by industrial mineral beneficiation with the batch-wise residence time of non-equilibrium plasma reactors remains an open engineering challenge for future large-scale commercialization.
7.3. Quantitative Validation Protocol, Ablation Design, and Standardization Roadmap
Because the dual-track SISTIFD + DAR/SDI paradigm is presented in this review as a conceptual methodological blueprint, establishing a rigorous, standardized experimental validation protocol is essential to guide upcoming empirical benchmarking and industrial standardization. To objectively verify model accuracy, justify multimodal integration, and assess cross-deposit generalizability, future empirical trials must adhere to a four-pillar validation protocol:
(1) Reference Ground-Truth Certification: Model predictions must be benchmarked against statutory physicochemical reference methods on split sample aliquots. Specifically, bulk fixed-carbon and total ash contents across intermediate purification stages (90.0–99.9 wt.% C) should be certified via standard loss-on-ignition (LOI) gravimetric combustion (e.g., ASTM C561/GB/T 3518) and alkali-acid titration, whereas trace elemental impurity profiles (Si, Al, Fe, Ca, Mg, S) in ultrahigh-purity batches (>99.9 wt.% C) must be quantified via microwave-assisted acid digestion coupled with inductively coupled plasma optical emission or mass spectrometry (ICP-OES/MS). Furthermore, to evaluate process-induced morphological and compositional evolution, comparative experimental characterization of split graphite samples before and after purification treatment (e.g., raw flotation concentrates versus plasma- or acid-treated products) will be conducted as part of our upcoming empirical work and reported in a future study.
(2) Quantitative Evaluation Metrics: Following established regression benchmarks in machine-learning-driven mineral and coal ash characterization [86,91], predictive accuracy and error dispersion for the chemical purity estimation track across N independent test batches (with ground-truth purity ym, model-predicted purity , and sample mean ) must be evaluated using standard statistical metrics—specifically the Mean Absolute Error, , the Root Mean Square Error, , and the Coefficient of Determination, .
Concurrently, for the microstructural integrity track, pixel-level defect segmentation performance should be evaluated via the mean Intersection over Union (mIoU) and Dice Similarity Coefficient (DSC), while the consistency of SDI severity ranking against mechanical comminution energy should be verified via Spearman’s rank correlation coefficient (ρ).
(3) Multimodal Ablation Study Design: To empirically verify whether integrating SEM morphology with EDS spectra genuinely improves purity estimation over single modalities, systematic four-tier ablation experiments are required: (i) Morphology-Only Baseline (feeding only BSE-SEM images into the CNN–Transformer backbone to test purity regression from grayscale contrast alone); (ii) Spectrum-Only Baseline (relying solely on sparse EDS point-counting without morphological boundary guidance); (iii) Statistical Fusion Baseline (combining SEM and EDS via classical AB-PLS-DA pansharpening [99]); and (iv) Full SISTIFD Architecture (sequentially activating NIFE gating, TEGM spatial attention, and InfoNCE mutual information constraints). This ablation protocol directly quantifies the error reduction (ΔMAE and ΔRMSE) achieved by decoupling physical voids from solid inclusions.
(4) Multi-Batch and Cross-Deposit Generalization Testing: Currently, commercial-grade assessment in the global graphite market remains monopolized by destructive chemical standards. Advancing AI-driven nondestructive screening toward statutory industry consensus requires stratified cross-validation across diverse geological origins—spanning metamorphic flake deposits in China (e.g., Jixi and Luobei), Central Finland [3], and Africa [81]—as well as across distinct flake size fractions (+50, +80, and −100 mesh) and purification batches. Implementing inter-laboratory blind testing to demonstrate statistical equivalence (R2 ≥ 0.95 within the 90.0–99.8 wt.% C window) between multimodal predictions and chemical assays represents the definitive pathway toward next-generation automated mineralogy standards.
8. Conclusions
To meet the growing demand of strategic industries for large-flake, high-purity natural graphite, conventional destructive chemical assays and rule-based automated mineralogy platforms face clear technical bottlenecks in light-element matrices. This perspective review systematically synthesizes the physicochemical mechanisms of non-equilibrium low-temperature plasma modification—confirming bulk sp2 lattice preservation via micro-Raman and XPS evidence—and conceptualizes a dual-track automated quality evaluation framework that explicitly decouples microstructural damage assessment from chemical impurity estimation. For the microstructural integrity track, we formulate two mechanics-inspired heuristic geometric indicators, the Defect Area Ratio (DAR) and the regularized Structural Damage Index (SDI), which serve as order-preserving targets for lightweight CNN–Transformer segmentation of physical voids and cleavage microcracks. For the chemical impurity track, we account for the physical constraints and minimum detection limits of SEM–EDS (0.1–1.0 wt.%) by defining two operational regimes: semi-quantitative impurity screening for intermediate purification products (90.0–99.8 wt.% C) and localized inclusion anomaly detection for ultrahigh-purity batches (>99.9 wt.% C). Within this window, the proposed dual-stream SISTIFD architecture—incorporating Nonlinear Interactive Feature Extraction (NIFE), Transformer-Enhanced Global Modeling (TEGM), and mutual information constraints—provides a theoretical mechanism to suppress topographic charging noise and isolate solid inclusions from empty cracks. Combined with HNSW-indexed vector databases and a standardized quantitative validation protocol (MAE, RMSE, and R2 benchmarked against LOI and ICP-OES), this conceptual blueprint establishes a rigorous methodological roadmap for next-generation intelligent mineral characterization. Building upon this theoretical framework, our ongoing experimental work focuses on comparative benchmarking of natural flake graphite samples before and after purification treatments, and the resulting empirical validation datasets will be presented in a forthcoming research manuscript.
Author Contributions
Conceptualization, R.H. and S.S.T.; methodology, R.H. and H.W.; software, R.H.; validation, S.S.T., H.W. and H.I.; formal analysis, R.H. and H.W.; investigation, R.H.; resources, S.S.T. and H.I.; data curation, R.H.; writing—original draft preparation, R.H.; writing—review and editing, S.S.T., H.W. and H.I.; visualization, R.H. and H.W.; supervision, S.S.T. and H.I.; project administration, S.S.T.; funding acquisition, R.H. All authors have read and agreed to the published version of the manuscript.
Funding
This research was funded by the Joint Guiding Project of the Natural Science Foundation of Heilongjiang Province, grant number LH2024E113.
Data Availability Statement
No new data were created or analyzed in this study. Data sharing is not applicable to this article.
Acknowledgments
The authors would like to acknowledge Universiti Sains Malaysia and Heilongjiang University of Technology for institutional and administrative support.
Conflicts of Interest
The authors declare no conflicts of interest. The funders had no role in the design of the study; in the collection, analyses, or interpretation of data; in the writing of the manuscript; or in the decision to publish the results.
References
- Merchichi, A.; Mailloux-Keroack, G.-É.; Coudert, L.; Bazin, C.; Boulanger, J.-F. Graphite processing from beneficiation to final product: A review focused on purification of natural and recycled materials. Sep. Purif. Technol. 2026, 380, 135068. [Google Scholar] [CrossRef] [Scilit]
- Abdollahifar, M.; Doose, S.; Cavers, H.; Kwade, A. Graphite recycling from end-of-life lithium-ion batteries: Processes and applications. Adv. Mater. Technol. 2023, 8, 2200368. [Google Scholar] [CrossRef] [Scilit]
- Al-Ani, T.; Leinonen, S.; Ahtola, T.; Salvador, D. High-grade flake graphite deposits in metamorphic schist belt, Central Finland—Mineralogy and beneficiation of graphite for lithium-ion battery applications. Minerals 2020, 10, 680. [Google Scholar] [CrossRef] [Scilit]
- Cheng, Q.; Marchetti, B.; Chen, X.; Xu, S.; Zhou, X. Separation, purification, regeneration and utilization of graphite recovered from spent lithium-ion batteries—A review. J. Environ. Chem. Eng. 2022, 10, 107312. [Google Scholar] [CrossRef] [Scilit]
- Chen, Y.; Li, S.; Lin, S.; Chen, M.; Tang, C.; Liu, X. Promising energy-storage applications by flotation of graphite ores: A review. Chem. Eng. J. 2023, 454, 139994. [Google Scholar] [CrossRef] [Scilit]
- Cho, S.-S.; Kim, J.; Park, S.; Lee, H.; Kang, Y.; Lee, J. Facile strategy for high-efficiency purification and regeneration of graphite anodes from spent lithium-ion batteries. Chem. Eng. J. 2025, 516, 163926. [Google Scholar] [CrossRef] [Scilit]
- Barma, S.D.; Baskey, P.K.; Rao, D.; Sahu, S.N. Ultrasonic-assisted flotation for enhancing the recovery of flaky graphite from low-grade graphite ore. Ultrason. Sonochem. 2019, 56, 386–396. [Google Scholar] [CrossRef] [Scilit] [PubMed]
- Chehreh Chelgani, S.; Rudolph, M.; Kratzsch, R.; Sandmann, D.; Gutzmer, J. A review of graphite beneficiation techniques. Miner. Process. Extr. Metall. Rev. 2016, 37, 58–68. [Google Scholar] [CrossRef] [Scilit]
- Gao, J.; Bu, X.; Dong, L.; Qiu, Y.; Xie, G.; Chehreh Chelgani, S. Natural graphite froth flotation-an overview. Miner. Process. Extr. Metall. Rev. 2025, 46, 306–323. [Google Scholar] [CrossRef] [Scilit]
- Ghosh, A. Literature quest and survey on graphite beneficiation through flotation. Renew. Sustain. Energy Rev. 2024, 189, 113980. [Google Scholar] [CrossRef] [Scilit]
- Kang, W.; Li, H. Enhancement of flaky graphite cleaning by ultrasonic treatment. R. Soc. Open Sci. 2019, 6, 191160. [Google Scholar] [CrossRef] [Scilit] [PubMed]
- Al-Sairafi, F.A.; Jiang, C.; Zhong, Z.; Saleh, B. Study on purification of flake graphite by heat activation and hydrofluoric acid. Adv. Mater. Process. Technol. 2022, 8, 4564–4578. [Google Scholar] [CrossRef] [Scilit]
- Bao, C.; Yu, L.; Shen, W.; Li, X.; Ren, P.; Li, M. Purification effect of the methods used for the preparation of the ultra-high purity graphite. Diam. Relat. Mater. 2021, 120, 108704. [Google Scholar] [CrossRef] [Scilit]
- Bu, X.; Tong, Z.; Ren, X.; Bilal, M.; Ni, C. Leaching kinetics of ash impurities from aphanitic graphite by combining dual-ultrasound and hydrochloric acid–potassium hydrogen fluoride. Miner. Eng. 2024, 213, 108731. [Google Scholar] [CrossRef] [Scilit]
- Chen, T.; Zhang, Y.; Liu, X.; Wang, H.; Zhao, J.; Sun, W. Purification and regeneration of spent graphite via a short-process combining microwave irradiation and acid leaching. Chem. Eng. J. 2026, 532, 174339. [Google Scholar] [CrossRef] [Scilit]
- Dong, H.; Qiu, Y.; Liu, J.; Mai, Y.; You, D.; Sun, K. Efficient removal of impurities from natural spherical graphite for lithium-ion batteries by hot-pressure leaching. Miner. Eng. 2025, 227, 109284. [Google Scholar] [CrossRef] [Scilit]
- Feng, L.; Zou, Y.; Zhao, Y.; Wang, Z.; Liu, J.; Gong, X. Hydroxyl removal in muscovite by heating for low-fluoride purification of natural flake graphite. Energy Fuels 2024, 38, 2436–2446. [Google Scholar] [CrossRef] [Scilit]
- Gao, Y.; Zhang, Z.; Chen, S.; Shen, X.; Yu, G.; Du, C. Graphite recycling from the spent lithium-ion batteries by sulfuric acid curing–leaching combined with high-temperature calcination. ACS Sustain. Chem. Eng. 2020, 8, 9447–9455. [Google Scholar] [CrossRef] [Scilit]
- Ge, P.; Wang, H.; Zhao, J.; Xie, L.; Zhang, Q. Preparation of high purity graphite by an alkaline roasting–leaching method. Carbon 2010, 48, 2123–2124. [Google Scholar] [CrossRef] [Scilit]
- Zhou, G. Research on Fluxing Agent Alkali Fusion and Acid Leaching Technology for Graphite Fabrication. Master’s Thesis, Heilongjiang University of Science and Technology, Harbin, China, 2014. [Google Scholar]
- Guo, H.; Chao, B.; Zhao, Z.; Nan, D. Research on purification technology of ultra-large flake graphite based on alkali-acid method. Mater. Sci. Forum 2021, 1036, 104–113. [Google Scholar] [CrossRef] [Scilit]
- Krysenko, G.; Epov, D.; Sitnik, P.; Molchanov, V.; Medkov, M.A. Studying conditions for purifying natural graphite with ammonium hydrodifluoride. Theor. Found. Chem. Eng. 2021, 55, 737–741. [Google Scholar] [CrossRef] [Scilit]
- Lee, J.; Yoo, K.; Park, H. The removal of impurities from domestic graphite concentrate by H2SO4 solution and NaOH solution leaching. Resour. Recycl. 2023, 32, 38–44. [Google Scholar] [CrossRef] [Scilit]
- Li, Y.; Zhu, S.; Wang, L. Purification of natural graphite by microwave assisted acid leaching. Carbon 2013, 55, 377–378. [Google Scholar] [CrossRef] [Scilit]
- Lu, X.; Forssberg, E. Preparation of high-purity and low-sulphur graphite from Woxna fine graphite concentrate by alkali roasting. Miner. Eng. 2002, 15, 755–757. [Google Scholar] [CrossRef] [Scilit]
- Quan, Y.; Liu, Q.; Li, K.; Zhang, H.; Yuan, L. Highly efficient purification of natural coaly graphite via an electrochemical method. Sep. Purif. Technol. 2022, 281, 119931. [Google Scholar] [CrossRef] [Scilit]
- Rantala, V.; Salo, M.; Valkeapää, M.; Kärki, T.; Heiskanen, K. Comparison of thermal and chemical purification methods for graphite from spent lithium-ion batteries. Sep. Purif. Technol. 2025, 376, 133992. [Google Scholar] [CrossRef] [Scilit]
- Shen, K.; Chen, X.; Shen, W.; Huang, Z.; Liu, B.; Kang, F. Thermal and gas purification of natural graphite for nuclear applications. Carbon 2021, 173, 769–781. [Google Scholar] [CrossRef] [Scilit]
- Tan, Y.; Duchesne, M.; Doninger, A.; Meyers, M.; Barsukov, I. Ultrahigh temperature purification of graphite for the development of a continuous process. ACS Omega 2025, 10, 12–21. [Google Scholar] [CrossRef] [Scilit] [PubMed]
- Wang, H.; Feng, Q.; Tang, X.; Liu, K. Preparation of high-purity graphite from a fine microcrystalline graphite concentrate: Effect of alkali roasting pre-treatment and acid leaching process. Sep. Sci. Technol. 2016, 51, 2465–2472. [Google Scholar] [CrossRef] [Scilit]
- Dong, H.; Qiu, Y.; Mai, Y.; Liu, J.; You, D.; Sun, K. Quantifying the impurity distribution in spherical graphite: The limitation of flotation for graphite purification explained. Minerals 2024, 14, 1187. [Google Scholar] [CrossRef] [Scilit]
- Zhang, X.; Sun, H.; Peng, T.; Zeng, L.; Liu, B. Purification mechanism of microcrystalline graphite and dissolution of non-carbon impurity during alkali autoclave-acid leaching. Phys. Chem. Miner. 2024, 51, 25. [Google Scholar] [CrossRef] [Scilit]
- Li, J.; Zhao, J.; Wang, Z.; Liu, H.; Wen, Q.; Yin, J. Purification of natural flake graphite with acid leaching method using a two-step method of introducing additives. J. Min. Environ. 2025, 16, 371–385. [Google Scholar] [CrossRef]
- Yuan, Z. Research of Acid Method Purification Experiment of Thin Crystal Graphite in Yihuang. Master’s Thesis, Jiangxi University of Science and Technology, Ganzhou, China, 2007. [Google Scholar]
- Zhang, Y.; Chen, Z.; Xie, K.; Chen, X.; Hu, Y.; Ma, W. Purification of waste graphite from crucibles used in photovoltaic crystallization by an alkali-acid method. Metals 2023, 13, 1180. [Google Scholar] [CrossRef] [Scilit]
- Sybir, A.; Hubynskyi, S.; Fedorov, S.; Sukhyy, K.M.; Hubynskyi, M.; Vvedenska, T. Peculiarities of high-temperature refining of carbon materials. Vopr. Khim. Khim. Tekhnol. 2023, 151, 177–186. [Google Scholar] [CrossRef] [Scilit]
- Peng, S. Investigation of purification technology for aphanitic graphite by ammonium fluoride and hydrochloric acid. Mater. Rev. 2013, 27, 112–115. [Google Scholar]
- Ri, H.; Jin, H.; Han, K.; Ri, S.; Jon, S.; Choe, U. Effective purification of graphite via low pulp density flotation-low temperature alkali roasting-acid leaching route: From laboratory-scale to pilot-scale. Miner. Eng. 2022, 188, 107852. [Google Scholar] [CrossRef] [Scilit]
- Quéméré, S.; Lemire, C.; Charbonneau, C.; Paquet, E.; Gariépy, V.; Magnan, J.-F. Application of chlorination technology for the conversion of natural flake graphite into coated spherical purified graphite for Li-ion batteries. Carbon Trends 2026, 23, 100621. [Google Scholar] [CrossRef] [Scilit]
- Naranpanawa, H.M.H.D.K.; Amaraweera, T.H.N.G.; Balasooriya, N.W.B.; Attanayake, A.N.B.; Wijayasinghe, H.W.M.A.C. Development of vein graphite by optimizing the NaOH concentration in alkali roasting-acid leaching process for the anode application in rechargeable Li-ion batteries. Ionics 2023, 29, 129–144. [Google Scholar] [CrossRef] [Scilit]
- Sandmann, D.; Haser, S.; Gutzmer, J. Characterisation of graphite by automated mineral liberation analysis. Miner. Process. Extr. Metall. 2014, 123, 184–189. [Google Scholar] [CrossRef] [Scilit]
- Miller, P.; Zuiderwyk, M.; Reid, A. SEM image analysis in the determination of modal assays, mineral associations and mineral liberation. In Proceedings of the XVIII International Mineral Processing Congress; Australasian Institute of Mining and Metallurgy: Melbourne, Australia, 1983; pp. 77–83. [Google Scholar]
- Fandrich, R.; Gu, Y.; Burrows, D.; Moeller, K. Modern SEM based mineral liberation analysis. Int. J. Miner. Process. 2007, 84, 310–320. [Google Scholar] [CrossRef] [Scilit]
- Gu, Y. Automated scanning electron microscope based mineral liberation analysis: An introduction to JKMRC/FEI Mineral Liberation Analyser. J. Miner. Mater. Charact. Eng. 2003, 2, 33–41. [Google Scholar] [CrossRef]
- De Castro, B.; Benzaazoua, M.; Chopard, A.; Plante, B. Automated mineralogical characterization using optical microscopy: Review and recommendations. Miner. Eng. 2022, 189, 107896. [Google Scholar] [CrossRef] [Scilit]
- Acosta, I.C.C.; Khodadadzadeh, M.; Tusa, L.; Ghamisi, P.; Gloaguen, R. A machine learning framework for drill-core mineral mapping using hyperspectral and high-resolution mineralogical data fusion. IEEE J. Sel. Top. Appl. Earth Obs. Remote Sens. 2019, 12, 4829–4842. [Google Scholar] [CrossRef] [Scilit]
- Ali, A.; Zhang, N.; Santos, R.M. Mineral characterization using scanning electron microscopy (SEM): A review of the fundamentals, advancements, and research directions. Appl. Sci. 2023, 13, 12600. [Google Scholar] [CrossRef] [Scilit]
- Asadi, P.; Beckingham, L. Machine learning for mineral segmentation and accessibility quantification in scanning electron microscopy images. In Proceedings of the Thirty-Second Annual Goldschmidt Conference, Honolulu, HI, USA, 10–15 July 2022. [Google Scholar] [CrossRef] [Scilit]
- Ather, M.A.; Khan, M.U.; Ahmad, S.; Al-Dulaijan, S.U.; Maslehuddin, M. A hybrid deep boosting framework with adaptive label stabilization for SEM-based porosity estimation in fly-ash cement mortar. Front. Artif. Intell. 2026, 9, 1766671. [Google Scholar] [CrossRef] [Scilit] [PubMed]
- Bulgarevich, D.; Tsukamoto, S.; Kasuya, T.; Demura, M.; Watanabe, M. Pattern recognition with machine learning on optical microscopy images of typical metallurgical microstructures. Sci. Rep. 2018, 8, 2078. [Google Scholar] [CrossRef] [Scilit] [PubMed]
- Chen, Z.; Liu, X.; Yang, J.; Little, E.; Zhou, Y. Deep learning-based method for SEM image segmentation in mineral characterization, an example from Duvernay Shale samples in Western Canada Sedimentary Basin. Comput. Geosci. 2020, 138, 104450. [Google Scholar] [CrossRef] [Scilit]
- Chopard, A.; Marion, P.; Royer, J.; Taza, R.; Bouzahzah, H.; Benzaazoua, M. Automated sulfides quantification by multispectral optical microscopy. Miner. Eng. 2019, 131, 38–50. [Google Scholar] [CrossRef] [Scilit]
- DeCost, B. Microstructure Representations: Applied Computer Vision Methods for Microstructure Characterization. Ph.D. Dissertation, Carnegie Mellon University, Pittsburgh, PA, USA, 2016. [Google Scholar] [CrossRef]
- Filippo, M.P.; da Fonseca Martins Gomes, O.; da Costa, G.A.; Mota, G. Deep learning semantic segmentation of opaque and non-opaque minerals from epoxy resin in reflected light microscopy images. Miner. Eng. 2021, 170, 107007. [Google Scholar] [CrossRef] [Scilit]
- Fu, Y.; Aldrich, C. Quantitative ore texture analysis with convolutional neural networks. IFAC-PapersOnLine 2019, 52, 99–104. [Google Scholar] [CrossRef] [Scilit]
- Holm, E.; Cohn, R.; Gao, N.; Kitahara, A.R.; Bascomb, T.P.; Kuchibhatla, S. Overview: Computer vision and machine learning for microstructural characterization and analysis. Metall. Mater. Trans. A 2020, 51, 5985–5999. [Google Scholar] [CrossRef] [Scilit]
- Huang, X.; Shi, H.; Liu, Y.; Lu, H. Image classification algorithm for graphite ore carbon grade based on multiscale feature fusion. In Computer Supported Cooperative Work and Social Computing; LNICST; Springer: Cham, Switzerland, 2024; Volume 544, pp. 166–177. [Google Scholar] [CrossRef] [Scilit]
- Huang, X.; Pan, R.; Wang, J. A graphite ore grade recognition method based on improved Inception-ResNet-v2 model. IEEE Access 2025, 13, 48007–48018. [Google Scholar] [CrossRef] [Scilit]
- Juránek, R.; Výravský, J.; Kolář, M.; Motl, D.; Zemčík, P. Graph-based deep learning segmentation of EDS spectral images for automated mineral phase analysis. Comput. Geosci. 2022, 165, 105109. [Google Scholar] [CrossRef] [Scilit]
- Koh, E.J.; Amini, E.; McLachlan, G.; Beaton, N. Utilising convolutional neural networks to perform fast automated modal mineralogy analysis for thin-section optical microscopy. Miner. Eng. 2021, 173, 107230. [Google Scholar] [CrossRef] [Scilit]
- Hauwiller, M.R.; Jones, N.; Zhang, L.; Chen, J.; Evans, P.; Kryder, M. High-throughput SEM imaging of nanoscale metal grains for heat assisted magnetic recording. AIP Adv. 2026, 16, 025103. [Google Scholar] [CrossRef] [Scilit]
- Kadela, K.; Grzybek, G.; Kotarba, A.; Stelmachowski, P. Enhancing graphene nanoplatelet reactivity through low-temperature plasma modification. ACS Appl. Mater. Interfaces 2024, 16, 19771–19779. [Google Scholar] [CrossRef] [Scilit] [PubMed]
- Cvelbar, U.; Markoli, B.; Poberaj, I.; Zalar, A.; Kosec, L.; Spaić, S. Formation of functional groups on graphite during oxygen plasma treatment. Appl. Surf. Sci. 2006, 253, 1861–1865. [Google Scholar] [CrossRef] [Scilit]
- Anderson, N.A.; Miller, M.; Wang, Y.; Bilén, S. High temperature oxidation of graphite under non-thermal oxygen plasma. In Proceedings of the AIAA SCITECH 2022 Forum, San Diego, CA, USA, 3–7 January 2022; American Institute of Aeronautics and Astronautics: Reston, VA, USA, 2022. [Google Scholar] [CrossRef] [Scilit]
- Anderson, N.A.; Miller, M.; Wang, Y.; Bilén, S. Flow reactor experiments of high-temperature graphite oxidation and nitridation. High Temp. Corros. Mater. 2024, 101, 185–201. [Google Scholar] [CrossRef] [Scilit]
- Duan, S.; Zhao, C.; Jing, X.; Liu, J.; Song, D.; Hu, S. Removal of U(VI) from aqueous solution by amino functionalized flake graphite prepared by plasma treatment. ACS Sustain. Chem. Eng. 2017, 5, 4073–4085. [Google Scholar] [CrossRef] [Scilit]
- Li, J.; Song, C.; Lu, D.; Huang, R.; Zhang, H. Study on plasma spraying graphite purification device. IOP Conf. Ser. Earth Environ. Sci. 2021, 772, 012070. [Google Scholar] [CrossRef] [Scilit]
- Mizuno, K.; Yokogawa, K.; Yasuda, N.; Hozumi, K. Low-temperature plasma ashing of high-carbon materials. Bunseki Kagaku 1974, 23, 1010–1015. [Google Scholar] [CrossRef] [Scilit][Green Version]
- Tamargo-Martínez, K.; Villar-Rodil, S.; Martínez-Alonso, A.; Tascón, J.M.D. Surface modification of high-surface area graphites by oxygen plasma treatments. Appl. Surf. Sci. 2022, 575, 151675. [Google Scholar] [CrossRef] [Scilit]
- Wang, L.; Huang, R.; Yang, H. Design of Graphite Purification Device Based on DBD Plasma Technology. In Proceedings of the 2022 Global Conference on Robotics, Artificial Intelligence and Information Technology (GCRAIT), Chengdu, China, 19–21 August 2022; IEEE: Piscataway, NJ, USA, 2022; pp. 157–161. [Google Scholar] [CrossRef] [Scilit]
- Wang, Y.; Zhang, Y.; Li, J.; Song, C. Prediction and modelling of plasma jet zone temperature for DC arc graphite purification. J. Phys. Conf. Ser. 2023, 2510, 012013. [Google Scholar] [CrossRef] [Scilit]
- Yue, C.; Jin, S.; Li, Y.; Dong, P.; Wang, X. Study on purification of flaky graphite by argon arc plasma torch. High Power Laser Part. Beams 2021, 33, 065021. [Google Scholar] [CrossRef]
- Zhou, L.; Liu, H.; Zhuang, X.; Liu, D. Study on Brittle Graphite Surface Roughness Detection Based on Gray-Level Co-Occurrence Matrix. In Proceedings of the 2018 3rd International Conference on Mechanical, Control and Computer Engineering (ICMCCE), Huhhot, China, 14–16 September 2018; IEEE: Piscataway, NJ, USA, 2018; pp. 62–66. [Google Scholar] [CrossRef] [Scilit]
- Krebbers, L.T.; Lottermoser, B.G.; Liu, X. Computed tomography of flake graphite ore: Data acquisition and image processing. Minerals 2023, 13, 247. [Google Scholar] [CrossRef] [Scilit]
- Wang, N.; Zhang, X.; Yan, X.; Peng, T.; Sun, H.; Dong, L. Visual insights into surface destruction differences of the large flake graphite ground with gangue minerals. Colloids Surf. A Physicochem. Eng. Asp. 2024, 701, 134871. [Google Scholar] [CrossRef] [Scilit]
- Weiss, M.; Meisen, T. Reviewing material-sensitive computed tomography: From handcrafted algorithms to modern deep learning. NDT 2024, 2, 286–310. [Google Scholar] [CrossRef] [Scilit]
- Thiele, S.T.; Lorenz, S.; Kirsch, M.; Acosta, I.C.C.; Tusa, L.; Gloaguen, R. Predicting mineralogy with hyperspectral data: A benchmark dataset and machine learning framework to enable hyperspectral geometallurgy. Minerals 2026, 16, 674. [Google Scholar] [CrossRef] [Scilit]
- Tsai, C.; Grealy, J. Microscopy and microanalysis of graphite in graphite/talc mixture. Microsc. Microanal. 2024, 30, 337. [Google Scholar] [CrossRef] [Scilit]
- Wang, B.; Zhou, L.; He, Y.; Wan, X. Optimization of high-temperature graphite purification process by coupling heat-mass transfer simulation and machine learning methods. Int. Commun. Heat Mass Transf. 2026, 176, 111334. [Google Scholar] [CrossRef] [Scilit]
- Niu, Y.; Cheng, S. Exploration of genetic characteristics of flake graphite mineral processing and prediction of process indexes. Physicochem. Probl. Miner. Process. 2025, 61, 205269. [Google Scholar] [CrossRef] [Scilit]
- Sun, K.; Qiu, Y.; Zhang, L. Preserving flake size in an African flake graphite ore beneficiation using a modified grinding and pre-screening process. Minerals 2017, 7, 115. [Google Scholar] [CrossRef] [Scilit]
- Li, C.; Wang, D. Application of machine learning techniques in mineral classification for scanning electron microscopy-energy dispersive X-ray spectroscopy (SEM-EDS) images. J. Pet. Sci. Eng. 2021, 200, 108178. [Google Scholar] [CrossRef] [Scilit]
- Inglis, C.E. Stresses in a plate due to the presence of cracks and sharp corners. Trans. Inst. Nav. Archit. 1913, 55, 219–241. [Google Scholar]
- Blakslee, O.L.; Proctor, D.G.; Seldin, E.J.; Spence, G.B.; Weng, T. Elastic constants of compression-annealed pyrolytic graphite. J. Appl. Phys. 1970, 41, 3373–3382. [Google Scholar] [CrossRef] [Scilit]
- Lekhnitskii, S.G. Anisotropic Plates; Gordon and Breach Science Publishers: New York, NY, USA, 1968; pp. 157–185. [Google Scholar]
- Choudhary, K.; DeCost, B.; Chen, C.; Jain, A.; Tavazza, F.; Cohn, R. Recent advances and applications of deep learning methods in materials science. npj Comput. Mater. 2022, 8, 59. [Google Scholar] [CrossRef] [Scilit]
- Liu, Y.; Wang, X.; Zhang, Z.; Deng, F. Deep learning in image segmentation for mineral production: A review. Comput. Geosci. 2023, 180, 105455. [Google Scholar] [CrossRef] [Scilit]
- Chen, J.; Lu, Y.; Yu, Q.; Luo, X.; Adeli, E.; Wang, Y.; Lu, L.; Yuille, A.L.; Zhou, Y. TransUNet: Transformers Make Strong Encoders for Medical Image Segmentation. arXiv 2021, arXiv:2102.04306. [Google Scholar] [CrossRef] [Scilit]
- Xie, E.; Wang, W.; Yu, Z.; Anandkumar, A.; Alvarez, J.M.; Luo, P. SegFormer: Simple and efficient design for semantic segmentation with transformers. In Advances in Neural Information Processing Systems; Ranzato, M., Beygelzimer, A., Dauphin, Y., Liang, P.S., Vaughan, J.W., Eds.; Curran Associates, Inc.: Red Hook, NY, USA, 2021; Volume 34, pp. 12077–12090. [Google Scholar]
- Shi, R.; Liu, R.; Zhou, Z.; Zhou, X. SemiWaferNet: Efficient semi-supervised hybrid CNN–Transformer models for wafer defect classification and segmentation. Electronics 2026, 15, 1437. [Google Scholar] [CrossRef] [Scilit]
- Zhang, K.; Chen, P.; Liu, J.; Yang, Z.; Zhou, Q.; Li, M. A CNN-based regression framework for estimating coal ash content on microscopic images. Measurement 2022, 189, 110589. [Google Scholar] [CrossRef] [Scilit]
- Zhang, Y.; Wu, X.; You, J. A benchmark dataset and baseline methods for rock microstructure interpretation in SEM images. Sci. Data 2025, 12, 5947. [Google Scholar] [CrossRef] [Scilit] [PubMed]
- Qiu, Z.; Huang, X.; Sun, Z.; Li, S.; Wang, J. GS-YOLO-Seg: A lightweight instance segmentation method for low-grade graphite ore sorting based on improved YOLO11-Seg. Sustainability 2025, 17, 5663. [Google Scholar] [CrossRef] [Scilit]
- Qiu, Z.; Huang, X.; Li, S.; Wang, J. Stellar-YOLO: A graphite ore grade detection method based on improved YOLO11. Symmetry 2025, 17, 966. [Google Scholar] [CrossRef] [Scilit]
- Shu, W.; Wang, J.; Huang, X. Research on graphite ore grade classification based on the integration of multi-level features from ResNet and transformer. In Proceedings of the SPIE 13403, International Conference on Advanced Imaging and Information Processing, Xi’an, China, 26–28 July 2024; SPIE: Bellingham, WA, USA, 2024; Volume 13403, pp. 107–113. [Google Scholar] [CrossRef] [Scilit]
- Siddegowda, D.Y. Gray-cast iron classification based on graphite flakes using image morphology and neural networks. Int. J. Eng. Res. Technol. 2016, 5, 122–126. [Google Scholar]
- Ma, J.; Chen, J.; Ng, M.; Huang, R.; Li, Y.; Li, C.; Yang, X.; Martel, A.L. Loss odyssey in medical image segmentation. Med. Image Anal. 2021, 71, 102035. [Google Scholar] [CrossRef] [Scilit] [PubMed]
- Duma, Z.-S.; Sihvonen, T.; Havukainen, J.; Reinikainen, V.; Reinikainen, S.-P. Optimizing energy dispersive X-ray spectroscopy (EDS) image fusion to scanning electron microscopy (SEM) images. Micron 2022, 163, 103361. [Google Scholar] [CrossRef] [Scilit] [PubMed]
- Sihvonen, T.; Duma, Z.-S.; Reinikainen, S.-P. AB-PLS-DA: Pansharpening tailored for scanning electron microscopy and energy-dispersive X-ray spectrometry multimodal fusion. Micron 2024, 177, 103578. [Google Scholar] [CrossRef] [Scilit] [PubMed]
- Repka, S.; Reich, B.; Zolotarev, F.; Eerola, T.; Zemčík, P. Mineral segmentation using electron microscope images and spectral sampling through multimodal graph neural networks. Pattern Recognit. Lett. 2025, 193, 79–85. [Google Scholar] [CrossRef] [Scilit]
- Li, J.; Zhang, L.; Wang, Y.; Li, F.; Li, D.; Han, Y. Deep fusion feature extraction and classification of pellet phase. IEEE Access 2020, 8, 75428–75436. [Google Scholar] [CrossRef] [Scilit]
- Misra, S.; Wu, Y. Machine learning assisted segmentation of scanning electron microscopy images of organic-rich shales with feature extraction and feature ranking. In Machine Learning for Subsurface Characterization; Gulf Professional Publishing: Cambridge, MA, USA, 2020; pp. 289–314. [Google Scholar] [CrossRef] [Scilit]
- Goldstein, J.I.; Newbury, D.E.; Michael, J.R.; Ritchie, N.W.M.; Scott, J.H.J.; Joy, D.C. Scanning Electron Microscopy and X-Ray Microanalysis, 4th ed.; Springer: New York, NY, USA, 2018; pp. 29–63, 209–264. [Google Scholar] [CrossRef] [Scilit]
- Zhang, H.; Xu, H.; Tian, X.; Jiang, J.; Ma, J. Image fusion meets deep learning: A survey and perspective. Inf. Fusion 2021, 76, 323–336. [Google Scholar] [CrossRef] [Scilit]
- Peng, P.; Luo, Y. Multimodal medical image fusion using a progressive parallel strategy based on deep learning. Electronics 2025, 14, 2266. [Google Scholar] [CrossRef] [Scilit]
- Liang, C.; Liu, Z.; Wang, S.; Chen, X.; Zhang, Y.; Zhao, Q. Multimodal data fusion in neuroscience: Promises, challenges, and future directions. IEEE Signal Process. Mag. 2025, 42, 8–21. [Google Scholar] [CrossRef] [Scilit] [PubMed]
- Papa, J.; Nakamura, R.; de Albuquerque, V.; Falcão, A.; Tavares, J. Computer techniques towards the automatic characterization of graphite particles in metallographic images of industrial materials. Expert Syst. Appl. 2013, 40, 590–597. [Google Scholar] [CrossRef] [Scilit]
- Xiang, J.; Shi, H.; Huang, X.; Chen, D. Improving graphite ore grade identification with a novel FRCNN-PGR method based on deep learning. Appl. Sci. 2023, 13, 5179. [Google Scholar] [CrossRef] [Scilit]
- Wu, Y.; Misra, S.; Sondergeld, C.; Curtis, M.; Jernigen, J. Machine learning for locating organic matter and pores in scanning electron microscopy images of organic-rich shales. Fuel 2019, 253, 662–676. [Google Scholar] [CrossRef] [Scilit]
- Xie, W.; Dong, Y.; Zhao, Y.; Liu, X.; Zhang, T.; Wang, F. Fixed carbon content and reaction mechanism of natural microcrystalline graphite purified by hydrochloric acid and sodium fluoride. Int. J. Miner. Process. 2016, 155, 45–54. [Google Scholar] [CrossRef] [Scilit]
- Yang, S.; Zhang, S.; Dong, W.; Xia, Y. Purification mechanism of microcrystalline graphite and lithium storage properties of purified graphite. Mater. Res. Express 2022, 9, 025505. [Google Scholar] [CrossRef] [Scilit]
- Malkov, Y.A.; Yashunin, D.A. Efficient and robust approximate nearest neighbor search using Hierarchical Navigable Small World graphs. IEEE Trans. Pattern Anal. Mach. Intell. 2020, 42, 824–836. [Google Scholar] [CrossRef] [Scilit] [PubMed]
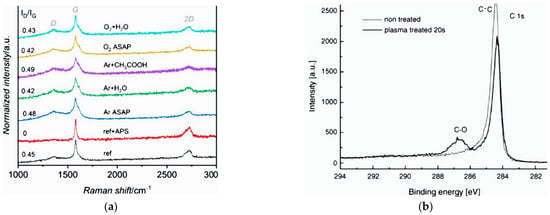
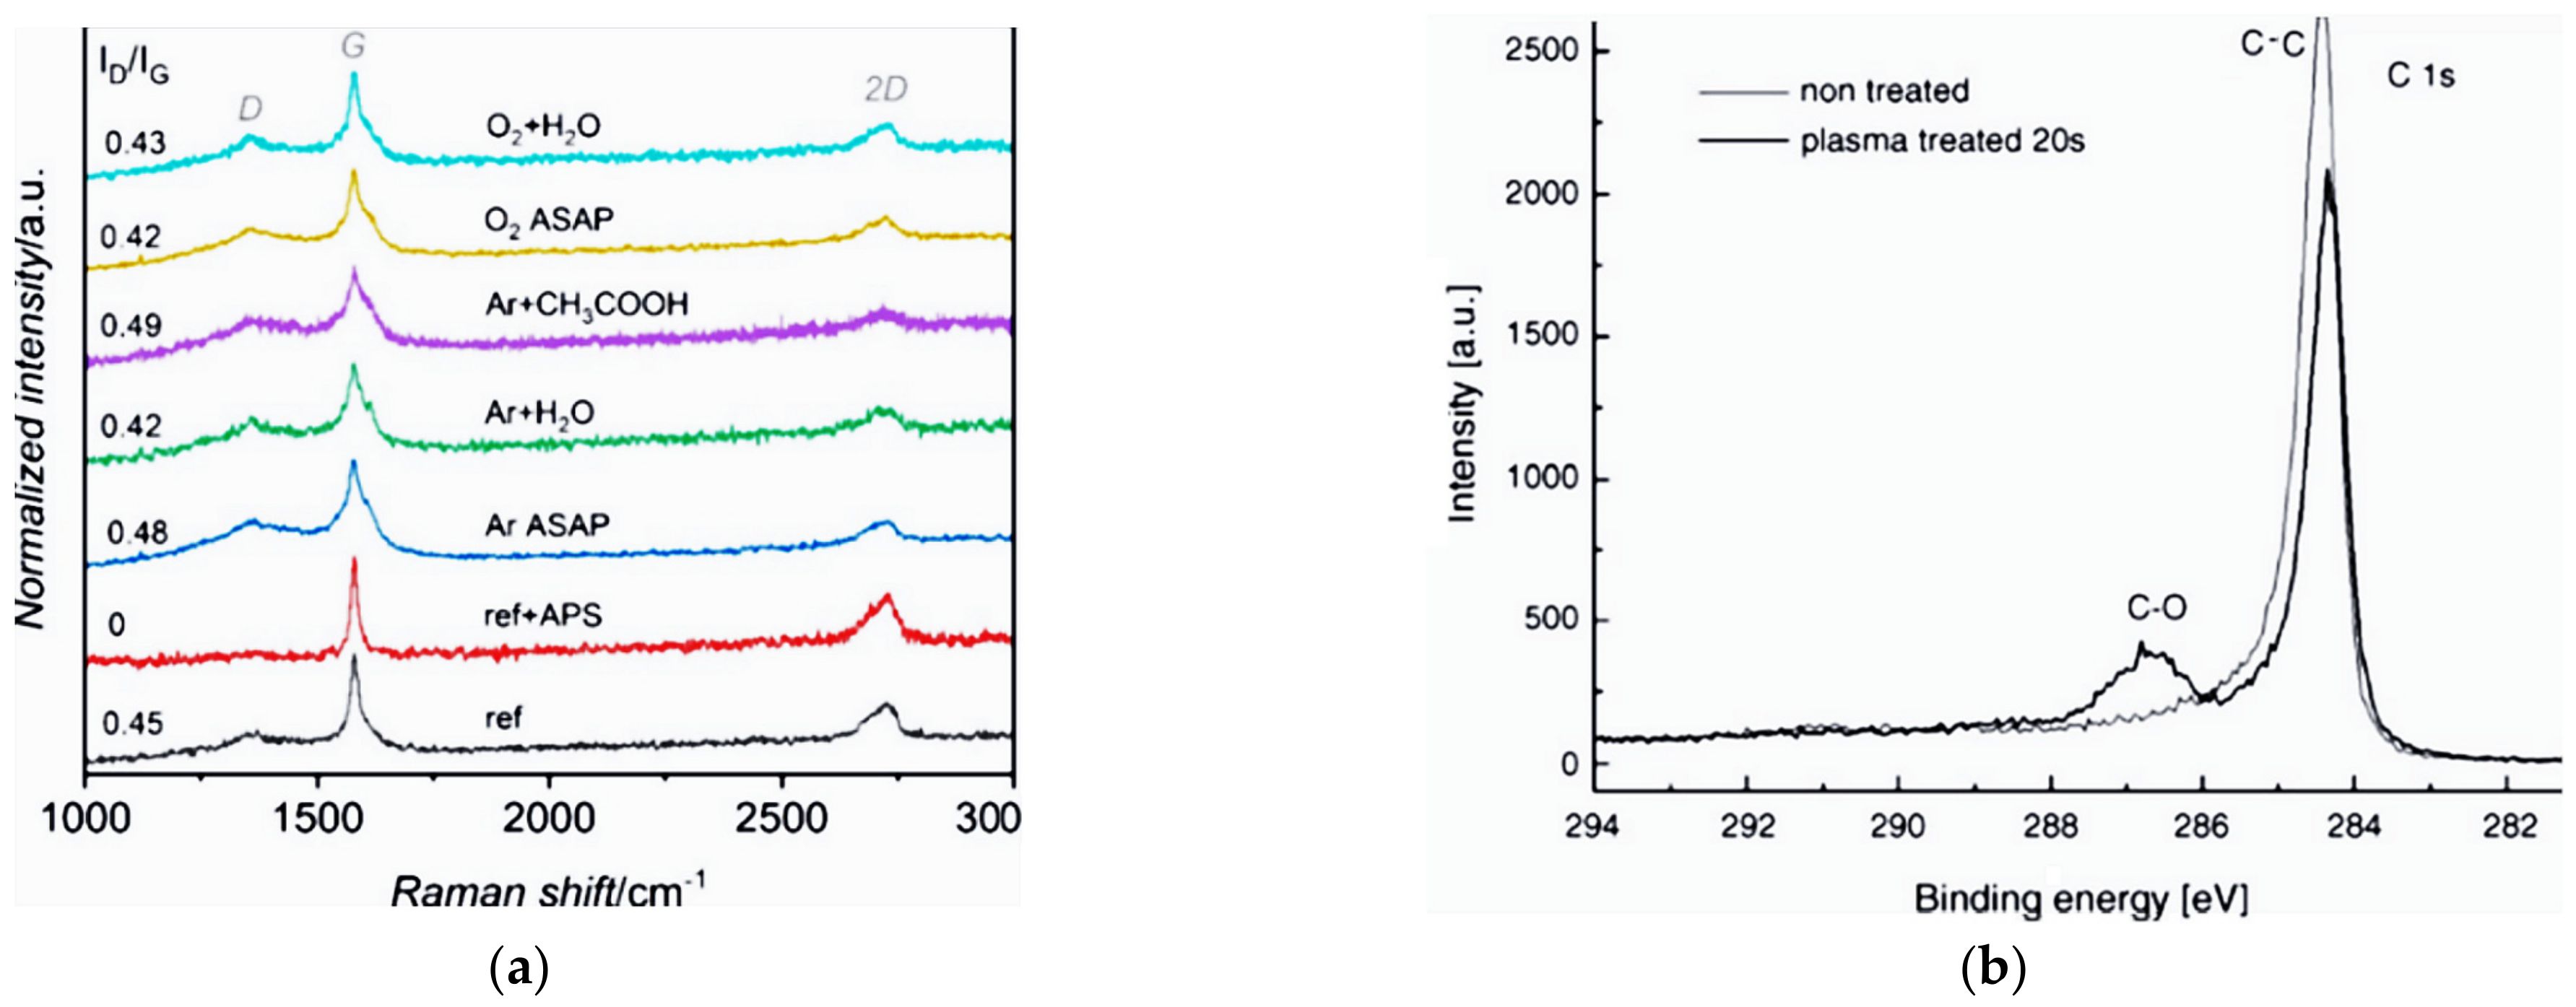
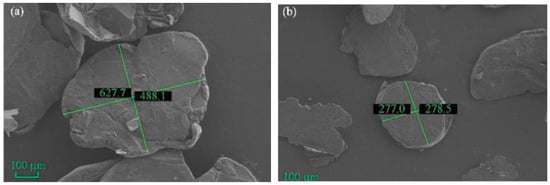
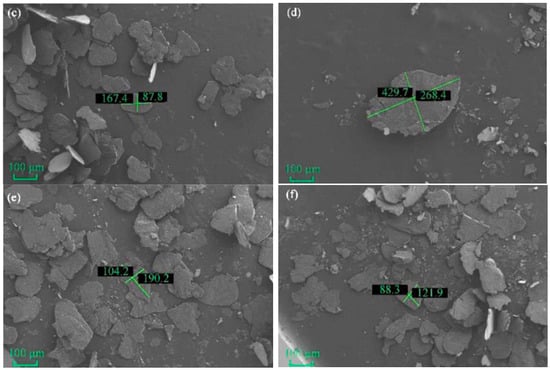
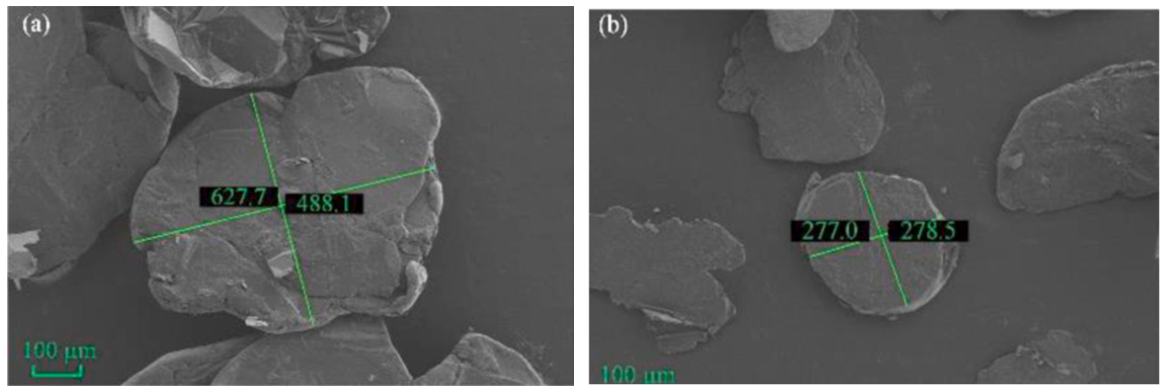
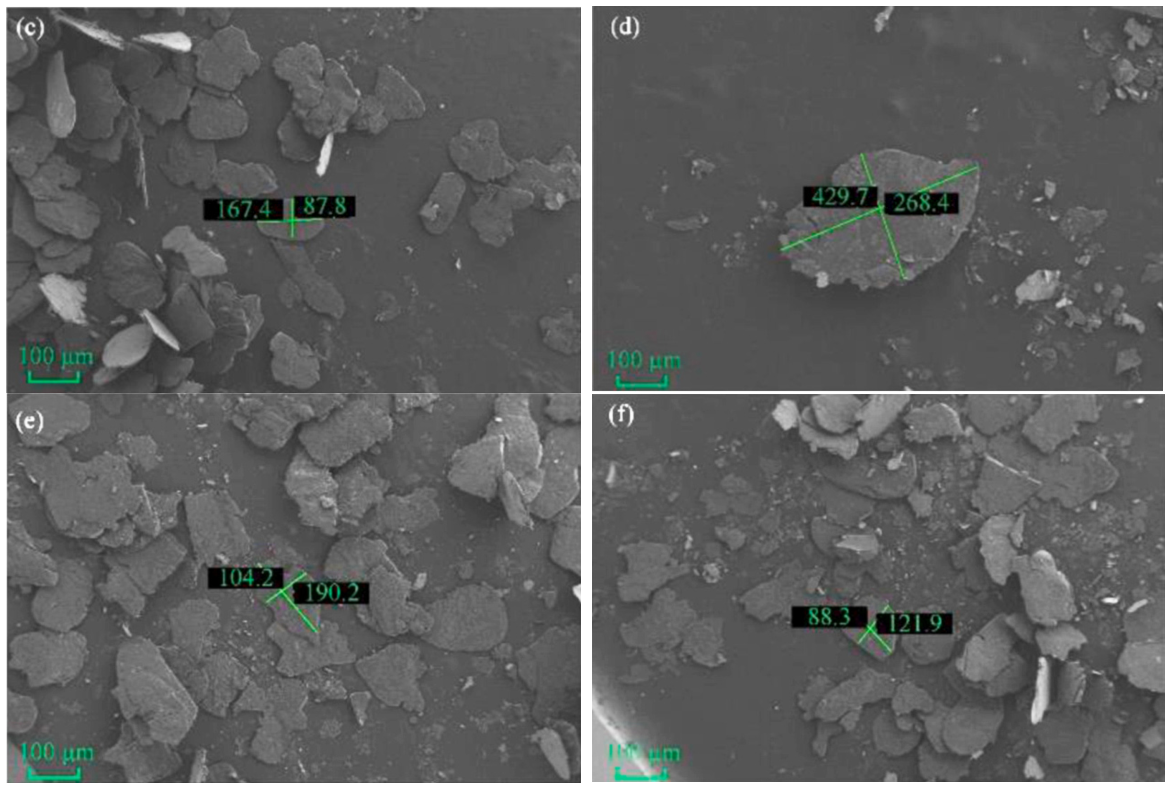
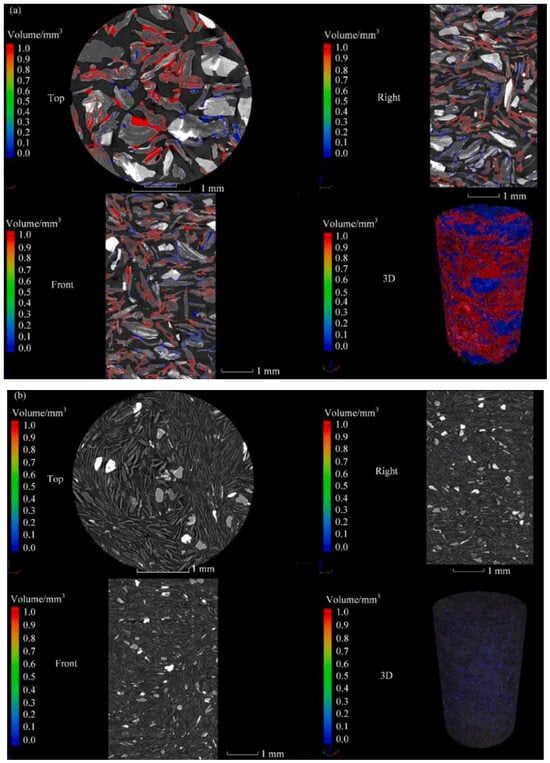
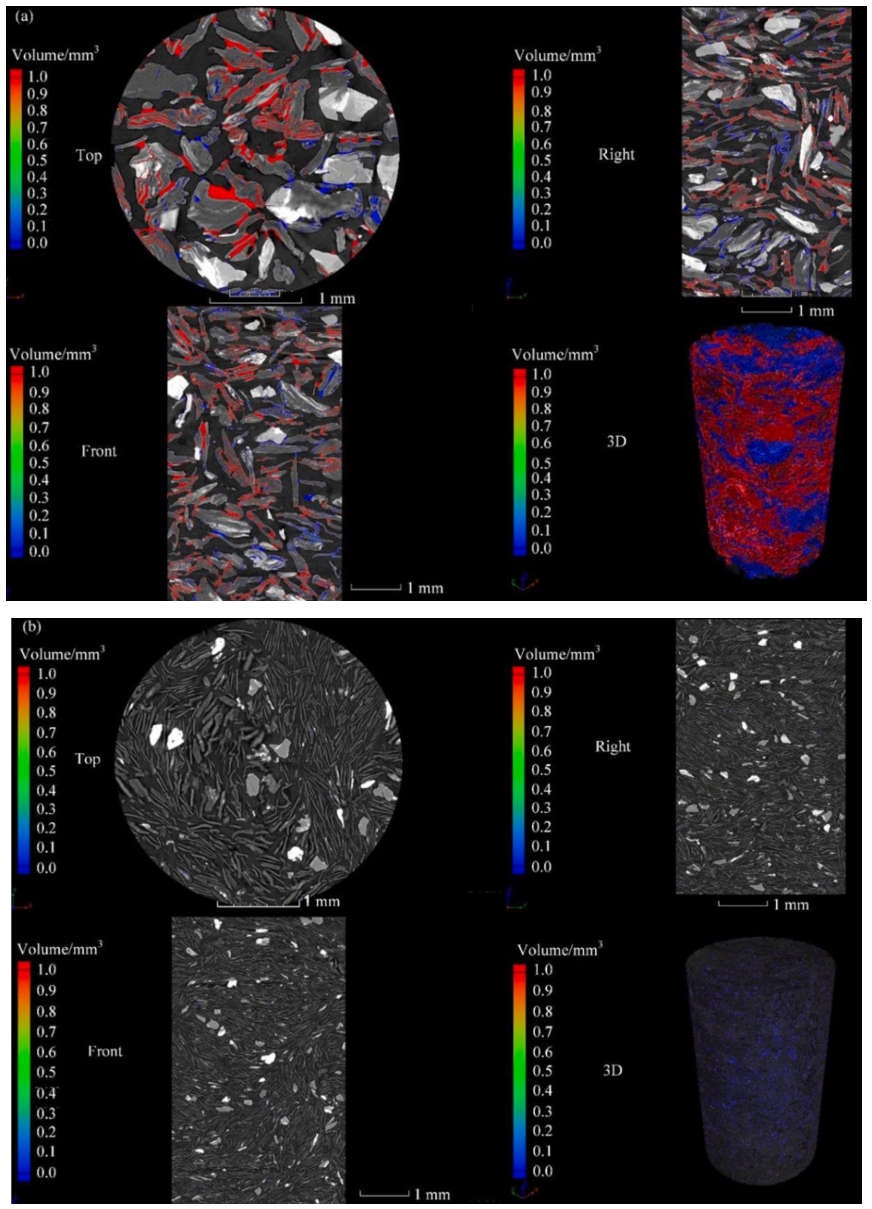
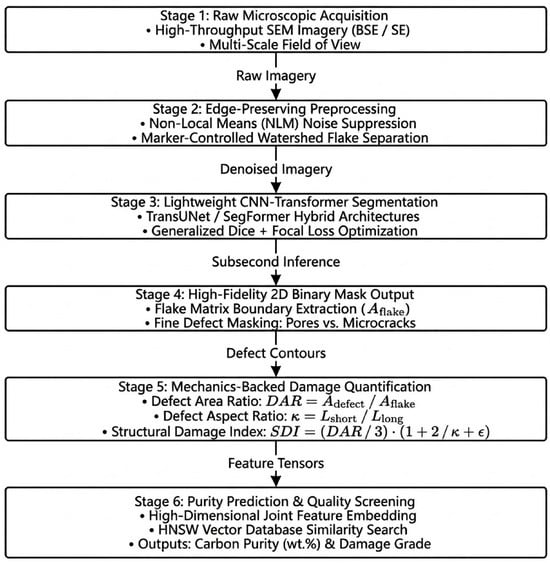
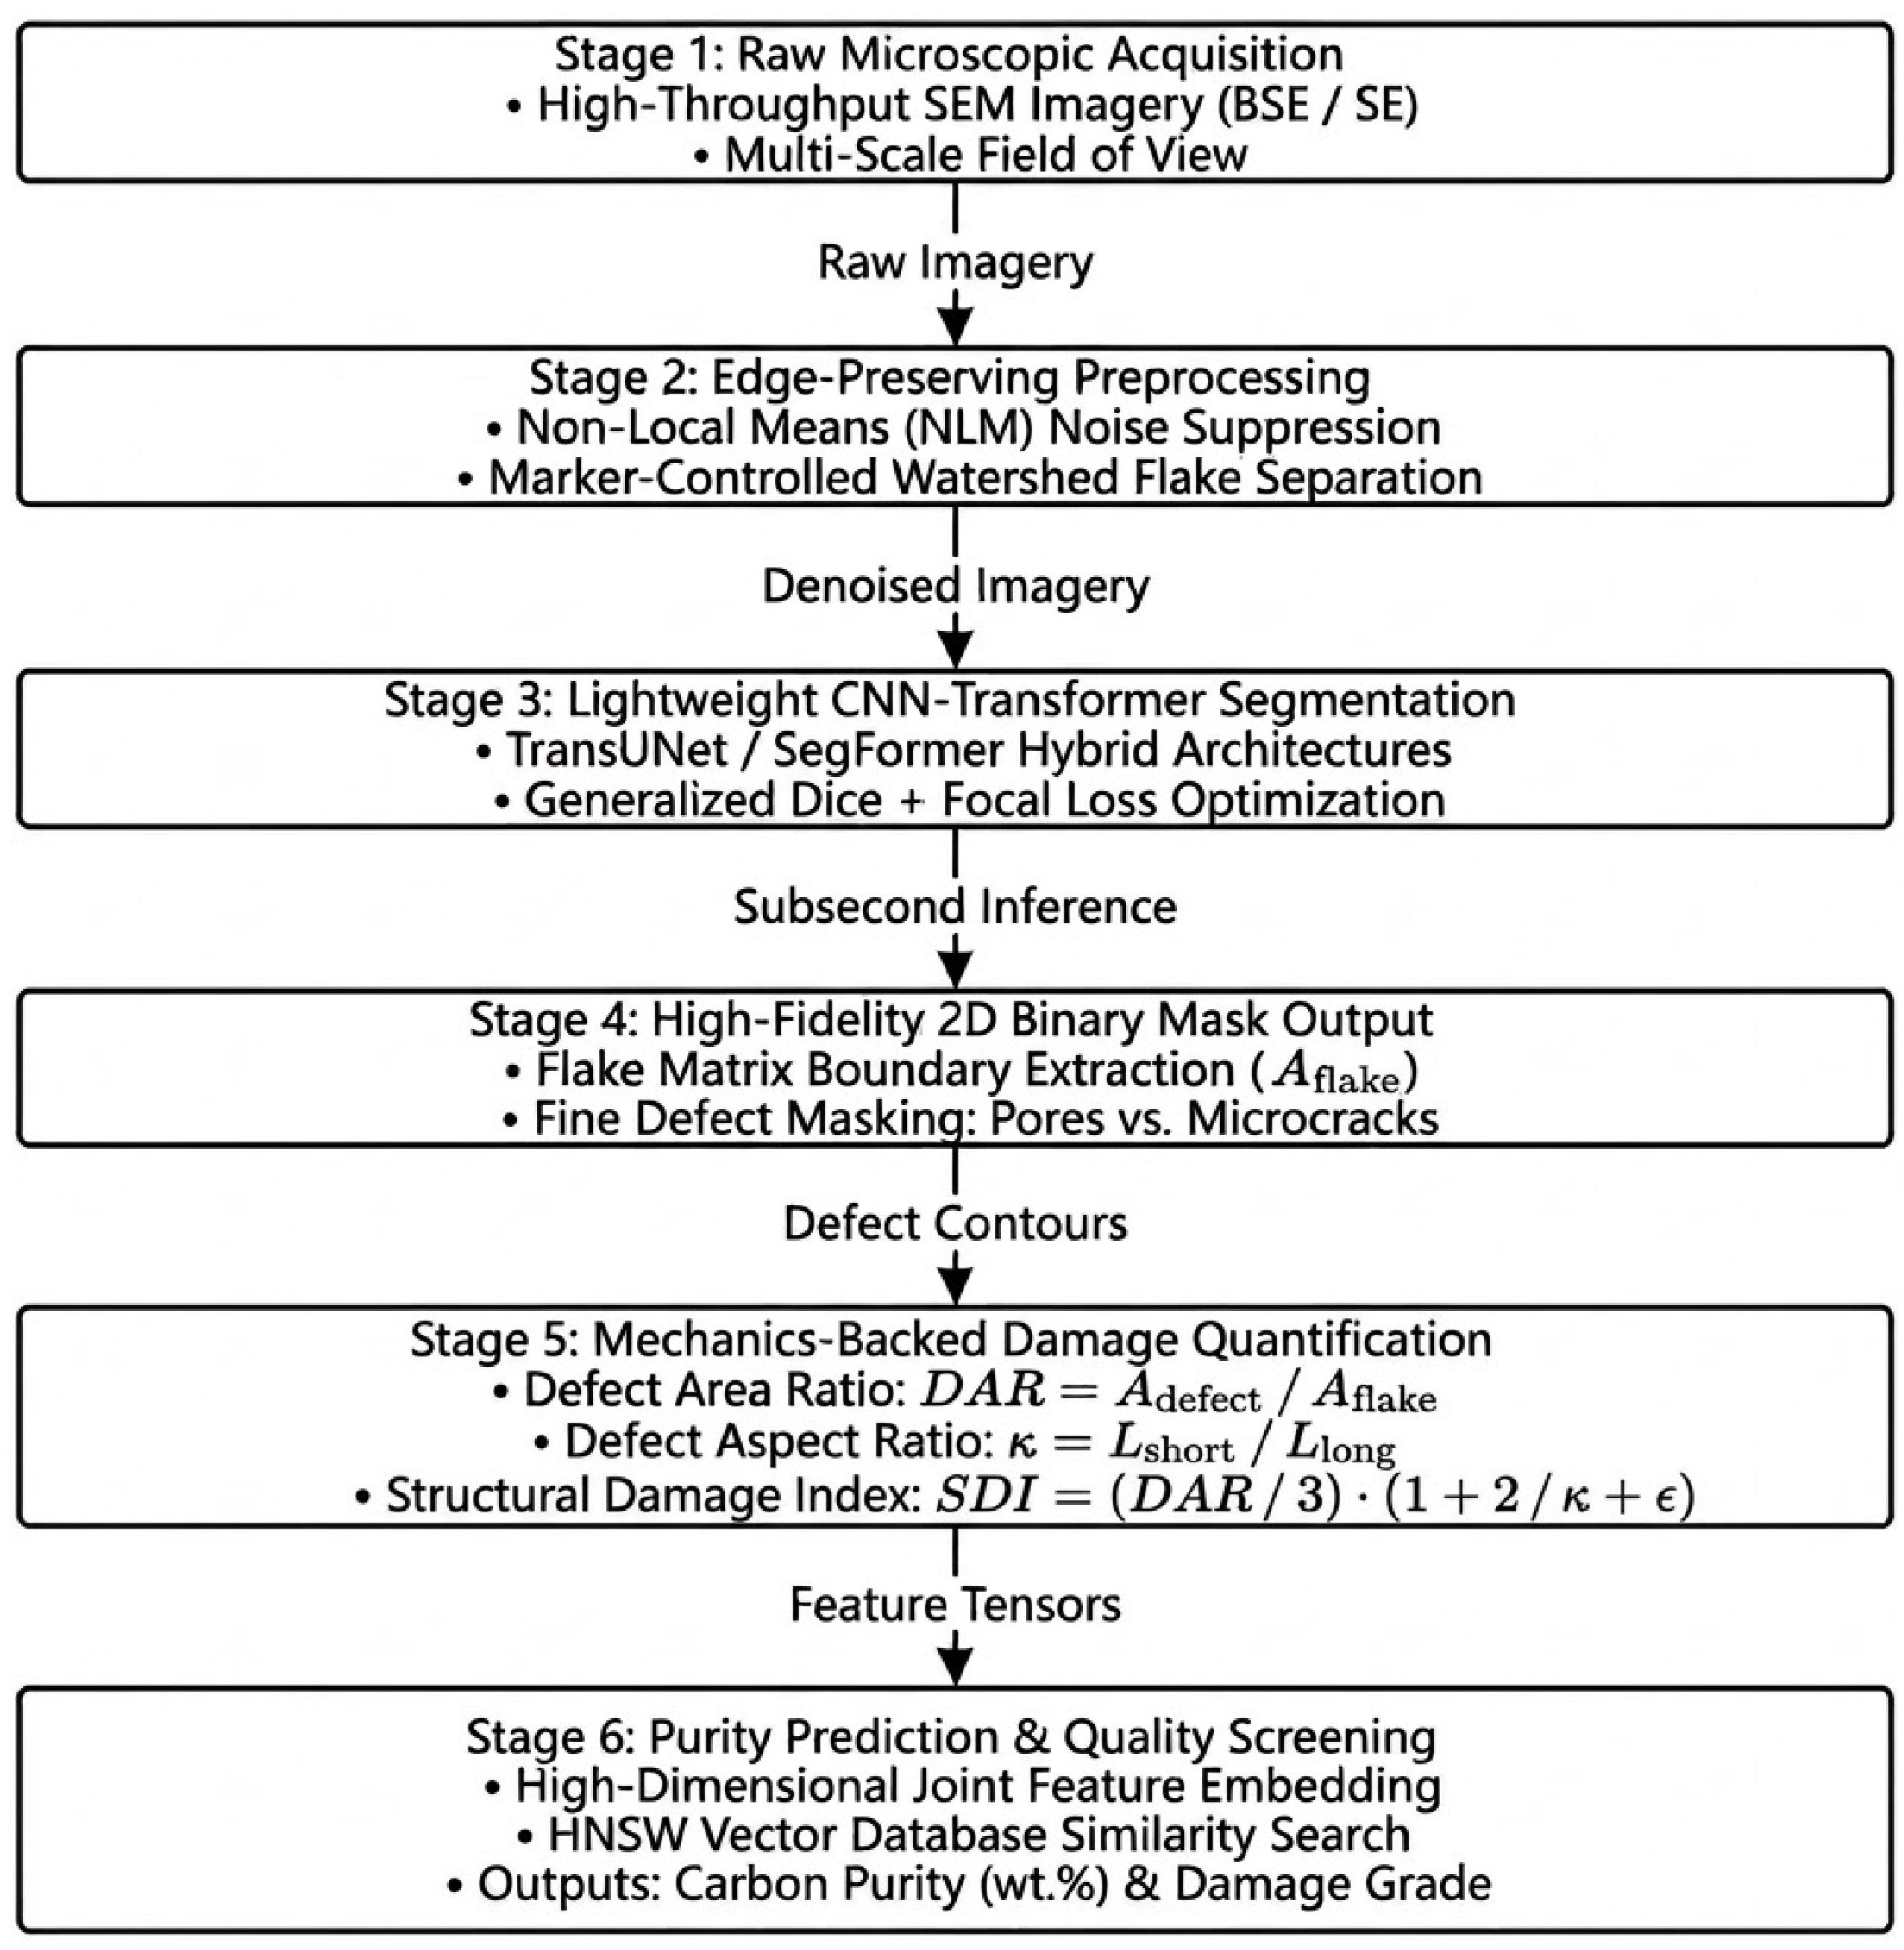
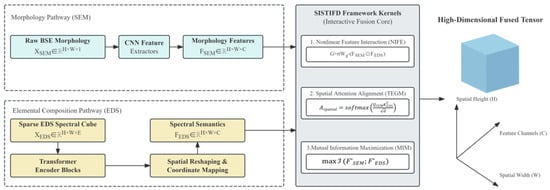
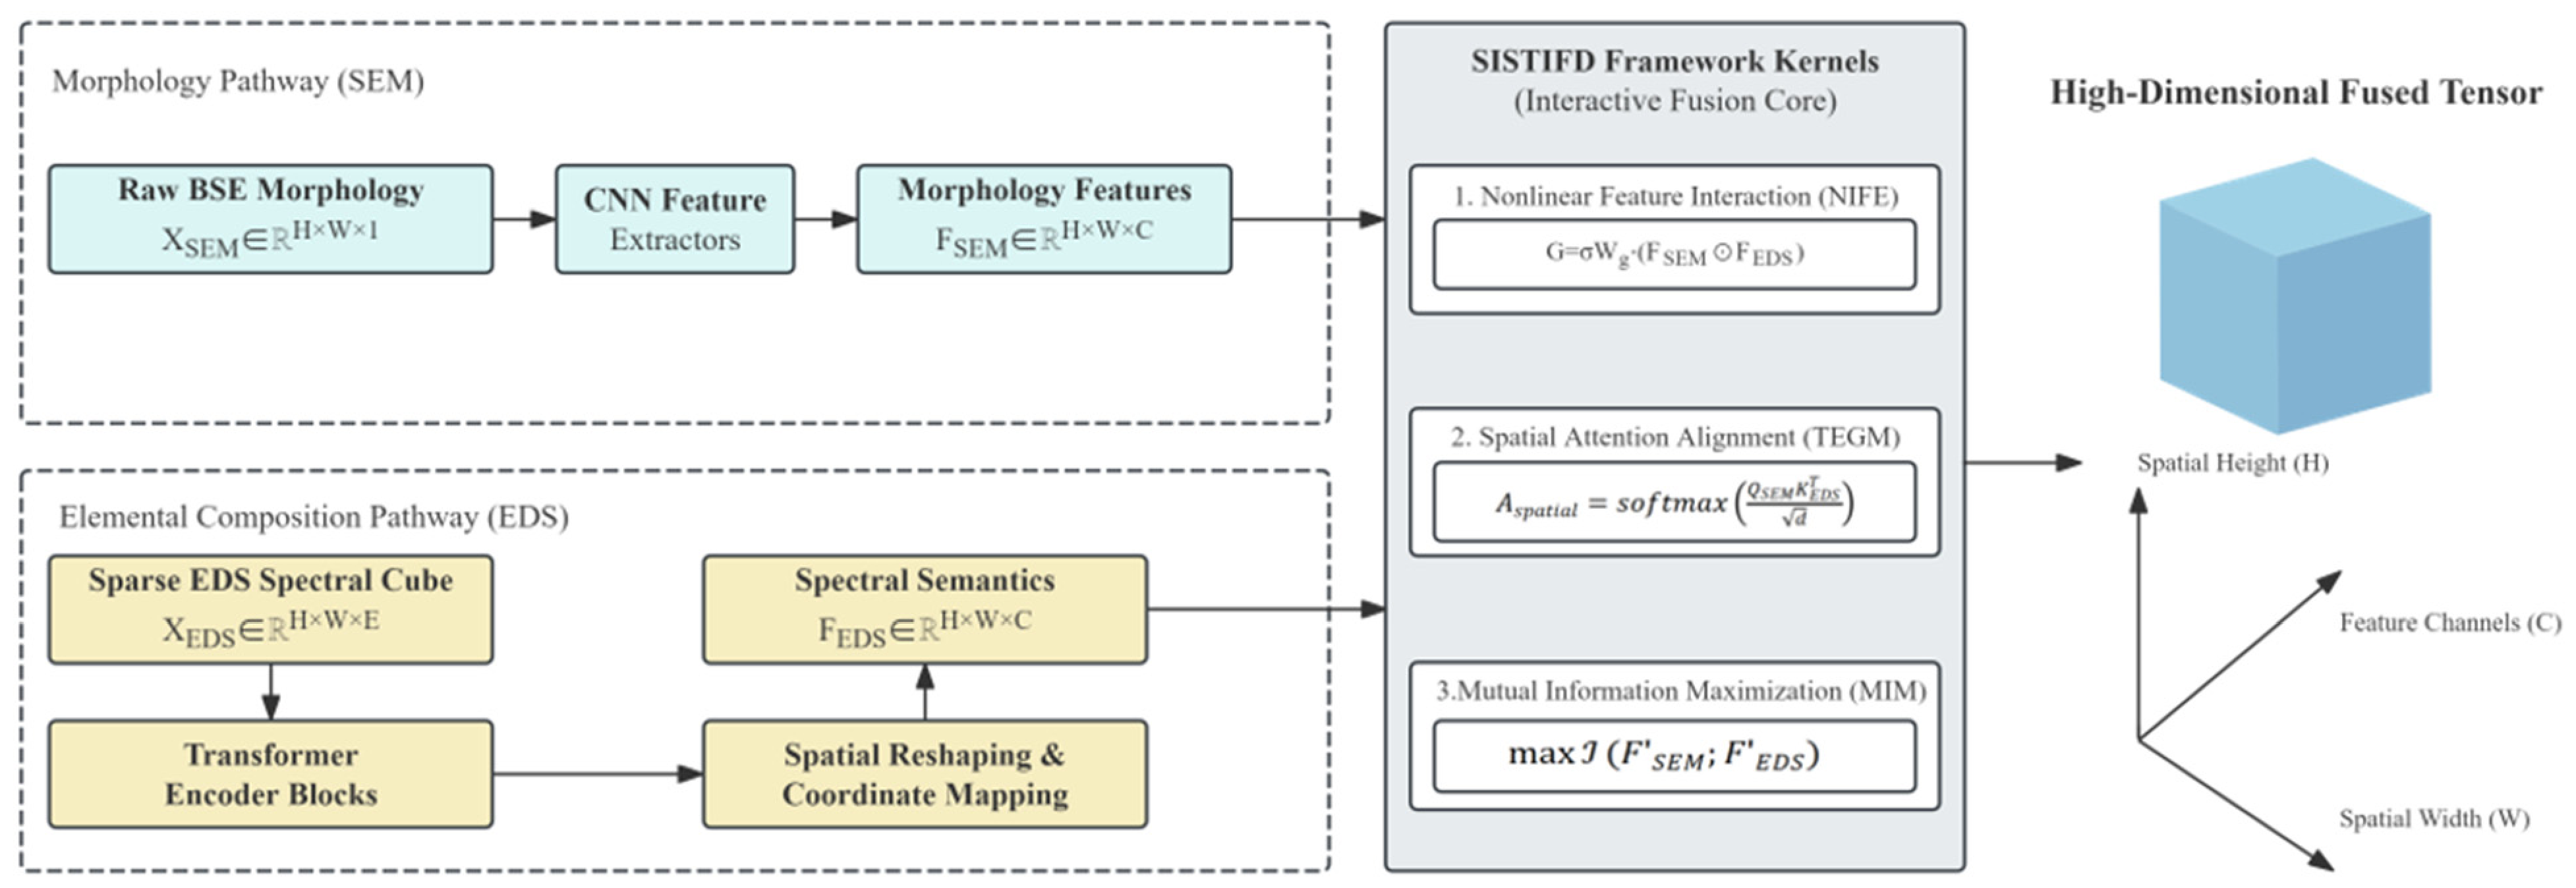

Disclaimer/Publisher’s Note: The statements, opinions and data contained in all publications are solely those of the individual author(s) and contributor(s) and not of MDPI and/or the editor(s). MDPI and/or the editor(s) disclaim responsibility for any injury to people or property resulting from any ideas, methods, instructions or products referred to in the content. |
© 2026 by the authors. Licensee MDPI, Basel, Switzerland. This article is an open access article distributed under the terms and conditions of the Creative Commons Attribution (CC BY) license.