


Abstract
Zircon megacrysts from Wenchang, Hainan Island, South China, were investigated to characterize their mineralogical and geochemical properties, U-Pb age, radiation-damage state, and heat-induced spectral and color responses. We integrated electron probe microanalysis (EPMA), laser ablation–inductively coupled plasma mass spectrometry (LA-ICP-MS) U-Pb and trace-element analyses, Fourier transform infrared (FTIR), Raman and ultraviolet–visible (UV-Vis) spectroscopy, powder X-ray diffraction (XRD), and controlled heating. This approach extends previous occurrence-based descriptions of the Wenchang deposits through an integrated mineralogical, chronological, structural, and thermal-response assessment. The zircons show HREE-enriched patterns, positive Ce anomalies, Eu/Eu* values close to unity, and Th/U ratios of 0.42–1.26, supporting a magmatic affinity without identifying a specific parental melt. A weighted mean 206Pb/238U age of 3.78 ± 0.10 Ma (1σ) was obtained. FTIR spectra retain relatively sharp SiO4 bending features, and five representative spectra show no resolvable broad OH-related feature at the displayed scale. Raman spectra show a narrow ν3(SiO4) band near 1008 cm−1 with an average corrected full width at half maximum of 5.5 cm−1. XRD patterns of two unheated grains contain sharp zircon reflections without a conspicuous diffuse-scattering halo. Together, these observations support retained crystalline order and weak radiation damage in the analyzed samples. Within the measured low-dose dataset, ν3(SiO4) full width at half maximum (FWHM) increases with accumulated alpha dose (Dα), whereas Raman band position shows no statistically significant dose-related trend. Heating weakens the broad 450–550 nm absorption as the brown samples become lighter, while treatment at 1100 °C under nitrogen produces a bluish-gray hue accompanied by broad red-region absorption. The data constrain the age, radiation-damage state, and heat-induced responses of the analyzed Wenchang zircons; their primary host, source region, and transport history remain unresolved.
1. Introduction
In northern Hainan, Cenozoic alkaline basaltic volcanic rocks form part of the Leiqiong volcanic province [1,2]. This regional setting provides geological context for the Wenchang deposits but does not establish the source of the studied zircon grains.
Zircon (ZrSiO4) is one of the most widespread accessory minerals in igneous, metamorphic and sedimentary rocks. Its crystal structure can accommodate U, Th, REE and other trace elements [3]. Pb diffusion in zircon is extremely slow, giving the U-Pb system a high effective closure temperature under geological conditions [4]. Zircon is therefore widely used for precise dating of magmatic events, source tracing and reconstruction of magmatic evolution [4,5]. In addition, trace-element signatures in zircon, particularly Th/U ratios, REE distribution patterns and Ce-Eu anomalies, can be used to distinguish genetic types and to constrain magmatic redox conditions [5,6,7].
Zircon megacrysts from alluvial deposits in the Huadian area of northeastern China have been characterized using trace-element, U-Pb, and Hf-isotope data [8]. Comparable zircon megacrysts from placer deposits in the Central Highlands of Vietnam have also been studied using mineralogical, geochemical, and geochronological methods [9]. Broader Indo-Pacific compilations show that zircon megacryst suites are geochemically and isotopically diverse [10]. In the Wenchang area, previous work mainly documented the mineral assemblages of quartz-sand deposits [11]. An integrated assessment combining mineral chemistry, U-Pb age, radiation-damage indicators, and controlled heat-treatment responses has remained unavailable for the Wenchang zircons.
The metamictization of zircon is another key issue. Zircon commonly contains U and Th, whose radioactive decay progressively damages the crystal lattice. This process changes physical properties such as density, hardness and color [12,13,14,15,16,17,18]. Recrystallization and associated trace-element mobility may further disturb the U-Pb isotopic system [19]. Laser Raman spectroscopy is highly sensitive to this damage. With increasing radiation damage, the ν3 antisymmetric stretching band of the SiO4 tetrahedron near 1008 cm−1 shifts toward lower wavenumber and broadens progressively [12,13,20,21]. Recent work has further quantified the relationships between Raman full width at half maximum (FWHM), Raman shift and alpha dose in natural and synthetic zircons, supporting the use of Raman parameters as proxies for radiation damage [22]. Raman band position and FWHM can therefore be used as non-destructive proxies for zircon crystallinity. Heat treatment can partly anneal lattice damage [23,24,25,26] and modify color-related defects [27,28], providing an experimental approach to evaluate the link between color, structural defects and spectroscopic response. For Wenchang zircon, however, the degree of metamictization and the possible relationship between Raman parameters and accumulated radiation dose have not yet been established.
Powder X-ray diffraction (XRD) complements vibrational spectroscopy by probing long-range crystalline order. Studies of damaged and annealed zircon have evaluated changes in Bragg reflections, diffuse scattering, reflection-dependent line profiles and lattice parameters, rather than treating the width of a single reflection as a universal measure of crystallinity [23,24,25]. Applying these complementary observations to unheated Wenchang zircon provides a direct structural check on the interpretation of weak metamictization based on Raman and Fourier transform infrared (FTIR) spectra.
This study integrates electron probe microanalysis (EPMA), laser ablation–inductively coupled plasma mass spectrometry (LA-ICP-MS) trace-element and U-Pb analyses, FTIR, Raman and ultraviolet–visible (UV-Vis) spectroscopy, XRD, and heat-treatment experiments under different atmospheres. The objectives are to: (1) characterize the mineralogical and geochemical features of the Wenchang zircons, determine their U-Pb age, and assess their magmatic affinity without assigning them to a specific parental melt; (2) evaluate radiation-related structural disorder using accumulated alpha dose (Dα), Raman parameters, FTIR spectra, and XRD observations; and (3) document heat-induced spectral and color changes under controlled temperatures and atmospheres. The principal contribution is a sample-specific integration of age, radiation-dose estimates, short- and long-range structural observations, and thermal-response data for the Wenchang zircons.
2. Geological Setting
2.1. Regional Geological Setting
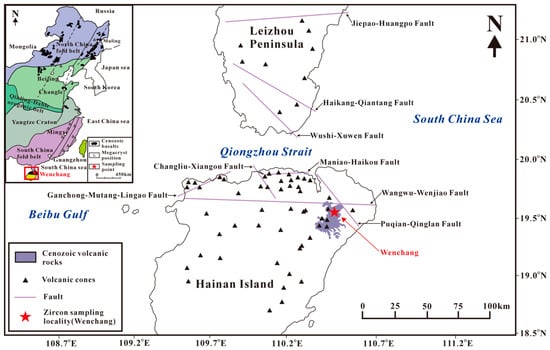
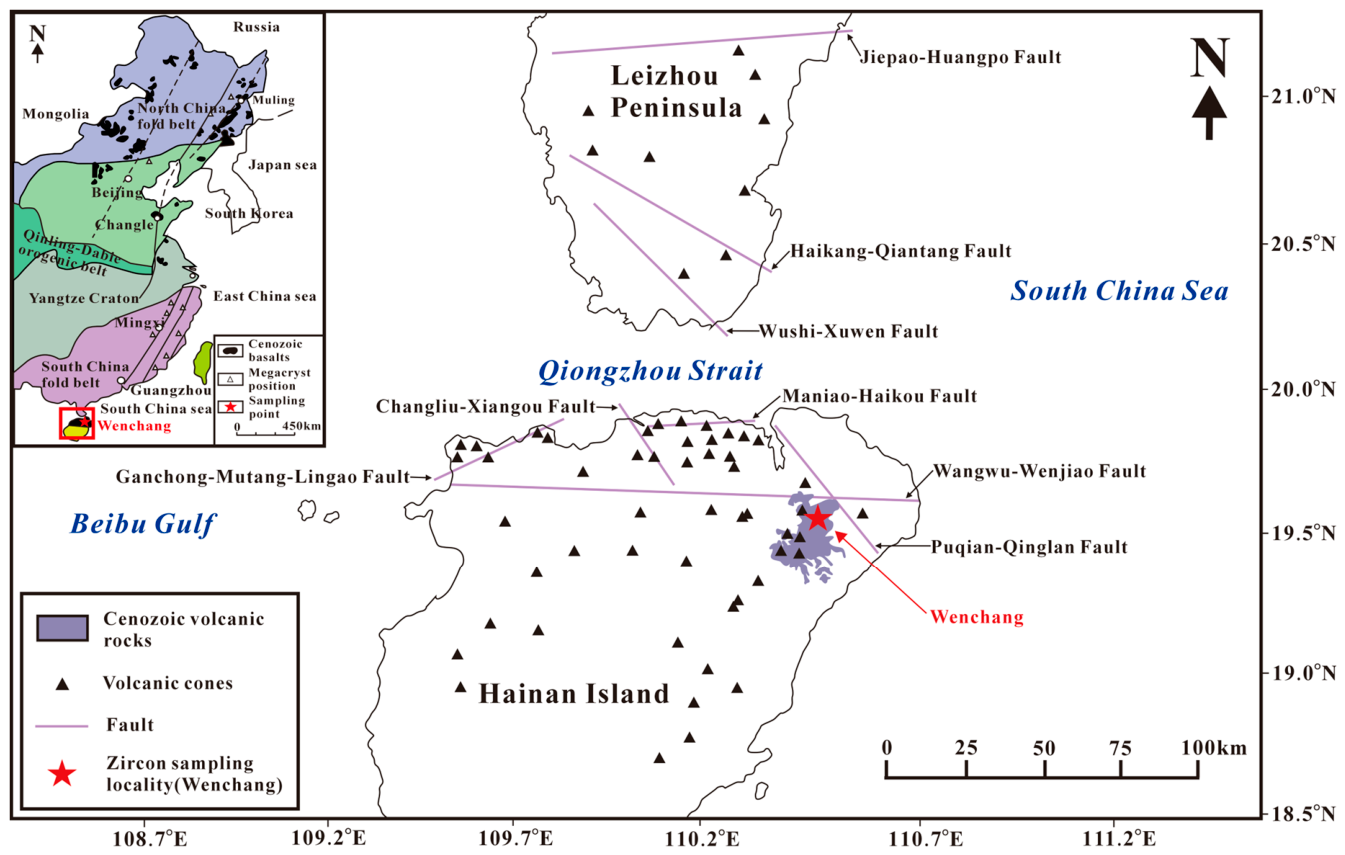
Hainan Island is situated on the northern margin of the South China Sea and, together with the Leizhou Peninsula, constitutes the Leiqiong volcanic fields. These fields represent the southernmost continental Cenozoic volcanic province in China [1]. Although northern Hainan and the Leizhou Peninsula are separated by the Qiongzhou Strait, their geochronological, geochemical and geophysical features indicate that they belong to a single volcanic-tectonic system [1]. Cenozoic volcanic rocks and volcanic cones are spatially associated with major nearly E-W, NE-SW and NW-SE fault systems (Figure 1), including the Wangwu-Wenjiao, Maniao-Haikou, Jiepao-Huangpo, Ganchong-Mutang-Lingao, Puqian-Qinglan, Changliu-Xiangou, Haikang-Qiantang and Wushi-Xuwen faults. These structures likely provided pathways for magma ascent and exerted an important control on the distribution of volcanic rocks in the Leiqiong volcanic fields [1]. Regional geophysical and geodetic studies indicate that the principal E-W and NW-SE fault systems were reactivated during Cenozoic extension associated with opening of the South China Sea and remained active into the Quaternary and present day [29,30].
Figure 1.
Distribution of Cenozoic volcanic rocks, volcanic cones and major faults in the Leiqiong volcanic fields, South China. The Wenchang zircon sampling locality is marked by the red star. The upper-left inset shows the regional tectonic setting of eastern China and adjacent areas and indicates the location of Hainan Island and Wenchang. Modified after Wei et al. [1]. The red square in the inset outlines the area shown in the main map.
Wenchang City is located in northeastern Hainan Island, within the northern Hainan sector of the Leiqiong volcanic fields. The study area lies south of the eastern segment of the Wangwu-Wenjiao Fault and close to the Puqian-Qinglan Fault (Figure 1). Regional studies document late Cenozoic basaltic volcanism and Cenozoic-to-Quaternary reactivation of major fault systems in northern Hainan [1,2,29,30]. This geological context does not identify the primary host, source region, or incorporation mechanism of the zircon grains recovered from secondary deposits.
In northern Hainan, Cenozoic volcanic rocks and associated volcaniclastic-sedimentary units are widely exposed [1,2]. Volcanic rocks, volcaniclastic deposits, and interbedded sedimentary materials provide the regional geological setting of the secondary zircon-bearing deposits [1,2,31].
2.2. Occurrence of Zircon Megacrysts
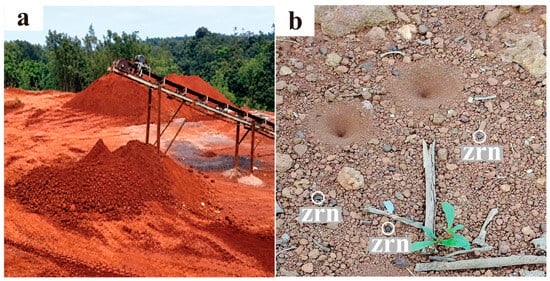
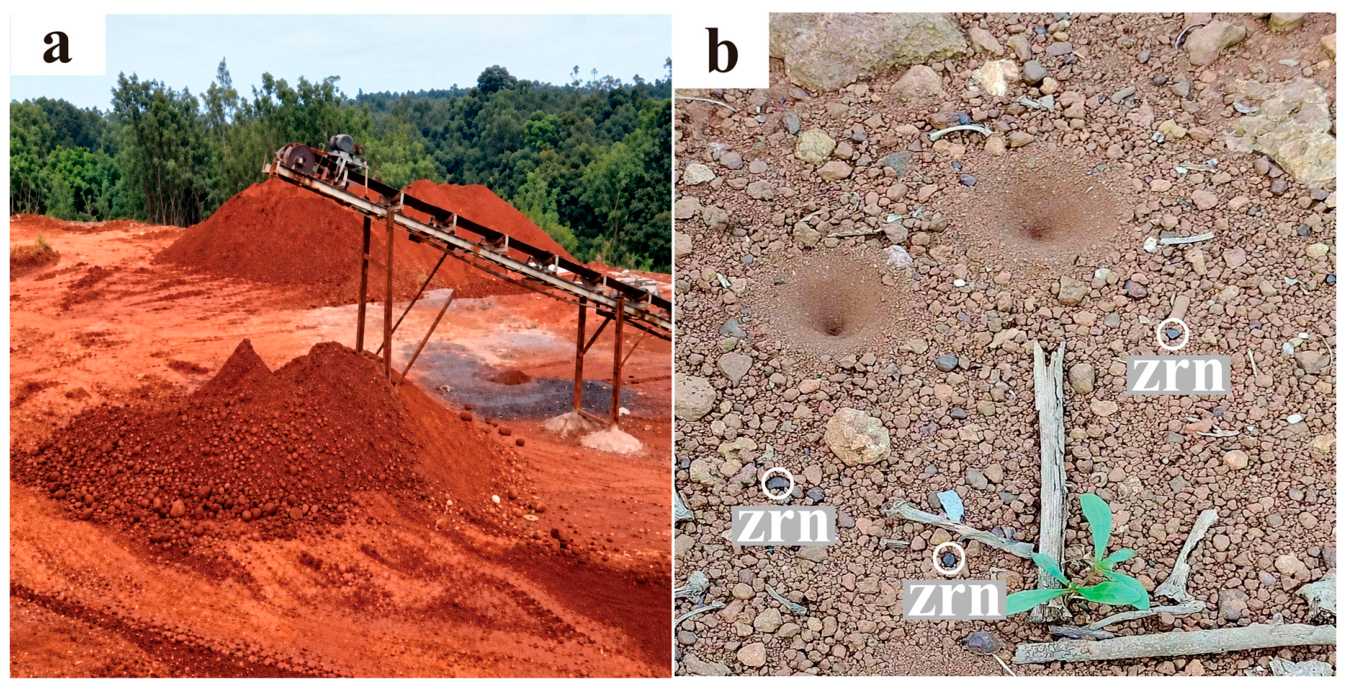
The studied Wenchang zircon megacrysts were collected from secondary deposits. Field observations at the sampling locality show loose slope deposits and alluvial-proluvial sediments developed from weathered volcanic materials. The sampling locality lies in northeastern Hainan Island, close to the Wangwu-Wenjiao and Puqian-Qinglan fault systems (Figure 1). The mining area is located at approximately 110° E and 19° N, at an elevation of about 149 m, and covers approximately 35 km2.
Field observations indicate that the ore-bearing horizons are mainly Quaternary unconsolidated sediments. They occur as layered bodies composed of ore-bearing clayey gravel and ore-bearing gravelly clay, broadly parallel to local depositional layering (Figure 2). Because the analyzed zircon grains were collected from secondary deposits and weathered material, field occurrence alone does not establish their primary host, crystallization environment, or transport mechanism. Field observations suggest that weathering, erosion, transport, and gravitational sorting may have concentrated the grains in slope and alluvial-proluvial environments.
Figure 2.
Field occurrence of the Wenchang zircon-bearing secondary deposit: (a) overview of the mining area; (b) loose surface material containing zircon grains, indicated by the labels.
3. Materials and Methods
3.1. Samples
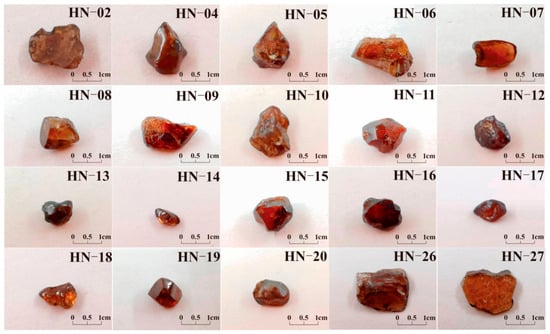
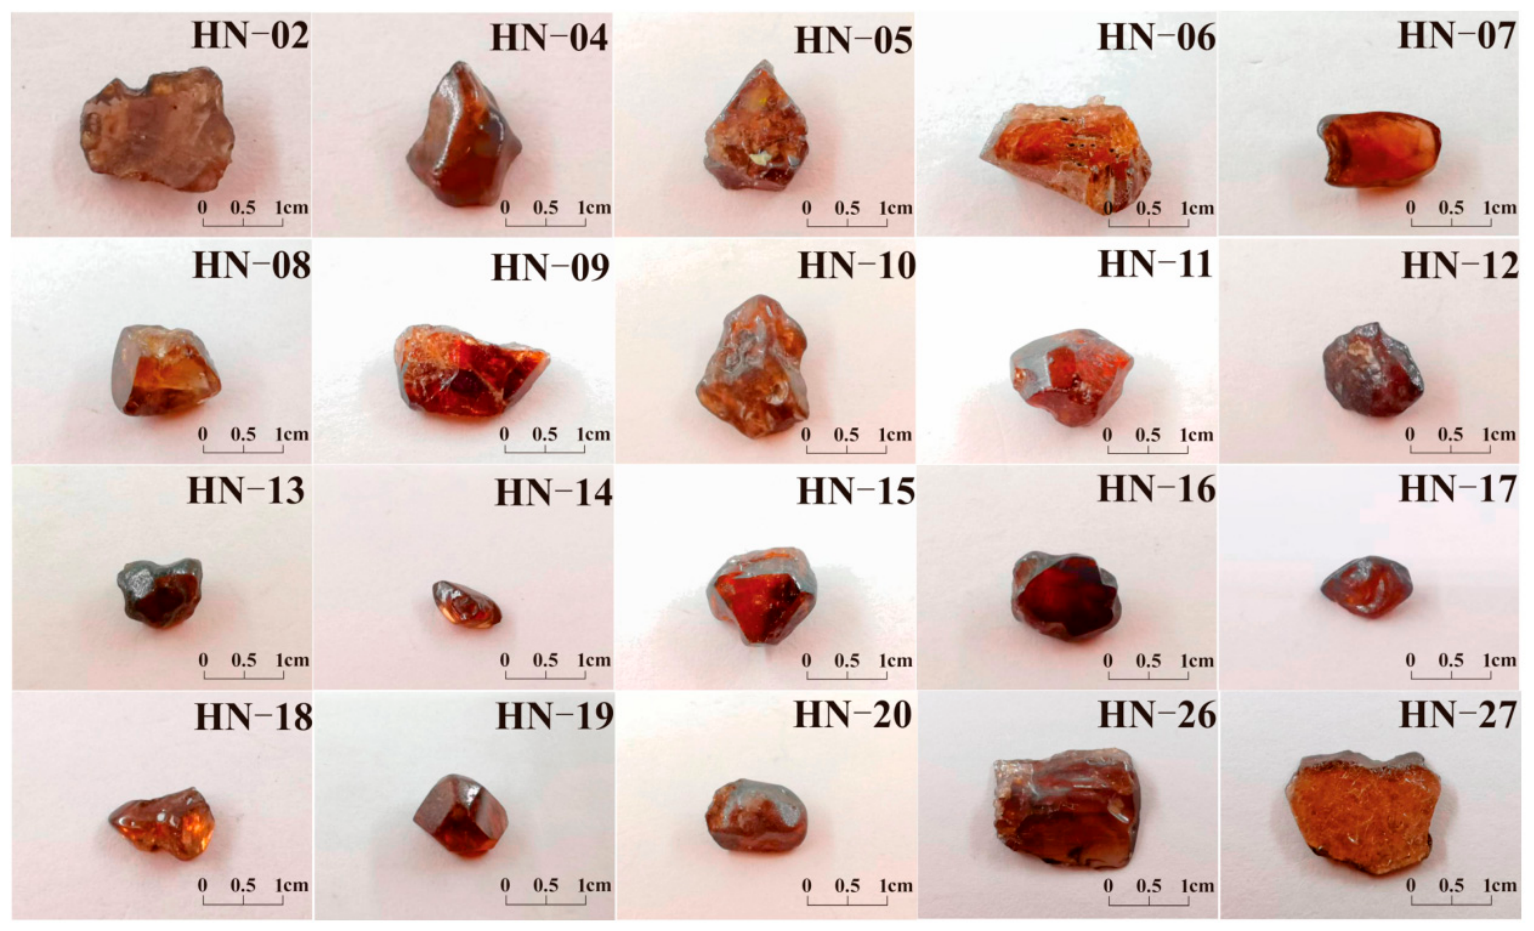
A total of 105 zircon grains were collected from slope deposits and weathered volcanic breccias in the Wenchang mining area. On the basis of color variation, grain morphology and preliminary spectroscopic screening, 28 representative grains (HN-01 to HN-28) were selected for detailed mineralogical, geochemical and spectroscopic analyses. Individual grains weigh 0.08–0.35 g (Figure 3).
Figure 3.
Representative zircon megacrysts from Wenchang, Hainan. The grains are mainly dark brown to reddish brown and show rounded to irregular morphologies after weathering and transport.
The zircons are mainly brown, ranging from dark brown to reddish brown. Most rough crystals are transparent to translucent, and some darker grains become more transparent after cutting and polishing (Figure 3). Crystal forms are generally incomplete: crystal edges are commonly rounded, and rounded to irregular grains are more abundant than well-developed tetragonal prisms or dipyramids. Grain sizes range mainly from 2 to 9 mm. Polished samples show vitreous luster, whereas broken surfaces are uneven to conchoidal and locally display greasy luster. The average density measured by hydrostatic weighing is 4.6 g/cm3. Larger grains commonly contain fractures and inclusions, whereas smaller and more euhedral grains tend to be cleaner and more transparent.
3.2. Major- and Trace-Element Analyses
Major-element compositions were determined at the Electron Probe Laboratory of Hebei GEO University using a JEOL JXA-8230 electron probe microanalyzer (JEOL Ltd., Akishima, Tokyo, Japan). Analytical conditions were 15 kV accelerating voltage, 20 nA beam current, and 1 μm beam diameter. Peak and background counting times were 10 s and 5 s, respectively, and matrix effects were corrected using the ZAF procedure. Thirty-one spot analyses from five representative samples are reported in Supplementary Table S1. Instrument-reported detection limits were 218–242 ppm for U, 182–238 ppm for Th, 614–664 ppm for Hf, and 105–306 ppm for P. Zr was calibrated against K5 zircon, whereas Si was calibrated against K5 zircon or SPI-27 jadeite. The records indicate that U, Th, and Hf were calibrated against SPI-U, SPI-Th, and SPI-Hf, respectively. The instrument-reported S.D. (%) values are 1σ relative standard deviations derived from peak and background X-ray counting statistics. Values associated with signals reported below the detection limit are retained for traceability but are not interpreted as quantitative precision estimates. Individual 1σ S.D. (%) and detection-limit information are provided in Supplementary Table S1.
Trace-element and U-Pb isotopic analyses were carried out at the Key Laboratory of Strategic Critical Mineral Resources of Hebei Province. Analyses used a Thermo Fisher iCAP RQ inductively coupled plasma mass spectrometer (Thermo Fisher Scientific (Bremen) GmbH, Bremen, Germany) coupled to a Resolution SE 193 nm excimer laser ablation system. The laser spot diameter was 29 μm, with an energy density of 3 J/cm2 and a repetition rate of 8 Hz. Each analysis included 20 s background acquisition and 40 s sample ablation. Trace-element concentrations were normalized to the CI chondrite abundances of McDonough and Sun [32]. Trace-element and REE interpretation was restricted to 24 analyses whose spot identifiers could be matched to the U-Pb dataset. Trace-element data reduction followed the external-calibration strategy described by Liu et al. [33]. Time-dependent signal drift, down-hole elemental fractionation, and common-Pb correction were handled during U-Pb data reduction using ICPMSDataCal 11.8 [34]. Robust correction of down-hole elemental fractionation is an established requirement in LA-ICP-MS U-Pb analysis [35]. Zircon 91500 served as the primary U-Pb reference material [36], with accepted 207Pb/206Pb and 206Pb/238U ages of 1065.4 ± 0.6 Ma and 1062.4 ± 0.8 Ma, respectively (95% confidence/2σ). GJ-1 served as a secondary reference material [37], with accepted 206Pb/238U and 207Pb/206Pb ages of 601.7 ± 1.3 Ma and 608.5 ± 0.4 Ma, respectively (2σ). NIST SRM 610 glass was used for external trace-element calibration, with Si as the internal standard, and NIST SRM 612 was analyzed as an independent secondary quality-control material. The analytical output reports 2SE values. For consistent onefold reporting, the sample U-Pb isotopic-ratio and age uncertainties tabulated in Supplementary Table S2 were converted to absolute 1σ values by dividing the exported 2SE values by two [38]. Weighted mean age uncertainties are likewise reported at 1σ. Reference-material measurements and quality-control results are reported in Supplementary Table S4. Across all seven U-Pb analytical batches, 23 analyses of 91500 yielded a mean 206Pb/238U age of 1062.57 ± 8.89 Ma (mean ± 1 SD). All archived GJ-1 measurements are reported without statistical rejection. For the Y-REE-Hf-Th-U suite used in the interpretation, NIST SRM 612 recoveries were 95.80%–100.09%, with RSD values of 0.95%–3.84%. U-Pb ages, concordia diagrams, and weighted mean ages were calculated using Isoplot/Ex 3.0 [39]. Supplementary Table S2 reports 32 sample analyses with concordance greater than 90%. The reported sample isotopic ratios and ages are provided in Supplementary Table S2. The equations used to calculate Ce/Ce* and Eu/Eu*, together with the positive-value validity criterion, are provided in the notes to Supplementary Table S3.
3.3. Spectroscopic Analyses
FTIR, Raman and UV-Vis spectra were obtained at the Gem Testing Center of Hebei GEO University. FTIR spectra were collected from polished crystal surfaces in reflection mode using a Thermo Nicolet iS5 Fourier transform infrared spectrometer (Thermo Electron Scientific Instruments LLC, Madison, WI, USA) over 400–4000 cm−1 with a resolution of 4 cm−1. Raman spectra were collected using a Renishaw inVia confocal Raman microscope (Renishaw plc, Wotton-under-Edge, Gloucestershire, UK) with 532 nm excitation, 50 mW laser power and a spectral resolution of about 1.5 cm−1. Spectra were collected over 100–4000 cm−1, with 10 s acquisition time and three accumulations for each spectrum. A silicon wafer at 520 cm−1 was used for calibration before analysis. The ν3(SiO4) band at approximately 1008 cm−1 was fitted with a Gaussian–Lorentzian mixed function in Origin, version 9.8.0.200 (OriginLab Corporation, Northampton, MA, USA), and the resulting full width at half maximum (FWHM) was corrected for instrumental broadening following Irmer [40]. The standard error of each fitted FWHM was calculated by propagating the full covariance matrix of the width and shape parameters in the Gaussian–Lorentzian mixed-function fit and is reported as 1σ. These uncertainties quantify peak-fitting precision and do not include uncertainty associated with the subsequent FWHM correction. The same fitting and correction procedure was applied to all analyzed grains. All 105 grains were analyzed by Raman spectroscopy. UV-Vis spectra were collected in reflection mode using a Biaoqi GEM-3000 spectrophotometer (Guangzhou BiaoQi Optoelectronics Co., Ltd., Guangzhou, China) over 200–1000 nm.
3.4. Powder X-Ray Diffraction
XRD analyses were performed at Guangdong University of Technology using a Rigaku MiniFlex 600 diffractometer (Rigaku Corporation, Akishima, Tokyo, Japan) operated at 40 kV and 15 mA with monochromatic Cu Kα1 radiation. Patterns were collected over 5–75° 2θ with a step size of 0.01° and a scan speed of 6°/min, as recorded in the original acquisition files. A silicon powder standard (SRM 640f [41]) was used for instrument calibration. For display, the patterns were restricted to 15–75° 2θ.
Two unheated grains, HN-14 and HN-16, were each ground in their entirety for XRD analysis. They were selected as contrasting representatives from the measured Raman–Dα range: HN-14 has low FWHM and low Dα, whereas HN-16 has relatively higher FWHM and Dα. They are not the absolute extrema of the dataset. The corrected ν3(SiO4) Raman FWHM is 5.3 cm−1 at the three measured spots in HN-14 and 5.6–5.7 cm−1 at the two valid spots in HN-16. The powder measurements therefore sample the whole grains, whereas the Raman measurements characterize selected microscopic locations.
Patterns were processed in MDI Jade 6 (release 6.5.26) and compared with the zircon reference pattern PDF 06-0266. Peak positions and apparent FWHM values were taken from the exported peak-search reports. Unit-cell parameters were refined from indexed peak positions using the tetragonal zircon model (space group I41/amd, No. 141), with sample displacement refined and zero offset fixed at zero. This procedure is a peak-position-based cell refinement.
3.5. Heat-Treatment Experiments
Heat-treatment experiments were carried out in an OTF-1200X-S tube furnace (Hefei Kejing Materials Technology Co., Ltd., Hefei, China) under two atmospheres: air (oxidizing) and nitrogen (inert to weakly reducing; 99.99% N2, flow rate 0.5 L/min). Six representative samples (HN-02, HN-04, HN-05, HN-09, HN-26 and HN-27) were heated from room temperature to target temperatures of 600, 800 and 1100 °C at a rate of 10 °C/min. Samples were held at the target temperature for 3 h and then cooled in the furnace. During cooling, additional 2 h holds were conducted at 800, 600 and 400 °C. FTIR, Raman and UV-Vis spectra were collected before and after heating.
4. Results
4.1. Geochemical Characteristics
4.1.1. Major Elements
The retained analyzed points contain 32.219–35.860 wt.% SiO2 and 62.144–67.513 wt.% ZrO2, with SiO2 + ZrO2 totals of 97.62–101.05 wt.% (average 99.63 wt.%; Supplementary Table S1). The slight excess above 100 wt.% in a small number of analyses is attributed to cumulative analytical uncertainty and residual standardization and ZAF matrix-correction effects in the EPMA dataset.
Minor components include UO2, ThO2, and HfO2. HfO2 contents are relatively stable (0.44–1.16 wt.%), whereas UO2 and ThO2 vary more widely and are below detection limit in some analytical spots. The total abundance of impurity oxides is generally less than 2 wt.%, indicating high mineral purity.
4.1.2. Trace Elements and REE
Trace-element and REE results are reported for 24 analyses. Th contents range from 13 to 342 ppm (mean 92 ppm), U contents range from 30 to 395 ppm (mean 122 ppm), and Th/U ratios range from 0.42 to 1.26 (mean 0.66). Th/U ratios greater than 0.4 are commonly associated with magmatic zircon, whereas many metamorphic zircons have Th/U ratios below 0.1 [5,42]; the Wenchang values therefore support a magmatic affinity.
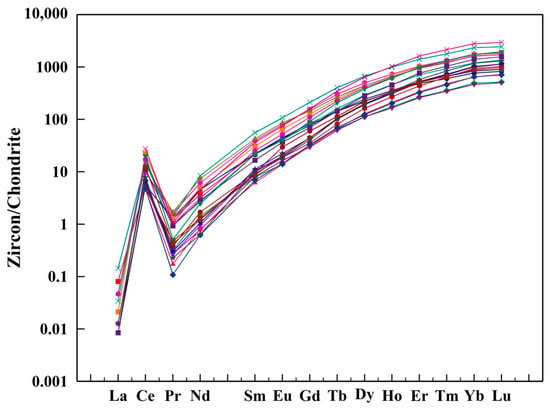
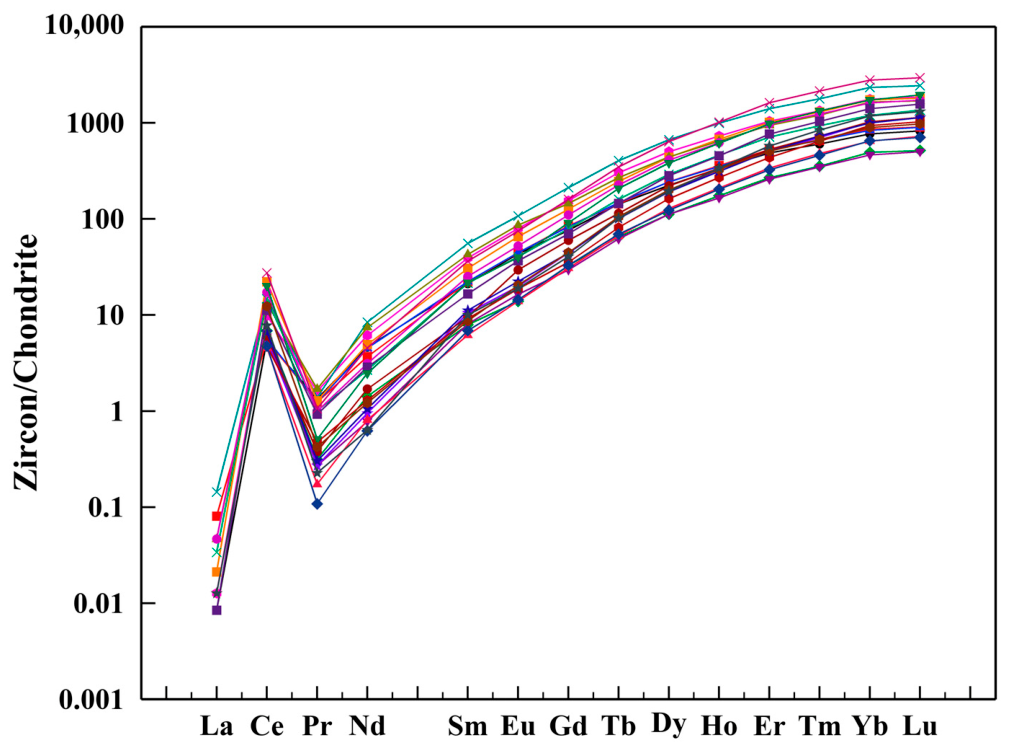
Across the 24 matched analyses, total REE contents (ΣREE) range from 188 to 1113 ppm, with a mean of 472 ppm. CI-chondrite-normalized REE patterns are depleted in LREE and enriched in HREE, with pronounced fractionation between LREE and HREE. This pattern is consistent with the crystal-chemical preference of zircon for incorporating smaller HREE ions (Figure 4) [3,32,43,44].
Figure 4.
CI-chondrite-normalized REE patterns of zircon from Wenchang, Hainan. Each colored curve represents an individual analytical spot.
Using the conventional neighboring-element formulas, valid Ce/Ce* values range from 17.41 to 144.87 (n = 10), and Eu/Eu* values range from 0.863 to 1.229 (n = 24; Figure 4). All ten valid Ce/Ce* results indicate positive Ce anomalies, whereas Eu/Eu* values are distributed close to unity. Preferential incorporation of Ce4+ relative to trivalent LREE can contribute to a positive zircon Ce anomaly [45]. These values are reported as compositional observations and are not used for quantitative oxygen-fugacity estimates.
4.2. U-Pb Age
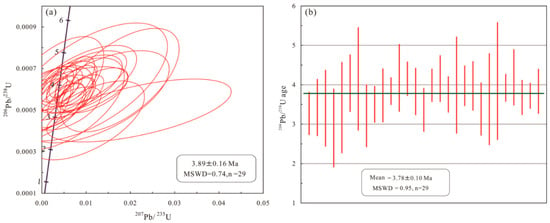
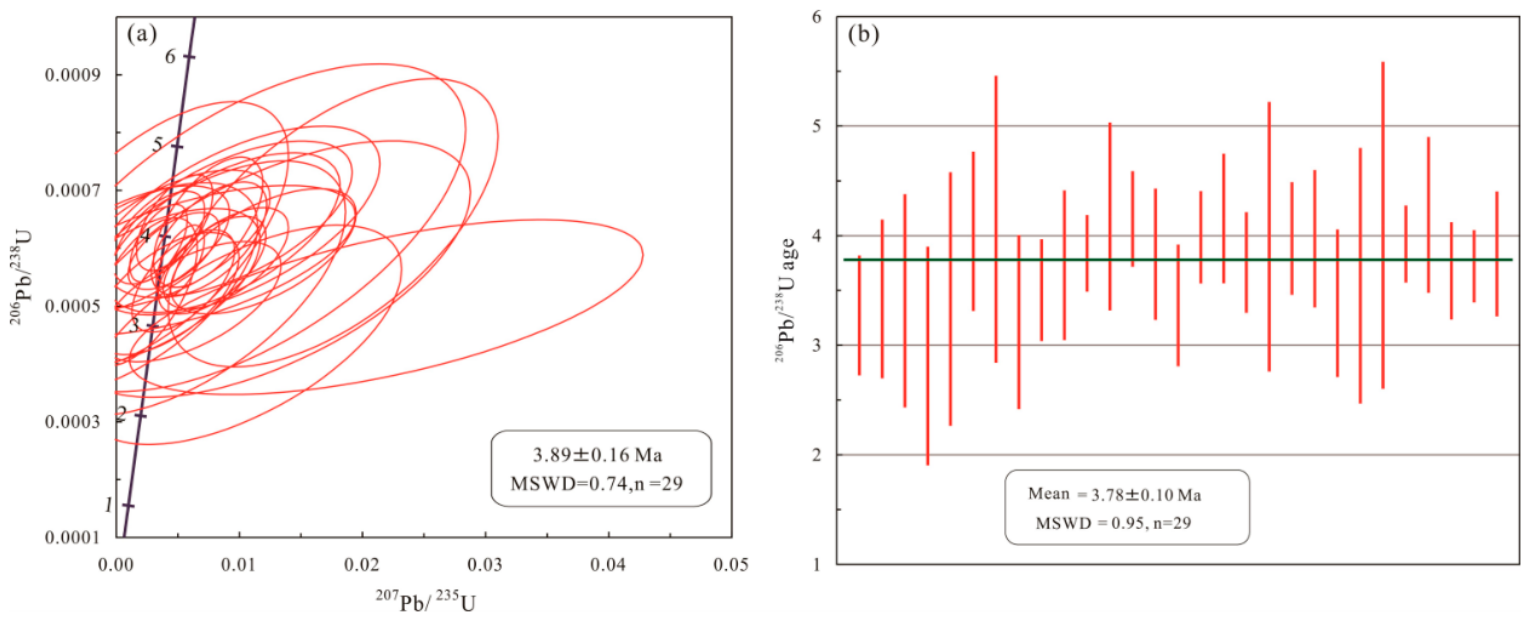
Supplementary Table S2 contains 32 zircon analyses with concordance greater than 90%. All 32 analyses are retained in Table S2, and the concordia and weighted mean age plots are presented in Figure 5.
Figure 5.
(a) U-Pb concordia diagram and (b) weighted mean 206Pb/238U age plot of zircon from Wenchang, Hainan. MSWD = mean square of weighted deviates. The quoted weighted mean age uncertainty is 1σ.
In the concordia diagram (Figure 5a), most analytical spots plot on or close to the concordia curve, indicating that the U-Pb isotopic system remained closed and experienced no significant radiogenic Pb loss or gain. Because the zircons are very young and radiogenic 207Pb is extremely limited, 207Pb-based ages have large uncertainties and are not used for geological interpretation. The calculated ages show that the 206Pb/238U ages of the samples range from 2.5 to 5.0 Ma. The weighted mean age was calculated using the Isoplot/Ex program, yielding a 206Pb/238U weighted mean age of 3.78 ± 0.10 Ma (1σ), with a mean square of weighted deviates (MSWD) of 0.95 (n = 29) (Figure 5b).
The weighted mean age falls within the broad interval of late Cenozoic volcanic activity in northern Hainan [1,2]. The relatively small dispersion of the 206Pb/238U age data and the MSWD value close to 1 indicate good age consistency among the analyzed samples. The age relationship supports a temporal association with late Cenozoic magmatism, although it does not demonstrate crystallization from or transport by basaltic magma.
4.3. Spectroscopic Characteristics
4.3.1. FTIR Spectra
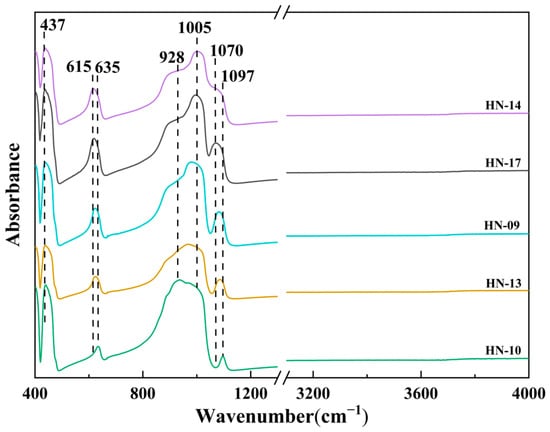
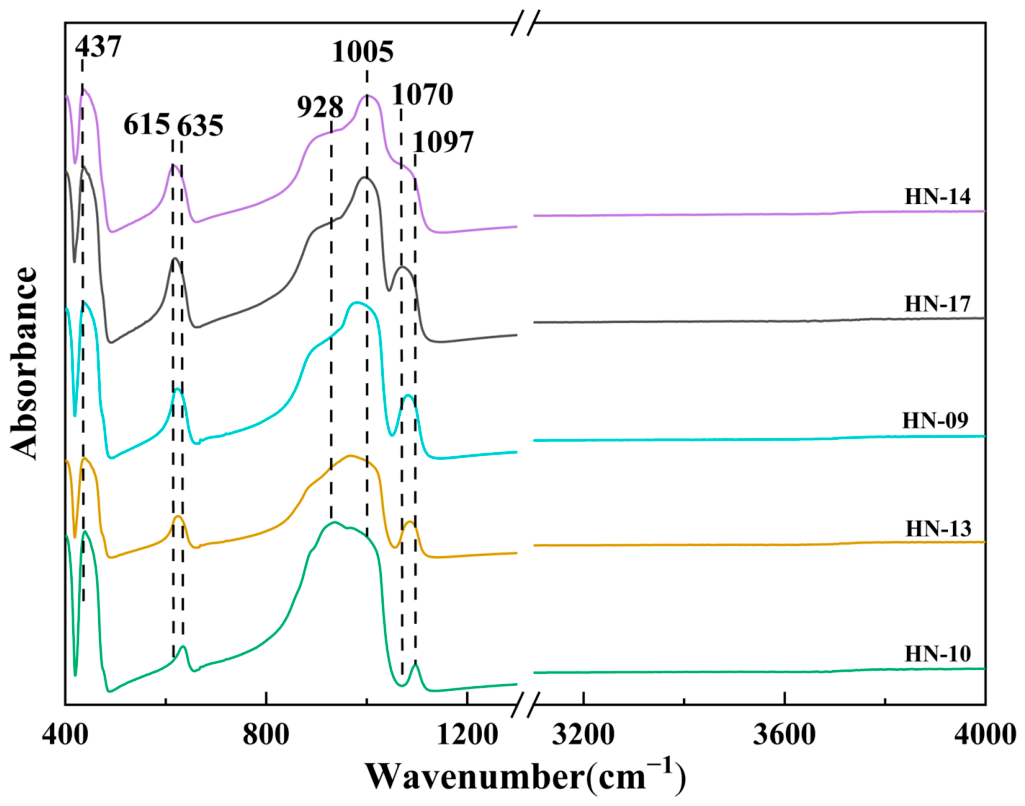
The 400–1200 cm−1 FTIR spectra show features near 437, 615–635, 928 and 1005 cm−1 and within 1072–1097 cm−1 (Figure 6, 400–1200 cm−1 segment). The lower-frequency features are consistent with SiO4 bending, whereas the feature near 928 cm−1 is tentatively assigned to Si-O stretching. The feature near 1005 cm−1 cannot be assigned uniquely from the present reflection spectra and permits only a tentative interpretation involving overlapping crystalline zircon vibrations and damage-related Si-O environments [46,47].
Figure 6.
Representative reflection-mode FTIR spectra of zircon samples in the 400–1200 and 3000–4000 cm−1 regions. The broken abscissa separates the lattice-vibration region, with the marked absorption features, from the high-wavenumber region examined for OH-related absorption. The spectra are vertically offset for clarity. No resolvable broad OH-related absorption band is observed at approximately 3300–3600 cm−1.
Relatively sharp features near 437 and 615–635 cm−1 remain visible, and no prominent broad feature centered at 500–530 cm−1 is resolved. Neither the ~928 nor ~1005 cm−1 feature is used alone as a diagnostic of metamictization. The present reflection spectra do not separate crystalline and damage-related contributions or establish a discrete amorphous SiO2 microphase; their structural significance is assessed jointly with Raman and XRD observations.
In the 3000–4000 cm−1 region, spectra of five representative grains (HN-09, HN-10, HN-13, HN-14 and HN-17) are nearly featureless, with no resolvable broad OH-related feature at approximately 3300–3600 cm−1 at the displayed scale (Figure 6, 3000–4000 cm−1 segment). The slight high-wavenumber baseline variation is not treated as a discrete band. Hydrous species in zircon may occur as structurally incorporated OH or in hydrous inclusions [48,49]; therefore, the absence of a resolved broad feature is limited to the measured grains and the displayed spectral scale.
4.3.2. Raman Spectra
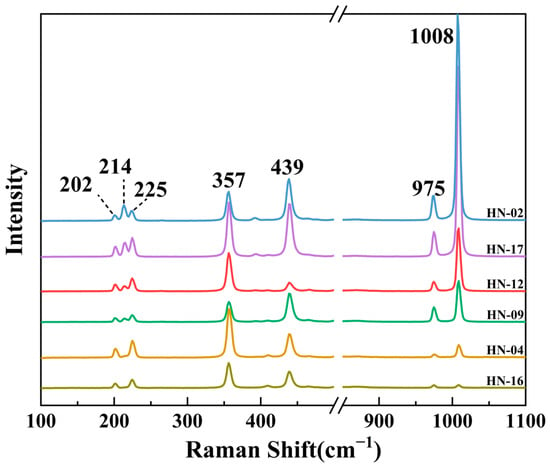
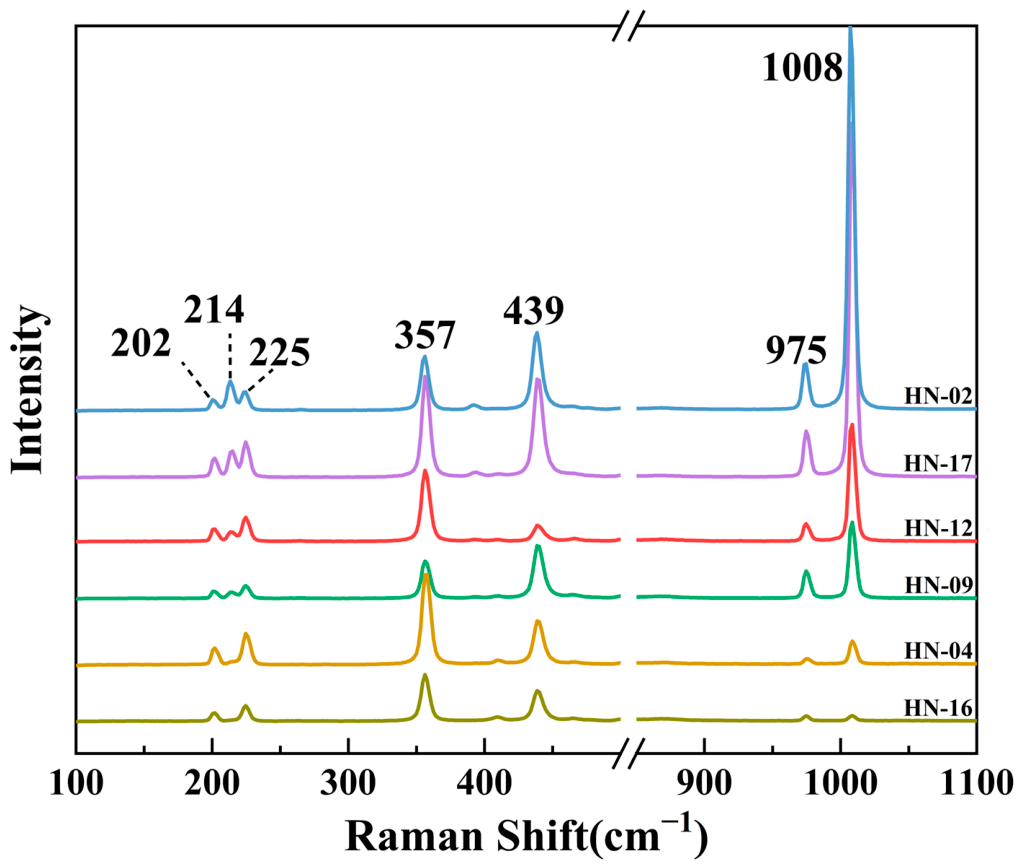
Raman spectra of the Wenchang zircons show several bands between 100 and 1100 cm−1 (Figure 7). The strongest band near 1008 cm−1 is assigned to the ν3 antisymmetric stretching vibration of the SiO4 tetrahedron (B1g mode) and is the most sensitive Raman feature for radiation damage. A shoulder near 975 cm−1 corresponds to the ν1 symmetric stretching vibration of SiO4 (A1g mode). The band near 439 cm−1 is assigned to the ν2 symmetric bending vibration of SiO4 (A1g mode), and the band near 357 cm−1 is related to Zr-O bending deformation (Eg mode). Low-frequency bands at 202–225 cm−1 are attributed to external lattice modes, including translational vibrations of Zr-SiO4 units and rotations of SiO4 tetrahedra.
Figure 7.
Representative Raman spectra of zircon samples in the range of 100–1100 cm−1.
Two Raman spectral types are observed. In spectra represented by sample HN-02, the 1008 cm−1 band is stronger than the 357 cm−1 band; in spectra represented by HN-04, the 357 cm−1 band is stronger than the 1008 cm−1 band. Polarized Raman spectra of oriented zircon likewise show marked variations in the relative intensities of bands near 1005 and 356 cm−1 [50]. These intensity differences are therefore consistent with an orientation effect.
4.4. Spectroscopic Parameters Related to Metamictization
4.4.1. Raman Band Position and FWHM
In general, crystalline zircon exhibits relatively sharp Raman peaks, with high intensities for characteristic bands such as the ν3(SiO4) antisymmetric stretching vibration mode of the Si-O tetrahedra. As the degree of metamictization increases, the Raman peaks of zircon shift toward lower wavenumbers, the spectra gradually become broader and flatter, and the peak intensities progressively decrease. In addition, the full width at half maximum (FWHM) of the peaks increases gradually.
Table 1 presents all 19 valid Raman–Dα paired spot analyses from seven representative zircon grains. Fit-derived 1σ standard errors are available for all 19 paired analyses and range from 0.09 to 0.31 cm−1. For the 16 analyses outside HN-14, the uncertainties range from 0.09 to 0.19 cm−1, with a mean of 0.12 cm−1. The three HN-14 analyses have larger uncertainties of 0.19–0.31 cm−1, with a mean of 0.26 cm−1. At the reported precision, ν3(SiO4) band positions range from 1008.6 to 1009.8 cm−1, with a mean of 1009.3 cm−1. Corrected FWHM values range from 5.3 to 5.8 cm−1, with a mean of 5.5 cm−1. These summaries refer specifically to the paired dataset. Published Raman classifications place corrected ν3(SiO4) FWHM values at approximately 5–10 cm−1 for crystalline-to-slightly metamict zircon, 10–20 cm−1 for metamict zircon, and 20–30 cm−1 for fully metamict zircon, whereas highly metamict, X-ray-amorphous samples may exhibit values above 30 cm−1 and up to approximately 30–55 cm−1 [12,20,51]. The corrected FWHM values of the Wenchang zircons (5.3–5.8 cm−1) therefore lie at the lower end of the crystalline-to-slightly metamict interval, consistent with weak metamictization.
Table 1.
Raman spectral parameters (ν3(SiO4) band position and corrected FWHM) and accumulated alpha dose (Dα) for Wenchang zircon samples.
4.4.2. Accumulated Alpha Dose
The alpha dose, Dα, for each analytical spot was calculated from the U and Th contents and U-Pb ages of the samples using Equation (1) [21,22]. Dα is expressed in α/mg. The calculation formula is given as follows:
where Cu and CTh represent the U and Th contents, respectively, in ppm; NA is Avogadro’s constant; M238, M235, and M232 are the molar masses of the corresponding isotopes; λ238, λ235, and λ232 are the decay constants; and t denotes the zircon age converted from Ma to years in the exponential terms. The calculated results show that the Dα values of zircon from Wenchang, Hainan range from 0.00065 × 10¹⁵–0.01194 × 10¹⁵ α/mg, indicating an overall low alpha dose (Table 1). This is consistent with the relatively young age of the samples (~3.78 Ma) and their moderate U and Th contents.
4.4.3. Relationships Between Raman Parameters and Dα
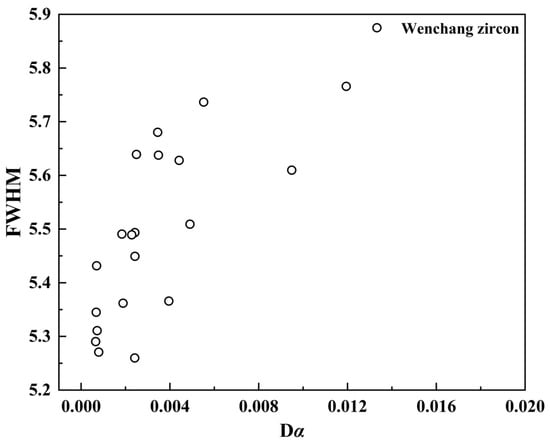
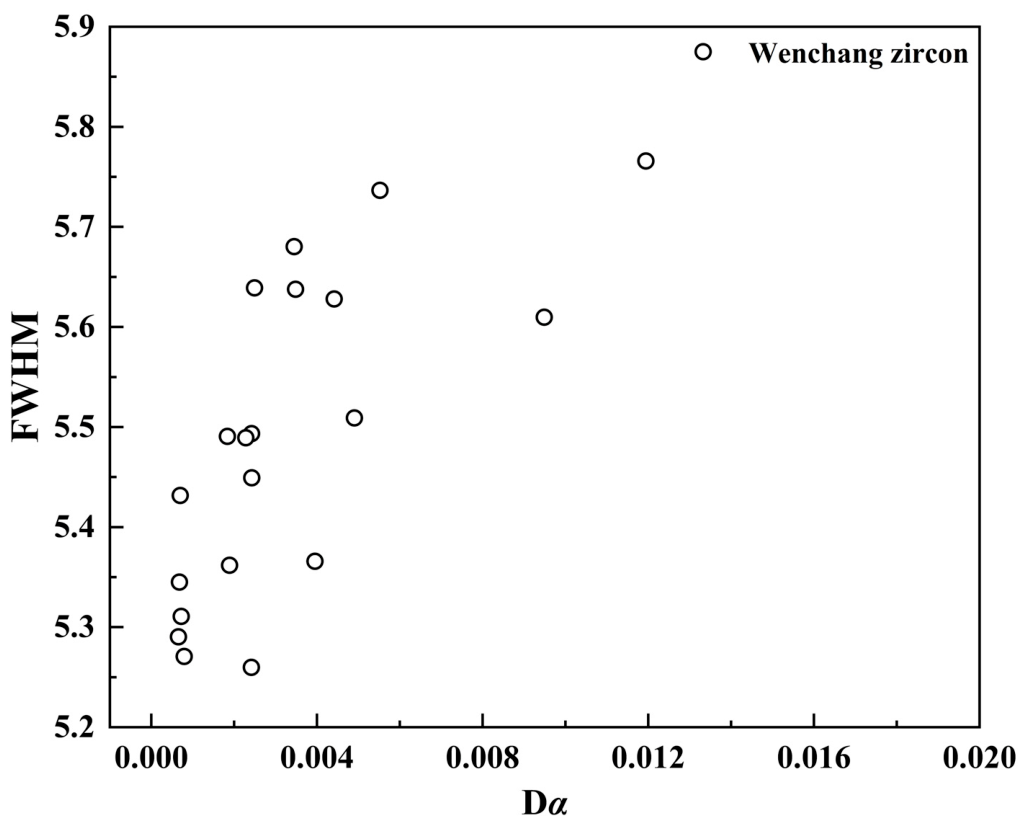
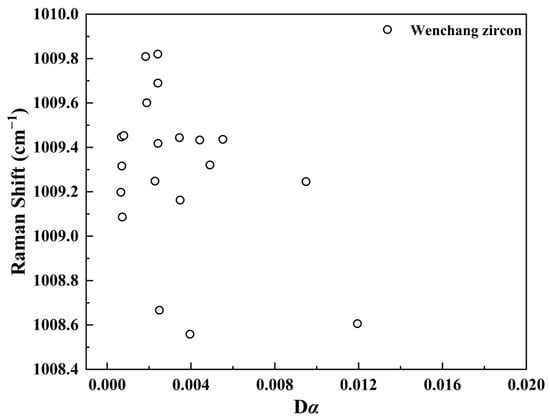
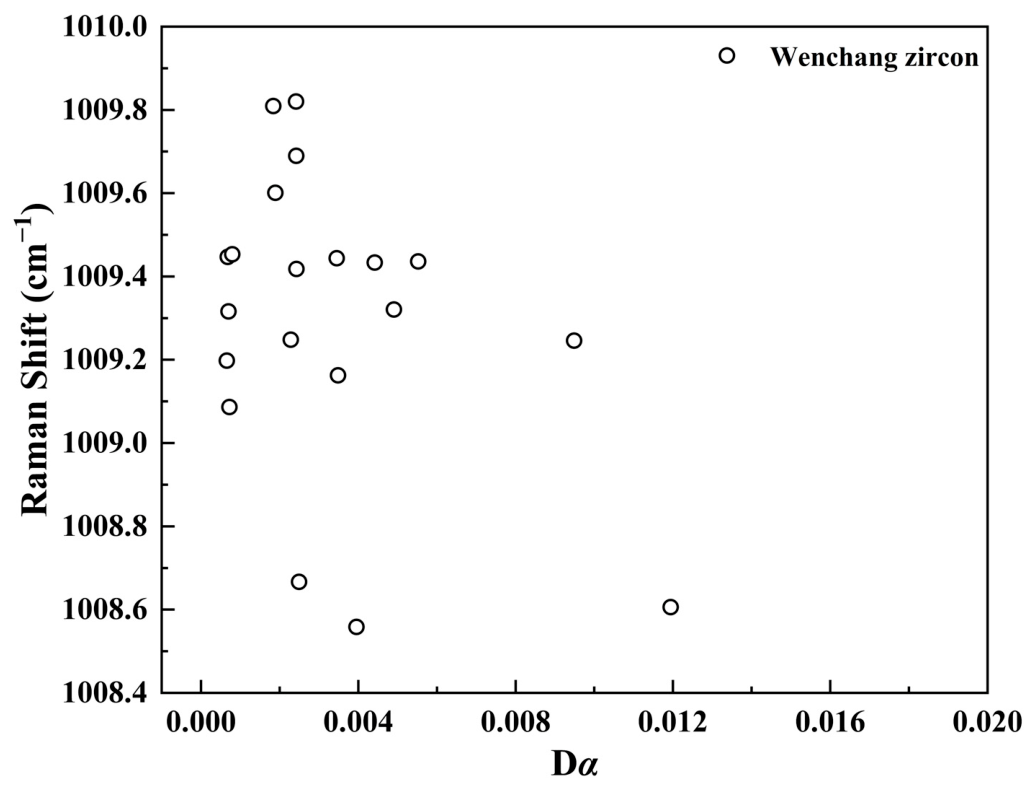
Figure 8 and Figure 9 show the Raman–Dα relationships for the complete paired dataset of 19 spots from seven grains. The following statistics were calculated from the values in Table 1.
Figure 8.
Relationship between corrected ν3(SiO4) FWHM and accumulated alpha dose, Dα (1015 α/mg), for zircon from Wenchang.
Figure 9.
Relationship between ν3(SiO4) Raman band position and accumulated alpha dose, Dα (1015 α/mg), for zircon from Wenchang.
FWHM is positively associated with Dα (Figure 8): Pearson r = 0.751 (p = 0.00021) and Spearman ρ = 0.654 (p = 0.0024). The positive association is also present when one mean FWHM and one mean Dα are used per grain (seven grain means; Pearson r = 0.947, p = 0.0012). Thus, the observed FWHM-Dα trend is retained in a grain-level sensitivity analysis. Within the measured low-dose dataset, FWHM provides clearer evidence of an association with Dα than band position.
4.5. Powder X-Ray Diffraction Results
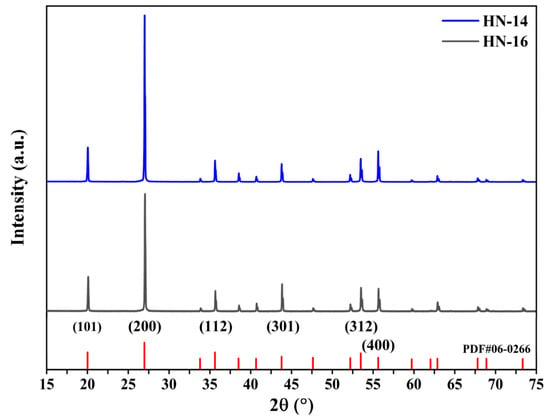
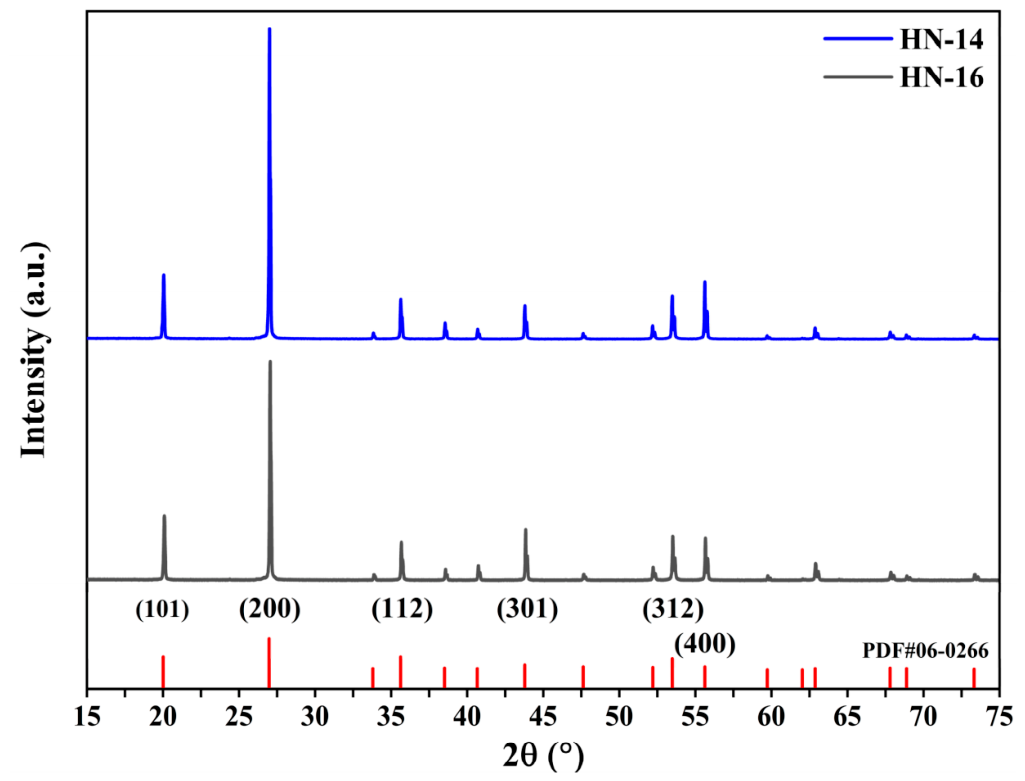
Both unheated representative samples display a series of sharp Bragg reflections consistent with tetragonal zircon, including the (101), (200), (112), (301), (312) and (400) reflections (Figure 10). No conspicuous broad diffuse-scattering halo is evident in the displayed patterns. These observations, consistent with X-ray diffraction studies of crystalline and radiation-damaged zircon [15,16,17,18,52], support retention of long-range crystalline order in both grains.
Figure 10.
XRD patterns of unheated zircon samples HN-14 and HN-16. Red ticks show the zircon reference pattern PDF 06-0266; selected reflections are indexed. The patterns are vertically offset for clarity and are displayed over 15–75° 2θ; the acquisition range was 5–75° 2θ.
The refined parameters are a = b = 6.60810 ± 0.00023 Å, c = 5.98442 ± 0.00080 Å and V = 261.32 Å3 for HN-14, and a = b = 6.60801 ± 0.00061 Å, c = 5.98482 ± 0.00107 Å and V = 261.33 Å3 for HN-16 (Table 2). The quoted uncertainties are the cell-fitting estimated standard deviations. The small differences in a and c are below their combined fitting uncertainties, and the rounded cell volumes differ by only 0.01 Å3. These cell results do not establish a resolved structural difference between the samples.
Table 2.
Cell-refinement parameters and Raman FWHM for the two unheated zircon samples.
Apparent peak widths vary with reflection. The (200) and (400) FWHM values are smaller in HN-14 (0.062° and 0.063° 2θ) than in HN-16 (0.071° and 0.070° 2θ). The opposite relation occurs for (101) and (301): 0.100° and 0.073° in HN-14 versus 0.091° and 0.064° in HN-16. The (312) widths are identical at the reported precision (0.076°).
5. Discussion
5.1. Magmatic Affinity of the Wenchang Zircons
Zircon megacrysts from alluvial deposits in the Huadian area also show magmatic trace-element characteristics, including HREE enrichment, positive Ce anomalies, and Th/U ratios typical of magmatic zircon [8]. The Wenchang zircons share these broad geochemical features, supporting their magmatic affinity. However, these similarities do not establish a common source or demonstrate crystallization from, or transport by, associated basaltic magma.
Trace-element compositions, especially Th/U ratios and REE patterns, can help distinguish broad zircon growth environments, but they do not uniquely identify provenance or host rock [5,7,42,43,44]. The Wenchang zircons have Th/U ratios of 0.42–1.26, all greater than 0.4. This range is consistent with a magmatic affinity and is distinct from many metamorphic zircons, which commonly have Th/U ratios below 0.1 [5,42]. These geochemical features support a magmatic affinity but do not identify the parental melt, primary host, source region, or transport mechanism.
The REE patterns support this interpretation. The chondrite-normalized REE curves are strongly depleted in LREE and enriched in HREE (Figure 4). This reflects the preference of the zircon lattice for HREE ions such as Yb3+ and Lu3+, whose ionic radii are closer to that of Zr4+ than those of LREE [5,7]. Such HREE-enriched patterns are common in magmatic zircon and are consistent with a magmatic affinity.
Positive zircon Ce anomalies reflect coupled crystal-chemical and redox controls, rather than either control in isolation. Relative to trivalent LREE, Ce4+ is readily accommodated at the Zr site [6,45]. Experiments by Burnham and Berry [53] confirm redox-dependent Ce partitioning, while Trail et al. [54] showed that anomaly magnitude also increases with decreasing temperature and varies with melt composition. Thus, a positive anomaly is redox-sensitive, but its presence or magnitude alone does not uniquely determine melt oxygen fugacity.
Smythe and Brenan [55] estimated oxygen fugacity using zircon-melt Ce partitioning together with temperature, melt composition and water content. These constraints are unavailable for the parental melt of the Wenchang megacrysts. Zhong et al. [56] further showed that conventional Ce/Ce* estimates can be unstable when La and Pr are near detection limits or affected by inclusions. Accordingly, the conventional Ce/Ce* values reported here are restricted to analyses with valid positive La, Ce, and Pr concentrations and are treated as descriptive observations rather than quantitative oxygen-fugacity estimates. The HREE-enriched patterns and Th/U ratios support a magmatic affinity, but neither the Ce anomaly nor the near-unity Eu/Eu* values independently establish an oxidized parental melt or a unique degree of plagioclase fractionation [7].
The Wenchang zircon U-Pb age of 3.78 ± 0.10 Ma broadly overlaps late Cenozoic volcanic activity in northern Hainan [1,2]. This temporal association and the magmatic geochemical signatures are consistent with Cenozoic magmatism, but they do not demonstrate that the zircons crystallized from or were entrained and transported by the local basaltic magma. Because the analyzed grains were collected from secondary deposits and cathodoluminescence images, Ti-in-zircon thermometry, in situ Hf-O isotopic data, and zircon-in-rock field relationships are unavailable, the primary host, exact source region, crystallization conditions, parental melt composition, and transport history remain unresolved.
5.2. Raman and XRD Constraints on Metamictization
Geological Meaning of the Raman–Dα Relationships
Zircon metamictization is a cumulative radiation-damage process caused by alpha decay of U and Th in the crystal lattice [12,14,15,16,17,18]. With progressive damage, ordered zircon transforms toward a disordered state, producing systematic changes in physical and spectroscopic properties. Raman spectroscopy is particularly sensitive to this process and has been widely used to evaluate zircon crystallinity and metamictization [12,13,14,15,16,17,18,20,21,22]. A systematic review of shocked zircon further shows that the ν3(SiO4) band position and FWHM are widely used as indicators of structural disorder, although shock-related disorder is not equivalent to accumulated alpha-decay damage [57].
In the measured Wenchang zircon subset, ν3(SiO4) FWHM is positively associated with Dα (Figure 8). In a well-ordered crystal, equivalent structural units vibrate at similar frequencies, producing a narrow Raman band. Radiation-induced defects, atomic displacement and local amorphization can broaden the distribution of vibrational frequencies and increase FWHM [20]. Accordingly, the observed FWHM-Dα association is physically consistent with the accumulation of subtle radiation-related disorder. The fits for all three HN-14 spectra converged successfully, but their relatively low signal-to-noise ratios and weaker constraints on the coupled width and line-shape parameters resulted in larger propagated FWHM uncertainties. These uncertainties therefore indicate reduced fitting precision and do not, by themselves, demonstrate fit failure or greater structural heterogeneity. Because the reported 1σ values quantify peak-fitting precision only, the narrow Dα range limits the relationship to a descriptive, sample-specific trend.
Radiation damage can lower vibrational frequencies through changes in bond lengths and force constants [12]. However, the present band-position data do not show a statistically significant relationship with Dα (Figure 9). A dose-related downshift is therefore not established for these samples, and band position is retained as a complementary observation rather than used as evidence for a systematic radiation-damage trend.
The 19 paired analyses span Dα values of 0.00065–0.01194 × 10¹⁵ α/mg and FWHM values of 5.3–5.8 cm−1. Their positive FWHM-Dα association, which persists for the seven grain means, is consistent with subtle radiation-related structural disorder within this low-dose subset [22]. XRD patterns of unheated HN-14 and HN-16 provide independent evidence for retained long-range crystalline order (Figure 10), complementing the Raman and FTIR observations. Together, these results support well-preserved crystalline structure in the Wenchang zircon samples.
The narrower Raman band in HN-14 than in HN-16 is consistent with lower local structural disorder at the analyzed spots [12,22]. HN-14 also has narrower (200) and (400) XRD peaks, which are compatible with this interpretation. Reflection-dependent annealing behavior and differences between local and long-range order have been documented in zircon [23,24,26]. Taken together, these observations indicate greater local structural order in HN-14 than in HN-16, whereas the XRD data do not resolve a consistent difference in bulk crystallinity between the two grains.
5.3. Mechanism of Heat-Induced Color Modification
5.3.1. Effects of Heat Treatment on Spectroscopic Features
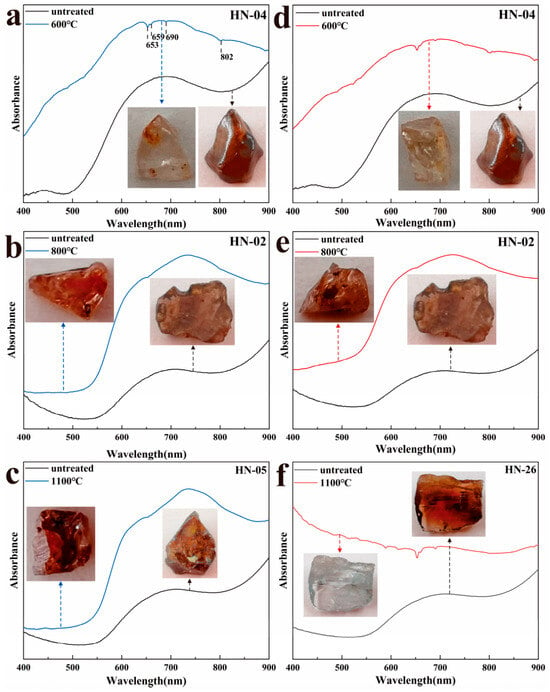
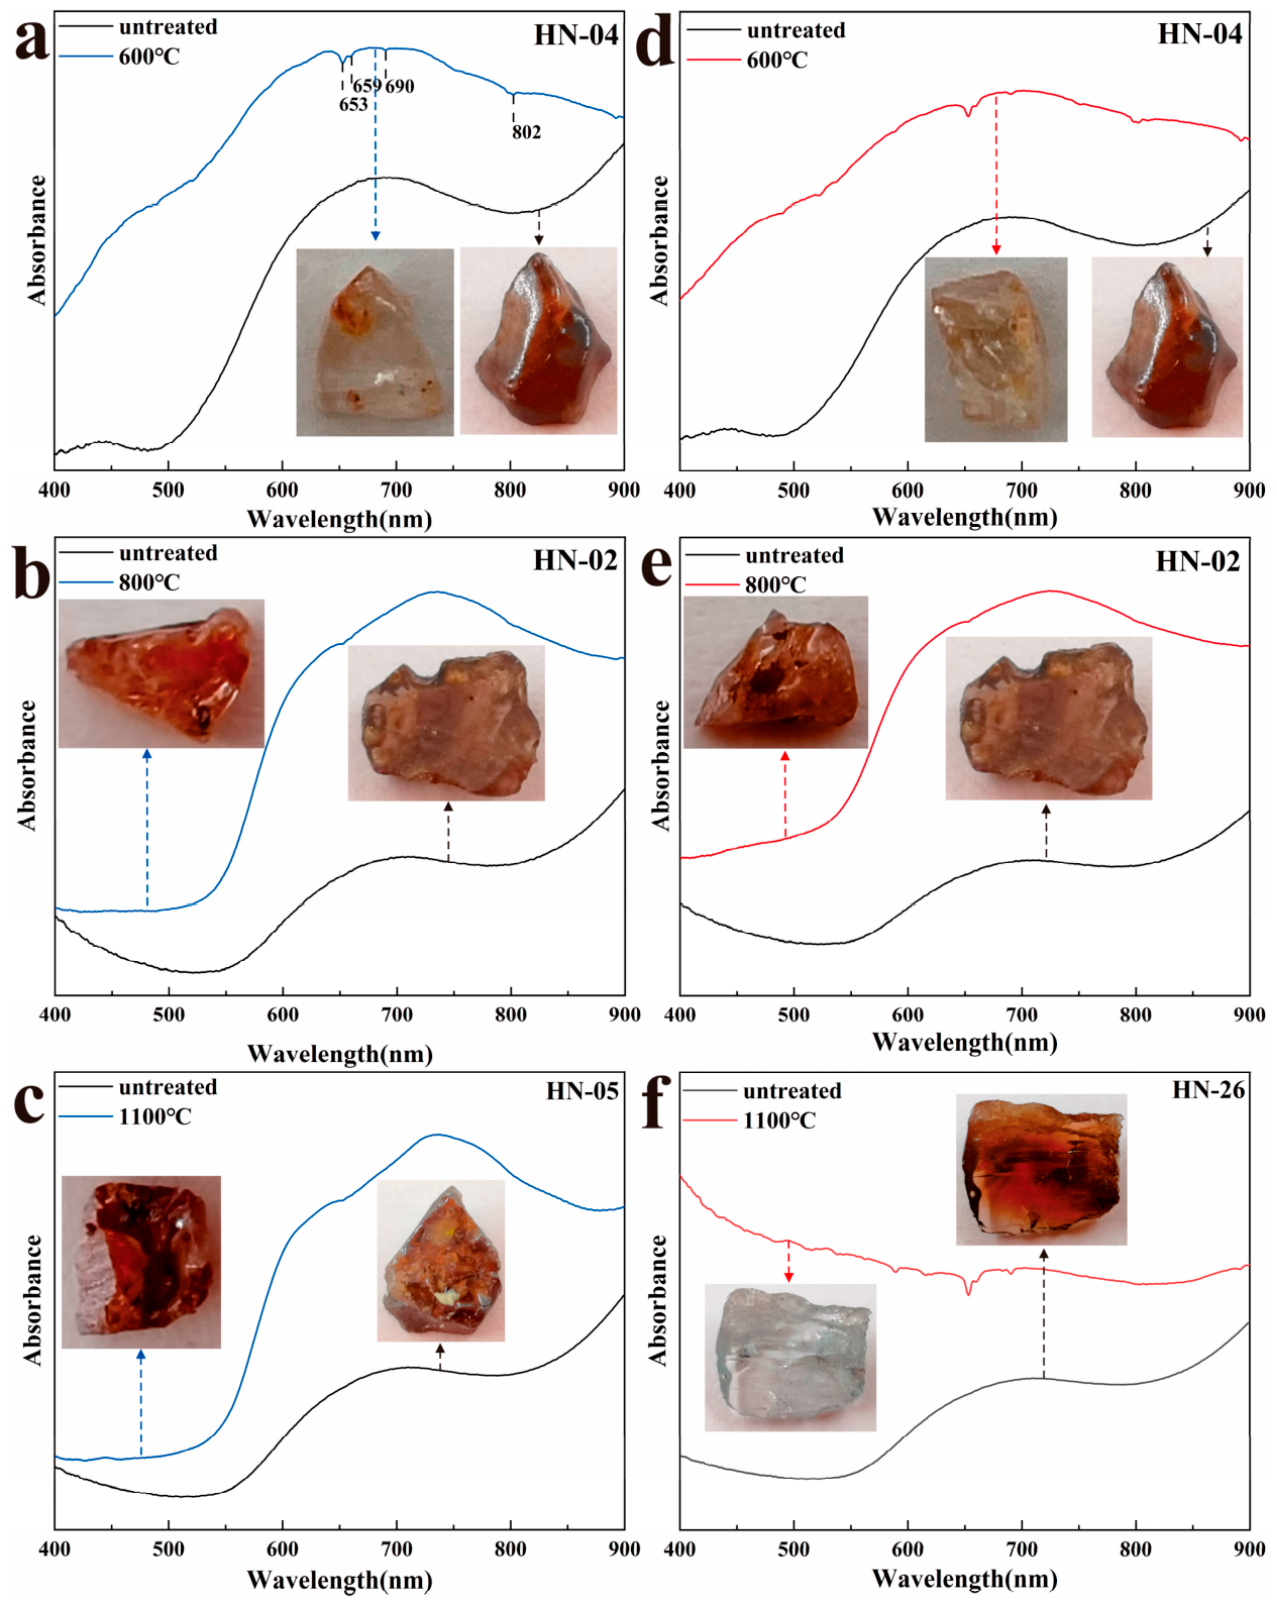
The heat-treatment experiments indicate that zircon from Wenchang, Hainan, underwent pronounced color changes during heating. When heated to 600 °C, the dark-brown samples changed to colorless or reddish-brown varieties, whereas heating to 1100 °C under nitrogen (N2) produced a bluish-gray tone (Figure 11). These visible changes are accompanied by changes in FTIR, Raman and UV-Vis spectra. Before heat treatment, the UV-Vis spectra show a broad absorption band at 450–550 nm. This is the strongest broad feature that consistently weakens as the samples become lighter, so the spectral and color changes are interpreted as associated rather than as proof of a unique microscopic cause. After heating to 600 °C, the band weakens markedly or disappears, while a broad absorption band at 640–675 nm appears, accompanied by absorption peaks near 653, 690 and 802 nm.
Figure 11.
UV-visible absorption spectra of zircon before and after heat treatment at different temperatures under air (left panels, (a–c)) and nitrogen (right panels, (d–f)) atmospheres: (a) untreated vs. heat-treated at 600 °C in air; (b) untreated vs. heat-treated at 800 °C in air; (c) untreated vs. heat-treated at 1100 °C in air; (d) untreated vs. heat-treated at 600 °C in nitrogen; (e) untreated vs. heat-treated at 800 °C in nitrogen; (f) untreated vs. heat-treated at 1100 °C in nitrogen.
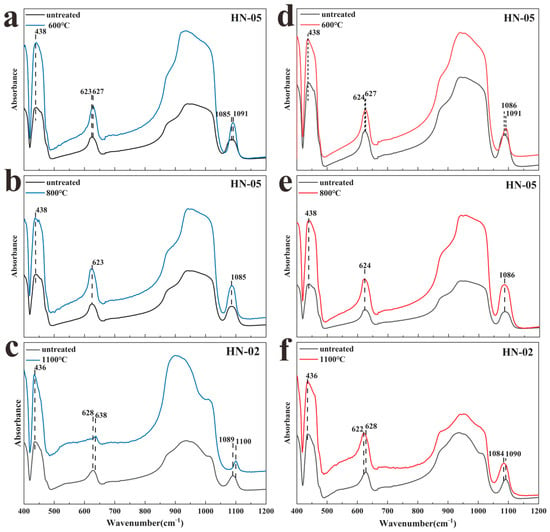
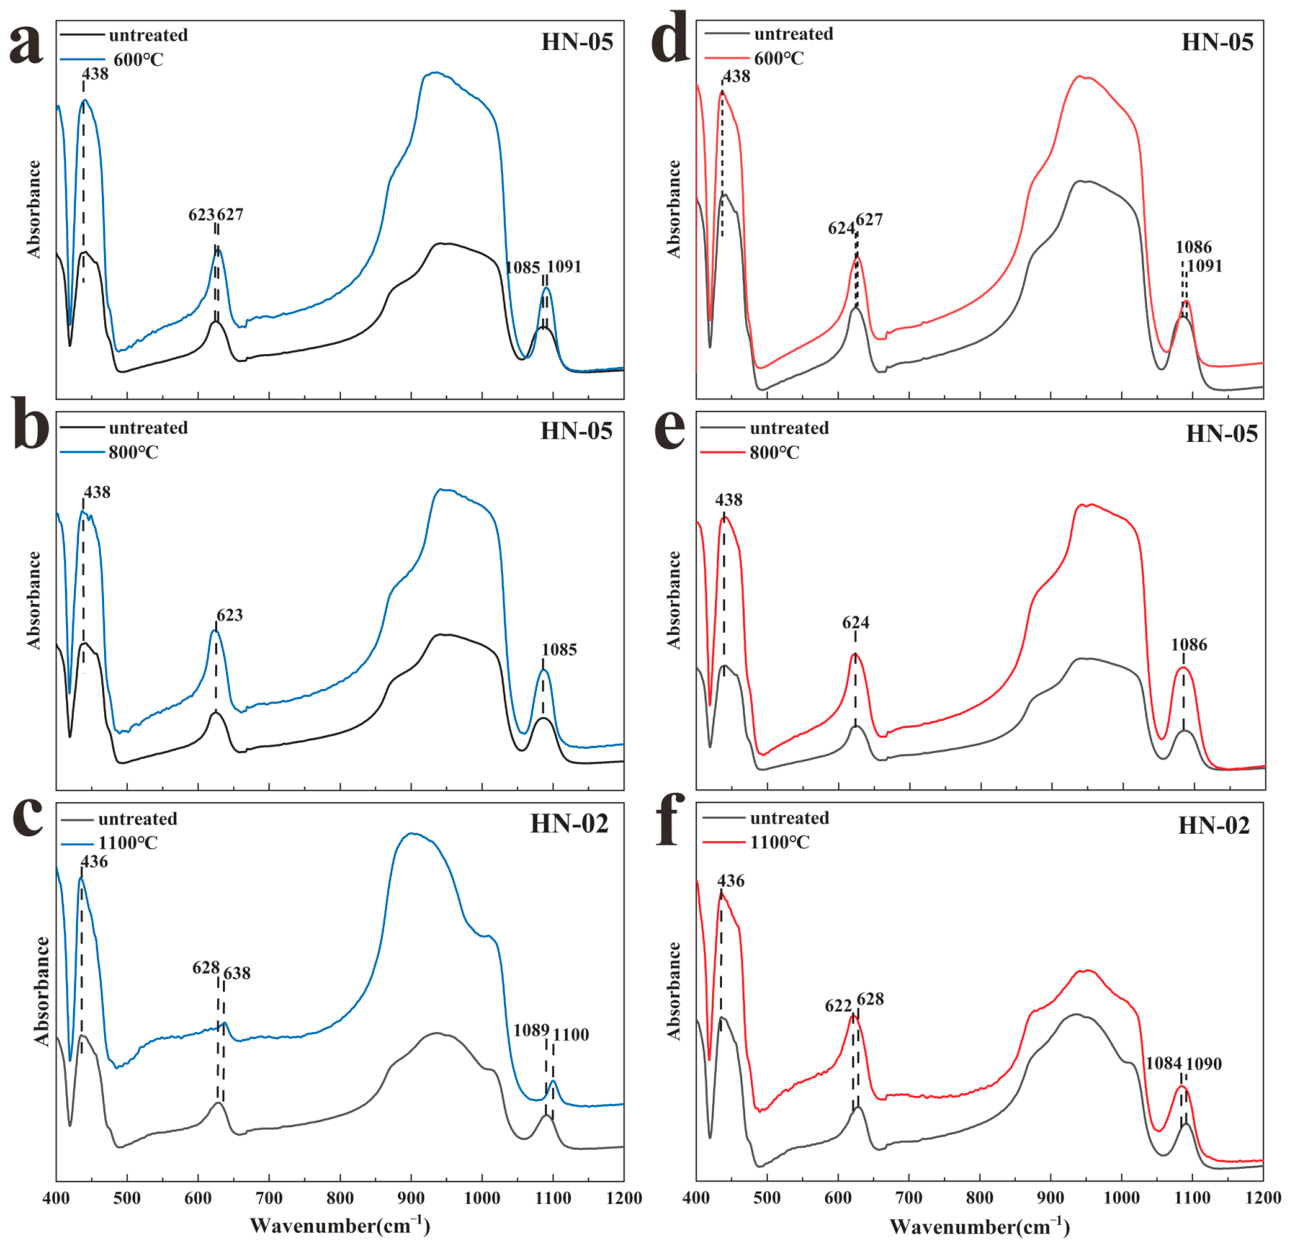
In the FTIR spectra (Figure 12), features near 437 and 950 cm−1 intensify after heating, while the feature near 1090 cm−1 becomes narrower and shifts slightly toward higher wavenumber. These are heat-induced spectral changes, but narrowing of the ~1090 cm−1 feature alone is not a unique measure of crystalline recovery. The Raman changes provide complementary evidence for reduced local disorder.
Figure 12.
Infrared spectra of zircon before and after heat treatment at different temperatures under air (left panels, (a–c)) and nitrogen (right panels, (d–f)) atmospheres: (a) untreated vs. heat-treated at 600 °C in air; (b) untreated vs. heat-treated at 800 °C in air; (c) untreated vs. heat-treated at 1100 °C in air; (d) untreated vs. heat-treated at 600 °C in nitrogen; (e) untreated vs. heat-treated at 800 °C in nitrogen; (f) untreated vs. heat-treated at 1100 °C in nitrogen.
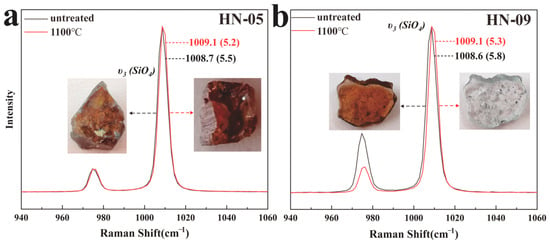
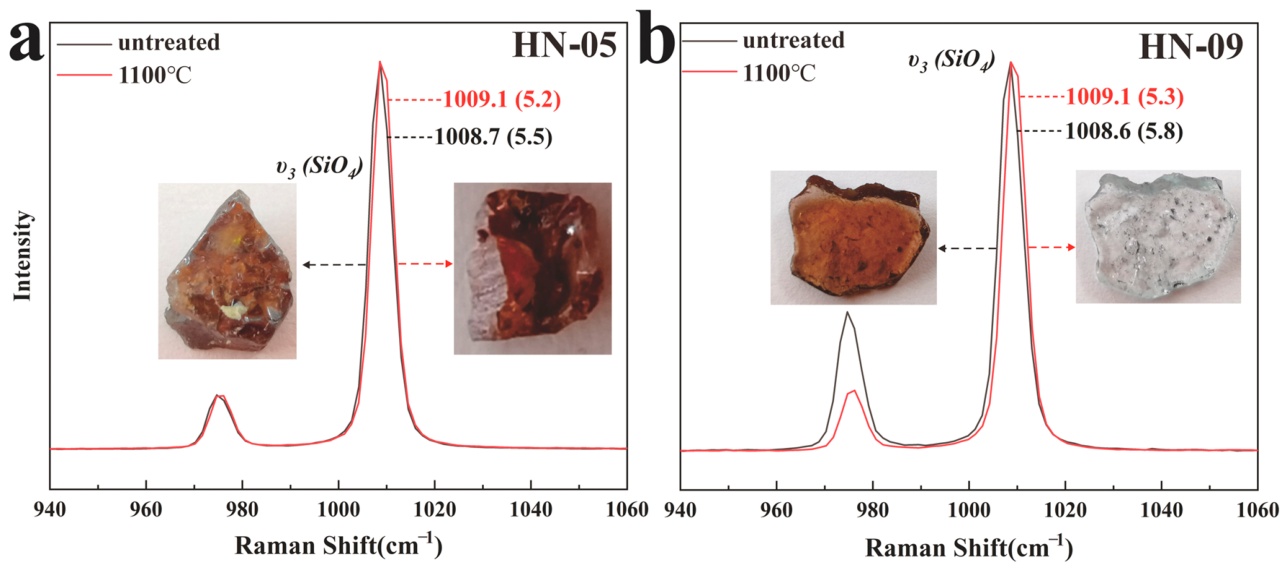
Raman spectra show a shift of the ν3(SiO4) band toward higher wavenumber (from 1008.7 to 1009.1 cm−1) and a decrease in FWHM (from 5.5 to 5.2 cm−1) after heat treatment (Figure 13). This trend is opposite to that associated with radiation damage and is consistent with partial annealing of radiation-related lattice disorder [23,24,25,26]. The decrease in FWHM is likewise consistent with reduced local structural disorder. Zircon inclusions in heated sapphires have similarly been reported to exhibit lower ν3(SiO4)-band FWHM values than those in unheated samples, consistent with partial structural restoration and improved crystalline order during heating [58].
Figure 13.
Raman spectra of zircon before and after heat treatment at 1100 °C under air (a) and nitrogen (b) atmospheres. In each panel, the untreated spectrum is shown in black and the heat-treated spectrum in red.
5.3.2. Coloration Mechanism
Color in zircon is controlled by several mechanisms, including transition-metal ions, REE-related electronic transitions, radiation-induced color centers and heat-treatment-related defect modification [13,27,28]. The 450–550 nm band is emphasized because it is broad and prominent in the untreated brown samples, overlaps the blue-green part of the visible spectrum, and consistently weakens as the samples become colorless or lighter after heating (Figure 11). This covariation supports an association between the band and brown coloration, but UV-Vis spectra alone do not uniquely identify the responsible defect. Radiation-related electron-hole centers are one possible explanation consistent with previous zircon studies [13,28]. Heating to approximately 600 °C may modify defect-related absorption [27,28] while partly annealing local lattice disorder [23,24,25,26].
The broad absorptions near 625 and 660 nm are emphasized because they occur in samples that develop a blue-gray hue after heating at 1100 °C under nitrogen and because absorption in the red region can enhance the complementary blue-gray appearance. This is a spectral association, not a direct identification of the absorbing species. A broad absorption near 640 nm has been associated with blue heat-treated zircon, but its chromophore remains disputed; uranium-related electronic transitions are one proposed contribution [59,60]. The present bands cannot be assigned uniquely and no direct valence-state measurements (e.g., XANES, EPR, or XPS) were carried out here. Uranium-related centers or changes in U valence therefore remain hypotheses rather than demonstrated causes.
The blue-gray color occurs under nitrogen but is absent in samples heated in air, demonstrating an atmosphere-dependent response. Relative to air, the nitrogen treatment provides a lower-oxygen environment, but oxygen fugacity and U valence were not measured. Some samples retain a reddish-brown hue after heating, and their UV-Vis spectra show that the 450–550 nm absorption is reduced but not fully removed. Contributions from REE-related transitions and incompletely modified defect absorptions remain possible.
Overall, the color changes are associated with multiple spectral responses. The weakening of the 450–550 nm band coincides with bleaching of brown samples, whereas the appearance of broad red-region absorption near 625 and 660 nm coincides with blue-gray coloration after nitrogen treatment. The present data document these covariations but do not uniquely determine the atomic-scale defects or uranium valence states responsible for them.
6. Conclusions
- (1)
- The Wenchang zircons show magmatic trace-element characteristics, including enrichment in HREE, positive Ce anomalies, Eu/Eu* values close to unity, and Th/U ratios greater than 0.4. Their weighted mean 206Pb/238U age of 3.78 ± 0.10 Ma (1σ) broadly overlaps late Cenozoic basaltic activity in northern Hainan. Together, these results establish a Pliocene U-Pb age and support a magmatic affinity for the studied Wenchang zircons.
- (2)
- In the analyzed subset, corrected ν3(SiO4) FWHM shows an overall increasing trend with accumulated alpha dose, whereas Raman band position shows no statistically significant dose-related trend. The mean corrected Raman FWHM of 5.5 cm−1 and sharp XRD reflections of unheated HN-14 and HN-16 support retained crystalline order and weak metamictization in the representative samples. Within the measured low-dose range, Raman FWHM therefore provides clearer evidence of subtle local structural disorder than Raman band position.
- (3)
- Heat treatment modifies both the color and structural state of the Wenchang zircons. Heating at approximately 600 °C weakens the 450–550 nm absorption band as the brown samples become lighter. In the 1100 °C experiments, Raman band narrowing is consistent with reduced local structural disorder. Under nitrogen at 1100 °C, some samples develop a blue-gray hue accompanied by broad red-region absorption near 625 and 660 nm. Together, these results indicate that the spectral changes associated with heat-induced zircon color modification vary with temperature and atmospheric conditions.
Supplementary Materials
The following supporting information can be downloaded at: https://www.mdpi.com/article/10.3390/min16111091/s1. Supplementary Table S1. Electron probe microanalysis (EPMA) results of zircon samples from Wenchang, Hainan (wt%). Supplementary Table S2. LA-ICP-MS U-Pb isotopic data for zircon samples from Wenchang, Hainan. Supplementary Table S3. LA-ICP-MS trace-element and rare-earth-element concentrations of zircon samples from Wenchang, Hainan (ppm). Supplementary Table S4. Reference-material measurements and quality-control results for LA-ICP-MS U-Pb dating and trace-element analysis.
Author Contributions
Conceptualization, Y.S., S.H. and Y.L.; methodology, S.H. and Y.L.; formal analysis, S.H. and Y.L.; investigation, S.H. and H.S.; project administration, Y.L.; validation, Y.L.; visualization, S.H. and Y.L.; writing—original draft, S.H.; writing—review and editing, Y.L.; funding acquisition Y.D. and Y.L. All authors have read and agreed to the published version of the manuscript.
Funding
This research was funded by the National Natural Science Foundation of China (42103034); the Science and Technology Fund Project of Hebei University of Geosciences (KAZ202214); and the Opening Foundation of Key Laboratory of Mineralization and Exploration of the Upper Yellow River (YSMRKF202404).
Data Availability Statement
The authors confirm that the data supporting the findings of this study are available within the article.
Acknowledgments
We are grateful for the insightful suggestions from the anonymous reviewers, which greatly improved our manuscript.
Conflicts of Interest
The authors declare no conflicts of interest.
References
- Wei, F.; Wei, W.; Yu, H. The Cenozoic volcanic fields in northern Hainan Island and the Leizhou Peninsula, South China: Eruption history, magma source and dynamic background. Geol. Soc. Lond. Spec. Publ. 2021, 510, 179–196. [Google Scholar] [CrossRef] [Scilit]
- Chen, S.S.; Wu, D.Y.; Gao, R.; Cheng, Q.; Liu, J.Q. In-situ Sr isotope disequilibrium in plagioclases from Late Cenozoic basalts in Leiqiong area: Evidence for the role of the Hainan plume and mantle metasomatism due to a paleo-subduction event. Front. Earth Sci. 2023, 11, 1090803. [Google Scholar] [CrossRef] [Scilit]
- Finch, R.J.; Hanchar, J.M. Structure and chemistry of zircon and zircon-group minerals. Rev. Mineral. Geochem. 2003, 53, 1–25. [Google Scholar] [CrossRef] [Scilit]
- Cherniak, D.J.; Watson, E.B. Pb diffusion in zircon. Chem. Geol. 2001, 172, 5–24. [Google Scholar] [CrossRef] [Scilit]
- Hoskin, P.W.O.; Schaltegger, U. The composition of zircon and igneous and metamorphic petrogenesis. Rev. Mineral. Geochem. 2003, 53, 27–62. [Google Scholar] [CrossRef] [Scilit]
- Ballard, J.R.; Palin, M.J.; Campbell, I.H. Relative oxidation states of magmas inferred from Ce(IV)/Ce(III) in zircon: Application to porphyry copper deposits of northern Chile. Contrib. Mineral. Petrol. 2002, 144, 347–364. [Google Scholar] [CrossRef] [Scilit]
- Burnham, A.D. Key concepts in interpreting the concentrations of the rare earth elements in zircon. Chem. Geol. 2020, 551, 119765. [Google Scholar] [CrossRef] [Scilit]
- Sun, H.; Pan, S.; Qin, H.; Liu, Y.; Wu, X. Age and geochemistry of zircon megacrysts from alluvial deposits in the Huadian area, northeastern China. Minerals 2023, 13, 882. [Google Scholar] [CrossRef] [Scilit]
- Bui Thi Sinh, V.; Osanai, Y.; Lenz, C.; Nakano, N.; Adachi, T.; Belousova, E.; Kitano, I. Gem-Quality Zircon Megacrysts from Placer Deposits in the Central Highlands, Vietnam—Potential Source and Links to Cenozoic Alkali Basalts. Minerals 2019, 9, 89. [Google Scholar] [CrossRef] [Scilit]
- Sutherland, L.; Graham, I.; Yaxley, G.; Armstrong, R.; Giuliani, G.; Hoskin, P.; Nechaev, V.; Woodhead, J. Major zircon megacryst suites of the Indo-Pacific lithospheric margin (ZIP) and their petrogenetic and regional implications. Mineral. Petrol. 2016, 110, 399–420. [Google Scholar] [CrossRef] [Scilit]
- Wang, S.J.; Shao, W.H. Mineralogy of coastal quartz sand: A case study of Wenchang quartz sand in Hainan. Conserv. Util. Miner. Resour. 2019, 39, 58–61. [Google Scholar] [CrossRef]
- Nasdala, L.; Irmer, G.; Wolf, D. The degree of metamictization in zircon: A Raman spectroscopic study. Eur. J. Mineral. 1995, 7, 471–478. [Google Scholar] [CrossRef] [Scilit]
- Nasdala, L.; Zhang, M.; Kempe, U.; Panczer, G.; Gaft, M.; Andrut, M.; Plötze, M. Spectroscopic methods applied to zircon. Rev. Mineral. Geochem. 2003, 53, 427–468. [Google Scholar] [CrossRef] [Scilit]
- Ewing, R.C.; Meldrum, A.; Wang, L.M.; Weber, W.J.; Corrales, L.R. Radiation effects in zircon. Rev. Mineral. Geochem. 2003, 53, 387–425. [Google Scholar] [CrossRef] [Scilit]
- Murakami, T.; Chakoumakos, B.C.; Ewing, R.C.; Lumpkin, G.R.; Weber, W.J. Alpha-decay event damage in zircon. Am. Mineral. 1991, 76, 1510–1532. [Google Scholar]
- Holland, H.D.; Gottfried, D. The effect of nuclear radiation on the structure of zircon. Acta Crystallogr. 1955, 8, 291–300. [Google Scholar] [CrossRef] [Scilit]
- Chakoumakos, B.C.; Murakami, T.; Lumpkin, G.R.; Ewing, R.C. Alpha-decay-induced fracturing in zircon: The transition from the crystalline to the metamict state. Science 1987, 236, 1556–1559. [Google Scholar] [CrossRef] [Scilit] [PubMed]
- Woodhead, J.A.; Rossman, G.R.; Silver, L.T. The metamictization of zircon: Radiation dose-dependent structural characteristics. Am. Mineral. 1991, 76, 74–82. [Google Scholar]
- Huijsmans, J.R.; Hamers, M.; Drury, M.R.; Lee, J.K.W. Recrystallisation and Trace-Element Mobility in Zircons: Implications for U-Pb Dating. Minerals 2022, 12, 1489. [Google Scholar] [CrossRef] [Scilit]
- Zhang, M.; Salje, E.K.H.; Farnan, I.; Graeme-Barber, A.; Daniel, P.; Ewing, R.C.; Clark, A.M.; Leroux, H. Metamictization of zircon: Raman spectroscopic study. J. Phys. Condens. Matter 2000, 12, 1915–1925. [Google Scholar] [CrossRef] [Scilit]
- Nasdala, L.; Wenzel, M.; Vavra, G.; Irmer, G.; Wenzel, T.; Kober, B. Metamictisation of natural zircon: Accumulation versus thermal annealing of radioactivity-induced damage. Contrib. Mineral. Petrol. 2001, 141, 125–144 . [Google Scholar] [CrossRef] [Scilit]
- Su, K.; Zhang, S.B.; Hanchar, J.M.; Li, Z.X.; Sun, F.Y.; Liang, T.; Gao, X.Y. Quantification of radiation damage in natural and synthetic zircon by Raman spectroscopy: Application to low-temperature thermochronology. Acta Geochim. 2023, 42, 673–688. [Google Scholar] [CrossRef] [Scilit]
- Colombo, M.; Chrosch, J. Annealing of natural metamict zircons. I low degree of radiation damage. Radiat. Phys. Chem. 1998, 53, 555–561. [Google Scholar] [CrossRef] [Scilit]
- Colombo, M.; Chrosch, J.; Salje, E.K.H. Annealing metamict zircon: A powder X-ray diffraction study of a highly defective phase. J. Am. Ceram. Soc. 1999, 82, 2711–2716. [Google Scholar] [CrossRef] [Scilit]
- Nasdala, L.; Lengauer, C.L.; Hanchar, J.M.; Kronz, A.; Wirth, R.; Blanc, P.; Kennedy, A.K.; Seydoux-Guillaume, A.-M. Annealing radiation damage and the recovery of cathodoluminescence. Chem. Geol. 2002, 191, 121–140. [Google Scholar] [CrossRef] [Scilit]
- Geisler, T.; Pidgeon, R.T.; Van Bronswijk, W.; Pleysier, R. Kinetics of thermal recovery and recrystallization of partially metamict zircon: A Raman spectroscopic study. Eur. J. Mineral. 2001, 13, 1163–1176. [Google Scholar] [CrossRef] [Scilit]
- Xiao, Q.; Guo, Y. The effect of heat treatment on zircon color and its enhancement mechanism. Spectrochim. Acta Part A Mol. Biomol. Spectrosc. 2024, 322, 124795. [Google Scholar] [CrossRef] [Scilit] [PubMed]
- Klinger, M.; Kempe, U.; Pöpl, A.; Böttcher, R.; Trinkler, M. Paramagnetic hole centres in natural zircon and zircon colouration. Eur. J. Mineral. 2012, 24, 1005–1016. [Google Scholar] [CrossRef] [Scilit]
- Lu, H.; Lei, J.; Zhao, D.; Xu, Y.-G.; Sun, C.; Hu, X. Pn anisotropic tomography of Hainan Island and surrounding areas: New insights into the Hainan mantle plume. J. Geophys. Res. Solid Earth 2022, 127, e2021JB023609. [Google Scholar] [CrossRef] [Scilit]
- Hu, Y.; Hao, M.; Ji, L.; Song, S. Three-dimensional crustal movement and the activities of earthquakes, volcanoes and faults in Hainan Island, China. Geod. Geodyn. 2016, 7, 284–294. [Google Scholar] [CrossRef] [Scilit]
- Huang, X.; Chen, Z.; Zhong, S. Geological characteristics of volcanic rocks in Penglai area, Hainan and their relationship with sapphire deposit formation. Geol. Miner. Resour. South China 1997, 3, 39–45. [Google Scholar]
- McDonough, W.F.; Sun, S.-S. The composition of the Earth. Chem. Geol. 1995, 120, 223–253. [Google Scholar] [CrossRef] [Scilit]
- Liu, Y.S.; Hu, Z.C.; Gao, S.; Günther, D.; Xu, J.; Gao, C.G.; Chen, H.H. In situ analysis of major and trace elements of anhydrous minerals by LA-ICP-MS without applying an internal standard. Chem. Geol. 2008, 257, 34–43. [Google Scholar] [CrossRef] [Scilit]
- Liu, Y.S.; Hu, Z.C.; Zong, K.Q.; Gao, C.G.; Gao, S.; Xu, J.; Chen, H.H. Reappraisement and refinement of zircon U-Pb isotope and trace element analyses by LA-ICP-MS. Chin. Sci. Bull. 2010, 55, 1535–1546. [Google Scholar] [CrossRef] [Scilit]
- Paton, C.; Woodhead, J.D.; Hellstrom, J.C.; Hergt, J.M.; Greig, A.; Maas, R. Improved laser ablation U-Pb zircon geochronology through robust downhole fractionation correction. Geochem. Geophys. Geosyst. 2010, 11, Q0AA06. [Google Scholar] [CrossRef] [Scilit]
- Wiedenbeck, M.; Allé, P.; Corfu, F.; Griffin, W.L.; Meier, M.; Oberli, F.; Von Quadt, A.; Roddick, J.C.; Spiegel, W. Three natural zircon standards for U–Th–Pb, Lu–Hf, trace element and REE analyses. Geostand. Newsl. 1995, 19, 1–23. [Google Scholar] [CrossRef] [Scilit]
- Jackson, S.E.; Pearson, N.J.; Griffin, W.L.; Belousova, E.A. The application of laser ablation-inductively coupled plasma-mass spectrometry to in situ U–Pb zircon geochronology. Chem. Geol. 2004, 211, 47–69. [Google Scholar] [CrossRef] [Scilit]
- Horstwood, M.S.A.; Košler, J.; Gehrels, G.; Jackson, S.E.; McLean, N.M.; Paton, C.; Pearson, N.J.; Sircombe, K.; Sylvester, P.; Vermeesch, P.; et al. Community-derived standards for LA-ICP-MS U-(Th-)Pb geochronology: Uncertainty propagation, age interpretation and data reporting. Geostand. Geoanal. Res. 2016, 40, 311–332. [Google Scholar] [CrossRef] [Scilit]
- Ludwig, K.R. User’s Manual for Isoplot/Ex, Version 3.00: A Geochronological Toolkit for Microsoft Excel; Berkeley Geochronology Center Special Publication No. 4; Berkeley Geochronology Center: Berkeley, CA, USA, 2003. [Google Scholar]
- Irmer, G. Zum Einfluss der Apparatefunktion auf die Bestimmung von Streuquerschnitten und Lebensdauern aus optischen Phononenspektren. Exp. Tech. Phys. 1985, 33, 501–506. [Google Scholar]
- Standard’s SRM; 640f. National Institute of Standards and Technology (NIST): Gaithersburg, MD, USA, 2019.
- Belousova, E.A.; Griffin, W.L.; O’Reilly, S.Y.; Fisher, N.I. Igneous zircon: Trace element composition as an indicator of source rock type. Contrib. Mineral. Petrol. 2002, 143, 602–622. [Google Scholar] [CrossRef] [Scilit]
- Hoskin, P.W.O.; Ireland, T.R. Rare earth element chemistry of zircon and its use as a provenance indicator. Geology 2000, 28, 627–630. [Google Scholar] [CrossRef] [Scilit]
- Rubatto, D. Zircon trace element geochemistry: Partitioning with garnet and the link between U-Pb ages and metamorphism. Chem. Geol. 2002, 184, 123–138. [Google Scholar] [CrossRef] [Scilit]
- Xu, Y.; Miller, C.F.; Claiborne, L.L. Estimating Ce4+ and Ce3+ concentrations in zircon and coexisting melts, with implications for constraining oxygen fugacity. Chem. Geol. 2024, 663, 122283. [Google Scholar] [CrossRef] [Scilit]
- Zhang, M.; Salje, E.K.H. Infrared spectroscopic analysis of zircon: Radiation damage and the metamict state. J. Phys. Condens. Matter 2001, 13, 3057–3071. [Google Scholar] [CrossRef] [Scilit]
- Gucsik, A.; Zhang, M.; Koeberl, C.; Salje, E.K.H.; Redfern, S.A.T.; Pruneda, J.M. Infrared and Raman spectra of ZrSiO4 experimentally shocked at high pressures. Mineral. Mag. 2004, 68, 801–811. [Google Scholar] [CrossRef] [Scilit]
- Woodhead, J.A.; Rossman, G.R.; Thomas, A.P. Hydrous species in zircon. Am. Mineral. 1991, 76, 1533–1546. [Google Scholar]
- Aines, R.D.; Rossman, G.R. Relationships between radiation damage and trace water in zircon, quartz, and topaz. Am. Mineral. 1986, 71, 1186–1193. [Google Scholar]
- Chen, T.; Ai, H.; Yang, M.; Zheng, S.; Liu, Y. Brownish red zircon from Muling, China. Gems Gemol. 2011, 47, 36–41. [Google Scholar] [CrossRef] [Scilit]
- Resentini, A.; Andò, S.; Garzanti, E.; Malusà, M.G.; Pastore, G.; Vermeesch, P.; Chanvry, E.; Dall’Asta, M. Zircon as a provenance tracer: Coupling Raman spectroscopy and U–Pb geochronology in source-to-sink studies. Chem. Geol. 2020, 555, 119828. [Google Scholar] [CrossRef] [Scilit]
- Zaman, M.M.; Antao, S.M. Crystal chemistry and structural variations for zircon samples from various localities. Minerals 2020, 10, 947. [Google Scholar] [CrossRef] [Scilit]
- Burnham, A.D.; Berry, A.J. An experimental study of trace element partitioning between zircon and melt as a function of oxygen fugacity. Geochim. Cosmochim. Acta 2012, 95, 196–212. [Google Scholar] [CrossRef] [Scilit]
- Trail, D.; Watson, E.B.; Tailby, N.D. Ce and Eu anomalies in zircon as proxies for the oxidation state of magmas. Geochim. Cosmochim. Acta 2012, 97, 70–87. [Google Scholar] [CrossRef] [Scilit]
- Smythe, D.J.; Brenan, J.M. Magmatic oxygen fugacity estimated using zircon-melt partitioning of cerium. Earth Planet. Sci. Lett. 2016, 453, 260–266. [Google Scholar] [CrossRef] [Scilit]
- Zhong, S.; Seltmann, R.; Qu, H.; Song, Y. Characterization of the zircon Ce anomaly for estimation of oxidation state of magmas: A revised Ce/Ce* method. Mineral. Petrol. 2019, 113, 755–763. [Google Scholar] [CrossRef] [Scilit]
- Zamyatin, D.A. Application of Raman Spectroscopy for Studying Shocked Zircon from Terrestrial and Lunar Impactites: A Systematic Review. Minerals 2022, 12, 969. [Google Scholar] [CrossRef] [Scilit]
- Karampelas, S.; Hennebois, U.; Mevellec, J.-Y.; Pardieu, V.; Delaunay, A.; Fritsch, E. Pink to Purple Sapphires from Ilakaka, Madagascar: Insights to Separate Unheated from Heated Samples. Minerals 2023, 13, 704. [Google Scholar] [CrossRef] [Scilit]
- Mackey, D.J.; Runciman, W.A.; Vance, E.R. Crystal-field calculations for energy levels of U4+ in ZrSiO4. Phys. Rev. B 1975, 11, 211–218. [Google Scholar] [CrossRef] [Scilit]
- Sun, Y.; Schmitt, A.K.; Häger, T.; Schneider, M.; Pappalardo, L.; Russo, M. Natural blue zircon from Vesuvius. Mineral. Petrol. 2021, 115, 21–36. [Google Scholar] [CrossRef] [Scilit]

Disclaimer/Publisher’s Note: The statements, opinions and data contained in all publications are solely those of the individual author(s) and contributor(s) and not of MDPI and/or the editor(s). MDPI and/or the editor(s) disclaim responsibility for any injury to people or property resulting from any ideas, methods, instructions or products referred to in the content. |
© 2026 by the authors. Licensee MDPI, Basel, Switzerland. This article is an open access article distributed under the terms and conditions of the Creative Commons Attribution (CC BY) license.