


Abstract
Artificial intelligence (AI) is increasingly applied to image-based and image-formatted geoscientific evidence across mineral exploration, from regional and surface surveys to drilling/core analysis and laboratory characterization. However, the literature remains distributed across different research communities, making it difficult to compare how visual evidence, AI tasks, methodological choices, and geological outputs relate across exploration contexts. This systematic mapping review searched the Web of Science Core Collection, Scopus, and IEEE Xplore for English-language journal articles published between 2016 and 2026. Of 397 identified records, 91 studies were retained after deduplication, screening, and full-text assessment. The studies were mapped across exploration contexts, visual-data domains, AI visual tasks, methodological paradigms, and geological outputs. Regional and surface survey data dominate the evidence base, while drilling/core and laboratory imaging remain less represented. Classification is the most frequent visual task, and CNN-based models remain the dominant methodological paradigm, with hybrid and emerging architectures forming the next major group. The evidence does not indicate a single architecture that is uniformly suitable across mineral-exploration settings; model choice depends on input structure, required geological output, labeled-data availability, and spatial scale. Multisource integration can combine complementary evidence, but differences in spatial support, annotation, sensing conditions, and validation design continue to limit direct comparison and cross-region generalization. Future progress requires more traceable public resources, geographically independent validation, and more systematic integration of complementary geological evidence.
1. Introduction
Mineral exploration combines evidence collected during regional mapping, drilling, laboratory analysis, and target evaluation [1,2,3]. As exploration extends into covered or structurally complex terrain and deeper concealed deposits, interpretation increasingly depends on several forms of evidence rather than on a single survey product. Remote-sensing observations may need to be considered together with geological, geo-chemical, geophysical, drilling, and laboratory information [4,5,6]. This increases the volume of material requiring interpretation and also makes consistency difficult to maintain when the workflow depends mainly on specialist judgment. Machine learning has consequently been used for geological information extraction, anomaly recognition, and mineral prospectivity analysis. Deep-learning models reduce part of the dependence on manually designed features by learning representations from the input data [7,8].
The visual component of this evidence is not confined to satellite imagery. Regional studies use multispectral and hyperspectral images, UAV observations, LiDAR point clouds, and digital-outcrop models. Drill-core photographs, HyLogger scans, thin-section micrographs, SEM images, Raman maps, and micro-CT volumes describe geological materials at progressively finer scales [9,10,11,12]. These data differ not only in resolution, but also in geometry, spectral content, and acquisition conditions, which limits the use of a single analytical workflow across all of them. Field-oriented applications have also appeared, including smartphone-based rock recognition [13]. The associated methods remain diverse: conventional machine learning is still used, while CNNs, Transformers, graph-based models, and hybrid architectures are applied where the data require more complex spatial or spectral representation. Vision Transformers have been examined for lithological image classification [14], and unsupervised segmentation has been used in settings where dense geological annotation is difficult to obtain [15].
However, these studies are usually discussed within separate research communities. Remote-sensing studies tend to emphasize regional mapping, drill-core studies focus on subsurface classification and logging, and petrological or digital-rock studies examine minerals and microstructures at much finer scales. As a result, it is often difficult to trace how a particular data source is translated into a visual task, how that task shapes the choice of model, and what type of geological evidence the model ultimately produces. Figure 1 therefore organizes the reviewed literature across five complementary dimensions: exploration context, visual data, AI task, learning method, and geological output.
Figure 1.
Conceptual overview of exploration contexts, visual data sources, AI vision tasks, learning paradigms, and geological outputs covered in this review.
Figure 1 provides an overview of the principal dimensions covered in this review. These dimensions are not intended to represent fixed one-to-one pathways; rather, they define the broader application space within which different combinations occur across the literature. Their specific relationships and recurring combinations are examined in the subsequent data, task, and method-oriented sections.
Previous reviews have examined closely related aspects of this field, but they organize the literature around different research questions. Zeng et al. [7] focused on the translation of machine-learning-based rock and lithology identification into engineering rock-mass characterization, with particular attention to multimodal geological and engineering data. Sudharsan et al. [8] reviewed deep-learning techniques for hyperspectral imaging and explicitly organized hyperspectral analysis around visual tasks such as classification, segmentation, detection, and feature representation. Hajaj et al. [16] concentrated on hyperspectral imagery for lithological mapping and mineral prospecting, including spectral processing, machine-learning techniques, and emerging data-integration strategies. At a broader mineral-exploration scale, Lee and Moon [17] reviewed machine learning, deep learning, and geologically informed approaches across remote sensing, geochemistry, geophysics, and drill-core imagery, with emphasis on geological consistency and exploration-stage applicability. Yuan et al. [18] systematically examined deep learning with multisource geoscience data and proposed a stage-dependent framework linking data requirements and model characteristics to different exploration applications.
These reviews provide important and complementary perspectives, but their organizational emphasis differs from that adopted here. The present review specifically centers on image-based and image-formatted geoscientific evidence and examines how such evidence is distributed across exploration contexts, translated into AI visual tasks, processed by different methodological paradigms, and converted into geological outputs. In particular, visual tasks are defined according to the form of the AI output, rather than according to broader exploration applications such as geological mapping or mineral prospectivity assessment. Table 1 compares the organizational scope of the five closely related reviews and the present review using four predefined research questions.
Table 1.
Comparison between existing reviews and the present review.
Q1: Does the review synthesize evidence across multiple geological or mineral-exploration data contexts rather than focusing on a single sensing modality?
Q2: Does the review establish an explicit AI visual-task taxonomy based on the form of the model output?
Q3: Does the review explicitly organize AI methods into methodological or architectural families?
Q4: Does the review explicitly examine relationships among data or exploration context, AI tasks, methods, and geological or application outputs?
Against this background, the main contributions of this review are as follows:
- A systematic mapping framework is established for visual evidence used across regional and surface investigation, drilling and core analysis, and laboratory rock and mineral characterization, clarifying where different forms of imagery contribute within mineral-exploration practice.
- AI visual tasks are organized according to the form of their outputs into classification, segmentation and localization, anomaly identification, regression and quantitative attribute prediction, and image enhancement and fusion. This task-oriented organization separates the computational form of the AI problem from the broader geological application in which it is used.
- Traditional machine learning, CNNs and their variants, Transformer architectures, graph-based and relational models, and hybrid and emerging architectures are systematically examined in relation to their data characteristics, AI tasks, and exploration contexts.
- Representative public data resources are summarized, while multisource and multimodal integration is examined as a mechanism for combining complementary geological evidence at the data, feature, and decision levels.
The remainder of this review describes the systematic literature search and evidence-mapping procedure, followed by analyses of visual-data domains, AI visual tasks, methodological paradigms, and multisource integration. The final sections discuss current limitations, future research directions, and the principal conclusions of the review.
2. Literature Search and Study Mapping
2.1. Review Design, Protocol Registration, and Search Strategy
This review was conducted as a systematic mapping review to characterize the use of AI and computer-vision (CV) methods for image-based and image-formatted geoscientific evidence in mineral exploration. The review was designed to systematically map how visual data sources, AI tasks, methodological paradigms, and geological outputs are distributed and related across different mineral-exploration contexts.
This systematic mapping review was conducted and reported in accordance with the Preferred Reporting Items for Systematic Reviews and Meta-Analyses (PRISMA 2020) statement [19], and the completed PRISMA checklist is provided in Supplementary Table S1. To improve the transparency and reproducibility of the review, the review protocol was registered with OSF Registries on 23 August 2026 using the Generalized Systematic Review Registration template under the title Artificial Intelligence for Mineral Exploration Imagery: A Systematic Mapping Review of Data, Tasks and Methods (https://doi.org/10.17605/OSF.IO/K6WV7, 23 August 2026). The registration provides a public record of the review scope, information sources, eligibility criteria, study-selection procedure, and evidence-mapping framework.
The literature search was conducted in three bibliographic databases: Web of Science Core Collection, Scopus, and IEEE Xplore. The final search was completed on 23 August 2026. Searches were limited to English-language journal articles published between 2016 and 2026. The search strategy combined terms representing three conceptual dimensions: mineral exploration and related geological objectives; AI and CV concepts; and visual or image-formatted geoscientific evidence. Traditional machine-learning studies were not defined as a separate search category but were retained when they were retrieved through the broader search terms and satisfied the predefined visual-data, task, and mineral-exploration eligibility criteria. The complete database-specific search strings are provided in the registered review materials.
The searches identified 397 records, including 162 from Web of Science Core Collection, 166 from Scopus, and 69 from IEEE Xplore. After removal of 174 duplicate records, 223 unique records remained for title-and-abstract screening. The complete PRISMA-style [19] study-selection procedure is shown in Figure 2.
Figure 2.
PRISMA-style workflow for literature identification, screening, eligibility assessment, and selection of the final core evidence set.
2.2. Eligibility Criteria and Study Selection
Study eligibility was determined by the intersection of three principal requirements. First, the study had to address mineral exploration or a geological objective directly relevant to exploration, including geological or lithological mapping, alteration identification, mineral or mineralization characterization, anomaly analysis, drill-core interpretation, prospectivity assessment, or exploration-target delineation. Second, the analytical input had to contain an identifiable visual or image-formatted representation, such as multispectral or hyperspectral imagery, remote-sensing images, UAV observations, point clouds, drill-core images, thin-section or microscopy images, SEM-derived imagery, Raman maps, CT or micro-CT volumes, or other spatially represented geoscientific data. Third, AI or CV had to form a substantive component of the analytical workflow and produce an identifiable visual, geological, or exploration-related output.
Studies were excluded during title-and-abstract screening when they had no direct mineral-exploration connection, contained no identifiable visual data, involved no relevant visual task, or did not satisfy the predefined publication-type, publication-year, or language requirements. Before formal screening, two human reviewers independently piloted the eligibility criteria on a small sample of records to establish a consistent interpretation. Title-and-abstract screening and subsequent full-text eligibility assessment were then conducted independently by the same two reviewers. Disagreements at either stage were resolved through discussion, with consultation of another member of the review team when necessary. After screening the 223 unique records, 98 records were excluded, leaving 125 reports for full-text eligibility assessment.
Full-text reports were subsequently assessed against the same conceptual scope with greater emphasis on whether the relationship among exploration context, visual evidence, analytical task, and AI methodology could be verified from the complete article. Reports were excluded when they had no direct mineral-exploration objective or context, used an ineligible visual-data format, or provided insufficient methodological information to verify that the study met the predefined review criteria. A total of 34 reports were excluded at this stage, resulting in a final core evidence set of 91 studies.
The study-selection process and exclusion categories are summarized in Figure 2. Record-level screening and eligibility decisions are documented in the associated OSF project repository, providing traceability from the identified records to the final included evidence set.
2.3. Data Extraction, Coding, and Evidence Mapping
For each of the 91 included studies, bibliographic information and review-specific variables were recorded in a structured evidence matrix. The principal coding dimensions included the study identifier, publication information, visual-data source, exploration objective or geological target, AI task, methodological family, and geological output. These variables provided a consistent basis for the data, task, and method-oriented synthesis presented in the subsequent sections.
Visual data were grouped according to the exploration context in which they are primarily generated and used, including regional and surface survey data, drilling and core data, and laboratory rock and mineral images. For the purpose of the distribution analysis, each study was assigned to one principal visual-data domain according to the dominant form of evidence used in the analysis. These categories reflect the principal exploration stage or analytical context in which the corresponding visual evidence contributes to geological interpretation and mineral-exploration analysis.
AI tasks were coded according to the form and geological meaning of the model output. The principal task categories comprised classification, segmentation and localization, anomaly identification, regression and quantitative attribute prediction, and image enhancement and fusion. Because some studies addressed more than one substantive visual task within the same workflow, multiple task labels were permitted. Consequently, the total number of task assignments exceeds the number of included studies.
Methodological coding was based on the principal AI or CV paradigm used in each study. Each study was assigned to one dominant methodological category: traditional machine learning, CNNs and their variants, Transformer architectures, graph neural networks and relational modeling, or hybrid and emerging architectures. This mutually exclusive coding strategy enabled the distributions of visual evidence, AI tasks, and methodological paradigms to be examined consistently across the 91-study evidence base. Bibliographic information, visual-data types, exploration targets, and AI tasks for the 91 included studies are provided in Supplementary Table S2, allowing the distributions reported in this review to be traced to individual included studies.
2.4. Distribution of the Included Studies
The 91 studies included in the final core evidence set provide the common basis for the subsequent data, task, and method-oriented analyses. As summarized in Figure 3, the literature is strongly concentrated on regional and surface survey data, while drilling/core and laboratory imaging constitute smaller evidence domains. Classification is the most frequently represented AI visual task, followed by segmentation/localization and anomaly identification, whereas quantitative prediction and image enhancement/fusion occur less frequently. Methodologically, CNNs and their variants remain dominant, with hybrid and emerging architectures forming the next major group.
Figure 3.
Distribution of the 91 included studies across (a) visual-data domains, (b) AI visual task categories, and (c) methodological paradigms. Percentages are calculated relative to the 91-study core evidence set; multiple task assignments were permitted where a study addressed more than one substantive AI visual task.
Task categories were coded using a multilabel scheme because some studies addressed more than one substantive visual task; therefore, task counts may exceed the 91 included studies. In contrast, each study was assigned to one principal visual-data domain and one principal methodological paradigm. These three dimensions provide the organizational basis for Section 3, Section 4 and Section 5, which examine visual-data domains, AI visual tasks, and methodological paradigms, respectively.
The included literature is concentrated in recent years, with 65 of 91 studies (71.4%) published in 2024–2026 (Figure 4a). CNNs remain the largest family overall (47 studies), while 18 of the 20 hybrid or emerging studies were published in 2025–2026, indicating recent methodological diversification.
Figure 4.
Temporal and geographical distribution of the 91 included studies: (a) annual publication counts by principal methodological family; (b) geographical distribution of study areas or sample sources by principal methodological family.
Asia accounts for the largest geographical group (46 studies); four studies span multiple regions, and locations were not reported in the accessible material for 18 studies (Figure 4b). These descriptive patterns do not establish cross-region transferability or comparative progress in validation design; 2026 represents a partial year ending on 23 August.
3. Visual Data Sources and Public Datasets in Mineral Exploration
This chapter summarizes the principal image-data sources and places particular emphasis on publicly accessible datasets and resources. Figure 5 summarizes the representative visual-data domains, analytical contexts, and principal applications of these three categories.
Figure 5.
Major visual-data domains and their principal analytical roles in mineral-exploration-related applications.
Image-based mineral exploration relies on observations acquired at regional, drilling, and laboratory scales. Regional and surface surveys describe broad geological patterns, drilling and core data provide direct subsurface evidence, and laboratory imaging reveals detailed mineralogical and microstructural characteristics. These data differ in spatial coverage, resolution, spectral information, and geological meaning. These domains represent complementary sources of visual evidence used under different geological and analytical contexts.
3.1. Regional and Surface Survey Data
Regional and surface surveys provide the widest spatial coverage and are mainly used for geological mapping, alteration identification, structural interpretation, and mineral prospectivity assessment. The principal sources include multispectral and hyperspectral imagery, optical and SAR observations, UAV imagery, and three-dimensional surface data [20,21,22,23,24].
Regional studies draw mainly on multispectral imagery, hyperspectral observations, and higher-resolution surface data, but these sources serve different analytical needs. Landsat, Sentinel-2, and ASTER are widely used because their broad coverage and long-term archives make them suitable for regional lithological mapping and multitemporal comparison [25,26,27,28]. Hyperspectral sensors provide much finer spectral sampling and are therefore more useful when lithological units have similar visible appearances but differ in diagnostic absorption features [29]. EMIT and related imaging-spectroscopy missions have further increased the availability of regional mineralogical information [30].
Other platforms contribute information that conventional optical imagery may not capture well. SAR and multitemporal observations add structural or temporal cues [31]. UAV images resolve outcrops, fractures, and lithological contacts at a finer scale [32], whereas LiDAR and photogrammetric point clouds preserve surface geometry for digital-outcrop interpretation and three-dimensional geological mapping [33,34].
Prospectivity studies also make extensive use of image-formatted evidence that is not acquired as imagery in the usual sense. Remote-sensing products, DEMs, geochemical and geophysical measurements, structural variables, and known occurrences are often interpolated or rasterized into aligned spatial layers [35,36,37]. In this review, these layers are treated as visual representations of heterogeneous geological evidence rather than as a separate data category.
3.2. Drilling and Core Data
Drilling and core observations provide direct information on subsurface lithology, alteration, fractures, and mineralization. The most widely used sources are core RGB images, core hyperspectral measurements, HyLogger products, and images of drill cuttings [38,39,40,41].
Core-box photographs and continuous RGB scans record visible color, texture, grain characteristics, and structural features. They are inexpensive to acquire and can support lithological or lithofacies classification and continuous geological logging [42]. Whole-core CT scans additionally reveal internal three-dimensional structures and have been used for automated lithology classification [43].
Spectral core-scanning systems provide additional mineralogical information. Core hyperspectral and HyLogger data capture diagnostic absorption features together with depth and spatial position, supporting mineral identification, alteration mapping, and abundance estimation [44,45,46]. These data are particularly valuable where important mineral differences are not visible in conventional photographs.
Drill cuttings offer an alternative when intact cores are unavailable. RGB images can support rapid lithological classification through transfer learning [47], SEM images describe particle morphology and microstructure [48], and micro-CT provides three-dimensional information on pores, fractures, mineral distributions, and grain contacts [49].
3.3. Laboratory Rock and Mineral Image Data
Laboratory imaging is used to examine mineral composition, rock texture, grains, pores, and fractures at finer scales. Typical data include polarized-light thin-section images, SEM and automated mineralogical maps, CT or micro-CT volumes, and laboratory hyperspectral images. Within mineral exploration, these laboratory observations are relevant when they support mineral and alteration identification, quantitative mineralogical characterization, or the interpretation and validation of samples collected during surface investigation and drilling.
Thin-section images provide direct petrographic evidence through mineral color, interference color, cleavage, grain shape, and contact relationships [50,51,52,53,54]. SEM, QEMSCAN, and MLA extend this analysis by resolving mineral boundaries and elemental composition, allowing mineral phases and grains to be mapped quantitatively. CT and micro-CT are particularly useful when internal structure is important. They preserve the three-dimensional arrangement of pores, fractures, and mineral grains and can support measurements of volume, connectivity, and spatial distribution [55].
Laboratory hyperspectral imaging adds mineralogical information that is not directly available from structural imaging alone. Under controlled acquisition conditions, it can resolve diagnostic spectral responses associated with different minerals [56]. The influence of the atmosphere and surface cover is much smaller than in regional remote sensing, but the measured spectra are still sensitive to how the sample is prepared and presented.
3.4. Public Datasets and Data Resources
Public availability is treated here as a cross-cutting resource characteristic rather than as a separate visual-data domain. The resources summarized below remain associated with the regional/surface, drilling/core, or laboratory domains defined above. Most datasets were collected for a specific mineral district, borehole, or laboratory experiment and were not released in a form that allowed independent reuse. Table 2 brings together representative public resources from regional, drilling, and laboratory settings.
Table 2.
Representative publicly accessible datasets and data resources for visual analysis in mineral exploration.
They are not directly interchangeable: the listed datasets differ in sensing platform, spatial extent, data dimensionality, annotation completeness, and supported task. These differences determine whether a resource can be used only for method development or can also support reproducible comparison and independent evaluation.
At the regional scale, open Earth-observation resources provide the broadest coverage and are suitable for lithological mapping, alteration analysis, and prospectivity assessment. NASA EMIT L2A extends these resources by providing imaging-spectroscopy products together with uncertainty and mask information. More task-oriented regional datasets, such as Churchill Province and DEEP-SEAM Curnamona, integrate remote-sensing, geological, geophysical, geochemical, and field observations for predictive geological analysis.
Three-dimensional and drilling-scale resources remain less common. Tinto provides real and synthetic outcrop representations together with hyperspectral point clouds for point-wise geological interpretation [33]. DCID supports RGB-based drill-core classification and transfer-learning studies [63], whereas Rocklea Dome 3D links core hyperspectral, geochemical, airborne, and three-dimensional geological information. Laboratory-scale datasets, including drill-cutting SEM and micro-CT resources, mainly support particle, pore, mineral-phase, and digital-rock analysis.
Because the datasets are distributed across different repositories and data portals, Table 3 lists their corresponding access platforms.
Table 3.
Access links for the public datasets and data resources listed in Table 2.
The public resources identified in this review span regional Earth observation, three-dimensional surface mapping, drill-core analysis, and laboratory-scale characterization. Their coverage, however, is uneven and the datasets were generally developed for different sensors, repositories, and application scales. As a result, similar tasks may rely on incompatible data formats, class definitions, annotation procedures, data partitions, and evaluation protocols, making direct performance comparison difficult. A more useful benchmark would require geographically independent regions, clearly defined labels, fixed training and test partitions, and consistent evaluation criteria. Linking regional imagery with drilling and laboratory observations would also make it possible to examine model performance across exploration scales rather than within a single dataset.
4. AI Visual Tasks in Mineral Exploration
In the reviewed literature, visual tasks differ mainly in the type of geological output produced. Some studies reduce an observation to a categorical label, whereas others preserve spatial information or estimate continuous attributes. Enhancement and reconstruction methods form a separate group because they modify the image itself before later geological analysis. This output-based distinction provides the basis for the task taxonomy shown in Figure 6.
Figure 6.
Major AI visual tasks and their exploration-oriented applications and outcomes in mineral exploration.
On this basis, Figure 6 groups the literature into five task families: classification and recognition; segmentation and spatial localization; anomaly identification; regression and quantitative prediction; and image enhancement, reconstruction, and image-level fusion. These groups describe different analytical outputs rather than successive steps in an exploration workflow. A single exploration application may therefore involve several of them—for example, image enhancement may precede lithological classification, while segmentation results may later be used for quantitative measurement or target delineation.
4.1. Classification Tasks
Classification assigns predefined geological categories to images, image patches, core intervals, drill cuttings, or individual rock and mineral samples. Depending on the study scale, the predicted label may represent lithology, mineral type, alteration class, or petrographic category. Model outputs generally take the form of a class label, class probability, or spatially distributed classification map.
The meaning of a classification result depends on the unit being labeled. Image- or sample-level models assign one category to an entire observation, whereas patch- and interval-based models can represent local variation across a remote-sensing scene or along a drill core. Pixel-wise classification produces continuous thematic maps, although the resulting class transitions do not necessarily correspond to sharply delineated geological boundaries. For samples containing several minerals or alteration features, multilabel predictions or class probabilities may therefore be more informative than a single dominant label.
The reviewed applications also differ across exploration scales. In regional studies, multispectral and hyperspectral imagery is used to distinguish lithological units, mineral assemblages, and alteration-related surface materials [15,22,23,24,29,66,67,68]. Drill-core and drill-cutting studies instead assign labels to depth intervals or particles using RGB, SEM, hyperspectral, or micro-CT observations, with automated geological logging as a common objective [38,41,43,49]. At the laboratory scale, thin-section and microscopic images are used to separate rock types, petrographic classes, and alteration assemblages whose visual differences may be subtle [51,53,54]. Hyperspectral models add another source of discrimination by using diagnostic spectral responses that are not apparent from color and texture alone [30,69,70].
These applications all produce categorical geological information, but their practical requirements are not the same. Regional mapping depends on geographically representative training samples, core logging requires consistent interval labels, and laboratory classification is sensitive to imaging and sample-preparation conditions. Across all three scales, performance is difficult to interpret when label definitions vary between studies or when models are evaluated only within the sensor, deposit, or study area used for training. Representative outputs and applications are compared in Table 4.
Table 4.
Representative classification settings and exploration applications.
4.2. Semantic Segmentation, Instance Segmentation, and Localization
Segmentation and localization retain information that is lost when an image or sample is reduced to a single class label. Their outputs may be pixel-wise maps, object masks, delineated target regions, geological contacts, or point labels on a three-dimensional surface. The choice among these outputs depends on whether the study aims to map a continuous geological unit, separate individual objects, or identify the position and extent of a target.
At regional and outcrop scales, semantic segmentation is mainly used to convert UAV, multispectral, or hyperspectral imagery into spatially continuous maps of lithology, alteration, or geological boundaries [21,32,59,74,75]. Interactive segmentation offers a less fully automated alternative, allowing lithological contacts to be refined from outcrop imagery with limited user input [76]. For these applications, pixel accuracy alone is not sufficient. A segmentation map may achieve high overlap while still producing discontinuous contacts or boundaries that are difficult to reconcile with geological structure.
Laboratory studies operate on much smaller objects. Microscopic and digital-rock images have been segmented to identify minerals, grains, pores, fractures, and mineral phases [45,50,55], thereby enabling measurements of area, shape, abundance, and spatial arrangement. Detection and instance-segmentation models have also been applied to individual grains and particulate materials in geological samples, supporting grain-size and morphology estimation, as well as particle classification and counting [77,78]. When separate objects of the same class must be counted or measured, instance segmentation is more appropriate than a single semantic mask. Galdames et al. [56], for example, combined hyperspectral dimensionality reduction with Mask R-CNN to identify and classify individual rock samples.
Spatial localization also extends to irregular three-dimensional data. A. J. Afifi et al. [33] and U. Iqbal et al. [34] assigned lithological labels to points or regions within three-dimensional geological surfaces, supporting digital-outcrop interpretation and mine-highwall mapping. Compared with two-dimensional segmentation, point-cloud analysis must account for irregular sampling density, complex surface geometry, and discontinuous geological boundaries.
Segmentation and localization are evaluated differently from image-level classification because the predicted geometry is part of the result. Overlap and point-wise accuracy remain useful, but they do not reveal whether geological contacts are continuous, adjacent objects are correctly separated, or predicted regions preserve a plausible spatial form.
4.3. Anomaly Detection and Mineralization Anomaly Identification
The meaning of an anomaly varies across the reviewed studies. Table 5 distinguishes the main anomaly levels by evidence source, output form, and representative application.
Table 5.
Main levels of anomaly identification in mineral exploration.
In some cases, it refers only to a spectral or textural departure from the local image background. In others, remote-sensing responses are interpreted together with geochemical or geophysical evidence and used to identify alteration zones, mineralization-related areas, or prospectivity targets. An anomaly score, a candidate region, and a ranked prospectivity map therefore represent different levels of geological interpretation and should not be treated as equivalent outputs.
This distinction is important because statistical or visual deviation alone does not establish geological significance. A spectrally unusual area may reflect illumination, surface cover, sensor noise, or lithological variation rather than mineralization, and an alteration-related response should not be treated as equivalent to a confirmed exploration target. Qin et al. [80], for example, linked GF-5 hyperspectral features with Au geochemical anomalies, whereas Luo et al. [62] combined multiple forms of evidence for rare-earth-element prospectivity mapping. These studies operate at different interpretive levels and should not be compared as if they produced the same type of evidence.
Evaluation should therefore consider how the anomaly threshold was selected, whether geological constraints were incorporated, and whether the predicted areas were tested against independent observations.
4.4. Regression and Quantitative Attribute Prediction
Regression and quantitative prediction estimate continuous geological or mineralogical attributes rather than assigning discrete classes. Typical outputs include mineral content, relative abundance, elemental concentration, grain size, particle shape, and other measurable properties derived from image-based or spatially represented evidence.
A quantitative result is meaningful only when its spatial reference is clear. Values predicted for an entire sample or a drill-core interval usually represent an average property, while pixel-level estimates describe local variation within the image. Some studies derive additional measurements from segmented grains or mineral regions, including area, size, shape, and roundness. These measurements are particularly relevant when samples assigned to the same geological class still differ in mineral proportion or particle characteristics.
The reviewed applications include mineral-content estimation from drill-core imagery, mineral-abundance prediction from hyperspectral and geochemical observations, and quantitative analysis of thin-section or particle images. Matimbi and Carranza [64], for example, combined drill-core hyperspectral data with geochemical measurements to estimate mineral abundance. Qin et al. [80] instead related GF-5 hyperspectral features to Au-associated geochemical responses. More recently, M. Rasoolijaberi et al. [84] quantified iron sulfides from high-resolution RGB drill-core scans, whereas Y. Yuan et al. [85] generated high-resolution geochemical maps by fusing ASTER imagery, NDVI, aeromagnetic data, DEM, and geochemical observations. Other studies derived mineral proportions or particle-scale measurements from core and thin-section images.
The main difficulty is establishing a reliable correspondence between the image input and the reference value. Bulk assays, pixel-level spectra, segmented particles, and depth-interval measurements do not represent the same spatial support, even when they are assigned to the same sample. Quantitative performance therefore depends on reference-measurement quality, calibration, spatial matching, and whether the training data cover rare phases and extreme values. Predictions become less reliable when these conditions differ from those represented during model development. Table 6 compares the main quantitative targets, prediction units, and representative applications.
Table 6.
Representative regression and quantitative prediction tasks in mineral exploration.
4.5. Image Enhancement and Image-Level Fusion
Image enhancement, reconstruction, and image-level fusion improve the quality or information content of geological imagery rather than directly assigning geological labels. Their outputs generally remain in image form, including spatially enhanced images, spectrally preserved fused products, and reconstructed representations that can support subsequent classification, segmentation, or anomaly analysis.
Image fusion is most often used to address the trade-off between spectral and spatial detail. Hyperspectral imagery records diagnostic spectral responses across many bands but commonly provides coarser spatial information, whereas multispectral imagery offers finer spatial structure with more limited spectral sampling [86]. Dong et al. [87] combined GaoFen-5 hyperspectral imagery with Sentinel-2B data before lithological classification, using the fused product to preserve both spectral information and finer spatial detail. Chen et al. [88] followed a comparable image-level fusion strategy for geological interpretation. Yuan et al. [89] instead focused on enhancement, aiming to make structural and alteration-related patterns more visible.
The usefulness of these operations cannot be determined from visual appearance alone. A sharper image may still contain weakened absorption features, amplified noise, or artificial boundaries. Evaluation should therefore examine whether the processed image improves the geological task for which it was produced, rather than relying only on conventional image-quality measures.
In most of the reviewed studies, enhancement and fusion served as preparation for a later prediction task rather than as the final output. This distinction is used in the present taxonomy. Image-level fusion produces a new visual input before classification, segmentation, or prospectivity analysis, whereas feature-level fusion combines information within the predictive model. The latter is treated in this review as a modeling strategy.
5. AI Vision Learning Methods and Technical Architectures
The methods reviewed in this chapter are organized by the architecture responsible for the main prediction step. The five groups are traditional machine learning, CNNs, Transformers, graph-based models, and hybrid or emerging architectures. Learning strategies such as transfer learning, multimodal learning, or limited-label training are considered separately because they can be applied across more than one architectural group.
Figure 7 summarizes these model families and their principal forms of representation.
Figure 7.
Image-based AI visual learning methods for mineral exploration.
CNNs emphasize local image and spectral patterns, Transformers relate information across wider spatial or spectral ranges, and graph-based models operate on explicitly connected samples or irregular structures. Hybrid architectures combine components from different families when the task requires more than one type of representation.
5.1. Data Preprocessing and Model-Ready Input Construction
Preprocessing in mineral-exploration vision is determined less by a fixed workflow than by the structure of the input data and the form of the required output. Classification models may accept spectral vectors, image patches, or three-dimensional blocks, whereas segmentation models must preserve the correspondence between pixels, voxels, or points and their labels. Multisource models impose an additional requirement: geological evidence acquired from different platforms must be brought into a consistent spatial reference without obscuring differences in scale or coverage.
Optical, multispectral, and hyperspectral imagery is usually prepared with attention to radiometric consistency, spectral quality, and spatial alignment. Depending on the dataset, this may involve reflectance correction, registration, resampling, normalization, removal of low-quality bands, and extraction of regions of interest or image patches. Atmospheric degradation may also be addressed with image-enhancement methods such as attention-based dehazing [90]. Because hyperspectral data contain substantial interband redundancy, principal component analysis, band selection, or spectral grouping is often applied before the data are arranged as spectral vectors, two-dimensional patches, or three-dimensional spectral–spatial cubes [91,92,93,94,95,96,97]. When several sensors are used together, projection, scale, and pixel-level correspondence must also be checked so that aligned locations refer to the same ground area [36,58,87,88,98].
Close-range images, including drill-core, thin-section, and SEM data, present a different set of problems. Their appearance varies with lighting, imaging devices, background conditions, and sample placement, so preprocessing commonly focuses on cropping, background removal, resizing, color or illumination adjustment, and normalization. Data augmentation is frequently used when labeled samples are limited or class distributions are uneven [51,53]. For continuous drill-core imagery, window construction must also preserve the link between image position, borehole depth, lithological labels, and associated mineral measurements.
Three-dimensional data require preprocessing that retains volumetric or geometric structure. CT and micro-CT volumes may be reconstructed, denoised, normalized, and divided into slices or subvolumes before being represented as two-dimensional sequences or voxel blocks [49]. Point clouds instead require operations such as outlier removal, downsampling, coordinate normalization, registration, and density adjustment, after which they may be organized as point sets, voxel grids, or graphs [33,34]. For multisource geological, remote-sensing, geochemical, and geophysical evidence, interpolation, rasterization, resolution matching, and layer alignment are often used to construct spatially corresponding multichannel or multibranch inputs [36,37].
Table 7 summarizes the principal preprocessing operations and model-ready input forms for the main data representations used in mineral exploration.
Table 7.
Major preprocessing operations and model-ready inputs for mineral exploration data.
Preprocessing not only standardizes model inputs but also influences the geological information preserved for subsequent learning. Although noise reduction, dimensionality reduction, resampling, and geometric alignment can improve data consistency, excessive processing may attenuate diagnostic spectral responses, blur geological contacts, remove fine-scale microstructures, or distort spatial relationships. Preprocessing strategies should therefore be designed to improve numerical consistency while preserving information that is relevant to geological interpretation.
5.2. Traditional Machine Learning
Traditional machine learning generally relies on manually constructed color, spectral, textural, or spatial features, followed by clustering, classification, regression, or ensemble learning [81,99,100]. In mineral exploration, these methods have been applied to drill-core mineral mapping, remote-sensing-based geological zoning, geochemical anomaly prediction, mineral prospectivity mapping, and field geological mapping.
Figure 8 presents three representative traditional machine-learning workflows: unsupervised clustering, spatial regression, and tree-based ensemble learning. Liu et al. [44] integrated drill-core RGB imagery with corresponding HyLogger mineralogical measurements. The RGB images were transformed into HSV space, and K-means clustering was then applied to group pixels with similar color properties. Mineral classes derived from HyLogger were matched to the dominant color clusters, after which global color profiling was used to extrapolate these associations from the scanned strip to the wider core surface. The estimated mineral classes and relative abundances showed close agreement with the HyLogger-derived results, while the image-based mapping also extended mineral characterization beyond the restricted HyLogger scan path.
Figure 8.
Representative traditional machine-learning workflows in mineral exploration. (a) Drill-core mineral mapping based on K-means and color features [44]; (b) prediction of Au geochemical anomalies using GF-5 hyperspectral data and regression models [80]; and (c) iterative field geological mapping based on LightGBM [100].
Qin et al. [80] investigated the relationship between GF-5 hyperspectral signatures and field Au geochemical anomalies. After hyperspectral noise reduction and endmember-related feature extraction, MLR, PLS, a BP neural network, and GWR were compared. GWR achieved the strongest fit because it explicitly accounted for spatial variation, although prediction of local extreme anomaly values remained challenging.
Wang et al. [100] incorporated LightGBM into an iterative field-mapping framework. Remote-sensing variables and interpolated geochemical features were combined with lithological labels collected along simulated survey routes. The model produced lithological predictions together with class-probability maps, from which low-confidence areas were identified for subsequent field sampling. The newly collected observations were then added to the training set for the next iteration. After five iterations, the workflow generated predictions for approximately 90% of the lithological units while field observations covered only about 20% of the study area. This result indicates that machine learning can contribute not only to lithological mapping but also to the prioritization of additional data collection.
Other studies broadened the use of traditional models. El Atillah et al. [99] compared K-means, ISODATA, watershed, graph-based segmentation, and thresholding for Sentinel-2A geological mapping, with K-means and ISODATA providing the clearest geological discrimination. Mohamed Taha et al. [81] used 12 geological, geochemical, and remote-sensing variables to benchmark Deep Forest against several neural models for gold prospectivity mapping. Deep Forest achieved an accuracy of 0.979 and an AUC of 0.984, while maintaining favorable efficiency and robustness under limited-sample conditions. Table 8 summarizes the principal traditional machine-learning paradigms and their modeling characteristics in mineral-exploration applications.
Table 8.
Major traditional machine-learning paradigms in mineral exploration.
Traditional machine learning remains useful when labeled data or computing resources are limited. Its performance, however, is strongly influenced by feature design, preprocessing, and spatial interpolation. These dependencies have encouraged the use of CNNs, which can learn hierarchical image features more directly from the input data.
5.3. CNNs and Their Variants
CNN-based methods account for a large proportion of the reviewed literature because they can learn hierarchical representations of color, texture, morphology, and local spatial structure directly from image data. The studies were grouped into four architectural families according to how these features were extracted and organized: basic and residual CNNs, multidimensional and multi-branch CNNs, encoder–decoder networks, and convolutional autoencoders [41,43,97,101,102].
Figure 9 summarizes the main differences among these families. Basic and residual CNNs are used mainly for image- or sample-level classification and regression involving rock, drill-core, and remote-sensing data. Multidimensional and multi-branch designs separate or combine spectral and spatial representations and are therefore common in hyperspectral classification and multisource analysis. Encoder–decoder networks preserve spatial correspondence during prediction and are primarily applied to the segmentation or localization of lithological units, alteration zones, and mineral targets. Convolutional autoencoders, by contrast, are used mainly for unsupervised feature learning and reconstruction when dense labels are unavailable.
Figure 9.
CNN architecture families and their supported vision-task mappings in mineral exploration.
Basic and residual CNNs are primarily used for image-level classification and regression. To address the limited size of labeled drill-core datasets, D. Fu et al. [38] initialized ResNeSt-50 with ImageNet-pretrained weights. The Split-Attention mechanism embedded within the residual blocks strengthened interactions among feature groups and improved the representation of lithological textures and structures. A different emphasis was placed on efficiency by M. A. M. Abdullah et al. [65], who developed the lightweight RockDNet architecture for rock-image classification. At the microscopic scale, D. Becerra et al. [48] employed ResNet-18 to classify BSE-SEM images of drill cuttings and compared transfer learning with training from random initialization.
These studies include both conventional spectral–spatial CNNs and multidimensional or multibranch networks designed for hyperspectral lithological classification [29,103,104]. Z. Wang and R. Zuo [92] compared 1D, 2D, and 3D-CNNs together with a dual-branch 1D–2D CNN, illustrating the different roles of spectral, spatial, and joint spectral–spatial feature learning. In the ResNetX2 framework, Z. Xu et al. [104] processed PCA-derived spectral features and Local-GLCM texture features using two residual branches, followed by feature fusion supported by a spatial transformation network and spectral–spatial attention. Similar multi-branch strategies were adopted to integrate geological priors, optical imagery, hyperspectral information, microwave texture, and other multisource evidence [66,93,105,106,107,108,109].
Encoder–decoder architectures are primarily associated with pixel-level geological mapping because they combine high-level semantic encoding with progressive recovery of spatial detail. Decoding layers, skip connections, and multiscale context modules are commonly used to restore boundaries and local structures that would otherwise be lost during feature compression. Liu et al. [32], for example, incorporated MobileNetV2, Coordinate Attention, and multiscale feature fusion into DeepLabV3+ for lithological segmentation of UAV imagery. FCN, U-Net, Attention U-Net, and related variants have likewise been applied to lithological units, alteration zones, mineral phases, pores, and large geological boundaries [21,59,74]. At the instance level, Galdames et al. [56] combined neural-network-based hyperspectral dimensionality reduction with Mask R-CNN to separate and classify individual rock samples.
Convolutional autoencoders address a different limitation: the scarcity of dense annotations. Yu et al. [94] extended autoencoding to three-dimensional hyperspectral cubes through pixel-based and cube-based representations, whereas Otele et al. [68] developed an automatically stacked sparsely connected convolutional autoencoder for remote-sensing lithological mapping.
CNNs have also been incorporated into broader predictive frameworks rather than used as isolated backbones. Wang et al. [110] added Bayesian and ensemble-based uncertainty estimation to lithological mapping, while Fan et al. [36] combined robust principal component analysis with ResNet for prospectivity prediction from airborne magnetic features. In alteration and prospectivity studies, CNNs were further integrated with remote-sensing, geochemical, and hyperspectral evidence layers [60,111]. These extensions indicate that recent CNN-based research is moving beyond direct image classification toward spatial prediction, uncertainty assessment, and multisource evidence integration.
Table 9 summarizes the main modeling characteristics and the literature coverage of the four CNN architecture categories. CNN-based methods account for the largest share of the reviewed image-based mineral-exploration studies. Their widespread use reflects their capacity to extract local spectral, textural, and structural patterns and to accommodate different data forms through residual, multibranch, and encoder–decoder designs. However, their ability to represent broader geological context is influenced by receptive-field size and network depth. Long-range spatial dependencies may therefore be modeled less explicitly than local image patterns. This limitation provides the main rationale for the growing use of Transformer-based architectures in more recent studies.
Table 9.
Major CNN architecture categories and their modeling characteristics in mineral exploration.
5.4. Transformer Architectures
In the reviewed literature, Transformer models appear in a smaller number of studies than CNNs. Their use is concentrated in tasks that require information to be related across wider spatial regions, spectral bands, or irregular three-dimensional neighborhoods.
The reviewed evidence shows several distinct uses of attention-based modeling, but the number of studies remains limited. Reported performance is influenced by input construction, pretraining, training-set size, and computational demand, making direct comparison across these applications difficult. Table 10 summarizes the corresponding representation strategies and geological tasks.
Table 10.
Major Transformer paradigms and their applications in mineral exploration.
Representative applications span rock-image recognition, regional geological mapping, spectral-image analysis, and three-dimensional point-cloud interpretation. Wang et al. [53] developed Rock-ViT for distinguishing visually similar sandstone classes. Built on RegionViT and supervised contrastive learning, the model represented both local details and larger image regions. Han et al. [57] addressed regional mapping with RSWFormer, using hierarchical sampling and multiscale context enhancement to connect geological information across different spatial extents.
For spectral data, the reviewed methods differ mainly in how the input is prepared before attention is applied. Gul et al. [30] used a Spatial–Spectral Transformer to analyze interactions between EMIT bands and nearby image regions. In SpecPool-Transformer, Feng et al. [70] reduced redundancy through grouped spectral embedding and convolutional pooling before encoding. Zhang et al. [119] considered GF-3 SAR imagery rather than hyperspectral data and introduced Fourier filtering to combine frequency information with image-patch features. The principal methodological difference among these studies is therefore the construction of the input representation.
Transformers have also been tested on irregular geological surfaces. Iqbal et al. [34] compared SparseUNet, Point Transformer v2, Point Transformer v3, and Sonata for point-wise lithological segmentation of mine-highwall point clouds. Unlike image-based applications, this setting requires the model to operate on unevenly distributed points and complex surface geometry.
5.5. Graph Neural Networks and Relational Modeling
Graph-based models appear in only a small number of the reviewed studies, and their use is concentrated in hyperspectral lithological and mineral mapping. Rather than processing all observations on a regular image grid, these models represent pixels, regions, or spectral samples as connected nodes, allowing information to be exchanged across explicitly defined neighborhoods.
Dong et al. [87] used this idea in the ViT-DGCN framework for regional lithological classification. GaoFen-5 hyperspectral imagery and Sentinel-2B multispectral imagery were first combined using smoothing-filter-based intensity modulation. The fused image was then processed by a Vision Transformer for global representation learning, while dynamic graph convolution modeled relationships among the extracted features. In the Cuonadong study area, the model classified seven lithological units and achieved an overall accuracy of approximately 97% with 1% of the samples used for training. This result was obtained within a single regional dataset and should therefore be interpreted mainly as evidence of the feasibility of combining attention and graph-based feature relations.
Zhang et al. [46] applied a different form of graph modeling to drill-core mineral identification. Their GCNNSAM method combined multigranularity graph convolution with the Spectral Angle Mapper. The graph component propagated contextual information among hyperspectral samples, whereas SAM preserved the similarity between measured spectra and mineral reference signatures. Applied to HySpex SWIR drill-core imagery, the method mapped montmorillonite, chlorite, and Al-rich illite and achieved an overall accuracy of 89.23%, higher than the separate GCNN and SAM baselines.
The two graph-based studies differ in both data scale and the role assigned to the graph component. In ViT-DGCN [87], graph convolution was applied after GaoFen-5 and Sentinel-2B image fusion and complemented the global representation learned by the Vision Transformer for seven-class regional lithological mapping. In GCNNSAM [46], the graph module operated on HySpex SWIR drill-core samples and was combined with Spectral Angle Mapper to retain similarity to reference mineral spectra. The reported overall accuracies were approximately 97% and 89.23%, respectively, but the results were obtained from different datasets, targets, and validation settings and are therefore not directly comparable. With only these two studies identified, the available evidence is sufficient to illustrate two uses of graph modeling, but not to establish a general advantage over CNN- or Transformer-based alternatives.
5.6. Hybrid Models and Emerging Architectures
Hybrid architectures have been increasingly adopted when a single backbone cannot fully represent the spectral, spatial, temporal, and geological characteristics of mineral-exploration data. Rather than simply stacking different modules, these approaches combine complementary learning mechanisms to address specific limitations, such as insufficient temporal modeling, weak cross-modal interaction, limited labeled samples, and uncertainty in geological interpretation.
Hybrid designs in the reviewed studies served several different purposes. A first group introduced sequence modeling into convolutional pipelines. Matimbi and Carranza [64] compared CNN, LSTM, and CNN–LSTM variants for drill-core hyperspectral and geochemical data. Hajaj et al. [96] linked 3D convolution with BiLSTM in RecSpecCNN, whereas Agrawal and Govil [69] used 1D convolution, LSTM, and residual learning in their mineral-CNN-LSTM and mineral-ResNet models. Lu et al. [31] followed a different route in MSTDA-Net, replacing recurrent units with multiscale temporal convolution and temporal–channel attention.
A second set of studies retained conventional analytical components within a deep-learning workflow. Qaderi et al. [91] combined spectral processing, deep autoencoding, and fuzzy logic for alteration identification and prospectivity assessment. Jan et al. [120] used a 1D-CNN to construct features that were subsequently classified by an SVM. DEEP-SEAM [62] brought together RPCA preprocessing, semi-supervised anomaly detection, and SHAP analysis, thereby separating data preparation, prediction, and interpretation into distinct stages.
More recent architectures combine modules that operate on different representations or tasks. Yang et al. [52] linked lightweight classification with SAM–CRF segmentation to obtain both thin-section labels and grain-level measurements. AMENet [121] integrated ResNet101, cross-modal Attention-Mamba, and TransUNet for multimodal lithological segmentation. Marques Jr. et al. [122] introduced a lithological classification model combining Fourier Neural Operators with channel-wise self-attention for RGB outcrop images, while Chen et al. [123] used a remote-sensing vision–language foundation model with retrieval-augmented generation for few-shot lithology recognition and geological knowledge reasoning. More broadly, recent work has identified self-supervised pretraining, Earth-observation foundation models, geoscientific language models, and multimodal foundation models as emerging directions for mineral-exploration AI [124]. These approaches may reduce dependence on task-specific labels and facilitate knowledge transfer across data sources and regions, although direct evidence of reliable cross-region and cross-deposit transfer in mineral exploration remains limited.
Hybrid modeling has also been extended beyond two-dimensional prediction. V. S. dos Santos et al. [61] incorporated sparse field observations, dual encoding paths, late fusion, and Monte Carlo Dropout into SCB-Net for geologically constrained lithological mapping and uncertainty estimation. X. Li et al. [125] used DeepLabV3+ as a surface-segmentation front end and linked its output with an improved multistep Markov-chain framework for probabilistic three-dimensional geological modeling.
Table 11 summarizes the principal integration strategies and their intended roles in mineral-exploration analysis. The reviewed hybrid models are not limited to replacing one image-classification backbone with another. Instead, they extend the prediction process by incorporating information that a single visual architecture may not represent adequately. Depending on the application, this includes temporal relationships, interactions between data modalities, geological constraints, uncertainty estimates, or external knowledge. Their significance therefore lies in broadening the evidence available to the model rather than in architectural complexity itself.
Table 11.
Summary of hybrid and emerging architectures in mineral exploration.
Taken together, the reviewed evidence does not indicate that a single architecture is uniformly superior across mineral-exploration settings. Method selection is closely related to the structure of the input evidence, the required output, the availability of labeled data, and the spatial scale of the geological problem. CNNs remain widely used for extracting local image and spectral–spatial patterns, whereas Transformers provide a means of modeling broader contextual relationships. Graph-based models offer a framework for representing irregular or relational geological information, while hybrid approaches are particularly relevant when complementary evidence or additional constraints need to be incorporated. Comparisons across these methodological families should nevertheless be interpreted cautiously because the underlying datasets, geological targets, sensing conditions, and validation protocols differ substantially among studies. To make these cross-family differences more explicit for model selection, Table 12 compares the five method families using common criteria, including input structure, annotation requirements, computational cost, interpretability, and reported evidence limitations. No family is uniformly preferable across exploration settings.
Table 12.
Comparison of five method families for model selection in mineral exploration.
Taken together, the comparison suggests that method selection should begin with the structure of the available evidence and the required geological output rather than with model complexity alone. Traditional machine-learning methods remain useful when engineered predictors and labeled samples are limited; CNNs are well suited to local image and spectral–spatial patterns; Transformers become more relevant when broader context or irregular point geometry must be represented; GNNs are appropriate when explicit relationships among samples or features are informative; and hybrid models are most useful when complementary modalities, geological constraints, or additional sources of evidence need to be integrated.
6. Multimodal and Multisource Geoscience Data Integration
Multisource studies draw on evidence that differs in both spatial coverage and geological meaning. Remote-sensing imagery records regional surface patterns, whereas drilling and core observations provide localized subsurface information. Geological maps add lithological and structural constraints, and geochemical or geophysical measurements contribute indirect evidence of mineralization. The purpose of integration is therefore not simply to increase the number of input channels, but to combine observations that describe different parts of the exploration problem [35,37,61,62,64]. Related mineral-prospectivity studies have likewise integrated remote-sensing-derived alteration information with geological, geochemical, and geophysical evidence using neuro-fuzzy, fuzzy-logic, and Fuzzy-AHP frameworks [127,128,129]. These studies further illustrate that multisource integration can support VMS copper, polymetallic, and copper prospectivity assessment, while field observations and drilling can provide additional geological validation of the resulting target zones.
As shown in Figure 10, integration can occur at the data, feature, or decision level. Data-level fusion combines aligned images or rasterized evidence into a common input, feature-level fusion integrates representations extracted from different sources, and decision-level fusion combines the outputs of separate models. Data-level fusion is most appropriate when sources can be reliably co-registered and share compatible spatial support. Feature-level fusion is better suited to heterogeneous observations whose complementary information can be retained in separate representations, whereas decision-level fusion is useful when modalities differ substantially in geometry, availability, or modeling requirements. These strategies have been applied to lithological and alteration mapping, prospectivity assessment, quantitative prediction, and three-dimensional geological interpretation [58,109,111,116]. Representative integration settings are summarized in Table 13.
Figure 10.
Multimodal and multisource geoscience data integration in mineral exploration.
Table 13.
Representative multimodal and multisource integration settings in mineral exploration.
The main challenges arise from differences in spatial resolution, coordinate systems, acquisition time, coverage, and data quality. Registration errors, interpolated layers, and missing modalities can introduce additional uncertainty, while the contribution of each source is often insufficiently evaluated. These issues indicate that multisource integration depends not only on model architecture, but also on reliable spatial alignment, scale correspondence, and the availability of different data sources.
Beyond the integration mechanism itself, the practical relevance of AI/CV depends on how exploration objectives, visual evidence, analytical tasks, and geological outputs are connected, as well as on how the resulting outputs are validated. Representative methodological choices for these tasks are comparatively synthesized in Section 5 and Table 12. Table 14 therefore focuses on the exploration-oriented relationships among objectives, visual data, AI tasks, geological outputs, and reported validation evidence or limitations.
Table 14.
Exploration objectives, visual data, AI tasks, geological outputs, and validation evidence.
7. Current Limitations and Future Directions
The reviewed evidence supports AI/CV as an aid to mapping, logging and target prioritization, with confidence depending on the validation endpoint. High image-classification accuracy can coexist with untested performance on new drill cores [38]. More direct checks include XRD comparisons for mineral estimates [39], blind testing on a third micro-CT core [55], and expert assessment of sulfide masks across deposit contexts [84]. Conversely, interpolation-derived supervision [85] and model tuning informed by the test set [62] weaken claims of independent predictive performance. Laboratory agreement tests geological correspondence; external-site testing addresses transfer, and neither substitutes for the other. Model suitability should therefore be judged against the required geological output and a matched baseline (Table 12 and Table 14). These studies do not by themselves establish improved discovery rates, economic returns, or universal cross-deposit transfer.
7.1. Limitations of Public Data and Standardized Benchmarks
The public resources identified in this review are uneven in both scope and readiness for reuse. Regional satellite products are relatively abundant, whereas public drill-core, digital-outcrop, SEM, and micro-CT datasets remain much less common. Even within the same data type, comparison is difficult because class definitions, annotation units, sample organization, and evaluation settings vary from one resource to another. Random pixel splits and adjacent patch splits are particularly problematic for spatial data, since training and test samples may contain closely related information from the same location.
A useful benchmark must preserve the metadata needed to understand how each sample was acquired and how independence was maintained during evaluation. For remote-sensing datasets, this includes geographic coverage, sensor and band information, and test areas separated from the training region. Drill-core datasets require borehole identity, depth, continuous intervals, and reliable links between images and geological labels. Laboratory resources need comparable imaging scales, sample-preparation records, and explicit annotation criteria. Without these details, public access alone does not ensure that a dataset can support reproducible or cross-study evaluation.
Existing resources provide partial examples of these practices. DCID offers a basis for drill-core classification and transfer-learning experiments [63]. Tinto and Rocklea Dome 3D organize three-dimensional and cross-scale geological observations in more integrated forms [33,64]. Even so, fixed partitions and common evaluation settings that permit comparison across datasets or tasks remain uncommon.
7.2. Generalization Across Mineral Districts, Sensors, and Scales
Most of the reviewed models were developed and evaluated within one dataset or one local study area [130]. Reported performance may therefore reflect not only geological discrimination, but also the specific acquisition conditions represented in the training data. In regional remote sensing, seasonal effects, atmospheric conditions, surface cover, and spatial resolution can alter image appearance. Drill-core, thin-section, and microscopic images are affected by a different set of factors, including scanner characteristics, illumination, color calibration, and sample preparation [48,51].
This distinction matters because a model can achieve high accuracy by learning dataset-specific visual cues that do not remain stable across deposits or devices. Transfer learning has been applied to limited drill-core datasets [38], but most evaluations still reuse the same district, sensor, or acquisition setting for both model development and testing. Stronger evidence of generalization would require validation on mineral districts, sensors, or acquisition batches that were not represented during training.
Domain adaptation, domain generalization, self-supervised pretraining, few-shot learning, and geoscientific foundation models provide possible directions for improving transfer across datasets and regions [124], but their value should be assessed through such independent tests. The objective is not simply to reduce distribution differences, but to retain spectral, textural, boundary, and spatial patterns that remain geologically meaningful under changing acquisition conditions.
Cross-scale generalization also requires greater attention. Regional remote-sensing imagery, outcrop images, drill-core images, and microscopic images describe geological phenomena at different spatial levels and cannot be linked simply by resizing them to a common image dimension. Future studies need to identify transferable visual representations across exploration stages so that regional-scale interpretations can be related more clearly to drilling- and laboratory-scale observations.
The available deposit-specific examples show a recurring use of mineralization indicators across different AI/CV methods. Porphyry-Cu prospectivity integrates alteration imagery and geochemistry through CNN classification [111], whereas a Mississippi Valley-type (MVT) Pb–Zn study combines dolomitization and carbonate–iron-oxide indicators with deep autoencoding and fuzzy modelling [91]. In a Carlin-type gold setting, spatial regression reproduced broad Au-anomaly trends but underestimated extremes [80]. CNN-based sulfide segmentation was evaluated in orogenic-gold and porphyry/epithermal cores [84], illustrating a shared visual task across deposit contexts. These examples favor selecting representations around geological indicators and reference data. They do not establish deposit-specific architecture rankings or reliable transfer between mineral systems: indirect mineralization proxies, local sampling and validation design remain recurring constraints.
7.3. Spatial and Scale Correspondence in Multisource Data
Resampling and rasterization are widely used to combine remote-sensing, geological, geochemical, and geophysical data in a common grid [35,62]. This treatment makes the inputs computationally compatible, but it can also create a misleading impression that the observations refer to the same spatial unit. A satellite pixel summarizes surface materials over an area, a borehole records a vertical sequence at a single location, and a laboratory image represents only a small part of a specimen. Assigning these observations the same pixel size does not make their geological support equivalent.
In our view, scale mismatch is one of the main unresolved problems in multisource mineral-exploration models. Fusion should therefore preserve information on geographic position, depth, acquisition time, and observation scale instead of reducing all sources to aligned arrays alone. Models that retain hierarchical or relational links among regional imagery, boreholes, and samples are more appropriate than simple channel stacking when these sources represent different geological volumes.
Data incompleteness is another practical issue, because many mineral districts do not have complete remote-sensing, geophysical, geochemical, and drilling datasets. Models therefore need to accommodate incomplete inputs rather than depend on a fixed and fully available modality combination. SCB-Net and related three-dimensional modeling studies have begun to use sparse observations, probabilistic outputs, and multiscale data to support lithological interpretation [61,125]. However, systematic correspondence among regional imagery, drilling information, and laboratory images remains at an early stage.
Future studies should also place greater emphasis on the geological consistency of model outputs. Feature attribution, uncertainty estimation, and other interpretability tools may assist this process, but their value depends on whether the resulting explanations can be verified against independent geological, field, drilling, or laboratory evidence rather than interpreted solely from model-generated attention or importance maps.
7.4. Geological Interpretability and Knowledge-Constrained AI
Interpretability is increasingly important when AI outputs are used to support geological interpretation or exploration targeting. In mineral prospectivity mapping, black-box models may achieve high predictive performance while remaining difficult to relate to geological processes or expert knowledge. Zuo et al. [131] proposed a broader XAI framework in which interpretability is considered at the levels of input data, model structure, and prediction results. Geological knowledge can be introduced through mineral-system-based feature construction and sample selection, while ore-controlling relationships may be embedded into hidden layers or loss functions as hard or soft constraints. Such approaches shift interpretability from post-hoc explanation toward knowledge-constrained learning.
Post-hoc attribution remains a more direct approach for examining trained models. SHAP can quantify the contribution of individual variables at both global and local levels. Antonini et al. [132], for example, applied SHAP to mafic–ultramafic rock classification and found that Al2O3, MgO, and Sr were the most influential geochemical variables; importantly, these contributions were interpreted against established mineralogical relationships rather than treated as model outputs alone.
However, interpretability does not by itself establish geological validity. Feature importance, attribution values, or attention maps explain model behavior but may still reflect correlated variables, sampling bias, or study-area-specific relationships. Geological constraints are likewise only as reliable as the prior assumptions embedded in the model. Future work should therefore combine attribution methods, geological knowledge embedding, uncertainty estimation, and independent geological validation. Explanations that remain consistent with field observations, drilling information, laboratory measurements, or known mineral-system relationships will be more useful for evaluating whether AI models have learned transferable geological patterns rather than dataset-specific correlations.
8. Conclusions and Limitations of This Review
This review examined how image-based and image-formatted geoscientific evidence is used with AI across regional surveys, drilling and core analysis, and laboratory rock and mineral characterization. The 91 core studies were mapped across five complementary dimensions: exploration context, visual data, AI visual task, methodological paradigm, and geological output. The literature is strongly concentrated on regional remote sensing, classification, and CNN-based modeling. Segmentation, anomaly analysis, quantitative prediction, image enhancement, and multisource integration are represented by smaller groups of studies. Hybrid and emerging architectures form a substantial secondary methodological group, whereas Transformers, graph-based methods, and vision–language models remain comparatively less represented.
The reviewed evidence suggests that methodological development has advanced more rapidly than dataset and validation design. Many models can extract lithological, mineralogical, structural, or mineralization-related information within a particular study area, but fewer studies establish whether the same model remains reliable across districts, sensors, or observation scales. Public benchmarks, geographically independent test sets, and explicit links between regional imagery, borehole observations, and laboratory measurements are still uncommon. Future progress will therefore depend not only on introducing new architectures, but also on improving data organization, validation design, and correspondence across exploration scales.
The scope of this review also imposes several limitations. Only studies with explicit image or image-formatted inputs and a mineral-exploration objective or exploration-relevant geological context were included in the core evidence base. Research based primarily on conventional tabular variables, mining production, mineral processing, equipment monitoring, or multisource analysis without an identifiable visual representation was outside this scope. The literature search was limited to the Web of Science Core Collection, Scopus, and IEEE Xplore and to English-language journal articles published between 2016 and 2026; relevant studies outside these databases or publication criteria may therefore not have been captured. In addition, substantial variation in dataset size, class definitions, annotation procedures, sample partitioning, and evaluation metrics prevented quantitative meta-analysis. Task categories were coded using a multilabel scheme, whereas each study was assigned to one principal visual-data domain and one principal methodological paradigm; therefore, task distributions are not mutually exclusive, while data-domain and methodological distributions are. Assessment of reproducibility was further constrained where preprocessing, partitioning, or implementation details were incompletely reported. The resulting synthesis should therefore be interpreted as a structured account of the principal data forms, visual tasks, and methodological patterns represented in the available literature rather than as a complete quantitative assessment of all artificial-intelligence applications in mineral exploration.
Supplementary Materials
The following supporting information can be downloaded at: https://www.mdpi.com/article/10.3390/min16100984/s1, Table S1: PRISMA 2020 Checklist for the Systematic Mapping Review; Table S2: Study-Level Coding Matrix of the 91 Core Studies Included in the Review.
Author Contributions
The authors confirm contribution to the paper as follows: conceptualization, Y.X., Y.Z. and J.T.; methodology, Y.X., Y.Z. and J.T.; investigation and literature screening, Y.X., Y.Z. and J.T.; data curation, Y.X., C.K. and K.X.; formal analysis, Y.X., K.X. and Y.Z.; visualization, Y.X. and C.K.; writing—original draft preparation, Y.X. and Y.Z.; writing—review and editing, C.K., K.X., D.L., Y.Z. and J.T.; supervision, Y.Z. and J.T.; project administration, D.L., C.K. and K.X.; funding acquisition, Y.X. and D.L. All authors have read and agreed to the published version of the manuscript.
Funding
This research was supported by the Guizhou Provincial Scientific and Technological Program (No. QKBPT SSYS [2026] 002, No. Qiankehe Platform SSYS [2026] ZD025, No. Qiankehe Platform SSYS [2026] ZD024).
Data Availability Statement
The data supporting this systematic mapping review, including the database-specific search strategies, screening records, and study-level coding matrix, are available through the associated OSF project repository at https://doi.org/10.17605/OSF.IO/K6WV7.
Conflicts of Interest
The authors declare no conflicts of interest.
References
- Tagwai, M.G.; Jimoh, O.A.; Shehu, S.A.; Zabidi, H. Application of GIS and remote sensing in mineral exploration: Current and future perspectives. World J. Eng. 2023, 21, 487–502. [Google Scholar] [CrossRef] [Scilit]
- Zuo, R. Key technology for intelligent mineral prospectivity mapping: Challenges and solutions. Sci. China Earth Sci. 2025, 68, 2976–2991. [Google Scholar] [CrossRef] [Scilit]
- Zuo, R.; Carranza, E.J.M. Machine Learning-Based Mapping for Mineral Exploration. Math. Geosci. 2023, 55, 891–895. [Google Scholar] [CrossRef] [Scilit]
- Abedini, M.; Ziaii, M.; Timkin, T.; Pour, A.B. Machine Learning (ML)-Based Copper Mineralization Prospectivity Mapping (MPM) Using Mining Geochemistry Method and Remote Sensing Satellite Data. Remote Sens. 2023, 15, 3708. [Google Scholar] [CrossRef] [Scilit]
- Alexandre, P.; Salvi, S. Mineral Chemistry of Li-Bearing Minerals at the Giant Tanco Pegmatite, Canada. Minerals 2025, 15, 221. [Google Scholar] [CrossRef] [Scilit]
- Senanayake, I.P.; Kiem, A.S.; Hancock, G.R.; Metelka, V.; Folkes, C.B.; Blevin, P.L.; Budd, A.R. A Spatial Data-Driven Approach for Mineral Prospectivity Mapping. Remote Sens. 2023, 15, 4074. [Google Scholar] [CrossRef] [Scilit]
- Zeng, Y.; Zhou, X.; Yang, Y.; Liu, X.; Yang, J. Application prospect of machine learning bridging rock/lithology identification and engineering rock mass characterization: A review. Tunn. Undergr. Space Technol. 2026, 174, 107693. [Google Scholar] [CrossRef] [Scilit]
- Sudharsan, S.; Hemalatha, R.; Radha, S. Deep learning techniques for hyperspectral imaging classification: Challenges and opportunities. Environ. Earth Sci. 2026, 85, 223. [Google Scholar] [CrossRef] [Scilit]
- Mammoliti, E.; Pepi, A.; Fronzi, D.; Morelli, S.; Volatili, T.; Tazioli, A.; Francioni, M. 3D Discrete Fracture Network Modelling from UAV Imagery Coupled with Tracer Tests to Assess Fracture Conductivity in an Unstable Rock Slope: Implications for Rockfall Phenomena. Remote Sens. 2023, 15, 1222. [Google Scholar] [CrossRef] [Scilit]
- Qudsi, I.; Corlett, H.; Koeshidayatullah, A. Leveraging generative AI and hyperspectral drill-core imaging for fully automated mineral mapping of unconventional reservoir. Appl. Comput. Geosci. 2025, 28, 100298. [Google Scholar] [CrossRef] [Scilit]
- Li, D.; Zhao, J.; Liu, Z. A Novel Method of Multitype Hybrid Rock Lithology Classification Based on Convolutional Neural Networks. Sensors 2022, 22, 1574. [Google Scholar] [CrossRef] [Scilit] [PubMed]
- Koeshidayatullah, A.; Al-Azani, S.; Baraboshkin, E.E.; Alfarraj, M. FaciesViT: Vision transformer for an improved core lithofacies prediction. Front. Earth Sci. 2022, 10, 992442. [Google Scholar] [CrossRef] [Scilit]
- Fan, G.; Chen, F.; Chen, D.; Li, Y.; Dong, Y. A Deep Learning Model for Quick and Accurate Rock Recognition with Smartphones. Mob. Inf. Syst. 2020, 2020, 7462524. [Google Scholar] [CrossRef] [Scilit]
- Roder, M.; Pereira, C.R.; Papa, J.P.; de Mello Junior, A.F.; de Rezende, M.F.; Silva, Y.M.P.; Vidal, A. Vision transformers as SOTA models for lithological classification of Brazilian pre-salt rocks. Appl. Comput. Geosci. 2025, 28, 100301. [Google Scholar] [CrossRef] [Scilit]
- Qin, S.; Wang, Q.; Zeng, Q.; Ye, M.; Fu, A.; Chen, G. Automatic recognition of debris rock lithology based on unsupervised semantic segmentation. Comput. Geosci. 2025, 196, 105790. [Google Scholar] [CrossRef] [Scilit]
- Hajaj, S.; El Harti, A.; Pour, A.B.; Jellouli, A.; Adiri, Z.; Hashim, M. A review on hyperspectral imagery application for lithological mapping and mineral prospecting: Machine learning techniques and future prospects. Remote Sens. Appl. Soc. Environ. 2024, 35, 101218. [Google Scholar] [CrossRef] [Scilit]
- Lee, S.; Moon, I. Recent Advances and Future Perspectives of AI-Based Mineral Exploration: A Review of Machine Learning, Deep Learning, and Geologically Informed Approaches. Minerals 2026, 16, 584. [Google Scholar] [CrossRef] [Scilit]
- Yuan, M.; Li, Q.; Zhang, B.; Pan, J.; Gao, L.; Jing, L.; Lu, L. A systematic review of deep learning methods for mineral exploration using multisource geoscience data (2018–2025). Int. J. Appl. Earth Obs. Geoinf. 2026, 149, 105254. [Google Scholar] [CrossRef] [Scilit]
- Page, M.J.; McKenzie, J.E.; Bossuyt, P.M.; Boutron, I.; Hoffmann, T.C.; Mulrow, C.D.; Shamseer, L.; Tetzlaff, J.M.; Akl, E.A.; Brennan, S.E.; et al. The PRISMA 2020 statement: An updated guideline for reporting systematic reviews. BMJ 2021, 372, n71. [Google Scholar] [CrossRef] [Scilit] [PubMed]
- Nwaila, G.T.; Zhang, S.E.; Bourdeau, J.E.; Ghorbani, Y.; Carranza, E.J.M. Artificial intelligence-based anomaly detection of the Assen iron deposit in South Africa using remote sensing data from the Landsat-8 Operational Land Imager. Artif. Intell. Geosci. 2022, 3, 71–85. [Google Scholar] [CrossRef] [Scilit]
- Luo, S.; Yin, S.; Chen, J.; Wu, Y.; Chen, X. Lithology Identification of UAV Oblique Photography Images Based on Semantic Segmentation Neural Network Algorithm. Math. Geosci. 2024, 56, 1053–1072. [Google Scholar] [CrossRef] [Scilit]
- Liu, L.; Xiao, Z.; Hu, J.; Han, J.; Kim, J.Y.; Sharma, R.; Li, C. FSBNet: A Classifying Framework of Disaster Scene for Volcanic Lithology Through Deep-Learning Models. IEEE J. Sel. Top. Appl. Earth Obs. Remote Sens. 2025, 18, 15101–15115. [Google Scholar] [CrossRef] [Scilit]
- Li, C.; Wu, C.; Liu, L.; Yan, L.; Kim, J.Y.; Liu, X.; Han, J.; Zhao, J. MIFFNet: Feature fusion-oriented classification of volcanic lithology from remote sensing image. Alex. Eng. J. 2025, 115, 538–552. [Google Scholar] [CrossRef] [Scilit]
- Ouyang, S.; Chen, W.; Qin, X.; Yang, J. Geological Background Prototype Learning-Enhanced Network for Remote-Sensing-Based Engineering Geological Lithology Interpretation in Highly Vegetated Areas. IEEE J. Sel. Top. Appl. Earth Obs. Remote Sens. 2024, 17, 8794–8809. [Google Scholar] [CrossRef] [Scilit]
- Bentahar, I.; Si Mhamdi, H.; Bentahar, I.; Raji, M. Integrated Sentinel-2 and Landsat-9 data for high-resolution lithological mapping in the Rich High Atlas (Morocco) using machine learning and deep learning. J. Afr. Earth. Sci. 2026, 240, 106132. [Google Scholar] [CrossRef] [Scilit]
- Shirmard, H.; Farahbakhsh, E.; Heidari, E.; Beiranvand Pour, A.; Pradhan, B.; Müller, D.; Chandra, R. A Comparative Study of Convolutional Neural Networks and Conventional Machine Learning Models for Lithological Mapping Using Remote Sensing Data. Remote Sens. 2022, 14, 819. [Google Scholar] [CrossRef] [Scilit]
- El-Desoky, H.M.; Bachri, I.; El Mezayen, A.M.; Abdel-Rahman, A.M.; El-Awny, H.; El-Gammal, A.A.; Alshehri, F.; Almadani, S. An integrated remote sensing, petrology, and field geology analyses for Neoproterozoic basement rocks in some parts of the southern Egyptian-Nubian Shield. Sci. Rep. 2024, 14, 14761. [Google Scholar] [CrossRef] [Scilit] [PubMed]
- Liu, H.; Huang, X.; Wang, W. Lithological Mapping in Plateau Regions by Integrating Spectral Feature Selection and Deep Learning: A Case Study of the Gonjo Area, Tibet. Remote Sens. 2026, 18, 1621. [Google Scholar] [CrossRef] [Scilit]
- Hajaj, S.; El Harti, A.; Jellouli, A.; Pour, A.B.; Mnissar Himyari, S.; Hamzaoui, A.; Hashim, M. Evaluating the Performance of Machine Learning and Deep Learning Techniques to HyMap Imagery for Lithological Mapping in a Semi-Arid Region: Case Study from Western Anti-Atlas, Morocco. Minerals 2023, 13, 766. [Google Scholar] [CrossRef] [Scilit]
- Gul, N.; Frnda, J.; Minallah, N.; Sher, M. Mapping Afghanistan’s Mineral Diversity With NASA EMIT Hyperspectral Data: Spatial–Spectral Transformer Versus CNN for Geo-Mineralogical Classification. IEEE J. Sel. Top. Appl. Earth Obs. Remote Sens. 2026, 19, 17209–17223. [Google Scholar] [CrossRef] [Scilit]
- Lu, J.; Li, L.; Wang, J.; Han, L.; Tang, F.; Xia, Z.; Liu, Z. Lithological mapping in semi-arid shallow-covered areas using a multi-scale temporal dual attention network. Int. J. Appl. Earth Obs. Geoinf. 2026, 149, 105292. [Google Scholar] [CrossRef] [Scilit]
- Liu, J.; Wei, Z.; Gong, X.; Sun, M.; Cheng, Y.; Zhang, Y.; Zhang, Z. Lithological Mapping from UAV Imagery Based on Lightweight Semantic Segmentation Methods. Drones 2025, 9, 866. [Google Scholar] [CrossRef] [Scilit]
- Afifi, A.J.; Thiele, S.T.; Rizaldy, A.; Lorenz, S.; Ghamisi, P.; Tolosana-Delgado, R.; Kirsch, M.; Gloaguen, R.; Heizmann, M. Tinto: Multisensor Benchmark for 3-D Hyperspectral Point Cloud Segmentation in the Geosciences. IEEE Trans. Geosci. Remote Sens. 2024, 62, 5501015. [Google Scholar] [CrossRef] [Scilit]
- Iqbal, U.; Giacomini, A.; Thoeni, K. Automated Lithology Segmentation of 3D Point Clouds from Highwalls Using Deep Learning. Remote Sens. 2025, 17, 3835. [Google Scholar] [CrossRef] [Scilit]
- Wang, Z.; Zuo, R.; Liu, H. Lithological Mapping Based on Fully Convolutional Network and Multi-Source Geological Data. Remote Sens. 2021, 13, 4860. [Google Scholar] [CrossRef] [Scilit]
- Fan, Z.; Xiong, S.; Ge, T.; He, J.; Yang, X.; Liu, Y.; Luo, J. Mineral prospectivity prediction from airborne magnetic data based on the RPCA-ResNet hybrid learning framework. J. Asian Earth Sci. 2025, 292, 106718. [Google Scholar] [CrossRef] [Scilit]
- Wang, M.; Zhao, J.; Wan, J.; Sui, Y.; Chang, L.; Wang, B.; Zhao, Y.; Zhu, H. Mineral prospectivity mapping for Gejiu tin district using random forest and convolutional neural network methods. J. Asian Earth Sci. X 2026, 15, 100223. [Google Scholar] [CrossRef] [Scilit]
- Fu, D.; Su, C.; Wang, W.; Yuan, R. Deep learning based lithology classification of drill core images. PLoS ONE 2022, 17, e0270826. [Google Scholar] [CrossRef] [Scilit] [PubMed]
- Boiger, R.; Churakov, S.V.; Ballester Llagaria, I.; Kosakowski, G.; Wüst, R.; Prasianakis, N.I. Direct mineral content prediction from drill core images via transfer learning. Swiss J. Geosci. 2024, 117, 8. [Google Scholar] [CrossRef] [Scilit]
- Park, J.; Jeong, J. Assessment of the effectiveness of a convolutional autoencoder for digital image-based automated core logging. Geoenergy Sci. Eng. 2023, 227, 211802. [Google Scholar] [CrossRef] [Scilit]
- Zhang, Z.; Tang, J.; Fan, B.; Zhao, X.; Jin, F.; Chen, C.; Chen, Z.; Chen, S.; Song, Y.; Yang, J. An intelligent lithology recognition system for continental shale by using digital coring images and convolutional neural networks. Geoenergy Sci. Eng. 2024, 239, 212909. [Google Scholar] [CrossRef] [Scilit]
- Pires de Lima, R.; Suriamin, F.; Marfurt, K.J.; Pranter, M.J. Convolutional neural networks as aid in core lithofacies classification. Interpretation 2019, 7, SF27–SF40. [Google Scholar] [CrossRef] [Scilit]
- Chawshin, K.; Berg, C.F.; Varagnolo, D.; Lopez, O. Lithology classification of whole core CT scans using convolutional neural networks. SN Appl. Sci. 2021, 3, 668. [Google Scholar] [CrossRef] [Scilit]
- Liu, J.; Chen, W.; Muller, M.; Chalup, S.; Wheeler, C. An automatic HyLoggerTM mineral mapping method using a machine-learning-based computer vision technique. Aust. J. Earth Sci. 2019, 66, 1063–1073. [Google Scholar] [CrossRef] [Scilit]
- Hamedianfar, A.; Laakso, K.; Middleton, M.; Törmänen, T.; Köykkä, J.; Torppa, J. Leveraging High-Resolution Long-Wave Infrared Hyperspectral Laboratory Imaging Data for Mineral Identification Using Machine Learning Methods. Remote Sens. 2023, 15, 4806. [Google Scholar] [CrossRef] [Scilit]
- Zhang, L.; Zhang, M.; Huang, J.; Zhang, C.; Ye, F.; Pan, W. A New Approach for Mineral Mapping Using Drill-Core Hyperspectral Image. IEEE Geosci. Remote Sens. Lett. 2023, 20, 5511705. [Google Scholar] [CrossRef] [Scilit]
- Wang, H. Intelligent identification of logging cuttings based on deep learning. Energy Rep. 2022, 8, 1–7. [Google Scholar] [CrossRef] [Scilit]
- Becerra, D.; Pires de Lima, R.; Galvis-Portilla, H.; Clarkson, C.R. Generating a labeled data set to train machine learning algorithms for lithologic classification of drill cuttings. Interpretation 2022, 10, SE85–SE100. [Google Scholar] [CrossRef] [Scilit]
- Olsen, N.; Chen, Y.; Turberg, P.; Moreau, A.; Alahi, A. X-ray Micro-CT based characterization of rock cuttings with deep learning. Appl. Comput. Geosci. 2025, 25, 100220. [Google Scholar] [CrossRef] [Scilit]
- Chen, Y.; Yi, Y.; Dai, Y.; Shi, X. A multiangle polarised imaging-based method for thin section segmentation. J. Microsc. 2024, 294, 14–25. [Google Scholar] [CrossRef] [Scilit] [PubMed]
- Çenet, R.; Ünsal, E.; Canbaz, O. Classification of Hydrothermal Alteration Types from Thin-Section Images Using Deep Convolutional Neural Networks. Appl. Sci. 2025, 15, 12274. [Google Scholar] [CrossRef] [Scilit]
- Yang, W.; Li, A.; Zhang, L.; Qin, X. Deep Learning-Based Intelligent Analysis of Rock Thin Sections: From Cross-Scale Lithology Classification to Grain Segmentation for Quantitative Fabric Characterization. Electronics 2026, 15, 1509. [Google Scholar] [CrossRef] [Scilit]
- Wang, C.; Li, P.; Long, Q.; Chen, H.; Wang, P.; Meng, Z.; Wang, X.; Zhou, Y. Deep Learning for Refined Lithology Identification of Sandstone Microscopic Images. Minerals 2024, 14, 275. [Google Scholar] [CrossRef] [Scilit]
- Xu, Z.; Ma, W.; Lin, P.; Hua, Y. Deep learning of rock microscopic images for intelligent lithology identification: Neural network comparison and selection. J. Rock Mech. Geotech. Eng. 2022, 14, 1140–1152. [Google Scholar] [CrossRef] [Scilit]
- Mahmoudi, S.; Asghari, O.; Boisvert, J. Addressing class imbalance in micro-CT image segmentation: A modified U-Net model with pixel-level class weighting. Comput. Geosci. 2025, 196, 105853. [Google Scholar] [CrossRef] [Scilit]
- Galdames, F.J.; Perez, C.A.; Estévez, P.A.; Adams, M. Rock lithological instance classification by hyperspectral images using dimensionality reduction and deep learning. Chemom. Intell. Lab. Syst. 2022, 224, 104538. [Google Scholar] [CrossRef] [Scilit]
- Han, S.; Wan, Z.; Deng, J.; Zhang, C.; Liu, X.; Zhu, T.; Zhao, J. RSWFormer: A Multi-Scale Fusion Network from Local to Global with Multiple Stages for Regional Geological Mapping. Remote Sens. 2024, 16, 2548. [Google Scholar] [CrossRef] [Scilit]
- Kouame, J.P.; Chen, J.; Kouame, K.; Kouame, K.J.; Danumah, J.H.; Indrick, A.A.; Kossou Beugre, Y.B. Geodata fusion and deep learning-based improved lithological mapping: A case study from the autonomous district of Yamoussoukro. Sci. Remote Sens. 2026, 13, 100411. [Google Scholar] [CrossRef] [Scilit]
- Tsangaratos, P.; Vakalas, I.; Zanarini, I. Distinguishing Lithofacies of Flysch Formations Using Deep Learning Models: Integrating Remote Sensing Data with Morphological Indexes. Remote Sens. 2025, 17, 422. [Google Scholar] [CrossRef] [Scilit]
- Farahbakhsh, E.; Goel, D.; Pimparkar, D.; Müller, R.D.; Chandra, R. Convolutional Neural Networks for Mineral Prospecting Through Alteration Mapping with Remote Sensing Data. PFG—J. Photogramm. Remote Sens. Geoinf. Sci. 2025, 93, 379–400. [Google Scholar] [CrossRef] [Scilit]
- Silva dos Santos, V.; Gloaguen, E.; Tirdad, S. Lithological mapping using Spatially Constrained Bayesian Network (SCB-Net): A deep learning model for generating field-data-constrained predictions with uncertainty evaluation using remote sensing data. Comput. Geosci. 2025, 204, 105964. [Google Scholar] [CrossRef] [Scilit]
- Luo, Z.; Farahbakhsh, E.; Hore, S.; Müller, R.D. DEEP-SEAM: An explainable semi-supervised deep learning framework for mineral prospectivity mapping. Geosci. Model Dev. 2026, 19, 2593–2625. [Google Scholar] [CrossRef] [Scilit]
- Li, J.-Y.; Tang, J.-Z.; Zhao, X.-Z.; Fan, B.; Jiang, W.-Y.; Song, S.-Y.; Li, J.-B.; Chen, K.-D.; Zhao, Z.-G. A large-scale, high-quality dataset for lithology identification: Construction and applications. Pet. Sci. 2025, 22, 3207–3228. [Google Scholar] [CrossRef] [Scilit]
- Matimbi, D.K.; Carranza, E.J.M. Integration of drill-core hyperspectral and geochemical data by deep learning to enhance drill-core mineral mapping. Appl. Comput. Geosci. 2026, 31, 100372. [Google Scholar] [CrossRef] [Scilit]
- Abdullah, M.A.M.; Mohammed, A.A.; Awad, S.R. RockDNet: Deep Learning Approach for Lithology Classification. Appl. Sci. 2024, 14, 5511. [Google Scholar] [CrossRef] [Scilit]
- Zhou, G.; Chen, W.; Qin, X.; Li, J.; Wang, L. Lithological Unit Classification Based on Geological Knowledge-Guided Deep Learning Framework for Optical Stereo Mapping Satellite Imagery. IEEE Trans. Geosci. Remote Sens. 2023, 61, 5624916. [Google Scholar] [CrossRef] [Scilit]
- Árvai, V.; Albert, G. Lightweight Deep Learning Approaches for Lithological Mapping in Vegetated Terrains of the Vălioara Valley, Romania. ISPRS Int. J. Geo-Inf. 2025, 14, 350. [Google Scholar] [CrossRef] [Scilit]
- Atangana Otele, C.G.; Akong Onabid, M.; Assembe, P.S. Design and implementation of an Automatic Deep Stacked Sparsely Connected Convolutional Autoencoder (ADSSCCA) neural network for remote sensing lithological mapping using calculated dropout. Earth Sci. Inf. 2024, 17, 1993–2010. [Google Scholar] [CrossRef] [Scilit]
- Agrawal, N.; Govil, H. A deep residual convolutional neural network for mineral classification. Adv. Space Res. 2023, 71, 3186–3202. [Google Scholar] [CrossRef] [Scilit]
- Feng, X.; Huang, J.; Chen, X.; Zhou, H.; Zhang, M.; Zhang, C.; Ye, F. Research on hyperspectral remote sensing alteration mineral mapping using an improved ViT model. Comput. Geosci. 2026, 206, 106037. [Google Scholar] [CrossRef] [Scilit]
- Khandouch, Y.; Hajaj, S.; El Harti, A.; Pour, A.B.; Laamrani, A.; Ouzemou, J.-E.; Flah, A.; Ghazouani, N. IL-HS: A deep inception-LSTM architecture for enhanced lithological mapping using EnMAP hyperspectral remote sensing data. Sci. Rep. 2026, 16, 23137. [Google Scholar] [CrossRef] [Scilit] [PubMed]
- Hui, Z.; Wang, R.; Chen, W.; Zhou, G.; Li, J. Lithologic Unit Classification Attention-Based and Multiscale Geology Knowledge-Guided Framework in Vegetated Areas. IEEE Trans. Geosci. Remote Sens. 2025, 63, 4417715. [Google Scholar] [CrossRef] [Scilit]
- Wang, Z.; Xu, M.; Liu, S.; Zheng, H.; Yasir, M.; Tong, Q. A Spatial-Spectral Component Representation Network for Fine-Grained Mineral Classification in Hyperspectral Imagery. IEEE J. Sel. Top. Appl. Earth Obs. Remote Sens. 2026, 19, 17111–17125. [Google Scholar] [CrossRef] [Scilit]
- Guo, D.; Wang, Z.; Zuo, R. Large-scale Himalayan Leucogranite Mapping Based on Multi-source Remote-Sensing Data and U-Net Convolutional Network. Nat. Resour. Res. 2025, 34, 2403–2421. [Google Scholar] [CrossRef] [Scilit]
- Wu, Z.; Chen, C.; Yu, Y.; Tian, Y.; Yu, J.; Xia, F. Semantic Segmentation of Pegmatite Dikes in High-Resolution Remote Sensing Imagery Using GAD-UNet++ in the Yilanlike Area, South Tianshan. Remote Sens. 2026, 18, 1988. [Google Scholar] [CrossRef] [Scilit]
- Vasuki, Y.; Holden, E.-J.; Kovesi, P.; Micklethwaite, S. An interactive image segmentation method for lithological boundary detection: A rapid mapping tool for geologists. Comput. Geosci. 2017, 100, 27–40. [Google Scholar] [CrossRef] [Scilit]
- Liu, B.; AlSalmi, H.; John, C.M. CAGEY (CArbonate Grain Estimation with YOLO): Object detection for grain size, roundness, and dunham classification. Appl. Comput. Geosci. 2026, 29, 100329. [Google Scholar] [CrossRef] [Scilit]
- Bang, S.; Keum, J.-Y.; Ji, Y.; Kang, Y.J.; So, B.-D.; Hong, J.K.; Kim, H.-I. Application of YOLOv11 deep learning model for classification and counting ice-rafted debris (IRD) in core sediments in the Arctic Ocean. Artif. Intell. Geosci. 2026, 7, 100191. [Google Scholar] [CrossRef] [Scilit]
- Mielke, C.; Rogass, C.; Boesche, N.; Segl, K.; Altenberger, U. EnGeoMAP 2.0—Automated Hyperspectral Mineral Identification for the German EnMAP Space Mission. Remote Sens. 2016, 8, 127. [Google Scholar] [CrossRef] [Scilit]
- Qin, Y.; Zhang, X.; Zhao, Z.; Li, Z.; Yang, C.; Huang, Q. Coupling relationship analysis of gold content using Gaofen-5 (GF-5) satellite hyperspectral remote Sensing Data: A potential method in Chahuazhai Gold Mining Area, Qiubei county, SW China. Remote Sens. 2022, 14, 109. [Google Scholar] [CrossRef] [Scilit]
- Mohamed Taha, A.M.; Obaid, Y.Y.; Liu, G.; Chen, Q.; Xu, K.; Cui, Z. Advancing Data-Driven Mineral Prospectivity Mapping: Benchmarking Deep Forest Against Deep Neural Network Models. Math. Geosci. 2026, 58, 143–174. [Google Scholar] [CrossRef] [Scilit]
- Mahboob, M.A.; Celik, T.; Genc, B. Predictive modelling of mineral prospectivity using satellite remote sensing and machine learning algorithms. Remote Sens. Appl. Soc. Environ. 2024, 36, 101316. [Google Scholar] [CrossRef] [Scilit]
- Zhou, Y.; Wang, Y.; Wen, S.; Zhang, G.; Li, Y. Geo-U-Mamba: A Mamba-Based Framework for Mineral Prospectivity Mapping of Gold Exploration Using Multi-Source Geoscientific Data. Remote Sens. 2026, 18, 2068. [Google Scholar] [CrossRef] [Scilit]
- Rasoolijaberi, M.; Zeng, C.; Manchuk, J.; Legat, M.; Jackson-Gain, A. SulfideNet: Deep Learning for Detection and Quantification of Iron Sulfides in Drill Core Scans. IEEE J. Sel. Top. Appl. Earth Obs. Remote Sens. 2025, 18, 17080–17091. [Google Scholar] [CrossRef] [Scilit]
- Yuan, Y.; Zhou, S.; Bian, J.; Wang, J.; Han, W.; Yan, J. High-Resolution Geochemical Data Mapping With Swin Transformer-Convolution-Based Multisource Geoscience Data Fusion. IEEE J. Sel. Top. Appl. Earth Obs. Remote Sens. 2025, 18, 3530–3543. [Google Scholar] [CrossRef] [Scilit]
- Li, J.; Hu, Q.; Ai, M. Multispectral and panchromatic image fusion based on spatial consistency. Int. J. Remote Sens. 2018, 39, 1017–1041. [Google Scholar] [CrossRef] [Scilit]
- Dong, Y.; Yang, Z.; Liu, Q.; Zuo, R.; Wang, Z. Fusion of GaoFen-5 and Sentinel-2B data for lithological mapping using vision transformer dynamic graph convolutional network. Int. J. Appl. Earth Obs. Geoinf. 2024, 129, 103780. [Google Scholar] [CrossRef] [Scilit]
- Chen, Q.; Zhao, Z.-F.; Xia, J.-S.; Zhao, X.; Yang, H.-Y.; Zhang, X.-L. Improving the accuracy of hydrothermal alteration mapping based on image fusion of ASTER and Sentinel-2A data: A case study of Pulang Cu deposit, Southwest China. Geocarto Int. 2022, 37, 13923–13948. [Google Scholar] [CrossRef] [Scilit]
- Yuan, L.; Wu, Z.; Xu, Z.; Huang, J.; Li, H.; Zhang, Z.; Jiang, H.; Yan, Z.; Huang, Y.; Jin, W. Remote sensing interpretation of surface linear-ring structures and wall-rock alteration in the Lingshan area, Shangrao City, Jiangxi Province, China: Implications for mineral prospecting. Geocarto Int. 2025, 40, 2584954. [Google Scholar] [CrossRef] [Scilit]
- Kim, N.; Choi, I.S.; Han, S.S.; Jeong, C.S. DA-Net: Dual Attention Network for Haze Removal in Remote Sensing Image. IEEE Access 2024, 12, 136297–136312. [Google Scholar] [CrossRef] [Scilit]
- Qaderi, S.; Maghsoudi, A.; Pour, A.B.; Yousefi, M. Satellite-based remote sensing analysis for the exploration of MVT Pb-Zn mineralization using an integrated approach of minimum distance classification, deep autoencoder and fuzzy logic modeling. Remote Sens. Appl. Soc. Environ. 2025, 38, 101561. [Google Scholar] [CrossRef] [Scilit]
- Wang, Z.; Zuo, R. An Evaluation of Convolutional Neural Networks for Lithological Mapping Based on Hyperspectral Images. IEEE J. Sel. Top. Appl. Earth Obs. Remote Sens. 2024, 17, 6414–6425. [Google Scholar] [CrossRef] [Scilit]
- Liu, H.; Zhang, H.; Yang, R. Lithological Classification by Hyperspectral Remote Sensing Images Based on Double-Branch Multiscale Dual-Attention Network. IEEE J. Sel. Top. Appl. Earth Obs. Remote Sens. 2024, 17, 14726–14741. [Google Scholar] [CrossRef] [Scilit]
- Yu, J.; Zhang, L.; Li, Q.; Li, Y.; Huang, W.; Sun, Z.; Ma, Y.; He, P. 3D autoencoder algorithm for lithological mapping using ZY-1 02D hyperspectral imagery: A case study of Liuyuan region. J. Appl. Remote Sens. 2021, 15, 042610. [Google Scholar] [CrossRef] [Scilit]
- Li, S.; Lin, P.; Yang, K.; Xu, Z. In situ, non-destructive and rapid mineral mapping in tunnels with hyperspectral imaging. Undergr. Space 2026, 27, 301–320. [Google Scholar] [CrossRef] [Scilit]
- Hajaj, S.; Harti, A.E.; Pour, A.B.; Khandouch, Y.; Benaouiss, N.; Hashim, M.; Habashi, J.; Almasi, A. Recurrent-spectral convolutional neural networks (RecSpecCNN) architecture for hyperspectral lithological classification optimization. Earth Sci. Inf. 2024, 18, 125. [Google Scholar] [CrossRef] [Scilit]
- Ma, Y.; Wang, S.; Du, W.; Cheng, X. An Improved 3D-2D Convolutional Neural Network Based on Feature Optimization for Hyperspectral Image Classification. IEEE Access 2023, 11, 28263–28279. [Google Scholar] [CrossRef] [Scilit]
- Bahrami, Y.; Hassani, H.; Maghsoudi, A. Precise Lithological Mapping Using HHO-Optimized Deep ResNet-18 and GoogleNet CNN Models. Nat. Resour. Res. 2025, 34, 2467–2507. [Google Scholar] [CrossRef] [Scilit]
- El Atıllah, A.; El Atıllah, M.; El Morjanı, Z.E.A.; El Fazazy, K.; Souhassou, M. Segmentation and classification algorithms applied to sentinel-2A images for geological mapping: Case of the Al Glo’a sheet (1/50000), Morocco. Bull. Mineral. Res. Explor. 2021, 166, 113–125. [Google Scholar] [CrossRef] [Scilit]
- Wang, W.; Xue, C.; Zhao, J.; Yuan, C.; Tang, J. Machine learning-based field geological mapping: A new exploration of geological survey data acquisition strategy. Ore Geol. Rev. 2024, 166, 105959. [Google Scholar] [CrossRef] [Scilit]
- Liu, L.; Shao, Y.; Shao, Y.; Li, P.; Yang, Q.; Zeng, R. MC-H-Geo: A Multi-Scale Contextual Hierarchical Framework for Fine-Grained Lithology Classification. Sensors 2025, 25, 6859. [Google Scholar] [CrossRef] [Scilit] [PubMed]
- Chen, X.; Hassan, M.A.; Fu, X. Convolutional neural networks for image-based sediment detection applied to a large terrestrial and airborne dataset. Earth Surf. Dynam. 2022, 10, 349–366. [Google Scholar] [CrossRef] [Scilit]
- Liu, H.; Wu, K.; Zhou, D.; Xu, Y. A Novel Sample Generation Method for Deep Learning Lithological Mapping with Airborne TASI Hyperspectral Data in Northern Liuyuan, Gansu, China. Remote Sens. 2024, 16, 2852. [Google Scholar] [CrossRef] [Scilit]
- Xu, Z.; Li, S.; Lin, P.; Li, Q. Intelligent lithology identification via spectral-image fusion. Undergr. Space 2025, 25, 327–349. [Google Scholar] [CrossRef] [Scilit]
- Wu, S.; Liu, Y. Interpretable Dual-Channel Convolutional Neural Networks for Lithology Identification Based on Multisource Remote Sensing Data. Remote Sens. 2025, 17, 1314. [Google Scholar] [CrossRef] [Scilit]
- Pan, T.; Zuo, R.; Wang, Z. Geological Mapping via Convolutional Neural Network Based on Remote Sensing and Geochemical Survey Data in Vegetation Coverage Areas. IEEE J. Sel. Top. Appl. Earth Obs. Remote Sens. 2023, 16, 3485–3494. [Google Scholar] [CrossRef] [Scilit]
- Li, D.; Wang, J.; Zhou, K.; Bi, J.; Zhang, Q.; Wang, W.; Qu, G.; Li, C.; Qiu, H.; Liao, T.; et al. Application of Hybrid Attention Mechanisms in Lithological Classification with Multisource Data: A Case Study from the Altay Orogenic Belt. Remote Sens. 2024, 16, 3958. [Google Scholar] [CrossRef] [Scilit]
- Wang, Y.; Xiao, K.; Tang, R.; Zhang, Q. Lithological Mapping Based on Multi-Source Fusion Data and Convolutional Neural Networks: A Case Study of the Guyang Area, Inner Mongolia, China. Appl. Sci. 2026, 16, 4003. [Google Scholar] [CrossRef] [Scilit]
- Zhang, Z.; Xu, Y.; Chen, J. Method of Convolutional Neural Networks for Lithological Classification Using Multisource Remote Sensing Data. Remote Sens. 2026, 18, 29. [Google Scholar] [CrossRef] [Scilit]
- Wang, Z.; Zuo, R.; Kreuzer, O.P. Uncertainty Quantification of Deep Learning Algorithms for Lithological Mapping. Math. Geosci. 2026, 58, 503–531. [Google Scholar] [CrossRef] [Scilit]
- Fu, Y.; Cheng, Q.; Jing, L.; Ye, B.; Fu, H. Mineral Prospectivity Mapping of Porphyry Copper Deposits Based on Remote Sensing Imagery and Geochemical Data in the Duolong Ore District, Tibet. Remote Sens. 2023, 15, 439. [Google Scholar] [CrossRef] [Scilit]
- Zidan, U.; Desouky, H.A.E.; Gaber, M.M.; Abdelsamea, M.M. From Pixels to Deposits: Porphyry Mineralization With Multispectral Convolutional Neural Networks. IEEE J. Sel. Top. Appl. Earth Obs. Remote Sens. 2023, 16, 9259–9271. [Google Scholar] [CrossRef] [Scilit]
- Jia, Z.; Huang, M.; Xu, H.; Du, W.; Li, Y. Pole Transformation of Magnetic Data Using CNN-Based Deep Learning Models. IEEE Trans. Geosci. Remote Sens. 2025, 63, 5908710. [Google Scholar] [CrossRef] [Scilit]
- Ye, B.; Tian, S.; Cheng, Q.; Ge, Y. Application of Lithological Mapping Based on Advanced Hyperspectral Imager (AHSI) Imagery Onboard Gaofen-5 (GF-5) Satellite. Remote Sens. 2020, 12, 3990. [Google Scholar] [CrossRef] [Scilit]
- Liu, H.; Wu, K.; Xu, H.; Xu, Y. Lithology Classification Using TASI Thermal Infrared Hyperspectral Data with Convolutional Neural Networks. Remote Sens. 2021, 13, 3117. [Google Scholar] [CrossRef] [Scilit]
- He, K.; Dong, J.; Ma, H.; Cai, Y.; Feng, R.; Dong, Y.; Wang, L. Remote sensing image interpretation of geological lithology via a sensitive feature self-aggregation deep fusion network. Int. J. Appl. Earth Obs. Geoinf. 2025, 137, 104384. [Google Scholar] [CrossRef] [Scilit]
- Han, W.; Fu, Z.; Xiao, S.; Zheng, X.; Huang, X.; Wang, Y.; Yan, J.; Wang, S.; Yan, D. Dual-Model Collaboration Consistency Semi-Supervised Learning for Few-Shot Lithology Interpretation. IEEE Trans. Geosci. Remote Sens. 2024, 62, 4514114. [Google Scholar] [CrossRef] [Scilit]
- Sang, X.; Xue, L.; Ran, X.; Li, X.; Liu, J.; Liu, Z. Intelligent High-Resolution Geological Mapping Based on SLIC-CNN. ISPRS Int. J. Geo-Inf. 2020, 9, 99. [Google Scholar] [CrossRef] [Scilit]
- Zhang, Z.; Wang, M.; Qi, Y.; Su, X.; Kong, D. Deep Learning-Based Methods for Lithology Classification and Identification in Remote Sensing Images. IEEE Access 2025, 13, 3038–3050. [Google Scholar] [CrossRef] [Scilit]
- Jan, N.; Minallah, N.; Sher, M.; Wasim, M.; Khan, S.; Al-Rasheed, A.; Ali, H. Advanced Mineral Deposit Mapping via Deep Learning and SVM Integration With Remote Sensing Imaging Data. Eng. Rep. 2025, 7, e13031. [Google Scholar] [CrossRef] [Scilit]
- Li, C.; Han, J.; Pan, X.; Song, Y.; Kim, J.Y.; Liu, Y.; Gu, G.; Liu, Y.; He, Y. AMENet: A semantic segmentation framework for multimodal remote sensing lithology scene images. Int. J. Remote Sens. 2025, 46, 9780–9815. [Google Scholar] [CrossRef] [Scilit]
- Marques, A.; Silva, L.J.S.; Cagliari, J.; Scalco, L.; Silva, L.C.F.D.; Veronez, M.R.; Gonzaga, L. A Lithological Classification Model Based on Fourier Neural Operators and Channel-Wise Self-Attention. IEEE Geosci. Remote Sens. Lett. 2024, 21, 3004305. [Google Scholar] [CrossRef] [Scilit]
- Chen, X.; Liu, Y.; Han, W.; Zheng, X.; Wang, S.; Wang, J.; Wang, L. A vision-language foundation model-based multi-modal retrieval-augmented generation framework for remote sensing lithological recognition. ISPRS J. Photogramm. Remote Sens. 2025, 225, 328–340. [Google Scholar] [CrossRef] [Scilit]
- Taghipour, A.; Scott, R.; Ghahremani, M.; Jessell, M.; Boussaid, F.; Laga, H.; Bennamoun, M. Artificial Intelligence for Mineral Exploration: Methods, Foundation Models, and Future Directions. Preprints 2026, 2026072303. [Google Scholar] [CrossRef] [Scilit]
- Li, X.; Song, Z.; Zhang, M.; Pu, J.; Wang, T. Probabilistic geological body modeling of point cloud based on IMMC-Geo and application. Eng. Geol. 2026, 364, 108603. [Google Scholar] [CrossRef] [Scilit]
- He, L.; Qin, Z.; Tang, Y.; Cai, J.; Xue, C.; Liu, Y.; Liu, Z. PolAlpha-Net: A Lithology Segmentation Network Guided by Polarimetric Decomposition Knowledge for Dual-Polarization SAR Images in Vegetated Areas. IEEE J. Sel. Top. Appl. Earth Obs. Remote Sens. 2026, 19, 15508–15528. [Google Scholar] [CrossRef] [Scilit]
- Shirazi, A.; Hezarkhani, A.; Beiranvand Pour, A.; Shirazy, A.; Hashim, M. Neuro-Fuzzy-AHP (NFAHP) Technique for Copper Exploration Using Advanced Spaceborne Thermal Emission and Reflection Radiometer (ASTER) and Geological Datasets in the Sahlabad Mining Area, East Iran. Remote Sens. 2022, 14, 5562. [Google Scholar] [CrossRef] [Scilit]
- Aali, A.A.; Shirazy, A.; Shirazi, A.; Pour, A.B.; Hezarkhani, A.; Maghsoudi, A.; Hashim, M.; Khakmardan, S. Fusion of Remote Sensing, Magnetometric, and Geological Data to Identify Polymetallic Mineral Potential Zones in Chakchak Region, Yazd, Iran. Remote Sens. 2022, 14, 6018. [Google Scholar] [CrossRef] [Scilit]
- Shabani, A.; Ziaii, M.; Monfared, M.S.; Shirazy, A.; Shirazi, A. Multi-Dimensional Data Fusion for Mineral Prospectivity Mapping (MPM) Using Fuzzy-AHP Decision-Making Method, Kodegan-Basiran Region, East Iran. Minerals 2022, 12, 1629. [Google Scholar] [CrossRef] [Scilit]
- Madokoro, H.; Sato, K.; Nix, S.; Chiyonobu, S.; Nagayoshi, T.; Sato, K. OutcropHyBNet: Hybrid Backbone Networks with Data Augmentation for Accurate Stratum Semantic Segmentation of Monocular Outcrop Images in Carbon Capture and Storage Applications. Sensors 2023, 23, 8809. [Google Scholar] [CrossRef] [Scilit] [PubMed]
- Zuo, R.; Cheng, Q.; Xu, Y.; Yang, F.; Xiong, Y.; Wang, Z.; Kreuzer, O.P. Explainable artificial intelligence models for mineral prospectivity mapping. Sci. China Earth Sci. 2024, 67, 2864–2875. [Google Scholar] [CrossRef] [Scilit]
- Antonini, A.S.; Tanzola, J.; Asiain, L.; Ferracutti, G.R.; Castro, S.M.; Bjerg, E.A.; Ganuza, M.L. Machine Learning model interpretability using SHAP values: Application to Igneous Rock Classification task. Appl. Comput. Geosci. 2024, 23, 100178. [Google Scholar] [CrossRef] [Scilit]
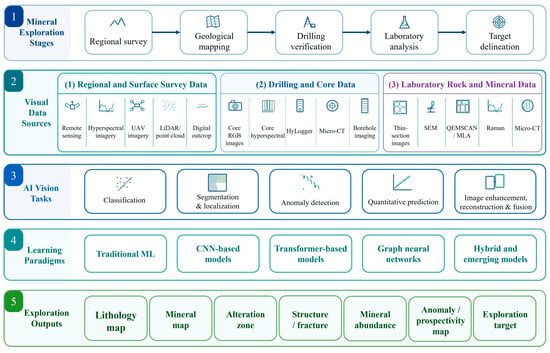
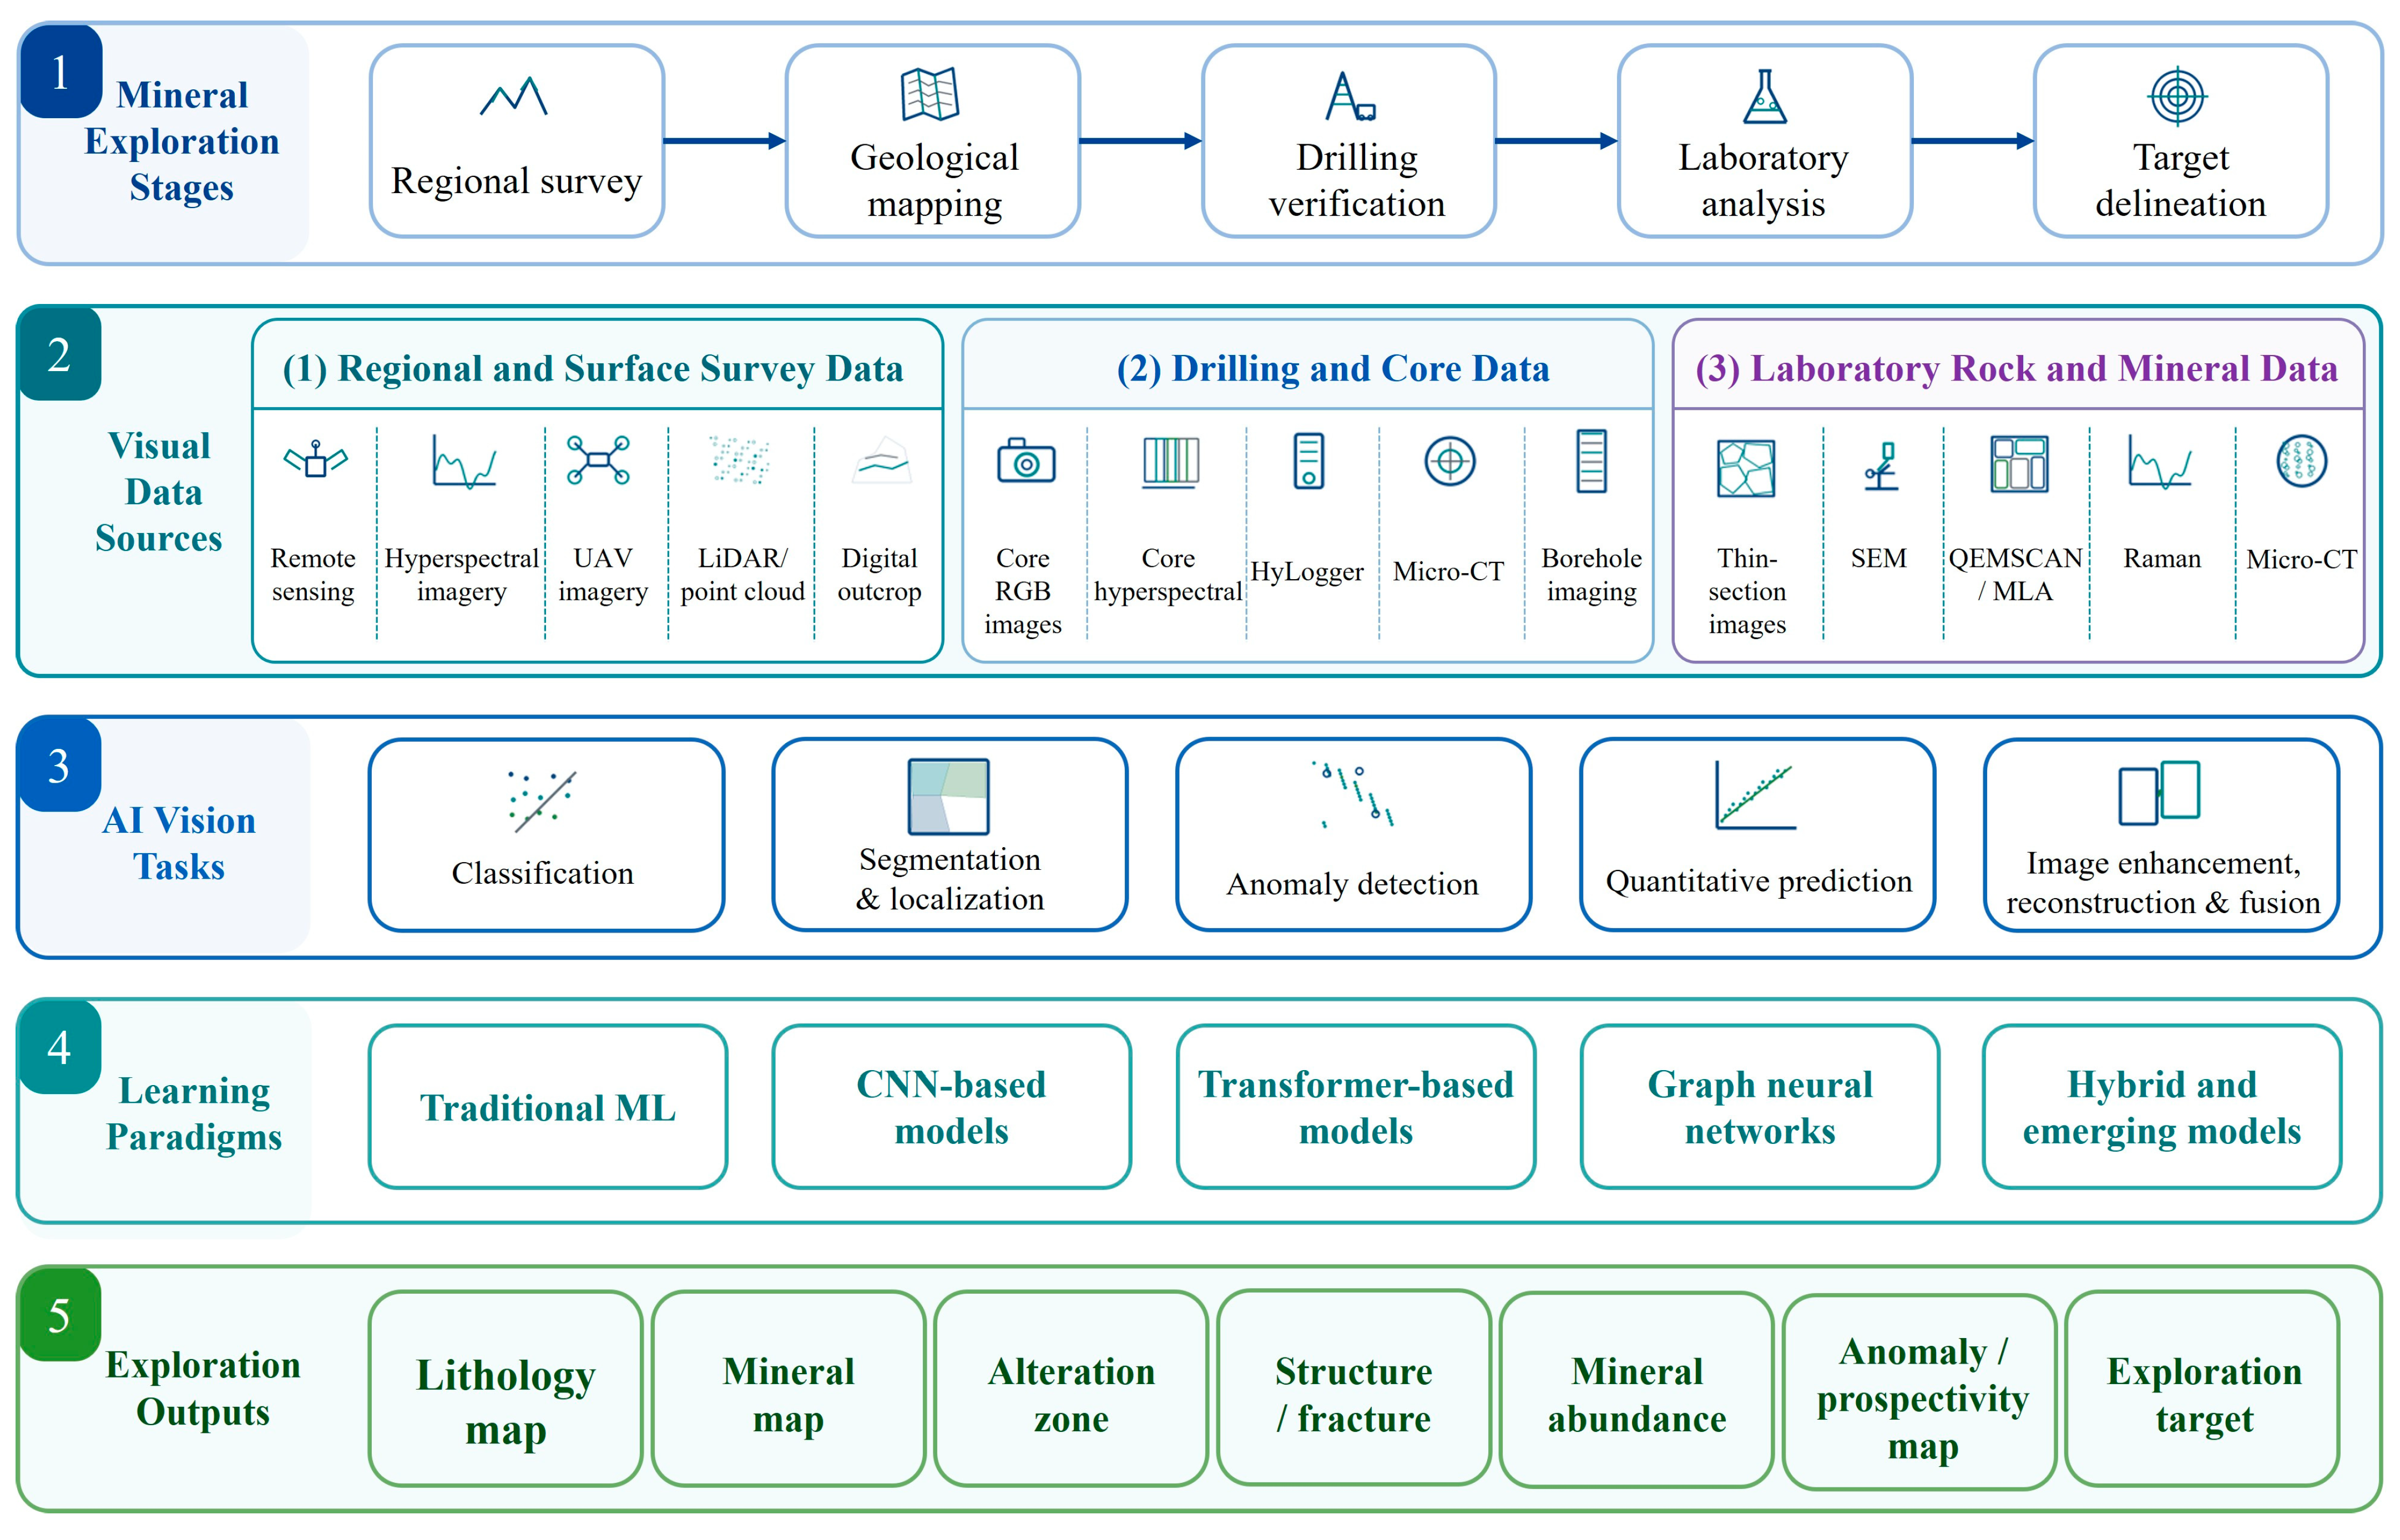
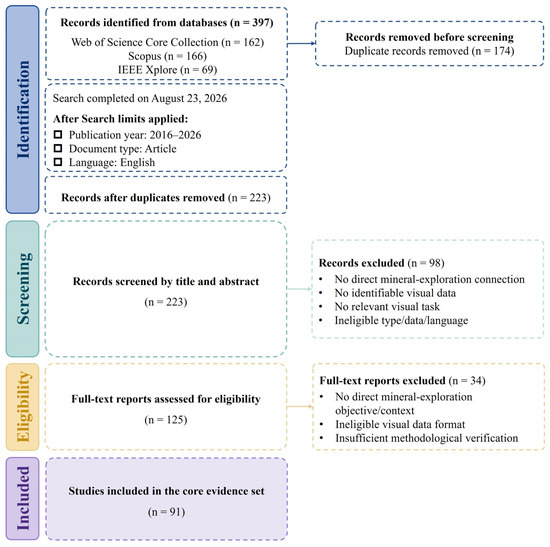
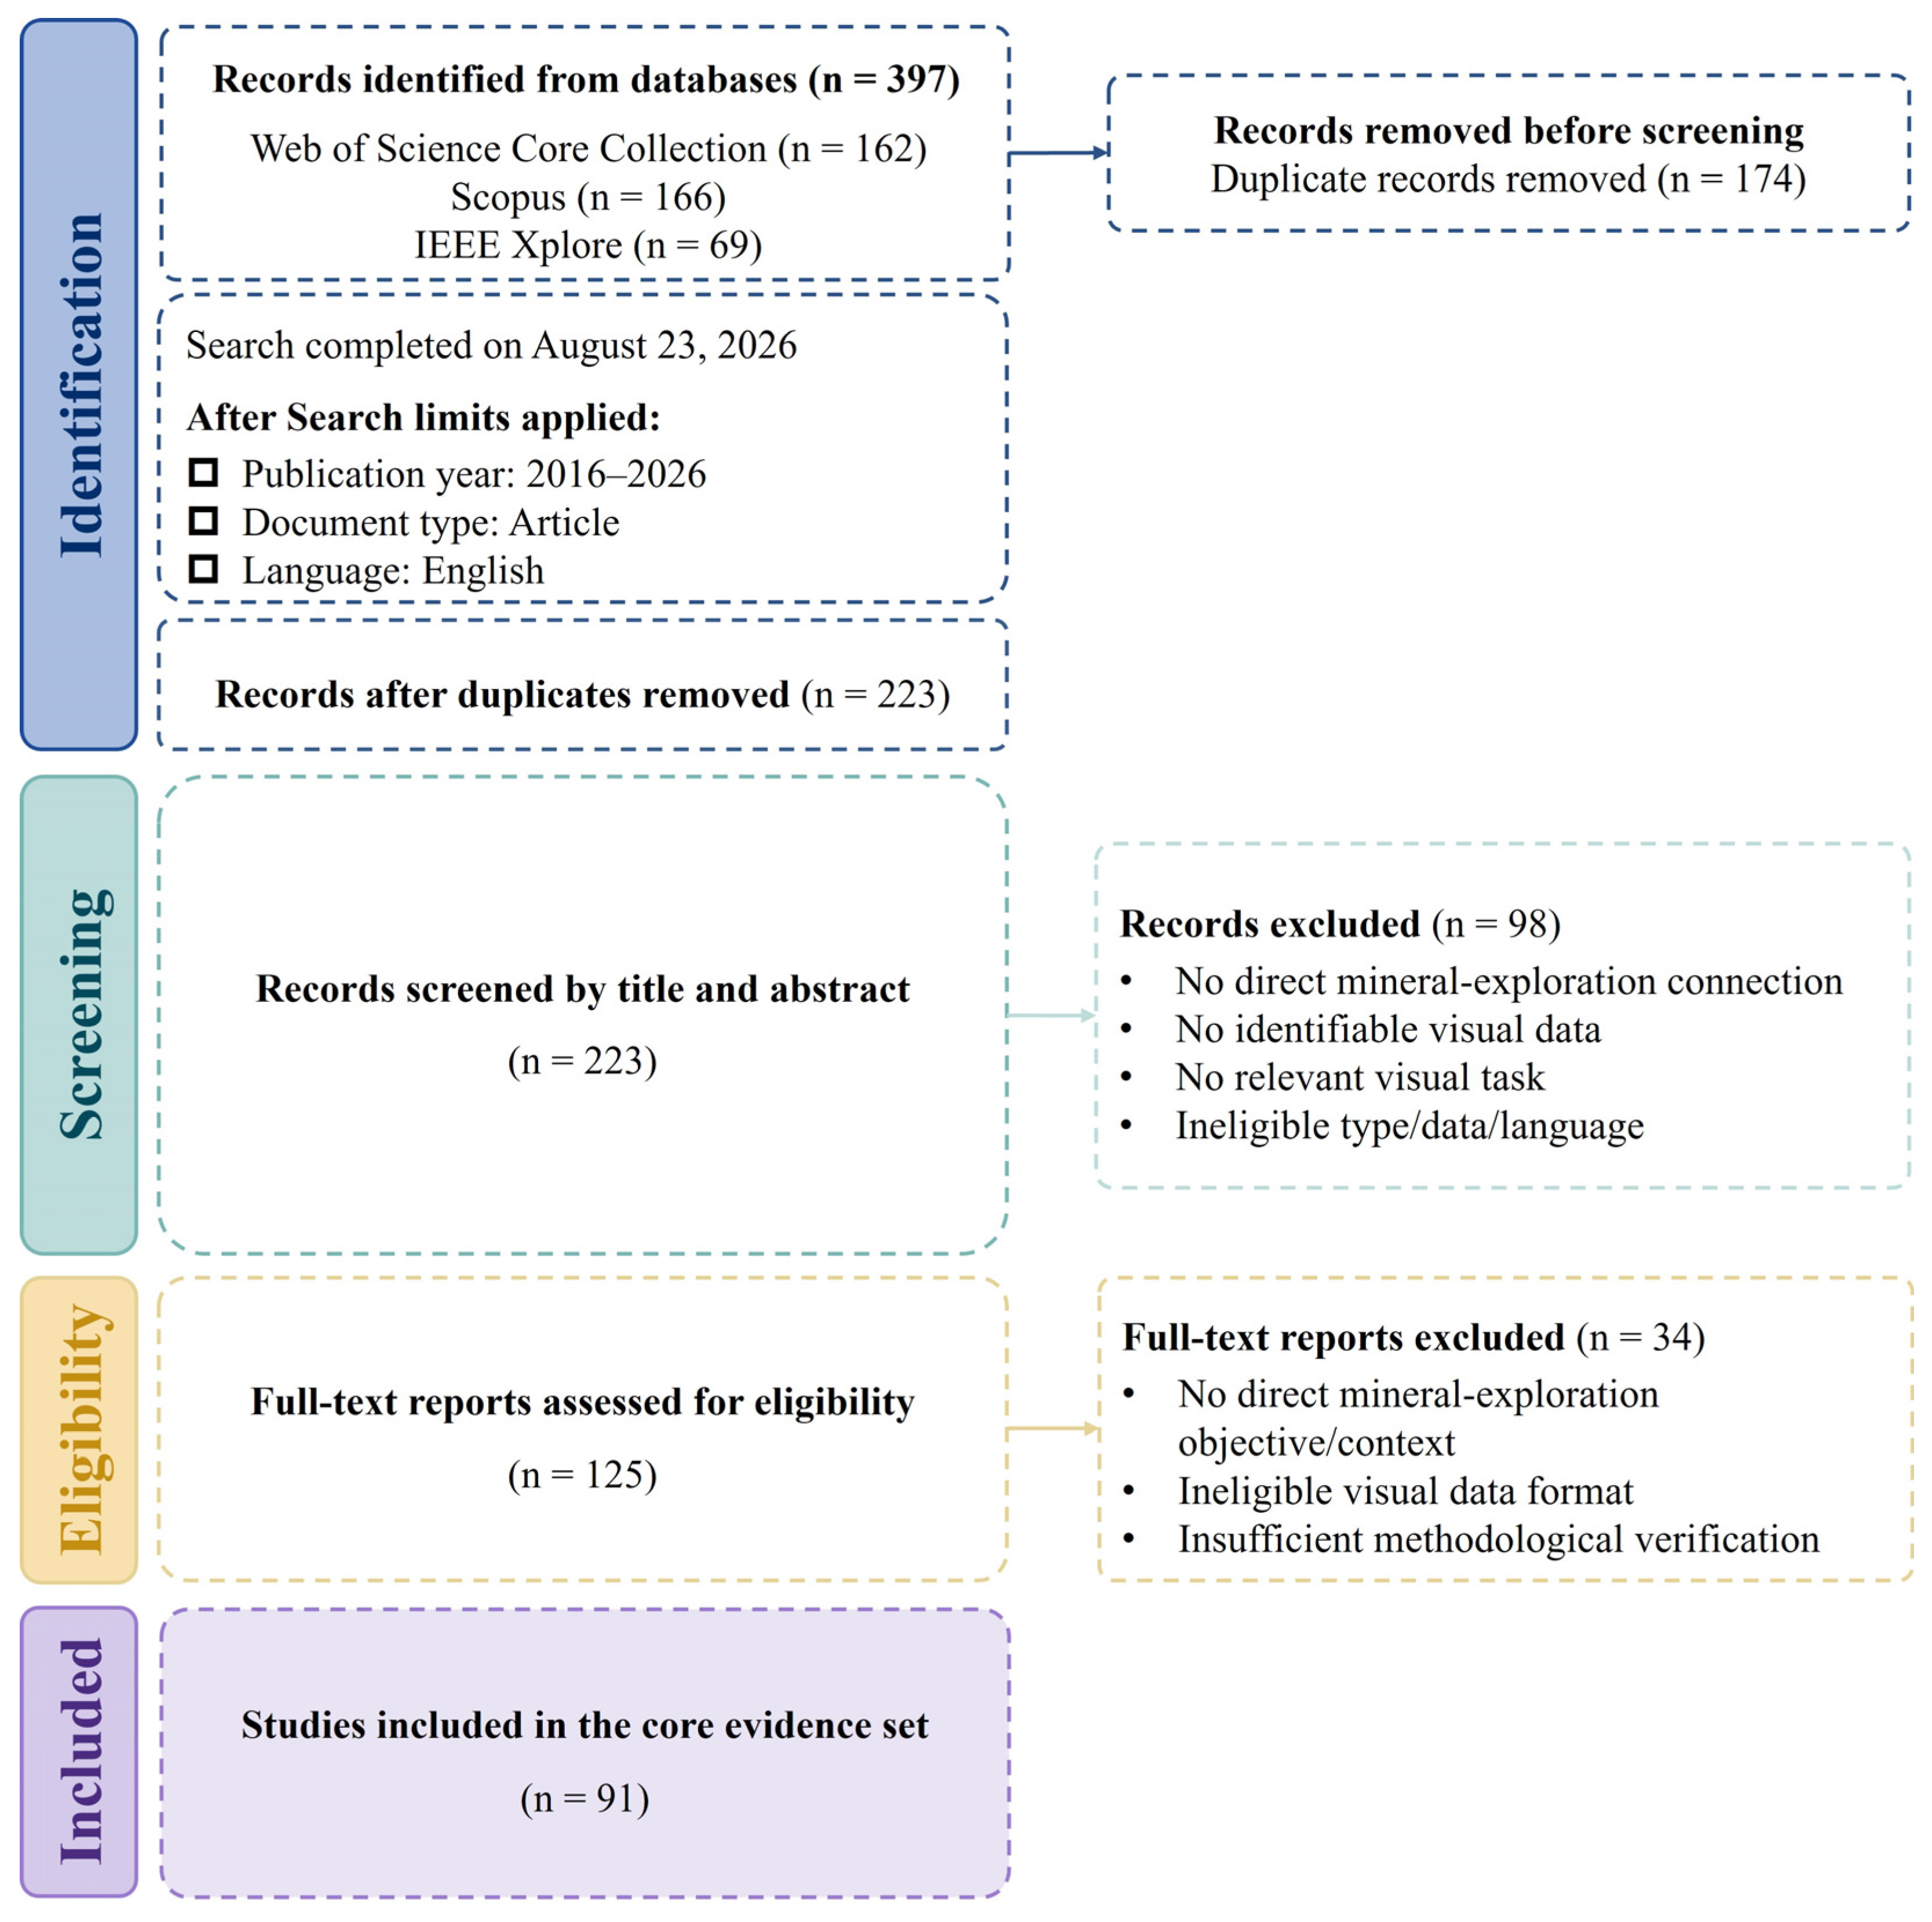
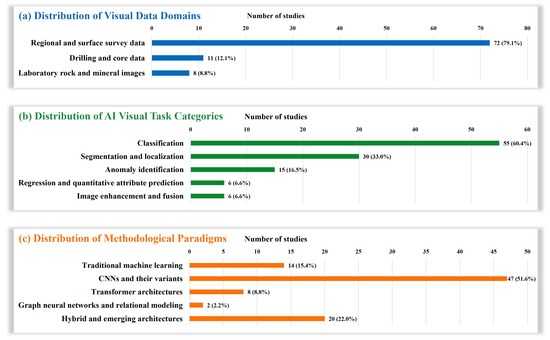
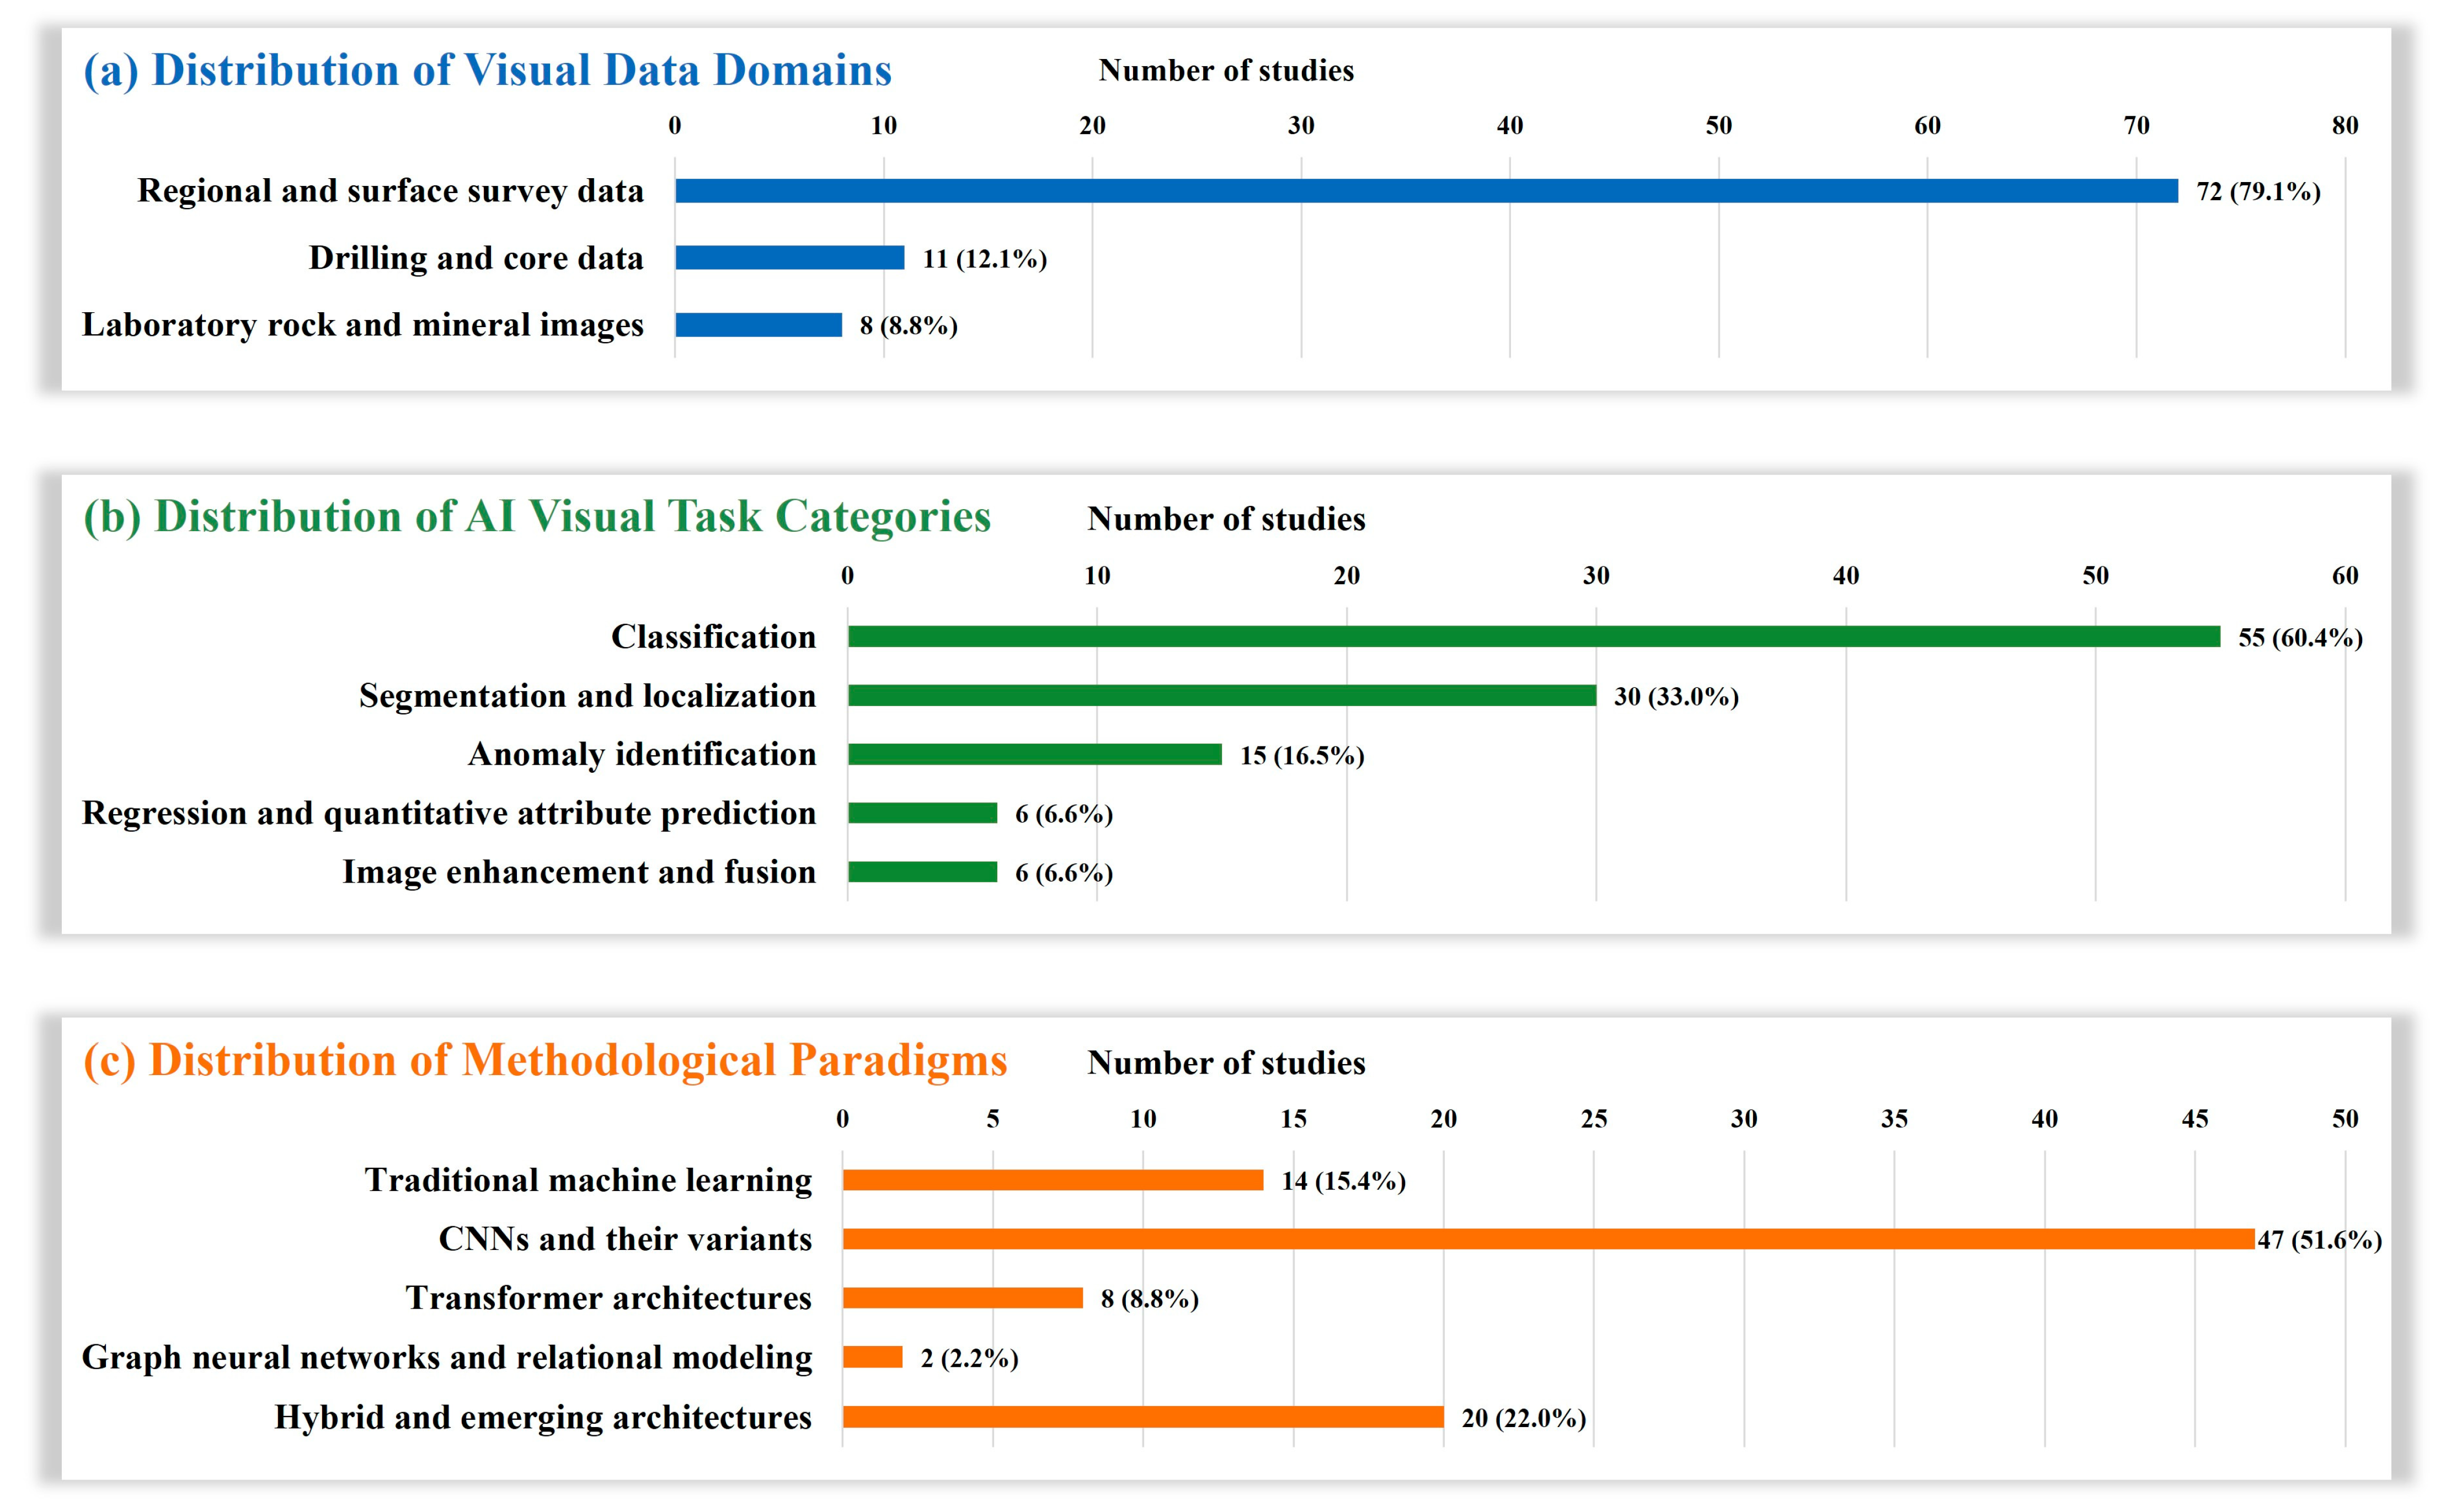
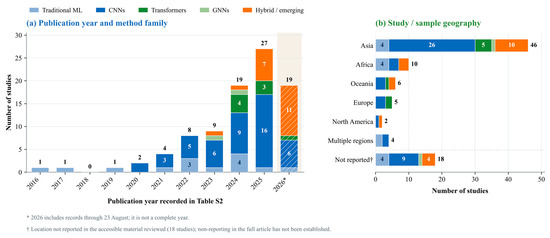
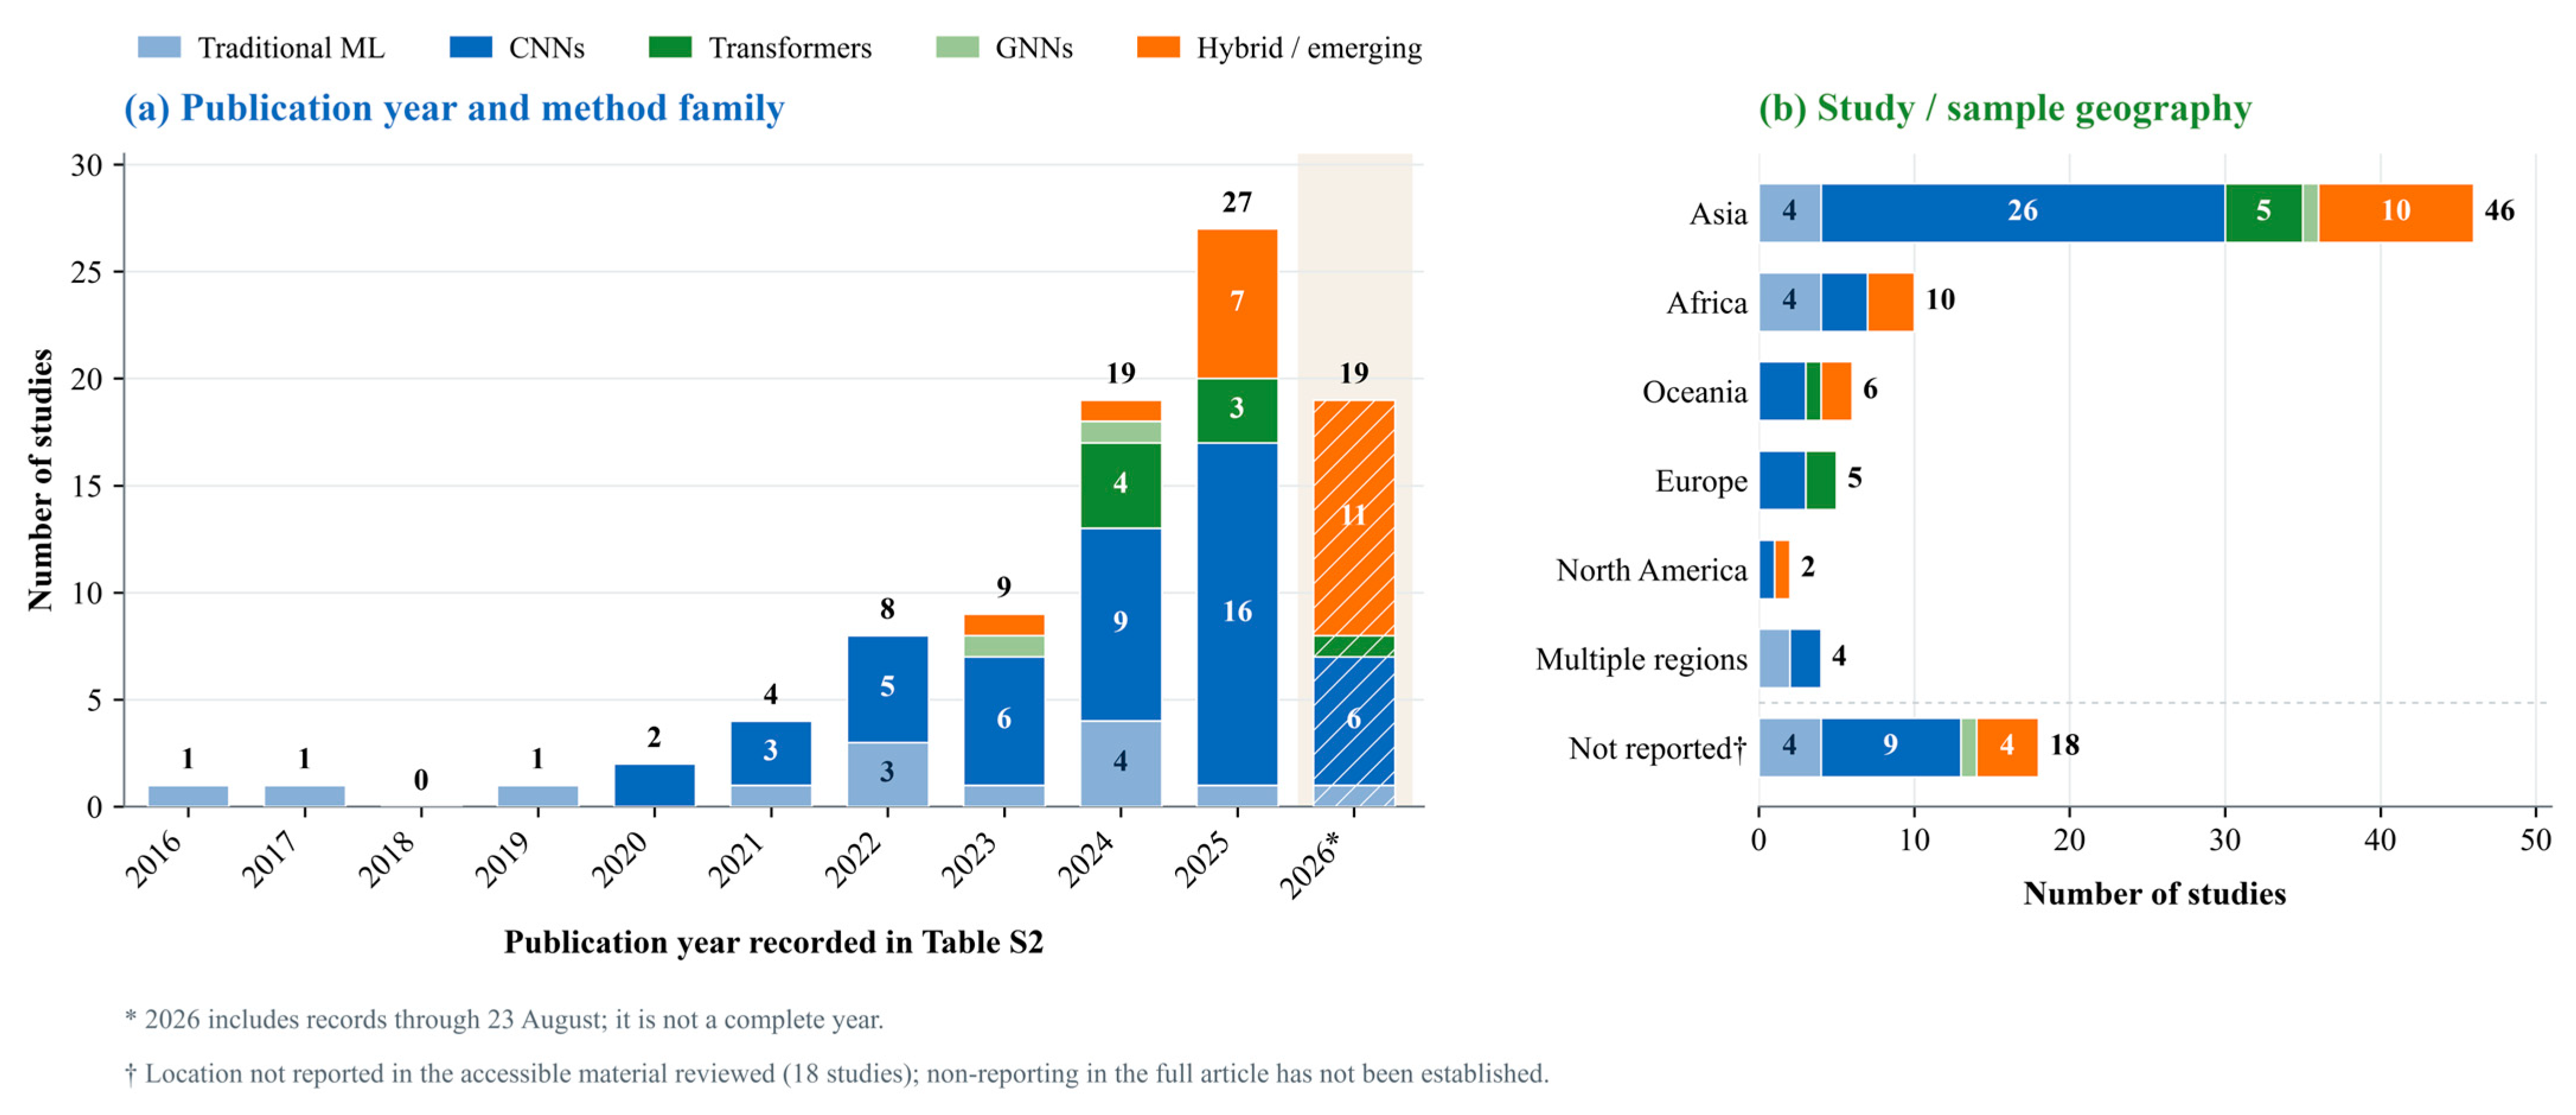
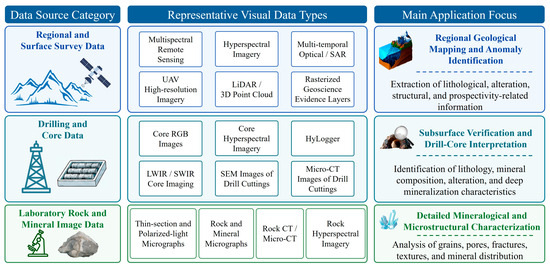
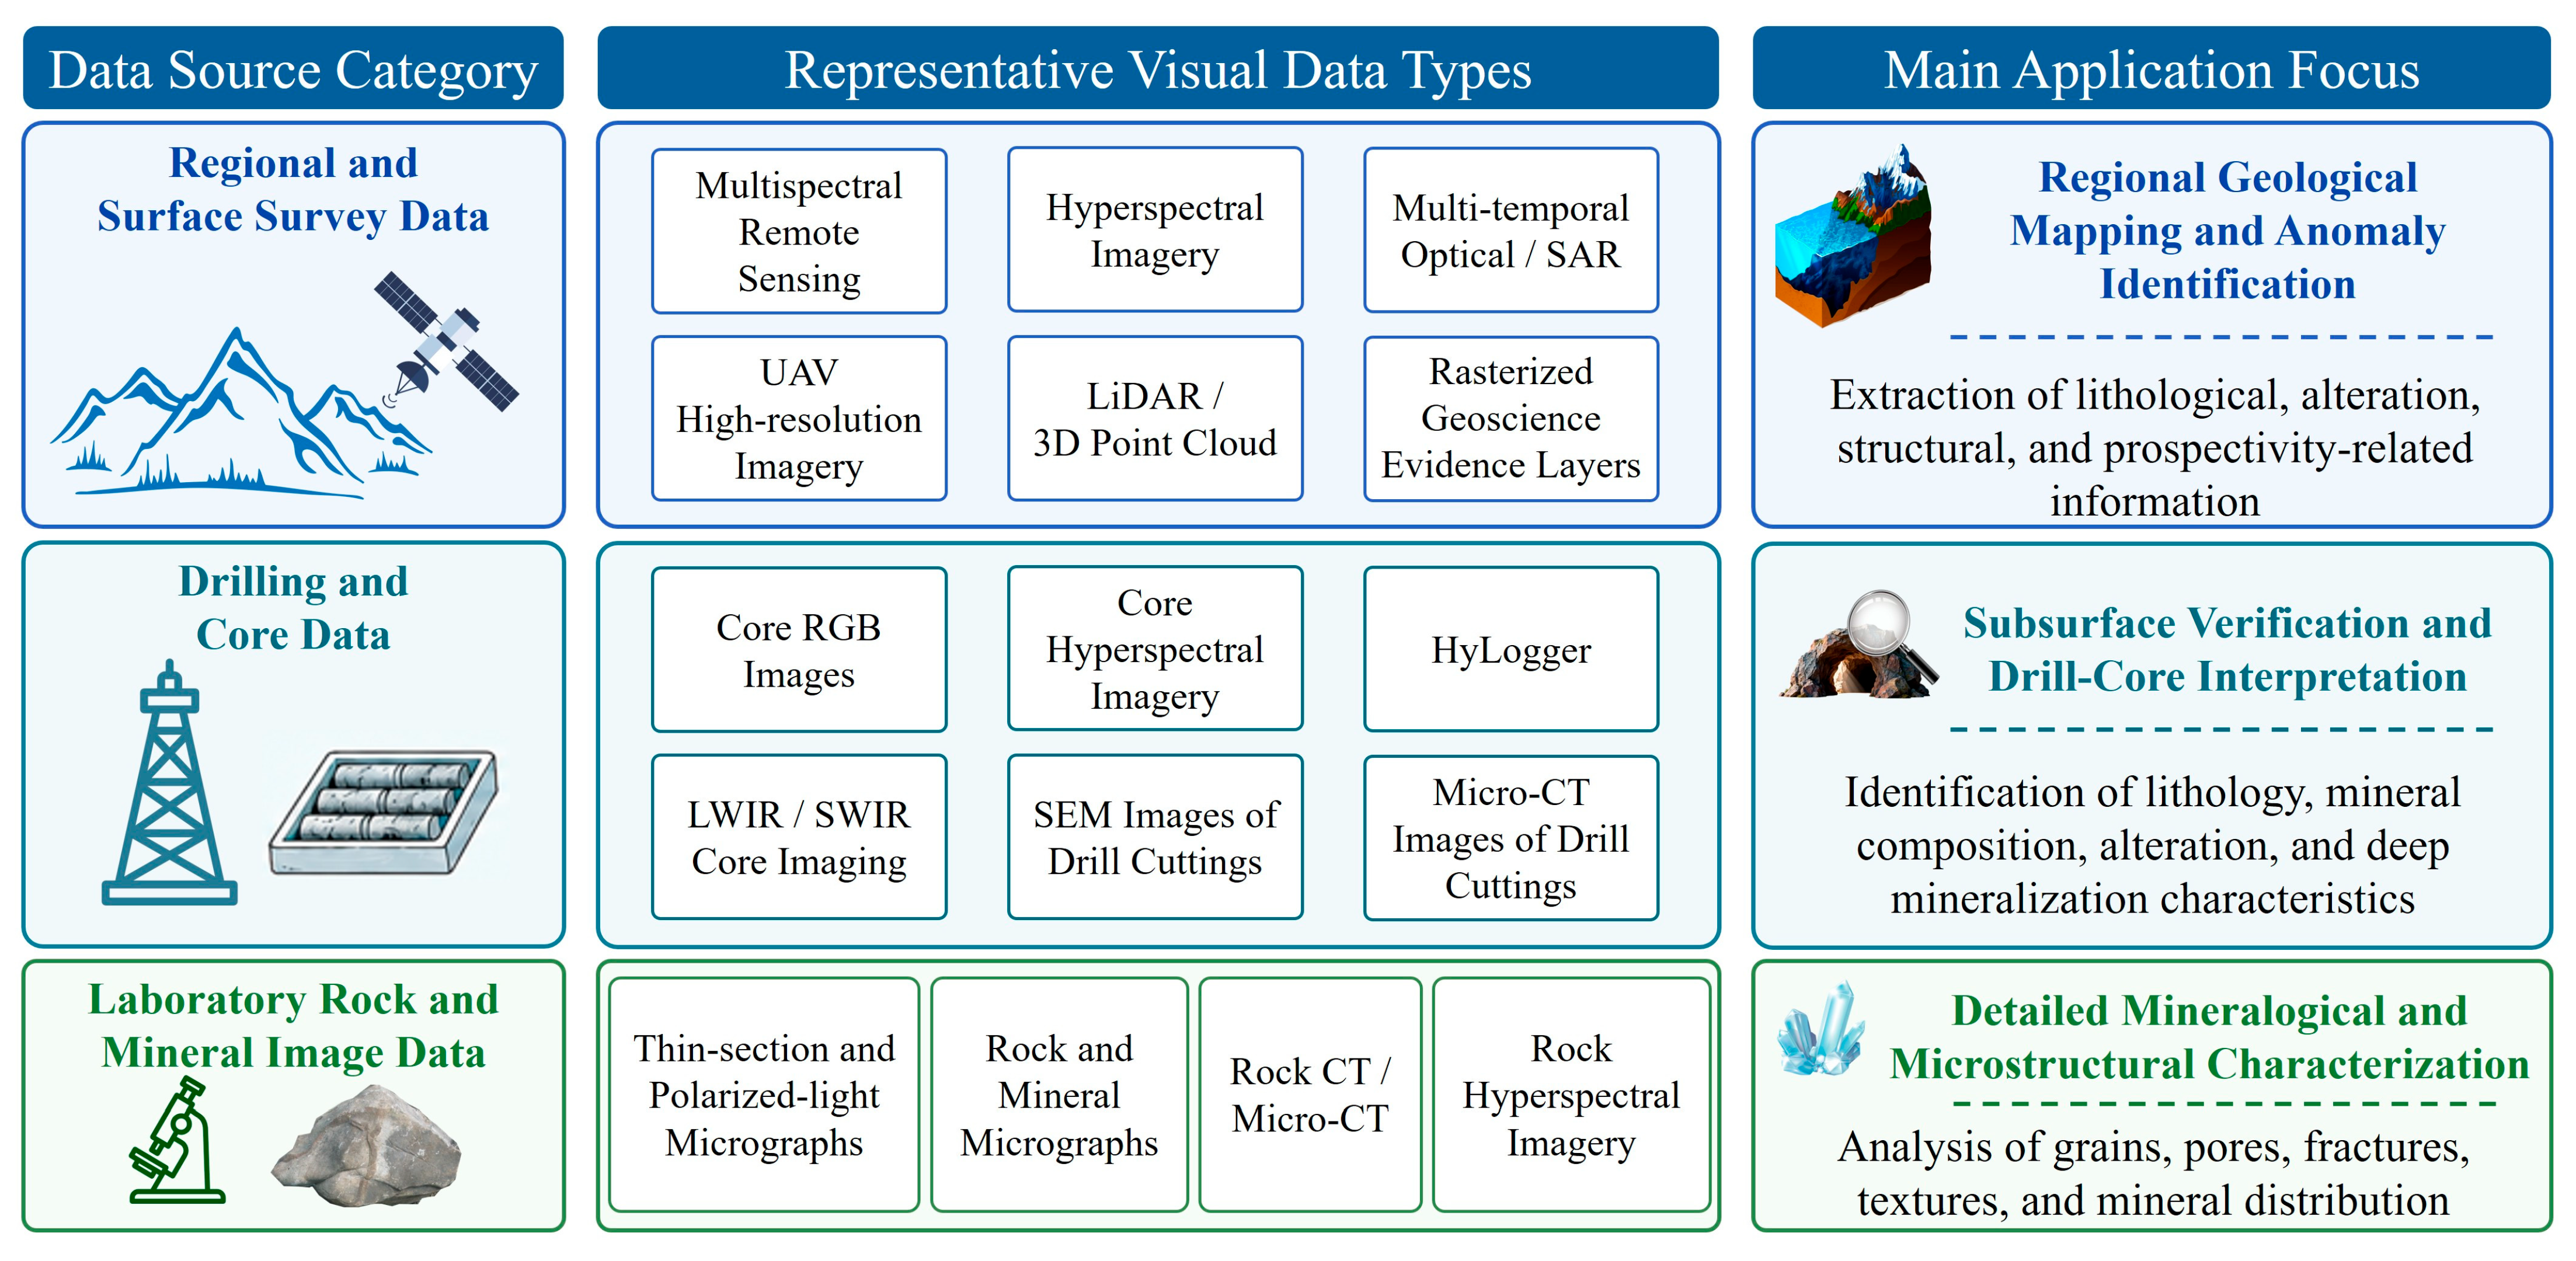
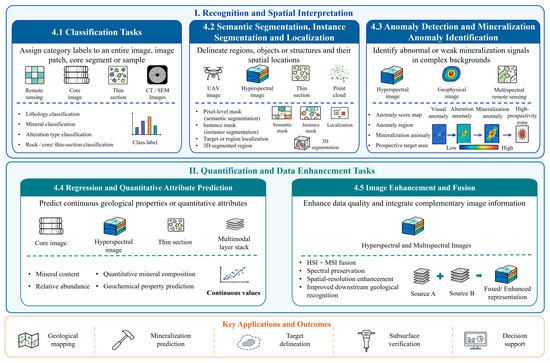
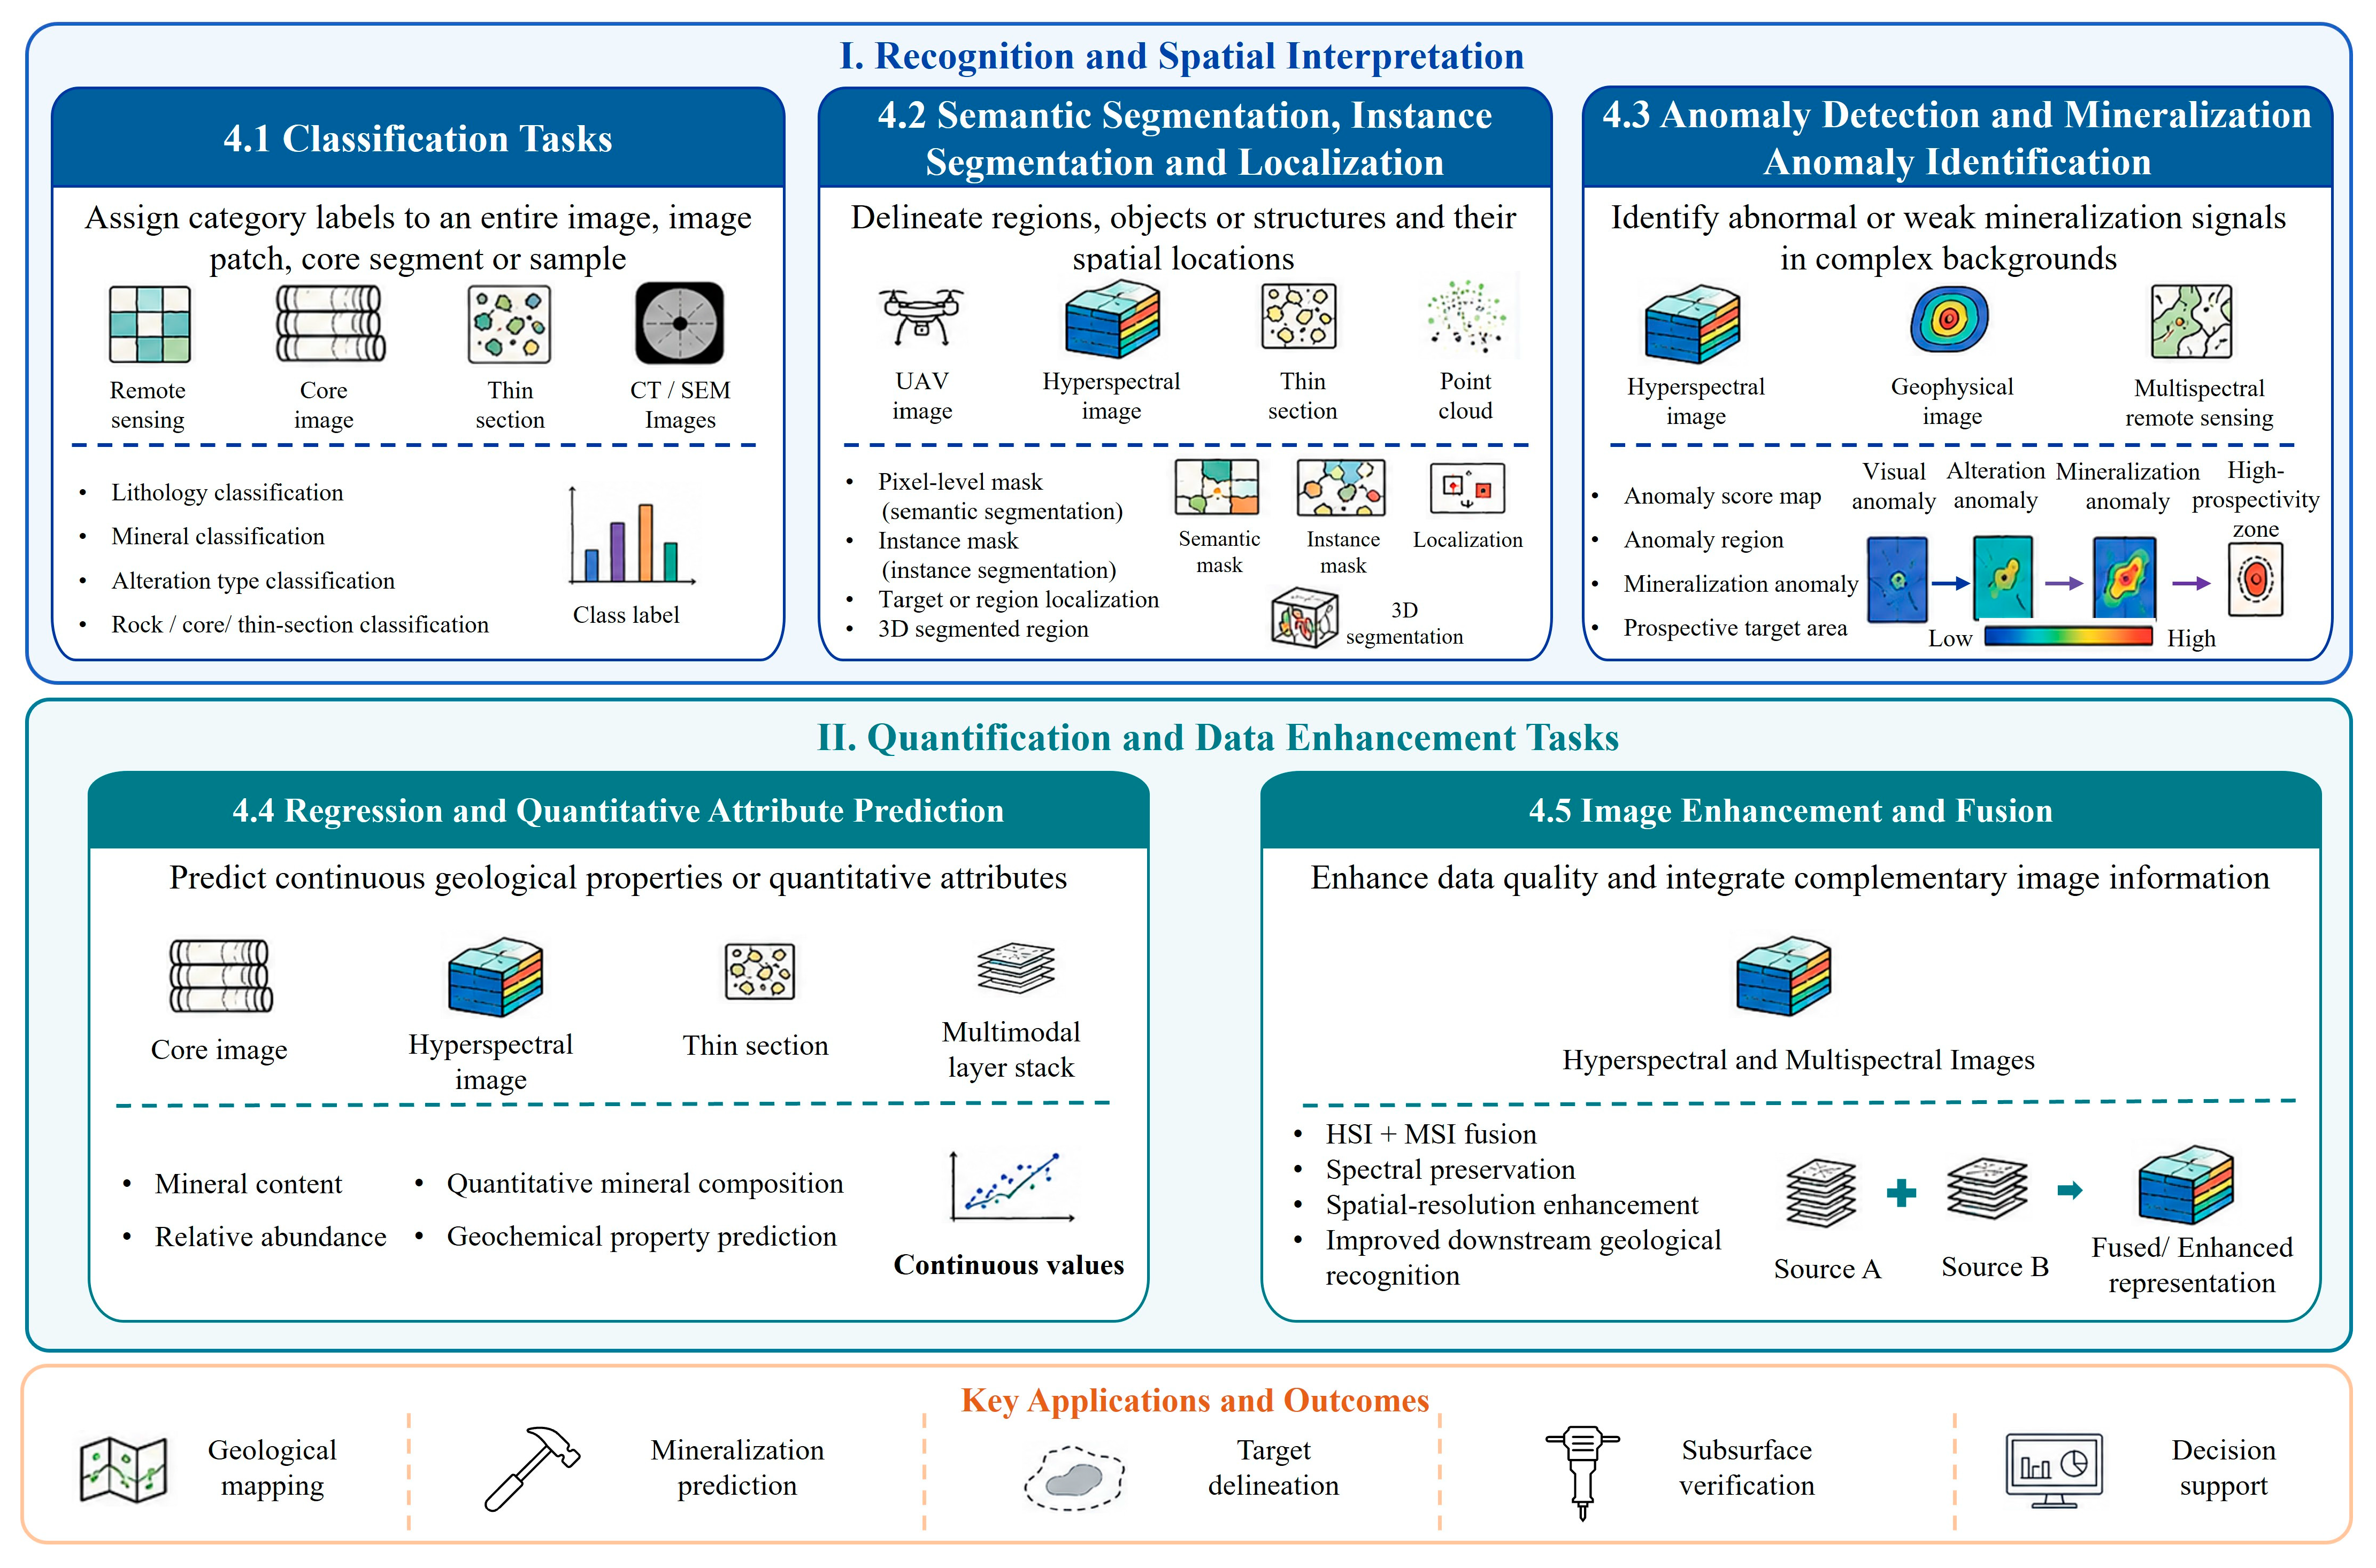
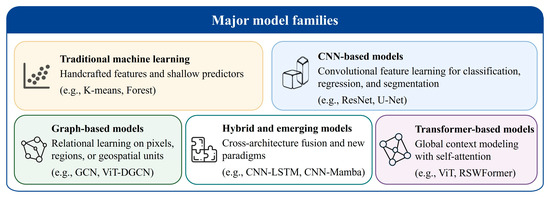
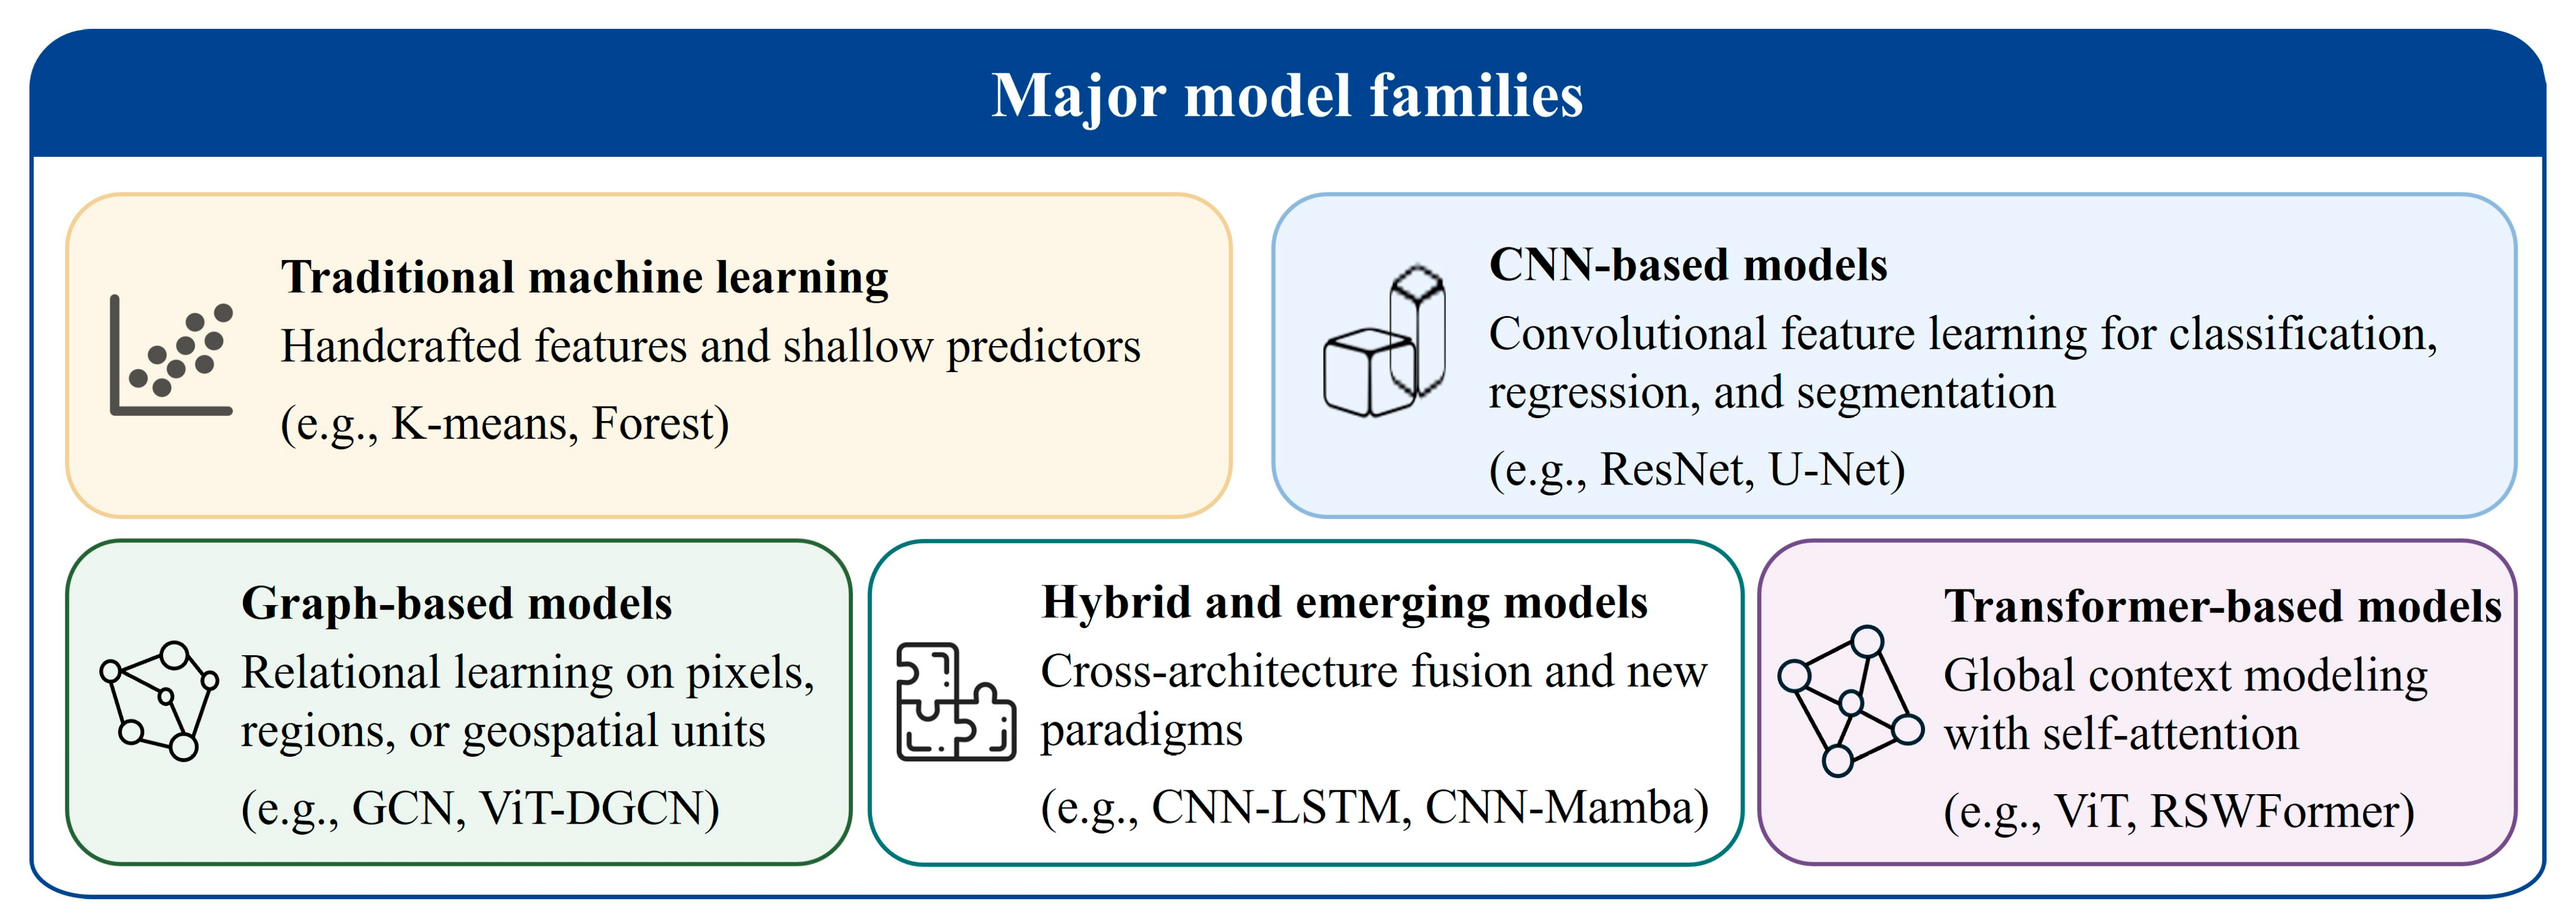
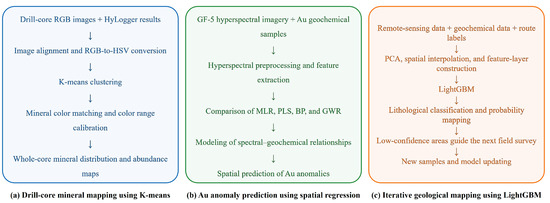
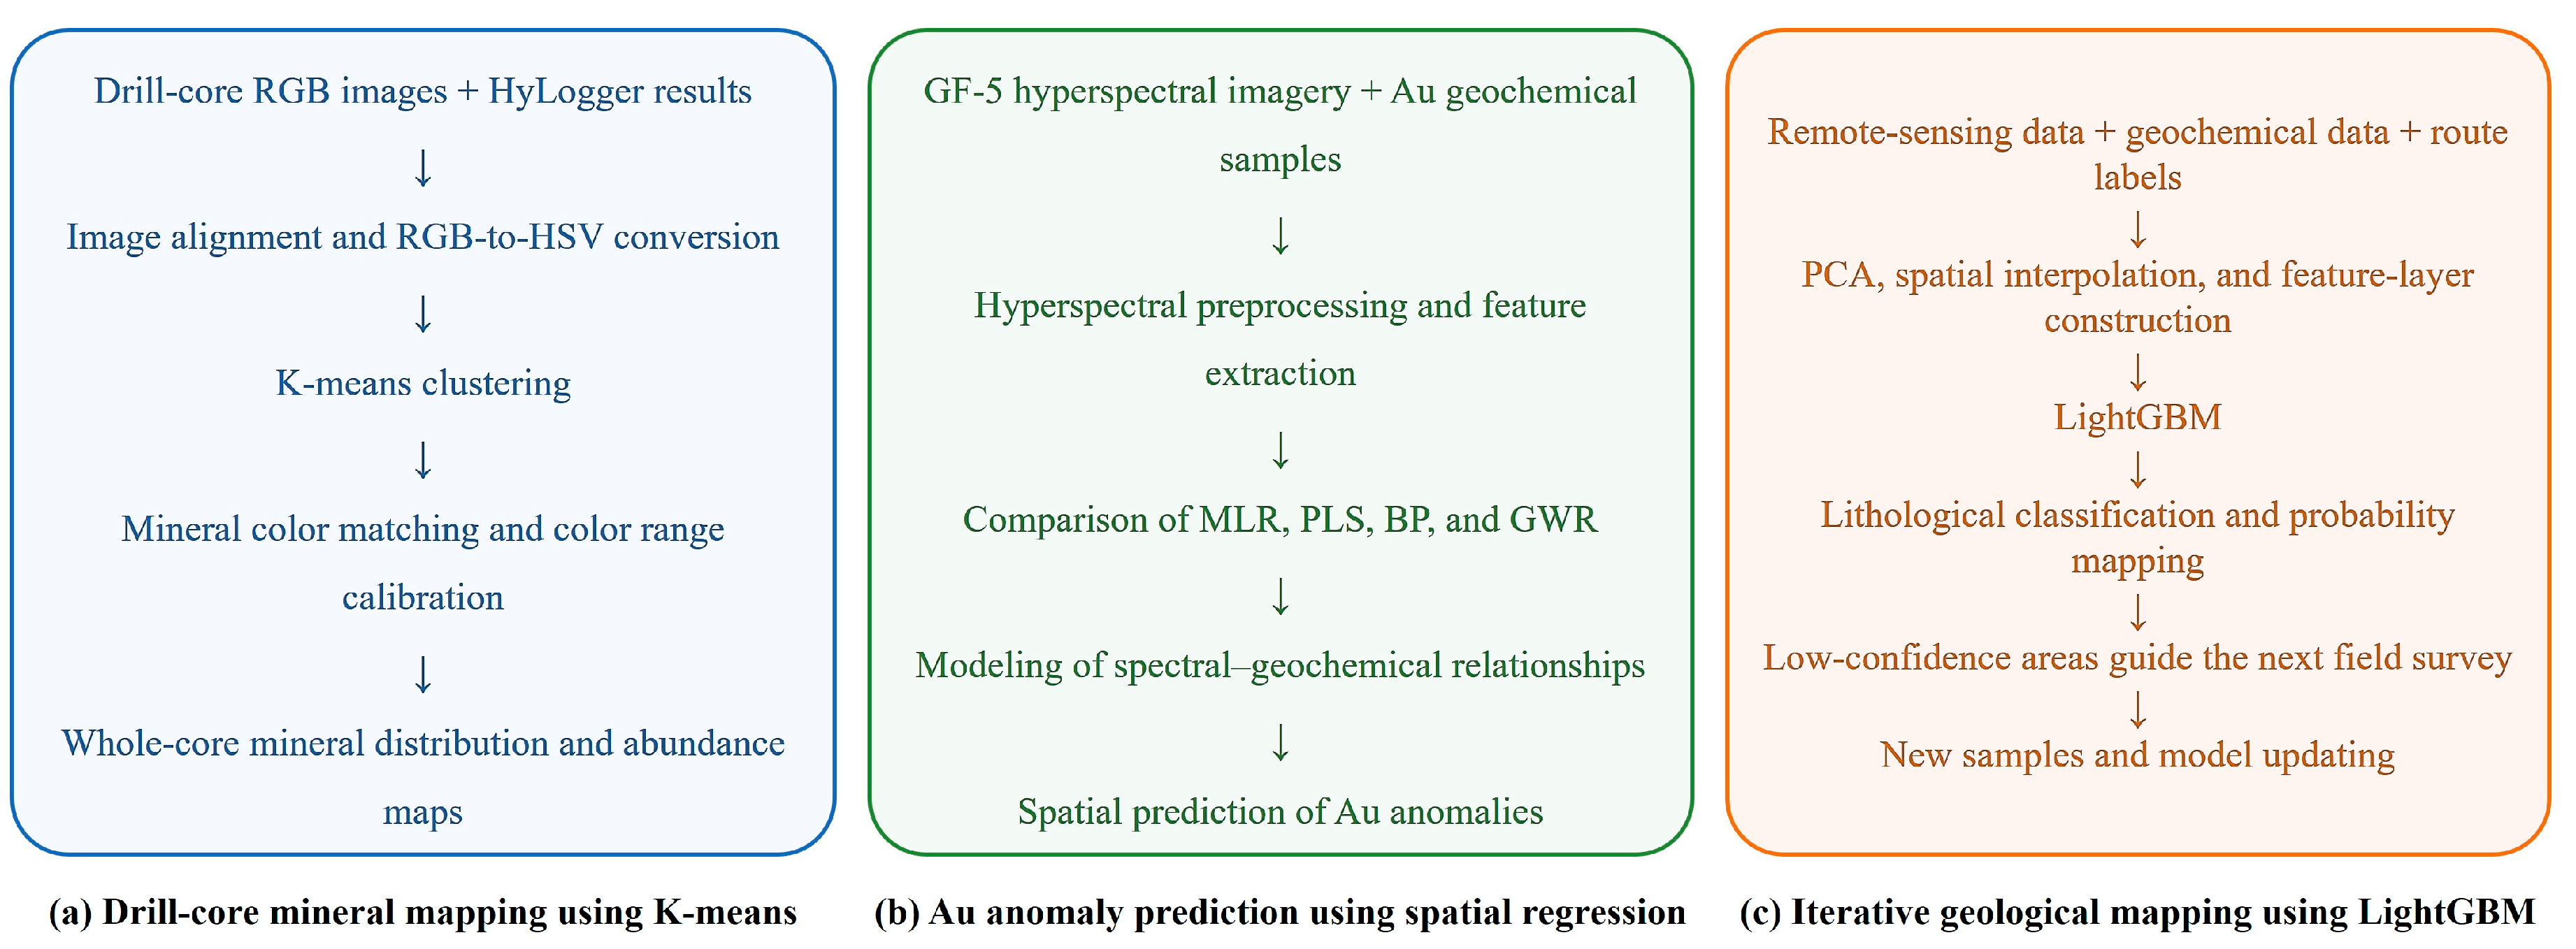
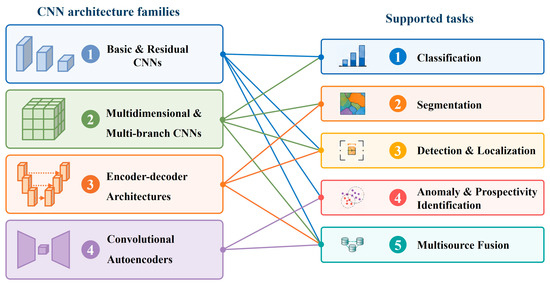
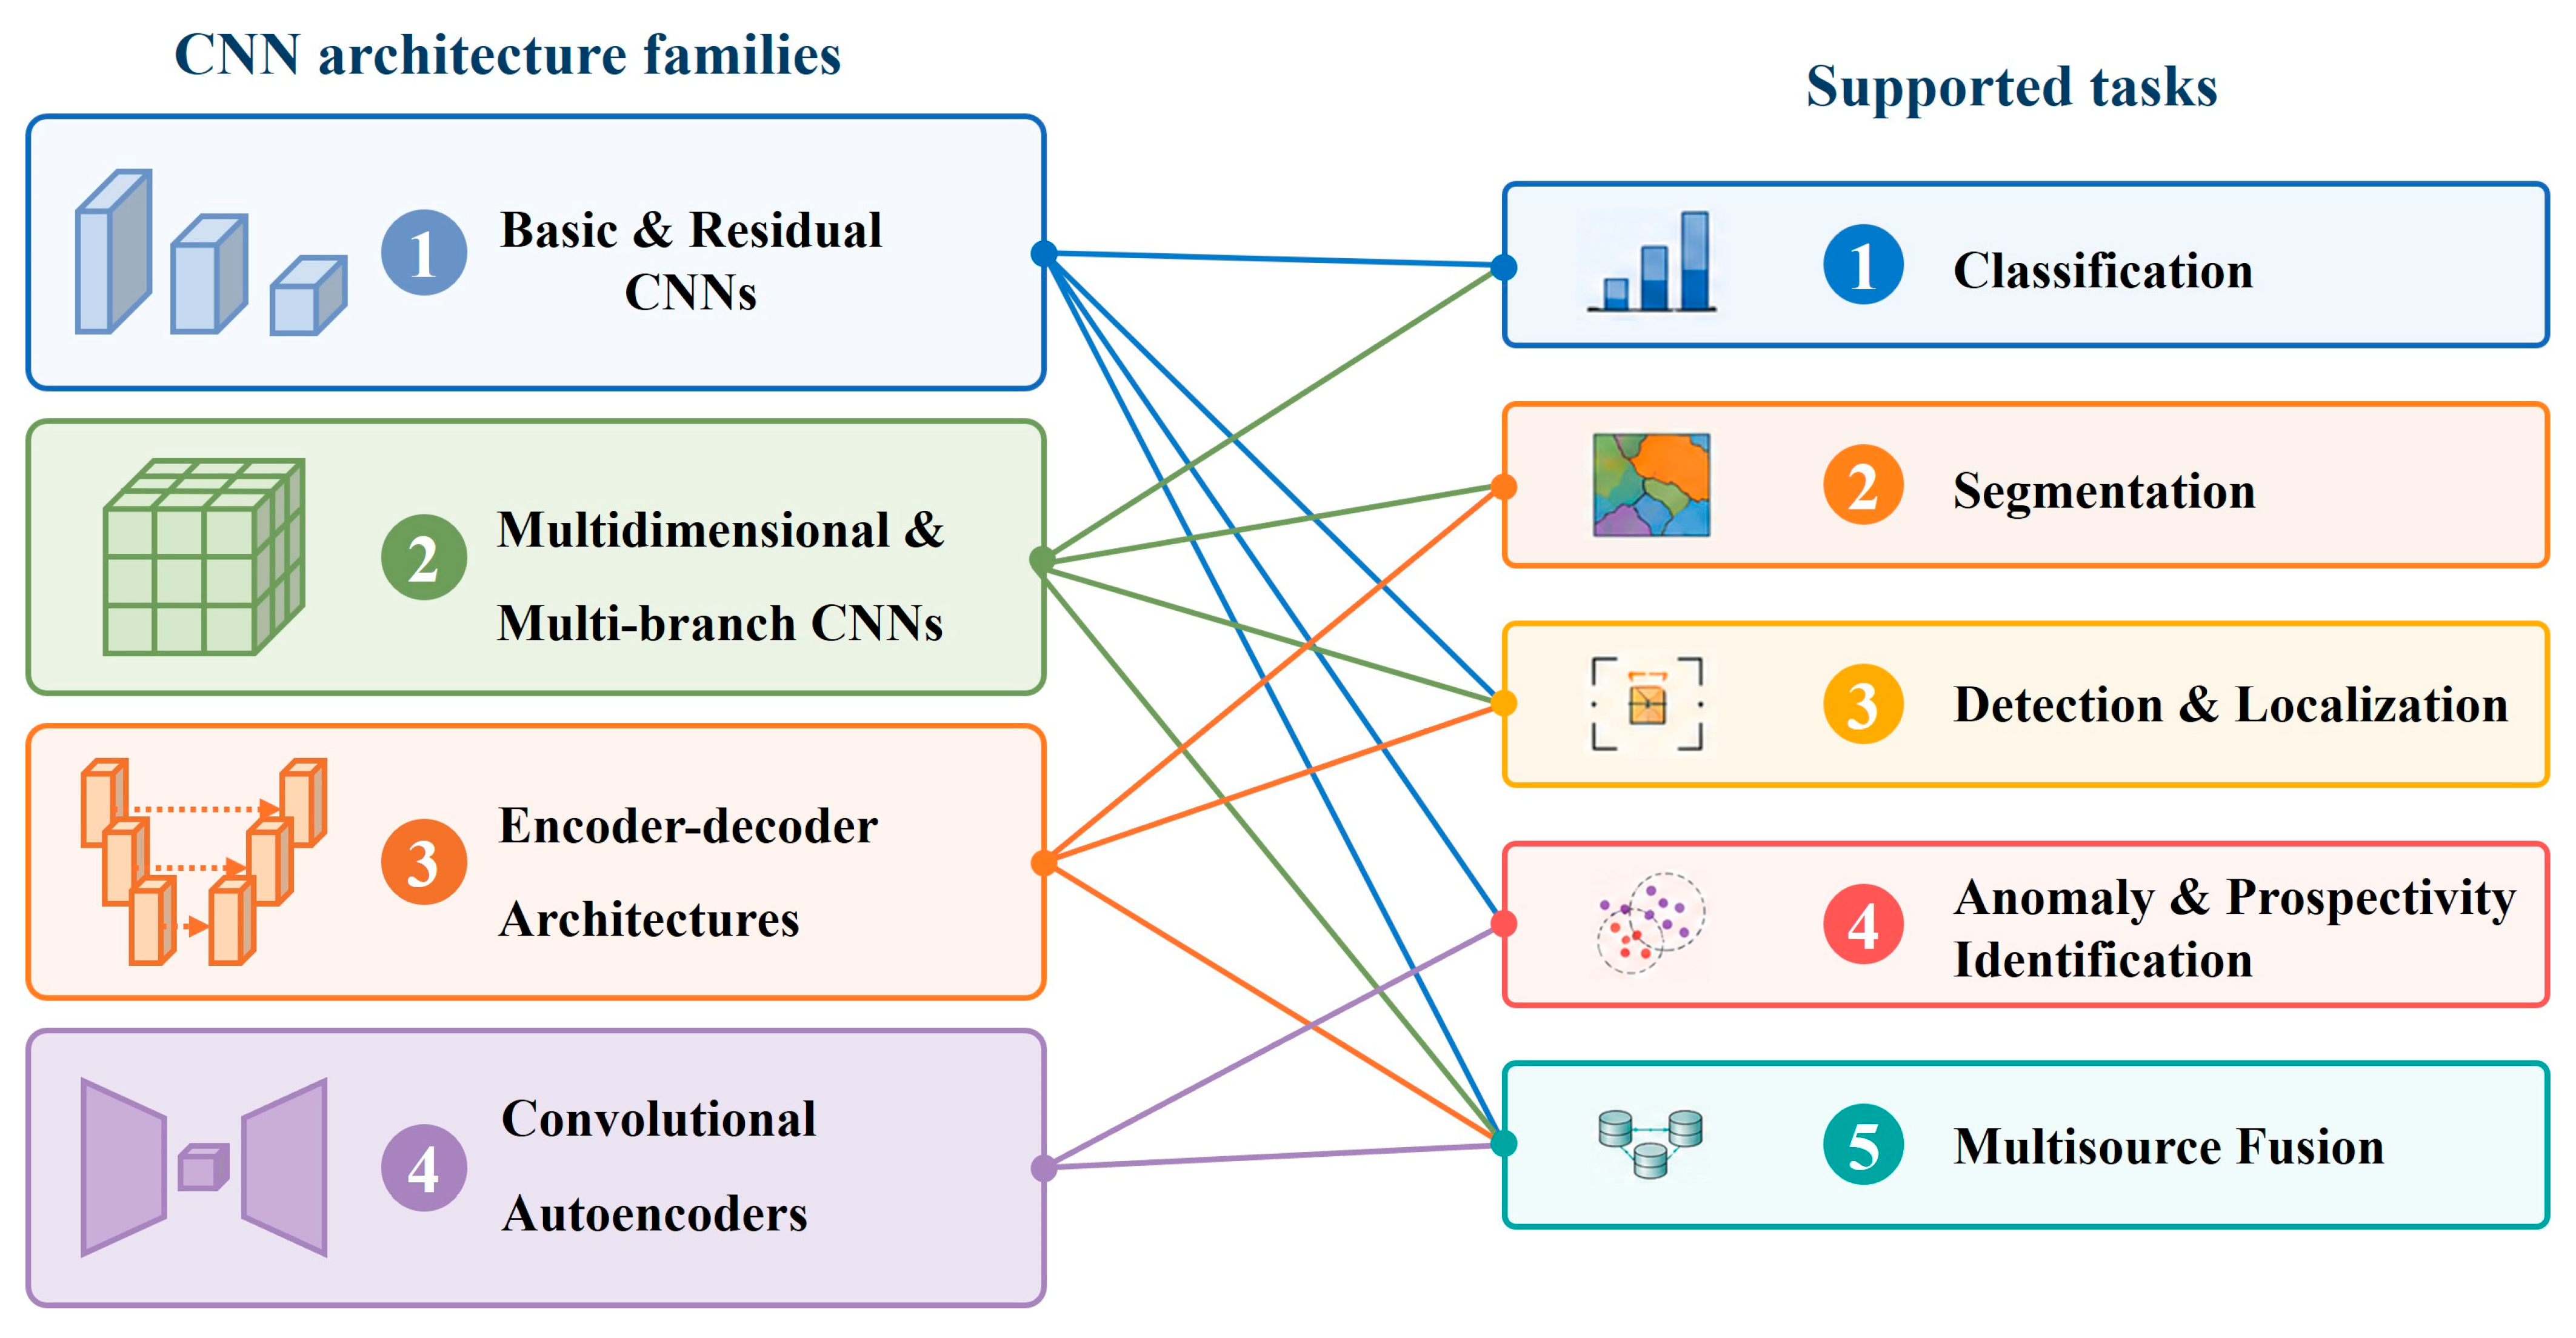
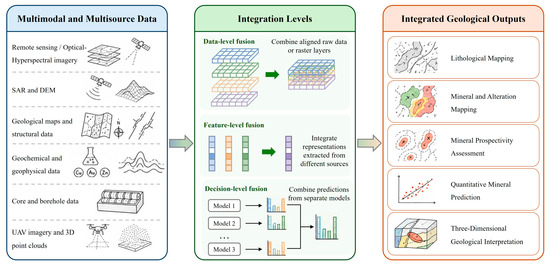
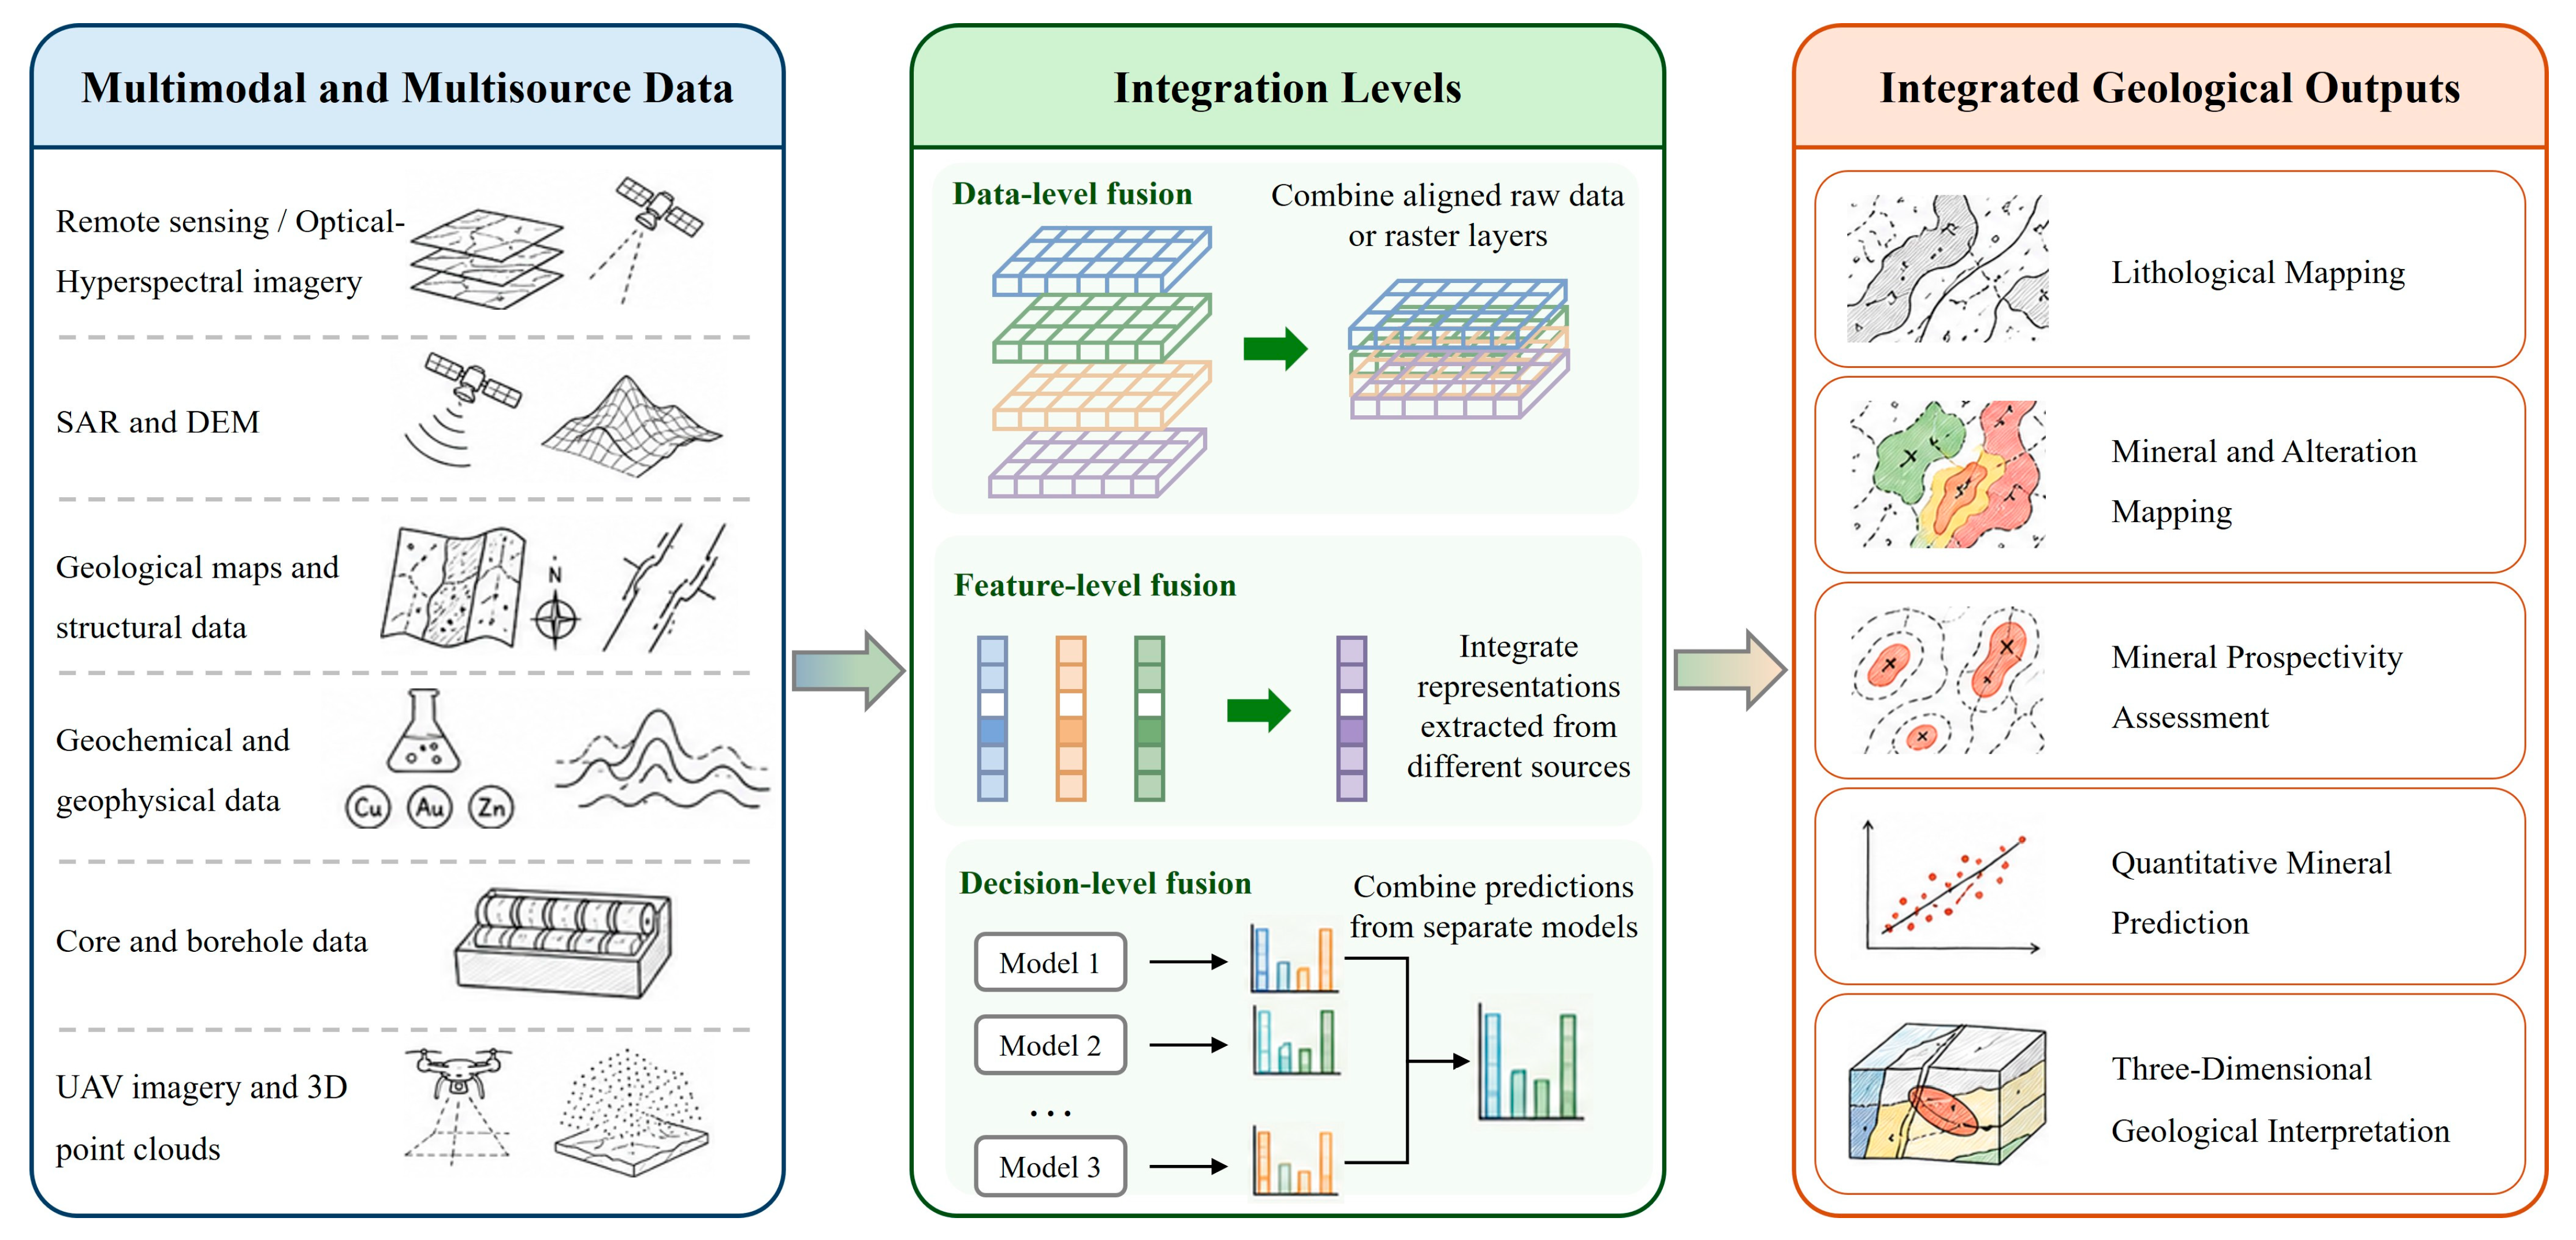

Disclaimer/Publisher’s Note: The statements, opinions and data contained in all publications are solely those of the individual author(s) and contributor(s) and not of MDPI and/or the editor(s). MDPI and/or the editor(s) disclaim responsibility for any injury to people or property resulting from any ideas, methods, instructions or products referred to in the content. |
© 2026 by the authors. Licensee MDPI, Basel, Switzerland. This article is an open access article distributed under the terms and conditions of the Creative Commons Attribution (CC BY) license.