


Abstract
Natural silica materials traditionally described as “opal” encompass different structural states, and their macroscopic appearance does not necessarily reflect their crystallographic identity. This study re-examines “opal”-like materials associated with ultramafic-hosted magnesite deposits of northern Evia Island, Greece. PXRD, ICP-MS, μ-XRF, micro-Raman spectroscopy, solid-state 29Si MAS NMR, and TEM were combined to determine their mineralogical identity, structural state, and colour-related mineralogical characteristics. The investigated materials are predominantly poorly ordered to crystalline rather than truly amorphous, with α-quartz as the principal SiO2 phase. The faintly green EVIA-4 material is predominantly quartz and contains 661 ppm Ni, preferentially associated with sepiolite-rich domains, suggesting that finely dispersed Ni-bearing sepiolite is the most likely mineralogical contributor to its colour. Moganite was not detected, and EVIA-4 is more appropriately regarded as quartzite rather than opal. In contrast, the reddish to pale-pink EVIA-5 material consists predominantly of α-quartz with moganite identified by PXRD and micro-Raman spectroscopy. 29Si MAS NMR and HRTEM/SAED further confirm its crystalline and nanocrystalline character. EVIA-5 is therefore more appropriately classified as chalcedony, likely carnelian, and represents, to our knowledge, the first occurrence of moganite associated with an ultramafic-hosted magnesite deposit in Greece.
1. Introduction
Natural silica materials traditionally described as “opal” have been reported from several geological environments in Greece, particularly volcanic and volcano-sedimentary formations, but also in association with ultramafic rocks and cryptocrystalline magnesite deposits. Their mineralogical and structural characteristics vary considerably, while detailed investigations combining diffraction, spectroscopic, and nanoscale methods remain limited. Among the better documented occurrences are those associated with volcanic and volcano-sedimentary environments. Stamatakis et al. [1] identified opal-C, opal-CT, chalcedony, and quartz in Pliocene siliceous sediments of the Aridea volcanic province, while opal-CT has also been reported from altered volcanic tuffs, including the mordenite-bearing tuffs of Prassa, Kimolos Island [2]. A broader investigation of gem-quality and related silica materials from Greece documented considerable mineralogical variability among materials conventionally described as opal, including opal-C, opal-CT, and quartz-bearing assemblages from localities such as Lykofi and Sapes in Thrace and Moudros on Limnos Island [3]. More recently, Lampropoulou et al. [4] identified moganite in siliceous beach nodules from Kefalonia Isl., whereas Skliros et al. [5] reported moganite from a Tertiary magmatic–hydrothermal environment in the Evros region. These represent, to our knowledge, the first reported occurrences of moganite in Greece.
Silica associated with Mesozoic ultramafic rocks (Ophiolites) and magnesite depositshas received considerably less attention. At Vavdos, Chalkidiki, Dabitzias [6] described quartz and/or chalcedony in veins and vugs associated with serpentinized ultramafic rocks and magnesite mineralization, as well as networks and pockets of fine-grained quartz within dolomite–quartz alteration rocks. These observations demonstrate that fine-grained crystalline silica is an important component of Greek ultramafic-hosted magnesite systems. Northern Evia hosts important ‘cryptocrystalline’ magnesite deposits within variably serpentinized dunite and harzburgite of the Pelagoniangeotectonic zone [7,8,9,10]. Magnesite occurs principally as veins and stockworks structurally controlled by an extensive fault and fracture network and is locally accompanied by carbonate–silica alteration and silica filling fractures, breccias, cavities, and vugs [7,8,9,10,11]. Of particular relevance to the present study are the early interpretations of silica associated with the northern Evia magnesite mineralization. Dabitzias [7] reported “opal” in late-stage cavities of serpentine breccias and interpreted silica formation in association with magnesite in terms of olivine carbonation, expressed by the simplified reaction Mg2SiO4 + 2CO2 → 2MgCO3 + SiO2, with the resulting silica explicitly described as amorphous. Gartzos [8] subsequently described post-magnesite “opalization” and reported silica-rich materials as “opal”, including green material referred to as “Ni-opal”. These early studies established the occurrence of opaline silica associated with the magnesite deposits and proposed a relationship between Ni and some of the green material, but did not resolve the structural state of the silica or the mineralogical host of Ni. This distinction is important because bulk chemical evidence for Ni does not establish whether it is incorporated into the silica structure or hosted by discrete, finely dispersed Ni-bearing mineral phases. Silica associated with the northern Evia magnesite deposits was subsequently classified as opal-CT on the basis of conventional PXRD [12]. This represents an important development from the earlier interpretation of the material as amorphous silica or generically as “opal”. Nevertheless, its structural and mineralogical nature has not been systematically investigated using complementary techniques capable of distinguishing X-ray-amorphous or poorly ordered silica from micro- and nanocrystalline SiO2 phases and of identifying associated mineral phases at the micro- to nanoscale. The samples investigated in detail in the present study were collected from the magnesite mining operations of TERNA MAG S.A. in northern Evia and include silica materials displaying considerable variation in colour and texture, some of which have macroscopically been described as “opal”. The geological setting is considered primarily as the context of occurrence; the present study focuses on their mineralogical identity, structural state, and nanoscale characteristics rather than on the genesis of the magnesite deposits.
Previous studies therefore demonstrate that Greek materials described as “opal” encompass silica with markedly different structural characteristics. Opal-C and opal-CT are well documented particularly in magmatic-hydrothermal and volcano-sedimentary environments, whereas the structural nature of macroscopically opaline silica associated with ultramafic-hosted magnesite deposits remains less constrained. Moreover, although moganite has recently been identified in beach nodules of Kefalonia Isl. and volcanic-related materials from northeastern Greece [4,5], its occurrence in silica associated with Greek ultramafic-hosted magnesite deposits has not previously been documented. These uncertainties provide the basis for re-examining Greek silica materials historically or macroscopically classified as “opal” using complementary diffraction, spectroscopic, and nanoscale methods.
The present study re-examines a suite of natural silica materials from Greece that have traditionally, macroscopically, or previously been described as “opal”, with particular emphasis on samples associated with the ultramafic-hosted magnesite deposits of northern Evia. Rather than addressing the genesis of the magnesite deposits, the study focuses on the mineralogy, structural state, and mineral chemistry of the silica materials through a complementary combination of powder X-ray diffraction (PXRD), inductively coupled plasma mass spectrometry (ICP-MS), micro-X-ray fluorescence (μ-XRF), micro-Raman spectroscopy, solid-state 29Si magic-angle spinning nuclear magnetic resonance (29Si MAS NMR), and transmission electron microscopy (TEM). Together, these techniques provide information across different length scales, from bulk phase identification and chemical composition to local Si environments and micro- to nanoscale structural and mineralogical characteristics. The principal objectives are to identify and characterize the silica phases present and to investigate the mineralogical origin of their macroscopic colours through the identification of associated micro- and nanoscale mineral inclusions. By integrating these approaches, the study aims to provide a more rigorous mineralogical and structural classification of natural silica materials from Greece and to critically evaluate the use of traditional terms such as “opal” and “amorphous silica” when unsupported by detailed structural characterization.
2. Materials and Methods
The principal samples investigated in this study were collected from the underground workings of TERNA MAG S.A. in the Gerorema area, northern Evia Island, Greece, as well as from different stages of the company’s production line. Silica-rich materials encountered during magnesite extraction and processing are operationally regarded as gangue and solid mining wastes, representing undesirable non-magnesite material that may interfere with the production of MgO. Over the long history of magnesite exploitation in the area, large volumes of such waste materials have accumulated in extensive waste-rock deposits around the mining operations. Their detailed mineralogical and chemical characterization is therefore relevant not only to establishing their actual nature, but also to assessing their potential future utilization or valorizationand to providing a sound mineralogical basis for the evaluation and management of associated environmental issues. The northern Evia samples display considerable macroscopic variability in colour, texture, and their relationship with the magnesite mineralization (Table A1). They range from silica occurring within or associated with magnesite veins (e.g., EVIA-1, EVIA-3, and EVIA-6) to grey, white, and faintly green hard materials associated with the magnesite bodies (EVIA-7–EVIA-9). Of particular interest are EVIA-4 and EVIA-5, which were macroscopically identified in the field and/or historically regarded as “opal”. EVIA-4 is characterized by a faint greenish hue, whereas EVIA-5 consists of reddish-brown to pale-pink, locally translucent silica fragments. These two samples were the principal focus of the more detailed structural, chemical, and nanoscale investigation, consistent with the objective of re-examining the materials historically described as “opal” and “Ni-opal”.
Bulk mineralogical characterization was performed by powder X-ray diffraction (PXRD). All samples presented in Table A1 were reduced to <2 mm and subsequently pulverized in an agate mortar. PXRD patterns were obtained using a Siemens D-5005 X-ray diffractometer (Siemens/AXS Analytical X-Ray Systems GmbH, Karlsruhe, Germany) with Cu Kα radiation, operated at 40 kV and 40 mA, over the range 3° ≤ 2θ ≤ 65°, using a step size of 0.02° 2θ and a counting time of 1 s per step. X-ray diffraction patterns were evaluated using the DIFFRACplus EVA software (Version 10.0, Bruker AXS GmbH, Karlsruhe, Germany) ssociated with the instrument and the corresponding reference diffraction database. Phase identification was additionally cross-checked by processing the original .raw files using Match! software (Version 1.9, Crystal Impact, Bonn, Germany).
The bulk trace-element composition of selected northern Evia samples (EVIA-4 and EVIA-5) was determined by inductively coupled plasma mass spectrometry (ICP-MS) using a PerkinElmer SCIEX ELAN 9000 ICP-MS (PerkinElmer SCIEX, Shelton, CT, USA) instrument. Representative silica fragments were separated from each sample, subsequently powdered and homogenized, and accurately weighed aliquots were mixed with lithium metaborate–lithium tetraborate (LiBO2–LiB4O7) flux and fused at approximately 1000–1100 °C in Pt–Au (95:5) crucibles to produce homogeneous glass beads. The fusion procedure ensures complete decomposition of silicate and refractory mineral phases. Following fusion, the glass beads were completely dissolved in ultrapure HNO3 prior to ICP-MS analysis.
The chemical composition in polished sections of samples was additionally investigated using a purpose-built laboratory micro-X-ray fluorescence (μ-XRF) system, specifically designed for spatially resolved analysis of heterogeneous geological and archaeological materials, at the XRF Laboratory of the Institute of Nuclear and Particle Physics, National Centre for Scientific Research “Demokritos”, Athens, Greece. Measurements were performed at an operating voltage of 50 kV using a Rh-anode X-ray tube. A combination of metallic foils was employed as an excitation-beam filter to improve detection limits for trace-element analysis. For the μ-XRF area scans presented in this study, measurements were acquired using a step size of 0.20 mm and a dwell time of 20 s per measurement point. XRF spectra were deconvoluted and quantified using the PyMca software package (Version 6.2, European Synchrotron Radiation Facility, Grenoble, France) [13]. Geological reference materials were used for calibration and optimization of the relevant configuration parameters, resulting in agreement generally better than 10% between determined and certified/reference concentrations.
Micro-Raman spectroscopic analyses were performed on polished sections using a Renishaw inVia™ Raman microscope (Renishaw plc, Wotton-under-Edge, Gloucestershire, UK) controlled by WiRE software (version 5.5, Renishaw plc, Wotton-under-Edge, Gloucestershire, UK). Raman spectra were acquired using a 785 nm excitation laser, selected to minimize fluorescence, and a 50× long-working-distance objective. The laser power at the sample was 1 mW, and spectra were collected using an exposure time of 20 s and a single accumulation. The Raman signal was dispersed using a 1200 lines mm−1 grating, with a 65 μm slit, while a notch filter was used to suppress Rayleigh scattering. Laser alignment, monochromator position, slit width, and beam focus were optimized before spectral acquisition to maximize signal quality and minimize instrumental spectral displacement. Cosmic-ray removal and background correction were performed using WiRE software.
Solid-state 29Si magic-angle spinning nuclear magnetic resonance (MAS NMR) experiments were performed using a Bruker Avance NEO 500 MHz spectrometer equipped with an ASCEND 11.76 T magnet (Bruker BioSpin GmbH, Ettlingen, Germany), corresponding to a 1H Larmor frequency of 500.11 MHz, with 29Si observed at 99.36 MHz, and controlled using TopSpin 4.1 software. Measurements were carried out at 300 K, with temperature controlled using a Bruker BCU II cooling unit. Powdered samples were loaded into 4 mm zirconia rotors and analysed using a Bruker smart iProbe dual BB/F-H cross-polarization MAS probe. The MAS spinning frequency was 10 kHz for all measurements. Direct-excitation 29Si MAS NMR spectra were acquired using a pulse length of 3.81 μs, a relaxation delay of 100 s, and 50 scans. Spectra were collected using 2.5k time-domain data points, zero-filled prior to Fourier transformation, and processed using an exponential window function with a line-broadening factor of 100.
Nanoscale mineralogical and structural characterization was performed using a JEOL JEM-2010F field-emission transmission electron microscope (JEOL Ltd., Akishima, Tokyo, Japan) operated at 200 kV. The microscope was equipped with an ORIUS SC1000A slow-scan CCD camera (Gatan Inc., Pleasanton, CA, USA) and an Oxford Instruments Link ISIS300 energy-dispersive X-ray spectroscopy system (Oxford Instruments, High Wycombe, UK) fitted with a Si(Li) detector. FIB-SEM preparation was not employed, as site-specific extraction was unnecessary for the comparatively homogeneous silica material. The TEM specimens were prepared mechanically from powdered material, followed by ion milling to obtain electron-transparent regions, and mounted on conventional Cu TEM grids. Conventional TEM imaging, electron diffraction, scanning transmission electron microscopy/high-angle annular dark-field imaging (STEM-HAADF), and energy-dispersive X-ray spectroscopy (EDS) were used, where appropriate, to investigate the crystallinity, nanoscale structure, and chemical composition of the SiO2-rich materials and associated mineral inclusions.
3. Results and Discussion
3.1. Mineralogy by PXRD
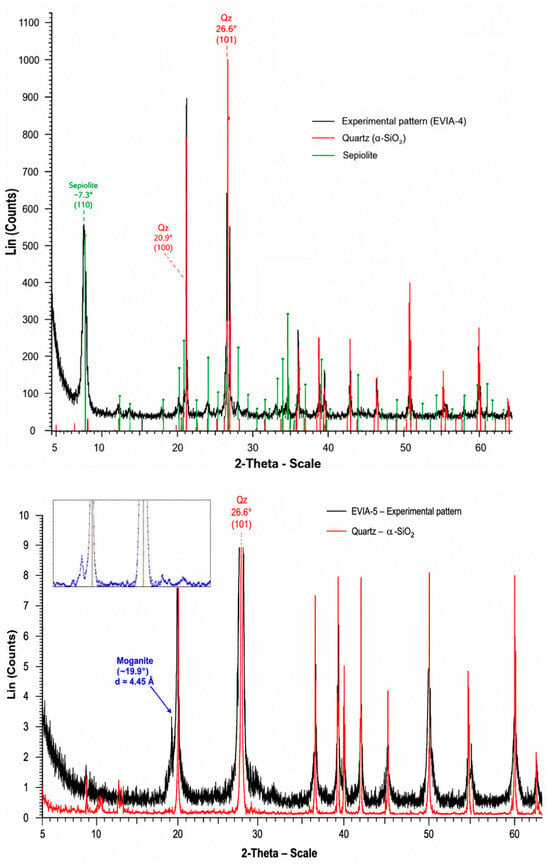
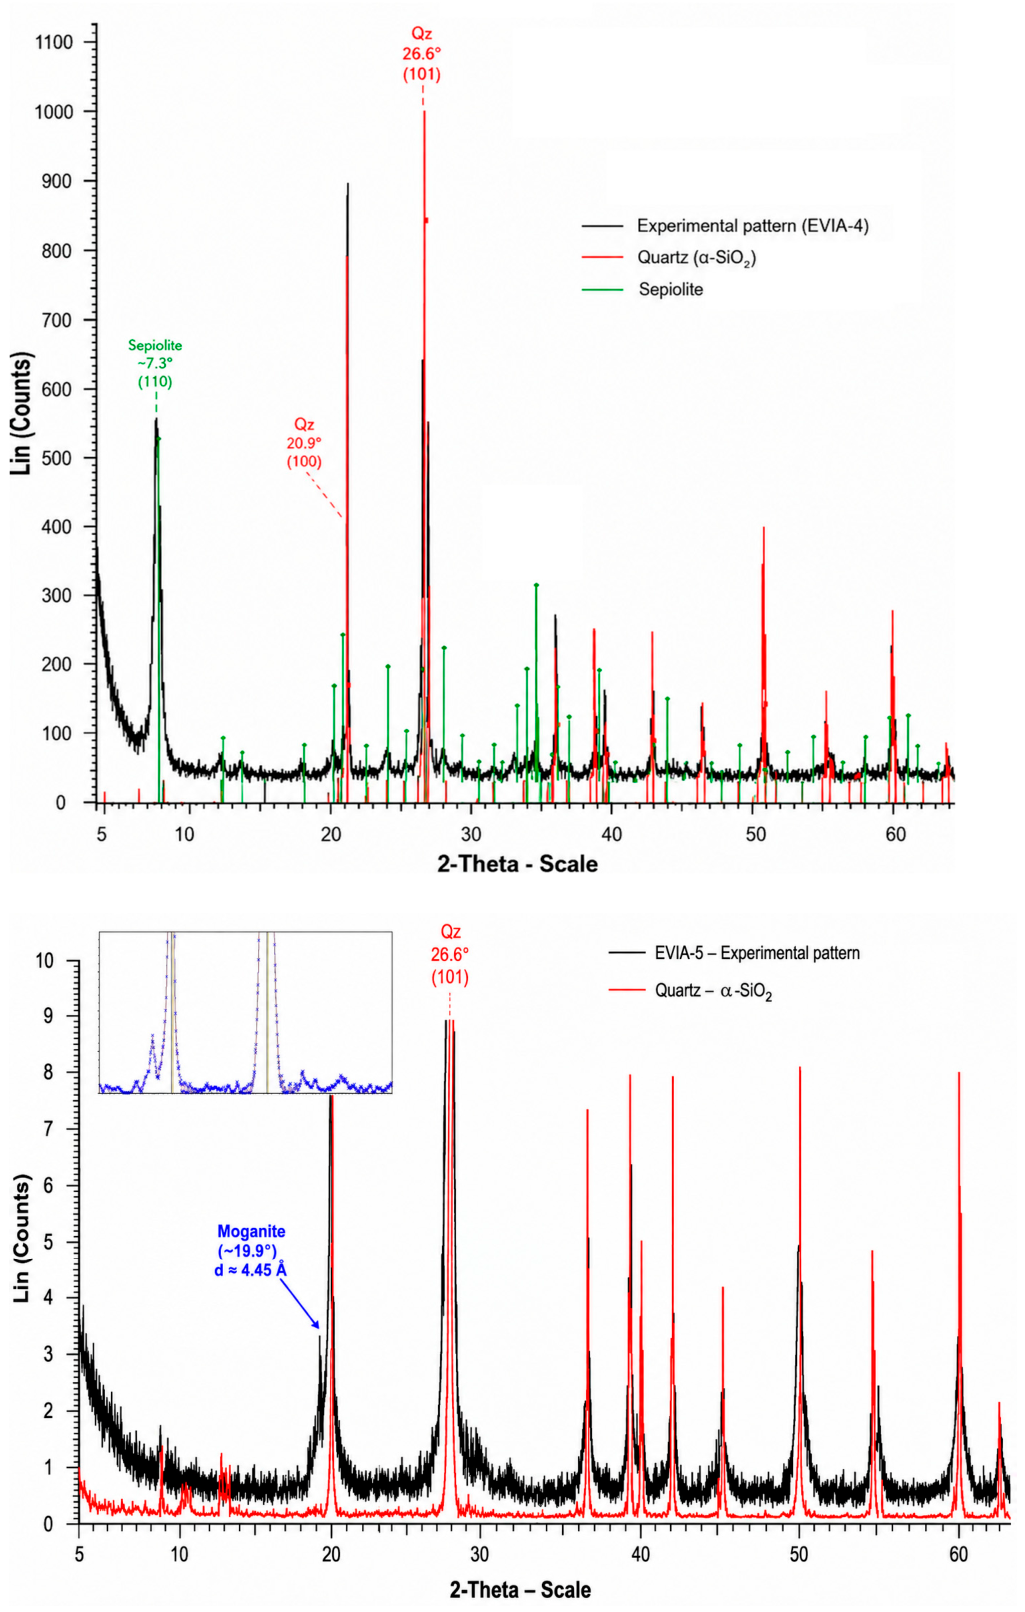
Representative PXRD patterns of the investigated samples are shown in Figure 1. Among the northern Evia samples, EVIA-1, EVIA-2, EVIA-3, EVIA-7, EVIA-8 and EVIA-9 contain α-quartz as the principal SiO2 phase, associated in variable proportions with carbonate minerals, principally magnesite and/or dolomite, and phyllosilicates, particularly sepiolite. Sample EVIA-8 is especially rich in sepiolite and occurs as a hard, nearly massive material regarded as gangue in the magnesite production line of TERNA MAG S.A. The materials conventionally described as “opal”, EVIA-4 and EVIA-5, are mineralogically the most distinctive samples. EVIA-4, a faintly green material, consists principally of α-quartz together with sepiolite. The occurrence of sepiolite is possibly linked to the colour of this material because sepiolite can accommodate Ni2+ through substitution for Mg2+. Ni-bearing sepiolite is well documented in ultramafic environments, and the Ni-dominant analogue of sepiolite is falcondoite, forming a solid-solution relationship with sepiolite [14,15]. The association observed in EVIA-4 therefore raises the possibility that its faint green colour is related to finely dispersed Ni-bearing sepiolite rather than to the SiO2 phase itself, similar to what was observed in chrysoprase [16,17]. EVIA-5 represents the macroscopically most “opal”-like material investigated from northern Evia, displaying a pale red-brown to pink colour and a glassy appearance despite its predominantly crystalline character. Its PXRD pattern is dominated by α-quartz, but an additional weak feature occurs at approximately 19.9–20.0° 2θ, immediately below the quartz (100) peak at ~20.9° 2θ. A peak in this region (d ≈ 4.45 Å) is characteristic of moganite, which commonly occurs intergrown with quartz in microcrystalline silica and may be difficult to recognize by conventional PXRD because several of its peaks occur close to major quartz peaks [18,19]. The observed feature is therefore consistent with the presence of moganite and suggests that EVIA-5 represents a quartz–moganite assemblage, likely carnelian—a reddish-brown to brownish-red variety of chalcedony—rather than opal.PXRD alone, however, does not provide an unambiguous identification of minor moganite in such fine-grained quartz-rich material. The structural identity of EVIA-5 was therefore further investigated using micro-Raman spectroscopy, 29Si MAS NMR and TEM.
Figure 1.
Representative PXRD patterns of the northern Evia “opal” samples. Upper panel: EVIA-4, a faintly green material consisting predominantly of α-quartz and sepiolite; the principal peaks of quartz and the diagnostic low-angle peak of sepiolite at ~7.3° 2θ are indicated. Lower panel: EVIA-5, a pale red-brown to pink, glassy material dominated by α-quartz; the weak additional peak at ~19.9° 2θ (d ≈ 4.45 Å), immediately below the quartz (100) peak at ~20.9° 2θ, is consistent with the presence of moganite. The main EVIA-5 pattern represents the diffraction data evaluated using the original equipment software, whereas the upper-left inset shows additional processing of the same original EVIA-5 .raw file using Match! software, highlighting the moganite-bearing region. Reference diffraction patterns and selected diagnostic reflections are shown for comparison.
3.2. Bulk Chemical Composition (ICP-MS)
The bulk trace-element compositions of EVIA-4 and EVIA-5 are presented in Table 1. Both silica materials are characterized by generally low trace-element concentrations, with most analysed elements occurring at or below their respective method detection limits. The most conspicuous compositional feature is the elevated Ni concentration of EVIA-4 (660.7 ppm), whereas EVIA-5 contains substantially less Ni (25.6 ppm). Other common metals, including Cr and Mn, were not detected in the separated silica fragments subsequently powdered for fusion and ICP-MS measurements (detection limit: 0.1 ppm for both elements). For comparison, an average Ni concentration of approximately 2.26 ppm has been reported for quartz [20]). Thus, although Ni concentrations in both samples exceed the value typically reported for quartz, the enrichment is particularly pronounced in the greenish EVIA-4 material. The high Ni concentration of EVIA-4, together with the identification of sepiolite by PXRD, suggests that Ni is principally associated with Ni-bearing sepiolite or related phyllosilicate inclusions rather than incorporated within the α-quartz structure. This interpretation is consistent with the occurrence of Ni-bearing phyllosilicates in ultramafic environments and is further evaluated below using μ-XRF observations. A comparable mineralogical control on colour has been demonstrated for chrysoprase, in which the characteristic green colour has been attributed to finely dispersed Ni-bearing phyllosilicate inclusions within the silica matrix rather than to Ni incorporated directly into the SiO2 structure [16,17]. In contrast, EVIA-5 is considerably less enriched in Ni and is remarkably poor in most other trace elements. Apart from Fe (see the μ-XRF results below), minor Zr (2.1 ppm), and very low concentrations of a few other elements, most analysed trace elements occur at or below their respective detection limits. The trace-element composition of EVIA-5 is also compatible with the generally low, but compositionally variable, trace-element contents reported for natural chalcedony and its varieties. EVIA-5 is notably trace-element poor, with most analysed elements occurring at or below their respective detection limits; among the detected elements, Ni (25.6 ppm) and Zr (2.1 ppm) are the most abundant, whereas La (0.2 ppm), Ce (0.3 ppm), Pr (0.03 ppm), Cu (0.2 ppm), Rb (0.1 ppm) and Pb (0.1 ppm) occur only at very low concentrations. Similarly, Götze et al. [21] reported generally low concentrations of many trace elements in agate, including Cr (0.39–1.02 ppm), Co (0.04–0.12 ppm) and individual REEs commonly below 1 ppm, although Fe (143–1280 ppm), Al (56–304 ppm) and some other elements were more variable. Considerable compositional variability among chalcedony varieties is also evident from Monico et al. [22], with agate being particularly trace-element poor, whereas chrysoprase and aquaprase show pronounced enrichments in elements such as Ni and Cr, respectively. Published carnelian compositions likewise exhibit considerable variability [23,24]. Thus, the comparatively trace-element-poor character of EVIA-5 falls within the broad compositional variability reported for natural chalcedonic silica and is consistent with its pre-classification as chalcedony.
Table 1.
Trace element concentrations in EVIA-4 and EVIA-5 determined by ICP-MS.
The bulk chemical data therefore emphasize the contrasting character of the two macroscopically “opal”-like materials: EVIA-4 is distinguished by pronounced Ni enrichment associated with its greenish appearance and sepiolite-bearing mineralogy, whereas EVIA-5 represents a comparatively trace-element-poor, but Fe-bearing, silica material whose principal interest lies in its SiO2 structural characteristics. The trace-element composition of EVIA-5 is broadly comparable with the generally low, but compositionally variable, trace-element contents reported for natural chalcedony and its varieties (Figure A1). Published data demonstrate considerable compositional variability among chalcedonic silica materials from different geological settings. Götze et al. [21], for example, reported generally low concentrations of many trace elements in agate, whereas Monico et al. [22] documented marked compositional differences among agate, chrysoprase and aquaprase, including pronounced Ni enrichment in chrysoprase and Cr enrichment in aquaprase. Similarly, published carnelian compositions show substantial variability in trace-element abundances [23,24]. Within this broad compositional framework, EVIA-5 lies at the trace-element-poor end of the range for chalcedonic silica, whereas EVIA-4 is clearly distinguished by its substantially higher Ni content (Figure A1). Thus, the comparatively trace-element-poor character of EVIA-5 is consistent with its pre-classification as chalcedony; its more specific interpretation as likely carnelian is further evaluated below in conjunction with its Fe distribution, colour and structural characteristics.
3.3. Microscale Chemical Composition (μ-XRF)
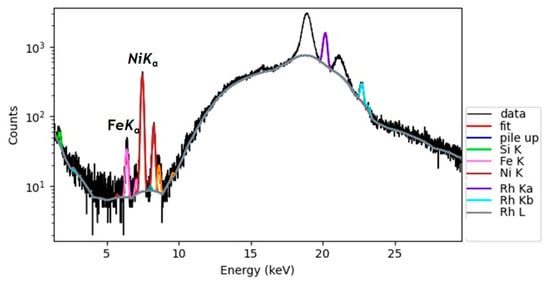
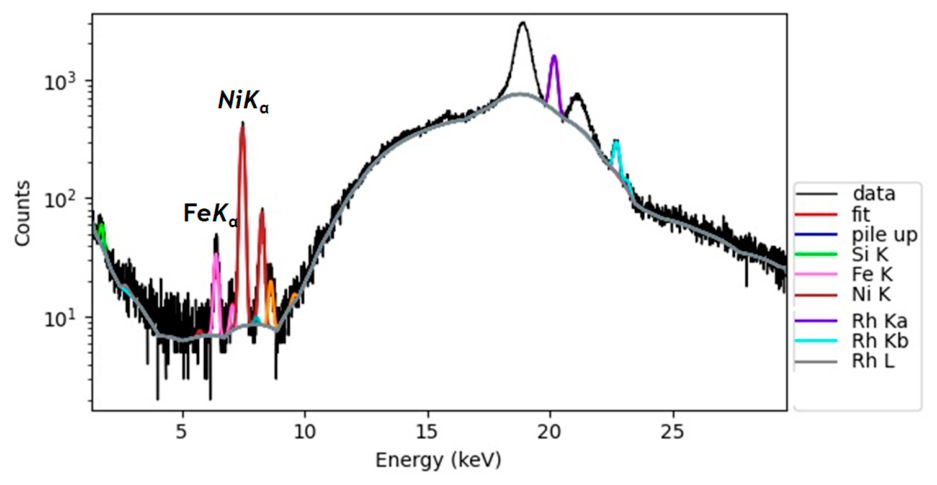
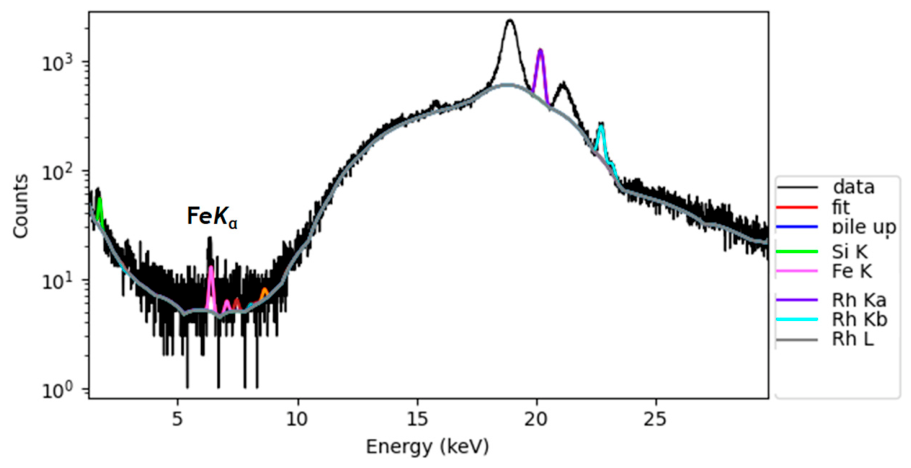
The microscale chemical composition of polished sections of EVIA-4 and EVIA-5 was investigated by μ-XRF, with particular emphasis on the distribution of transition metals within the silica-rich materials. A representative μ-XRF spectrum for EVIA-4 is shown in Figure 2. The analyses reveal the presence of Fe and, most importantly, Ni. Micro-XRF line scans and elemental maps demonstrate that these elements are heterogeneously distributed within the silica-rich material, with localized domains of enhanced Ni intensity. A representative Ni μ-XRF map of EVIA-4 is presented in Figure A2. Together with the independent identification of sepiolite by PXRD and the pronounced bulk Ni enrichment determined by ICP-MS, the spatial distribution observed by μ-XRF supports the interpretation that Ni is principally associated with sepiolite-bearing domains rather than incorporated within the α-quartz structure. Ni-bearing sepiolite is therefore considered the most likely mineralogical contributor to the faint green colour of EVIA-4, although its specific optical role is not demonstrated directly by the present data.
Figure 2.
Representative single-point μ-XRF spectrum acquired on the polished section of EVIA-4 after surveying the composition at the microscale for elements other than Si and O.
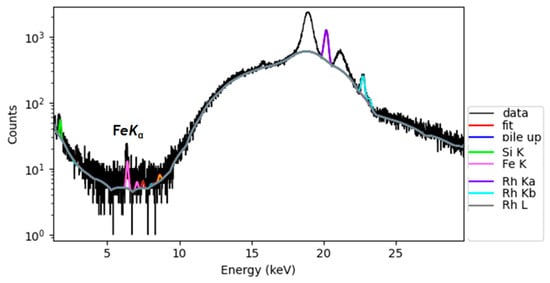
A distinctly different elemental distribution is observed in EVIA-5. A representative μ-XRF spectrum is shown in Figure 3. Nickel is not a prominent component, consistent with its substantially lower bulk concentration (25.6 ppm), whereas Fe is readily detected. Elemental mapping shows that Fe is heterogeneously distributed and concentrated at discrete points within the silica-rich material, rather than being homogeneously distributed throughout the matrix (Figure A3). This localized distribution is consistent with Fe occurring in finely dispersed submicroscopic Fe-bearing phases, potentially including Fe oxides and/or oxyhydroxides; however, their specific mineralogical identity cannot be established from the μ-XRF data alone.
Figure 3.
Representative single-point μ-XRF spectrum acquired on the polished section of EVIA-5 after surveying the composition at the microscale for elements other than Si and O.
The μ-XRF observations therefore reinforce the contrasting chemical character indicated by the bulk analyses: EVIA-4 is distinguished by pronounced Ni enrichment and a heterogeneous spatial distribution of Ni associated with its sepiolite-bearing mineralogy, whereas EVIA-5 contains much less Ni and is characterized instead by discrete Fe-rich domains within the chalcedonic silica.
3.4. Laser μ-Raman Spectroscopy
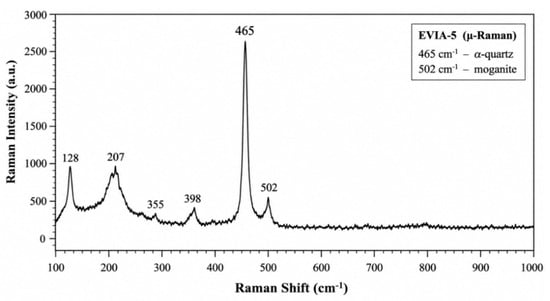
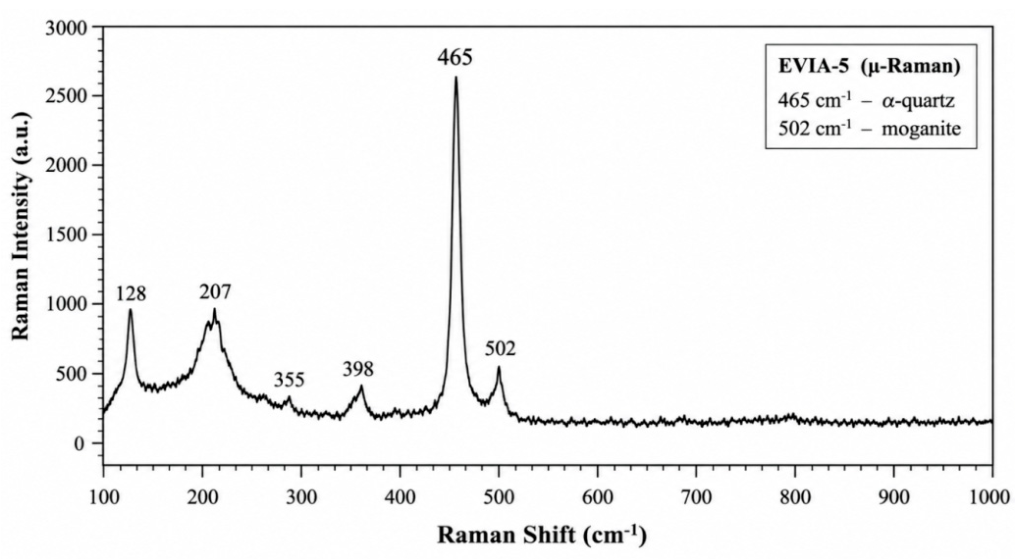
Because the X-ray diffraction peaks of moganite substantially overlap those of α-quartz, conventional PXRD alone may not provide unequivocal identification of moganite, particularly when it occurs in low abundance or as very fine crystalline domains. Micro-Raman spectroscopy was therefore employed to further investigate the structural identity of the SiO2 phases in EVIA-4 and EVIA-5 and, in the latter, their spatially variable spectral expression. Raman analysis of EVIA-4 confirmed the presence of α-quartz but provided no evidence for moganite, consistent with the PXRD results, indicating that this material can more appropriately be classified as sepiolite-bearing quartzite. EVIA-4 was therefore not investigated further by 29Si MAS NMR and TEM. The representative Raman spectrum of EVIA-5 (Figure 4) is dominated by the characteristic α-quartz bands at approximately 128, 207, 355, 398 and 465 cm−1, with the intense band at ~465 cm−1 representing the principal Raman feature of α-quartz. No robust Raman evidence was obtained for hematite, goethite or other Fe-bearing phases at the micrometre scale, despite the localized Fe enrichments revealed by μ-XRF. Considering the reddish colour of EVIA-5 and the heterogeneous distribution of Fe observed by μ-XRF, the absence of identifiable Fe-bearing phases in the Raman spectra may indicate that the Fe occurs in submicroscopic Fe-oxide and/or oxyhydroxide particles below the effective spatial or detection limits of the Raman measurements. Confirmation of their mineralogical identity would require targeted nanoscale investigation. As the present study focuses primarily on the structural characterization of the silica phases, this aspect was not investigated further. Nevertheless, the reddish to pale-pink colour and translucent appearance of EVIA-5, together with its Fe content and chalcedonic character established below, remain consistent with its interpretation as likely carnelian. Importantly, a distinct additional band occurs at approximately 502 cm−1, adjacent to the dominant quartz band. A Raman band in the ~501–503 cm−1 region is widely used as an indicator of moganite and has been extensively employed to distinguish moganite from associated α-quartz in natural microcrystalline silica materials [4,25,26,27,28,29,30,31], although some authors have attributed the feature to a combination of the moganite band at ~500–501 cm−1 and non-bridging Si–O vibrations of silanol groups at ~503 cm−1 (e.g., [32]). The application of micro-Raman spectroscopy to characterize quartz–moganite assemblages was demonstrated particularly by Götze et al. [25], who combined micro-Raman spectroscopy with Rietveld analysis and cathodoluminescence microscopy to investigate the occurrence and distribution of moganite in agate and chalcedony. More recently, Lampropoulou et al. [4] identified quartz and moganite in siliceous nodules from western Kefalonia, Greece, through characteristic Raman bands at ~464 and ~502 cm−1, respectively, in combination with XRD and TEM–SAED observations. The simultaneous occurrence of the intense ~465 cm−1 quartz band and the distinct ~502 cm−1 moganite-related band in EVIA-5 therefore provides strong spectroscopic evidence for a quartz–moganite assemblage, supporting the indication independently obtained by PXRD.
Figure 4.
Representative Raman spectrum of the macroscopically “opal”-like sample EVIA-5, showing the characteristicα-quartz bands at approximately 128, 207, 355, 398, and 465 cm−1, with the dominant band at 465 cm−1 corresponding to symmetric Si–O–Si stretching vibrations. The distinct band at approximately 502 cm−1 is considered moganite-related.
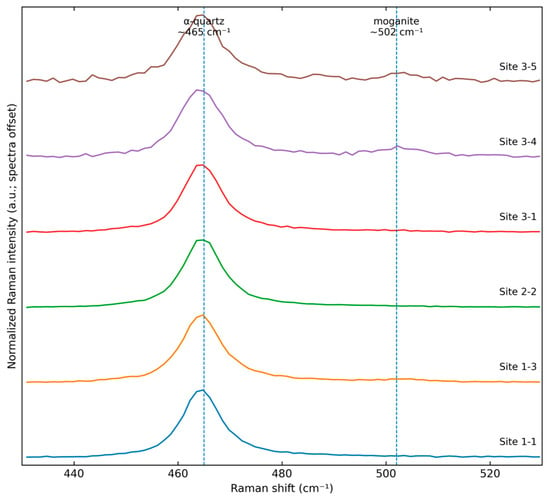
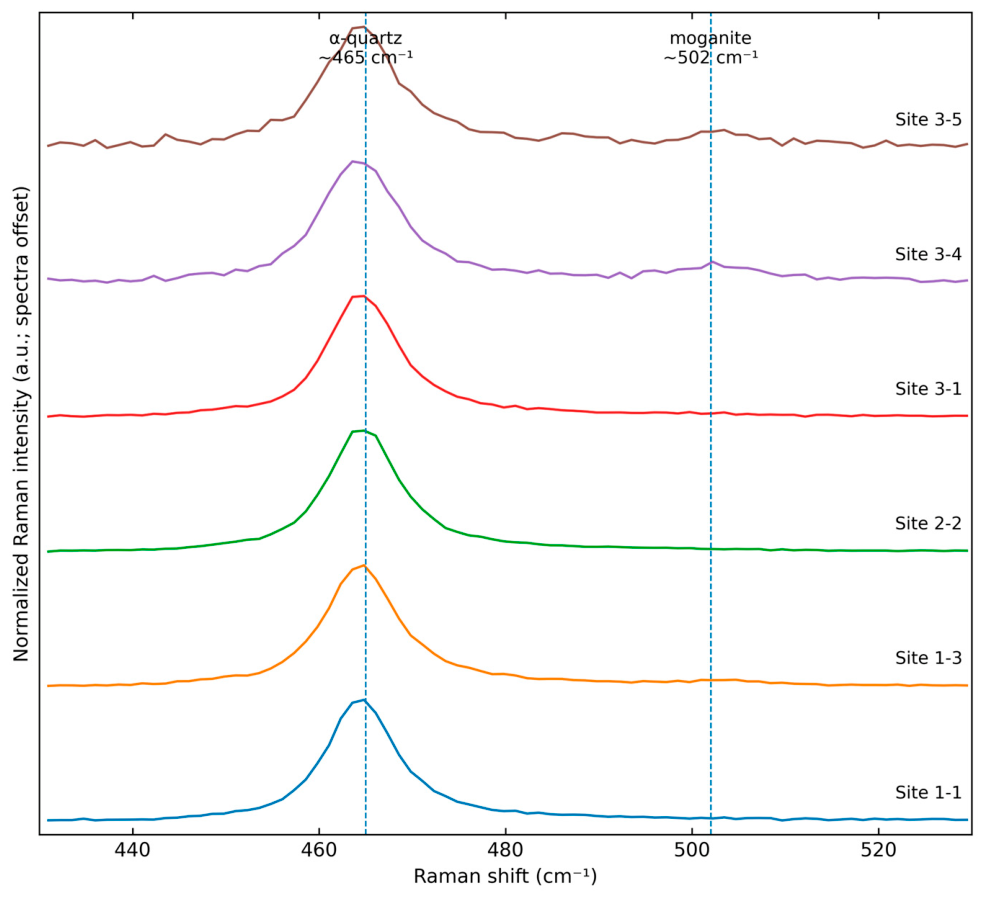
To evaluate the spatial reproducibility and local expression of the moganite-related Raman feature without relying on intensity maps, representative spectra acquired at different positions within EVIA-5 were reprocessed using the same baseline-correction procedure and compared over the 430–530 cm−1 region (Figure 5). For visualization, the spectra were normalized to the dominant ~465 cm−1α-quartz band and vertically offset. The ~465 cm−1 band is consistently present at all investigated positions, whereas the ~502 cm−1 moganite-related feature is locally resolved with variable relative intensity and is particularly evident in selected spectra from Site 3. These data therefore support intimate association of quartz and moganite within a spatially heterogeneous microcrystalline silica assemblage. Importantly, the normalized spectra are used only to compare spectral shape and the local expression of the ~502 cm−1 feature; Raman intensities are not used here to quantify the relative proportions of quartz and moganite. This conservative interpretation avoids assigning mineral abundances from spatial variations in absolute Raman intensity, which may also be influenced by sample topography, focus and collection efficiency. Comparable intimate quartz–moganite associations have been documented in other fine-grained natural silica materials, particularly agate, chalcedony and siliceous nodules [4,18,25,27,28,31]. The Kefalonia material investigated by Lampropoulou et al. [4] provides a particularly relevant Greek analogue, although it occurs as siliceous nodules in a carbonate-hosted geological setting rather than in association with ultramafic-hosted magnesite mineralization. The structural character of the EVIA-5 quartz–moganite assemblage at the nanometre scale is further evaluated by TEM below. The identification of moganite in EVIA-5 is also noteworthy in the context of Greek natural silica occurrences. Lampropoulou et al. [4] documented moganite-bearing siliceous nodules hosted by carbonate rocks in western Kefalonia, whereas Skliros et al. [5] reported moganite in chalcedony and carnelian associated with a Tertiary volcanic–hydrothermal environment in the Evros region, northeastern Greece. EVIA-5, in contrast, represents silica associated with the ultramafic-hosted magnesite deposits of northern Evia. To the best of our knowledge, this is the first identification of moganite in natural silica associated with an ultramafic-hosted magnesite deposit in Greece.
Figure 5.
Representative baseline-corrected μ-Raman spectra acquired at different positions within sample EVIA-5, shown over the 430–530 cm−1 spectral region and normalized to the dominant ~465 cm−1 α-quartz band. The ~502 cm−1 band attributed to moganite is locally resolved with variable relative intensity. Spectra are vertically offset for clarity. The spectra are presented to illustrate spatial variation in spectral response and are not used to quantify the relative proportions of quartz and moganite.
3.5. 29Si MAS NMR Spectroscopy
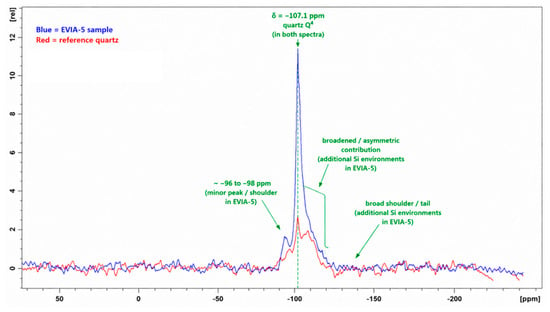
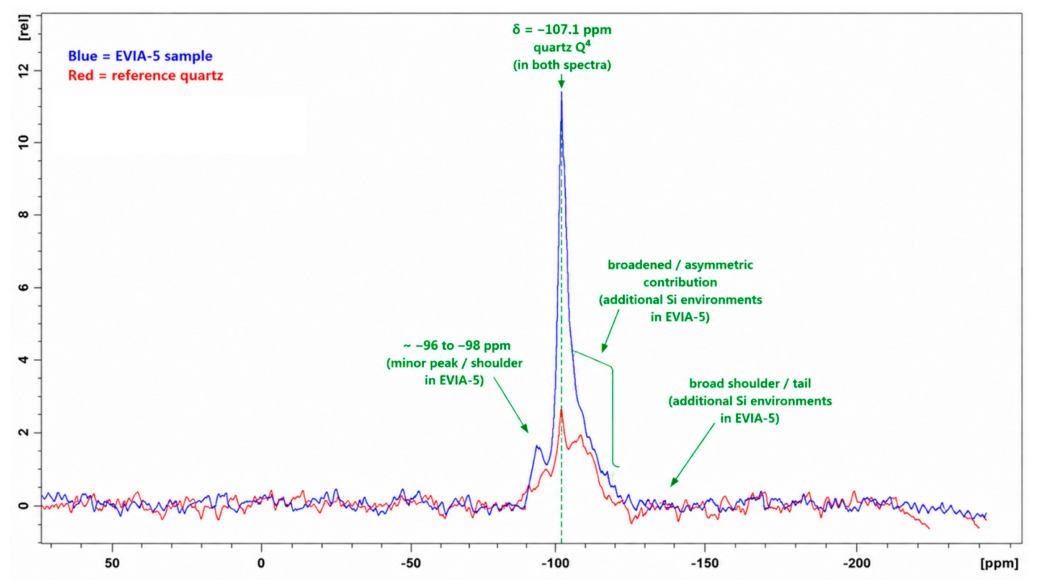
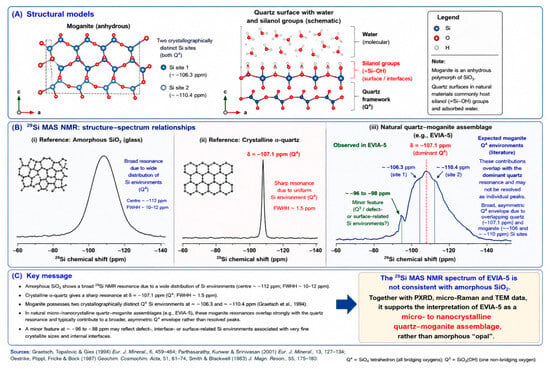
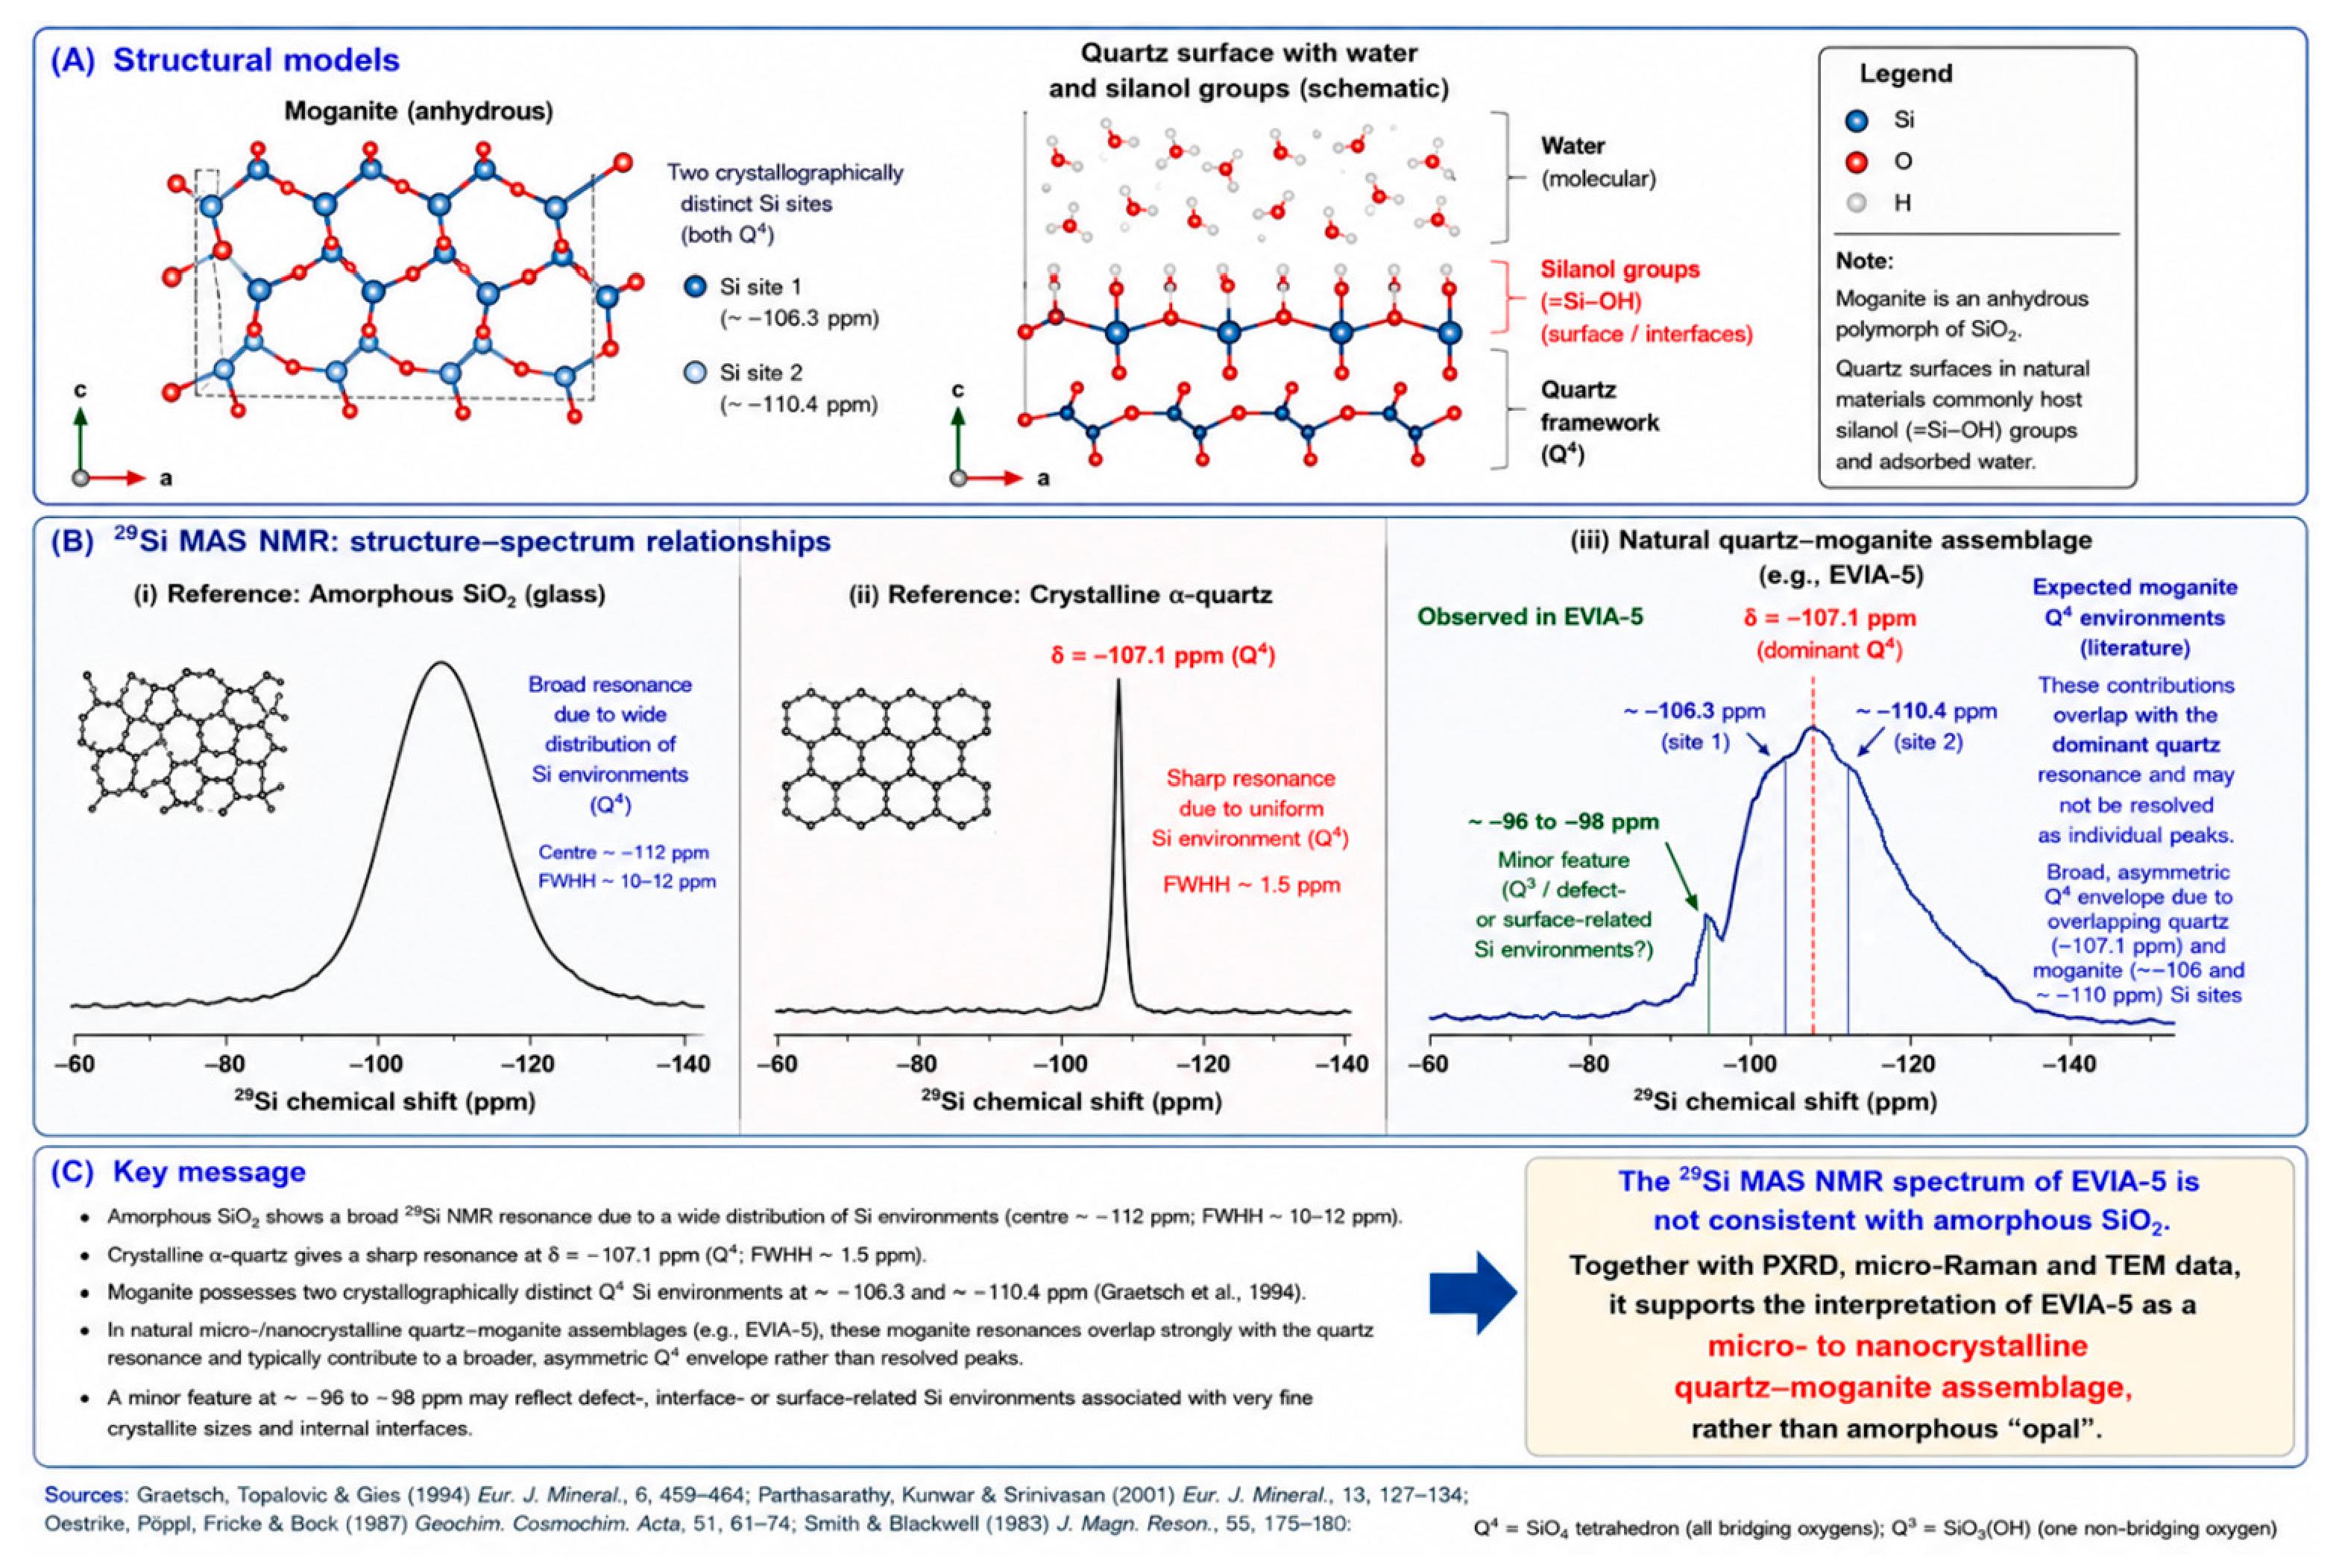
The 29Si MAS NMR spectrum of EVIA-5 is compared with that of natural α-quartz in Figure 6. The reference quartz spectrum (red) is characterized by a sharp dominant resonance at δ = −107.1 ppm, corresponding to the Q4 Si environment of crystalline α-quartz and consistent with previously reported 29Si NMR data [33]. The EVIA-5 spectrum (blue) is likewise dominated by a resonance at δ = −107.1 ppm, but differs markedly from the natural quartz reference in its broader, asymmetric profile and pronounced shouldering. This spectral complexity is particularly significant in view of previous 29Si MAS NMR investigations of moganite. Unlike α-quartz, moganite contains two crystallographically distinct Si sites and consequently exhibits a more complex 29Si NMR response. Graetsch et al. [34] reported two principal resonances at approximately −106.3 and −110.4 ppm, assigned to the two distinct tetrahedral Si environments in moganite. Parthasarathy et al. [26] subsequently observed a sharp resonance at approximately −110 ppm, together with a broad contribution or shoulder near −106 ppm, in natural moganite-rich chalcedony from the Deccan basalts, whereas their quartz-rich material showed a strong resonance at approximately −107.6 ppm. The close proximity of the moganite resonance at ~−106 ppm to the principal α-quartz resonance means that these contributions cannot readily be resolved independently in a natural quartz–moganite intergrowth such as EVIA-5. Similarly, the second moganite environment near −110 ppm is expected to contribute additional intensity to the more negative chemical-shift side of the principal Q4 envelope. Thus, rather than representing individually resolved moganite resonances, the broader and asymmetric Q4 envelope of EVIA-5 is consistent with overlapping local Si environments associated with its micro- to nanocrystalline quartz–moganite assemblage. This interpretation agrees with the independent identification of moganite by PXRD and its diagnostic ~502 cm−1 Raman band and is further supported by the TEM observations of intimately associated micro- to nanocrystalline silica domains. A minor additional feature is apparent at approximately δ = −96 to −98 ppm in EVIA-5 and is absent, or substantially less pronounced, in the natural α-quartz reference. Its chemical shift is distinct from the principal Q4 resonances of both quartz and moganite and may reflect a minor population of defect-, interface-, or surface-related Si environments associated with the very fine crystallite size and high density of internal interfaces in EVIA-5. Such environments may include incompletely polymerized or hydroxyl-associated Si sites at crystallite surfaces and quartz–moganite boundaries. The 29Si MAS NMR spectrum of EVIA-5 also differs markedly from the broad resonance characteristic of amorphous SiO2. In silica glass, structural disorder and the associated distribution of Si–O–Si bond angles and local tetrahedral geometries produce a broad distribution of 29Si chemical shifts and consequently a broad Q4 resonance [35,36]. Oestrike et al. [35], for example, reported a broad 29Si resonance for SiO2 glass centred at −112.1 ppm, with a full width at half height (FWHH) of 11.2 ppm, in contrast to the much narrower resonance of crystalline quartz (FWHH ~1.5 ppm). EVIA-5 instead retains a strong, comparatively well-defined crystalline-SiO2 resonance at δ = −107.1 ppm, although its broader and asymmetric profile relative to the natural α-quartz reference reflects a more heterogeneous distribution of local Si environments (Figure 6). A schematic comparison of the expected 29Si NMR responses of amorphous silica, crystalline α-quartz and a natural micro-/nanocrystalline quartz–moganite assemblage is presented in Figure 7. The NMR results therefore provide independent evidence that the macroscopically “opal”-like EVIA-5 material is not predominantly amorphous silica. Rather than exhibiting the broad, relatively featureless Q4 distribution characteristic of silica glass, EVIA-5 retains a dominant crystalline-SiO2 resonance accompanied by asymmetry, shouldering and minor additional Si environments. Considered together with the PXRD and micro-Raman data and, particularly, the TEM observations (see below), the 29Si MAS NMR results are fully consistent with the interpretation of EVIA-5 as a micro- to nanocrystalline quartz–moganite assemblage corresponding mineralogically to reddish to pale-pink chalcedony, likely carnelian, rather than “opal.”
Figure 6.
29Si MAS NMR spectra of EVIA-5 (blue) and reference α-quartz (red); the x-axis represents the 29Si chemical shift, δ (ppm). The dominant resonance at δ = −107.1 ppm corresponds to the Q4 Si environment of quartz and is present in both spectra. Relative to reference quartz, EVIA-5 displays a broader and asymmetric resonance envelope, together with a minor feature at approximately δ = −96 to −98 ppm, indicating additional local Si environments.
Figure 7.
Schematic interpretation of the structural–spectroscopic relationships relevant to the 29Si MAS NMR spectrum of EVIA-5. (A) Structural models illustrating the two crystallographically distinct Q4 Si environments of moganite and schematic surface/interface silanol groups in micro- to nanocrystalline silica. (B) Comparison of characteristic 29Si MAS NMR responses of amorphous SiO2, crystalline α-quartz, and the EVIA-5 quartz–moganite assemblage. The expected moganite Q4 contributions at approximately −106.3 and −110.4 ppm overlap the dominant quartz resonance at −107.1 ppm, consistent with the broader, asymmetric EVIA-5 envelope; the minor feature at −96 to −98 ppm may reflect defect-, interface-, or surface-related Si environments. (C) Summary interpretation of EVIA-5 as a micro- to nanocrystalline quartz–moganite assemblage rather than predominantly amorphous “opal.” Literature values, structural models, and spectroscopic interpretations presented in the figure are based on Parthasarathy et al. [26], Smith and Blackwell [33], Graetsch et al. [34], Oestrike et al. [35], and Brouwer [36].
3.6. Transmission Electron Microscopy (TEM)
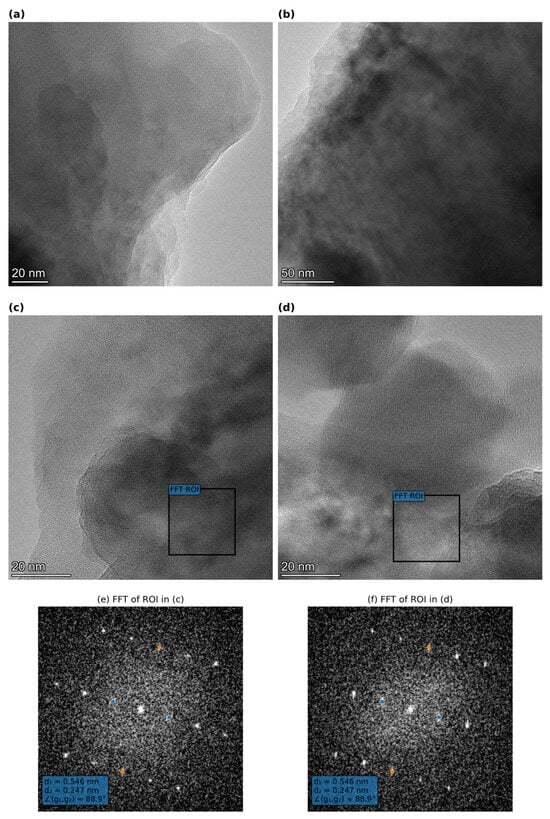
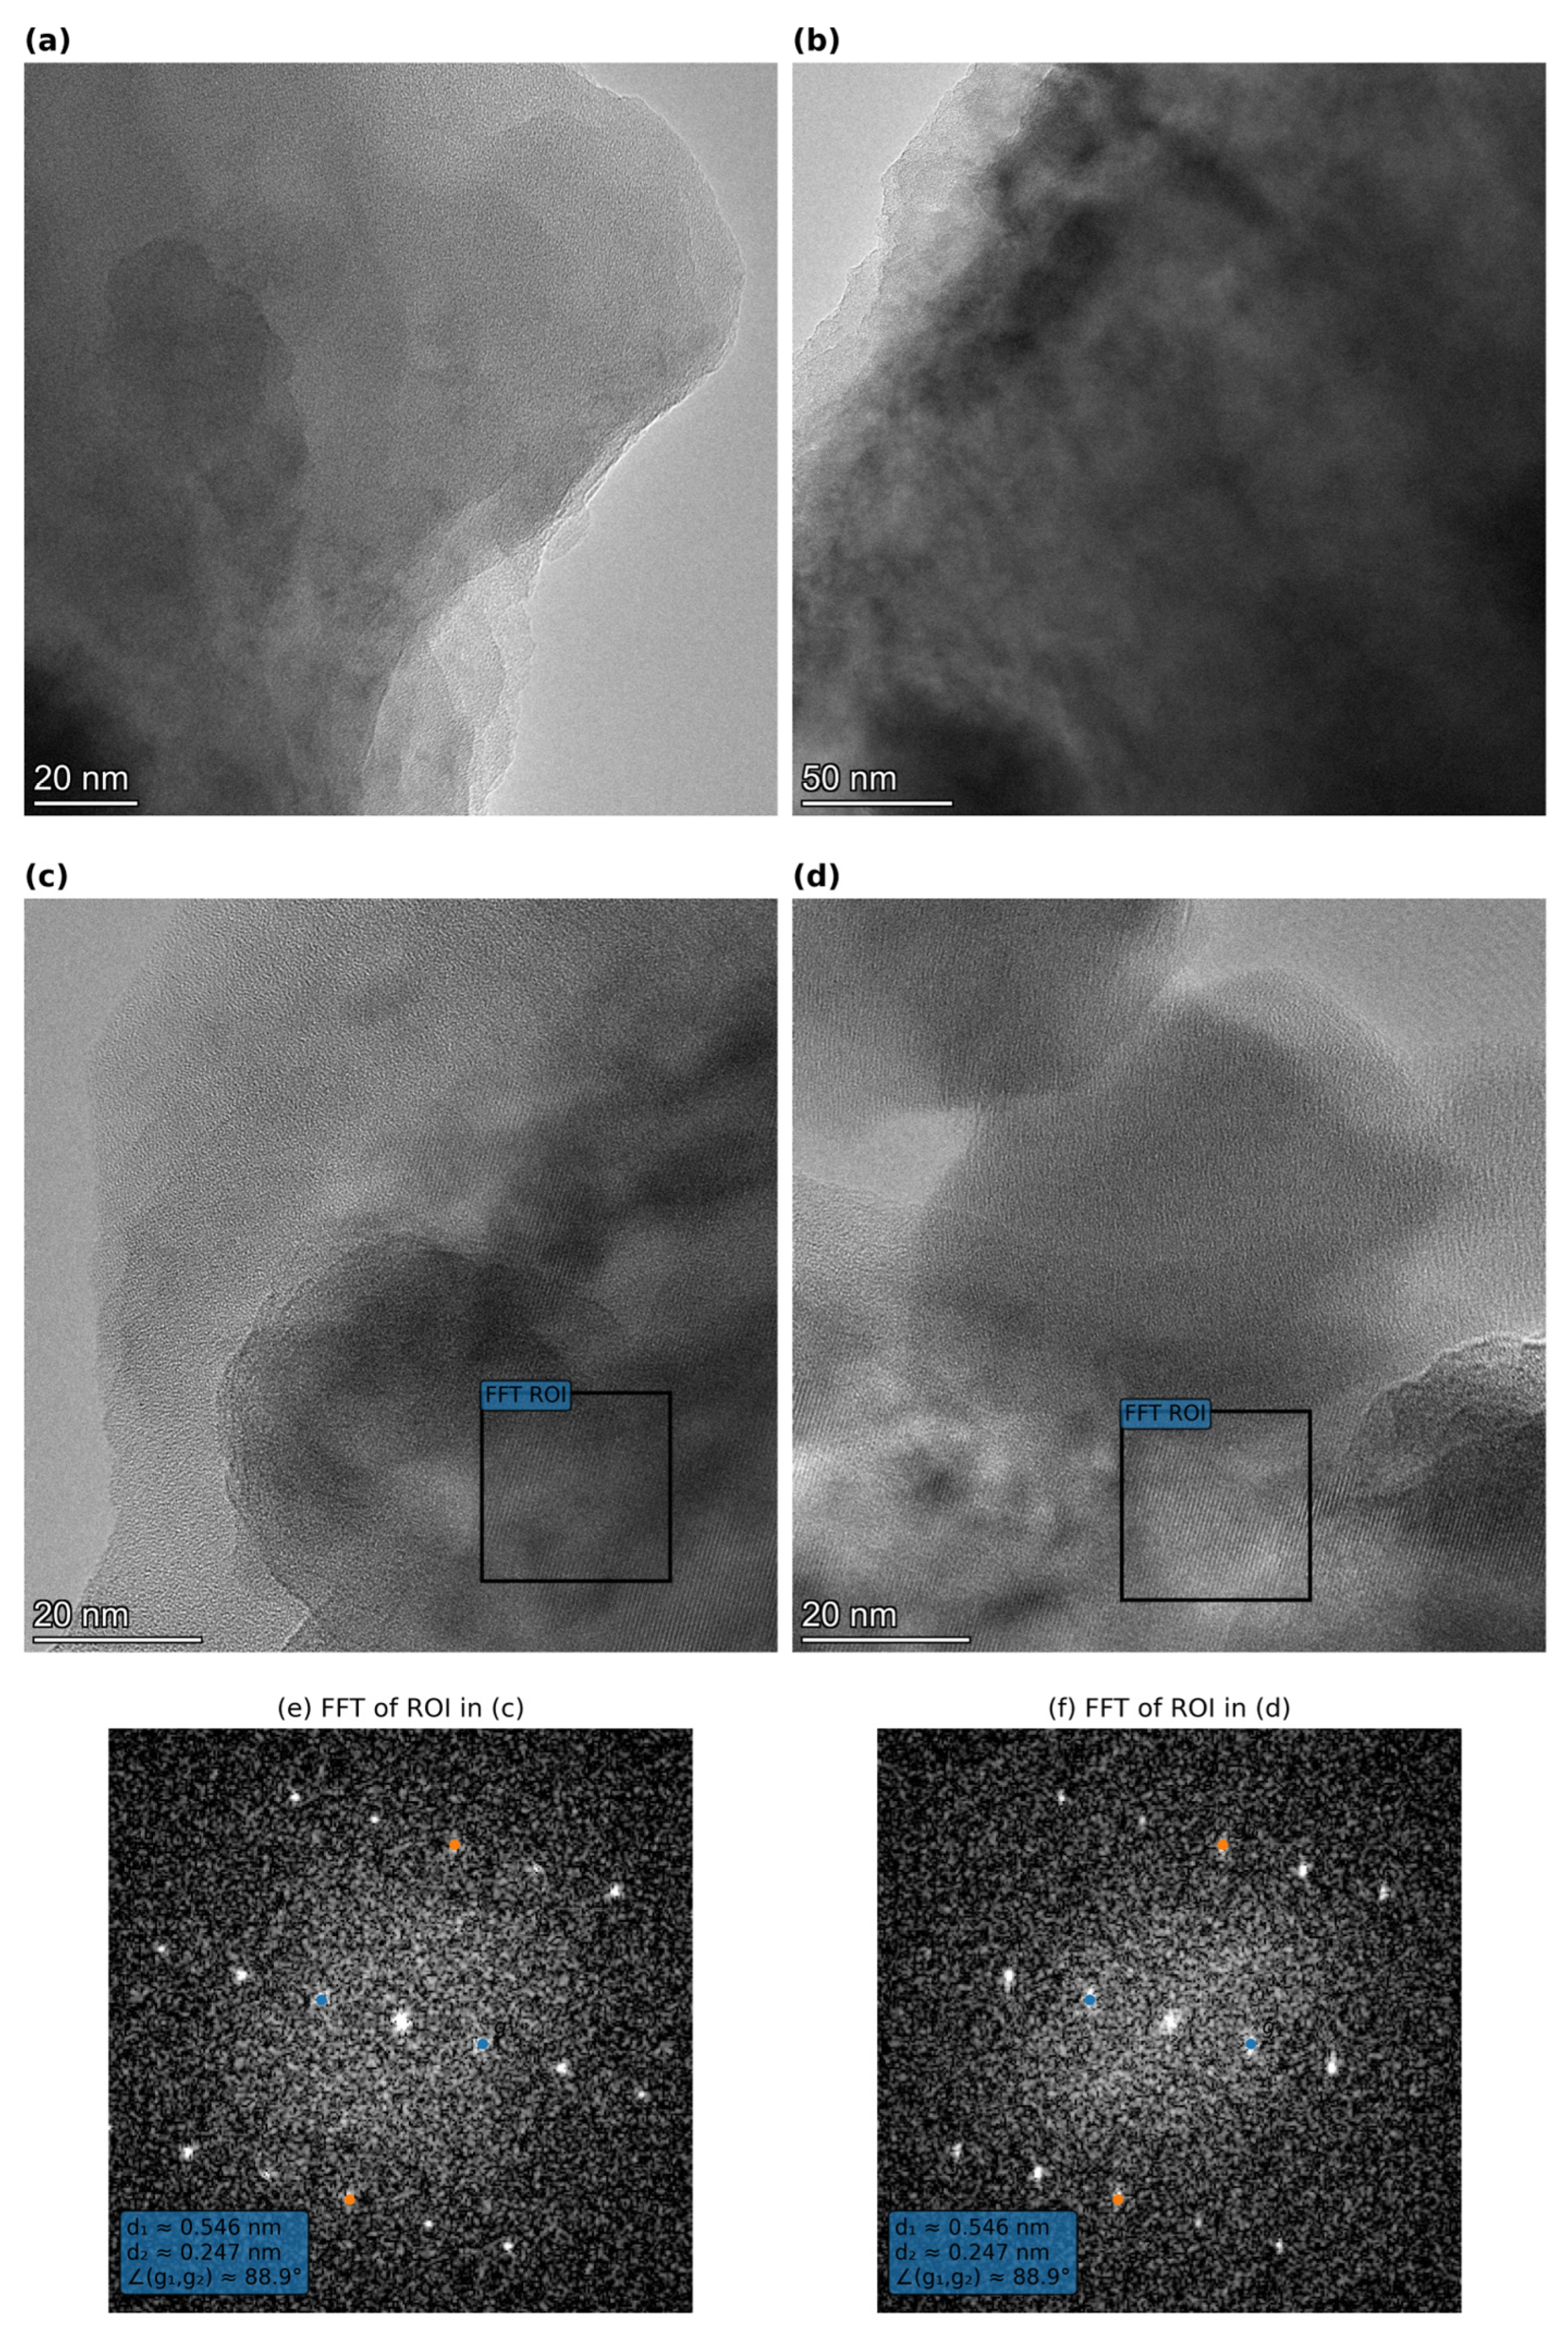
Transmission electron microscopy (TEM) further demonstrates the crystalline nature and nanoscale organization of the silica material. At low magnification, EVIA-5 consists of irregular aggregates of submicrometre particles and domains, whereas higher-magnification TEM and HRTEM imaging reveal abundant micro-/nanocrystalline regions, typically several tens of nanometres across (Figure 8). Well-resolved lattice fringes occur locally and change orientation between adjacent domains, indicating aggregation and/or intergrowth of differently oriented silica crystallites rather than a homogeneous amorphous silica matrix. Areas lacking clearly resolved lattice fringes should not necessarily be regarded as amorphous, as their appearance may also reflect crystal orientation and specimen thickness. HAADF-STEM imaging and EDS elemental mapping show broadly coincident distributions of Si and O throughout the aggregates, whereas only a very weak and dispersed Ti signal was detected (Figure A4).
Figure 8.
Representative TEM/HRTEM images of the micro-/nanocrystalline silica assemblage in EVIA-5. Selected lattice-fringe domains and corresponding FFTs exhibit discrete reciprocal-lattice maxima, confirming local crystalline ordering. The principal periodicities obtained independently from the HRTEM images are approximately 0.54 and 0.247 nm, with an approximately orthogonal reciprocal-vector relationship. This geometry closely reproduces that independently determined from the SAED patterns (Figure A5) and is crystallographically compatible with projections close to the [210] zone axis of α-quartz and the [100] zone axis of moganite. Because these projections have very similar principal reciprocal metrics and because HRTEM Fourier components may additionally be affected by imaging conditions and nanoscale intergrowth, the FFTs are used to demonstrate crystalline ordering and crystallographic consistency rather than as an independent basis for distinguishing quartz from moganite. (a) Representative TEM image of the micro-/nanocrystalline silica assemblage; (b) representative TEM image showing another micro-/nanocrystalline domain; (c) HRTEM image showing a selected lattice-fringe domain, with the box indicating the region of interest (ROI) used for FFT analysis; (d) HRTEM image showing a second selected lattice-fringe domain, with the box indicating the ROI used for FFT analysis; (e) FFT calculated from the boxed ROI in (c); (f) FFT calculated from the boxed ROI in (d).
Fast Fourier Transform (FFT) analysis of selected HRTEM regions exhibiting well-resolved lattice fringes produces discrete, regularly arranged reciprocal-lattice maxima, independently confirming local crystalline ordering (Figure 8). Analysis of independent crystalline domains yields two principal periodicities of approximately 0.54 and 0.247 nm (5.4 and 2.47 Å), with an approximately orthogonal relationship between the corresponding reciprocal vectors (~89°). These values closely reproduce the principal reciprocal-lattice geometry independently obtained by selected-area electron diffraction (SAED; Figure A5). The FFT geometry is compatible with projections close to both α-quartz [210] and moganite [100], whose principal reciprocal metrics are very similar because of their close structural relationship [37]. Because the FFTs do not contain sufficiently diagnostic additional reciprocal-lattice information to distinguish these closely related structures unequivocally, and because Fourier components derived from HRTEM images may additionally be affected by imaging conditions, specimen thickness, dynamical scattering and nanoscale intergrowth, the FFT analysis is used here primarily to demonstrate local crystalline ordering and crystallographic consistency with the quartz–moganite assemblage rather than as an independent basis for phase identification.
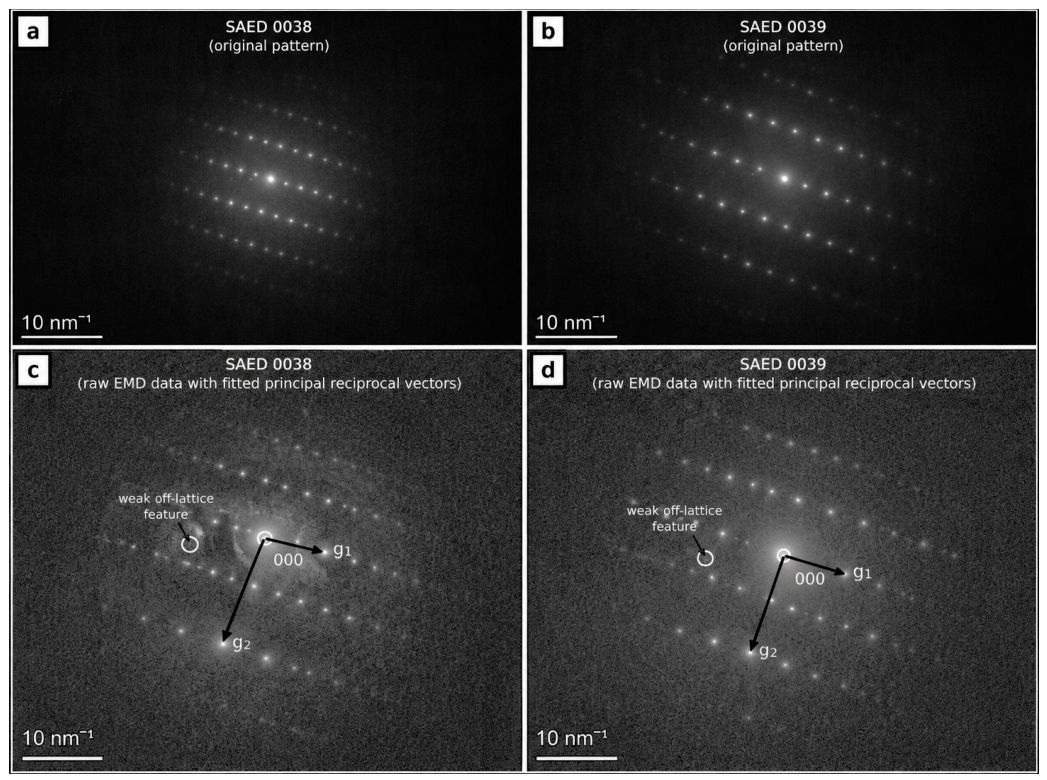
SAED patterns obtained from different crystalline silica domains (Figure A5) exhibit sharp, regularly arranged reflections, further confirming the crystalline character of the material. Re-evaluation of the original calibrated SAED datasets (patterns 0038 and 0039 in Figure A5), acquired at camera lengths of 330 and 524 mm, respectively, yielded highly reproducible reciprocal-lattice geometries. The two principal reciprocal translations correspond to d-spacings of 5.405 and 2.458 Å in pattern 0038 and 5.425 and 2.467 Å in pattern 0039, with inter-vector angles of 89.88° and 90.16°, respectively, and an essentially identical reciprocal-vector ratio of 2.199 in both patterns. The principal metric can be indexed according to the α-quartz [210] orientation proposed by the Reviewer, but is also compatible with the structurally closely related [100] projection of moganite. Importantly, consideration of the complete experimental reflection sequence shows that these two descriptions are not crystallographically equivalent. Under the α-quartz [210] indexing, the successive reflections along the long-period reciprocal direction correspond to 001, 002 and 003; because the quartz screw-axis reflection condition requires 001: 1 = 3n, the first two are systematically absent in the ideal kinematical diffraction pattern. Nevertheless, clear intensity occurs at these reciprocal positions in both independently acquired experimental patterns. In the moganite [100] description, the same sequence corresponds naturally to 002, 004 and 006, while the approximately orthogonal 2.46 Å periodicity is compatible with 020. Thus, although the principal reciprocal metric is compatible with both structural descriptions, the observed reflection sequence is more directly consistent with a moganite-related [100] reciprocal lattice than with an ideal kinematical α-quartz [210] pattern.
This interpretation nevertheless requires caution because electron diffraction is strongly affected by dynamical and multiple scattering, through which nominally forbidden reflections may acquire intensity. In natural chalcedony, additional complications may arise from nanoscale quartz–moganite intergrowth, differently oriented or overlapping crystallites, Brazil-law twinning, structural disorder, specimen thickness and double diffraction. Weak additional/intermediate reflections are reproducibly present in both experimental patterns, but their origin cannot presently be assigned uniquely to moganite superstructure rather than intergrowth- or dynamical-diffraction effects. This complexity is consistent with the experimental TEM/SAED literature on natural quartz–moganite assemblages. Miehe and Graetsch [19] documented moganite diffraction involving additional superstructure reflections, whereas Lee et al. [38] further documented intimate nanoscale intergrowth of moganite and quartz and associated complex diffraction features. Kovács Kis and Dódony [39] reported an experimental [100] SAED pattern of moganite in chalcedony in which the 002 and 020 reflections define a principal reciprocal geometry comparable to that observed here, while also discussing complexities associated with quartz–moganite structural relationships and intergrowth. Natalio et al. [40] distinguished α-quartz and moganite nanocrystallites by indexing SAED patterns against crystallographic reference structures, demonstrating that phase discrimination is possible where sufficiently diagnostic diffraction information is available. Conversely, Lampropoulou et al. [4], studying natural quartz–moganite-bearing siliceous nodules from western Kefalonia, noted that discrete moganite domains could not be distinguished because of the similarity between quartz and moganite d-spacings. Accordingly, although re-analysis of the original SAED data provides crystallographic support for a moganite-related interpretation, the patterns are not regarded as independently diagnostic of moganite.
Taken together, the TEM observations demonstrate that EVIA-5 lacks the predominantly amorphous nanoscale character expected for “opal” (fundamentally opal-A) and instead comprises an intimate micro-/nanocrystalline silica assemblage. HRTEM-FFT and SAED independently reveal closely comparable reciprocal-lattice periodicities, providing internally consistent crystallographic evidence for the nanocrystalline silica assemblage, although neither technique is used alone to distinguish unequivocally between α-quartz and moganite in individual nanodomains. Identification of moganite and its association with α-quartz is independently supported by the complementary PXRD, micro-Raman spectroscopy, and 29Si MAS NMR results. The material traditionally described as “opal” from the northern Evia magnesite deposits is therefore not predominantly amorphous opal, but a micro-/nanocrystalline quartz–moganite assemblage, corresponding mineralogically to chalcedony, likely carnelian.
4. Conclusions
The mineralogical re-examination of natural silica materials from Greece demonstrates that macroscopic appearance and traditional designation as “opal” do not necessarily reflect their actual structural state. The principal conclusions are:
- The investigated silica materials span poorly ordered to fully crystalline structural states rather than being uniformly amorphous. α-Quartz is the principal SiO2 phase, while moganite occurs together with quartz in the chalcedonic EVIA-5 material from the northern Evia magnesite deposits.
- The faint green colour of the quartz-rich EVIA-4 sample from northern Evia is associated with pronounced Ni enrichment (661 ppm) and sepiolite-rich domains showing localized Ni enrichment, suggesting that Ni-bearing sepiolite is the most likely mineralogical contributor to its colour rather than Ni incorporation into the quartz structure. This association illustrates the potential importance of accessory mineral phases in influencing the colour and macroscopic appearance of fine-grained natural silica materials. Moganite was not detected in EVIA-4 by either PXRD or micro-Raman spectroscopy. Despite its Ni-bearing character and pale green colour, EVIA-4 represents a quartz-rich gangue material whose relatively opaque appearance and mineralogical characteristics make its classification as chrysoprase questionable, particularly from a practical gemological perspective. Considering its quartz-dominated crystalline mineralogy and subordinate sepiolite content, EVIA-4 can therefore be more appropriately regarded as a sepiolite-bearing quartzite.
- The glassy, reddish to pale-pink EVIA-5 sample is comparatively trace-element poor but Fe-bearing, with μ-XRF revealing localized Fe-rich domains most probably related to submicroscopic Fe oxides and/or oxyhydroxides. EVIA-5 consists of a micro-/nanocrystalline quartz–moganite assemblage, with the presence of moganite supported primarily by PXRD and the moganite-related ~502 cm−1 Raman band, while 29Si MAS NMR provides complementary evidence for the crystalline character and structural complexity of the silica.TEM/HRTEM observations independently demonstrate the micro-/nanocrystalline character and nanoscale organization of the silica, while FFT analysis of lattice-fringe domains and SAED reveal closely comparable reciprocal-lattice periodicities, providing internally consistent evidence for crystalline ordering. Although these electron-microscopy data are crystallographically compatible with the quartz–moganite assemblage, they are not considered independently diagnostic of quartz or moganite in individual nanodomains. Together with its reddish colour, translucent appearance and Fe-bearing character, these mineralogical and structural characteristics indicate that EVIA-5 can be classified as chalcedony, likely carnelian, rather than “opal,” although it represents gangue material rather than gem-quality silica.
- To our knowledge, EVIA-5 represents the first identification of moganite in natural silica associated with an ultramafic-hosted magnesite deposit in Greece, extending the range of geological environments in which moganite-bearing silica has been documented in the country beyond previously reported volcanic–hydrothermal environments and carbonate-hosted siliceous nodules.
Overall, these results demonstrate the importance of combining diffraction, spectroscopic, chemical and nanoscale approaches for the reliable characterization of fine-grained natural SiO2 materials. They further caution against assigning structural terms such as “opal” or “amorphous silica” solely on the basis of macroscopic appearance or traditional nomenclature, and emphasize that apparently glassy or opal-like materials may in fact consist predominantly of poorly ordered or micro-/nanocrystalline silica phases.
Author Contributions
Conceptualization, S.F.A. and A.G.; methodology, S.F.A. and A.G.; formal analysis, S.F.A., J.Z., A.P., A.G.K. and A.C.; investigation, S.F.A. and A.G.; data curation, S.F.A. and A.G.; writing—original draft preparation, S.F.A. and A.G.; writing—review and editing, S.F.A., J.Z., A.P., A.G.K., A.C., P.V., S.K. and A.G.; visualization, S.F.A. and A.G.; supervision, A.G.; project administration, A.G. and J.Z. contributed to TEM analyses; A.P. to micro-Raman spectroscopy; A.G.K. to μ-XRF analyses; and A.C. to solid-state 29Si MAS NMR analysis and interpretation. P.V. and S.K. provided scientific advice and critical review of the manuscript. All authors have read and agreed to the published version of the manuscript.
Funding
This research received no external funding.
Data Availability Statement
The data supporting the findings of this study are available within the article and Appendix A. Additional data are available from the corresponding author upon reasonable request.
Acknowledgments
The support provided by TERNA MAG S.A., and particularly by G. Tsoupas and I. Moutopoulosin the Gerorema mine, is gratefully acknowledged.
Conflicts of Interest
The authors declare no conflicts of interest.
Appendix A
Table A1.
Macroscopic characteristics and field and laboratory photographs of the investigated samples obtained from the active magnesite mines and associated production operations of TERNA MAG S.A. in northern Evia, Greece. The samples represent materials encountered during the company’s mining and processing of magnesite ore and were provided for mineralogical investigation; they are not general geological samples collected independently from the wider area. Field photographs document the sampling locations/materials, whereas laboratory photographs show representative hand specimens or fragments of the corresponding samples. Each EVIA designation refers to an individual geological sample/material; where multiple fragments are shown, these belong to the same sample. The descriptions refer to the macroscopic characteristics observed during sampling and prior to mineralogical characterization.
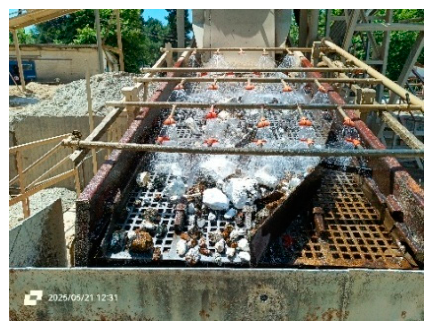
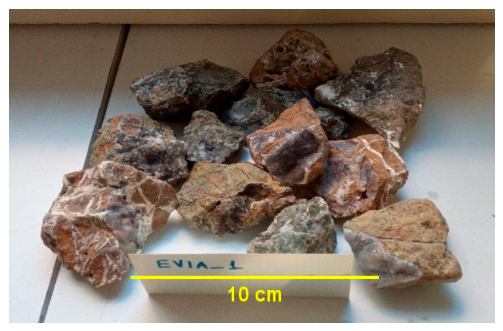
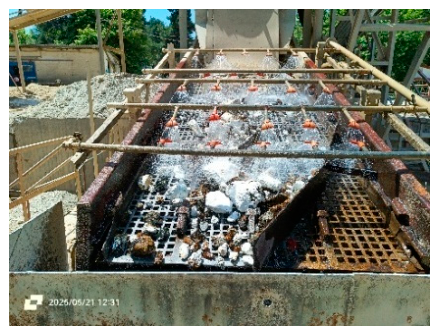
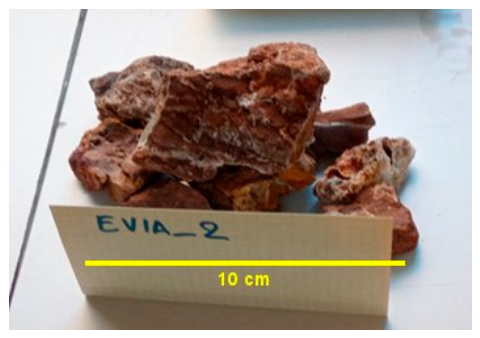
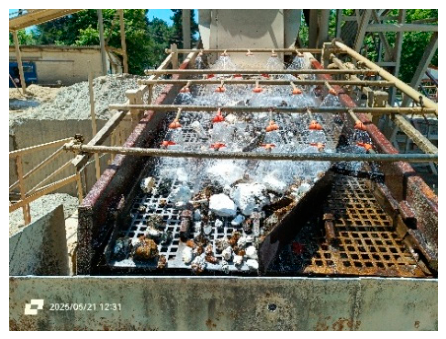
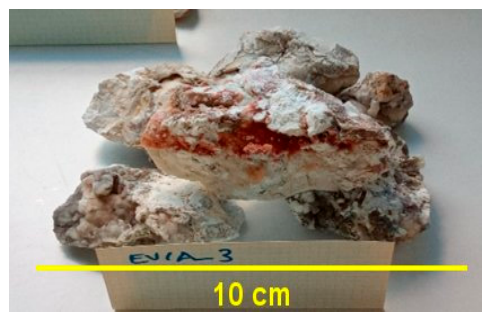
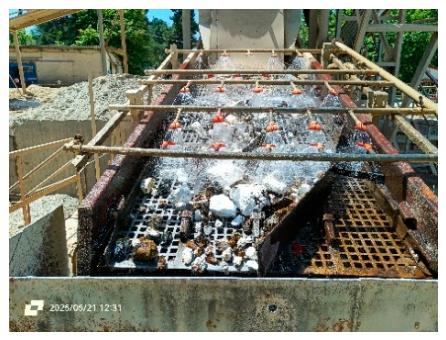
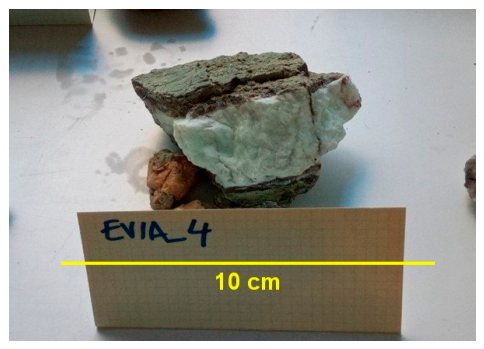
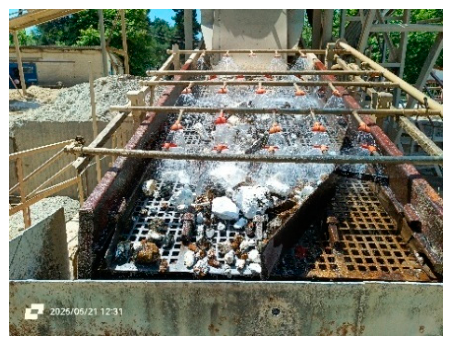
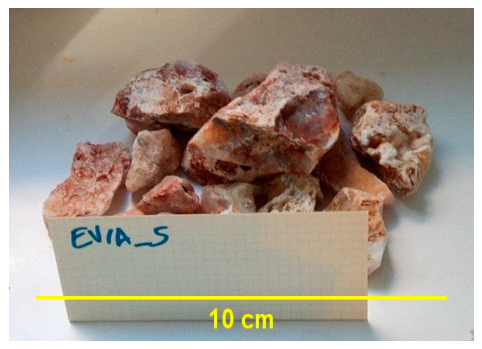
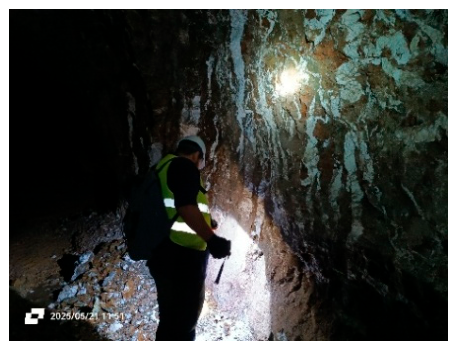
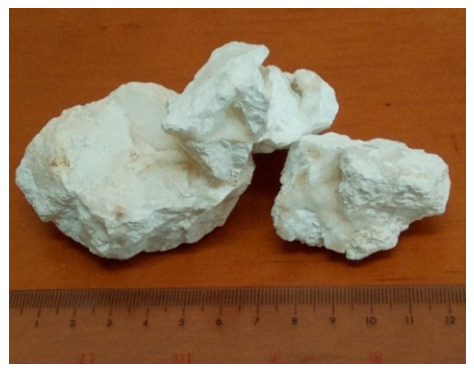
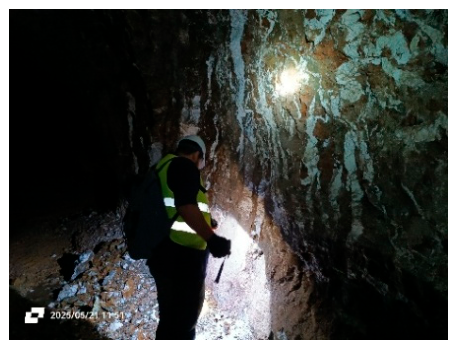
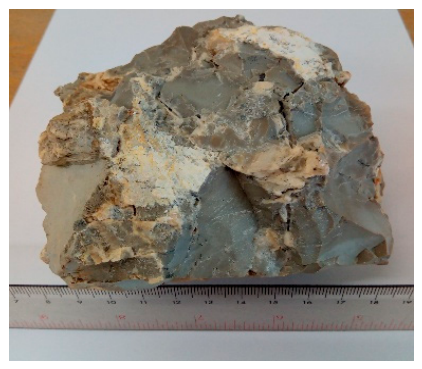
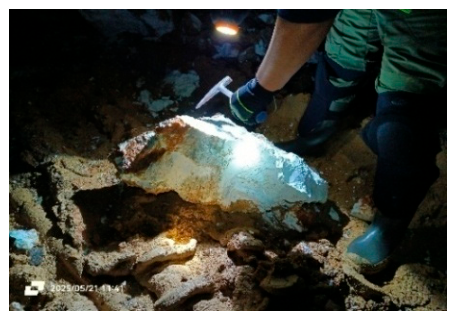
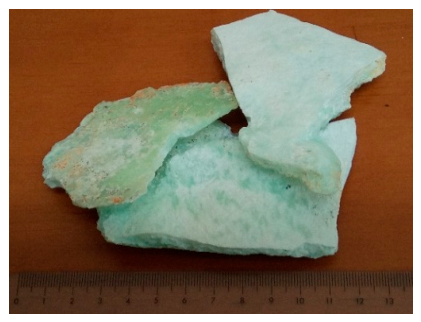
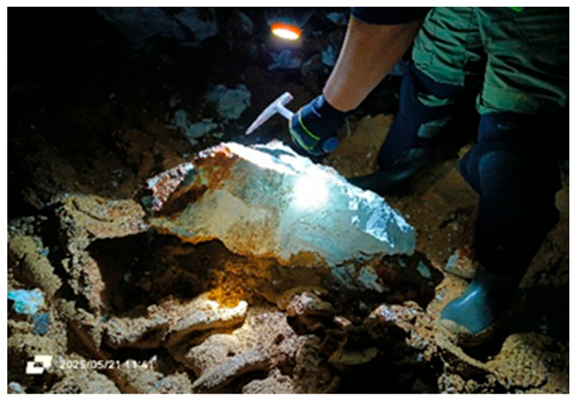
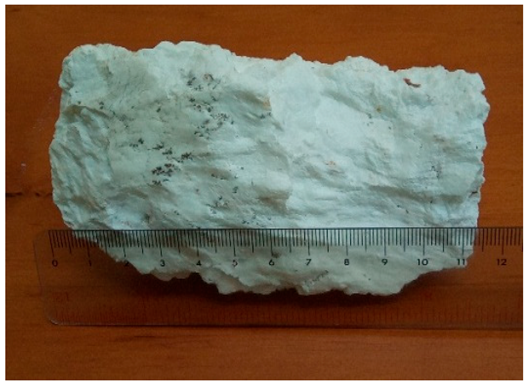
Figure A1.
Comparison of selected trace-element concentrations in EVIA-4 and EVIA-5 with published data for natural chalcedonic silica, including agate (Götze et al., 2016) [21], chalcedony (Monico et al., 2024) [22], and carnelian (Volkert et al., 2023; Yan et al., 2026) [23,24]. Only elements occurring at or above the analytical detection limit in at least one of the EVIA samples are included. Literature data are presented as concentration ranges with central values, whereas EVIA-4 and EVIA-5 represent individual analyses from the present study. Concentrations are plotted on a logarithmic scale. Open downward triangles indicate values below the respective analytical detection limits. The comparison illustrates the broad compositional variability of natural chalcedonic silica; differences in analytical methods and detection limits among the cited studies should be considered when comparing absolute concentrations.
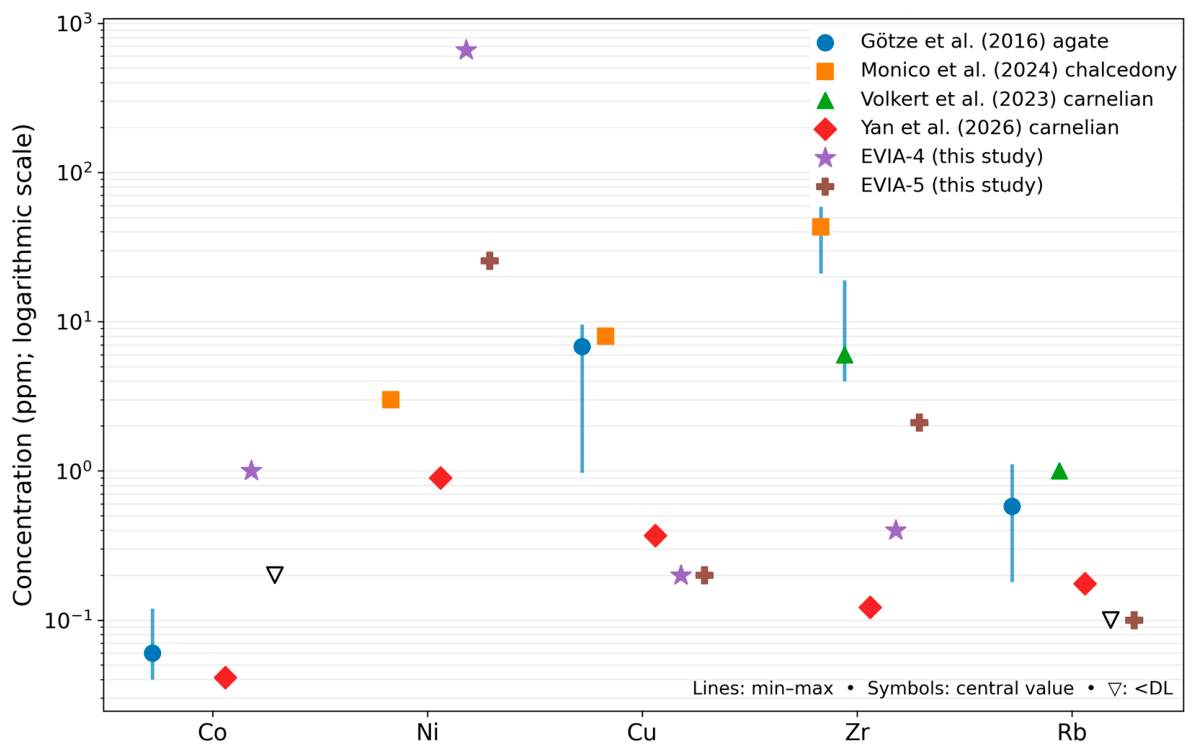
Figure A2.
Representative μ-XRF Ni map of EVIA-4, showing the heterogeneous spatial distribution of Ni. The colour scale represents relative Ni XRF intensity and not Ni concentration in ppm.
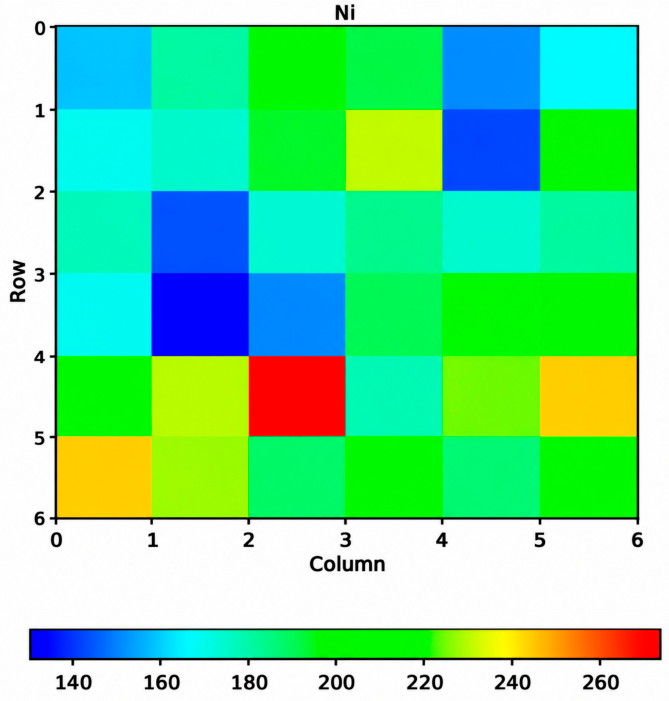
Figure A3.
Representative μ-XRF Fe map of EVIA-5, showing the heterogeneous spatial distribution of Fe. The colour scale represents relative Fe XRF intensity and not Fe concentration in ppm.
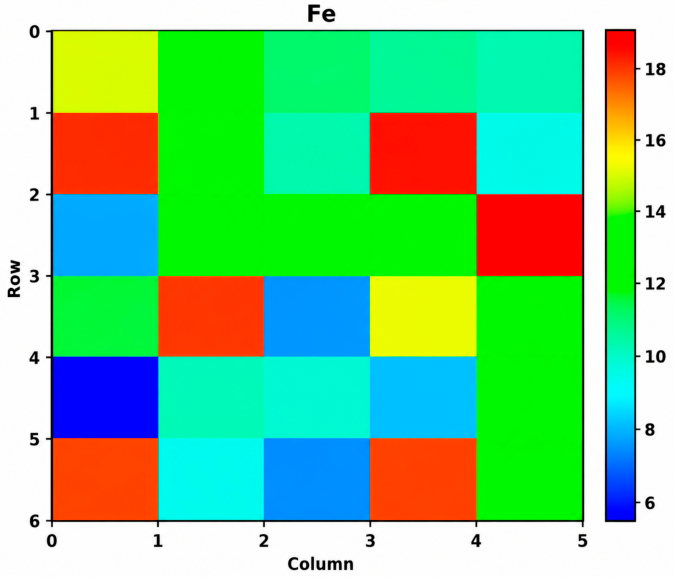
Figure A4.
HAADF-STEM image and corresponding STEM-EDS elemental maps showing the distribution of Si, O and Ti in the investigated silica (“opal”) sample EVIA-5 from northern Evia, Greece.
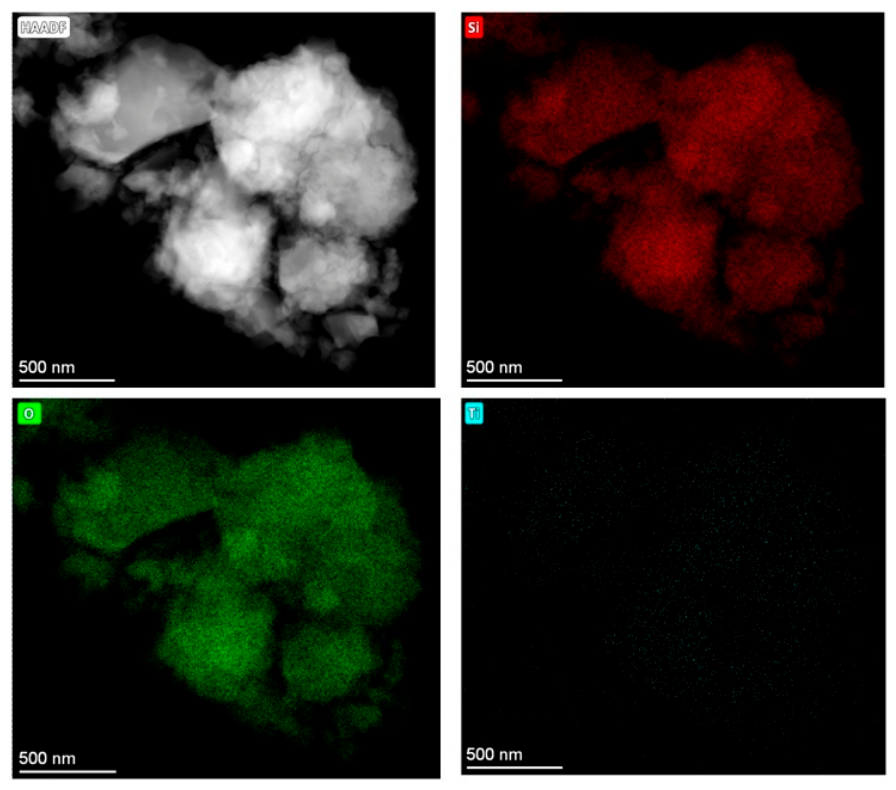
Figure A5.
Representative selected-area electron diffraction (SAED) patterns obtained from crystalline silica domains in sample EVIA-5. (a,b) Original SAED patterns (patterns 0038 and 0039, respectively) acquired at camera lengths of 330 and 524 mm. Both patterns exhibit sharp and regularly arranged diffraction reflections, confirming the crystalline character of the silica material. (c,d) Corresponding re-analysis of the original calibrated EMD datasets with fitted principal reciprocal vectors (g1 and g2)). The two independently acquired patterns reveal highly reproducible reciprocal-lattice geometries, with equivalent principal reciprocal-vector relationships. The weak additional off-lattice features indicated in (c,d) are reproducibly observed but are not assigned uniquely because of the complexity of electron diffraction from quartz–moganite intergrowths. The detailed analysis of reciprocal-lattice geometry, reflection conditions and phase interpretation is discussed in the text.
References
- Stamatakis, M.G.; Kanaris-Sotiriou, R.; Spears, D.A. Authigenic silica polymorphs and the geochemistry of Pliocene siliceous swamp sediments of the Aridea volcanic province, Greece. Can. Mineral. 1991, 29, 587–598. [Google Scholar]
- Godelitsas, A.; Gamaletsos, P.; Roussos-Kotsi, M. Mordenite-bearing tuffs from Prassa quarry, Kimolos Island, Greece. Eur. J. Mineral. 2010, 22, 797–811. [Google Scholar] [CrossRef] [Scilit]
- Voudouris, P.; Mavrogonatos, C.; Graham, I.; Giuliani, G.; Tarantola, A.; Melfos, V.; Karampelas, S.; Katerinopoulos, A.; Magganas, A. Gemstones of Greece: Geology and crystallizing environments. Minerals 2019, 9, 461. [Google Scholar] [CrossRef] [Scilit]
- Lampropoulou, P.; Xanthopoulou, V.; Wojtaszek-Kalaitzidi, M.; Petrounias, P.; Zoumpouli, E.; Iliopoulos, G.; Kalaitzidis, S. Characterization of siliceous nodules in western Kefalonia Island, Greece: An initial approach to their formation and diagenetic characteristics. Minerals 2022, 12, 101. [Google Scholar] [CrossRef] [Scilit]
- Skliros, V.; Fitros, M.; Mavrogonatos, C.; Laskaridis, K.; Perraki, M. Moganite occurrence in quartz varieties (chalcedony and carnelian) from Evros Region, NE Greece. In Proceedings of the 16th International GeoRaman Conference (GeoRaman 2024), Island of Rhodes, Greece, 24–27 September 2024. [Google Scholar]
- Dabitzias, G.S. Petrology and genesis of the Vavdos cryptocrystalline magnesite deposits, Chalkidiki Peninsula, Northern Greece. Econ. Geol. 1980, 75, 1138–1151. [Google Scholar] [CrossRef] [Scilit]
- Dabitzias, G.S. Geology and Environment of Ore Deposition in the Vavdos and Troupi Magnesite Districts, Greece. Ph.D. Thesis, University of Leicester, Leicester, UK, 1982. [Google Scholar]
- Gartzos, E. On the Genesis of Cryptocrystalline Magnesite Deposits in the Ultramafic Rocks of Northern Evia, Greece. Ph.D. Thesis, ETH Zürich, Zürich, Switzerland, 1986. [Google Scholar]
- Gartzos, E. Carbon and oxygen isotope constraints on the origin of magnesite deposits, N. Evia (Greece). Schweiz. Mineral. Petrogr. Mitt. 1990, 70, 67–72. [Google Scholar]
- Grieco, G.; Cavatto, A.; Marescotti, P.; Crispini, L.; Tzamos, E.; Bussolesi, M. The formation of magnesite ores by reactivation of dunite channels as key to their spatial association to chromite ores: An example from northern Evia, Greece. Minerals 2023, 13, 159. [Google Scholar] [CrossRef] [Scilit]
- Serelis, K.; Gartzos, E.; Tsaousidou, P. Study of the wall rock alteration occurring in ultramafic rocks hosting magnesite deposits, Evia, Greece. Bull. Geol. Soc. Greece 2004, 36, 377–386. [Google Scholar] [CrossRef] [Scilit]
- Kaza, S.; Stamatakis, M. Determination of silica polymorphs and feldspars in industrial samples of bentonite and perlite. Bull. Geol. Soc. Greece 2016, 50, 1878–1886. [Google Scholar] [CrossRef] [Scilit][Green Version]
- Solé, V.A.; Papillon, E.; Cotte, M.; Walter, P.; Susini, J. A multiplatform code for the analysis of energy-dispersive X-ray fluorescence spectra. Spectrochim. Acta B 2007, 62, 63–68. [Google Scholar] [CrossRef] [Scilit]
- Brindley, G.W.; Maksimović, Z. The nature and nomenclature of hydrous nickel-containing silicates. Clay Miner. 1974, 10, 271–277. [Google Scholar] [CrossRef] [Scilit]
- Tauler, E.; Proenza, J.A.; Galí, S.; Lewis, J.F.; Labrador, M.; García-Romero, E.; Suárez, M.; Longo, F.; Bloise, G. Ni-sepiolite-falcondoite in garnierite mineralization from the Falcondo Ni-laterite deposit, Dominican Republic. Clay Miner. 2009, 44, 435–454. [Google Scholar] [CrossRef] [Scilit]
- Jiang, Y.; Guo, Y. Genesis and influencing factors of the colour of chrysoprase. Sci. Rep. 2021, 11, 9939. [Google Scholar] [CrossRef] [Scilit] [PubMed]
- Jiang, Y.; Guo, Q.; Wang, Y.; Cheung, V.; Westland, S.; Han, J.; Zong, X.; Guo, Y.; Wang, D. Colouration mechanism of chrysoprase: Insights from colourimetry, spectroscopy and mineralogy. RSC Adv. 2025, 15, 34926–34938. [Google Scholar] [CrossRef] [Scilit] [PubMed]
- Heaney, P.J.; Post, J.E. The widespread distribution of a novel silica polymorph in microcrystalline quartz varieties. Science 1992, 255, 441–443. [Google Scholar] [CrossRef] [Scilit] [PubMed]
- Miehe, G.; Graetsch, H. Crystal structure of moganite: A new structure type for silica. Eur. J. Mineral. 1992, 4, 693–706. [Google Scholar] [CrossRef] [Scilit]
- Götze, J.; Plötze, M.; Graupner, T.; Hallbauer, D.K.; Bray, C.J. Trace element incorporation into quartz: A combined study by ICP-MS, electron spin resonance, cathodoluminescence, capillary ion analysis, and gas chromatography. Geochim. Cosmochim. Acta 2004, 68, 3741–3759. [Google Scholar] [CrossRef] [Scilit]
- Götze, J.; Möckel, R.; Vennemann, T.; Müller, A. Origin and geochemistry of agates in Permian volcanic rocks of the Sub-Erzgebirge basin, Saxony (Germany). Chem. Geol. 2016, 428, 77–91. [Google Scholar] [CrossRef] [Scilit]
- Monico, S.; Cantaluppi, M.; Diella, V.; Gatta, G.D.; Adamo, I.; Fumagalli, P.; Marinon, N. Similarities and differences among selected gemmological varieties of chalcedony: Chemistry, mineralogy and microstructure. Miner. Mag. 2024, 88, 136–146. [Google Scholar] [CrossRef] [Scilit]
- Volkert, R.A.; Gorring, M.L.; Peck, W.H.; Stanford, S.D. Characterization and origin of basalt-derived carnelian in the Mesozoic Newark Basin, New Jersey, USA. Minerals 2023, 13, 1249. [Google Scholar] [CrossRef] [Scilit]
- Yan, M.; Liu, J.; Qin, C.; He, X.; Li, X.; Yu, J.; Mao, R.; Han, H.; Sun, Z.; Wang, C.; et al. Sourcing the origins of carnelian in early Chinese civilizations. Proc. Natl. Acad. Sci. USA 2026, 123, e2524563123. [Google Scholar] [CrossRef] [Scilit] [PubMed]
- Götze, J.; Nasdala, L.; Kleeberg, R.; Wenzel, M. Occurrence and distribution of “moganite” in agate/chalcedony: A combined micro-Raman, Rietveld, and cathodoluminescence study. Contrib. Mineral. Petrol. 1998, 133, 96–105. [Google Scholar] [CrossRef] [Scilit]
- Parthasarathy, G.; Gopalakrishnarao, R.; Kunwar, A.C.; Srinivasan, R. Occurrence of moganite-rich chalcedony in Deccan flood basalts, Killari, Maharashtra, India. Eur. J. Mineral. 2001, 13, 127–134. [Google Scholar] [CrossRef] [Scilit]
- Götze, J.; Möckel, R.; Pan, Y. Mineralogy, geochemistry and genesis of agate—A review. Minerals 2020, 10, 1037. [Google Scholar] [CrossRef] [Scilit]
- Powolny, T.; Dumańska-Słowik, M.; Szczerbowska-Boruchowska, M.; Woszczyna, M. Water and moganite participation in agates from Bou Hamza (Morocco). Sci. Rep. 2024, 14, 22473. [Google Scholar] [CrossRef] [Scilit] [PubMed]
- Tsukada, Y.; Schmidt, P.; Bowden, A.S. Differentiating α-moganite, silanol and α-quartz by Raman spectroscopy. Phys. Chem. Chem. Phys. 2024, 26, 8195–8199. [Google Scholar] [CrossRef] [Scilit] [PubMed]
- Campomenosi, N.; Murri, M.; Prencipe, M.; Mihailova, B. Atomic dynamics and structural transformations in chalcedony as a model cryptocrystalline multiphase system at non-ambient conditions. J. Raman Spectrosc. 2025, 56, 420–434. [Google Scholar] [CrossRef] [Scilit]
- Powolny, T.; Dumańska-Słowik, M.; Asadi, A.; Hosseinzadeh, M.R.; Krzątała, A. Resolving colouration mechanisms in gem-quality chalcedony: Mineralogical and spectroscopic constraints. Mineral. Petrol. 2026, 120, 1–22. [Google Scholar] [CrossRef] [Scilit]
- Caggiani, M.C.; Cavarra, M.; Barone, G.; Coccato, A.; Manenti, A.M.; Mazzoleni, P. Corroborating the autoptic identification of archeological glyptics in museum collections: The contribution of portable Raman spectroscopy. J. Raman Spectrosc. 2023, 55, 200–215. [Google Scholar] [CrossRef] [Scilit]
- Smith, J.V.; Blackwell, C.S. Nuclear magnetic resonance of silica polymorphs. Nature 1983, 303, 223–225. [Google Scholar] [CrossRef] [Scilit]
- Graetsch, H.; Topalović, I.; Gies, H. NMR spectra of moganite and chalcedony. Eur. J. Mineral. 1994, 6, 459–469. [Google Scholar] [CrossRef] [Scilit]
- Oestrike, R.; Yang, W.-H.; Kirkpatrick, R.J.; Hervig, R.L.; Navrotsky, A.; Montez, B. High-resolution ^23Na, ^27Al and ^29Si NMR spectroscopy of framework aluminosilicate glasses. Geochim. Cosmochim. Acta 1987, 51, 2199–2209. [Google Scholar]
- Brouwer, D.H. NMR of inorganic nuclei. In Comprehensive Inorganic Chemistry III, 3rd ed.; Elsevier: Amsterdam, The Netherlands, 2023; Volume 9. [Google Scholar]
- Heaney, P.J.; Post, J.E. Evidence for an I2/a to Imab phase transition in the silica polymorph moganite at ~570 K. Am. Mineral. 2001, 86, 1358–1366. [Google Scholar] [CrossRef] [Scilit]
- Lee, S.; Xu, H.; Xu, H.; Neuefeind, J. Crystal structure of moganite and its anisotropic atomic displacement parameters determined by synchrotron X-ray diffraction and X-ray/neutron pair distribution function analyses. Minerals 2021, 11, 272. [Google Scholar] [CrossRef] [Scilit]
- Kovács Kis, V.; Dódony, I. Mineralogical and microstructural features of chalcedony from Mátra Mts, Northern Hungary—A TEM study. Acta Mineral.-Petrogr. 2004, 45, 101–106. [Google Scholar]
- Natalio, F.; Corrales, T.P.; Pierantoni, M.; Rosenhek-Goldian, I.; Cernescu, A.; Raguin, E.; Maria, R.; Cohen, S.R. Characterization of Eocene flint. Chem. Geol. 2021, 582, 120427. [Google Scholar] [CrossRef] [Scilit]

Disclaimer/Publisher’s Note: The statements, opinions and data contained in all publications are solely those of the individual author(s) and contributor(s) and not of MDPI and/or the editor(s). MDPI and/or the editor(s) disclaim responsibility for any injury to people or property resulting from any ideas, methods, instructions or products referred to in the content. |
© 2026 by the authors. Licensee MDPI, Basel, Switzerland. This article is an open access article distributed under the terms and conditions of the Creative Commons Attribution (CC BY) license.