


Abstract
Microgrid scheduling is a challenging optimization problem because renewable energy generation, energy storage behavior, load demand, and grid interaction must be coordinated under nonlinear and constrained operating conditions. To improve the search performance of the original Butterfly Optimization Algorithm (BOA), this paper proposes an Improved Butterfly Optimization Algorithm (IBOA) for global optimization and microgrid scheduling. Three strategies are embedded into the BOA framework. First, the Dance Synchronization Guidance Strategy uses both the current global best solution and the dominant-group center to reduce excessive dependence on a single leader and improve population cooperation. Second, the Dance Emotion Disturbance Strategy introduces an adaptive perturbation term into the local search process, which helps the algorithm escape stagnant regions. Third, the Exponential Fragrance Decay Strategy dynamically adjusts the sensory modality parameter, allowing the search process to gradually shift from global exploration to local refinement. The performance of IBOA is evaluated through the IEEE CEC2017 and CEC2022 benchmark suites under different dimensions. The Friedman ranking results show that IBOA achieves the best mean ranks on CEC2017 with values of 1.13, 1.23, and 1.87 for 30-, 50-, and 100-dimensional cases, respectively. On CEC2022, IBOA also ranks first, with mean ranks of 1.50 and 1.00 for 10- and 20-dimensional cases. In the microgrid scheduling case, IBOA obtains the lowest average operating cost of 1443.56 with a standard deviation of 69.61 over 30 independent runs. Compared with CCO, CBSO, and GWCA, the average cost is reduced by approximately 13.58%, 14.98%, and 15.39%, respectively. Moreover, compared with the original BOA, the average cost is reduced from 28,338.69 to 1443.56. These results indicate that IBOA provides a more stable and cost-effective optimization approach for both benchmark optimization and microgrid scheduling problems.
1. Introduction
In recent years, driven by the rapid advancement of distributed energy resources, energy storage systems, and renewable energy technologies, microgrids have gradually emerged as a vital component of modern power systems. Microgrids integrate diverse energy units—such as wind turbines, photovoltaic arrays, energy storage devices, and controllable loads—and are capable of operating in either grid-connected or islanded modes, depending on specific operational scenarios. Consequently, they play a pivotal role in enhancing energy utilization efficiency, bolstering power supply reliability, and facilitating the integration of new energy sources [1,2]. Particularly against the backdrop of “Dual Carbon” goals and the broader energy transition, the challenge of microgrid dispatch has garnered widespread attention from an increasing number of researchers. Effective microgrid dispatch strategies not only serve to reduce system operating costs but also effectively curtail pollutant emissions, thereby enhancing both the operational stability and economic efficiency of the system.
However, the microgrid scheduling problem typically involves a complex interplay of factors—including various distributed energy units, energy storage devices, electricity pricing mechanisms, and load demands—that make it, in essence, a complex optimization problem characterized by multiple constraints, multiple objectives, nonlinearity, and high dimensionality. In practical operation, renewable energy sources such as wind and solar power exhibit significant stochasticity and volatility, while load demands undergo dynamic changes over time; these factors further exacerbate the complexity of the microgrid scheduling problem [3,4,5]. Consequently, determining how to minimize operating costs and emissions—while simultaneously maximizing energy utilization efficiency—under the constraints of system power balance, equipment operational limits, and user demands has emerged as a focal point in microgrid research.
Currently, researchers have proposed a variety of solution methods to address microgrid scheduling problems. Traditional approaches primarily encompass mathematical programming techniques such as linear programming [6], nonlinear programming [7], dynamic programming [8], mixed-integer programming [9], and robust optimization [10]. These methods possess a solid theoretical foundation and demonstrate high solution accuracy when applied to problems of smaller scale and simpler model structures. For instance, linear programming and mixed-integer linear programming are frequently employed to formulate economic dispatch models; dynamic programming is well-suited for handling energy storage scheduling problems characterized by time-series dynamics, while robust optimization and stochastic optimization are capable of addressing the inherent uncertainties associated with renewable energy outputs.
Although traditional optimization methods can address microgrid scheduling problems to a certain extent, their limitations become increasingly apparent as system scale and complexity grow. On the one hand, microgrid scheduling problems often exhibit high degrees of nonlinearity and discreteness; consequently, traditional methods are prone to falling victim to the “curse of dimensionality,” leading to a rapid escalation in computational complexity. On the other hand, when the objective function possesses multiple local optima, traditional methods struggle to identify the global optimum. Furthermore, when handling multi-objective optimization problems and complex constraints, traditional methods typically demand advanced mathematical modeling expertise, and their solution efficiency tends to decline significantly.
To address the aforementioned issues, an increasing number of studies have begun to employ heuristic and meta-heuristic algorithms to solve microgrid scheduling problems [11,12]. Compared with traditional methods, heuristic algorithms do not rely on the differentiability or convexity of the objective function; they possess strong global search capabilities and superior robustness, enabling them to yield high-quality solutions within a relatively short timeframe. For instance, to address the problem of microgrid scheduling, Liu et al. established a microgrid scheduling model—taking into account factors related to distributed energy resources as well as comprehensive costs—and defined the minimization of comprehensive costs as the optimization objective [13]. Furthermore, building upon the standard Whale Optimization Algorithm, they proposed an improved version incorporating an adaptive weighting mechanism and Lévy flight trajectories. Simulation results demonstrate that this improved algorithm offers distinct advantages in terms of both comprehensive costs and operational efficiency, thereby effectively validating its superiority in the context of microgrid operational planning problems. To address the 24-h optimal scheduling problem for grid-connected microgrids, Fu et al. enhanced the Secretary Bird Optimization Algorithm by incorporating an adaptive cooperative search mechanism, a local exploitation mechanism based on quadratic interpolation, and a soft-boundary backtracking mechanism [14]. Simulation results demonstrate that the proposed algorithm is capable of significantly reducing operating costs while simultaneously satisfying all system operational constraints, thereby validating its effectiveness and practicality in real-world engineering optimization problems. To address the optimal sizing and design of autonomous microgrids, İpek et al. developed an approach that utilizes a hybrid algorithm, in which the Harris Hawks Optimization (HHO) and the Arithmetic Optimization Algorithm (AOA) operate cooperatively in a unique manner [15]. Simulation results, obtained from testing this hybrid algorithm on a microgrid comprising a photovoltaic system, wind turbines, a battery energy storage system, a diesel generator, and a commercial load, demonstrate that the method not only achieved the lowest Loss of Power Supply Probability (LPSP) and Cost of Energy (COE) but also attained the highest Renewable Fraction (RF).
Furthermore, to address complex, high-dimensional optimization problems, numerous researchers have recently proposed a wide array of heuristic algorithms for their solutions. For instance, in the field of mobile edge computing, Yu et al. introduced the Bounty Hunter Optimizer [16]; to tackle 2D/3D UAV path planning and engineering design problems, Fu et al. proposed the Red-billed Blue Magpie Optimizer [17]; and to resolve global optimization problems, Liu et al. presented the Secretary Bird Optimization Algorithm [18]. Inspired by the food-seeking and mating behaviors of butterflies, the Butterfly Optimization Algorithm [19] simulates the foraging strategies of butterflies—specifically, their use of olfaction to locate nectar or mates—to address global optimization problems. It has yielded promising results across 30 benchmark test functions as well as three classic engineering problems. According to the No Free Lunch Theorem, no optimization algorithm can achieve the best performance on all types of problems simultaneously. An algorithm that performs well on a specific class of problems may not necessarily maintain the same superiority when facing different search spaces, constraints, or objective characteristics. Therefore, although the Butterfly Optimization Algorithm has shown promising performance in benchmark functions and engineering applications, it may still suffer from premature convergence, insufficient population diversity, and weak local exploitation ability when solving more complex large-scale global optimization and microgrid scheduling problems. Consequently, it is necessary to design targeted improvement strategies according to the characteristics of the problem to further enhance the balance between exploration and exploitation, strengthen the algorithm’s ability to escape local optima, and improve its adaptability and optimization accuracy for different application scenarios.
In accordance with the “No Free Lunch” theorem, no single optimization algorithm can simultaneously achieve optimal performance across all types of problems. While an algorithm may perform well on a specific class of problems, its advantages may not necessarily persist when confronted with different search spaces, constraints, or characteristics of objective functions. Consequently, although the Butterfly Optimization Algorithm (BOA) has demonstrated robust performance in benchmark tests and engineering applications, it may still suffer from issues—such as premature convergence, insufficient population diversity, and weak exploitation capabilities regarding local optima—when applied to more complex, large-scale global optimization and microgrid scheduling problems. Based on this premise, this paper proposes several strategies to enhance the BOA, thereby enabling it to more effectively address microgrid scheduling problems; the specific contributions are outlined below.
- An Improved Butterfly Optimization Algorithm (IBOA) is proposed by redesigning the search framework of the original BOA. The proposed algorithm aims to reduce the excessive dependence on the current best individual and improve the search behavior of BOA when dealing with nonlinear, multimodal, and high-dimensional optimization problems.
- A Dance Synchronization Guidance Strategy is developed to modify the global search process of BOA. Instead of using only the global best solution as the guidance source, this strategy introduces the average position of dominant individuals to construct a cooperative guidance mechanism. In this way, the population can obtain more stable search direction while reducing the risk of premature convergence caused by single-leader guidance.
- A Dance Emotion Disturbance Strategy is introduced into the local search phase. By adding an adaptive disturbance term to the original local movement equation, the search agents can generate additional position variations when the search process becomes stagnant. This mechanism helps BOA retain population diversity and improves its ability to move away from poor local regions.
- An Exponential Fragrance Decay Strategy is designed to adjust the sensory modality parameter during the iteration process. A relatively larger fragrance intensity is maintained in the early stage to support wider exploration, while a smaller value is used in the later stage to encourage local refinement. This staged parameter adjustment provides a smoother transition between exploration and exploitation.
The proposed IBOA is evaluated using the IEEE CEC2017 and IEEE CEC2022 benchmark suites, together with a microgrid scheduling case study. These experiments are designed to examine its search accuracy, stability, and practical applicability from both numerical optimization and engineering scheduling perspectives. The results show that IBOA achieves competitive performance compared with several representative metaheuristic algorithms and maintains reliable optimization behavior under different problem dimensions and scheduling conditions.
The remainder of this paper is organized as follows. Section 2 introduces the basic principle of the original BOA. Section 3 presents the proposed IBOA and explains the three improvement strategies. Section 4 reports the benchmark experiments on the CEC2017 and CEC2022 test suites and analyzes the performance of IBOA against other algorithms. Section 5 applies IBOA to the microgrid scheduling problem to evaluate its engineering applicability. Section 6 concludes the paper and discusses possible directions for future work.
2. Butterfly Optimization Algorithm (BOA)
As one of the representative swarm intelligence algorithms, BOA has attracted considerable attention due to its simple structure, few control parameters, and strong optimization capability. BOA simulates the food-foraging behavior of butterflies and achieves optimization through the interaction between fragrance-based attraction and random movement. Since the algorithm proposed in this paper is an improvement on BOA, we will briefly introduce it in this chapter, as shown below.
2.1. Butterfly
Butterflies possess highly sensitive sensory systems, including smell, vision, taste, touch, and hearing. Among these senses, smell plays the most important role in locating food sources and mating partners. Butterflies can detect fragrance over long distances through chemoreceptors distributed on body parts such as antennae and legs. This excellent sensing ability enables them to identify nectar-rich flowers and suitable mates efficiently. In BOA, butterflies are regarded as search agents in the solution space. Each butterfly represents a candidate solution, and its fitness value determines the intensity of the fragrance it emits. Better solutions generate stronger fragrance, attracting other butterflies toward promising regions of the search space.
When a butterfly senses a stronger fragrance from another butterfly, it moves toward that individual, which corresponds to the global search stage. Otherwise, it performs a random movement around neighboring butterflies, corresponding to the local search stage. Through this mechanism, BOA achieves a balance between exploration and exploitation.
2.2. Fragrance
Fragrance is the core concept that distinguishes BOA from many other metaheuristic algorithms. In BOA, the fragrance intensity emitted by each butterfly is closely related to its fitness value. A better butterfly emits a stronger fragrance and has a greater influence on the movement of other individuals. The fragrance model in BOA is defined as follows:
where denotes the perceived fragrance intensity, is the sensory modality, represents the stimulus intensity associated with the fitness value, and is the power exponent controlling the fragrance absorption degree. Usually, both and are set within the interval . A larger value of means weaker fragrance attenuation and stronger global search ability, while a smaller value of increases local exploitation capability. Therefore, these parameters play an important role in determining the convergence speed and search behavior of BOA.
2.3. Movement of Butterflies
The movement mechanism of BOA is mainly divided into global search and local search. In the global search phase, butterflies move toward the current best individual in the population, which can be expressed as:
where is the position of the -th butterfly at iteration , denotes the current global best solution, is a random number in , and is the fragrance of the -th butterfly. This strategy enables butterflies to converge rapidly toward promising regions.
In the local search phase, butterflies update their positions according to neighboring individuals:
where and are two randomly selected butterflies. This local random walk helps the population maintain diversity and avoid premature convergence.
To coordinate these two search behaviors, BOA introduces a switch probability . When a random number is smaller than , global search is performed; otherwise, local search is executed. By combining these two search strategies, BOA can effectively balance exploration and exploitation during the optimization process. The pseudocode for the BOA execution process is shown in Algorithm 1.
| Algorithm 1: Butterfly Optimization Algorithm |
| 1: Define the objective function |
| 2: Initialize population and stimulus Intensity |
| 3: Define sensor modality , power exponent and switch probability |
| 4: while stopping criteria not met do |
| 5: for each butterfly in population do |
| 6: Calculate fragrance for using Equation (1) |
| 7: end for |
| 8: Find the best |
| 9: for each butterfly in population do |
| 10: Generate a random number from [0, 1] |
| 11: if then |
| 12: Move towards best butterfly/solution using Equation (2) |
| 13: else |
| 14: Move randomly using Equation (3) |
| 15: end if |
| 16: end for |
| 17: Update the value of |
| 18: end while |
| 19: Output the best solution |
3. Proposed IBOA
To further improve the exploration and exploitation capabilities of the original BOA, an Improved Butterfly Optimization Algorithm (IBOA) is proposed in this paper. Although BOA has shown good optimization performance, it still suffers from some limitations, such as insufficient population diversity in the later stage, premature convergence, and a tendency to fall into local optima when solving complex multimodal problems. Therefore, three enhancement strategies are introduced into BOA. Among them, two strategies are inspired by dance therapy behaviors, while the third strategy is designed to improve population diversity.
It should be noted that the concepts of dance therapy, emotion release, and group synchronization are used in this work primarily as behavioral inspirations rather than strict mathematical representations of human psychological processes. The proposed mathematical formulations are not intended to accurately model real-world dance therapy dynamics. Instead, these concepts serve as intuitive design motivations for developing search mechanisms that enhance information sharing, population cooperation, and search diversity within the optimization process. Therefore, the relationship between the behavioral concepts and the mathematical operators should be understood as an inspiration-driven abstraction rather than a direct physical or psychological mapping.
3.1. Dance Synchronization Guidance Strategy
Dance therapy emphasizes rhythm synchronization and coordinated interaction among participants. During group dance activities, individuals gradually adjust their movements according to the rhythm and the behavior of surrounding participants, which helps improve group consistency and emotional stability.
Inspired by this phenomenon, a Dance Synchronization Guidance Strategy is introduced into BOA. In the original BOA, butterflies move directly toward the current best individual during the global search phase. However, this movement pattern may cause the population to converge too quickly, resulting in a loss of diversity.
To address this issue, the movement of butterflies is guided not only by the global best individual but also by the average position of the dominant individuals in the population. Specifically, the top-performing individuals are selected to form a “dance group center,” and each butterfly updates its position according to both the global best position and the dance group center. The updated position can be expressed as:
where is the current global best solution, represents the average position of several dominant butterflies, and and are random coefficients. This strategy can effectively slow down premature convergence and enhance the cooperative search capability of the population.
Specifically, the butterflies are first ranked according to their fitness values. The top 20% of the population are selected as dominant individuals, and their average position is calculated to form the dance center. The dance center is defined as . where denotes the number of dominant individuals and represents the position of the -th dominant butterfly. In this study, , where is the population size.
Although the synchronization guidance mechanism shares certain similarities with centroid-based and leader-guided search strategies employed in some swarm intelligence algorithms, it differs in that both the current global best individual and the dynamically updated dominant-group center are simultaneously incorporated into the search process. This design aims to provide more stable directional information while reducing excessive dependence on a single leader solution.
The notion of group synchronization is abstracted into a cooperative search mechanism where individuals adjust their search directions according to both elite information and population-level guidance. This abstraction aims to improve collective search behavior rather than reproduce actual synchronization dynamics observed in dance activities.
It should be noted that the proposed enhancement strategies are not intended to introduce entirely new mathematical operators. Some of their underlying ideas are related to commonly used mechanisms in the metaheuristic optimization literature, such as elite guidance, population information utilization, adaptive perturbation, and dynamic parameter adjustment. However, the novelty of this work lies in the problem-oriented redesign and integration of these mechanisms within the BOA framework. Specifically, the proposed strategies are developed according to the search characteristics and limitations of BOA, and they interact cooperatively through different search stages to improve population diversity, search guidance, and exploration–exploitation balance. Therefore, the contribution of this work stems from the construction of a coordinated optimization framework rather than from any individual operator alone.
Although the Dance Synchronization Guidance Strategy shares certain similarities with elite-guided and centroid-based search mechanisms, its objective is different from conventional leader-following approaches. Traditional elite-guided methods usually rely on a single best individual or several elite solutions to guide the search process. In contrast, the proposed strategy simultaneously utilizes the current global best solution and the dynamically updated dominant-group center. The dominant-group center represents the collective search tendency of multiple high-quality individuals rather than a single leader. This design provides more stable directional information, reduces excessive dependence on a single elite solution, and helps maintain population diversity during the optimization process.
Similarly, the Dance Emotion Disturbance Strategy belongs to the category of perturbation-based search mechanisms. However, unlike conventional random mutation or Gaussian perturbation operators that are applied independently, the proposed disturbance mechanism is embedded within the local search phase of BOA and operates cooperatively with the fragrance-based movement mechanism. The adaptive disturbance term is introduced to enhance escape capability from local optima while preserving the exploitation behavior of BOA. Therefore, the proposed strategy is not intended to introduce a completely new perturbation operator but rather to improve the effectiveness of local search within the BOA framework.
The Exponential Fragrance Decay Strategy is related to adaptive parameter control techniques commonly used in metaheuristic algorithms. Nevertheless, instead of employing a fixed sensory modality parameter as in the original BOA, the proposed strategy introduces an exponential decay mechanism to dynamically regulate search intensity throughout the optimization process. This allows the algorithm to gradually transition from exploration-oriented search to exploitation-oriented refinement. Consequently, the novelty of the proposed IBOA lies in the problem-oriented integration and cooperative interaction of these mechanisms within the BOA framework rather than in any individual operator alone.
3.2. Dance Emotion Disturbance Strategy
Dance therapy also emphasizes emotional release and movement variation. During the dance process, individuals may produce spontaneous changes in rhythm, amplitude, and direction, which can help break fixed behavioral patterns and stimulate creativity.
Inspired by this characteristic, a Dance Emotion Disturbance Strategy is proposed for the local search phase of BOA. In the original BOA, butterflies perform local random walks around neighboring individuals. However, such random walks may become weak in the later stage and cannot effectively help the algorithm escape local optima.
Therefore, an adaptive disturbance factor is introduced into the local search stage. When the population diversity decreases or the global best solution has not improved for several iterations, butterflies perform an additional dance-inspired disturbance movement. The updated local search formula is defined as:
where = 0.7 is the disturbance coefficient and is a random dance disturbance vector. In the early stage of optimization, the disturbance is relatively large to encourage exploration, while in the later stage, the disturbance gradually decreases to maintain exploitation ability. This strategy helps the algorithm escape local optima and improves its robustness.
Similarly, the concept of emotion release is employed as an intuitive metaphor for introducing adaptive perturbations into the search process. The objective is to increase population diversity and facilitate escape from local optima rather than to simulate real psychological responses.
3.3. Exponential Fragrance Decay Strategy
In the original BOA, the sensory modality parameter is usually fixed throughout the optimization process. However, a fixed fragrance intensity cannot effectively adapt to different search stages. A larger fragrance value is beneficial for global exploration in the early stage, while a smaller value is more suitable for local exploitation in the later stage.
Therefore, an Exponential Fragrance Decay Strategy is introduced into IBOA. At the beginning of the optimization process, butterflies emit relatively strong fragrance to enlarge the search range and improve population diversity. As the iteration proceeds, the fragrance intensity gradually decreases, enabling the algorithm to focus more on local refinement around promising regions.
The adaptive update of the sensory modality parameter is defined as:
where is the initial sensory modality value, is the decay coefficient, is the current iteration number, and is the maximum number of iterations. A larger value of causes the fragrance intensity to decay faster, while a smaller value allows the algorithm to maintain stronger exploration capability for a longer period.
In addition, the power exponent can be gradually increased during the optimization process to further strengthen local exploitation in the later stage. Therefore, the proposed strategy enables IBOA to dynamically balance exploration and exploitation more effectively than the original BOA. The pseudocode for the IBOA proposed in this paper is shown in Algorithm 2. Figure 1 illustrates the execution flow of IBOA using a flowchart.
| Algorithm 2: Improved Butterfly Optimization Algorithm (IBOA) |
| Input: Population size ; Maximum iteration ; Dimension ; Lower bound ; Upper bound |
| Output: Best solution |
| 1: Initialize butterfly population |
| 2: Evaluate fitness of all butterflies |
| 3: Determine the global best solution |
| 4: while do |
| 5: Update sensory modality parameter |
| 6: Update disturbance coefficient |
| 7: Calculate fragrance value of each butterfly |
| 8: Rank butterflies according to fitness values |
| 9: Select the top 20% butterflies as dominant individuals |
| 10: Compute the dance center |
| 11: for each butterfly do |
| 12: Generate a random number |
| 13: if then |
| 14: Generate random coefficients |
| 15: Update using the Dance Synchronization Guidance Strategy |
| 16: else |
| 17: Randomly select two butterflies |
| 18: Generate disturbance vector |
| 19: Update using the Dance Emotion Disturbance Strategy |
| 20: end if |
| 21: Apply boundary control |
| 22: Evaluate new fitness value |
| 23: if new solution is better then |
| 24: Accept the new position |
| 25: end if |
| 26: end for |
| 27: Update global best solution |
| 28: |
| 29: end while |
| 30: Return Gbest |
Figure 1.
IBOA execution flowchart.
Implementation Details: The dominant butterflies are selected according to fitness ranking, and the top 20% individuals are used to construct the dance center. The dance center is computed as the average position of all dominant butterflies. The boundary-handling strategy projects any out-of-bound solution back into the feasible search space.
3.4. Computational Complexity Analysis
The computational complexity of the proposed IBOA is analyzed in this subsection. Let denote the population size, denote the problem dimension, and denote the maximum number of iterations. In the initialization stage, generating the initial population requires time complexity. During each iteration, the fragrance calculation and fitness evaluation of all butterflies require computational cost. In the Dance Synchronization Guidance Strategy, the dominant individuals are selected and their average position is calculated to form the dance center. The computation of the dance center requires , and the position update of all individuals also requires . In the Dance Emotion Disturbance Strategy, each individual performs local search with an adaptive disturbance vector, whose computational cost is also . The Exponential Fragrance Decay Strategy only updates the sensory modality parameter and therefore introduces negligible additional cost, i.e., per iteration.
Therefore, the overall computational complexity of IBOA in each iteration is . Considering iterations, the total computational complexity of the proposed algorithm is . This is the same order as the original BOA, indicating that the proposed enhancement strategies do not significantly increase the theoretical computational burden. Although IBOA introduces additional operations such as dominant-group center calculation and adaptive disturbance generation, these operations are lightweight compared with the fitness evaluation process. Therefore, the proposed IBOA maintains computational efficiency while improving the search capability, convergence accuracy, and robustness of the original BOA.
Consequently, the improvement in optimization performance is achieved without changing the dominant complexity order of the original BOA.
4. Benchmark Function Evaluation and Performance Analysis
This section evaluates the performance of the proposed IBOA algorithm using the IEEE CEC2017 [20] and IEEE CEC2022 [21] benchmark sets. First, the characteristics of the benchmark functions are briefly introduced. Then, to ensure the reproducibility of the experiments, parameter settings and relevant references for all comparison algorithms are provided. Subsequently, the optimization capability of the IBOA algorithm is examined under 30-dimensional, 50-dimensional, and 100-dimensional conditions in the CEC2017 test set, and under 10-dimensional and 20-dimensional conditions in the CEC2022 test set. Furthermore, a Friedman mean-rank test is performed to determine whether the performance difference between the IBOA algorithm and the competing algorithms is statistically significant. To maintain consistency, all algorithms use a population size of 30 and a maximum number of iterations of 1000. To reduce the influence of randomness, each algorithm is run independently 30 times, and the mean result and standard deviation are reported for performance evaluation.
4.1. IEEE CEC2017 and IEEE CEC2022 Benchmark Sets
The IEEE CEC2017 and IEEE CEC2022 benchmark suites are widely recognized as authoritative test platforms for evaluating the performance of metaheuristic optimization algorithms. These benchmark sets were developed by the IEEE Congress on Evolutionary Computation (CEC) and have been extensively used in the optimization community to assess the effectiveness of newly proposed algorithms. Compared with traditional benchmark functions, the CEC benchmark suites provide more complex and challenging optimization landscapes, making them more suitable for verifying the practical optimization capability of modern heuristic algorithms.
Specifically, the CEC2017 benchmark suite consists of 30 test functions, including unimodal, multimodal, hybrid, and composition functions. Unimodal functions are mainly used to evaluate the convergence speed and local exploitation ability of an algorithm, while multimodal functions are designed to test its global exploration capability and ability to avoid local optima. In addition, hybrid and composition functions combine multiple basic functions with different properties, significantly increasing the complexity of the search space and making them more representative of real-world optimization problems. Similarly, the CEC2022 benchmark suite contains a series of highly challenging functions with more complex variable interactions, irregular landscapes, and stronger nonlinearity, which can further assess the robustness and adaptability of optimization algorithms in solving large-scale and complicated problems.
Due to their diversity, complexity, and representativeness, the IEEE CEC2017 and IEEE CEC2022 benchmark suites have become standard tools for measuring the performance of heuristic optimization algorithms. They can comprehensively evaluate the global search ability, local exploitation capability, convergence accuracy, robustness, and stability of an algorithm. Therefore, in this paper, both CEC2017 and CEC2022 benchmark suites are employed to comprehensively verify the effectiveness and superiority of the proposed algorithm.
4.2. Comparison Algorithms and Parameter Settings
To ensure the fairness and reproducibility of the experiment, this section introduces the comparison algorithms used in this study and their corresponding parameter settings. We selected nine well-known and recently developed metaheuristic algorithms as comparison targets to comprehensively evaluate the performance of the proposed algorithm, including the Connected Banking System Optimizer (CBSO) [22], Centered Collision Optimizer (CCO) [23], Great Wall Construction Algorithm (GWCA) [24], Parrot Optimizer (PO) [25], Information Acquisition Optimizer (IAO) [26], Black-winged Kite Algorithm (BKA) [27], Zebra Optimization Algorithm (ZOA) [28], Preschool Education Optimization Algorithm (PEOA) [29], and the standard Butterfly Optimization Algorithm (BOA). The parameter settings of all algorithms are based on the recommendations in the original literature, as shown in Table 1.
Table 1.
Parameter settings of comparative algorithms.
4.3. Performance Evaluation on the CEC2017 Benchmark Suite
This section evaluates the performance of IBOA on the IEEE CEC2017 benchmark suite. Nine representative metaheuristic algorithms are selected for comparison, and the experiments are conducted under 30-, 50-, and 100-dimensional settings. Figure 2 shows the convergence curves of the compared algorithms on selected benchmark functions, which are used to compare their convergence speed and final solution accuracy. The numerical results are listed in Table 2, Table 3 and Table 4, where “mean” and “std” represent the average fitness value and standard deviation obtained from 30 independent runs. A smaller mean value indicates better optimization accuracy, while a smaller standard deviation reflects more stable performance. In addition, Figure 3 presents the boxplot results, which further show the distribution, median, interquartile range, and outliers of the optimization results. We have bolded the optimal results for each function to facilitate reading.
Figure 2.
Convergence behavior of different algorithms on the CEC2017 benchmark suite.
Table 2.
Experimental results on the 30-dimensional CEC2017 benchmark suite.
Table 3.
Experimental results on the 50-dimensional CEC2017 benchmark suite.
Table 4.
Experimental results on the 100-dimensional CEC2017 benchmark suite.
Figure 3.
Boxplot comparison of algorithm performance on the CEC2017 benchmark suite.
As shown in Figure 2, IBOA generally exhibits a faster and more stable convergence trend on the selected CEC2017 functions. In the early search stage, its objective values decrease rapidly on most functions, indicating that the population can quickly approach promising regions. In the middle and later stages, the convergence curves of IBOA continue to decline on several functions rather than becoming flat too early. This behavior suggests that the proposed strategies help maintain the search activity after the initial convergence. For example, on F6, F9, F23, and F27 in the 30-dimensional case, the convergence curves of IBOA are lower than those of most comparison algorithms and finally reach mean values of 6.0000 × 10², 9.0012 × 10², 2.6670 × 10³, and 3.2130 × 10³, respectively. Compared with the original BOA, IBOA shows a clear improvement in both convergence speed and final accuracy, which indicates that the introduced guidance, disturbance, and parameter adjustment mechanisms can improve the search behavior of BOA.
Table 2, Table 3 and Table 4 report the detailed results of all algorithms on the CEC2017 benchmark suite. In the 30-dimensional case, IBOA obtains the best mean values on most test functions, including F1, F3, F5–F9, F11–F13, and F15–F30. This result indicates that IBOA performs well on different types of functions, especially on multimodal, hybrid, and composition functions. For instance, on F9, F12, and F30, IBOA achieves mean values of 9.0012 × 10², 5.0776 × 10³, and 5.6378 × 10³, respectively, which are better than those of the original BOA and most competing algorithms. The corresponding standard deviations are also relatively small, showing that IBOA can obtain stable results over repeated independent runs.
When the dimension increases to 50, the optimization task becomes more difficult because the search space is enlarged and the interaction among variables becomes more complex. Even under this condition, IBOA still maintains competitive performance on most functions. In particular, it obtains the best or near-best mean values on F3, F5–F9, F11–F17, and F19–F30. For example, IBOA obtains a mean value of 3.2009 × 10² on F3, which is lower than those of the other algorithms. On F9 and F12, the mean values obtained by IBOA are 9.0242 × 10² and 6.3378 × 10⁵, respectively. These results show that the proposed strategies remain useful when the problem dimension increases. Compared with BOA, the performance gap becomes more obvious in the 50-dimensional case, suggesting that IBOA is more capable of reducing premature convergence and diversity loss.
In the 100-dimensional case, all algorithms show a certain degree of performance degradation due to the increased problem complexity. Nevertheless, IBOA still achieves relatively low mean values and stable standard deviations on many functions. This result indicates that the proposed algorithm has a certain level of scalability when dealing with high-dimensional optimization problems. However, IBOA does not achieve the best result on all 100-dimensional functions. For example, on F3, F10, F14, F18, and F22, some comparison algorithms obtain better or comparable mean values. These results suggest that the effectiveness of IBOA may vary with the landscape characteristics of different functions. For some high-dimensional hybrid and composition functions, complex variable interactions and irregular local optima may weaken the advantage of the dominant-center guidance mechanism. In such cases, algorithms with stronger random exploration or differential perturbation may have a better chance of locating alternative promising regions. Therefore, although IBOA shows strong overall performance on CEC2017, further improvements in adaptive strategy selection and diversity maintenance are still worth exploring.
Figure 3 shows the boxplot comparison of the optimization results obtained by all algorithms on the CEC2017 benchmark suite. In most cases, the boxes of IBOA are located at lower positions, indicating better fitness values. Meanwhile, the interquartile ranges of IBOA are relatively compact on many functions, which means that the results obtained in 30 independent runs are more concentrated. The number of extreme outliers is also limited compared with several competing algorithms. These observations indicate that IBOA is less sensitive to random initialization and has better solution consistency. In contrast, the original BOA often produces wider box distributions and higher median values, reflecting weaker stability and lower search accuracy. Overall, the convergence curves, numerical results, and boxplots together show that IBOA improves the performance of BOA on the CEC2017 benchmark suite, especially in terms of convergence accuracy and result stability.
4.4. Performance Evaluation on the CEC2022 Benchmark Suite
This section evaluates the performance of IBOA on the IEEE CEC2022 benchmark suite. Nine representative metaheuristic algorithms are used for comparison, and the experiments are carried out under 10- and 20-dimensional settings. The convergence curves of all algorithms are shown in Figure 4, which reflects their convergence speed and final search accuracy on selected benchmark functions. The detailed numerical results are reported in Table 5 and Table 6, where “mean” and “std” denote the average fitness value and standard deviation obtained from 30 independent runs, respectively. A smaller mean value indicates better optimization accuracy, while a smaller standard deviation reflects more stable performance. In addition, Figure 5 presents the boxplot results, including the median, quartiles, and outliers, to further compare the distribution characteristics of the optimization results.
Figure 4.
Convergence behavior of different algorithms on the CEC2022 benchmark suite.
Table 5.
Experimental results on the 10-dimensional CEC2022 benchmark suite.
Table 6.
Experimental results on the 20-dimensional CEC2022 benchmark suite.
Figure 5.
Boxplot comparison of algorithm performance on the CEC2022 benchmark suite.
As shown in Figure 4, IBOA exhibits competitive convergence behavior on most CEC2022 benchmark functions. In the early stage of iteration, the objective values of IBOA decrease rapidly on several functions, indicating that the algorithm can approach promising search regions efficiently. In the middle and later stages, its convergence curves remain relatively stable and continue to improve on most test functions, rather than stagnating too early. This suggests that the proposed strategies help preserve useful search activity after the initial convergence. By contrast, some comparison algorithms show fast convergence at the beginning but gradually become flat in the later stage, which may indicate premature convergence or insufficient local refinement. When the dimension increases from 10 to 20, the search difficulty becomes higher for all algorithms. Nevertheless, IBOA still maintains relatively stable convergence trends, showing that the proposed guidance, disturbance, and adaptive fragrance decay mechanisms are useful for improving the search behavior of BOA on more complex CEC2022 functions.
Figure 5 further compares the distribution of the optimization results obtained by different algorithms on the CEC2022 benchmark suite. In most cases, the boxplots of IBOA are located at lower positions than those of the comparison algorithms, indicating that IBOA obtains better fitness values in repeated runs. Meanwhile, the interquartile ranges of IBOA are relatively compact on many functions, suggesting that its results are more concentrated and less affected by random initialization. The number of extreme outliers is also limited compared with several competing algorithms. These observations show that IBOA has better result consistency and stability. In contrast, some algorithms produce wider box distributions and more outliers, reflecting larger fluctuations among independent runs.
Table 5 and Table 6 list the numerical results of all algorithms on the 10- and 20-dimensional CEC2022 benchmark suites, respectively. In the 10-dimensional case, IBOA obtains the best or near-best mean values on most functions. This indicates that the proposed improvement strategies can enhance the overall search capability of BOA, especially on functions with multimodal, hybrid, or composition characteristics. Compared with the original BOA, IBOA achieves lower mean values on many test functions, which shows that the introduced mechanisms can improve convergence accuracy. In addition, the standard deviations of IBOA are generally small, demonstrating that the algorithm can maintain stable optimization performance over 30 independent runs.
When the dimension increases to 20, the enlarged search space and stronger variable interactions make the optimization task more difficult. Under this condition, the performance of most algorithms declines to varying degrees. However, IBOA still maintains strong competitiveness on the majority of functions and continues to outperform the original BOA in both mean value and stability. This result indicates that IBOA has a certain degree of dimensional adaptability. The Dance Synchronization Guidance Strategy provides more reliable search direction by combining the global best solution with the dominant-group center, while the Dance Emotion Disturbance Strategy helps the algorithm avoid stagnation during local search. Meanwhile, the Exponential Fragrance Decay Strategy adjusts the search intensity along with the iteration process. Overall, the results in Figure 4 and Figure 5 and Table 5 and Table 6 show that IBOA performs well on the CEC2022 benchmark suite in terms of convergence accuracy, stability, and adaptability to different dimensions.
4.5. Statistical Analysis
Statistical analysis is essential for evaluating the reliability and significance of optimization results. Since metaheuristic algorithms are stochastic in nature, their performance may vary across different independent runs due to random initialization and probabilistic search operators. Therefore, relying solely on the mean fitness value or the best result may not provide a sufficiently objective assessment of algorithm performance. To address this issue, two widely used non-parametric statistical methods, namely the Wilcoxon signed-rank test and the Friedman mean-rank test, are employed in this paper to further analyze the superiority and robustness of the proposed algorithm.
The Wilcoxon signed-rank test is used to determine whether the performance differences between the proposed algorithm and the comparison algorithms are statistically significant on each benchmark function. Meanwhile, the Friedman mean-rank test is adopted to evaluate the overall ranking performance of all algorithms across the entire benchmark suite. These statistical methods can effectively reduce the influence of randomness and provide more reliable evidence for the effectiveness of the proposed algorithm. The detailed statistical results are presented in the following subsections.
4.5.1. Wilcoxon Signed-Rank Test
The Wilcoxon signed-rank test is an important nonparametric statistical method widely used to evaluate the significance of performance differences between optimization algorithms [30]. Since metaheuristic algorithms are inherently stochastic, even under the same experimental settings, results can vary from run to run. Therefore, comparing algorithms solely based on averages or optimal values may lead to biased conclusions. The Wilcoxon signed-rank test can effectively determine whether observed performance differences are statistically significant, rather than being caused by random fluctuations. Therefore, the Wilcoxon signed-rank test was employed in this section to evaluate the performance of IBOA at a significance level of ; the experimental results are presented in Table 7. In addition, we applied the Holm correction for multiple comparisons; the experimental p-values are presented in Appendix A Table A1, Table A2, Table A3, Table A4 and Table A5.
Table 7.
W/T/L results of the compared algorithms.
Table 7 presents the W/T/L results obtained from the Wilcoxon signed-rank test, where W, T, and L denote the numbers of benchmark functions on which IBOA performs better than, equal to, or worse than the compared algorithms, respectively. It can be observed that IBOA achieves overwhelmingly more wins than losses against most competing algorithms across both the CEC2017 and CEC2022 benchmark suites, indicating that the proposed method has a statistically significant advantage in overall optimization performance. In particular, the number of wins is substantially higher than the number of losses when IBOA is compared with the original BOA and several other state-of-the-art metaheuristic algorithms, demonstrating that the proposed improvement strategies effectively enhance the search capability and robustness of the original algorithm. Moreover, the relatively small number of ties further suggests that the superiority of IBOA is not limited to only a few benchmark functions, but is consistently reflected across different types of optimization problems, including unimodal, multimodal, hybrid, and composition functions. Therefore, the W/T/L results provide strong statistical evidence that IBOA possesses better convergence accuracy, stability, and global competitiveness than the compared algorithms, further confirming the effectiveness and reliability of the proposed method.
As shown in Table A1, Table A2, Table A3, Table A4 and Table A5, the vast majority of Holm-adjusted p-values are lower than the significance level of 0.05, confirming that IBOA significantly outperforms most competing algorithms on both the CEC2017 and CEC2022 benchmark suites. Notably, many p-values are as small as 1.5610 × 10⁻⁵, providing strong statistical evidence for the superiority of the proposed algorithm. Compared with the original BOA, all corresponding p-values remain well below the significance threshold across nearly all benchmark functions and dimensional settings, indicating that the three proposed enhancement strategies lead to substantial and statistically significant performance improvements. The consistency of these results across multiple benchmark suites and dimensions further demonstrates the robustness, effectiveness, and statistical reliability of IBOA.
4.5.2. Friedman Mean-Rank Test
When comparing metaheuristic algorithms, it is difficult to judge the overall performance of an algorithm based solely on the results of a few individual benchmark functions, as different algorithms may perform differently on different problems [31]. The Friedman mean-rank test provides a more comprehensive statistical perspective by ranking the performance of all algorithms on each benchmark function and summing their average ranking across the entire test suite. Compared to direct comparisons based solely on mean or standard deviation, this method better reflects the stability, robustness, and overall competitiveness of each algorithm. Therefore, the Friedman mean-rank test is considered an effective tool for identifying the relative performance of metaheuristic algorithms and is widely used in optimization research. In this section, we conduct the Friedman mean-rank test on IBOA, and the experimental results are shown in Table 8.
Table 8.
Statistical ranking results based on the Friedman test.
Table 8 presents the statistical ranking results obtained from the Friedman test, which provides a comprehensive evaluation of the overall performance of all compared algorithms across the benchmark functions. It can be observed that IBOA achieves the best overall ranking with the lowest mean rank value among all algorithms, indicating that it maintains consistently superior performance across different benchmark functions and dimensional settings. This result demonstrates that IBOA not only performs well on several individual functions, but also shows strong competitiveness on the majority of test problems, including unimodal, multimodal, hybrid, and composition functions. Compared with the other algorithms, the ranking of IBOA remains more stable under different benchmark suites, suggesting that the proposed method has better robustness and adaptability to various optimization landscapes. In contrast, the rankings of several competing algorithms fluctuate more significantly, implying that their performance is more sensitive to changes in problem characteristics and dimensionality. Therefore, the Friedman ranking results further verify that IBOA possesses superior convergence accuracy, robustness, and comprehensive optimization capability, providing strong statistical support for the effectiveness of the proposed improvement strategies.
To further investigate whether the performance differences among the compared algorithms are statistically significant, the Nemenyi post hoc test was conducted based on the Friedman ranking results. For the CEC2017 benchmark suite, which contains 30 test functions, the critical difference (CD) value at the significance level of 0.05 is 2.47. As shown in Table 8, the average ranks of IBOA are 1.13, 1.23, and 1.87 for the 30-, 50-, and 100-dimensional cases, respectively, which are substantially better than those of most competing algorithms. In particular, the rank differences between IBOA and algorithms such as BOA, PO, ZOA, BKA, IAO, and PEOA are all greater than the corresponding CD value, indicating statistically significant performance improvements. Although the rank differences between IBOA and the top-performing competitors CBSO and CCO are smaller in some dimensional settings, IBOA consistently achieves the best rank in all cases, demonstrating its superior optimization capability and robustness.
For the CEC2022 benchmark suite, which contains 12 test functions, the calculated CD value is 3.91. The average ranks of IBOA are 1.50 and 1.00 in the 10-dimensional and 20-dimensional cases, respectively, both ranking first among all compared algorithms. The rank differences between IBOA and most algorithms, particularly BOA, PO, ZOA, BKA, and PEOA, exceed the CD threshold, confirming statistically significant superiority. These results indicate that the proposed IBOA maintains a clear performance advantage across different benchmark suites and dimensional settings. Therefore, the Friedman and Nemenyi analyses jointly verify that the superior performance of IBOA is statistically reliable rather than resulting from random fluctuations.
4.6. Comparison with High-Performance Algorithms
To further ensure the fairness and credibility of the experimental comparisons, the maximum number of function evaluations (MaxFEs) is adopted as the termination criterion in this subsection. Compared with a fixed number of iterations, MaxFEs provides a unified computational budget and eliminates the influence caused by different evaluation consumption mechanisms among algorithms. Consequently, it has become a commonly accepted evaluation protocol in recent metaheuristic optimization studies. Under this setting, the proposed algorithm is compared with several recently developed high-performance optimization algorithms to further verify its effectiveness and competitiveness in solving complex optimization problems. The experimental results are shown below.
Figure 6 presents the convergence curves of IBOA and several high-performance optimization algorithms under the same maximum number of function evaluations (MaxFEs). It can be observed that IBOA exhibits highly competitive convergence behavior across different benchmark functions and dimensional settings. In the 30-dimensional cases, such as F4, F8, F12, F16, F20, and F24, IBOA consistently achieves faster fitness reduction during the early search stage and reaches lower final objective values than most comparison algorithms. Particularly on F8, F12, and F20, the convergence curve of IBOA remains below those of the advanced DE-based algorithms, including JADE, SHADE, LSHADE, LSHADE-cnEpSin, and LSHADE-SPACMA, indicating superior search efficiency and optimization accuracy under the same computational budget. In the 50-dimensional cases, including F1, F7, F13, F20, F26, and F30, the superiority of IBOA becomes even more evident. Although the search space complexity increases significantly, IBOA still maintains rapid convergence in the early stage while continuously improving solution quality in the later stage, ultimately obtaining the best or near-best fitness values on most functions. Compared with the original BOA, the convergence curves of IBOA are consistently lower and more stable, demonstrating that the proposed enhancement strategies effectively improve population diversity, strengthen the balance between exploration and exploitation, and enhance the capability of escaping local optima. Overall, the results demonstrate that IBOA can achieve superior convergence efficiency and solution quality under an equal function evaluation budget, confirming its competitiveness against several state-of-the-art optimization algorithms.
Figure 6.
Convergence curves from comparative experiments with high-performance algorithms.
These results further verify that the performance advantage of IBOA is not caused by differences in iteration mechanisms or evaluation consumption, but originates from the effectiveness of the proposed search strategies themselves.
4.7. Parameter Sensitivity Analysis
Since the performance of meta-heuristic algorithms is often influenced by control parameter settings, parameter sensitivity analysis is crucial for evaluating algorithm robustness and determining appropriate parameter configurations. Different parameter values can affect the algorithm’s search behavior, convergence speed, and the balance between exploration and exploitation. In light of this, to further investigate the impact of parameter settings on the proposed IBOA algorithm, this paper conducts a sensitivity analysis of two key parameters: and . The experimental results are presented below.
Based on the parameter-sensitivity analysis results shown in Figure 7, it is evident that the parameters and influence the optimization performance of IBOA, yet the algorithm demonstrates overall robustness. In the analysis of parameter (Figure 7a–f), the algorithm achieved rapid convergence across various λ values; however, setting yielded lower final fitness values and faster convergence speeds on most test functions, with particularly notable advantages observed on functions such as CEC2017-F4, F11, and F28. Conversely, smaller values diminish the search capability of the perturbation mechanism, whereas excessively large values introduce excessive randomness, thereby compromising the precision of local exploitation in the later stages of optimization. Regarding the analysis of parameter (Figure 7g–l), the algorithm maintained stable convergence across different settings, confirming the stability of the proposed exponential scent-decay mechanism. Notably, setting resulted in superior or near-optimal performance on the majority of test functions, indicating that this value establishes a more effective balance between global exploration and local exploitation. In summary, IBOA exhibits optimal performance in terms of convergence speed, search accuracy, and stability when and ; consequently, these values are adopted as the default settings for the subsequent experiments in this study.
Figure 7.
Experimental results of parameter-sensitivity analysis.
4.8. Ablation Study Analysis
To examine how each proposed strategy affects the performance of IBOA, an ablation study is conducted in this subsection. Three simplified variants are constructed by adding only one strategy to the original BOA, namely BOA+DSGS, BOA+DEDS, and BOA+EFDS. These variants are compared with both the original BOA and the complete IBOA on the CEC2017 and CEC2022 benchmark suites. In this way, the individual contribution of each strategy and the combined effect of the complete framework can be evaluated more directly.
Table 9 reports the ranking results of the ablation study under different benchmark suites and dimensional settings. The original BOA obtains relatively poor ranks in most cases, indicating that its original search mechanism is limited when dealing with complex benchmark functions. After introducing each strategy separately, the ranks of BOA+DSGS, BOA+DEDS, and BOA+EFDS are all improved to varying degrees. This result suggests that the three strategies contribute positively to the search process, but their effects are different. Among the three single-strategy variants, BOA+DSGS generally achieves better rankings, showing that the dominant-group guidance mechanism plays an important role in improving the search direction and reducing the dependence on a single best solution. BOA+DEDS improves the local search behavior by introducing additional perturbation, while BOA+EFDS adjusts the search intensity through the dynamic fragrance parameter.
Table 9.
Ranking results of the algorithms in the ablation study.
It is also clear from Table 9 that the complete IBOA obtains the best mean rank in all tested cases. Compared with the single-strategy variants, IBOA shows more stable ranking performance across different dimensions and benchmark suites. This indicates that the three strategies do not work independently in isolation, but complement each other during the optimization process. The guidance strategy helps the population approach promising regions, the disturbance strategy provides additional diversity when the search tends to stagnate, and the fragrance-decay strategy controls the transition between exploration and exploitation. Therefore, the ablation results verify that the performance improvement of IBOA comes from the coordinated use of the three strategies rather than from a single modification alone.
5. Evaluation of the Proposed IBOA for Microgrid Optimal Scheduling
5.1. Microgrid System Description
To further validate the practical applicability of the proposed IBOA, it is employed to solve the optimal scheduling problem of a grid-connected microgrid over a 24 h scheduling horizon [32,33,34]. The considered microgrid consists of renewable energy sources, controllable distributed generators, an energy storage unit, and the utility grid. Specifically, the renewable generation subsystem includes photovoltaic (PV) panels and wind turbines (WT), while the controllable generation subsystem contains fuel cells (FC), microturbines (MT), and gas engines (GS). In addition, a battery storage unit (BT) is introduced to smooth renewable fluctuations and improve system flexibility. The utility grid is connected to the microgrid to provide auxiliary support when local generation is insufficient or when surplus energy can be sold back to the grid. The overall objective is to determine the optimal hourly power output of each unit such that the total operating cost is minimized while maintaining system balance and operational security. The values for the various parameters are shown in Table 10 [35,36]. The specific modeling details are as follows.
Table 10.
Parameters of distributed power sources in the microgrid.
The photovoltaic (PV) generation profiles, wind turbine (WT) generation profiles, and load demand curves used in this study are derived from time-varying data representing a typical daily microgrid scheduling scenario in a region of Guangdong; consequently, they are treated as known input parameters rather than decision variables during the optimization process. The optimization algorithm focuses solely on determining the operational scheduling schemes for controllable units—including fuel cells, micro-turbines, small internal combustion engines, battery energy storage systems, and grid interactions—while ensuring that power-balance constraints are satisfied for each scheduling interval.
5.2. Mathematical Models of Distributed Energy Sources
5.2.1. Renewable Energy Model
The outputs of PV and WT are determined by their forecasted power values and are treated as uncontrollable variables in the scheduling process. Therefore, the generated power of PV and WT at time can be expressed as:
where and denote the actual outputs of PV and WT at time , respectively, while and are their corresponding forecasted values.
5.2.2. Controllable Distributed Generator Model
The controllable generation units, including FC, MT, and GS, can adjust their outputs according to system demand. Their operating power must satisfy the following output constraints:
where , , and denote the outputs of FC, MT, and GS at time , respectively, while the superscripts “” and “” represent their minimum and maximum operating limits.
5.2.3. Battery Storage Model
The battery storage unit can operate in both charging and discharging modes. Its charging/discharging power is constrained by:
The state of charge (SOC) of the battery at time is updated as follows:
where is the battery state of charge at time , denotes the battery capacity, and is the scheduling interval. In addition, the SOC must satisfy the following safety constraint:
5.2.4. Utility Grid Interaction Model
The power exchanged between the microgrid and the utility grid is constrained by the maximum allowable exchange capacity, as specifically expressed below:
where denotes the power purchased from or sold to the utility grid at time . Positive values indicate electricity purchase, while negative values indicate electricity sale.
5.3. Objective Function
The purpose of microgrid scheduling is to minimize the total operating cost over the entire scheduling horizon. In this study, the total cost consists of fuel cost, operation and maintenance cost, pollutant treatment cost, utility grid interaction cost, and power imbalance penalty cost.
The total operating cost can be formulated as:
where , , , , and represent fuel cost, operation and maintenance cost, pollutant treatment cost, grid interaction cost, and imbalance penalty cost, respectively.
The fuel cost is given by:
where , , and are the fuel cost coefficients of FC, MT, and GS, respectively.
The operation and maintenance cost is expressed as:
where is the operation and maintenance coefficient of the -th distributed energy source, and denotes its output at time .
The pollutant treatment cost can be written as:
where denotes the treatment cost coefficient of pollutant , and is the amount of pollutant emitted at time . In this study, the pollutants mainly include , , and .
The grid interaction cost is defined as:
where is the time-varying electricity price of the utility grid.
To maintain supply–demand balance, a penalty cost is introduced:
where is the penalty coefficient, is the load demand at time , and is the total power supplied by all generation units.
5.4. Constraints
The microgrid scheduling problem is subject to the power-balance constraint:
The constraint ensures that the total generated power matches the load demand at each scheduling period. In addition, all units must satisfy their own output constraints, and the battery SOC must remain within the allowable operating range.
It should be noted that the microgrid scheduling model adopted in this study is not newly proposed by the authors. Instead, it is a widely used benchmark model derived from previous microgrid scheduling studies. The primary objective of this work is to evaluate the optimization capability of the proposed IBOA in solving practical engineering optimization problems rather than introducing a new scheduling model.
5.5. Results and Discussion
To evaluate the applicability of IBOA to microgrid scheduling, a typical daily load profile and renewable energy generation profile are used in this case study. All algorithms are executed independently 30 times under the same experimental conditions. The minimum cost, maximum cost, average cost, and standard deviation are used as statistical indicators, and the results are reported in Table 11.
Table 11.
Microgrid scheduling experimental results.
As shown in Table 11, IBOA obtains the lowest scheduling cost among all compared algorithms. The minimum, maximum, average cost, and standard deviation of IBOA are 1344.00, 1603.54, 1443.56, and 69.61, respectively. Compared with CCO, CBSO, and GWCA, whose average costs are 1670.34, 1698.00, and 1706.18, IBOA reduces the average cost by approximately 13.58%, 14.98%, and 15.39%, respectively. The improvement over the original BOA is more evident, as the average cost decreases from 28,338.69 to 1443.56. In addition, the standard deviation of IBOA is much smaller than that of BOA, indicating that the proposed algorithm can obtain more consistent scheduling results over repeated runs. These results show that the introduced strategies improve the scheduling performance of BOA in terms of both cost reduction and solution stability.
Figure 8 shows the convergence curves of different algorithms in the microgrid scheduling problem. IBOA decreases rapidly at the beginning of the search and reaches a lower objective value than the other algorithms. In the later stage, its curve remains relatively smooth and continues to refine the solution. By contrast, CCO, CBSO, and GWCA show acceptable initial convergence but tend to become flat earlier, which limits their final scheduling accuracy. The original BOA stays at a much higher cost level during the whole optimization process, suggesting that it has difficulty escaping poor search regions in this scheduling problem. Other algorithms, such as PO, IAO, BKA, ZOA, and PEOA, also show larger fluctuations or slower convergence. Therefore, the convergence results indicate that IBOA has better search continuity and cost-minimization ability in the considered microgrid scheduling scenario.
Figure 8.
Microgrid scheduling algorithm convergence curves.
Figure 9 presents the output distribution of each unit under the optimal scheduling result obtained by IBOA. Renewable energy sources, including photovoltaic units and wind turbines, are preferentially used when their output is available. During periods with strong solar radiation, the photovoltaic unit contributes a large part of the power supply, while wind power provides additional support according to the wind generation profile. When renewable generation cannot fully meet the load demand, controllable units such as microturbines and fuel cells increase their output to maintain power balance. The battery energy storage system also contributes to power regulation. It is charged during low-load or high-renewable-output periods and discharged during peak-load periods or when renewable generation decreases. Through this coordinated scheduling process, IBOA can arrange controllable units, battery storage, and grid interaction in a cost-effective manner.
Figure 9.
IBOA-output distribution of each unit.
Figure 10 further illustrates the stacked power distribution over the 24-h scheduling horizon. PV and WT units provide an important portion of the power supply during daytime hours, especially when PV generation reaches its peak around noon. During periods of low renewable output, the fuel cell, microturbine, and small internal combustion engine increase their generation to satisfy the load demand. The battery stores surplus energy when renewable generation is sufficient and releases energy during high-demand periods, which helps reduce the need for expensive grid electricity purchases. Grid power is mainly used when local generation and battery discharge cannot fully cover the load. These results suggest that the scheduling solution obtained by IBOA is reasonable from both economic and operational perspectives.
Figure 10.
IBOA-power distribution stackup diagram.
It should also be noted that the PV and WT outputs used in this study are predetermined according to actual generation profiles and are not directly optimized by IBOA. Therefore, the main role of the algorithm is to coordinate controllable generation units, battery charging and discharging, and grid power exchange under the given renewable generation conditions. This setting allows the algorithm to reduce the operating cost while satisfying the load demand and power-balance constraints.
From a practical perspective, the battery energy storage system plays a key role in balancing supply and demand. Its charging and discharging behavior is limited by battery capacity, state-of-charge constraints, and power rating constraints. When renewable generation is sufficient, the battery absorbs excess energy; when the load demand increases or renewable output decreases, it releases stored energy to support the system. This operation helps improve energy utilization efficiency and reduce the dependence on grid electricity or conventional generation units.
Although IBOA shows good performance in the considered case study, the current scheduling framework does not explicitly consider renewable generation uncertainty. In real microgrid operation, PV and WT outputs may be affected by forecasting errors and environmental changes. In addition, load demand variations and electricity price fluctuations may also influence the scheduling results. Therefore, future work will consider stochastic or robust optimization frameworks and conduct sensitivity analysis under different operating conditions to further evaluate the practical adaptability of the proposed method.
To further evaluate the statistical reliability of the experimental results, a t-test was employed in this study. Given the inherent stochastic nature of meta-heuristic algorithms—influenced by random initialization and probabilistic search mechanisms—optimization outcomes may vary across independent runs. While mean and standard deviation values reflect an algorithm’s overall accuracy and stability, they cannot determine whether observed performance differences between algorithms are statistically significant. Therefore, a t-test was necessary to verify that the superior performance of the proposed IBOA algorithm stems from its effective search mechanism rather than random fluctuations. In this experiment, paired t-tests were conducted at a significance level of 0.05 to compare the IBOA against the benchmark algorithms based on the results of 30 independent runs. The experimental results are presented below, where “+” indicates that the IBOA outperformed the comparison algorithm.
Table 11 further reports the t-test results between the proposed IBOA and the compared algorithms for the microgrid scheduling problem. As shown in the table, the p-values obtained by comparing IBOA with CBSO, CCO, GWCA, PO, IAO, BKA, ZOA, PEOA, and BOA are all much smaller than the significance level of 0.05. This indicates that the performance differences between IBOA and the other algorithms are statistically significant. In addition, the t-test results are marked with “+”, meaning that IBOA significantly outperforms the corresponding comparison algorithms. Combined with the statistical results of Max, Min, Mean, and Std, IBOA achieves the lowest mean cost and maintains competitive stability. Therefore, the t-test results further confirm that the superior performance of IBOA in microgrid scheduling is statistically reliable rather than caused by random fluctuations.
6. Conclusions
This study proposed an Improved Butterfly Optimization Algorithm (IBOA) to improve the search performance of the original BOA when solving complex optimization problems. Three strategies were introduced into the BOA framework, including the Dance Synchronization Guidance Strategy, the Dance Emotion Disturbance Strategy, and the Exponential Fragrance Decay Strategy. These strategies modify the search guidance, local perturbation, and parameter adjustment processes of BOA, thereby improving population cooperation, maintaining search diversity, and reducing the risk of premature convergence.
The proposed IBOA was evaluated on the IEEE CEC2017 and IEEE CEC2022 benchmark suites under different dimensional settings. The experimental results show that IBOA achieves better or highly competitive results on most test functions compared with the original BOA and several representative metaheuristic algorithms. In particular, IBOA performs well on multimodal, hybrid, and composition functions, indicating that the proposed strategies are useful for handling complex search landscapes. The convergence curves and boxplot results further show that IBOA can maintain stable search behavior and obtain more concentrated results over repeated runs. In addition, the Friedman mean-rank test confirms the overall advantage of IBOA from a statistical perspective.
IBOA was also applied to a microgrid scheduling problem to examine its engineering applicability. In this case study, IBOA obtained the lowest average operating cost of 1443.56 with a standard deviation of 69.61 over 30 independent runs. Compared with CCO, CBSO, and GWCA, the average operating cost was reduced by approximately 13.58%, 14.98%, and 15.39%, respectively. Compared with the original BOA, the average cost decreased from 28,338.69 to 1443.56. These results indicate that IBOA can generate more cost-effective and stable scheduling schemes by coordinating controllable generation units, battery energy storage, and grid power exchange under the given renewable energy profiles.
Although IBOA achieved promising results in the benchmark tests and the microgrid scheduling case, some limitations still remain. First, the current microgrid model uses predetermined photovoltaic and wind power profiles, and renewable generation uncertainty is not explicitly considered. Second, the performance of the algorithm may be affected by different load patterns, electricity price fluctuations, and operating constraints. Third, although IBOA shows good performance in the tested dimensions, its behavior on larger-scale and more complex real-world systems still requires further investigation. Future work will focus on extending IBOA to stochastic and robust microgrid scheduling, multi-objective optimization problems, and large-scale engineering applications. In addition, adaptive parameter control and hybrid optimization frameworks may be explored to further improve its applicability and search efficiency.
Author Contributions
Conceptualization, Q.Z. and F.L.; methodology, Q.Z. and F.L.; software, Q.Z. and F.L.; validation, Q.Z. and F.L.; formal analysis, Q.Z. and F.L.; investigation, Q.Z. and F.L.; resources, Q.Z. and F.L.; data curation, Q.Z. and F.L.; writing—original draft preparation, S.C. and Q.H.; writing—review and editing, S.C. and Q.H.; visualization, S.C. and Q.H.; supervision, S.C. and Q.H.; funding acquisition, S.C. and Q.H. All authors have read and agreed to the published version of the manuscript.
Funding
This research received no external funding.
Data Availability Statement
Data are contained within the article.
Acknowledgments
The authors used ChatGPT 5.5 by OpenAI only to improve the readability, grammar, and clarity of some English expressions. It was not used to generate the scientific ideas, methodology, experimental design, data, results, figures, tables, analysis, or conclusions of the manuscript. All AI-assisted text was carefully reviewed, checked, and edited by the authors. The authors take full responsibility for the accuracy, originality, integrity, and validity of the entire manuscript.
Conflicts of Interest
The authors declare no conflicts of interest.
Appendix A
Table A1.
P_holm values for various algorithms on the CEC 2017 (dim = 30).
Table A2.
P_holm values for various algorithms on the CEC 2017 (dim = 50).
Table A3.
P_holm values for various algorithms on the CEC 2017 (dim = 100).
Table A4.
P_holm values for various algorithms on the CEC 2022 (dim = 10).
Table A5.
P_holm values for various algorithms on the CEC 2022 (dim = 20).
References
- Ahmad, S.; Shafiullah, M.; Ahmed, C.B.; Alowaifeer, M. A Review of Microgrid Energy Management and Control Strategies. IEEE Access 2023, 11, 21729–21757. [Google Scholar] [CrossRef] [Scilit]
- Agupugo, C.P.; Kehinde, H.M.; Manuel, H.N.N. Optimization of Microgrid Operations Using Renewable Energy Sources. Eng. Sci. Technol. J. 2024, 5, 2379–2401. [Google Scholar] [CrossRef] [Scilit]
- Karthik, N.; Rajagopalan, A.; Bajaj, M.; Medhi, P.; Kanimozhi, R.; Blazek, V.; Prokop, L. Chaotic Self-Adaptive Sine Cosine Multi-Objective Optimization Algorithm to Solve Microgrid Optimal Energy Scheduling Problems. Sci. Rep. 2024, 14, 18997. [Google Scholar]
- Zhou, Y.; Zhai, Q.; Xu, Z.; Wu, L.; Guan, X. Multi-Stage Adaptive Stochastic-Robust Scheduling Method with Affine Decision Policies for Hydrogen-Based Multi-Energy Microgrid. IEEE Trans. Smart Grid 2023, 15, 2738–2750. [Google Scholar]
- Mei, Y.; Li, B.; Wang, H.; Wang, X.; Negnevitsky, M. Multi-Objective Optimal Scheduling of Microgrid with Electric Vehicles. Energy Rep. 2022, 8, 4512–4524. [Google Scholar] [CrossRef] [Scilit]
- Bio Gassi, K.; Baysal, M. Analysis of a Linear Programming-based Decision-making Model for Microgrid Energy Management Systems with Renewable Sources. Int. J. Energy Res. 2022, 46, 7495–7518. [Google Scholar]
- Shawon, S.M.R.H.; Liang, X.; Janbakhsh, M. Optimal Placement of Distributed Generation Units for Microgrid Planning in Distribution Networks. IEEE Trans. Ind. Appl. 2023, 59, 2785–2795. [Google Scholar] [CrossRef] [Scilit]
- Chen, B.; Jiang, J.; Shao, Y. Integrated Scheduling and Control System of Microgrid Based on Dynamic Programming Algorithm. In Proceedings of the 2023 IEEE International Conference on Integrated Circuits and Communication Systems (ICICACS), Raichur, India, 24–25 February 2023; pp. 1–5. [Google Scholar]
- Nguyen-Duc, T.; Hoang-Tuan, L.; Ta-Xuan, H.; Do-Van, L.; Takano, H. A Mixed-Integer Programming Approach for Unit Commitment in Micro-Grid with Incentive-Based Demand Response and Battery Energy Storage System. Energies 2022, 15, 7192. [Google Scholar]
- Haider, H.; Jun, Y.; Rashed, G.I.; Peixiao, F.; Kamel, S.; Li, Y. A Robust Optimization Model for Microgrid Considering Hybrid Renewable Energy Sources under Uncertainties. Environ. Sci. Pollut. Res. 2023, 30, 82470–82484. [Google Scholar] [CrossRef] [Scilit]
- Vaish, J.; Tiwari, A.K.; Siddiqui, K.M. Optimization of Micro Grid with Distributed Energy Resources Using Physics Based Meta Heuristic Techniques. IET Renew. Power Gener. 2025, 19, e12699. [Google Scholar]
- Güven, A.F. Heuristic Techniques and Evolutionary Algorithms in Microgrid Optimization Problems. In Microgrid; CRC Press: Boca Raton, FL, USA, 2024; pp. 260–301. ISBN 1-003-48183-3. [Google Scholar]
- Liu, Y.; Yang, S.; Li, D.; Zhang, S. Improved Whale Optimization Algorithm for Solving Microgrid Operations Planning Problems. Symmetry 2022, 15, 36. [Google Scholar] [CrossRef] [Scilit]
- Fu, K.; Guo, Y.; Qiu, W. Optimization of Microgrid Scheduling Based on Adaptive Collaborative Secretary Bird Optimization Algorithm. Mathematics 2026, 14, 622. [Google Scholar] [CrossRef] [Scilit]
- ÇetınbaŞ, İ.; Tamyürek, B.; Demırtaş, M. The Hybrid Harris Hawks Optimizer-Arithmetic Optimization Algorithm: A New Hybrid Algorithm for Sizing Optimization and Design of Microgrids. IEEE Access 2022, 10, 19254–19283. [Google Scholar] [CrossRef] [Scilit]
- Yu, M.; Yang, H.; Zhang, J.; Ouyang, K.; Fu, S.; Tan, P.; Jiang, F.; Xu, J. Bounty Hunter Optimizer: A Novel Metaheuristic with an Application to Multi-UAV Mobile Edge Computing and Path Planning. Knowl.-Based Syst. 2026, 341, 115836. [Google Scholar] [CrossRef] [Scilit]
- Fu, S.; Li, K.; Huang, H.; Ma, C.; Fan, Q.; Zhu, Y. Red-Billed Blue Magpie Optimizer: A Novel Metaheuristic Algorithm for 2D/3D UAV Path Planning and Engineering Design Problems. Artif. Intell. Rev. 2024, 57, 134. [Google Scholar]
- Fu, Y.; Liu, D.; Chen, J.; He, L. Secretary Bird Optimization Algorithm: A New Metaheuristic for Solving Global Optimization Problems. Artif. Intell. Rev. 2024, 57, 123. [Google Scholar] [CrossRef] [Scilit]
- Arora, S.; Singh, S. Butterfly Optimization Algorithm: A Novel Approach for Global Optimization. Soft Comput. 2019, 23, 715–734. [Google Scholar] [CrossRef] [Scilit]
- Wu, G.; Mallipeddi, R.; Suganthan, P.N. Problem Definitions and Evaluation Criteria for the CEC 2017 Competition on Constrained Real-Parameter Optimization; Nanyang Technological University: Singapore, 2017; Volume 9. [Google Scholar]
- Ahrari, A.; Elsayed, S.; Sarker, R.; Essam, D.; Coello, C.A.C. Problem Definition and Evaluation Criteria for the CEC’2022 Competition on Dynamic Multimodal Optimization; University of New South Wales: Sydney, Australia, 2022; pp. 18–23. [Google Scholar]
- Nemati, M.; Zandi, Y.; Sabouri, J. Application of a Novel Metaheuristic Algorithm Inspired by Connected Banking System in Truss Size and Layout Optimum Design Problems and Optimization Problems. Sci. Rep. 2024, 14, 27345. [Google Scholar] [CrossRef] [Scilit]
- Lang, Y.; Gao, Y.; Chen, T.; Wang, H. Centered Collision Optimizer: A Novel and Efficient Physics-Based Metaheuristic Optimization Algorithm for Solving Complex Real-World Engineering Optimization Problems. Comput. Methods Appl. Mech. Eng. 2026, 448, 118491. [Google Scholar]
- Guan, Z.; Ren, C.; Niu, J.; Wang, P.; Shang, Y. Great Wall Construction Algorithm: A Novel Meta-Heuristic Algorithm for Engineer Problems. Expert Syst. Appl. 2023, 233, 120905. [Google Scholar] [CrossRef] [Scilit]
- Lian, J.; Hui, G.; Ma, L.; Zhu, T.; Wu, X.; Heidari, A.A.; Chen, Y.; Chen, H. Parrot Optimizer: Algorithm and Applications to Medical Problems. Comput. Biol. Med. 2024, 172, 108064. [Google Scholar] [CrossRef] [Scilit]
- Wu, X.; Li, S.; Jiang, X.; Zhou, Y. Information Acquisition Optimizer: A New Efficient Algorithm for Solving Numerical and Constrained Engineering Optimization Problems. J. Supercomput. 2024, 80, 25736–25791. [Google Scholar] [CrossRef] [Scilit]
- Wang, J.; Wang, W.; Hu, X.; Qiu, L.; Zang, H. Black-Winged Kite Algorithm: A Nature-Inspired Meta-Heuristic for Solving Benchmark Functions and Engineering Problems. Artif. Intell. Rev. 2024, 57, 98. [Google Scholar]
- Trojovská, E.; Dehghani, M.; Trojovský, P. Zebra Optimization Algorithm: A New Bio-Inspired Optimization Algorithm for Solving Optimization Algorithm. IEEE Access 2022, 10, 49445–49473. [Google Scholar] [CrossRef] [Scilit]
- Trojovský, P. A New Human-Based Metaheuristic Algorithm for Solving Optimization Problems Based on Preschool Education. Sci. Rep. 2023, 13, 21472. [Google Scholar] [CrossRef] [Scilit]
- Woolson, R.F. Wilcoxon Signed-Rank Test. In Wiley Encyclopedia of Clinical Trials; John Wiley & Sons: Hoboken, NJ, USA, 2008; pp. 1–3. [Google Scholar] [CrossRef] [Scilit]
- Sheldon, M.R.; Fillyaw, M.J.; Thompson, W.D. The Use and Interpretation of the Friedman Test in the Analysis of Ordinal-scale Data in Repeated Measures Designs. Physiother. Res. Int. 1996, 1, 221–228. [Google Scholar]
- Guan, Z.; Wang, H.; Li, Z.; Luo, X.; Yang, X.; Fang, J.; Zhao, Q. Multi-Objective Optimal Scheduling of Microgrids Based on Improved Particle Swarm Algorithm. Energies 2024, 17, 1760. [Google Scholar] [CrossRef] [Scilit]
- Suresh, V.; Janik, P.; Jasinski, M.; Guerrero, J.M.; Leonowicz, Z. Microgrid Energy Management Using Metaheuristic Optimization Algorithms. Appl. Soft Comput. 2023, 134, 109981. [Google Scholar]
- Kharrich, M.; Abualigah, L.; Kamel, S.; AbdEl-Sattar, H.; Tostado-Véliz, M. An Improved Arithmetic Optimization Algorithm for Design of a Microgrid with Energy Storage System: Case Study of El Kharga Oasis, Egypt. J. Energy Storage 2022, 51, 104343. [Google Scholar] [CrossRef] [Scilit]
- Cao, L.; Wei, Q. SZOA: An Improved Synergistic Zebra Optimization Algorithm for Microgrid Scheduling and Management. Biomimetics 2025, 10, 664. [Google Scholar] [CrossRef] [Scilit]
- Ke, Y.; Zhuo, C.; Zhao, X. Research on Microgrid Dispatch Management Method Based on Improved Enterprise Development Optimization Algorithm. Symmetry 2026, 18, 601. [Google Scholar] [CrossRef] [Scilit]
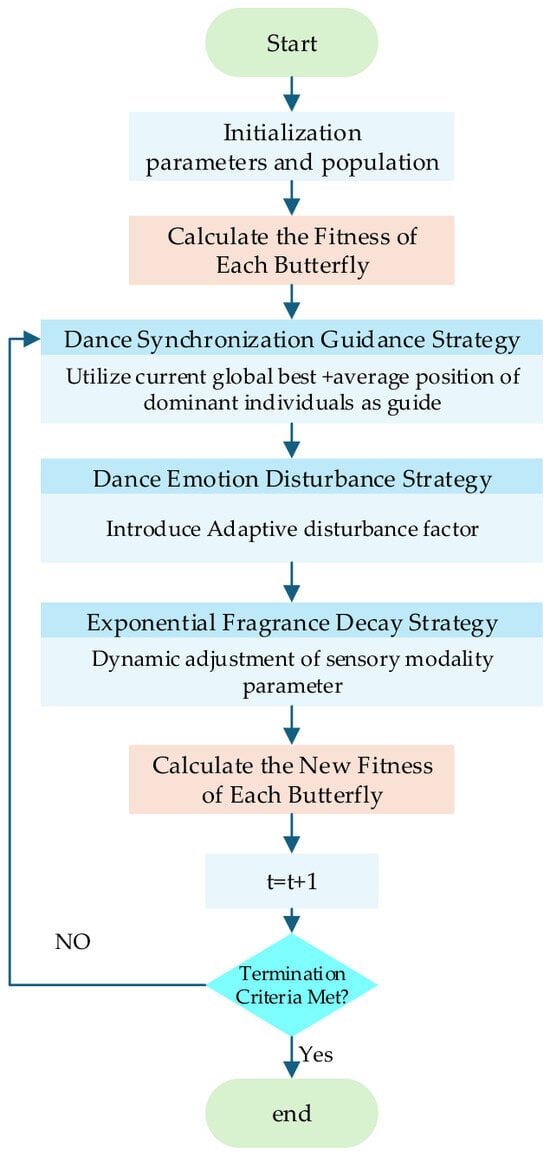
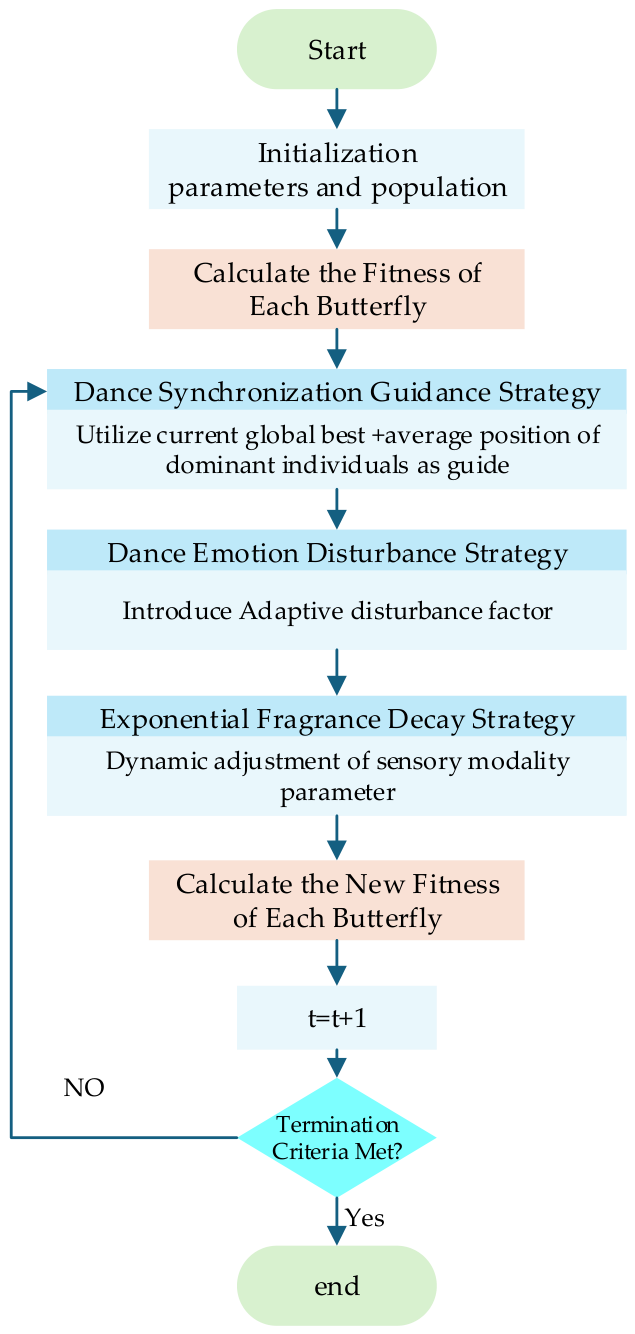
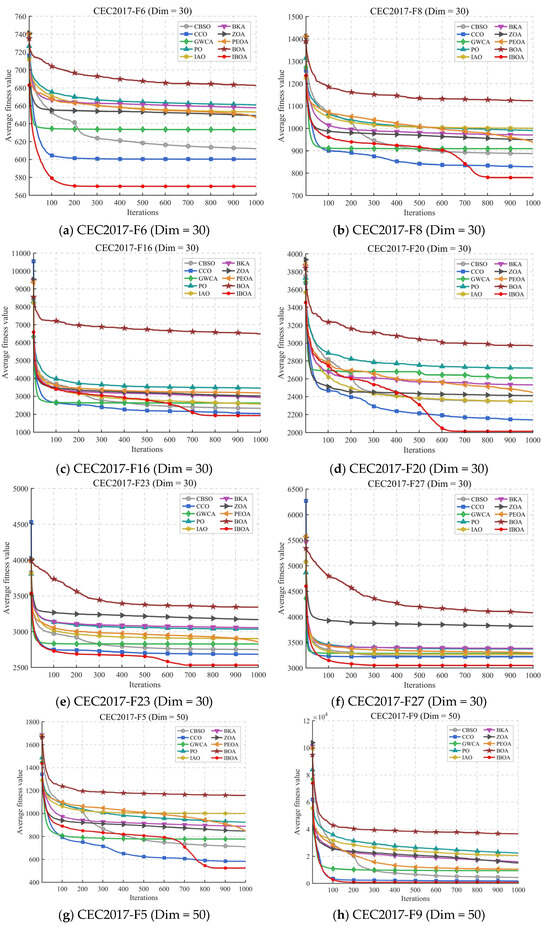
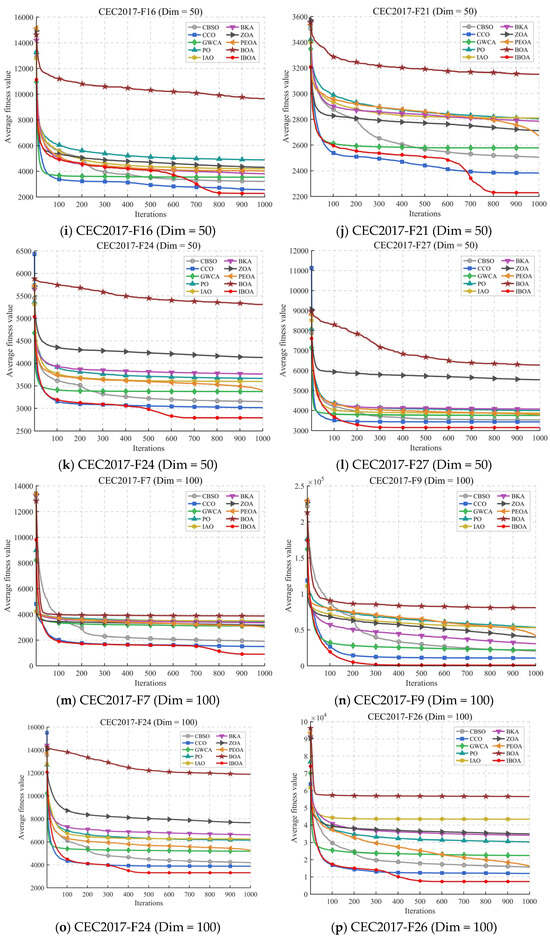
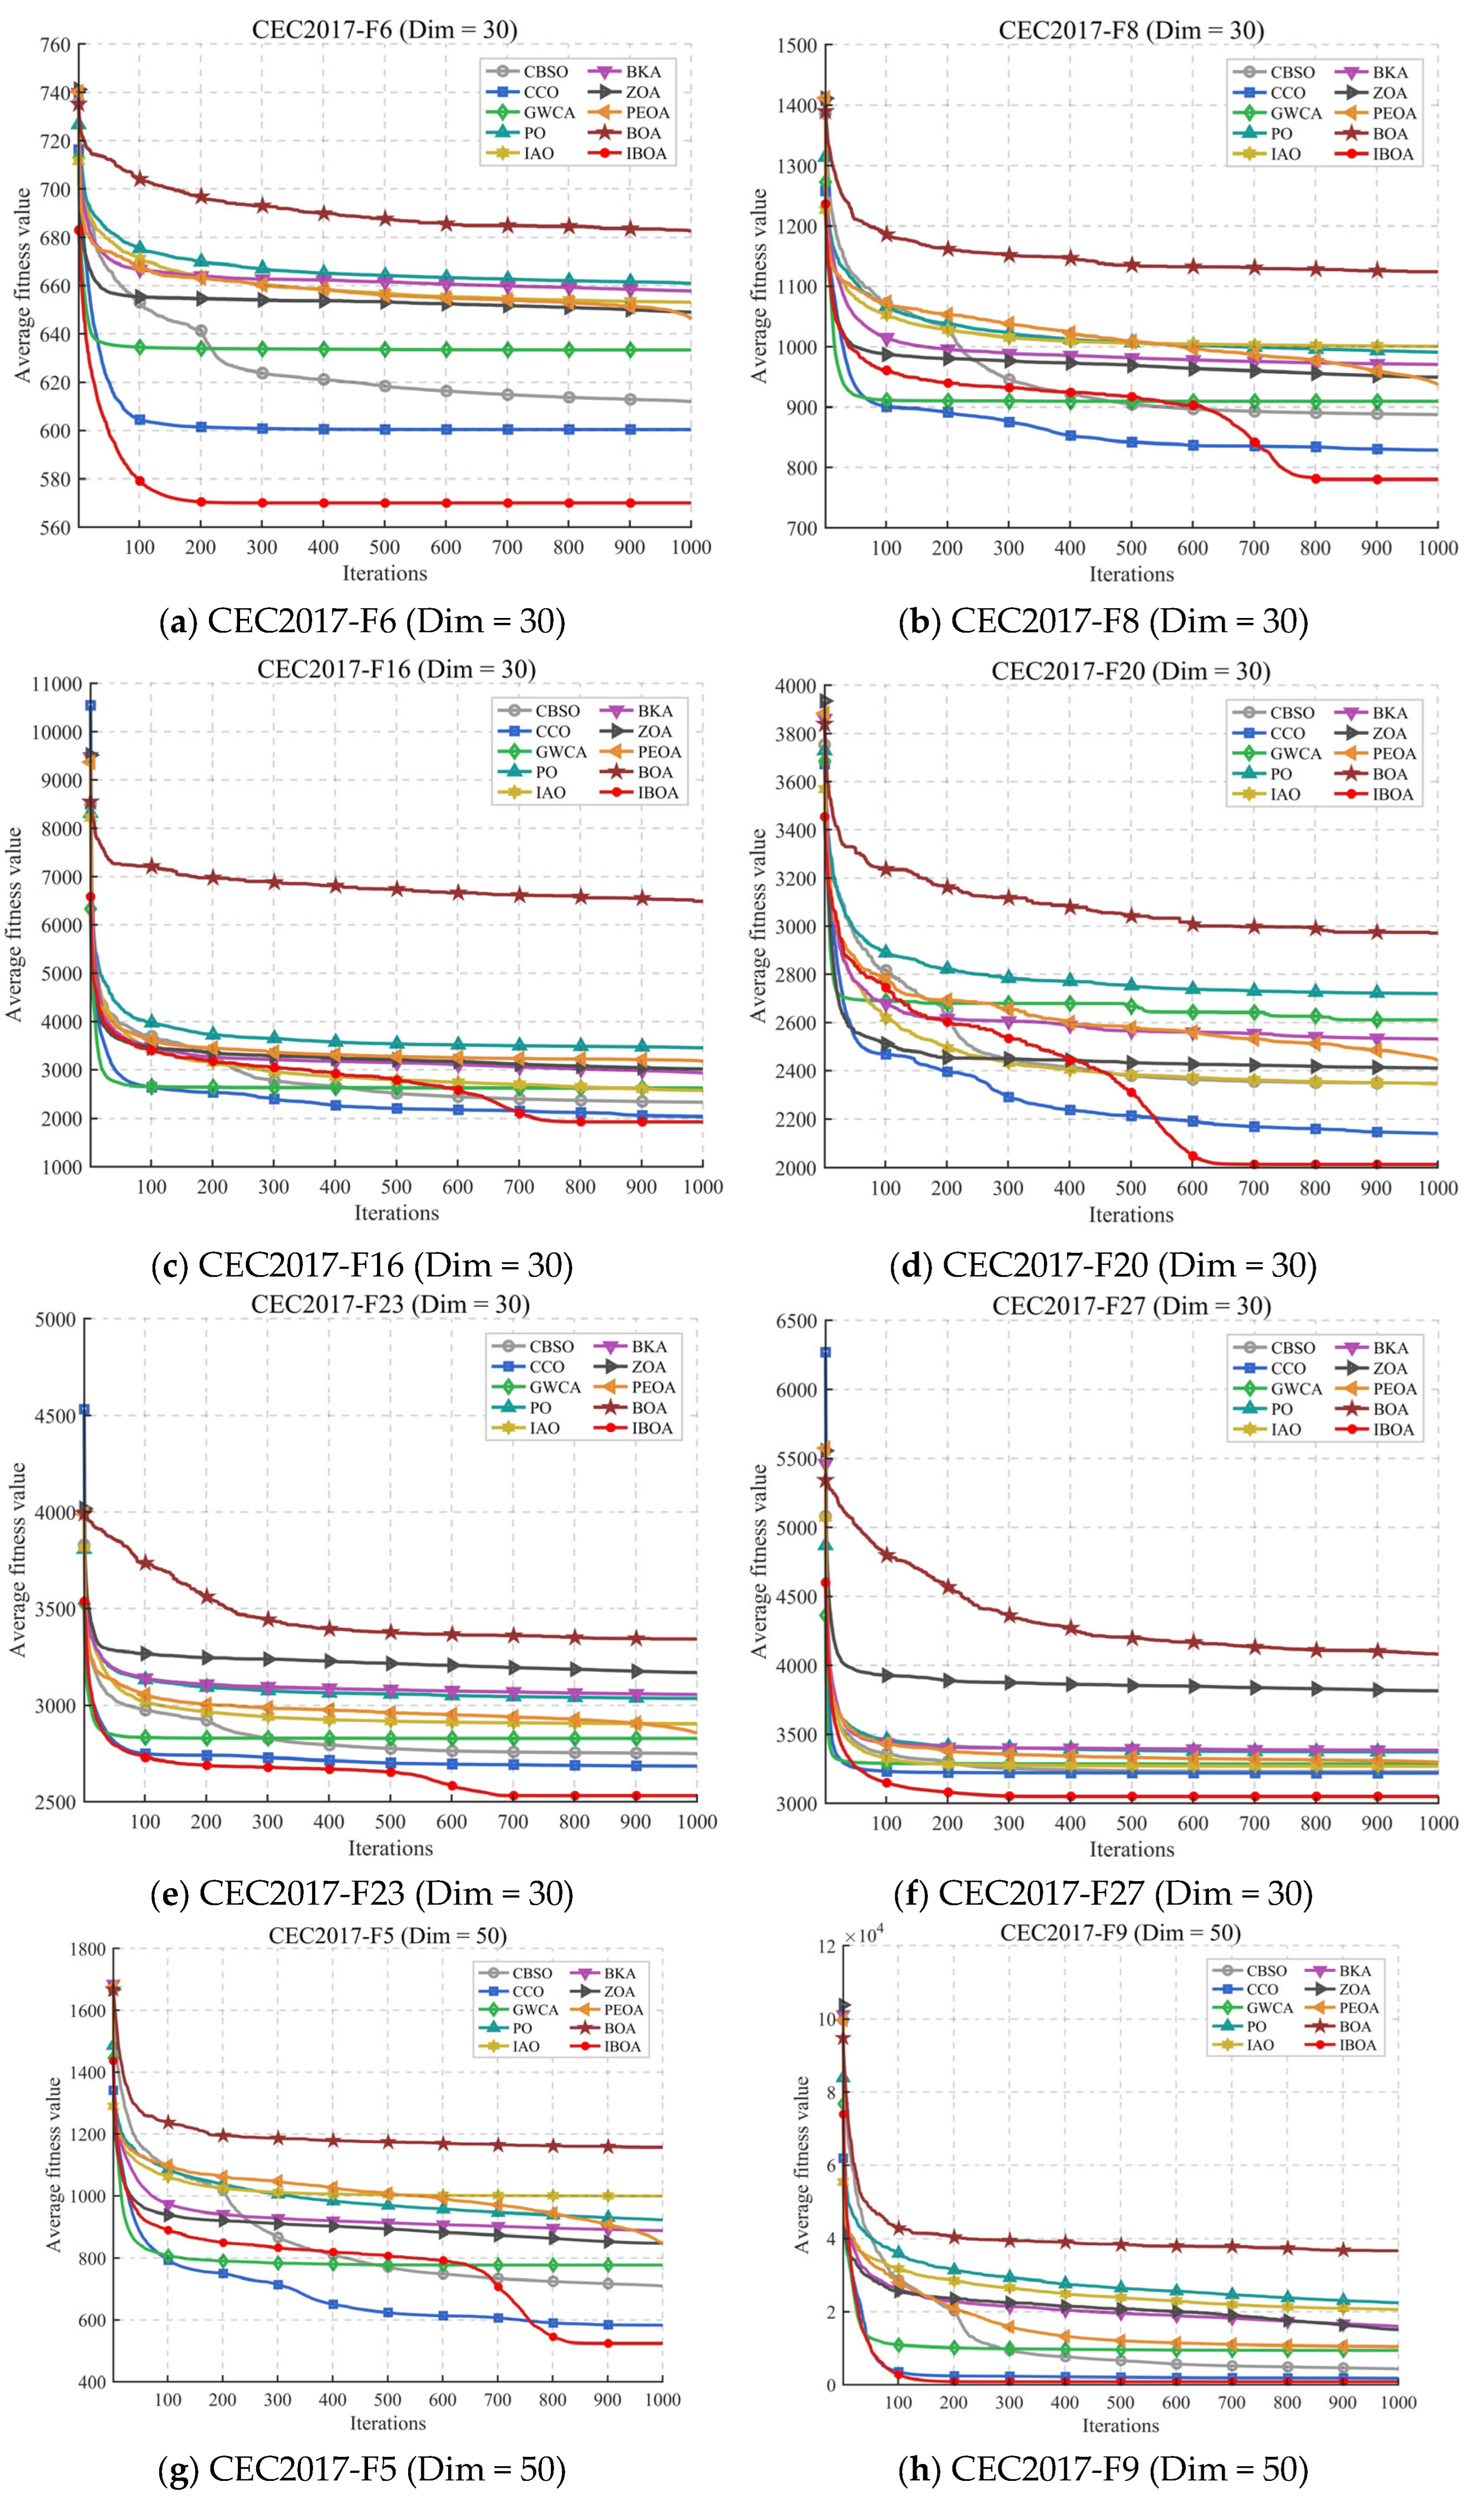
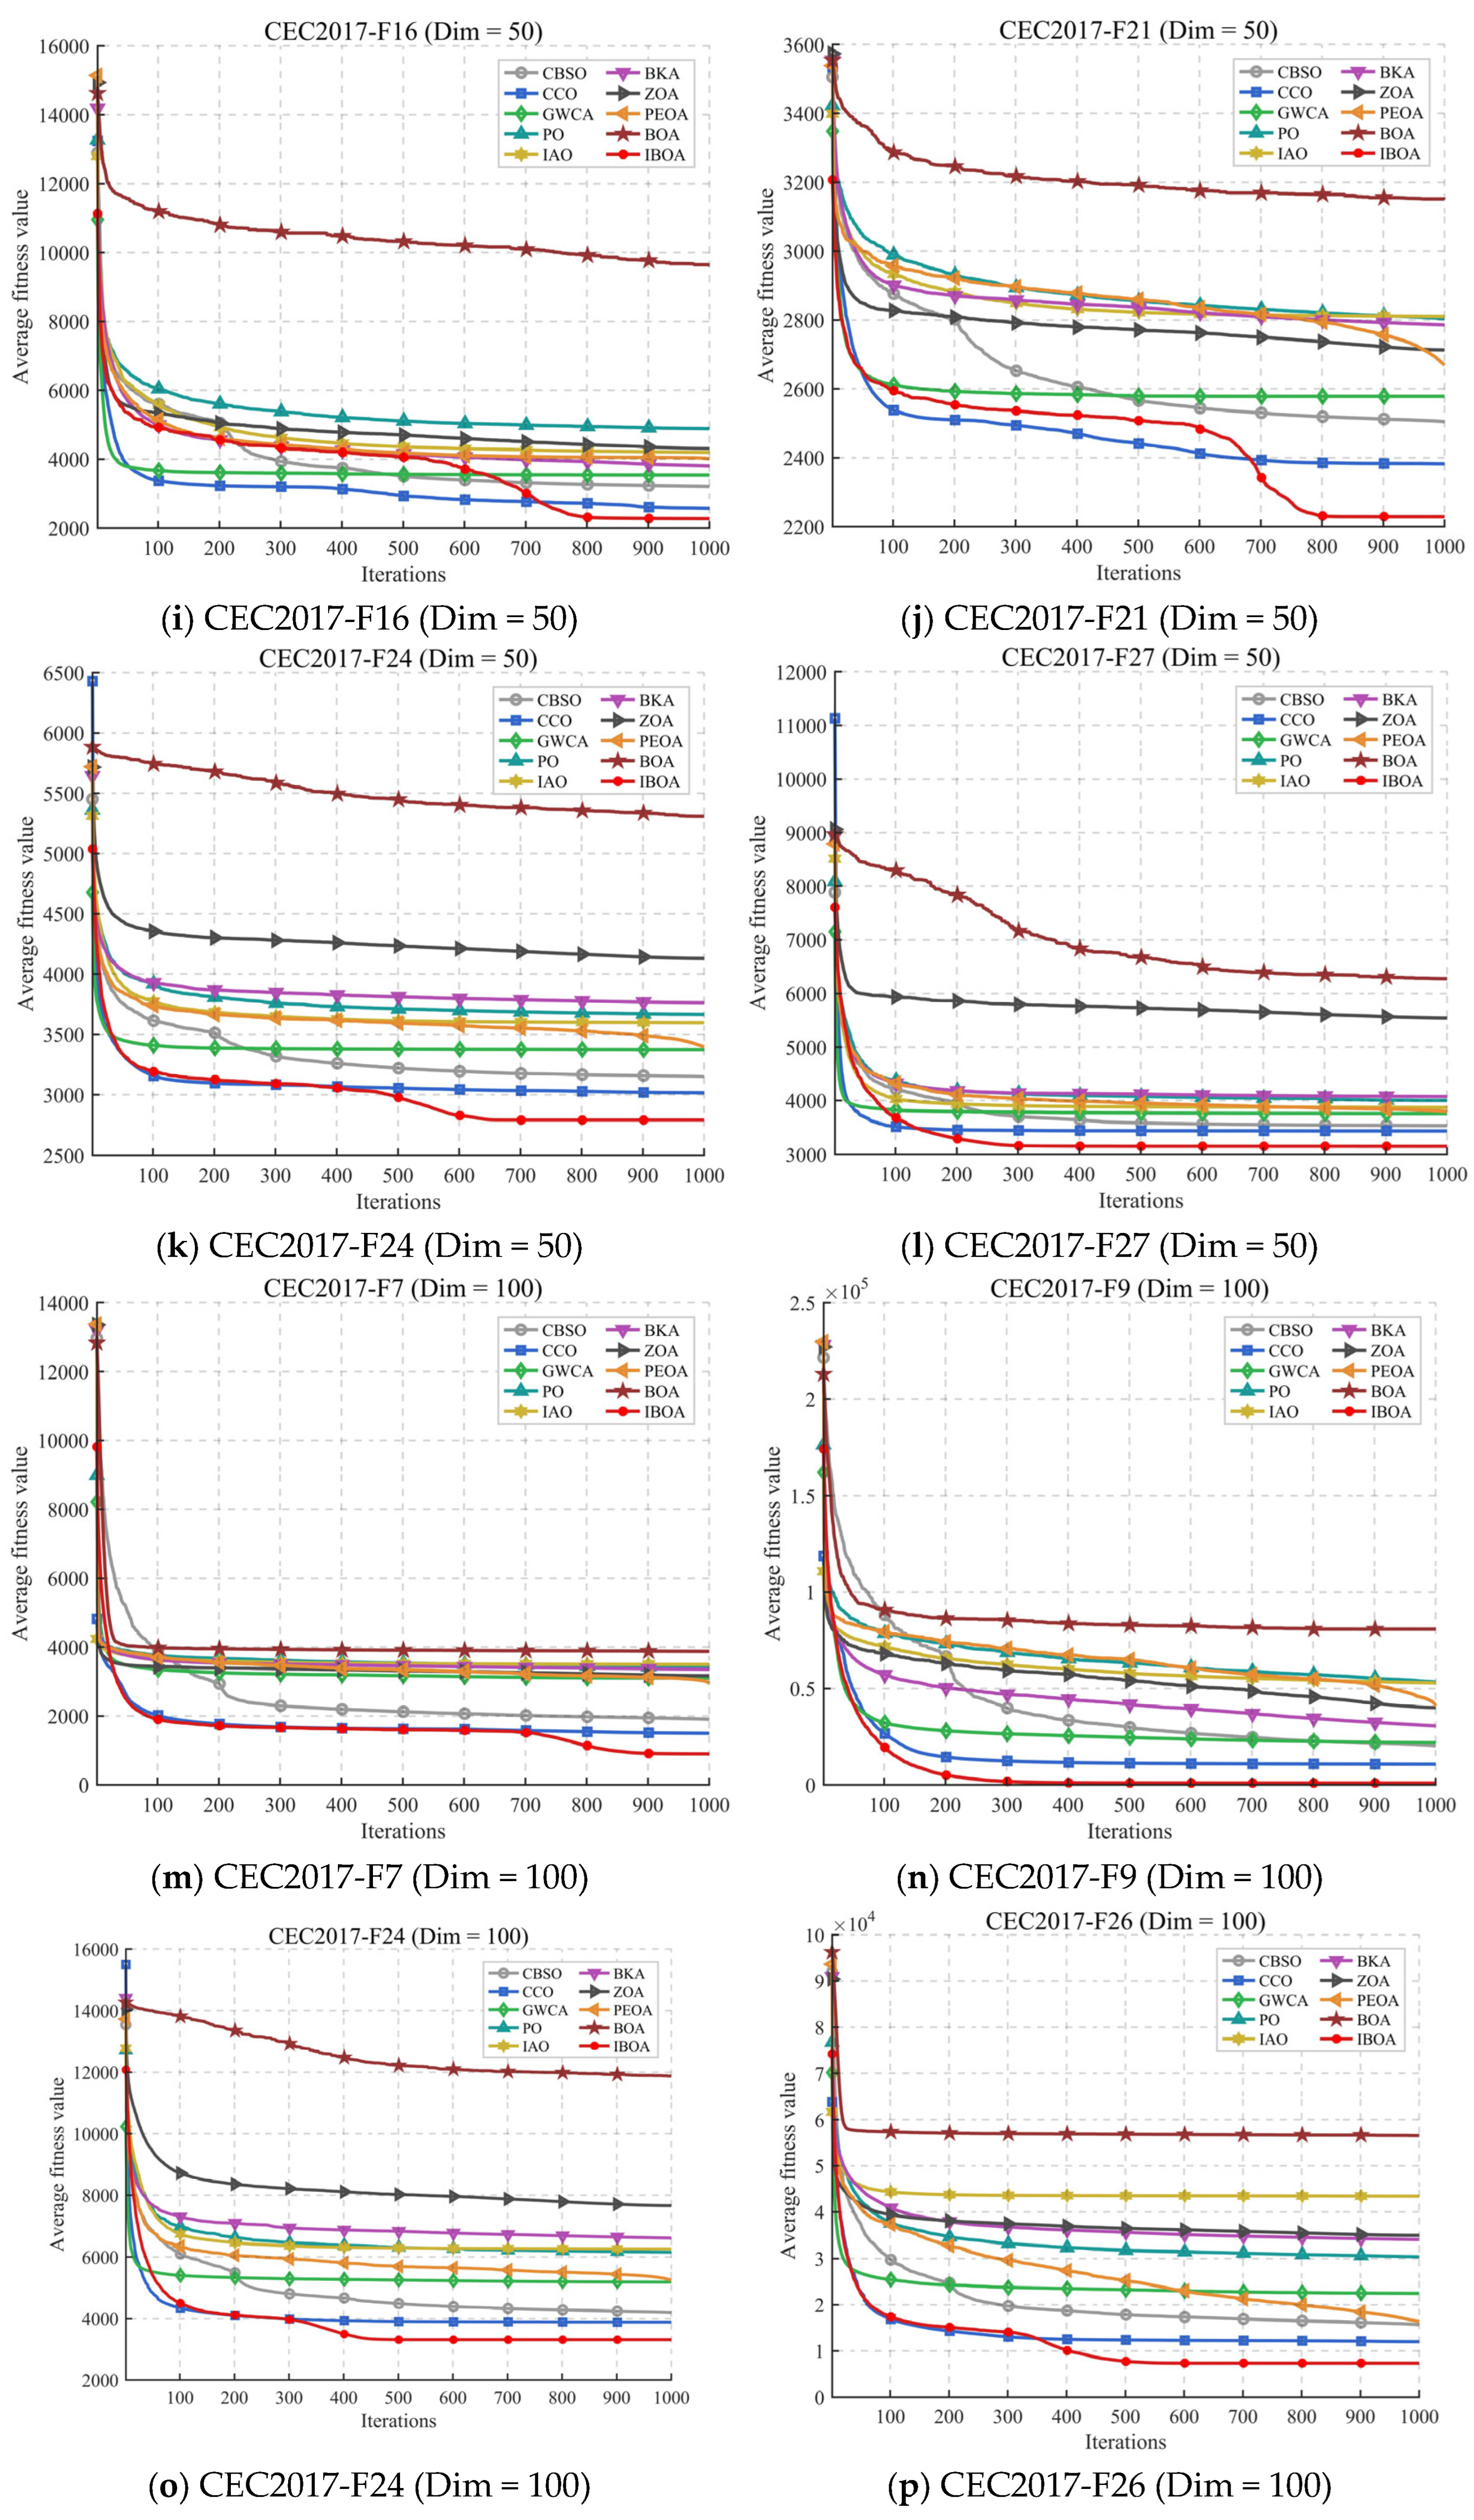
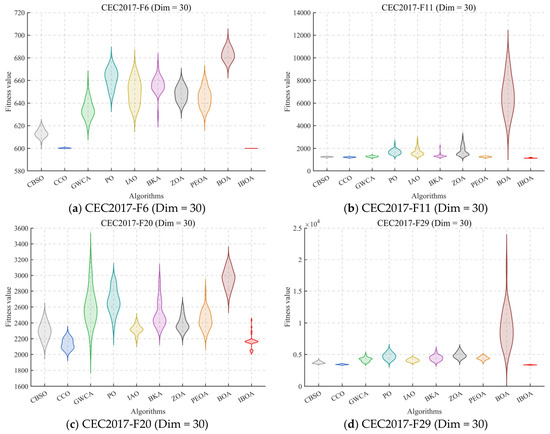
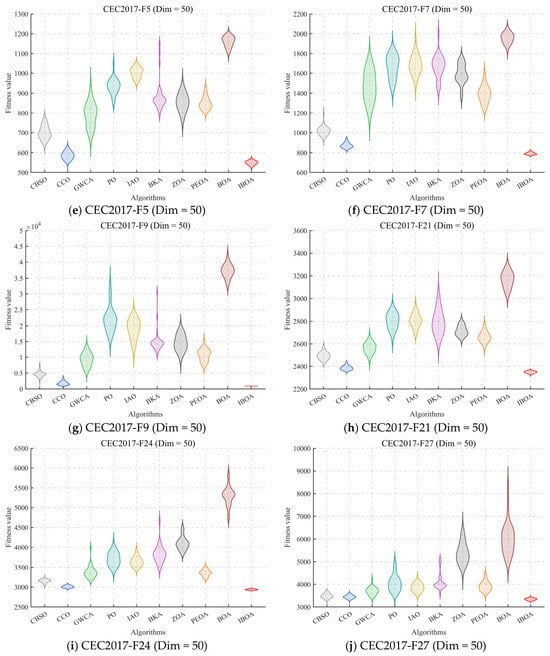
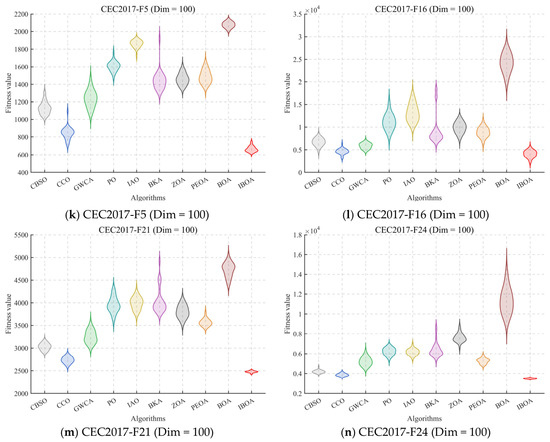
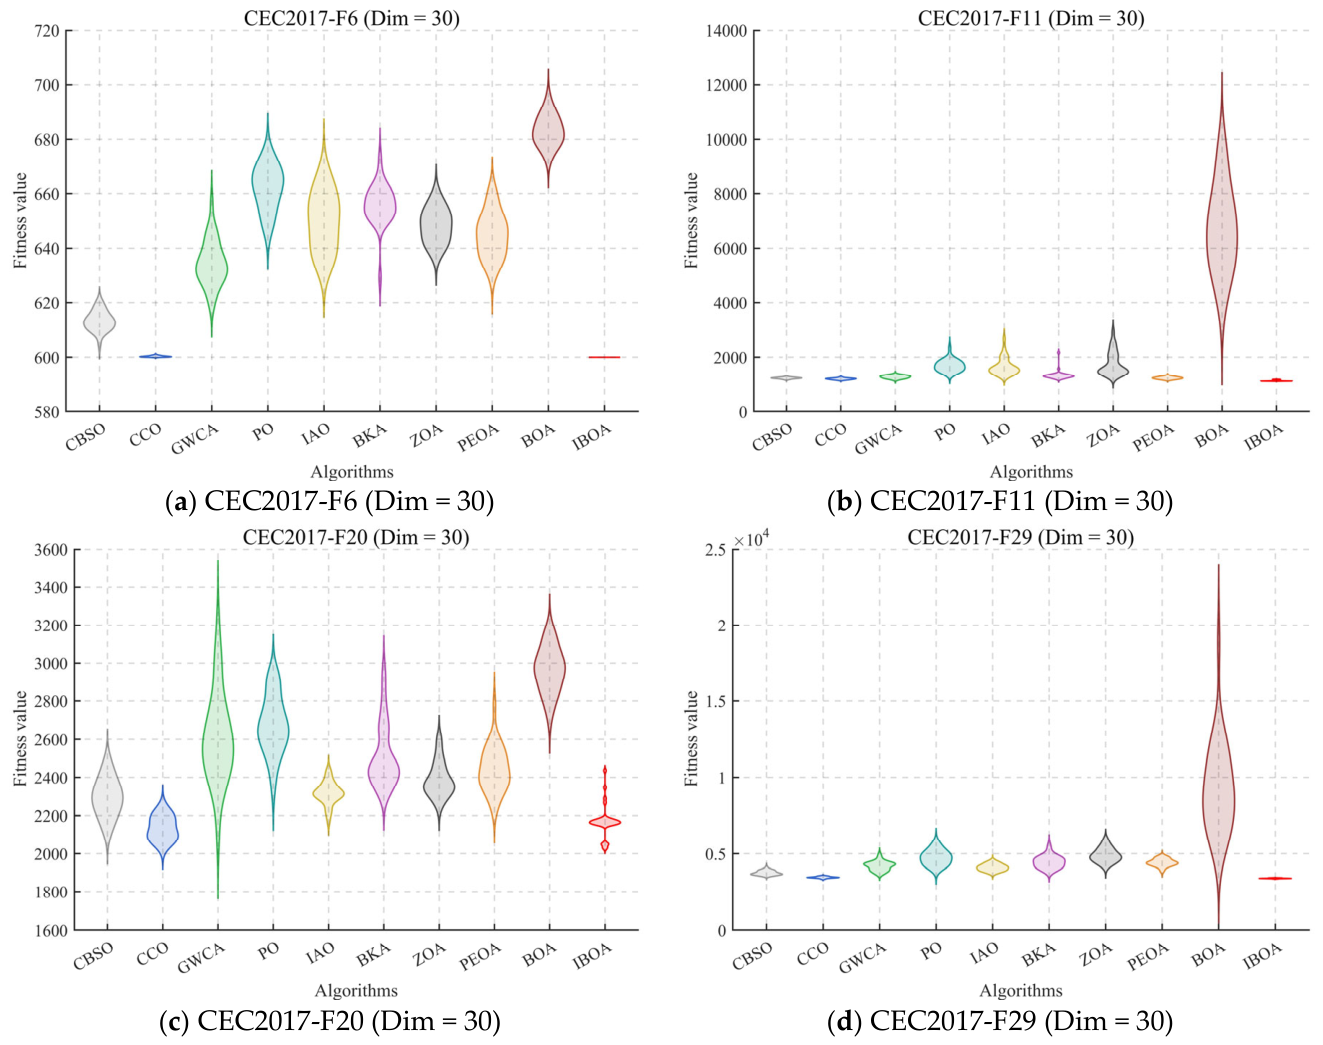
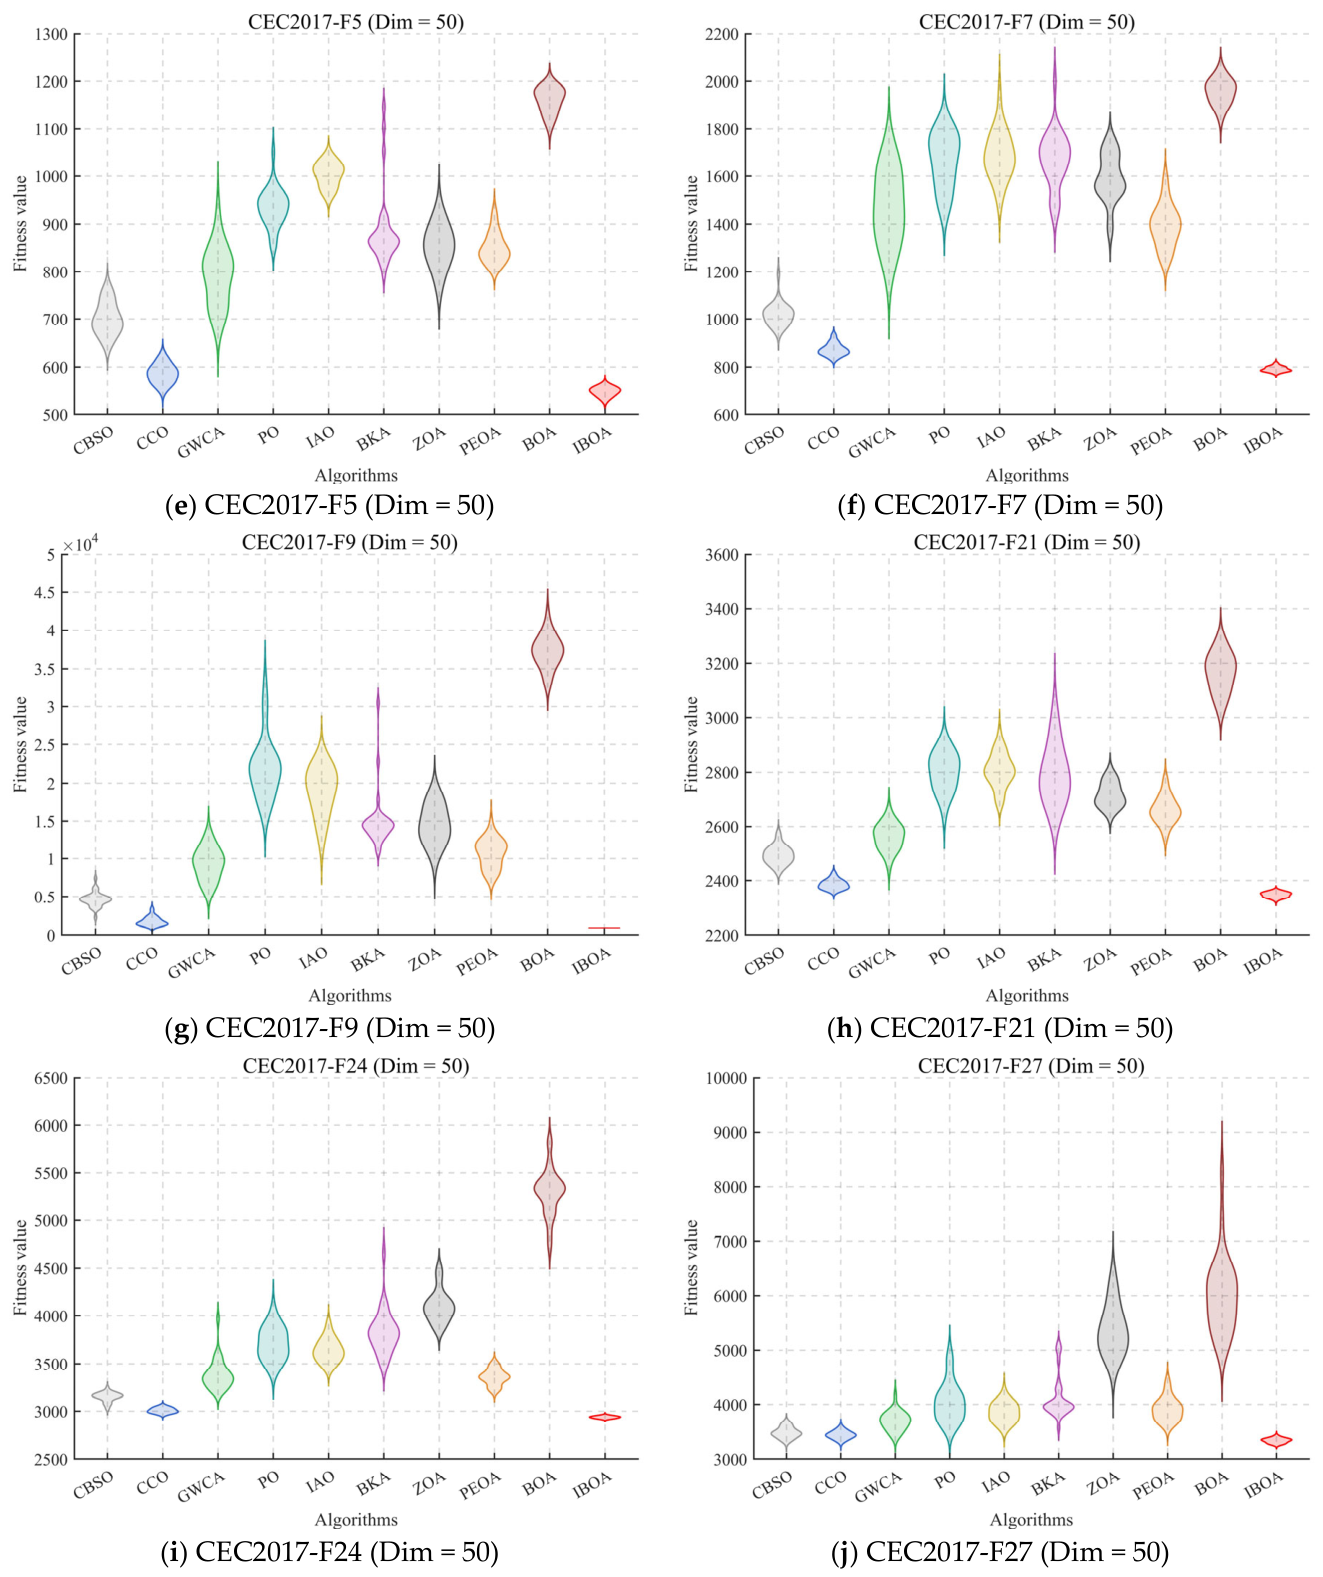
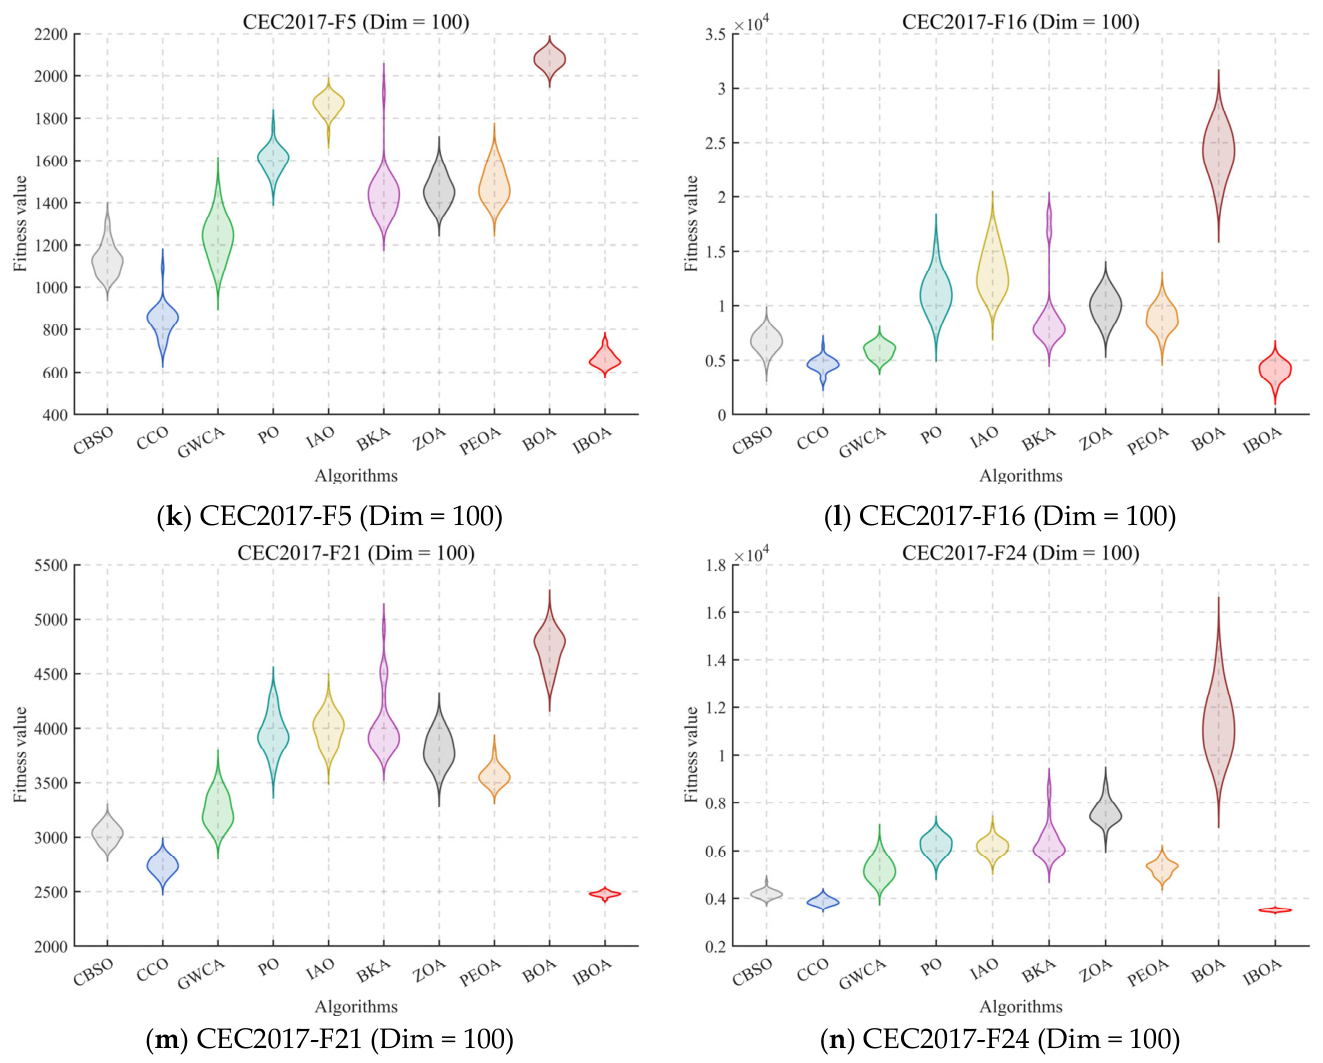
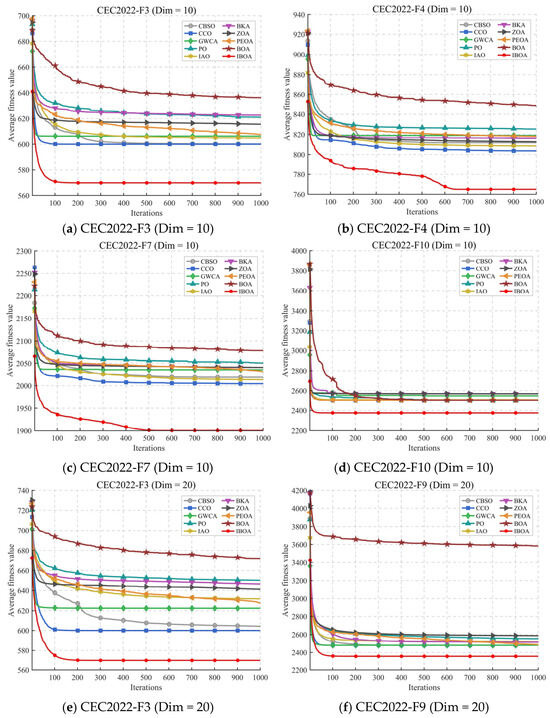
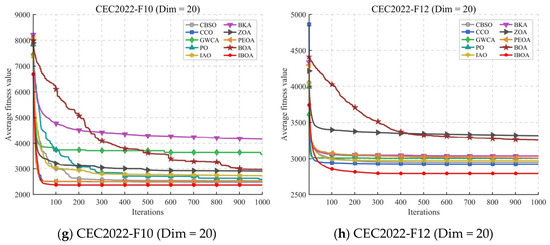
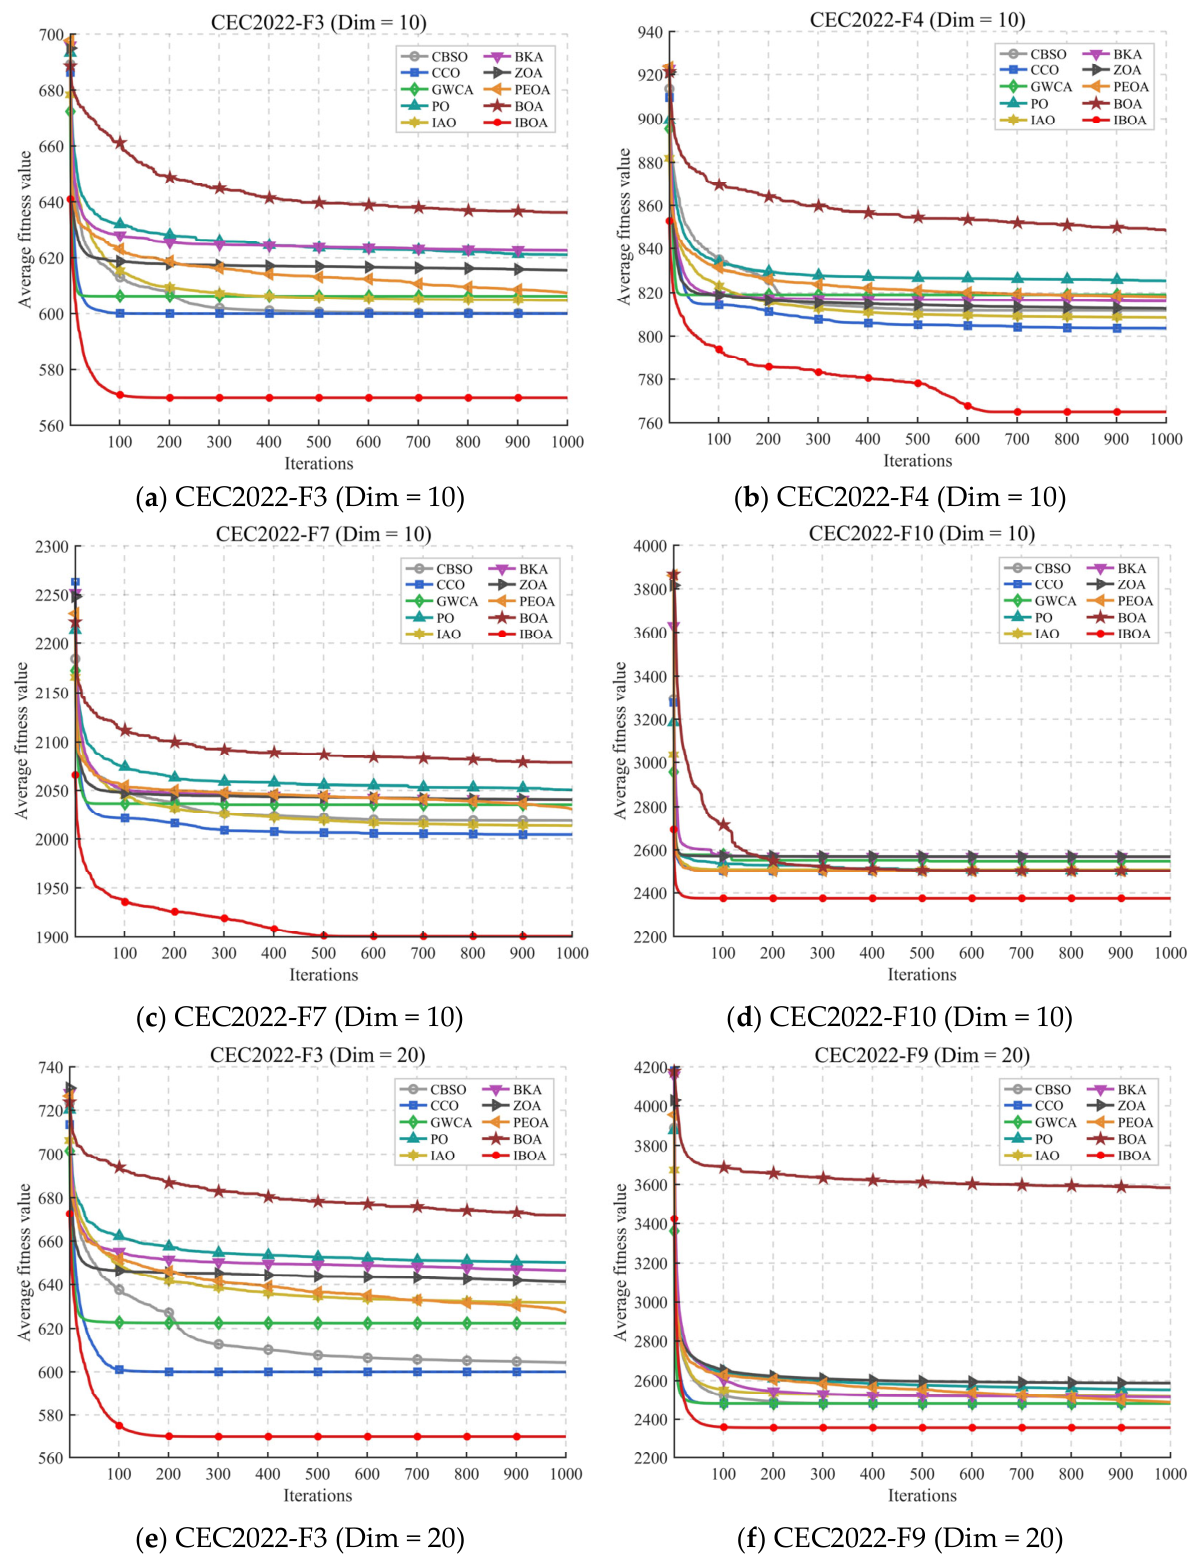
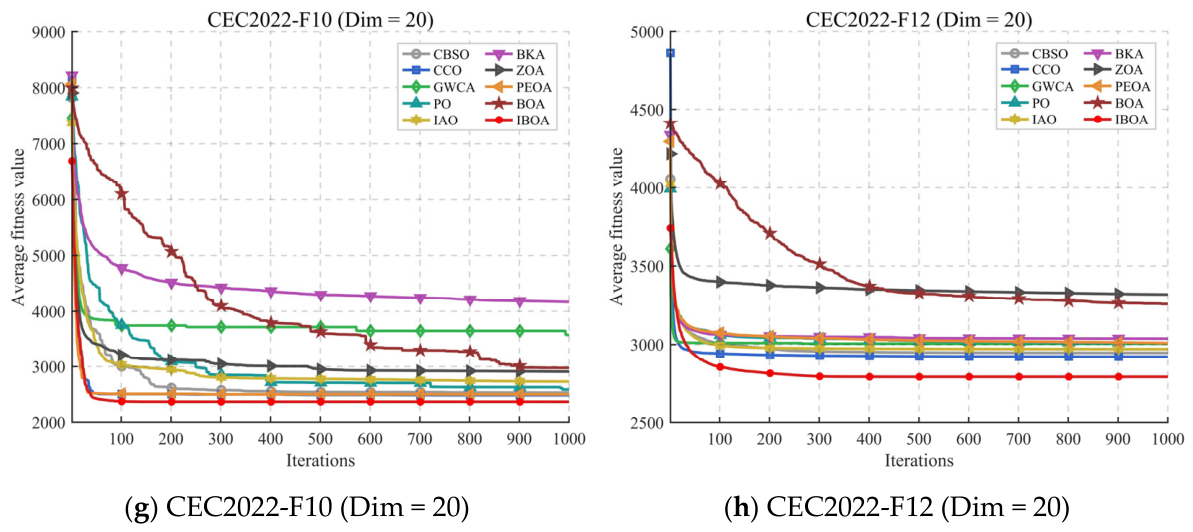
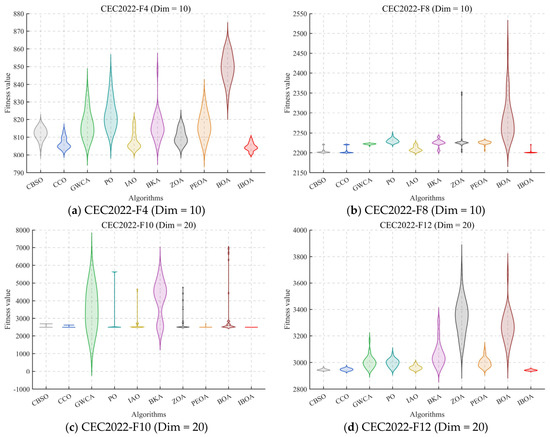
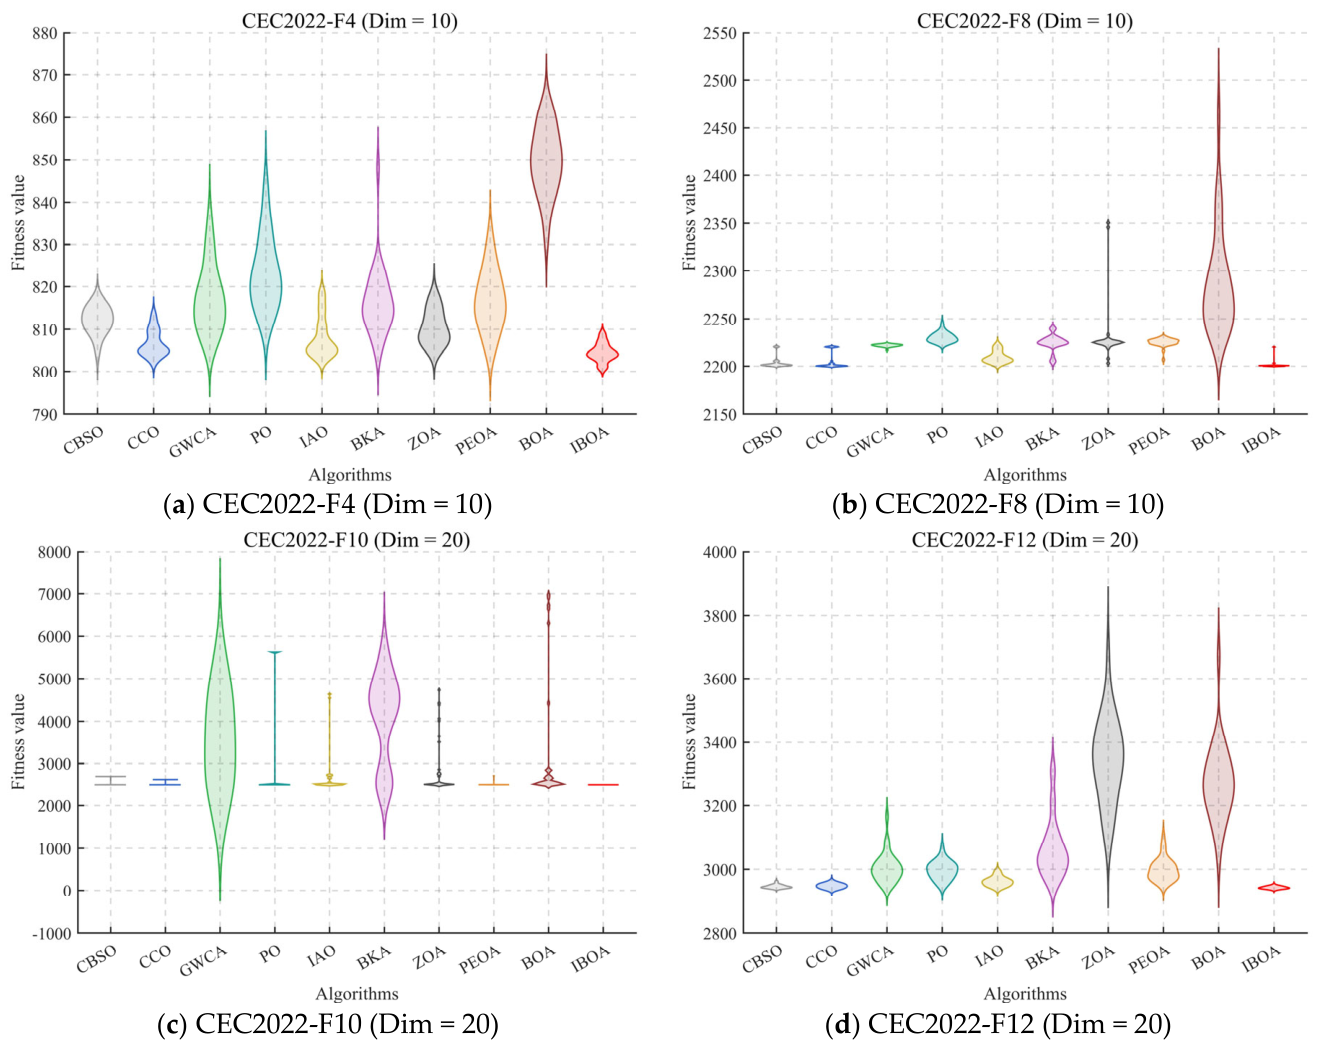
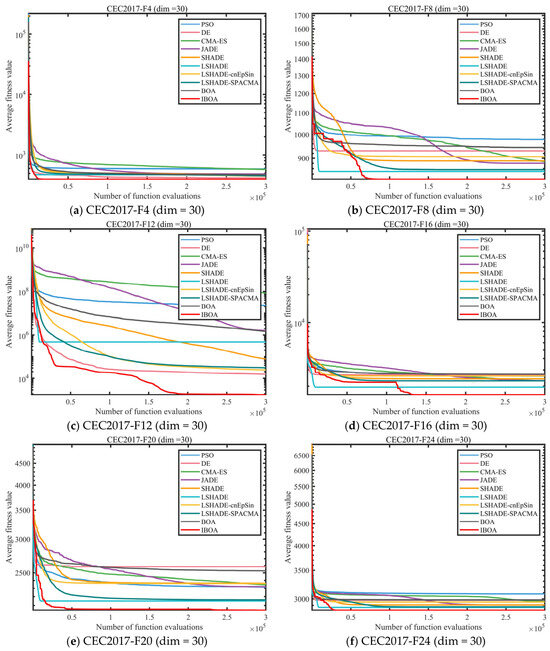
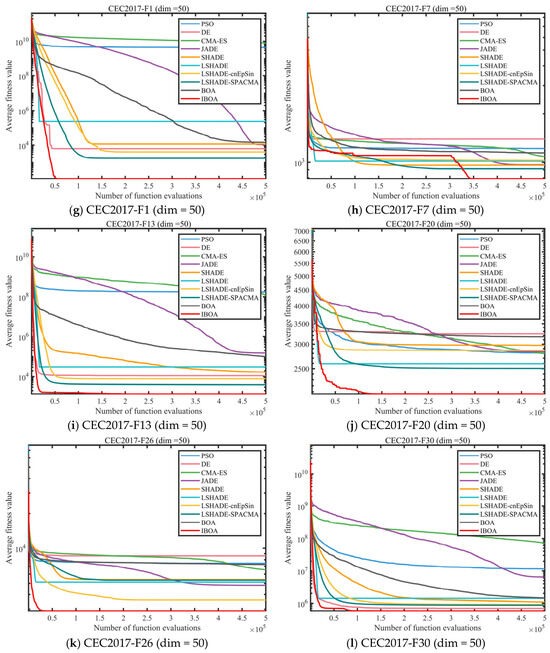
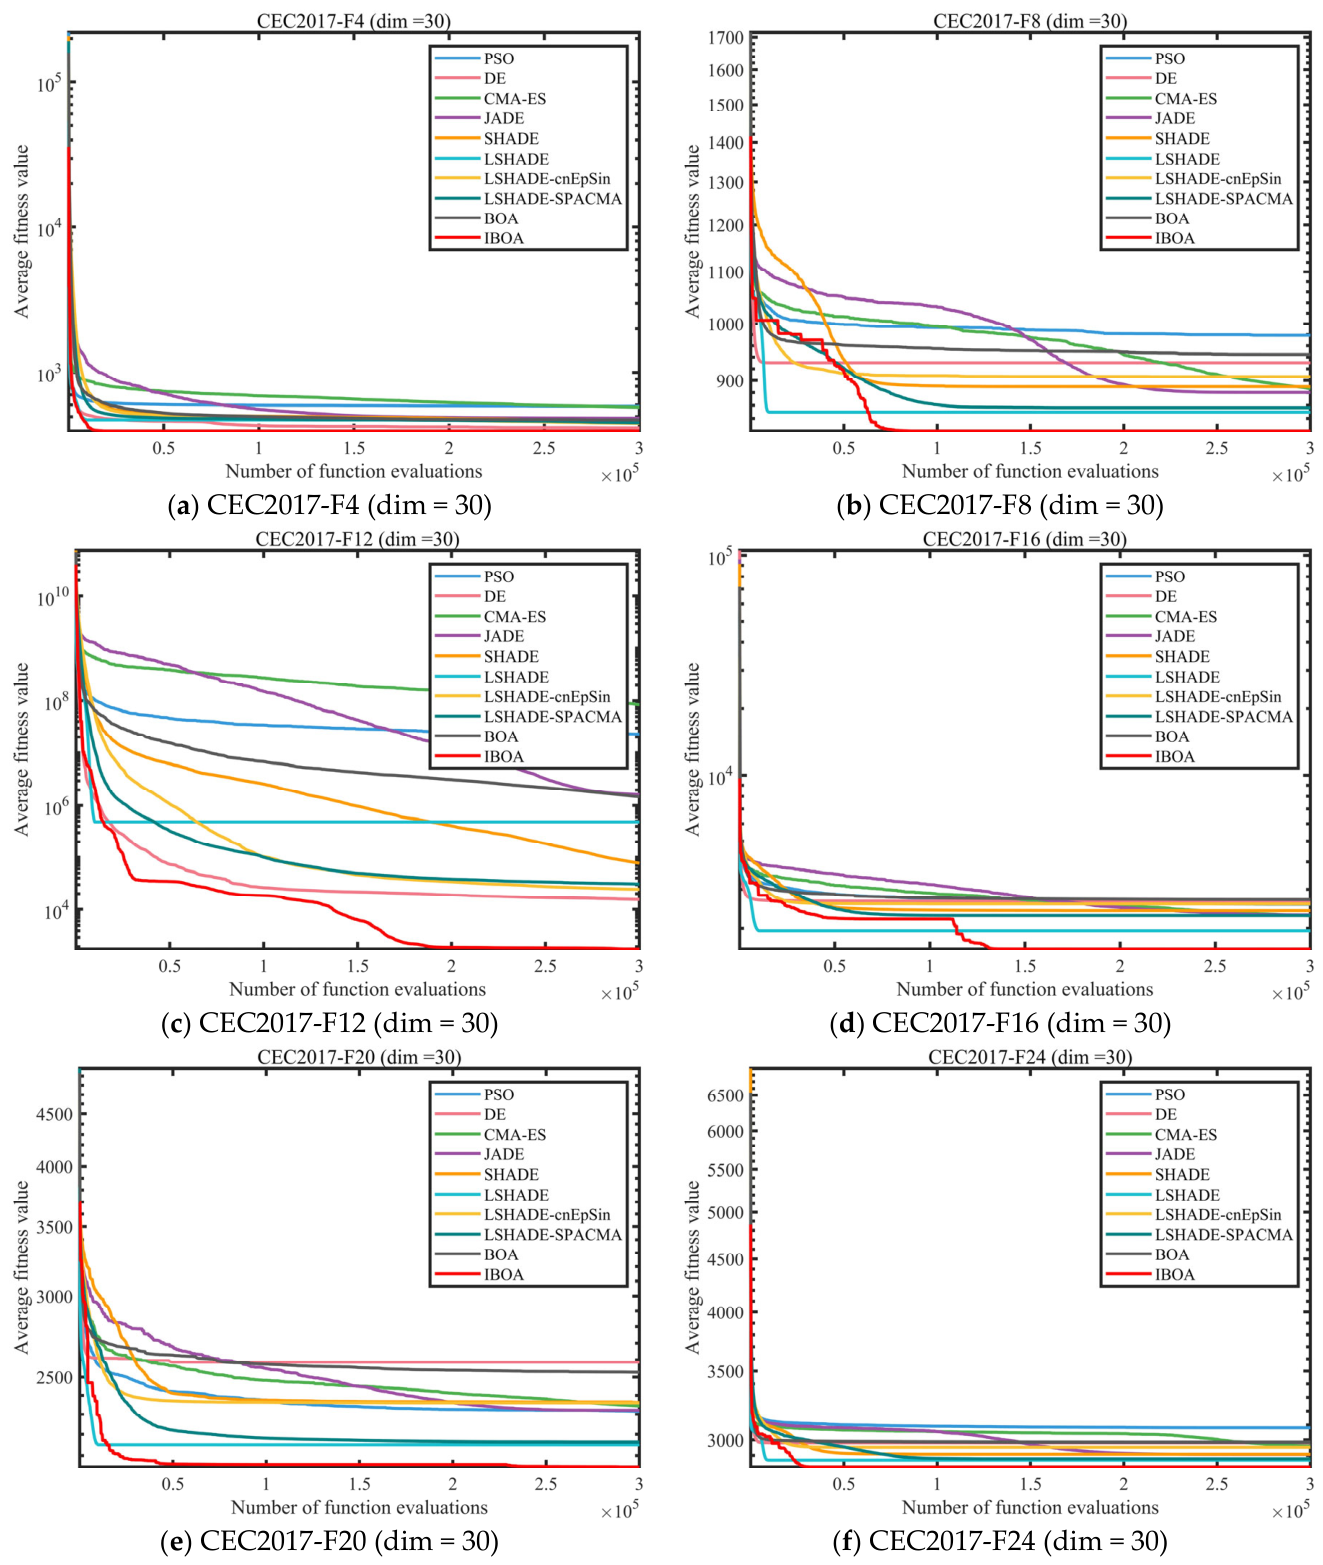
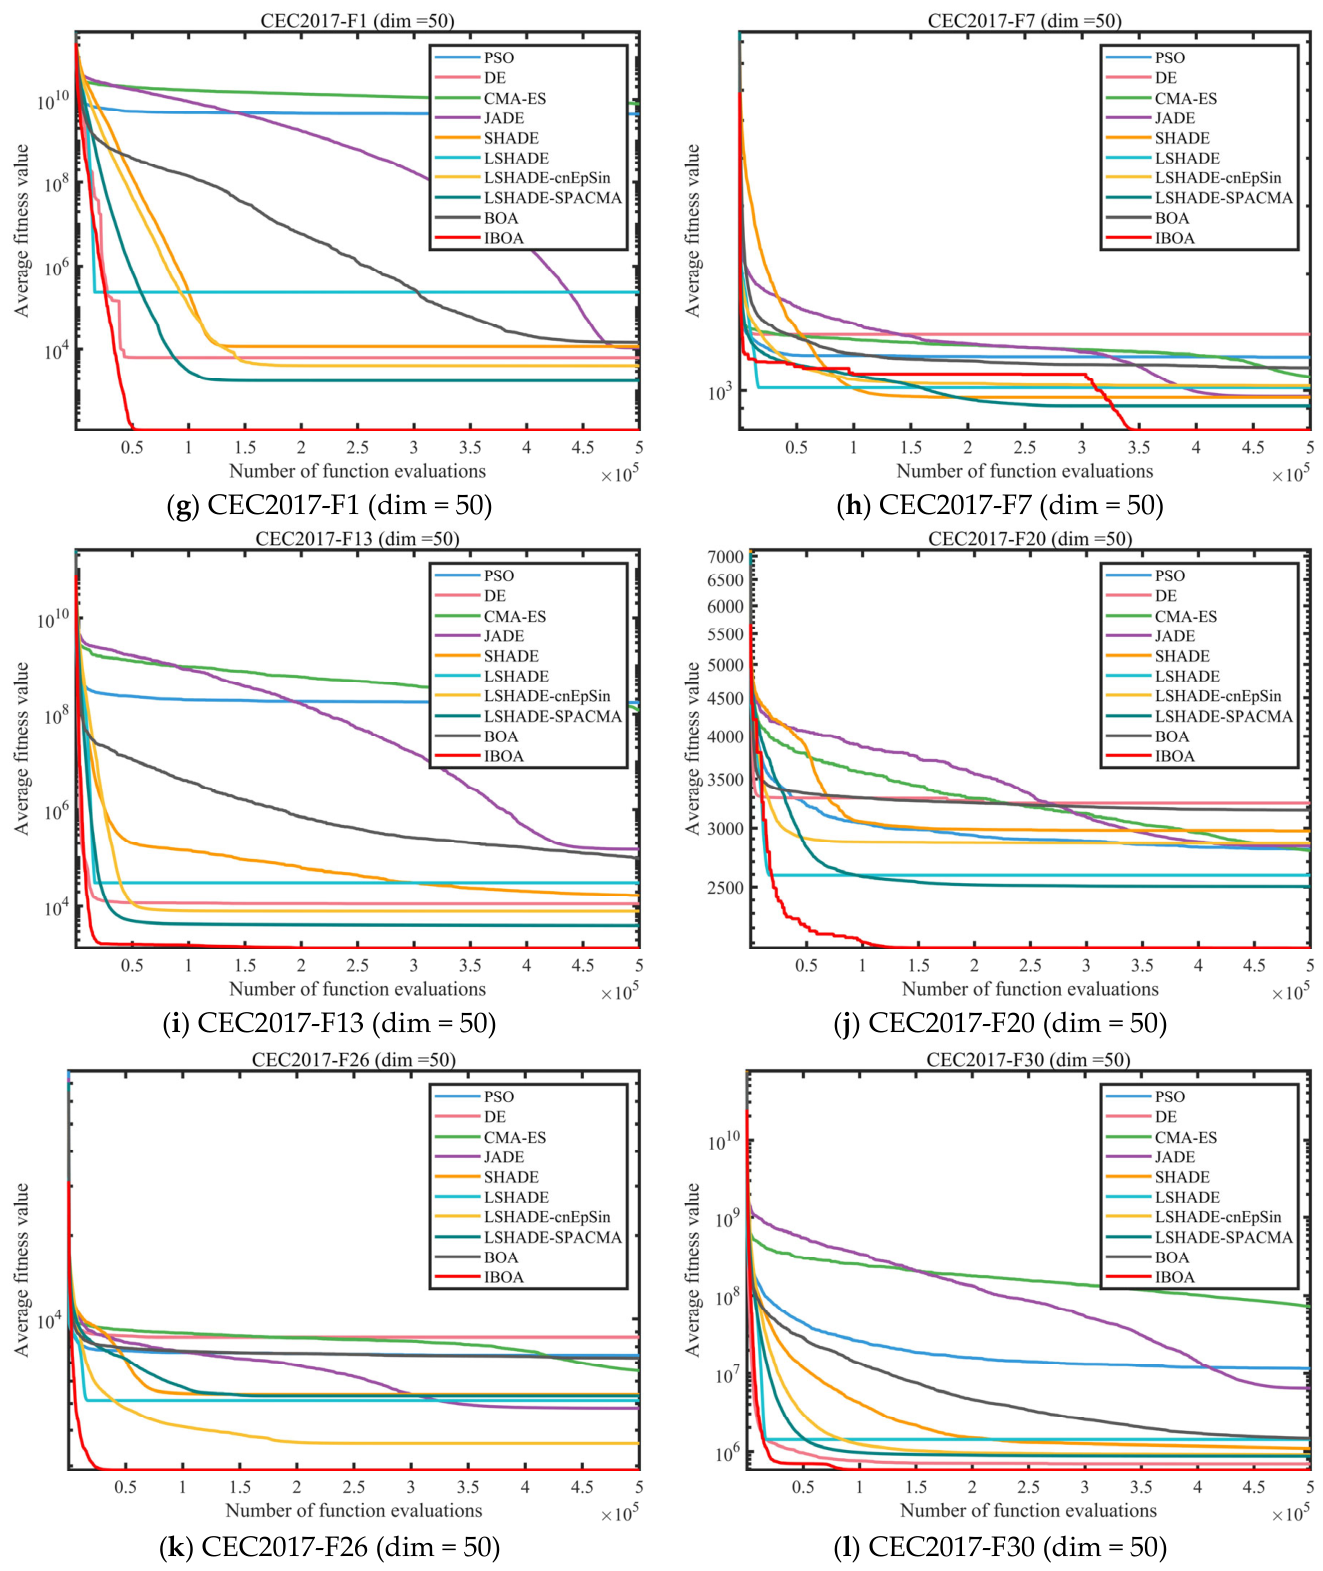
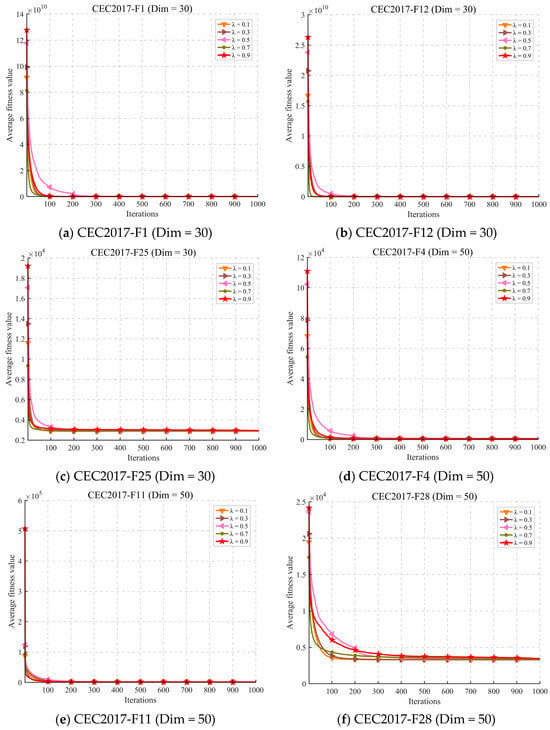
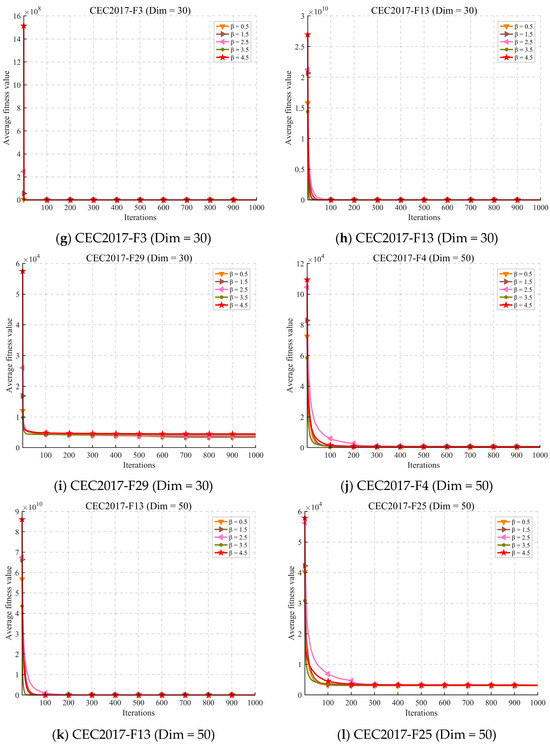
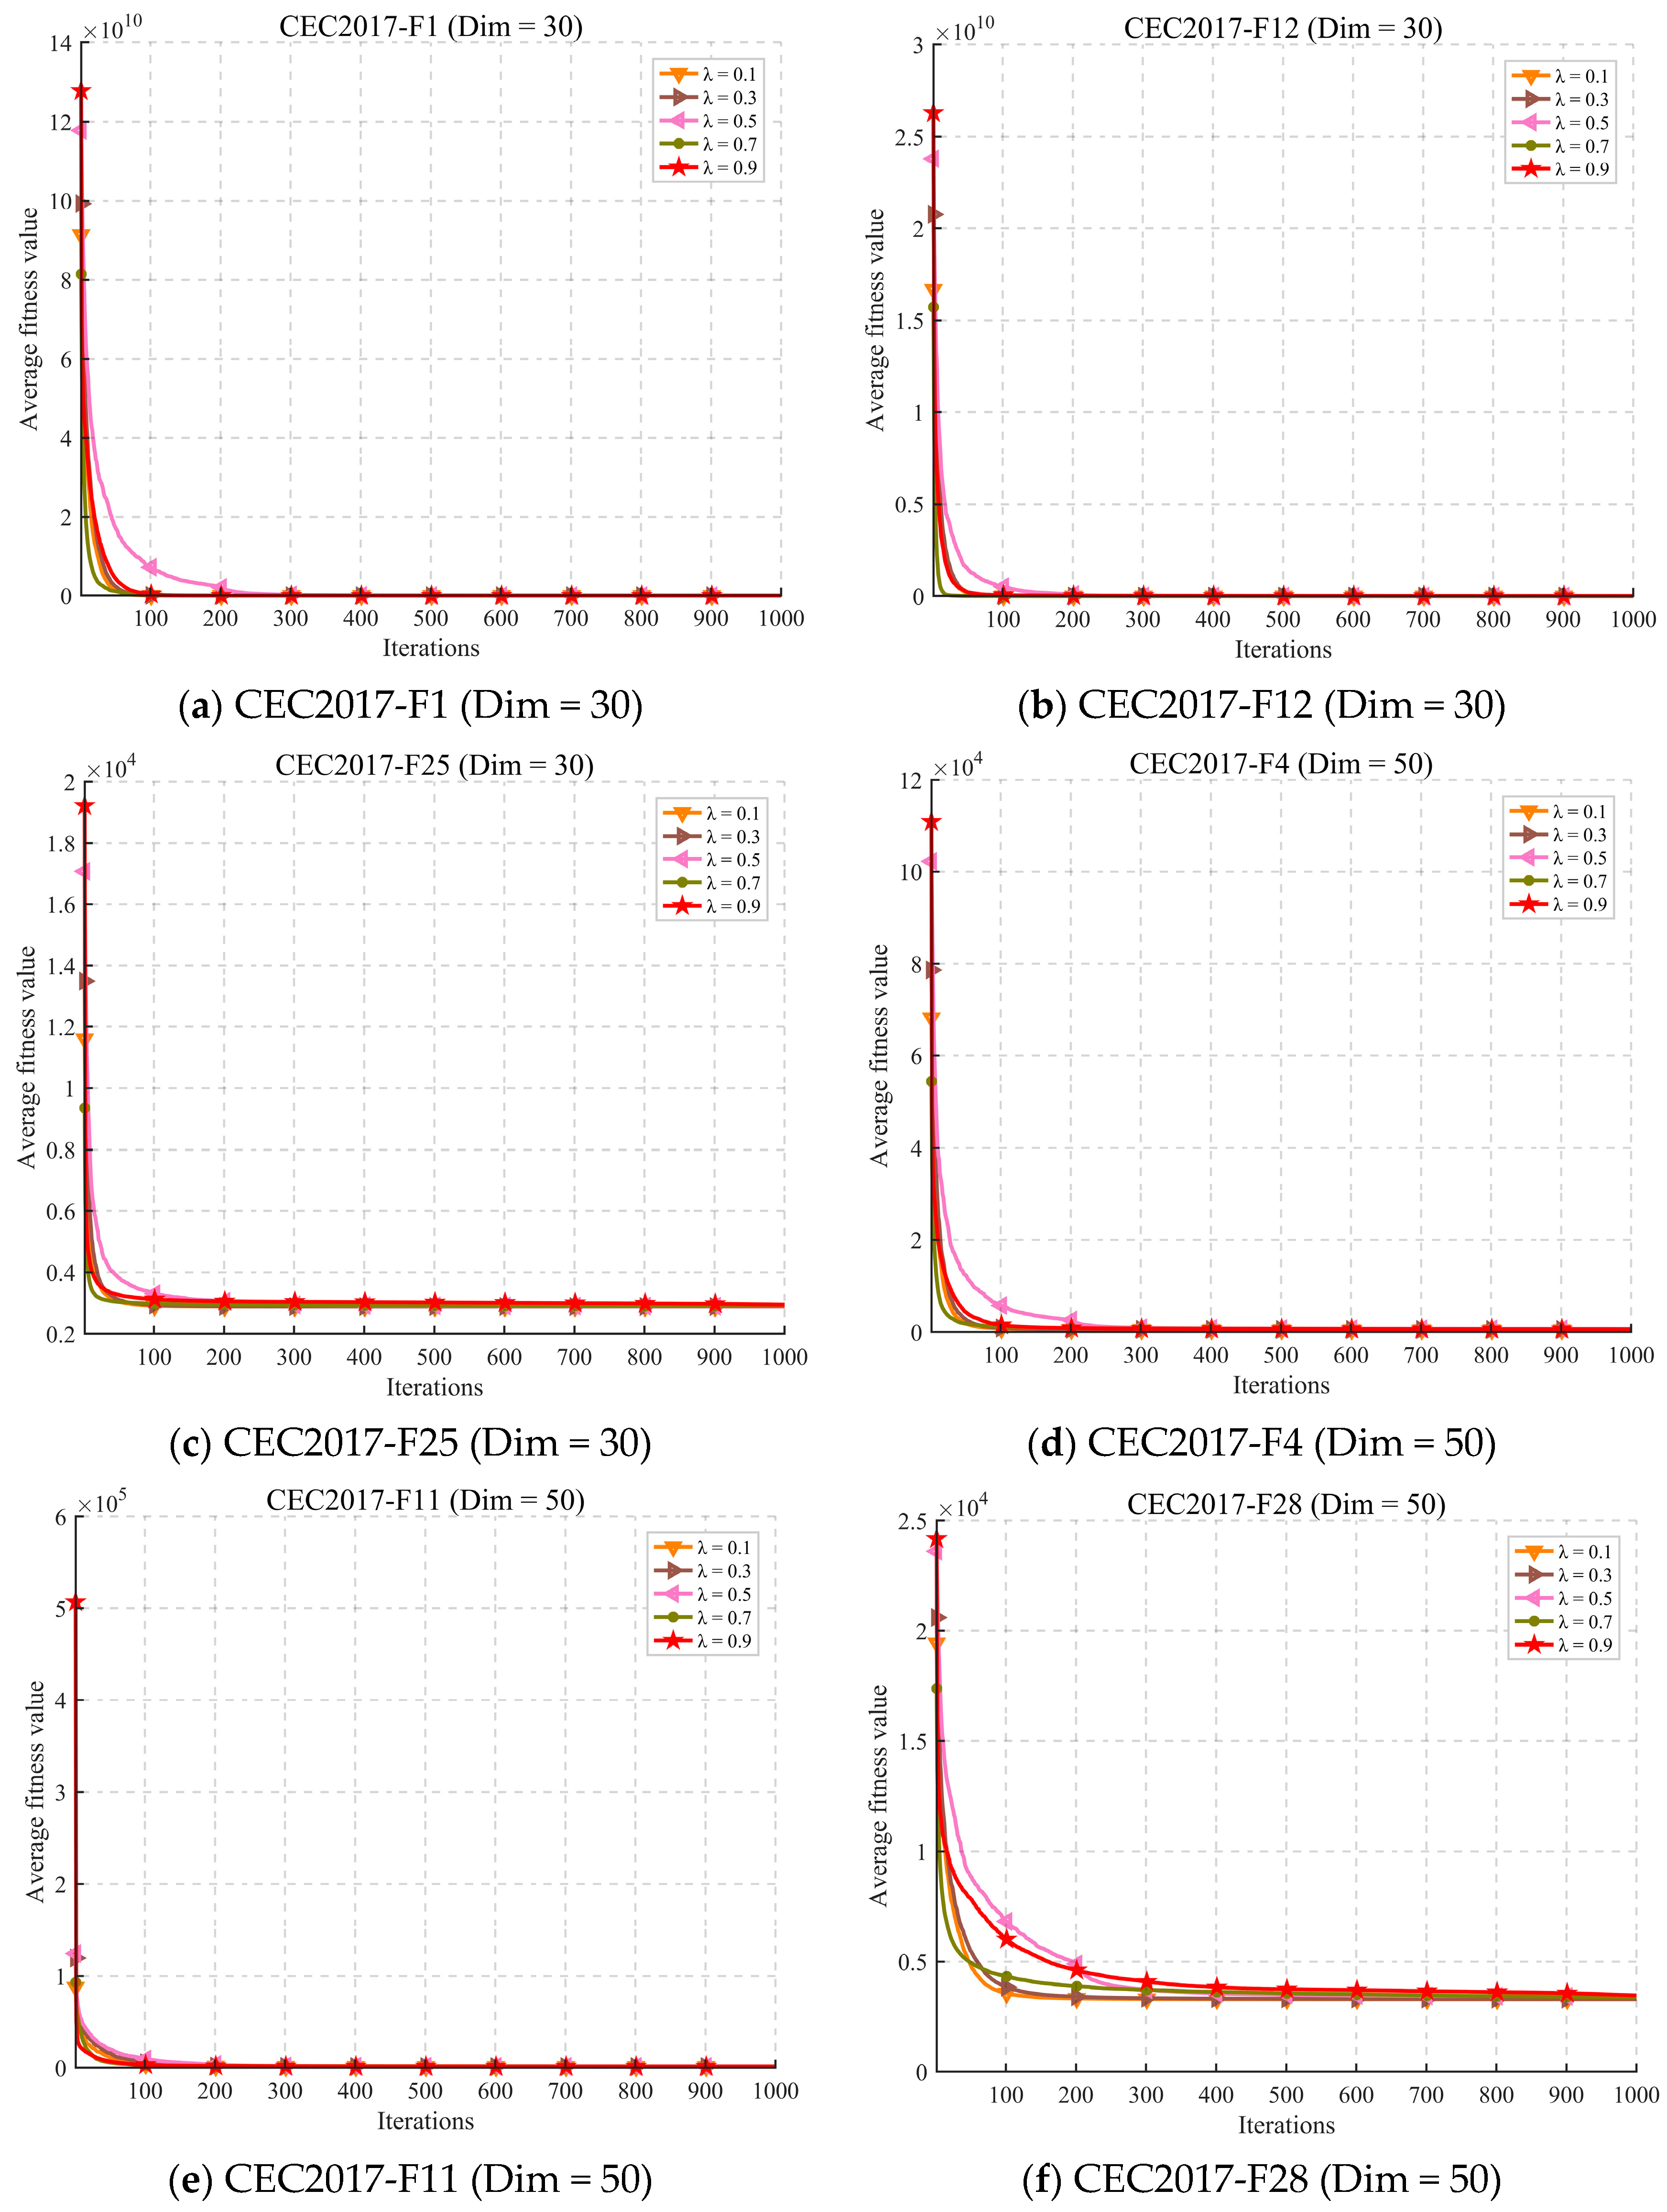
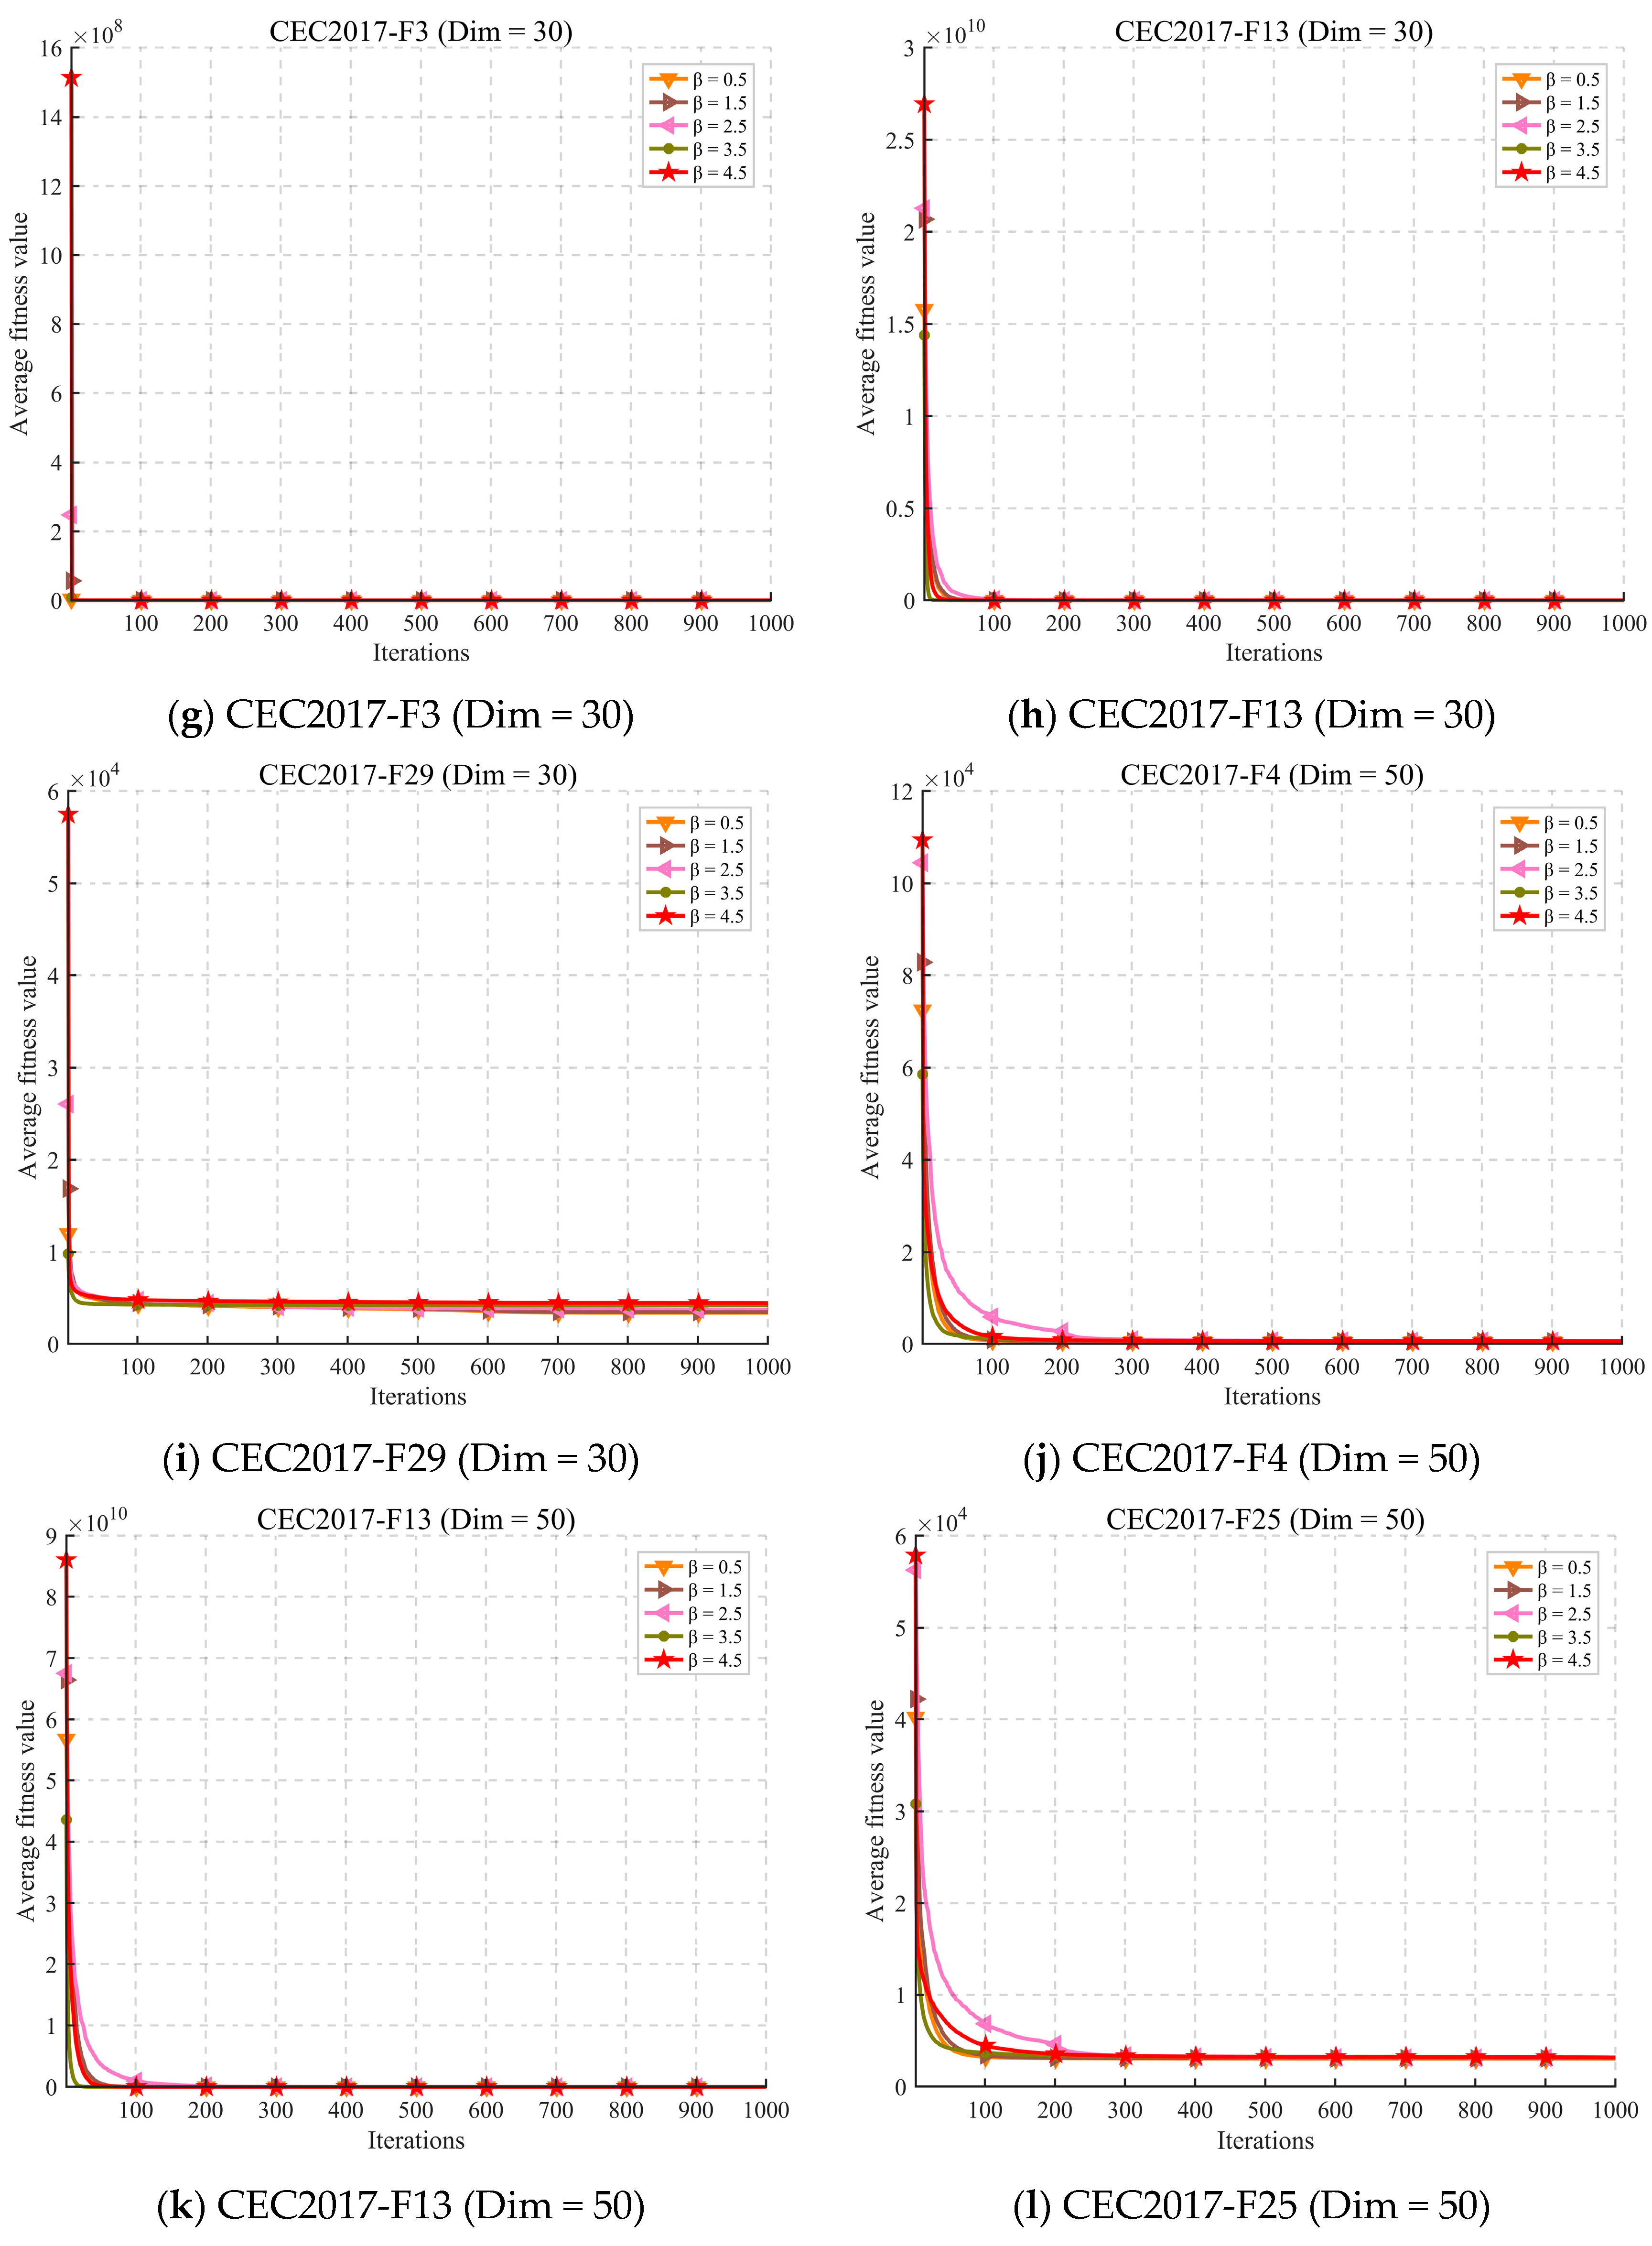
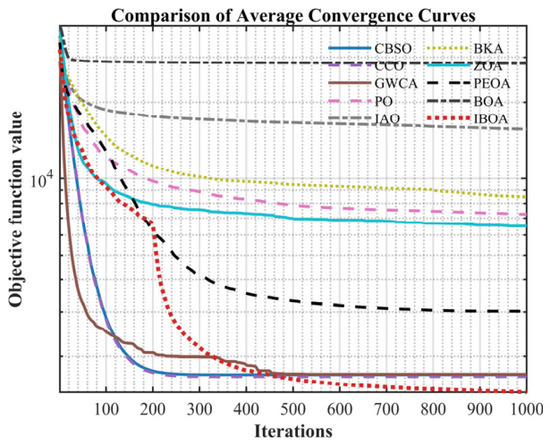
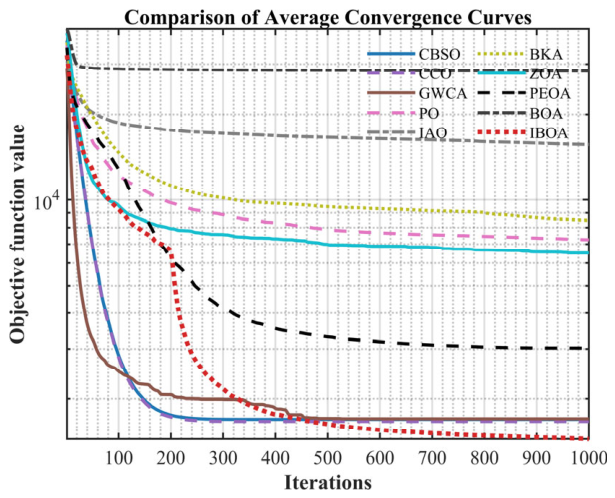
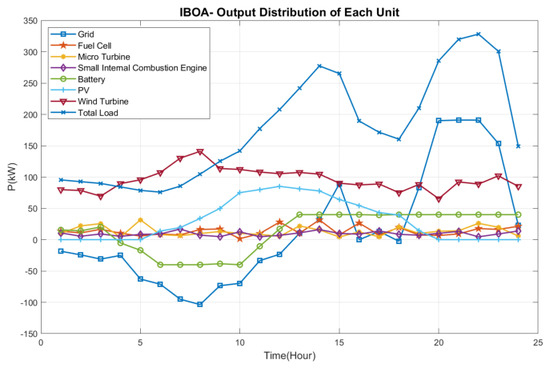
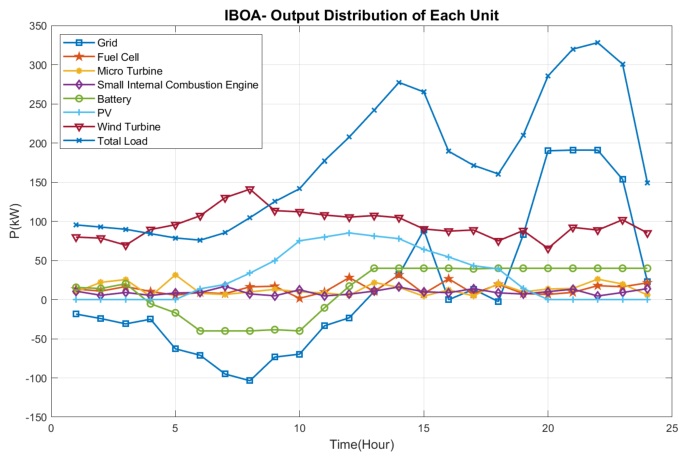
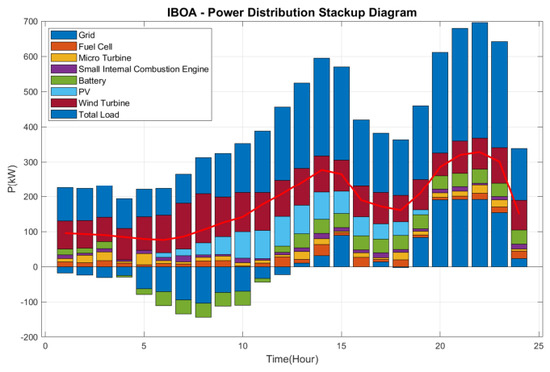
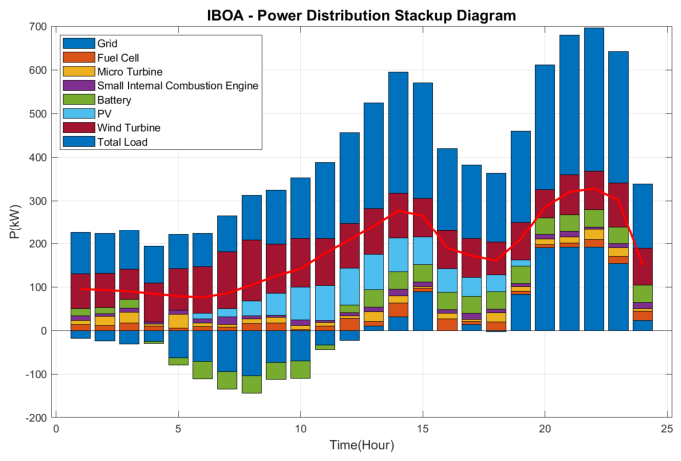

Disclaimer/Publisher’s Note: The statements, opinions and data contained in all publications are solely those of the individual author(s) and contributor(s) and not of MDPI and/or the editor(s). MDPI and/or the editor(s) disclaim responsibility for any injury to people or property resulting from any ideas, methods, instructions or products referred to in the content. |
© 2026 by the authors. Licensee MDPI, Basel, Switzerland. This article is an open access article distributed under the terms and conditions of the Creative Commons Attribution (CC BY) license.