


Abstract
Numerical simulations were conducted to investigate the effects of the Reynolds number and gap ratio on the flow over two tandem equilateral triangular cylinders. The variations in wake dynamics, aerodynamic coefficients, and Strouhal number were analyzed for Reynolds numbers ranging from 80 to 160 and gap ratios from 0 to . The pisoFoam solver available in the OpenFOAM software, which employs the PISO algorithm, was used to solve the governing flow equations. Analysis of the vorticity contours reveals that the vortex shedding characteristics of the tandem cylinders are strongly influenced by the gap ratio. Distinct vortex shedding from both cylinders is observed only beyond a critical gap ratio, with vortex shedding being delayed up to this critical value. Based on the vorticity patterns, three distinct flow regimes were identified depending on the values of and . The vortices shed from the cylinders are found to be periodic and symmetric across the investigated ranges of and . The time-averaged drag coefficient remains positive for the first cylinder, while for the second cylinder it transitions from positive to negative with increasing . A higher value of the is observed for the second cylinder due to its placement in the wake of the first cylinder. Furthermore, a sudden increase in both the force coefficients and the Strouhal number is observed for both cylinders beyond the critical gap ratio. The Strouhal number values are found to be nearly identical for the two cylinders.
1. Introduction
The study of flow around cylinders [1,2,3,4,5,6,7,8] has remained a significant area of interest for fluid dynamicists over several decades due to its relevance in a multitude of engineering disciplines. Triangular cylinders, in particular, have drawn substantial attention within the scope of fluid–structure interaction (FSI) research [9,10,11,12,13,14,15,16] because of their distinct and unique aerodynamic and hydrodynamic characteristics in comparison with other shapes, such as circular, square, elliptical, etc. The research presented in this study has significant applications across a wide array of domains, including, but not limited to, aerodynamics and vehicle design, space exploration and related applications, and the development and improvement of heat exchangers. Additionally, it has pertinent implications for civil and marine engineering structures, as well as for the technological advancements in electronic cooling systems, thereby extending its relevance to multiple scientific and engineering sectors. Flow over triangular cylinders is widely used in ocean and marine engineering to control vortex shedding and reduce flow-induced vibrations in offshore structures such as platforms, risers, and support frames. Their sharp edges fix the separation points, which helps in modifying wake patterns and improving structural stability under ocean currents. Triangular sections are also applied as passive flow control devices on subsea pipelines and cables to minimize scouring and oscillations. In marine renewable energy systems, they are utilized to enhance vortex-induced vibration for efficient energy harvesting from ocean currents. Additionally, these geometries are extensively used in experimental and CFD studies to better understand wake dynamics and hydrodynamic forces in marine environments. Triangular cross-sectional elements have emerged as a topic of interest for potential use in offshore risers and submerged infrastructure. Practical applications involving triangular cylinders include vortex flowmeters, offshore jacket-platform bracing members, lattice transmission towers, compact heat exchangers, solar air heaters, electronic cooling channels, and passive flow-control devices. In many of these systems, multiple bluff bodies may be arranged in tandem, making the understanding of wake interference and vortex-induced vibrations essential for reliable design and operation.Their appeal lies in their capacity to mitigate hydrodynamic forces and reduce the effects of vortex-induced motion (VIM), thereby enhancing the structural stability and integrity of these systems when subjected to challenging fluid dynamic conditions [15,16,17,18,19], which was one of the primary motives to attempt this problem.
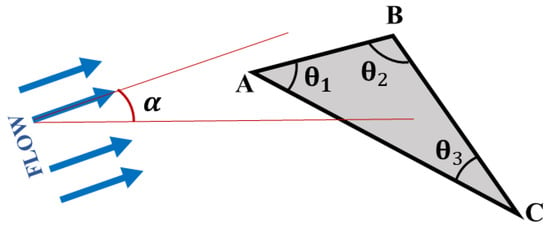
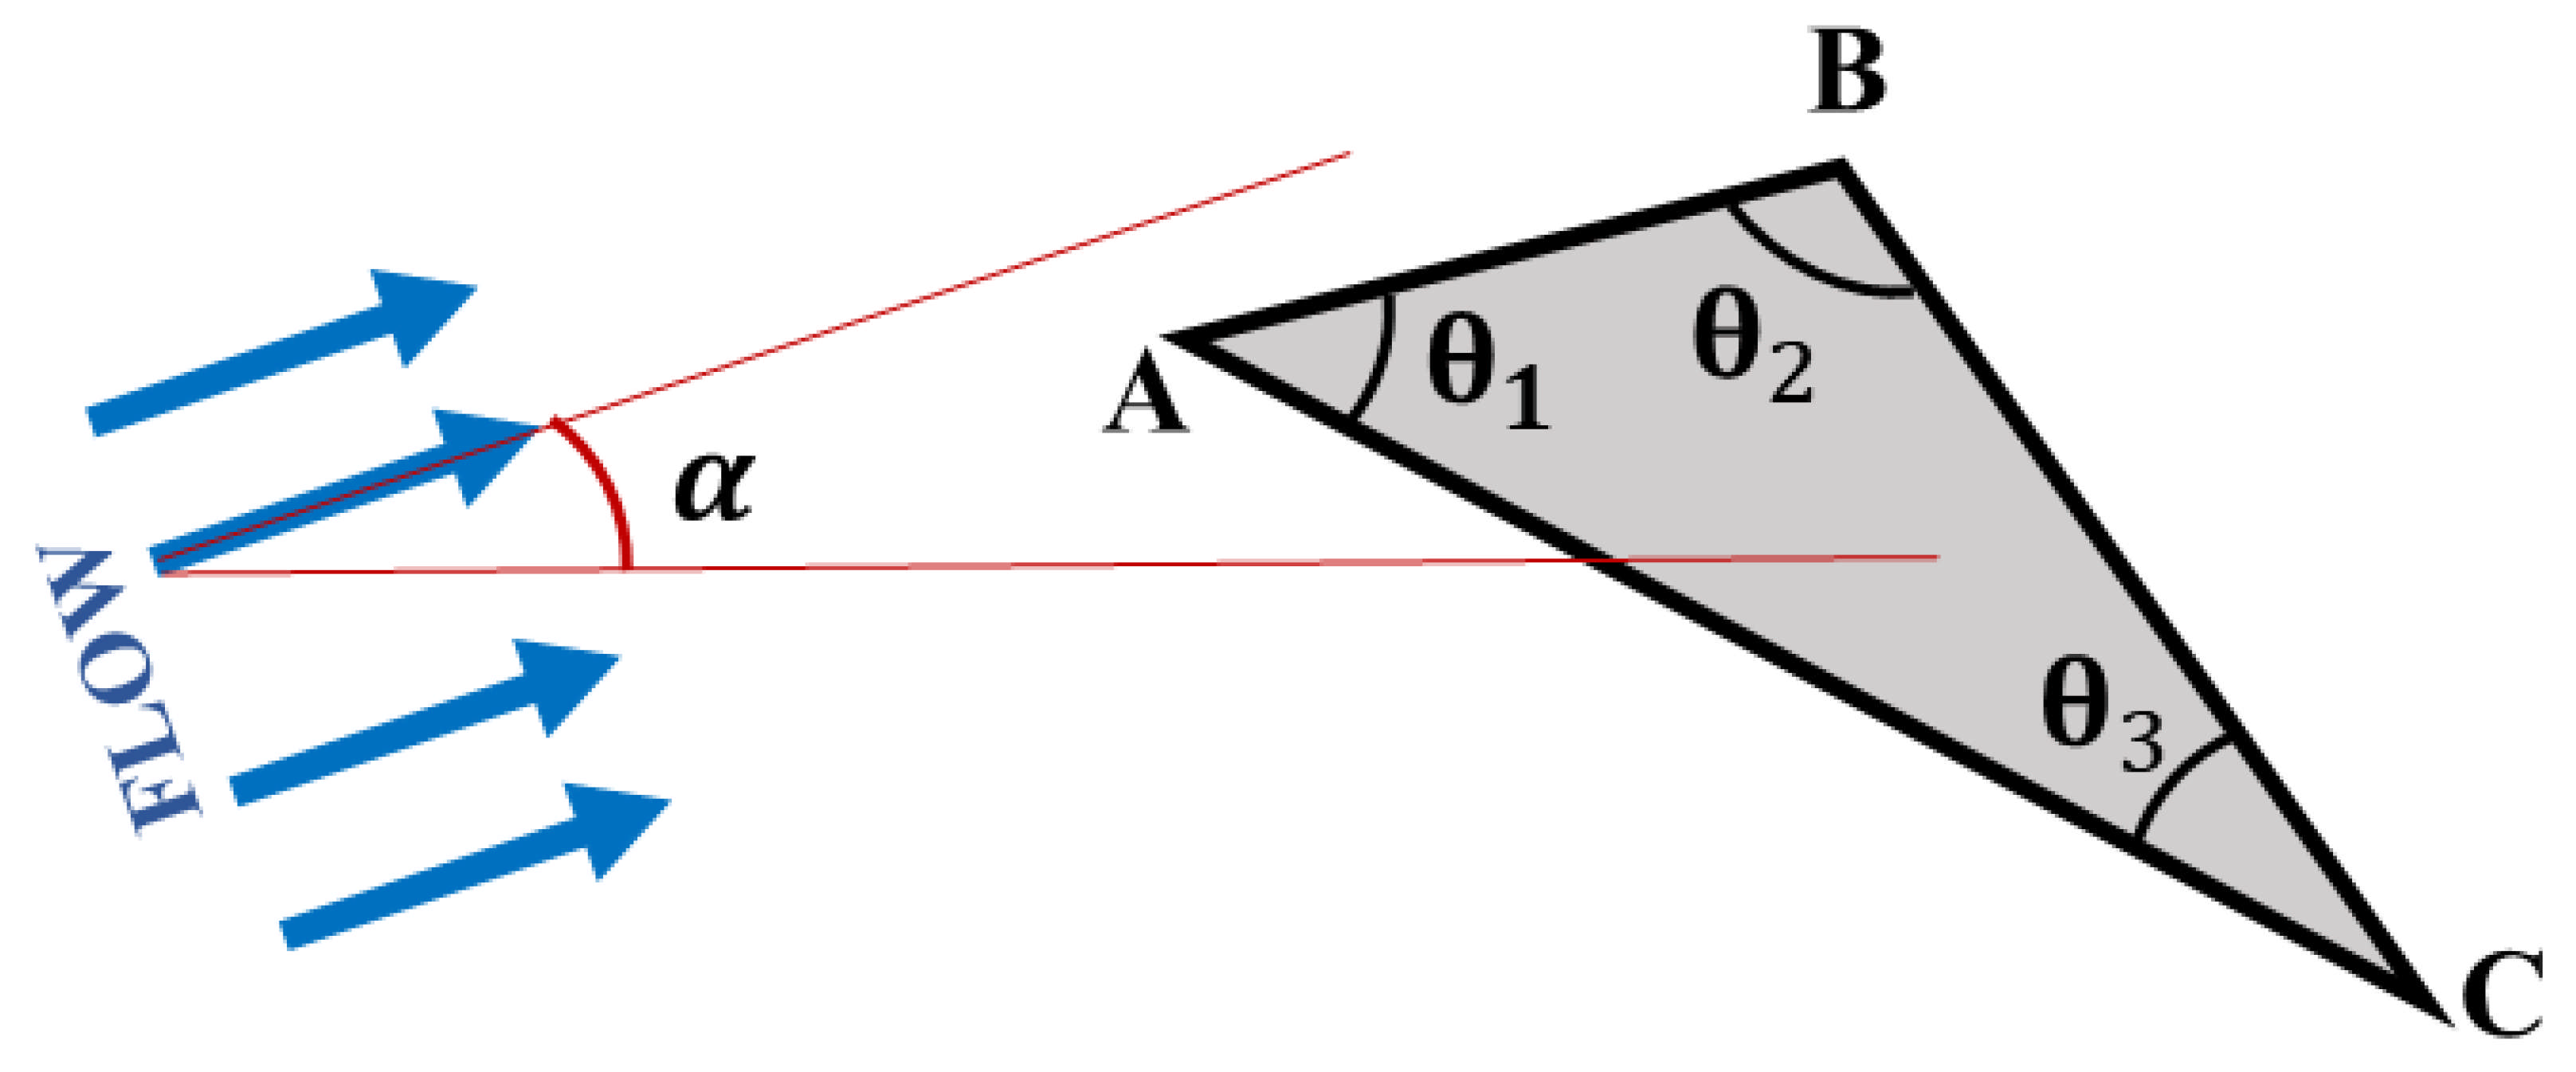
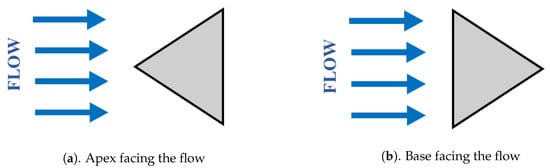
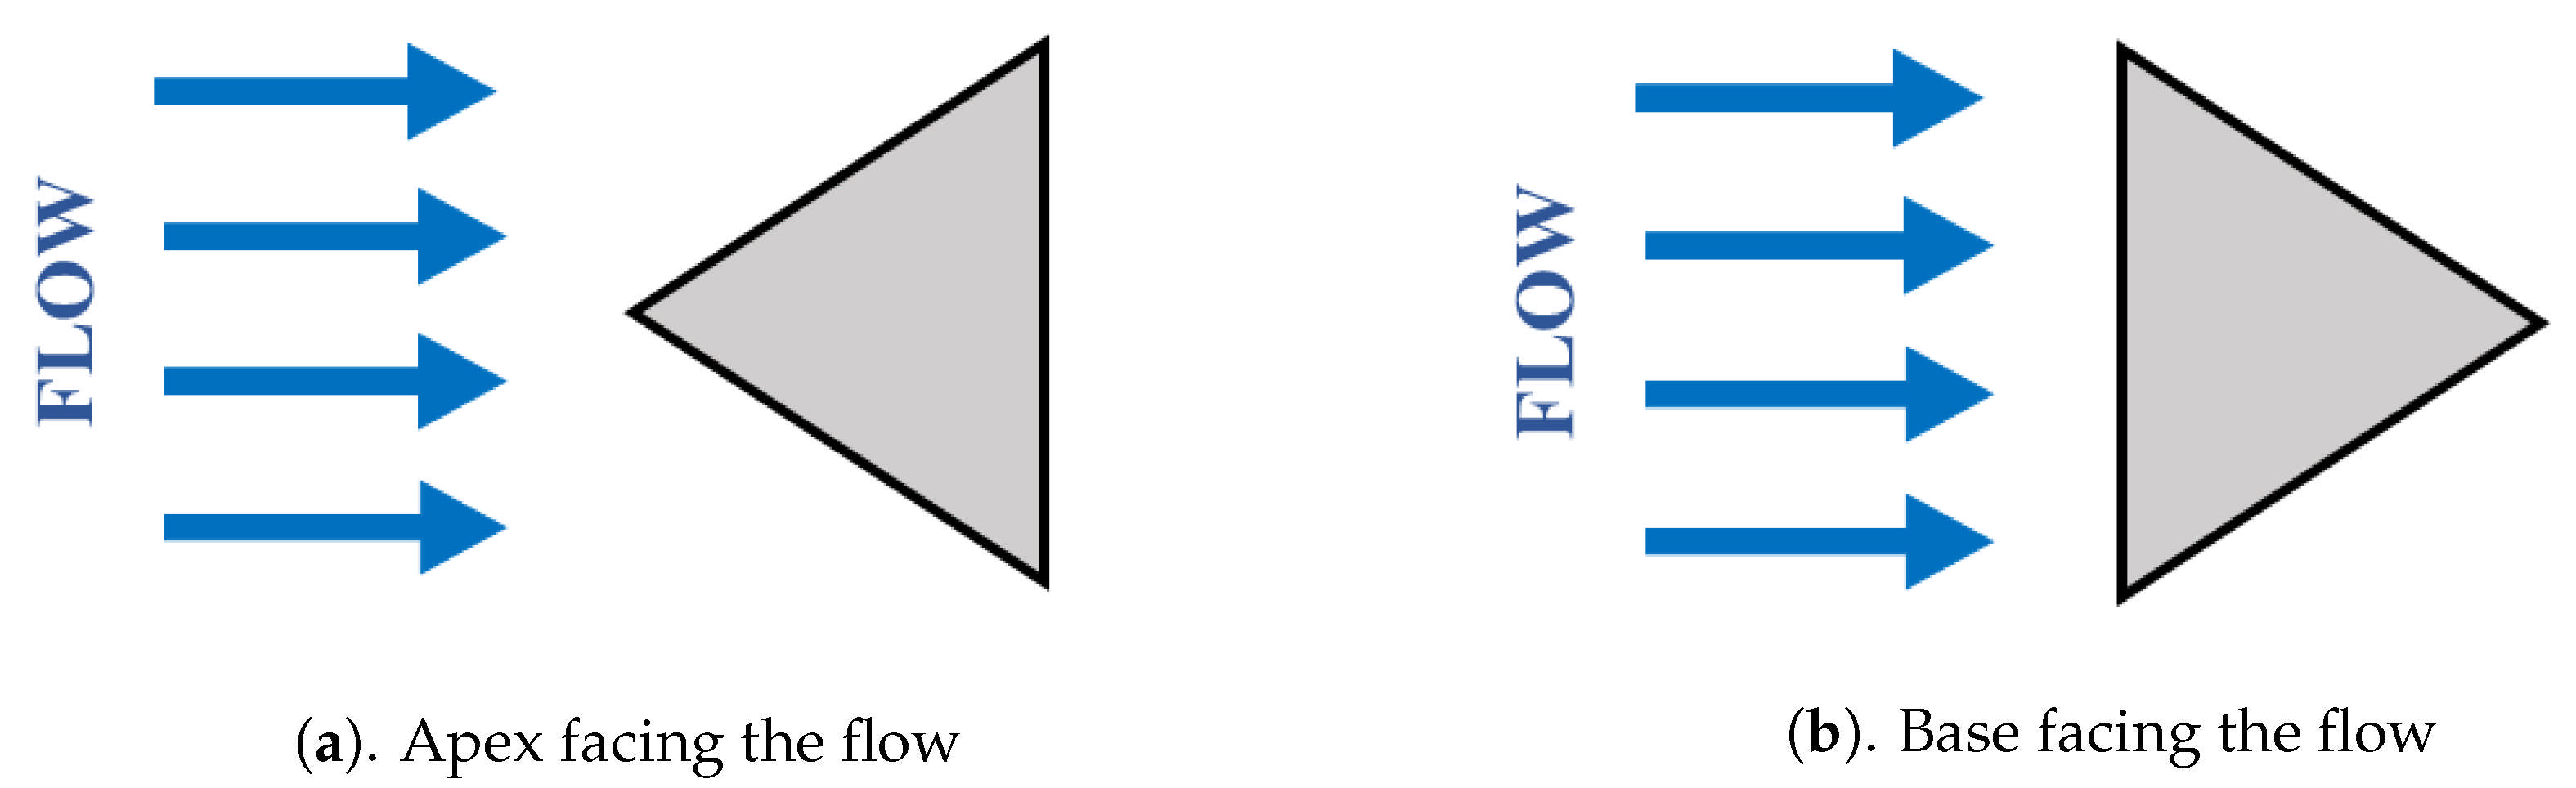
The flow over a triangular cylinder shows unique characteristics that clearly distinguish it from the flow around circular, elliptical, and square cylinder counterparts, which adds to the motivation. Firstly, in contrast to circular cylinders, triangular cylinders are more prone to flow separation at their three corners, as indicated in Figure 1, which markedly alters the wake dynamics and, in turn, their aerodynamic performance [9,10,20,21]. Secondly, as illustrated in Figure 1, the characteristics of the fluid flow around triangular cylinders are strongly influenced by their internal angles , , and . Thirdly, the resulting wake and the associated vortex shedding structures differ markedly depending on whether the incoming flow first impinges on the apex or on the flat base of the triangular cylinder [11,12,14,22], as illustrated in Figure 2. In addition, variation in flow dynamics is observed when cylindrical structures are tilted at various angles in relation to the incoming fluid flow (angle of attack, ) [13,23,24].
Figure 1.
Schematic sketch on flow over a triangular cylinder with different included angles , , and . The flow approaches the cylinder at an angle of attack, . The flow is equally likely to separate from all three corners, A, B, and C.
Figure 2.
The schematic picture showing the flow over an equilateral triangular cylinder ( = = = 60°) with apex facing and the base facing the flow ( = 0 and 180°), respectively.
The impact of changes in the apex angle on the wake dynamics of triangular cylinders, particularly concerning vortex shedding behaviors and aerodynamic force coefficients, was studied comprehensively by many researchers [9,24]. Their findings illustrate that as the Reynolds number rises, cylinders with larger apex angles show a more significant fluctuation in both lift and drag coefficients. Further, they claim that the frequency of vortex shedding remains linearly related to the Reynolds number for all configurations of the cylinders evaluated in their investigation.
Extensive research efforts have been devoted to understanding the effects of orientation and incidence angle on wake development and the associated hydrodynamic characteristics of equilateral triangular cylinders at low Reynolds numbers. These studies have primarily focused on the base-facing and apex-facing configurations of the triangular cross-section [25,26,27]. De and Dalal [10] conducted numerical simulations to analyze such a geometric configuration subjected to a low Reynolds number regime, precisely in the range of . Their numerical simulations have observed the steady–unsteady transition due to vortex shedding, and the critical Reynolds number corresponding to this transition was found to be approximately . Their study also meticulously provided quantitative data, including the drag coefficient, the root mean square (rms) of the lift coefficient, as well as the Strouhal number, specifically for the apex-facing configuration of the triangular cylinder. Ganga Prasath et al. [27] numerically analyzed the wake dynamics of triangular prisms at low Reynolds numbers, establishing relationships between wake bubble length, , and aspect ratio (). The study also characterized drag coefficients for base-facing and apex-facing orientations, highlighting and effects on drag forces. Manzoor et al. [14] present a numerical investigation of fluid flow past a triangular cylinder positioned in both left and right orientations over a Reynolds number range of 80–200. For both orientations, regular vortex shedding is observed across all Reynolds numbers. However, in the right-oriented case, vortices exhibit an upward drift with increasing , accompanied by near-zero mean drag and negative mean lift in the range .
The present study focuses exclusively on flow over equilateral triangular cylinders in the apex-facing configuration (Figure 2a). Although considerable research has been conducted on flow past triangular cylinders, the apex-facing configuration has received comparatively less attention in the literature. Moreover, owing to its relevance in various engineering applications, a comprehensive understanding of the associated wake dynamics and flow-induced responses remains necessary.
In an effort to mitigate vortex shedding and the associated unsteady aerodynamic forces on bluff bodies, numerous active and passive flow-control methods have been proposed and extensively investigated by researchers [8,28,29,30,31,32,33,34]. A substantial body of work exists on flows past multiple cylinders arranged in various configurations, such as tandem, side-by-side, and staggered layouts. Among these, arrangements involving multiple circular cylinders have been particularly well studied. Comprehensive reviews of the flow around circular cylinders have been provided by Zdravkovich [35] and Sumner [36]. Experimental studies related to flow past multiple cylinders can be found in the work of Igarashi [37], Bearman et al. [38], and Xu et al. [39]. Igarashi [37] conducted an experimental study of flow past two circular cylinders arranged in tandem at small gap ratios and in the subcritical Reynolds number range. Six distinct flow regimes were identified as functions of Reynolds number and gap spacing. Velocity and pressure fluctuations around the cylinders were examined, along with the vortex shedding frequency (), for various combinations of Reynolds numbers and gap ratios.
The effect of varying the gap ratio and Reynolds number on the Strouhal number of two cylinders in tandem was experimentally investigated by Xu et al. [39]. They found that up to a critical gap ratio, vortex shedding appears only in the wake of the downstream cylinder, and the Strouhal number decreases sharply as the gap ratio increases. Once this critical gap ratio is exceeded, both cylinders shed vortices independently, and the Strouhal numbers of the two cylinders become identical. Moreover, the vortex shedding behavior of the tandem cylinders was classified into four distinct regimes based on the Strouhal–Reynolds number relationship. Numerical investigations of the aerodynamic characteristics of multiple circular cylinders in uniform flow have been presented by Li et al. [40], as well as by Meneghini et al. [41], Sharman et al. [42], and Liu et al. [43]. In the numerical study by Li et al. [40], the flow past a single cylinder and a pair of tandem circular cylinders was examined at a Reynolds number of 100, with the gap ratio varying between 2 and 6. Independent vortex shedding from each cylinder was detected only beyond a certain critical gap ratio; below this critical value, the Strouhal number decreased, and it increased again once the gap ratio exceeded it. The downstream cylinder was found to experience reduced drag and increased lift.
Following extensive studies on multiple circular cylinders, the flow past multiple square cylinders has also received considerable attention from researchers due to its distinct separation characteristics and wake interactions. Interestingly, the observed vortex shedding and its related behavior exhibited the same pattern. The aerodynamic characteristics and the shedding frequency showed a trend similar to that of the circular cylinder [44,45,46,47].
Compared with the extensive literature on circular and square cylinders, studies of flow past multiple triangular cylinders remain relatively limited.
Hamid and Noh [48] numerically examined the influence of placing a control cylinder upstream of a main triangular cylinder for Reynolds numbers between 50 and 250 at a fixed gap ratio of 1. Their results showed that the upstream control cylinder substantially weakened the aerodynamic forces acting on the main cylinder and delayed the onset of periodic vortex shedding. At lower Reynolds numbers, the control cylinder was even capable of fully suppressing vortex shedding from the main cylinder. Manu and Ajith [49] numerically investigated the influence of placing a downstream triangular cylinder on the Strouhal number of an upstream equilateral triangular cylinder over a range of Reynolds numbers from 75 to 200 and gap ratios from 0 to . The results showed that, for all Reynolds numbers and gap ratios considered, the two-cylinder configuration produced lower Strouhal numbers compared to the corresponding single-cylinder case. Fallah et al. [50] examine the influence of oscillation frequency, phase difference, and the configuration of two triangular cylinders on hydrothermal behavior in a channel at . The side-by-side configuration achieves a higher thermal performance index (TPI) than the tandem configuration, with maximum TPI values of and , respectively. The combination of oscillatory motion and geometric arrangement leads to improved convective heat transfer relative to stationary cylinder cases.
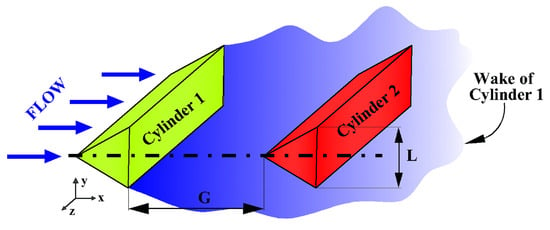
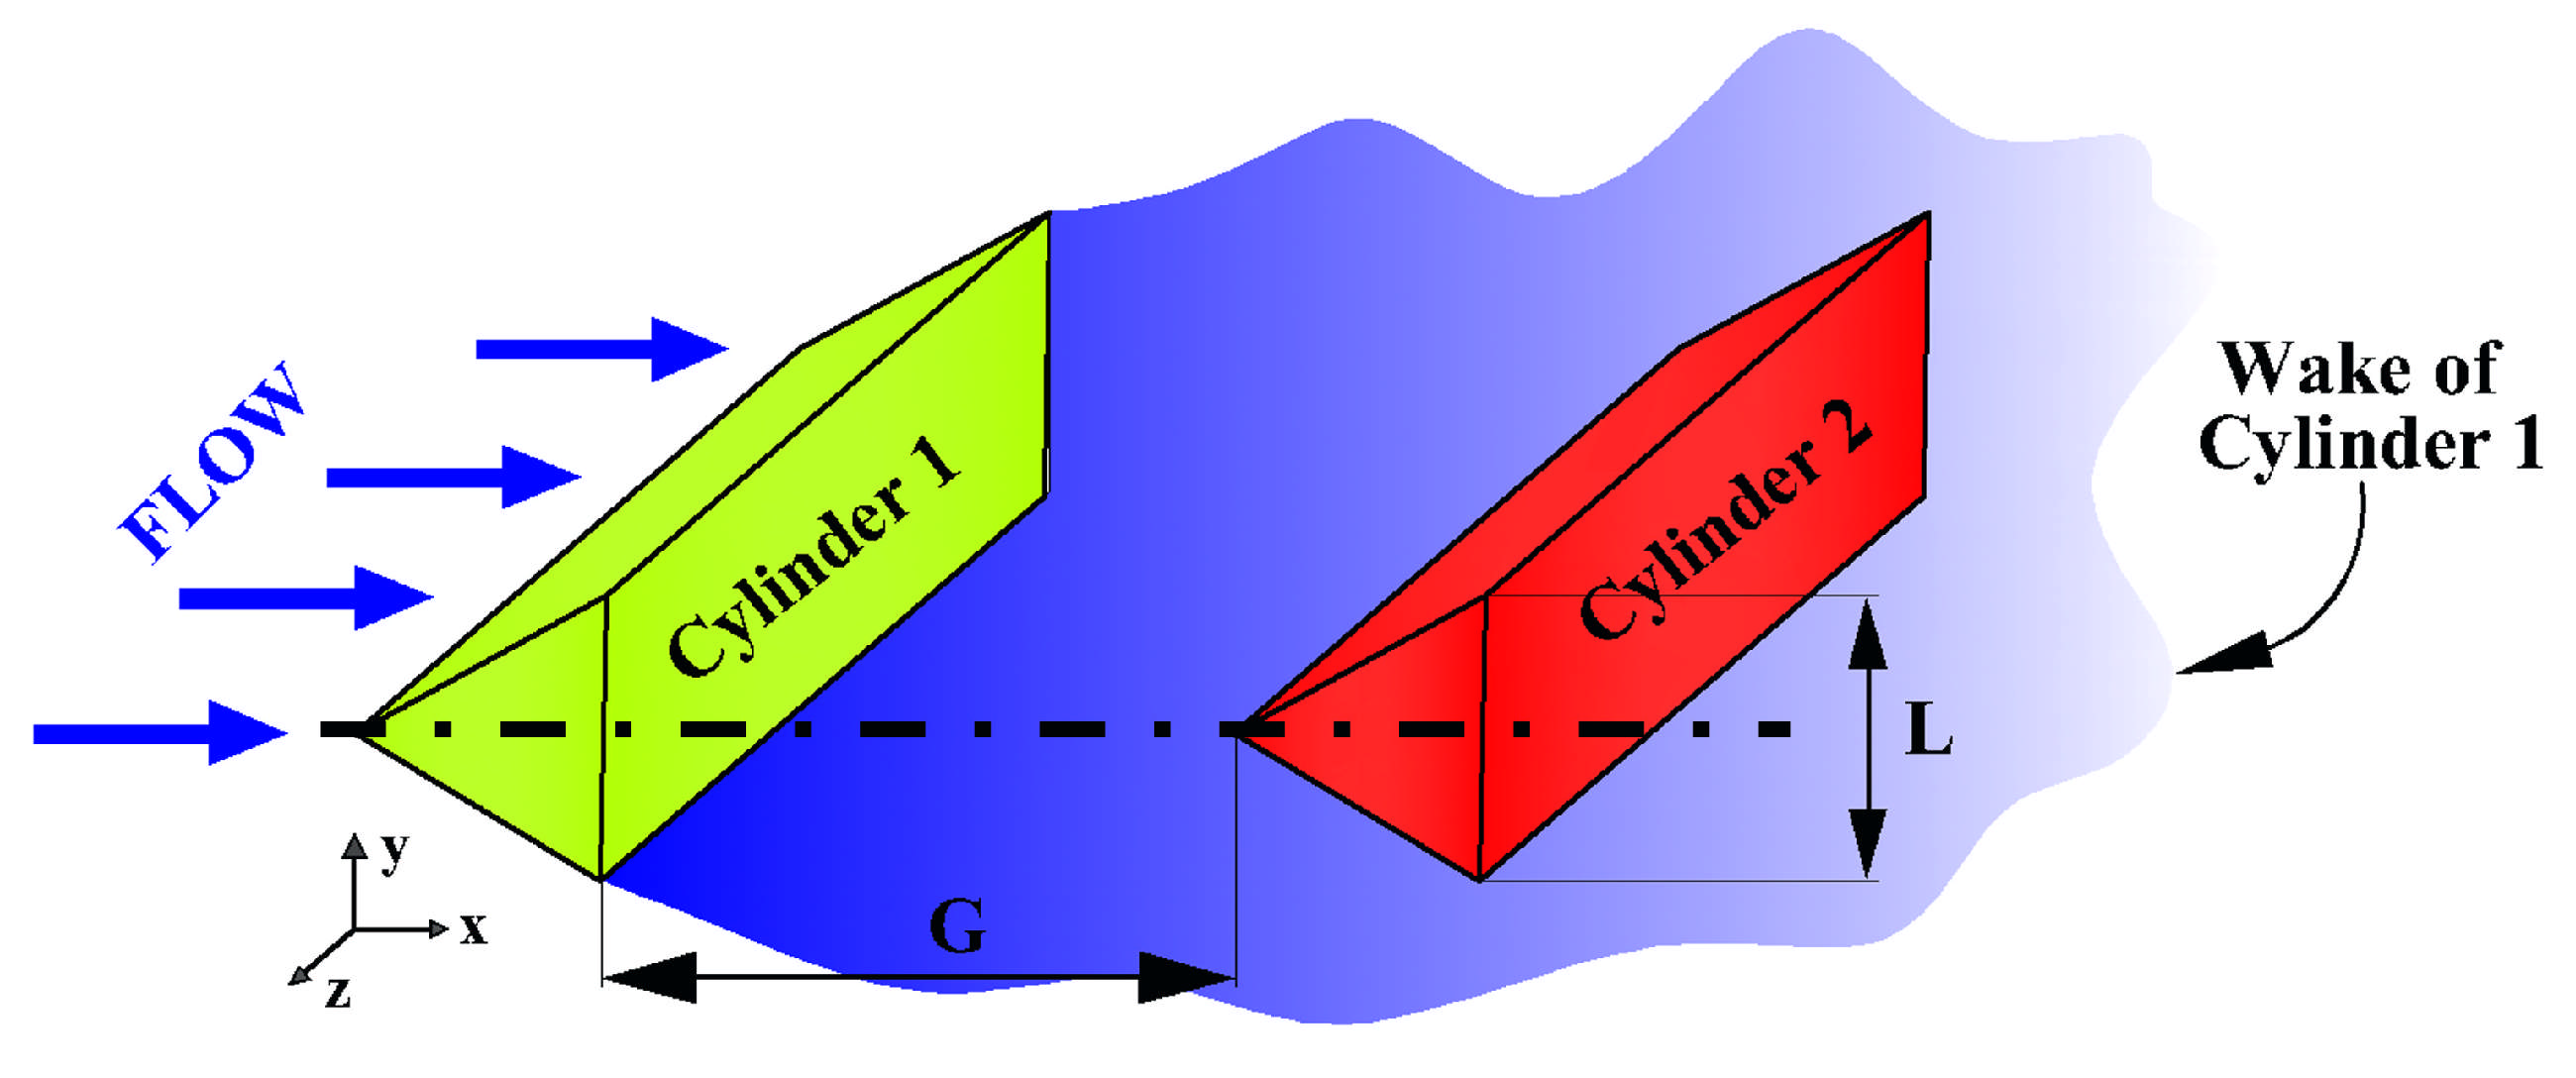
Table 1 provides an overview of prior research works on multiple cylinders in laminar flow, including the corresponding and values. The majority of these studies concentrate on the ranges 50 200 and 0 10. Collectively, the existing literature reveals a shortage of thorough investigations and fundamental analyses of laminar flow past multiple triangular cylinders at low Reynolds numbers. Moreover, the existing literature provides limited discussion of the fluid dynamics underlying wake behavior, particularly for tandem equilateral triangular cylinders in the apex-facing configuration. Figure 3 provides a schematic representation of the configuration analyzed in this study. We examine how introducing a second, identically sized equilateral triangular cylinder of base length L influences the wake structure and aerodynamic response of the upstream cylinder. The present numerical study focuses on the effects of the gap ratio () and Reynolds number () on the flow past two equilateral triangular cylinders arranged in an tandem configuration, with both cylinder apexes facing the incoming stream, as depicted in Figure 3.
Table 1.
Synopsis of computational studies on laminar flow over bluff bodies of different shapes.
Figure 3.
Schematic sketch showing the laminar flow over two tandem equilateral triangular cylinders. L is the length of the base of the cylinder and G is the gap between the cylinders measured from the base of the upstream cylinder to the apex of the downstream cylinder.
The Reynolds numbers considered in this study are and 160, while the ratio is varied from to in increments of for each value. For every combination of and , the vortex shedding characteristics and aerodynamic behavior of both triangular cylinders are analyzed in detail. In addition, particular attention is devoted to explaining the reasoning behind all the aerodynamic behavior observed in this research work.
The methodology and results of this study are outlined in the following sections. Section 2 details the numerical approach, including the governing equations for flow around triangular cylinders, the computational domain and boundary conditions, the adopted solution procedure, and the definitions of the aerodynamic parameters. Section 3 reports the domain independence assessment, followed by the grid and time independence analyses, and ends with the validation of the numerical code. Section 4 provides an in-depth examination of vortex shedding and wake behavior behind the cylinders, together with an analysis of the variations in the aerodynamic coefficients and Strouhal numbers for both cylinders. Finally, Section 5 highlights the principal outcomes and states the conclusions of this numerical investigation.
2. Numerical Methodology
2.1. Governing Equations
The two-dimensional governing equations for the laminar incompressible flows in the non-dimensional form can be represented as:
where the variables u, v and p represent the non-dimensional velocity components in the x and y directions and the non-dimensional pressure, respectively. The velocity components are non-dimensionalised using the free-stream velocity and pressure is non-dimensionalised with dynamic pressure . The Reynolds number, , is a dimensionless parameter defined as , where is the free-stream velocity, L is the characteristic dimension of the cylinder, and is the kinematic viscosity.
2.2. Computational Domain
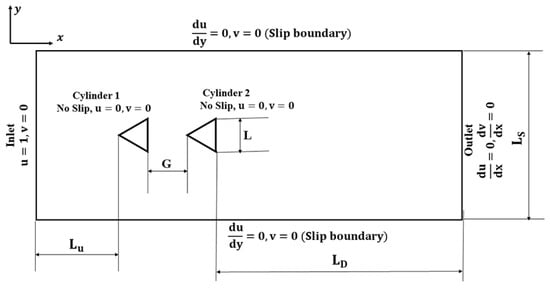
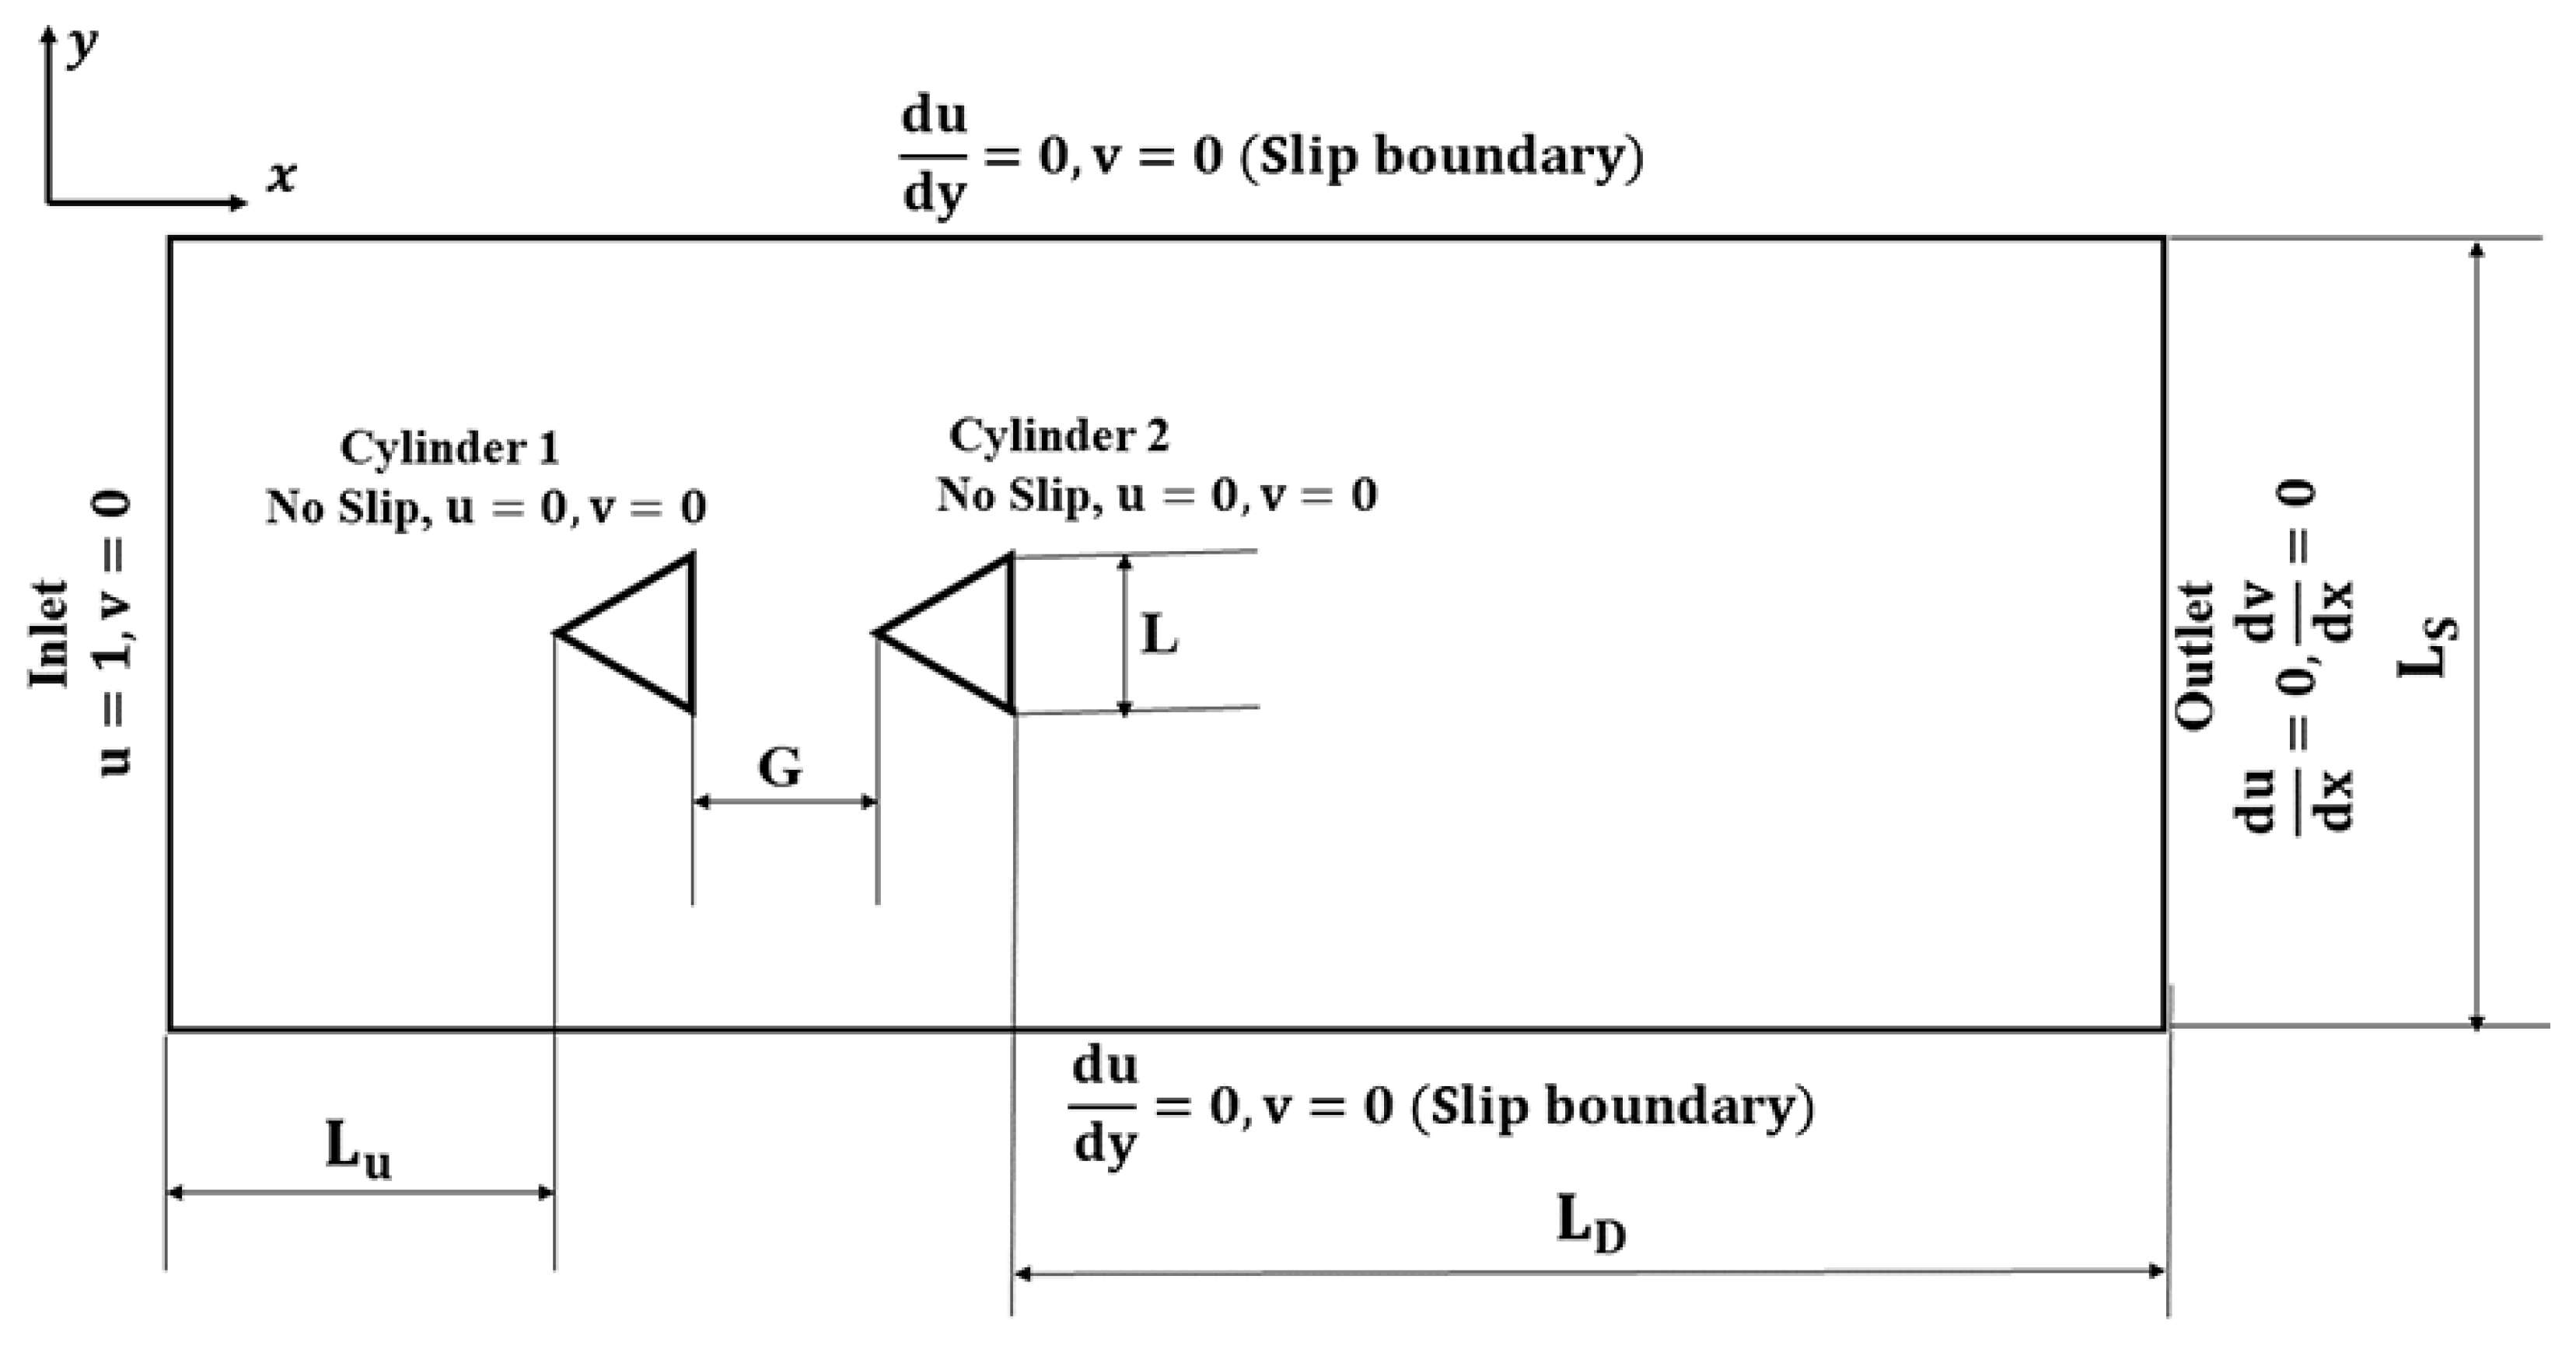
A rectangular computational domain is selected for simulating the flow over two apex-facing tandem triangular cylinders, as shown in Figure 4. The boundary conditions used for the computational simulations are indicated in the figure. The dimensions of the domain used, the grid structure, and the time step employed for the solution algorithm are selected after performing independence studies, which are discussed in the preceding subsections.
Figure 4.
Computational domain along with the boundary conditions used for the present study.
2.3. Boundary Conditions
The boundary conditions used in the work are shown in Table 2.
Table 2.
Boundary condition used in the work.
2.4. Solution Strategy
The open-source finite-volume CFD toolkit OpenFOAM v10, is popular among the research community for simulating bluff body flows [58,59,60] and has been used in this work. Table 3 lists the solution settings of this numerical work, akin to Gao et al. [61]. The pisoFoam solver, utilizing the PISO algorithm [62], solves the governing Equations (1)–(3). The time-dependent terms are tackled using a second-order Crank–Nicolson scheme, while the convective and diffusive terms are dealt with using a second-order linear upwind scheme for spatial discretization. The time integration adheres to the CFL condition [63], while the norms of u and v are tracked [64,65,66,67] to drop below . Mass continuity is also ensured below .
Table 3.
Solution settings employed in OpenFOAM.
2.5. Definitions and Formulations of Some Global Quantities Used
For the equilateral cylinder of side length L, free stream velocity of and fluid density , the hydrodynamic quantities have been estimated based on the empirical equations given below and produced from Damu et al. [68].
where p represents the static pressures of the fluid.
The vortex shedding frequency (f) is characterized by,
3. Independence Tests
3.1. Domain Independence Test
A rectangular computational domain is selected for simulating the flow over two apex-facing, tandem triangular cylinders. For the domain independence test, seven different domain sizes are selected by varying the dimensions , , and ; the dimensions are indicated in Figure 4. The test was conducted for a representative Reynolds number of 100 and = 6.0, which is the largest of all considered in this study. The integral quantities, such as the aerodynamic coefficients and the Strouhal number, are evaluated for both cylinders for all seven cases ( to ) from the flow field obtained and are summarized in Table 4. It can be observed that there is not much change in the parametric values obtained after , manifesting a domain independence about . Hence, which is highlighted in the Table 4 is selected for all the subsequent simulations in this study.
Table 4.
Summary of domain independence test conducted for = 100 and = 6.0.
3.2. Grid Independence Test
Subsequently, the grid independence test is conducted on the domain obtained from the domain independence test. The computational domain is discretized using quadrilateral cells, providing adequate grid refinement around the cylinders to capture the boundary layer and the associated behavior accurately. A grid-independence test was conducted on ten progressively refined meshes ( to ) for the highest Reynolds number, , and for and 6, and the results are summarized in Table 5 and Table 6. The refinement is achieved by varying the number of cells on the surface of the cylinders from 5 to 50 (i.e., and indicate, respectively, 5 and 50 cells on the cylinder surface) and the corresponding total numbers of cells are indicated in the second column of Table 5 and Table 6.
Table 5.
Summary of grid independence test conducted for = 160 and = 6.0.
Table 6.
Summary of grid independence test conducted for = 160 and = 0.0.
For all the meshes considered in the test, the time-averaged aerodynamic coefficients and Strouhal number were evaluated in the same way, as discussed in Section 3.1, for both the cylinders and are consolidated in Table 5 and Table 6. It is evident from the table that the parameters evaluated are almost insensitive to the mesh when the total number of cells exceeds 100,056 (i.e., ), with deviations of less than 1%. Hence, the grid independence test confirms that is the optimum mesh that can be used for the preceding simulations of this study.
3.3. Time Step Independence Test
After obtaining the optimum grid, the time step independence test is conducted on for = 100 and = 6.0 to see the sensitivity of the simulations on the time step used and to obtain the time step independent solution. For this, six different time steps have been considered, and the simulations are performed. The corresponding aerodynamic coefficients and Strouhal number of both cylinders are calculated for all six cases and are summarized in Table 7. It is not surprising to note the declining trend in the change in the parameters evaluated between two consecutive time steps. However, after , the percentage deviation in the parameters between two consecutive cases has reached below 1.0%, which is adequately small enough to consider as the optimum time step for the computations for the rest of the studies.
Table 7.
Summary of time step independence test conducted for = 100 and = 6.0.
3.4. Code Validation
The OpenFOAM code is validated for flow over apex-facing single equilateral triangular cylinder against six similar previous investigations at = 100. The aerodynamic parameters are evaluated and compared with the existing literature and are consolidated in Table 8. The percentage deviation obtained from the present computations and that from the literature is indicated in brackets. It can be seen that the present code shows agreement with the reported values, and the maximum deviation obtained is %, which is very much within the admissible limit.
Table 8.
Validation for flow over a single equilateral triangular cylinder at = 100.
4. Results and Discussion
In this section, the results obtained from the present numerical analysis are discussed in detail. The numerical investigation focuses on the flow dynamics over two in-line equilateral triangular cylinders and examines the influence of different gap ratios () and Reynolds numbers (). The study systematically investigates the effect of from 0 to 6 in steps of 0.5 and at five discrete values from 80 to 160 in increments of 20. This section aims to explore how variations in both the gap ratio and the Reynolds number impact the vortex shedding behavior, wake characteristics, and the aerodynamic performance of the cylinders.
4.1. Vortex Shedding
For flow over an equilateral triangular cylinder, the range of considered in this study is characterized by unsteady laminar vortex shedding. Vortex shedding is visualized and analyzed with the help of vorticity contours, which are covered in more detail in the following sections. In addition, a comprehensive discussion has been included to explain how the introduction of a second equilateral triangular cylinder in the wake of the first cylinder alters the vortex shedding pattern and its properties.
4.1.1. Instantaneous Vorticity Contours
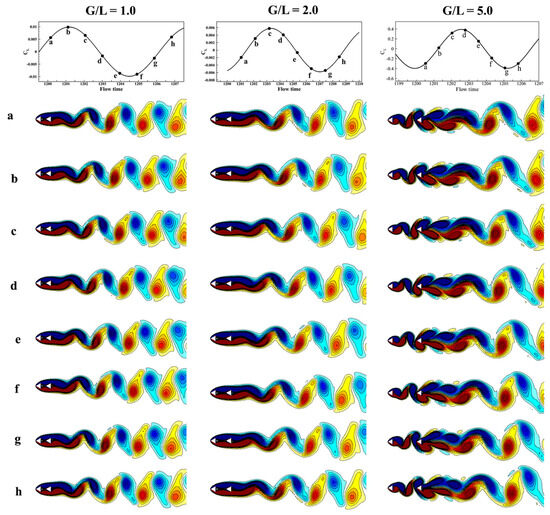
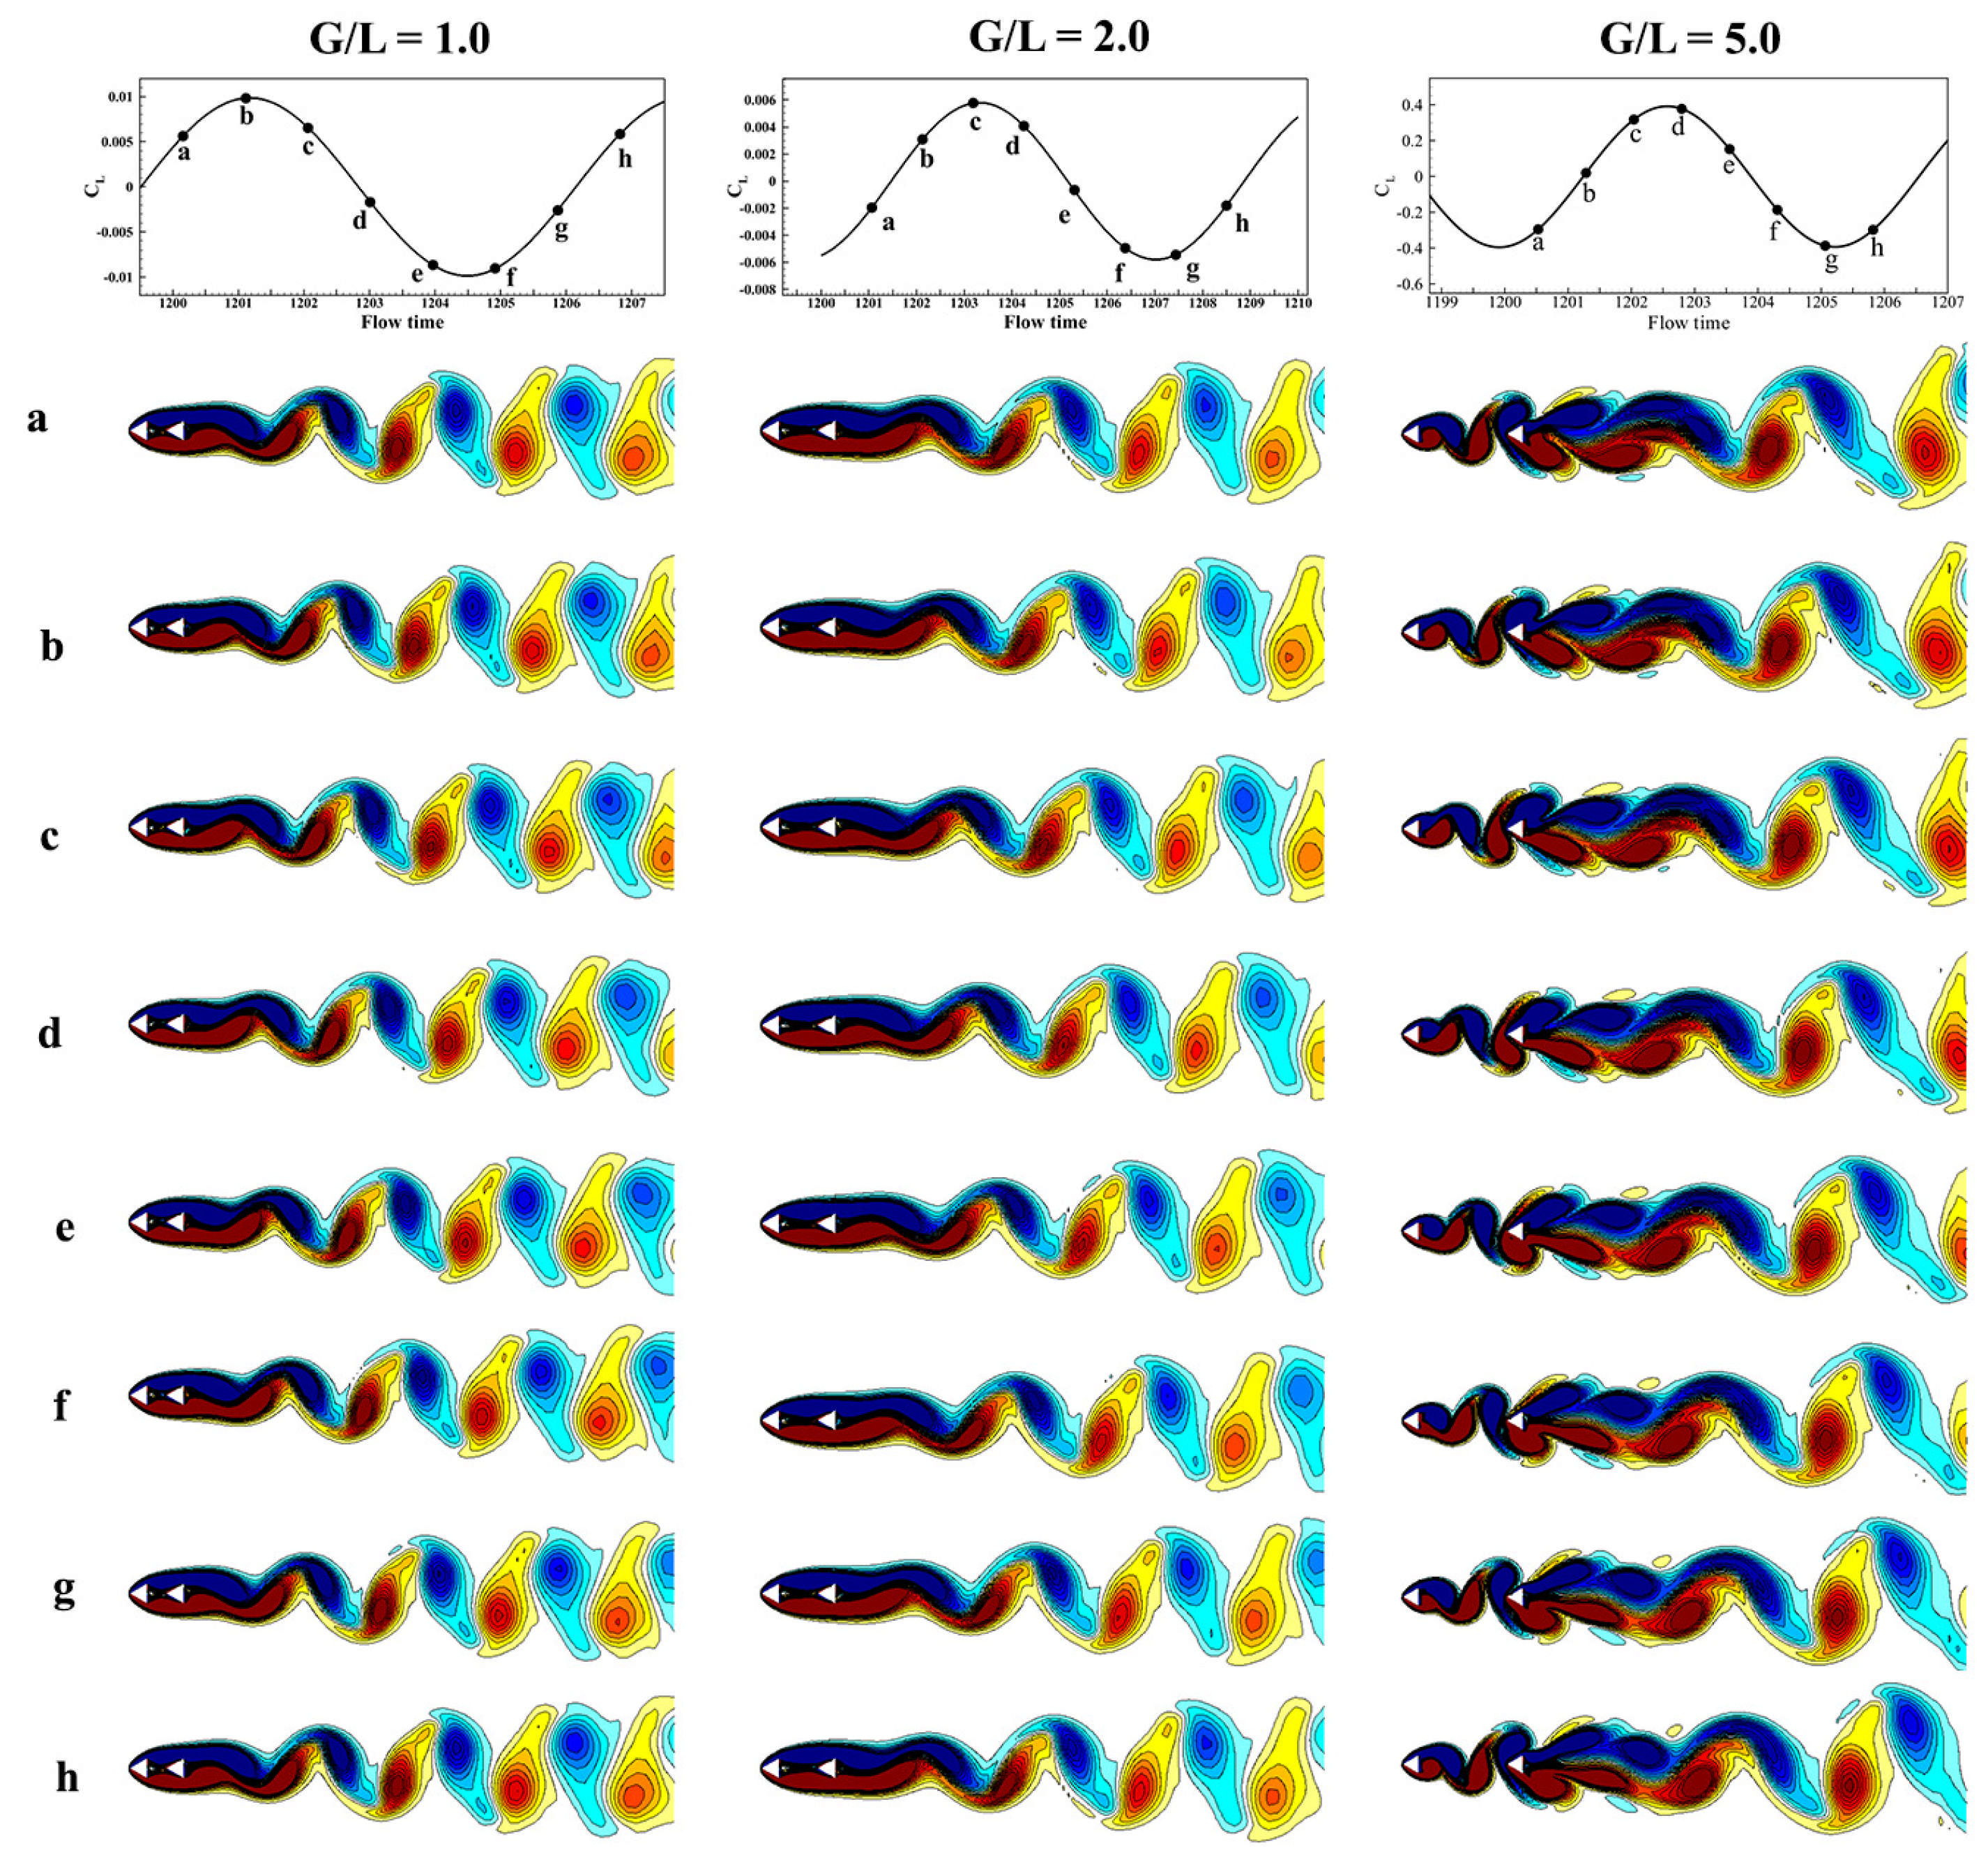
The vorticity contours for one shedding cycle for various ratios at = 100 are shown in Figure 5. Here, the instantaneous vorticity contours are plotted at eight equal time intervals (a–h, in rows) of a single time period, and the corresponding instances are marked on the -time history at the top for better clarity in the explanation. The columns of the figure represent three different ratios: 1.0, 2.0, and 5.0. Vortex shedding has been observed from the downstream cylinder consistently, regardless of the specific value. However, when considering smaller ratios 1 and 2, it is observed that vortex shedding predominantly occurs from the downstream cylinder alone. On the contrary, the upstream cylinder does not exhibit any notable vortex shedding phenomenon. Furthermore, on comparing = 1.0 and 2.0, it has been noted that for , the separated shear layer emanating from the downstream cylinder undergoes a more significant elongation compared to when . Consequently, the delay in shear-layer interaction modifies the onset of vortex shedding, thereby affecting both the shedding frequency and drag force. The vortex shedding characteristics and associated wake behavior will be further analyzed using contour plots, which will be elaborated in the subsequent sections. On the other hand, for the case where , illustrated in Figure 5, independent vortex shedding from each cylinder is evident, as shown in column-3. The vortices also form closer to the upstream cylinder compared with the cases of and 2. Moreover, an important observation is made, in which these vortices merge into a single row of vortices at the downstream cylinder.
Figure 5.
Vorticity contours (seven segments evenly spaced in one shedding cycle) at = 100 and various . The corresponding time instances are marked in the -time history at the top each column.
4.1.2. Regimes of the Wake
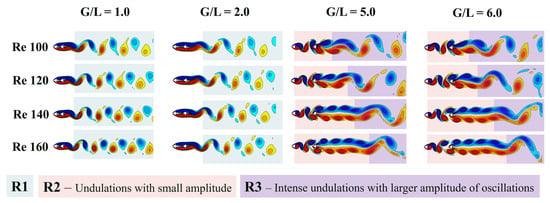
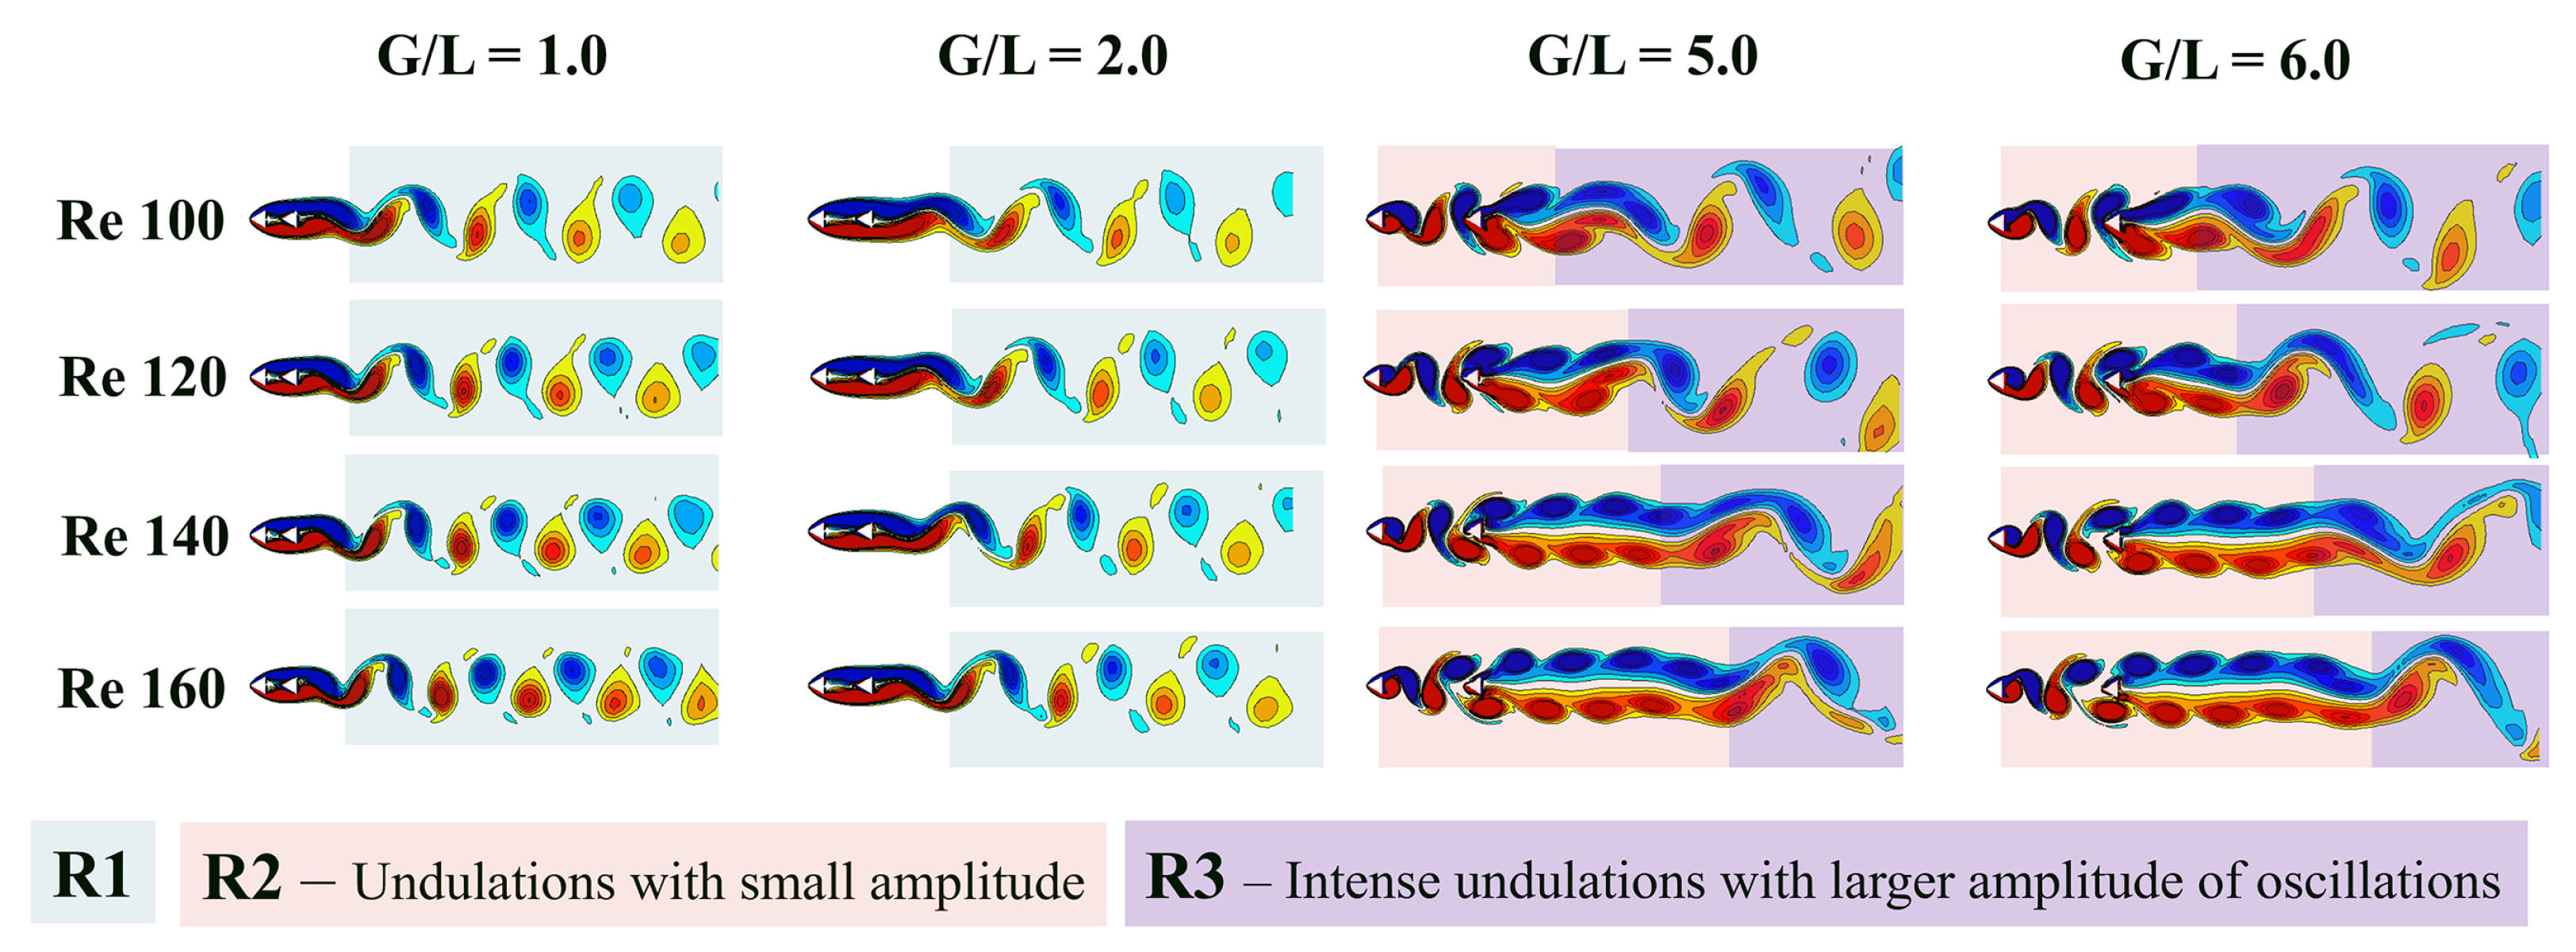
On detailed examination and scrutiny of the vorticity contours, various regimes , , and within the wake flow are revealed for flow over tandem triangular cylinders, as shown in Figure 6. Distinct colors are used to denote the regimes, and their labels are provided directly in the figure. The first two columns of Figure 6 correspond to the lower values of = 1 and 2. The second and third columns represent = 5 and 6, respectively. Figure 6 provides a comprehensive consolidation and substantiation of three distinct regimes, each of which is elaborated in more detail below. The characteristics that define these regimes are influenced by multiple geometric and fluid dynamic parameters. These include, but are not limited to, the relative size of the cylinders, their alignment with respect to the flow direction, the Reynolds number (), and the gap ratio (), etc.
Figure 6.
Vorticity contours unwrapping different regimes of flow at t = 1500 s. , , and are the three distinctly different regimes observed (for a combination of and ), which have unique flow characteristics.
- Regime-1 (). In the region denoted as , the phenomenon of vortex shedding predominantly occurs in the immediate wake of the downstream cylinder. The characteristics of the vortex shedding appear as if they were generated from a single body, masking the existence of the second cylinder within the wake, as discussed in Section 4.1.1. This behavior is particularly notable when the gap ratio is small, irrespective of the Reynolds numbers used in the present study. Furthermore, with an increase in the ratio, the initiation and subsequent release of vortices tend to move farther from the downstream cylinder. This observation is clearly visible in the second column of Figure 6, which would cause an increase in the reattachment length. More details about the wake characteristics and behavior are discussed in Section 4.2.
- Regime-2 (). An independent vortex shedding pattern is observed from both cylinders after the gap ratio crosses a threshold, known as the critical gap ratio, denoted as , irrespective of the Reynolds number (). It should be noted that for all the cases analyzed, the occurs between 2 and 5. In this scenario, vortices generated from the upstream cylinder move into the inter-cylinder space and proceed to merge with those detached from the downstream cylinder. This vortex interaction and subsequent merging in the wake of the second cylinder significantly influence both the aerodynamic characteristics and the downstream vortex shedding pattern.In regime , vortex shedding takes place in the immediate vicinity of the downstream cylinder, and this occurrence is markedly different from the dynamics observed in region . A detailed analysis of the vorticity contours, as illustrated in Figure 6, reveals for ratios of 5 and 6, the emergence of two additional, clearly distinct flow patterns. The first pattern is characterized by being in proximity to the downstream cylinder, with the presence of fewer undulations that extend downstream, and is categorized as Regime-2. Subsequently, a second pattern is identified, exhibiting more significant undulations and a greater amplitude of oscillations, bearing resemblance to the characteristics observed in region , and is therefore classified as Regime-3. The distinct regimes are clearly identified in Figure 6.
- Regime-3 (). The interaction occurring between the upper and lower sequences of elongated vortices, as observed in the region denoted as , results in the initiation of two-dimensional vortex shedding. However, when the situation is exposed to low-viscosity conditions, where the 2D instabilities responsible for the vortex shedding cease, the damping effect grows in their amplitude. This amplification process subsequently culminates in the formation of secondary vortices, as can be observed in Figure 6 for higher values of 5 and 6. This phenomenon, which is categorized as Regime-3, manifests at a considerable distance from the downstream cylinder and is evident across all conditions of Reynolds numbers for ratios of 5 and 6. The generation of secondary vortices is heavily influenced by both the Reynolds number, , and the ratio. As the Reynolds number increases, due to the inertial effects, the vortices become more pronounced, and the location where secondary vortices begin to form is displaced further downstream, as can be seen in Figure 6. Conversely, an increase in the ratio accelerates the shear layer “rolling-up” process, thereby facilitating faster shedding of vortices.
4.1.3. Periodicity and Frequency of Vortex Shedding
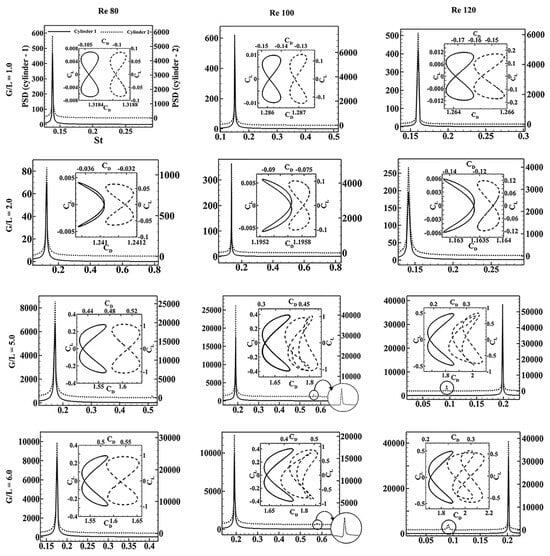
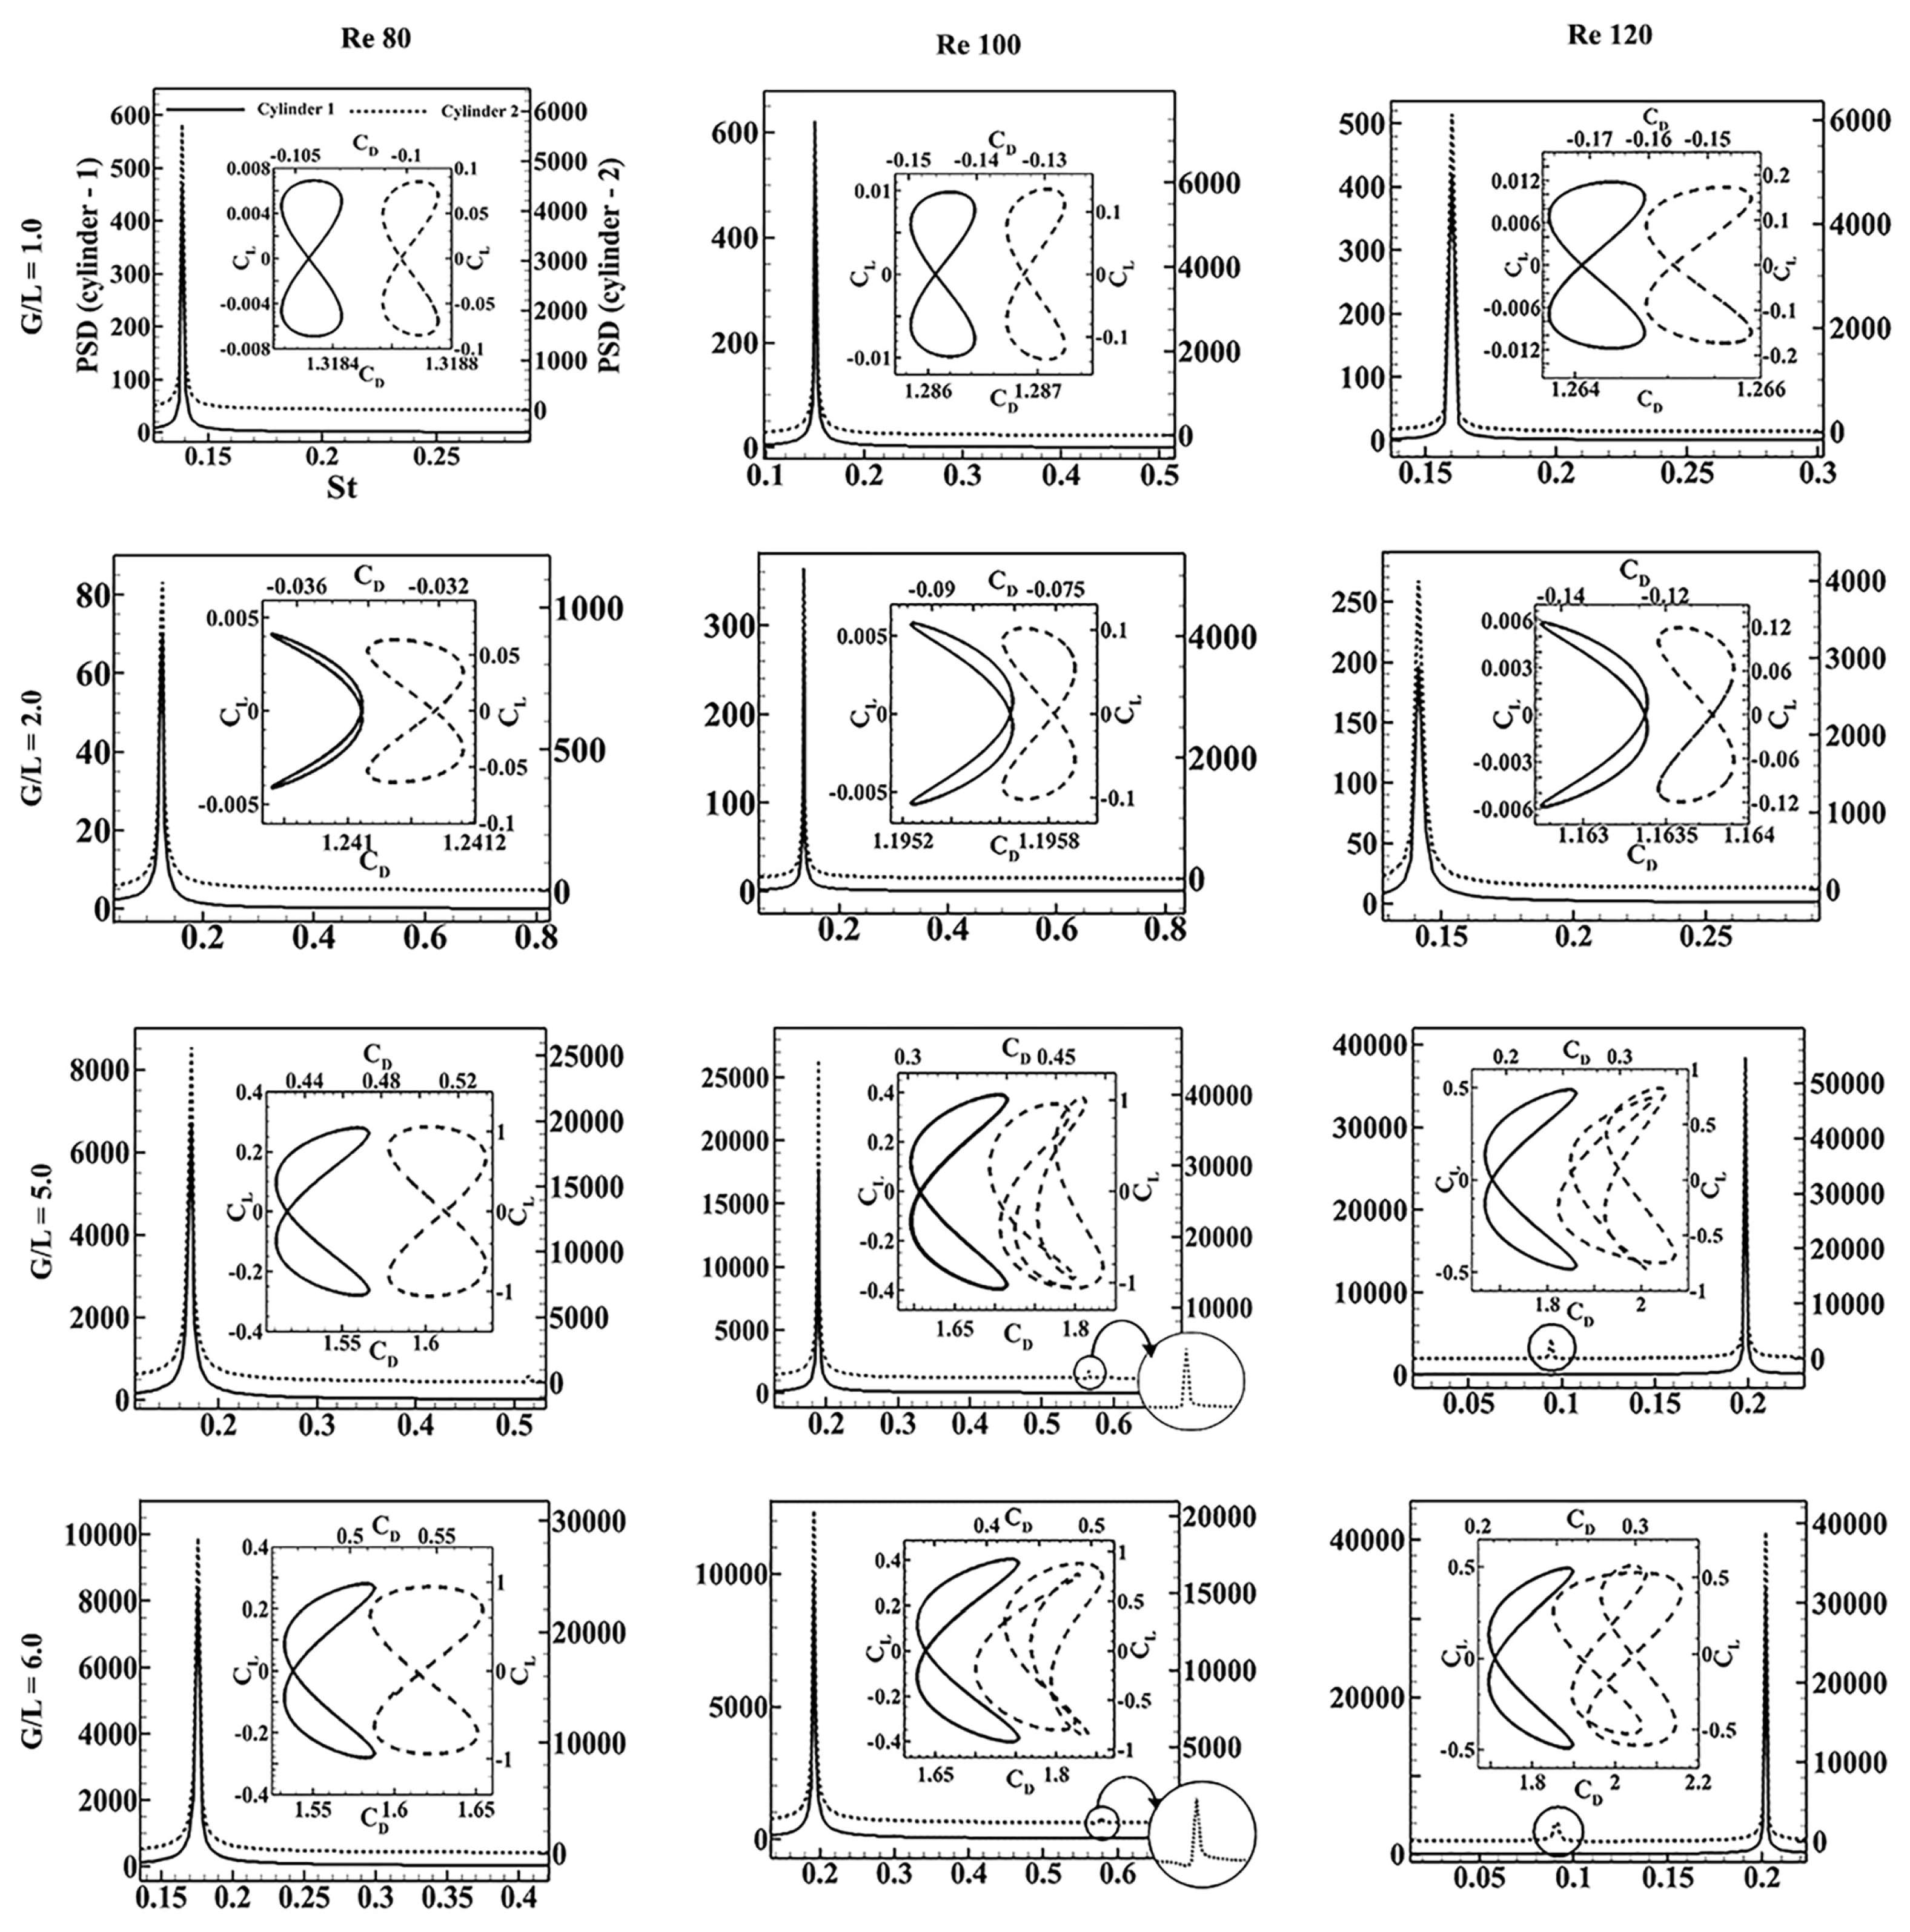
This analysis is conducted to estimate the vortex shedding frequency across different configurations characterized by varying Reynolds numbers () and the ratio. Also, the periodic nature of the vortex shedding is analyzed using the phase diagrams. Figure 7 presents the Fourier transform of with respect to time for both the upstream (Cylinder 1) and downstream (Cylinder 2) configurations.
Figure 7.
PSD of lift coefficient plotted for variety of and . The inset shows the corresponding phase diagrams ( vs. plot). The solid line indicates the upstream cylinder, and the dotted line indicates the downstream cylinder.
The non-dimensional shedding frequency, denoted as the Strouhal number (), is defined as Equation (12) and is conventionally obtained from the power spectral density analysis of the lift coefficient, which is represented on the horizontal axis, as shown in Figure 7. The plot distinguishes the two cylinders with different line styles, where the solid line corresponds to Cylinder 1, and the dotted line to Cylinder 2. It is noteworthy that across all examined scenarios, the predominant (vortex shedding) frequency of lift oscillations remains identical for both cylinders, regardless of the Reynolds number () and values. Moreover, to confirm the periodicity of the vortex shedding in each scenario, the phase diagram depicting the lift coefficient () versus the drag coefficient () is incorporated within every plot in Figure 7. The presence of a closed-loop nature for the phase diagram serves as an indicator of the periodic characteristics of the flow field around the cylinder. Also, the loops maintain a symmetry of about , which suggests that the cylinder undergoes oscillations around its mean position. Consequently, in a time-averaged framework, this results in zero net lift being generated by the cylinder. The drag coefficient associated with Cylinder 1 consistently exhibits positive values across all values of the ratio. Conversely, the behavior of the drag coefficient for Cylinder 2 is distinct, as it initially displays negative values when in the pre-critical range of . Subsequently, as the ratio surpasses its critical threshold, the drag coefficient transitions to positive values in the post-critical range. Furthermore, for at larger , a second harmonic component is exclusively observed for Cylinder 2, which is marked and highlighted in Figure 7 for enhanced clarity. More comprehensive analysis of this phenomenon will be provided in the forthcoming Section 4.3 on aerodynamic coefficients.
4.2. Wake Parameters
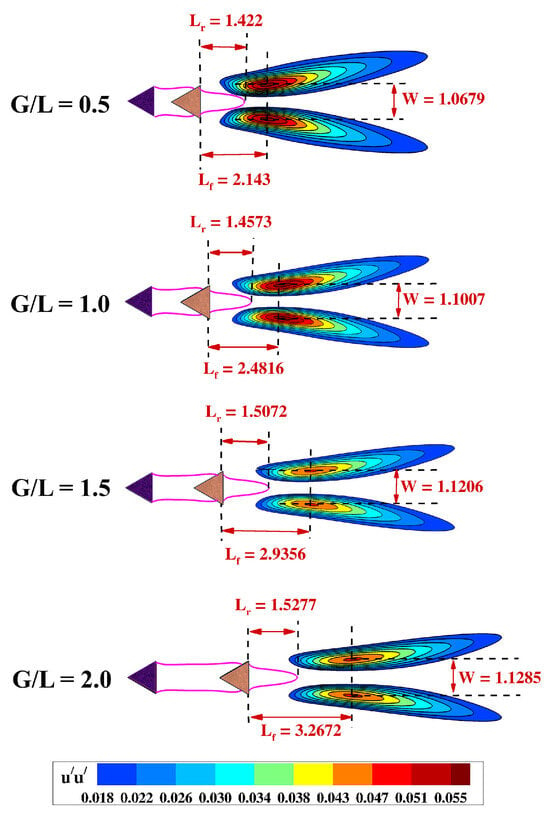
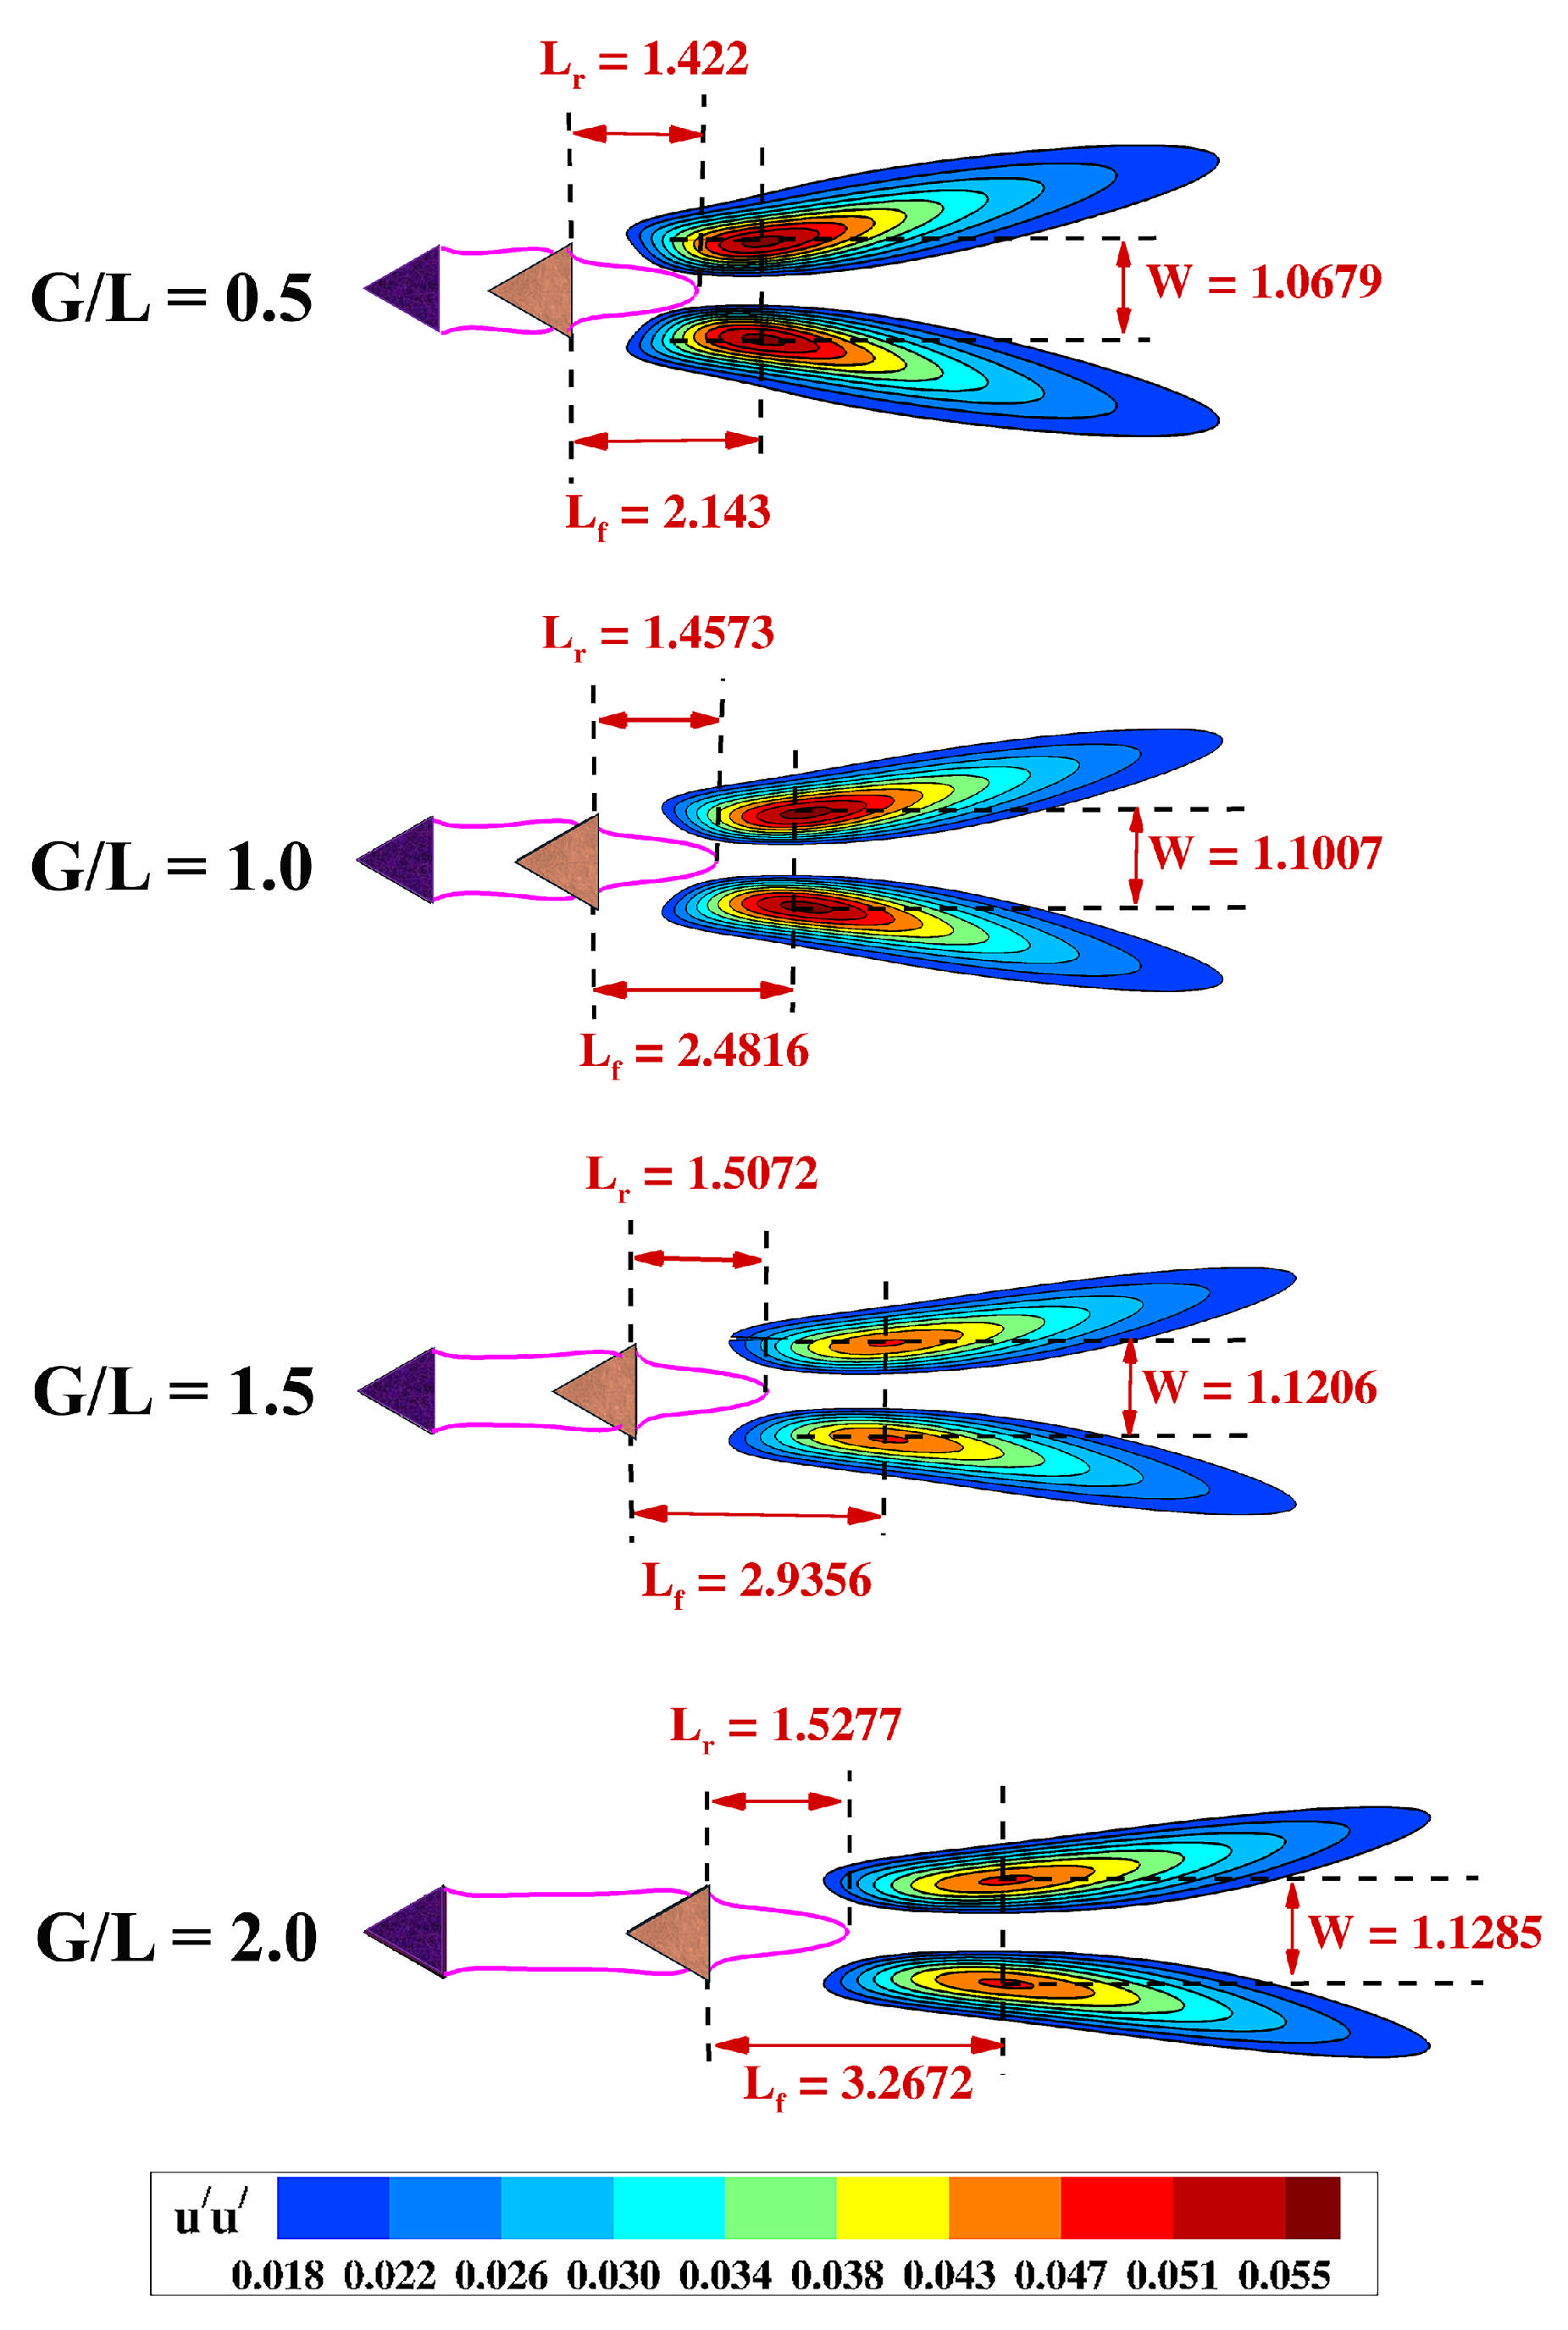
In this section, an extensive and detailed examination is provided that includes the consideration of three crucial parameters related to the dynamics of the wake, specifically focusing on the vortex formation length (), the recirculation bubble length (), and the wake width (W). Each of these parameters plays a pivotal role in influencing the wake dynamics and possesses significant implications for the aerodynamic characteristics related to the cylinder. Figure 8 displays the contours of the fluctuating component for various ratios for = 100. The parameter represents temporal variations in the streamwise velocity component u, and is computed as . Here, denotes the streamwise velocity averaged over time, and indicates the deviations from this mean flow speed. The length of vortex formation, denoted , is specified as the span that originates from the base of the downstream cylinder to the specific location along the centerline of the wake, where the fluctuations in velocity reach their peak value. Meanwhile, the wake width, symbolized as W, is quantified as the vertical separation between the locations of the peak velocity fluctuations located on opposite sides of the wake. The recirculation bubble is generally observed by graphically representing the contours where equals zero. This particular representation serves to demarcate the boundary that separates the recirculation region from the surrounding forward flow. The recirculation bubble length, symbolized as , can be estimated by evaluating the distance extending from the tip of this bubble back to the base of the cylinder, specifically traced along the centerline of the wake. All these definitions are taken from the literature [72,73].
Figure 8.
Contours of streamwise fluctuating velocities plotted for various ratios at = 100, along with the contour of = 0 (pink line). The vortex formation length (), the recirculation bubble length (), and the wake width (W) are evaluated and are indicated on the plot.
Typically, flow separation initiates from both the upper and lower surfaces of the cylinder, which subsequently leads to the development of shear layers along each side of the cylinder. These shear layers interact with one another, a process that plays a crucial role in the shear layer’s roll-up’, ultimately culminating in vortex shedding. In this study, it was observed that the shear layer, which detaches from the leading cylinder, subsequently converges with the second cylinder and interacts with the shear layer that forms in the wake of the downstream cylinder. In contrast to conventional interactions, the dynamics of this shear layer interaction are highly intricate. The shear layer ‘roll-up’ process is significantly influenced by both the Reynolds number () and the ratio, indicating a notable sensitivity to these parameters.
Figure 9 illustrates the variation of vortex formation length, the recirculation bubble length, and the wake width with different ratios at a Reynolds number () of 100. Upon examination, it becomes clear that all three of these parameters tend to increase with a rise in values when is maintained at 100, as depicted in Figure 9. A reduced vortex formation length indicates that vortices begin to form in proximity to the cylinder surface. As previously mentioned, when the ratio rises, there is a corresponding decline in interaction, causing the shedding mechanism to become less pronounced. As a result, there will be a delay in the shedding process, which, in turn, leads to an elongation of the vortex formation length as the ratio of is augmented. In a similar manner, the wake becomes broader, and the recirculation bubble extends further along the streamwise direction with an increase in the ratio. It is important to underscore that the trio of parameters addressed within this section plays a crucial role in influencing the vortex shedding phenomena and the aerodynamic properties of the flow. These parameters serve as the underlying explanation for numerous aspects of wake dynamics, which will be elaborated upon in the following sections.
Figure 9.
Variation of vortex formation length, recirculation bubble length and the wake width are plotted with various ratios at = 100.
4.3. Aerodynamic Coefficients
The aerodynamic force coefficients, which include the lift coefficient (), the drag coefficient (), and their statistical interpretations, are calculated using Equations (4)–(11). Note that, in the subsequent sections, an ‘’ and ’ are used to denote the time-averaged and root mean squared quantities. This section elaborates on how these coefficients vary with changes in the Reynolds number and the ratio.
4.3.1. Coefficient of Drag
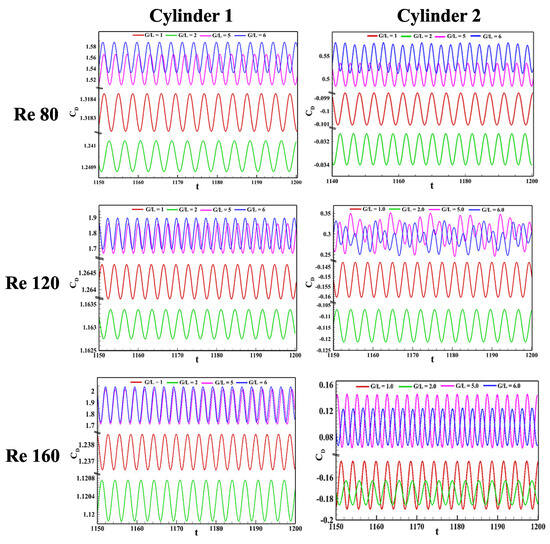
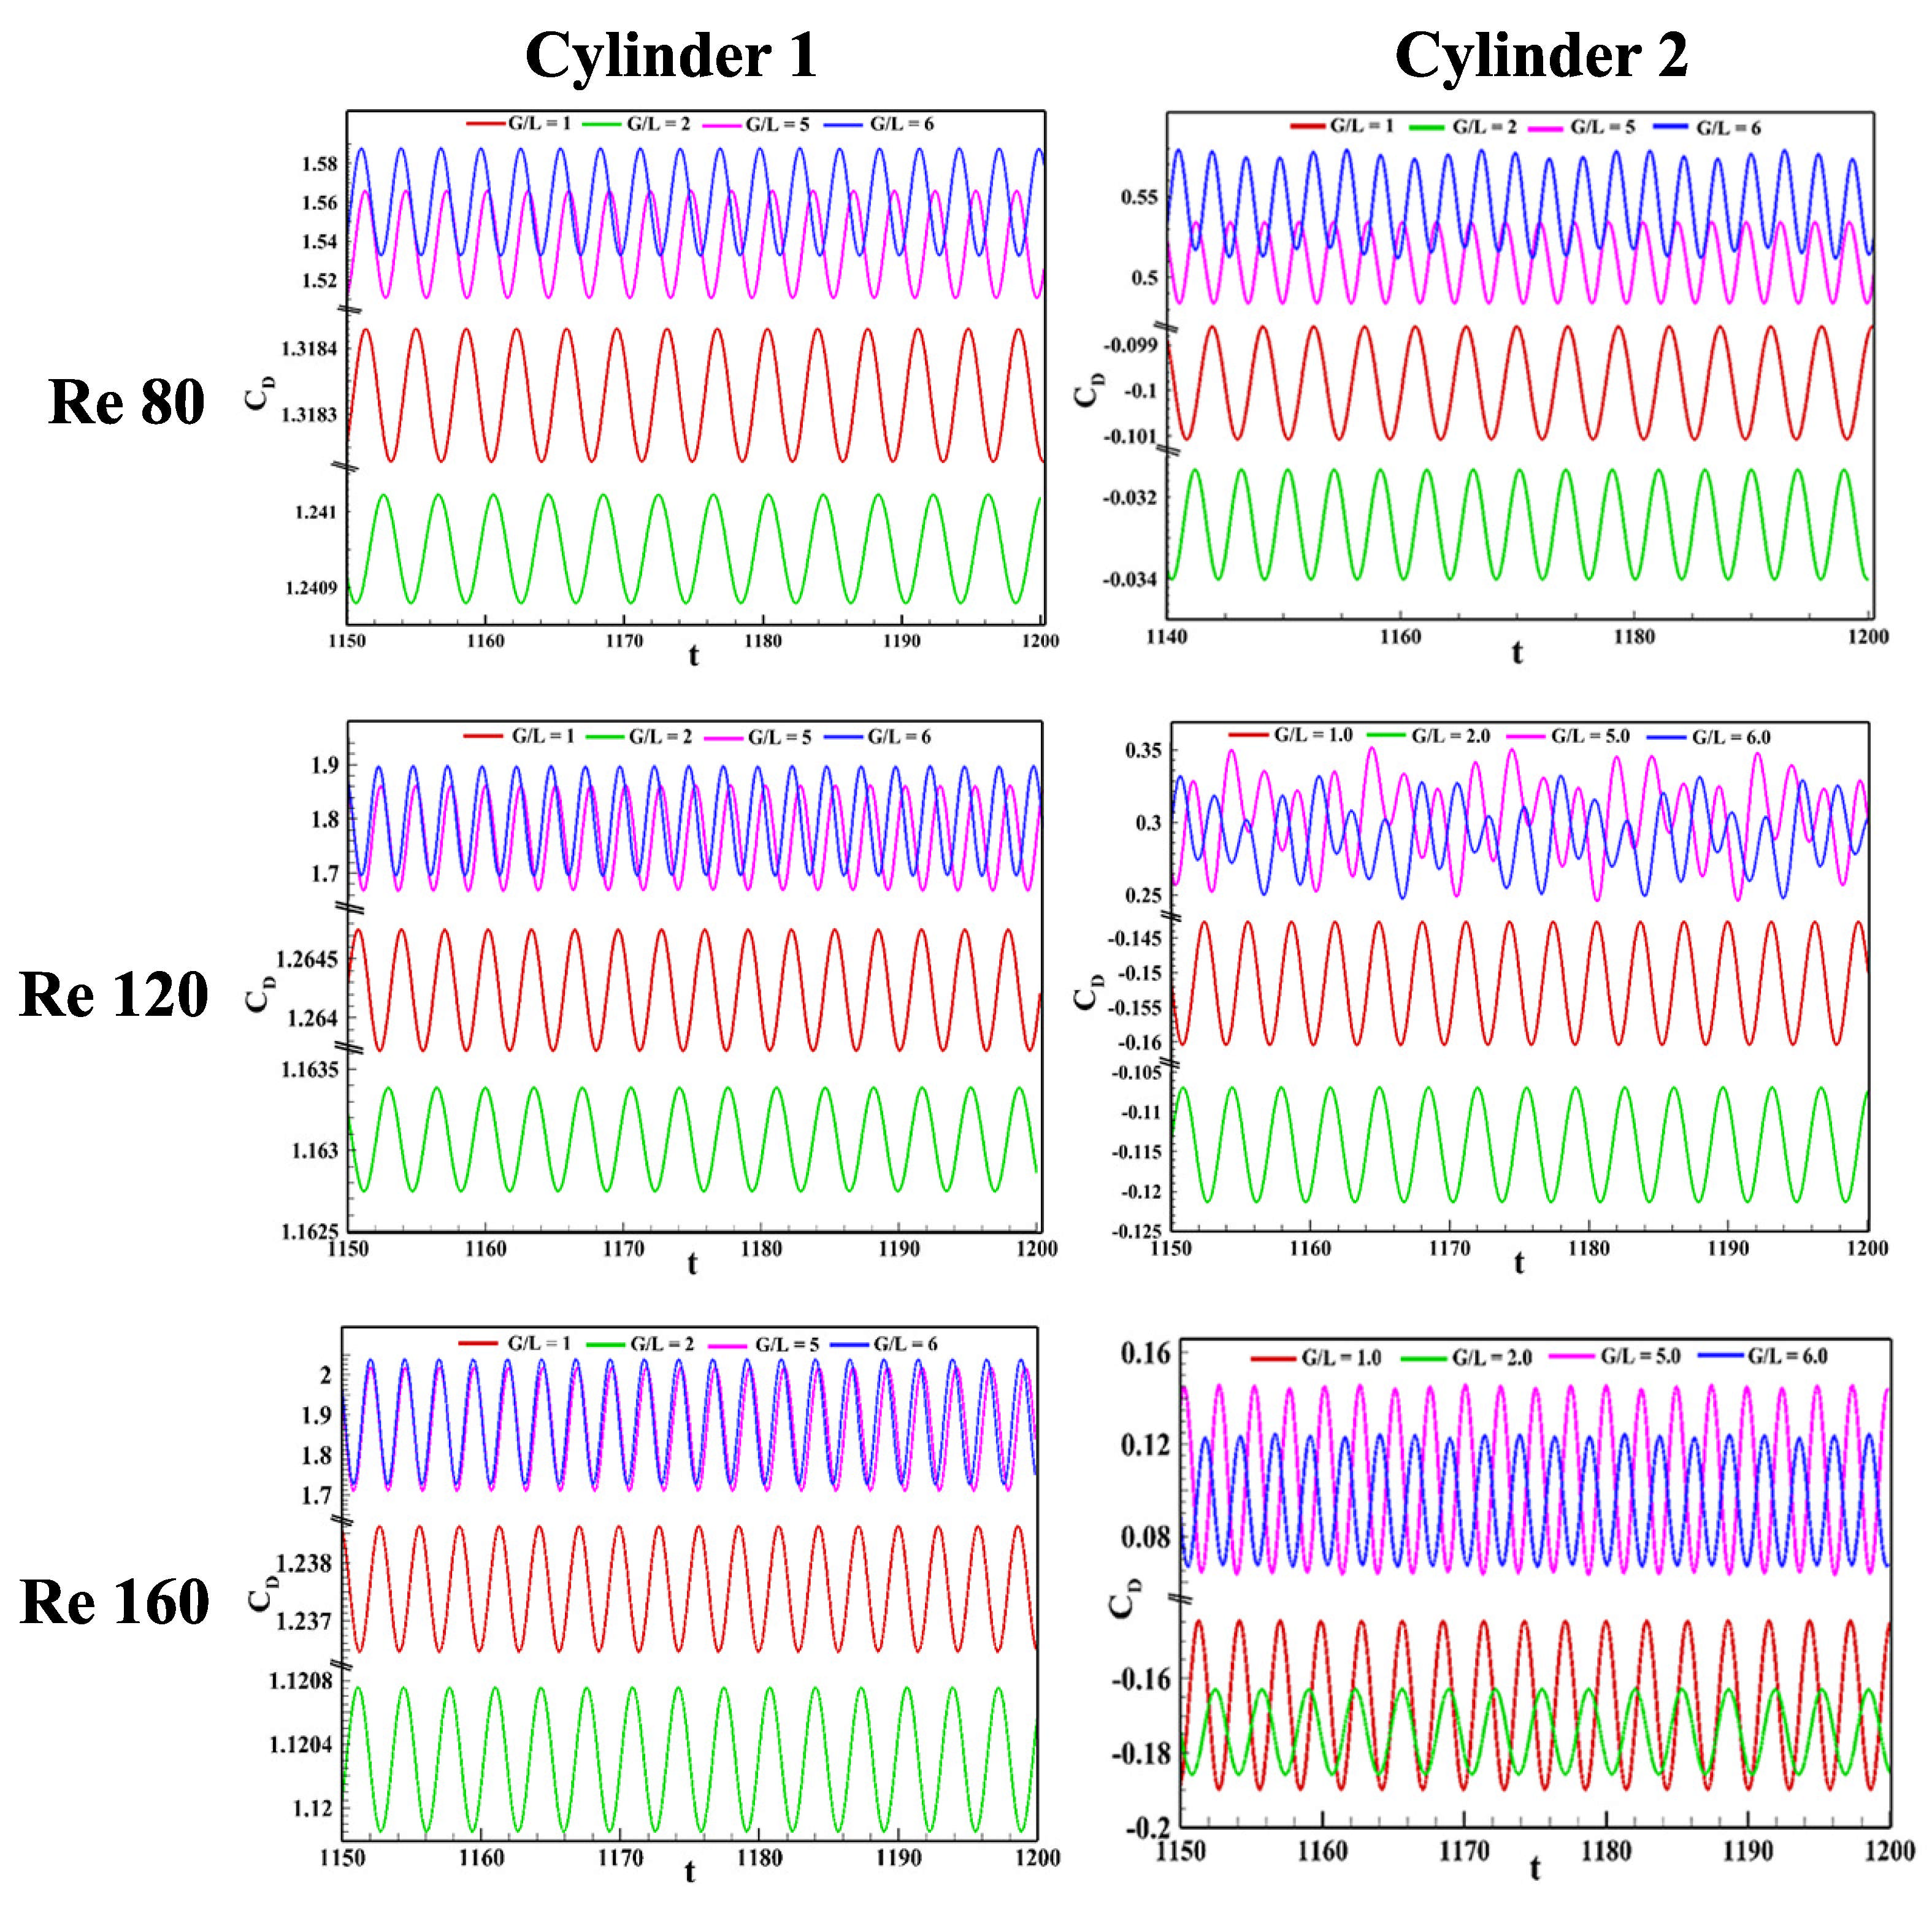
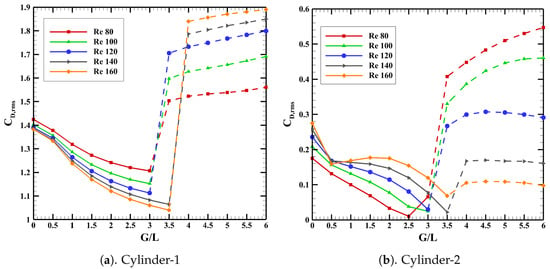
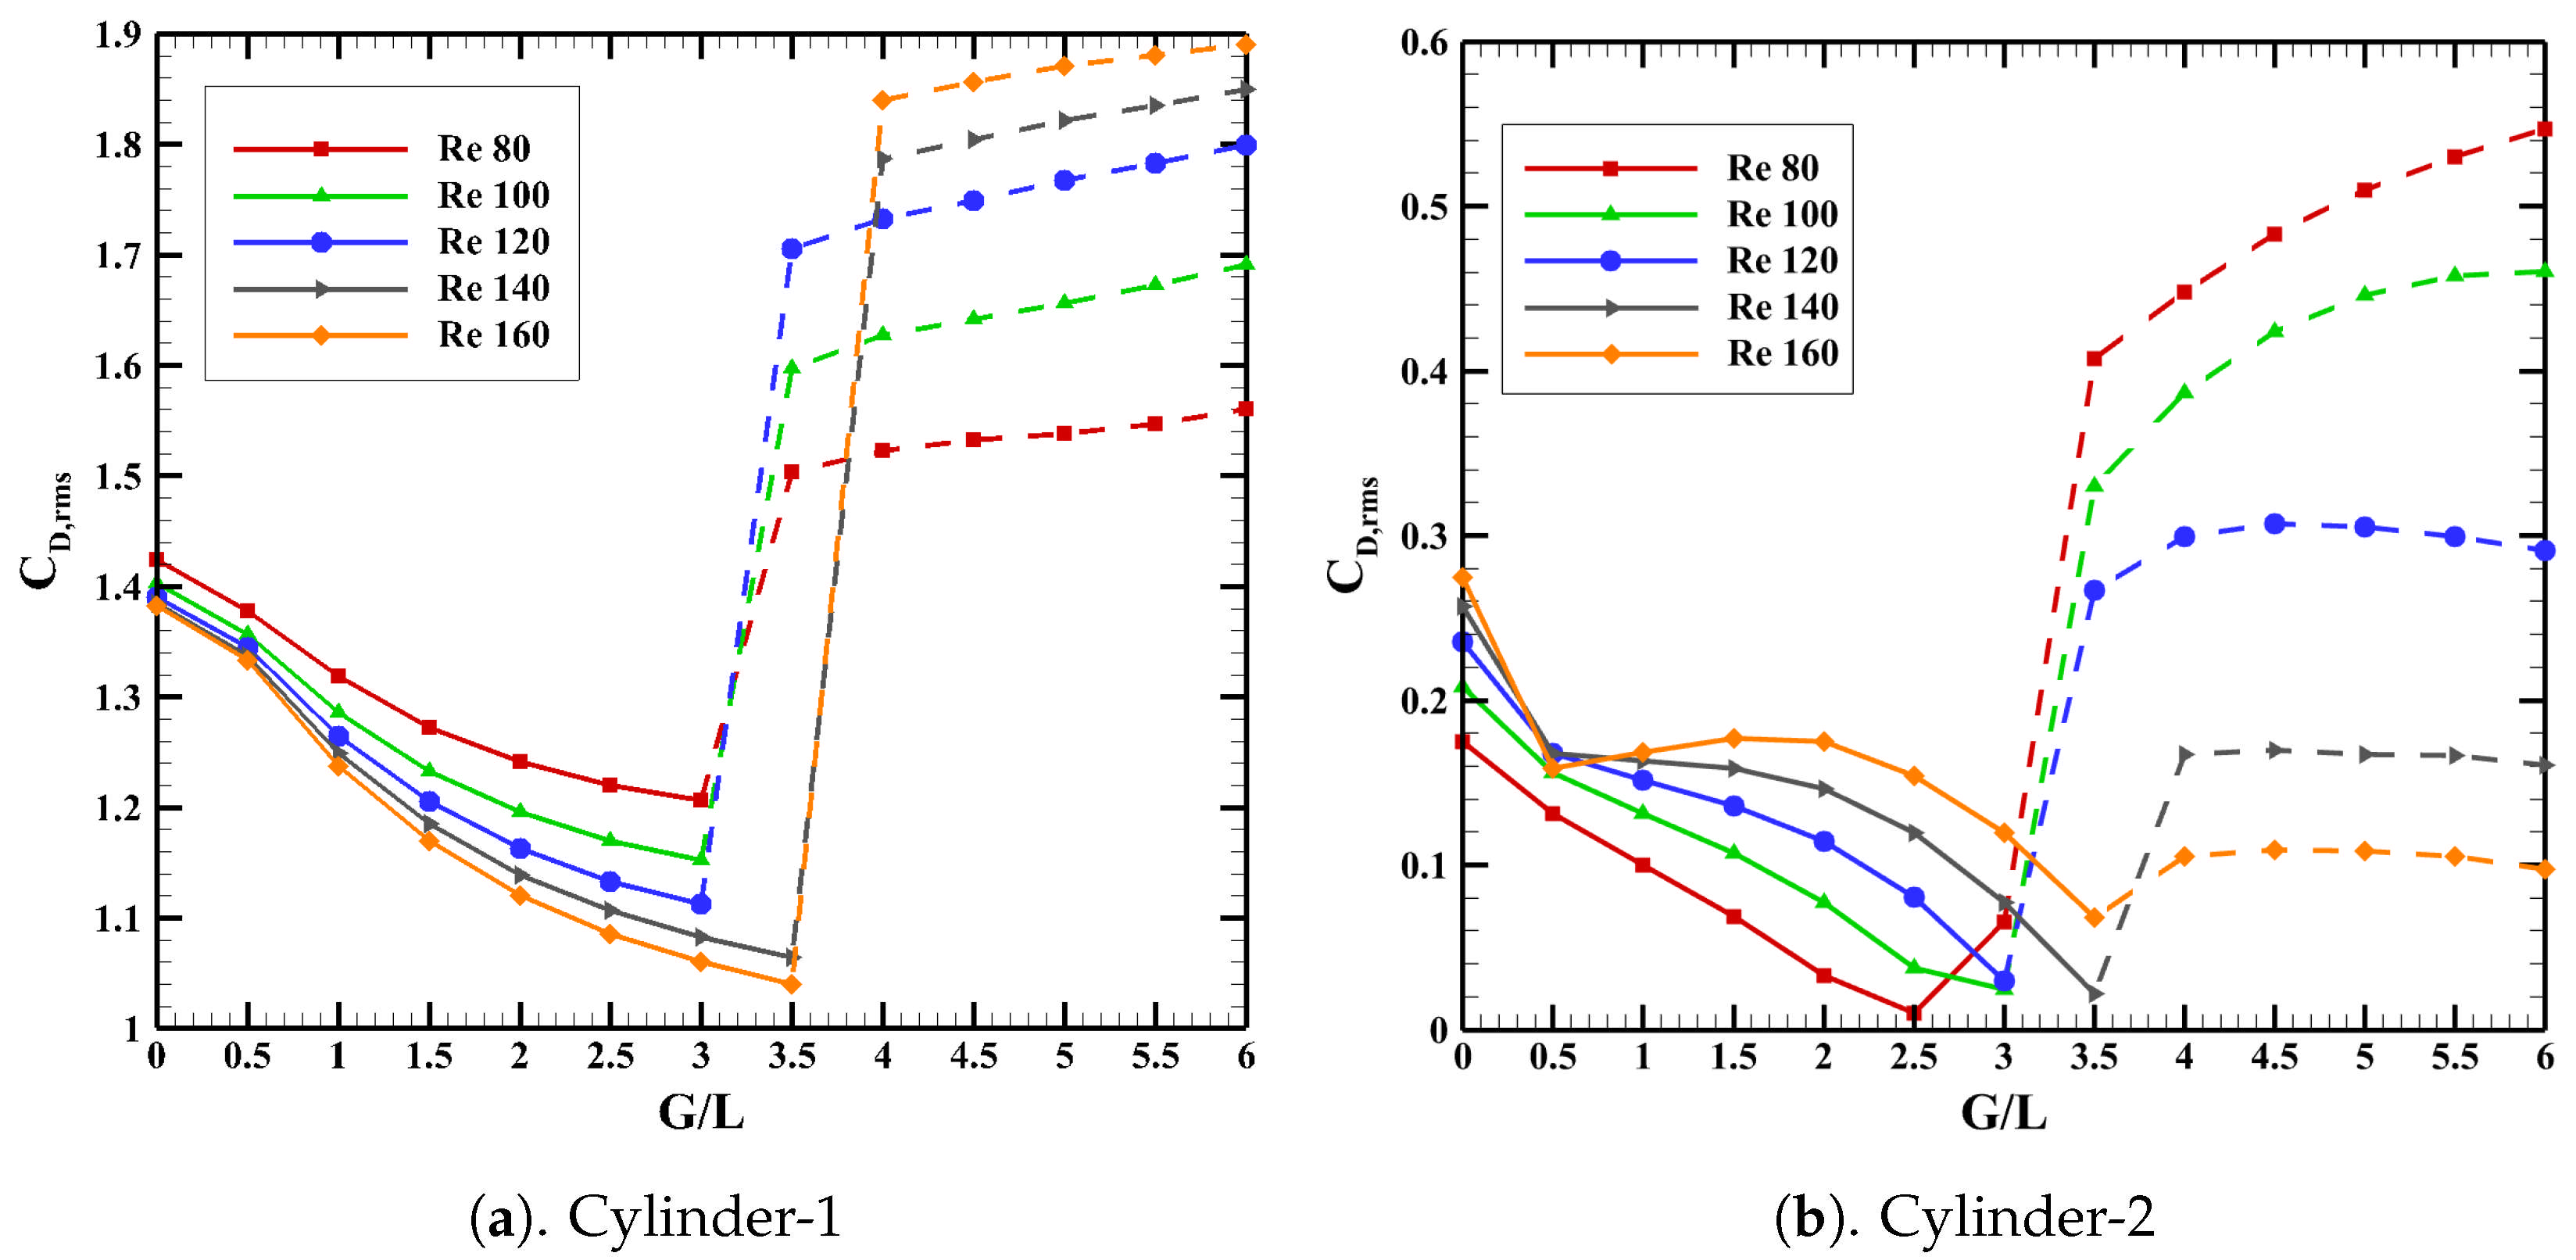
The temporal evolution of the drag coefficient () for both upstream and downstream cylinders over the interval from to 1200 is depicted in Figure 10, for different values of the gap-to-length ratio () and Reynolds number (). It is observed that the upstream cylinder experiences a positive drag across the entire range of values considered. In contrast, the second cylinder demonstrates an initial negative drag coefficient, maintaining this behavior until it reaches a critical threshold of the ratio. Beyond this critical point, the downstream cylinder exhibits transitions to positive drag, which will be discussed later in this section. Significant effects are observed on the magnitude and the amplitude of the drag force experienced by the upstream cylinder when a second cylinder is introduced in its wake. For every case examined, the drag coefficient of the downstream cylinder is consistently found to be lower than that of the upstream cylinder. The root mean square values associated with the oscillations of the drag coefficient are calculated and plotted in Figure 11 against varying ratios of and Reynolds numbers (). From the figure, it can be concluded that the amplitude of the drag coefficient for cylinder-2 is consistently lower than that for cylinder-1, irrespective of the values of and . Examination reveals that for cylinder-1, there is a noticeable decrease in the amplitude of the drag oscillations as both and increase, up to a critical threshold of , after which an increase is observed. For cylinder-2, the amplitude of drag oscillations decreases with an increase in and a decrease in , up to a certain critical point of . Beyond this critical point, the amplitude begins to increase with further increases in , especially at lower values of , while it tends to stabilize at higher levels of .
Figure 10.
Temporal Variation of for various combinations of and for both upstream and downstream cylinders. The dataset is limited from t = 1150 to 1200 for better visual clarity.
Figure 11.
Variation of the rms of the drag coefficient with various and .
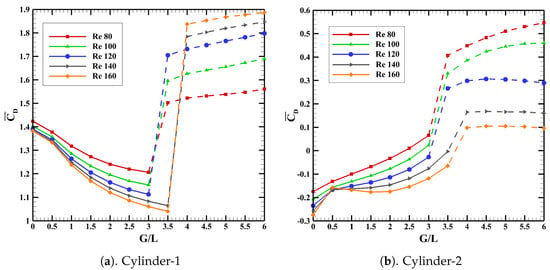
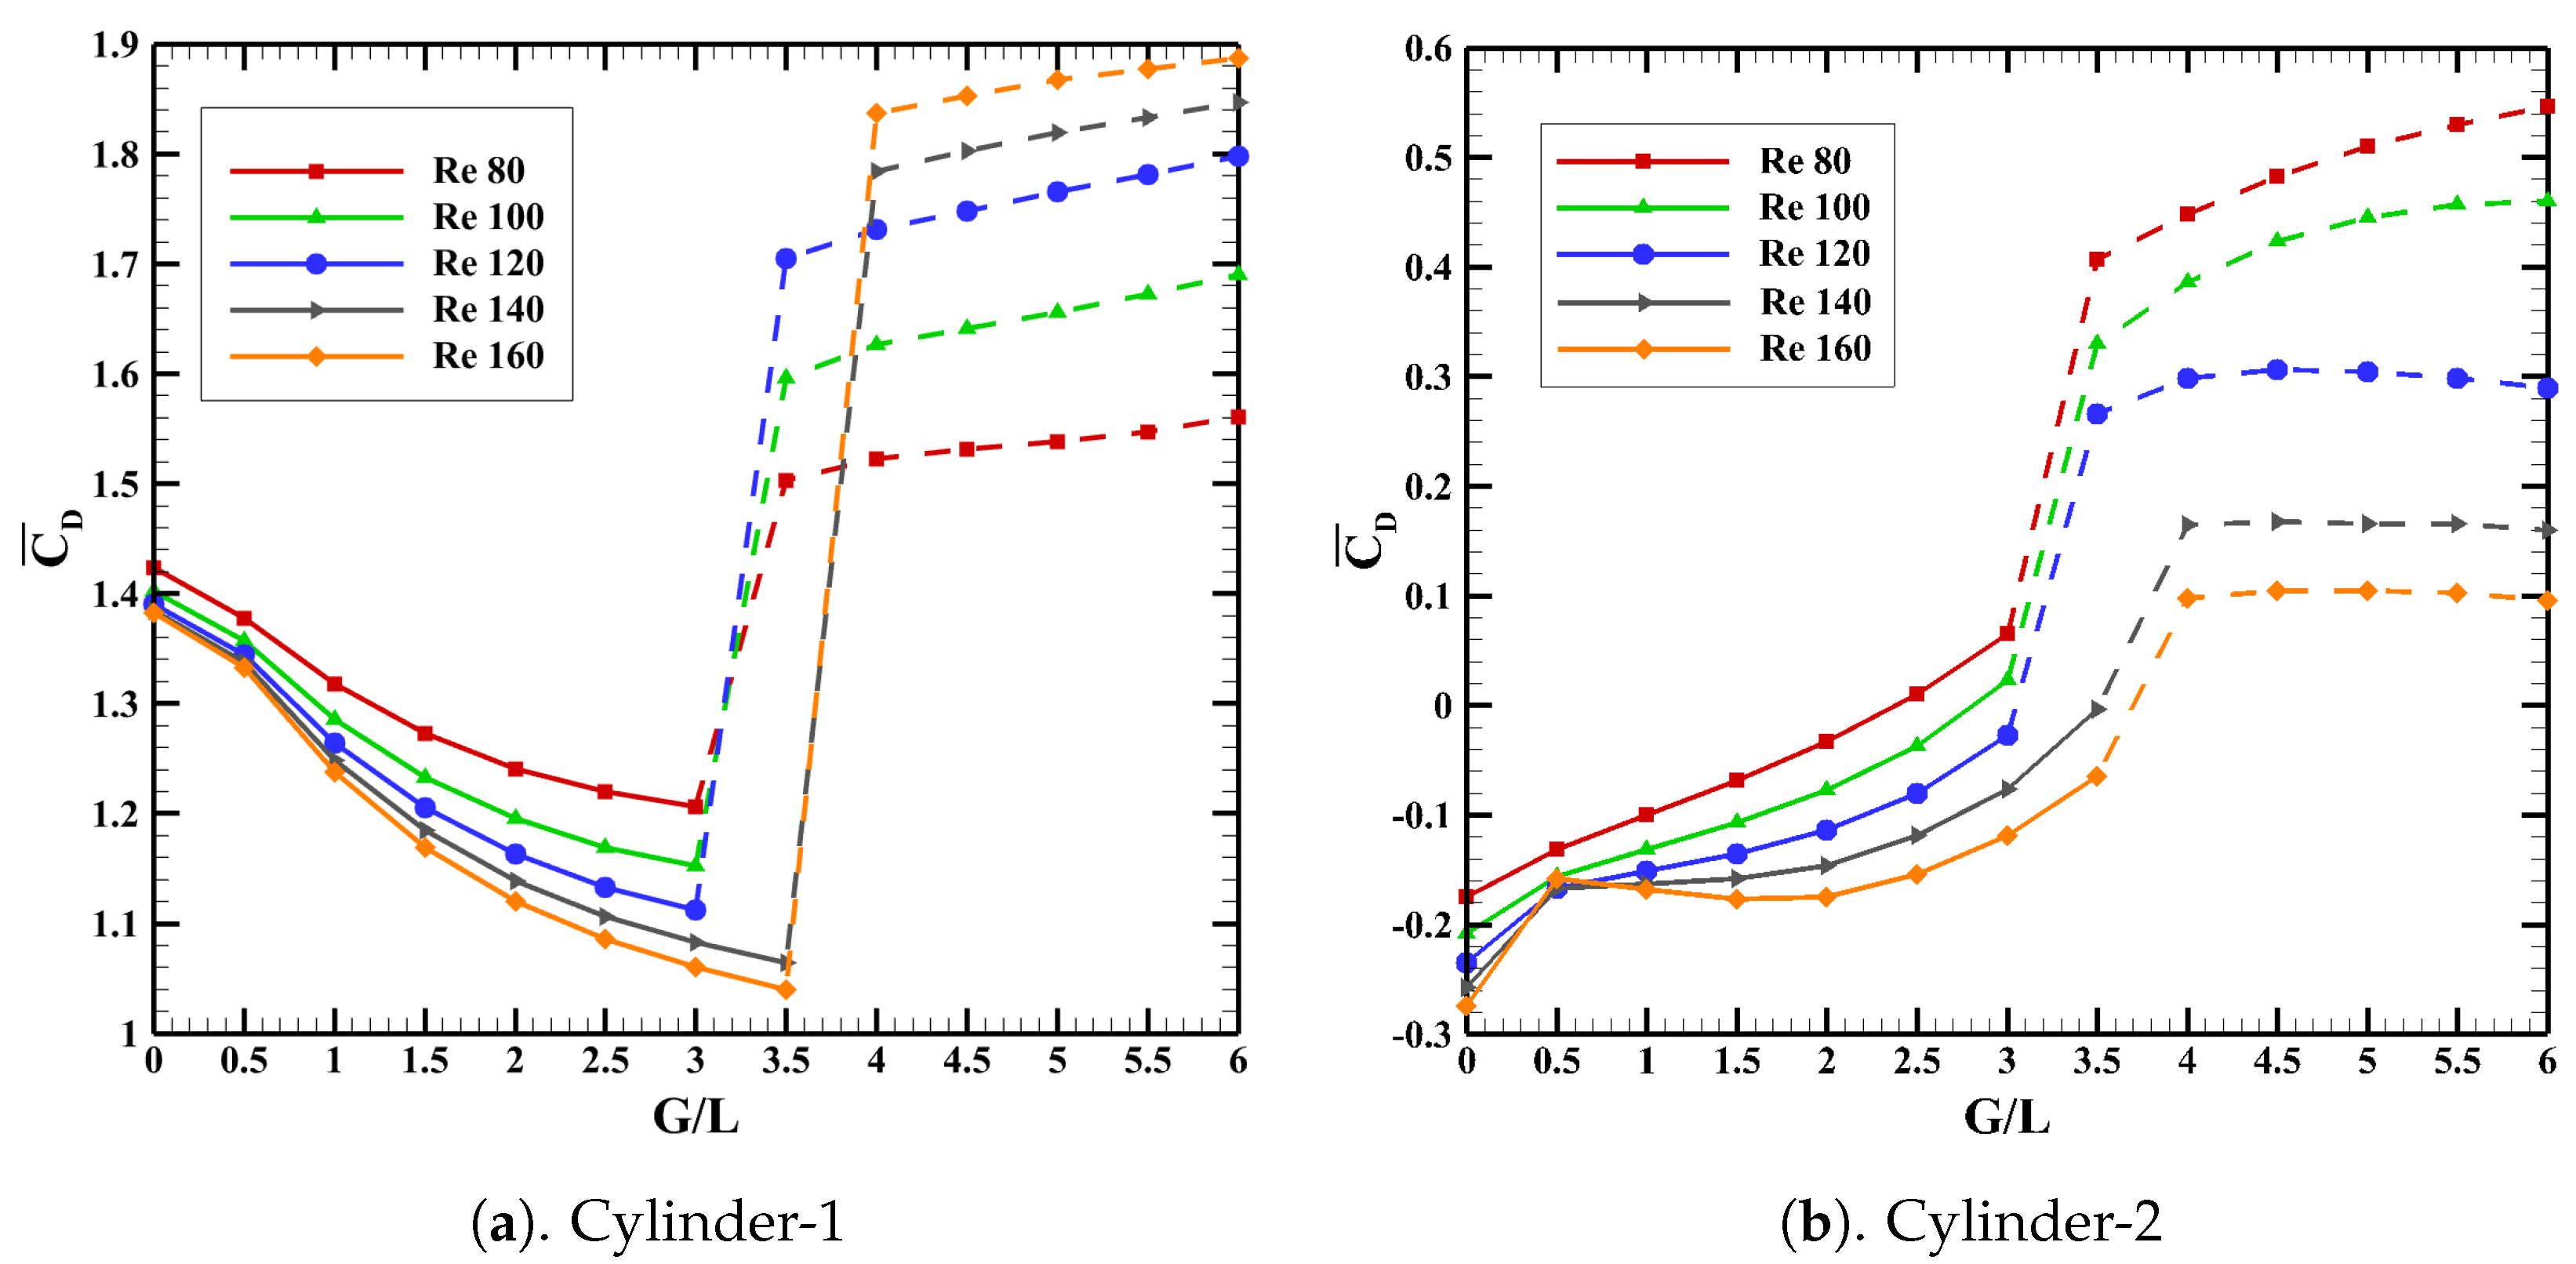
Figure 12 consolidates the variation of the time-averaged drag coefficient plotted against ratio for different . This plot reinforces the observation that cylinder-1 consistently demonstrates positive drag throughout the range of and values. In contrast, cylinder-2 exhibits negative drag prior to reaching the , and then proceeds to the regime of positive drag. The absence of vortex shedding between cylinder-1 and cylinder-2, coupled with an increase in the gap ratio , leads to a reduction in fluctuations in the wake of cylinder-1. Consequently, the mean (time-averaged) drag coefficient of cylinder-1 decreases in the precritical regime. Surpassing , the flow pattern in the wake behind cylinder-1 transitions into a more unstable phase, which is associated with a notable increase in the drag coefficient. Also, it is found that the increases consistently with an increase in , as seen in Figure 12. For the downstream cylinder, this behavior contrasts with the trend observed for the upstream cylinder after exceeding the critical threshold . Of particular interest is the transition of the drag coefficient from negative to positive values, which is closely aligned with the critical value . This emphasizes the importance of the threshold in defining the specific drag characteristics of the downstream cylinder. With respect to cylinder-2, it is observed that the average drag coefficient progressively increases throughout the range for any specified Reynolds number, . The critical gap ratio marks a significant transition point where the average drag coefficient shifts from negative to positive. Furthermore, it should be highlighted that the mean drag coefficient tends to decrease as the Reynolds number increases in all the ratios considered. In every scenario involving , the calculated mean drag coefficient values for cylinders 1 and 2 arranged in the specified tandem configurations were consistently found to be less than those recorded for the configuration featuring a solitary equilateral triangular cylinder. Regardless of the parameters and , the mean drag coefficient for both cylinders remained always below that of a single cylinder in all conditions evaluated.
Figure 12.
Variation of time-averaged drag coefficient with various and .
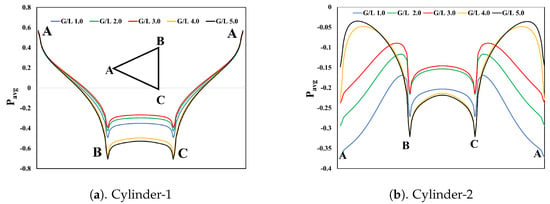
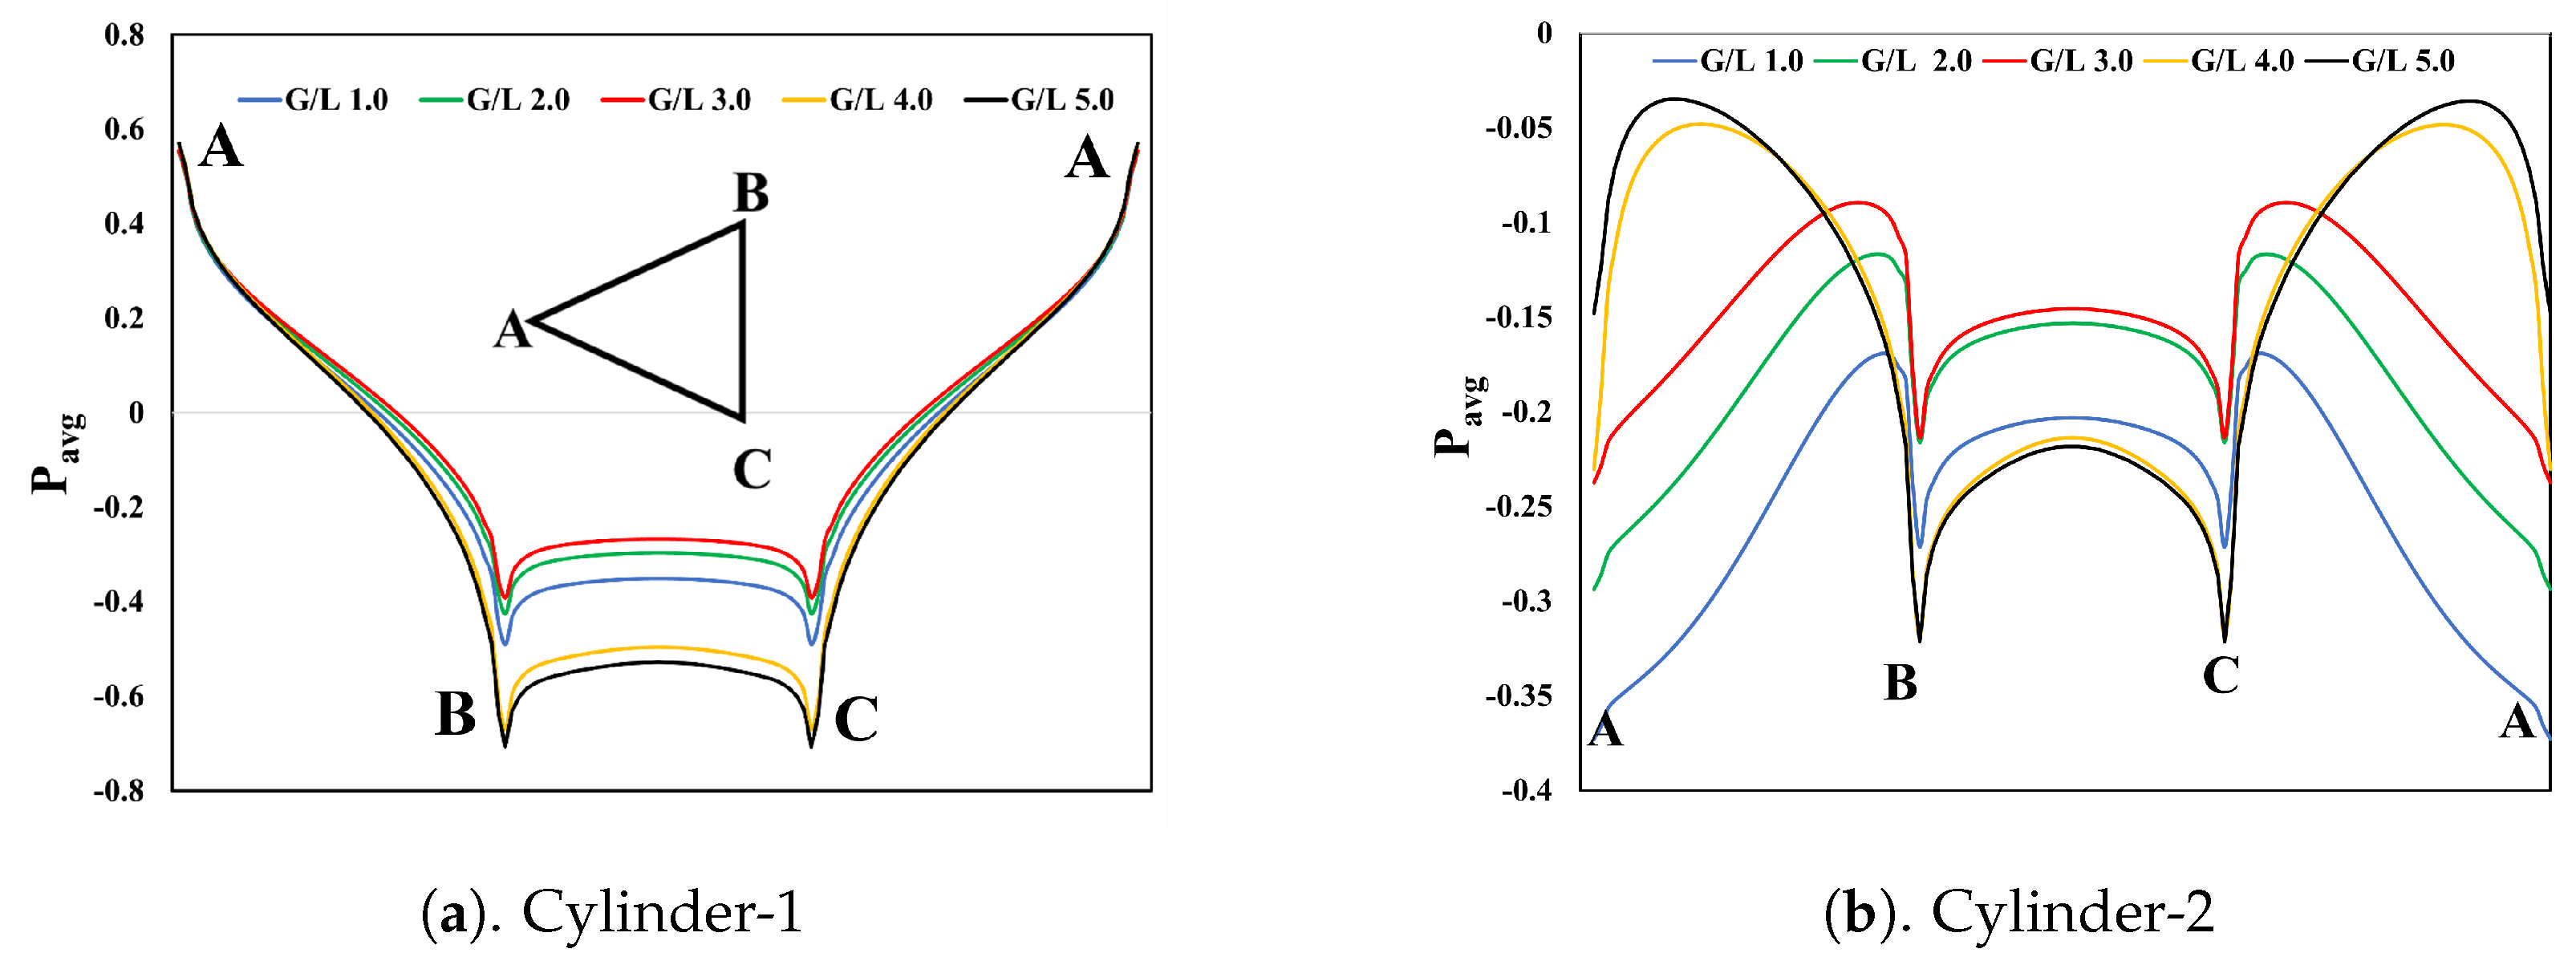
The time-averaged static pressure distribution around the upstream and the downstream cylinders at and of and is shown in Figure 13. The net drag acting on the triangular cylinders primarily arises from the pressure imbalance between the high-pressure region on the upstream faces and the low-pressure region in the wake. Variations in the surface pressure distribution directly modify this imbalance, thereby leading to a corresponding increase or decrease in the overall drag force.
Figure 13.
Time-averaged static pressure distribution around the cylinders for various and .
Point A represents the front stagnation point, and B and C represent the rear corners of the cylinders. For Cylinder 1, the flow is observed to accelerate from A toward B and C, as evidenced by the monotonic decrease in pressure from A, reaching a minimum at B and C. For Cylinder 1, across all values of G/L, the pressure at the front stagnation point remains higher than that at the base, indicating that Cylinder 1 experiences positive drag over the entire range of G/L. The base pressure of Cylinder 1 increases (i.e., the suction weakens) up to the critical G/L, which effectively reduces the pressure difference across the cylinder and consequently lowers the net drag. Beyond the critical G/L, the base region of Cylinder 1 is subjected to increasingly negative pressure with further increases in G/L, resulting in an enhancement of the drag force acting on the cylinder. The trend of the mean drag coefficient with respect to G/L for Cylinder 1, shown in Figure 12, is in agreement with the above observations.
For all gap ratios, the pressure remains negative around the entire perimeter (A–B–C–A), indicating that Cylinder 2 is fully submerged in the low-pressure wake of Cylinder 1 rather than seeing a stagnation region at its front face. For Cylinder 2, the pressure at point A is lower than the base pressure up to the critical G/L, resulting in a negative drag acting on the cylinder. Beyond the critical G/L, the front stagnation pressure exceeds the base pressure, thereby subjecting Cylinder 2 to positive drag. As G/L increases from 1 to 3, the entire pressure distribution shifts upward, with the most pronounced change occurring between G/L = 1 and 2. This upward shift leads to an overall increase in the net drag on Cylinder 2. Beyond the critical G/L, at larger spacings (G/L = 4 and 5), the pressure along the sides AB and AC becomes less negative, while the base region experiences slightly stronger suction. Consequently, the pressure-induced drag continues to increase beyond the critical G/L, as reflected in the variation of the mean drag coefficient for Cylinder 2 shown in Figure 12. In comparison with Cylinder 1, the pressure along the sides AB and AC of Cylinder 2 increases from point A toward B and C, reaches a maximum, and then decreases to a minimum at B and C.
4.3.2. Coefficient of Lift
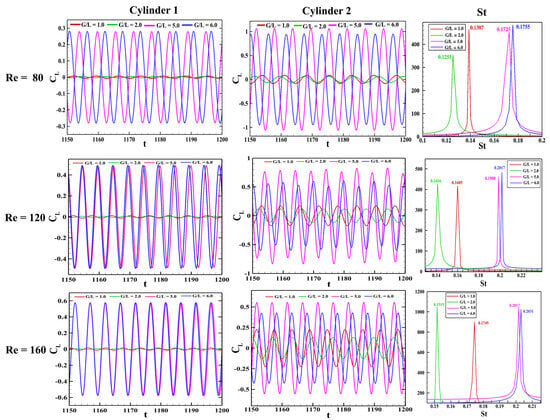
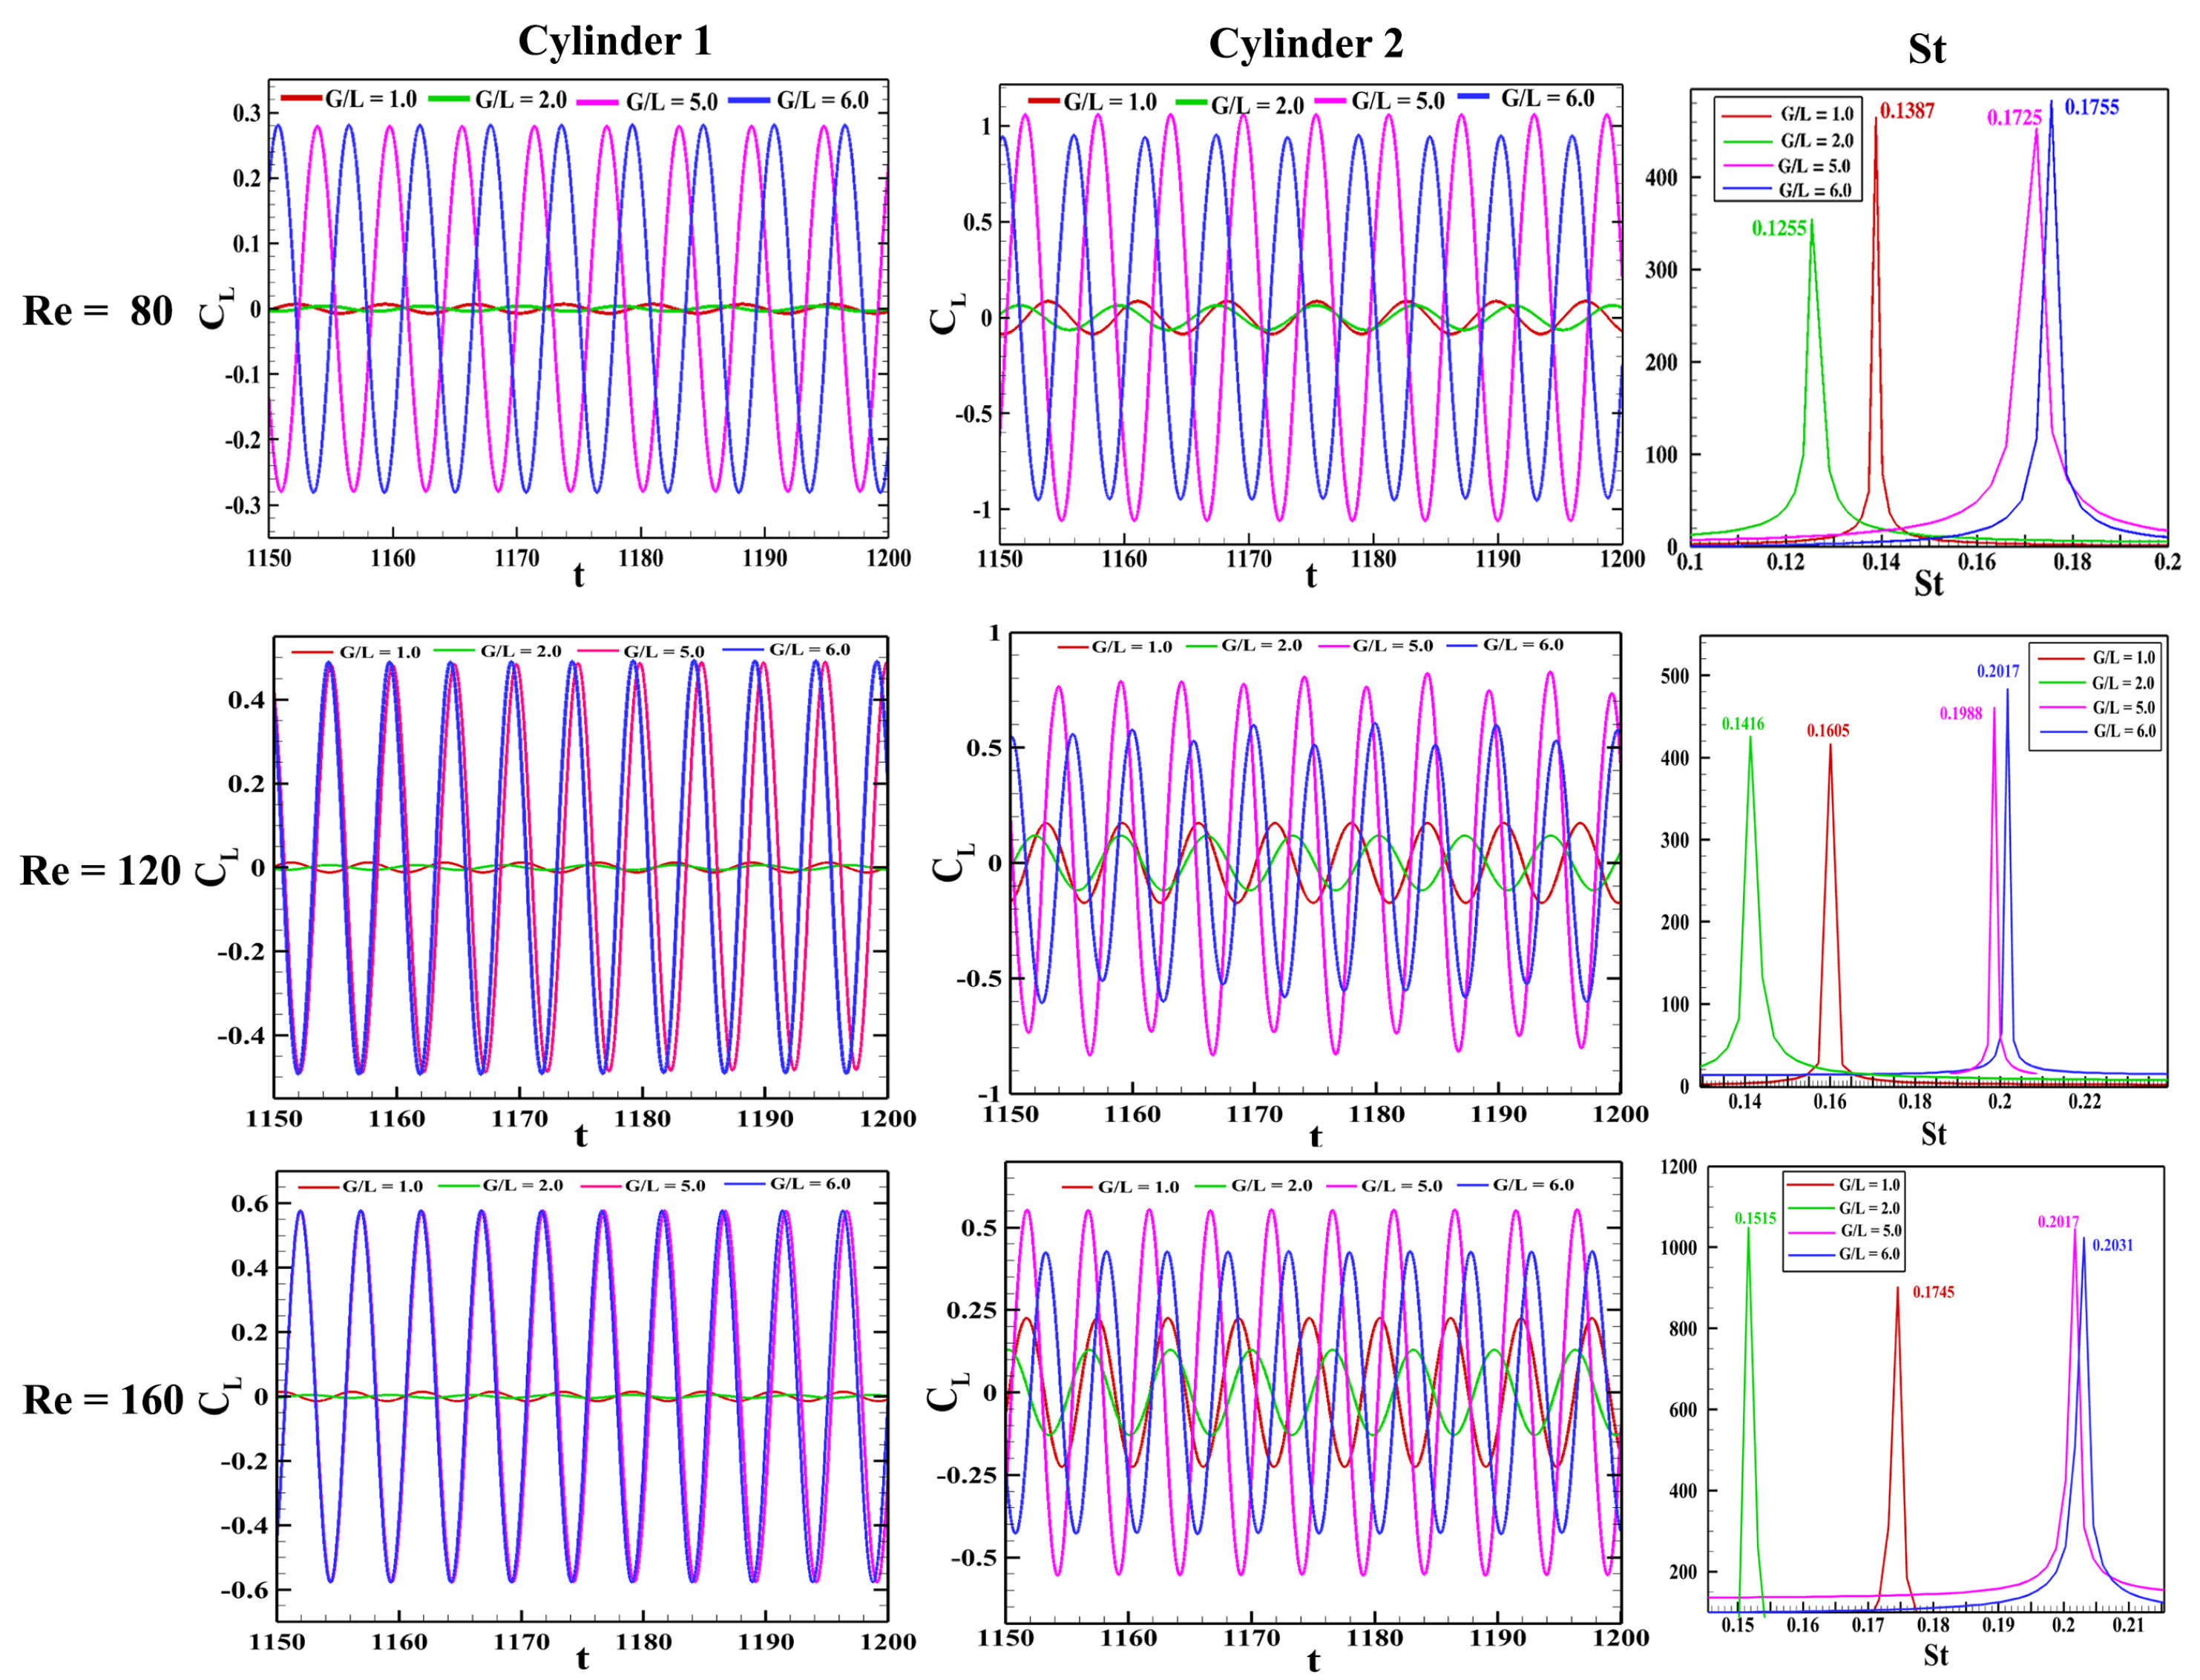
The temporal evolution of the lift coefficient for both the upstream and downstream cylinders, across varying values of the gap ratio () and Reynolds number (), is illustrated in the initial two columns of Figure 14. The third column presents the power spectrum density (PSD) corresponding to the oscillations of the lift coefficient . For all the representative cases demonstrated, a single dominant frequency is evident, identifiable as the vortex shedding frequency, and is denoted by the Strouhal number (). The values corresponding to each case are indicated on the plot itself. It is important to note that = 1.0 and 2.0 fall within the pre-critical regime, whereas 5.0 and 6.0 pertain to the post-critical regime for all Reynolds numbers considered. It can be observed from the third column that before the critical gap ratio is reached, the Strouhal number exhibits a declining trend as the gap-to-length ratio increases. However, once the critical gap ratio is crossed, the situation reverses, with beginning to rise as the continues its increase. The details about the aspects of will be discussed in Section 4.4 of this paper. Notably, there is a considerable rise in the amplitude of the lift coefficient for both cylinders, particularly for the upstream cylinder, upon attaining the critical gap ratio due to vortex shedding from both cylinders (first and second columns of Figure 14). Conversely, for the downstream cylinder, this pronounced trend tends to become less distinct when subjected to higher Reynolds numbers. The root mean square (rms) value of the lift coefficient over time, denoted as , was subjected to additional analysis to gain a deeper understanding of oscillation amplitudes and to evaluate the influence of the Reynolds number () and the ratio on these oscillations.
Figure 14.
Temporal evolution of lift coefficient at different and combinations for the upstream (first column) and downstream (second column) cylinders. The plot is zoomed from t = 1150 to 1200 for better clarity and understanding. The third column represents the power spectrum density plot of the -time response (first column) to estimate the Strouhal number () for the upstream cylinder (which is the same as the downstream cylinder).
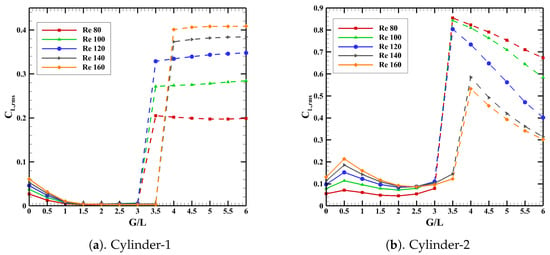
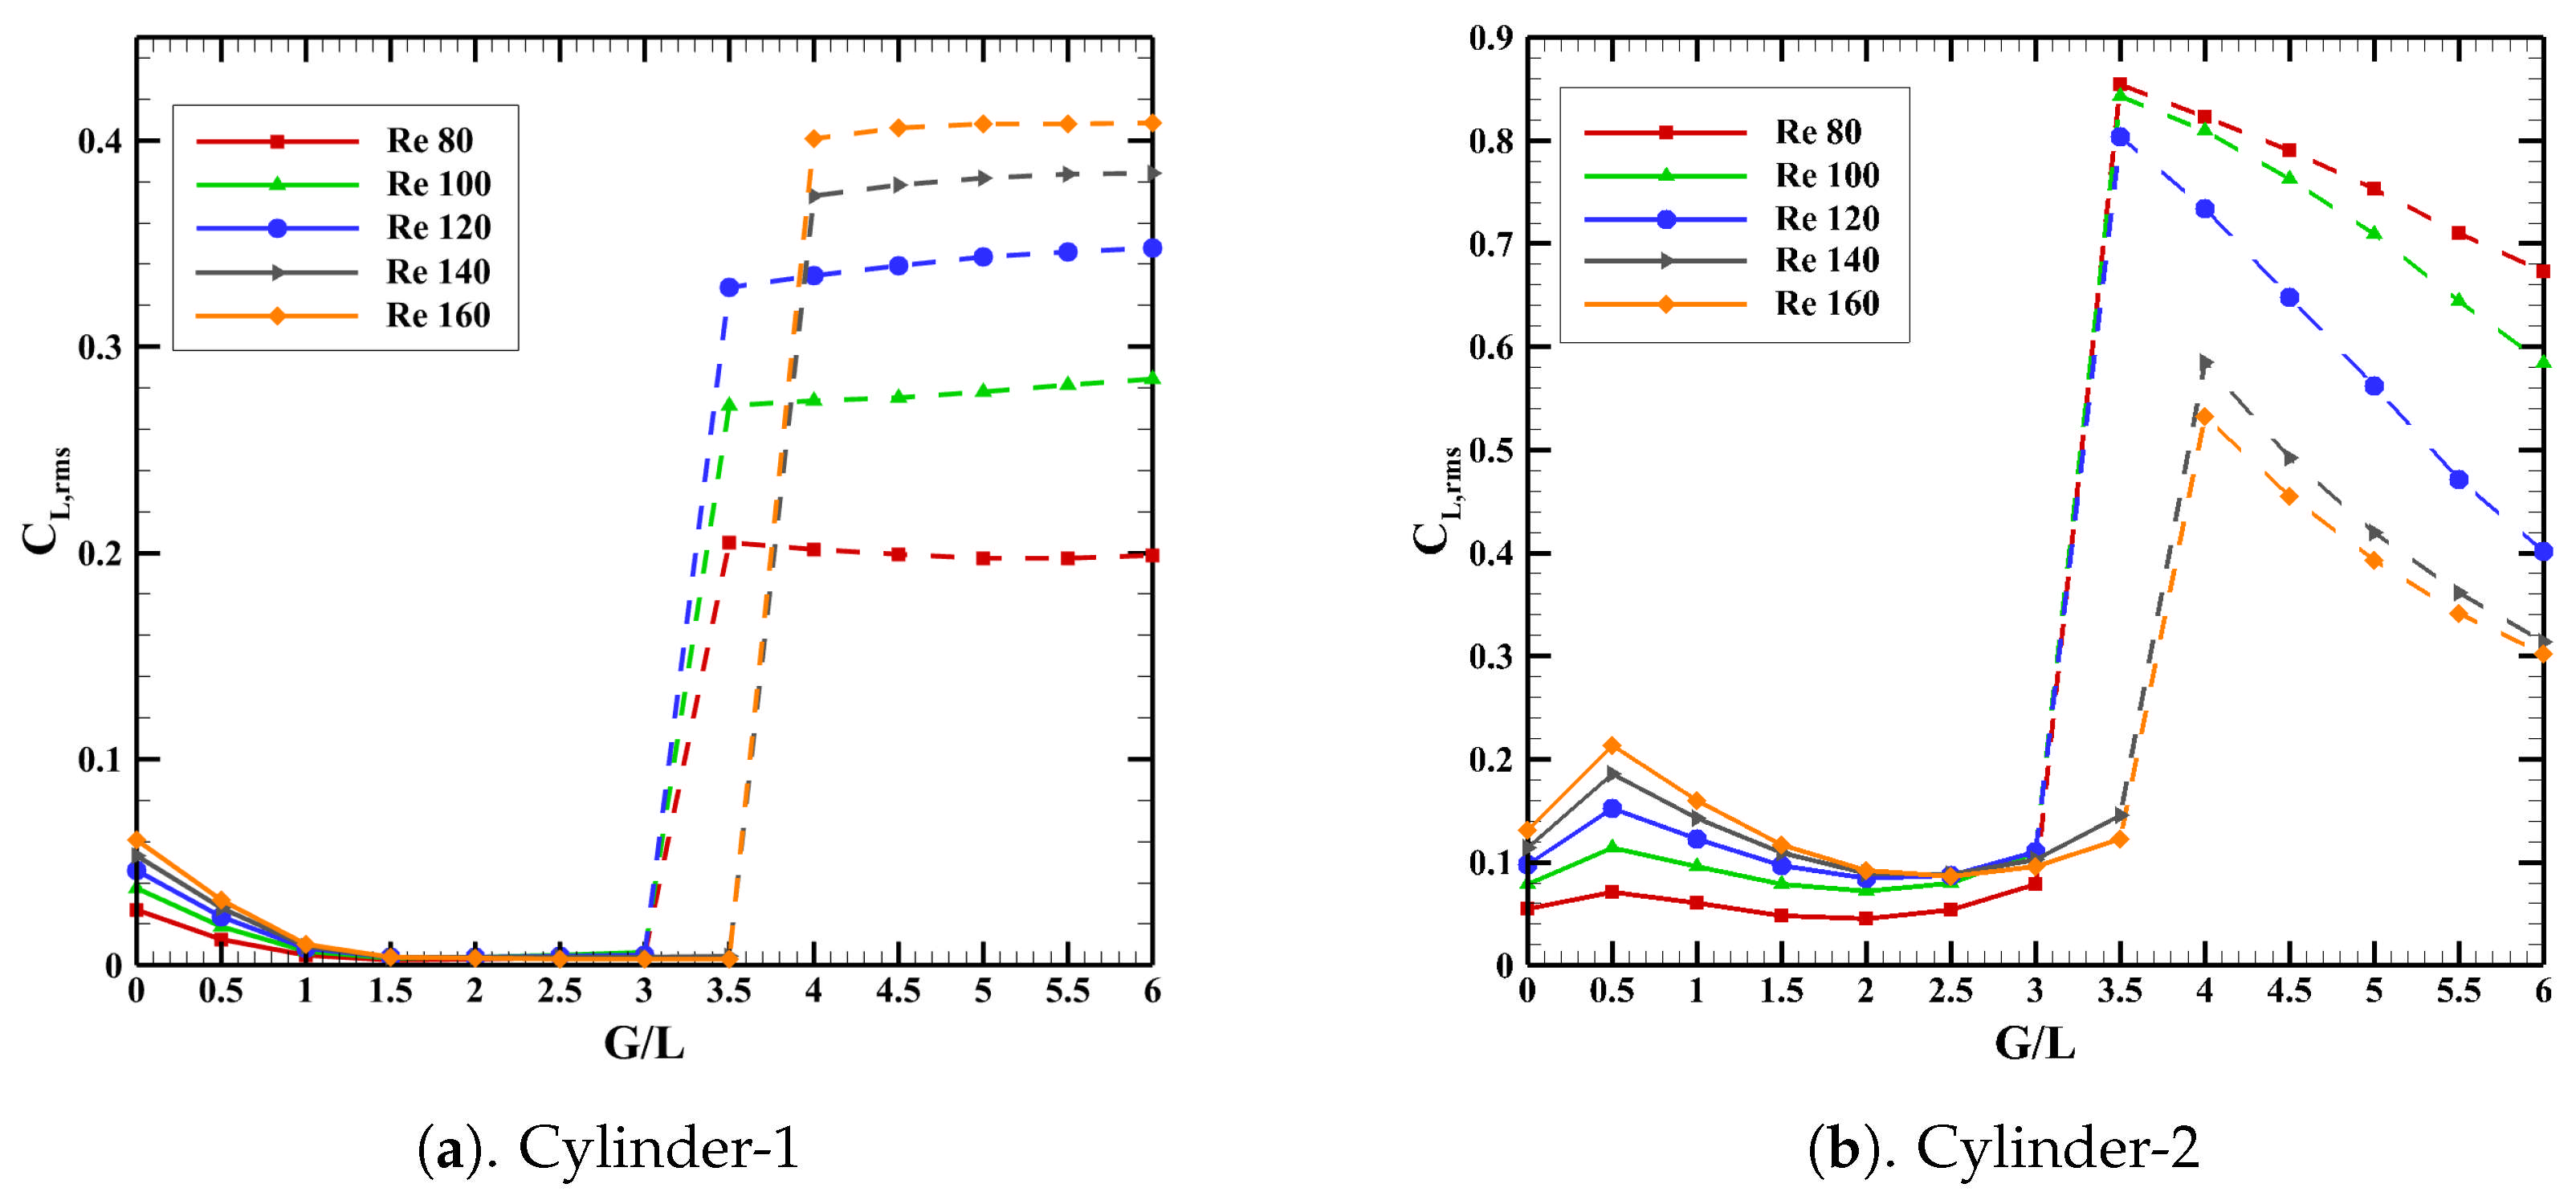
Figure 15 illustrates the root mean square value (rms) of the lift coefficient, denoted as , for both cylinders. Observations from the figure indicate that for the upstream cylinder, the decreases to nearly zero as the gap ratio increases from zero up to the critical gap ratio. This reduction implies the effective suppression of vortex shedding. Beyond the identified critical gap ratio , there is a notable increase in . This trend is consistent with previous research on flows around tandem cylinders, circular or square, where the downstream placement of a cylinder in the wake effectively inhibits vortex shedding from the cylinder upstream [45,74]. In the regime beyond the critical gap ratio, the amplitude of oscillations exhibited by the upstream cylinder appears to be almost unchanged with variations in . This suggests that in this post-critical regime, the influence of the downstream cylinder is minimally significant. In contrast, the downstream cylinder shows a subtle downward trend in the root mean square of the lift coefficient . Again, this observation aligns with the earlier trends observed in the literature, where the values were lower for the upstream cylinder compared to the downstream one. However, in the post-critical regime, there is an abrupt reduction in as the continues to increase. Additionally, in the regime preceding the critical transition, exhibits an increase with the Reynolds number, . In stark contrast, an inverse relationship is noted in the regime following the critical point. Furthermore, it is important to acknowledge that across all the parametric combinations of and ratio employed in this study, the root mean square lift coefficient, , for the upstream cylinder consistently remains below the value reported for a single cylinder configuration. Contrarily, in the post-critical flow regime, the of the downstream cylinder, exceeds that of the single cylinder.
Figure 15.
Variation of rms of lift coefficient with variety of and .
4.4. Vortex Shedding Frequency
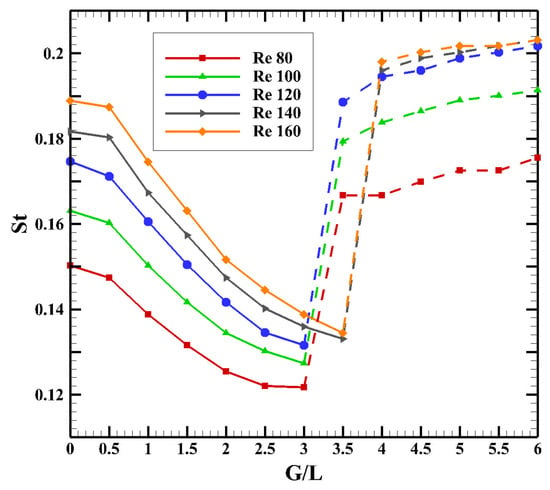
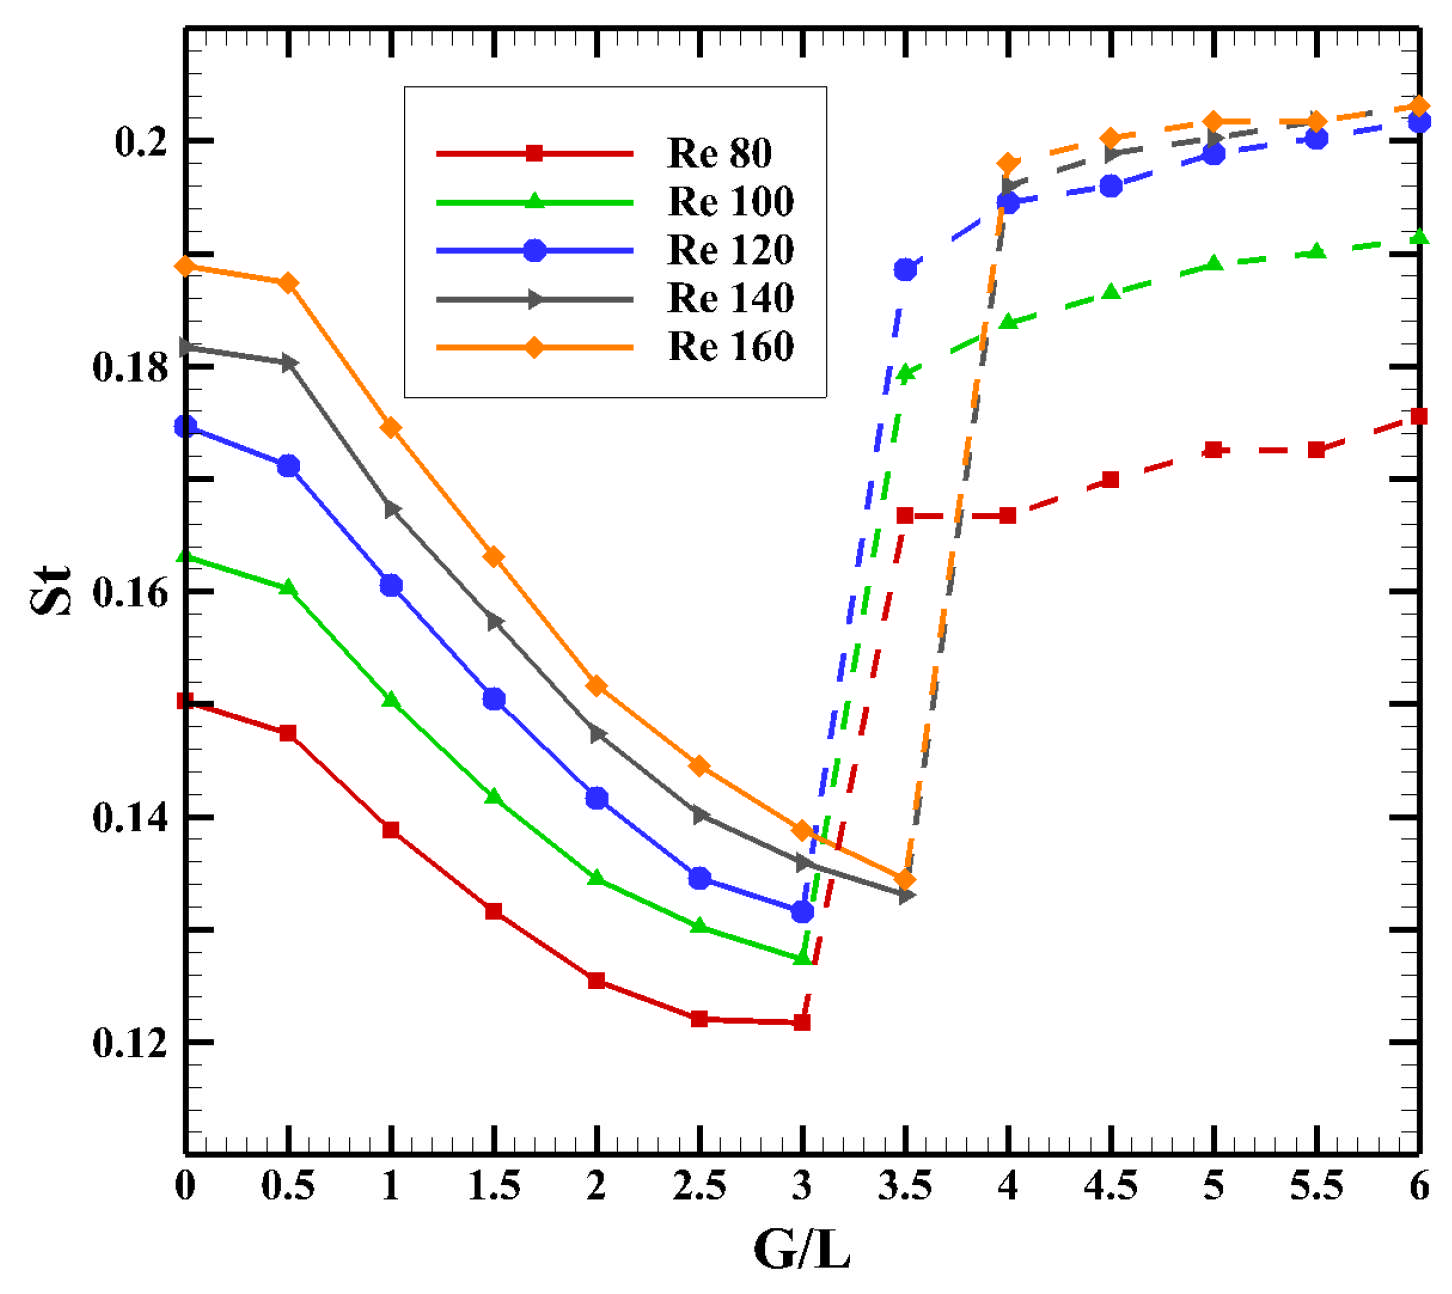
The vortex shedding frequency in its non-dimensional representation, denoted as Strouhal number (), is derived by analyzing the power spectral density of the lift fluctuations, elaborated in Section 4.3.2. Within the scope of the present study, it has been found that the values for both cylinders as shown in Figure 16, remain the same across the set of parameters evaluated, signifying synchronized vortex shedding. As the gap ratio increases towards a critical threshold, there is a noticeable reduction in St, eventually hitting a minimum point and increasing afterwards. The observed decreasing pattern of Strouhal number () in the pre-critical regime can be explained using the concept of vortex formation length, denoted as . A comprehensive explanation of this phenomenon is provided in Section 4.2. The vortex formation length is a key parameter that identifies the location where the ‘roll-up’ of the shear layer initiates, eventually leading to the development of vortices downstream from the cylinder [73]. It has been observed that this vortex formation length increases as the ratio is increased. Similar observations can be made from Figure 5 that the shed vortices are becoming elongated when the is increased. The increase in formation length results in the delay in the commencement of the shear layer ‘roll-up’ process and ultimately culminates in a reduction in the frequency at which vortices are shed.
Figure 16.
Variations of with for different .
5. Conclusions
The present numerical study investigates the influence of gap ratio () and Reynolds number (Re) on the vortex shedding characteristics and aerodynamic behavior of flow over two tandem triangular cylinders arranged in an apex configuration. The numerical investigations are carried out for and using the OpenFOAM solver. The PISO algorithm is employed for solving the governing partial differential equations of the 2D incompressible laminar flow around the equilateral triangular cylinders. The major findings of the present study are summarized below.
- For flow past tandem equilateral cylinders, the Reynolds number and the gap ratio are identified as the two primary parameters governing vortex shedding and the related aerodynamic behavior.
- For small values of , vortex shedding seems to occur solely behind the downstream cylinder, effectively concealing the influence of the upstream cylinder; the flow behaves as if it were shedding from a single body. When the gap ratio exceeds a certain threshold known as the critical gap ratio, , vortex shedding also develops in the region between the two cylinders and then combines with the vortices formed behind the downstream cylinder to develop a new shedding pattern.
- Three distinct flow regimes, denoted as , , and , are identified, which appear to be specific to laminar flow over tandem equilateral cylinder arrangements. These wake regimes characterize the underlying formation mechanisms and the associated vortex shedding patterns. is associated with the pre-critical flow regime, whereas and correspond to post-critical flow conditions. In regime , the vortex shedding behavior is effectively that of a single bluff body, with periodic vortices forming only in the wake of the downstream cylinder. In contrast, in regimes and , distinct and independent vortex shedding is observed from both cylinders. Moreover, in , the shed vortices are noticeably larger, exhibiting increased spatial extent and higher oscillation amplitudes compared to those in .
- The phase diagrams ( - plot) demonstrate that, for all investigated values of and Reynolds number (), the vortex shedding from both cylinders persists in a symmetric and temporally periodic regime.
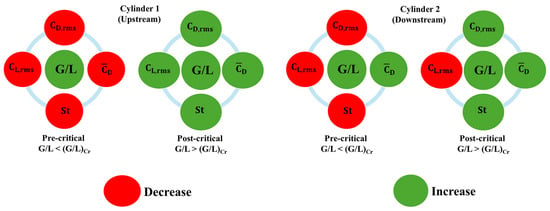
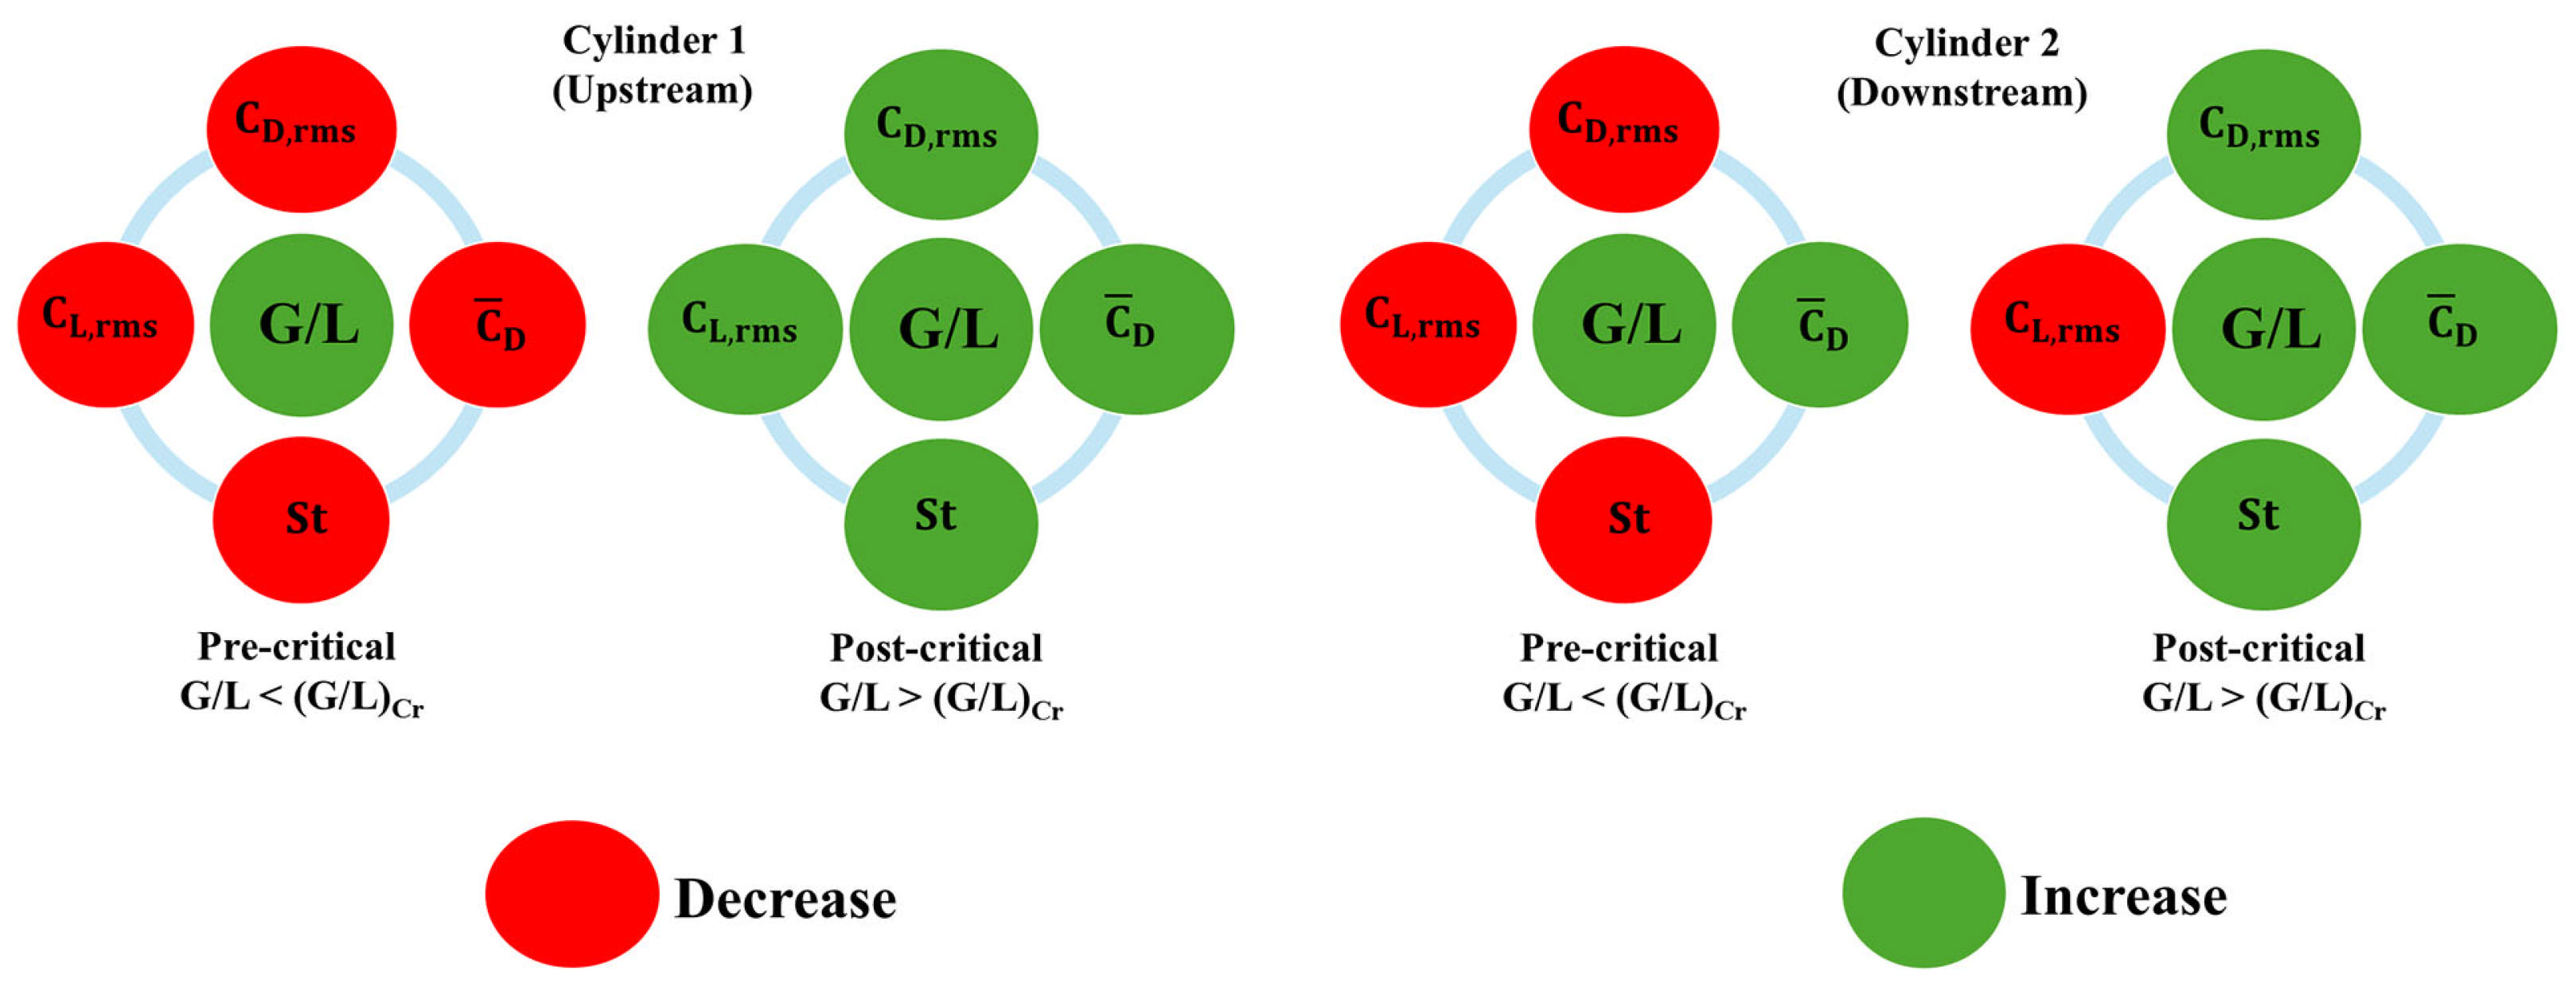
- A detailed analysis of changes in , , and was carried out for a variety of combinations of and , and a graphical summary of the results is given below for easy identification (Figure 17). The green color of the parameter block implies that an increase in the parameter would increase the value of the measured quantity, and the red color indicates an unfavorable trend.
- The drag coefficient associated with the upstream cylinder remains strictly positive over the range of configurations considered. In contrast, the drag coefficient of the downstream cylinder exhibits a transition from negative to positive values as the normalized gap ratio increases. Moreover, at higher values of , -time response exhibits a second harmonic for the downstream cylinder for Reynolds numbers and . Because the upstream cylinder is subjected to a more pronounced frontal stagnation region than the downstream cylinder (from the time-averaged static pressure profiles over the cylinders), the drag coefficient of the downstream cylinder is consistently lower than that of the upstream one. Both drag coefficients decrease with increasing up to the critical ratio , beyond which a sudden increase (i.e., a discontinuous jump) in their values is observed.
- The downstream cylinder experiences stronger lift fluctuations as it is located in the wake of the upstream cylinder. Consequently, the of the downstream cylinder is consistently higher than that of the upstream cylinder.
- The addition of a second cylinder is found to be a strategic approach to suppress the vortex shedding, but only for the pre-critical regime. In contrast, strong vortices are shed after the . Both cylinders have shown a significant reduction in up to the critical . After this point, there is a sudden rise in with the increase in , leaving the minimum at .
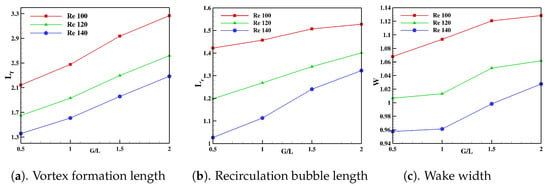
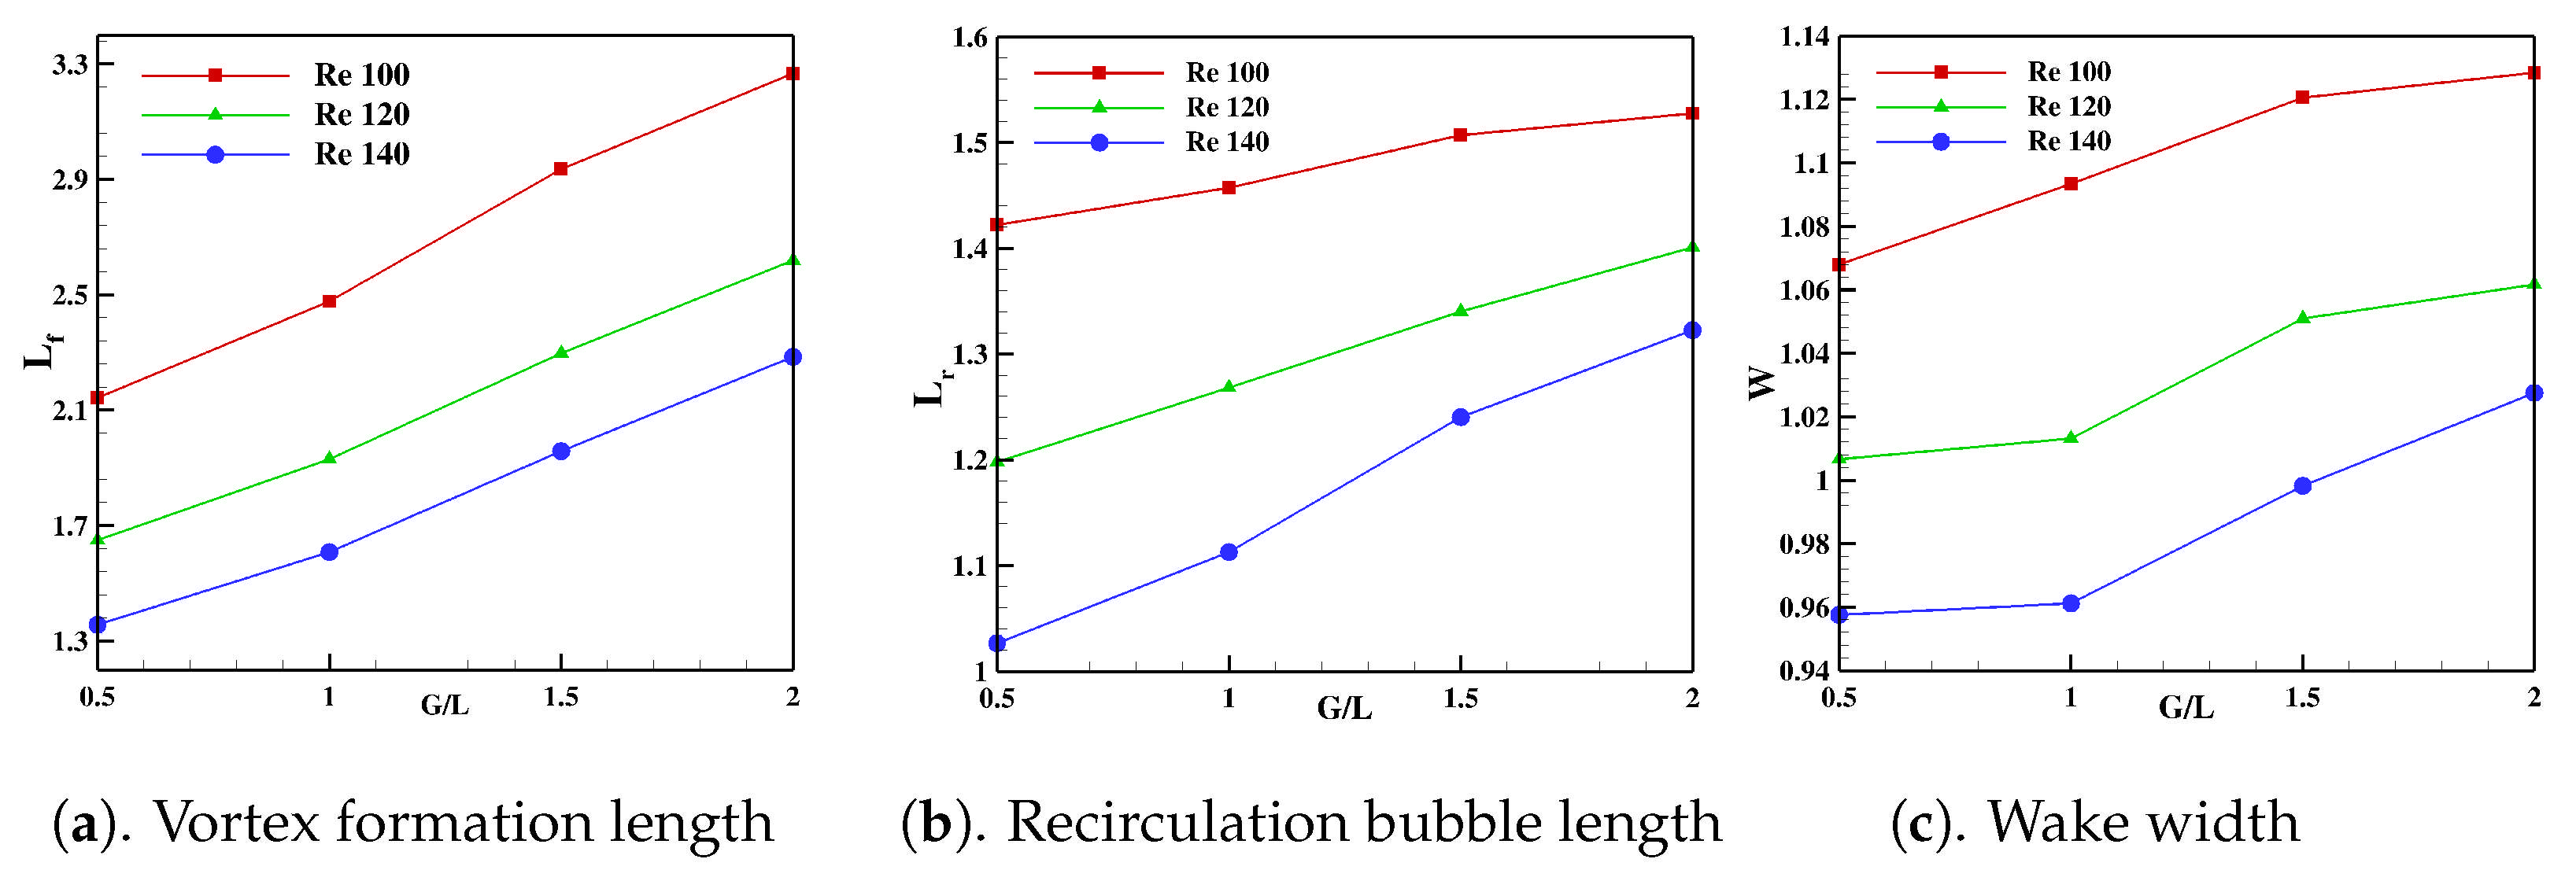
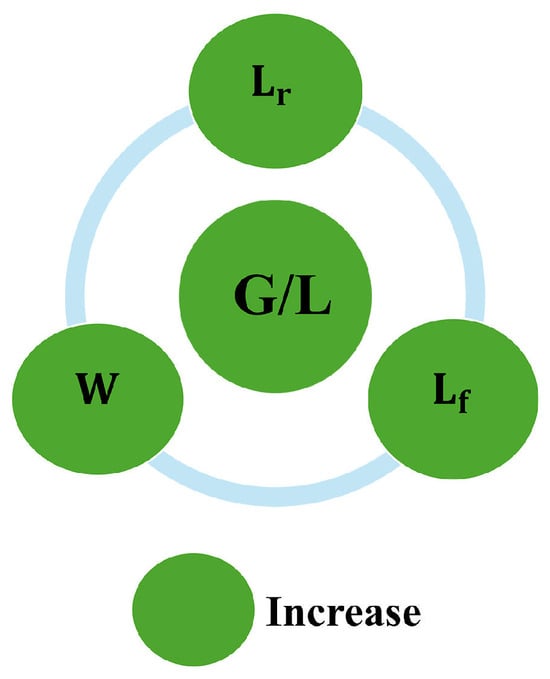
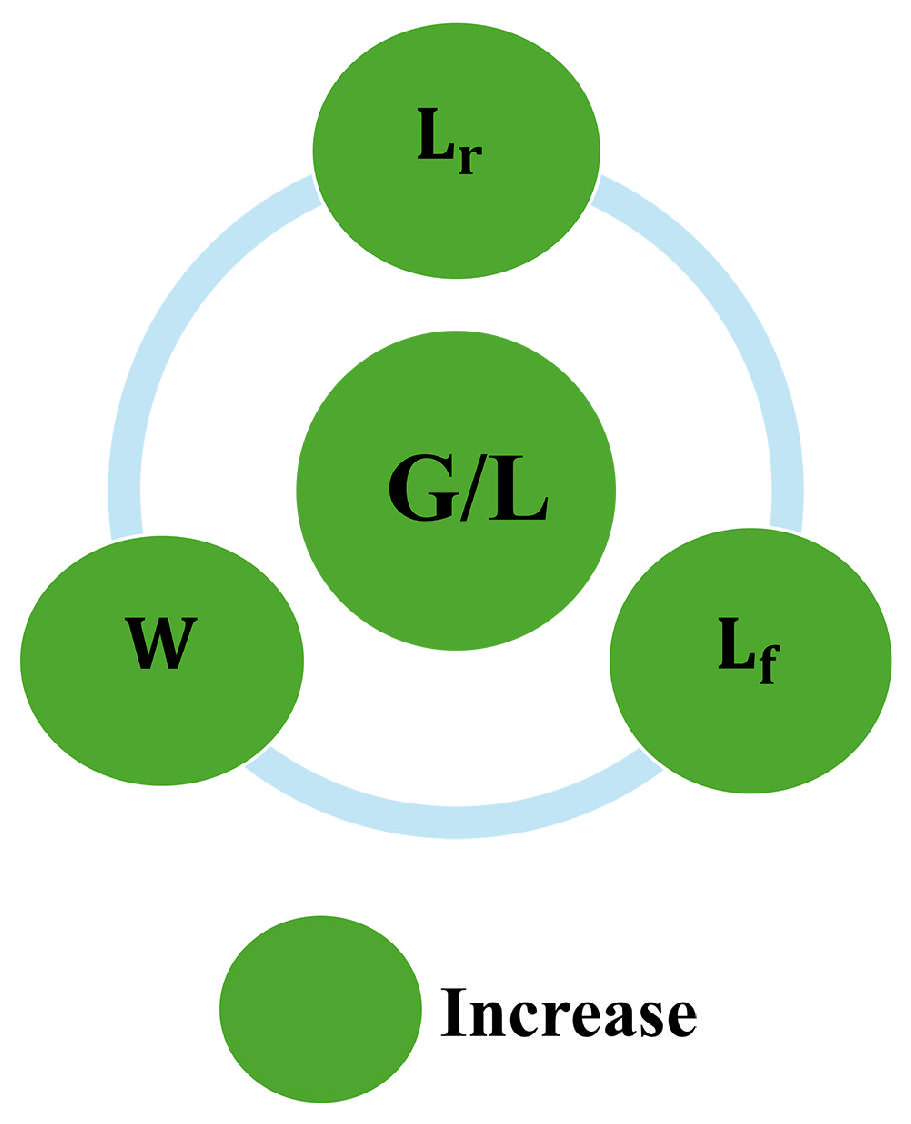
- A comprehensive study has been performed to evaluate some wake parameters, such as the vortex formation length, the wake width, and the recirculation length, which have a significant impact on the vortex shedding behavior and associated aerodynamic performance. Further, the variation in drag coefficient and shedding frequency with respect to and has been reasoned out with the help of these parameters. All three parameters mentioned above are found to increase with for the range of considered. The increase in vortex formation length and wake width delays vortex formation, which is responsible for the reduction in . Figure 18 represents a graphical summary of variation in these parameters with and similar to that of Figure 17.
- The investigation of flow around tandem equilateral triangular cylinders provides valuable insights into wake interference, force characteristics, and vortex dynamics relevant to the design of heat exchangers, offshore structures, aerospace components, and energy-efficient flow-control systems. The use of multiple-cylinder configurations has been widely recognized as an effective approach for mitigating vortex shedding, reducing dynamic fluid forces, and minimizing structural damage in fluid–structure interaction problems. In the case of tandem triangular cylinders, the present study demonstrates that the spacing ratio plays a critical role in governing wake interference and the resulting vibration response. Configurations associated with strong wake interactions produce larger oscillation amplitudes and force fluctuations, which may accelerate fatigue damage and compromise structural integrity. Therefore, such spacing arrangements should be avoided in practical applications where long-term durability is a primary concern. Conversely, spacing ratios that promote weaker wake interactions can effectively reduce flow-induced vibrations and associated structural loading, making them more suitable for the design of engineering systems incorporating tandem triangular structural members.
Figure 17.
Graphical summary: A graphical representation of the influence of gap ratio on the quantities (, , and ) is provided. The green color indicates that when the value of the parameters increases, the value of the measured quantity will also increase, while the red color implies the opposite.
Figure 18.
Figure showing the trend of vortex formation length, recirculation bubble length, and wake width with increases in (up to = 2.0).
Author Contributions
Conceptualization, A.K.S. and M.S.; methodology, A.K.S.; software, M.S.; validation, M.S; formal analysis, M.S.; resources, A.K.S.; writing—original draft preparation, M.S.; review and editing, A.K.S. All authors have read and agreed to the published version of the manuscript.
Funding
This research received no external funding.
Data Availability Statement
The data used in this study are available from the corresponding author upon reasonable request. The datasets have not been deposited in a public repository due to their large size and because they are associated with an ongoing research project.
Acknowledgments
The authors would like to express their sincere gratitude to Amrita Vishwa Vidyapeetham for providing the facilities, support, and academic environment that contributed significantly to the successful completion of this research.
Conflicts of Interest
The authors declare no conflicts of interest.
References
- Williamson, C. Vortex Dynamics in the Cylinder Wake. Annu. Rev. Fluid Mech. 2003, 28, 477–539. [Google Scholar] [CrossRef]
- Qu, L.; Norberg, C.; Davidson, L.; Peng, S.H.; Wang, F. Quantitative numerical analysis of flow past a circular cylinder at Reynolds number between 50 and 200. J. Fluids Struct. 2013, 39, 347–370. [Google Scholar] [CrossRef] [Scilit]
- Sen, S.; Mittal, S.; Biswas, G. Flow past a square cylinder at low Reynolds numbers. Int. J. Numer. Methods Fluids 2010, 67, 1160–1174. [Google Scholar] [CrossRef] [Scilit]
- Thulasiraman, G.; Unnikrishnan, D.; Akram, M.; Edacheri Veetil, J.; Velamati, R.K. Effect of Groove Spacing on the Characteristics of Steady Symmetric Wake. Symmetry 2025, 18, 43. [Google Scholar] [CrossRef] [Scilit]
- Mao, H.; He, Y.; Wu, G.; Lin, J.; Ji, R. Study of Liquid Viscosity Effects on Hydrodynamic Forces on an Oscillating Circular Cylinder Underwater Using OpenFOAM. Symmetry 2021, 13, 1806. [Google Scholar] [CrossRef] [Scilit]
- Aguirre López, M.; Hueyotl Zahuantitla, F.; Martinez-Vazquez, P. Advances in Numerical Data Visualization of Flow around a Square Cylinder. Symmetry 2023, 16, 32. [Google Scholar] [CrossRef] [Scilit]
- Loktongbam, P.; Muraleedharan, S.; Sasidharanpillai, A.K. Improving the Fluid–Structure Interaction for Effective Energy Harvesting in Vertical-Axis Wind Walls with Symmetrical Configuration. Symmetry 2025, 17, 2115. [Google Scholar] [CrossRef] [Scilit]
- S, S.; Kumar, R.; Kumar, K. Numerical Investigation of Wake Interference in Tandem Square Cylinders at Low Reynolds Numbers. Symmetry 2025, 17, 2038. [Google Scholar] [CrossRef] [Scilit]
- Agrwal, N.; Dutta, S.; Gandhi, B. Experimental investigation of flow field behind triangular prisms at intermediate Reynolds number with different apex angles. Exp. Therm. Fluid Sci. 2015, 72, 97–111. [Google Scholar]
- De, A.; Dalal, A. Numerical simulation of unconfined flow past a triangular cylinder. Int. J. Numer. Methods Fluids 2006, 52, 801–821. [Google Scholar] [CrossRef] [Scilit]
- Tu, J.; Zhou, D.; Bao, Y.; Han, Z.; Li, R. Flow characteristics and flow-induced forces of a stationary and rotating triangular cylinder with different incidence angles at low Reynolds numbers. J. Fluids Struct. 2014, 45, 107–123. [Google Scholar] [CrossRef] [Scilit]
- Bao, Y.; Zhou, D.; Zhao, Y. A two-step Taylor - characteristic- based Galerkin method for incompressible flows and its application to flow over triangular cylinder with different incidence angles. Int. J. Numer. Meth. Fluids. 2010, 62, 1181–1208. [Google Scholar]
- Zhang, W.; Yang, H.; Dou, H.S.; Zhu, Z. Flow Unsteadiness and Stability Characteristics of Low-Re Flow Past an Inclined Triangular Cylinder. J. Fluids Eng. 2017, 139, 121203. [Google Scholar] [CrossRef] [Scilit]
- Manzoor, R.; Mushtaq, S.; Nadeem, N.; Perveen, S.; Kalsoom, S.; Naeem, A.; Akbar, R. Numerical investigation of flow past a triangular cylinder at various Reynolds numbers. Phys. Fluids 2023, 35, 124101. [Google Scholar] [CrossRef] [Scilit]
- Gnatowska, R.; Kocoń, A. Flow regimes for triangular cylinders in various angular orientations in tandem configuration for distance 6D. Ocean Eng. 2026, 351, 124253. [Google Scholar] [CrossRef] [Scilit]
- Gnatowska, R.; Kocoń, A.; Gajewska, K. Experimental investigation of flow characteristics around triangular cylinders in various angular orientations in a tandem configuration. Ocean Eng. 2025, 331, 121356. [Google Scholar] [CrossRef] [Scilit]
- Wang, H.; Zhao, D.; Yang, W.; Yu, G. Numerical investigation on flow-induced vibration of a triangular cylinder at a low Reynolds number. Fluid Dyn. Res. 2014, 47, 015501. [Google Scholar] [CrossRef] [Scilit]
- Zhang, J.; Xu, G.; Liu, F.; Lian, J.; Yan, X. Experimental investigation on the flow induced vibration of an equilateral triangle prism in water. Appl. Ocean Res. 2016, 61, 92–100. [Google Scholar] [CrossRef] [Scilit]
- Chen, W.; Ji, C.; Xu, D.; Zhang, Z.; Wei, Y. Flow-induced vibrations of an equilateral triangular prism at various angles of attack. J. Fluids Struct. 2020, 97, 103099. [Google Scholar] [CrossRef] [Scilit]
- Liu, X.; Gui, N.; Wu, H.; Yang, X.; Tu, J.; Jiang, S. Numerical simulation of flow past a triangular prism with fluid–structure interaction. Eng. Appl. Comput. Fluid Mech. 2020, 14, 462–476. [Google Scholar] [CrossRef] [Scilit]
- Buresti, G.; Iungo, G. Experimental investigation on the connection between flow fluctuations and vorticity dynamics in the near wake of a triangular prism placed vertically on a plane. J. Wind Eng. Ind. Aerodyn. 2010, 98, 253–262. [Google Scholar] [CrossRef] [Scilit]
- Ng, Z.; Vo, T.; Hussam, W.; Sheard, G. Two-dimensional wake dynamics behind cylinders with triangular cross-section under incidence angle variation. J. Fluids Struct. 2016, 63, 302–324. [Google Scholar] [CrossRef] [Scilit]
- Ng, Z.Y.; Vo, T.; Sheard, G.J. Stability of the wakes of cylinders with triangular cross-sections. J. Fluid Mech. 2018, 844, 721–745. [Google Scholar] [CrossRef] [Scilit]
- Khan, M.H.; Khan, H. Flow around triangular prisms with varying vertex angle at low Reynolds numbers. Phys. Fluids 2024, 36, 103633. [Google Scholar] [CrossRef] [Scilit]
- El-Sherbiny, S. Flow separation and reattachment over the sides of a 90° triangular prism. J. Wind Eng. Ind. Aerodyn. 1983, 11, 393–403. [Google Scholar] [CrossRef] [Scilit]
- Rui, Z.; Shang, L.; Jianhua, J.; Feng, B.; Zhirong, L. Wake Flow Dynamic Characteristics of Triangular Prisms. Fluid Dyn. 2019, 54, 785–796. [Google Scholar] [CrossRef] [Scilit]
- Ganga Prasath, S.; Sudharsan, M.; Kumar, V.; S. Venkatesan, D.; Sundararajan, T.; Tiwari, S. Effects of aspect ratio and orientation on the wake characteristics of low Reynolds number flow over a triangular prism. J. Fluids Struct. 2014, 46, 59–76. [Google Scholar] [CrossRef] [Scilit]
- Dipankar, A.; Talla, S. Suppression of vortex shedding behind a circular cylinder by another control cylinder at low Reynolds numbers. J. Fluid Mech. 2007, 573, 171–190. [Google Scholar] [CrossRef] [Scilit]
- Xu, W.; Ma, Y.x. A Review on Vibration Control of Multiple Cylinders Subjected to Flow-Induced Vibrations. China Ocean Eng. 2024, 38, 183–197. [Google Scholar] [CrossRef] [Scilit]
- Kalsoom, S.; Abbasi, W.; Raheela, M. Numerical study of flow past two square cylinders with horizontal detached control rod through passive control method. AIP Adv. 2024, 14, 065009. [Google Scholar] [CrossRef] [Scilit]
- Bhatt, R.; Kumar Maiti, D.; Zhou, Q. Flow around two square cylinders near a wall. Phys. Fluids 2025, 37, 033621. [Google Scholar] [CrossRef] [Scilit]
- Gupta, A.; Saha, A. Suppression of vortex shedding in flow around a square cylinder using control cylinder. Eur. J. Mech. B/Fluids 2019, 76, 276–291. [Google Scholar] [CrossRef] [Scilit]
- Chen, Z.; Guan, T.; Zhang, L.; Li, S.; Bubryur, K.; Fu, Y.; Li, C.; Zhang, X.; Kim, B. The flow interference investigation of multi-square prisms under fluid-structure interaction. I. Proximal wake characteristics of tandem square prisms. Phys. Fluids 2024, 36, 75137. [Google Scholar] [CrossRef] [Scilit]
- Sikdar, P.; Dash, S. Effect of pitching splitter plate on the wake topology and drag reduction of two square cylinders in tandem arrangement. Ocean Eng. 2025, 330, 121283. [Google Scholar] [CrossRef] [Scilit]
- Zdravkovich, M. REVIEW—Review of Flow Interference Between Two Circular Cylinders in Various Arrangements. ASME Trans. J. Fluids Eng. 1977, 99, 618–633. [Google Scholar] [CrossRef] [Scilit]
- Sumner, D. Two circular cylinders in cross-flow: A review. J. Fluids Struct. 2010, 26, 849–899. [Google Scholar] [CrossRef] [Scilit]
- IGARASHI, T. Characteristics of the Flow around Two Circular Cylinders Arranged in Tandem: 2nd Report, Unique Phenomenon at Small Spacing. Bull. JSME 1984, 27, 2380–2387. [Google Scholar] [CrossRef] [Scilit]
- Bearman, P.W.; Wadcock, A.J. The interaction between a pair of circular cylinders normal to a stream. J. Fluid Mech. 1973, 61, 499–511. [Google Scholar] [CrossRef] [Scilit]
- Xu, G.; Zhou, Y. Strouhal numbers in the wake of two inline cylinders. Exp. Fluids 2004, 37, 248–256. [Google Scholar] [CrossRef] [Scilit]
- Li, J.; Chambarel, A.; Donneaud, M.; Martin, R. Numerical study of laminar flow past one and two circular cylinders. Comput. Fluids 1991, 19, 155–170. [Google Scholar] [CrossRef] [Scilit]
- Meneghini, J.; Saltara, F.; Siqueira, C.; JR, J. Numerical simulation of flow interference between two circular cylinders in tandem and side-by-side arrangement. J. Fluids Struct. 2001, 15, 327–350. [Google Scholar] [CrossRef] [Scilit]
- Sharman, B.; Lien, F.S.; Davidson, L.; Norberg, C. Numerical predictions of low Reynolds number flows over two tandem circular cylinders. Int. J. Numer. Methods Fluids 2005, 47, 423–447. [Google Scholar] [CrossRef] [Scilit]
- Liu, M.; Lu, L.; Teng, B.; Zhao, M.; Tang, G.Q. Re-examination of laminar flow over twin circular cylinders in tandem arrangement. Fluid Dyn. Res. 2014, 46, 025501. [Google Scholar] [CrossRef] [Scilit]
- Yen, S.; San, K.; Chuang, T. Interactions of tandem square cylinders at low Reynolds numbers. Exp. Therm. Fluid Sci. 2008, 32, 927–938. [Google Scholar] [CrossRef] [Scilit]
- Shui, Q.; Duan, C.; Wang, D.; Gu, Z. New insights into numerical simulations of flow around two tandem square cylinders. AIP Adv. 2021, 11, 045315. [Google Scholar] [CrossRef] [Scilit]
- Zhang, W.; Dou, H.S.; Zhu, Z.; Li, Y. Unsteady characteristics of low Re flow past two tandem cylinders. Theor. Comput. Fluid Dyn. 2018, 32, 475–493. [Google Scholar] [CrossRef] [Scilit]
- Kumar, D.; Sourav, K.; Sen, S. Steady separated flow around a pair of identical square cylinders in tandem array at low Reynolds numbers. Comput. Fluids 2019, 191, 104244. [Google Scholar] [CrossRef] [Scilit]
- Hamid, A.; Noh, M.H.A. Laminar Flows Over Equilateral Triangular Cylinders in Tandem Arrangemen. J. Mech. Eng. 2020, 9, 105–115. [Google Scholar]
- Sivan, M.; Ajith Kumar, S. Numerical Study on Flow Over Two Inline Triangular Cylinders—Influence of Gap Ratio on Vortex Shedding. In Proceedings of the International Conference on Thermofluids; Springer: Singapore, 2021; pp. 13–23. [Google Scholar]
- Abbasinezhad Fallah, D.; Rezazadeh, S.; Dadvand, A.; Sadeghi, H. Effects of oscillation frequency, phase difference, and arrangement of two triangular cylinders on the hydrothermal performance of a channel. Phys. Fluids 2024, 36, 127112. [Google Scholar] [CrossRef] [Scilit]
- Farrokhi Derakhshandeh, J.; Alam, M.M. Reynolds number effect on the flow past two tandem cylinders. Wind Struct. Int. J. 2020, 475–483, 475–483. [Google Scholar] [CrossRef]
- Abbasi, W.; Islam, S.; Faiz, L.; Rahman, H. Numerical investigation of transitions in flow states and variation in aerodynamic forces for flow around square cylinders arranged inline. Chin. J. Aeronaut. 2018, 31, 2111–2123. [Google Scholar] [CrossRef] [Scilit]
- Zhou, Y.; Wang, Z.; Qian, Y.; Yang, H.; Wei, Y. Numerical simulation of the flow around two square cylinders using the lattice Boltzmann method. Phys. Fluids 2021, 33, 037110. [Google Scholar] [CrossRef] [Scilit]
- Sohankar, A. A numerical investigation of the flow over a pair of identical square cylinders in a tandem arrangement. Int. J. Numer. Methods Fluids 2012, 70, 1244–1257. [Google Scholar]
- Lankadasu, A.; Vengadesan, S. Interference effect of two equal-sized square cylinders in tandem arrangement: With planar shear flow. Int. J. Numer. Methods Fluids 2008, 57, 1005–1021. [Google Scholar] [CrossRef] [Scilit]
- Wang, S.; Zhu, L.; Xing, Z.; He, G. Flow Past Two Freely Rotatable Triangular Cylinders in Tandem Arrangement. J. Fluids Eng. 2011, 133, 081202. [Google Scholar] [CrossRef] [Scilit]
- Zhai, Q.; Wang, H.; Yu, G. Numerical Study of Flow Past Two Transversely Oscillating Triangular Cylinders in Tandem at Low Reynolds Number. J. Appl. Fluid Mech. 2017, 10, 1247–1260. [Google Scholar] [CrossRef] [Scilit]
- Jiang, H.; Cheng, L.; An, H. On numerical aspects of simulating flow past a circular cylinder. Int. J. Numer. Methods Fluids 2017b, 85, 113–132. [Google Scholar] [CrossRef] [Scilit]
- Jiang, H.; Cheng, L. Strouhal–Reynolds number relationship for flow past a circular cylinder. J. Fluid Mech. 2017, 832, 170–188. [Google Scholar] [CrossRef] [Scilit]
- Constant, E.; Favier, J.; Meldi, M.; Meliga, P.; Serre, E. An immersed boundary method in OpenFOAM: Verification and validation. Comput. Fluids 2017, 157, 55–72. [Google Scholar] [CrossRef] [Scilit]
- Gao, Y.; Zhu, H.; Zhou, X.; Alam, M.M.; Zhou, T.; Tang, T. Wake flow structure and hydrodynamic characteristics of flow around a C-shaped cylinder with variable attack angle at low Reynolds numbers. Phys. Fluids 2024, 36, 013607. [Google Scholar] [CrossRef] [Scilit]
- Issa, R. Solution of implicitly discretized fluid flow equations by operator-splitting. J. Comput. Phys. 1986, 62, 40–65. [Google Scholar] [CrossRef] [Scilit]
- Courant, R.; Friedrichs, K.; Lewy, H. On the Partial Difference Equations of Mathematical Physics. IBM J. Res. Dev. 1967, 11, 215–234. [Google Scholar] [CrossRef] [Scilit]
- Ajith Kumar, S.; Mathur, M.; Sameen, A.; Anil Lal, S. Effects of Prandtl number on the laminar cross flow past a heated cylinder. Phys. Fluids 2016, 28, 113603. [Google Scholar] [CrossRef] [Scilit]
- Ajith Kumar, S.; Murali, D.; Sethuraman, V.R.P. Flow control using hot splitter plates in the wake of a circular cylinder: A hybrid strategy. Phys. Fluids 2024, 36, 013624. [Google Scholar] [CrossRef] [Scilit]
- Ajith Kumar, S.; Anil Lal, S. Effects of Prandtl Number on Three Dimensional Coherent Structures in the Wake behind a Heated Cylinder. J. Appl. Fluid Mech. 2020, 14, 515–526. [Google Scholar] [CrossRef] [Scilit]
- Murali, D.; Suresh, K.; Arjun, C.K.; Ajith Kumar, S. Influence of slip and orientation on entropy generation due to natural convection in a square cavity. ASME J. Heat Mass Transf. 2022, 145, 032602. [Google Scholar] [CrossRef] [Scilit]
- Murali, D.; Ajith Kumar, S.; Ajithkumar, R. On the laminar wake of curved plates. Phys. Fluids 2024, 36, 043616. [Google Scholar] [CrossRef] [Scilit]
- Chatterjee, D.; Mondal, B. Forced convection heat transfer from an equilateral triangular cylinder at low Reynolds numbers. Heat Mass Transf. 2012, 48, 1575–1587. [Google Scholar] [CrossRef] [Scilit]
- Dhiman, A.; Shyam, R. Unsteady Heat Transfer from an Equilateral Triangular Cylinder in the Unconfined Flow Regime. Int. Sch. Res. Netw. 2011, 2011, 932738. [Google Scholar] [CrossRef] [Scilit]
- Atlac, Z.; Sert, Z.; Mahir, N.; Timuralp, C. Mixed convection heat transfer from a triangular cylinder subjected to upward cross flow. Int. J. Therm. Sci. 2019, 137, 75–85. [Google Scholar] [CrossRef] [Scilit]
- Zhu, H.; Li, G.; Wang, J. Flow-induced vibration of a circular cylinder with splitter plates placed upstream and downstream individually and simultaneously. Appl. Ocean Res. 2020, 97, 102084. [Google Scholar] [CrossRef] [Scilit]
- Zhu, H.; Tang, T.; Liu, H.; Zhou, T.; Zhong, J. Flow structures around trapezoidal cylinders and their hydrodynamic characteristics: Effects of the base length ratio and attack angle Physics of Fluids. Phys. Fluids 2020, 32, 103606. [Google Scholar] [CrossRef] [Scilit]
- Singha, S.; Sinhamahapatra, K. High-Resolution Numerical Simulation of Low Reynolds Number Incompressible Flow About Two Cylinders in Tandem. J. Fluids Eng. Trans. ASME 2010, 132, 011101. [Google Scholar]

Disclaimer/Publisher’s Note: The statements, opinions and data contained in all publications are solely those of the individual author(s) and contributor(s) and not of MDPI and/or the editor(s). MDPI and/or the editor(s) disclaim responsibility for any injury to people or property resulting from any ideas, methods, instructions or products referred to in the content. |
© 2026 by the authors. Licensee MDPI, Basel, Switzerland. This article is an open access article distributed under the terms and conditions of the Creative Commons Attribution (CC BY) license.