


Abstract
Dynamic multi-criteria evaluation plays a central role in assessing complex systems based on panel data. However, existing objective weighting methods often suffer from sensitivity to extreme observations and may produce unstable or even negative weights, limiting their reliability in practice. To address these issues, this study proposes an improved dynamic weighting approach by integrating sampling-based resampling with a density-weighted aggregation (DWA) scheme. The proposed method extends the traditional Vertical–Horizontal Scatter Degree (VHSD) framework by stabilizing weight estimation across repeated samples and aggregating weights in a distribution-aware manner. This design effectively reduces the influence of extreme observations and ensures non-negative and consistent weighting results. An empirical analysis based on panel data is conducted to evaluate the performance of the proposed method. The results show that, compared with the classical VHSD, the proposed approach consistently eliminates negative weights, achieves higher stability across different sampling schemes, and demonstrates improved robustness under data perturbations. In addition, the method exhibits greater sensitivity to structural variations in the data while maintaining overall consistency in evaluation outcomes. Overall, the proposed framework provides a transparent and reproducible approach for composite indicator construction and dynamic multi-criteria evaluation, and is particularly suitable for applications involving complex and heterogeneous datasets.
1. Introduction
Dynamic comprehensive evaluation problems, which are typically based on three-dimensional time series data tables [1], have attracted increasing attention due to their wide applicability in analyzing complex systems over time. Such evaluation frameworks play an important role in fields where multiple attributes evolve simultaneously, requiring methods that can capture both temporal dynamics and cross-sectional differences.
Within this context, the determination of indicator weights is a critical step, as it directly affects the reliability and interpretability of the evaluation results. In recent years, a large body of research has focused on weighting methods, leading to a variety of approaches that aim to improve the objectivity and effectiveness of comprehensive evaluation [2,3,4]. However, many existing methods tend to emphasize differences among indicators themselves, while paying relatively less attention to the dispersion of evaluation results across the evaluated objects. This limitation may reduce the ability of the model to adequately reflect heterogeneity in real-world data.
To address this issue, the vertical and horizontal scatter degree (VHSD) method was proposed [1]. By utilizing three-dimensional time series data, VHSD incorporates both temporal variation and cross-sectional information, thereby reducing the influence of data fluctuations in individual periods and improving the overall robustness of the evaluation. Owing to these advantages, VHSD has been widely applied in various empirical studies [5].
However, its performance may be affected when applied to complex and heterogeneous data environments. In particular, due to its variance-maximization mechanism, the method can be sensitive to extreme observations, which may result in unstable weight estimation and, in some cases, negative weights, thereby affecting the interpretability of the evaluation results. Moreover, as the method relies on the covariance structure of the data, it may not adequately account for noise or outliers in large-scale datasets, which can introduce bias into the final evaluation outcomes. These issues become more pronounced in multi-dimensional and irregular data settings, where the stability and reliability of the evaluation are critical.
To address these limitations, this study proposes an improved VHSD framework that integrates sampling-based estimation with a density-weighted aggregation (DWA) operator. The proposed approach aims to reduce the influence of extreme observations, promote non-negative weight estimation, and improve stability across different sampling schemes, thereby enhancing the robustness and applicability of the VHSD in complex evaluation settings.
The remainder of this paper is organized as follows. Section 2 reviews related work on indicator weighting, VHSD, and DWA; Section 3 introduces the preliminaries; Section 4 presents the proposed method; Section 5 reports the empirical application and comparisons; and Section 6 concludes the paper and discusses future work.
2. Literature Review
In dynamic comprehensive evaluation, determining the weights of each indicator is pivotal [6]. Indicator weighting methods can be classified into three categories: subjective weighting based on expert judgment, objective weighting derived from data, and hybrid weighting that combines subjective and objective information [7,8,9,10]. Although the objective weighting method ensures the objectivity of the weighting process, most of the studies aim to highlight the differences between the indicators and cannot guarantee the degree of dispersion of the evaluation results among all the evaluated subjects. To address this, the VHSD emerged, which determines indicator weights through three-dimensional time series data tables to highlight the overall dispersion among all the evaluated subjects.
Comprehensively considering the time factor effectively mitigates distortions in evaluation results due to single-period data errors. As an innovative method, the VHSD has been widely applied in fields such as green innovation [11], industrial ecology [12], and the digital economy [13], demonstrating its practicality and adaptability. Recent studies have also adopted VHSD or its hybrid variants (e.g., VHSD combined with entropy weighting) for dynamic index construction and spatiotemporal assessment, further validating its applicability in complex evaluation settings [14,15,16]. The method’s core lies in maximizing overall differences among evaluated objects across periods to ensure objective and accurate evaluation results. With research progressing, scholars have continuously refined and optimized the method. For example, Wang and Gong [17] corrected the normalization procedure to avoid order-preservation violations. Despite enhancements in the method’s performance, several limitations remain. For instance, to maximize variance, the method selects the largest sum of deviations from three-dimensional time series data tables, which may lead to biased effects of extreme samples on the final weights or even negative weights.
To address the aforementioned problems, the DWA operator proposed by Yi et al. offers a novel solution [18]. From the perspective of data distribution, the operator clusters information according to the sparsity of the data distribution, thus mitigating the effect of extreme samples on the results. Numerous scholars have continually explored new forms of DWA and their applications in diverse complex decision-making scenarios, greatly enriching its theoretical framework and practical scope. For instance, Liu et al. [19] introduced several density aggregation operators for two-dimensional uncertain linguistic variables, including arithmetic, geometric, and generalized aggregation forms. Additionally, Teng et al. [20] proposed linguistic fuzzy density aggregation operators by integrating arithmetic aggregation operators with DWA under the framework of linguistic fuzzy intuitionistic environments. More recently, density-informed OWA-type aggregation has been further advanced by incorporating probability/entropy-driven mechanisms to generate more stable aggregation behaviors, which is conceptually aligned with mitigating extreme-sample effects in weighting/aggregation [21]. Meanwhile, new density-weighted averaging operator families have been proposed to better accommodate complex decision requirements (e.g., incentive-oriented or uncertain environments), showing that density-driven aggregation is still an active research frontier and can be integrated with broader dynamic evaluation workflows [22,23]. However, despite the progress made in DWA, most of its development is still limited to the expansion and refinement of data forms. With the rise in big data and AI, decision-making environments are becoming more complex and dynamic. Accordingly, extending DWA and embedding it into broader decision-making frameworks remains an active research direction.
Building upon the above discussion, this study integrates the VHSD framework with sampling-based estimation and density-weighted aggregation to address the aforementioned limitations. Compared with existing approaches, the proposed method provides several advantages. It ensures non-negative weights, thereby improving the interpretability of the evaluation results. By incorporating sampling and density-aware aggregation, the method reduces the influence of extreme observations and enhances robustness. In addition, the proposed approach exhibits strong consistency across different sampling schemes, as reflected in the high correlation of weight estimates under varying sampling conditions.
Furthermore, the proposed framework maintains the simplicity and applicability of the original VHSD while extending its capability to handle complex and heterogeneous panel data. These advantages position the proposed method as a meaningful extension of the current literature on dynamic multi-criteria evaluation.
3. Preliminaries
In this section, we introduce the VHSD and the density-ordered weighted averaging operator (), which provide the basis for the proposed method. The data structure and basic notation used in the following sections are introduced together with the corresponding methods.
3.1. “Vertical and Horizontal” Scatter Degree Method
The scatter degree method [24] is an objective weighting approach that derives indicator weights from observed data. It assigns weights by maximizing the dispersion among evaluated objects, thereby emphasizing overall cross-object differences. The vertical and horizontal scatter degree method (VHSD) extends this framework to dynamic settings by incorporating the time dimension. In particular, VHSD operates on three-dimensional panel data tables (object-indicator-time) and determines weights by maximizing the overall dispersion across both the vertical (time) and horizontal (cross-sectional) dimensions.
For the dynamic evaluation problem, it is assumed that there are evaluated objects , evaluation indicators , evaluation periods , denotes the value of evaluated object on indicator at period . This three-dimensional data structure is used throughout the paper, and all subsequent formulations are based on this unified notation, and the three-dimensional time series data of all evaluated objects for periods are shown in Table 1.
Table 1.
Three-dimensional time series data tables.
The dynamic comprehensive evaluation model is constructed from three-dimensional time series data, which can generally be expressed as:
where denotes the comprehensive evaluation value of the evaluated object at period , denotes the weight coefficient at period , and denotes the original data of the evaluated object on indicator at period , which is simplified and denoted as .
3.2. DWA Operator
The basic idea of the density weighted averaging (DWA) operator is to aggregate multi-attribute information by considering both the magnitude and the distribution characteristics of attribute values. Specifically, attributes are first ordered and then grouped according to their scale and distribution density, so that values with similar magnitudes are aggregated together.
This idea follows the density weighted averaging framework originally proposed by Yi et al. [18], in which the aggregation weights are adjusted according to the distribution of the input data. Based on this framework, the DWA operator used in this study is defined as follows.
Definition 1.
Let , if
where , is the jth largest element in ; , is a normalized weighted vector representing the importance of the positional elements in , satisfying ; is a vector weighted by density. It is noted that in this definition the ordered weighted averaging (OWA) operator is used for the aggregation of the elements in each cluster . In practice, the other aggregation methods, such as the weighted averaging aggregation (WAA), the averaging aggregation (AA) operators, can also be adopted.
4. Improved “Vertical and Horizontal” Scatter Degree Method
For clarity, the proposed method can be summarized as a three-stage procedure. First, resampled panel datasets are constructed by randomly selecting both evaluated objects and time periods. Second, the VHSD is applied to each resampled dataset to obtain a set of sample-specific weight vectors. Third, the weights of the same indicator obtained from repeated resampling are clustered and aggregated using the DWA operator to derive the final weights.
Considering the limitations that the final weights obtained through the VHSD may be negative, this paper proposes an approach grounded in mathematical statistics. Under the premise of maximizing the reflection of indicator differences, we establish sampling conditions, randomly select samples, and substitute them into the VHSD to compute indicator weights. Then, the DWA operator was applied to calculate the adjusted weights and was employed to aggregate these weights into global weights for all samples. Based on this idea, the specific calculation steps are outlined below.
4.1. Data Processing
The data processing procedure consists of three primary steps: missing value filling, indicator type consistency and dimensionless processing. In the collected data, missing indicator values frequently arise. Hence, addressing these missing values is an essential component of the processing work. Missing values are imputed using mean imputation within each indicator, as outlined below:
where denotes the raw data of the evaluated object on indicator at period .
To mitigate the influence of variations in indicator type, scale, and magnitude on the comprehensive indicator system, normalization and standardization of raw indicator data are necessary to ensure type consistency and dimensionality reduction.
Initially, all indicators were converted uniformly to benefit-based indicators, and the conversion of cost-based indicators is detailed in the following Equation (4).
Then, the efficiency-based indicators were normalized using the standardization method, as described by the following equation:
where denotes the sample mean and denotes the sample mean squared deviation of the observations for the th indicator. However, for convenience, is still utilized below to represent the standardized data.
4.2. Sample Sampling
Simple random sampling is the most fundamental and simple sampling model among all sampling techniques, ensuring equal probability for each sample. To mitigate the likelihood of extreme samples and their impact on the final weights, this study adopts the simple random sampling method for data processing from a mathematical statistics perspective. Because VHSD uses panel data, each resample should preserve the time structure. We therefore resample objects and periods with equal probability to form a new time-indexed table. This design reduces the impact of extreme observations on weight estimation. Specifically, each resampling iteration contains two random selections: one from the set of time periods and the other from the set of evaluated objects. The sampling proportion is denoted by a%. Thus, the same sampling proportion is applied to both dimensions so that the resampled dataset preserves the basic panel structure while reducing the influence of individual extreme observations. The specific sampling methods are outlined below:
For the evaluated object and period , an equivalent proportion of data is extracted. The sampling error typically varies with the sample size; hence, in this paper, a% of the data is extracted from both sets. Specifically, times are randomly sampled from the time series to form a new time series, and objects are randomly selected from the n evaluated objects to constitute the new set of evaluated objects . The values of and are calculated as follows:
where is the total number of time series and is the total number of evaluated objects. In practical implementation, the sampling proportions are set as 50%, 55%, 60%, 65%, 70%, 75%, and 80%, respectively. For each sampling proportion, the above resampling process is repeated multiple times to generate sample datasets. Each sample dataset is then substituted into the VHSD model to calculate one corresponding weight vector.
After identifying the sampling objects and periods, it is necessary to determine the stopping rule for repeated resampling. According to the law of large numbers, repeated equal-probability sampling can reduce the influence of individual abnormal observations and provide a more representative distribution of candidate weights. In this study, the repeated sampling procedure is conducted until either the pre-specified maximum number of resampling iterations is reached or the variation in the estimated weight vectors falls below a convergence threshold. Specifically, for each sampling proportion, each resampled dataset is substituted into the VHSD model to obtain a candidate weight vector, and the resulting set of candidate weight vectors is subsequently aggregated through the DWA operator to generate the final weights.
The convergence threshold is used to monitor whether the candidate weight vectors generated by repeated sampling have become sufficiently stable for subsequent aggregation. In the baseline implementation, the threshold is set to τ = 0.09. Since the choice of the threshold may affect the number of resampling iterations and the stability of the aggregated weights, its sensitivity is further examined in Section 5.5 by varying τ within a reasonable range. The results show that the final weights and rankings remain highly stable under alternative threshold settings, indicating that the proposed framework is not sensitive to this parameter choice.
Once the sampling objects and the stopping rule have been determined, it is imperative to establish a novel data table indexed by time grounded on the newly derived time series incorporating the evaluated object, as illustrated in Table 2.
Table 2.
Novel data table indexed by time.
At period , the comprehensive evaluation function of the evaluated object is:
The overall difference among the evaluated objects on the data table indexed by time can be portrayed by the maximum total deviation sum of squares of . Based on the concept of the VHSD, the selection of the weighting coefficients should aim to maximize the overall difference among the evaluated objects. Specifically, this implies:
where , because the raw data is pre-processed using the standardized method.
Sampling in this way constitutes a number of new sample data sets , where is the total iterations of sampling. The weight value in each iteration of sampling can be determined by Equations (7) and (8).
4.3. Sample Weights and Final Weights
After obtaining the weight values of each iteration of sampling through the above steps, it is necessary to summarize the information of multiple weights of the same indicator because different indicators have multiple corresponding weights under the same sample sampling. In this paper, the operator is adopted to summarize the weights. When applying the operator, the weights of the same indicator are partitioned according to the ordered incremental partitioning method before calculation. That is, for each indicator, all weights obtained from repeated resampling are first collected into one set. The clustering procedure is then applied to this set rather than to the original indicator values. The purpose is to identify dense regions of weight estimates and separate sparse or extreme weight values before DWA aggregation. The specific steps of the ordered incremental partitioning method are as follows:
Step 1: Given a dataset , sort its elements in descending order to obtain the ordered dataset . Let represent the th largest element in the dataset. The set is defined as the ordered incremental set of , and represents the ordered increment of .
Step 2: In this procedure, large ordered increments are treated as natural separation points between adjacent groups. Therefore, observations within the same cluster have relatively similar magnitudes, whereas sparse or extreme values are more likely to be separated into different clusters. Given , select the largest ordered increments in ascending order. Divide the data based on the resulting intervals. The independent data clusters on the numerical axis are the required one-dimensional group clustering.
Let denote the data sets obtained after performing one-dimensional clustering on the weights of the same indicator, arranged in descending order based on the number of elements, the size of is . Then, the operator is applied to aggregate the data after clustering, where the determination of the density weighting vector is a key issue. It can be obtained from the following equation:
where , , is the density impact index (a value on is generally sufficient to satisfy the need). The density impact index controls the sensitivity of the aggregation process to cluster density. A larger value assigns relatively greater importance to clusters with more elements, whereas a smaller value weakens the density effect and makes the aggregation closer to an ordinary averaging process. In this study, the value of this parameter is determined through repeated experiments to balance robustness and discrimination. This setting prevents the final weights from being dominated by sparse or extreme weight realizations.
For implementation, the proposed method follows the sequence below: (1) preprocess the original data; (2) construct resampled panel datasets under a given sampling proportion; (3) calculate the VHSD weight vector for each resampled dataset; (4) collect the repeated weights of each indicator and divide them using ordered incremental partitioning; and (5) apply the DWA operator to obtain the final weight vector.
To further clarify the motivation of the proposed method, it is worth emphasizing that the design of the framework directly addresses the main limitations of the classical VHSD. Specifically, the issue of negative weights is handled through the incorporation of constrained optimization and aggregation, which ensures non-negativity in the final weighting scheme. In addition, the sensitivity to extreme observations is mitigated through the sampling-based estimation and density-weighted aggregation, which effectively reduce the influence of outliers on weight determination. Therefore, the proposed method provides a targeted improvement over the classical VHSD from both theoretical and practical perspectives.
To evaluate the effectiveness and practical performance of the proposed method, the following section presents an empirical application and robustness analysis based on panel data.
5. Application and Robustness Analysis
5.1. Data and Indicator System
The improved VHSD method proposed in this paper is applied to evaluate the comprehensive development of 31 provinces in China from 2018 to 2022. To capture multiple dimensions of regional development, an indicator system is constructed covering economic, resource, social, and environmental aspects. The system includes seven secondary indicators, 22 tertiary indicators, and 51 quaternary indicators. The overall structure of the indicator system is summarized in Table 3.
Table 3.
Structure of the evaluation indicator system.
The data used in this study are primarily collected from authoritative statistical yearbooks and official databases in China, including the China Statistical Yearbook, China Financial Yearbook, China Science and Technology Statistical Yearbook, China Environmental Statistical Yearbook, and relevant provincial statistical yearbooks, covering the period from 2018 to 2022. The detailed list of indicators and their data sources is provided in Appendix A. The collected data are then organized and evaluated using the proposed method, and the detailed procedure is described as follows.
5.2. Weight Estimation and Evaluation Results
Initially, the cost-based indicator data are processed according to Equation (4), transforming them into efficiency-based indicator data. Subsequently, all data are rendered dimensionless as outlined in Equation (5), and then sampled according to Equation (6). Sampling proportions of 50%, 55%, 60%, 65%, 70%, 75%, and 80% are used for the calculations. The sampled data are then applied to Equations (7) and (8) to calculate the weight values. Subsequently, Equation (9) is applied to derive the sample weights at each sampling probability. Finally, the final weights are obtained, as shown in Table 4.
Table 4.
Indicator weights under different sampling proportions.
The Pearson correlation coefficients between the final weights and the weights obtained from the different sampling processes were calculated and the results are shown in Table 5.
Table 5.
Correlation coefficients between different sample weights and final weights.
As shown in Table 4 and Table 5, the weights derived from the improved VHSD are consistently non-negative, effectively addressing the issue of negative weights encountered in the classical VHSD.
Furthermore, the correlation analysis indicates that the weights obtained under different sampling proportions are highly consistent with the final weights. In particular, the 65% sampling proportion exhibits the highest correlation (0.9999), while all other sampling schemes also show correlation coefficients exceeding 0.99. This suggests that the proposed method produces stable and reliable weight estimates across different sampling settings.
At the same time, slight differences can be observed for lower sampling proportions, such as 50%, indicating that smaller samples may lead to larger deviations in the estimated weights. This further highlights the importance of an appropriate sampling strategy in the proposed framework.
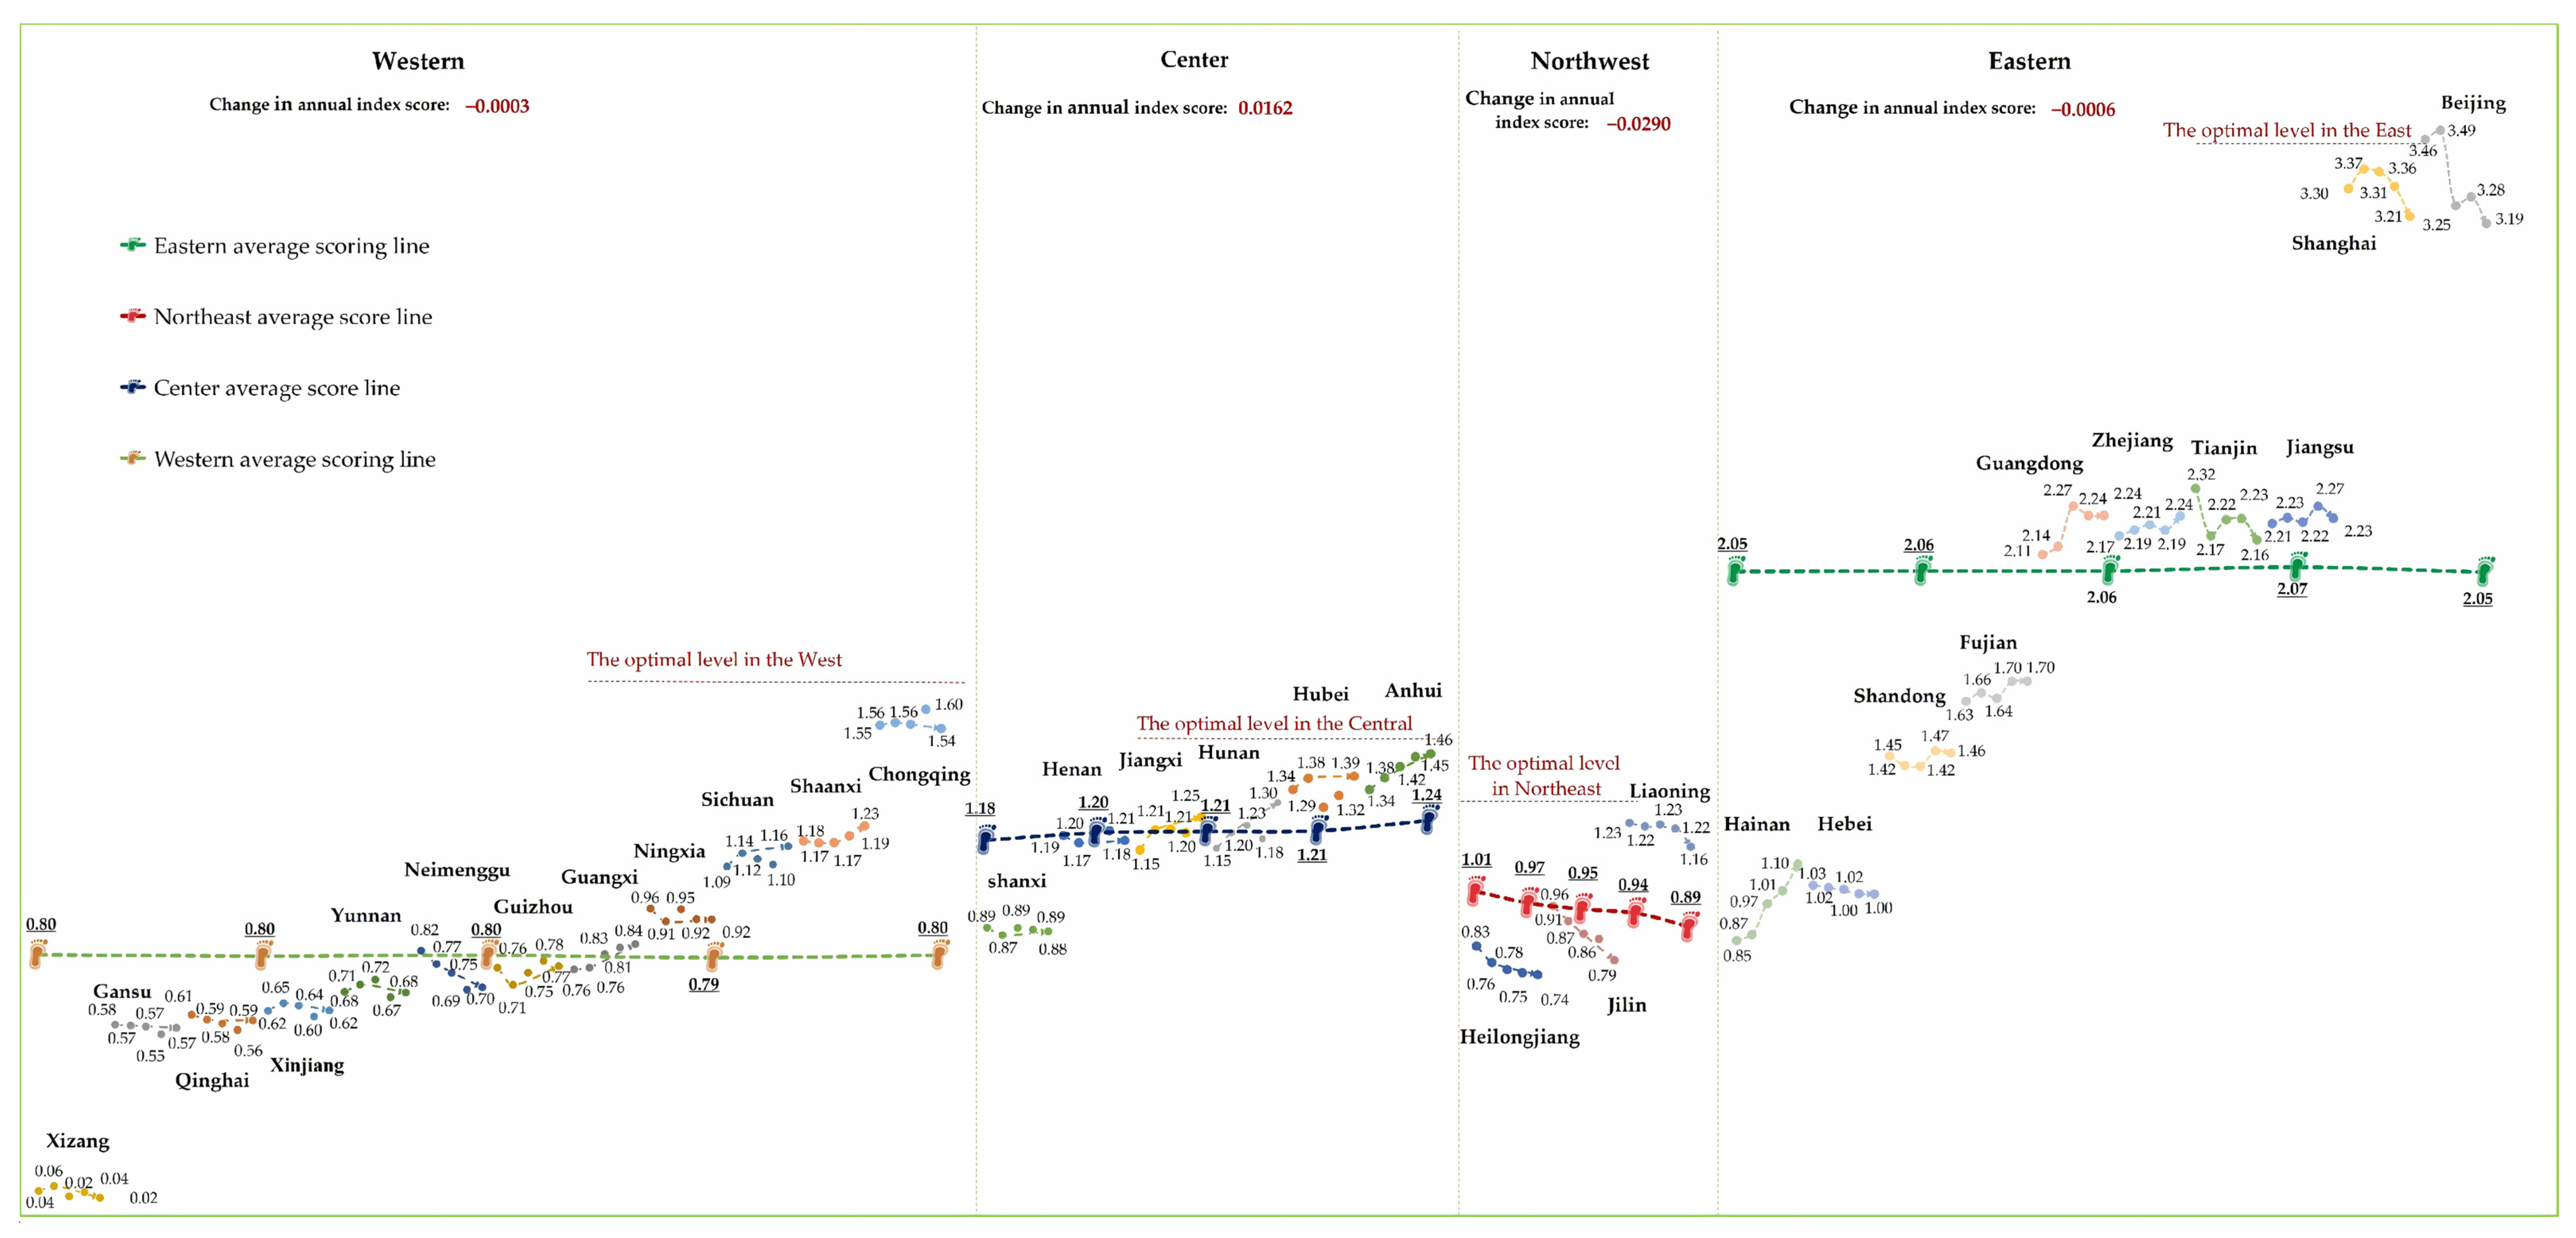
Finally, the obtained weights are used to calculate the comprehensive evaluation scores for each province and city. The results are illustrated in Figure 1 (for visualization purposes, the evaluation scores are adjusted upward).
Figure 1.
Comprehensive development of the 31 provinces and cities of China.
Figure 1 reports the comprehensive evaluation scores of 31 provinces and municipalities in China from 2018 to 2022. To facilitate regional comparison, the provinces and municipalities are classified into the eastern, central, western, and northeastern regions and are ordered within each region according to their average scores from low to high. Each provincial curve contains five annual observations corresponding to 2018–2022, while the regional average curves are included to compare broader regional development patterns.
As shown in Figure 1, Beijing and Shanghai remain at the top of the overall distribution, indicating a relatively high level of comprehensive development. By contrast, Xizang records the lowest scores among the evaluated regions. At the regional level, the eastern region generally performs better than the other regions, whereas the western region remains relatively behind. This pattern suggests that the proposed evaluation results are broadly consistent with China’s regional development differences.
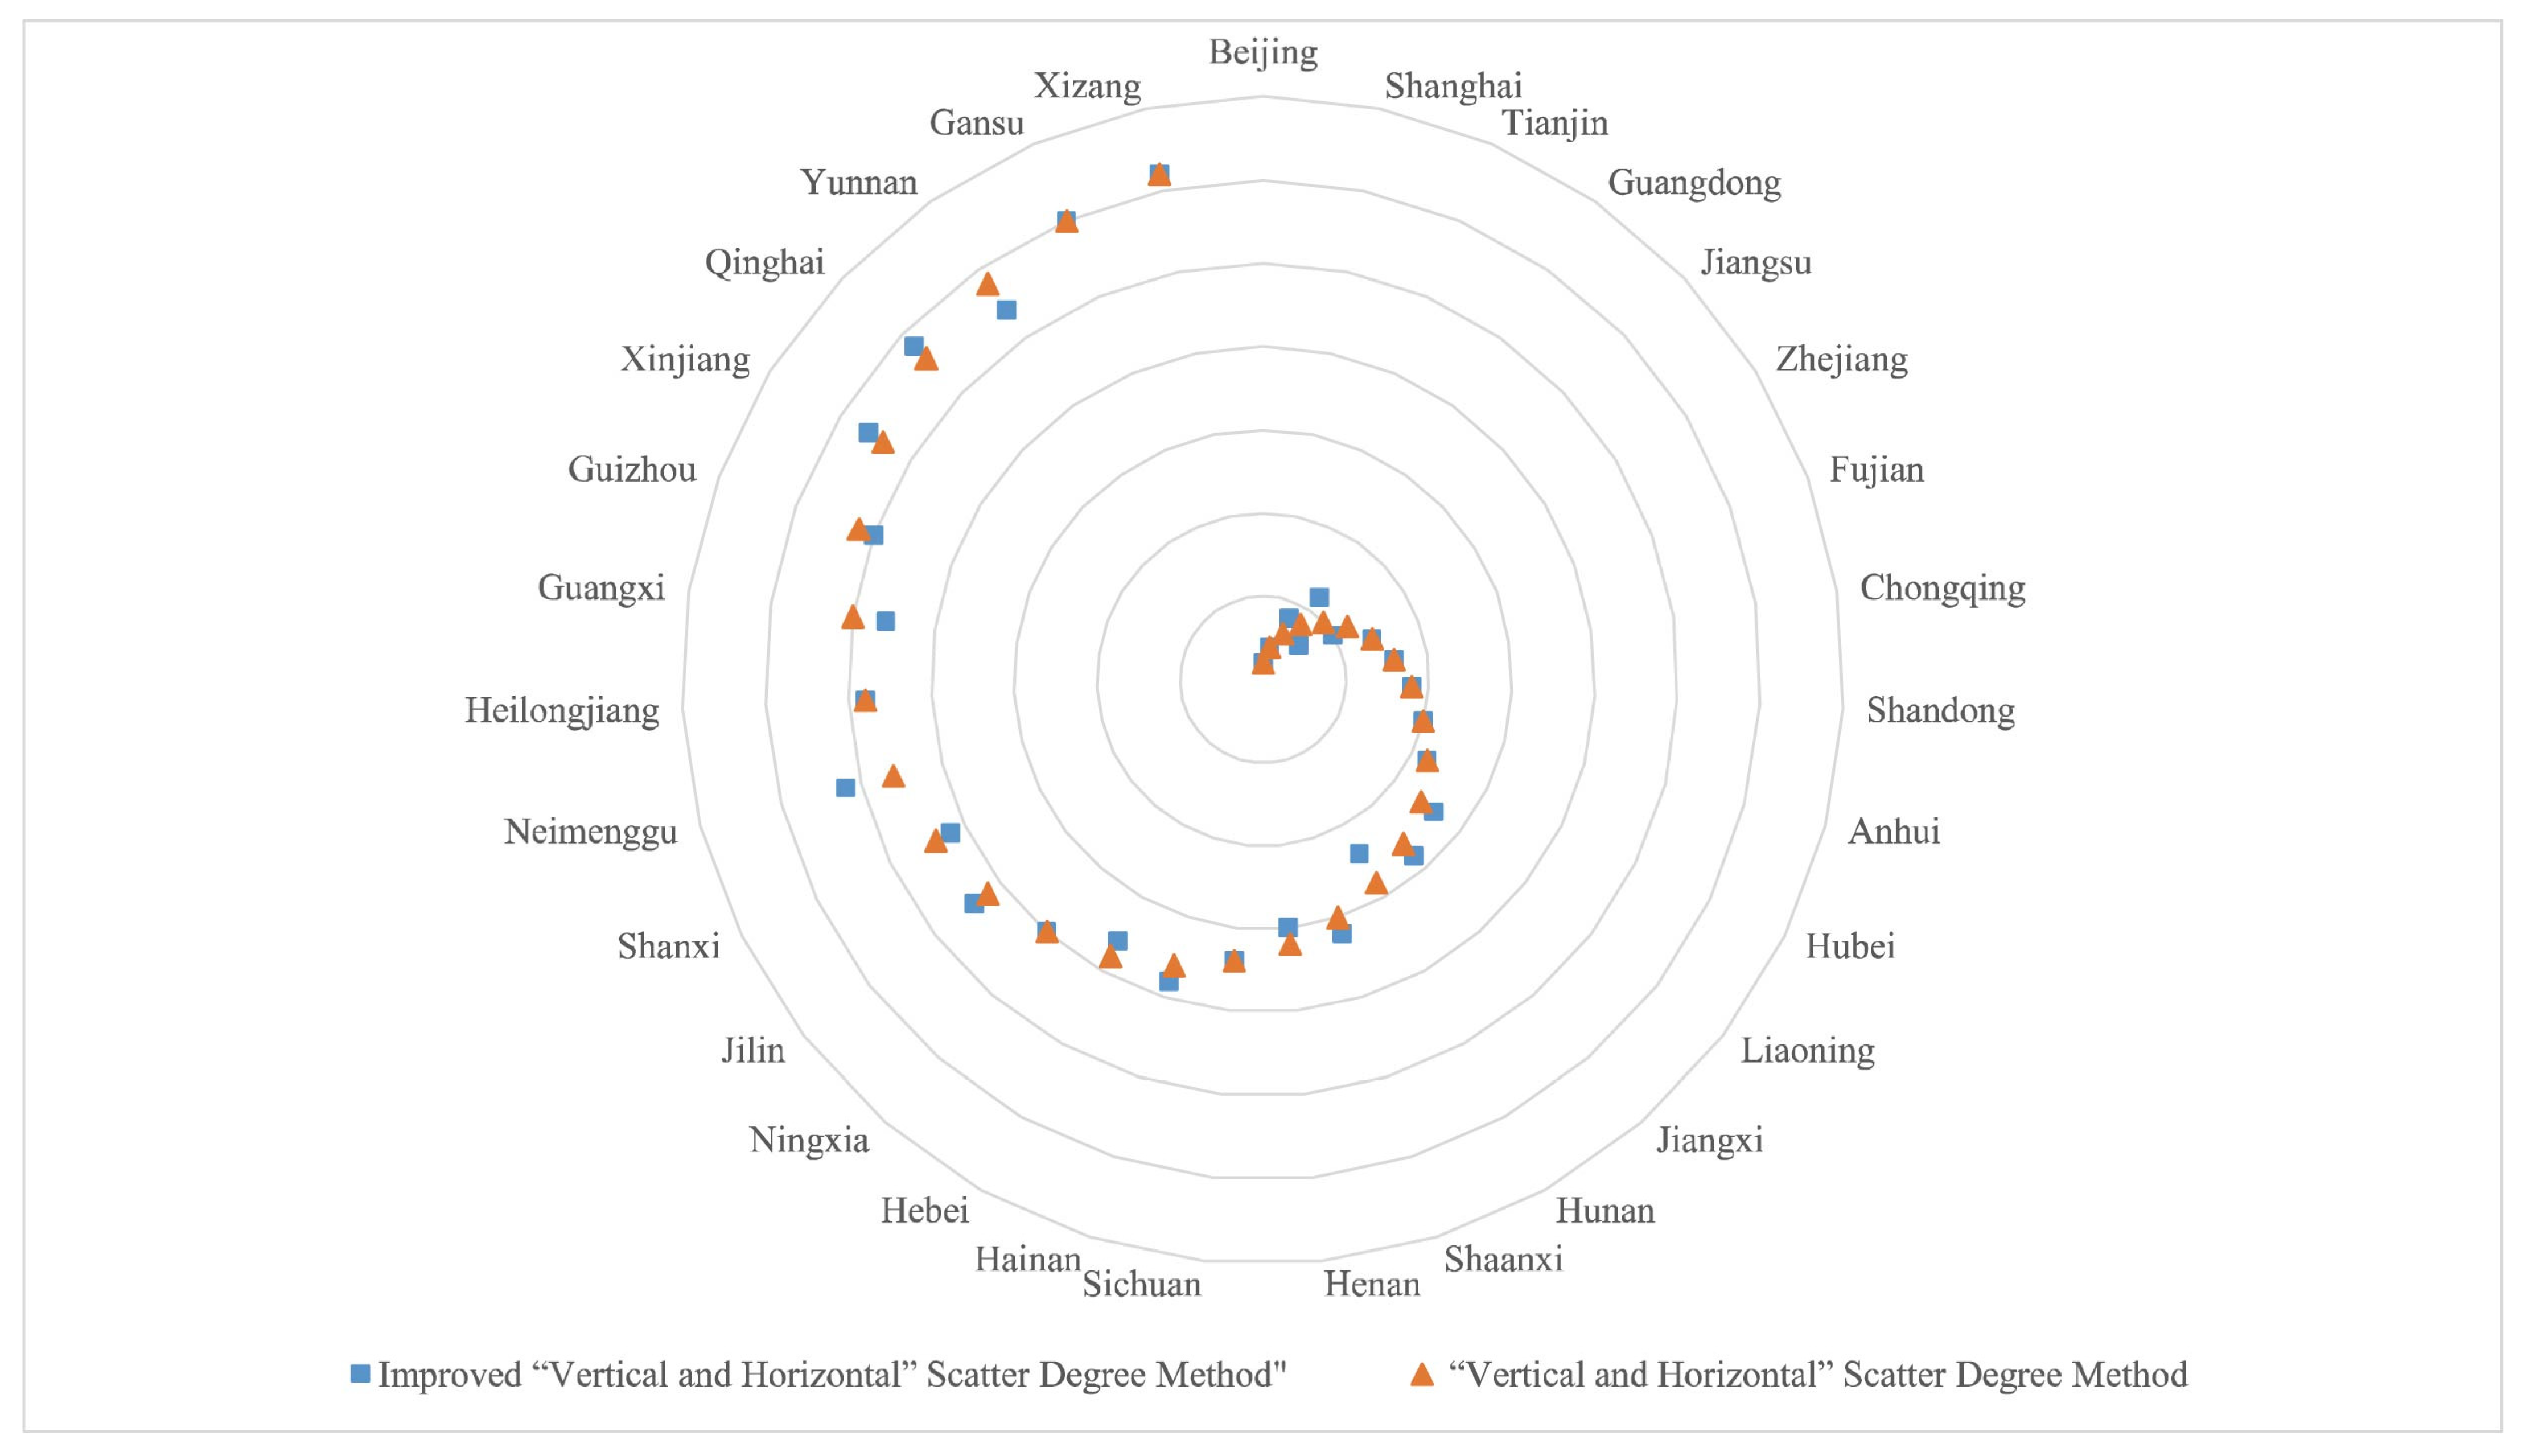
To verify the advantages of the proposed method, the ranking situation of the provinces and cities obtained by the proposed method is compared and analyzed with the traditional VHSD, and the results are shown in Figure 2.
Figure 2.
Ranking of 31 provinces and cities by the two methods.
The comparative analysis of the results derived from the evaluation method proposed in the paper and the classical VHSD reveals that the comprehensive evaluation ranking tends to decline as regions become less economically developed. Figure 2 illustrates a significant change in the ranking. The results indicate that the proposed method in the paper can capture development disparities among different regions and more accurately reflect the relationships among the evaluated objects.
5.3. Comparative Analysis of Representative Weighting Methods
To further examine the differences between the classical VHSD and the proposed approach, a comparison of the evaluation results is first presented in Figure 2. It can be observed that, although the overall ranking patterns obtained by the two methods are broadly similar, noticeable differences appear for several provinces. These differences suggest that the proposed method is more responsive to variations in the underlying data structure, particularly in cases where indicator values exhibit heterogeneity or irregular fluctuations.
While Figure 2 provides an empirical comparison of the evaluation outcomes, a more detailed methodological comparison is necessary to better understand the sources of these differences. To this end, a pointwise comparison between the classical VHSD and the proposed VHSD is provided from several key aspects, including weight properties, robustness, sensitivity to extreme values, and interpretability.
First, in terms of weight properties, the classical VHSD may produce negative weights due to its variance-maximization mechanism, which can limit interpretability in practical applications. In contrast, the proposed method ensures non-negative weights through constrained optimization and aggregation, thereby improving interpretability.
Second, regarding robustness, the classical VHSD relies on a single estimation based on the full dataset and is therefore sensitive to data perturbations. The proposed method introduces a sampling-based framework, which stabilizes weight estimation by averaging over multiple resampled datasets.
Third, in terms of sensitivity to extreme observations, the classical VHSD is directly affected by outliers through its dependence on the covariance structure of the data. By contrast, the proposed method reduces this sensitivity through a combination of sampling and density-weighted aggregation, which down-weights sparse or extreme realizations.
Fourth, in terms of ranking behavior, the classical VHSD tends to produce relatively stable rankings; however, such stability may mask distortions caused by negative or extreme weights. The proposed method exhibits moderate adjustments in rankings, reflecting its ability to capture meaningful structural changes in the data.
To further clarify the methodological positioning of the proposed approach, Table 6 compares the proposed VHSD with several representative objective weighting and composite-index methods, including the entropy weight method, CRITIC, MEREC, and the classical VHSD. The purpose of this comparison is not to claim that one method is universally superior, but to highlight the specific problem addressed by the proposed framework: improving the interpretability and perturbation robustness of VHSD-based dynamic evaluation through non-negative optimization, repeated sampling, and density-weighted aggregation.
Table 6.
Comparative characteristics of representative objective weighting methods and the proposed VHSD.
As shown in Table 6, entropy weighting, CRITIC, and MEREC provide useful objective weighting mechanisms and generally produce non-negative weights. However, these methods are not originally designed to exploit the vertical–horizontal scatter structure of dynamic panel-type evaluation data. The classical VHSD, by contrast, is specifically developed for dynamic comprehensive evaluation, but it may generate negative weights and can be sensitive to abnormal scatter structures. The proposed VHSD retains the dynamic-evaluation logic of the classical VHSD while introducing non-negative optimization and sampling-based density-weighted aggregation. Therefore, its main contribution lies in improving the interpretability and robustness of VHSD-type dynamic weighting, rather than replacing all existing objective weighting methods.
To further support this qualitative comparison, an additional quantitative comparison with representative objective weighting methods is provided in Appendix B. Specifically, the classical VHSD, the proposed VHSD, the entropy weight method, and CRITIC are compared in terms of negative weights, weight concentration, and ranking consistency. The appendix results show that the proposed VHSD produces rankings broadly comparable to representative objective weighting methods while eliminating the negative weights observed in the classical VHSD.
5.4. Robustness Analysis Under Localized Sparse Perturbations
To further evaluate the robustness of the proposed method, we conduct a localized sparse perturbation test. Unlike systematic indicator-level perturbations, localized sparse perturbations are introduced by randomly amplifying a small number of observations involving selected indicators, evaluated objects, and time periods. This setting is designed to simulate occasional measurement errors, short-term local shocks, or abnormal observations that may appear only in part of the panel data. Since the proposed method uses repeated sampling and density-weighted aggregation, this test is particularly relevant for examining whether sparse extreme weight realizations can be prevented from dominating the final weights.
Specifically, we randomly select a small number of indicators, evaluated objects, and time periods, and amplify the corresponding observations by fixed factors. The perturbation settings include one to three selected indicators, three to five evaluated objects, one to two time periods, and amplification factors of two or three. Based on the perturbed datasets, both the classical VHSD and the proposed VHSD methods are re-estimated. The results are summarized in Table 7.
Table 7.
Robustness test under localized sparse perturbations.
Several observations can be made from Table 7. First, the classical VHSD consistently produces approximately 15 negative weights across all perturbation settings, whereas the proposed VHSD eliminates negative weights in every scenario. This confirms that the proposed framework improves the interpretability of the weighting results.
Second, the weight–structure correlations of the proposed method remain high under all perturbation settings, ranging from 0.9367 to 0.9898. Although these values are lower than those of the classical VHSD, the latter achieves such numerical invariance while still producing negative weights. Therefore, the robustness of the weighting scheme should be evaluated together with weight interpretability.
Third, the effect of localized sparse perturbations on the proposed method remains limited. The average increase in the contaminated-indicator weight share is below 0.07 across all settings. In addition, the mean rank change remains below 0.30, and the average maximum rank change is within two positions. These results indicate that the proposed method maintains reasonable evaluation consistency while allowing moderate responsiveness to localized data irregularities.
Overall, the robustness test suggests that the proposed sampling-based VHSD with density-weighted aggregation achieves a better balance between interpretability and stability. While the classical VHSD appears more numerically invariant under local perturbations, such invariance is accompanied by persistent negative weights. By contrast, the proposed method ensures non-negative weights and keeps the influence of sparse perturbations within a controlled range.
5.5. Parameter Sensitivity Analysis
Because the proposed framework involves several empirical settings, we further examine whether the final results are sensitive to the density impact index in the DWA aggregation and the convergence threshold in the repeated sampling procedure. The density impact index controls the relative importance assigned to high-density clusters in the DWA procedure, while the convergence threshold determines when the repeated sampling process is considered sufficiently stable for subsequent aggregation. The baseline setting is ρ = 2 and τ = 0.09.
Table 8 reports the sensitivity results. For the density impact index, ρ is varied from 1 to 4 while τ is fixed at 0.09. For the convergence threshold, τ is varied from 0.07 to 0.11 while ρ is fixed at 2. The results are compared with the baseline setting in terms of weight correlation, mean absolute weight change, rank correlation, mean rank change, and maximum rank change.
Table 8.
Parameter sensitivity analysis of the proposed VHSD.
As shown in Table 8, the proposed method is highly insensitive to the density impact index. When ρ changes from 1 to 4, the weight correlations with the baseline remain above 0.997, and the evaluation rankings remain unchanged. This indicates that the DWA aggregation result is not driven by a specific choice of the density impact index.
The convergence threshold also has limited influence on the final results. As expected, a smaller threshold leads to a larger average number of stopping iterations, whereas a larger threshold allows earlier termination. When τ changes from 0.07 to 0.11, the weight correlations with the baseline remain above 0.986 and the rank correlations remain above 0.992. The mean rank change is below 0.5 in all cases. In particular, for τ = 0.08, 0.10, and 0.11, the maximum rank change is no more than one position. These results show that τ = 0.09 is a reasonable baseline convergence threshold and that the main results are not sensitive to the threshold setting.
The above robustness results also indicate that the proposed framework is built on a flexible sampling-and-aggregation structure, which can be further extended in future research. In particular, the repeated-sampling procedure generates a distribution of candidate weights rather than a single deterministic solution. This distributional feature could be further combined with intelligent uncertainty-modeling techniques. Recent developments in higher-order neuro-fuzzy systems, such as the Type-3 Adaptive Neuro-Fuzzy Inference System with a noniterative learning algorithm (T3-ANFIS) [25], suggest a promising direction for modeling complex uncertainty, nonlinear relationships, and adaptive decision rules in data-driven evaluation settings. From this perspective, future extensions may integrate the sampling-based VHSD framework with type-3 neuro-fuzzy inference mechanisms to capture higher-order uncertainty in indicator information, construct nonlinear data-driven weighting schemes, and support adaptive multi-criteria decision-making under dynamic and heterogeneous environments.
6. Conclusions and Future Work
This paper proposes an improved VHSD framework that integrates sampling-based estimation with density-weighted aggregation to address two key limitations of the classical VHSD, namely the occurrence of negative weights and the sensitivity to extreme observations. By combining resampling with a distribution-aware aggregation mechanism, the proposed method provides a more stable and interpretable weighting scheme for dynamic multi-criteria evaluation.
The empirical results yield several important findings. First, the proposed method consistently produces non-negative weights, thereby enhancing the interpretability of the evaluation outcomes. Second, the weight estimates obtained under different sampling proportions exhibit a high degree of consistency, indicating strong stability of the proposed approach. Third, the stress test results show that the method effectively mitigates the influence of extreme values, demonstrating improved robustness under data perturbations. In addition, the comparison of evaluation rankings suggests that the proposed method is more responsive to structural variations in the data, while still maintaining reasonable overall stability.
Taken together, these findings suggest that the sampling-enhanced VHSD achieves a better balance between robustness, interpretability, and adaptability than the classical VHSD. In particular, the proposed framework is well suited for applications involving complex and heterogeneous datasets, where data irregularities and local fluctuations are common. From a broader perspective, the method provides a transparent and flexible approach for constructing composite indicators in dynamic evaluation settings.
Despite these contributions, several directions for future research remain open. First, alternative sampling strategies may be explored to further improve computational efficiency and estimation stability. Second, the performance of the proposed method could be examined from additional perspectives, such as local sensitivity, dispersion properties, and scalability. Third, different clustering and aggregation strategies within the DWA framework may be investigated to enhance the flexibility and generality of the method.
In addition, as discussed above, future studies may extend the proposed sampling-based VHSD framework by incorporating advanced intelligent modeling techniques, including higher-order neuro-fuzzy systems such as T3-ANFIS [25]. Such integration may further improve the ability of dynamic evaluation models to handle nonlinear indicator relationships, higher-order uncertainty, and adaptive decision-support requirements.
Author Contributions
Conceptualization, D.Z. and H.Y.; methodology, D.Z., H.Y. and Q.Z.; software, Q.Z. and B.Z.; validation, H.Y. and Q.Z.; resources, D.Z. and H.Y.; data curation, Q.Z.; writing—original draft preparation, D.Z. and H.Y.; writing—review and editing, D.Z., H.Y., Q.Z. and B.Z.; supervision, D.Z.; funding acquisition, D.Z. All authors have read and agreed to the published version of the manuscript.
Funding
This research was funded by the National Natural Science Foundation of China, grant number 71803073; and the Humanities and Social Sciences Research Project of the Ministry of Education of China, grant number 18YJC790211.
Data Availability Statement
The raw data supporting the conclusions of this article will be made available by the authors on request.
Conflicts of Interest
The authors declare no conflicts of interest.
Abbreviations
The following abbreviations are used in this manuscript:
| DWA | density weighted averaging |
| VHSD | vertical and horizontal scatter degree method |
Appendix A. Detailed Indicator System and Data Sources
Table A1.
Indicator system and data sources.
Appendix B. Supplementary Comparison with Representative Objective Weighting Methods
To further examine the broader methodological usefulness of the proposed framework, we compare the proposed VHSD with the classical VHSD and two representative objective weighting methods, namely the entropy weight method and CRITIC. The comparison focuses on weight interpretability, weight concentration, and ranking consistency. Since the proposed VHSD is designed as an improvement of the VHSD framework rather than a replacement for all objective weighting methods, the purpose of this comparison is to examine whether the proposed method generates evaluation rankings that are broadly comparable to commonly used objective weighting methods while addressing the negative-weight problem of the classical VHSD.
Table A2.
Quantitative comparison with representative objective weighting methods.
The results are reported in Table A2. The proposed VHSD eliminates negative weights, whereas the classical VHSD produces 15 negative weights. In terms of ranking consistency, the proposed VHSD is highly consistent with the classical VHSD and the entropy weight method, with Spearman rank correlations of 0.9738 and 0.9407, respectively. The correlation with CRITIC is lower but remains positive at 0.8173, which is reasonable because CRITIC emphasizes contrast intensity and inter-indicator conflict, whereas VHSD-based methods exploit vertical–horizontal scatter information in dynamic panel data. Overall, the results suggest that the proposed VHSD retains the dynamic-evaluation logic of the classical VHSD, produces rankings broadly comparable to representative objective weighting methods, and improves weight interpretability by eliminating negative weights.
References
- Guo, Y. New theory and method of dynamic comprehensive evaluation. J. Manag. Sci. China 2002, 2, 49–54. [Google Scholar] [CrossRef]
- Lidz, C.S. Dynamic assessment: Psychoeducational assessment with cultural sensitivity. J. Soc. Distress Homeless 1997, 6, 95–111. [Google Scholar] [CrossRef] [Scilit]
- Cai, W. Design of Dynamic Evaluation Algorithm for Classroom Mathematics Teaching. J. Phys. Conf. Ser. 2021, 1881, 032027. [Google Scholar] [CrossRef] [Scilit]
- Ding, F.; Zhang, W.; Cao, S.; Hao, S.; Chen, L.; Xie, X.; Li, W.; Jiang, M. Optimization of water quality index models using machine learning approaches. Water Res. 2023, 243, 120337. [Google Scholar] [CrossRef] [Scilit]
- Song, H.; Wang, Y. Dynamic Comprehensive Evaluation of the Development Level of High-end Equipment Manufacturing Industry in Eastern Provinces of China. Stat. Decis. 2021, 37, 85–89. [Google Scholar]
- Cheng, R.; Fan, J.; Wu, M. A dynamic multi-attribute group decision-making method with R-numbers based on MEREC and CoCoSo method. Complex Intell. Syst. 2023, 9, 6393–6426. [Google Scholar] [CrossRef] [Scilit]
- Keshavarz-Ghorabaee, M.; Amiri, M.; Zavadskas, E.K.; Turskis, Z.; Antucheviciene, J. Determination of objective weights using a new method based on the removal effects of criteria (MEREC). Symmetry 2021, 13, 525. [Google Scholar] [CrossRef] [Scilit]
- Xiao, F.; Wen, J.; Pedrycz, W. Generalized divergence-based decision making method with an application to pattern classification. IEEE Trans. Knowl. Data Eng. 2022, 35, 6941–6956. [Google Scholar] [CrossRef] [Scilit]
- Yang, L.; Zou, H.; Shang, C.; Ye, X.; Rani, P. Adoption of information and digital technologies for sustainable smart manufacturing systems for industry 4.0 in small, medium, and micro enterprises (SMMEs). Technol. Forecast. Soc. Change 2023, 188, 122308. [Google Scholar] [CrossRef] [Scilit]
- Chang, K.H. Integrating subjective–objective weights consideration and a combined compromise solution method for handling supplier selection issues. Systems 2023, 11, 74. [Google Scholar] [CrossRef] [Scilit]
- Zhao, N.; Liu, X.; Pan, C.; Wang, C. The performance of green innovation: From an efficiency perspective. Socio-Econ. Plan. Sci. 2021, 78, 101062. [Google Scholar] [CrossRef] [Scilit]
- Zhang, W.; He, X.; Liu, X. Does green finance improve the industrial eco-efficiency in China? Environ. Sci. Pollut. Res. 2023, 30, 14484–14496. [Google Scholar] [CrossRef] [Scilit]
- Zhang, W.; Liu, X.; Wang, D.; Zhou, J. Digital economy and carbon emission performance: Evidence at China’s city level. Energy Policy 2022, 165, 112927. [Google Scholar] [CrossRef] [Scilit]
- Tian, Y.; Tunio, F.H. Assessing financial risks of foreign agricultural investment in belt and road countries: A risk index approach and VHSD-EM model analysis. PLoS ONE 2023, 18, e0293146. [Google Scholar] [CrossRef] [Scilit]
- Yang, W.; Huang, R.; Li, D. China’s high-quality economic development: A study of regional variations and spatial evolution. Econ. Change Restruct. 2024, 57, 86. [Google Scholar] [CrossRef] [Scilit]
- Zhao, X.; Ke, X.; Jiang, S. Dynamic assessment and pathway optimisation of China’s national energy system: An integrated spatial–temporal insight for addressing the global energy trilemma. Energy Convers. Manag. 2025, 343, 120200. [Google Scholar] [CrossRef] [Scilit]
- Wang, C.; Gong, Z. Amendments to the methodology for the normalization of indicators in the “horizontal and vertical” gradient approach. Stat. Decis. 2016, 02, 77–79. [Google Scholar]
- Yi, P.; Guo, Y.; Zhang, D. Density weighted averaging middle operator and application in multi-attribute decision making. Control Decis. 2007, 5, 515–519+524. [Google Scholar]
- Liu, P.; Teng, F. Multiple attribute decision-making method based on 2-dimension uncertain linguistic density generalized hybrid weighted averaging operator. Soft Comput. 2018, 22, 797–810. [Google Scholar] [CrossRef] [Scilit]
- Teng, F.; Liu, P. Multiple-attribute group decision-making method based on the linguistic intuitionistic fuzzy density hybrid weighted averaging operator. Int. J. Fuzzy Syst. 2019, 21, 213–231. [Google Scholar] [CrossRef] [Scilit]
- Zheng, T.; Chen, H.; Yang, X. Entropy and probability based Fuzzy Induced Ordered Weighted Averaging operator. J. Intell. Fuzzy Syst. 2023, 44, 4949–4962. [Google Scholar] [CrossRef] [Scilit]
- Li, W.; Yi, P.; Li, L.; Liu, J. Vector-based uncertain ordered density weighted averaging: A family of incentive-oriented aggregation operators. Soft Comput. 2024, 28, 10007–10021. [Google Scholar] [CrossRef] [Scilit]
- Guo, H.; Yao, R. Density aggregation operators for interval-valued q-rung orthopair fuzzy numbers and their application in multiple attribute decision making. Int. J. Fuzzy Syst. 2023, 44, 3195–3206. [Google Scholar] [CrossRef] [Scilit]
- Yi, P.; Li, W.; Guo, Y. Comprehensive Evaluation Theory and Method; Economic Management Publishing House: Beijing, China, 2019. [Google Scholar]
- Mohammadzadeh, A.; Alattas, K.A.; Xie, W.-F.; Taghavifar, H.; Zhang, C.; Sakthivel, R. T3-ANFIS: Type-3 Adaptive Neuro-Fuzzy Inference System with a Noniterative Learning Algorithm. IEEE Trans. Cybern. 2010, 55, 14. [Google Scholar] [CrossRef] [Scilit] [PubMed]

Disclaimer/Publisher’s Note: The statements, opinions and data contained in all publications are solely those of the individual author(s) and contributor(s) and not of MDPI and/or the editor(s). MDPI and/or the editor(s) disclaim responsibility for any injury to people or property resulting from any ideas, methods, instructions or products referred to in the content. |
© 2026 by the authors. Licensee MDPI, Basel, Switzerland. This article is an open access article distributed under the terms and conditions of the Creative Commons Attribution (CC BY) license.