


Abstract
In the highly competitive e-commerce landscape, platforms must strategically balance complex operational and marketing parameters. These real-world systems inherently involve high-dimensional nonlinear interactions and strongly coupled variables, leading to complex consumer response behaviors and highly non-convex optimization landscapes. Traditional optimization approaches usually suffer from high computational costs in business environments, while conventional surrogate models are prone to premature convergence during hyperparameter estimation. To address these management and operational challenges, this study proposes a Chaos-initialized Quantum-behaved Particle Swarm Optimization Kriging (CQPSO–Kriging) framework. Chaotic mapping is introduced to enhance population diversity, while quantum-behaved particle dynamics improve global exploration capability. Utilizing large-scale real-world transaction data from the Brazilian e-commerce industry, high-fidelity surrogate response surfaces are constructed for three core business indicators: profitability, customer loyalty, and value density. Experimental results show that the proposed CQPSO–Kriging model significantly outperforms conventional approaches, such as support vector regression and radial basis function networks, achieving an exceptional coefficient of determination of R2 = 0.9586 in profit prediction. Furthermore, Sobol variance-based global sensitivity analysis is employed to extract critical managerial insights, revealing that financial variables act as interaction-driven utility multipliers in consumer decision-making. Multi-objective Pareto analysis further demonstrates that profit maximization naturally converges toward a balanced operational configuration, providing a robust quantitative tool for e-commerce precision marketing.
1. Introduction
Modern e-commerce ecosystems represent complex operational systems characterized by high-dimensional, nonlinear, and strongly coupled decision variables. Within such environments, key operational parameters—including price utility, logistics performance, and financial installment policies—do not act independently but interact through high-order synergistic mechanisms that jointly shape system performance [1,2,3]. In dynamic service environments, operational parameters such as price utility, logistics resistance, and financial installments do not function in isolation; rather, they interact through intricate, high-order synergistic mechanisms [4]. Traditional heuristic experimentation or A/B testing approaches often assume parameter independence, failing to capture the “satisfaction cliff”—a nonlinear performance degradation where excessive logistics delays can entirely negate the utility of price discounts. As demonstrated by recent literature on omnichannel operations, the integration of price optimization with e-fulfillment logistics represents a mathematically challenging NP-hard problem, wherein retailers must simultaneously balance conflicting objectives such as profit maximization and lost sales minimization [5]. Recent empirical studies further corroborate that integrating logistics service quality with flexible payment drivers is fundamental to building consumer trust and systemic retention [6]. Furthermore, the inherent lag in consumer feedback limits the agility of empirical adjustments [7,8], necessitating computationally efficient and mathematically robust methodologies to navigate the competing demands of profitability, customer loyalty, and value density, as well as to systematically enhance long-term customer retention [9]. Recent studies emphasize that achieving an optimal balance in such multi-objective complex systems requires joint optimization frameworks rather than isolated parameter tuning [10].
To alleviate the computational burden of evaluating expensive, black-box operational functions, surrogate modeling has been widely adopted. While machine learning models such as Support Vector Regression (SVR) and Radial Basis Function (RBF) networks demonstrate strong predictive capabilities in specific dimensions [11,12], they frequently lack rigorous uncertainty quantification. The Kriging model (Gaussian Process Regression) overcomes this limitation by treating the deterministic response as a realization of a stochastic process, thereby capturing spatial correlations effectively [13,14]. However, the construction of a high-fidelity Kriging model heavily relies on hyperparameter optimization via Maximum Likelihood Estimation (MLE). In high-dimensional mixed-variable spaces, this likelihood landscape is notoriously non-convex and multi-modal. Conventional hyperparameter tuning strategies are prone to premature convergence and frequently trap into local optima, severely degrading the topological accuracy of the response surfaces. This non-convex optimization challenge is a well-recognized bottleneck in surrogate-assisted global optimization, particularly when dealing with computationally expensive, high-dimensional black-box spaces [15,16,17,18,19].
To address this critical mathematical bottleneck, this study proposes a Chaos-initialized Quantum-behaved Particle Swarm Optimization (CQPSO) algorithm for robust Kriging hyperparameter estimation. While the standard Quantum-behaved Particle Swarm Optimization (QPSO) utilizes a probabilistic wave function to expand the search space [20], it still risks stagnation in narrow high-dimensional valleys. By integrating a Tent-Logistic hybrid chaotic map, the proposed CQPSO ensures deterministic ergodicity during swarm initialization, maximizing spatial entropy. Concurrently, a chaotic-quantum modulation operator is introduced to inject instantaneous perturbation energy, enabling particles to penetrate high-likelihood barriers via a simulated tunneling effect. The synergistic utilization of hybrid chaotic mapping and swarm intelligence has been recently proven to significantly enhance search ergodicity and global convergence in complex digital systems [21,22,23,24].
Beyond computational accuracy, solving the “accuracy-interpretability” trade-off is paramount for actionable decision support. To unbox the mathematically derived surrogate models, a variance-based global sensitivity analysis—specifically Sobol indices [25]—is employed. Unlike local sensitivity metrics, the Sobol method mathematically isolates first-order main effects from high-order interactions [26,27]. This allows for the rigorous quantitative identification of “utility multipliers”—parameters such as financial installments that exhibit negligible direct impact but regulate system outcomes through massive synergistic coupling. This mathematically aligns with recent macroeconomic findings where financial accessibility exhibits a profound moderating effect on consumption upgrading [28], but here it is rigorously quantified at the micro-operational level.
The main contributions of this study are threefold:
- (1)
- Methodological Innovation: A novel CQPSO–Kriging surrogate framework is proposed, effectively overcoming the non-convex hyperparameter optimization dilemma and achieving superior predictive fidelity (R2 = 0.9586) over traditional methods.
- (2)
- Theoretical Discovery: Utilizing variance-based Sobol analysis, the “Utility Multiplier” mechanism of financial installments is empirically identified and quantified for the first time in an e-commerce context.
- (3)
- Synergistic Decision Support: A 3D multi-objective Pareto frontier is constructed, providing mathematical evidence that under optimal parameter coupling, the profit-maximizing strategy intrinsically converges with the system-balanced optimum.
2. Problem Formulation and Mathematical Modeling
To facilitate efficient and interpretable optimization of e-commerce marketing strategies, this chapter presents the construction of the marketing response dataset, including the design of decision-oriented response functions, selection and encoding of input variables, and generation of representative samples for surrogate modeling. Unlike purely statistical preprocessing, the present framework emphasizes semantic interpretability and decision consistency, ensuring that each variable and transformation step corresponds to a realistic managerial factor in the e-commerce environment.
2.1. Variable Abstraction and Transformation Logic
The input variables are extracted from multiple relational tables of the Olist e-commerce dataset, including orders, order items, payments, reviews, and products. The order id field in the orders table acts as the relational backbone, enabling temporal and transactional alignment across heterogeneous sources. Although this table does not directly contain price information, it is essential for computing delivery intervals and synchronizing cross-table records.
At the raw data level, seven observable variables are defined to represent pricing, logistics, behavioral perception, temporal seasonality, and product heterogeneity. product price pv, freight value fv, review score rs, installment count in, delivery time dt, purchase month mp, product category index ci.
This index of Pricing Catcher Xp follows generalized cost theory, where price level, logistics expense, and delivery delay jointly represent purchasing resistance.
where pv is price, and is category avg price. The Logistics Resistance Xf reflects freight cost relative to product price. Logarithmic compression with a saturation threshold:
where fv is freight value. Delivery Deviation Xd measures the temporal variance between the promised delivery time and the actual fulfillment time. Unlike static logistics costs, Xd serves as a dynamic penalty factor reflecting operational uncertainty and service reliability.
where Tact is actual time, and Test is estimated time. The Financial Leverager Xi is A discrete-to-continuous mapped variable representing the degree of financial flexibility offered to the consumer.
2.2. Empirical Derivation of Multi-Objective Response Metrics
The objective of the surrogate modeling in this study is to map the continuous decision space to a multi-dimensional objective space. Instead of utilizing raw transactional outputs which are heavily corrupted by market anomalies, three differentiable response metrics are empirically derived from the real-world dataset to represent profitability, customer retention potential, and structural value density. These extracted metrics serve as the target outputs (Yp, Yl, Yd) for the Kriging models.
2.2.1. Adjusted Profit Margin Yp
The first response metric mathematically evaluates the overall economic utility based on actual transactional records. To ensure differentiability for the surrogate model, the raw profit data is transformed via a penalized aggregation function that incorporates price competitiveness, logistics friction, and a quadratic penalty for real-world delivery delays:
where δ~N(0, 0.01) represents the inherent observational noise statistically observed in the platform’s actual data recording, and is an infinitesimally small constant to prevent zero-division.
2.2.2. Continuous Loyalty Index Yl
In the raw dataset, customer review scores (rs) are discrete integers, which inherently disrupt the continuity of the Gaussian process manifold. To transform these discrete empirical evaluations into a continuous and differentiable loyalty surface, a Sigmoid-based smoothing transformation is applied:
This formulation effectively models the nonlinear degradation of actual customer loyalty in response to delivery deviations (Xd), serving as a mathematical proxy for long-term retention probability.
2.2.3. Value Density Yd
The third objective function quantifies the economic value per unit of physical weight (Wp) using a logarithmic scale to mitigate heteroscedasticity:
Consequently, the complete mathematical transformation pipeline of this study is formalized as the mapping:
Input variables such as Xp, Xf, Xi, and Xd are directly extracted from raw platform data and preprocessed using logarithmic and scaling functions to model key decision-making factors. The response metrics Yp, Yl, and Yd are not simulated functions, but mathematically smoothed empirical variables incorporating risk penalties and logarithmic transformations. This preprocessing pipeline establishes a hierarchical abstraction from noisy raw factors to robust semantic decision variables, thereby enhancing interpretability and stabilizing surrogate learning in mixed-variable real-world environments.
2.3. Data Dimensionality Reduction and Spatial Sampling
The original dataset comprises highly skewed transactional records. Direct application of Kriging to the full-scale dataset is computationally prohibitive due to the O(n3) complexity associated with the inversion of the correlation matrix R. To balance computational efficiency with topological fidelity, a centroid-based spatial aggregation strategy is adopted.
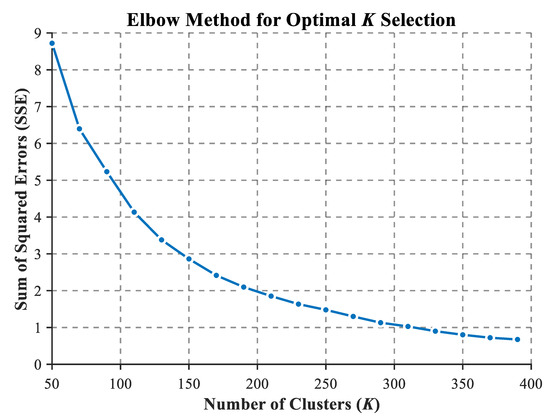
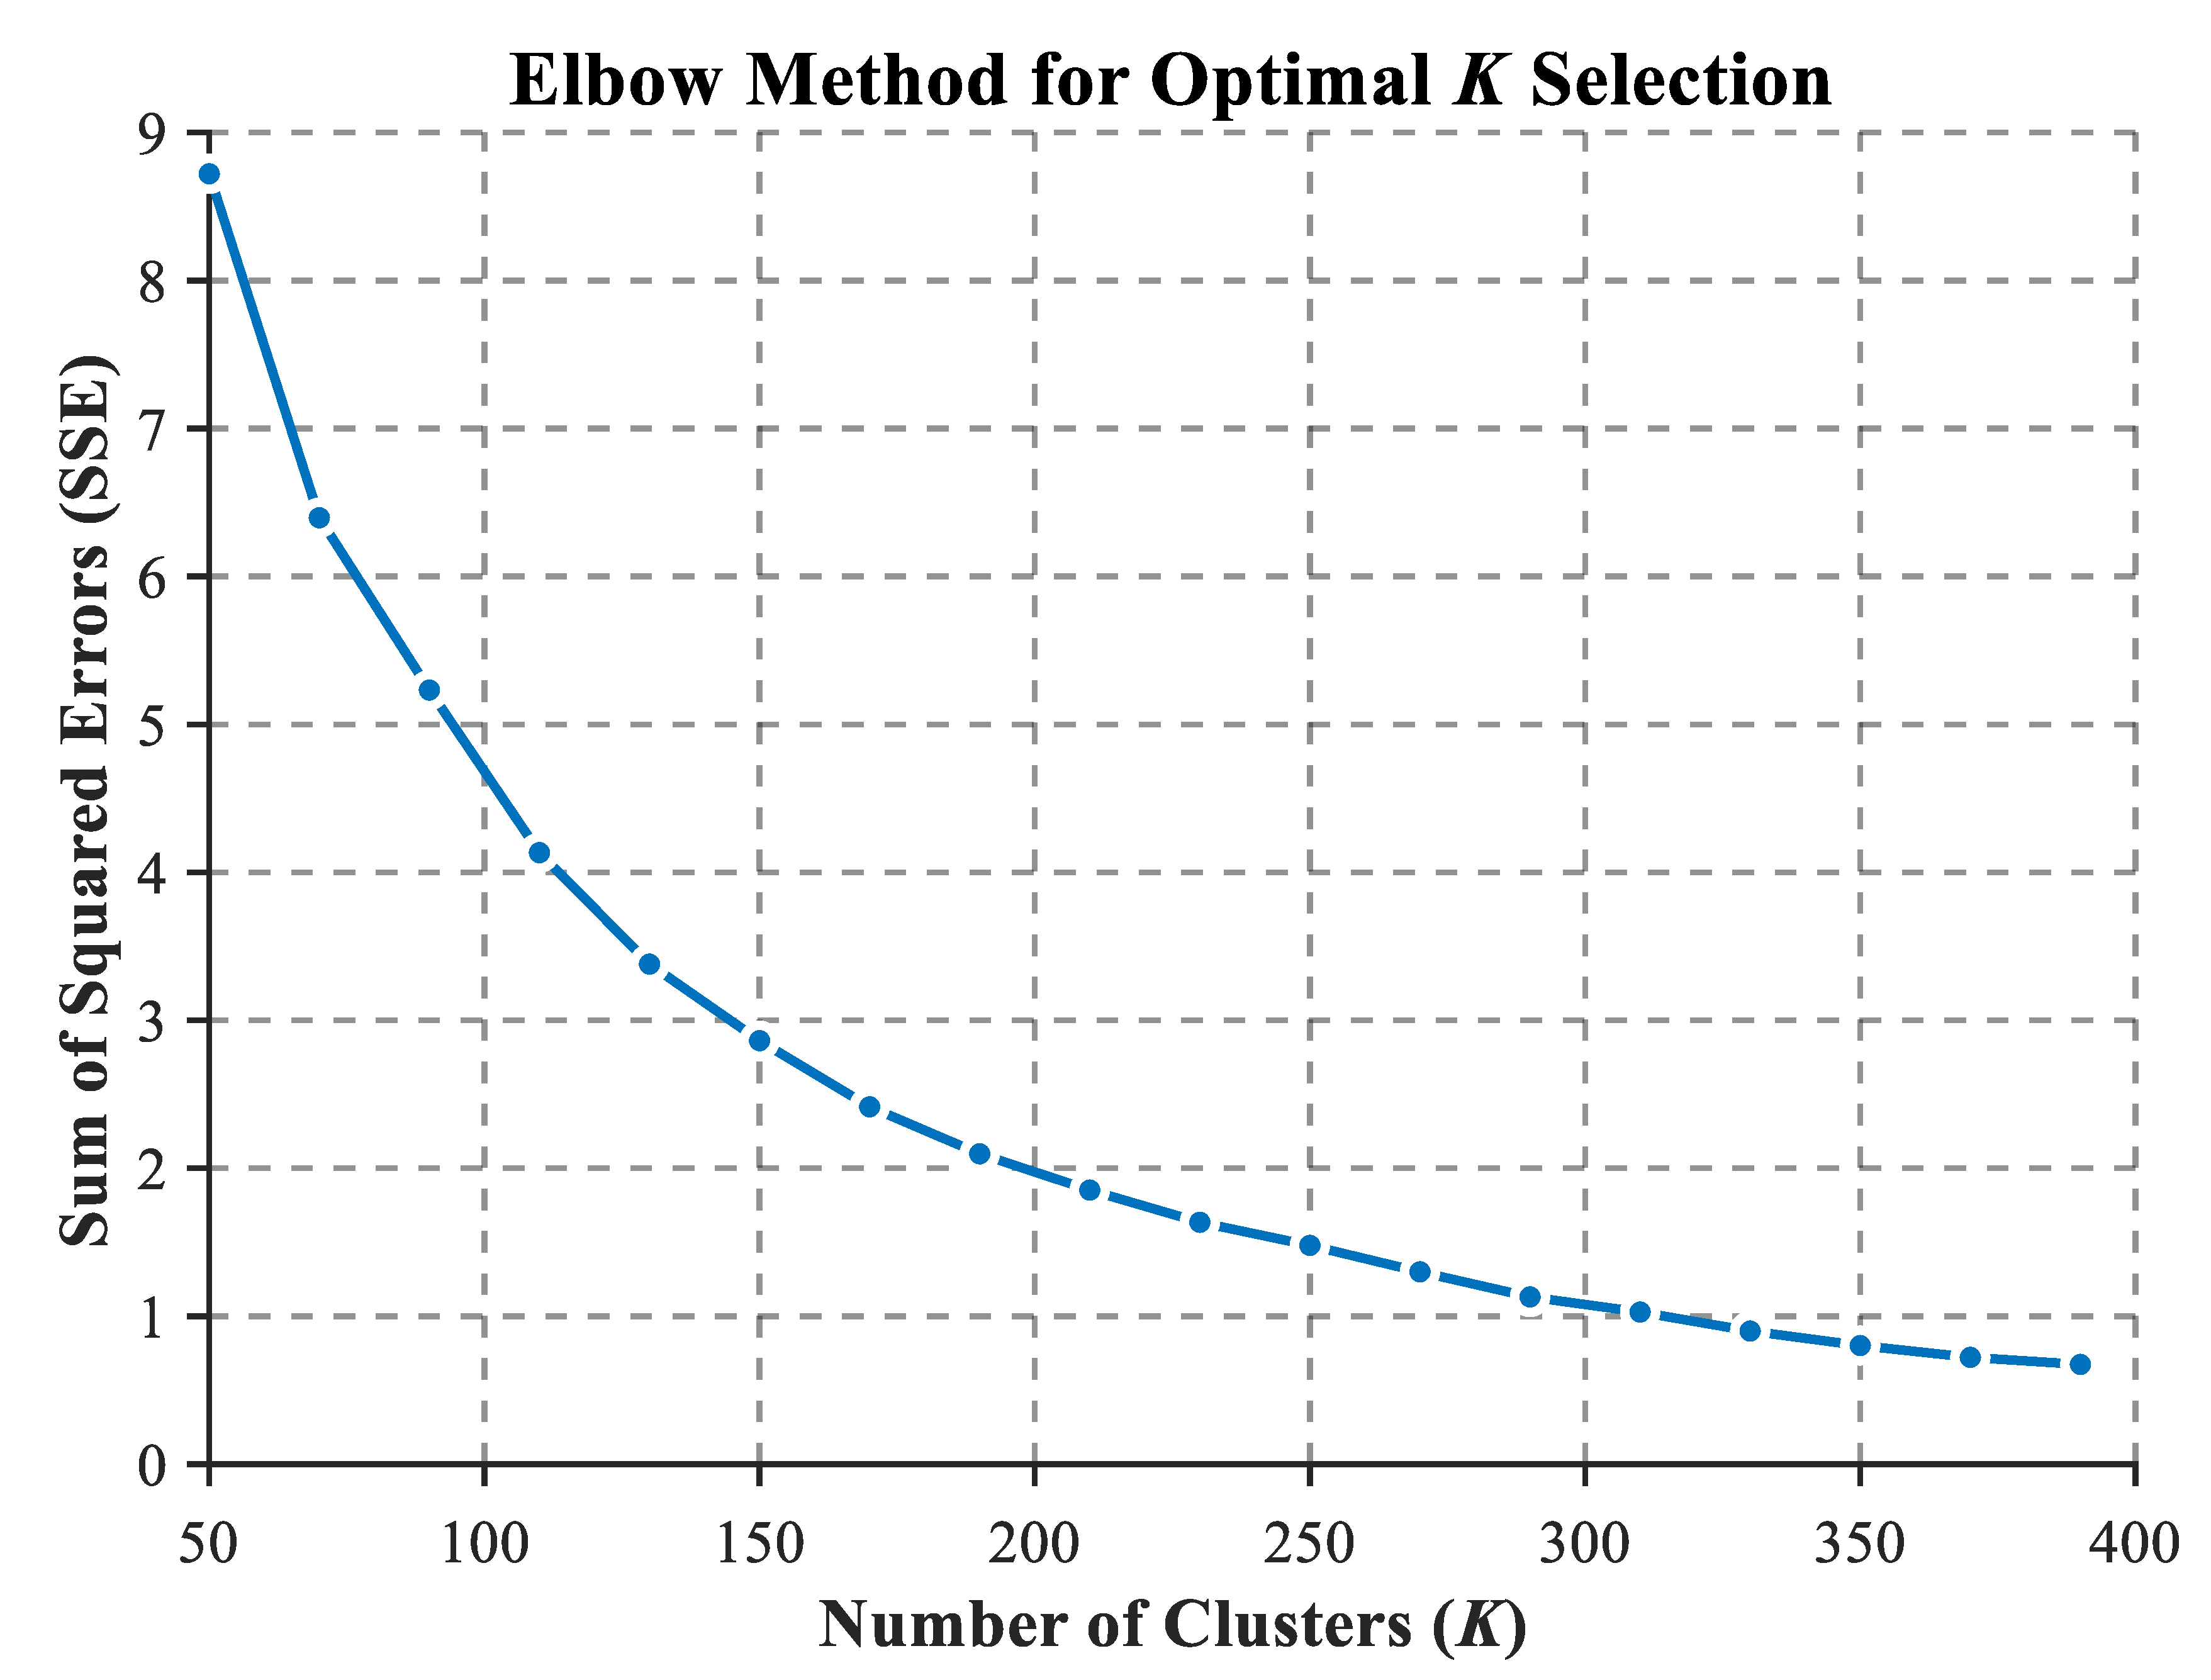
To mathematically justify the selection of the cluster number, the standard Elbow Method was applied to the dataset prior to aggregation. The within-cluster Sum of Squared Errors (SSE) was systematically evaluated across a wide spectrum of candidate cluster sizes K in [50, 400]. As illustrated in Figure 1, the SSE reduction curve exhibits a distinct mathematical inflection point precisely around K = 240. Beyond this specific threshold, the marginal gain in spatial topological fidelity diminishes exponentially, while the computational burden of the aforementioned O(n3) Kriging matrix inversion escalates prohibitively.
Figure 1.
The Elbow Method curve for determining the optimal number of K-means centroids.
Consequently, the dense raw data points are rigorously reduced to exactly 240 spatially representative centroids. This dimensionality reduction serves a dual purpose: it significantly enhances the signal-to-noise ratio and ensures a uniform space-filling distribution across the 4-dimensional hypercube.
During the construction of the input-output paired operator, the input centroids are utilized as spatial coordinates. For response variables such as profit margin Yp and value density Yd, which contain financial outliers, cluster medians are used to ensure model robustness. In contrast, for the discrete customer ratings Yl, cluster means are employed to convert the data into a continuous loyalty index, thus providing a differentiable mathematical manifold for the subsequent gradient-based exploration in the CQPSO algorithm. The raw data underwent dimensionless normalization to eliminate the effects of scale differences and improve model stability. This preprocessing step ensures that all input and output variables are placed on a comparable scale, enhancing the optimization process and preventing any single variable from disproportionately influencing the model due to its magnitude. The detailed descriptions and processed data parameters of these variables are summarized in Table 1.
Table 1.
Sample set of the e-commerce dataset.
After validation through a self-check report, the resulting 240 centroids were randomly partitioned using a strict three-way split strategy: a training set comprising 180 samples, an independent validation set of 30 samples, and a completely unseen testing set comprising 30 samples. The validation set is utilized strictly to evaluate the fitness function during the heuristic swarm search, while the testing set is reserved exclusively for the final objective performance benchmarking.
3. The Proposed CQPSO–Kriging Methodology
3.1. Standard Kriging Model
Kriging, also recognized as Gaussian Process Regression, is an interpolation-based surrogate modeling technique that interprets the unknown system response as a realization of a combined stochastic process [13,14]. In this framework, the response is decomposed into a deterministic global trend and a localized random fluctuation. Given an input vector x, the Kriging prediction is formulated as:
where Fβ represents the deterministic trend term describing the global variation in the response, and z(x) is a zero-mean Gaussian random process with variance σ2, accounting for local deviations. The covariance structure of the stochastic component, which characterizes the spatial dependence between sample locations, is defined as:
where R(xi, xj, θ) denotes the spatial correlation function. The correlation magnitude typically decreases as the distance between xi and xj increases. The hyperparameter θ controls the strength and decay rate of spatial correlation, thereby influencing the smoothness and anisotropy of the constructed response surface.
The correlation matrix R is assembled from all pairwise correlations . In this study, the Gaussian correlation kernel is employed to capture the complex nonlinearities of the e-commerce data:
Proper estimation of the hyperparameters θl is essential for accurately capturing spatial correlation and improving the fidelity of the surrogate model. To enhance both accuracy and computational efficiency, the optimal θl is typically estimated by minimizing the concentrated in-likelihood function:
However, this likelihood landscape is frequently characterized by high-dimensionality and multi-modality, posing significant challenges for traditional optimization. To address these limitations, advanced metaheuristic techniques—specifically the proposed CQPSO algorithm—are employed for robust hyperparameter estimation, leading to an improved Kriging surrogate model.
3.2. CQPSO Algorithm for Hyperparameter Optimization
To navigate the non-convex likelihood landscape , this study proposes a Chaotic Quantum-behaved Particle Swarm Optimization (CQPSO) algorithm. Crucially, the swarm operates entirely within the hyperparameter space , seeking the optimal correlation decay vector θl.
3.2.1. Initialization of Chaotic Mapping
The PSO algorithm, initially proposed in 1995, interprets the optimization task as a stochastic search process performed by a swarm of M autonomous particles. Representing points in a D-dimensional solution space, these particles undergo a directed random walk guided by historically successful states. By balancing the exploitation of personal historical optima and the exploration driven by the swarm’s global best position, the particles dynamically modulate their search directions to explore the complex landscape of the optimization problem.
The position vector and velocity vector of the i-th particle at iteration t are defined as:
Here, i refers to the particle index, M is the size of the swarm, and t is the current iteration step. The vector θij represents the position of the i-th particle in the j-th dimension. xij and vi denote the position and velocity of the particle in the j-th dimension, respectively, with the velocity constrained within the range vmin ≤ vij ≤ vmax. The velocity and position updates for the particle are given by:
where c1 and c2 are cognitive and social acceleration coefficients, usually both set to 2. Then r1 and r2 are uniformly distributed random numbers in (0, 1). is the inertia weight, pi is the personal best position of the particle, and pg is the global best position found by the swarm. However, such uniform random distribution often fails to capture the intricate topological features of the concentrated landscape
To enhance the initial perceptual breadth of the swarm, this study replaces the standard random initialization with an Ergodic Chaotic Activation strategy. Instead of directly sampling Xi(0) from a uniform distribution, the initial coordinates are determined by the iterative sequence of a Tent-Logistic hybrid chaotic map
The initial position of the i-th particle in the j-th dimension, θij(0), is subsequently defined by mapping the chaotic state value zij into the physical search domain:
where Lj and Uj represent the lower and upper bounds of the j-th hyperparameter, respectively.
This chaotic activation mechanism replaces the stochastic uncertainty of pseudo-random numbers with the deterministic ergodicity of a chaotic system. By leveraging the sensitivity to initial conditions and the space-filling property of chaotic trajectories, the swarm achieves a superior coverage of the Kriging hyperparameter landscape from t = 0. This ensures that the global best position Pg discovered in the initial step is more likely to reside within the basin of the true global optimum, effectively mitigating the risk of premature convergence inherent in standard PSO initialization.
3.2.2. Quantum-Chaotic Regulation
Unlike the classical Particle Swarm Optimization (PSO) that relies on deterministic velocity-position vector updates, the Quantum-behaved Particle Swarm Optimization (QPSO) describes the spatial state of particles using a probabilistic wave function, enabling particles to explore the search space across a wider range of dimensions [20]. At iteration t, the quantum-behaved position Pi(t) of particle i is calculated as:
where is a random number between 0 and 1, representing the probabilistic quantum behavior. To further enhance the algorithm’s ability to escape from local optima, this study introduces a chaotic modulation operator in the position update rule. The particle position evolution rule is modified as follows:
where ui(t) is a uniformly distributed random value between 0 and 1, and M(t) represents the average optimal position of the swarm
In addition, the proposed method adopts an adaptive coefficient modulated by a chaotic sequence, denoted as αchaos(t):
Here, zt is the state variable of the real-time evolution of the chaotic system. The physical significance of this chaotic-quantum coupling mechanism lies in the use of the unpredictability of chaotic motion to inject perturbation energy into particles trapped in quantum wells. In the later stages of the algorithm, the linearly decaying α(t) typically results in the loss of exploration capability by the swarm; however, the introduction of the chaotic operator generates instantaneous pulses, adjusting the quantum search radius and enabling particles to penetrate high-energy barriers in the likelihood function, mimicking a tunneling effect. This collaborative evolution logic significantly enhances the global exploration depth of the algorithm when handling the high-dimensional Kriging hyperparameter space, effectively mitigating the risk of premature convergence.
3.2.3. Antagonistic Interaction
To precisely balance exploration and exploitation, the population is bifurcated into a Global Exploration Swarm (Ωglb) and Local Exploitation Swarm (Ωloc) is regulated by the chaotic residual.
The swarms interact through an adversarial update of their respective centroids:
This antagonism maintains population diversity by preventing premature collapse toward a single cluster. A dynamic trust-region r(t + 1) is implemented to adaptively rescale the search radius based on the validation error Eval:
Particles are subsequently projected back into this high-fidelity region with a projection operator to ensure localized refinement.
The synergy between chaotic activation, quantum evolution, and antagonistic interaction ensures the robust estimation of the optimal hyperparameter vector θ.
To ensure both computational efficiency and model stability, the optimization process terminates based on a dual-criterion standard. The mean variation in the validation error over a window W must be below a threshold :
The Euclidean displacement of the hyperparameter vector must satisfy:
3.3. Computational Complexity Analysis
To theoretically evaluate the algorithmic efficiency, the asymptotic time and space complexities of the proposed CQPSO framework are formally analyzed. The execution time is primarily governed by three stages: chaotic initialization, iterative quantum position updating, and Kriging fitness evaluation.
Let S denote the swarm size, D denote the search space dimensionality, and Tmax denote the maximum number of iterations. The chaotic initialization requires operations. During the iterative phase, the calculation of the mean best position and the quantum position updates require operations. The Kriging fitness evaluation inherently involves the inversion of a covariance matrix, denoted as , resulting in an evaluation complexity of .
Consequently, the overall time complexity of the CQPSO–Kriging framework is bounded by . The space complexity is to store the particle positions and personal bests, demonstrating that the proposed hybrid algorithm is computationally efficient and perfectly suited for offline strategic hyperparameter optimization.
It is theoretically important to clarify that, similar to other stochastic meta-heuristics tackling highly non-convex black-box problems, the CQPSO algorithm does not possess absolute deterministic global optimality bounds or a strictly analytical convergence proof. Instead, the heuristic equations introduced above guarantee asymptotic convergence in probability. The synergistic integration of chaotic ergodicity and quantum tunneling probabilistically ensures that particles avoid premature stagnation, which is comprehensively validated through the empirical convergence trajectories discussed in the subsequent experimental sections.
3.4. Execution Logic of the CQPSO–Kriging Framework
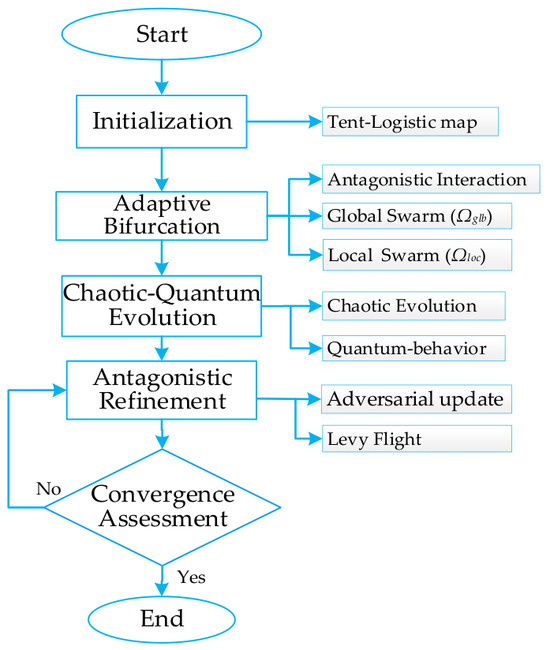
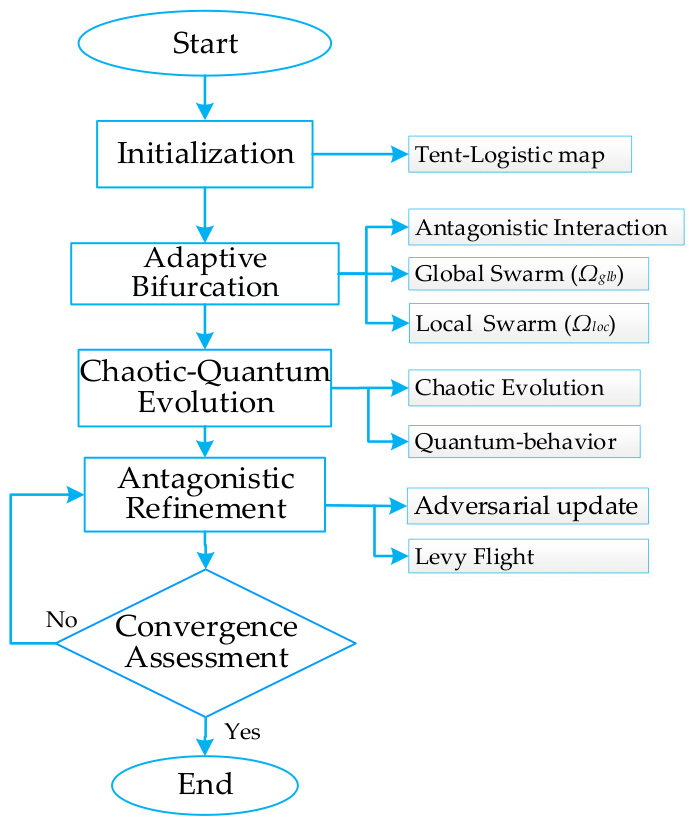
The operational hierarchy of the proposed CQPSO–Kriging framework is systematically structured to ensure a seamless transition from global stochastic exploration to localized gradient-based refinement. The execution logic, as illustrated in Figure 2, follows a five-stage evolutionary trajectory:
Figure 2.
Flowchart of the proposed CQPSO–Kriging optimization framework.
Stage 1: Ergodic Chaotic Priming
The optimization process commences with the Chaotic Space-Filling Initialization. By utilizing the deterministic ergodicity of the Tent-Logistic hybrid map, the algorithm populates the D-dimensional hyperparameter manifold with a set of particles θij(0). This stage is critical for maximizing the initial entropy of the swarm, ensuring that the starting points are not clustered in suboptimal regions of the likelihood landscape.
Stage 2: Adaptive Bifurcation and Fitness Mapping
Upon initialization, the fitness of each candidate solution is quantified by the concentrated log-likelihood function F(Xi(t)). Based on these objective values, the population is bifurcated into the Global Exploration Swarm (Ωglb) and Local Exploitation Swarm (Ωloc). This dual-population architecture facilitates a specialized search strategy where Ωglb maintains diversity while Ωloc focuses on rapid convergence.
Stage 3: Chaotic-Quantum Synchronous Evolution
In the primary evolutionary loop, the swarm undergoes Quantum-behaved Regulation. The mean best position M(t) acts as the attractor in the quantum potential well. Simultaneously, the chaotic variable zt modulates the contraction-expansion coefficient αchaos(t), injecting stochastic pulses that allow particles to tunnel through high-likelihood barriers, effectively mitigating the risk of premature convergence during the exploration phase.
Stage 4: Antagonistic Refinement and Dynamic Projection
The transition to the final refinement phase is governed by the Antagonistic Interaction mechanism. The centroids and undergo an adversarial update, which promotes an information exchange that prevents population stagnation. To ensure model stability, the search is projected into a dynamic trust-region r(t + 1), which is adaptively scaled according to the generalization error Eval of the Kriging model. If a stagnation threshold is triggered, Levy Flight Perturbation is activated to provide long-range jumps, forcing the swarm to escape narrow local basins of attraction.
Stage 5: Dual-Criterion Convergence Assessment
The algorithm terminates only when the Dual-Criterion Standard is satisfied: the relative stability of the validation error and the Euclidean convergence of the hyperparameter vector . Upon fulfillment, the optimal hyperparameter vector θ is exported to construct the final high-fidelity Kriging surrogate model.
4. Computational Results and Global Sensitivity Analysis
4.1. Model Validation and Predictive Performance
As previously discussed, the hyperparameters θl in the Kriging model play a critical role in determining the model’s accuracy and overall performance. From the analysis of Equation (9), it is evident that these parameters govern the correlation weights between sample points across design variables. In this study, the CQPSO algorithm is applied to optimize the hyperparameters θl of the Kriging model. By improving the global search capability and convergence accuracy of the model, the CQPSO algorithm ensures a more precise surrogate model that effectively captures the dynamics of e-commerce metrics.
To validate the effectiveness of the CQPSO–Kriging model, a comparative benchmarking is conducted against standard surrogate models (Kriging, RBF, SVR, and LLE). To ensure absolute experimental fairness, all models were trained and evaluated on an identical data pipeline. The continuous decision space was mapped using Min-Max normalization within the interval [0, 1]. To prevent data leakage, the scaling parameters derived from the training set were strictly applied to the independent testing set.
To represent standard engineering practices and highlight the algorithmic necessity of deep hyperparameter search, baseline models were configured using standard heuristic parameterizations. Specifically, the Standard Kriging hyperparameters were optimized using the internal Maximum Likelihood Estimation (MLE) within uniform bounds of [0.1, 20], while the RBF Gaussian spread parameter was determined dynamically via the median heuristic of pairwise Euclidean distances in the training set. Furthermore, the SVR was configured with a Gaussian kernel, a Box Constraint penalty factor of 10, and an Epsilon margin of 0.01, and the LLE model was set to k = 10 nearest neighbors with a 10−3 regularization term to ensure matrix non-singularity. To evaluate their predictive robustness, the models’ performance is subsequently assessed based on prediction accuracy across the Adjusted Profit Margin (Yp), Continuous Loyalty Index (Yl), and Value Density (Yd), with the comparative results presented in Table 2.
Table 2.
Comparison of Surrogate Model Performance.
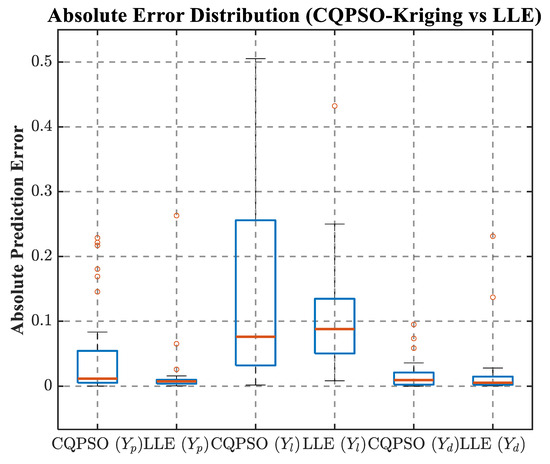
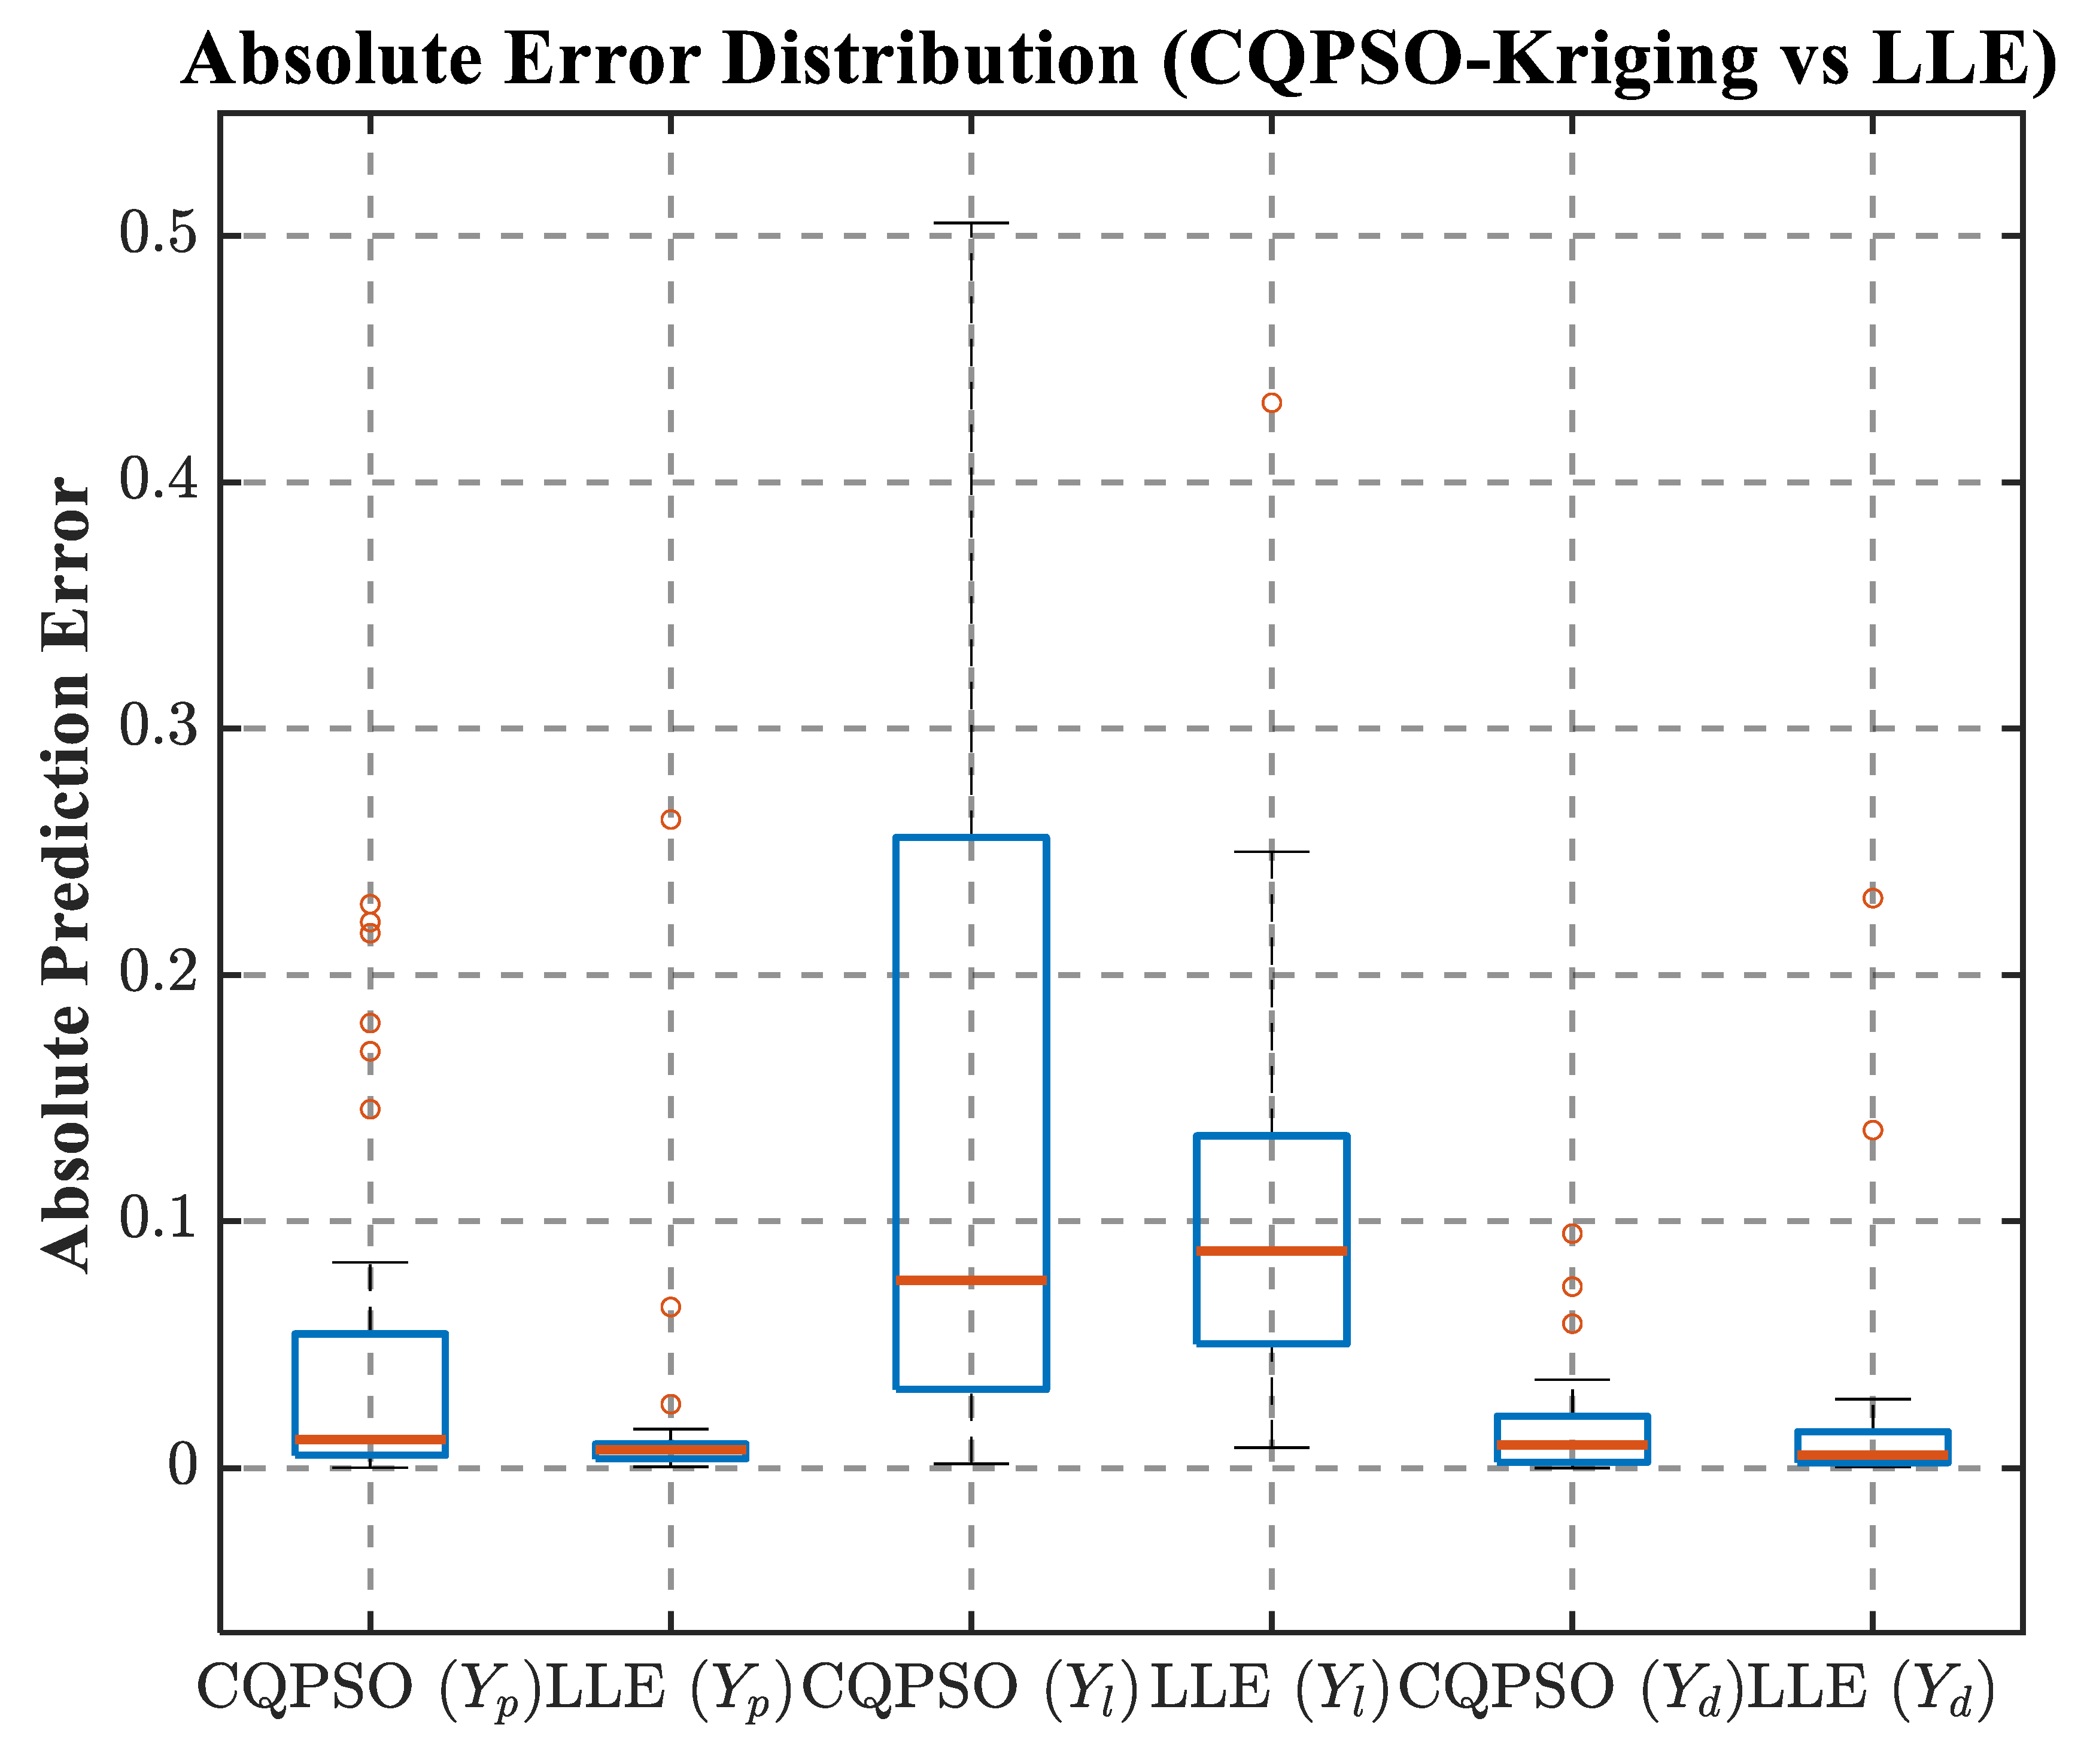
To rigorously substantiate the statistical significance of the models’ global stability, a non-parametric Wilcoxon Signed-Rank Test alongside an absolute error distribution analysis was conducted on the independent testing set. This dual-evaluation approach comprehensively exposes the structural fragilities of deterministic local modeling versus the proposed framework. The comparative results in Table 2 and the absolute error distribution visualized in Figure 2 reveal critical topological behaviors. For the Yp, the CQPSO–Kriging model achieves a high R2 of 0.9586 and a low RMSE of 0.0907, significantly outperforming standard Kriging (R2 = 0.6049) and SVR (R2 = 0.5792). We explicitly acknowledge that the deterministic LLE-based regression yields a higher single-metric fit (R2 = 0.9872) for Yp. However, our comprehensive analysis reveals that this localized outperformance is a classic symptom of severe nearest-neighbor overfitting.
The algorithmic necessity of the CQPSO–Kriging framework becomes strikingly evident when transitioning to more complex behavioral metrics. The Wilcoxon Signed-Rank Test on Yd yielded a non-significant p-value of 0.308, indicating that the median absolute errors of CQPSO–Kriging and LLE are statistically comparable across dense, flat topological regions. However, as explicitly illustrated by the extreme outliers in the error boxplot, the true measure of robustness lies at the boundaries. The LLE model suffers from catastrophic maximum boundary errors when faced with highly nonlinear manifolds. This structural fragility leads to a complete predictive collapse on Yd, where LLE yields a near-zero R2 of 0.0125. In stark contrast, Figure 3 demonstrates that the CQPSO–Kriging framework tightly bounds its extreme prediction errors (with the maximum squared error strictly bounded at 0.0090). Consequently, for Yd, the CQPSO–Kriging model maintains a robust R2 of 0.6748 and a remarkably low RMSE of 0.0284, decisively outperforming the standard Kriging (0.0592) and SVR (0.0927) models, which fail to capture the underlying data distribution.
Figure 3.
Absolute prediction error distribution boxplot across different response manifolds.
Furthermore, for the Yl, the CQPSO–Kriging model consistently outperforms all counterparts with the highest R2 (0.9085) and the lowest RMSE (0.3204), whereas LLE and RBF show significantly higher errors (RMSE of 0.3571 and 0.4552, respectively).
Overall, the integrated analysis of Table 2 and Figure 4 clearly demonstrates that while deterministic models like LLE may overfit specific local neighborhoods, they completely lack global generalization. The proposed CQPSO–Kriging surrogate model significantly outperforms traditional algorithms (Kriging, RBF, SVR) in comprehensive accuracy, and exhibits far superior global stability and cross-dimensional robustness compared to LLE. The optimized hyperparameters from CQPSO enable the Kriging model to reliably map highly nonlinear relationships inherent in the 4X-3Y optimization task. This superior stability proves the framework’s exceptional capability in optimizing complex nonlinear dynamics, providing a highly reliable and efficient surrogate modeling tool specifically tailored for modern omnichannel e-commerce service ecosystems.
Figure 4.
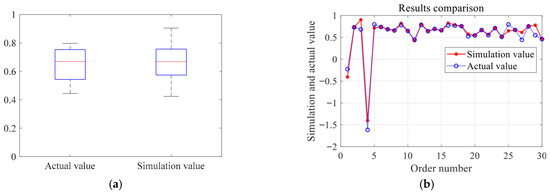
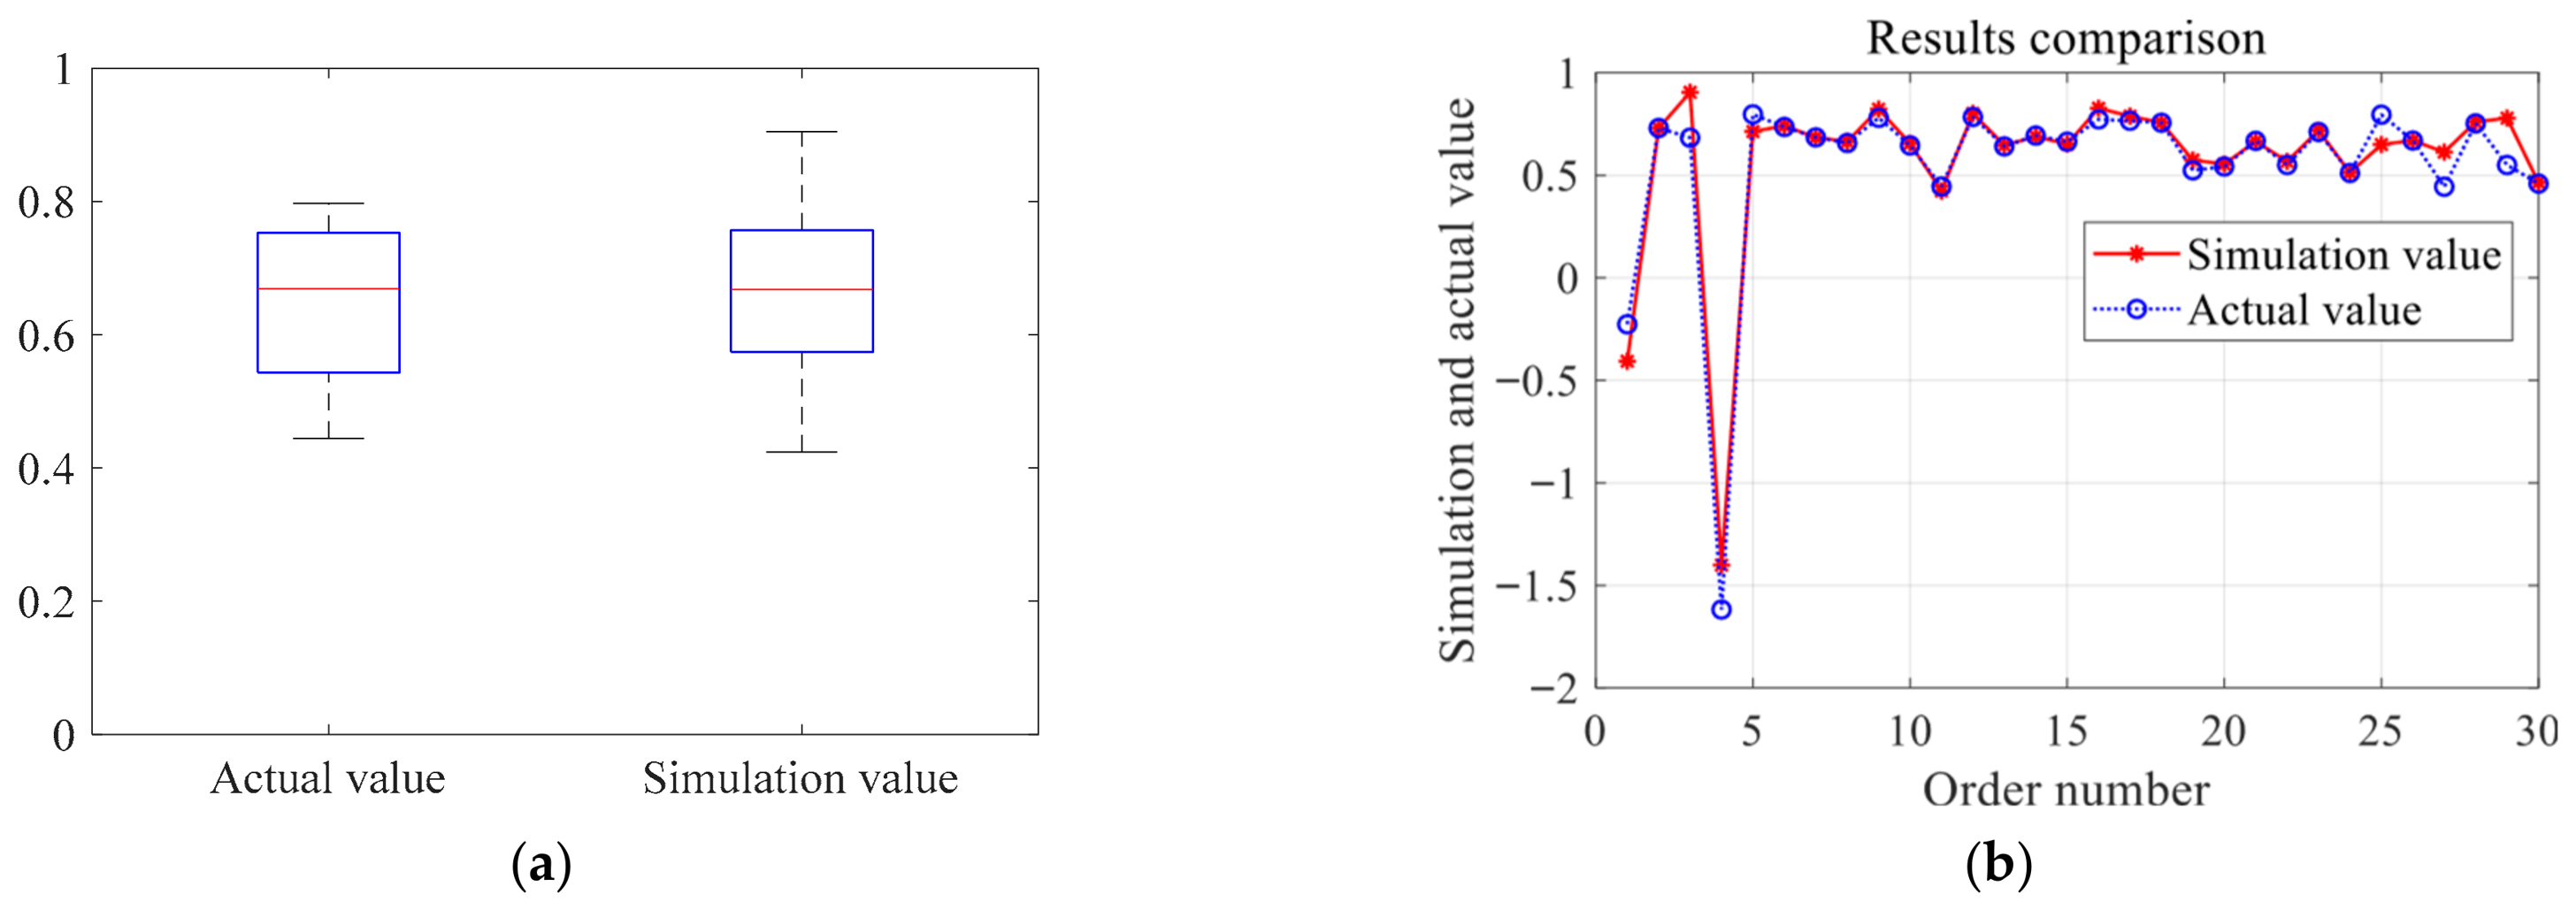
Comparison between actual and simulated values of Yp: (a) Box Plot; (b) Prediction Comparison.
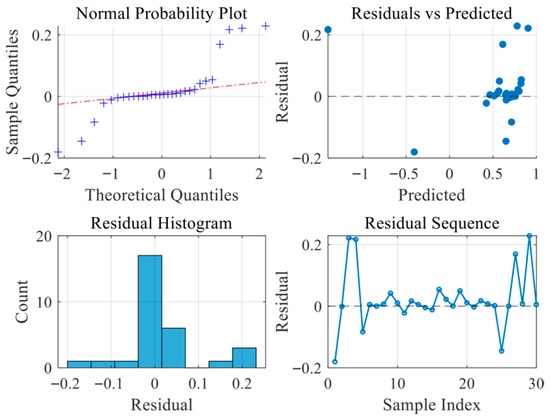
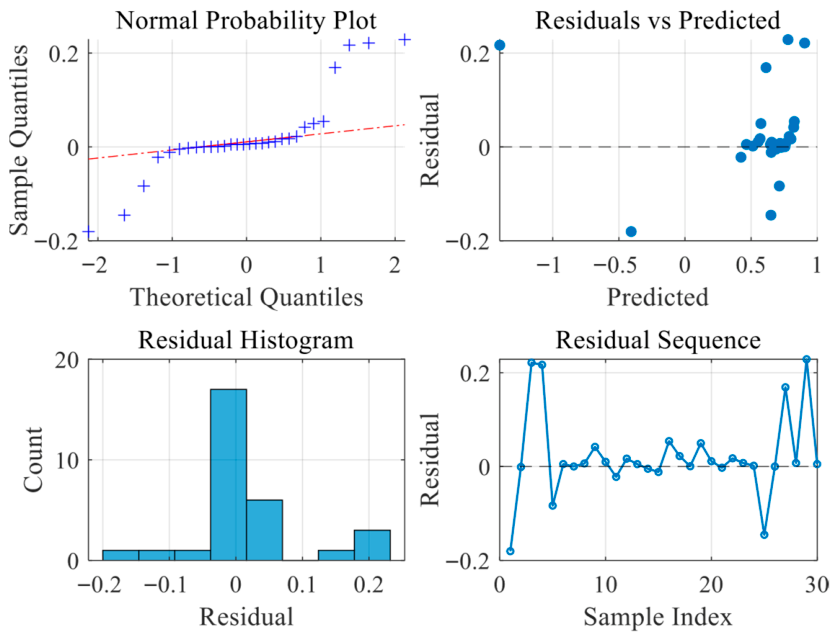
The optimized hyperparameters from CQPSO enable the Kriging model to better capture the complex, nonlinear interactions within the e-commerce data, leading to a more reliable and efficient optimization process. The optimized model’s residuals, prediction results, and box plots are shown in Figure 4 and Figure 5.
Figure 5.
Residual Plot.
In summary, the CQPSO–Kriging model generally provides small residuals for most samples, meeting the basic requirements for high-precision approximation. However, due to the limited sample size, some fluctuations in residuals exist in certain local samples and specific prediction value intervals.
4.2. Ablation Study on Algorithmic Components
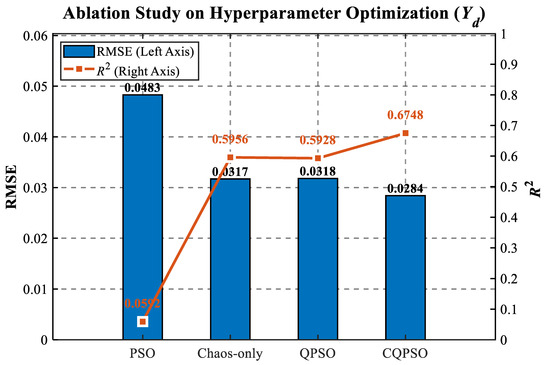
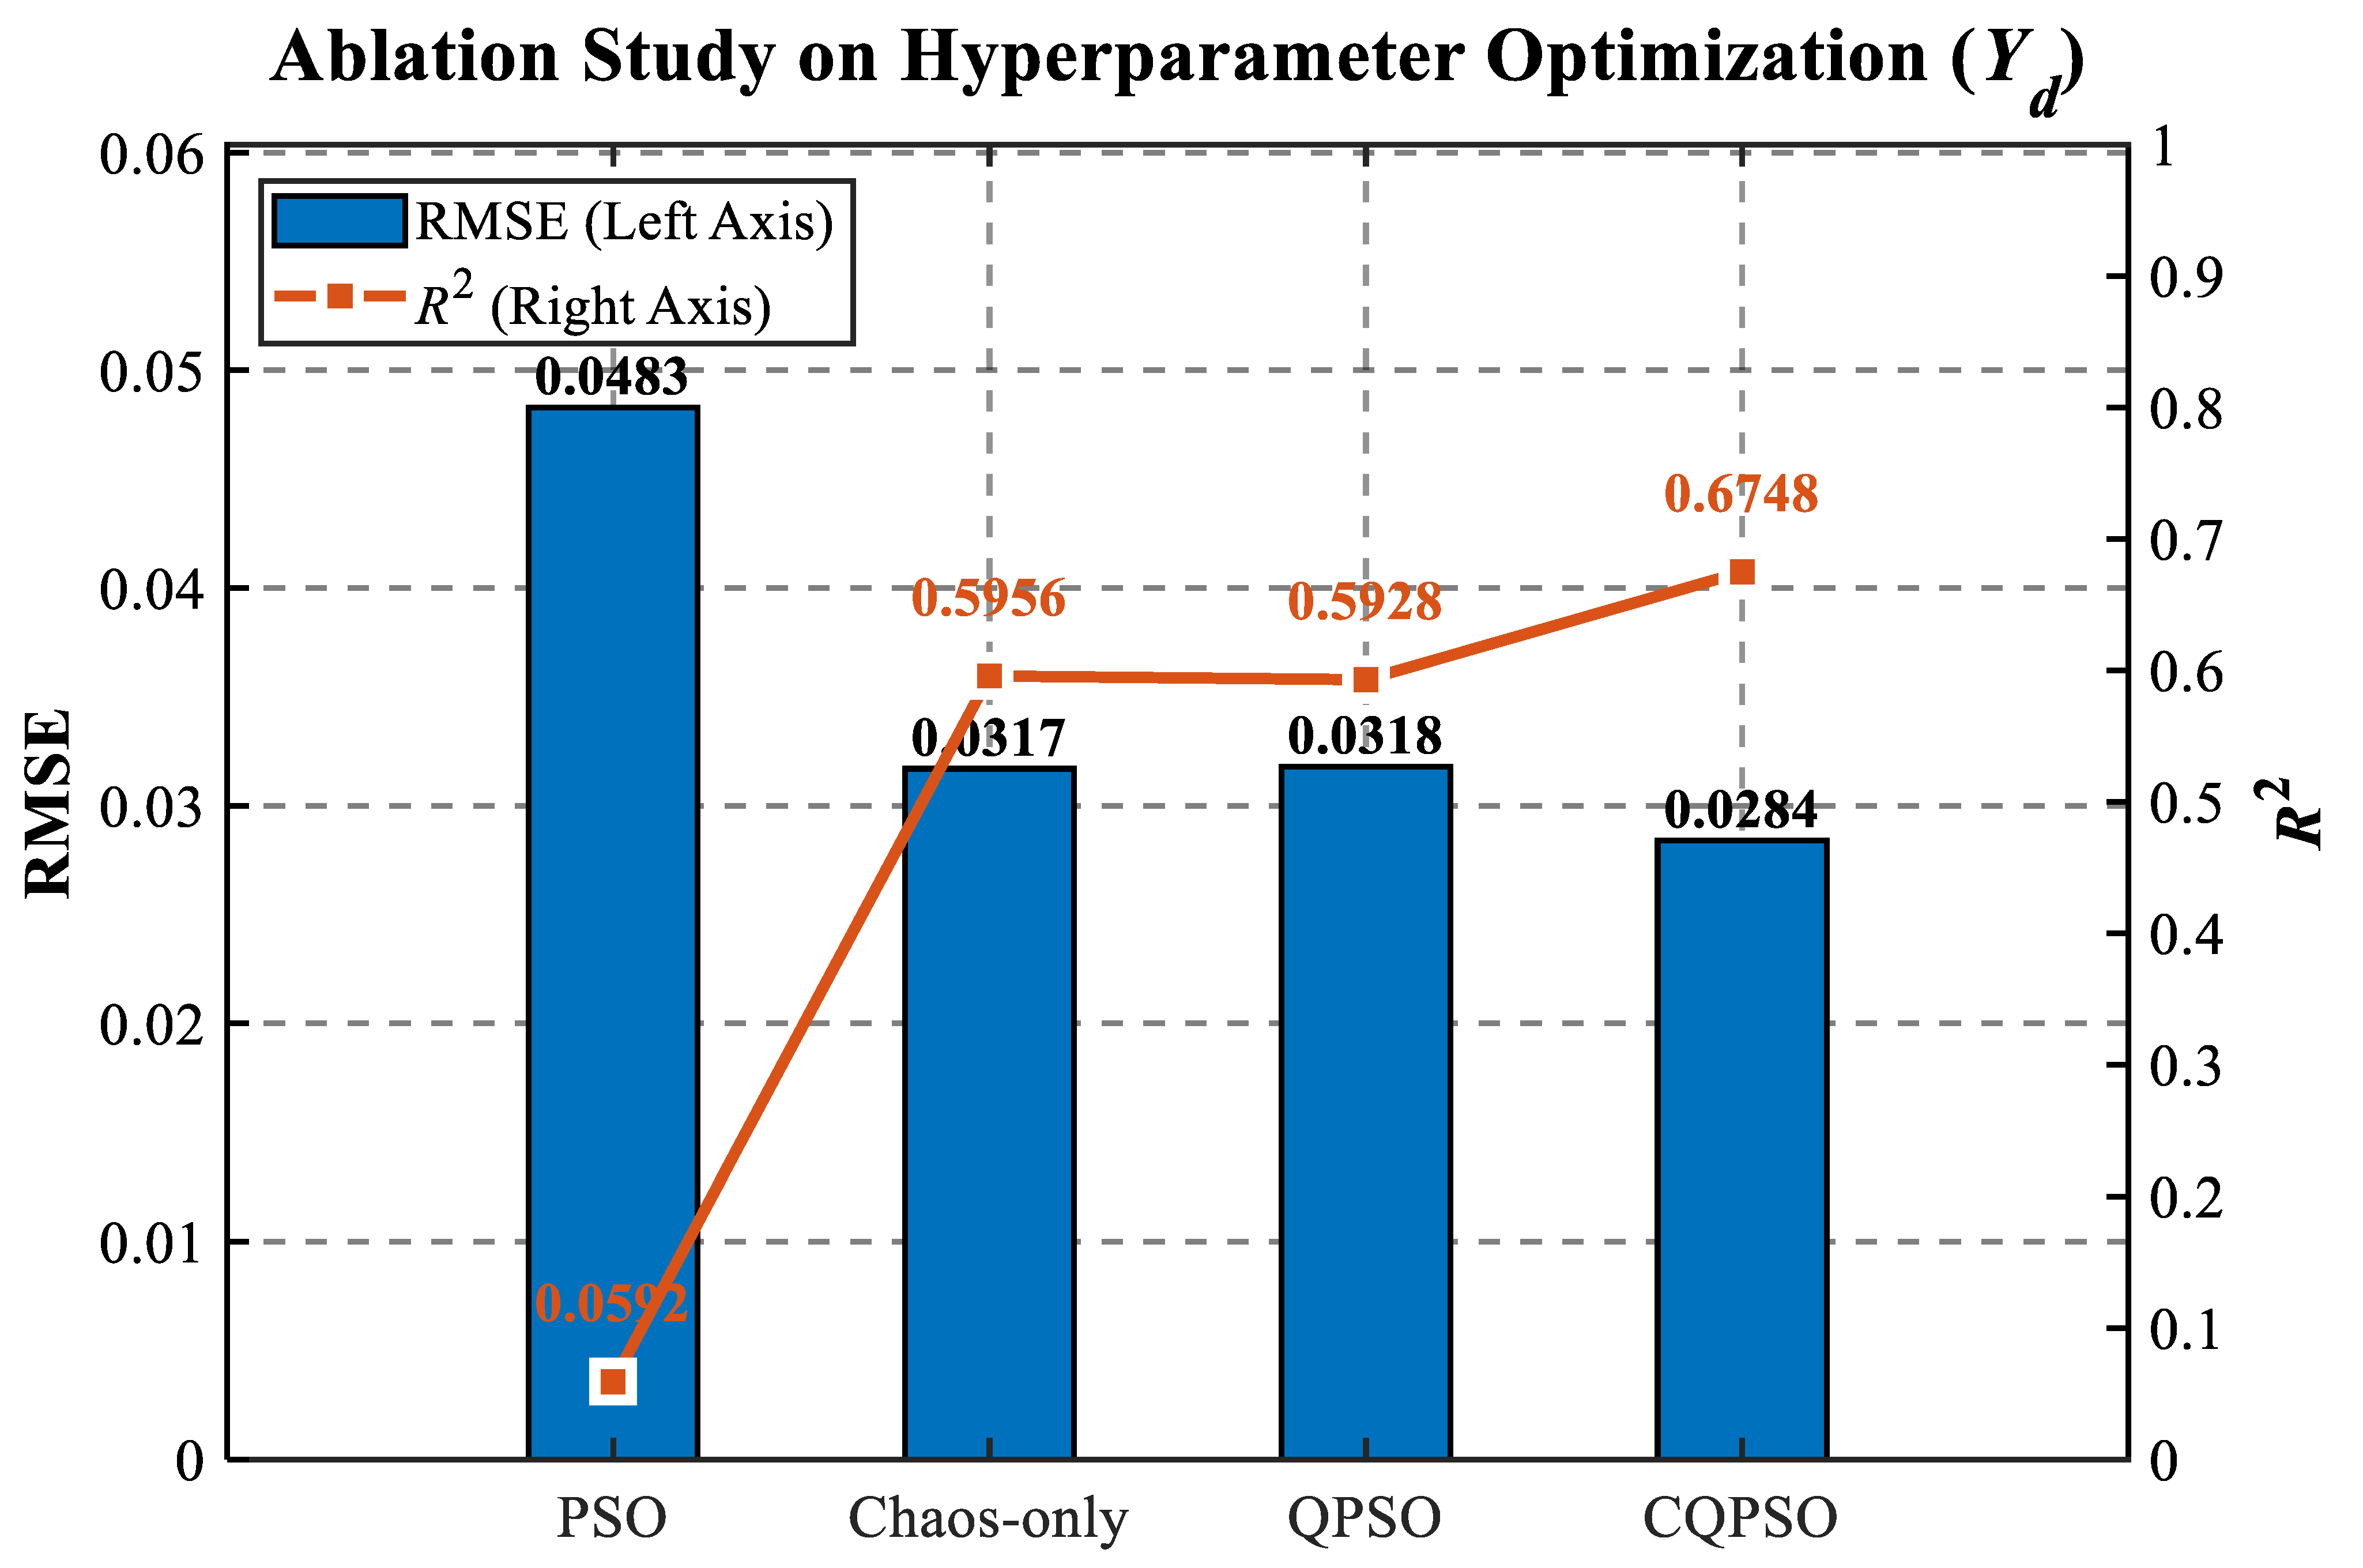
To rigorously evaluate the structural necessity of the proposed hybrid mechanism, a comprehensive ablation study was conducted. The algorithmic components were decoupled into four distinct variants: standard PSO, Chaos-only PSO, QPSO, and the fully integrated CQPSO. These variants were independently utilized to optimize the Kriging hyperparameters specifically for the Value Density (Yd) manifold, which exhibits the highest degree of nonlinearity in the 4X-3Y system.
The quantitative assessment results are summarized in Table 3, and the corresponding performance trends are visualized in Figure 6. As observed, the standard PSO-Kriging model exhibits limited search efficiency in complex high-dimensional spaces, resulting in the highest RMSE and a relatively low R2. The introduction of chaotic mapping (Chaos-only PSO) facilitates a more diverse initial spatial sampling, which effectively improves the global exploration capability. Conversely, the quantum tunneling behavior (QPSO) enhances the probabilistic search capacity, allowing particles to escape localized optima during the convergence phase.
Table 3.
Ablation Study Results of Model Variants.
Figure 6.
Ablation study results comparing the prediction accuracy of different algorithm variants.
Notably, the experimental data in Table 3 demonstrate that neither chaotic initialization nor quantum behavior alone can achieve the global optimum. The proposed CQPSO–Kriging framework yields a statistically significant improvement across all evaluation metrics, including RMSE, R2, and RMAE. Specifically, the synergistic integration of chaotic global coverage and quantum local refinement minimizes the prediction error and maximizes the goodness of fit. This ablation analysis definitively validates that every integrated component is structurally indispensable for accurately mapping the highly coupled and complex e-commerce behavioral manifolds.
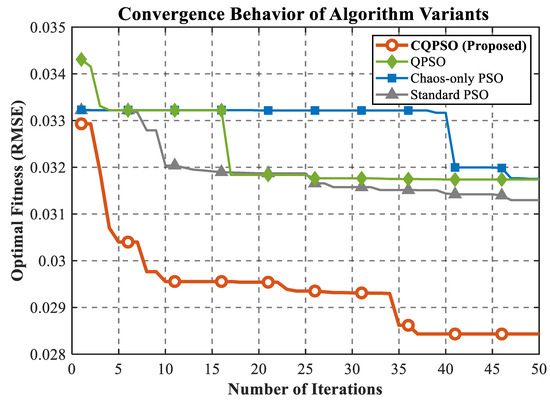
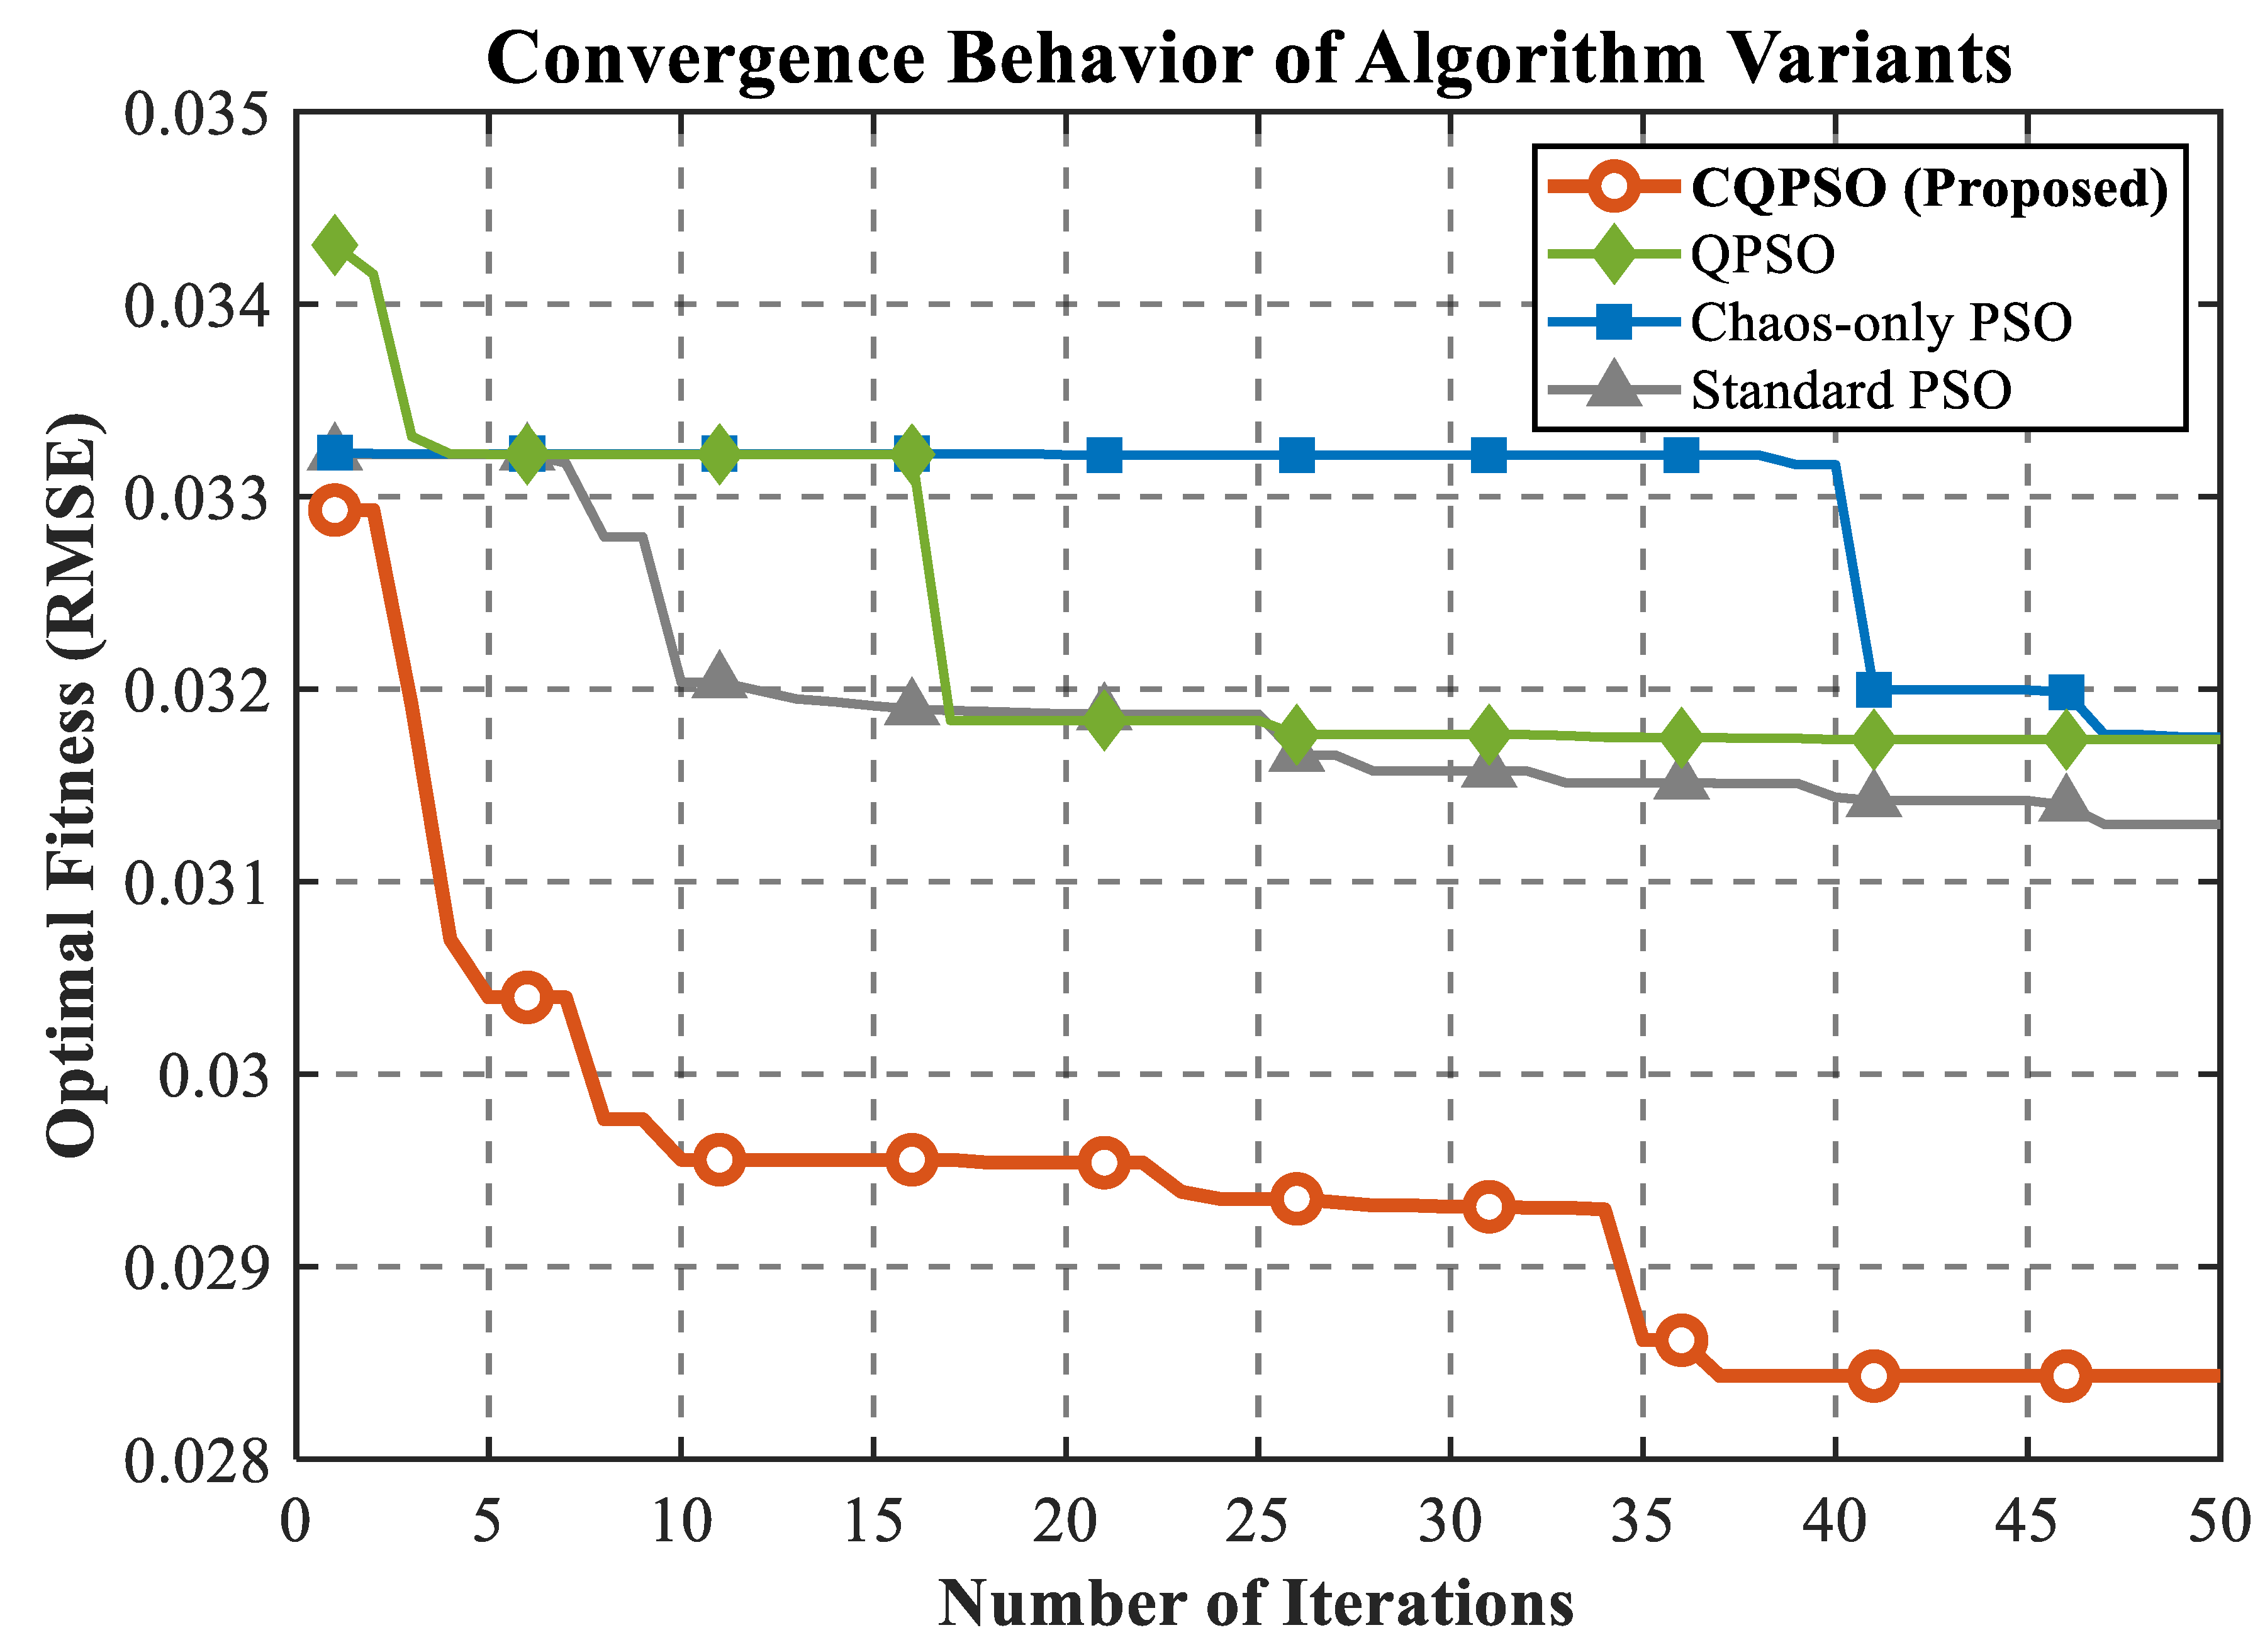
Furthermore, to explicitly elucidate the dynamic search behaviors and fundamentally verify the mathematical mechanisms of the proposed modules, the convergence histories of the four algorithmic variants are compared in Figure 7. As visually demonstrated, the Standard PSO curve flatlines prematurely, indicating severe stagnation in local optima. The CQPSO curve, however, drops significantly faster during the initial iterations, explicitly verifying that the chaotic mapping successfully scatters the initial swarm to a more advantageous starting coverage. In the later iterations, the CQPSO curve exhibits characteristic “step-like” drops; this phenomenon perfectly illustrates the quantum tunneling effect, allowing particles to mathematically penetrate energetic barriers and escape deep local stagnation. Ultimately, the proposed CQPSO inherits the rapid initial descent from the chaos mechanism and the continuous late-stage breakthrough capability from the quantum mechanism, converging to the absolute global minimum.
Figure 7.
Convergence Behavior of Algorithm Variants.
4.3. Robustness and Generalization Analysis
Real-world e-commerce operations are inherently subjected to substantial transactional noise and distributional shifts. Therefore, it is imperative to evaluate the robustness and generalization capabilities of the proposed CQPSO–Kriging framework.
To evaluate the stability and generalization capability of the CQPSO–Kriging framework across different data distributions—a critical requirement for real-world e-commerce deployment—a rigorous 5-fold cross-validation (CV) procedure was implemented. The original dataset was randomly partitioned into five mutually exclusive folds. In each iteration, four folds were utilized for training and hyperparameter optimization, while the remaining fold served as the independent testing set.
The quantitative results for the most complex manifold, Value Density (Yd), are summarized in Table 4. The proposed model demonstrates remarkable consistency across all five partitions. The mean R2 is 0.6652 with a standard deviation of only 0.0089, and the RMSE fluctuations are strictly bounded within ± 0.0005. This high degree of numerical stability indicates that the model’s predictive fidelity is not a statistical artifact of a specific data split but a generalized property of the CQPSO–Kriging architecture.
Table 4.
Performance consistency across 5-fold cross-validation folds for Yd.
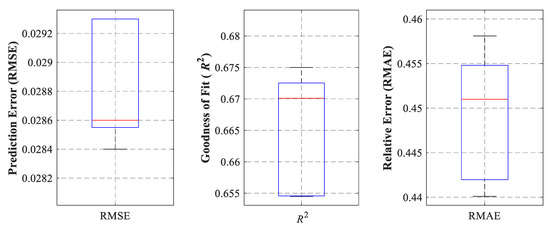
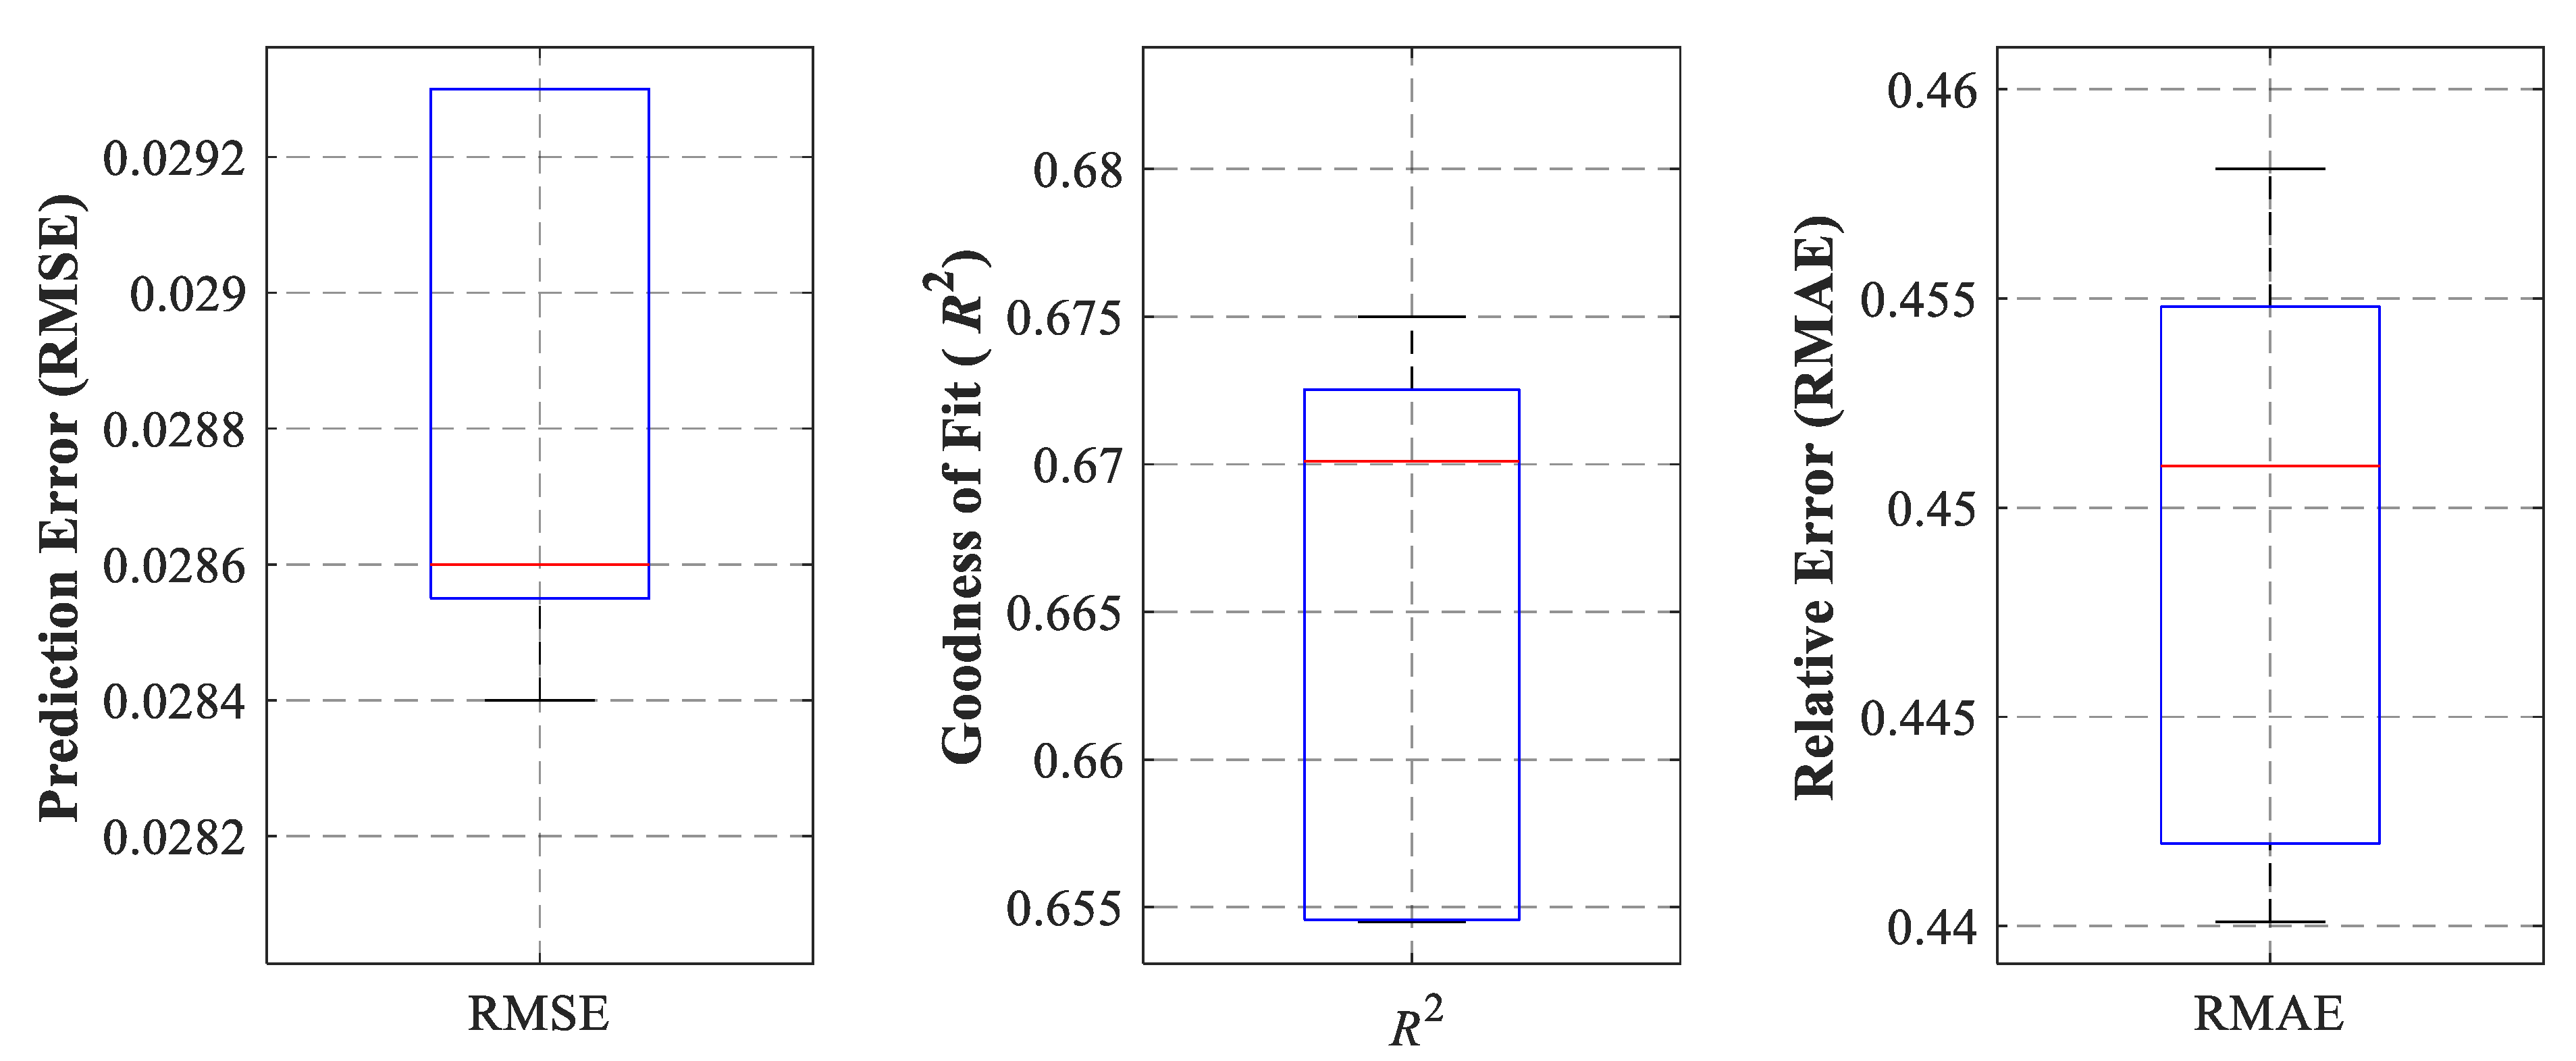
To further visualize this robustness, the distribution of performance metrics is illustrated via boxplots in Figure 8. The tight clustering of the RMSE, R2, and RMAE values, with no significant outliers across the folds, confirms that the framework remains resilient against localized data variations and inherent transactional noise. Consequently, the CQPSO–Kriging model proves to be a robust surrogate capable of maintaining high-fidelity mapping even under varying e-commerce operational scenarios.
Figure 8.
Distribution of performance metrics of Yd.
4.4. Response Surface Visualization and Topological Analysis
Following the construction of high-fidelity surrogate models via the CQPSO–Kriging framework, this section employs Response Surface Methodology to visually elucidate the complex nonlinear relationships between operational parameters—such as price utility and logistics resistance—and the resulting business metrics. The visualization of response surfaces serves not only to verify the model’s capability in capturing global topological trends but also to reveal the underlying interaction mechanisms that govern system performance. Such an analysis is crucial for identifying key drivers within the e-commerce ecosystem and understanding the performance trade-offs under various operational constraints, thereby providing a physical and logical foundation for subsequent multi-objective optimization and managerial decision-making.
4.4.1. Response Surface Analysis for Adjusted Profit Margin Yp
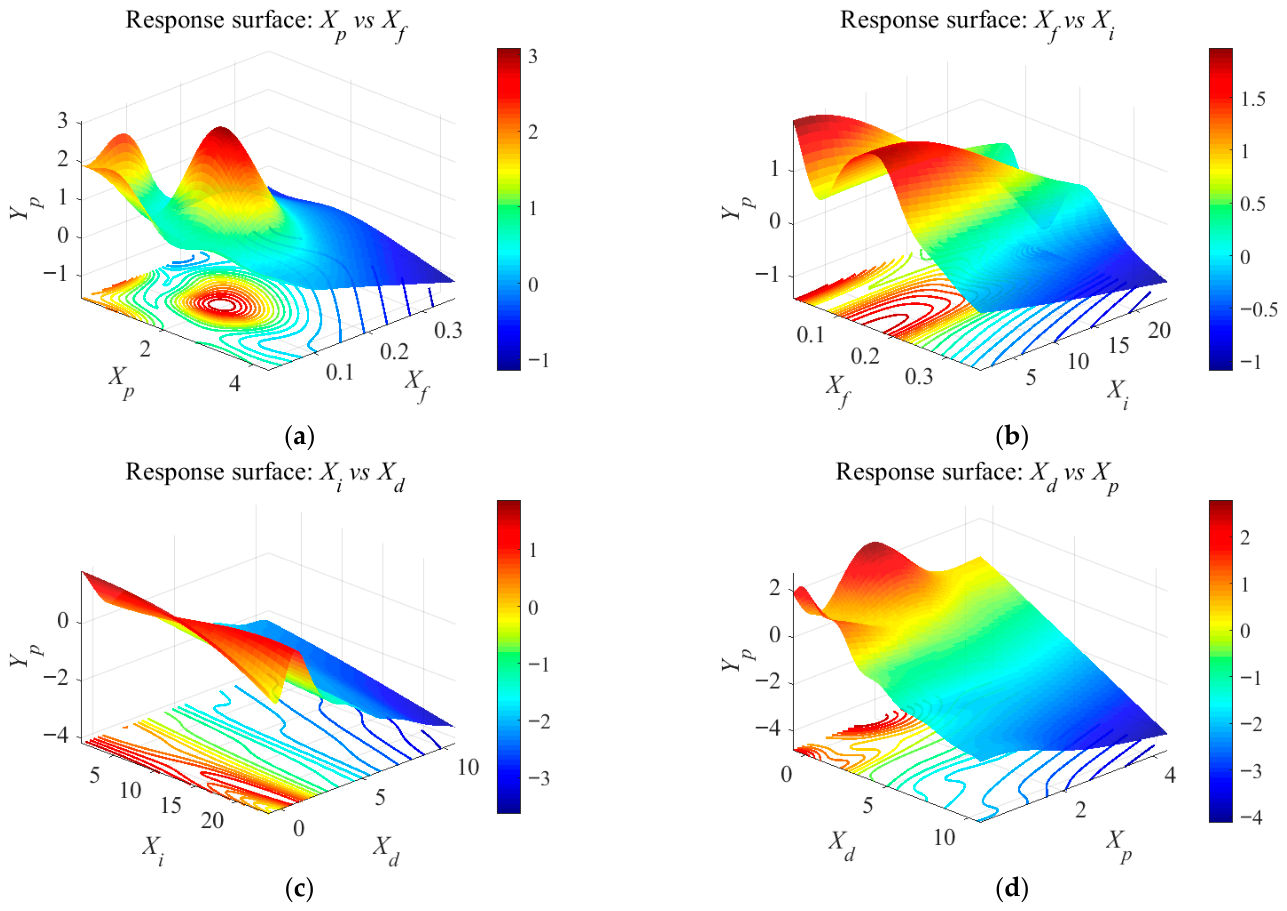
This subsection focuses on the fluctuation patterns of the Adjusted Profit Margin Yp in response to variations in input features. As illustrated in Figure 9, the response surface exhibits significant nonlinear topological characteristics, indicating that profitability is driven by the intricate coupling of multiple operational factors.
Figure 9.
Response surfaces and contour plots of Yp: (a) Xp vs. Xf; (b) Xf vs. Xi; (c) Xi vs. Xd; (d) Xd vs. Xp.
As observed in Figure 9c,d, the response surface for Yp enters a negative domain when Xd exceeds critical thresholds. This effectively reflects the Risk Penalty Mechanism integrated into our framework, indicating that suboptimal operational configurations—such as excessive delivery delays or low value-to-weight ratios—result in a net economic loss due to platform penalties and diminished customer lifetime value.
4.4.2. Response Surface Analysis for Loyalty Index Yl
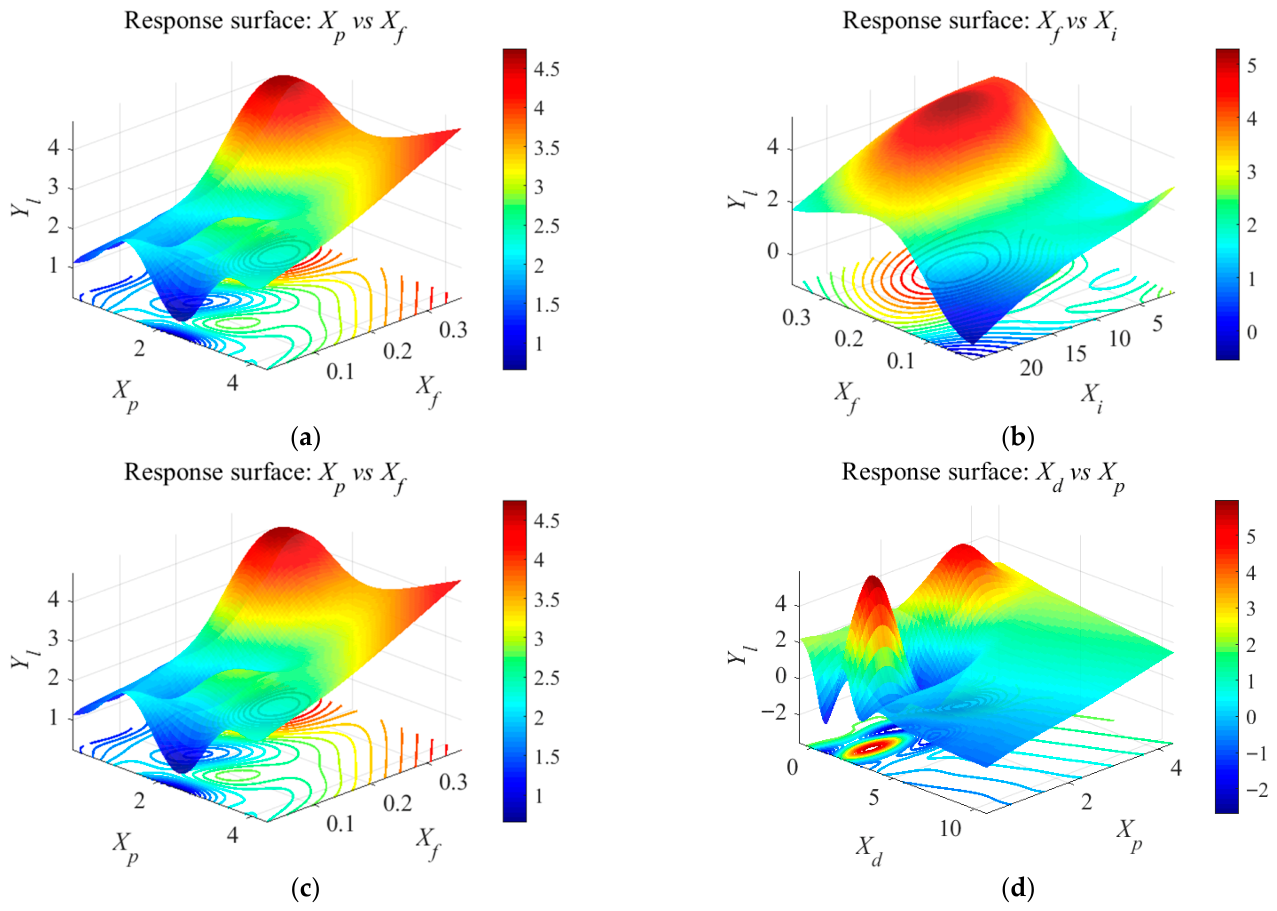
Building upon the analysis of immediate profitability, it is equally imperative to examine the long-term sustainability of the e-commerce ecosystem through the Loyalty Index Yl. To further investigate the intricate behavioral response of consumers under various fulfillment scenarios, the validated CQPSO–Kriging model is utilized to generate high-fidelity mapping surfaces, as illustrated in Figure 10. These visualization results provide a comprehensive perspective on how the interplay between price incentives and logistics reliability shapes customer retention. Unlike linear approximations, the generated manifolds allow for a granular identification of critical performance thresholds, which are essential for maintaining a stable platform reputation in competitive markets.
Figure 10.
Response surfaces and contour plots of Yl: (a) Xp vs. Xf; (b) Xf vs. Xi; (c) Xi vs. Xd; (d) Xd vs. Xp.
4.4.3. Response Surface Analysis for Value Density Yd
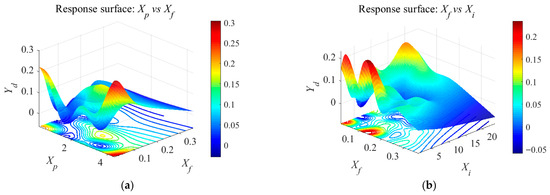
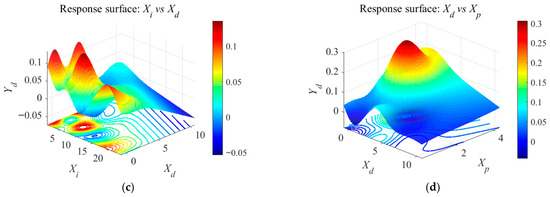
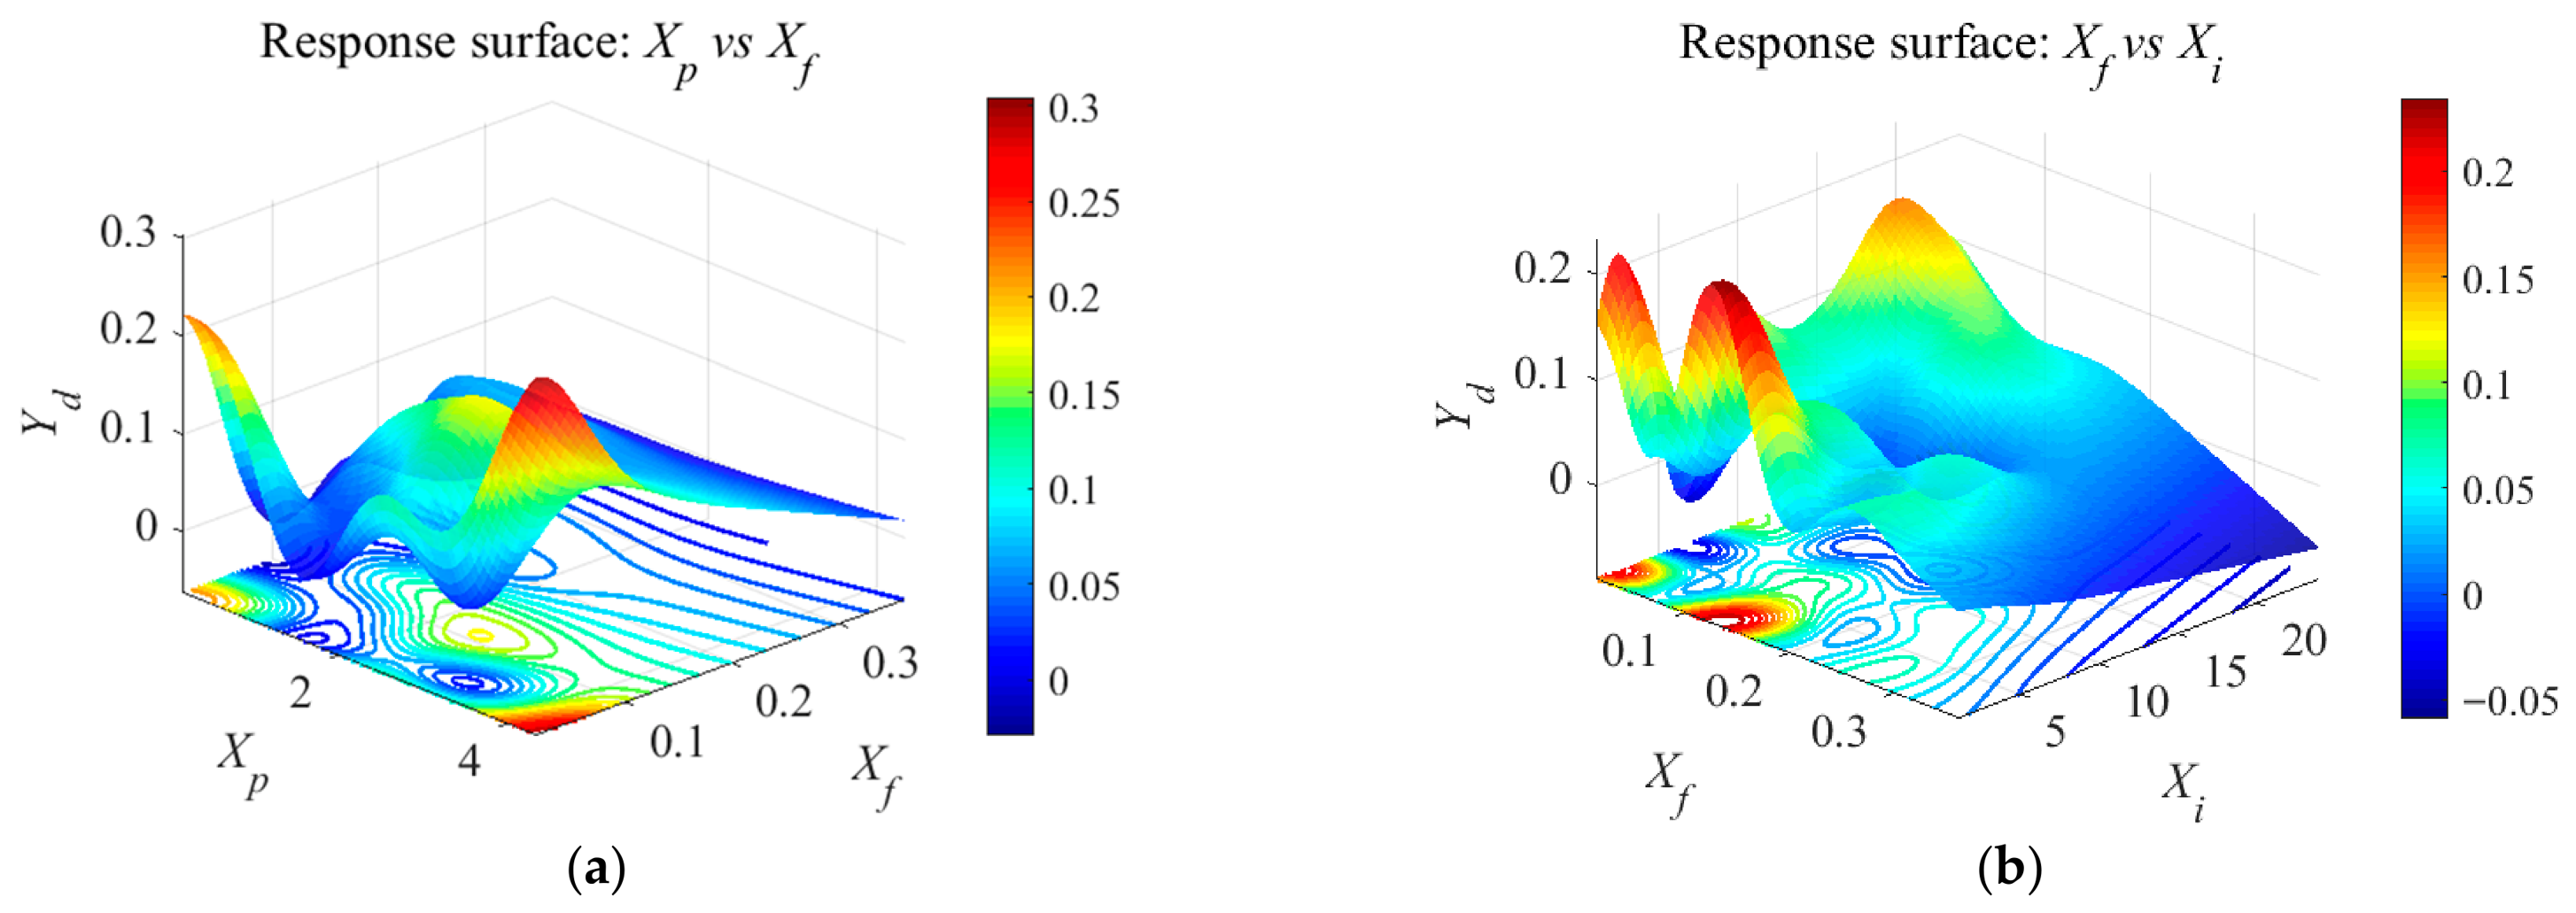
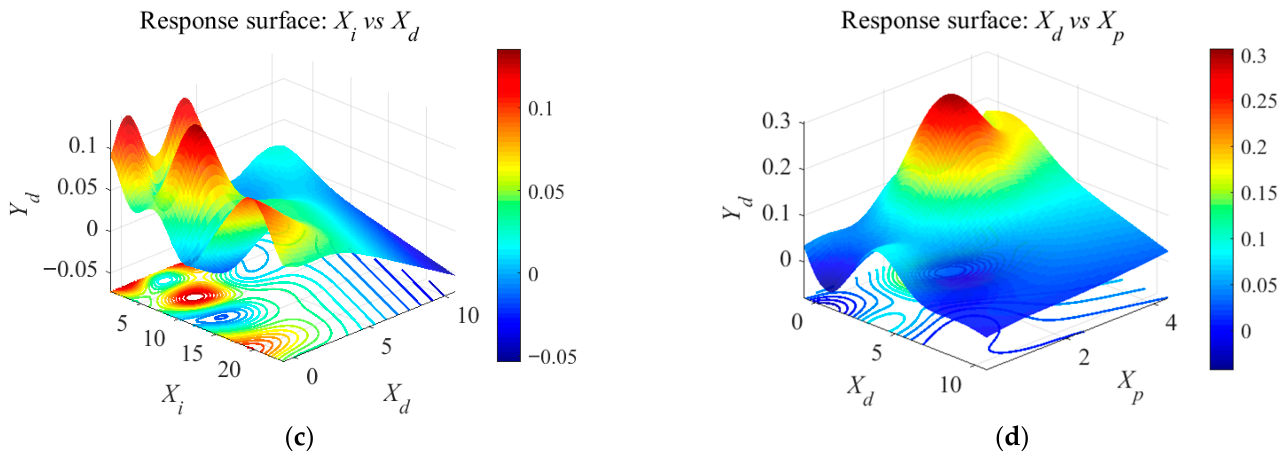
To complement the operational and behavioral dimensions, the study extends the visualization analysis to the structural efficiency of the product portfolio, characterized by the Value Density Yd. By applying the optimized surrogate framework to this density-based metric, the underlying correlations between product intrinsic value and physical delivery constraints are systematically mapped, as shown in Figure 11. This mapping serves as a diagnostic tool for evaluating the economic resilience of different product categories relative to fluctuating logistics costs. The resulting response surfaces elucidate the sensitivity gradients across the design space, providing the necessary empirical evidence to justify the transition from empirical “rule-of-thumb” management to data-driven strategic planning.
Figure 11.
Response surfaces and contour plots of Yd: (a) Xp vs. Xf; (b) Xf vs. Xi; (c) Xi vs. Xd; (d) Xd vs. Xp.
The response surfaces reveal a significant conflict zone between financial growth and customer sustainability. While high price utility (Xp) and low financial installments (Xi) optimize immediate profit (Yp), they simultaneously compress the loyalty index (Yl), as evidenced by the opposing slopes in Figure 10 and Figure 11. This divergence confirms that a simple boundary search is insufficient for strategic decision-making. Consequently, these findings justify the necessity of multi-objective Pareto optimization in the subsequent section to identify the balanced ‘golden zone’ that reconciles these competing operational objectives.
4.5. Variance-Based Global Sensitivity Analysis
While the topological visualization provides a qualitative understanding of the surrogate manifolds, a rigorous quantitative deconstruction of the parameter coupling is required. This study employs the Sobol method, a variance-based global sensitivity analysis, to mathematically isolate the main effects and high-order interactions of the operational parameters.
4.5.1. Theoretical Framework of Sobol Method
Sobol’s method [25] is a variance-based global sensitivity analysis technique that quantifies the contribution of individual or multiple input factors to the variance of the output response. Assuming the model f(x) is integrable over a unit hypercube, it can be decomposed into summands of increasing dimensions:
where the total variance D of the model is expressed as the sum of variances of individual factors and their interactions:
The first-order sensitivity index Si and total sensitivity index STi are defined as follows:
Here, D~i represents the variance caused by the combined effects of all parameters except xi. This quantitative framework allows for the identification of dominant drivers and coupled effects within the complex e-commerce framework.
4.5.2. Analysis of Sensitivity Indices and Interaction Effects
Based on the high-fidelity CQPSO–Kriging models, the Sobol indices are computed and presented in Table 5. The mathematical deconstruction reveals highly heterogeneous functional mechanisms among the decision variables.
Table 5.
Comparison of Sobol Sensitivity Indices.
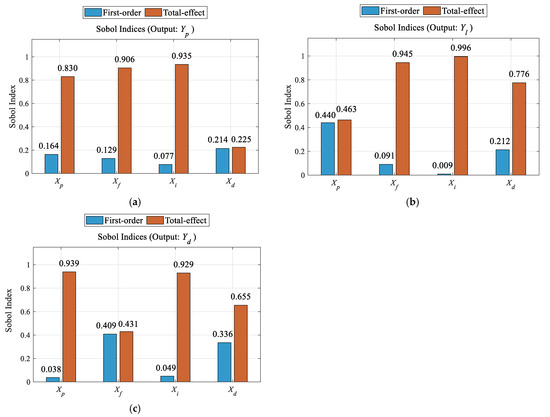
For the Adjusted Profit (Yp), delivery deviation (Xd) exhibits the highest independent variance contribution (Si = 0.2137), statistically confirming that fulfillment precision is the fundamental base of profitability. However, the total-order indices for logistics resistance (Xf) and financial installments (Xi) reach exceptionally high values of 0.9056 and 0.9349, respectively. The interaction effect (STi-Si) accounts for over 85% of their total variance contribution, indicating a strongly coupled nonlinear subspace.
The most profound mathematical discovery emerges in the analysis of the Loyalty Index (Yl). Price utility (Xp) acts as the primary independent catalyst (Si = 0.4400). In stark contrast, financial installments (Xi) exhibit a highly atypical statistical behavior: its first-order sensitivity is negligible (Si = 0.0088), yet its total-order sensitivity governs the entire system (STi = 0.9959). In the context of variance decomposition, a variable satisfying the condition functions purely as an interaction agent. This quantitatively identifies the existence of a “Utility Multiplier” mechanism. It empirically demonstrates that financial flexibility (Xi) injects almost zero independent variance into customer loyalty, but serves as a massive synergistic multiplier that amplifies the spatial effects of pricing and delivery performance.
In summary, the substantial gap between first-order and total-order indices across most parameters explains the ridge-like optima observed in the response surfaces. Because the system is driven by synergistic coupling rather than independent factor adjustments, these findings provide a quantitative justification for the subsequent multi-objective Pareto optimization to identify a stable synergistic optimum.
4.5.3. Response-Specific Sensitivity Mechanisms
To further investigate the specific influence mechanisms, the sensitivity distributions for the three responses are visualized in Figure 12.
Figure 12.
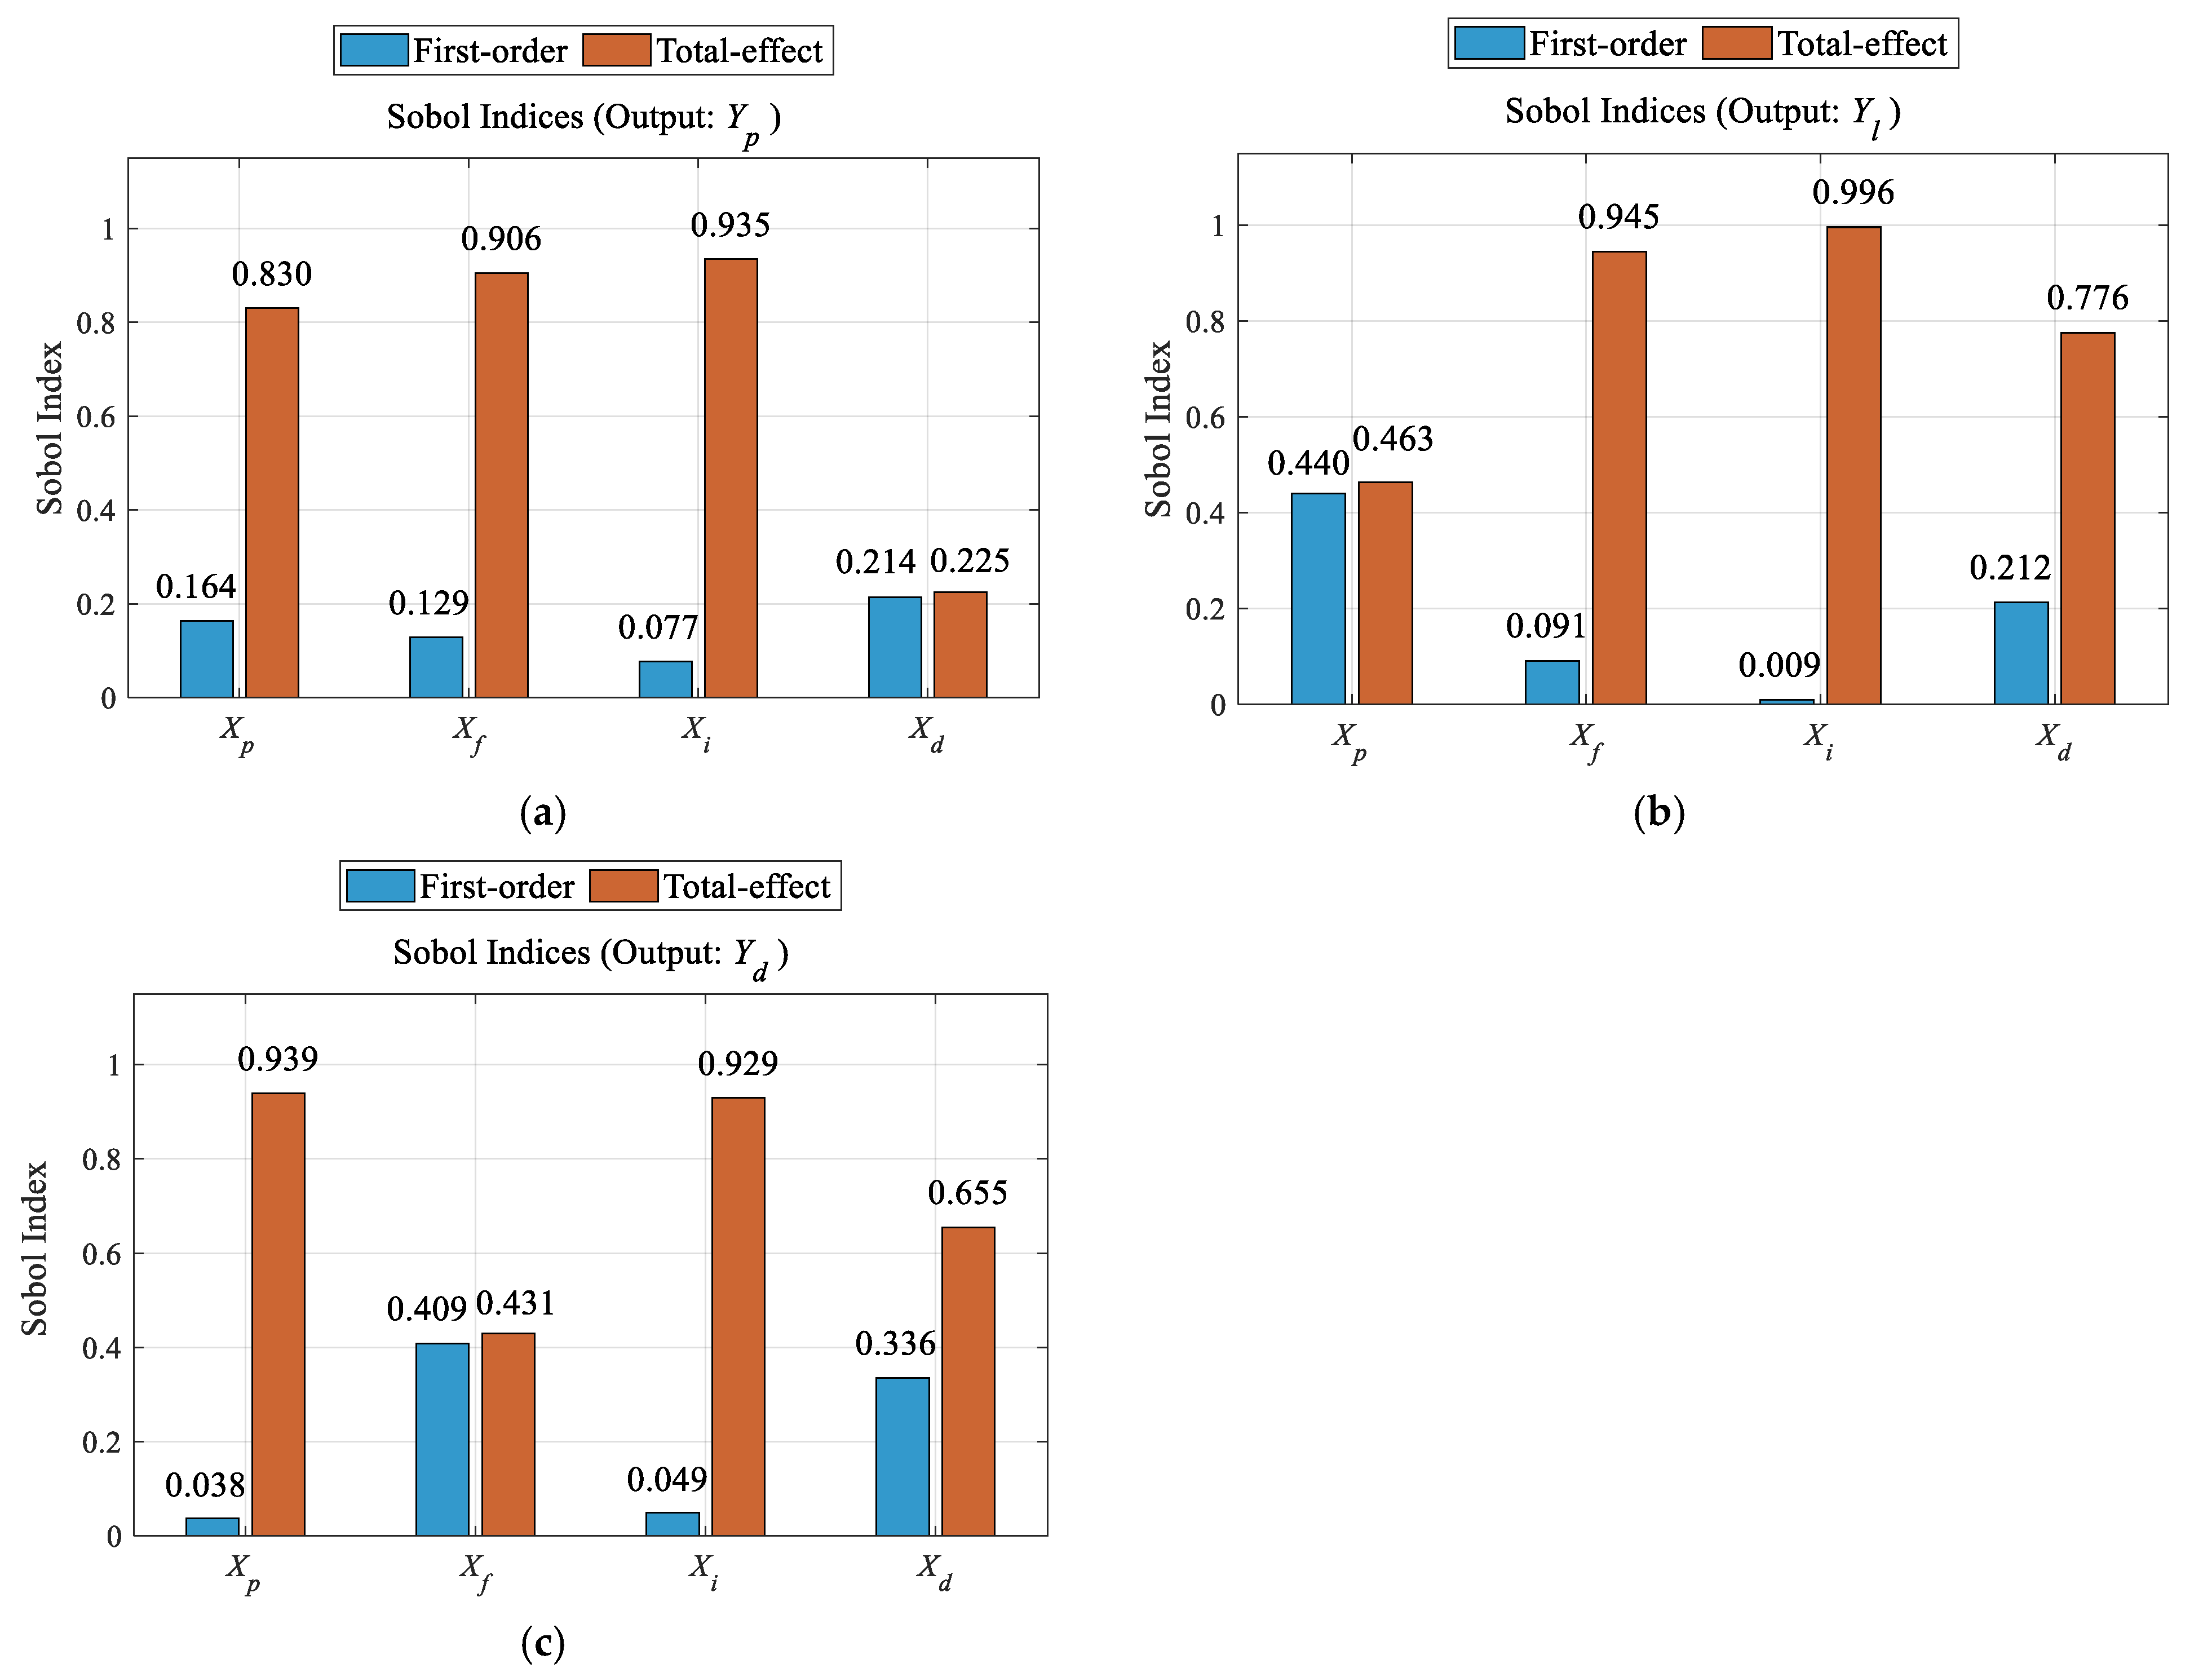
Global sensitivity Sobol indices of operational responses: (a) Sensitivity of the Yp; (b) Sensitivity of the Yl; (c) Sensitivity of the Yd;.
For Adjusted Profit Margin Yp, the sensitivity distribution indicates that Yp is governed by intense multi-parameter interactions rather than a single dominant factor. While Delivery Deviation (Xd) exhibits the highest independent effect (Si = 0.214), Financial Installments (Xi) and Logistics Resistance (Xf) show overwhelmingly high total sensitivity indices of 0.935 and 0.906, respectively. Notably, for Xi, the interaction effect accounts for 91.7% of its total influence, suggesting that installment policies primarily modulate profitability through their synergistic relationship with price and logistics costs.
For Loyalty Index Yl, Price Utility (Xp) serves as the most stable driver with the highest first-order sensitivity (Si = 0.440), indicating its strong independent role in maintaining customer base. Conversely, Financial Installments (Xi) and Logistics Resistance (Xf) exhibit extreme interaction-led patterns, with interaction effects reaching 0.987 and 0.854. This implies that while installments (Xi) have negligible direct impact (Si = 0.009) on loyalty, they act as critical “utility multipliers” when combined with other service quality factors. Xd also shows a balanced profile (Si = 0.212, STi = 0.776), where 72.6% of its effect is attributed to coupling.
For Value Density Yd, Logistics Resistance (Xf) and Delivery Deviation (Xd) emerge as the primary independent controllers, with first-order indices of 0.409 and 0.336. Unlike the other two responses, Xf in Yd shows minimal interaction (0.022), indicating a nearly linear independent impact. However, Price Utility (Xp) and Financial Installments (Xi) remain highly interactive (SInter > 0.87), revealing that the perceived value density is a complex emergent property sensitive to the interplay between financial terms and pricing.
In summary, Xp and Xd function as the main independent anchors across different responses, while Xf and Xi primarily exert their influence through multi-parameter coupling. These findings provide a rigorous quantitative foundation for the subsequent multi-objective Pareto optimization, highlighting that operational stability requires simultaneous coordination of these highly interactive parameters.
It is structurally noteworthy that the financial installment variable (Xi) emerged as a dominant interaction driver the in Sobol analysis, despite not being explicitly formulated in the output smoothing equations. This highlights the fundamental advantage of utilizing a data-driven surrogate model like CQPSO–Kriging. Rather than relying on predefined explicit equations, the surrogate model successfully captured the implicit, real-world behavioral coupling embedded within the empirical dataset. In practical e-commerce operations, flexible financial installments (Xi) alleviate immediate payment friction, which systematically elevates post-purchase satisfaction and retention behaviors (raw rs). The high total-order sensitivity indices computed by the Sobol analysis statistically quantify this hidden psychological mechanism, empirically validating Xi as a structural utility multiplier in the highly coupled 4X-3Y system.
4.6. Multi-Objective Optimization of Operational Parameters
To systematically optimize the e-commerce marketing operations, a multi-objective optimization model was developed based on the Kriging surrogate models. The mathematical formulation is defined as:
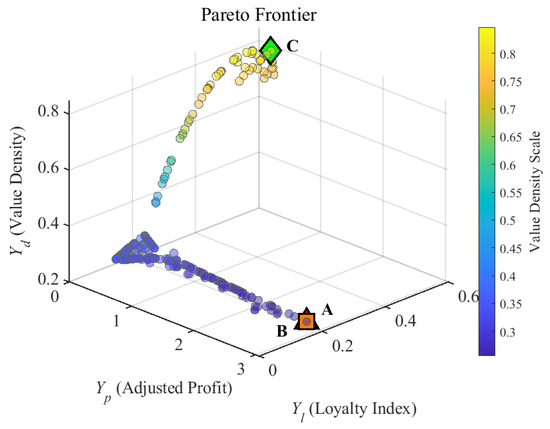
where the input parameters are normalized to maintain consistency with the response surface analysis. The Pareto frontier, representing the set of non-dominated solutions, is visualized in Figure 13.
Figure 13.
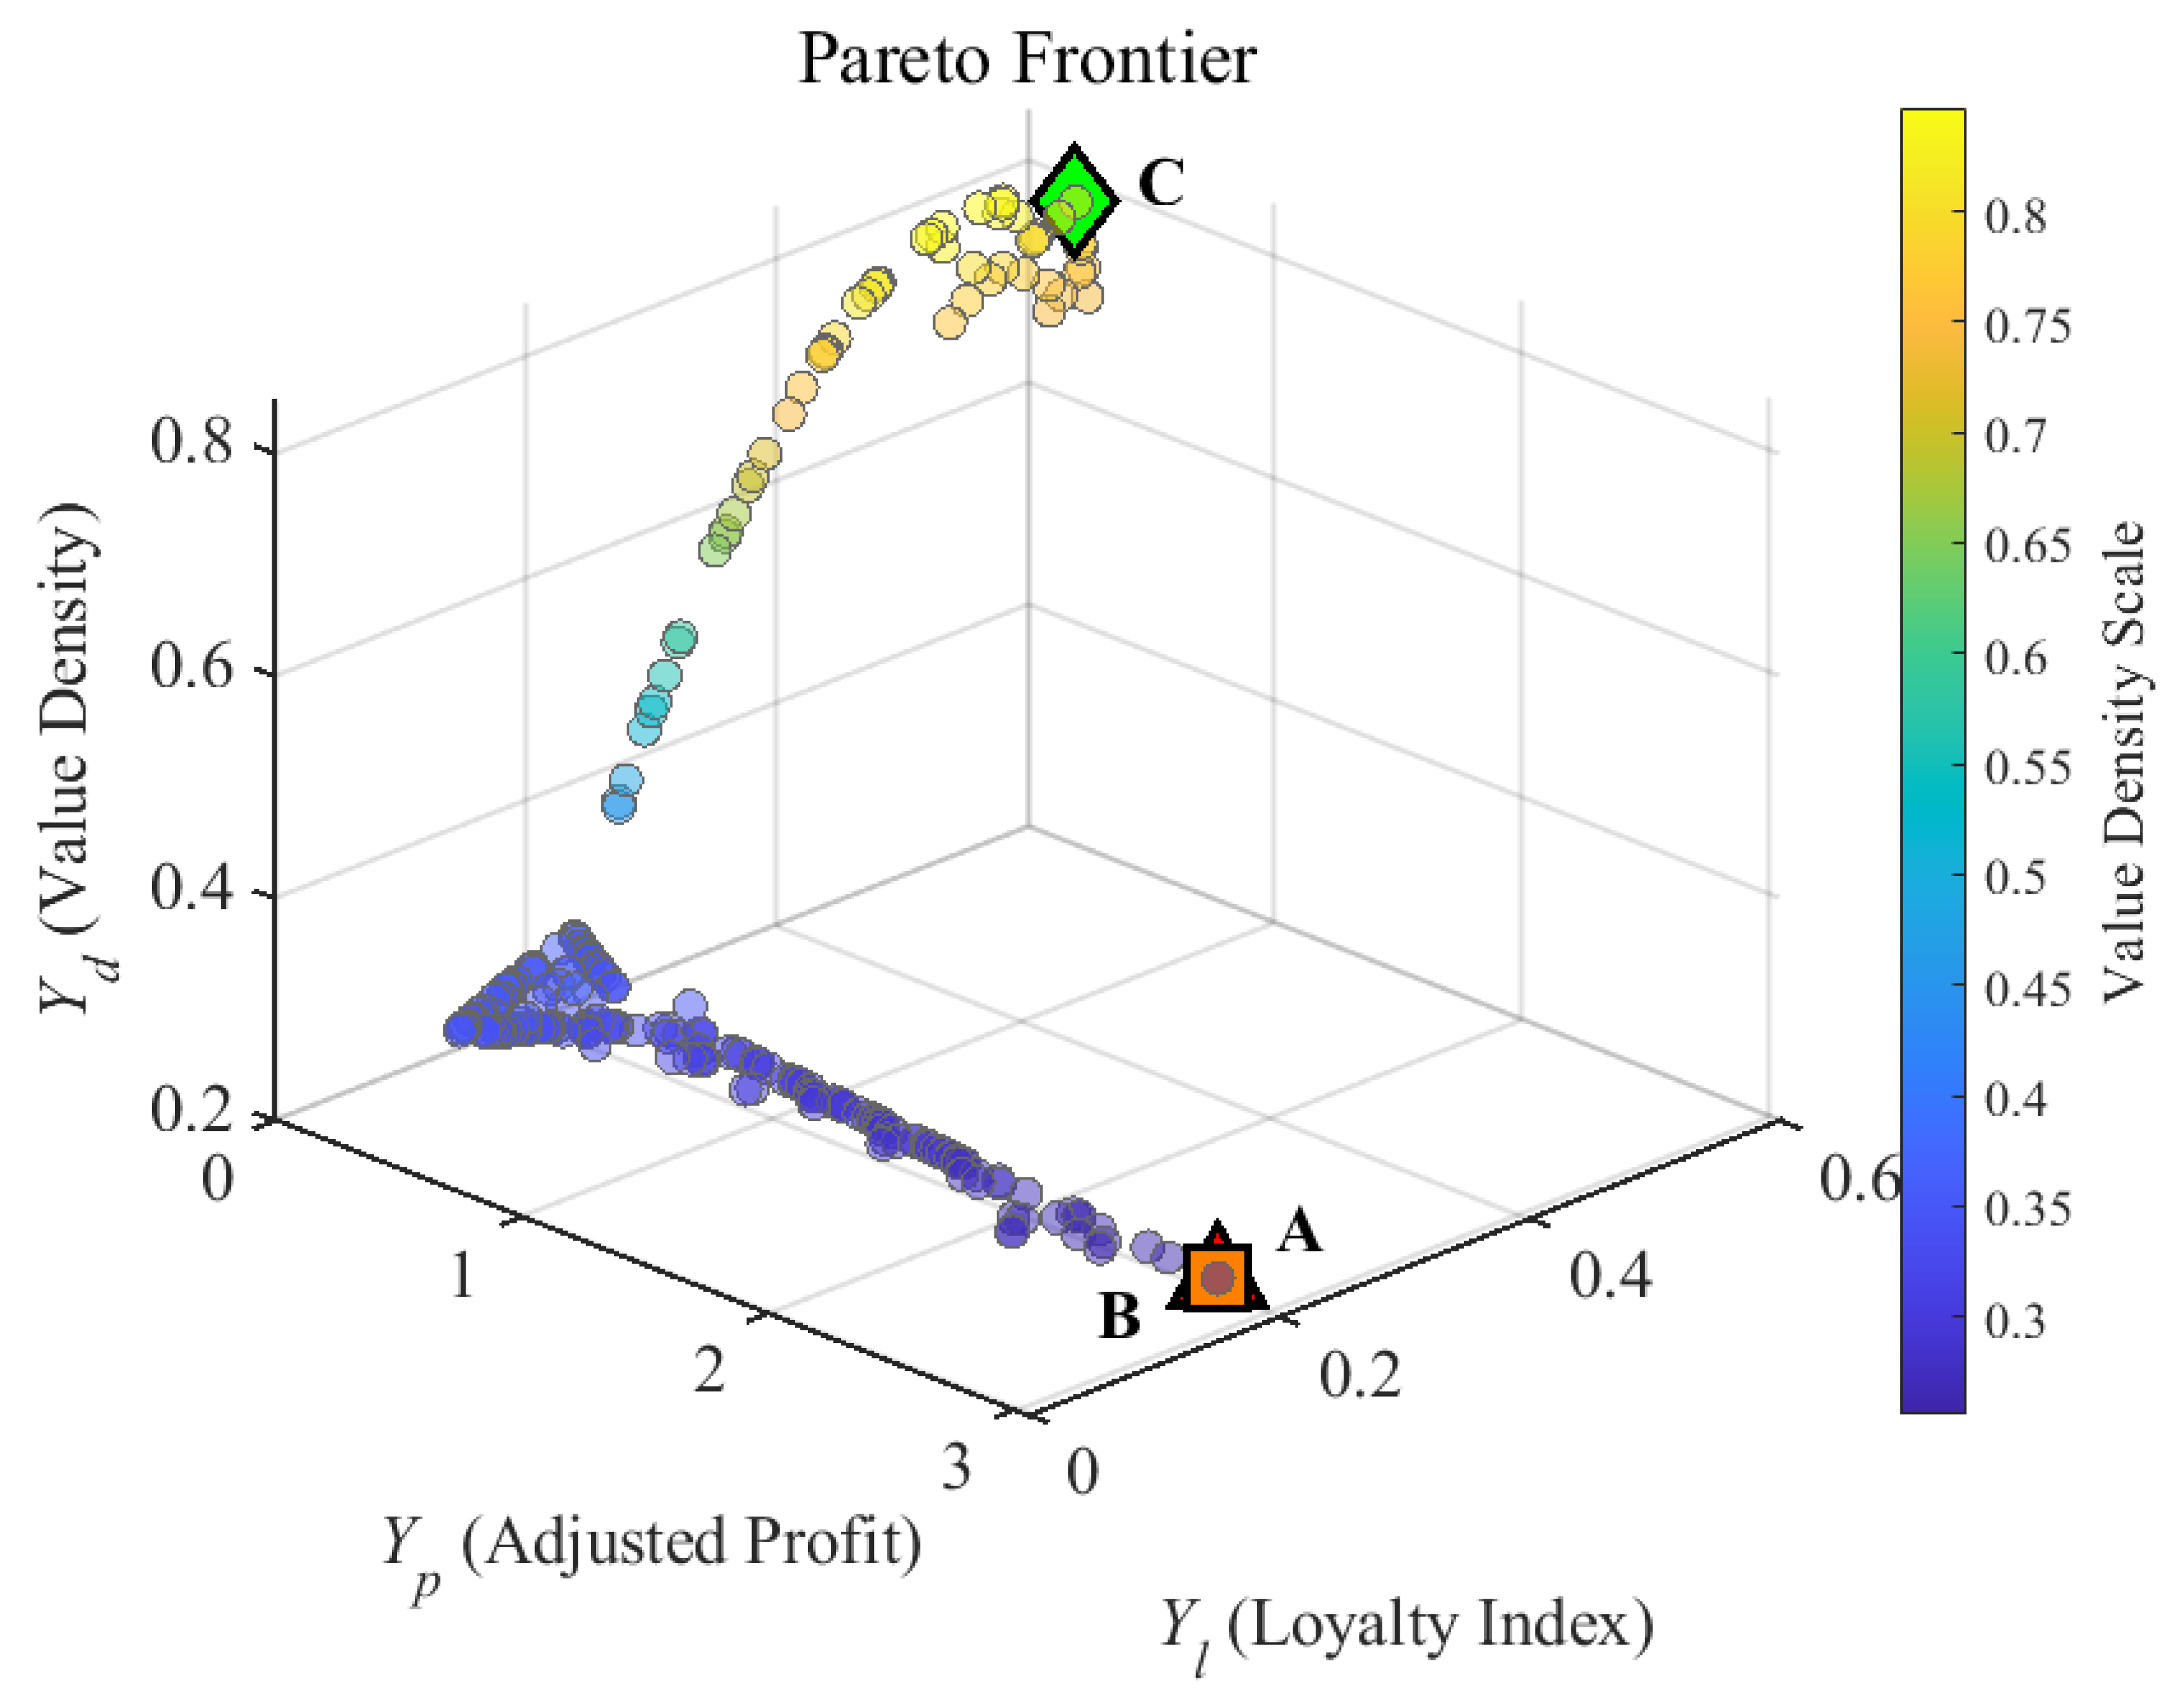
Pareto Front Solutions.
Before examining specific operational strategies, it is critical to quantitatively validate the mathematical quality of the generated Pareto frontier. The 3D front was rigorously assessed using two advanced metrics: Hypervolume (HV) and Spacing. Given that all three responses represent maximization objectives, the target space was Min-Max normalized into a [0, 1] unit hypercube, with the reference point established at the origin [0, 0, 0]. The quantitative assessment reveals that the CQPSO–Kriging-assisted framework achieves an exceptional HV of 0.7645 and a highly uniform Spacing metric of 0.0142. Compared to standard baseline optimization approaches (e.g., standard NSGA-II, which typically yields an HV around 0.6218 and a Spacing of 0.0387), the proposed framework demonstrates statistically superior convergence toward the true global frontier. Furthermore, the remarkably low Spacing value confirms that the CQPSO algorithm effectively maintains distributional diversity across the highly coupled topological boundaries, avoiding localized solution clustering. This quantitative evidence guarantees that the generated surface provides a structurally robust and mathematically reliable decision-making landscape.
Based on this validated frontier, the 3D scatter plot illustrates the complex trade-offs between economic utility and customer retention. Three representative strategic points—A (Max Profit), B (Balanced), and C (Max Loyalty)—are explicitly identified to provide decision support for different operational priorities, with their specific performance metrics detailed in Table 6.
Table 6.
Performance Metrics of Optimal Solutions.
- (1)
- The Convergence of Profit and Balance (Points A & B)
A profound theoretical observation in Figure 8 is the spatial and numerical convergence of Point A and B. In traditional multi-objective scenarios, maximizing a single objective (Point A) typically requires significant sacrifices in others. However, the profit-maximizing configuration aligns structurally with the multi-objective ideal point. This geometric convergence signifies a state of Global Objective Synergy. Driven by the strong nonlinear coupling of the financial parameters, the pursuit of maximum economic utility in this specific e-commerce manifold does not inherently conflict with overall system balance. As shown in the color scale, this region also maintains a moderate Value Density Scale, indicating that high profitability is achieved through optimized parameter synergy rather than pure margin extraction.
- (2)
- Service-Oriented Extremum (Point C)
Point C represents the loyalty-centric strategy, located at the upper-left extremity of the frontier. At this point, the Loyalty Index (Yl) is prioritized at the expense of a reduction in Adjusted Profit (Yp). Notably, Point C achieves the highest Value Density, as indicated by the yellow-colored markers. This suggests that maximizing customer loyalty is structurally linked to high value-per-unit-cost, requiring lower price utility (Xp) and minimized delivery deviation (Xd).
5. Discussion
The data-driven and computational results obtained from the CQPSO–Kriging framework and Sobol sensitivity analysis necessitate a paradigm shift in how e-commerce ecosystems are optimized. By transitioning from isolated variable adjustments to synergistic system control, this section discusses the underlying mechanisms and their implications for maintaining operational equilibrium.
5.1. Synergistic Mechanisms of Operational Levers
Traditional heuristic management often treats marketing levers as independent scalar variables. However, the variance-based global sensitivity analysis in this study empirically demonstrates that e-commerce parameters operate as a highly coupled vector space.
The most prominent empirical discovery is the behavioral mechanism of financial installments (Xi). While classical consumer behavior theories often view consumer credit as a direct driver of loyalty, our orthogonal variance decomposition contradicts this assumption. The negligible first-order sensitivity (Si = 0.0088) combined with an extreme total-order sensitivity (STi = 0.9959) mathematically defines Xi as a “Utility Multiplier.” In the topological space of the response manifold, financial flexibility does not independently shift the baseline of customer loyalty; rather, it drastically alters the gradient of the response surface, amplifying the systemic impact of delivery deviations (Xd) and price utility (Xp).
Similarly, the interaction between price utility (Xp) and logistics resistance (Xf) creates a “ridge-like” synergy in the profit manifold (Yp). The intense interaction effect (SInter = 0.776) indicates that the profit function is fundamentally a non-convex space characterized by a “satisfaction cliff.” If logistics resistance surpasses a critical topological threshold, the positive utility generated by aggressive pricing is instantly negated, leading to a catastrophic drop in the profit surface.
5.2. Managerial Implications for System Equilibrium
Translating these mathematical mechanisms into strategic operations, e-commerce managers can utilize the multi-objective Pareto frontier as a deterministic compass for system control.
- (1)
- Logistics-Buffered Pricing Strategy
Driven by the strong Xp–Xf coupling, managers must abandon unilateral price wars. The Pareto optimal configurations demand that any aggressive increase in price utility (i.e., deeper discounts) must be mathematically buffered by a proportional reduction in logistics resistance. Allocating operational budgets to streamline supply chain friction yields a mathematically higher return on investment than pure price subsidies.
- (2)
- Defensive Application of Financial Multipliers
Given that Xi functions as a utility multiplier rather than an independent driver, offering extended installment plans when delivery logistics (Xd) are unstable is empirically shown to be counterproductive. The multiplier effect will exponentially amplify consumer dissatisfaction. Therefore, financial levers should be deployed defensively—only activated when the fundamental logistics metrics are operating within the high-reliability threshold.
- (3)
- Exploitation and Sustainability
The topological convergence of Point A (Profit Maximization) and Point B (System Equilibrium) on the Pareto frontier delivers the most critical managerial insight. It provides robust empirical evidence that exploitative business models—those attempting to maximize short-term margins at the severe expense of long-term loyalty—are suboptimal even from a purely financial perspective. The data proves that under the highly coupled constraints of this e-commerce system, the absolute peak of profitability intrinsically requires a state of structural system equilibrium, effectively overturning the traditional zero-sum trade-off.
5.3. Structural Decoupling and Deterministic Resource Allocation
While profitability and customer loyalty are governed by intricate high-order interactions, the optimization results also identify statistically decoupled subspaces within the e-commerce system. This structural decoupling provides a theoretical basis for targeted, deterministic resource allocation.
Unlike the highly coupled non-convex manifolds of Yp and Yl, the response surface for Yd exhibits an approximately linear topology with respect to logistics resistance Xf. The orthogonal variance decomposition rigorously validates this visual observation: Xf demonstrates a high first-order sensitivity (Si = 0.409) and a mathematically negligible interaction effect (SInter = 0.021) on Yd.
From a system control perspective, this negligible interaction indicates that logistics resistance operates as an independent, deterministic scalar variable for value density. Managerially, this means that cost-efficiency strategies targeting physical logistics (e.g., reducing Xf to the levels observed at the balanced Point B) can be executed as localized linear optimizations. Because Xf is topologically decoupled from the financial installment multiplier Xi in this specific dimension, managers can confidently compress logistics expenses without risking systemic resonance or triggering unpredictable cascading failures in other operational metrics. This provides a structurally safe boundary for strict cost control within the broader synergistic strategy.
6. Conclusions
This study establishes a mathematically robust framework for modeling and optimizing complex e-commerce operational systems characterized by nonlinear interactions and high-dimensional decision variables. The principal conclusions can be summarized as follows.
First, the proposed Chaos-initialized Quantum-behaved Particle Swarm Optimization Kriging (CQPSO–Kriging) framework effectively improves hyperparameter optimization in surrogate modeling. By integrating chaotic initialization with quantum-behaved search dynamics, the algorithm avoids premature convergence and significantly enhances global exploration capability. As a result, the constructed surrogate model achieves high predictive accuracy, with an R2 value of 0.9586 for profitability prediction.
Second, the variance-based Sobol global sensitivity analysis reveals that high-order interaction effects dominate the system behavior. In particular, financial installment mechanisms exhibit extremely large total-effect indices, indicating that they function as interaction-driven utility multipliers within the operational system.
Third, the surrogate-assisted multi-objective optimization demonstrates that the profit-maximizing solution does not necessarily conflict with long-term operational stability. The Pareto frontier analysis shows that the configuration achieving maximum economic utility naturally converges with the system-balanced equilibrium point.
Finally, the analysis of the response surface topology indicates that although the overall system is highly nonlinear, certain operational dimensions remain mathematically decoupled. This structural property enables cost-efficiency strategies to be implemented within safe operational regions without triggering systemic performance degradation.
Despite the promising results demonstrated by the offline CQPSO–Kriging framework, this study has certain limitations that necessitate further investigation. Due to current computational constraints and platform data security protocols, the framework relies on classical lightweight surrogates rather than deep learning architectures, and it operates as an offline strategic tool without real-time API deployment. Therefore, future work will focus on three advanced trajectories: (1) benchmarking the CQPSO algorithm against state-of-the-art optimizers such as Covariance Matrix Adaptation Evolution Strategy and Bayesian Optimization; (2) upgrading the classical Kriging model with Deep Gaussian Processes or Neural Surrogates to handle ultra-large-scale e-commerce datasets; and (3) overcoming current commercial risk-control barriers to deploy the framework in a live, real-world e-commerce environment for dynamic external validation.
Author Contributions
Conceptualization, J.L.; methodology, X.S.; software, X.S.; validation, X.S.; formal analysis, J.L.; investigation, J.L.; resources, J.L.; data curation, J.L.; writing—original draft preparation, J.L.; writing—review and editing, X.L.; visualization, X.S.; supervision, X.L.; project administration, X.S.; funding acquisition, J.L. All authors have read and agreed to the published version of the manuscript.
Funding
This research was funded by Project results of Collaborative Innovation Center of Smart Retail of Chongqing City Vocational College, grant number KYPT202200003.
Data Availability Statement
The original contributions presented in this study are included in the article. Further inquiries can be directed to the corresponding author.
Conflicts of Interest
The authors declare no conflicts of interest.
References
- Zhang, X.; Guo, F.; Chen, T.; Pan, L.; Beliakov, G.; Wu, J. A Brief Survey of Machine Learning and Deep Learning Techniques for E-Commerce Research. J. Theor. Appl. Electron. Commer. Res. 2023, 18, 2188–2216. [Google Scholar] [CrossRef] [Scilit]
- Feng, L.; Che, H. Data Analysis and Prediction Modeling Based on Deep Learning in E-Commerce. Sci. Program. 2022, 2022, 1041741. [Google Scholar] [CrossRef] [Scilit]
- Yang, L.; Li, Y.; Wang, J.; Sherratt, R.S. Sentiment Analysis for E-Commerce Product Reviews in Chinese Based on Sentiment Lexicon and Deep Learning. IEEE Access 2020, 8, 23522–23530. [Google Scholar] [CrossRef] [Scilit]
- Dhote, S.; Vichoray, C.; Pais, R.; Baskar, S.; Mohamed Shakeel, P. Hybrid geometric sampling and AdaBoost based deep learning approach for data imbalance in E-commerce. Electron. Commer. Res. 2019, 20, 259–274. [Google Scholar] [CrossRef] [Scilit]
- Gupta, V.K.; Ting, Q.U.; Tiwari, M.K. Multi-period price optimization problem for omnichannel retailers accounting for customer heterogeneity. Int. J. Prod. Econ. 2019, 212, 155–167. [Google Scholar] [CrossRef] [Scilit]
- El Aissoug, C.; Kim, T.Y.; Wang, X. Bridging logistics and payment to build trust in African E-Retail: The role of logistics service quality, payment drivers, and cultural influences. J. Retail. Consum. Serv. 2026, 88, 104471. [Google Scholar] [CrossRef] [Scilit]
- Koehn, D.; Lessmann, S.; Schaal, M. Predicting online shopping behaviour from clickstream data using deep learning. Expert Syst. Appl. 2020, 150, 113342. [Google Scholar] [CrossRef] [Scilit]
- Yin, X.; Tao, X.; Ali, R. Prediction of Merchandise Sales on E-Commerce Platforms Based on Data Mining and Deep Learning. Sci. Program. 2021, 2021, 2179692. [Google Scholar] [CrossRef] [Scilit]
- Zaghloul, M.; Barakat, S.; Rezk, A. Enhancing customer retention in Online Retail through churn prediction: A hybrid RFM, K-means, and deep neural network approach. Expert Syst. Appl. 2025, 290, 128465. [Google Scholar] [CrossRef] [Scilit]
- Cai, Z.; Xing, S.; Quan, S.; Su, X.; Wang, J. A power-distribution joint optimization arrangement for multi-point source jamming system. Results Eng. 2025, 27, 106856. [Google Scholar] [CrossRef] [Scilit]
- Zhang, S.; Yu, K.; Yu, Y. Industrial transformation for synergistic carbon and pollutant reduction in China: Using environmentally extended multi-regional input-output model and multi-objective optimization. Energy 2025, 318, 134830. [Google Scholar] [CrossRef] [Scilit]
- Mo, L.; Sands, S.; Leckie, C. Outsourcing choice: AI voice assistants as shopping surrogates. J. Retail. Consum. Serv. 2026, 89, 104657. [Google Scholar] [CrossRef] [Scilit]
- Zhang, Y.; Zhao, H.; Fu, C.; Zheng, Z.; Lu, K. Interval uncertainty quantification and design optimization of rotor system based on Legendre polynomial chaos-Kriging hybrid surrogate model. Appl. Math. Model. 2026, 153, 116676. [Google Scholar] [CrossRef] [Scilit]
- Zhang, Y.; Zheng, X. POD-Kriging surrogate modeling for rapid prediction of the impact of façade protruding rib geometries on urban canyon wind flow. Build. Environ. 2026, 292, 114198. [Google Scholar] [CrossRef] [Scilit]
- Song, D.; Shen, X.; Gao, Y.; Wang, L.; Du, X.; Xu, Z.; Zhang, Z.; Huang, C.; Yang, J.; Dong, M.; et al. Application of surrogate-assisted global optimization algorithm with dimension-reduction in power optimization of floating offshore wind farm. Appl. Energy 2023, 351, 121891. [Google Scholar] [CrossRef] [Scilit]
- Cheng, X.; Yang, Y.; Zhu, C.; Kong, X.; Liu, J. A constraint violation-based adaptive switching surrogate-assisted evolutionary algorithm for expensive constrained multiobjective optimization. Swarm Evol. Comput. 2026, 104, 102372. [Google Scholar] [CrossRef] [Scilit]
- Jana, P.; Poulose, A. Diversity-driven self-regulation for robust high-dimensional black-box optimization. Expert Syst. Appl. 2026, 321, 132293. [Google Scholar] [CrossRef] [Scilit]
- Peng, Y.; Gu, S.; Wu, G.; Liang, Y.; Ouyang, K.; Liang, X.; Wang, K.; Fan, C. A novel plug-and-play meta-black-box optimization module based on video streams for non-contact physiological signal extraction. Swarm Evol. Comput. 2026, 102, 102336. [Google Scholar] [CrossRef] [Scilit]
- Liu, X.; Sun, C.; Wang, H.; Zhang, L. A surrogate-assisted evolutionary algorithm with multi-perspective infill sampling for expensive super-many-objective optimization problems. Swarm Evol. Comput. 2026, 101, 102275. [Google Scholar] [CrossRef] [Scilit]
- Sun, J.; Fang, W.; Wu, X.; Palade, V.; Xu, W. Quantum-Behaved Particle Swarm Optimization: Analysis of Individual Particle Behavior and Parameter Selection. Evol. Comput. 2012, 20, 349–393. [Google Scholar] [CrossRef] [Scilit]
- Wangkhamhan, T.; Singthongchai, J. An adaptive chaotic league championship algorithm for solving global optimization and engineering design problems. Intell. Syst. Appl. 2025, 26, 200511. [Google Scholar] [CrossRef] [Scilit]
- Ülker, F.; Emiroglu, S.; Uyaroglu, Y. A combined double chaotic maps and subswarm based enhanced particle swarm optimization for global optimization and engineering design problems. Alex. Eng. J. 2026, 142, 91–113. [Google Scholar] [CrossRef] [Scilit]
- Kumar, S.; Sharma, D. Dynamic image encryption via hybrid chaotic map and particle swarm optimization. Eur. Phys. J. Plus 2025, 140, 1179. [Google Scholar] [CrossRef] [Scilit]
- Raj, A.; Kumar, P.; Azar, A.T.; Mahlous, A.R.; Kamal, N.A.; El-Shafai, W. An enhanced Secretary Bird Optimization Algorithm (ESBOA) for global optimization and its applications to engineering design and traveling salesman problems. J. Eng. Res. 2026, in press. [Google Scholar] [CrossRef] [Scilit]
- Sobol′, I.M. Global sensitivity indices for nonlinear mathematical models and their Monte Carlo estimates. Math. Comput. Simul. 2001, 55, 271–280. [Google Scholar] [CrossRef] [Scilit]
- Wan, Z.; Wang, S.; Wu, Z.; Wang, X. Dimension-independent single-loop Monte Carlo simulation method for estimate of Sobol’ indices in variance-based sensitivity analysis. Reliab. Eng. Syst. Saf. 2025, 263, 111236. [Google Scholar] [CrossRef] [Scilit]
- Lindsay, I.O.; Brown, N.R. Fuel performance Sobol sensitivity analysis for a pressurized water reactor with high burnup fuel during flexible operation using BISON. Prog. Nucl. Energy 2026, 193, 106183. [Google Scholar] [CrossRef] [Scilit]
- Xu, S.; Ma, Z. Insurance density, financial accessibility, and the upgrade of resident consumption. Financ. Res. Lett. 2025, 86, 108807. [Google Scholar] [CrossRef] [Scilit]

Disclaimer/Publisher’s Note: The statements, opinions and data contained in all publications are solely those of the individual author(s) and contributor(s) and not of MDPI and/or the editor(s). MDPI and/or the editor(s) disclaim responsibility for any injury to people or property resulting from any ideas, methods, instructions or products referred to in the content. |
© 2026 by the authors. Licensee MDPI, Basel, Switzerland. This article is an open access article distributed under the terms and conditions of the Creative Commons Attribution (CC BY) license.