


Abstract
Textile wastewater contains recalcitrant dyes and organic matter, requiring efficient, scalable treatment technologies. This study optimized an aluminum-based electrocoagulation (EC) process to maximize color removal (Y1) and chemical oxygen demand (COD) reduction (Y2) using synthetic textile wastewater (SWW), and evaluated the practical transferability of the optimized conditions using real textile wastewater (RTW). A rotatable central composite design (CCD) coupled with response surface methodology (RSM) was used to assess the effects of treatment time, NaCl concentration, and applied voltage on both responses. From a modeling perspective, the results reveal the coexistence of symmetric and asymmetric response behaviors; quadratic effects define locally symmetric regions around the optimum, while interaction terms introduce asymmetry due to coupled electrochemical phenomena. Under the optimized conditions (16.5 min, 2.9 g·L−1 NaCl, 18 V), removal efficiencies reached 99% for color and 97% for COD reduction, with a specific energy consumption of 6.6 kWh·m−3 and sludge moisture content of 92–94%. To assess applicability beyond bench scale, the optimized voltage, current, and electrolyte concentration were applied to a 50 L batch of RTW collected from the final rinsing stage of a denim dyeing process. Treatment time was extended to 84 min to compensate for the lower current density at the larger scale; under these conditions, 95% color removal and 80% COD reduction were achieved.
1. Introduction
The textile industry is one of the largest industrial sectors worldwide and plays a key role in national economies. However, it also represents a major source of water pollution, particularly when adequate treatment and resource-recovery systems are not implemented [1,2,3,4]. A significant contributor to this environmental impact is the discharge of synthetic dyes, which exert severe ecological effects when released untreated into natural water bodies [4,5]. Textile manufacturing requires substantial volumes of water, especially during dyeing and washing operations [6,7,8], and these processes are estimated to generate nearly 20% of global industrial wastewater [1,9]. Much of this wastewater is discharged untreated, thereby becoming a source of environmental contamination [4,5,10].
Textile wastewater typically contains high concentrations of persistent synthetic dyes that pose considerable environmental hazards [11,12]. Even at low concentrations (10–15 mg·L−1), dyes increase the organic load of receiving waters [13,14], cause visible coloration, and reduce transparency and dissolved oxygen levels [15,16]. These effects disrupt aquatic ecosystems and food chains [2,4,5] by limiting sunlight penetration and inhibiting photosynthetic activity [1,4,5]. Moreover, the chemical stability of synthetic dyes allows them to remain largely unaffected by many conventional wastewater treatment processes [16,17,18,19,20].
Various treatment technologies have been proposed to reduce dye contamination in textile effluents [20,21]. Among them, electrocoagulation (EC) has gained prominence due to its operational simplicity, low chemical requirements, reduced sludge generation, and environmental compatibility [20,22,23,24,25,26]. EC uses an applied electric current to dissolve sacrificial electrodes, typically aluminum (Al) or iron, generating coagulant species in situ that destabilize and remove pollutants [20,27,28,29,30,31,32]. Its effectiveness has been demonstrated in several studies addressing industrial wastewater, including textile effluents [33,34,35]. Beyond textile applications, EC has also been explored in diverse fields—including, for example, the removal of inorganic contaminants from agricultural water sources such as nitrates in groundwater [36,37]—further demonstrating its versatility as an electrochemical treatment platform.
Building on these advantages, the optimization of EC systems using Al electrodes has been approached through both one-factor-at-a-time (OFAT) methods and, more recently, through Response Surface Methodology (RSM) [38,39,40,41,42,43,44]. While OFAT approaches fail to capture interactions among operational variables [19,20], RSM provides a statistically robust alternative by quantifying the combined effects of multiple factors and predicting optimal operating conditions [38,39,40,41,42,43,44]. Several RSM-based studies have demonstrated effective optimization of EC parameters for dye-containing wastewaters, including systems treating real textile effluents [39,40,41,42,43,44]. However, studies that simultaneously integrate multivariable RSM optimization with validation under real industrial effluent and preliminary scale-up assessment within a single experimental framework remain scarce. Moreover, complementary operational metrics—such as energy consumption (E_c), sludge characteristics, and cost estimation—are rarely reported alongside the optimization results, limiting the practical relevance of existing studies.
From a methodological standpoint, RSM can also be interpreted within a symmetry-based framework. The structured design of experiments, particularly when using central composite designs (CCDs), enables a balanced and systematic exploration of the design space [38]. This approach facilitates the identification of symmetric response patterns around optimal conditions, while also capturing deviations from symmetry arising from nonlinear terms and interaction effects inherent to quadratic RSM models. Such symmetry–asymmetry behavior is especially relevant in electrochemical systems, where multiple coupled phenomena interact nonlinearly to govern process performance.
In contrast to studies that focus on isolated operational parameters or simplified dye solutions, the present work integrates three elements: (i) multivariable RSM-CCD optimization of an Al-based batch EC system using synthetic textile wastewater (SWW); (ii) exploratory applicability assessment using real textile wastewater (RTW) in a 50 L scale-up system, where core operating conditions were partially transferred; and (iii) interpretation of the response surface behavior within a symmetry–asymmetry framework. Complementary operational indicators—including E_c, sludge moisture content, and operational cost—are also reported.
Accordingly, this study aims to optimize the color removal percentage (Y1) and chemical oxygen demand reduction (Y2) from synthetic textile wastewater (SWW) using Al electrodes in an EC process. A rotatable CCD was used to evaluate the effects of treatment time (X1), sodium chloride concentration (X2), and applied voltage (X3) on pollutant removal efficiency, providing a reproducible, scalable optimization framework for EC-based wastewater treatment.
Although SWW was selected to ensure controlled, reproducible influent conditions—necessary for robust statistical modeling—this choice poses a limitation for real-world implementation. Industrial textile effluents often contain variable dye formulations, surfactants, auxiliary chemicals, and complex organic loads that may alter EC performance [45,46,47,48]. This limitation is explicitly acknowledged and partially addressed through a scale-up experiment using RTW, which provides initial verification of the optimized conditions under more realistic scenarios.
2. Materials and Methods
2.1. Materials
2.1.1. Chemicals
Direct Blue 2 (DB2), an industrial-grade azo dye widely used in denim manufacturing, was used to prepare the SWW. Sodium chloride (NaCl, Merck, Darmstadt, Germany) served as the supporting electrolyte, while hydrochloric acid (HCl, Merck) was used for periodic electrode cleaning. All solutions and dilutions were prepared with deionized water (18.2 MΩ·cm).
2.1.2. Electrodes and Reactor Materials
T-shaped Al electrodes were fabricated from 2 mm thick Al plates (local supplier). All experiments were performed in a glass EC reactor (3 L total capacity; internal dimensions 20 × 10 × 20 cm; 6 mm wall thickness). Polypropylene containers were used to store SWW prior to treatment.
2.1.3. Instruments and Equipment
A direct current (DC) power supply (0–12 A, 0–32 V) powered the EC system. Color intensity measurements were performed using a Thermo Scientific Genesys 10S UV–Vis spectrophotometer (Thermo Fisher Scientific, Waltham, MA, USA). Chemical oxygen demand (COD) analyses were conducted with a Hach DRB-200 COD thermoreactor (Hach Company, Loveland, CO, USA). A precision digital balance (±0.001 g) and a laboratory drying oven were used for determining sludge moisture content.
2.2. Methods
2.2.1. Electrocoagulation Process
EC experiments were carried out in a batch cell designed to treat 3 L of wastewater. The reactor consisted of a transparent glass chamber (20 × 10 × 20 cm) equipped with a sampling port that enabled periodic collection of treated aliquots.
Ten T-shaped Al electrodes (2 mm thickness) were mounted on an upper support to provide stable alignment and reliable electrical contact during operation (Figure 1).
Figure 1.
T-shaped Al electrode configuration used in the cell.
The electrodes were connected to an adjustable DC power source operating in monopolar–parallel mode (Figure 2). The EC system was operated potentiostatically, with the applied cell voltage (X3) set to the target value specified by the experimental design. The total current was monitored throughout each run. It remained approximately constant at ~4.0 A, consistent with the high and stable initial conductivity of the SWW (~32 mS·cm−1), which minimized resistance variability across runs. All experiments were conducted in batch mode without mechanical agitation; mixing was provided solely by natural convection generated by hydrogen microbubble release at the cathode surface during EC. Operating temperature was maintained at room temperature (~20–25 °C). Electrode polarity reversal was not applied; the monopolar parallel configuration was maintained throughout all experimental runs.
Figure 2.
Experimental setup of the EC system used in this study.
Operational Current Density
Only the lower narrow section of each T-shaped electrode was submerged during treatment. This submerged section had an active area of 8.0 cm × 15.0 cm per face (120 cm2), corresponding to a total of 240 cm2 per electrode. With ten electrodes arranged in a monopolar parallel assembly (five anodes and five cathodes), the total current was distributed evenly among the anodes, resulting in ~0.8 A per anode. The interelectrode distance was set at 1.4 cm for all experiments.
The operational current density was 3.33 mA·cm−2, calculated from the total anodic area (1200 cm2) and the monitored current (~4.0 A). Voltage was used as the operational control variable due to instrumentation constraints during the preliminary experimental phase; future work will incorporate current density as the primary control variable using calibrated galvanostatic equipment.
2.2.2. Textile Wastewater
Two types of wastewater were used in this study:
Synthetic Textile Wastewater
SWW was prepared according to the formulation proposed by Lavorante et al. [49], which simulates the composition of textile dyeing effluents, with one modification: NaCl was excluded from the base formulation and included as an experimental variable (X2). The fixed components were: DB2 (2 g·L−1, 0.2% w/v), Na2CO3 (10 g·L−1, 1.0% w/v), and NaOH (5 g·L−1, 0.5% w/v), dissolved in deionized water (18.2 MΩ·cm). The formulation yielded an initial pH above 11 due to the alkaline components; prior to each experimental run, pH was adjusted to 7.1 ± 0.1 using dilute HCl and maintained as a fixed condition throughout the CCD to isolate the effects of the three design variables. The physicochemical characterization of the SWW after pH adjustment is presented in Table 1.
Table 1.
Physicochemical characterization of SWW after pH adjustment.
Real Textile Wastewater
RTW was collected from the final rinse stage of the dyeing process at a local denim manufacturing facility; the facility’s dyeing operations typically use blue-toned dye formulations. RTW typically contains dyes, surfactants, salts, and auxiliary chemicals that influence coagulant formation and flocculation dynamics.
Prior to treatment, the RTW was conditioned as follows: (i) diluted 1:1 (v/v) with deionized water to reduce pollutant load and improve comparability with SWW; (ii) pH was adjusted to 7.0 ± 0.1 using dilute HCl; and (iii) NaCl was added to reach a concentration of 2.9 g·L−1, matching the optimal electrolyte concentration identified by RSM. This conditioning was performed to establish electrochemical conditions comparable to those used in the SWW optimization, enabling a more consistent evaluation of process transferability. The physicochemical characterization of the RTW in its original state and after conditioning is presented in Table 2.
Table 2.
Physicochemical characterization of RTW in its original state and after conditioning.
2.2.3. Methodological Considerations
Rationale for Using Synthetic Wastewater
SWW was selected for the main experimental design to ensure: (i) controlled and reproducible influent characteristics, (ii) minimized matrix-driven variability, (iii) statistically valid application of RSM, and (iv) clearer interpretation of factor interactions.
This choice, however, constitutes a limitation regarding industrial applicability. RTW presents complex and variable matrices—including dispersants, surfactants, stabilizers, and metals—that may influence coagulant generation, electrode behavior, or pollutant removal efficiency. This limitation is explicitly acknowledged and partially addressed through the scale-up treatment of RTW (Section 3.2), which evaluates the transferability of optimized operating conditions under more realistic scenarios.
Reproducibility and Error Control
All EC experiments were performed under identical hydrodynamic and electrical conditions. Each point of the experimental matrix was executed in duplicate. Additionally, four independent replicate assays were carried out under the optimized conditions predicted by the RSM model to evaluate system stability and confirm model reliability.
Color and COD analyses were performed according to standard APHA procedures, and all instruments were calibrated according to manufacturer recommendations. Low variability among replicate measurements confirmed the reproducibility of the experimental system. All analytical measurements (color and COD) were performed in triplicate for each sample. Reported values correspond to the mean of triplicate measurements.
2.2.4. Experimental Design
RSM was applied to optimize the operational parameters of the EC system, aiming to maximize Y1 and Y2 in the treatment of SWW. A rotatable CCD with three independent variables was selected to construct second-order polynomial models and identify optimal operating conditions.
The three factors evaluated were: X1 (min), X2 (g·L−1), and X3 (V). Each factor was examined at five coded levels (−α, −1, 0, +1, +α), as shown in Table 3. These variables were selected due to their known influence on coagulant generation, solution conductivity, and the overall electrochemical performance of EC systems.
Table 3.
Levels of factors studied.
The initial conductivity of SWW (32.0 ± 0.4 mS·cm−1, Table 1) reflects the combined ionic contribution of all formulation components. Within the experimental design, X2 was varied to assess its specific role in anodic dissolution kinetics and electrolyte availability. At the same time, the baseline conductivity remained relatively stable across runs, despite the fixed formulation components. The factor ranges were established from preliminary full-factorial experiments that defined the feasible operational window and center-point values.
A total of 20 experimental runs were conducted, including 8 factorial points, 6 axial points, and 6 center points. This structure ensured the appropriate evaluation of linear, interaction, and quadratic effects and provided sufficient statistical power to construct reliable second-order models.
The factor ranges were defined based on preliminary OFAT experiments conducted prior to the CCD, which identified the feasible operational window within which measurable changes in color removal and COD reduction were observed. The center point values (X1 = 10 min, X2 = 2.5 g·L−1, X3 = 15 V) were selected at the midpoint of this feasible range, and the factorial levels (±1) were set to span the region of interest. The axial distance was determined by the rotatability condition for a 3-factor CCD (α = 23/4 = 1.682).
The symmetric structure of the CCD and the position of the center point ensured rotatability, providing uniform predictive variance across the design space and enabling a balanced exploration of factor effects and their interactions.
Two response variables were evaluated: Y1 (%) and Y2 (%). After each run, samples were collected and analyzed using standardized procedures. All statistical analyses, including regression modeling, Analysis of Variance (ANOVA), and optimization, were performed using Minitab v19 (trial version).
The resulting second-order models were expressed according to the general polynomial equation:
where Yi is the predicted response; β0, βi, βii, and βij are regression coefficients; Xi and Xj are coded variables; and ε represents experimental error.
2.2.5. Analytical Techniques
The performance of the EC system was assessed by measuring color removal, COD reduction, E_c, specific energy consumption (E_s), and sludge moisture content. All analytical procedures followed standard APHA recommendations and were performed in controlled laboratory conditions.
Color Analysis
Color removal was quantified by measuring color intensity in Platinum–Cobalt units (Pt-Co, also referred to as Hazen units) using a Thermo Scientific Genesys 10S UV-Vis spectrophotometer (Thermo Fisher Scientific, Waltham, MA, USA), following Standard Methods 2120 C (APHA, AWWA, WEF, 2017) [50]. The instrument was calibrated using a 500 Pt-Co standard solution prior to measurements. When required, samples were diluted with deionized water prior to measurement to ensure readings remained within the instrument’s linear calibration range; the final color value was obtained by multiplying the instrument reading by the corresponding dilution factor. Treated samples were filtered through 0.45 µm membrane filters prior to analysis to eliminate interference from residual flocs.
Prior to color analysis, the maximum absorbance wavelength of DB2 (λmax = 571 nm) was determined by spectral scanning, yielding a value within the reported range for this dye (λmax = 570–575 nm) [51,52]. This wavelength served as the reference for spectral verification of the dye identity and for confirming measurement consistency across runs. For RTW, color removal was also assessed at 571 nm as a reference metric to allow consistent comparison between systems, acknowledging that real effluents may contain additional chromophores absorbing at different wavelengths; this single-wavelength approach may result in a conservative estimate of total color removal for RTW.
Y1 was calculated using Equation (2):
where C0 is the initial color (Pt-Co) and Ct is the final color of the treated sample (Pt-Co).
Chemical Oxygen Demand
COD was determined following Standard Methods 5220 D (closed reflux colorimetric method; APHA, AWWA, WEF, 2017) [50] using a Hach DRB-200 thermoreactor (Hach Company, Loveland, CO, USA). The appropriate reagent range (high: 20–1500 mg·L−1; low: 0–150 mg·L−1) was selected for each sample based on the expected residual COD concentration. Digestion was performed at 150 °C for 2 h. All samples were filtered through 0.45 μm membrane filters prior to analysis to remove suspended solids that could interfere with the colorimetric reading. Absorbance readings were performed on a Macherey-Nagel PF-12 Plus photometer.
Y2 was calculated using Equation (3):
where COD0 and CODt correspond to the initial and final COD values (mg·L−1), respectively.
Energy Consumption
E_c was calculated according to Equation (4):
where E_c is the consumed energy (kWh), I is the current (A), V is the applied voltage (V), and t is the treatment time (h).
E_s was determined using Equation (5):
where VT is the treated volume (m3).
Sludge Moisture Content
Moisture content was quantified by measuring the wet mass of the final sludge immediately after EC treatment, then oven-drying and reweighing. Drying was performed at 105 °C until constant mass was achieved (approximately 24 h, verified by weighing at 1 h intervals until mass variation was less than 0.1%).
The percentage of water in the sludge was calculated using Equation (6):
where Wwet is the wet sludge mass (g) and Wdry is the dry mass (g).
3. Results
3.1. Optimization Results Using Synthetic Textile Wastewater
3.1.1. Experimental Matrix Design and Results
Table 4 summarizes the CCD experimental matrix, including the coded levels of the three independent variables (X1, X2, and X3) and the corresponding responses for Y1 and Y2. The results show a wide range of removal efficiencies (Y1 = 15–98%; Y2 = 20–96%), indicating that the selected operating ranges captured both low- and high-performance regions of the EC system.
Table 4.
Color removal (Y1) and COD reduction (Y2) achieved in each experimental run of the CCD.
Comparisons between factorial points differing only in X1 (runs 1 vs. 2, 3 vs. 4, 5 vs. 6, and 7 vs. 8) consistently showed higher Y1 and Y2 values as X1 increased from −1 to +1. Changes in X3 also produced higher responses under comparable X1 and X2 conditions (e.g., runs 1 vs. 5), and the influence of X2 was observable at several factorial comparisons (e.g., runs 1 vs. 3), although with a smaller magnitude relative to X1 and X3.
The axial points (runs 9–14) expanded the experimental domain and evidenced nonlinearity within the studied ranges. In particular, the contrast between runs 9 and 10 (extreme values of X1) produced the widest differences in performance. The six center points (runs 15–20) exhibited high consistency (Y1 = 70–73%; Y2 = 69–70%).
3.1.2. Significance of Model Terms for Color Removal and COD Reduction
Figure 3 presents the Pareto charts of standardized effects for the linear terms (X1, X2, X3), interaction terms (X1X2, X1X3, X2X3), and quadratic terms (X12, X22, X32) on Y1 and Y2 using the critical t-value at α = 0.05.
Figure 3.
Pareto charts of standardized effects for the full models of (A) Y1 and (C) Y2 and the reduced models of (B) Y1 and (D) Y2 (α = 0.05). The red dashed vertical line represents the critical t-value threshold for statistical significance at α = 0.05; bars extending beyond this line correspond to significant effects retained in the model. Treatment time (X1) is the dominant factor in all four models for both responses. Model reduction was performed by removing non-significant terms while preserving model hierarchy.
In the full models (Figure 3A,C), X1 had the largest standardized effect for both responses. For Y1 (Figure 3A), X3 and X2 were also significant, and interaction terms involving X1 (X1X3 and X1X2) showed relevant effects. For Y2 (Figure 3C), X1 remained the dominant term, followed by X3, while X2 showed a smaller but statistically significant contribution.
The reduced models (Figure 3B,D) were obtained after removing non-significant terms while maintaining hierarchy. For Y1 (Figure 3B), X12 and X22 remained significant, whereas X32 was not retained; interaction terms X1X2 and X1X3 were maintained. For Y2 (Figure 3D), X12, X22, and X32 were significant, indicating a stronger quadratic behavior relative to Y1 within the studied domain.
To support the analysis of model significance and validate the statistical assumptions, complete ANOVA tables for both reduced models are presented in Table 5 and Table 6.
Table 5.
ANOVA for the reduced quadratic model—Y1 (Color removal).
Table 6.
ANOVA for the reduced quadratic model—Y2 (COD reduction).
The ANOVA results confirm the statistical significance of all retained terms (p < 0.001 for all sources). X1 was the dominant factor for both responses, accounting for the largest portion of the adjusted sum of squares (Y1: SS = 8112.9; Y2: SS = 6684.2). For Y1, interaction terms X1X2 and X1X3 were both significant (p < 0.001), while for Y2, only X1X2 was retained, indicating a stronger coupling between X1 and X2 for Y2. The non-significant lack-of-fit tests (Y1: F = 2.37, p = 0.180; Y2: F = 3.02, p = 0.121) confirm that the quadratic models adequately represent the response behavior within the studied domain without overfitting.
Residual diagnostic plots for both reduced models are presented in Figure 4 and Figure 5. The normal probability plots show residuals following a near-linear pattern, confirming approximate normality. The residuals-versus-fitted-values plots exhibit no systematic pattern, indicating homoscedasticity and the absence of model bias. The histograms of residuals show an approximately symmetric distribution centered at zero, consistent with the normality assumption, noting that some irregularity is expected given the small sample size (n = 20). The residuals versus run-order plots show no temporal trend, confirming the independence of the observations. Collectively, these diagnostics support the validity of the model assumptions and the reliability of the optimization results.
Figure 4.
Residual diagnostic plots for the reduced quadratic model Y1 (color removal; S = 1.41, R2 = 99.77%, R2adj = 99.64%, lack-of-fit p = 0.180). (A) Normal probability plot: residuals follow an approximately linear pattern along the red dashed reference line. (B) Residuals vs. fitted values: no systematic structure across the fitted range. (C) Histogram of residuals: approximately symmetric distribution centered at zero; minor irregularities are consistent with the small sample size (n = 20). (D) Residuals vs. run order: no temporal trend relative to the red dashed zero line. The non-significant lack-of-fit (p = 0.180) formally confirms model adequacy.
Figure 5.
Residual diagnostic plots for the reduced quadratic model Y2 (COD reduction; S = 0.81, R2 = 99.91%, R2adj = 99.86%, lack-of-fit p = 0.121). (A) Normal probability plot: tight alignment of residuals along the red dashed reference line, consistent with the lower S value relative to Y1. (B) Residuals vs. fitted values: no discernible pattern or variance gradient across the fitted range. (C) Histogram of residuals: concentrated, near-symmetric distribution centered near zero. (D) Residuals vs. run order: no systematic trend relative to the red dashed zero line. The non-significant lack-of-fit (p = 0.121) formally confirms model adequacy.
These results justify the development of the reduced quadratic models used to establish the regression equations for Y1 and Y2, presented in Equations (7) and (8).
where X1, X2, and X3 are the coded values of treatment time, NaCl concentration, and voltage, respectively. All coefficients were verified against the experimental data; residuals for all 20 runs were within ±2% for Y1 (consistent with S = 1.41) and within ±1.5% for Y2 (consistent with S = 0.81).
Y1 = 71.5 + 24.38 (X1) + 6.87 (X2) + 7.18 (X3) − 7.0 (X1X2) + 2.75 (X1X3) − 6.0 (X12) − 3.0 (X22)
Y2 = 69.5 + 22.13 (X1) + 2.84 (X2) + 11.52 (X3) − 3.75 (X1X2) − 4.23 (X12) − 1.22 (X22) − 1.58 (X32)
3.1.3. Model Performance and Goodness-of-Fit
Table 7 summarizes the goodness-of-fit and predictive indicators for the quadratic models developed for Y1 and Y2, including the standard error of regression (S), the coefficient of determination (R2), the adjusted coefficient of determination (R2_adjusted), and the predicted coefficient of determination (R2_predicted).
Table 7.
Statistical summary of the quadratic models for color removal (Y1) and COD reduction (Y2).
For both responses, R2 exceeded 99% (Y1: 99.77%; Y2: 99.91%), indicating that most of the variability in the experimental data was explained by the fitted quadratic models. The R2_adjusted values (Y1: 99.64%; Y2: 99.86%) were close to the corresponding R2 values, indicating that the retained model terms contributed meaningfully to the responses. In addition, R2_predicted (Y1: 99.04%; Y2: 99.72%) was in good agreement with R2_adjusted, supporting the predictive capability of the models within the studied factor space [38,43]. The regression standard errors were low (S = 1.41 for Y1 and S = 0.81 for Y2), indicating small residual variability.
The high R2 values are consistent with the controlled experimental conditions employed: use of synthetic wastewater with defined composition, batch operation without mechanical agitation, and low pure error across center-point replicates (Y1 = 71.5 ± 1.0%; Y2 = 69.5 ± 0.5%). The non-significant lack-of-fit tests (Y1: F = 2.37, p = 0.180; Y2: F = 3.02, p = 0.121) formally confirm the absence of overfitting and demonstrate that the quadratic models adequately represent the response behavior within the studied domain.
3.1.4. Response Optimization and Response Surface Analysis
Using the quadratic models for Y1 and Y2, the response optimizer identified the optimal combination of operating parameters summarized in Table 8 (X1 = 16.5 min, X2 = 2.9 g·L−1 NaCl, and X3 = 18.0 V). To visualize the response behavior around the optimal region, contour and response surface plots were generated as functions of X1 and X3, with X2 fixed at its optimal value.
Table 8.
Optimal operating parameters predicted by the response optimizer.
The contour plots (Figure 6) show increasing removal efficiencies from low time/low voltage to high time/high voltage for both responses, with the highest response region located near the optimizer-predicted conditions. For Y1 (Figure 6A), efficiencies above 95% were achieved at longer treatment times and higher voltages within the explored domain. For Y2 (Figure 6B), high efficiencies similarly occurred at longer times and higher voltages, and the highest response region was located near the same optimal parameter combination.
Figure 6.
Contour plots for (A) color removal (Y1) and (B) COD reduction (Y2) as a function of treatment time (X1) and voltage (X3) at X2 fixed at its optimal value.
The response surface plots (Figure 7) reinforce the trends observed in the contour diagrams and show curvature consistent with the fitted quadratic models. For both responses, the maximum region was centered near X1 ≈ 16.5 min and X3 ≈ 18 V, supporting the selection of these conditions for subsequent experimental validation.
Figure 7.
Response surface plots for (A) color removal (Y1) and (B) COD reduction (Y2) as a function of treatment time (X1) and voltage (X3) at X2 fixed at its optimal value.
3.1.5. Model Validation Under Optimal Conditions
The accuracy of the quadratic models was evaluated through four additional runs performed under the optimal operating conditions predicted by the RSM analysis (X1 = 16.5 min, X2 = 2.9 g·L−1 NaCl, X3 = 18 V). The response optimizer predicted Y1 = 99.2% and Y2 = 97.8%, with 95% prediction intervals of [97.8%, 100%] for Y1 and [96.2%, 99.4%] for Y2. The four validation experiments yielded Y1 = 99.5 ± 0.6% and Y2 = 97.5 ± 0.6%, both within the stated prediction intervals, with a prediction error of less than 1% for both responses. The consistency among replicate assays confirms that the optimized region is reproducible under the tested conditions and supports the predictive reliability of the reduced quadratic models.
3.1.6. Energy Consumption
E_c was quantified for a treated volume of 3 L of SWW using Equations (4) and (5). Under the optimal conditions (18.0 V, 4.0 A, and 16.5 min), the total E_c was 0.02 kWh, corresponding to an E_s of 6.6 kWh·m−3.
An operational cost estimation was performed for both scales based on E_c, electrode dissolution (determined experimentally from anode mass loss measurements under optimal conditions, yielding an average anode efficiency of 92% ± 1%), and NaCl addition. The estimated costs are summarized in Table 9.
Table 9.
Estimated operational costs under optimized conditions—bench scale (3 L, SWW).
3.1.7. Sludge Moisture Content
The moisture content of the sludge generated under the optimized operating conditions was determined using Equation (6). Four replicate measurements performed during the validation runs yielded moisture values ranging from 92% to 94% (mean = 93.0 ± 0.8%).
3.2. Applicability Assessment Using Real Textile Wastewater (RTW) at 50 L Scale
A scaled-up EC cell was designed and constructed to evaluate the transferability of the optimized operating conditions to a larger treatment volume using RTW. Table 10 summarizes the main geometric and electrochemical parameters of both systems.
Table 10.
Comparative parameters of the bench-scale (3 L) and scale-up (50 L) EC systems.
The scale-up strategy prioritized preserving the parameters that directly govern the electrochemical environment: applied current (4.0 A), applied voltage (18 V), interelectrode distance (1.4 cm), electrode material (Al), and electrolyte concentration (2.9 g·L−1 NaCl). However, increasing the treated volume from 3 to 50 L while maintaining the same total current resulted in a substantially lower current density (0.42 vs. 3.33 mA·cm−2) and a reduced electrode area-to-volume ratio (0.19 vs. 0.40 cm2·mL−1). These differences are inherent to the scaling process when current is held constant and the electrode area increases.
As a consequence of the lower current density, the rate of anodic Al dissolution—and therefore the coagulant generation rate per unit volume—was reduced relative to the bench-scale system. To compensate for this reduced coagulant production rate and achieve comparable treatment performance, a longer treatment time was required. The extended treatment time of 84 min was determined empirically through preliminary trials at the 50 L scale, reflecting the time needed to accumulate sufficient coagulant species for effective pollutant destabilization under the modified electrochemical conditions.
The physicochemical characteristics of the RTW before and after EC treatment are presented in Table 11.
Table 11.
Physicochemical characterization of RTW before and after EC treatment (50 L, 18 V, 84 min).
Under these conditions, the system achieved 95% color removal, 80% COD reduction, 82% TSS removal, and 86% turbidity removal. The specific E_s at scale-up was 2.0 kWh·m−3, lower than the bench-scale value (6.6 kWh·m−3), consistent with the lower current density and the larger treated volume per unit energy input. The estimated total operational cost at scale-up was approximately 0.58 USD·m−3, compared to ~1.23 USD·m−3 at bench scale, primarily due to reduced energy demand per unit volume treated.
4. Discussion
4.1. Interpretation of Factor Effects and Interactions
The results obtained from the CCD matrix (Table 4) and the standardized effects analysis (Figure 3) show that X1 is the dominant factor for both Y1 and Y2. The consistent increase in both responses when X1 shifts from −1 to +1 across factorial pairs indicates that process performance strongly depends on the cumulative electrochemical exposure, which governs the overall extent of pollutant destabilization and removal.
X3 was the second most influential factor, particularly for Y2. Its relevance was also evident from comparisons at fixed X1 and X2 levels (e.g., runs 1 vs. 5). The significance of the X1X3 interaction in the Y1 reduced model indicates that the effects of treatment time and voltage on color removal are not independent; both variables jointly define a high-performance region, as confirmed by the contour and surface plots (Figure 6 and Figure 7). For Y2, the X1X2 interaction was retained instead, indicating a stronger coupling between treatment time and electrolyte concentration for COD reduction. Moreover, the Y2 model retained all three quadratic terms (X12, X22, X32), reflecting stronger nonlinearity relative to Y1 within the studied domain.
X2 showed a moderate but statistically meaningful influence. At lower time and lower voltage, increasing X2 improved both Y1 and Y2 (e.g., runs 1 vs. 3). In contrast, its effect became less pronounced under intensified electrochemical conditions (e.g., runs 6 vs. 7). In practical terms, these trends suggest that electrolyte concentration can contribute to improving performance within the explored domain. However, its relative importance may decrease as time and voltage approach the upper region of the design space.
The axial points (runs 9–14) further supported nonlinearity in the studied factors, consistent with the retention of quadratic terms in the reduced models. For Y1, the significance of X12 and X22 indicates curvature in the response surface, whereas for Y2, the significance of X12, X22, and X32 indicates stronger nonlinearity. Overall, the combined evidence from Table 4, Figure 3, Figure 6 and Figure 7 supports selecting a second-order model and explains the existence of a narrow optimal region centered on the operating conditions predicted by the response optimizer.
From a modeling standpoint, these trends can also be interpreted in terms of symmetry and asymmetry in the response surfaces. The predominance of quadratic terms indicates the presence of locally symmetric regions around the optimal operating point, where gradual variations in the factors yield predictable, smooth changes in the responses, particularly along the X1 axis. In contrast, the contribution of interaction terms, especially between treatment time and voltage (X1X3), introduces asymmetric distortions in the response surfaces, reflected in deviations from uniform curvature along the X3 axis. This behavior indicates that the system response is governed by coupled electrochemical phenomena rather than independent factor contributions, resulting in non-linear and direction-dependent effects across the design space. The statistical validity of these interpretations is supported by the model diagnostics presented in Section 3.1.2, including non-significant lack-of-fit tests (Y1: p = 0.180; Y2: p = 0.121) and residuals that satisfy the assumptions of normality and homoscedasticity.
4.2. Mechanistic Interpretation of Pollutant Removal During Electrocoagulation
A mechanistic interpretation supports the high Y1 and Y2 achieved under the optimized conditions. When Al electrodes are used, anodic dissolution generates Al3+ species, whose formation is governed by Faraday’s law and influenced by the applied electrical conditions and treatment time [53,54,55,56,57,58]. These Al3+ ions undergo hydrolysis and polymerization, forming mononuclear hydroxo complexes (e.g., Al(OH)2+, Al(OH)2+) and evolving into amorphous Al(OH)3 (s) and polymeric hydroxy-aluminum species [59,60,61,62,63,64,65]. In the pH range commonly encountered in textile wastewaters, these hydroxide phases act as effective coagulants that promote pollutant removal via charge neutralization, adsorption, ligand exchange, and sweep-flocculation [45,46,47,48,66,67].
In this study, the SWW was adjusted to pH 7.1 ± 0.1 prior to each experimental run, a condition under which amorphous Al(OH)3 (s) is the thermodynamically dominant species and sweep-flocculation is the prevailing removal mechanism [59,60,61,62,63,64,65]. The post-EC pH increase observed in both systems (SWW: 7.1 → 7.9 ± 0.1; RTW: 7.0 → 8.3 ± 0.1) is consistent with cathodic OH− generation, which progressively shifts the Al speciation equilibrium toward greater Al(OH)3 precipitation. This alkalinization effect remained self-limiting within the treatment timeframes used and did not drive speciation into the aluminate region (Al(OH)4−, dominant above pH ~9), thereby preserving the predominance of sweep-flocculation as the governing coagulation mechanism throughout all experimental runs.
Electrolyte concentration also plays a mechanistic role. Increasing NaCl improves conductivity and decreases ohmic resistance, supporting more stable electrochemical operation and enhancing coagulant formation rates [68,69]. In chloride-containing systems, the formation of hydroxo–chloro aluminum complexes (e.g., Al(OH)2Cl) has been reported under certain conditions [70,71]; however, since chloride speciation and free chlorine generation were not directly measured in the present study, this pathway is mentioned as a plausible contributor rather than a confirmed mechanism under the experimental conditions used here.
Voltage affects several coupled phenomena, including the rate of electrochemical reactions, the release of coagulant species, and the generation of hydrogen microbubbles at the cathode. Higher voltages can intensify microbubble production and mixing, facilitating the aggregation and separation of pollutant-laden flocs [57,70,71,72,73]. Treatment time integrates these effects by controlling the cumulative amount of Al released, the growth and consolidation of flocs, and the overall progression of pollutant destabilization. Accordingly, the synergistic trends observed for time and voltage in the response surfaces can be interpreted as the combined enhancement of coagulant generation, speciation dynamics, and electrochemically driven hydrodynamics, which together promote efficient removal of dyes and organic load under the optimized conditions. This mechanistic coupling is consistent with the nonlinear behavior captured by the quadratic models, reinforcing the interpretation of the process as a system governed by interdependent electrochemical and physicochemical mechanisms.
4.3. Comparison with Previous Studies and Practical Implications
A comparative summary of EC performance for textile wastewater treatment reported in selected studies is presented in Table 12.
Table 12.
Comparison of EC performance for textile wastewater treatment in selected studies.
Among the studies compiled in Table 12, Khorram and Fallah [39] and Pi et al. [40] demonstrated high color removal (≥97%) using RSM optimization under acidic conditions, while Bener et al. [13] reported 90–95% color removal from real textile wastewater using OFAT approaches, albeit with lower COD reduction. Elhadeuf et al. [75] achieved removals exceeding 99% and 98% for color and COD, respectively, using recycled Al electrodes with a Box–Behnken design. These results collectively confirm that Al-based EC systems can achieve high removal efficiencies across a range of operating conditions and wastewater types, with performance strongly influenced by optimization strategy, reactor configuration, and effluent composition.
The validation results (Y1 = 99–100%, Y2 = 97–98%) confirm the model’s predictive reliability and are consistent with high removal efficiencies reported for EC treatments applied to dye-containing textile effluents [6,10,13,78,79].
The comparison highlights that the present study achieves color removal and COD reduction efficiencies at the upper range of reported values, while operating at a competitive energy demand (6.6 kWh·m−3 at bench scale; 2.0 kWh·m−3 at scale-up) and estimated operational cost (~1.23 USD·m−3). The inclusion of RTW validation in a 50 L system, together with complementary reporting of E_c, sludge moisture content, and operational cost, distinguishes this work from studies that report only removal efficiencies under synthetic wastewater conditions.
From an operational perspective, E_c is a key parameter for feasibility. The E_S obtained under optimal conditions (6.6 kWh·m−3) indicates an energy demand within the range expected for EC systems and supports the practical relevance of the optimized operating window. When compared with previous reports, substantial variability is observed depending on reactor configuration and operating conditions. Zodi et al. [76] reported electrical requirements of 52–58 kWh·m−3 for dye removal in a continuous EC–flotation system, whereas Phalakornkule et al. [77] documented lower energy demands (0.69–1.40 kWh·m−3) for specific dye systems with high removal efficiencies. These differences highlight that energy performance depends strongly on factors such as current density, electrode arrangement, hydrodynamics, conductivity, and treatment objectives [76,77,80]. In this context, the present results provide a useful benchmark for a batch configuration optimized via RSM, while emphasizing the need for extended pilot-scale evaluation to refine energy performance under continuous operation.
Electrode passivation and maintenance are also relevant for long-term operation. Al electrodes can develop oxide or hydroxide layers that reduce effective surface area and increase cell resistance [20]. Routine cleaning strategies such as dilute HCl washing are commonly recommended to maintain stable performance [20,22]. Although significant passivation was not observed within the experimental timeframe of this study, electrode durability and maintenance frequency should be assessed under prolonged operation, particularly under real effluent conditions where matrix components can influence electrode behavior.
In terms of technology benchmarking, EC offers practical advantages over several conventional and advanced approaches used for textile wastewater treatment. Chemical coagulation–flocculation often requires substantial doses of metal salts and can generate large volumes of highly hydrated sludge, increasing dewatering and disposal burdens [74,81]. Adsorption processes (e.g., activated carbon) can be effective but may become economically restrictive at high dye loads, and regeneration can create additional waste streams [82,83,84]. Advanced oxidation processes (AOPs) such as Fenton, ozonation, and UV/H2O2 can achieve strong oxidation, but typically require external reagents, pH control, and higher operational complexity and/or energy inputs [46,85,86]. Biological treatments are environmentally attractive but often exhibit slower kinetics and reduced efficiency when treating highly recalcitrant synthetic dyes [87,88]. In contrast, EC generates coagulants in situ, can reduce chemical consumption, and can achieve high removal efficiencies within relatively short operational times [20,22,89].
When compared with the studies in Table 12, the RTW scale-up results (95% color removal, 80% COD reduction at 50 L) remain within the upper range of reported values for real textile effluents, despite the lower current density and increased matrix complexity at the larger scale. The lower COD reduction compared to SWW results is consistent with the greater complexity of real effluents, which can contain surfactants, detergents, auxiliaries, metals, colloids, and variable organic loads that influence coagulant formation and floc behavior, potentially reducing overall efficiency [90,91,92]. Even with this decrease, the maintained high color removal and substantial COD reduction indicate that the RSM-derived operating window retains practical effectiveness under more realistic conditions, supporting its technological relevance. This result highlights the robustness of the optimized parameter space, even under increased system complexity and scale-dependent hydrodynamic differences.
The broader contribution of this study lies in combining a statistically rigorous multivariable optimization with experimental verification and a scale-up demonstration using real industrial wastewater. While many EC studies report successful dye and/or COD reduction, fewer integrate RSM-based optimization with validation in real effluents [57,80,93], and even fewer report complementary operational metrics such as energy demand and sludge characteristics [93,94,95]. The inclusion of these performance indicators, together with the scale-up test, strengthens the practical value of the findings and provides a clearer pathway for subsequent pilot-scale development and industrial implementation [44,96,97,98,99]. At the same time, EC remains subject to inherent constraints—such as electrode consumption, passivation, and maintenance requirements [91,92]—and performance can vary with wastewater composition, underscoring the importance of further validation across diverse industrial scenarios [90,91,92].
Beyond removal performance and energy demand, sludge management is a key operational consideration. The sludge generated under the optimized operating conditions exhibited moisture contents of 92–94%, consistent with values reported for Al-based EC systems in the literature, which typically range from 90 to 97% [91,92]. This high moisture content reflects the amorphous, flocculent nature of Al(OH)3-based sludge. It has important practical implications: dewatering prior to disposal is generally required, which increases operational complexity and costs. Future characterization should include sludge metal content, leaching potential, particle morphology, and mechanical stability to evaluate environmental safety and potential valorization pathways within a circular-economy framework.
4.4. Limitations and Future Research Directions
Second, all experiments were conducted in batch mode at laboratory scale. Batch systems do not reproduce the hydraulic, mixing, or settling dynamics characteristic of continuous-flow electrocoagulation reactors, where parameters such as flow rate, turbulence, residence-time distribution, and hydraulic short-circuiting can influence removal performance, energy demand, and electrode wear. Therefore, future research should include continuous or semi-continuous operation and assess process robustness under realistic hydraulic conditions.
Third, although no significant electrode passivation was observed during the experimental runs, long-term electrode durability was not systematically evaluated. Extended operation may lead to surface fouling, accumulation of oxide layers, and changes in electrical resistance, which can reduce coagulant release and increase operational costs. A more complete assessment of electrode degradation mechanisms is needed to estimate maintenance requirements and replacement frequency.
Fourth, the study did not include a comprehensive physicochemical characterization of the sludge generated during EC. Only the moisture content was measured. Additional analyses—such as metal content, leaching potential, particle morphology, crystallinity, and mechanical stability—are necessary to evaluate environmental safety and to support any sludge valorization pathway within a circular-economy framework.
Finally, a complete economic assessment was not performed. Parameters such as electrode consumption rate, long-term energy demand, maintenance and cleaning frequency, sludge handling costs, and the economic impact of treating variable wastewater matrices were not quantified. These elements are essential to determine the practical and financial feasibility of scaling up the optimized process to industrial levels.
5. Conclusions
The Al-based batch EC system evaluated in this study demonstrated high efficiency in simultaneously removing Y1 and Y2 from SWW. Using a rotatable CCD and RSM, the optimal operating conditions were identified as a 16.5 min treatment time, 2.9 g·L−1 NaCl, and 18 V, achieving 99–100% color removal and 97–98% COD reduction in the validation experiments. The developed quadratic models exhibited excellent goodness of fit and predictive capability (R2, R2_adjusted, and R2_predicted > 99%), confirming their robustness for process optimization within the studied domain.
From a modeling perspective, the results revealed that a combination of symmetric and asymmetric response behaviors governs the EC process. The presence of significant quadratic terms indicates the existence of locally symmetric regions around the optimal operating point. In contrast, interaction effects—particularly between X1 and X3—introduce asymmetry, highlighting the coupled, nonlinear nature of the electrochemical system. This dual behavior provides a more comprehensive understanding of process dynamics and reinforces the suitability of RSM for capturing complex electrochemical interactions.
Under optimal conditions, the process required 0.02 kWh to treat 3 L (6.6 kWh·m−3), and the generated sludge exhibited moisture contents of 92–94%. The practical relevance of the optimized operating window was further supported by a 50 L scale-up test using RTW, which achieved 95% color removal and 80% COD reduction. These results provide initial evidence of the applicability of the optimized parameter space under more realistic and complex conditions.
This study provides a comprehensive framework integrating statistically rigorous multivariable optimization, mechanistic interpretation, and experimental validation, including scale-up assessment with real effluents. Several limitations should be explicitly acknowledged. First, the RSM optimization was performed on SWW with a defined single-dye composition, which does not fully represent the chemical variability of real industrial effluents. Second, pH was maintained at a neutral value as a fixed condition and was not varied as a design factor; the effect of pH on EC performance was therefore not captured by the optimization models. Third, the scale-up experiment did not preserve full electrochemical similarity—current density and electrode area-to-volume ratio differed substantially between scales—and therefore represents an exploratory applicability assessment rather than a rigorous scale-up demonstration. Fourth, long-term electrode performance, comprehensive sludge characterization, and full techno-economic analysis were not addressed. Future research should focus on continuous-flow operation, systematic evaluation of pH and conductivity effects, long-term electrode performance under variable industrial matrices, comprehensive sludge characterization within a circular-economy framework, and full techno-economic assessment to support industrial implementation.
Author Contributions
Conceptualization, H.M.Z.R., C.V. and J.C.A.-O.; Methodology, H.M.Z.R. and A.E.Z.R.; Software, H.M.Z.R. and A.E.Z.R.; Validation, H.M.Z.R. and C.V.; Formal analysis, H.M.Z.R. and A.E.Z.R.; Investigation, H.M.Z.R., C.V. and A.E.Z.R.; Resources, C.V., J.R., L.J.-C. and J.C.A.-O.; Data curation, H.M.Z.R. and C.V.; Writing—original draft preparation, H.M.Z.R.; Writing—review and editing, C.V., A.E.Z.R., J.R., L.J.-C. and J.C.A.-O.; Visualization, H.M.Z.R. and A.E.Z.R.; Supervision, C.V., J.R. and J.C.A.-O.; Project administration, J.C.A.-O.; Funding acquisition, J.C.A.-O. All authors have read and agreed to the published version of the manuscript.
Funding
This research was funded by the National University Toribio Rodriguez de Mendoza.
Data Availability Statement
The data supporting the findings of this study are available from the corresponding author upon reasonable request. The datasets are currently subject to an institutional embargo due to intellectual property protection associated with an ongoing Declaration of Invention process at the University of Buenos Aires.
Conflicts of Interest
The authors declare no conflicts of interest.
Abbreviations
The following abbreviations are used in this manuscript:
| AOPs | Advanced oxidation processes |
| Al | Aluminum |
| ANOVA | Analysis of Variance |
| CCD | Central composite design |
| COD | Chemical oxygen demand |
| DB2 | Direct Blue 2 |
| DC | Direct current |
| EC | Electrocoagulation |
| E_c | Energy consumption |
| E_s | Specific energy consumption |
| HCl | Hydrochloric acid |
| NaCl | Sodium chloride |
| OFAT | One-factor-at-a-time |
| RSM | Response surface methodology |
| RTW | Real textile wastewater |
| SWW | Synthetic textile wastewater |
| TSS | Total suspended solids |
| VT | Treated volume |
| λ_max | Maximum absorbance wavelength |
References
- Dipti, C.; Aakanksharaje, G.; Hetvi, D.; Shabiimam, M.A.; Anurag, K. Recent techniques of textile industrial wastewater treatment: A review. Mater. Today Proc. 2023, 77, 277–285. [Google Scholar] [CrossRef] [Scilit]
- Yaqub, A.; Raza, H.; Ajab, H.; Shah, S.H.; Shad, A.; Bhatti, Z.A. Decolorization of reactive blue-2 dye in aqueous solution by electrocoagulation process using aluminum and steel electrodes. J. Hazard. Mater. Adv. 2023, 9, 100248. [Google Scholar] [CrossRef] [Scilit]
- Das, P.P.; Sharma, M.; Purkait, M.K. Recent progress on electrocoagulation process for wastewater treatment: A review. Sep. Purif. Technol. 2022, 292, 121058. [Google Scholar] [CrossRef] [Scilit]
- Naje, A.S.; Chelliapan, S.; Zakaria, Z.; Ajeel, M.A.; Alaba, P.A. A review of electrocoagulation technology for the treatment of textile wastewater. Rev. Chem. Eng. 2016, 33, 263–292. [Google Scholar] [CrossRef] [Scilit]
- Imtiaz-Uddin, S.M. Impact of Textile Wastewater Pollution on the Environment. Pak. Text. J. 2018, 68, 38–39. Available online: https://www.researchgate.net/publication/329175203_Impact_of_Textile_Wastewater_Pollution_on_the_Environment (accessed on 18 February 2026).
- Aoudj, S.; Khelifa, A.; Drouiche, N.; Hecini, M.; Hamitouche, H. Electrocoagulation process applied to wastewater containing dyes from textile industry. Chem. Eng. Process. Process Intensif. 2010, 49, 1176–1182. [Google Scholar] [CrossRef] [Scilit]
- Negash, A.; Tibebe, D.; Mulugeta, M.; Kassa, Y. A study of basic and reactive dyes removal from synthetic and industrial wastewater by electrocoagulation process. S. Afr. J. Chem. Eng. 2023, 46, 122–131. [Google Scholar] [CrossRef] [Scilit]
- Abdulrazzaq, N.N.; Al-Sabbagh, B.H.; Shanshool, H.A. Coupling of electrocoagulation and microflotation for the removal of textile dyes from aqueous solutions. J. Water Process Eng. 2021, 40, 101906. [Google Scholar] [CrossRef] [Scilit]
- Parameswari, K.; Jagadeesh, T.; Kavitha, S.; Padmanabhan, D.; Palanichamy, J.; Murphy, A. Comparative study on removal of yellow 10gw dye from aqueous solution using Al, Cu electrodes in electrocoagulation. Mater. Today Proc. 2021, 47, 807–813. [Google Scholar] [CrossRef] [Scilit]
- Pajootan, E.; Arami, M.; Mahmoodi, N.M. Binary system dye removal by electrocoagulation from synthetic and real colored wastewaters. J. Taiwan Inst. Chem. Eng. 2012, 43, 282–290. [Google Scholar] [CrossRef] [Scilit]
- Ankoliya, D.; Mudgal, A.; Sinha, M.K.; Patel, V.; Patel, J. Application of electrocoagulation process for the treatment of dairy wastewater: A mini review. Mater. Today Proc. 2023, 77, 117–124. [Google Scholar] [CrossRef] [Scilit]
- Demirci, Y.; Pekel, L.C.; Alpbaz, M. Investigation of Different Electrode Connections in Electrocoagulation of Textile Wastewater Treatment. Int. J. Electrochem. Sci. 2015, 10, 2685–2693. [Google Scholar] [CrossRef] [Scilit]
- Bener, S.; Bulca, Ö.; Palas, B.; Tekin, G.; Atalay, S.; Ersöz, G. Electrocoagulation process for the treatment of real textile wastewater: Effect of operative conditions on the organic carbon removal and kinetic study. Process Saf. Environ. Prot. 2019, 129, 47–54. [Google Scholar] [CrossRef] [Scilit]
- Naje, A.S.; Chelliapan, S.; Zakaria, Z.; Abbas, S.A. Enhancement of an Electrocoagulation Process for the Treatment of Textile Wastewater under Combined Electrical Connections Using Titanium Plates. Int. J. Electrochem. Sci. 2015, 10, 4495–4512. [Google Scholar] [CrossRef] [Scilit]
- Nippatla, N.; Philip, L. Performance evaluation of a novel electrolytic reactor with rotating and non rotating bipolar disc electrodes for synthetic textile wastewater treatment. J. Environ. Chem. Eng. 2020, 8, 103462. [Google Scholar] [CrossRef] [Scilit]
- Santos, S.C.R.; Boaventura, R.A.R. Treatment of a simulated textile wastewater in a sequencing batch reactor (SBR) with addition of a low-cost adsorbent. J. Hazard. Mater. 2015, 291, 74–82. [Google Scholar] [CrossRef] [Scilit] [PubMed]
- Garg, N.; Garg, A.; Mukherji, S. Sequential treatment of simulated textile wastewater using zero-valent aluminum under alkaline conditions and biodegradation. J. Clean. Prod. 2022, 379, 134733. [Google Scholar] [CrossRef] [Scilit]
- Akter, S.; Shahinoor, I. Effect of additional Fe2+ salt on electrocoagulation process for the degradation of methyl orange dye: An optimization and kinetic study. Heliyon 2022, 8, e10176. [Google Scholar] [CrossRef] [Scilit]
- Mollah, M.Y.A.; Morkovsky, P.; Gomes, J.A.G.; Kesmez, M.; Parga, J.; Cocke, D.L. Fundamentals, present and future perspectives of electrocoagulation. J. Hazard. Mater. 2004, 114, 199–210. [Google Scholar] [CrossRef] [Scilit]
- Barrera-Díaz, C.E. Electrochemical Applications to Wastewater Treatment, 1st ed.; Reverté Editions: Ciudad de Mexico, Mexico, 2014; Available online: http://ri.uaemex.mx/handle/20.500.11799/52617 (accessed on 23 January 2026).
- Barrera-Díaz, C.E.; Balderas-Hernández, P.; Bilyeu, B. Chapter 3—Electrocoagulation: Fundamentals and Prospectives. In Electrochemical Water and Wastewater Treatment; Martínez-Huitle, C.A., Onofrio Scialdone, M.A.R., Eds.; Butterworth-Heinemann: Oxford, UK, 2018; pp. 61–76. [Google Scholar] [CrossRef] [Scilit]
- Garcia-Segura, S.; Maesia, M.; Eiband, S.G.; de Melo, J.V.; Martínez-Huitle, C.A. Electrocoagulation and advanced electrocoagulation processes: A general review about the fundamentals, emerging applications and its association with other technologies. J. Electroanal. Chem. 2017, 801, 267–299. [Google Scholar] [CrossRef] [Scilit]
- Tahreen, A.; Jami, M.S.; Ali, F. Role of electrocoagulation in wastewater treatment: A developmental review. J. Water Process Eng. 2020, 37, 101440. [Google Scholar] [CrossRef] [Scilit]
- Bharti, M.; Das, P.P.; Purkait, M.K. A review on the treatment of water and wastewater by electrocoagulation process: Advances and emerging applications. J. Environ. Chem. Eng. 2023, 11, 111558. [Google Scholar] [CrossRef] [Scilit]
- Holt, P.K.; Barton, G.W.; Wark, M.; Mitchell, C.A. A quantitative comparison between chemical dosing and electrocoagulation. Colloids Surf. A Physicochem. Eng. Asp. 2022, 211, 233–248. [Google Scholar] [CrossRef] [Scilit]
- Harif, T.; Khai, M.; Adin, A. Electrocoagulation versus chemical coagulation: Coagulation/flocculation mechanisms and resulting floc characteristics. Water Res. 2012, 46, 3177–3188. [Google Scholar] [CrossRef] [Scilit]
- Trompette, J.L.; Lahitte, J.F. Effects of some ion-specific properties in the electrocoagulation process with aluminum electrodes. Colloids Surf. A Physicochem. Eng. Asp. 2021, 629, 127507. [Google Scholar] [CrossRef] [Scilit]
- Bani-Melhem, K.; Al-Kilani, M.R. A comparison between iron and mild steel electrodes for the treatment of highly loaded grey water using an electrocoagulation technique. Arab. J. Chem. 2023, 16, 105199. [Google Scholar] [CrossRef] [Scilit]
- Jasim, M.A.; AlJaberi, F.Y.; Salman, A.D.; Alardhi, S.M.; Le, P.C.; Kulcsár, G.; Jakab, M. Studying the effect of reactor design on the electrocoagulation treatment performance of oily wastewater. Heliyon 2023, 9, e17794. [Google Scholar] [CrossRef] [Scilit] [PubMed]
- López, A.; Valero, D.; García-Cruz, L.; Sáez, A.; García-García, V.; Expósito, E.; Montiel, V. Characterization of a new cartridge type electrocoagulation reactor (CTECR) using a three-dimensional steel wool anode. J. Electroanal. Chem. 2017, 793, 93–98. [Google Scholar] [CrossRef] [Scilit]
- Yao, J.; Wang, L.; Zhang, G.; Tao, J.; Shi, X.; Wei, F. Plate structure optimization and performance study of a new continuous flow electrocoagulation reactor. Chem. Eng. Res. Des. 2023, 194, 693–704. [Google Scholar] [CrossRef] [Scilit]
- Nguyen, Q.H.; Kawamura, Y.; Watari, T.; Niihara, K.; Yamaguchi, T.; Nakayama, T. Electrocoagulation with a nanosecond pulse power supply to remove COD from municipal wastewater using iron electrodes. Int. J. Electrochem. Sci. 2020, 15, 493–504. [Google Scholar] [CrossRef] [Scilit]
- Talhajt, S.A.; Ghanjaoui, M.E.A.; Esserrar, S.; Nechchadi, B.; Salhi, A.; Krati, M.E.; Tahiri, S. Electrocoagulation treatment of paint wastewater from equipment cleaning and conversion of by-product sludge into nano-pigment. J. Ind. Eng. Chem. 2023, 127, 228–238. [Google Scholar] [CrossRef] [Scilit]
- Asaithambi, P.; Yesuf, M.B.; Govindarajan, R.; Selvakumar, P.; Niju, S.; Pandiyarajan, T.; Kadier, A.; Nguyen, D.D.; Alemayehu, E. Industrial wastewater treatment using batch recirculation electrocoagulation (BRE) process: Studies on operating parameters. Sustain. Chem. Environ. 2023, 2, 100014. [Google Scholar] [CrossRef] [Scilit]
- Safwat, S.M. Treatment of real printing wastewater using electrocoagulation process with titanium and zinc electrodes. J. Water Process Eng. 2020, 34, 101137. [Google Scholar] [CrossRef] [Scilit]
- Karabulut, B.Y.; Atasoy, A.D.; Can, O.T.; Yesilnacar, M.I. Electrocoagulation for nitrate removal in groundwater of intensive agricultural region: A case study of Harran plain, Turkey. Environ. Earth Sci. 2021, 80, 190. [Google Scholar] [CrossRef] [Scilit]
- Çiğ, H.; Alay, F.D.; Karabulut, B.Y. Predictive modelling and optimization of electrocoagulation for nitrate removal using deep learning: Toward intelligent and sustainable water treatment. J. Contam. Hydrol. 2025, 276, 104751. [Google Scholar] [CrossRef] [Scilit]
- Gutiérrez-Pulido, H.; De la Vara-Salazar, R. Analysis and Design of Experiments, 3rd ed.; Mc Graw Hill Education: Ciudad de Mexico, Mexico, 2012. [Google Scholar]
- Khorram, A.G.; Fallah, N. Treatment of textile dyeing factory wastewater by electrocoagulation with low sludge settling time: Optimization of operating parameters by RSM. J. Environ. Chem. Eng. 2018, 6, 635–642. [Google Scholar] [CrossRef] [Scilit]
- Pi, K.W.; Xiao, Q.; Zhang, H.Q.; Xia, M.; Gerson, A.R. Decolorization of synthetic Methyl Orange wastewater by electrocoagulation with periodic reversal of electrodes and optimization by RSM. Process Saf. Environ. Prot. 2014, 92, 796–806. [Google Scholar] [CrossRef] [Scilit]
- Bajpai, M.; Katoch, S.S. Reduction of COD from real graywater by electro-coagulation using Fe electrode: Optimization through box-behnken design. Mater. Today Proc. 2021, 43, 303–307. [Google Scholar] [CrossRef] [Scilit]
- Ebba, M.; Asaithambi, P.; Alemayehu, E. Development of electrocoagulation process for wastewater treatment: Optimization by response surface methodology. Heliyon 2022, 8, e09383. [Google Scholar] [CrossRef] [Scilit]
- Sözüdoğru, N. Design and optimization of a continuous electrooxidation system for real textile wastewater treatment using Response Surface Methodology (RSM)-guided multi-parameter analysis. J. Water Process Eng. 2025, 77, 108487. [Google Scholar] [CrossRef] [Scilit]
- Dehghan, G.; Asdaghi, M.; Dehghan, N.; Dolatabadi, M.; Ahmadzadeh, S. Response surface modeling of ceftriaxone removal from hospital wastewater. Environ. Monit. Assess. 2023, 195, 217. [Google Scholar] [CrossRef] [Scilit]
- Singh, S.; Srivastava, V.C.; Mall, I.D. Mechanism of Dye Degradation during Electrochemical Treatment. J. Phys. Chem. C 2013, 117, 15229–15240. [Google Scholar] [CrossRef] [Scilit]
- Titchou, F.E.; Zazou, H.; Afanga, H.; Jamila, E.G.; Akbour, R.A.; Hamdani, M.; Oturan, M.A. Comparative study of the removal of direct red 23 by anodic oxidation, electro-Fenton, photo-anodic oxidation and photoelectro-Fenton in chloride and sulfate media. Environ. Res. 2022, 204, 112353. [Google Scholar] [CrossRef] [Scilit] [PubMed]
- Naim, M.M.; El Abd, Y.M. Removal and recovery of dyestuffs from dyeing wastewaters. Sep. Purif. Methods 2021, 31, 171–228. [Google Scholar] [CrossRef] [Scilit]
- Bożęcka, A.M.; Orlof-Naturalna, M.M.; Kopeć, M. Methods of Dyes Removal from Aqueous Environment. J. Ecol. Eng. 2021, 22, 111–118. [Google Scholar] [CrossRef] [Scilit]
- Lavorante, M.J.; Álvarez, H.; Chantrill, C.; Fasoli, H.J. Environmental Applications of Electrocoagulation at Pilot Plant Scale. Ciencia 2011, 6, 39–47. Available online: https://www.researchgate.net/publication/376450550_Aplicaciones_Ambientales_de_la_Electrocoagulacion_a_Escala_de_Planta_Piloto_Environmental_Applications_of_Electrocoagulation_at_Pilot_Plant_Scale (accessed on 8 April 2026).
- Rice, E.W.; Baird, R.B.; Eaton, A.D. (Eds.) Standard Methods for the Examination of Water and Wastewater, 23rd ed.; American Public Health Association: Washington, DC, USA; American Water Works Association: Denver, CO, USA; Water Environment Federation: Alexandria, VA, USA, 2017. [Google Scholar]
- Castellar-Ortega, G.C.; Cely-Bautista, M.M.; Cardozo-Arrieta, B.M.; Angulo-Mercado, E.R.; Plaza-Vega, M.E. Adsorption of direct blue 2 dyes over a coffee grounds in a fixed-bed column at laboratory scale. Rev. UDCA Actual. Divulg. Científica 2018, 21, 531–541. [Google Scholar] [CrossRef] [Scilit]
- Piña-Mondragon, S. Biological Decolorization of Direct Blue Dye 2 in a Combined Anaerobic/Aerobic Filter. Master’s Thesis, Faculty of Engineering, Universidad Nacional Autónoma de México (UNAM), Mexico City, Mexico, 2007. Available online: http://132.248.52.100:8080/xmlui/handle/132.248.52.100/1732 (accessed on 16 February 2026).
- Dolatabadi, M.; Malekahmadi, R.; Ghorbanian, A. Investigation of Electrocoagulation Process for Efficient Removal of Bisphenol A from the Aqueous Environment: Promising Treatment Strategy. J. Environ. Health Sustain. Dev. 2021, 6, 1275–1283. [Google Scholar] [CrossRef] [Scilit]
- Chen, G. Electrochemical technologies in wastewater treatment. Sep. Purif. Technol. 2004, 38, 11–41. [Google Scholar] [CrossRef] [Scilit]
- Emamjomeh, M.M.; Sivakumar, M. Review of pollutants removed by electrocoagulation and electrocoagulation/flotation processes. J. Environ. Manag. 2009, 90, 1663–1679. [Google Scholar] [CrossRef] [Scilit]
- Khandegar, V.; Saroha, A.K. Electrocoagulation for the treatment of textile industry effluent—A review. J. Environ. Manag. 2013, 128, 949–963. [Google Scholar] [CrossRef] [Scilit]
- Al-Jaberi, F.Y.; Hadi, D.R.; Ajjam, S.K. Electrocoagulation treatment of textile wastewater: A review. AIP Conf. Proc. 2023, 2806, 030004. [Google Scholar] [CrossRef] [Scilit]
- Boinpally, S.; Kolla, A.; Kainthola, J.; Kodali, R.; Vemuri, J. A state-of-the-art review of the electrocoagulation technology for wastewater treatment. Water Cycle 2023, 4, 26–36. [Google Scholar] [CrossRef] [Scilit]
- Yousuf, M.; Mollah, A.; Schennach, R.; Parga, J.R.; Cocke, D.L. Electrocoagulation (EC)—Science and applications. J. Hazard. Mater. 2001, 84, 29–41. [Google Scholar] [CrossRef] [Scilit]
- Lin, L., Jr.; Huang, C.; Pan, J.R.; Wang, D. Effect of Al(III) speciation on coagulation of highly turbid water. Chemosphere 2008, 72, 189–196. [Google Scholar] [CrossRef] [Scilit]
- Wang, X.; Xu, H.; Wang, D. Mechanism of fluoride removal by AlCl3 and Al13: The role of aluminum speciation. J. Hazard. Mater. 2020, 398, 122987. [Google Scholar] [CrossRef] [Scilit]
- Hu, C.; Liu, H.; Qu, J. Coagulation properties of an electrochemically prepared polyaluminum chloride containing active chlorine. Chin. Sci. Bull. 2006, 51, 1955–1960. [Google Scholar] [CrossRef] [Scilit]
- Al-Marri, J.S.; Abouedwan, A.B.; Ahmad, M.I.; Bensalah, N. Electrocoagulation using aluminum electrodes as a sustainable and economic method for the removal of kinetic hydrate inhibitor (polyvinyl pyrrolidone) from produced wastewaters. Front. Water 2023, 5, 1305347. [Google Scholar] [CrossRef] [Scilit]
- Cañizares, P.; Carmona, M.; Lobato, J.; Martínez, F.; Rodrigo, M.A. Electrodissolution of Aluminum Electrodes in Electrocoagulation Processes. Ind. Eng. Chem. Res. 2005, 44, 4178–4185. [Google Scholar] [CrossRef] [Scilit]
- Mouedhen, G.; Feki, M.; De Petris Wery, M.; Ayedi, H.F. Behavior of aluminum electrodes in electrocoagulation process. J. Hazard. Mater. 2008, 150, 124–135. [Google Scholar] [CrossRef] [Scilit] [PubMed]
- Noreen, N.; Kazmi, M.; Feroze, N.; Javed, F.; Qutab, H.G.; Shahzad-Munir, H.M. Treatment of methylene blue in aqueous solution by electrocoagulation/micro-crystalline cellulosic adsorption combined process. Desalination Water Treat. 2020, 203, 379–387. [Google Scholar] [CrossRef] [Scilit]
- Linares-Hernández, I.; Barrera-Díaz, C.; Roa-Morales, G.; Bilyeu, B.; Ureña-Núñez, F. Influence of the anodic material on electrocoagulation performance. Chem. Eng. J. 2009, 148, 97–105. [Google Scholar] [CrossRef] [Scilit]
- Huang, C.H.; Shen, S.Y.; Chen, C.W.; Dong, C.D.; Raj, M.; Dakshinamoorthy, B.; Chang, J.H. Effect of Chloride Ions on Electro-Coagulation to Treat Industrial Wastewater Containing Cu and Ni. Sustainability 2020, 12, 7693. [Google Scholar] [CrossRef] [Scilit]
- Trompette, J.L.; Vergnes, H. On the crucial influence of some supporting electrolytes during electrocoagulation in the presence of aluminum electrodes. J. Hazard. Mater. 2009, 163, 1282–1288. [Google Scholar] [CrossRef] [Scilit] [PubMed]
- Shah, A.A.; Walia, S.; Kazemian, H. Advancements in combined electrocoagulation processes for sustainable wastewater treatment: A comprehensive review of mechanisms, performance, and emerging applications. Water Res. 2024, 252, 121248. [Google Scholar] [CrossRef] [Scilit]
- Issaka, E. From complex molecules to harmless byproducts: Electrocoagulation process for water contaminants degradation. Desalination Water Treat. 2024, 319, 100532. [Google Scholar] [CrossRef] [Scilit]
- Liu, Y.; Zhang, X.; Jiang, W.M.; Wu, M.R.; Li, Z.H. Comprehensive review of floc growth and structure using electrocoagulation: Characterization, measurement, and influencing factors. Chem. Eng. J. 2021, 417, 129310. [Google Scholar] [CrossRef] [Scilit]
- Karagözoğlu, M.; Bünyamin, R.; Malkoç, R. Optimization of Operating Parameters in the Removal of Synthetic Textile Dyestuff with the Electrocoagulation Process. Iran. J. Chem. Chem. Eng. 2023, 42, 1553–1573. [Google Scholar] [CrossRef]
- Gasmi, A.; Ibrahimi, S.; Elboughdiri, N.; Tekaya, M.A.; Ghernaout, D.; Hannachi, A.; Mesloub, A.; Ayadi, B.; Kolsi, L. Comparative Study of Chemical Coagulation and Electrocoagulation for the Treatment of Real Textile Wastewater: Optimization and Operating Cost Estimation. ACS Omega 2022, 7, 22456–22476. [Google Scholar] [CrossRef] [Scilit]
- Elhadeuf, K.; Bougdah, N.; Chikhi, M.; Djaballah, C.B.; Balaska, F. Optimization of textile wastewater treatment by electrocoagulation–microfiltration using recycled electrodes and Box–Behnken design. React. Kinet. Mech. Catal. 2023, 136, 981–1003. [Google Scholar] [CrossRef] [Scilit]
- Zodi, S.; Potier, O.; Lapicque, F.; Leclerc, J.P. Direct red 81 dye removal by a continuous flow electrocoagulation/flotation reactor. Sep. Purif. Technol. 2013, 108, 215–222. [Google Scholar] [CrossRef] [Scilit]
- Phalakornkule, C.; Sukkasem, P.; Mutchimsattha, C. Hydrogen recovery from the electrocoagulation treatment of dye-containing wastewater. Int. J. Hydrog. Energy 2010, 35, 10934–10943. [Google Scholar] [CrossRef] [Scilit]
- Gil-Pavas, E.; Dobrosz-Gómez, I.; Gómez-García, M.Á. Optimization of sequential chemical coagulation—Electro-oxidation process for the treatment of an industrial textile wastewater. J. Water Process Eng. 2018, 22, 73–79. [Google Scholar] [CrossRef] [Scilit]
- Thulasi, A.; Kannaiyan, S.; Kumar, K. Chapter 32—Diverse processes for the treatment of textile wastewater. In The Future of Effluent Treatment Plants; Shah, M., Rodriguez-Couto, S., Mehta, K., Eds.; Elsevier: Amsterdam, The Netherlands, 2021; pp. 661–682. [Google Scholar] [CrossRef] [Scilit]
- Gasmi, A.; Elboughdiri, N.; Ghernaout, D.; Hannachi, A.; Halim, K.S.A.; Khan, M.I. Electrocoagulation process for removing dyes and chemical oxygen demand from wastewater: Operational conditions and economic assessment—A review. Desalination Water Treat. 2022, 271, 74–107. [Google Scholar] [CrossRef] [Scilit]
- Chang, J.H.; Chang, S.W.; Dong, C.D.; Chen, C.W.; Huang, C.H.; Shen, S.Y. The coinage refractory wastewater treated by electrocatalytic-membrane process (ECMP) integrated with chemical- or electro-coagulation techniques. Process Saf. Environ. Prot. 2019, 125, 182–188. [Google Scholar] [CrossRef] [Scilit]
- Graça, N.S.; Rodrigues, A.E. The Combined Implementation of Electrocoagulation and Adsorption Processes for the Treatment of Wastewaters. Clean Technol. 2022, 4, 1020–1053. [Google Scholar] [CrossRef] [Scilit]
- Javed, F.; Feroze, N.; Ramzan, N.; Ikhlaq, A.; Kazmi, M.; Shahzad-Munir, H.M. Treatment of Reactive Red 241 dye by electro coagulation/biosorption coupled process in a new hybrid reactor. Desalination Water Treat. 2019, 166, 83–91. [Google Scholar] [CrossRef] [Scilit]
- Barjasteh-Askari, F.; Davoudi, M.; Dolatabadi, M.; Ahmadzadeh, S. Iron-modified activated carbon derived from agro-waste for enhanced dye removal from aqueous solutions. Heliyon 2021, 7, e07191. [Google Scholar] [CrossRef] [Scilit] [PubMed]
- Dolatabadi, M.; Ahmadzadeh, S. A rapid and efficient removal approach for degradation of metformin in pharmaceutical wastewater using electro-Fenton process; optimization by response surface methodology. Water Sci. Technol. 2019, 80, 685–694. [Google Scholar] [CrossRef] [Scilit] [PubMed]
- Othmani, A.; Kadier, A.; Singh, R.; Igwegbe, C.A.; Bouzid, M.; Aquatar, O.; Khanday, W.A.; Bote, M.E.; Damiri, F.; Gökkuş, Ö.; et al. A comprehensive review on green perspectives of electrocoagulation integrated with advanced processes for effective pollutants removal from water environment. Environ. Res. 2022, 215, 114294. [Google Scholar] [CrossRef] [Scilit]
- Huong-Nguyen, T.; Anh-Vu, N.; Huong-Nguyen, T.T.; Hidaka, T.; Fujiwara, T.; Watari, T.; Yamaguchi, T. Cosubstrates in azo dye decolorization: From conventional anaerobic systems to microbial fuel cells. Bioresour. Technol. 2025, 436, 132962. [Google Scholar] [CrossRef] [Scilit]
- Al-Ansari, M.M.; Li, Z.; Masood, A.; Rajaselvam, J. Decolourization of azo dye using a batch bioreactor by an indigenous bacterium Enterobacter aerogenes ES014 from the waste water dye effluent and toxicity analysis. Environ. Res. 2022, 205, 112189. [Google Scholar] [CrossRef] [Scilit]
- Sher, F.; Sania, K.H.; Iqbal, Z.; Imran, M. Implications of advanced wastewater treatment: Electrocoagulation and electroflocculation of effluent discharged from a wastewater treatment plant. J. Water Process Eng. 2020, 33, 101101. [Google Scholar] [CrossRef] [Scilit]
- Patel, S.K.; Shukla, S.C.; Natarajan, B.R.; Asaithambi, P.; Dwivedi, H.K.; Sharma, A.; Singh, D.; Nasim, M.; Raghuvanshi, S.; Sharma, D.; et al. State of the art review for industrial wastewater treatment by electrocoagulation process: Mechanism, cost and sludge analysis. Desalination Water Treat. 2025, 321, 100915. [Google Scholar] [CrossRef] [Scilit]
- Rajaniemi, K.; Tuomikoski, S.; Lassi, U. Electrocoagulation Sludge Valorization—A Review. Recursos 2021, 10, 127. [Google Scholar] [CrossRef] [Scilit]
- Zodi, S.; Potier, O.; Lapicque, F.; Leclerc, J.P. Treatment of the textile wastewaters by electrocoagulation: Effect of operating parameters on the sludge settling characteristics. Sep. Purif. Technol. 2009, 69, 29–36. [Google Scholar] [CrossRef] [Scilit]
- Brillas, E.; Martínez-Huitle, C.A. Decontamination of wastewaters containing synthetic organic dyes by electrochemical methods. An updated review. Appl. Catal. B Environ. 2015, 166–167, 603–643. [Google Scholar] [CrossRef] [Scilit]
- Sadaf, H.; Roy, H.; Fariha, A.; Rahman, T.U.; Tasnim, N.; Jahan, N.; Sokan-Adeaga, A.A.; Safwat, S.M.; Islam, S. Electrocoagulation-based wastewater treatment process and significance of anode materials for the overall improvement of the process: A critical review. J. Water Process Eng. 2024, 62, 105409. [Google Scholar] [CrossRef] [Scilit]
- Ingelsson, M.; Yasri, N.; Roberts, E.P.L. Electrode passivation, faradaic efficiency, and performance enhancement strategies in electrocoagulation—A review. Water Res. 2020, 187, 116433. [Google Scholar] [CrossRef] [Scilit] [PubMed]
- Dolatabadi, M.; Meftahizade, H.; Ahmadzadeh, S.; Abbasi, F.; Falakian, M.; Ghorbanpour, M. Efficiency of modified plant guar gum as aid coagulant for removal of diazinon from aqueous solution: Optimization by response surface methodology. Chem. Pap. 2023, 77, 1339–1349. [Google Scholar] [CrossRef] [Scilit]
- Karimifard, S.; Alavi-Moghaddam, M.R. Application of response surface methodology in physicochemical removal of dyes from wastewater: A critical review. Sci. Total Environ. 2018, 640–641, 772–797. [Google Scholar] [CrossRef] [Scilit] [PubMed]
- Hadeuf, N.B.; Fouzia-Balaska, M.C. Optimization of the electrocoagulation process by central composite design for the elimination of poly black dye using recycled aluminum electrodes. Desalination Water Treat. 2023, 283, 280–298. [Google Scholar] [CrossRef] [Scilit]
- Abbasi, S.; Mirghorayshi, M.; Zinadini, S.; Zinatizadeh, A.A. A novel single continuous electrocoagulation process for treatment of licorice processing wastewater: Optimization of operating factors using RSM. Process Saf. Environ. Prot. 2020, 134, 323–332. [Google Scholar] [CrossRef] [Scilit]
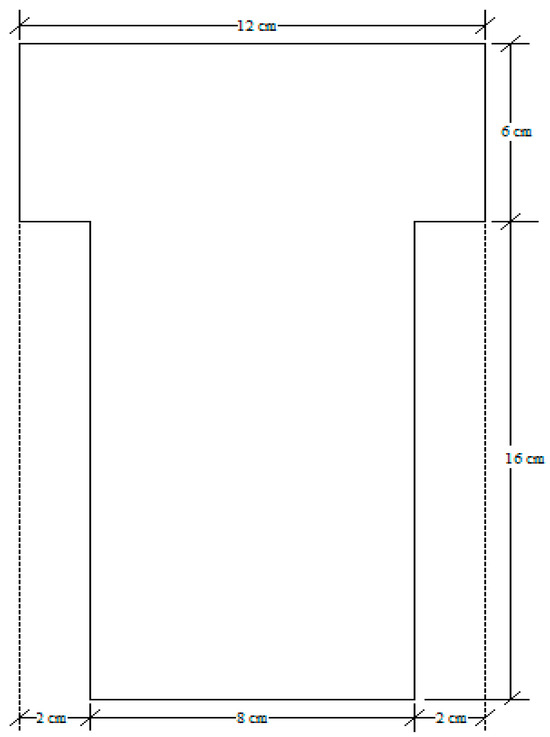
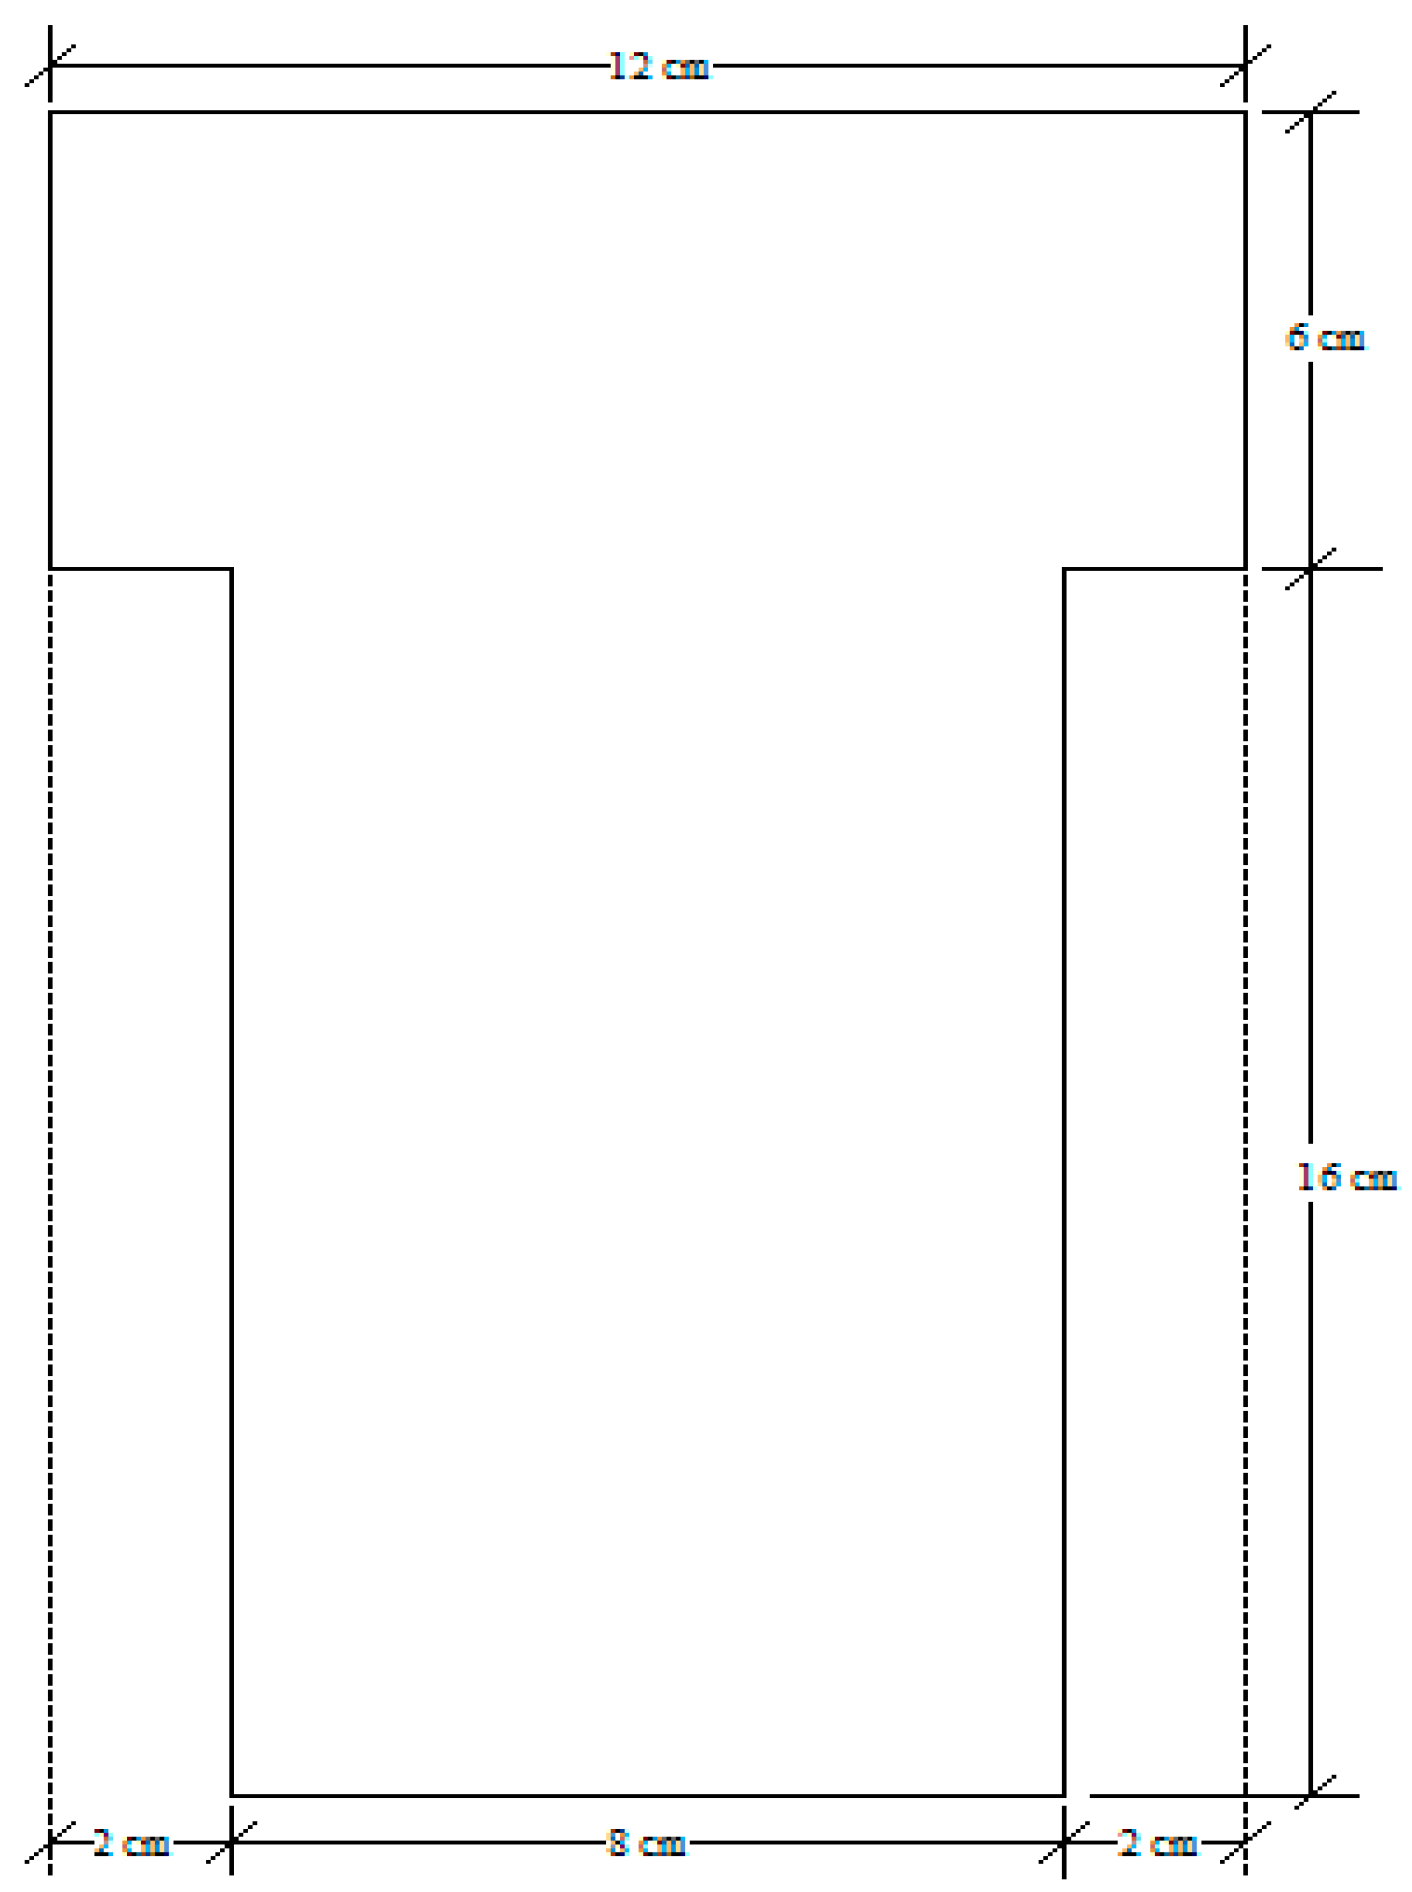
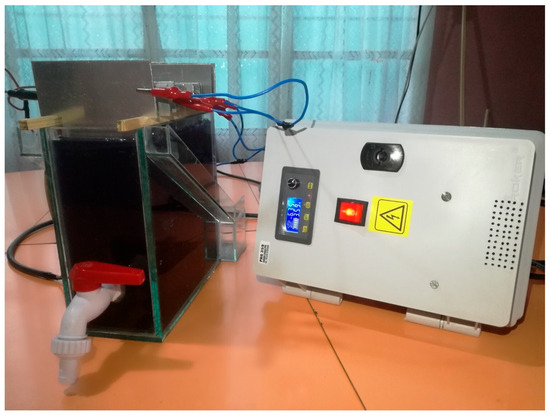
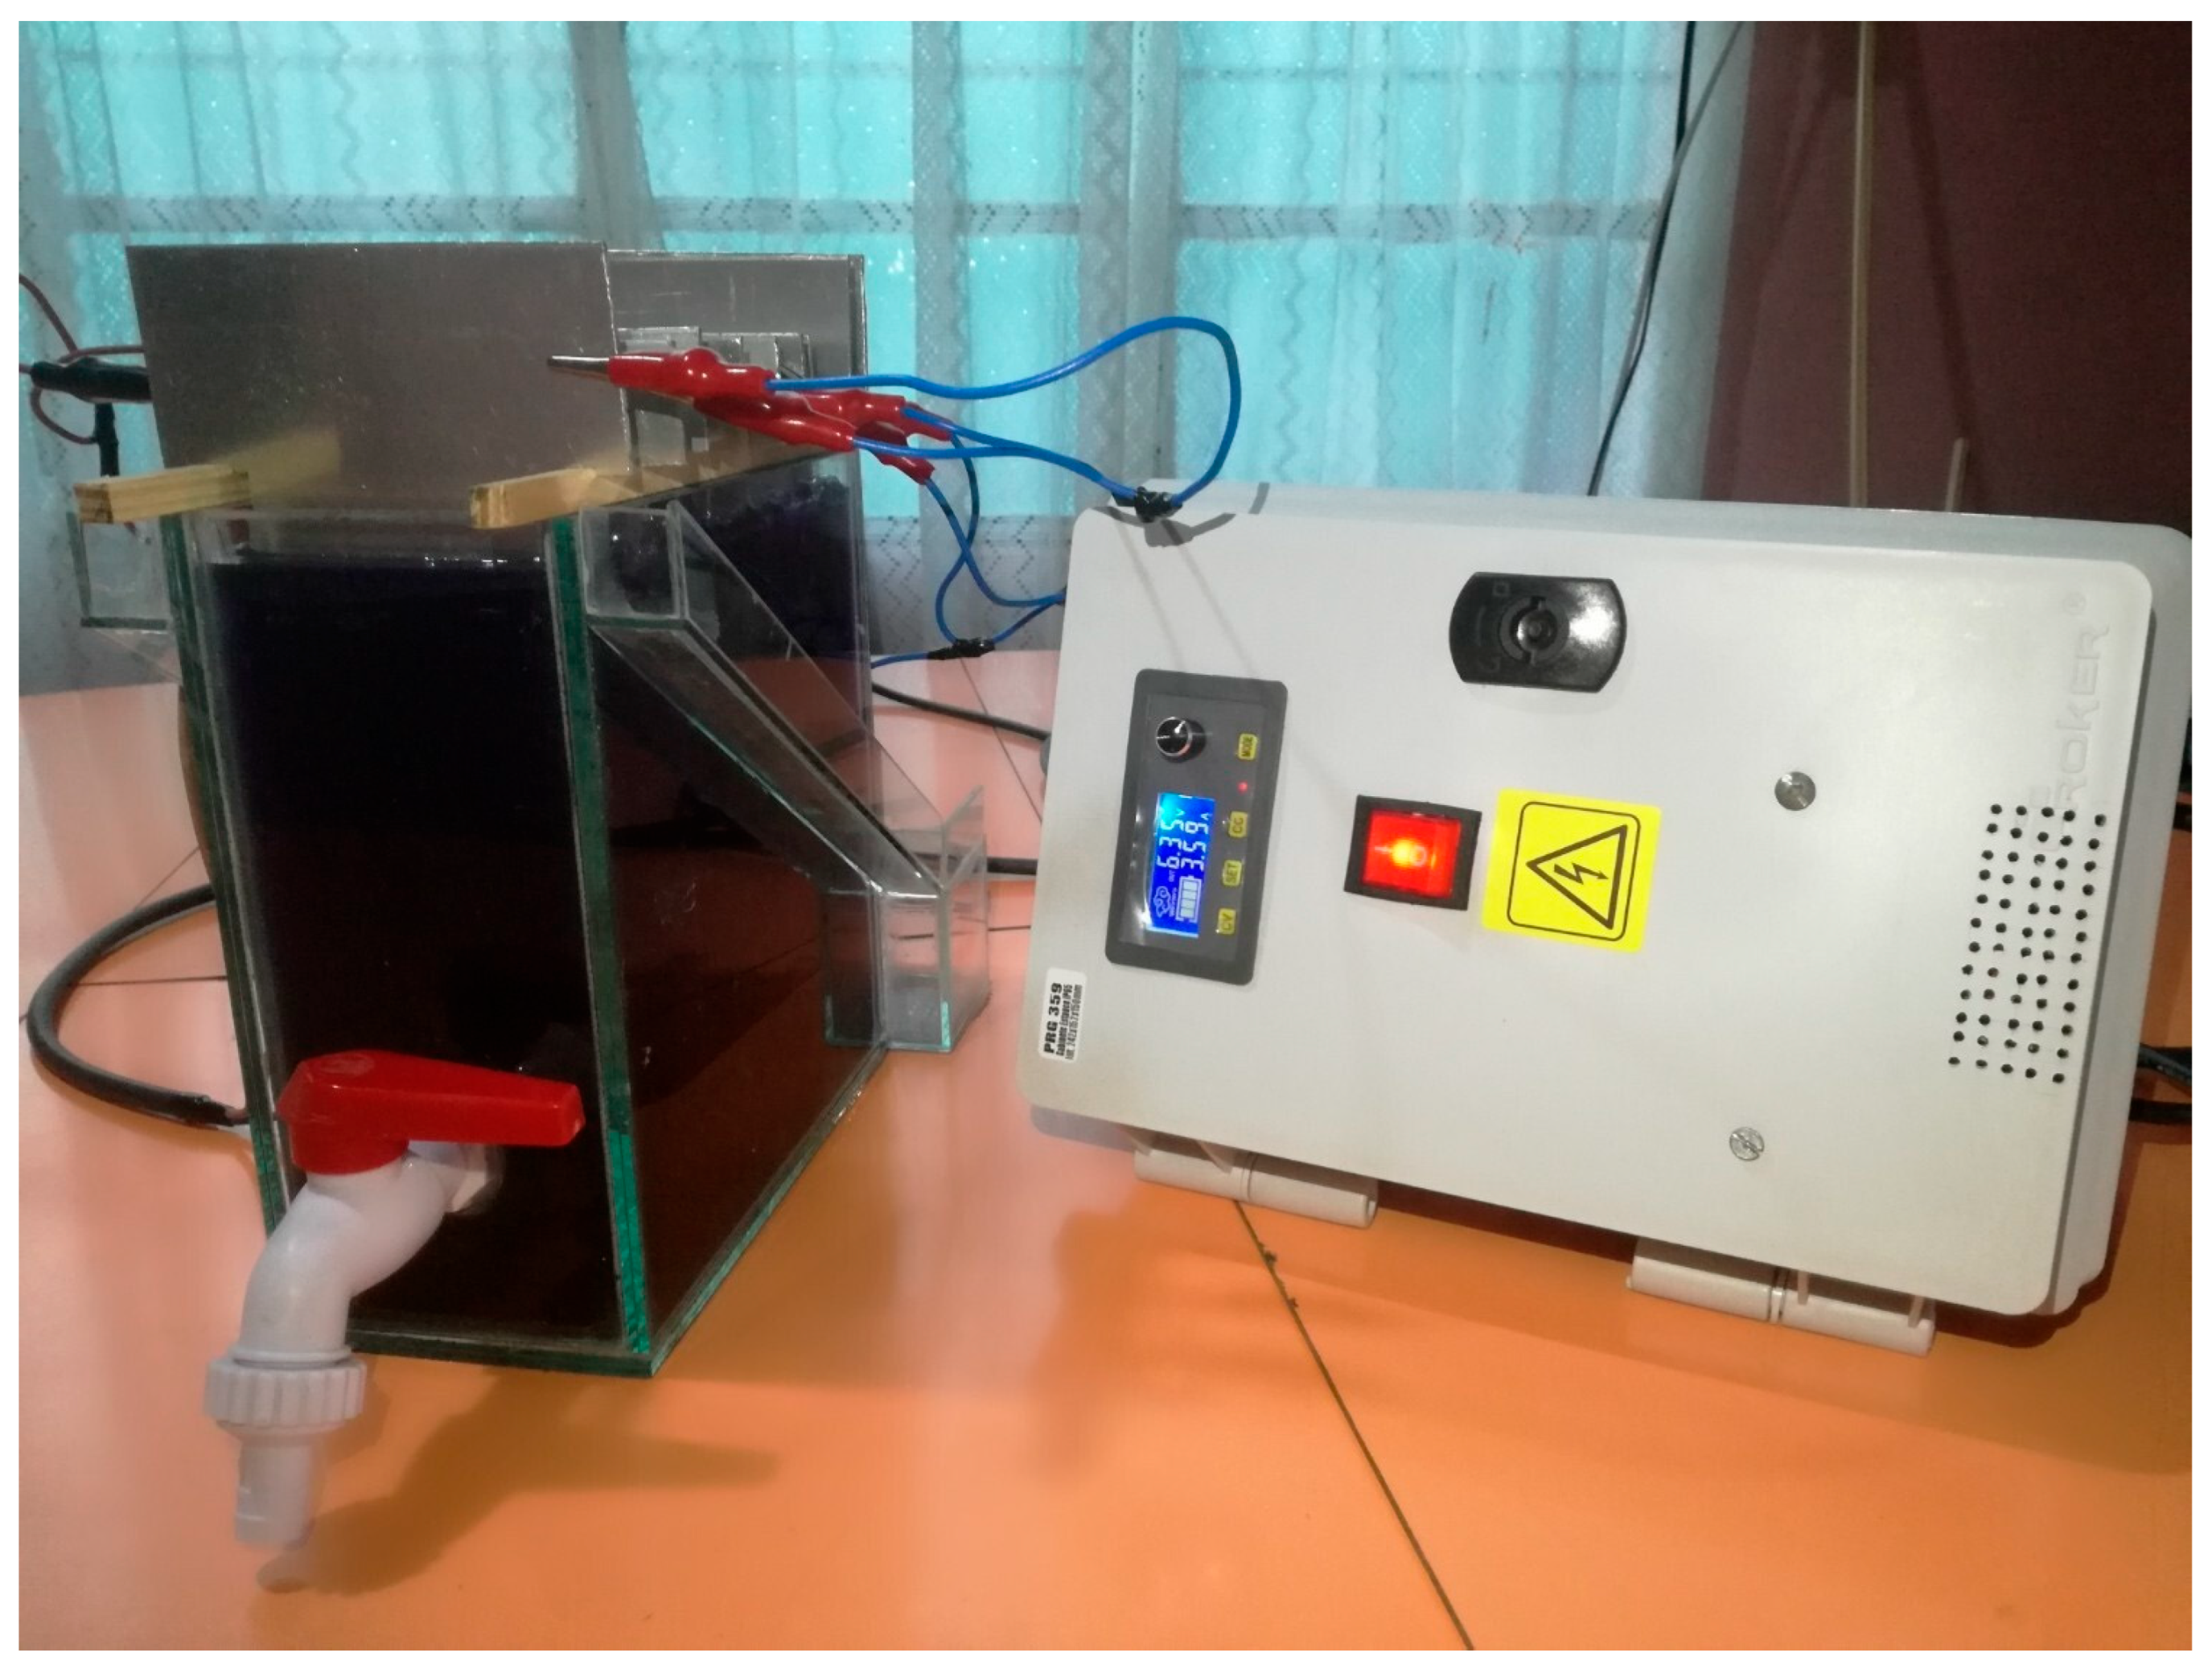
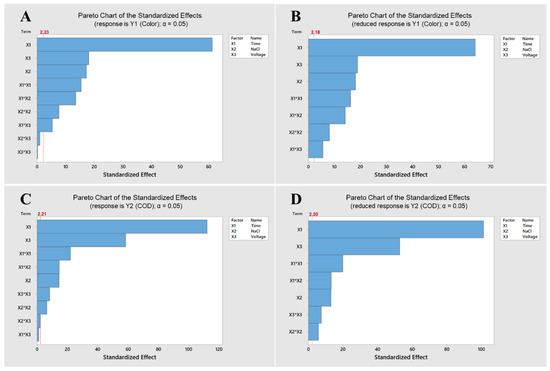
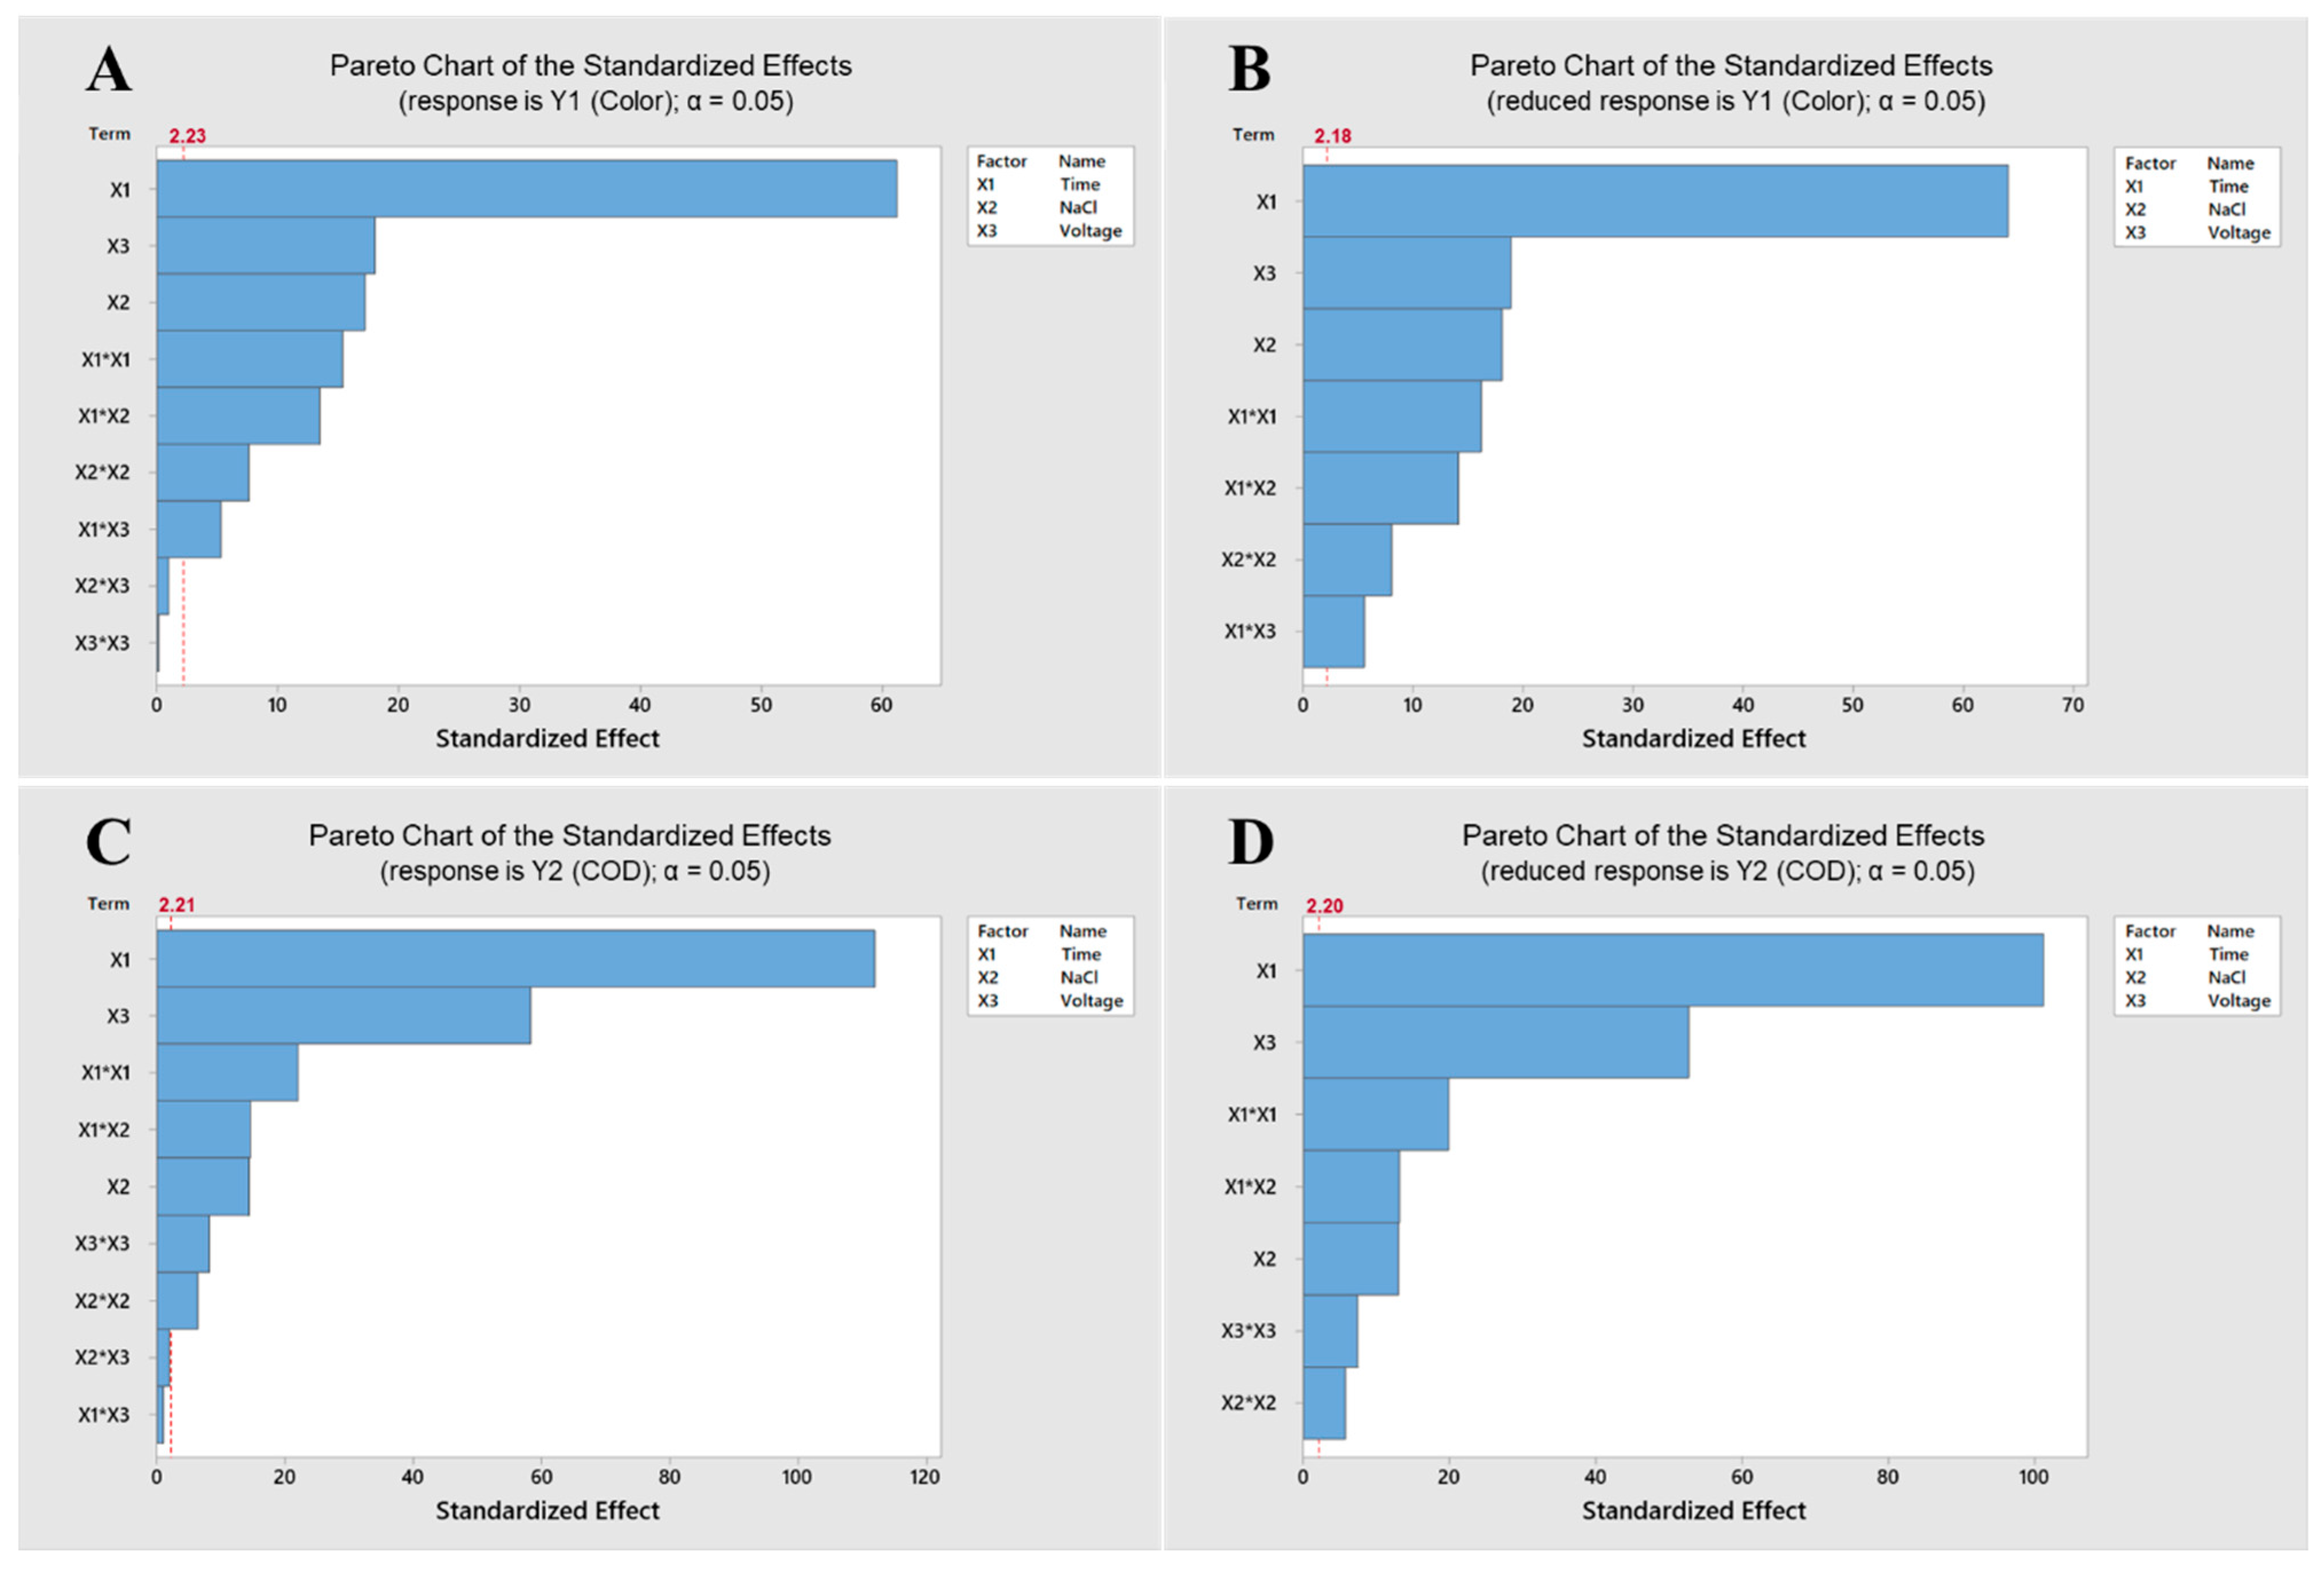
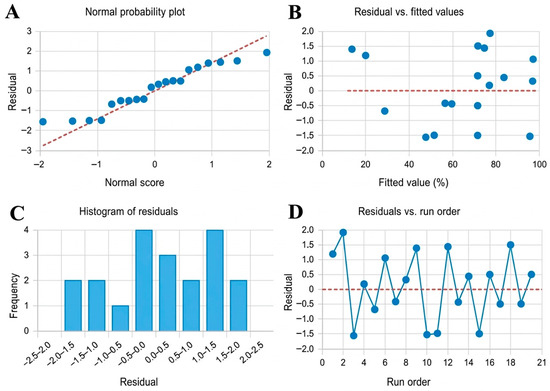
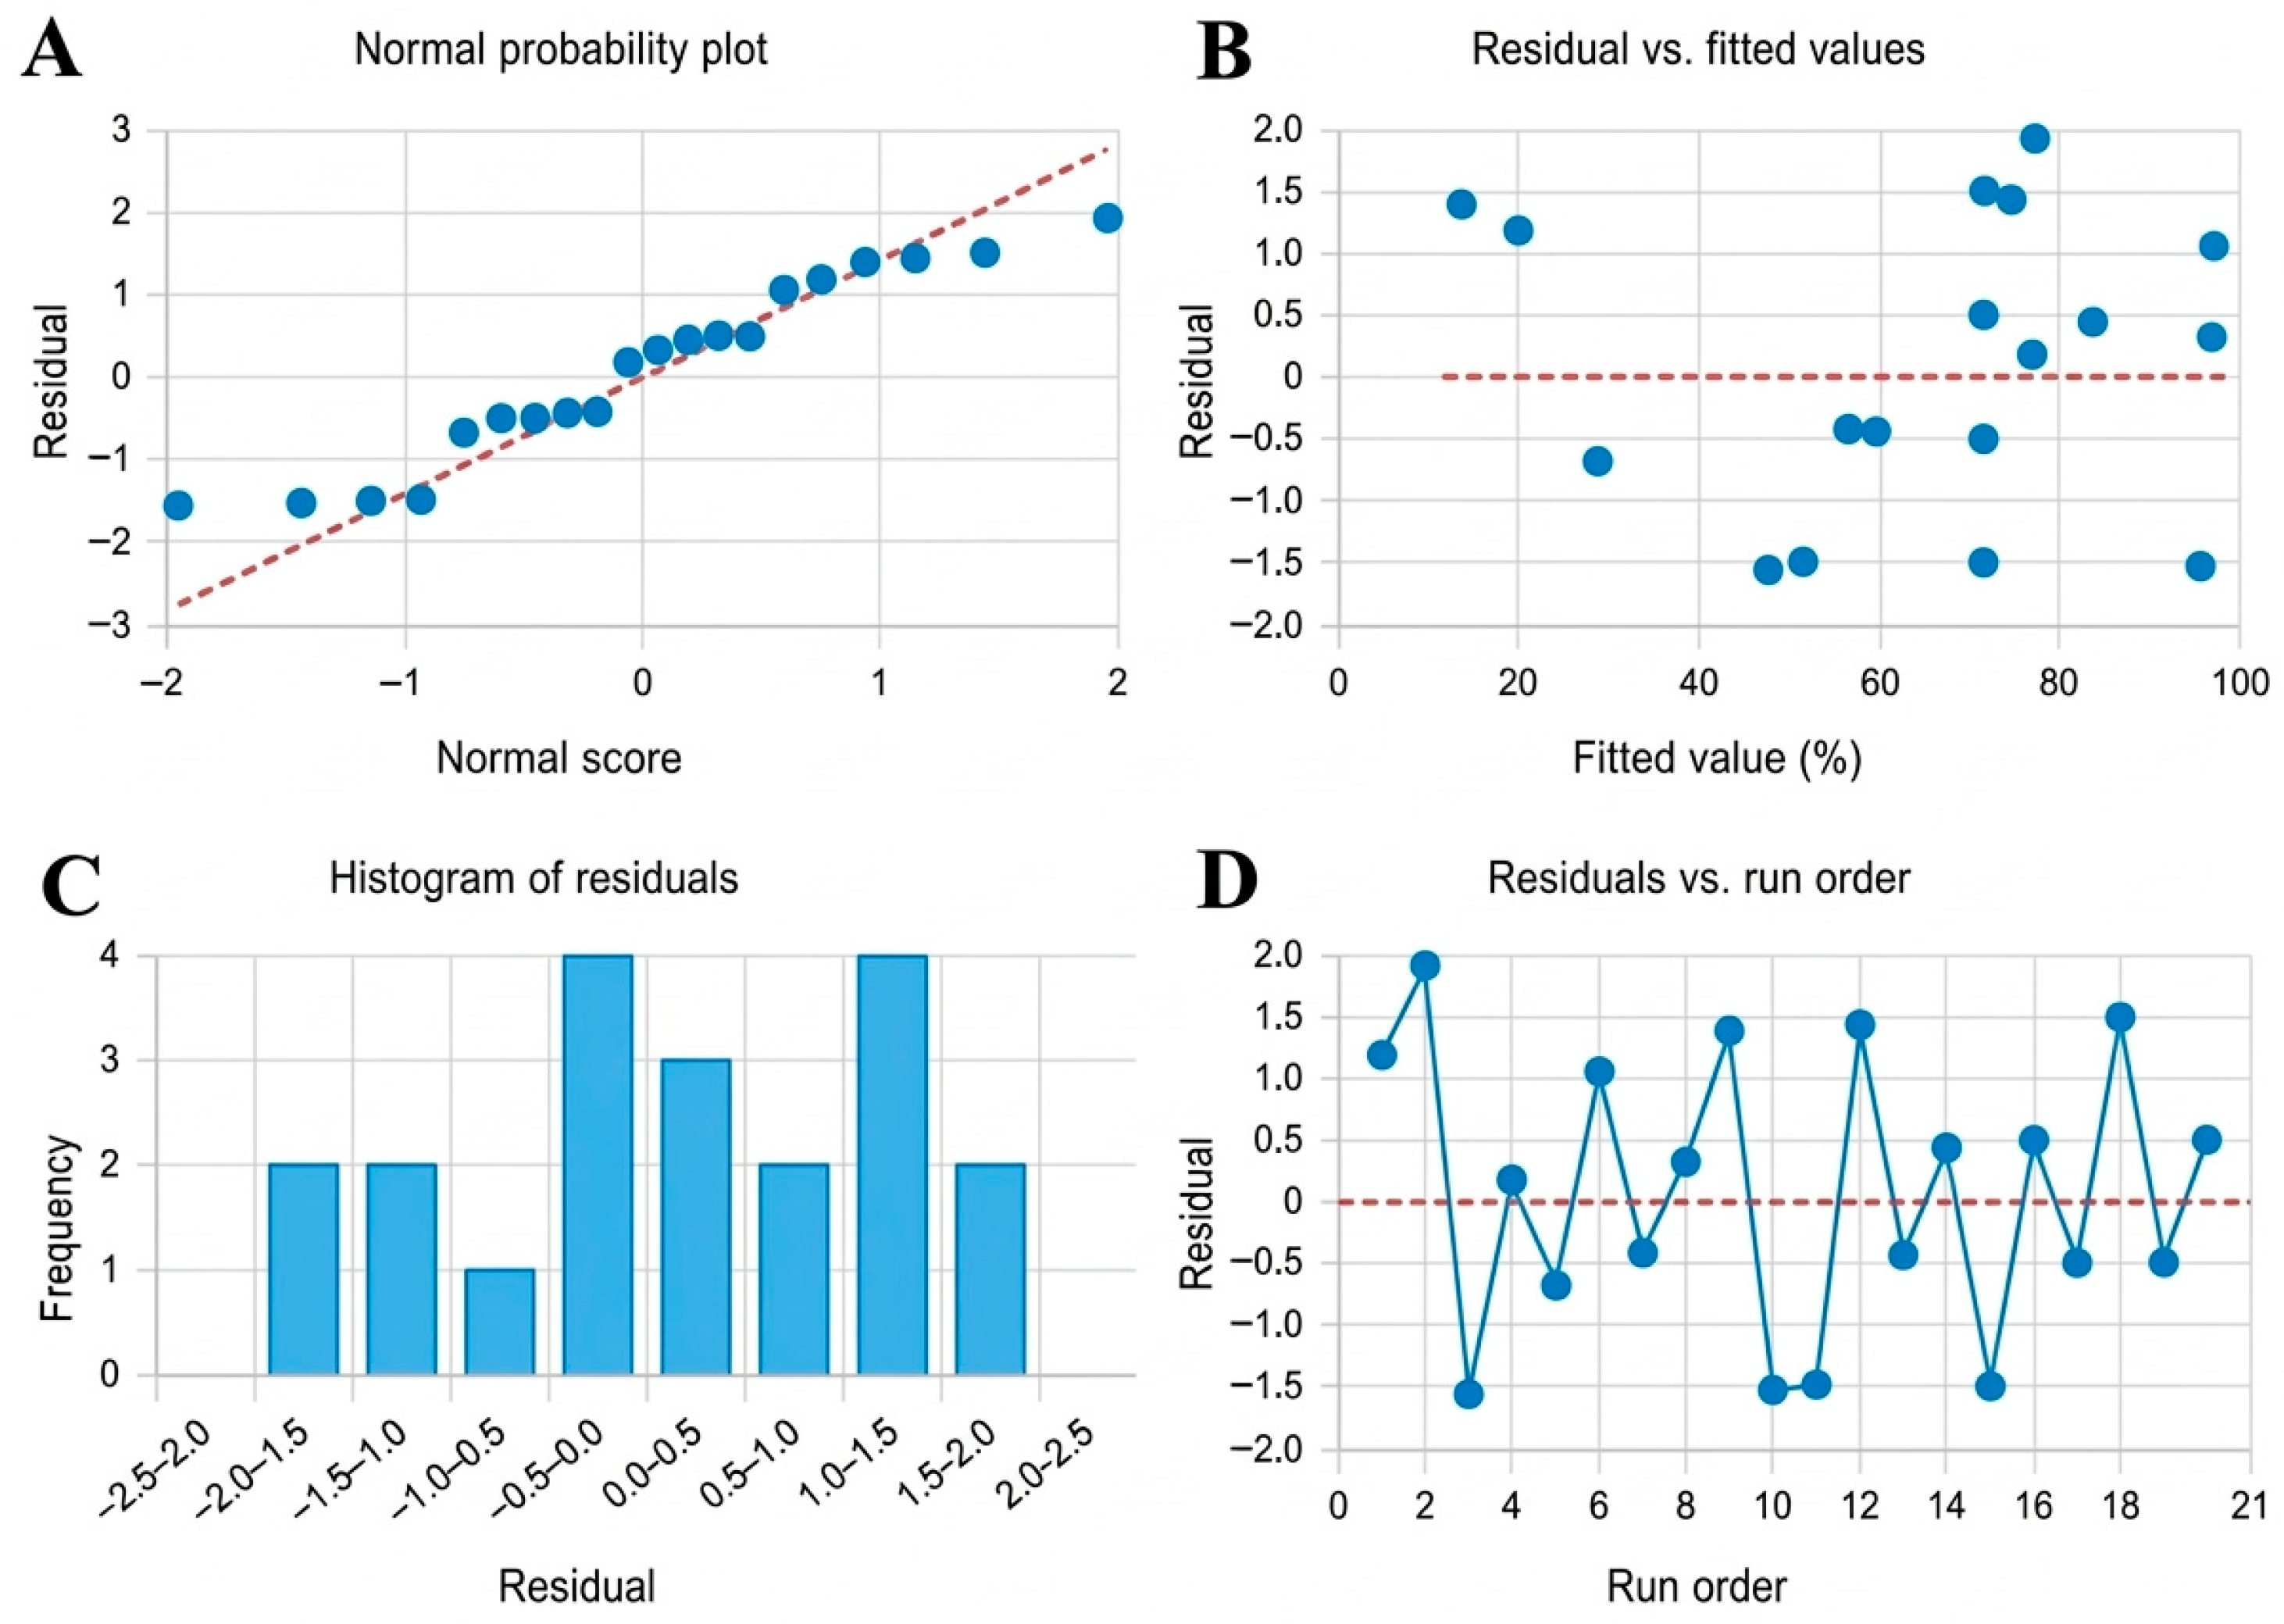
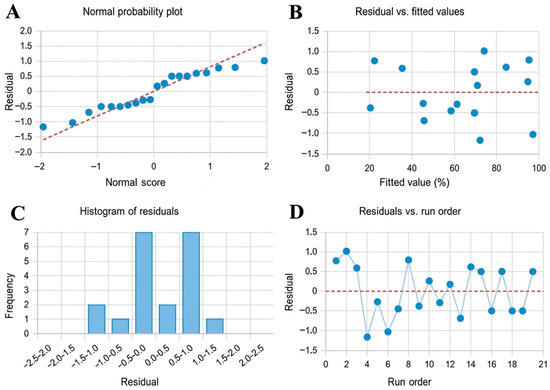
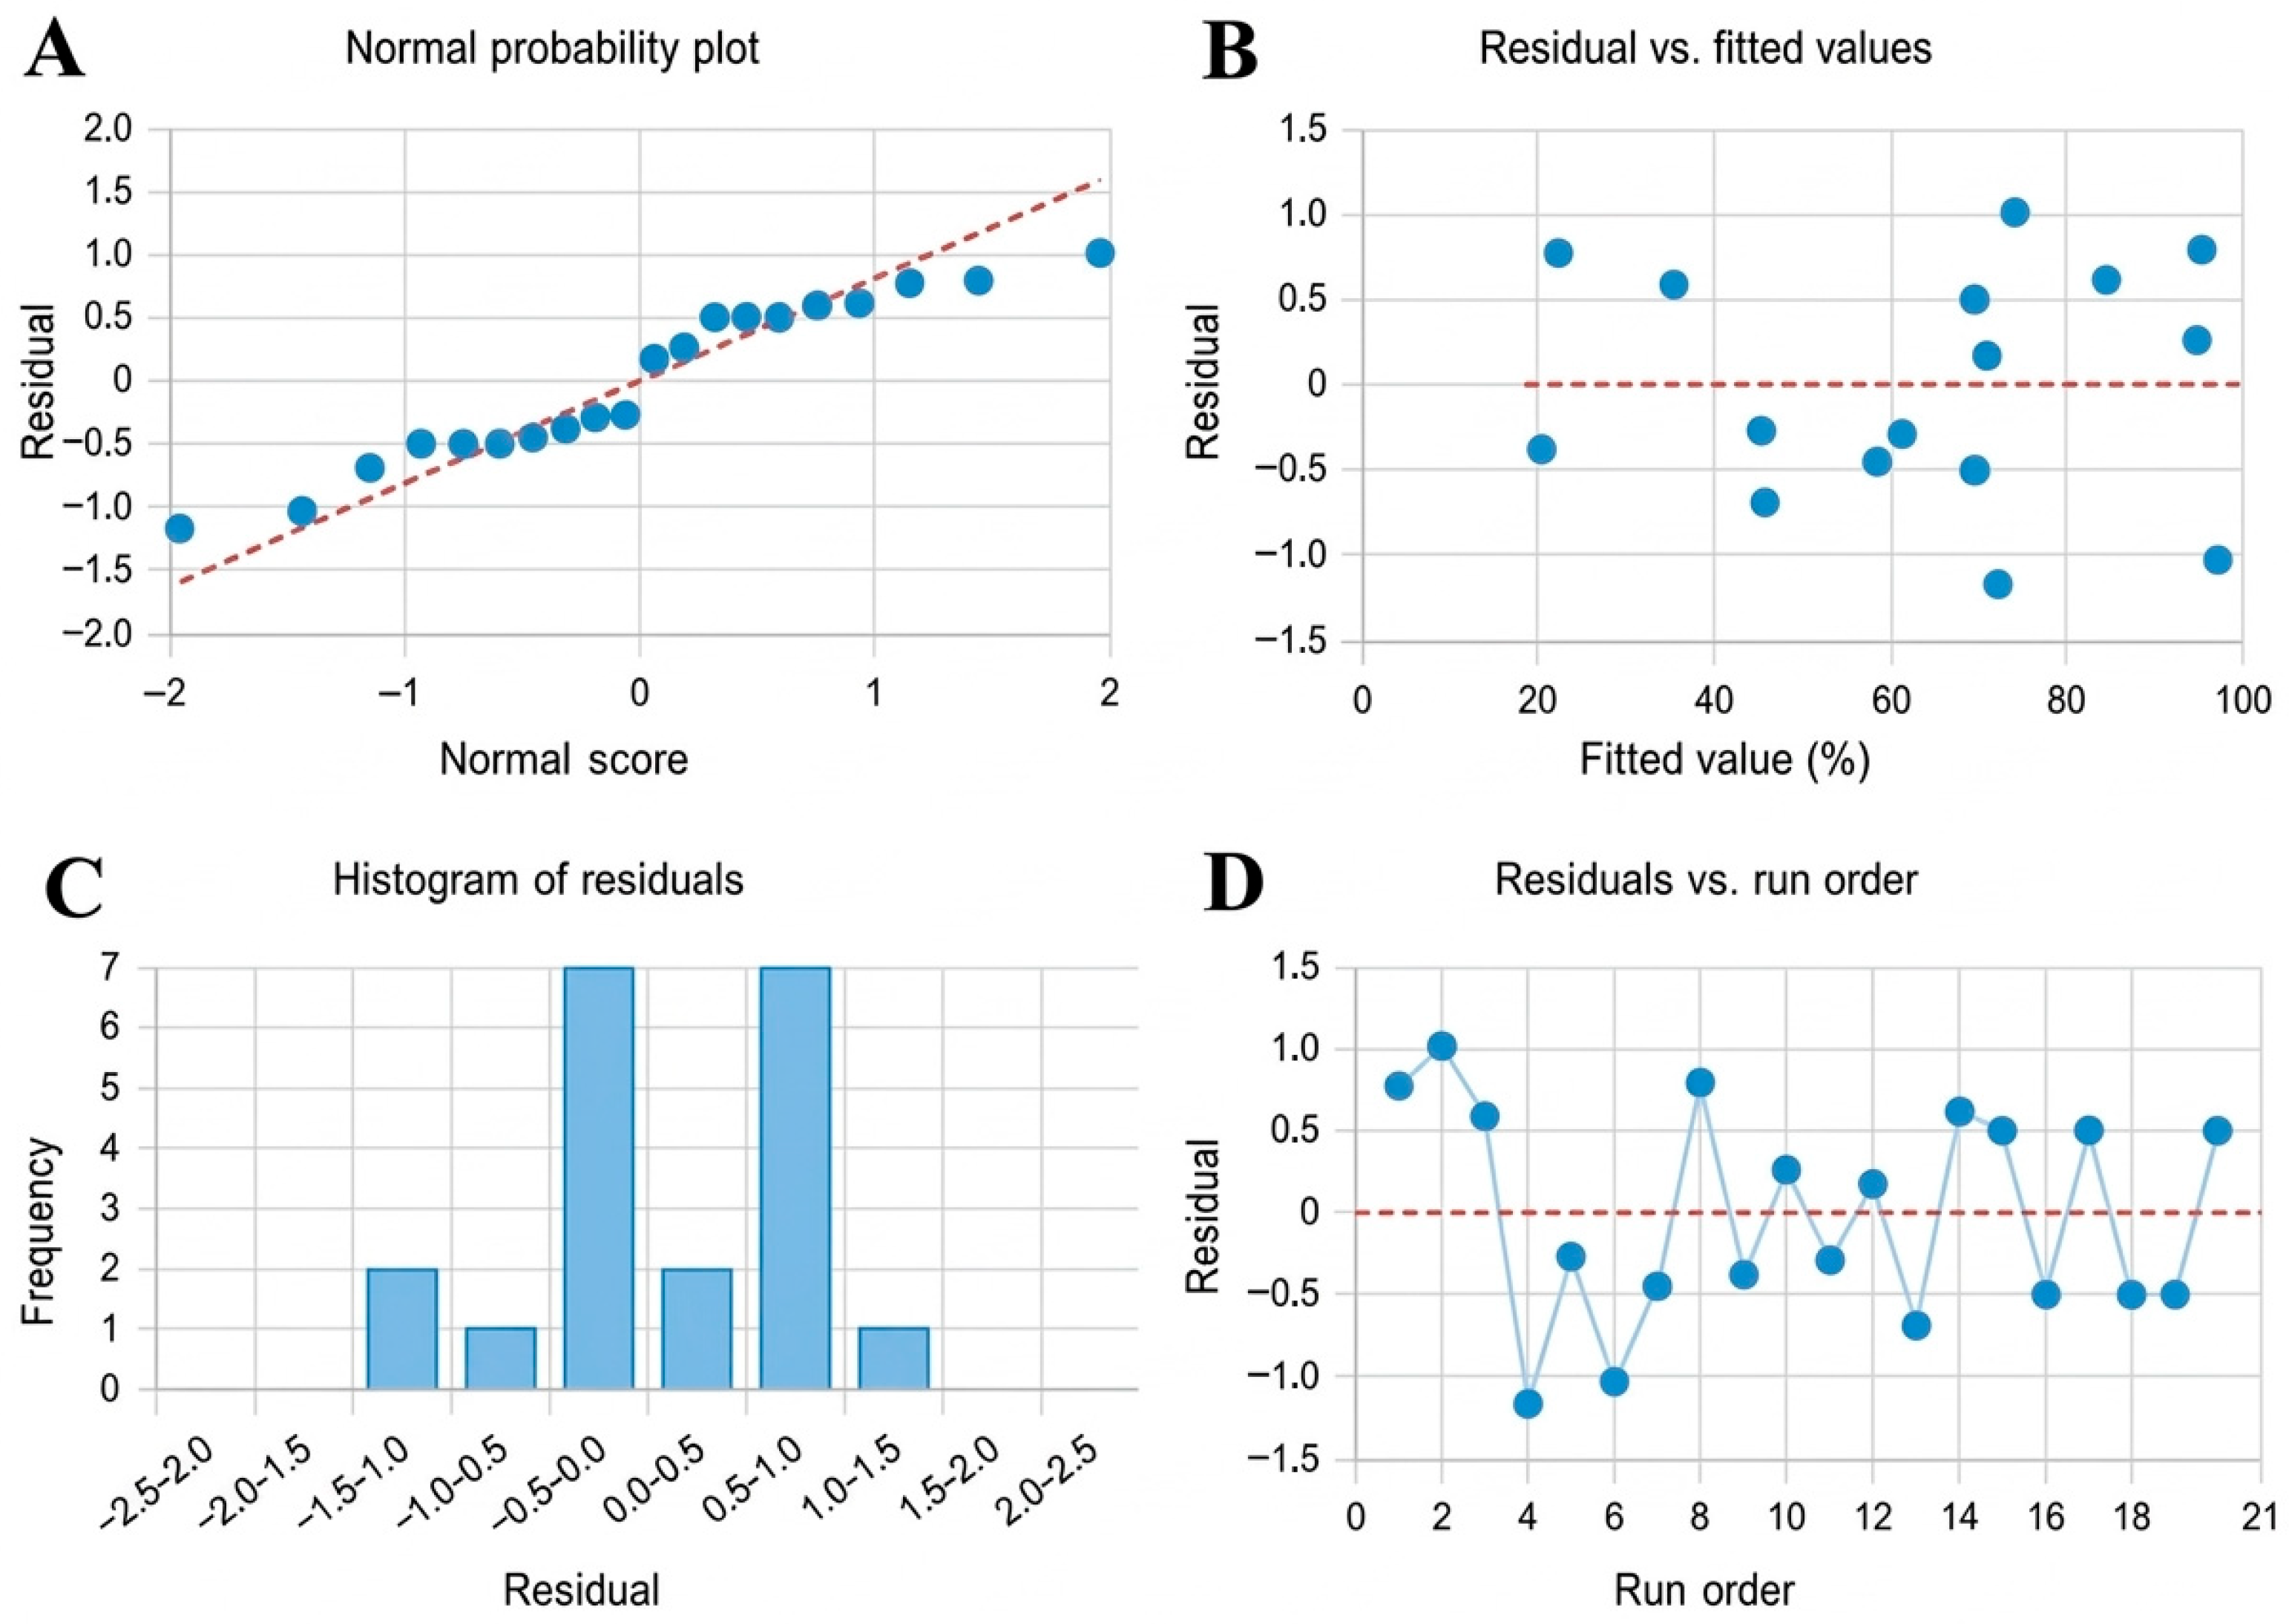
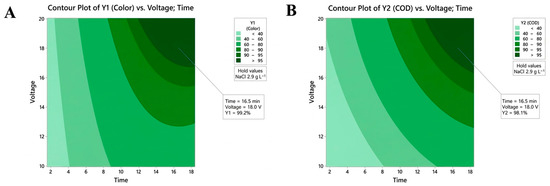
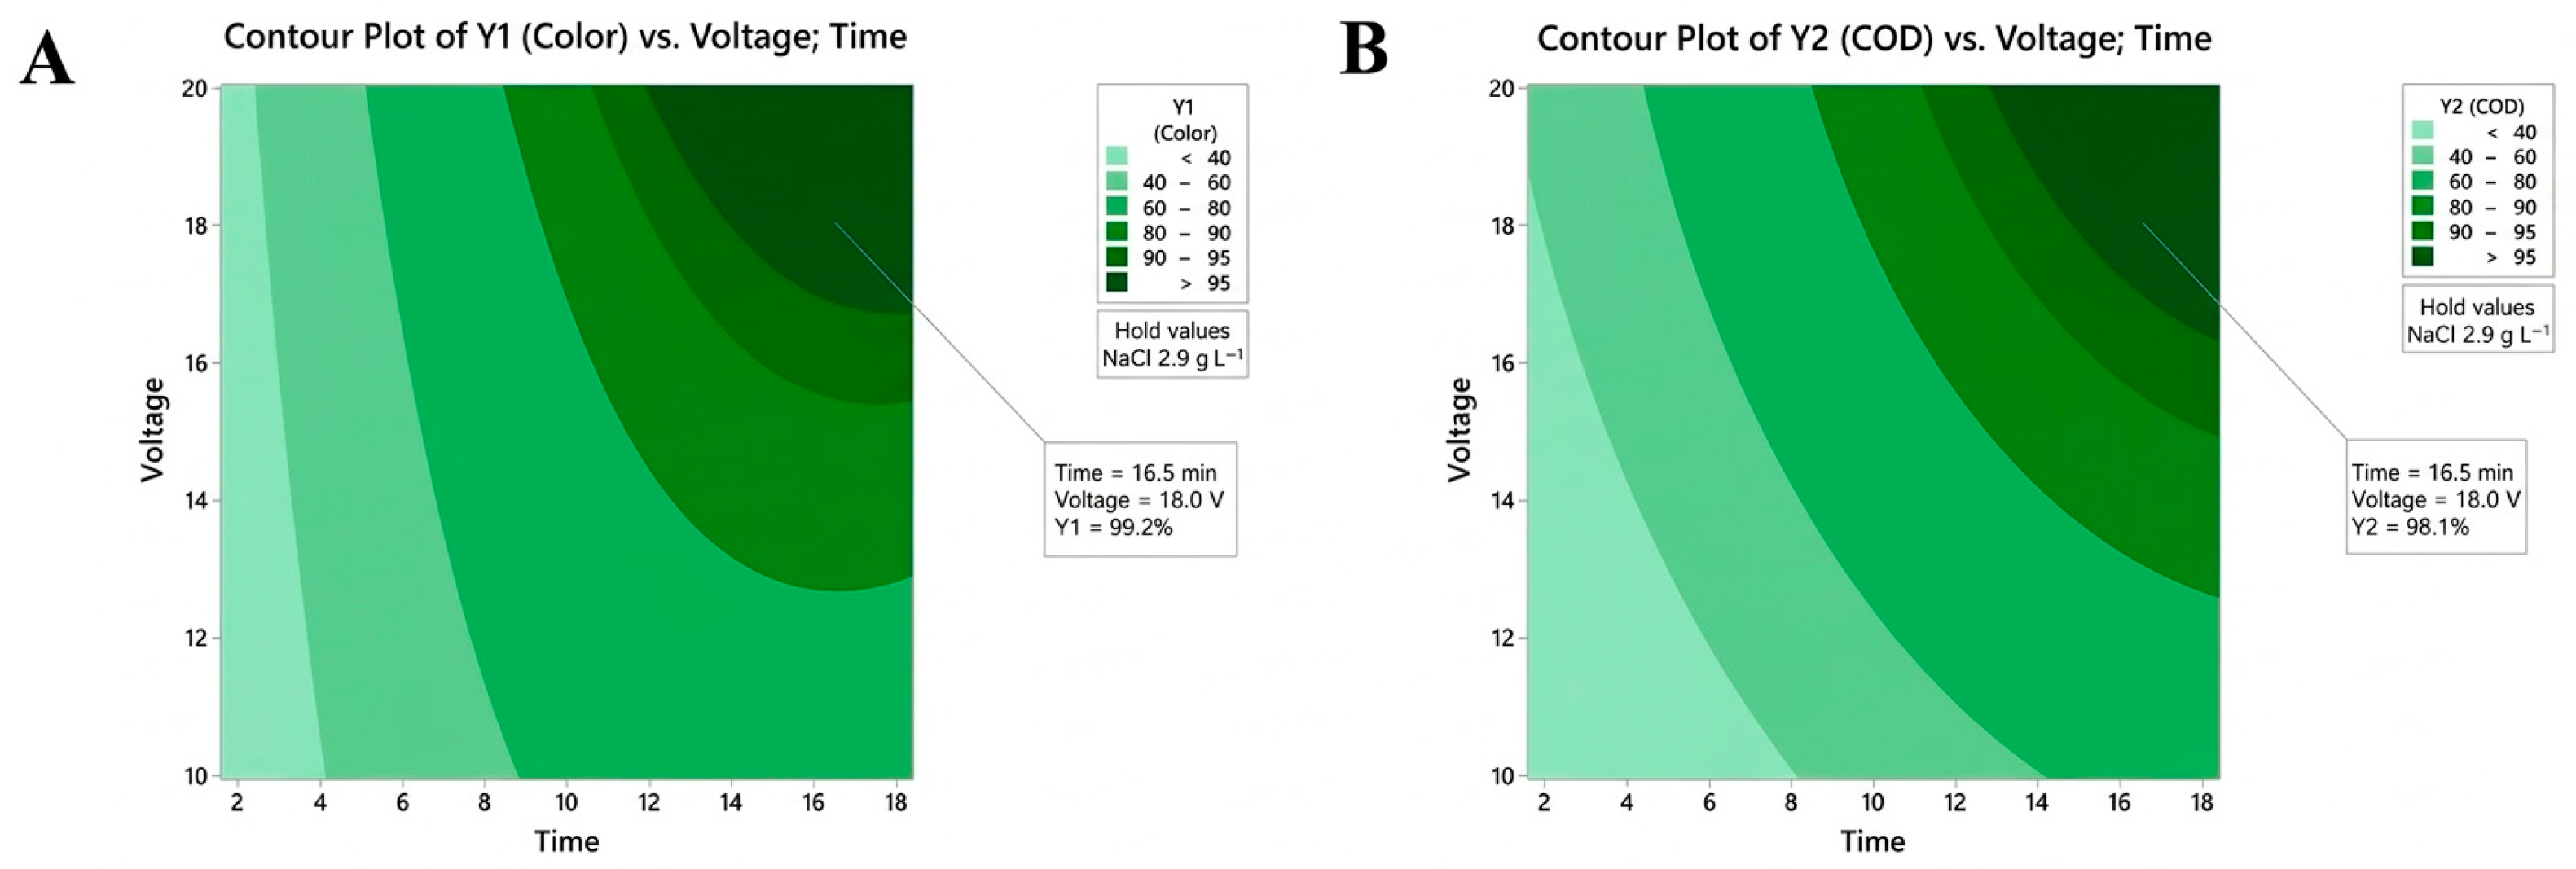
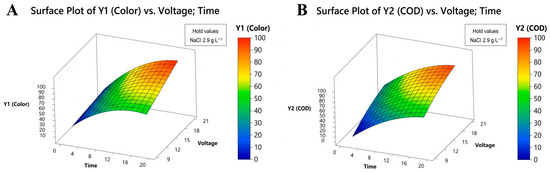
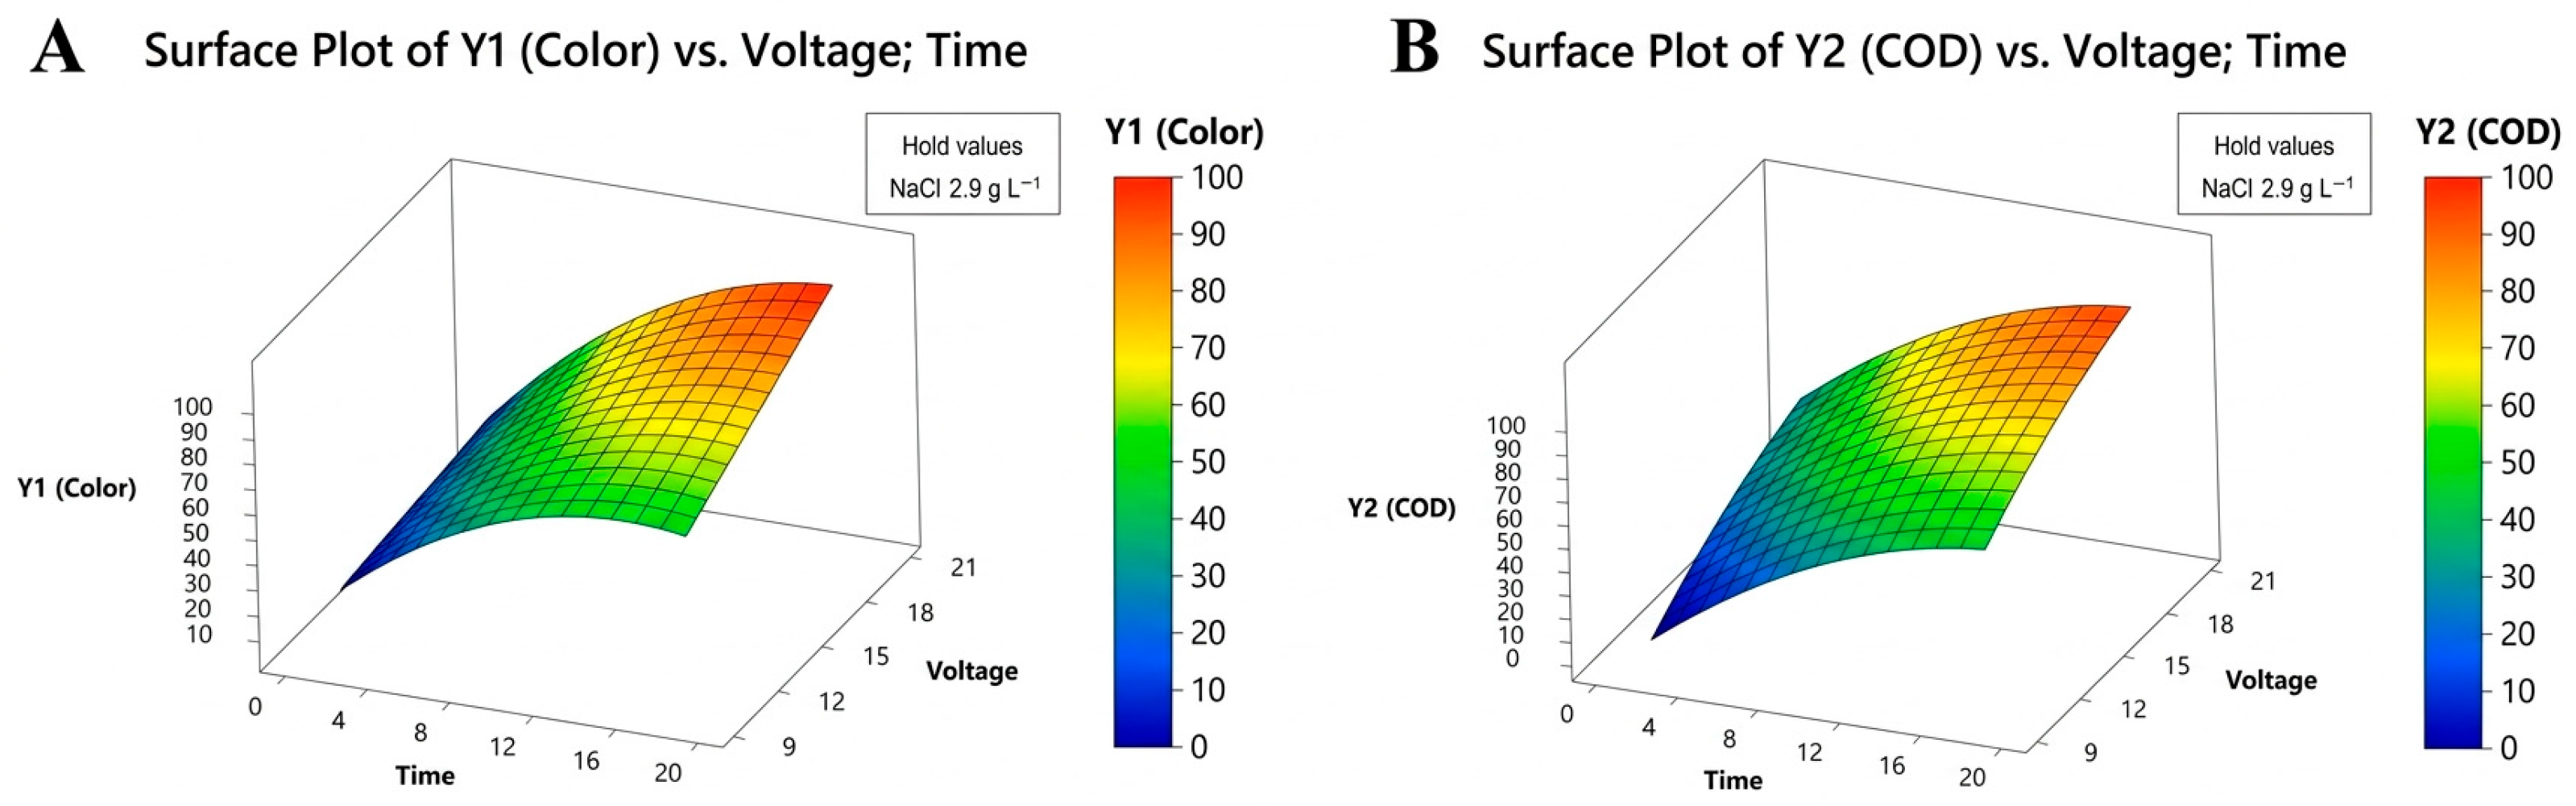

Disclaimer/Publisher’s Note: The statements, opinions and data contained in all publications are solely those of the individual author(s) and contributor(s) and not of MDPI and/or the editor(s). MDPI and/or the editor(s) disclaim responsibility for any injury to people or property resulting from any ideas, methods, instructions or products referred to in the content. |
© 2026 by the authors. Licensee MDPI, Basel, Switzerland. This article is an open access article distributed under the terms and conditions of the Creative Commons Attribution (CC BY) license.