


Abstract
To address the tendency of the traditional Children’s Drawing Development Optimization (CDDO) algorithm to fall into local optima and converge slowly in global optimization and fire-field robot path planning, this study proposes a Multi-Strategy Enhanced Children’s Drawing Development Optimization (MECDDO) algorithm. The algorithm achieves performance improvements through three core strategies: (1) an adaptive cooperative search strategy that integrates information from the global best, worst, and random individuals and guides updates via dynamic weighting, expanding the exploration of the solution space; (2) a multi-strategy adaptive selection mechanism that constructs a pool of four differentiated strategies and dynamically adjusts selection probabilities based on strategy success rates, balancing exploration and exploitation; and (3) a global-optimum guided boundary repair strategy that reduces the loss of high-quality information from out-of-bounds solutions, enhancing local exploitation efficiency. Experiments on the CEC2017 benchmark suite demonstrate that MECDDO achieves outstanding performance across 30-, 50-, and 100-dimensional spaces. Statistical significance was evaluated using the Friedman test and Wilcoxon signed-rank test at a 0.05 significance level. The Friedman test mean rankings (M.R.) are 1.63, 2.20, and 2.70, respectively, consistently outperforming traditional CDDO (M.R. = 9.83, 9.93, 9.73, ranked 10th). Applied to mobile robot path planning, MECDDO achieves an average path length of 27.95483 in 20 × 20 grid environments (rank 1), shortening paths by 8.83% compared with CDDO (30.66212, rank 10), and 61.15516 in 40 × 40 grids (rank 1), reducing paths by 37.19% versus CDDO (97.20336, rank 9), providing trajectories free of redundant turns and convergence speeds 2–3 times faster than competing algorithms. These results validate MECDDO’s significant advantages in numerical optimization accuracy and practical robot path planning.
1. Introduction
Against the backdrop of rapid advancements in artificial intelligence and automation technologies, global optimization algorithms have emerged as core tools for addressing complex engineering problems. They have been widely applied in fields such as mobile robot path planning [1,2], industrial parameter scheduling [3], and UAV trajectory optimization [4,5]. The central challenge of these problems lies in the fact that their solution spaces are often characterized by high dimensionality, multimodality, and strong constraints. Traditional optimization methods, such as gradient descent, are prone to being influenced by initial values and may become trapped in local optima. Although heuristic algorithms can explore a broader solution space through random search, they commonly suffer from slow convergence and an imbalance between exploration and exploitation [6,7,8]. This issue is particularly critical in emergency scenarios, such as fire-field robot path planning, where algorithms are required not only to rapidly generate feasible, collision-free, and short trajectories but also to ensure trajectory smoothness to reduce robotic energy consumption and motion errors [9,10,11,12,13]. Such demands place higher requirements on the overall performance of optimization algorithms.
As a typical application scenario of global optimization algorithms, mobile robot path planning directly affects a robot’s operational efficiency and safety in complex environments. Current mainstream path planning algorithms can be categorized into traditional methods and intelligent optimization methods. Traditional methods, such as the A* algorithm [14,15,16] and Dijkstra algorithm, can quickly find feasible paths but exhibit poor adaptability to dynamic or densely obstructed environments and tend to generate redundant turning trajectories [17,18]. In contrast, intelligent optimization methods, such as particle swarm optimization and ant colony optimization, offer stronger environmental adaptability but suffer from slow convergence and insufficient trajectory smoothness [19,20,21,22]. Therefore, developing an optimization algorithm that simultaneously achieves high solution accuracy, fast convergence, and robust environmental adaptability is of significant importance for enhancing the performance of mobile robot path planning.
In recent years, numerous swarm intelligence optimization algorithms have been proposed to address various problems [23]. For example, Fu et al. introduced the Secretary Bird Optimization Algorithm (SBOA), inspired by the survival behaviors of secretary birds in nature, and applied it to 3D path planning for UAVs [24]. Tian-Lei Wang et al. developed a novel metaheuristic algorithm, the Cuckoo Catfish Optimizer (CCO), by simulating the searching, predation, and parasitic behaviors observed in cichlids [25]. Dler O. Hasan et al. integrated four major foraging strategies of griffon vultures in nature—following behavior, group foraging, independent search, and carrion inspection—to propose the Griffon Vulture Optimization Algorithm (GVOA) [26]. Inspired by the survival strategies of rabbits, including detour foraging and random hiding, the Artificial Rabbits Optimization (ARO) algorithm was developed [27]. The Chimpanzee Optimization Algorithm (ChOA) simulates four social behaviors of chimpanzees toward prey: attack, driving, interception, and pursuit [28]. Salah Kamel et al. proposed the Super Tornado Algorithm (STA), which draws inspiration from storm strategies such as spiral motion, tornado formation, and rapid currents, and is specifically designed to simulate the behavior of supercell thunderstorms [29]. Additionally, inspired by the Newton–Raphson method, the Newton–Raphson-based Optimizer (NRBO) employs two rules—the Newton–Raphson Search Rule (NRSR) and the Trap Avoidance Operator (TAO)—along with several matrix sets to further explore optimal solutions [30].
In addition, to address the limitations of basic algorithms in path planning, such as slow convergence and suboptimal path quality, Ran Zhang et al. proposed a UAV path planning algorithm based on an improved Harris Hawks Optimization (HHO), incorporating the Cauchy mutation strategy, adaptive weights, and sine–cosine strategies to enhance performance in complex three-dimensional (3D) flight environments [31]. Chao Zhang et al. developed a multi-strategy integrated wind-driven optimization (MEWDO) algorithm for robotic path planning, leveraging cubic spline interpolation, Chebyshev strategies, and a dimension-wise perturbation mutation approach [32]. Yaonan Dai et al. introduced a novel Whale Optimization Algorithm (NWOA) for mobile robot path planning by employing adaptive techniques and potential field factors [33]. Ruo-Bin Wang et al., aiming to find collision-free optimal motion paths in obstacle-laden environments, proposed an Adaptive Parallel Algorithm Optimization (APAOA) with a novel parallel communication strategy [34]. To overcome major challenges faced by traditional path planning algorithms in large-scale scenarios with high-density irregular obstacles—including low search efficiency, limited obstacle avoidance capability, and a tendency to get trapped in local optima—Yuchao Wang et al. proposed a hybrid path planning algorithm combining an improved Golden Jackal Optimization (MGJO) algorithm with an Improved Dynamic Window Approach (IDWA) [35]. Xuzhen Deng et al. addressed issues such as low population diversity, imbalance between exploration and exploitation, and low optimal solution accuracy in arithmetic optimization algorithms by proposing a Multi-Strategy Enhanced Arithmetic Optimization Algorithm (MSEAOA) for mobile robot path planning [36]. Dong Wu et al. developed a hybrid path planning algorithm that utilizes Adaptive Step Rapidly-exploring Random Tree-Connect (AS-RRT-Connect) to generate initial paths and reduce the search space, thereby providing more accurate pheromone distribution information for an improved Ant Colony Optimization (IACO) algorithm and significantly enhancing convergence speed [37].
The Child Drawing Development Optimization Algorithm (CDDO), a novel metaheuristic algorithm, was proposed by Abdulhameed et al. in 2022 [38]. It draws inspiration from the cognitive development process observed in children’s drawing learning and simulates five stages—doodling, development, application of the golden ratio, creativity cultivation, and pattern memorization—to iteratively update solutions. CDDO incorporates the Golden Ratio (GR) and Pattern Memory (PM) mechanisms, demonstrating certain distinct advantages in low-dimensional and simple optimization problems. For instance, in unimodal function optimization, it guides solutions toward high-quality regions through the golden ratio, achieving convergence accuracy superior to some traditional algorithms.
However, as problem complexity increases, inherent limitations of CDDO gradually emerge. Its search mechanism is primarily “enveloping” and overly reliant on the golden ratio for local guidance, lacking effective interaction among multiple individual sources within the population. This restricts exploration of the solution space and makes the algorithm prone to being trapped in local optima for multimodal or high-dimensional problems. Moreover, its fixed update strategy—combining the golden ratio with pattern memory—limits the algorithm’s ability to rapidly cover a broad solution space in the early stages, while hindering precise refinement of the optimal solution in later stages, thus disrupting the balance between exploration and exploitation. Additionally, boundary handling relies solely on simple truncation, which discards potentially valuable information in out-of-bound dimensions. This not only reduces population diversity but also significantly increases the risk of premature convergence in high-dimensional or strongly constrained scenarios [39,40]. These limitations considerably restrict the application of CDDO in complex engineering problems, such as robot path planning in high-density obstacle environments.
In this context, this study proposes a Multi-Strategy Enhanced Child Drawing Development Optimization Algorithm (MECDDO), which achieves performance breakthroughs through three core improvement strategies: (1) an adaptive collaborative search strategy that integrates multi-source information from the global best, worst, and random individuals; dynamic weighting coefficients are computed based on Euclidean distances to guide individuals toward high-quality regions and broaden solution space exploration; (2) a multi-strategy adaptive selection mechanism that constructs a strategy pool comprising four differentiated strategies, including collaborative search and differential evolution, and dynamically adjusts strategy selection probabilities according to their success rates, thereby achieving a dynamic balance between exploration and exploitation throughout the optimization process; (3) a global-best-guided boundary repair strategy that uses the position of the global best individual as a reference to intelligently bring out-of-bound solutions back into the feasible domain, preventing the loss of high-quality information and improving local exploitation efficiency.
Compared with learning-based or neuroevolutionary approaches [41], MECDDO avoids costly model training and large memory requirements, making it more suitable for high-dimensional or resource-constrained optimization tasks.
Although MECDDO follows the general paradigm of multi-strategy hybridization, its novelty lies in three fundamental aspects. First, unlike conventional ensemble or adaptive DE-based optimizers that rely solely on historical success rates, MECDDO introduces an adaptive cooperative search strategy that explicitly integrates global best, worst, and random individuals through distance-based dynamic weighting, enabling structured population-level information exchange. Second, the proposed multi-strategy selection mechanism unifies heterogeneous search behaviors (collaborative search and multiple DE variants) within a single probabilistic framework, allowing the algorithm to adaptively transition between exploration-dominated and exploitation-dominated phases. Third, the global-best-guided boundary repair strategy departs from traditional truncation or random repair schemes by preserving high-quality information near the feasibility boundaries. These mechanisms collectively differentiate MECDDO from existing adaptive DE or ensemble-based optimizers.
To validate the performance of MECDDO, this study conducted multi-dimensional experiments. First, using the CEC2017 and CEC2022 (20-dimensional) benchmark test suite—which includes 30 functions across four categories: unimodal, multimodal, hybrid, and composition—MECDDO was compared with nine mainstream algorithms, including GWO, HHO, WOA, and CDDO, in 30-, 50-, and 100-dimensional spaces. Its numerical optimization capability was evaluated through average fitness values, standard deviations, and the Friedman test. Second, two grid maps with complexities of 20 × 20 and 40 × 40 were constructed to assess MECDDO’s practical applicability in mobile robot path planning, using path length, smoothness, and convergence speed as evaluation metrics. The experimental results indicate that MECDDO significantly outperforms the comparative algorithms in terms of numerical optimization accuracy, stability, and practical path planning performance, providing an efficient solution for complex global optimization problems and engineering applications.
The structure of this paper is organized as follows: Section 2 provides a detailed introduction to the principles of the traditional CDDO algorithm and the three core improvement strategies of MECDDO; Section 3 validates the numerical optimization performance of MECDDO through experiments on the CEC2017 benchmark test suite; Section 4 applies MECDDO to mobile robot path planning and analyzes its performance in different grid environments; Section 5 summarizes the research findings, highlights current limitations, and outlines directions for future work.
2. Child Drawing Development Optimization and the Proposed MECDDO
2.1. Child Drawing Development Optimization (CDDO)
The Child Drawing Development Optimization (CDDO) algorithm is a novel metaheuristic inspired by children’s learning behaviors and cognitive development, leveraging the Golden Ratio to optimize the aesthetic aspects underlying children’s art [38].
- (1)
- First Stage (Doodling Stage)
The initial doodles created by children mainly consist of random marks. At this stage, children are primarily observing and exploring hand movements and pressure. Since children notice that straight motions produce lines while other hand movements generate curves, their actions involve both linear motions and random curved motions. Hand pressure is often inconsistent—either too high or too low—but in subsequent stages, it is refined through repeated attempts and consideration of multiple factors [38,39]:
In the formula above, represents the current solution, corresponding to a child’s drawing. and denote the lower and upper bounds of the th dimension, ensuring that each individual’s initial position is randomly distributed within the feasible space. is a random number in the range [0,1].
- (2)
- Second Stage (Development Stage)
Hand pressure is one of the factors used to assess a child’s performance. Appropriate hand pressure indicates a higher skill level; it also implies that the child has sufficient ability to complete the drawing with minimal pressure while accurately applying the Golden Ratio. First, a random hand pressure (RHP) is generated. RHP is a random number between the problem’s lower bound and upper bound and is used to evaluate the current solution’s hand pressure relative to the actual hand pressure (HP) [38,39].
- (3)
- Third Stage (Golden Ratio Stage)
At this stage, children begin applying the skills they have learned. They utilize feedback from past experiences, observe patterns in the actual image, attempt to assign meaning to their drawings, and create artworks through imitation, practice, and active experimentation. To model these behaviors, after evaluating the hand pressure (HP) to assess the child’s skill level, the current hand pressure is compared with the random hand pressure (RHP). If the current HP is less than RHP, the solution is updated using Equation (3), while taking into account the child’s Skill Rate (SR) and Level Rate (LR). SR and LR are initially random numbers between 0 and 1; if the child’s hand pressure is appropriate, they are later adjusted to values between 0.6 and 1. Setting SR and LR to higher values (0.6–1) indicates that the child possesses relatively accurate knowledge and skill, which can be further enhanced by considering the Golden Ratio (GR) factor. Another factor used to update the solution and improve its performance is the Golden Ratio (GR), defined as the ratio between two selected features of the solution (i.e., the length and width of the child’s drawing) as shown in Equation (5). Each of these two features is randomly selected from all problem factors using Equation (5) [38,39].
where represents the child’s best artwork to date, i.e., the local optimum, while represents the global optimum observed in the child’s environment. The Golden Ratio (GR) is the ratio between the length and width of the child’s drawing.
- (4)
- Fourth Stage (Creativity Stage)
Each child possesses creativity and skills gained through experience and observation, which are key to enhancing the visual appeal of their artwork. During this stage, children integrate information and tend to adopt solutions that conform to or approximate the Golden Ratio. However, if a solution aligns with the Golden Ratio but performs poorly in practice, it indicates that the child’s skill is not yet fully developed and requires further refinement through creativity and application of the Golden Ratio. Children remember the best learning methods and imitate these processes to optimize outcomes. To model this process, the algorithm establishes a Pattern Memory (PM) for each solution, whose size can be adjusted according to the problem. Solutions are randomly selected from PM to update underperforming solutions, which helps accelerate convergence, akin to speeding up a child’s learning process. The Creativity Rate (CR) and Pattern Memory (PM) are both incorporated in Equation (6) to update the current solution and guide it toward the optimum. CR is experimentally set to a fixed value of 0.1. The Skill Rate (SR) and Level Rate (LR) are set to lower values (0–0.5), indicating that the child’s knowledge and skills are still developing and can be further enhanced through CR and PM [38,39].
- (5)
- Fifth Stage (Pattern Memory Stage)
At this stage, children use their prior knowledge and skills to add details to their drawings, enhancing precision, and compare their work with all previously best artworks. In the algorithm, this behavior is simulated by randomly selecting one solution from the top ten best solutions to update the current solution that is “proportionally accurate but exhibits improper hand pressure,” focusing on improving detailed performance [38,39].
This process corresponds to the individual update mechanism of agents in the algorithm: if a better solution exists, the current solution is updated toward the global best solution. Furthermore, whenever a new global best solution is found during iterations, it is simultaneously incorporated into the Pattern Memory (PM).
2.2. Multi-Strategy Enhanced Child Drawing Development Optimization (MECDDO)
2.2.1. Adaptive Collaborative Search Strategy
The core inspiration of the traditional CDDO algorithm comes from children’s drawing learning behaviors, relying on the Golden Ratio (GR) and the Pattern Matrix (PM) to guide individual updates. However, it exhibits significant limitations in global exploration. On one hand, its search mechanism is primarily “enveloping” and overly dependent on a single golden ratio for local guidance, lacking effective information exchange among different individuals in the population. This restricts exploration of the solution space and makes it difficult to escape the initial search region. On the other hand, the random search mechanism of CDDO is relatively blind, and individual updates do not sufficiently exploit high-quality information from the population. Consequently, the algorithm performs poorly during the exploration phase and is prone to stagnation in local optima, failing to efficiently approach the global optimum.
To address these issues, this study introduces an adaptive collaborative search strategy, which strengthens global exploration by integrating multi-source information from the population to construct a guided update mechanism.
The core logic of this strategy is as follows: for each individual to be updated, the global best individual and the worst individual are first determined based on population fitness ranking. Meanwhile, two distinct random individuals and , different from the current individual, are selected to form a multi-dimensional information exchange system. To achieve adaptive guidance, weighting coefficients and are computed based on the Euclidean distances among these individuals [42]:
Here, reflects the contribution of the difference between the global best and worst individuals, while captures the diversity information among the random individuals. The sum of and equals 1, ensuring a reasonable weight distribution. Based on this weighting system, the individual update formula is:
The adaptive weighting mechanism can be interpreted as a multi-criteria decision process, where convergence guidance (global best–worst difference) and diversity preservation (random individual difference) represent two competing criteria. The worst individual provides directional contrast information, enhancing population diversity and preventing premature convergence by encouraging exploration away from poor regions. By dynamically adjusting their weights based on Euclidean distances, MECDDO balances exploitation and exploration in a principled manner.
By integrating multi-source individual information with adaptive weight guidance, this strategy effectively addresses the traditional CDDO’s weaknesses in exploration and insufficient information interaction. The dynamic adjustment of weights allows individuals to move toward the global optimum while maintaining population diversity, enhancing both the breadth and efficiency of exploration in the solution space and reducing the risk of local stagnation.
2.2.2. Multi-Strategy Adaptive Selection Mechanism
The traditional CDDO algorithm employs a single update strategy (Golden Ratio guidance + Pattern Matrix update), which suffers from inadequate strategy adaptability. On one hand, a single strategy cannot simultaneously meet the requirements of the entire optimization process: strong exploration is needed in the early stage to cover a broad solution space, but the traditional CDDO’s exploratory capability is limited; strong exploitation is required in the later stage to refine the optimal solution, yet its local search ability is weak, resulting in an imbalance between exploration and exploitation. On the other hand, a fixed strategy lacks dynamic adjustment capability and cannot adaptively switch update modes according to the population’s evolution state, reducing algorithm robustness and limiting adaptability across different types of optimization problems. To address these issues, this study proposes a multi-strategy adaptive selection mechanism, constructing a multi-dimensional strategy pool and enabling intelligent strategy selection through dynamic probability adjustment [43,44].
The core logic of this mechanism consists of two parts: strategy pool construction and adaptive selection.
- (1)
- Strategy Pool Construction
A strategy pool containing four differentiated update strategies is constructed to cover exploration, exploitation, and balanced needs:
- Strategy 1: Adaptive Collaborative + Standard CDDO Strategy
Combines the previously described multi-source collaborative update with the standard CDDO strategy, focusing on broadening the search range.
- Strategy 2 (DE/rand/1):
Classic differential evolution strategy, constructing a differential vector from three randomly selected distinct individuals to enhance population diversity. The update formula is [43,44]
where are distinct random individuals different from the current individual, is the scaling factor, and is the crossover probability.
- Strategy 3 (DE/current-to-best/1):
A differential strategy based on the current individual and the global best, emphasizing local exploitation:
By incorporating guidance from the global best individual, this strategy accelerates convergence toward high-quality regions.
- Strategy 4 (DE/rand-to-current/1):
A differential strategy balancing exploration and exploitation:
where is a random weight coefficient. By integrating information from random and current individuals, this strategy achieves dynamic balance between exploration and exploitation.
- (2)
- Adaptive Selection Mechanism
In each iteration, the “success count” of each strategy (i.e., the number of times a strategy improves an individual’s fitness) is recorded. The strategy selection probability is then calculated as
If none of the strategies succeed (i.e., ), equal probabilities are assigned to avoid stagnation. Individuals select a strategy via a roulette-wheel method: generate a random number , and select the sth strategy if .
This mechanism allows the algorithm to dynamically adjust strategy preference according to the optimization process: in early stages, exploration-oriented strategies (Strategy 1 and 2) have higher success probabilities, ensuring broad solution space coverage; in later stages, exploitation-oriented strategies (Strategy 3 and 4) gain advantage, accelerating refinement of the optimal solution. Through this adaptive adjustment, the mechanism effectively addresses the limitations of the traditional single-strategy CDDO, significantly improving robustness and adaptability across different optimization scenarios.
2.2.3. Global-Best Guided Boundary Repair Strategy
In the traditional CDDO algorithm, out-of-bound solutions are handled using a simple “truncation method,” which directly resets the out-of-bound dimension values to the corresponding boundary via max/min functions. This approach has significant limitations. On one hand, truncation discards potentially valuable information contained in the out-of-bound solutions, sharply reducing solution diversity. This is especially problematic in high-dimensional optimization, where it can cause the population to become trapped in local optima, increasing the risk of premature convergence. On the other hand, the single truncation mechanism lacks guidance toward high-quality regions of the solution space; repaired solutions tend to cluster near the boundary edges and fail to approach the core regions where the global optimum resides, resulting in low local exploitation efficiency and insufficient utilization of high-quality boundary-adjacent solutions [45,46].
To address these issues, this study proposes a Global-Best Guided Boundary Repair Strategy, which leverages the position of the global-best individual to intelligently guide out-of-bound solutions back into the feasible domain, ensuring both solution validity and local exploitation efficiency.
The core logic is as follows: for the jth dimension of individual , first check whether it exceeds the feasible domain (i.e., or , where and are the lower and upper bounds for the jth dimension). If an out-of-bound case exists, the jth dimension of the global-best individual is used as a reference. A random adjustment factor guides the out-of-bound solution toward a high-quality region within the feasible domain, ensuring that the repaired solution remains feasible while approaching the region near the global optimum. The specific repair formula is [47]
Compared with the traditional truncation method, this strategy has two key advantages: (1) by leveraging the global-best solution as guidance, it avoids blind discarding of out-of-bound information, giving repaired solutions greater optimization potential; (2) repaired solutions are distributed near high-quality regions, significantly improving local exploitation efficiency while maintaining population diversity through random adjustment factors. This improvement effectively addresses the rough boundary handling and low exploitation efficiency of the traditional CDDO, and in high-dimensional optimization problems, it can significantly enhance convergence accuracy and stability.
The MECDDO’s pseudocode is provided in Algorithm 1, and a flowchart illustrating the overall MECDDO framework and its key innovations is shown in Figure 1.
| Algorithm 1: the pseudo-code of the MECDDO |
| Input: N (population size), T (maximum iterations), dim (problem dimensions), lb (lower bound), ub (upper bound), F (scaling factor = 0.8), pCR (crossover probability = 0.95). Output: Xbest (global optimal solution). |
| 1: Begin 2: Initialize: the relevant parameters N, T, dim and initialize population X by Equation (1). 3: Compute fitness, set personal best Xilbest and global best Xigbest. 4: Calculate Golden Ratio Equations (3)–(5). 5: Initialize strategy pool parameters: F = 0.8, pCR = 0.95, p = [0.25, 0.25, 0.25, 0.25]. 6: while t < T do 7: Calculate random hand pressure RHP by Equation (2). 8: for i = 1:Np do 9: Select current strategy via roulette wheel and record pre-update state Xold and fitnessold. 10: Switch strategy 11: Case 1: Self-adaptive Collaborative Search Strategy 12: Determine Xbest, Xworst, randomly select Xr1 and Xr2 13: Calculate weights α1 and α2 by Equation (7). 14: Update by Equation (8). 15: Perform Global Best-guided Boundary Repair by Equation (13). 16: Case 2: DE/rand/1 Differential Strategy 17: Update by Equation (9). 18: Perform Global Best-guided Boundary Repair by Equation (13). 19: Case 3: DE/current-to-best/1 Differential Strategy 20: Update by Equation (10). 21: Perform Global Best-guided Boundary Repair by Equation (13). 22: Case 4: DE/rand-to-current/1 Differential Strategy 23: Update by Equation (11). 24: Perform Global Best-guided Boundary Repair by Equation (13). 25: end Switch 26: 27: Update and strategy success count . 28: else 29: restore the original state . 30: end if 31: end for 32: Update strategy probabilities adaptively by Equation (12). 22: 23: end while 24: return the best solution Xbest. 25: End |
Figure 1.
The flowchart illustrating the overall MECDDO framework.
2.3. Computational Complexity Analysis
The computational complexity of the proposed algorithm (MECDDO) is analyzed in terms of the population size , the maximum number of iterations , and the problem dimensionality . Similar to the original CDDO, the computational cost of the initialization phase is . During the iterative process, the adaptive cooperative search strategy requires the computation of Euclidean distances among four individuals, resulting in a time complexity of . The multi-strategy adaptive selection mechanism consists of strategy execution with a complexity of and the statistics of successful strategies with a complexity of ; when combined, its overall complexity remains .
The global-best-guided boundary repair strategy checks and corrects each dimension of every individual, and thus also incurs a computational cost of . Consequently, the overall time complexity of MECDDO is , which is consistent with that of the original CDDO and other mainstream meta-heuristic optimization algorithms in terms of asymptotic complexity.
Although additional operations such as distance calculation, strategy success counting, and roulette-wheel selection are introduced, leading to a slight increase in the constant factor compared with the original CDDO, these operations incur only limited constant overhead and do not alter the algorithm’s asymptotic complexity. This demonstrates that the proposed enhancement strategies effectively improve the optimization performance while maintaining computational efficiency.
3. Numerical Experiments
3.1. Competitor Algorithms and Parameters Setting
In this subsection, the proposed MECDDO algorithm is evaluated using the currently most challenging numerical optimization benchmark, CEC2017 [48], and its performance is compared with several advanced optimization methods. The comparative algorithms are selected based on three core criteria: (1) representativeness of mainstream metaheuristic categories (swarm intelligence, evolutionary computation, etc.), including Grey Wolf Optimizer (GWO) [49], Harris Hawks Optimization(HHO) [50], Whale Optimization Algorithm (WOA) [51]; (2) recency and state-of-the-art performance, such as Dung beetle optimization algorithm (DBO) [52], Birds of Prey-Based Optimization (BPBO) [53], Artificial Lemming Algorithm(ALA) [54], Snow Geese Algorithm (SGA) [55], Hannibal Barca optimizer (HBO) [56], and the original Child Drawing Development Optimization (CDDO) [38]. The parameter settings for these algorithms are summarized in Table 1.
Table 1.
Parameter settings of the compared algorithms.
All comparative algorithms are implemented in MATLAB 2022b and run on the same hardware platform to ensure fair comparison. Each algorithm is independently executed 30 times for each function (consistent with the sample size requirement for non-parametric statistical tests), and the average fitness, standard deviation, and runtime are recorded. The source codes of the comparative algorithms are obtained from the original authors’ official repositories or standardized implementations in the MATLAB Optimization Toolbox, ensuring consistency with the original papers’ parameter settings (Table 1).
3.2. Design and Result Analysis of Ablation Experiments
To evaluate the performance enhancement of the CDDO algorithm brought by the proposed improvement strategies—Adaptive Collaborative Search Strategy, Multi-Strategy Adaptive Selection Mechanism, and Global Best-Guided Boundary Repair Strategy—this study conducts an ablation experiment. By comparing the standard CDDO algorithm with its enhanced variants, each incorporating only one individual strategy (denoted as CDDO-S1, CDDO-S2, and CDDO-S3), the independent contribution of each strategy is assessed, along with the effect of the fully integrated MECDDO. The evaluation is performed using the CEC 2017 benchmark suite (dim = 30), with all experimental parameter settings consistent with those described earlier.
The convergence curves in Figure 2 demonstrate the optimization behavior of CDDO and its enhanced variants (CDDO-S1, CDDO-S2, CDDO-S3, and MECDDO) on the CEC2017 benchmark set. As shown in the figure, the standard CDDO exhibits a significantly slower convergence rate and becomes trapped in suboptimal regions at early iterations, indicating insufficient global exploration capability. In contrast, all three single-strategy variants achieve noticeable acceleration in convergence, confirming the independent effectiveness of each improvement mechanism. Among them, CDDO-S1 shows superior early-stage descent due to strengthened global guidance, while CDDO-S3 provides more pronounced late-stage refinement benefiting from enhanced local exploitation. The full version, MECDDO, consistently delivers the fastest convergence and lowest fitness curve throughout the entire iteration range, suggesting that combining multiple strategies enables the optimizer to maintain strong exploration in early iterations and transition smoothly into fine exploitation later. This validates that the synergy between adaptive collaborative search, multi-strategy switching, and global best-guided boundary repair greatly improves convergence efficiency and solution quality.
Figure 2.
Convergence behavior of enhanced CDDO variants using distinct improvement strategies.
Figure 3 presents the average ranking performance of the five algorithms across all benchmark functions. As shown in the figure, MECDDO achieves the best overall rank with an average score of 1.10, indicating that it consistently outperforms all other competitors. The single-strategy variants show noticeable but limited improvements: CDDO-S1 obtains an average rank of 3.23, CDDO-S2 scores 2.87, and CDDO-S3 ranks at 2.90. Although these values are substantially better than the standard CDDO (4.90), they remain inferior to the fully enhanced MECDDO (1.10), demonstrating that single-strategy enhancement can improve performance but is insufficient to fully address the limitations of the original optimizer.
Figure 3.
Comparative performance ranking of enhanced CDDO implementations across various improvement strategies.
In contrast, the standard CDDO obtains the worst average ranking of 4.90, confirming its weaker optimization capability and higher likelihood of premature convergence on complex benchmark functions. The clear performance gap between MECDDO and the other four implementations validates the effectiveness of the multi-strategy fusion framework, which enables MECDDO to maintain stronger global exploration in early iterations while achieving more refined exploitation in the later search stage. Therefore, the results in Figure 3 demonstrate that MECDDO delivers the most balanced and robust optimization performance among all tested algorithms.
3.3. Parameter Sensitivity Analysis
The key fixed parameters of MECDDO include the scaling factor and the crossover probability . To conduct sensitivity analysis, each parameter was independently adjusted within a reasonable range , while keeping the other parameters unchanged. Figure 4 illustrates the variations in the average ranking of MECDDO on the CEC2017 (30-dimensional) benchmark suite.
Figure 4.
Average ranking values of the MECDDO algorithm under different parameter values.
The scaling factor FFF directly affects the magnitude of the mutation vectors in differential evolution strategies and plays a critical role in balancing exploration and exploitation. As shown in Figure 3 (left), MECDDO achieves the best average ranking of 1.23 when F = 0.8, which is significantly superior to other settings. When , the average ranking is 2.10, yielding the second-best performance. In contrast, the average rankings decrease to 3.40 and 3.47 when and , respectively, indicating a clear performance degradation. The worst performance is observed at , with an average ranking of 4.80. These results suggest that excessively small values of (e.g., 0.2 and 0.4) lead to insufficient mutation strength, making it difficult for the algorithm to escape local optima and thereby limiting its exploration capability. Conversely, an overly large value of (e.g., 1.0) results in overly aggressive mutations, which may disrupt high-quality solutions within the population and reduce exploitation efficiency. The setting achieves an optimal balance between mutation amplitude and solution stability, maintaining population diversity for global exploration while effectively exploiting high-quality solution information for local refinement, thus yielding the best overall performance.
The crossover probability determines the probability of updating individual dimensions and influences the search precision in the solution space. As depicted in Figure 3 (right), MECDDO attains the best average ranking (2.00) at , which represents the optimal configuration. When and , the average rankings are 2.60 and 2.50, respectively, indicating performance close to the optimum. However, the ranking deteriorates to 3.03 at , while the worst performance is observed at , with an average ranking of 4.87. This trend indicates that excessively high or low crossover probabilities can adversely affect algorithm performance. Specifically, when , all dimensions are forced to undergo crossover, which may lead to the loss of critical information from high-quality solutions and thus degrade solution quality. In contrast, when , the crossover probability is insufficient, resulting in low update efficiency and difficulty in rapidly converging to promising regions. The setting provides an appropriate crossover intensity that effectively integrates useful information from different individuals while preserving the core characteristics of high-quality solutions, enabling a dynamic balance between exploring new regions and reinforcing superior solutions, and thereby achieving optimal stability and optimization accuracy.
In summary, the parameter sensitivity analysis demonstrates that the core parameters of MECDDO are both reasonable and robust. Within the examined ranges, the impact of parameter variations on algorithm performance is consistent with the general parameter tuning principles of differential evolution strategies. Moreover, the optimal parameter combination effectively supports the cooperative search behavior and dynamic strategy selection mechanisms of MECDDO, providing a reliable basis for parameter configuration in subsequent numerical experiments and practical engineering applications.
3.4. Population Diversity Analysis
Population diversity is a core factor influencing the global exploration capability and local exploitation efficiency of heuristic algorithms. It directly determines whether an algorithm can effectively escape local optima and steadily approach the global optimum. Therefore, conducting comparative experiments on the population diversity of MECDDO and the conventional CDDO can provide in-depth insights into the optimization mechanism of search behavior induced by the multi-strategy enhancement framework.
Figure 5 compares the population diversity distribution characteristics of MECDDO and the traditional CDDO on the CEC2017 benchmark functions, intuitively illustrating the optimization effect of the multi-strategy enhancement mechanism on population dynamics. As observed from the diversity curves across multiple test functions, the population diversity of conventional CDDO decreases rapidly in the early iterations and remains at a relatively low level in the later stages. This phenomenon reflects its inherent deficiency of premature individual convergence and insufficient information exchange during the search process, which constitutes the primary reason for its tendency to become trapped in local optima. In contrast, MECDDO consistently maintains a higher level of population diversity throughout the entire iterative process, with a noticeably slower decay rate. This advantage is particularly pronounced in high-dimensional and complex functions (e.g., F19 and F28), indicating that the adaptive cooperative search strategy effectively preserves population heterogeneity by integrating multi-source information from the global best, global worst, and randomly selected individuals, thereby ensuring sustained exploration of the solution space.
Figure 5.
Comparative analysis of swarm diversity distribution between MECDDO and CDDO methodologies.
Further analysis reveals that MECDDO enables rapid population dispersion in the early iterations, guaranteeing extensive coverage of the solution space, while gradually converging in the later stages without sacrificing an appropriate level of diversity, thus achieving a dynamic balance between exploration and exploitation. This behavior is closely associated with the regulatory role of the multi-strategy adaptive selection mechanism. Specifically, exploration-oriented strategies (such as adaptive cooperative search and DE/rand/1) are assigned higher selection probabilities in the early phase to promote population dispersion, whereas exploitation-oriented strategies (such as DE/current-to-best/1) dominate in the later phase, guiding the population toward high-quality regions while effectively preventing premature homogenization. By comparison, due to the lack of flexibility inherent in its single update strategy, CDDO either rapidly exhausts population diversity—leading to search stagnation—or remains overly dispersed, making it difficult to converge to the optimal solution. In contrast, MECDDO achieves precise regulation of population diversity, thereby establishing a solid population foundation for the simultaneous improvement of optimization accuracy and convergence speed.
3.5. Experimental Results and Analysis on CEC 2017 Benchmark
This section presents a comparative performance evaluation between the MECDDO method and mainstream benchmark algorithms using the CEC 2017 test suite. The benchmark comprises four distinct categories of mathematical functions: unimodal, multimodal, hybrid, and composition functions. Multimodal functions, characterized by multiple local optima, are primarily employed to assess an algorithm’s exploration capability. In contrast, unimodal functions possess only one global optimum and are mainly used to evaluate the effectiveness of its exploitation mechanism. Hybrid and composition functions feature complex landscapes designed to test an optimizer’s ability to escape deceptive local solutions.
To ensure the fairness of the experimental process and minimize the interference of random factors, all algorithms involved in the comparison adopt a consistent parameter configuration: the population size is fixed at 30, and the maximum number of iterations is set to 500. Each algorithm is independently executed 30 times in repeated experiments, with the average value (Ave) and standard deviation (Std) of the results recorded, and the optimal values are highlighted in bold. All experiments are conducted on a unified computing platform with the following environmental configuration: Windows 11 operating system, AMD Ryzen 7 7700X 4.5GHz processor, 32GB DDR5-6000 memory, NVIDIA GeForce RTX 4070 Ti graphics card, Western Digital SN850X 2TB NVMe solid-state drive, and MATLAB 2022b as the programming environment. Table 2, Table 3 and Table 4 present the numerical optimization results of MECDDO and nine comparative algorithms on the CEC 2017 test suite in 30-, 50-, and 100-dimensional search spaces, with convergence curves and box plots shown in Figure 3 and Figure 4, respectively. In the tables, bold values are used to indicate the best-performing result in that row or column.
Table 2.
Experimental results of CEC2017 (dim = 30).
Table 3.
Experimental results of CEC2017 (dim=50).
Table 4.
Experimental results of CEC2017 (dim=100).
Table 2 presents the performance of 10 algorithms on the 30-dimensional CEC2017 test set, spanning unimodal functions (F1–F7), multimodal functions (F8–F13), hybrid functions (F14–F20), and composition functions (F21–F30). MECDDO demonstrates significant precision advantages and stability across all categories. For unimodal functions, F1 (Sphere function), which is a typical function with a unique global optimum and no local extrema, primarily tests the algorithm’s local exploitation capability. The mean fitness value of MECDDO (7.6981 × 10³) is 7 orders of magnitude lower than that of traditional CDDO (3.6030 × 10¹⁰) and 3 orders of magnitude lower than that of the second-best algorithm ALA (2.8929 × 10⁶). Moreover, its standard deviation (8.4717 × 10³) is only 1/40,000 of that of CDDO (3.4076 × 10⁹), indicating its ability to accurately approach the global optimum with minimal result fluctuation in low-dimensional unimodal scenarios. For the multimodal function F9 (Rastrigin function), which contains numerous local extrema and demands strong exploration capability from algorithms, the mean fitness value of MECDDO (1.4105 × 10³) is 8 times lower than that of CDDO (1.1489 × 10⁴) and 6 times lower than that of HHO (8.5554 × 10³). Its standard deviation (8.8352 × 10²) is also lower than all competing algorithms, demonstrating its effectiveness in escaping local extrema traps through an adaptive collaborative search strategy. In hybrid and composition functions, MECDDO’s advantages are further highlighted. For F18 (Hybrid function 1), which combines complex characteristics of different function types, the mean fitness value of MECDDO (2.0689 × 10³) is 4 orders of magnitude lower than that of CDDO (2.1310 × 10⁷) and 2 orders of magnitude lower than that of BPBO (5.1167 × 10⁵). For the composition function F30 (Composition function 10), where the solution space involves multimodal and nonlinear superposition, traditional algorithms generally perform poorly. In contrast, the mean fitness value of MECDDO (6.7748 × 10³) is only 1/91,800 of that of CDDO (6.2241 × 10⁸), and its standard deviation (2.1549 × 10³) is significantly lower than algorithms such as WOA (7.6390 × 10⁷) and GWO (6.5886 × 10⁶). These results fully validate MECDDO’s ability to balance exploration and exploitation in complex solution spaces.
The 50-dimensional test results in Table 3 show that as the dimensionality increases, most comparative algorithms exhibit significant performance degradation, while MECDDO maintains a stable advantage. In the unimodal function F4 (Schwefel 2.22 function), the average fitness of GWO increases from 6.3954 × 10² in 30 dimensions to 1.6522 × 10³ (a 1.58-fold increase), and WOA rises from 1.2910 × 10³ to 5.1401 × 10³ (a 3-fold increase). In contrast, MECDDO increases only from 4.8724 × 10² to 5.9977 × 10² (a 23% increase), and its standard deviation (4.1347 × 101) is just 1/37 of DBO (1.5255 × 10³), indicating stronger anti-degradation capability in local exploitation under medium-dimensional settings. The multimodal function F11 (Griewank function) imposes higher requirements on global exploration ability. CDDO’s average fitness increases from 6.2712 × 10³ to 2.0566 × 10⁴ (2.28-fold growth), and HHO rises from 1.6293 × 10³ to 3.1121 × 10³ (91% growth). However, MECDDO increases only from 1.2138 × 10³ to 1.3663 × 10³ (12.6% growth), and its standard deviation (9.2122 × 101) is just 1/30 of GWO (2.7705 × 10³), demonstrating that its multi-strategy adaptive selection mechanism can continuously and efficiently utilize population information in medium-dimensional scenarios, avoiding the decline in exploration efficiency. In the hybrid function F14 (Hybrid function 2), MECDDO’s average fitness increases only slightly from 1.5054 × 10³ (30D) to 1.7306 × 10³ (15% growth), while CDDO increases from 2.1453 × 10⁶ to 3.2584 × 10⁷ (14.2× growth), and SGA increases from 5.3941 × 10⁵ to 3.5832 × 10⁶ (5.6× growth). For the composition function F25 (Composition function 5), MECDDO achieves an average fitness of 3.0648 × 10³, which is 74% lower than CDDO (1.1977 × 10⁴), and its standard deviation (2.9872 × 101) is significantly lower than all comparative algorithms. These results further highlight MECDDO’s stability advantage in medium-dimensional complex optimization problems.
Table 4 presents the 100-dimensional test results, which serve as a critical benchmark for algorithmic performance. Most comparative algorithms experience a sharp decline in optimization accuracy due to the curse of dimensionality, while MECDDO achieves a performance breakthrough through the synergy of its three improvement strategies. For the unimodal function F2 (Rosenbrock function), which imposes extremely high requirements on local search accuracy, the average fitness of CDDO increases from 2.3889 × 1041 in 30 dimensions to 2.0662 × 10166 in 100 dimensions (an increase of 8.65 × 10124 times). WOA rises from 7.3693 × 1034 to 1.1553 × 10178 (an increase of 1.57 × 10143 times), whereas MECDDO increases from 2.6607 × 10¹⁹ to 1.1137 × 10119 (an increase of 4.19 × 1099 times) and is the only algorithm whose fitness does not exceed 10120 on this function. This confirms that its global-optimality-guided boundary repair mechanism effectively reduces the loss of high-quality information in high-dimensional spaces. In the multimodal function F11 (Griewank function), MECDDO achieves an average fitness of 2.3343 × 10⁴, which is 91.3% lower than CDDO (2.6994 × 10⁵) and 84.9% lower than HHO (1.5430 × 10⁵). Its standard deviation (1.1150 × 10⁴) is only one-ninth that of WOA (1.0129 × 10⁵), indicating that MECDDO can still efficiently explore the search space in high-dimensional multimodal environments. For the hybrid function F15 (Hybrid function 3), MECDDO’s average fitness increases from 1.8823 × 10³ (30-dimensional) to 1.8041 × 10⁴ (8.6× growth), while CDDO increases from 1.0125 × 10⁸ to 1.5005 × 10¹⁰ (147× increase) and DBO increases from 5.6060 × 10⁴ to 6.7565 × 10⁷ (1205× increase). In the composition function F30 (Composition function 10), MECDDO achieves an average fitness of 1.3492 × 10⁶, which is 99.995% lower than CDDO (3.0463 × 10¹⁰), and its standard deviation (2.0996 × 10⁶) is only 1/655 of GWO (1.3744 × 10⁹). These results fully demonstrate that MECDDO exhibits significantly superior global optimization capability in high-dimensional complex scenarios compared with conventional algorithms.
A horizontal comparison of Table 2 (30D), Table 3 (50D), and Table 4 (100D) shows that MECDDO exhibits a significantly lower performance degradation rate than the comparative algorithms, highlighting its dimensional adaptability advantage. For key test functions, in F1, the average fitness of MECDDO increases 481-fold from 30D to 100D, whereas CDDO, WOA, and GWO increase 658-fold, 505-fold, and 388-fold, respectively. In F9, MECDDO increases 41-fold, while CDDO, HHO, and SGA increase 3.4-fold, 8.1-fold, and 7.7-fold, respectively (although CDDO’s growth factor is smaller, its absolute values remain far higher than MECDDO’s). Regarding standard deviation, MECDDO maintains average values of 1.24 × 10³, 2.87 × 10⁴, and 1.12 × 10⁵ across the three dimensionalities, which are far lower than those of CDDO (1.21 × 10⁹, 6.27 × 10⁹, 3.47 × 10⁹) and WOA (1.69 × 10⁹, 5.27 × 10⁹, 1.12 × 10⁹). This indicates that MECDDO retains stable optimization consistency as dimensionality increases. Such robustness is attributed to the synergy of its three improvement strategies: adaptive cooperative search expands the high-dimensional search breadth, multi-strategy adaptive selection balances exploration and exploitation, and the global-optimality-guided boundary repair reduces the loss of high-quality information. Together, these mechanisms endow MECDDO with strong dimensional adaptability.
The convergence curves in Figure 6 provide an intuitive comparison of algorithmic convergence efficiency, showing that MECDDO consistently achieves faster convergence across all test functions. In the 30-dimensional F1 function, MECDDO approaches the optimal value within 100 iterations, whereas CDDO, GWO, WOA, and other algorithms remain in a slow-decreasing stage. In higher-dimensional spaces, MECDDO’s convergence advantage becomes even more pronounced: for the 100-dimensional F30 function, the fitness value drops by over 99% from its initial value after 500 iterations, significantly outperforming comparative algorithms, which achieve reductions of only 60–85%. This performance is attributed to MECDDO’s multi-strategy adaptive selection mechanism, which rapidly explores the solution space in the early stage and switches to exploitation strategies in the later stage to refine the optimal solution, thus dynamically balancing exploration and exploitation.
Figure 6.
Convergence speed comparison among competing algorithms on CEC2017 benchmark test set.
The fitness value distributions in Figure 7 further corroborate MECDDO’s superiority in optimization accuracy. For unimodal functions (e.g., F1, F6), multimodal functions (e.g., F9, F11), and hybrid functions (e.g., F23, F28), MECDDO’s fitness values are more tightly concentrated near the optimal value, with the smallest dispersion. In the 30-dimensional F9 function, MECDDO’s fitness values are concentrated around 1.4 × 10³, whereas CDDO, WOA, and others are spread between 2.1 × 10³ and 1.2 × 10⁴. In the 50-dimensional F26 function, MECDDO’s median fitness is over 30% lower than that of HBO, SGA, and other algorithms, demonstrating its ability to escape local optima and approach the global optimum in complex solution spaces.
Figure 7.
Statistical distribution analysis of all algorithms on CEC2017 benchmark set.
3.6. Experimental Results and Analysis on CEC 2022 Benchmark
To further validate the generalization performance of MECDDO across different benchmark test suites, supplementary experiments were conducted on the CEC2022 benchmark set with 20 dimensions. This benchmark consists of 12 functions with complex characteristics, covering unimodal, multimodal, hybrid, and other function types, which enables a more comprehensive evaluation of the algorithm’s adaptability under diverse optimization scenarios. The experiments adopted the same parameter settings and evaluation criteria as those used in CEC2017. MECDDO was compared with nine mainstream algorithms, and the corresponding results are reported in Table 5, Figure 8 and Figure 9.
Table 5.
Experimental results of CEC2022 (dim=20).
Figure 8.
Convergence speed comparison among competing algorithms on CEC2022 benchmark test set.
Figure 9.
Statistical distribution analysis of all algorithms on CEC2022 benchmark set.
The data in Table 5 indicate that MECDDO outperforms the comparative algorithms in terms of both average fitness values (Ave) and standard deviations (Std) on most test functions. For the unimodal function F1, the Ave value of MECDDO (3.5209 × 10²) is only 0.88% of that obtained by CDDO (3.9804 × 10⁴), while its Std value (7.3873 × 101) is merely 0.57% of that of CDDO, demonstrating an exceptionally strong capability for precise convergence.
For the multimodal function F5, the Ave value of MECDDO (9.0784 × 10²) is 75.7% lower than that of CDDO (3.7449 × 10³), and the corresponding Std value (2.1937 × 101) is only 6.6% of that of CDDO, verifying its effectiveness in escaping local optima.
For the hybrid and composition functions, the Ave value of MECDDO on F6 (3.4992 × 10³) is significantly lower than that of CDDO (4.3134 × 10⁸), and on F11, the Ave value (2.9167 × 10³) is 58.8% lower than that of CDDO (7.0783 × 10³), highlighting its superior adaptability in complex optimization scenarios.
The convergence curves shown in Figure 8 intuitively illustrate the efficiency advantage of MECDDO. For function F1, the fitness value of MECDDO decreases to below 400 within 100 iterations and stabilizes after 200 iterations, whereas algorithms such as CDDO and WOA still maintain fitness values above 10,000 even after 500 iterations.
For function F5, MECDDO completes the major fitness reduction within the first 100 iterations, decreasing from approximately 10,000 to around 900, followed by only minor refinements in subsequent iterations. In contrast, algorithms such as HHO and SGA continue to decrease slowly after 500 iterations and converge to fitness values that remain much higher than those of MECDDO, demonstrating that the multi-strategy cooperative mechanism effectively improves search efficiency.
The boxplots in Figure 9 further reveal that MECDDO exhibits a more concentrated fitness value distribution with the smallest dispersion. For function F1, MECDDO presents the narrowest box and no outliers, indicating highly consistent results over 30 independent runs, whereas CDDO shows a very wide box with numerous outliers, reflecting severe performance fluctuations.
For function F3, the box of MECDDO is almost entirely concentrated around 600, with an interquartile range significantly smaller than those of the other algorithms, confirming its stable performance in high condition number scenarios.
For function F5, MECDDO exhibits the lowest box position and the shortest whiskers, indicating not only superior average performance but also the ability to consistently generate high-quality solutions even under extreme conditions, thereby demonstrating a clear advantage in optimization stability.
Overall, MECDDO demonstrates accurate, fast, and stable optimization performance on the CEC2022 benchmark suite. The effectiveness of its core improvement strategies is consistently validated across different benchmark test sets.
3.7. Runtime Comparison Analysis
To evaluate the computational efficiency of MECDDO, the CEC2017 benchmark suite with 30 dimensions was employed as the experimental platform. The average running time of MECDDO and the other algorithms on each test function was recorded, with each algorithm independently executed 30 times to ensure result reliability. The corresponding results are illustrated in Table 6.
Table 6.
Average running time of different algorithms on CEC2017(dim = 30).
As shown in Table 6, under the CEC2017 (dim = 30) benchmark environment, the average running times of all algorithms across the 30 test functions are within the same order of magnitude (10−1 to 100 s). This indicates that, under the unified parameter settings of population size () and maximum iteration number (), all compared algorithms exhibit relatively high computational efficiency. Overall, WOA, SGA, and ALA demonstrate lower execution times on most functions. For example, on F1–F5, the running time of WOA remains consistently within 0.04–0.06 s, placing it among the fastest algorithms. This efficiency primarily results from its relatively simple update mechanism, where the position updating equations involve lower computational overhead, thereby reducing the time cost per iteration.
In contrast, the average running time of MECDDO is slightly higher than that of conventional algorithms on most functions. For instance, on F1, the average runtime of MECDDO is 0.1457 s, which is higher than that of WOA (0.0431 s) and SGA (0.0472 s); on F6, MECDDO requires 0.2583 s, also exceeding GWO (0.2035 s) and ALA (0.1503 s). This time difference mainly arises from the additional mechanisms introduced in MECDDO during each iteration, including the multi-strategy adaptive selection mechanism, Euclidean distance-based weight computation, and the global-best-guided boundary repair strategy. Compared with the original CDDO, which adopts a single update strategy, MECDDO requires additional operations such as strategy success counting, roulette-wheel selection, and multi-source individual information interaction, resulting in a moderate increase in the constant time factor.
Nevertheless, it should be emphasized that the increase in runtime overhead of MECDDO is limited and controllable. From an overall perspective, its running time remains stable within the range of 0.15–0.30 s, and no order-of-magnitude growth is observed even for complex functions (e.g., F19 and F30). This observation is consistent with the previous computational complexity analysis: the time complexity of MECDDO remains , which is asymptotically identical to that of the original CDDO and other mainstream swarm intelligence algorithms, with only a slight increase in the constant factor. Therefore, while significantly enhancing optimization performance, the proposed method does not sacrifice scalability or practical applicability.
Combining the accuracy and stability results presented in Section 3.5, it can be observed that although MECDDO incurs a slightly higher runtime than some structurally simpler algorithms, it exhibits substantial advantages in solution accuracy, convergence speed, and robustness. For example, on high-complexity functions (e.g., F18 and F30), MECDDO improves the optimization results by several orders of magnitude compared with CDDO, while the additional runtime increases by only approximately 0.02–0.05 s. This characteristic—achieving significant performance gains with only a marginal computational cost—demonstrates the effectiveness and practical value of the proposed multi-strategy cooperative framework.
In summary, MECDDO maintains the same asymptotic time complexity as mainstream swarm intelligence algorithms. Although its runtime is slightly increased, the growth is minor and stable. Meanwhile, its substantial improvements in optimization accuracy and robustness far outweigh the additional computational cost. Consequently, MECDDO achieves superior overall performance in terms of accuracy, stability, and efficiency, and is capable of providing high-quality solutions for complex global optimization problems while maintaining acceptable computational expense.
3.8. Friedman Test Analysis and Results
To construct a complete performance hierarchy for the MECDDO method, statistical tools that can evaluate multiple interrelated algorithms simultaneously are indispensable. Customized for this application, the Friedman test operates as a non-parametric technique comparing algorithms according to their ranked outcomes over diverse datasets. This methodology intrinsically avoids any presuppositions about the fundamental distribution of performance metrics. Such a property makes it especially powerful for comparative studies examining multiple algorithms tested on the same set of benchmark functions. The computation of the test statistic adheres to the following expression [3,7]:
In the presented equation, refers to the total number of blocks, indicates the count of experimental treatments, and represents the summed ranking value for treatment jth. Provided that the sample sizes for and meet sufficient magnitude requirements, the calculated statistic follows a probability distribution possessing degrees of freedom [7].
Table 7 clearly presents the mean ranking (M.R.) and total ranking (T.R.) of all algorithms on the CEC2017 (30/50/100 dimensions) and CEC2022 (20 dimensions) benchmark test suites. MECDDO consistently ranks first across all test scenarios, demonstrating a significant and stable performance advantage.
Table 7.
Friedman test ranking results with p-values.
On the CEC2017 benchmark, in the 30-dimensional scenario, MECDDO achieves an average ranking of only 1.63, which is substantially better than that of the second-ranked ALA (2.53) and the third-ranked GWO (3.90). In contrast, the conventional CDDO ranks tenth with an average ranking of 9.83, showing a pronounced performance gap compared with MECDDO. As the dimensionality increases to 50 and 100 dimensions, the average ranking of MECDDO slightly increases to 2.20 and 2.70, respectively, yet it still maintains the top position. Moreover, the gap between MECDDO and the second-ranked ALA (2.43 and 2.77) remains very small, indicating strong adaptability to high-dimensional optimization problems. Conversely, the average rankings of CDDO remain at the bottom, with values of 9.93 and 9.73 for the 50- and 100-dimensional cases, respectively, highlighting its clear performance disadvantage in high-dimensional scenarios.
On the CEC2022 (20-dimensional) benchmark, MECDDO further improves its average ranking to 1.25, which is the best result among all tested scenarios. This value is markedly superior to that of the second-ranked ALA (2.50) and the third-ranked BPBO (3.75), while CDDO again ranks last with an average ranking of 9.67. These results demonstrate that regardless of the benchmark characteristics, MECDDO consistently outperforms the comparative algorithms in terms of overall optimization performance, and its core improvement strategies remain effective across diverse optimization scenarios.
Figure 10 visualizes the relative ranking distributions of the algorithms across different test functions, providing an intuitive illustration of the ranking stability and dominance of MECDDO.
Figure 10.
Distribution of relative performance rankings across all evaluated algorithms.
In the CEC2017 (50-dimensional) scenario, the rankings of MECDDO are almost entirely concentrated at the top positions across all functions, with only marginal competition from ALA and BPBO on a few functions. The ranking distribution of MECDDO is highly concentrated and consistently leading, whereas algorithms such as CDDO and WOA exhibit dispersed rankings mainly located in the middle-to-lower range, with most function rankings between 8th and 10th.
In the 100-dimensional scenario, MECDDO continues to maintain a concentrated ranking advantage. Even on complex high-dimensional functions (e.g., F2, F12, and F30), MECDDO consistently remains within the top three positions. In contrast, the ranking fluctuations of other algorithms increase significantly, with some algorithms experiencing sharp ranking degradations on specific functions.
In the CEC2022 (20-dimensional) scenario, MECDDO ranks first or second on all 12 test functions, with a compact and stable ranking distribution and no evident fluctuations. By comparison, algorithms such as CDDO and WOA exhibit dispersed rankings mostly ranging from 6th to 10th and rank last on multiple functions. This distribution pattern clearly indicates that MECDDO not only achieves overall superior performance but also maintains consistent advantages across functions with different characteristics, effectively avoiding the “specialization bias” observed in some algorithms. These results further confirm its strong generalization capability and robustness.
Overall, the Friedman test results, from both quantitative ranking metrics and distribution characteristics, comprehensively confirm the superior overall performance of MECDDO across various test scenarios. Its stable ranking behavior and broad function adaptability further validate the effectiveness and synergistic interaction of the three core strategies: adaptive cooperative search, multi-strategy adaptive selection, and global-optimum-guided boundary repair.
All Friedman test results yielded p-values < 0.05 (Table 7), indicating statistically significant differences in optimization performance among the ten algorithms across all dimensional settings. The results showed that MECDDO’s mean ranking is significantly better than CDDO, WOA, and HHO in all dimensions, while no significant difference was found between MECDDO and ALA, confirming that MECDDO achieves performance comparable to the second-best algorithm while maintaining a stable leading advantage over other competitors.
3.9. Wilcoxon Signed-Rank Test
To further verify the statistical significance of MECDDO’s performance advantage, the Wilcoxon signed-rank test with Holm correction (significance level α = 0.05) is conducted between MECDDO and each comparative algorithm on CEC2017(30/50/100 dimensions) and CEC2022(20 dimensions) benchmark. The results are shown in Table 8, where “Win” indicates MECDDO is significantly better, “Loss” indicates significantly worse, and “Tie” indicates no significant difference.
Table 8.
Wilcoxon signed-rank test results (α = 0.05).
Based on the results obtained on the CEC2017 benchmark with 30 dimensions, MECDDO demonstrates a statistically significant advantage over all comparative algorithms. When compared with the original CDDO, MECDDO achieves 29 wins and 1 case with no significant difference, with no failures observed, indicating a highly reliable and statistically robust improvement over the baseline algorithm. Against the competitive ALA algorithm, MECDDO still records 24 wins and 6 cases with no significant difference, highlighting its superiority even among strong competitors. Furthermore, when compared with the well-performing GWO, MECDDO attains 22 wins and 8 cases with no significant difference, further confirming the statistical significance of its optimization performance in the 30-dimensional scenario.
In the CEC2017 (50-dimensional) scenario, the performance advantage of MECDDO becomes even more pronounced. In comparison with WOA, MECDDO achieves 30 complete wins, with no cases of no significant difference or failure, indicating that its optimization performance is far superior in medium-dimensional complex search spaces. Against HHO, MECDDO records 27 wins, 1 case with no significant difference, and only 2 failures, with failures being extremely rare and the overall advantage remaining dominant. When compared with CDDO, MECDDO maintains an absolute lead with 26 wins and 4 cases with no significant difference, once again demonstrating the effectiveness of the proposed improvement strategies in medium-dimensional scenarios.
In the high-dimensional CEC2017 (100-dimensional) scenario, the significant advantage of MECDDO does not diminish with increasing dimensionality. In comparisons with algorithms such as WOA and SGA, MECDDO achieves 30 complete wins, demonstrating outstanding stability in high-dimensional optimization. When compared with CDDO, MECDDO still achieves 27 wins and 3 cases with no significant difference, indicating that the performance improvements over the original algorithm remain statistically significant in high-dimensional spaces. Even against the relatively robust BPBO, MECDDO secures 29 wins and 1 case with no significant difference, maintaining a clear and decisive advantage.
On the CEC2022 benchmark with 20 dimensions, the statistical superiority of MECDDO is likewise confirmed. In comparisons with WOA, SGA, and CDDO, MECDDO achieves 12 complete wins, with no cases of no significant difference or failure, demonstrating that its generalization performance remains statistically significant across different benchmark test suites. Against algorithms such as GWO, BPBO, and ALA, MECDDO consistently records 10 wins and 2 cases with no significant difference, further validating the stability and reliability of its optimization performance.
Overall, the results of the Wilcoxon signed-rank test provide strong statistical evidence supporting the superior performance of MECDDO. Across different dimensional settings and benchmark test suites, the performance differences between MECDDO and the comparative algorithms are statistically significant, with an overwhelmingly high proportion of wins and no notable failure cases. These results comprehensively verify the effectiveness and synergistic contribution of the three core strategies—adaptive cooperative search, multi-strategy adaptive selection, and global-optimum-guided boundary repair.
4. Mobile Robot Path Planning
4.1. Map Model Construction
Common path planning representations mainly include the grid-based method, topological method, free-space method, and visibility graph method. The grid-based method discretizes the external environment into uniform cells according to a given resolution. Each cell is represented by a state, either occupied or free, indicating whether the cell corresponds to an obstacle [57,58]. The path planning algorithm occupies a free cell and searches for a path by traversing free cells while avoiding obstacles, forming a path composed of multiple connected cells.
The topological method divides the robot’s workspace into several smaller regions and establishes a topological network by connecting these regions with edges. Path planning is performed by searching through this network to form a path along the topological connections. The free-space method divides the environment into two regions: the movable region and the obstacle region [59]. A map model is generated by connecting the midpoints of line segments in the movable region, and the robot plans its path within this model. The visibility graph method connects the start position, obstacle vertices, and the goal position pairwise to construct a multi-segment path structure. Path planning algorithms then generate a complete path from the start to the goal along these segments [60].
Among these methods, the grid-based method is one of the simplest and most widely used for mobile robot path planning. It is straightforward, effective, highly adaptable to obstacles, and significantly reduces the complexity of environment modeling. Therefore, the robot path planning environment in this work is established based on the grid method. Each grid cell in the environment is classified as either a free cell or an obstacle cell, depending on whether it contains an obstacle.
Figure 11 illustrates the robot’s possible movements within the grid map. In the figure, red dots represent the robot, and arrows indicate the directions in which the robot can move. For the robot on the left, there are no surrounding obstacles, so all eight directions are accessible. In contrast, for the robot on the right, obstacles are present above and at the upper-left, leaving only five feasible directions for movement.
Figure 11.
Representation of the 2-dimensional grid environment.
4.2. Experimental Analysis of Mobile Robot Path Planning
To evaluate the feasibility and effectiveness of MECDDO in planning paths for mobile robots in complex fire-field grid environments, experiments were conducted on 20 × 20 and 40 × 40 grid maps. MECDDO was compared with nine other algorithms through simulation experiments. To minimize the influence of algorithmic randomness on the simulation results, each algorithm was independently run 30 times under the same conditions. In the tables, the average value represents the mean path length planned by the algorithm across 30 runs, while the maximum and minimum values indicate the longest and shortest path lengths obtained in these runs, respectively. The minimum value among the three metrics is highlighted in bold.
4.2.1. Experimental Analysis in 20 × 20 Grid Environment
In the 20 × 20 grid environment, the starting point was set at (1,1) and the goal at (20,20). Simulation experiments were conducted using MECDDO and nine comparison algorithms. The planned robot paths are shown in Figure 12, while the evolution of fitness values during iterations is presented in Figure 13. A comparison of the quantitative results for all ten algorithms is summarized in Table 9.
Figure 12.
Planned trajectories in a 20 × 20 grid-based environment.
Figure 13.
Fitness evolution across algorithms in the 20 × 20 grid environment.
Table 9.
Performance metrics in 20 × 20 grid environment.
Figure 12 provides a visual comparison of the mobile robot paths planned by ten algorithms in a 20 × 20 grid environment, clearly demonstrating MECDDO’s superior performance. The paths planned by MECDDO are characterized by minimal turns and near-linear trajectories. From the start point (1,1) to the goal (20,20), the path includes only 2–3 necessary turns, each close to 90°, with no redundant detours or sharp-angle turns. This effectively reduces frequent directional adjustments during actual robot movement, minimizing energy consumption and motion errors. In contrast, CDDO produces paths with obvious redundancies, showing multiple unnecessary turns in the grid region (8,10)–(12,15), resulting in a “zigzag” trajectory and significantly longer travel distance. While GWO and WOA generate smoother paths than CDDO, they still involve 1–2 unnecessary turns in the (5,5)–(10,10) region, leading to longer path lengths compared with MECDDO.
Regarding obstacle avoidance, MECDDO maintains a safe distance of 1–2 grid units from obstacles. In the dense obstacle area (12,8)–(15,12), MECDDO smoothly navigates along the obstacle edges without approaching too closely or risking collisions. In contrast, HHO and SGA generate paths that come dangerously close to obstacles (e.g., HHO passes only 0.5 grid units from an obstacle at (13,10)), posing potential collision hazards. These observations further confirm MECDDO’s ability to jointly optimize “safety” and “smoothness” in path planning.
Figure 13 illustrates the fitness (path length) evolution of ten algorithms in a 20 × 20 grid environment, highlighting MECDDO’s advantages in both convergence speed and accuracy. Regarding convergence speed, MECDDO exhibits a rapid decline in the early iterations (0–100), with the fitness value dropping below 28.5 by iteration 50 and approaching the optimal value (~27.95) by iteration 100. In contrast, CDDO requires 300 iterations to reach below 29.5, GWO and WOA need 200 iterations to approach 28.5, and HHO remains above 28.7 even after 500 iterations, demonstrating MECDDO’s ability to quickly identify high-quality paths and reduce computational time. In terms of convergence accuracy, MECDDO’s fitness curve stabilizes around 27.95 after 200 iterations, showing minimal fluctuation. Meanwhile, algorithms such as CDDO and ALA continue to exhibit slight oscillations in the later iterations (e.g., CDDO fluctuates between 30.7 and 30.5 during iterations 400–500), indicating a tendency to linger near local optima and difficulty in achieving stable convergence to the global optimum. Furthermore, MECDDO’s fitness curve consistently lies below all comparative algorithms, with the gap widening over iterations, further validating its dual advantage in path planning accuracy and convergence stability. These observations are fully consistent with the quantitative results in Table 8 and the trajectory visualizations in Figure 10, collectively confirming MECDDO’s effectiveness and superiority in mobile robot path planning within a 20 × 20 grid environment.
Table 9 quantitatively validates MECDDO’s path planning performance, with key metrics including average path length (Ave), standard deviation (Std), maximum path length (Max), minimum path length (Min), and overall rank (Rank). In terms of average path length, MECDDO achieves 27.95483, ranking first, which is 0.03109 shorter than the second-ranked DBO (27.98592) and 2.70729 shorter than the traditional CDDO (30.66212), representing an 8.83% reduction. This indicates a substantial decrease in energy consumption and travel time for the robot in practical applications. Regarding extremal performance, MECDDO attains the shortest minimum path length (27.67219) among all algorithms, and its maximum path length (28.25072) exceeds the minimum by only 0.57853, much smaller than comparative algorithms—for instance, HHO’s maximum (32.07765) exceeds its minimum (27.73738) by 4.34027, and CDDO’s maximum (32.18488) exceeds its minimum (29.17303) by 3.01185—demonstrating MECDDO’s superior stability and lower sensitivity to initial parameters or environmental randomness.
The standard deviation further confirms MECDDO’s stability advantage. Its Std value (0.234255) is only 38.1% of CDDO’s (0.614306) and 22.8% of HHO’s (1.028369). Even compared with the second-ranked DBO (0.24286), MECDDO is lower by 0.008605, indicating that across 30 independent trials, the path length fluctuations remain minimal, ensuring high reliability for robotic path planning. In overall ranking, MECDDO holds a clear first place with a significant gap from other algorithms, further confirming its optimal comprehensive performance in the 20 × 20 grid environment.
4.2.2. Experimental Analysis in 40 × 40 Grid Environment
In the 40 × 40 grid environment, the starting point was set at (1,1) and the goal at (40,40). Simulation experiments were conducted using MECDDO and nine comparison algorithms. The planned robot paths are shown in Figure 14, while the evolution of fitness values during iterations is presented in Figure 15. A comparison of the quantitative results for all ten algorithms is summarized in Table 10.
Figure 14.
Planned trajectories in a 40×40 grid-based environment.
Figure 15.
Fitness evolution across algorithms in the 40×40 grid environment.
Table 10.
Performance metrics in 40 × 40 grid environment.
Figure 14 presents the path planning results of ten algorithms in a 40×40 high-complexity grid environment, where obstacles are more densely distributed and the grid size is doubled, placing higher demands on global exploration and local obstacle-avoidance coordination. The trajectories generated by MECDDO demonstrate the core advantages of “short paths, low redundancy, and high safety.” From the start (1,1) to the goal (40,40), only 3–4 necessary turns occur in dense obstacle regions (e.g., grids (15,15)–(25,25) and (30,30)–(35,35)), and the path quickly returns to the straight-line direction between start and goal without detours. Overall, the trajectory closely follows the optimal path trend, accurately navigating narrow passages (e.g., grids (20,20)–(25,25)) while maintaining a safe distance of more than one grid unit from surrounding obstacles, avoiding any collision risk. Comparative algorithms exhibit notable trajectory deficiencies. CDDO produces significant detours in grids (10,10)–(15,20), resulting in a substantially longer path. GWO’s path near grids (25,25)–(30,30) approaches obstacles too closely, requiring 8–9 additional direction adjustments to avoid collisions. HHO and SGA generally avoid obstacles but show redundant turns in regions such as (5,5)–(10,10) and (35,35)–(40,40), resulting in much lower path smoothness than MECDDO. Additionally, MECDDO’s trajectory nodes are more evenly distributed, with smaller directional changes between adjacent grids, providing better kinematic adaptability for the robot and reducing energy consumption caused by frequent directional switches.
Table 10 quantitatively validates MECDDO’s superior performance in the 40 × 40 grid environment, with key metrics highlighting its advantages in high-complexity scenarios. For average path length (Ave), MECDDO achieves 61.15516, ranking first, which is 3.32758 shorter than the second-ranked DBO (64.48274) and 36.0482 shorter than traditional CDDO (97.20336), representing a 37.19% reduction. Compared with the 20 × 20 grid environment (8.83% reduction), this improvement demonstrates that MECDDO’s optimization advantage becomes even more pronounced as environmental complexity increases. Regarding extremal performance, MECDDO attains the shortest minimum path length (58.24101) among all algorithms, while its maximum path length (65.30184) exceeds the minimum by only 7.06083—much smaller than comparative algorithms. For example, GWO’s maximum (129.7612) exceeds its minimum (67.29792) by 62.46328, and CDDO’s maximum (121.1821) exceeds its minimum (74.81734) by 46.36476, indicating that MECDDO maintains stable path-planning precision even in highly complex environments, with lower sensitivity to environmental disturbances.
The standard deviation (Std) further confirms MECDDO’s stability. Its Std value (1.815313) is only 11.3% of CDDO (16.02579) and 12.1% of GWO (15.01177). Even compared with the second-ranked DBO (3.528144), MECDDO is lower by 1.712831, indicating minimal fluctuation in path length across 30 independent trials, far surpassing other algorithms. In overall ranking, MECDDO holds a clear first place, with a ranking gap of 3.32758 over DBO—much larger than the gap in the 20×20 environment (0.03109)—further demonstrating that its comprehensive performance advantage is more pronounced in high-complexity grid scenarios.
Figure 15 illustrates the fitness (path length) evolution of ten algorithms in a 40×40 grid environment, highlighting MECDDO’s advantages in convergence speed, accuracy, and stability. Regarding convergence speed, MECDDO exhibits a rapid decline during the early iterations (0–150), with the fitness value dropping below 75 by iteration 50 and approaching the optimal value (~61.15) by iteration 150. In contrast, CDDO requires 400 iterations to drop below 90, GWO remains above 100 even after 500 iterations, and HHO and SGA take 300 iterations to approach 70. This demonstrates MECDDO’s ability to quickly lock onto high-quality path regions in high-complexity environments, significantly reducing computational time. In terms of convergence accuracy, MECDDO’s fitness curve stabilizes completely after 200 iterations, with the final value consistently around 61.15 and no observable fluctuations. Meanwhile, CDDO, GWO, and other algorithms continue to exhibit significant oscillations in later iterations (e.g., CDDO fluctuates between 97 and 95 during iterations 400–500), indicating susceptibility to local optima and difficulty in consistently achieving the global optimal path.
Moreover, MECDDO’s fitness curve remains below all comparative algorithms throughout the process, with the gap widening over iterations. At iteration 500, MECDDO’s fitness value is 36.0482 lower than CDDO, 38.8891 lower than GWO, and 8.8599 lower than HHO, further confirming its superiority in path planning accuracy and convergence stability in high-complexity grid environments. These results are fully consistent with the quantitative data in Table 7 and the trajectory visualizations in Figure 12, collectively demonstrating that MECDDO can efficiently and reliably plan short, safe paths for mobile robots in large-scale, high-complexity grids, underscoring its strong practical applicability.
Overall, MECDDO leverages the synergistic effects of adaptive cooperative search, multi-strategy dynamic selection, and global-optimum guided boundary repair to achieve multi-objective optimization of path “length–smoothness–safety,” while simultaneously ensuring high convergence efficiency and stability. This provides a robust and efficient solution for mobile robot path planning in complex real-world environments.
It should be noted that the current path planning experiments are conducted in static grid environments. In dynamic or real-world environments where obstacles or targets may change, MECDDO would require integration with real-time sensing and replanning mechanisms. This limitation is acknowledged and will be addressed in future work.
Limitations of MECDDO in dynamic environments: The current path planning experiments are conducted in fixed grid environments. For dynamic scenarios (e.g., moving obstacles in fire-field rescue), MECDDO requires real-time path recalculation. The algorithm’s fast convergence enables near-real-time adjustment, but the multi-strategy framework may increase computational latency in highly dynamic environments. Future improvements will focus on integrating a dynamic obstacle detection module and simplifying strategy selection in real-time scenarios to enhance adaptability.
Additionally, for multi-target path planning (sequencing of multiple waypoints), MECDDO can be extended by integrating a multi-objective optimization framework (e.g., non-dominated sorting) to balance path length, smoothness, and target visiting order, similar to the multi-objective sequencing method in mixed-model assembly lines.
5. Conclusions and Prospects
This study addresses the core limitations of the traditional Children’s Drawing Development Optimization (CDDO) algorithm—namely, its tendency to fall into local optima, slow convergence, and insufficient information exchange—when applied to global optimization problems and mobile robot path planning. To overcome these issues, a Multi-Strategy Enhanced Children’s Drawing Development Optimization (MECDDO) algorithm is proposed, and its superiority is validated through systematic numerical experiments and engineering applications. From the algorithmic improvement perspective, MECDDO achieves performance breakthroughs through three core strategies. First, an adaptive cooperative search strategy is introduced, integrating multi-source information from the global best, worst, and randomly selected individuals. Dynamic weighting coefficients guide individual updates, effectively expanding the exploration of the solution space and addressing the limitations of CDDO’s traditional “encircling” search. Second, a multi-strategy adaptive selection mechanism comprising four differentiated strategies is constructed, dynamically adjusting selection probabilities based on the success rate of each strategy. This enables a dynamic balance between early-stage exploration and late-stage exploitation, overcoming the insufficient adaptability of a single strategy. Third, a global-optimum guided boundary repair strategy is designed, which intelligently returns out-of-bounds solutions to the feasible domain based on the global-best position, avoiding the loss of high-quality information caused by conventional truncation methods and improving local exploitation efficiency.
In numerical optimization tests based on the CEC2017 benchmark suite, MECDDO demonstrates outstanding precision and stability across 30-, 50-, and 100-dimensional spaces: in 30 dimensions, the mean fitness of F1 is reduced by seven orders of magnitude compared to CDDO, and in 100 dimensions, the performance degradation of F2 is only 1/200 of that of CDDO. Friedman tests further show that MECDDO ranks first in overall performance across all dimensions, with statistically significant differences from the second-best algorithm. In mobile robot path planning applications, MECDDO shortens the average path length by 8.83% in a 20 × 20 grid environment and by 37.19% in a 40 × 40 high-complexity grid. The planned trajectories involve no redundant turns while maintaining safe distances from obstacles, and the convergence speed is 2–3 times faster than comparative algorithms, fully demonstrating MECDDO’s practical effectiveness in real-world engineering problems.
From a statistical perspective, the Friedman test results across all dimensional settings yielded p-values significantly lower than 0.05, confirming the existence of statistically significant differences among the compared algorithms. Furthermore, the Wilcoxon signed-rank test demonstrated that MECDDO achieved a dominant number of wins against all competing algorithms in 30D, 50D, 100D, and 20D experiments. These statistical findings rigorously validate that the observed performance improvements are not due to random fluctuations but stem from the effectiveness of the proposed multi-strategy enhancement framework. Therefore, MECDDO can be considered a statistically superior optimization algorithm for both numerical benchmark problems and real-world path planning applications.
Despite its advantages, MECDDO still has areas for improvement. In high-dimensional or large-population scenarios, multi-strategy statistics and Euclidean distance computations increase computational overhead by 15–20% compared with traditional CDDO, limiting real-time applicability. When obstacle density exceeds 60% in grid environments, the number of trajectory turns rises by 30% and the path optimization rate drops to 22.5%, indicating insufficient adaptability to extreme environments. Moreover, key algorithm parameters currently rely on trial-and-error tuning, requiring repeated adjustments in non-continuous or strongly constrained problems, reflecting a lack of self-adaptive parameter regulation.
Future work will focus on targeted enhancements: dimensionality reduction via principal component analysis (PCA) and sliding-window statistics to reduce computational complexity and meet real-time requirements; an obstacle-density awareness module to dynamically adjust search weights and optimize trajectory smoothness, improving adaptability in extreme scenarios; integration with reinforcement learning to form a closed-loop, self-adaptive parameter tuning mechanism; and extension to other applications such as UAV trajectory planning and smart grid scheduling to further validate algorithm generality and provide solutions for a broader range of engineering optimization problems.
Author Contributions
Conceptualization, Z.W. and S.W.; methodology, Z.W. and S.W.; software, Z.W. and S.W.; validation, Z.W. and S.W.; formal analysis, Z.W. and S.W.; investigation, Z.W. and S.W.; resources, S.Y. and G.W.; data curation, S.Y. and G.W.; writing original draft preparation, S.Y. and G.W.; writing review and editing, S.Y. and G.W.; visualization, S.Y. and G.W.; supervision, S.Y. and G.W.; funding acquisition, S.Y. and G.W. All authors have read and agreed to the published version of the manuscript.
Funding
Taizhou Science and Technology Plan Project (25gyb46), Key Project of Zhejiang Provincial Philosophy and Social Sciences (25WH04ZD).
Data Availability Statement
All data in this paper are included in the manuscript.
Acknowledgments
The authors would like to express their sincere gratitude to all those who contributed to the completion of this work.
Conflicts of Interest
The authors declare no conflicts of interest.
References
- Ying, W.; Wang, Z.; Li, H.; Du, S.; Zhao, M. Intelligent Ship Scheduling and Path Planning Method for Maritime Emergency Rescue. Algorithms 2024, 17, 197. [Google Scholar] [CrossRef] [Scilit]
- Wu, X.; Zhang, Y.; Shi, M.; Li, P.; Li, R.; Xiong, N.N. An adaptive federated learning scheme with differential privacy preserving. Future Gener. Comput. Syst. 2022, 127, 362–372. [Google Scholar] [CrossRef] [Scilit]
- Cao, L.; Wei, Q. SZOA: An Improved Synergistic Zebra Optimization Algorithm for Microgrid Scheduling and Management. Biomimetics 2025, 10, 664. [Google Scholar] [CrossRef] [Scilit]
- Hu, W.; Ma, X. Optimization Algorithm of UAVs Task Assignment and Path Planning Based on Dynamic Cluster Particle Swarm Optimization. IEEE Trans. Intell. Transp. Syst. 2025, 26, 18157–18169. [Google Scholar] [CrossRef] [Scilit]
- Huang, S.; Fu, Y.; Liu, D.; Chen, J.; He, L.; Zhang, J. DLC-NGO: An enhanced northern goshawk optimization for 3D UAV path planning in complex environments with multiple threats. Clust. Comput. 2025, 28, 677. [Google Scholar] [CrossRef] [Scilit]
- Chen, B.; Hai, M.; Di, G.; Zhou, B.; Zhang, Q.; Wang, M.; Guo, Y. Enhanced Dung Beetle Optimizer-Optimized KELM for Pile Bearing Capacity Prediction. Buildings 2025, 15, 2654. [Google Scholar] [CrossRef] [Scilit]
- Chen, Z.; Fu, B.; Yang, Y. A Novel Elite-Guided Hybrid Metaheuristic Algorithm for Efficient Feature Selection. Biomimetics 2025, 10, 747. [Google Scholar] [CrossRef] [Scilit] [PubMed]
- Wang, H.; Zhang, X.; Xia, Y.; Wu, X. An intelligent blockchain-based access control framework with federated learning for genome-wide association studies. Comput. Stand. Interfaces 2022, 84, 103694. [Google Scholar] [CrossRef] [Scilit]
- Wu, X.; Dong, J.; Bao, W.; Zou, B.; Wang, L.; Wang, H. Augmented Intelligence of Things for Emergency Vehicle Secure Trajectory Prediction and Task Offloading. IEEE Internet Things J. 2024, 11, 36030–36043. [Google Scholar] [CrossRef] [Scilit]
- Fan, D.; Zhu, X.; Xiang, Z.; Lu, Y.; Quan, L. Dimension-Reduction Many-Objective Optimization Design of Multi-Mode Double-Stator Permanent Magnet Motor. IEEE Trans. Transp. Electrif. 2024, 11, 1984–1994. [Google Scholar] [CrossRef] [Scilit]
- Fan, D.; Miao, D.; Shan, W.; Xiang, Z.; Zhu, X. Short-Circuit Fault Demagnetization Assessment and Optimization of Double-Electrical-Port Vernier Permanent Magnet Motor. IEEE Trans. Ind. Appl. 2025, 1–10. [Google Scholar] [CrossRef] [Scilit]
- Qi, H. A Unified Metric Architecture for AI Infrastructure: A Cross-Layer Taxonomy Integrating Performance, Efficiency, and Cost. arXiv 2025, arXiv:2511.21772. [Google Scholar] [CrossRef] [Scilit]
- Guo, S.; Song, Y.; Wu, Y.; Hu, J.; Lu, J.; Wang, C.; Jia, Z.; Hua, L. Microscopic mechanism of enhanced strength-plasticity synergy in pre-damaged TC11 titanium alloys via novel electroshock treatment. J. Alloys Compd. 2026, 1052, 186139. [Google Scholar] [CrossRef] [Scilit]
- Milin, V.; Stanivuk, T.; Skoko, I.; Bulić, T. Dijkstra and A* Algorithms for Algorithmic Optimization of Maritime Routes and Logistics of Offshore Wind Farms. J. Mar. Sci. Eng. 2025, 13, 1863. [Google Scholar] [CrossRef] [Scilit]
- Qi, H. Location-Robust Cost-Preserving Blended Pricing for Multi-Campus AI Data Centers. arXiv 2025, arXiv:2512.14197. [Google Scholar] [CrossRef] [Scilit]
- Qi, H.; Chunyu, Q. Modular Landfill Remediation for AI Grid Resilience. arXiv 2025, arXiv:2512.19202. [Google Scholar] [CrossRef] [Scilit]
- Sedeño-noda, A.; Colebrook, M. A Biobjective Dijkstra Algorithm. Eur. J. Oper. Res. 2019, 276, 106–118. [Google Scholar] [CrossRef] [Scilit]
- Maristany de las Casas, P.; Kraus, L.; Sedeño-Noda, A.; Borndörfer, R. Targeted multiobjective Dijkstra algorithm. Networks 2023, 82, 277–298. [Google Scholar] [CrossRef] [Scilit]
- Zhou, T.; Wei, W. Mobile robot path planning based on an improved ACO algorithm and path optimization. Multimed. Tools Appl. 2024, 84, 10899–10922. [Google Scholar] [CrossRef] [Scilit]
- Duan, Z.; Zhang, Y.; Shao, Z.; Xu, Z.; Xiang, Z. Advanced robot path planning on rough terrain: A Q-learning-based multi-objective PSO algorithm. Appl. Soft Comput. 2025, 184, 113798. [Google Scholar] [CrossRef] [Scilit]
- Qi, H.; Chunyu, Q. Waste-to-Energy-Coupled AI Data Centers: Cooling Efficiency and Grid Resilience. arXiv 2025, arXiv:2512.24683. [Google Scholar] [CrossRef] [Scilit]
- Yan, J.; Cheng, Y.; Zhang, F.; Li, M.; Zhou, N.; Jin, B.; Wang, H.; Yang, H.; Zhang, W. Research on multimodal techniques for arc detection in railway systems with limited data. Struct. Health Monit. 2025. [Google Scholar] [CrossRef] [Scilit]
- Wang, H.; Song, Y.; Yang, H.; Liu, Z. Generalized Koopman Neural Operator for Data-driven Modelling of Electric Railway Pantograph-catenary Systems. IEEE Trans. Transp. Electrif. 2025, 11, 14100–14112. [Google Scholar] [CrossRef] [Scilit]
- Fu, Y.; Liu, D.; Chen, J.; He, L. Secretary bird optimization algorithm: A new metaheuristic for solving global optimization problems. Artif. Intell. Rev. 2024, 57, 123. [Google Scholar] [CrossRef] [Scilit]
- Wang, T.-L.; Gu, S.-W.; Liu, R.-J.; Chen, L.-Q.; Wang, Z.; Zeng, Z.-Q. Cuckoo catfish optimizer: A new meta-heuristic optimization algorithm. Artif. Intell. Rev. 2025, 58, 326. [Google Scholar] [CrossRef] [Scilit]
- Hasan, D.O.; Mohammed, H.M.; Abdul, Z.K. Griffon vultures optimization algorithm for solving optimization problems. Expert Syst. Appl. 2025, 276, 127206. [Google Scholar] [CrossRef] [Scilit]
- Wang, L.; Cao, Q.; Zhang, Z.; Mirjalili, S.; Zhao, W. Artificial rabbits optimization: A new bio-inspired meta-heuristic algorithm for solving engineering optimization problems. Eng. Appl. Artif. Intell. 2022, 114, 105082. [Google Scholar] [CrossRef] [Scilit]
- Khishe, M.; Mosavi, M.R. Chimp optimization algorithm. Expert Syst. Appl. 2020, 149, 113338. [Google Scholar] [CrossRef] [Scilit]
- Hassan, M.H.; Kamel, S. Supercell thunderstorm algorithm (STA): A nature-inspired metaheuristic algorithm for engineering optimization. Neural Comput. Appl. 2025, 37, 7207–7260. [Google Scholar] [CrossRef] [Scilit]
- Sowmya, R.; Premkumar, M.; Jangir, P. Newton-Raphson-based optimizer: A new population-based metaheuristic algorithm for continuous optimization problems. Eng. Appl. Artif. Intell. 2024, 128, 107532. [Google Scholar] [CrossRef] [Scilit]
- Zhang, R.; Li, S.; Ding, Y.; Qin, X.; Xia, Q. UAV Path Planning Algorithm Based on Improved Harris Hawks Optimization. Sensors 2022, 22, 5232. [Google Scholar] [CrossRef] [Scilit]
- Zhang, C.; Yang, Y.; Chen, W. Multi-strategy ensemble wind driven optimization algorithm for robot path planning. Math. Comput. Simul. 2024, 231, 144–159. [Google Scholar] [CrossRef] [Scilit]
- Dai, Y.; Yu, J.; Zhang, C.; Zhan, B.; Zheng, X. A novel whale optimization algorithm of path planning strategy for mobile robots. Appl. Intell. 2022, 53, 10843–10857. [Google Scholar] [CrossRef] [Scilit]
- Wang, R.-B.; Wang, W.-F.; Xu, L.; Pan, J.-S.; Chu, S.-C. An Adaptive Parallel Arithmetic Optimization Algorithm for Robot Path Planning. J. Adv. Transp. 2021, 2021, 3606895. [Google Scholar] [CrossRef] [Scilit]
- Wang, Y.; Tong, K.; Fu, C.; Wang, Y.; Li, Q.; Wang, X.; He, Y.; Xu, L. Hybrid path planning algorithm for robots based on modified golden jackal optimization method and dynamic window method. Expert Syst. Appl. 2025, 282, 127808. [Google Scholar] [CrossRef] [Scilit]
- Deng, X.; He, D.; Qu, L. A Multi-strategy Enhanced Arithmetic Optimization Algorithm and Its Application in Path Planning of Mobile Robots. Neural Process. Lett. 2024, 56, 18. [Google Scholar] [CrossRef] [Scilit]
- Wu, D.; Du, K. A hybrid optimization algorithm of ACO and RRT for solving mobile robot path planning. Meas. Sci. Technol. 2025, 36, 076215. [Google Scholar] [CrossRef] [Scilit]
- Abdulhameed, S.; Rashid, T.A. Child Drawing Development Optimization Algorithm Based on Child’s Cognitive Development. Arab. J. Sci. Eng. 2022, 47, 1337–1351. [Google Scholar] [CrossRef] [Scilit]
- Ameen, A.A.; Rashid, T.A.; Askar, S. CDDO-HS:Child Drawing Development Optimization Harmony Search Algorithm. arXiv 2023, arXiv:2305.09615. [Google Scholar] [CrossRef] [Scilit]
- Kari Balakrishnan, A.; Chellaperumal, A.; Lakshmanan, S.; Vijayakumar, S. A novel efficient data storage and data auditing in cloud environment using enhanced child drawing development optimization strategy. Netw. Comput. Neural Syst. 2025, 1–41. [Google Scholar] [CrossRef] [Scilit] [PubMed]
- Chen, Y.; Zhang, J.; Rauf, M.; Mumtaz, J.; Huang, S. Dynamic scheduling of hybrid flow shop problem with uncertain process time and flexible maintenance using NeuroEvolution of Augmenting Topologies. IET Collab. Intell. Manuf. 2024, 6, e12119. [Google Scholar] [CrossRef] [Scilit]
- Rauf, M.; Guan, Z.; Sarfraz, S.; Mumtaz, J.; Shehab, E.; Jahanzaib, M. Multi-Criteria Inventory Classification Based on Multi-Criteria Decision-Making (MCDM) Technique. In Advances in Manufacturing Technology XXXII: Proceedings of the 16th International Conference on Manufacturing Research, incorporating the 33rd National Conference on Manufacturing Research, Skövde, Sweden, 11–13 September 2018; SAGE Publications Limited: Thousand Oaks, CA, USA, 2018. [Google Scholar]
- Chen, M.; Feng, C.; Cheng, R. MetaDE: Evolving Differential Evolution by Differential Evolution. IEEE Trans. Evol. Comput. 2025, 30, 141–155. [Google Scholar] [CrossRef] [Scilit]
- Zhang, S.X.; Liu, Y.H.; Hu, X.R.; Luo, J.T.; Zheng, L.M.; Zheng, S.Y. Differential evolution with dimensionally adaptive inheritance. Eng. Appl. Artif. Intell. 2025, 163, 112587. [Google Scholar] [CrossRef] [Scilit]
- Zhu, Y.; Zhang, M.; Huang, Q.; Wu, X.; Wan, L.; Huang, J. Secretary bird optimization algorithm based on quantum computing and multiple strategies improvement for KELM diabetes classification. Sci. Rep. 2025, 15, 3774. [Google Scholar] [CrossRef] [Scilit]
- Zhang, Y.; Wang, J.; Zhang, X.; Wang, B. ACPOA: An Adaptive Cooperative Pelican Optimization Algorithm for Global Optimization and Multilevel Thresholding Image Segmentation. Biomimetics 2025, 10, 596. [Google Scholar] [CrossRef] [Scilit] [PubMed]
- Hou, X.; Li, Y.; Liu, Z. An Enhanced Polar Lights Optimization Algorithm with Symmetry Mechanisms for Global Optimization and Its Application to Wind Power Forecasting. Symmetry 2025, 18, 61. [Google Scholar] [CrossRef] [Scilit]
- Wu, G.; Mallipeddi, R.; Suganthan, P. Problem Definitions and Evaluation Criteria for the CEC 2017 Competition and Special Session on Constrained Single Objective Real-Parameter Optimization. 2016. Available online: http://www.kiphub.com/paper/666152c71a6f2cfc2305a5b0 (accessed on 28 February 2026).
- Mirjalili, S.; Mirjalili, S.M.; Lewis, A. Grey Wolf Optimizer. Adv. Eng. Softw. 2014, 69, 46–61. [Google Scholar] [CrossRef] [Scilit]
- Heidari, A.A.; Mirjalili, S.; Faris, H.; Aljarah, I.; Mafarja, M.; Chen, H. Harris hawks optimization: Algorithm and applications. Future Gener. Comput. Syst. 2019, 97, 849–872. [Google Scholar] [CrossRef] [Scilit]
- Mirjalili, S.; Lewis, A. The Whale Optimization Algorithm. Adv. Eng. Softw. 2016, 95, 51–67. [Google Scholar] [CrossRef] [Scilit]
- Zhu, F.; Li, G.; Tang, H.; Li, Y.; Lv, X.; Wang, X. Dung beetle optimization algorithm based on quantum computing and multi-strategy fusion for solving engineering problems. Expert Syst. Appl. 2024, 236, 121219. [Google Scholar] [CrossRef] [Scilit]
- Ghasemi, M.; Akbari, M.A.; Zare, M.; Mirjalili, S.; Deriche, M.; Abualigah, L.; Khodadadi, N. Birds of prey-based optimization (BPBO): A metaheuristic algorithm for optimization. Evol. Intell. 2025, 18, 88. [Google Scholar] [CrossRef] [Scilit]
- Xiao, Y.; Cui, H.; Khurma, R.A.; Castillo, P.A. Artificial lemming algorithm: A novel bionic meta-heuristic technique for solving real-world engineering optimization problems. Artif. Intell. Rev. 2025, 58, 84. [Google Scholar] [CrossRef] [Scilit]
- Tian, A.-Q.; Liu, F.-F.; Lv, H.-X. Snow Geese Algorithm: A novel migration-inspired meta-heuristic algorithm for constrained engineering optimization problems. Appl. Math. Model. 2024, 126, 327–347. [Google Scholar] [CrossRef] [Scilit]
- Ouertani, M.W.; Manita, G.; Korbaa, O. Hannibal Barca optimizer: The power of the pincer movement for global optimization and multilevel image thresholding. Clust. Comput. 2025, 28, 482. [Google Scholar] [CrossRef] [Scilit]
- Mac, T.T.; Copot, C.; Tran, D.T.; De Keyser, R. Heuristic approaches in robot path planning: A survey. Robot. Auton. Syst. 2016, 86, 13–28. [Google Scholar] [CrossRef] [Scilit]
- Felsner, K.; Schlachter, K.; Zambal, S. Robotic Coverage Path Planning for Ultrasonic Inspection. Appl. Sci. 2021, 11, 10512. [Google Scholar] [CrossRef] [Scilit]
- Zhang, Z.; Xu, X.; Yue, F.; Ba, Y. Robot path planning based on concept lattice. Int. J. Approx. Reason. 2022, 153, 87–103. [Google Scholar] [CrossRef] [Scilit]
- Gao, Y.; Jiang, Q.; Wang, M.; Dong, X. Advances in Path-Planning Algorithms for Agricultural Robots. J. Field Robot. 2025, 43, 89–145. [Google Scholar] [CrossRef] [Scilit]
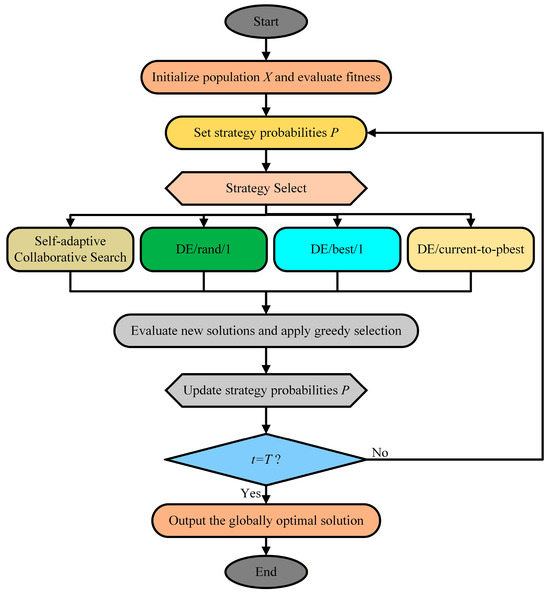
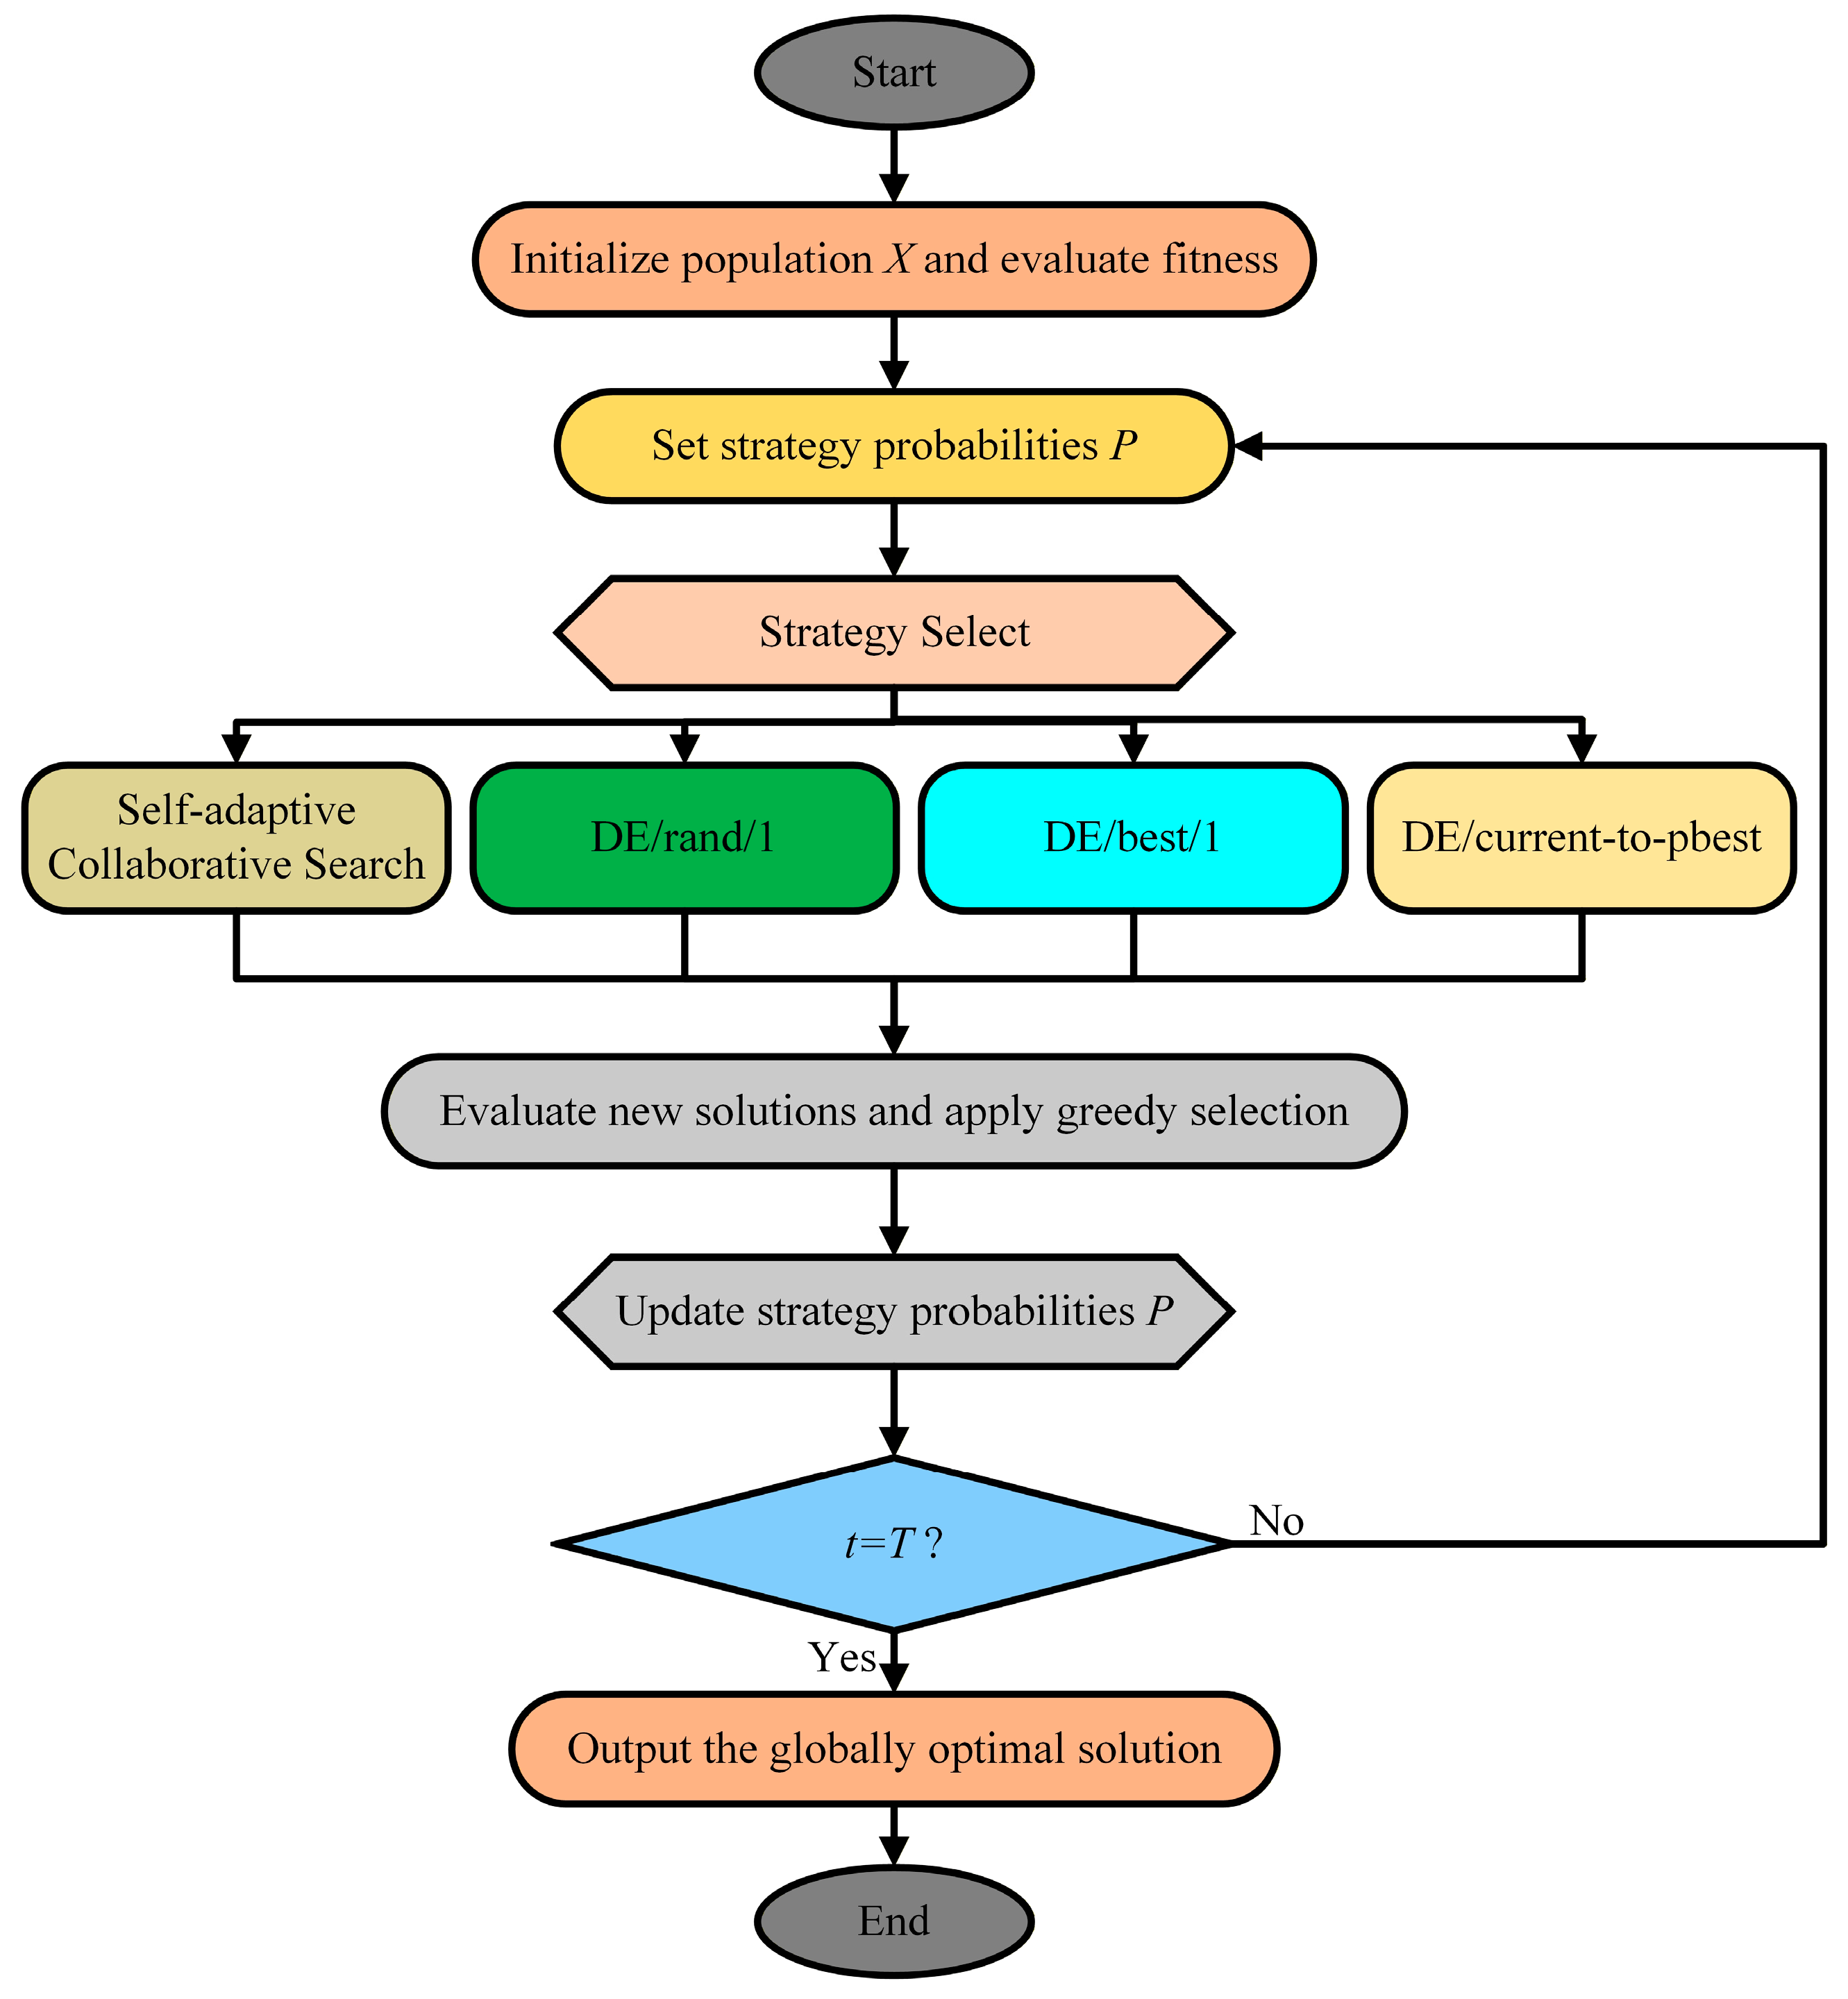
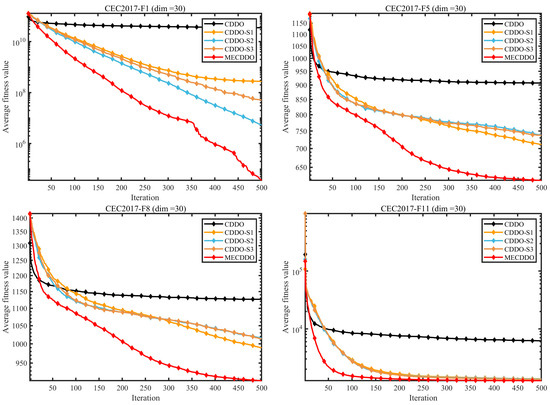
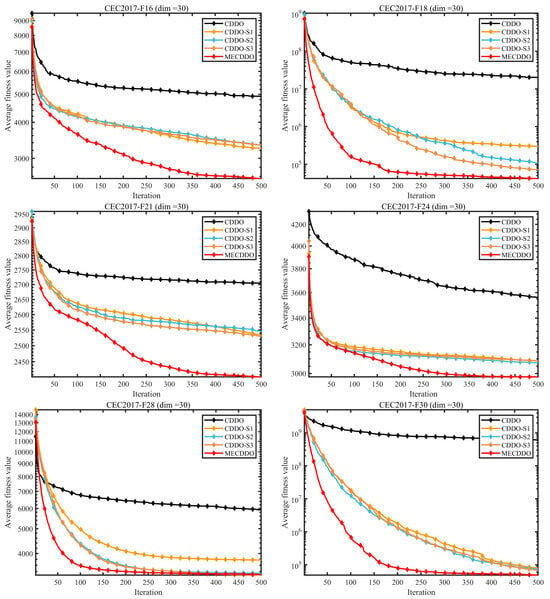
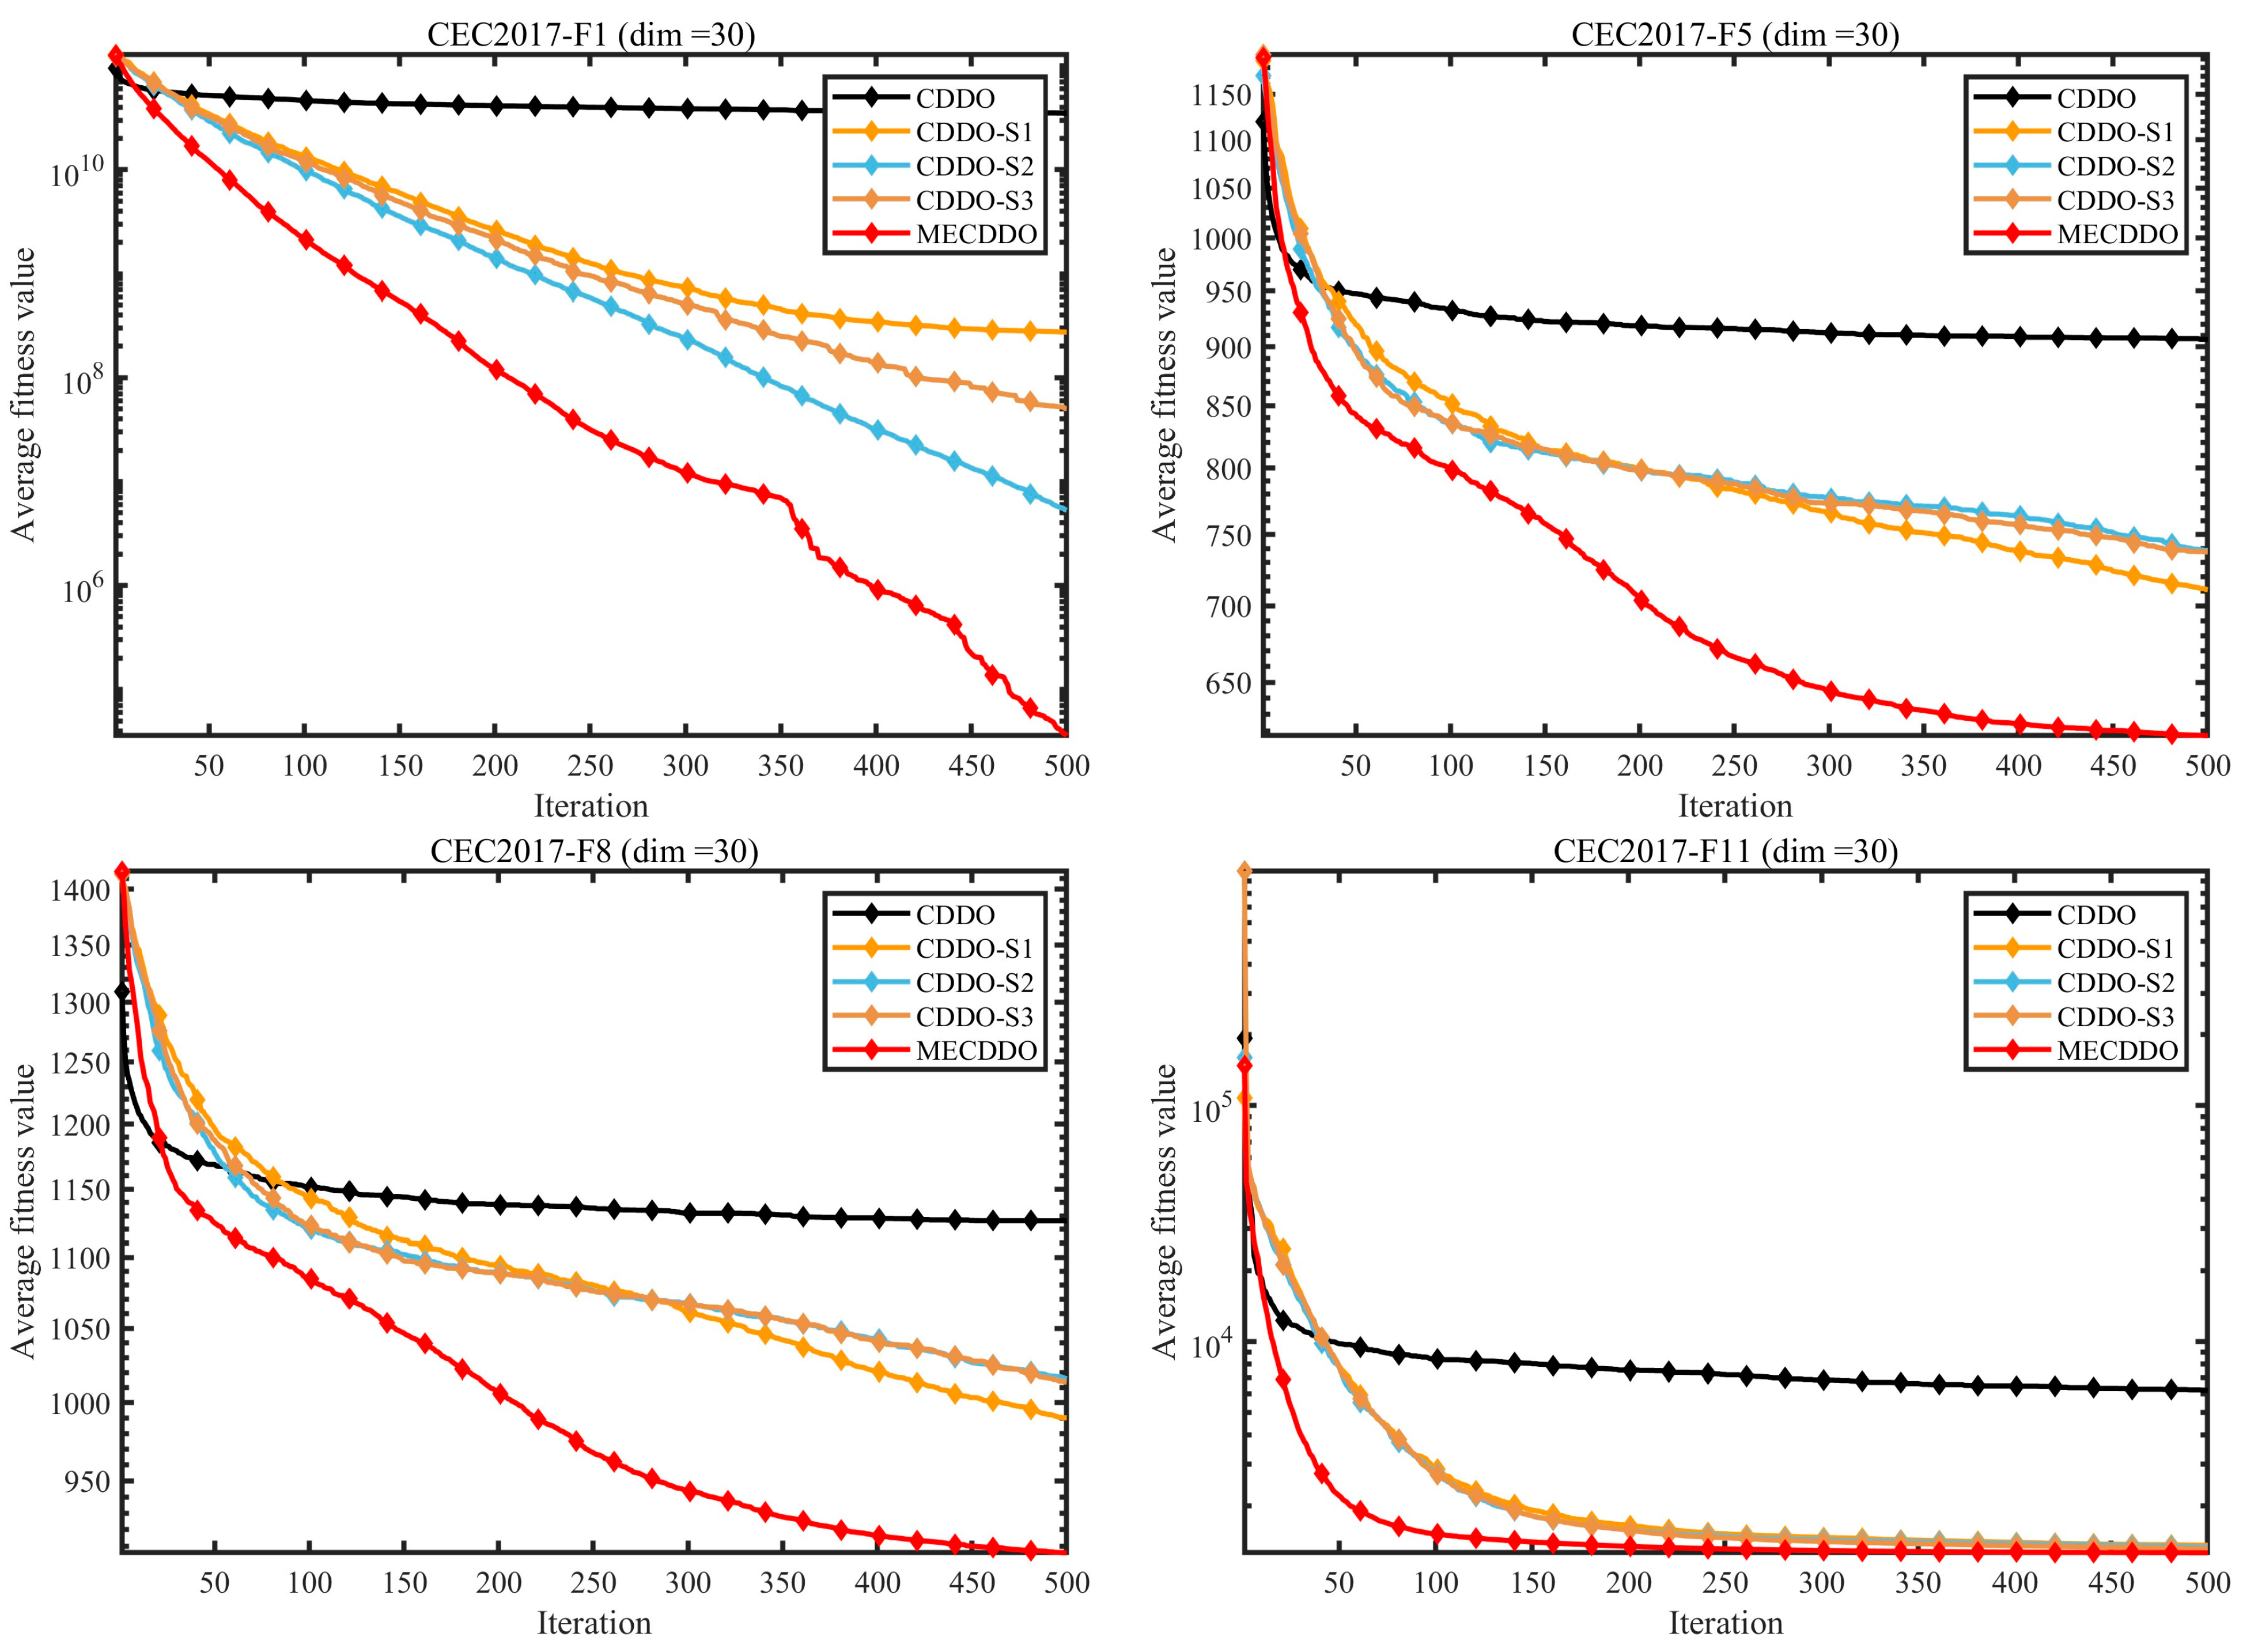
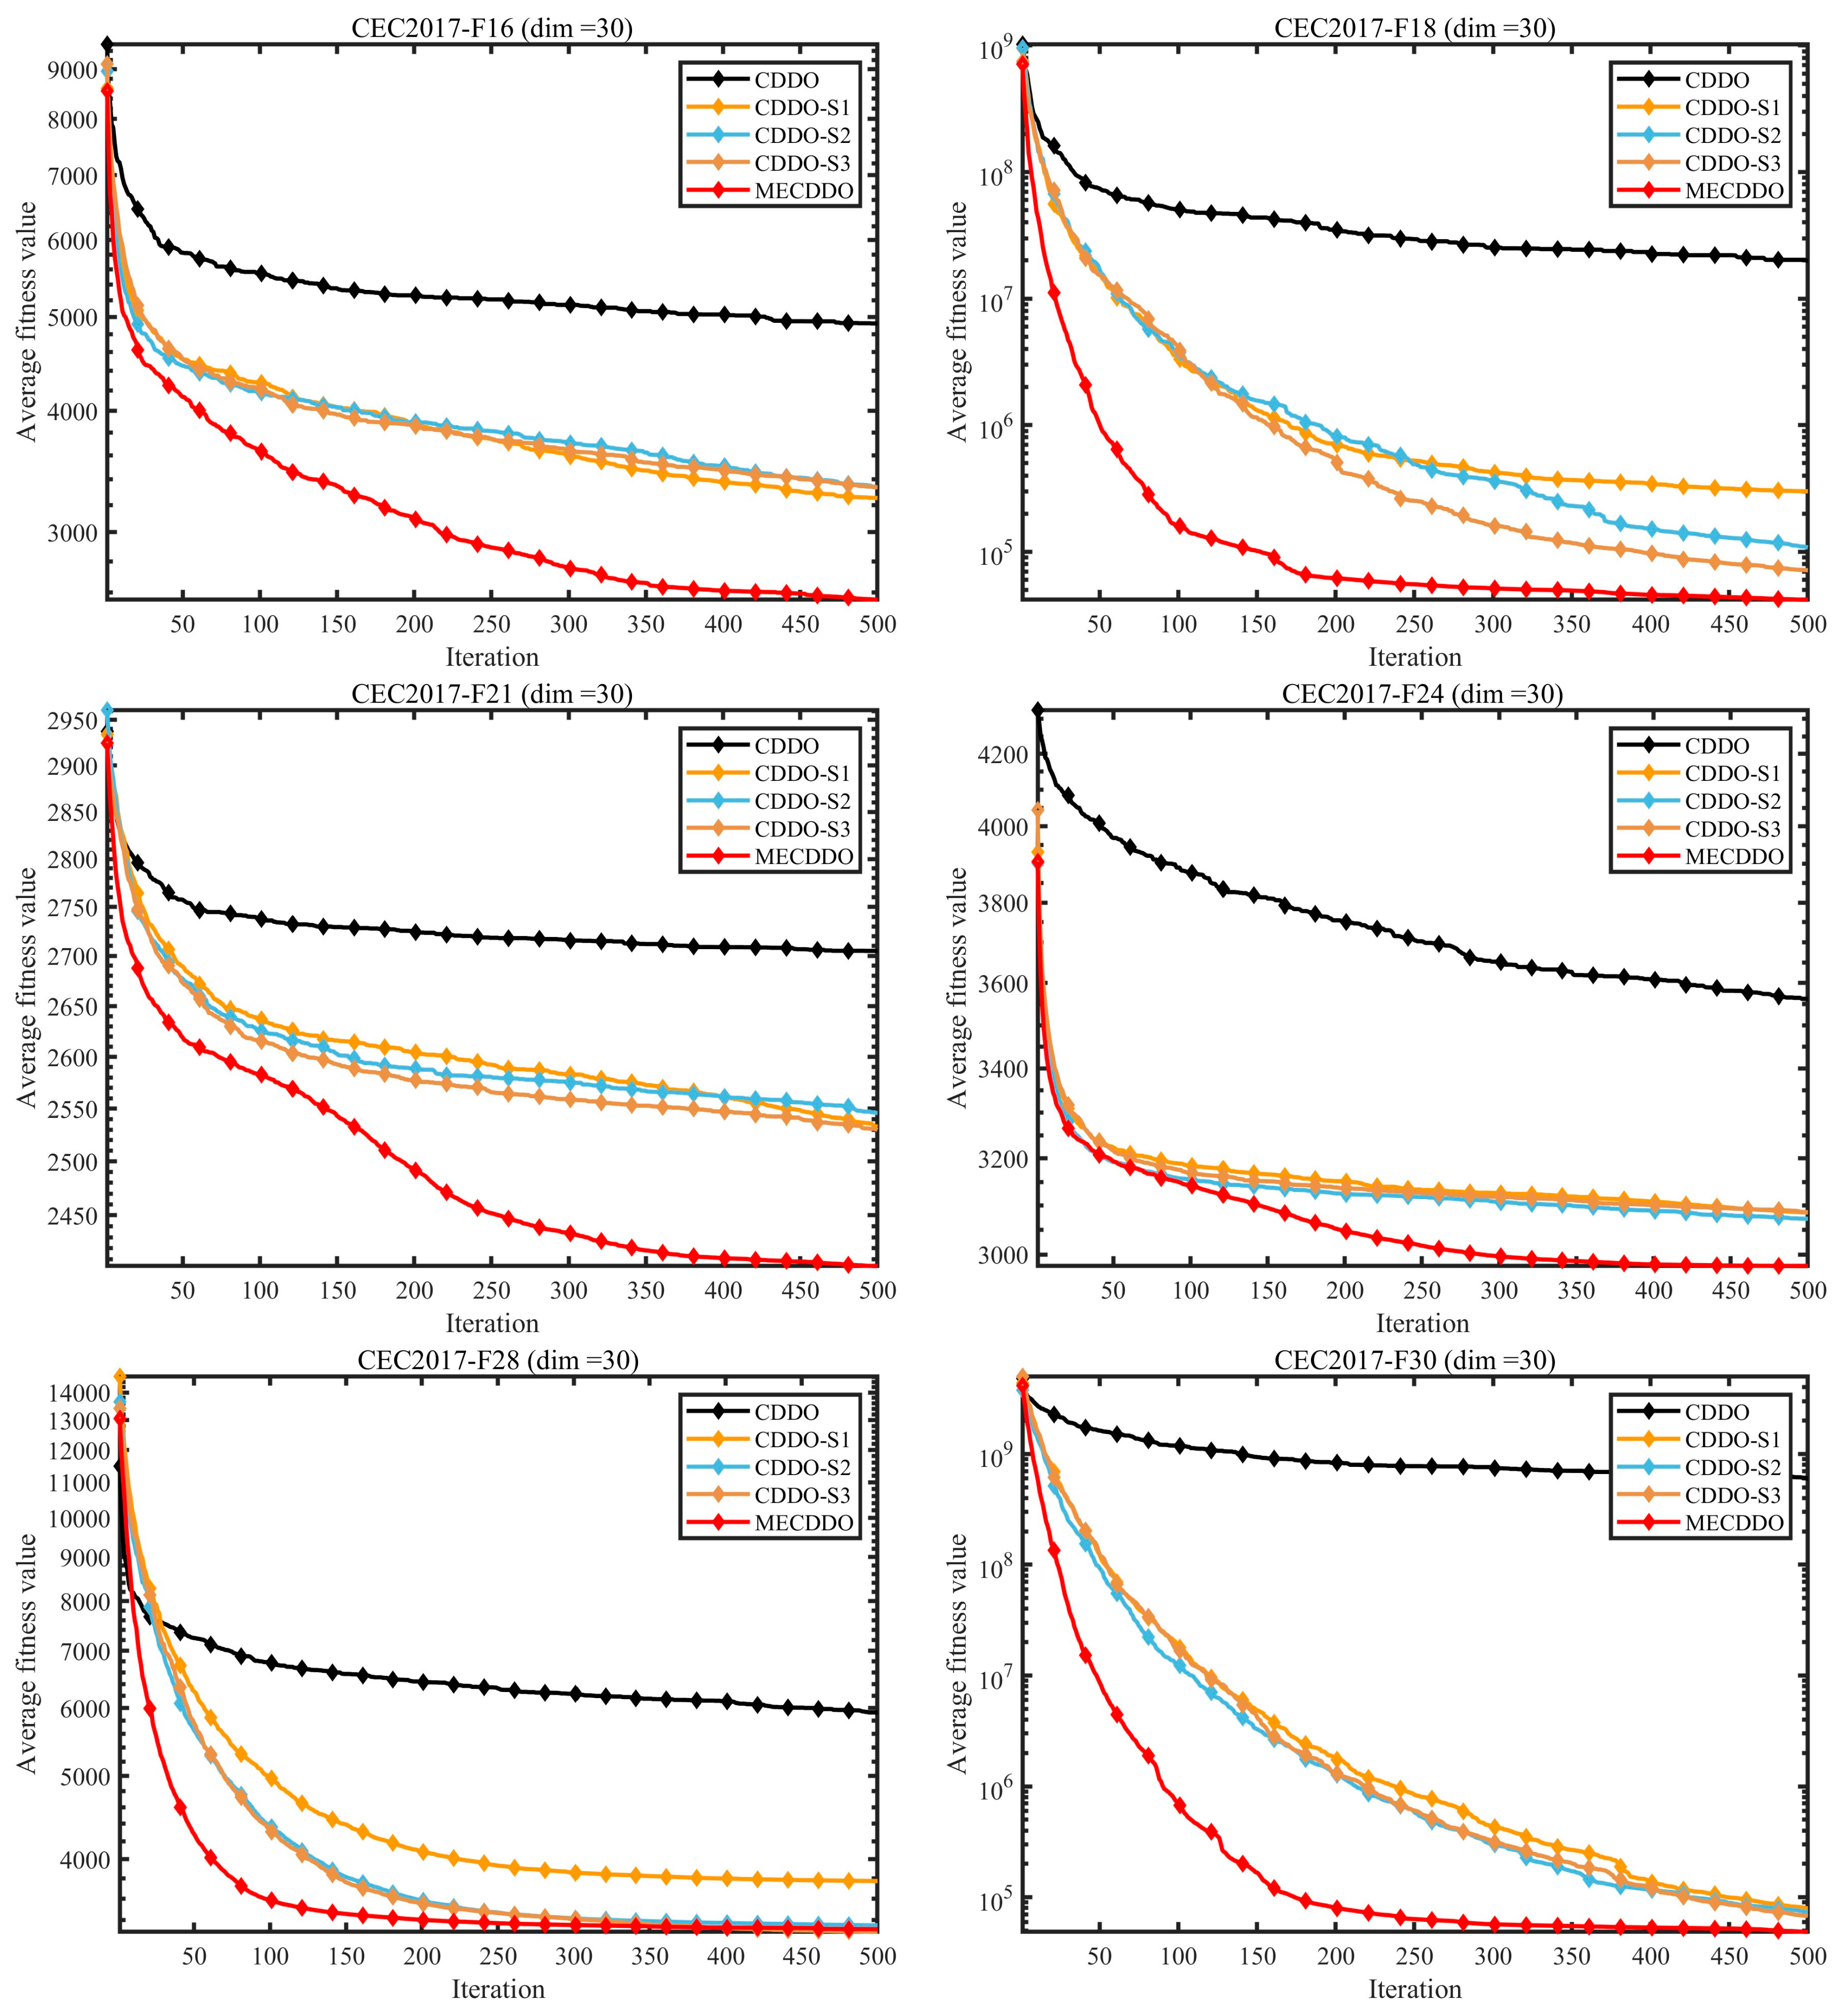
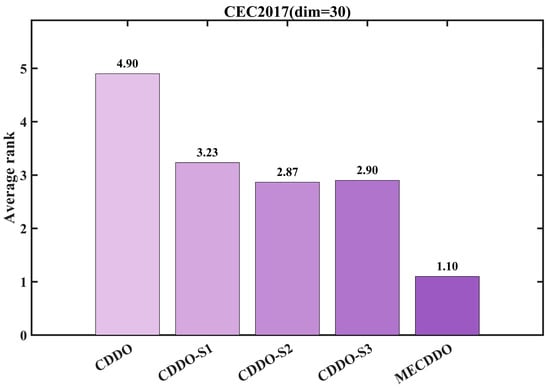
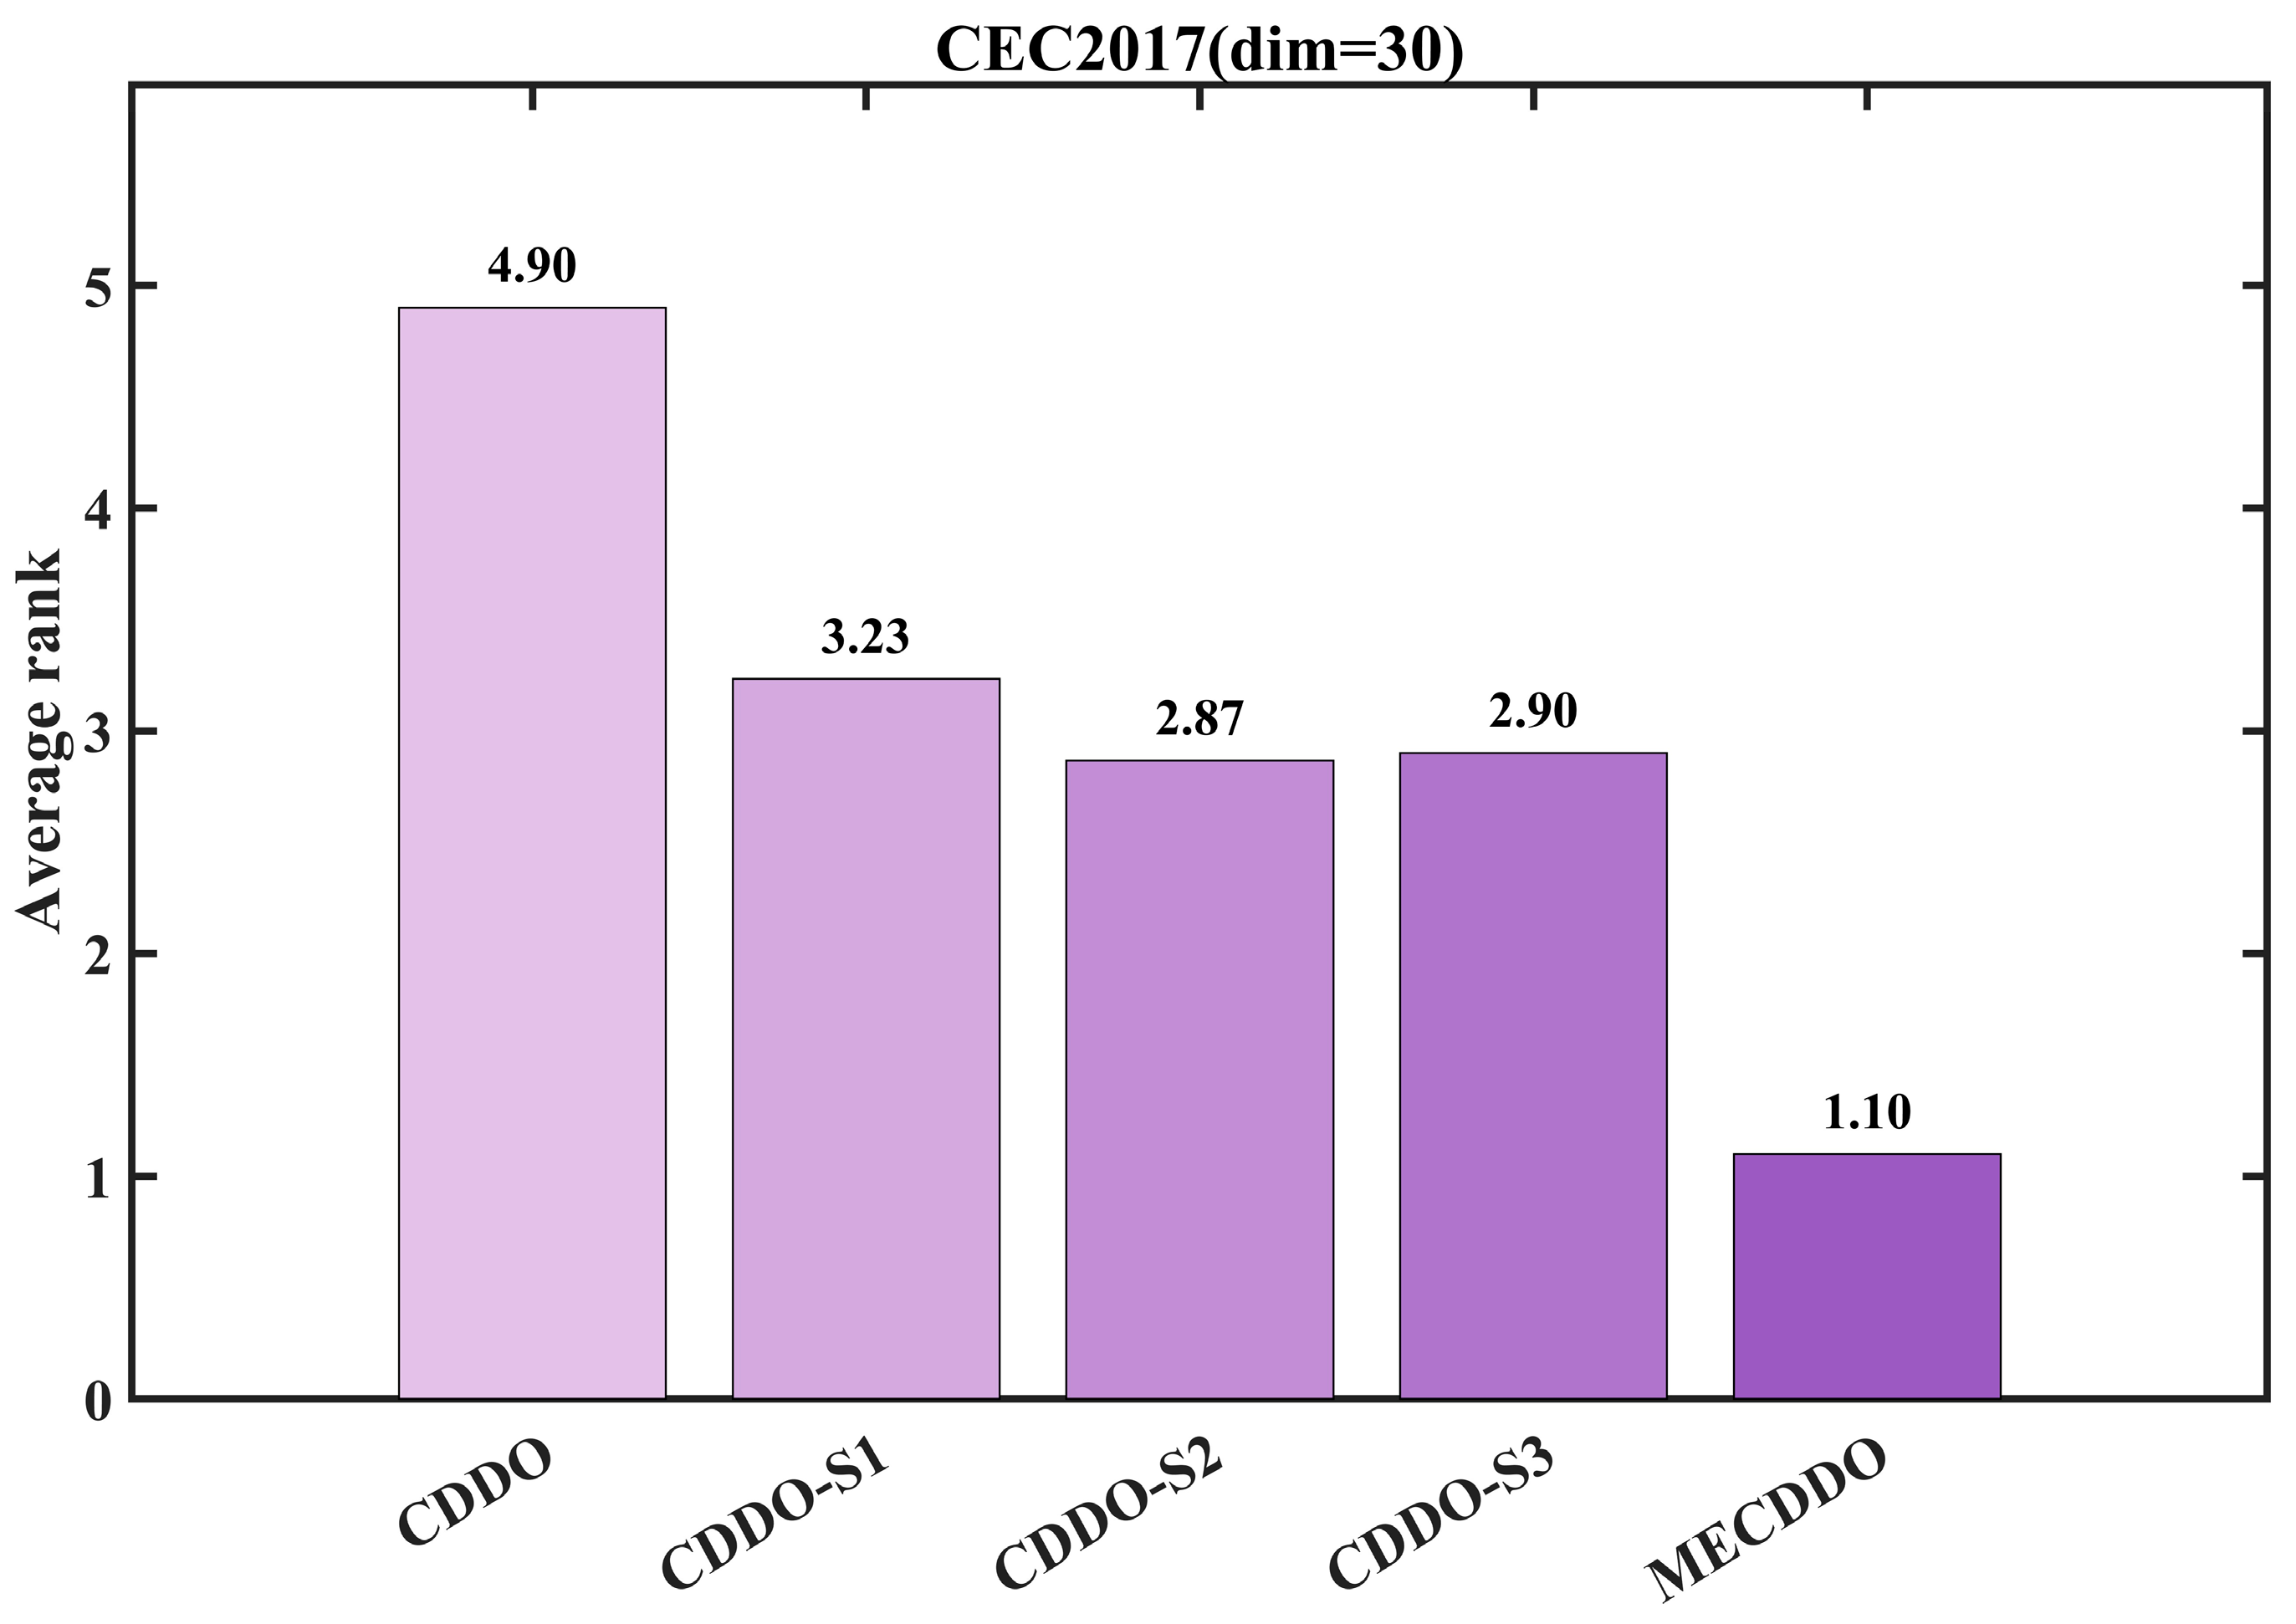
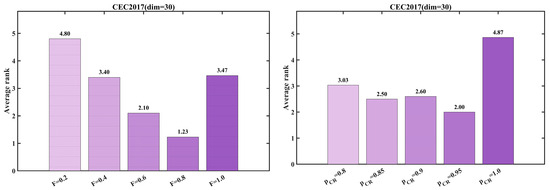
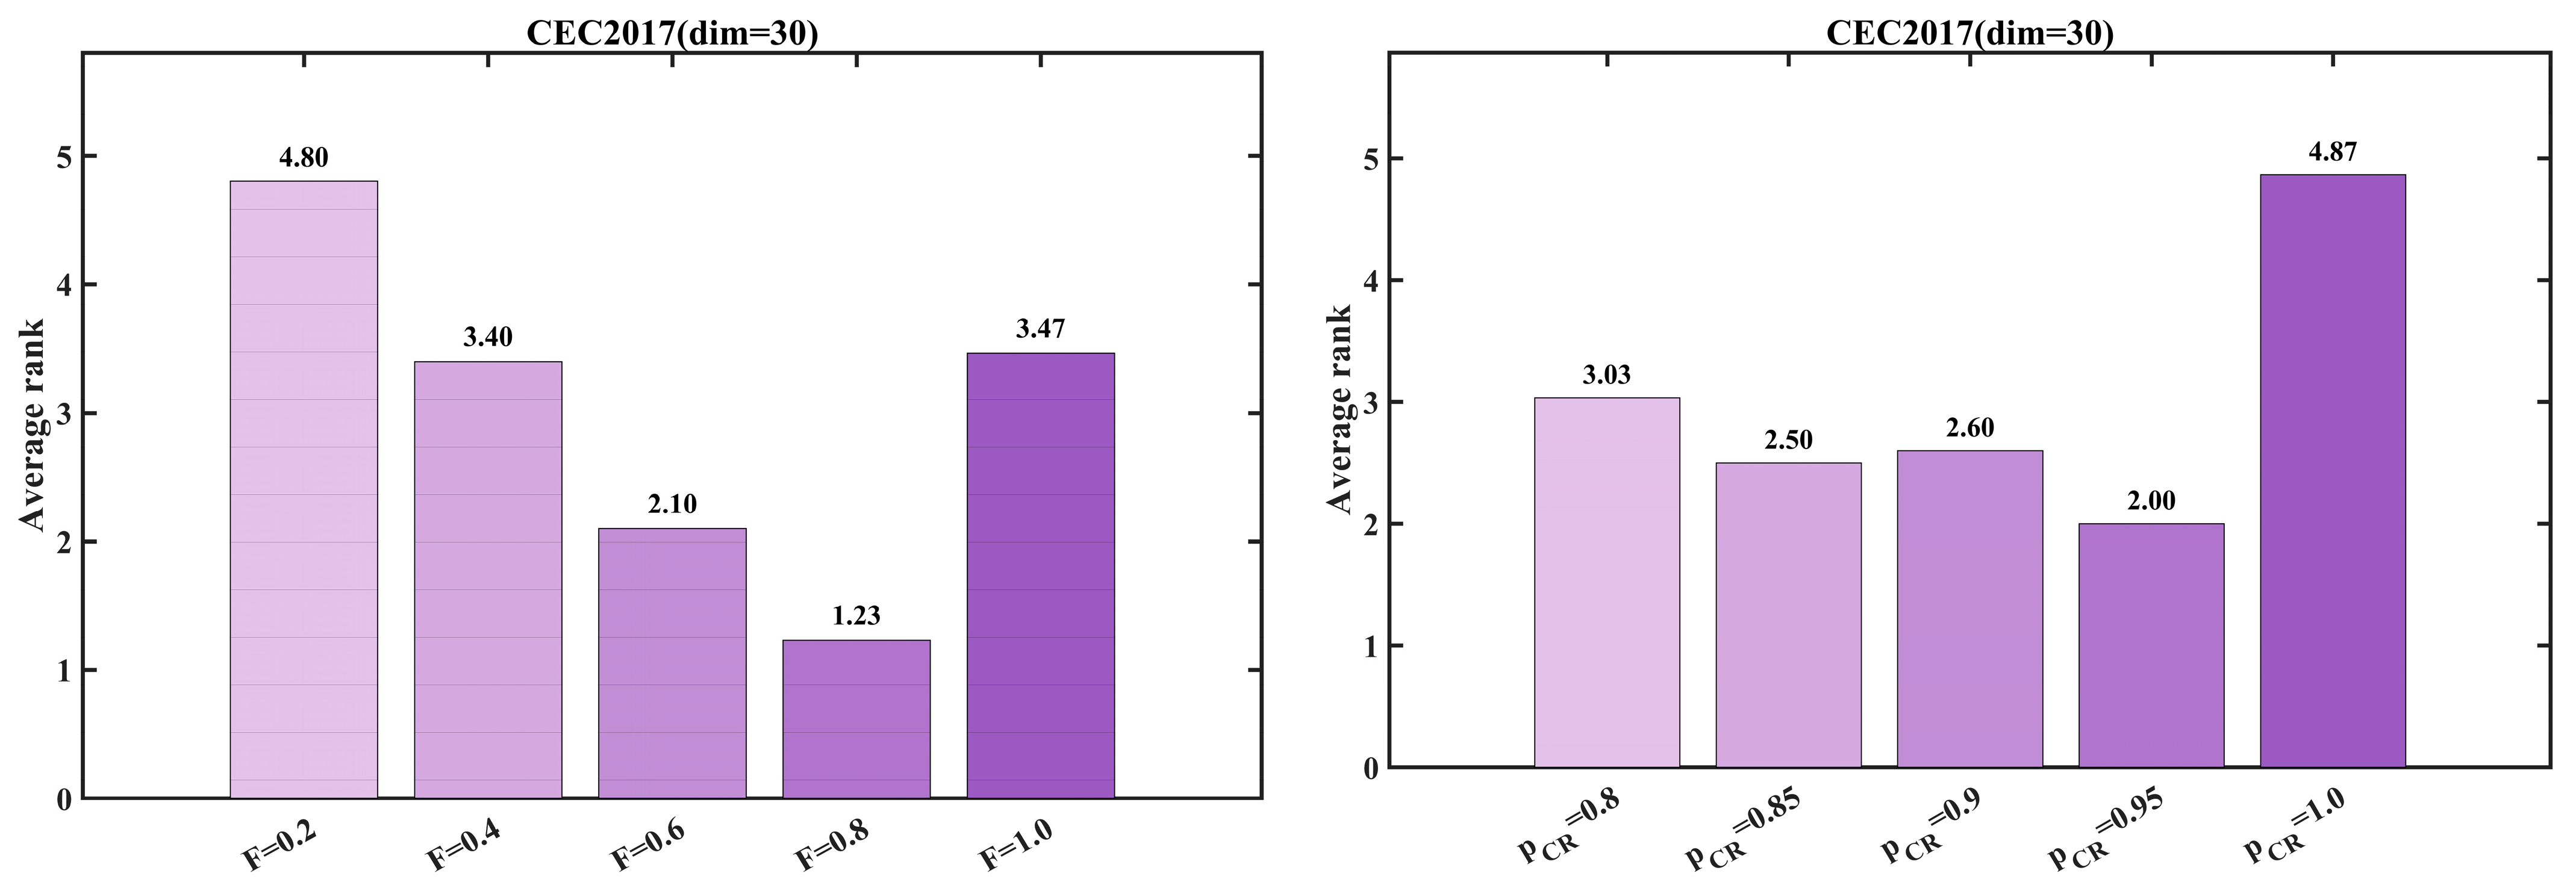
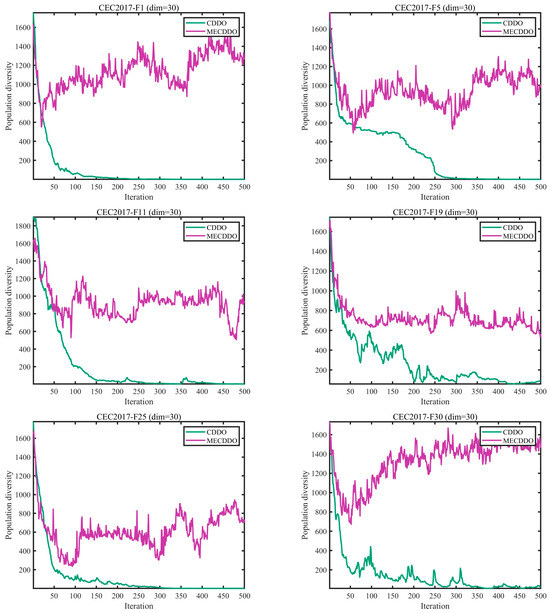
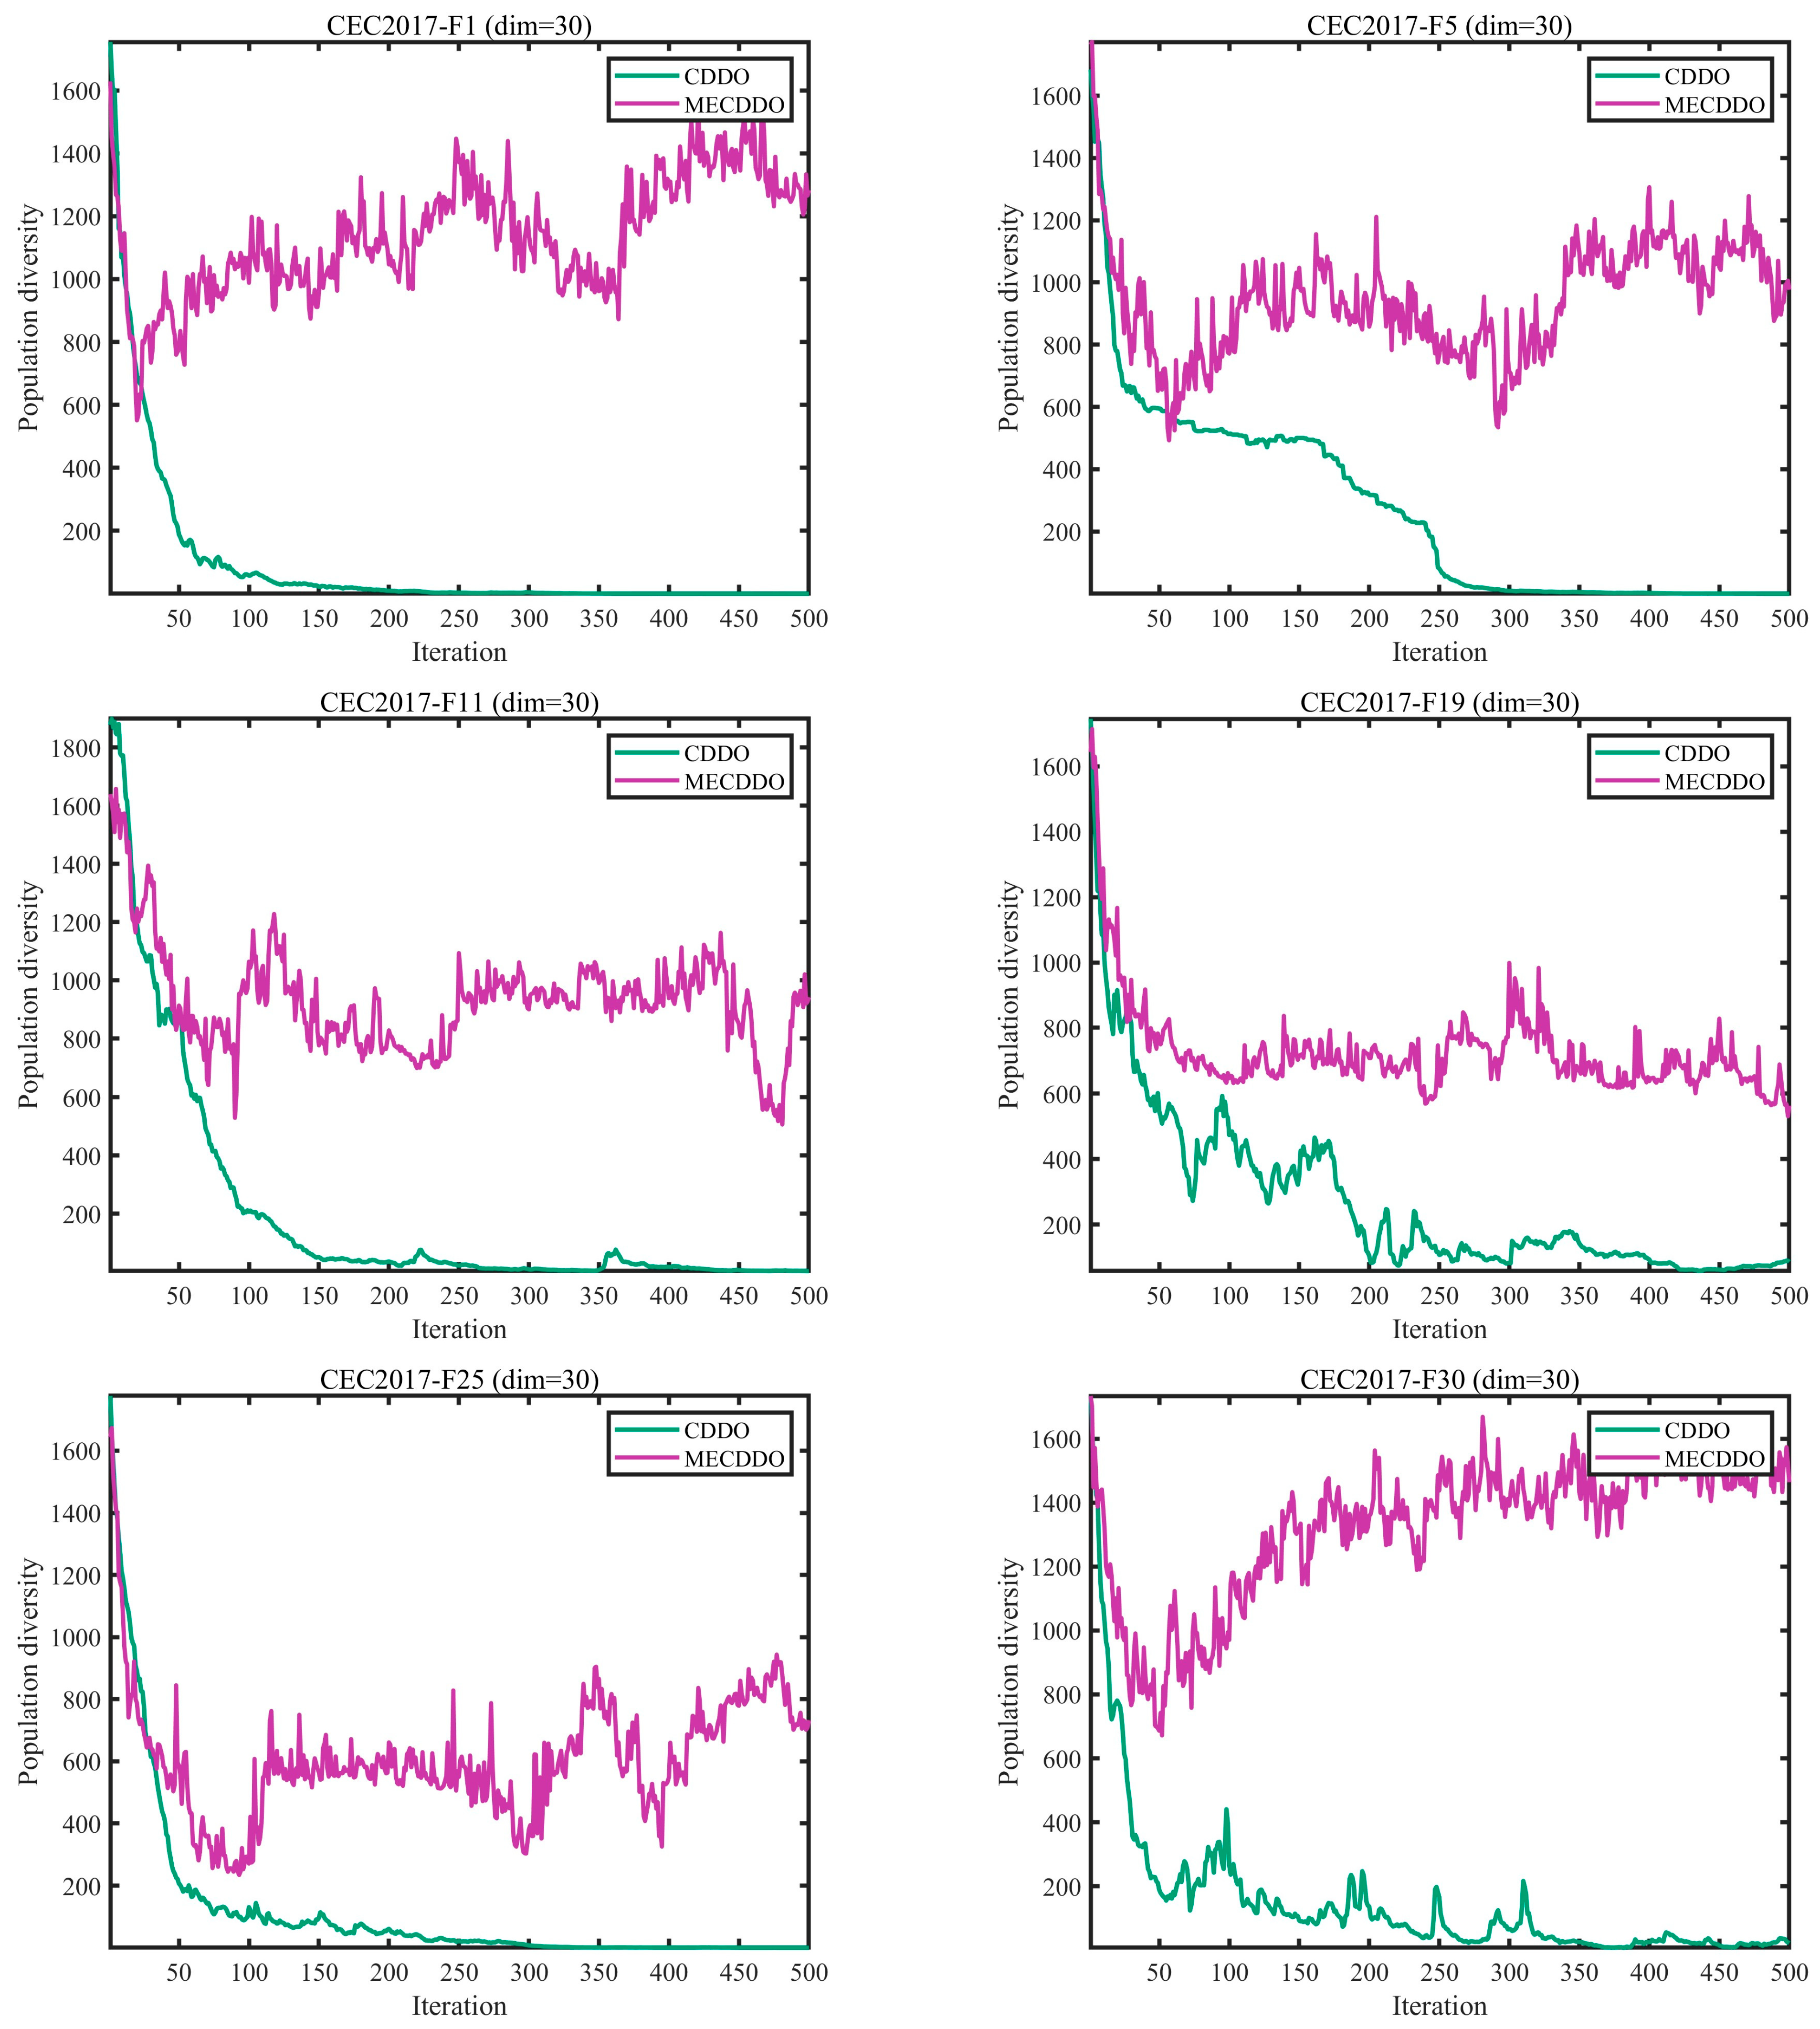
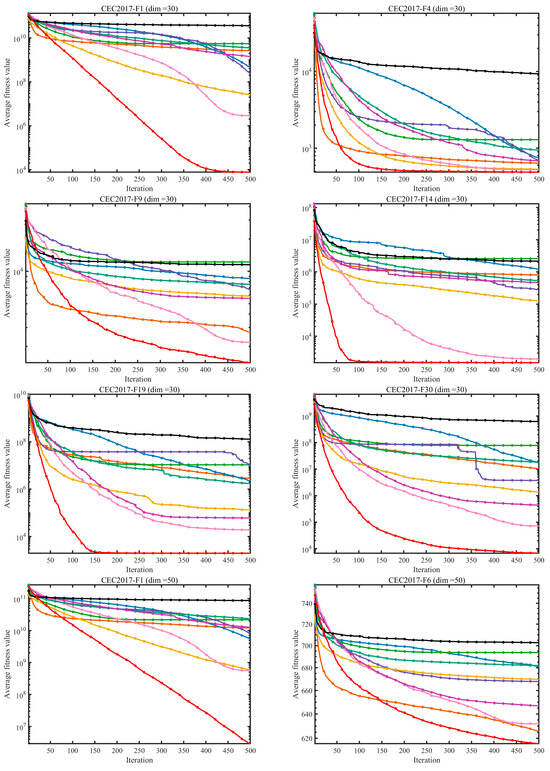
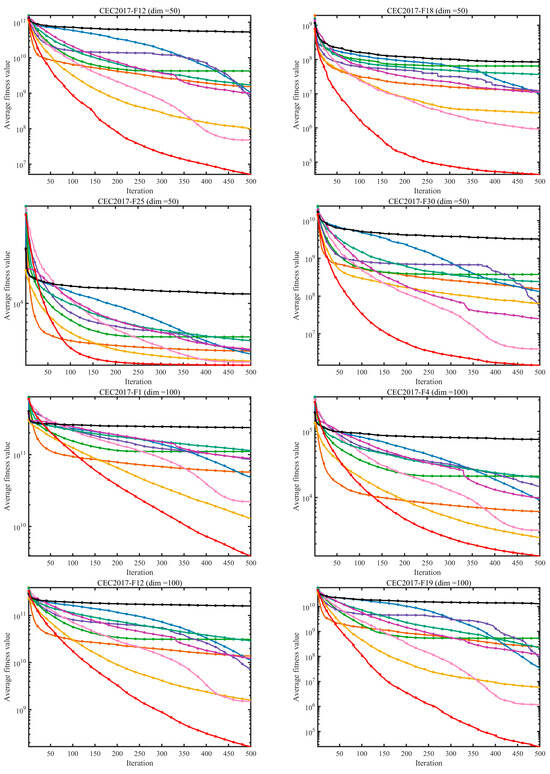
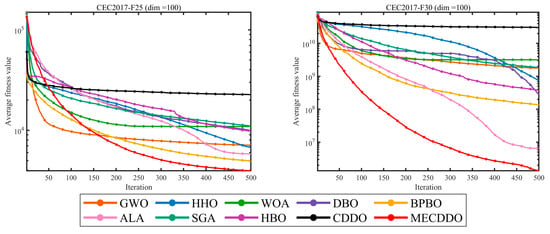
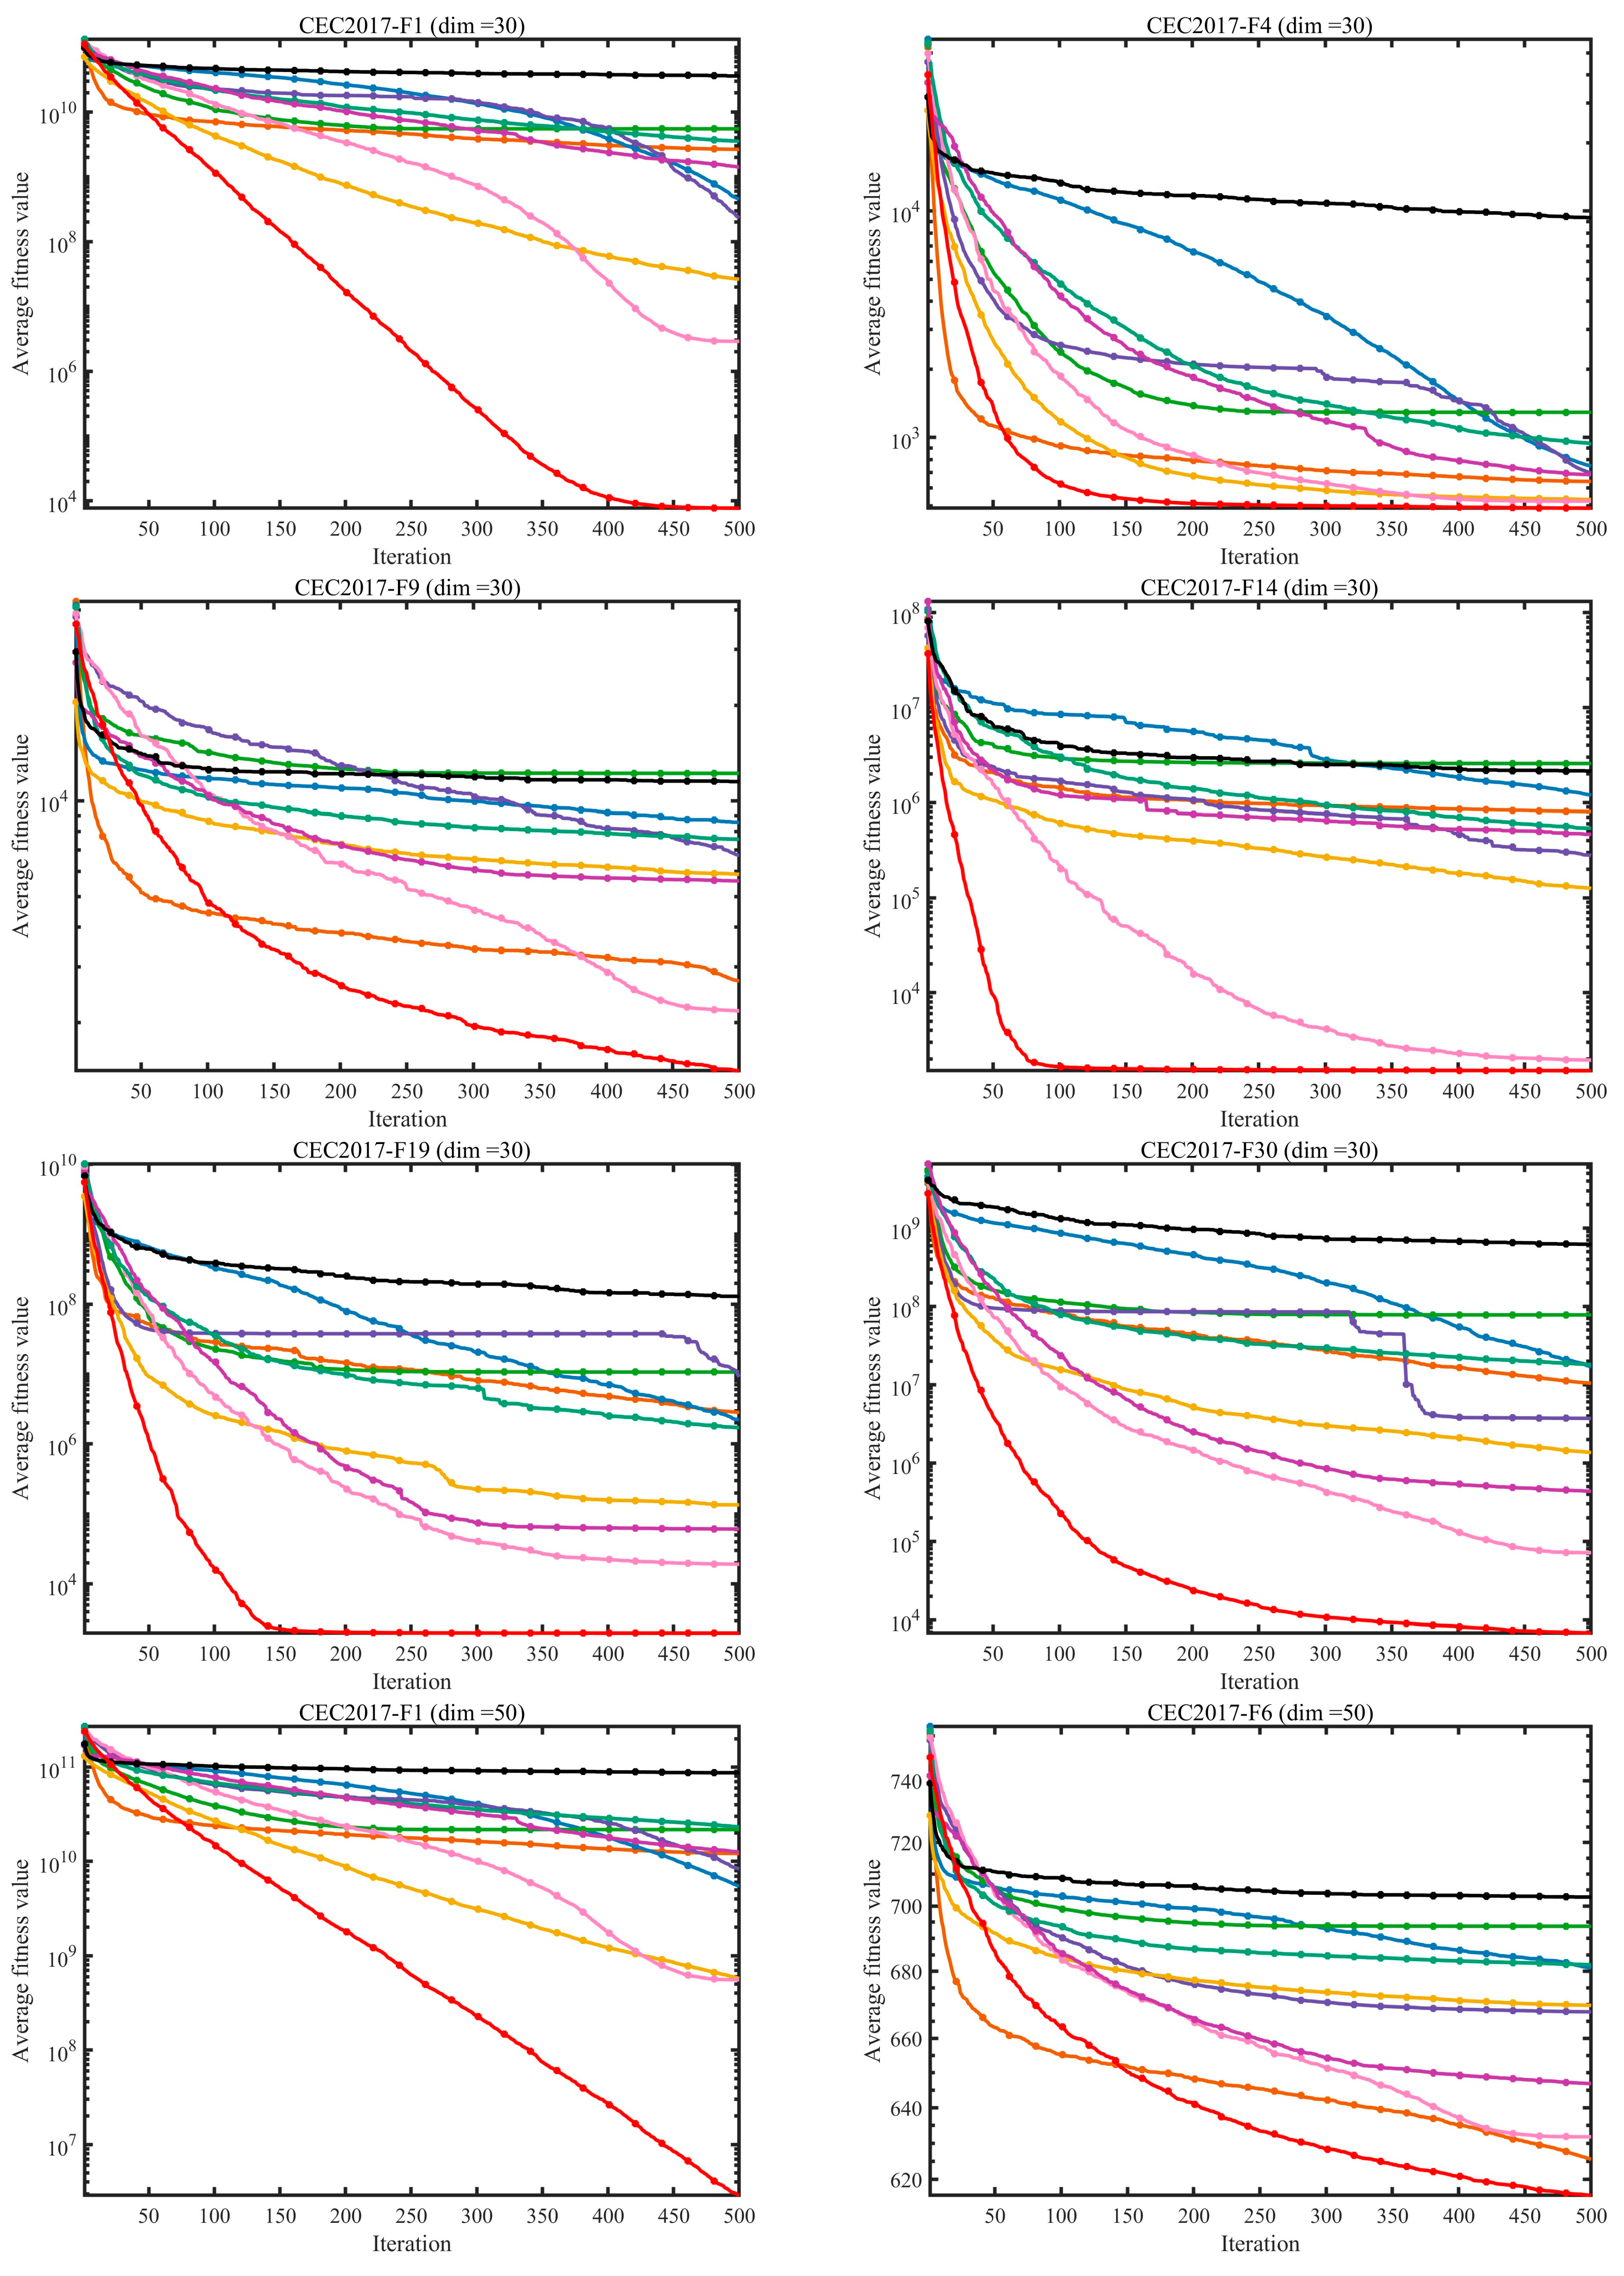
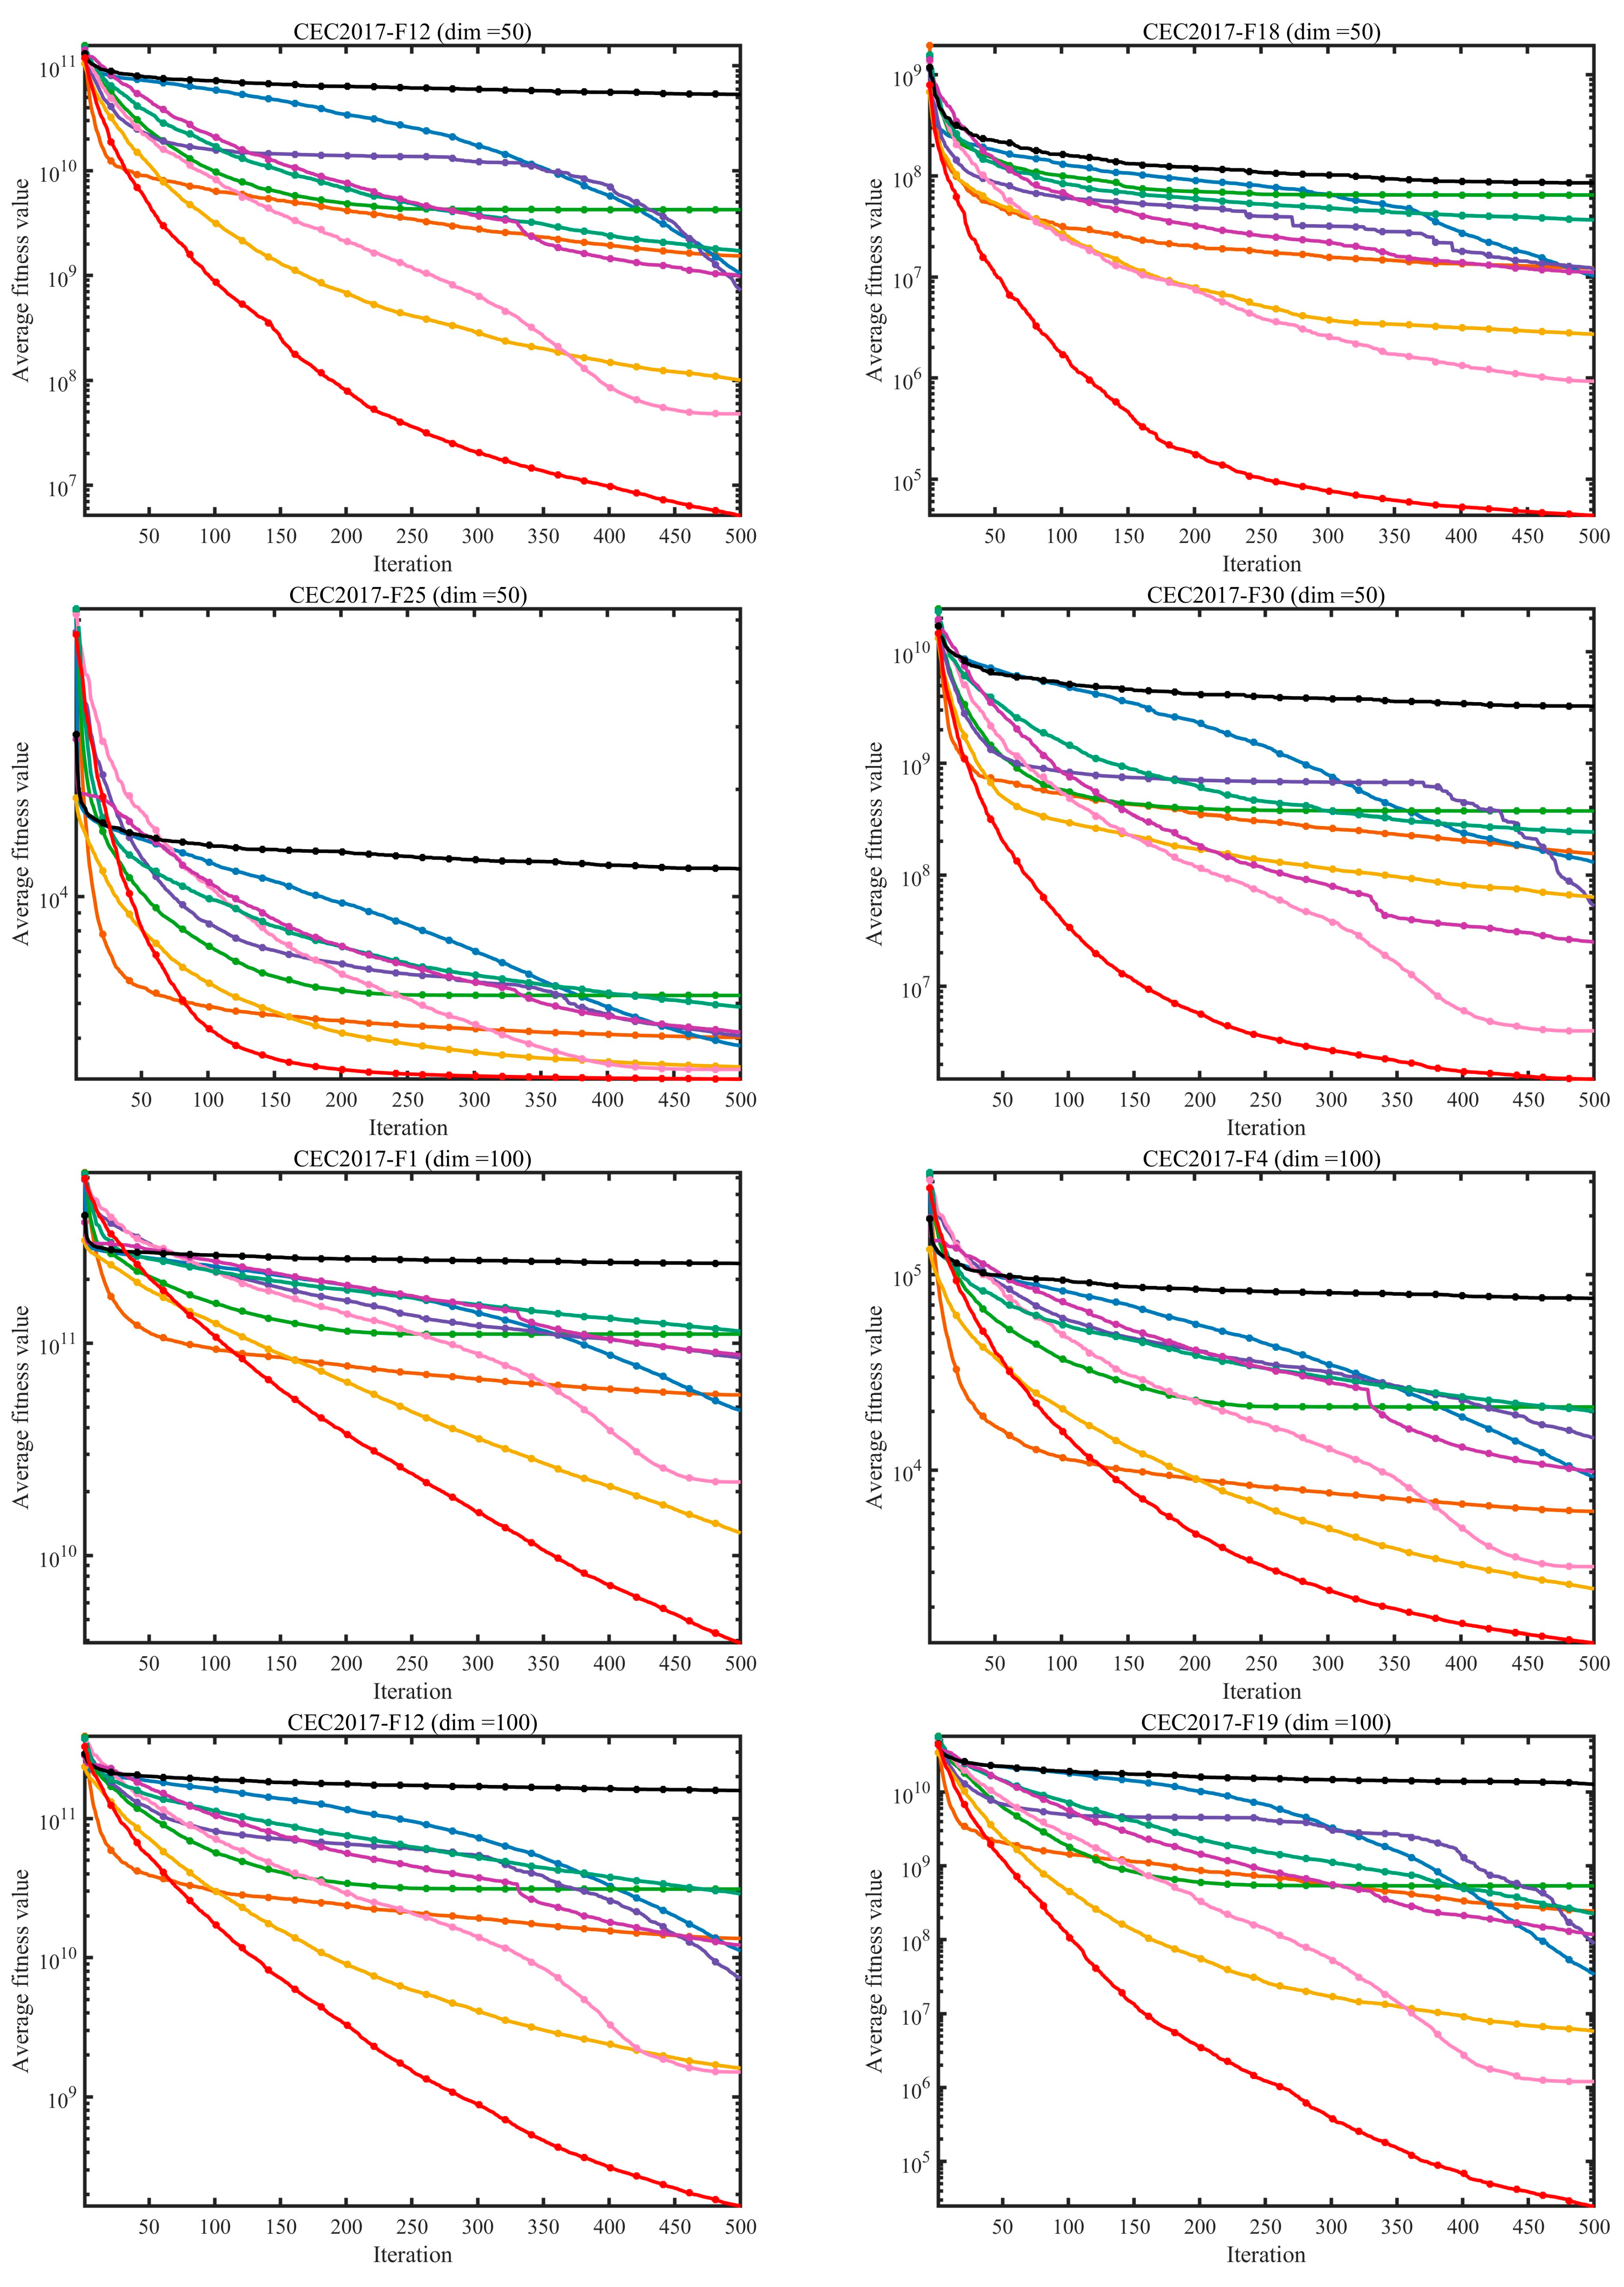
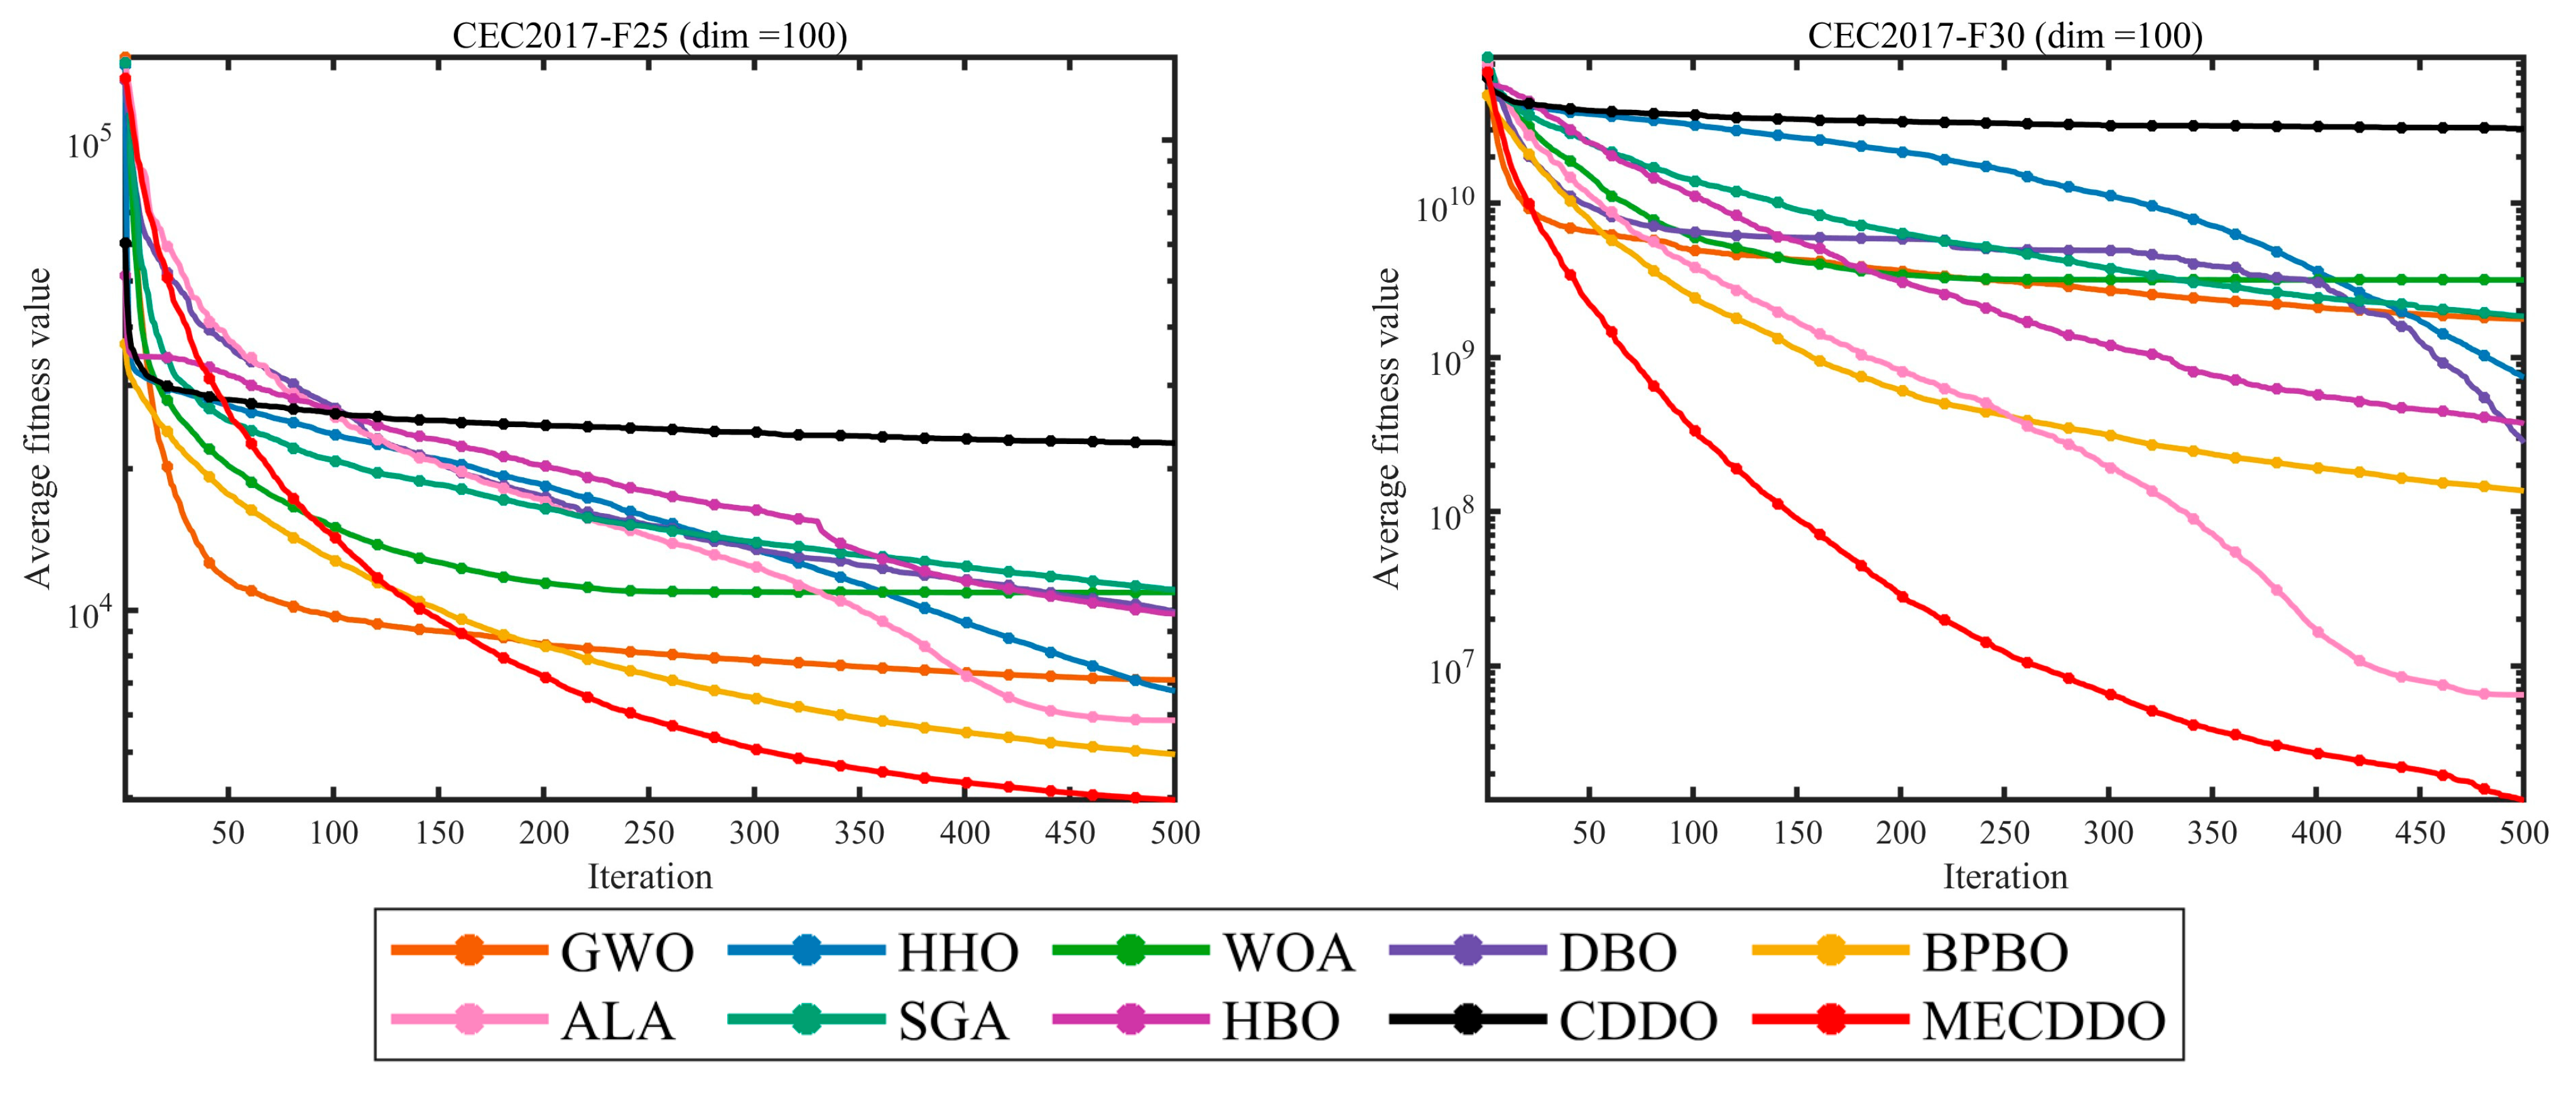
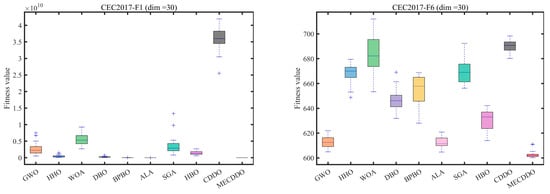
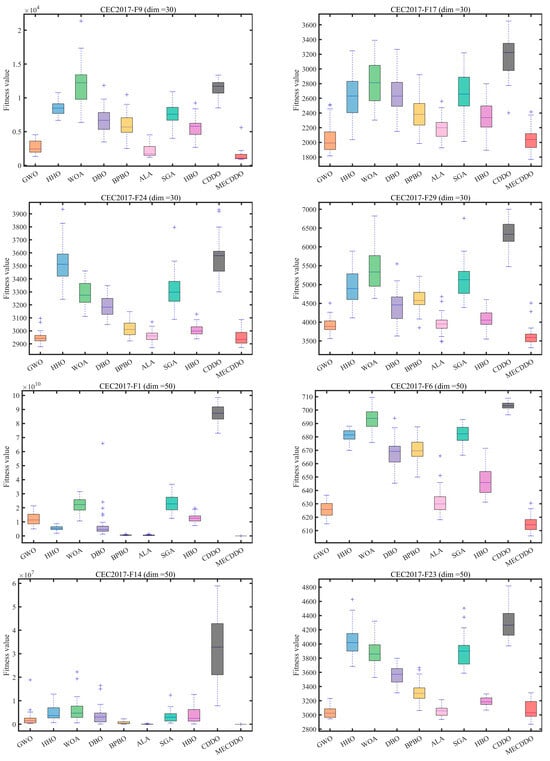
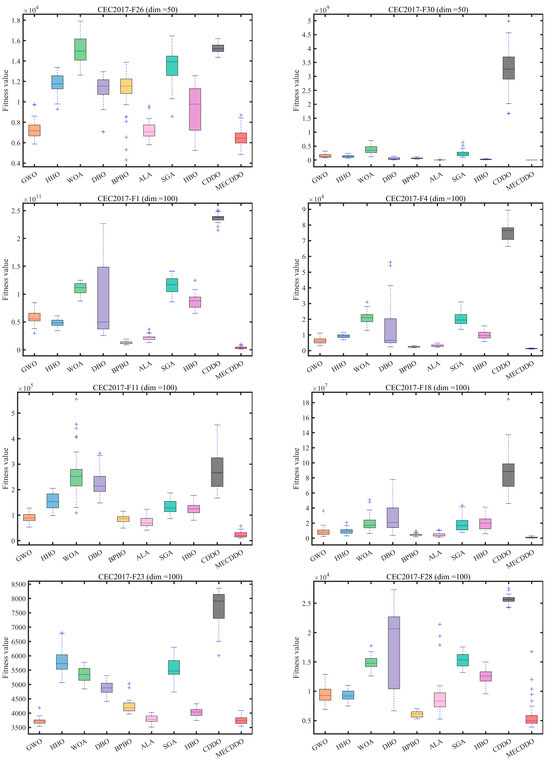
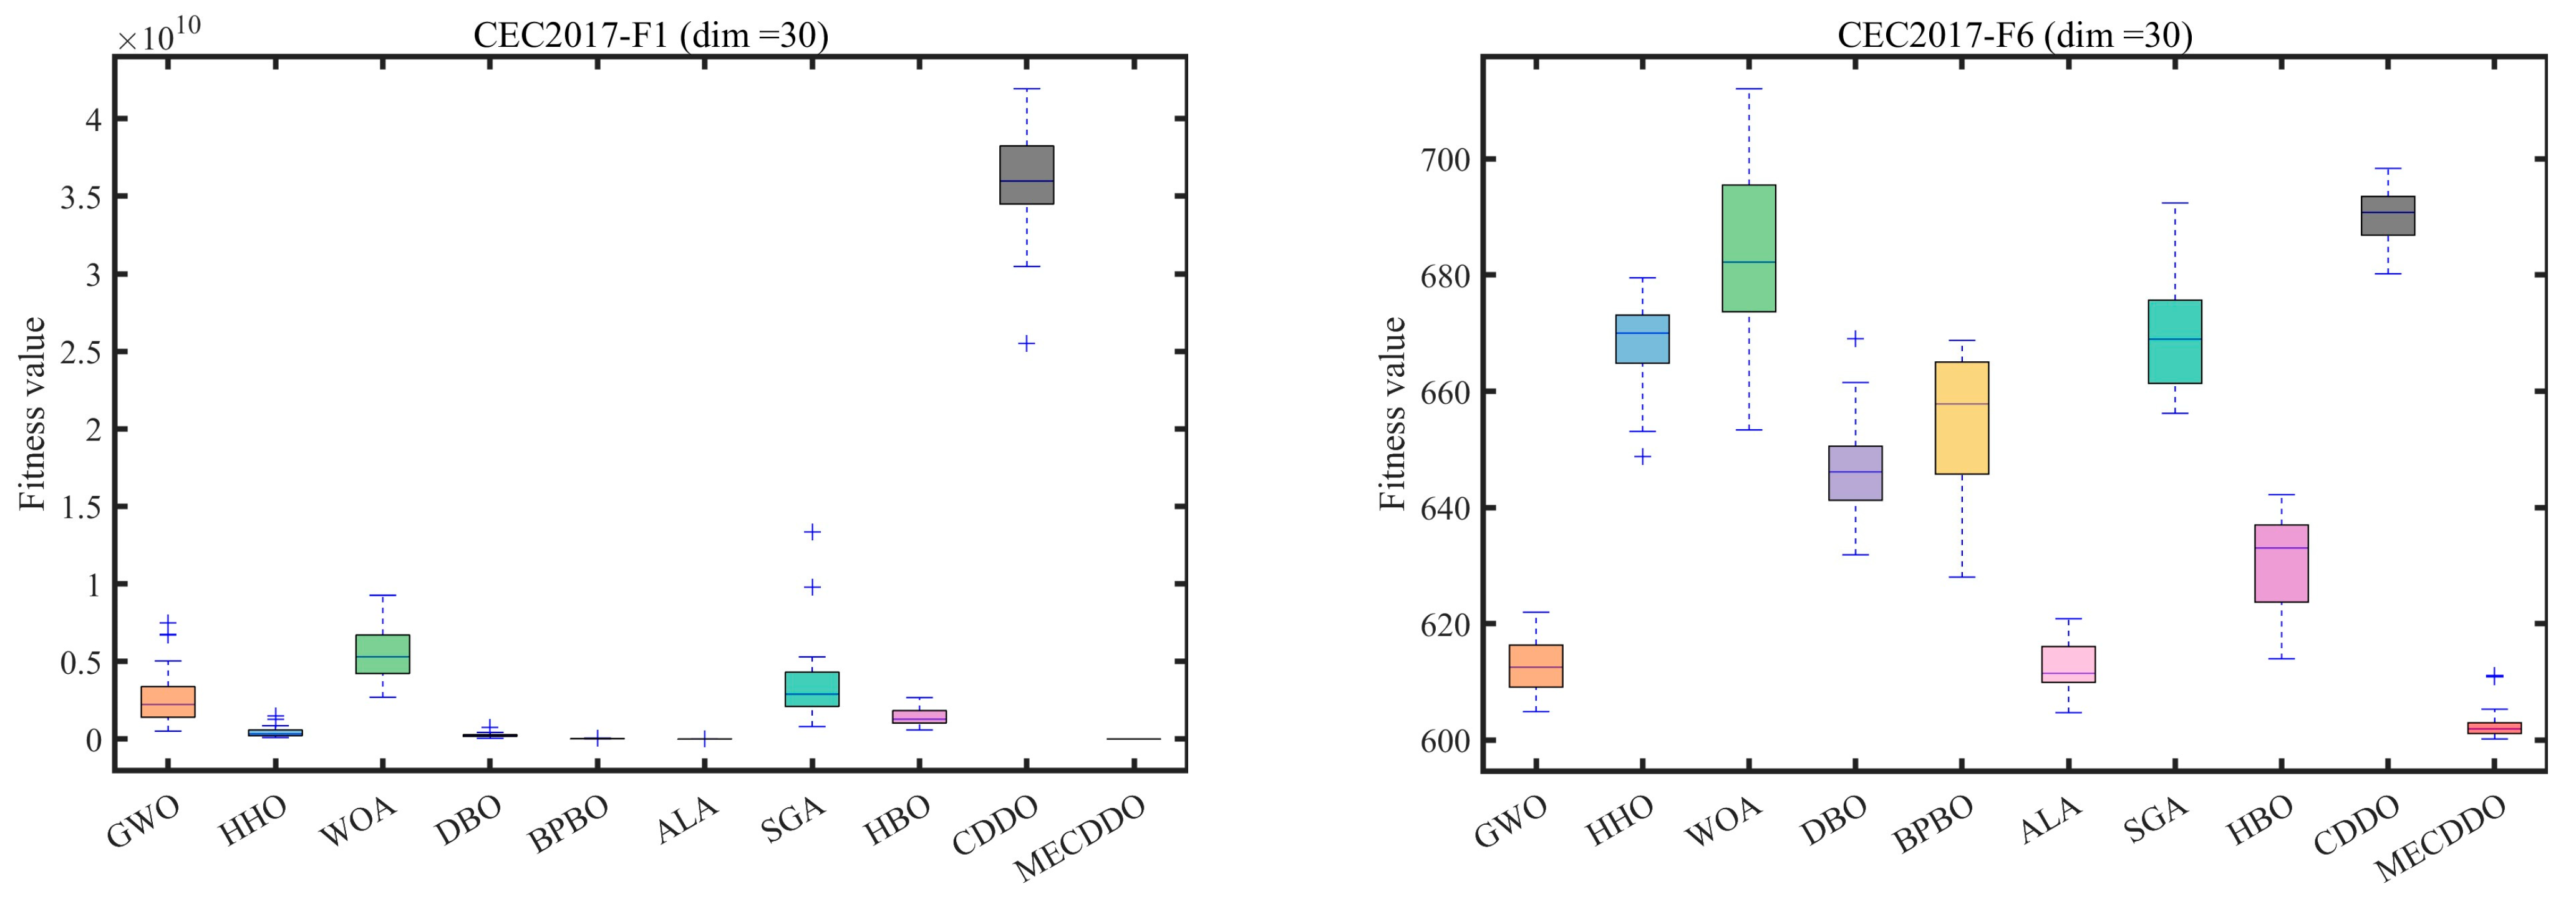
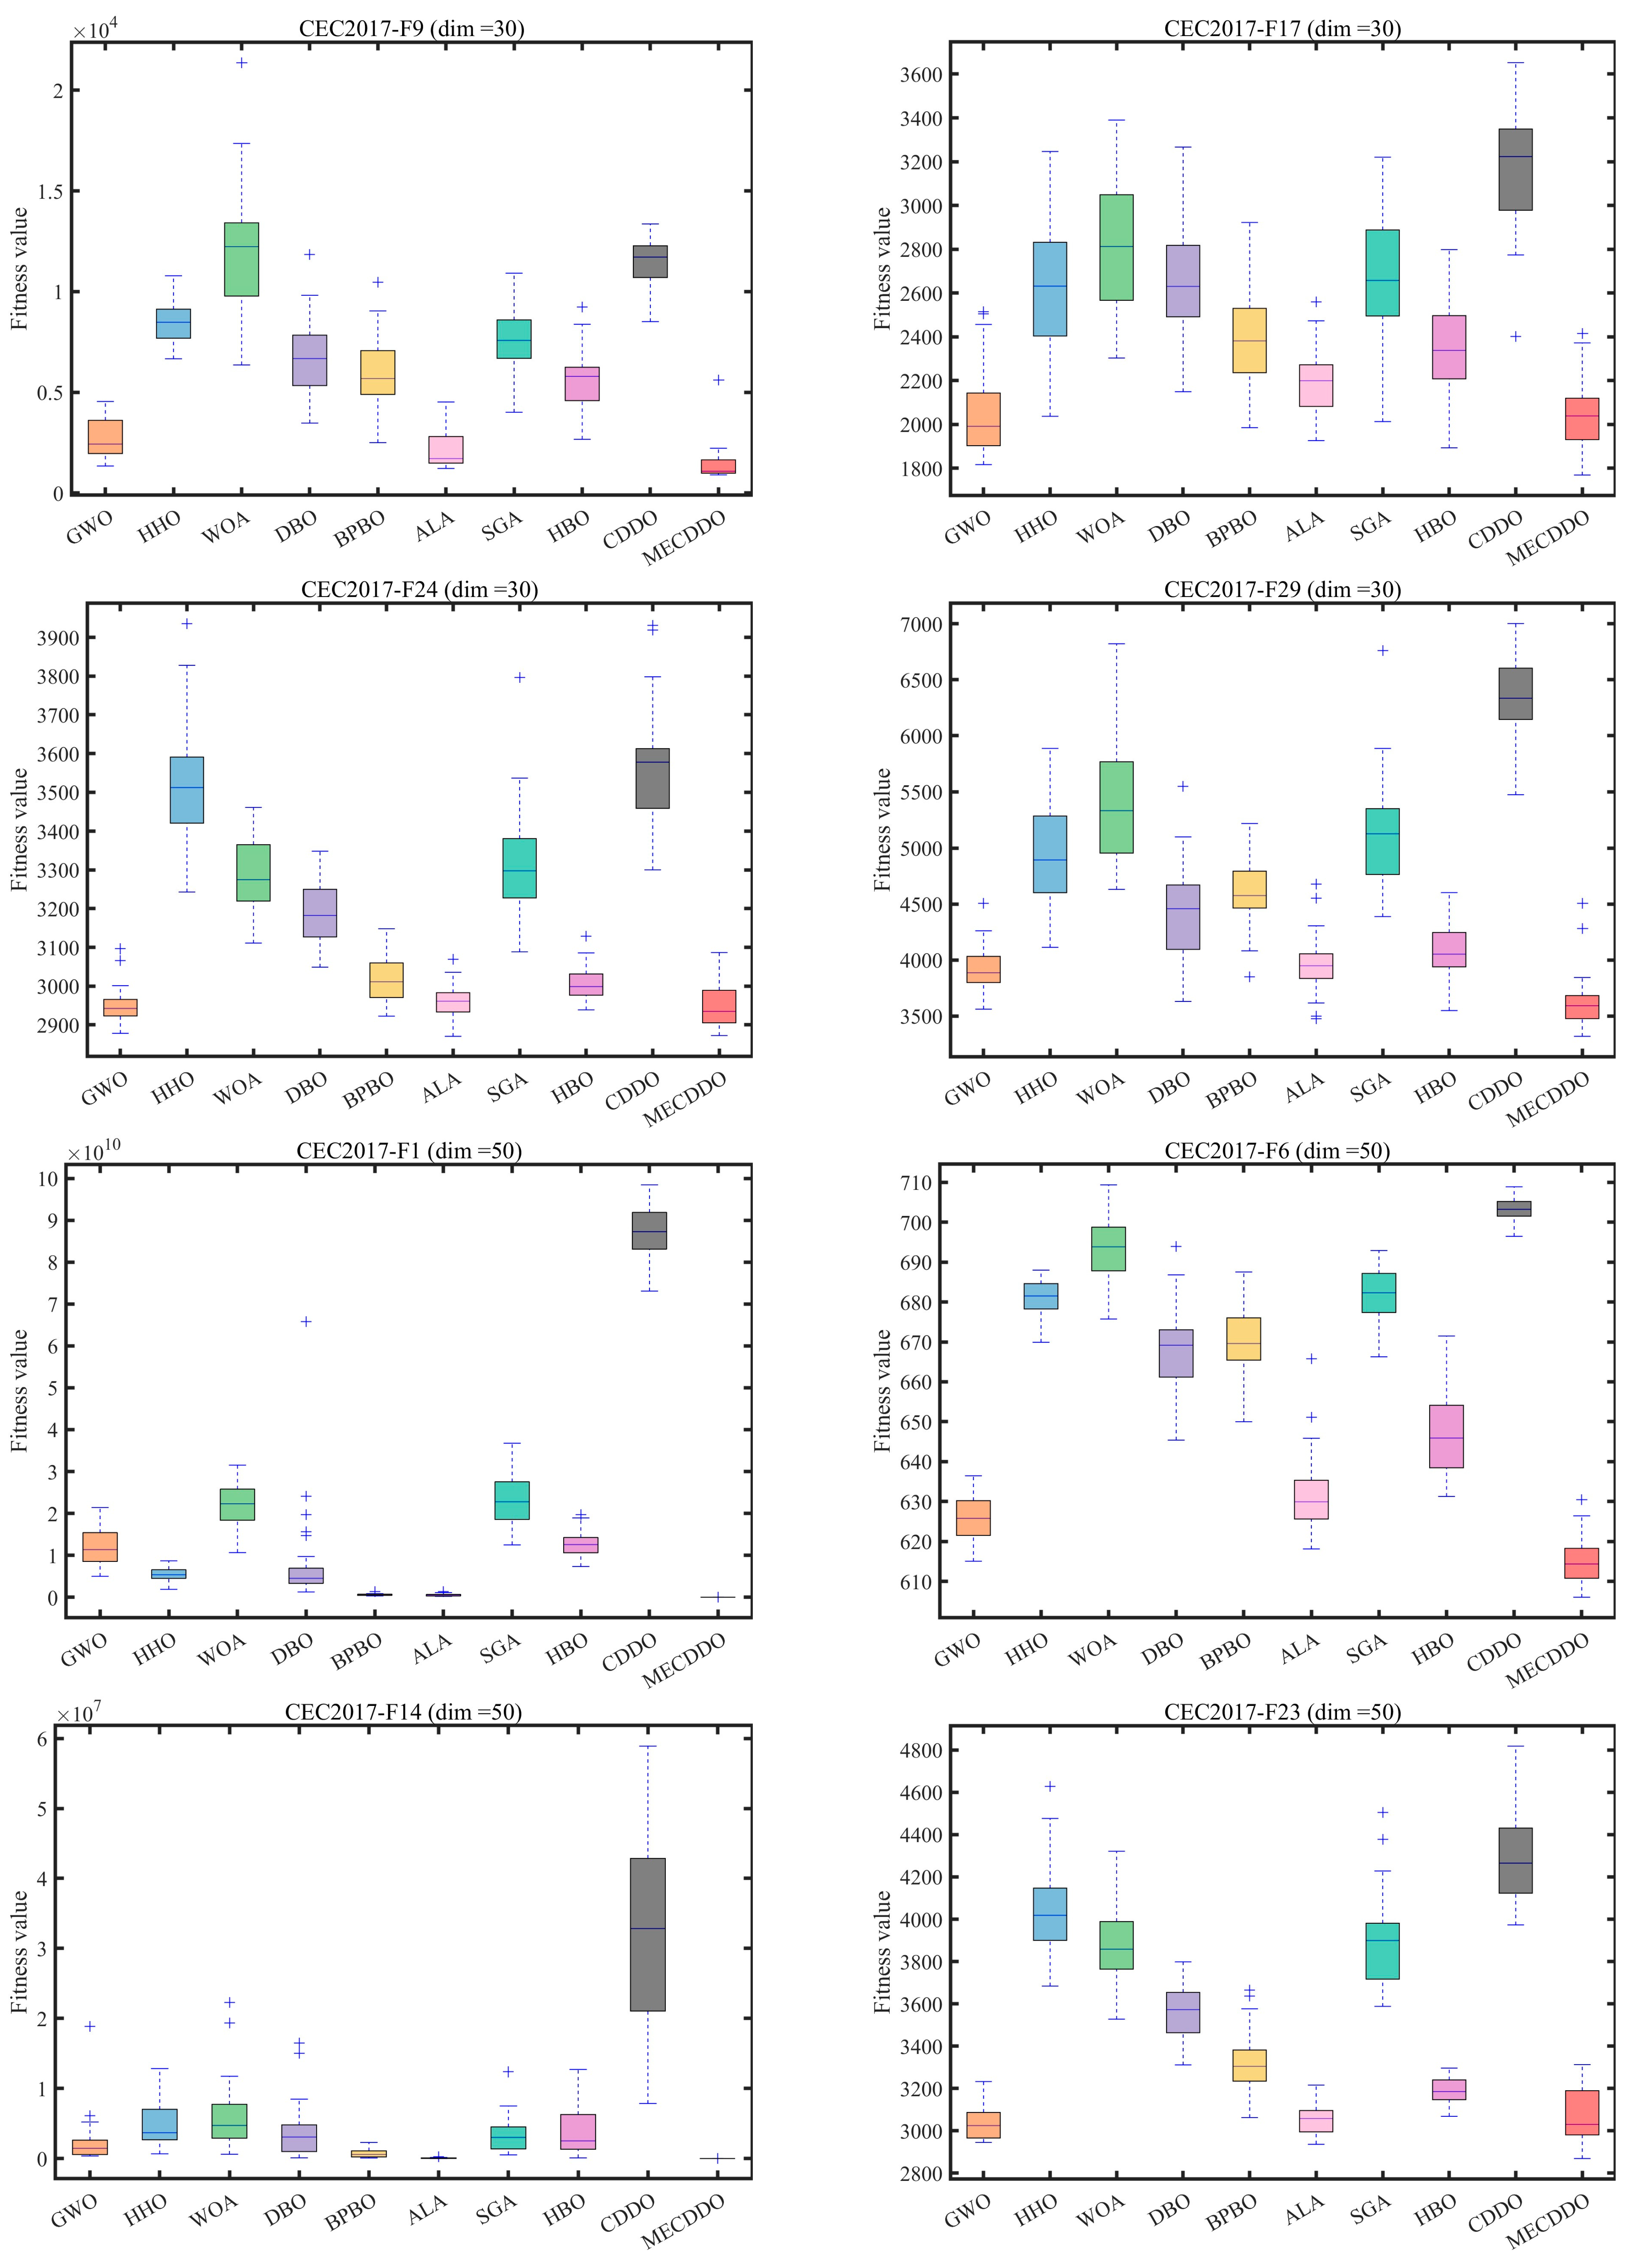
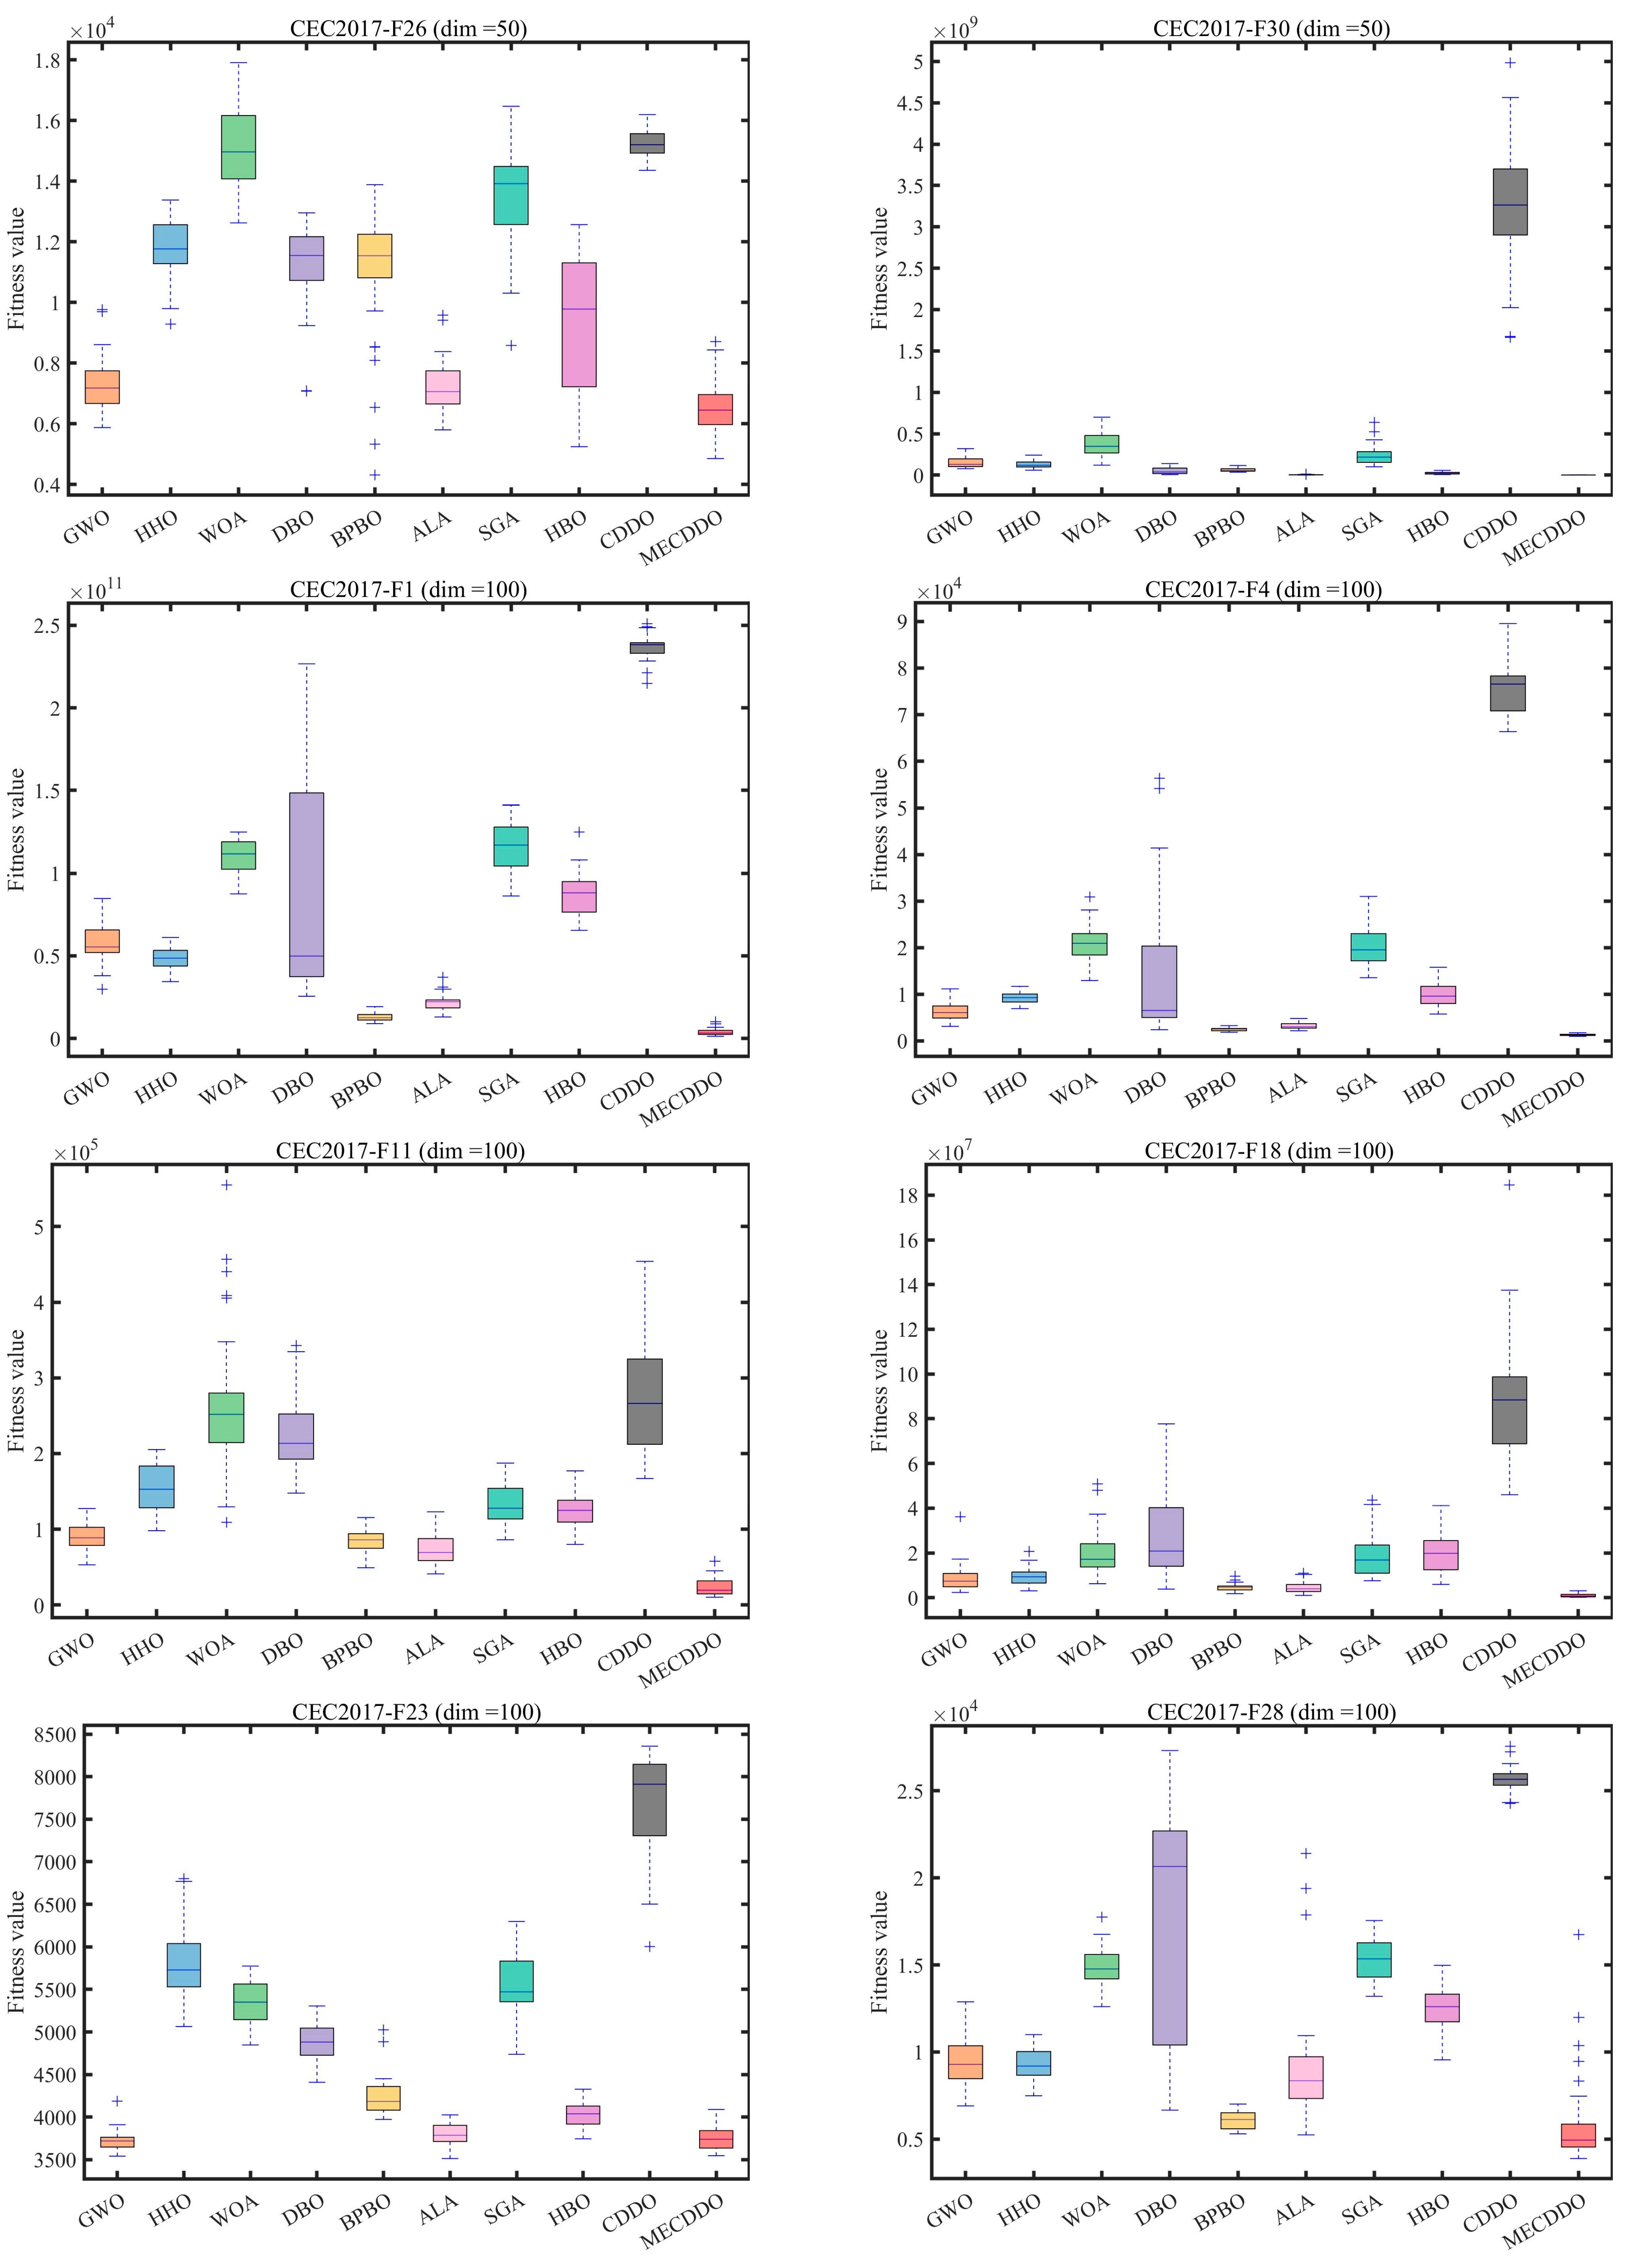
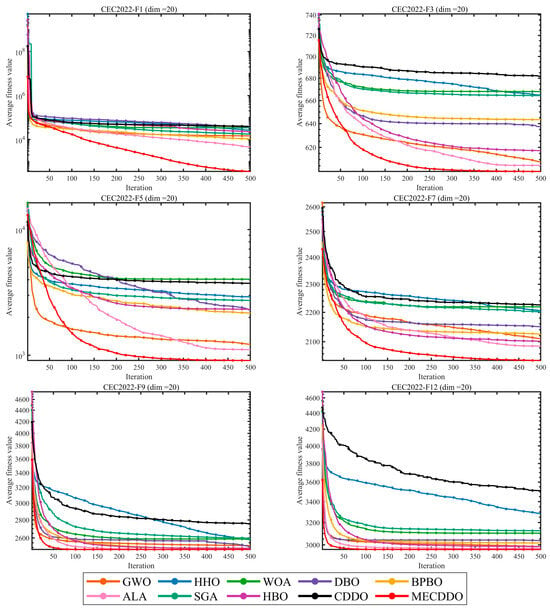
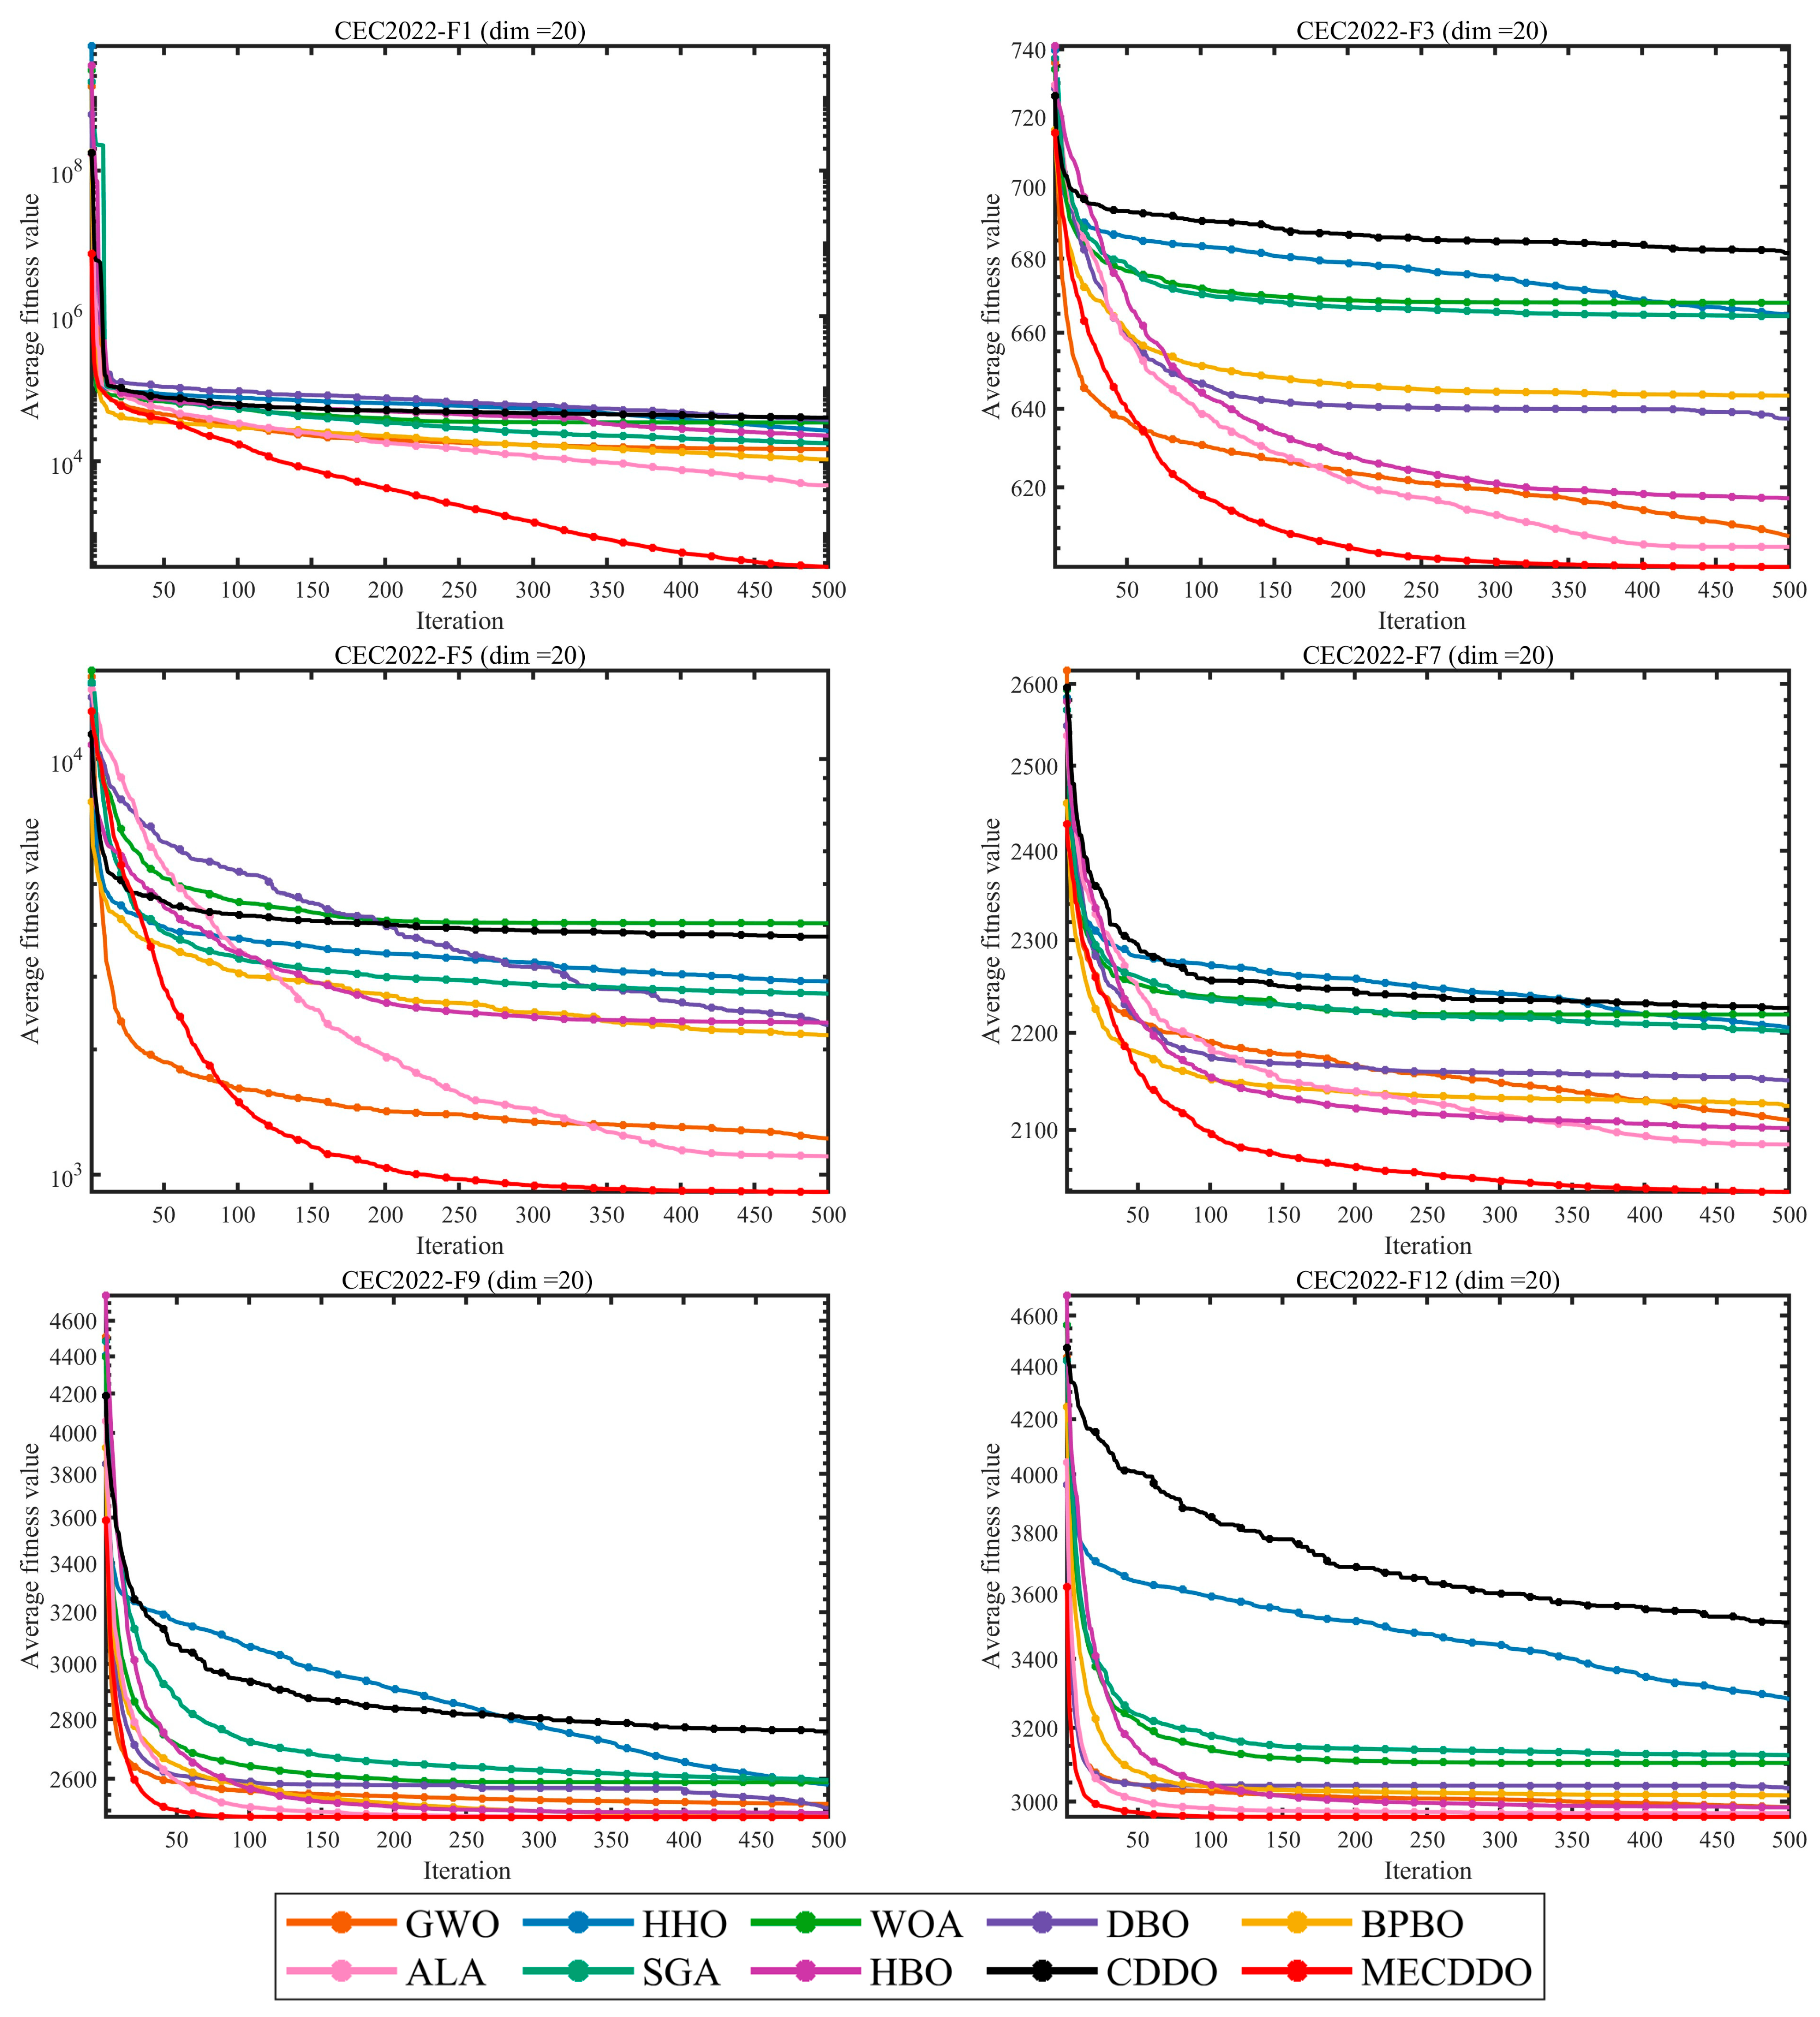
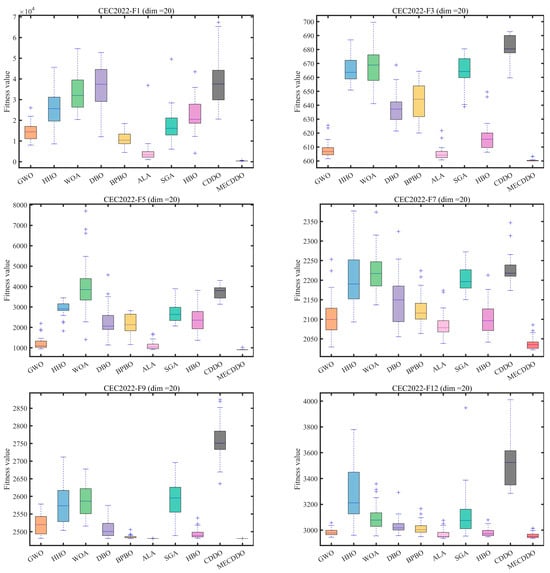
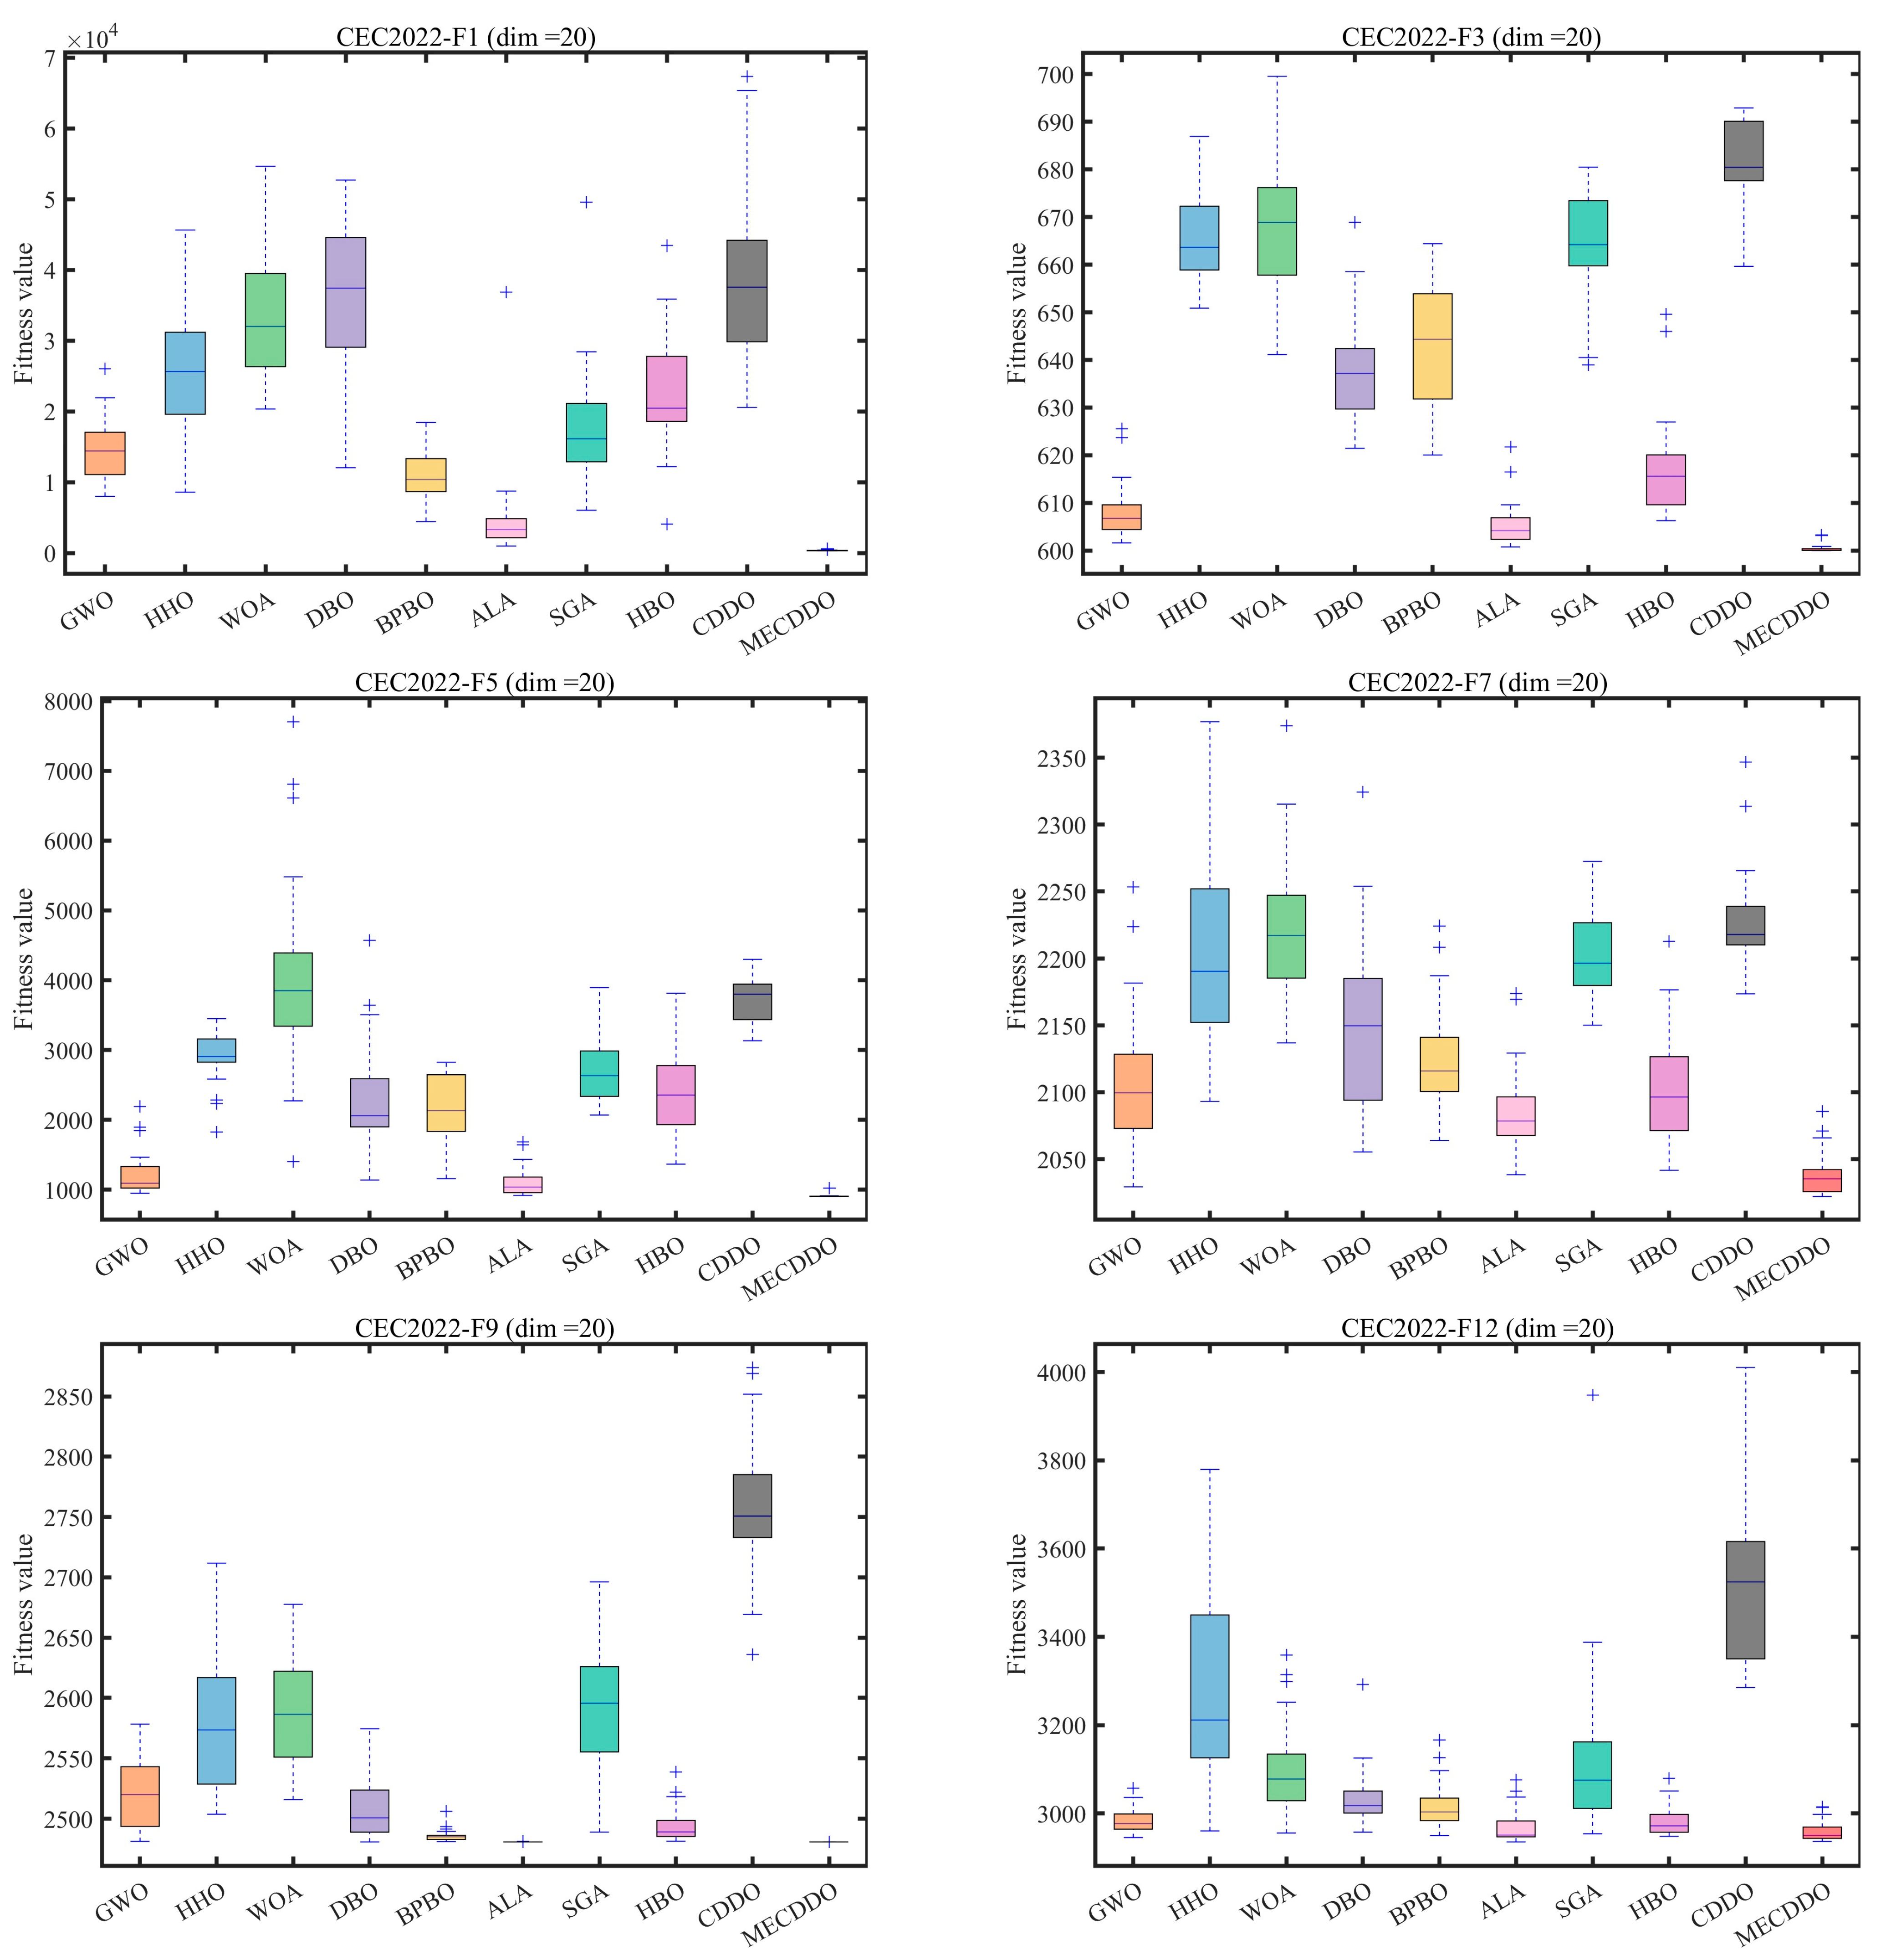
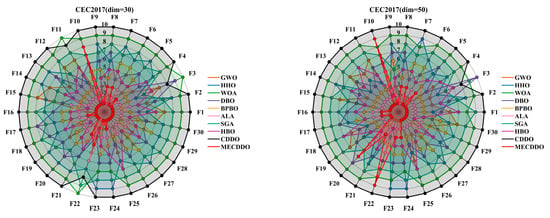
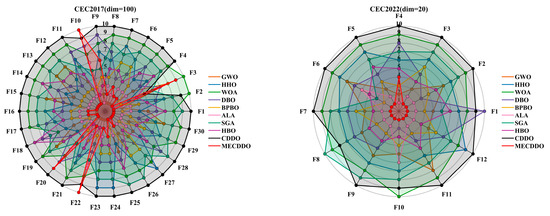
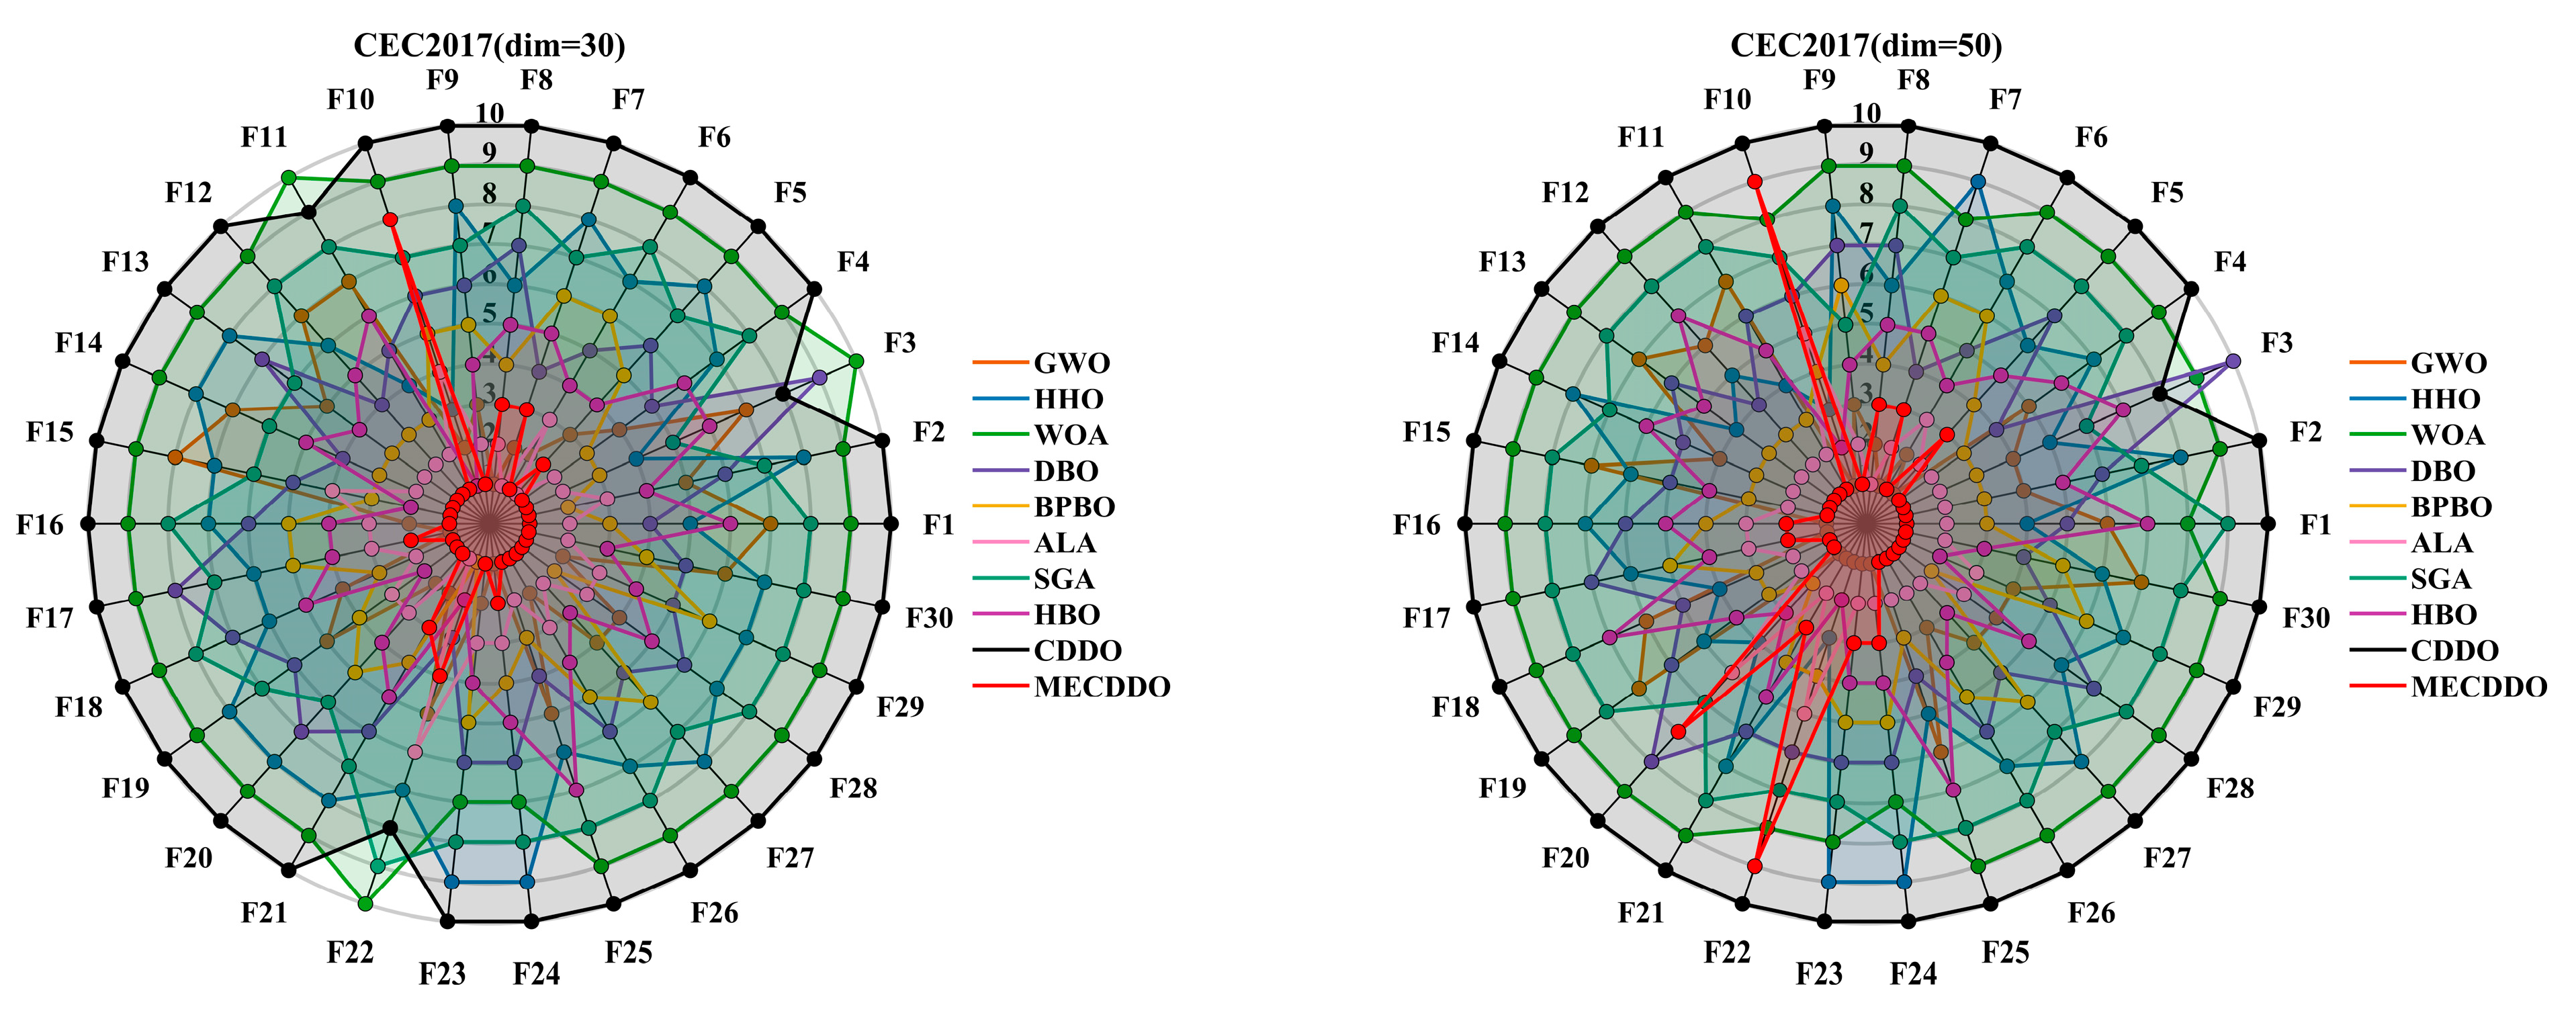
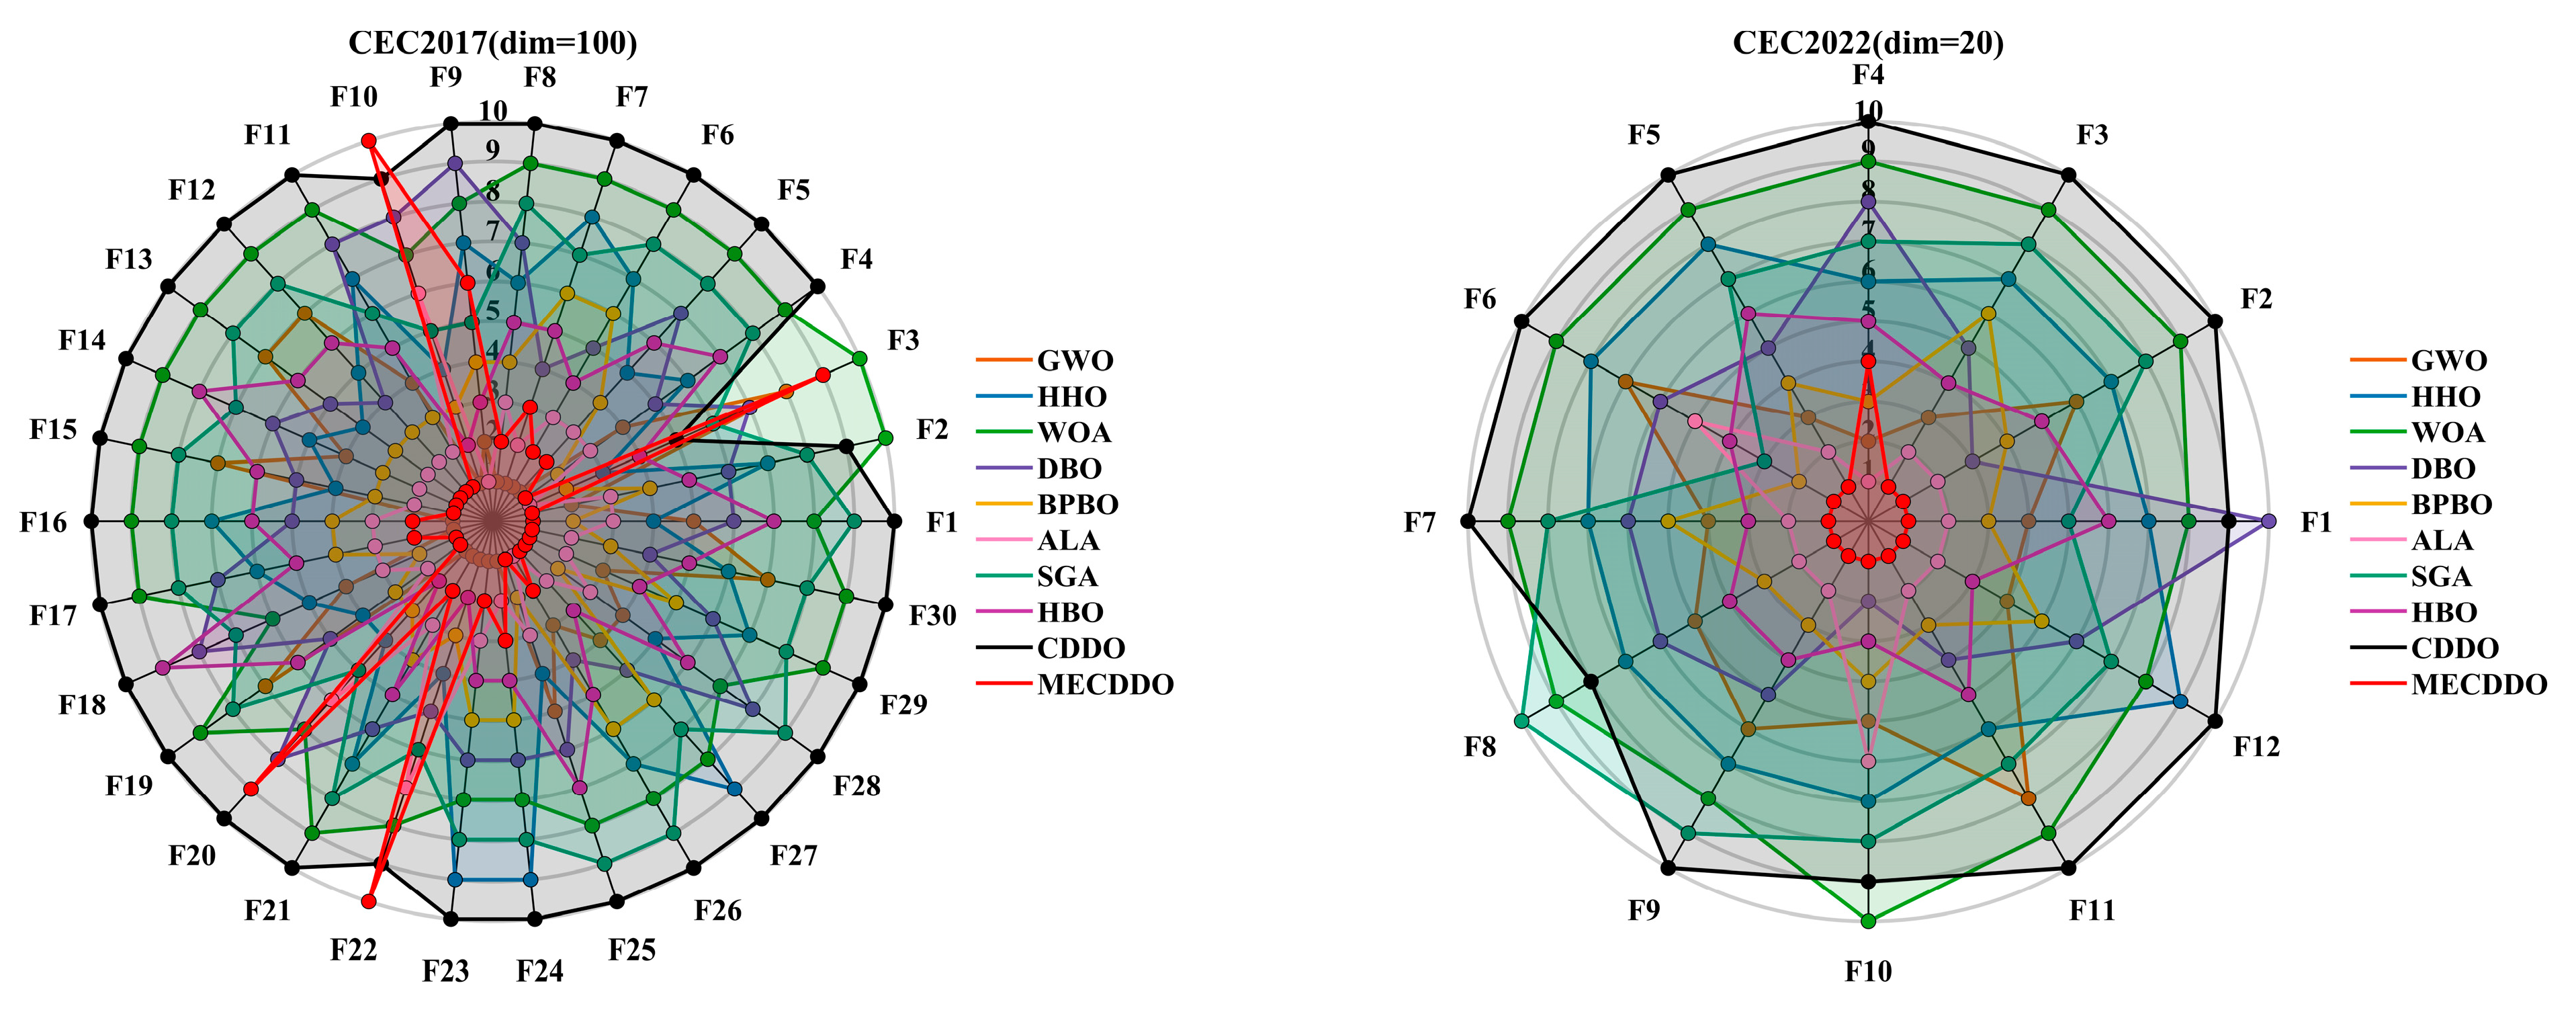
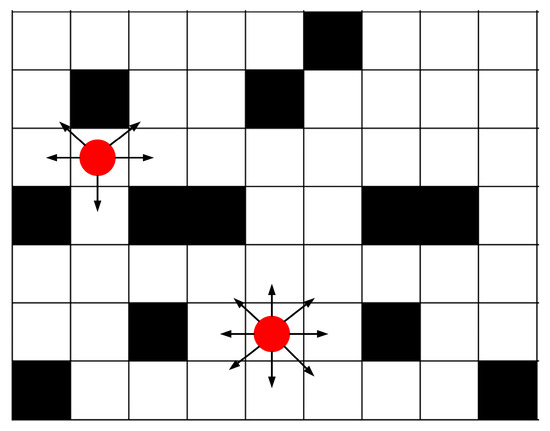
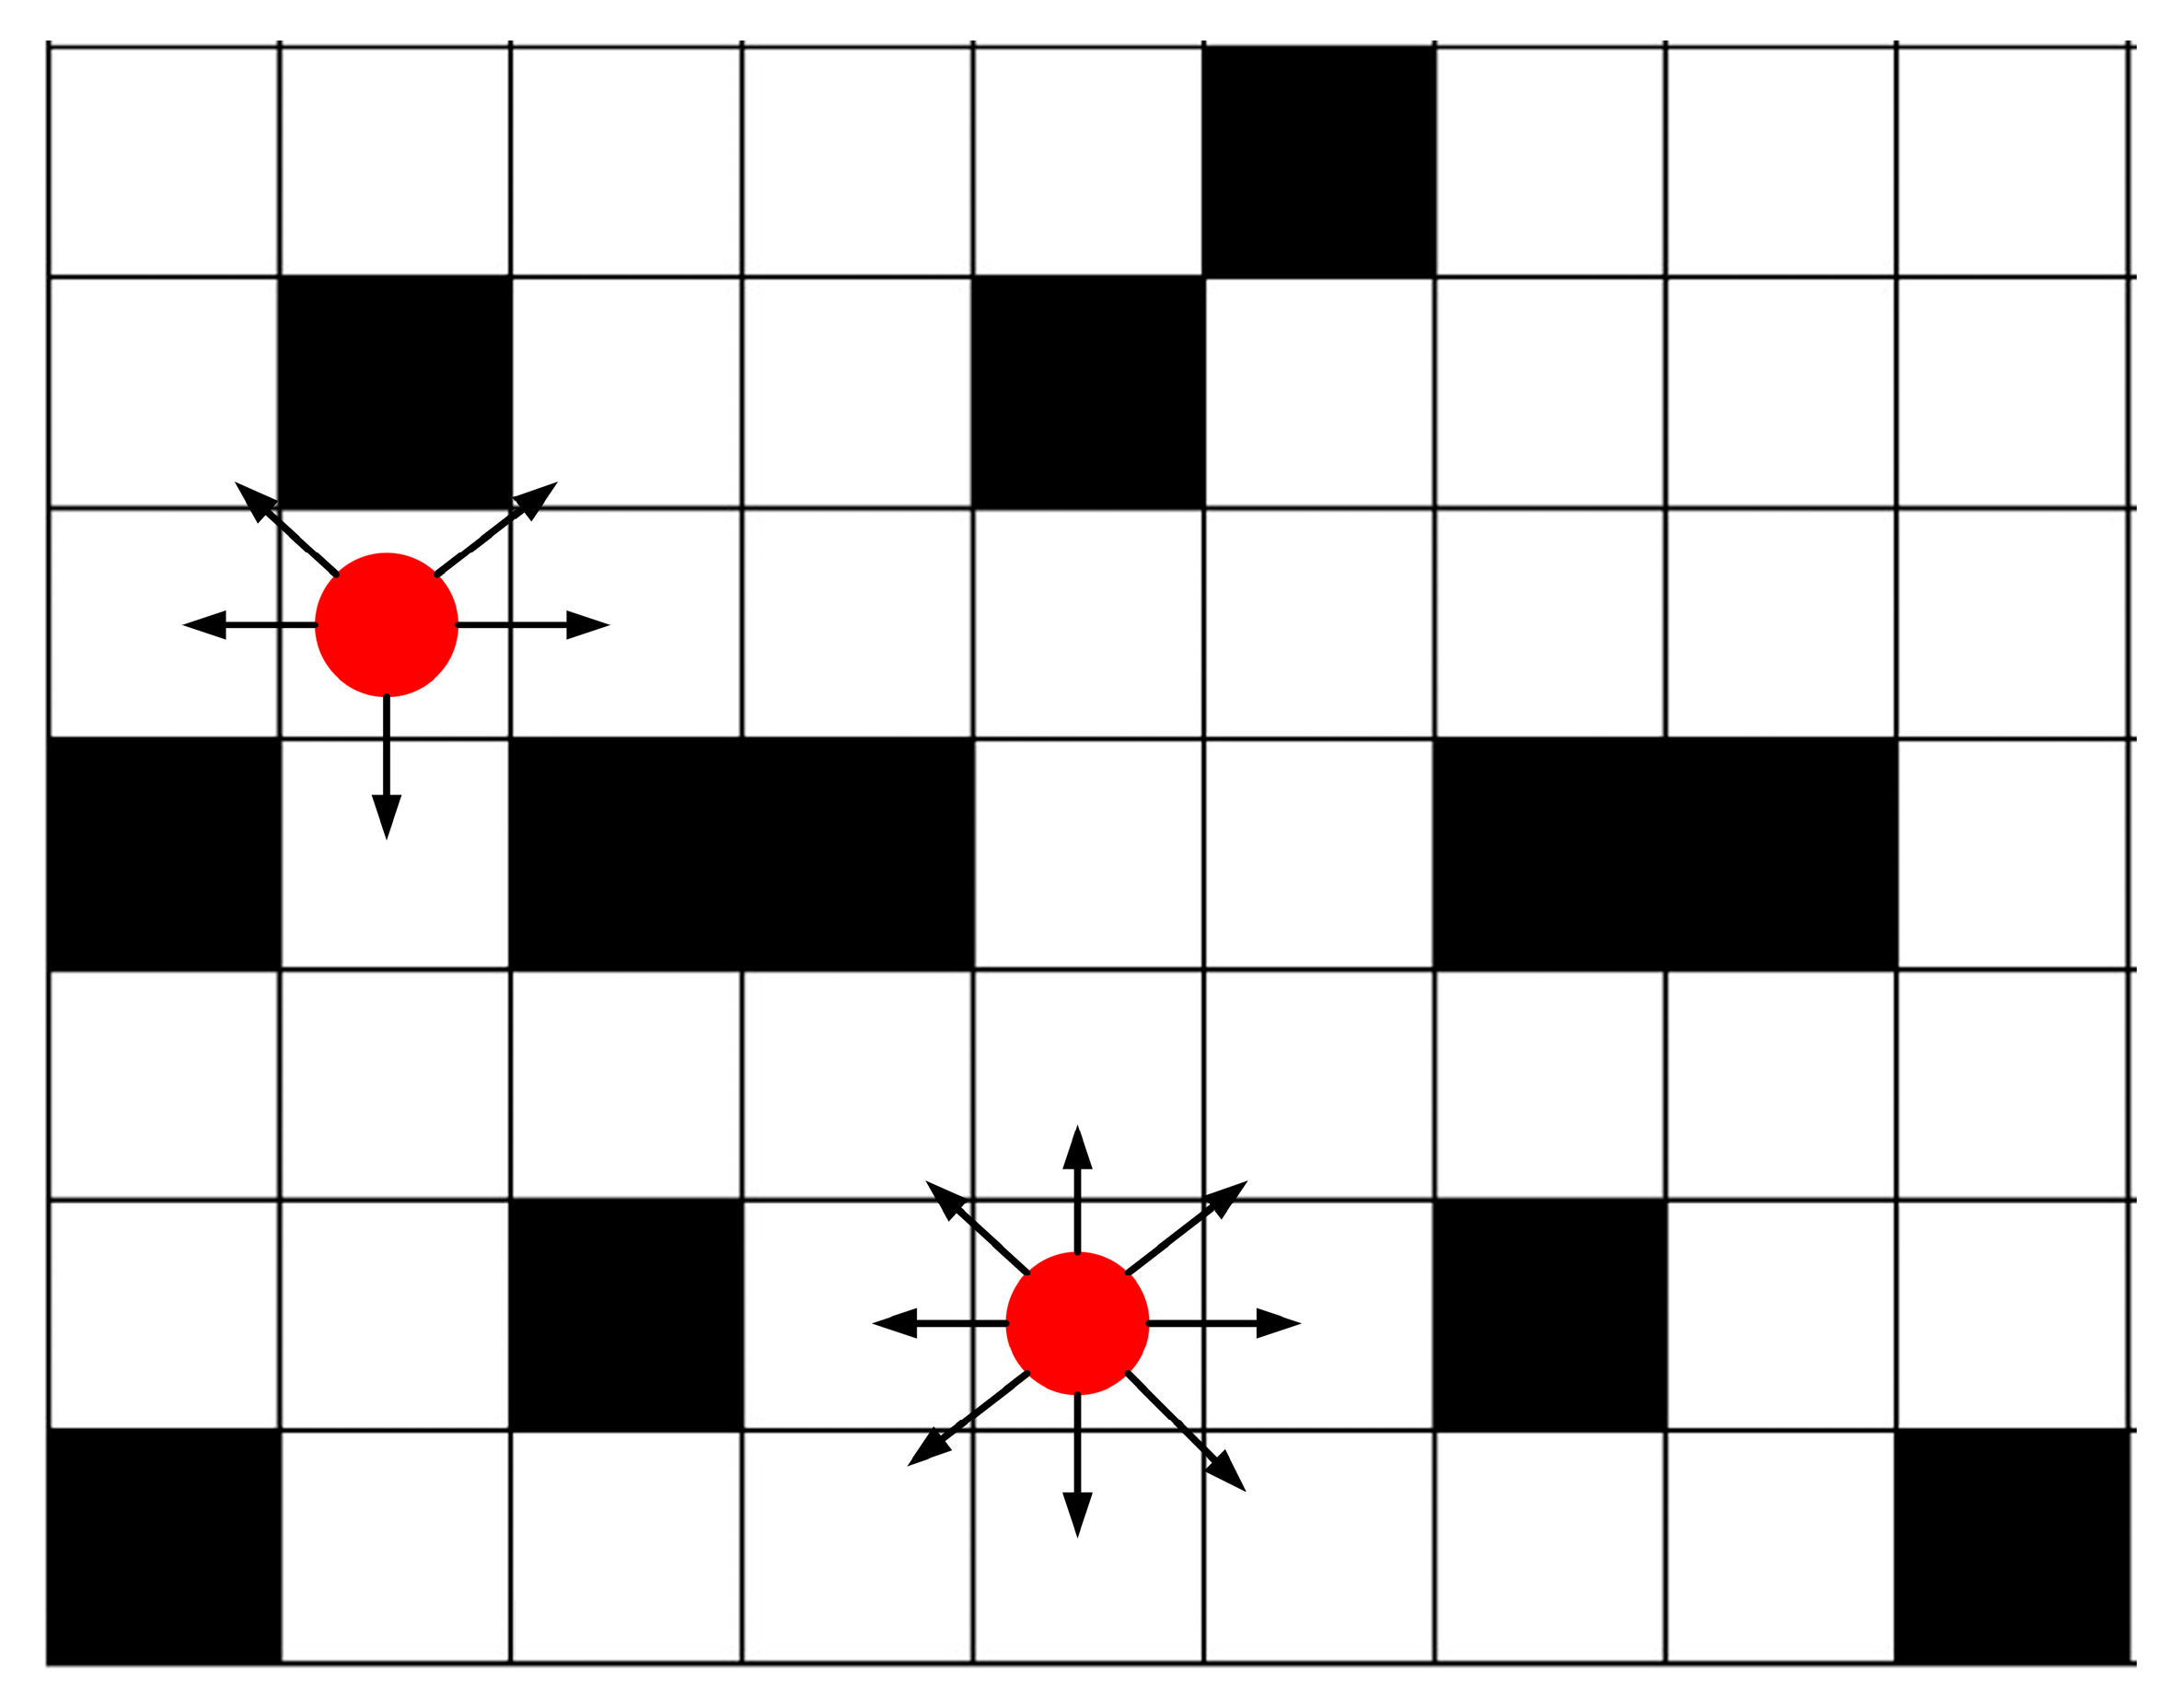
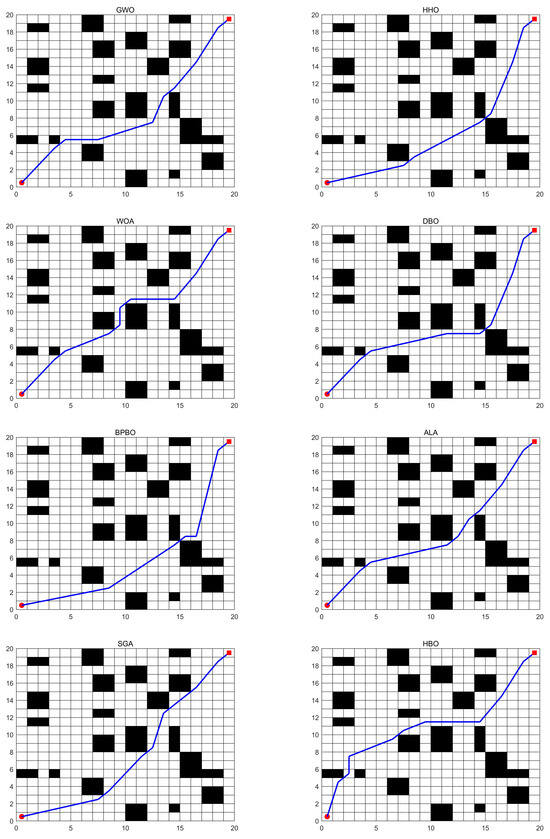
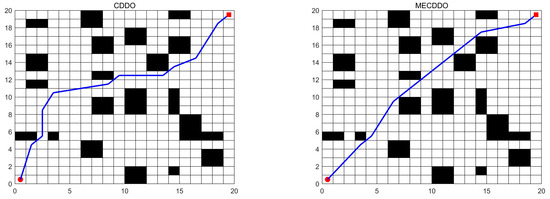
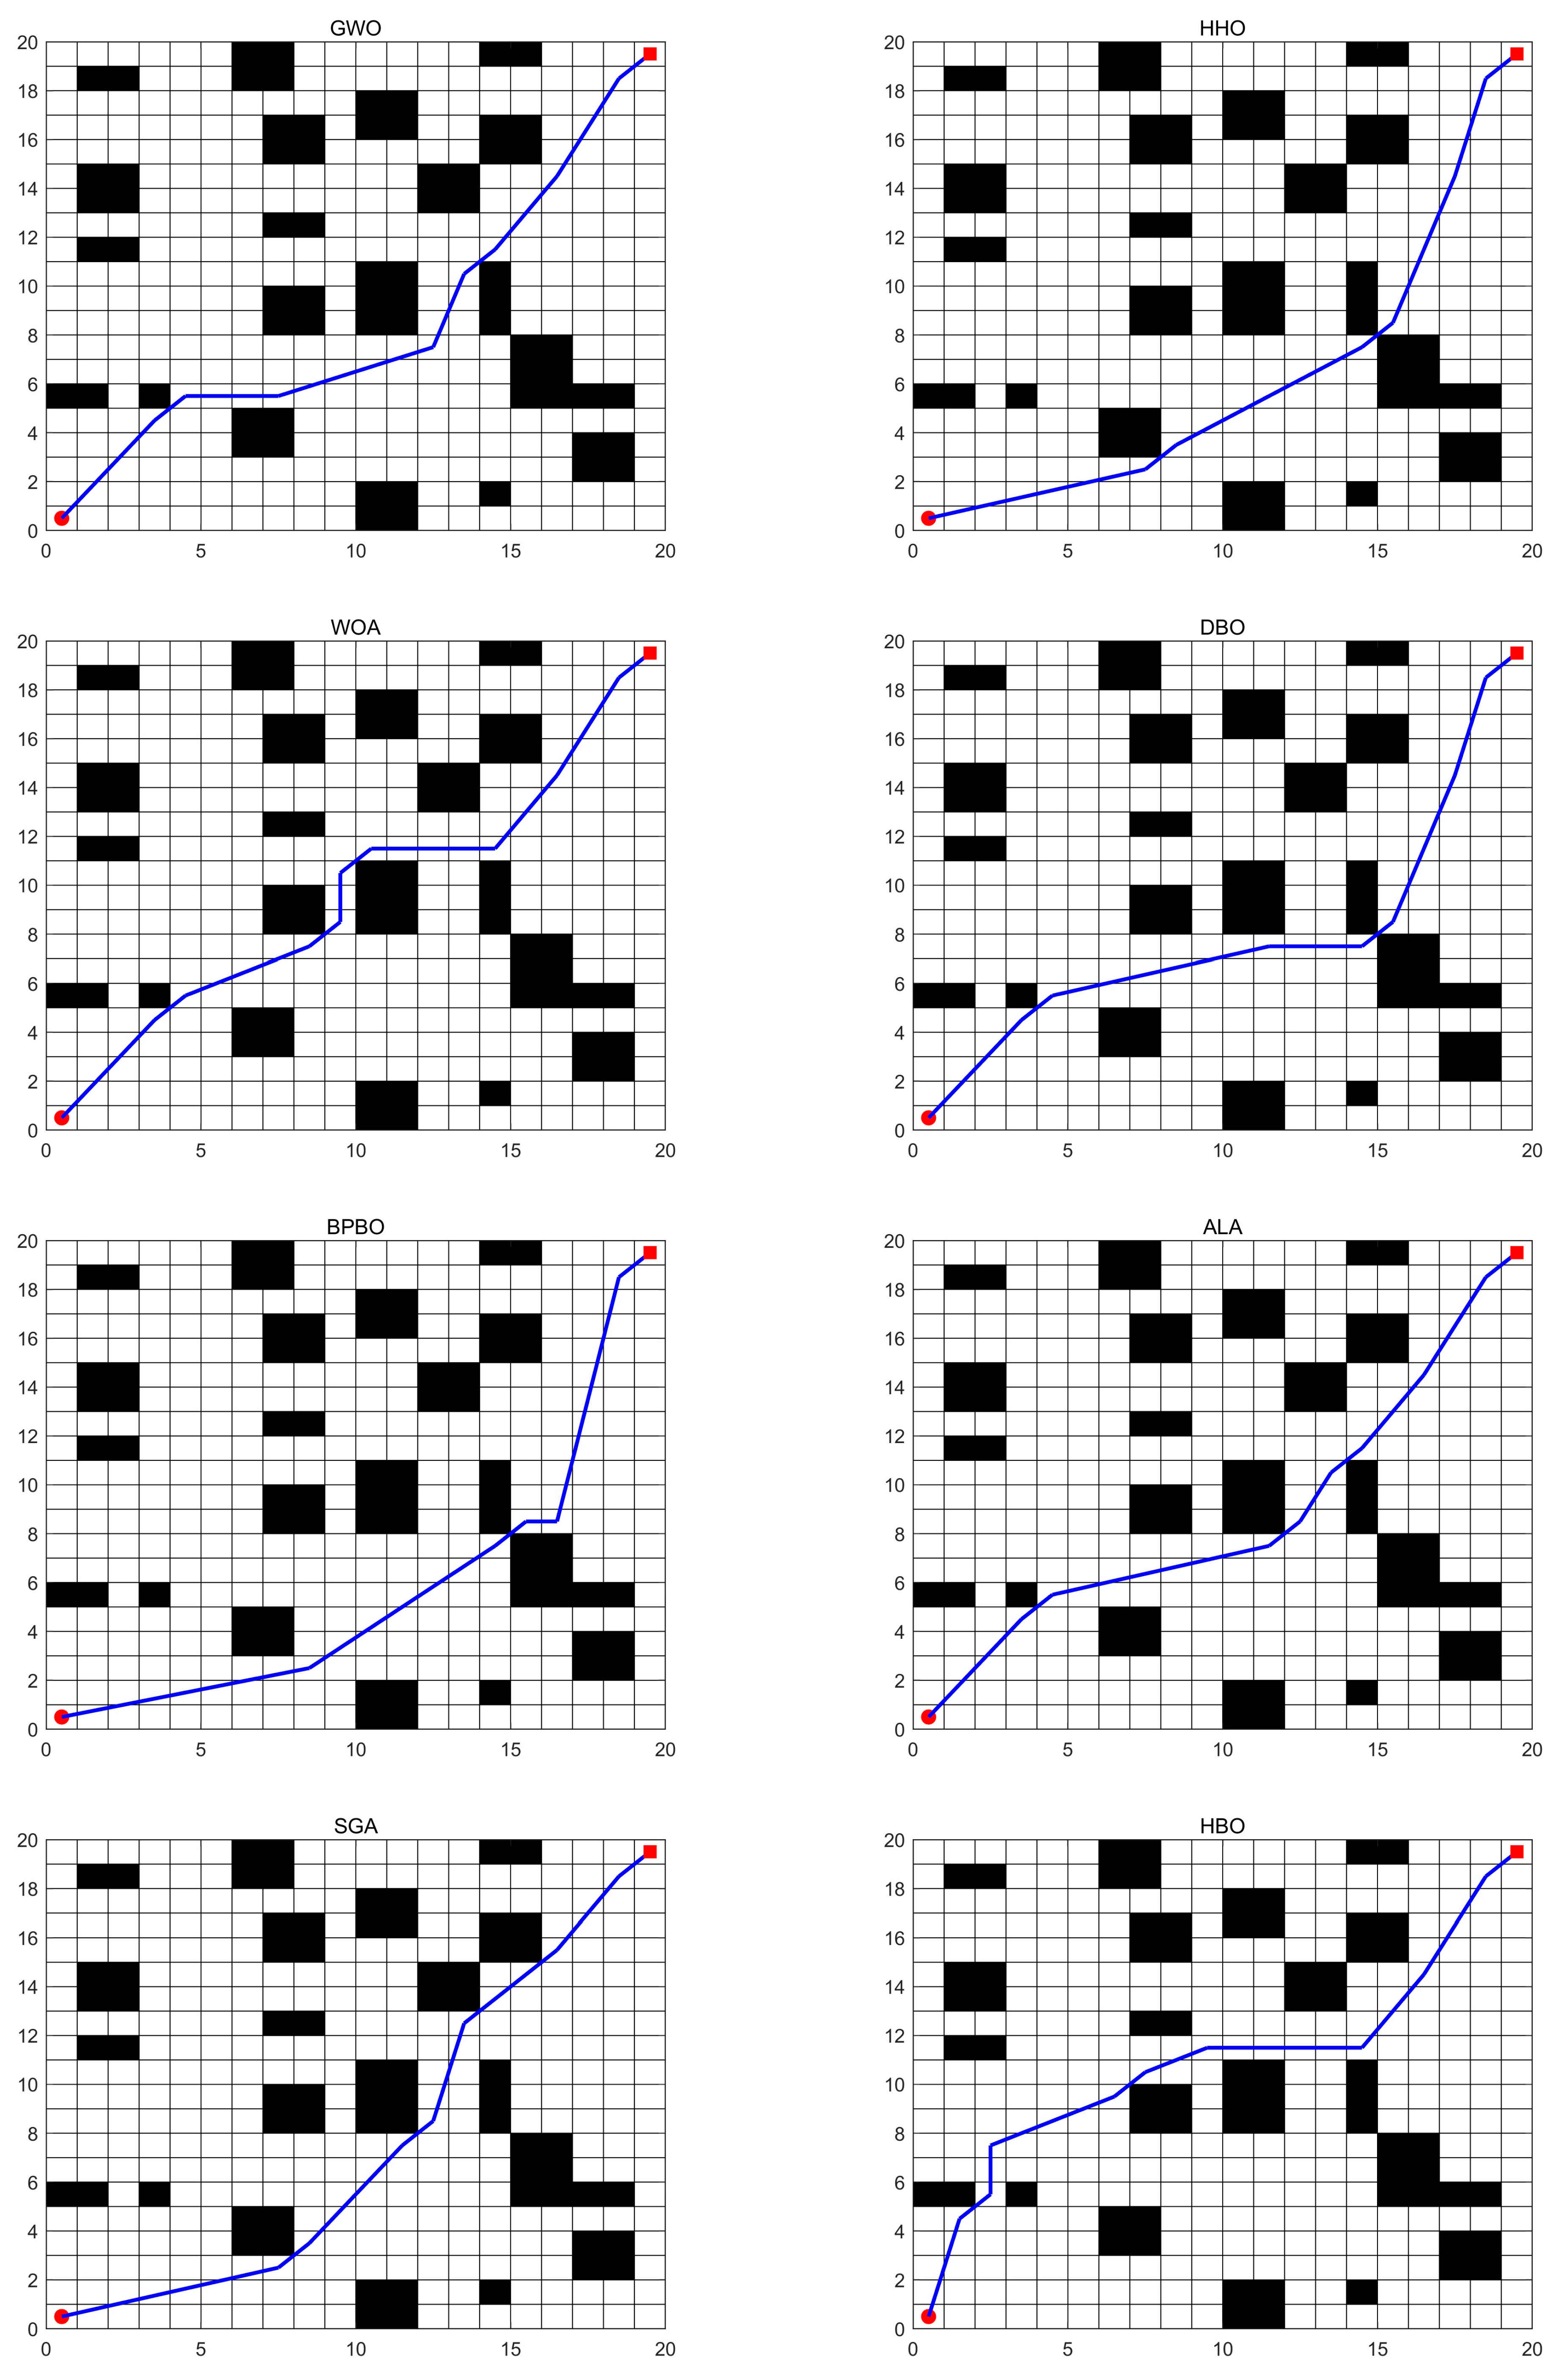
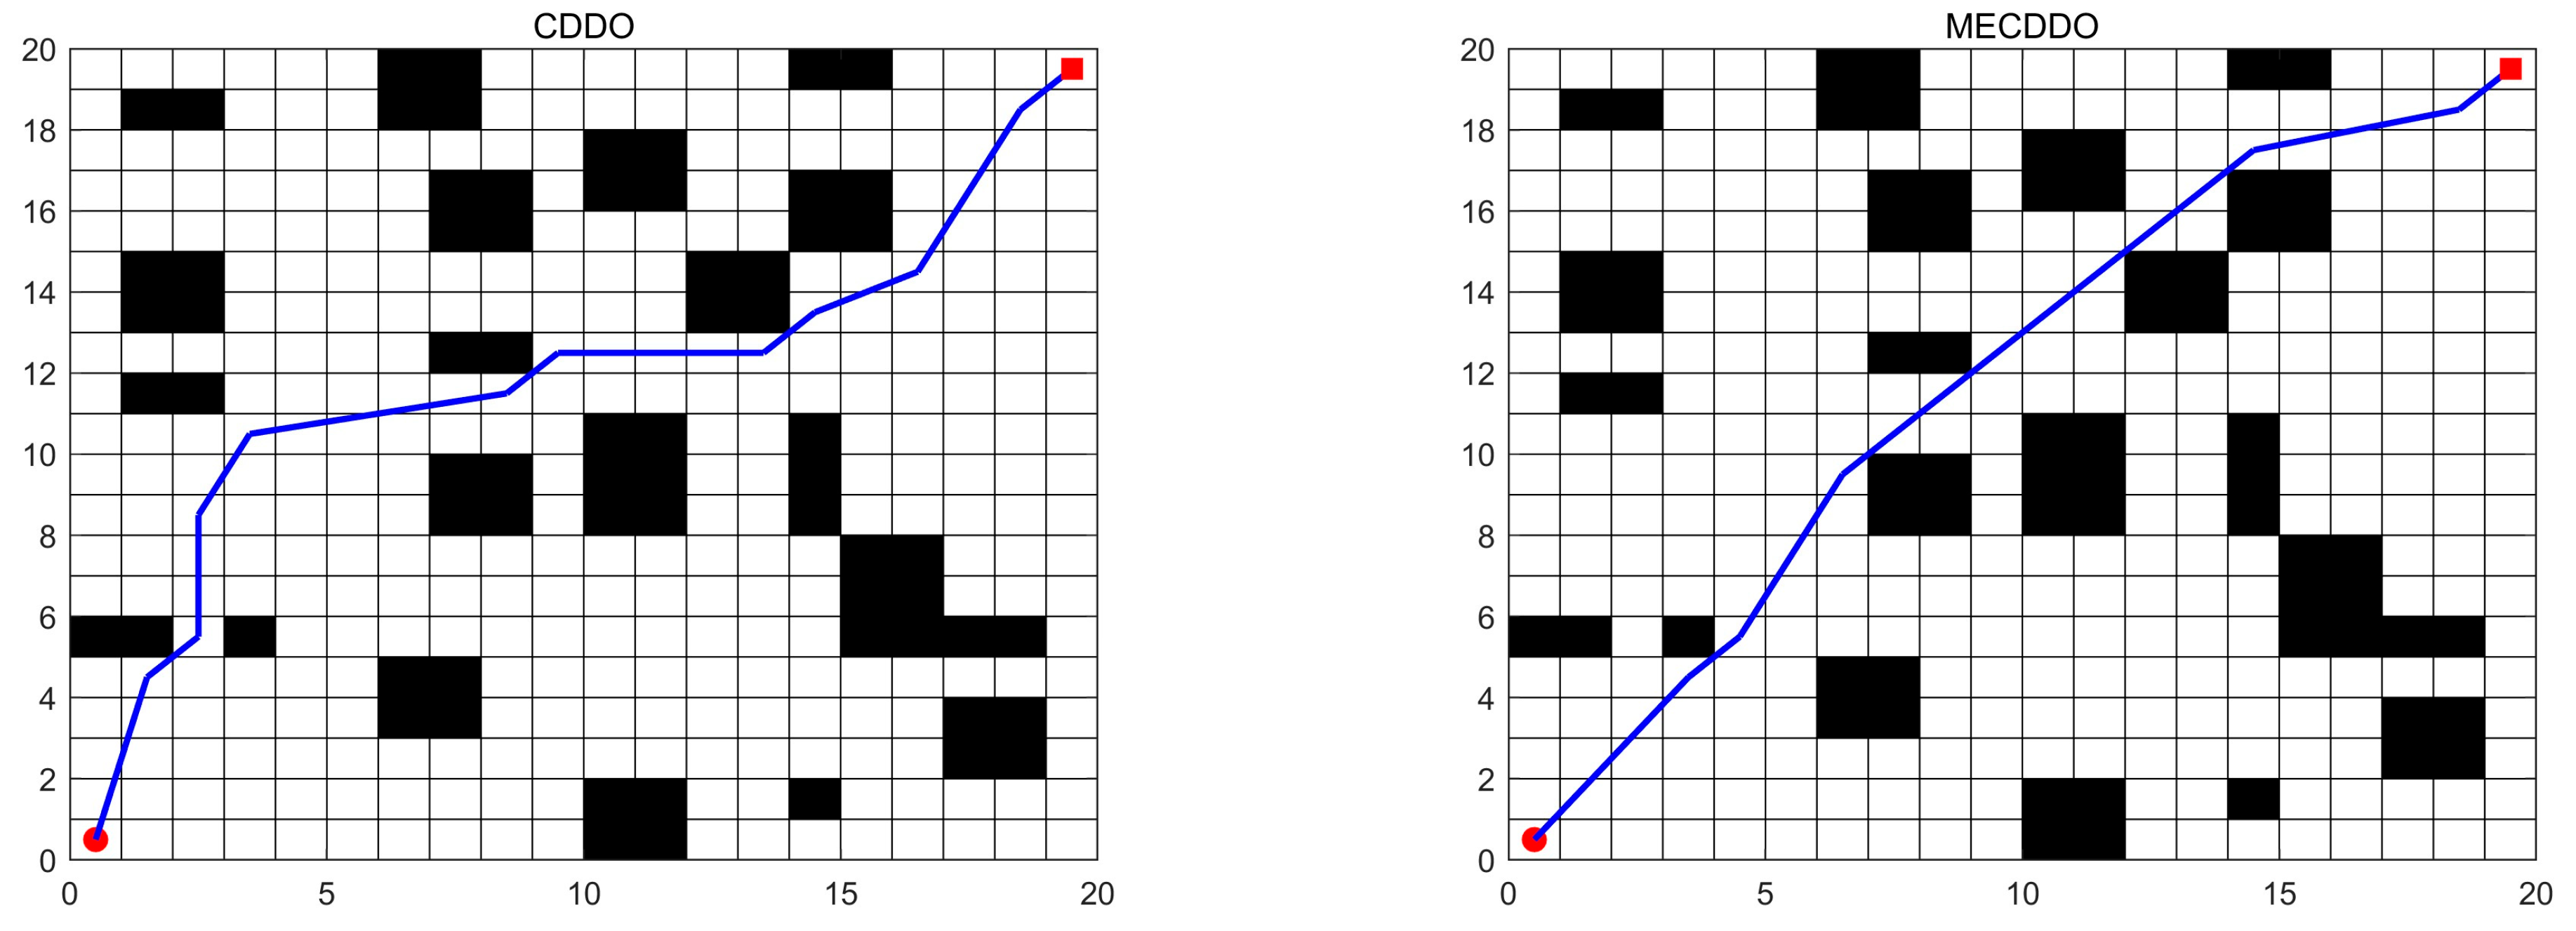
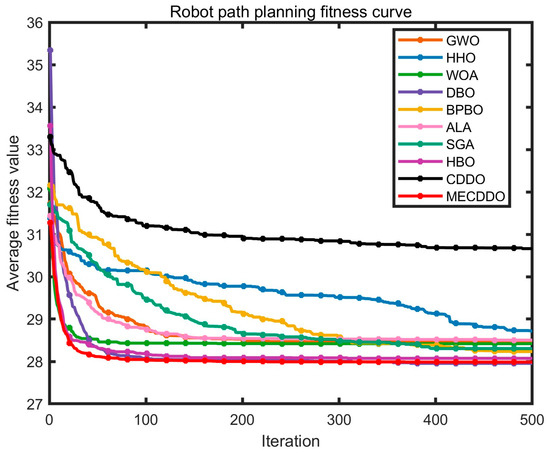
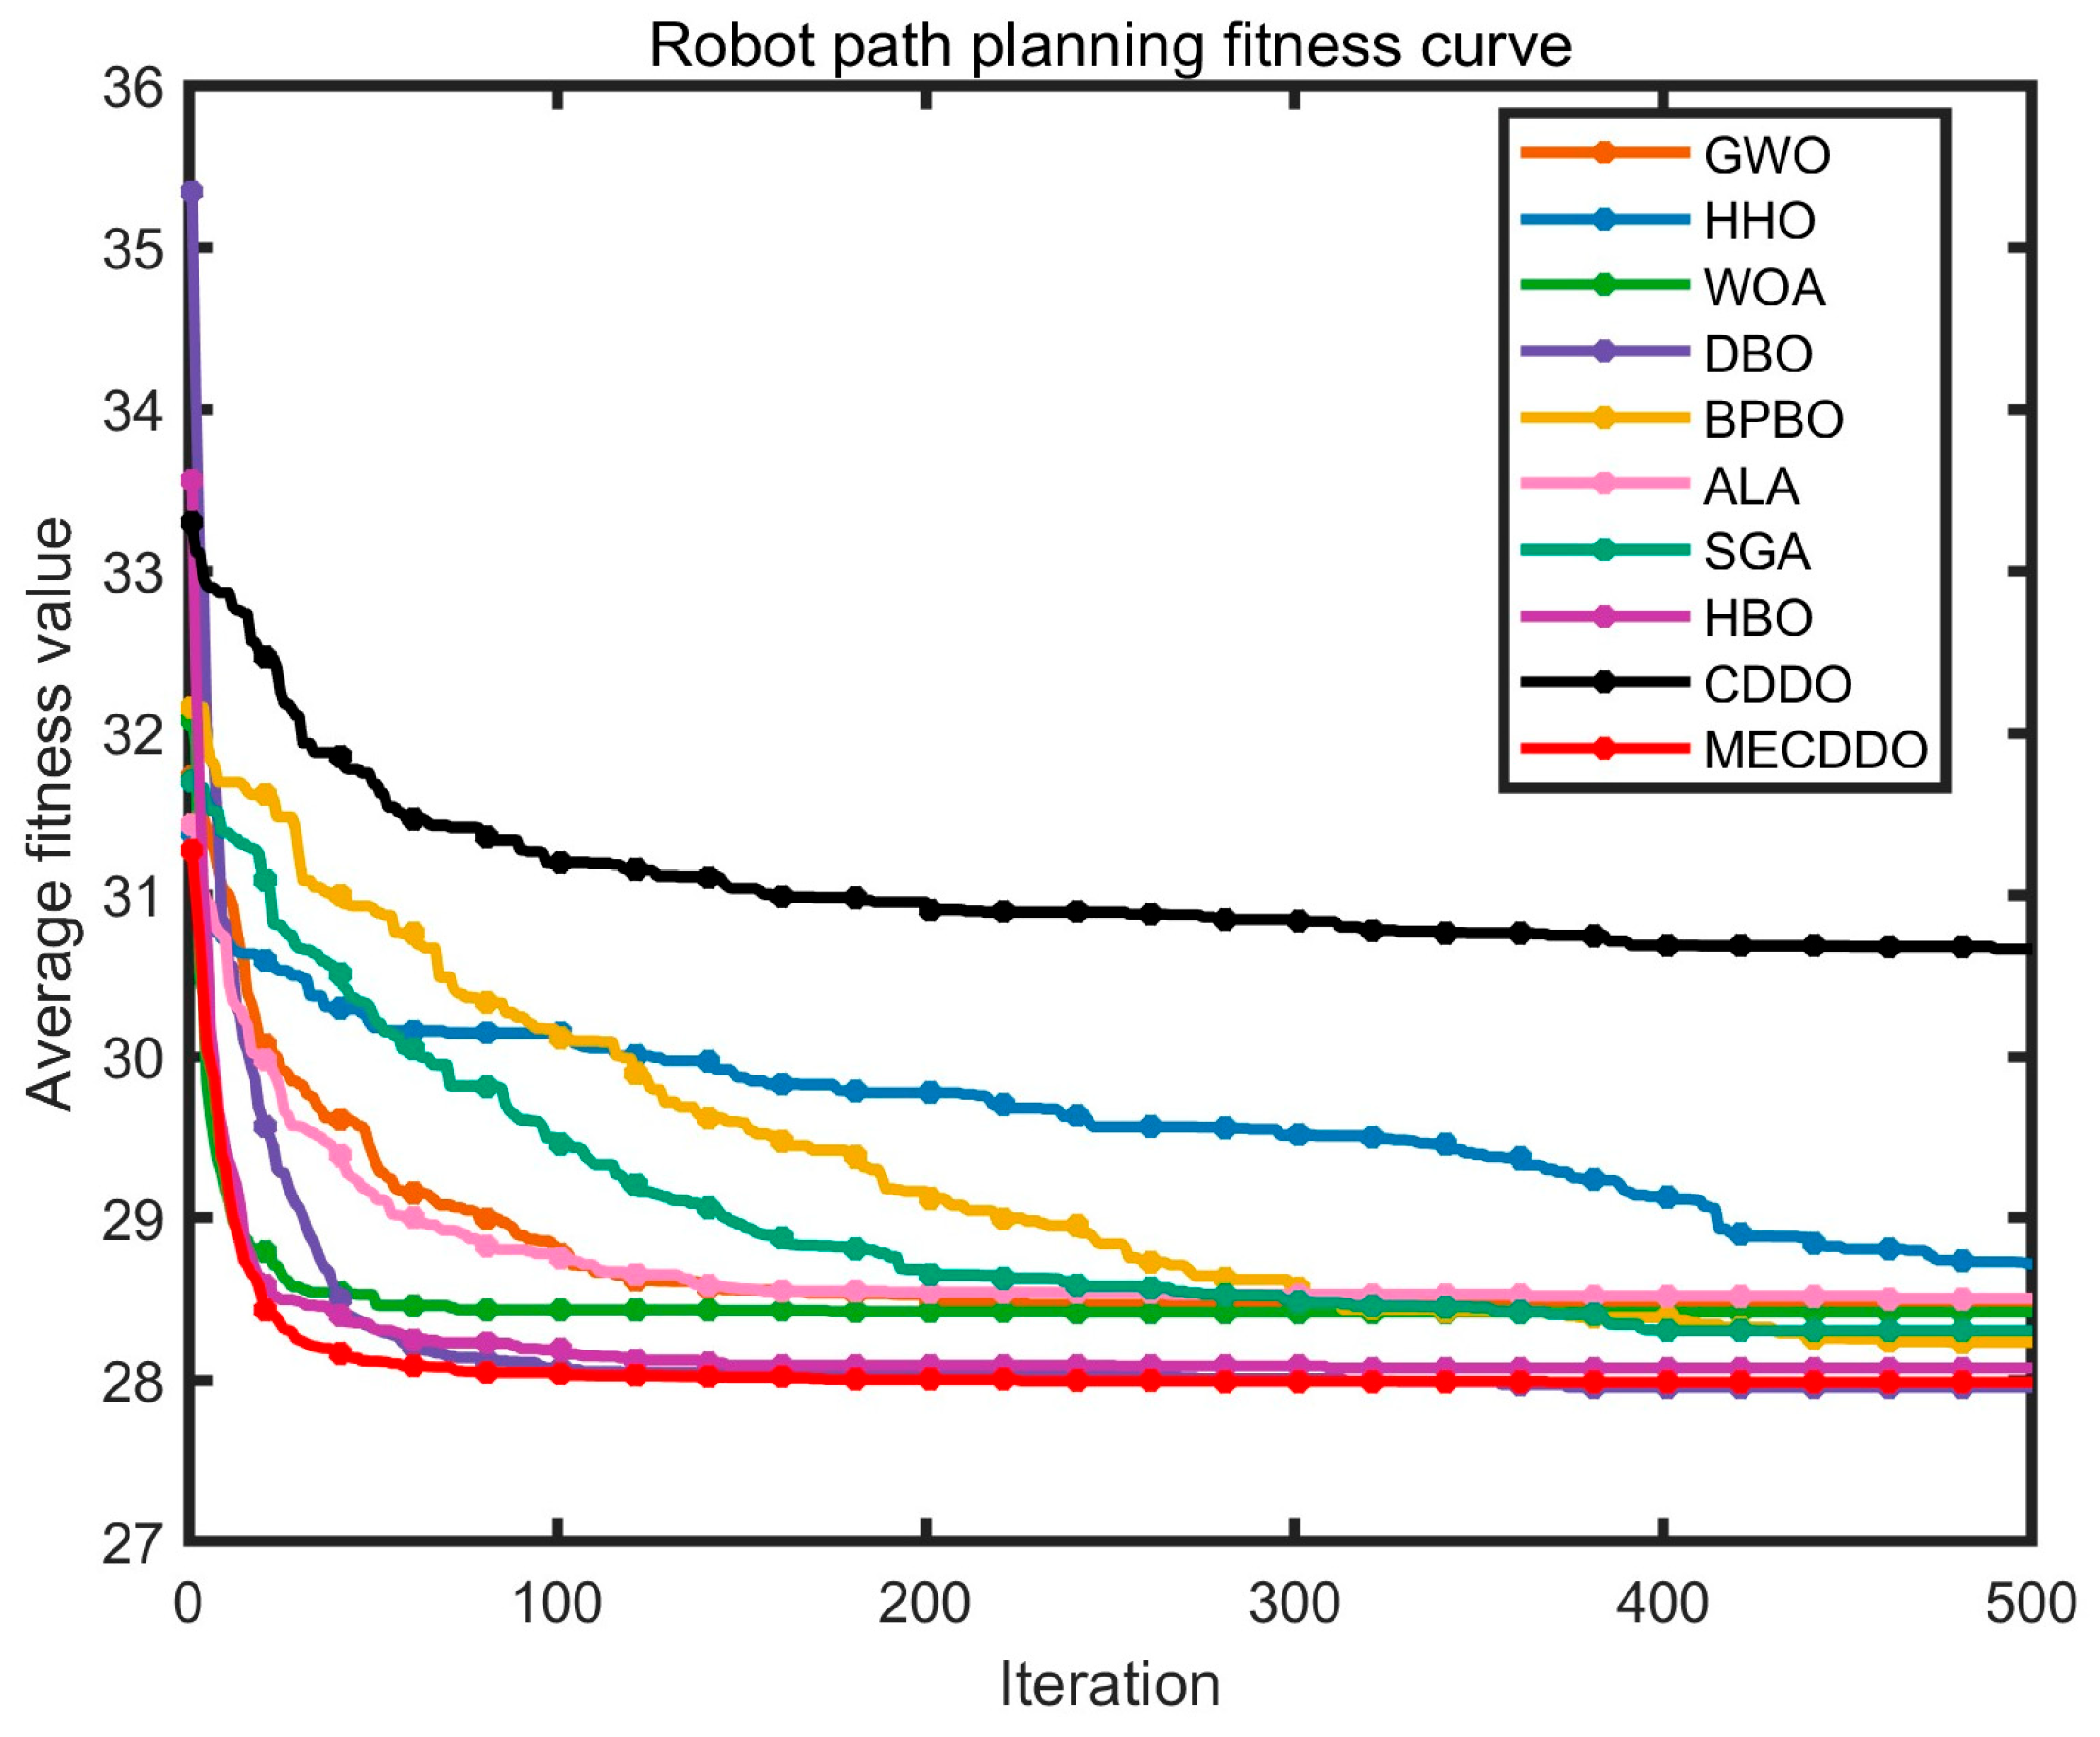
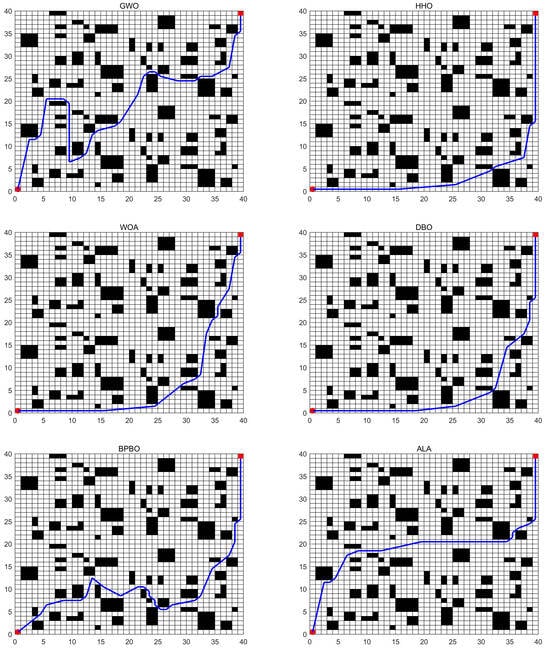
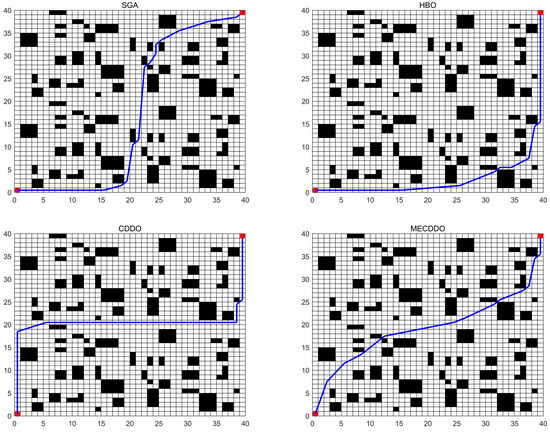
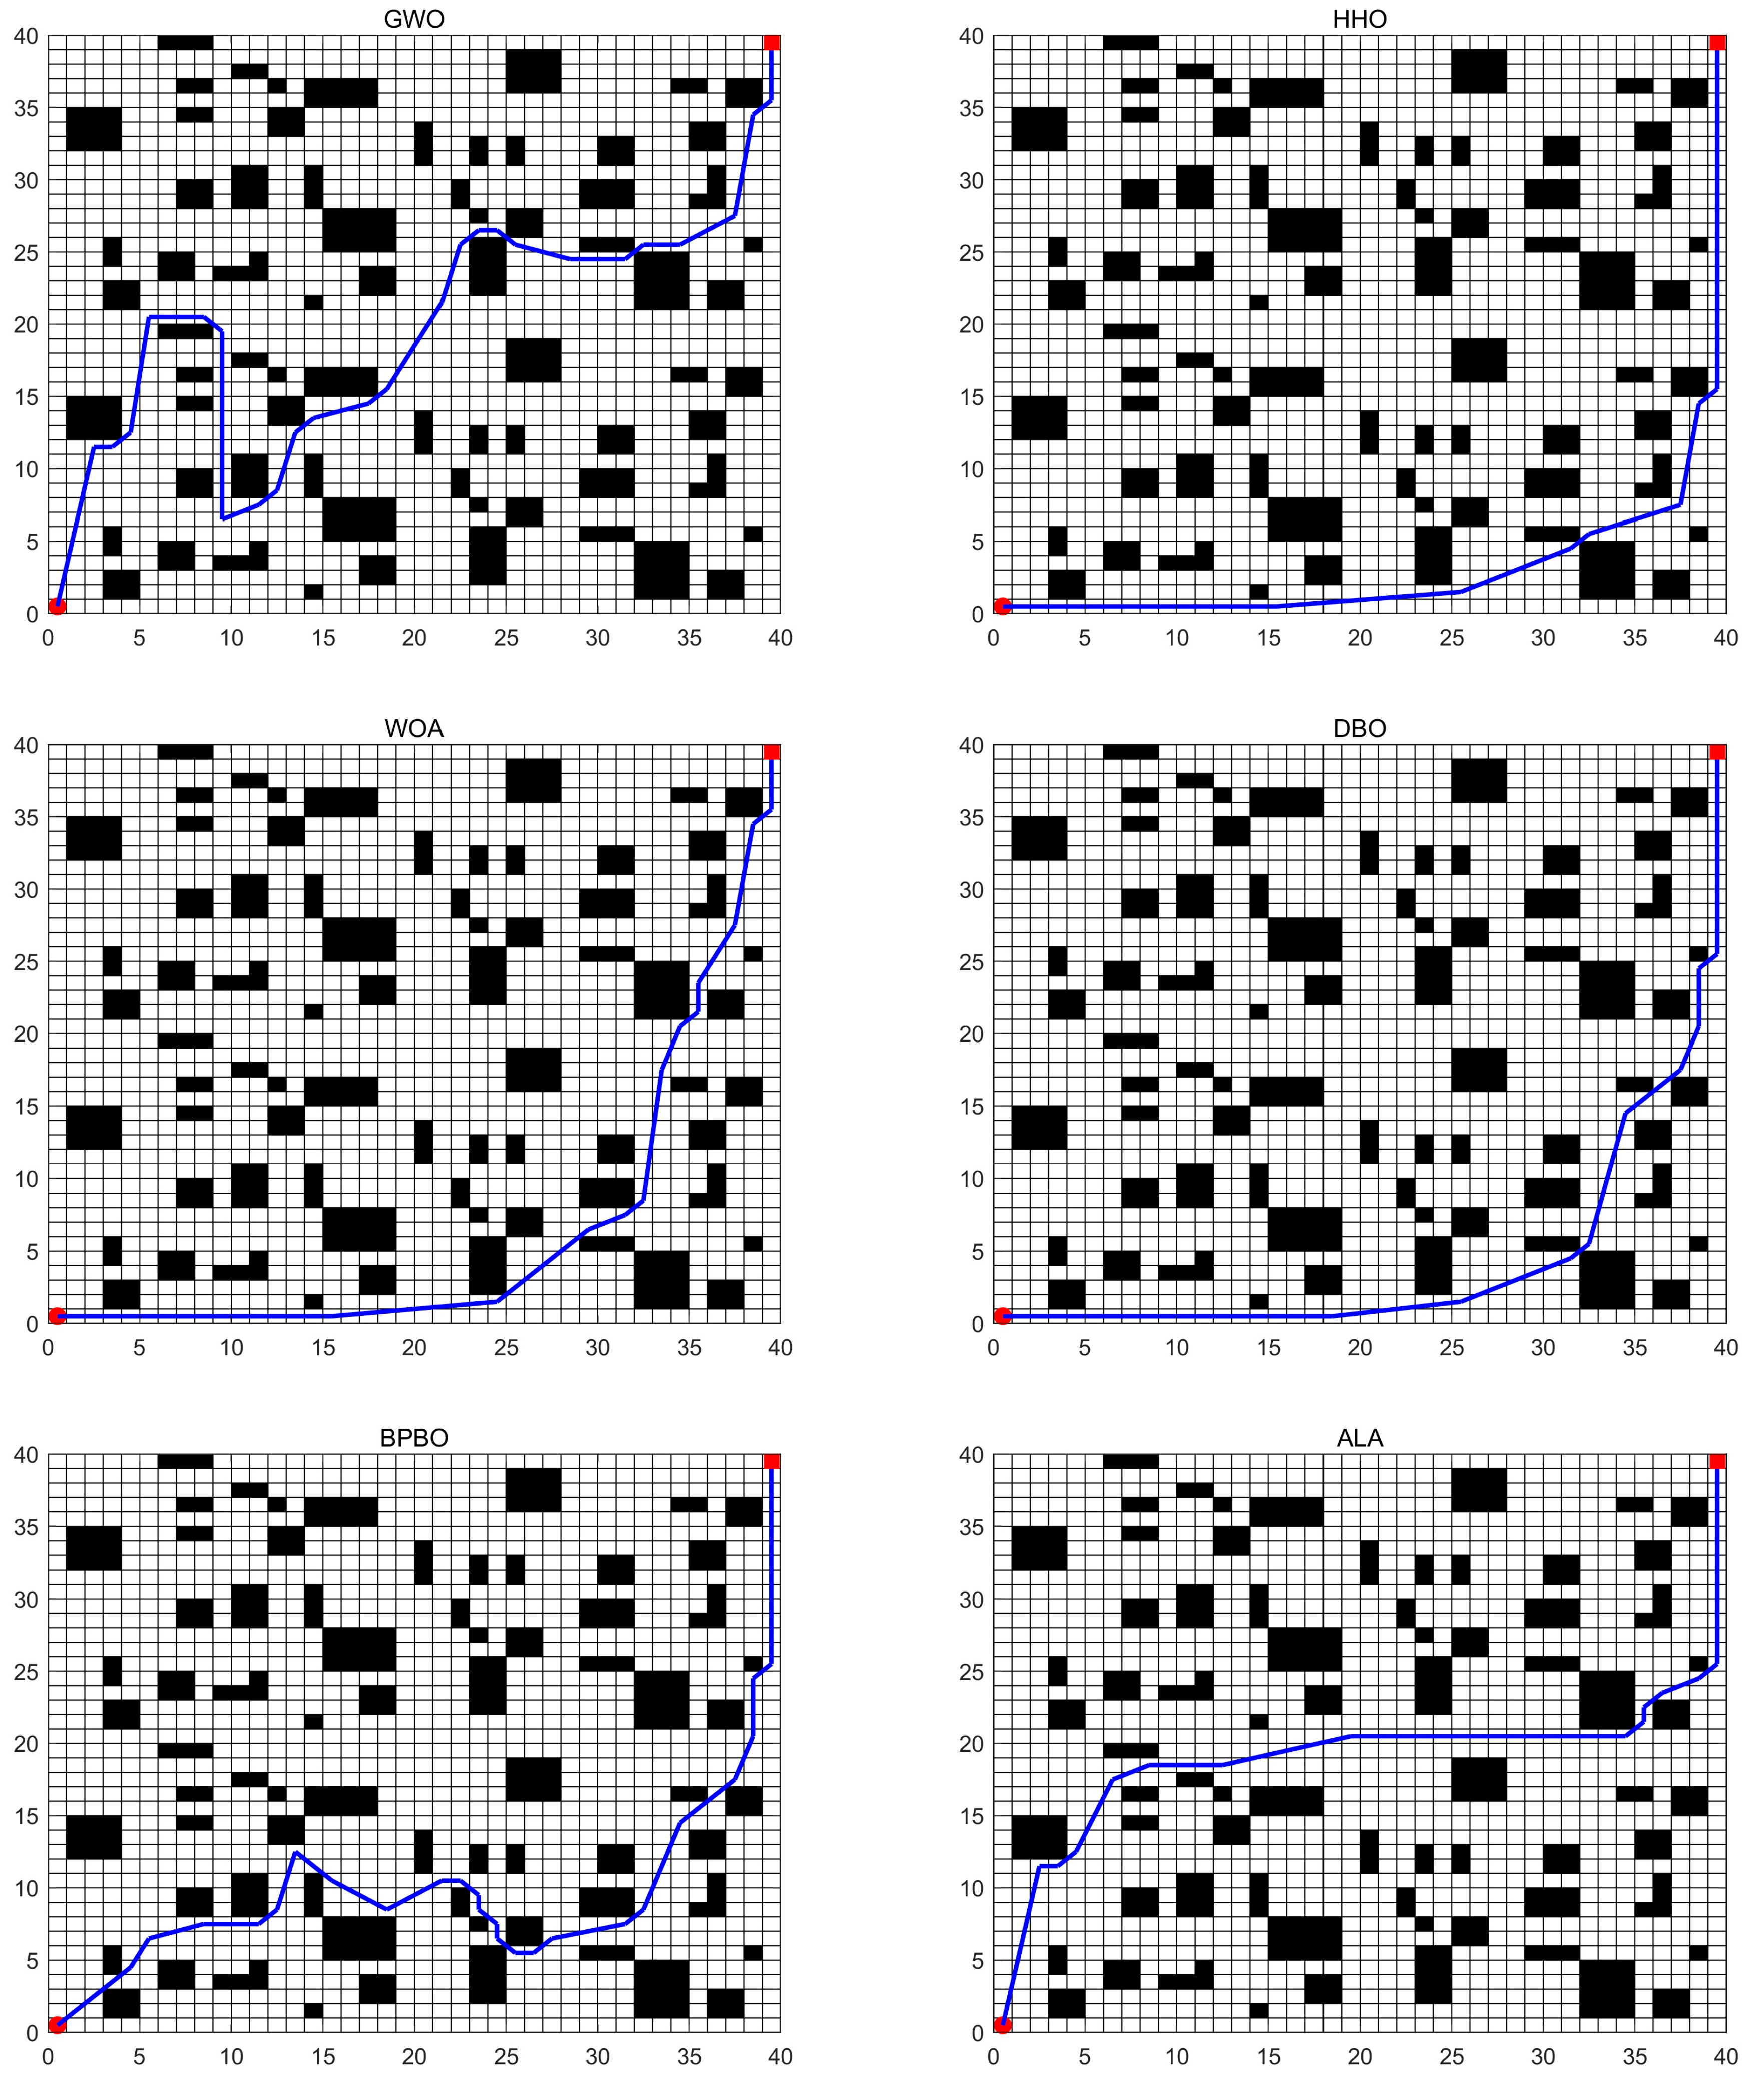
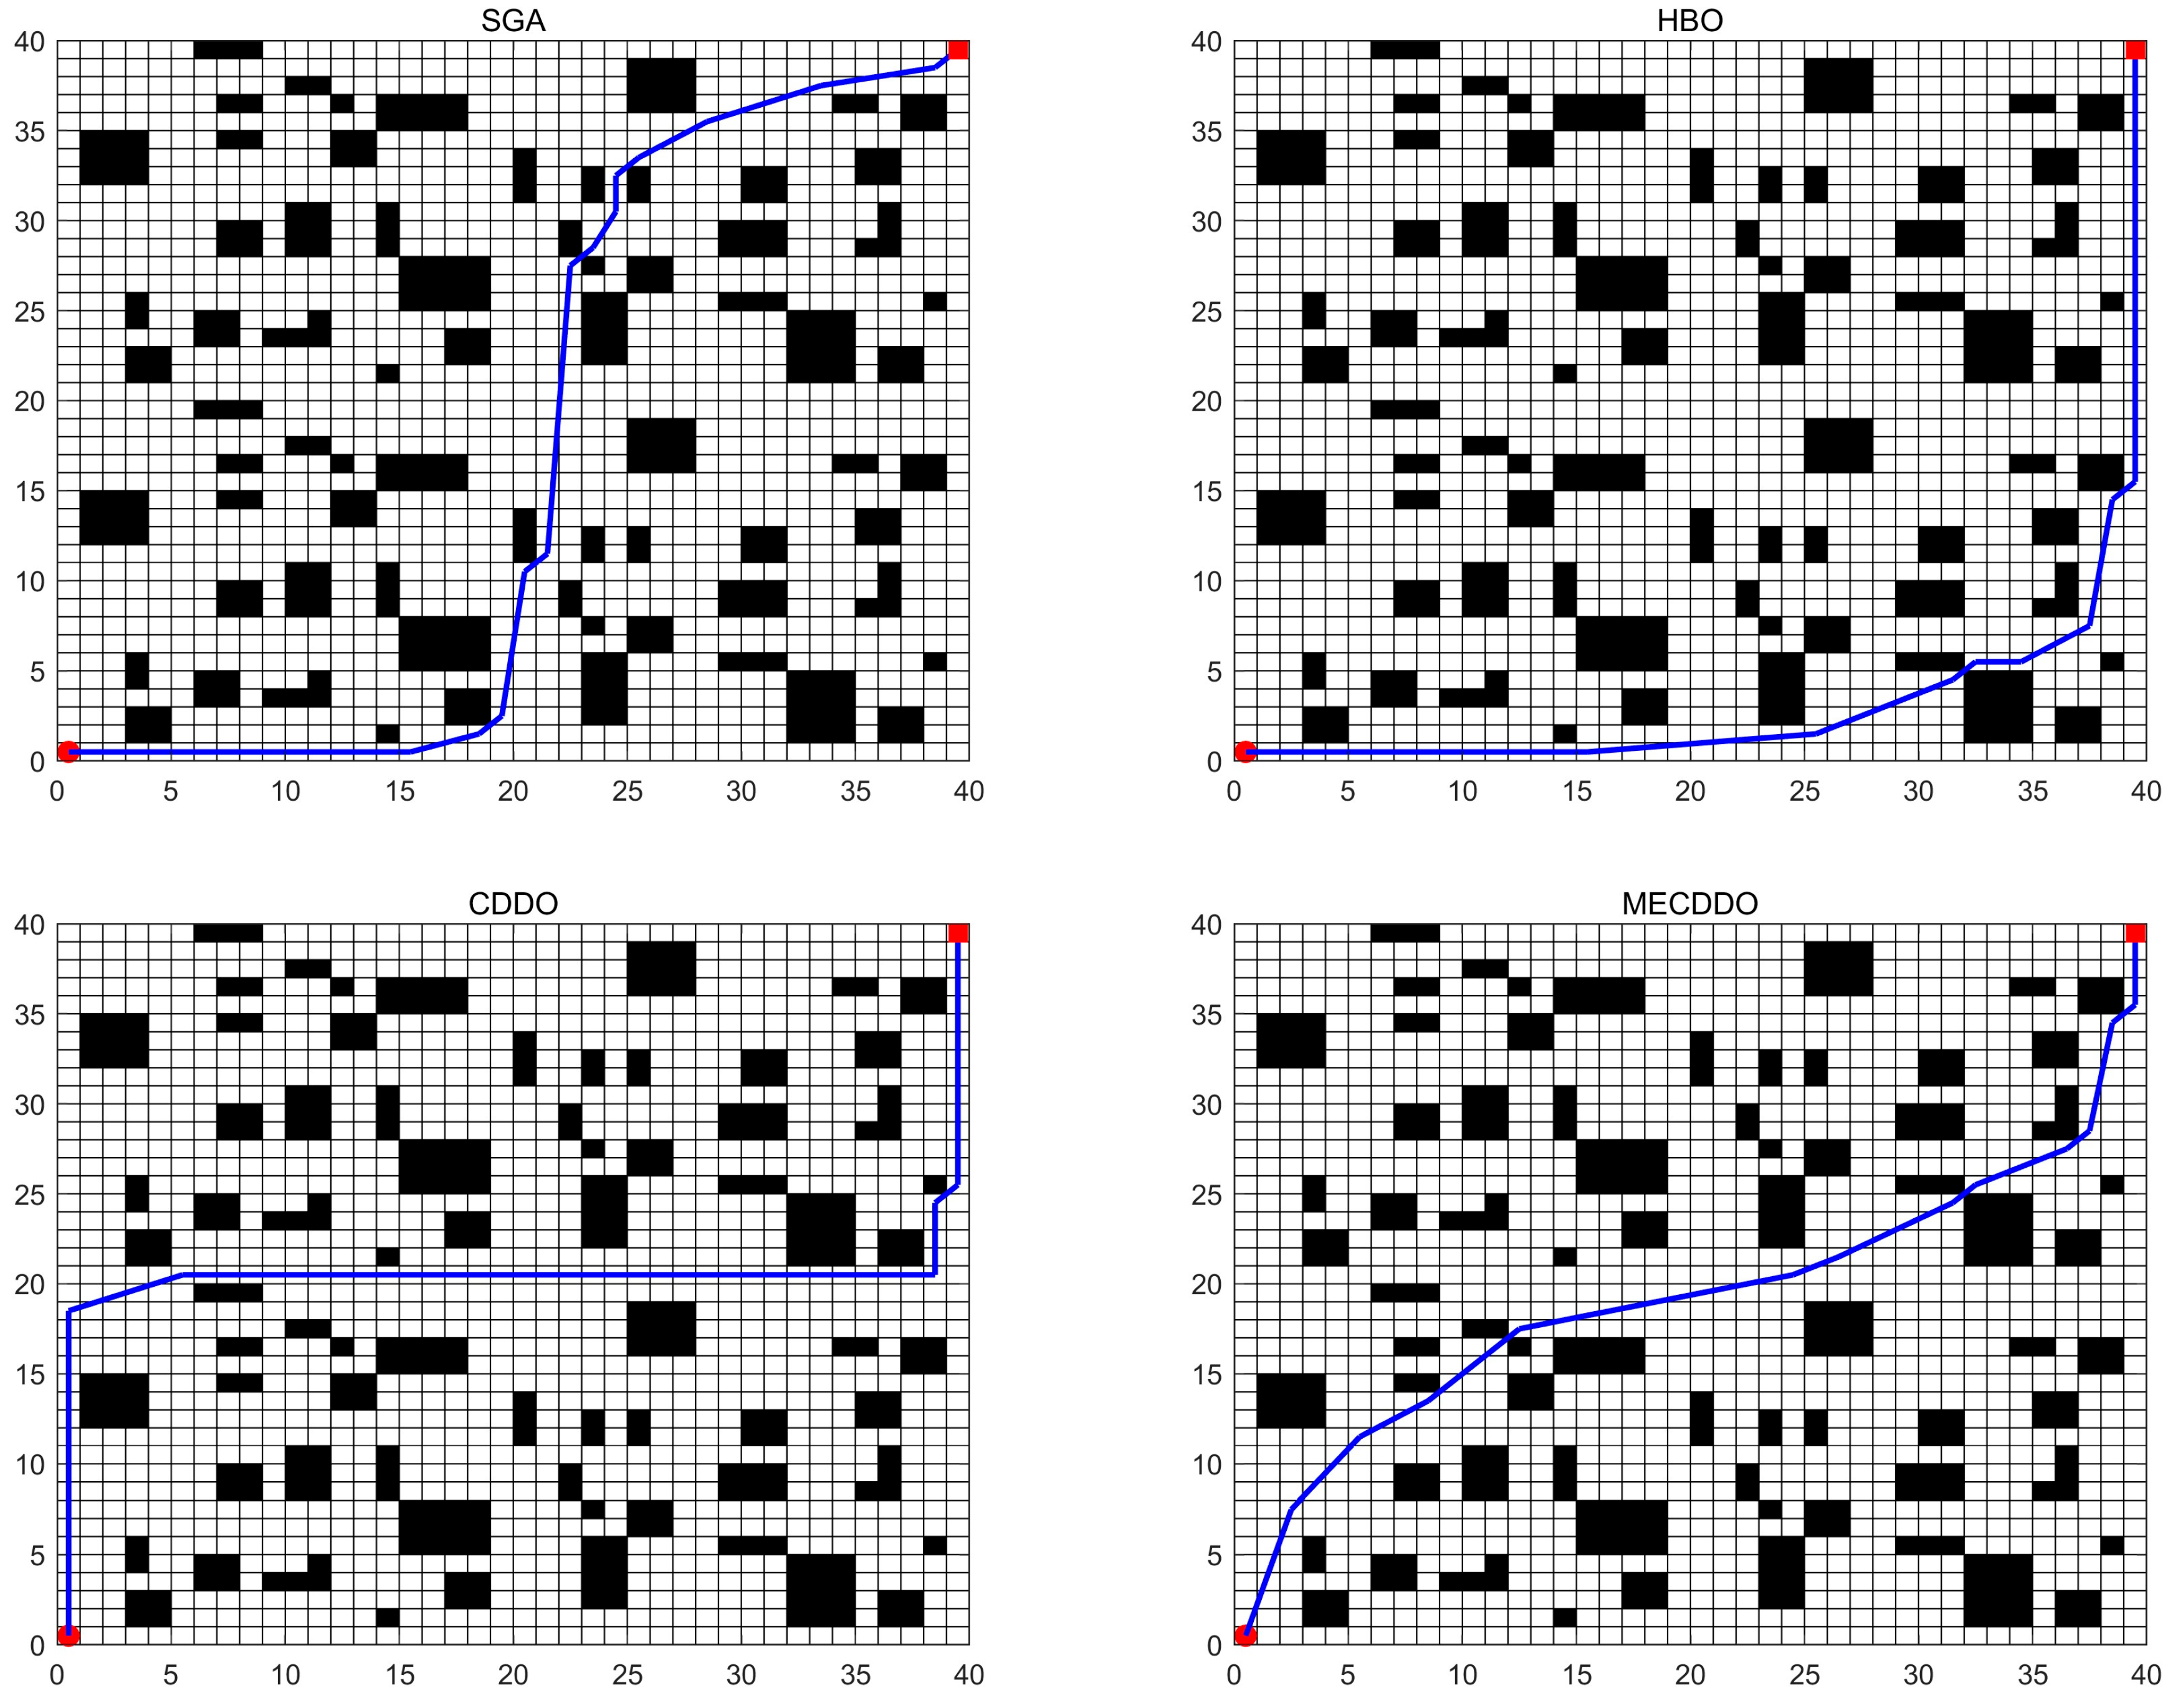
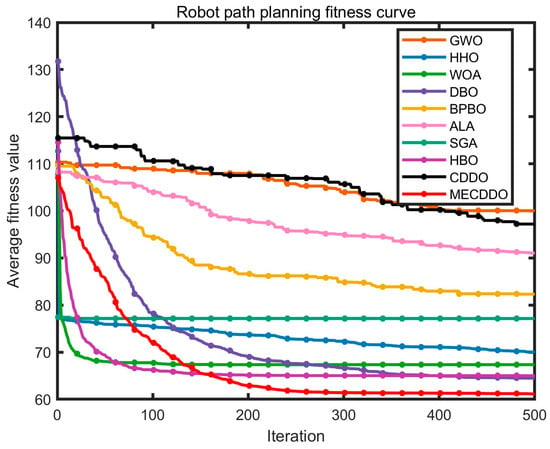
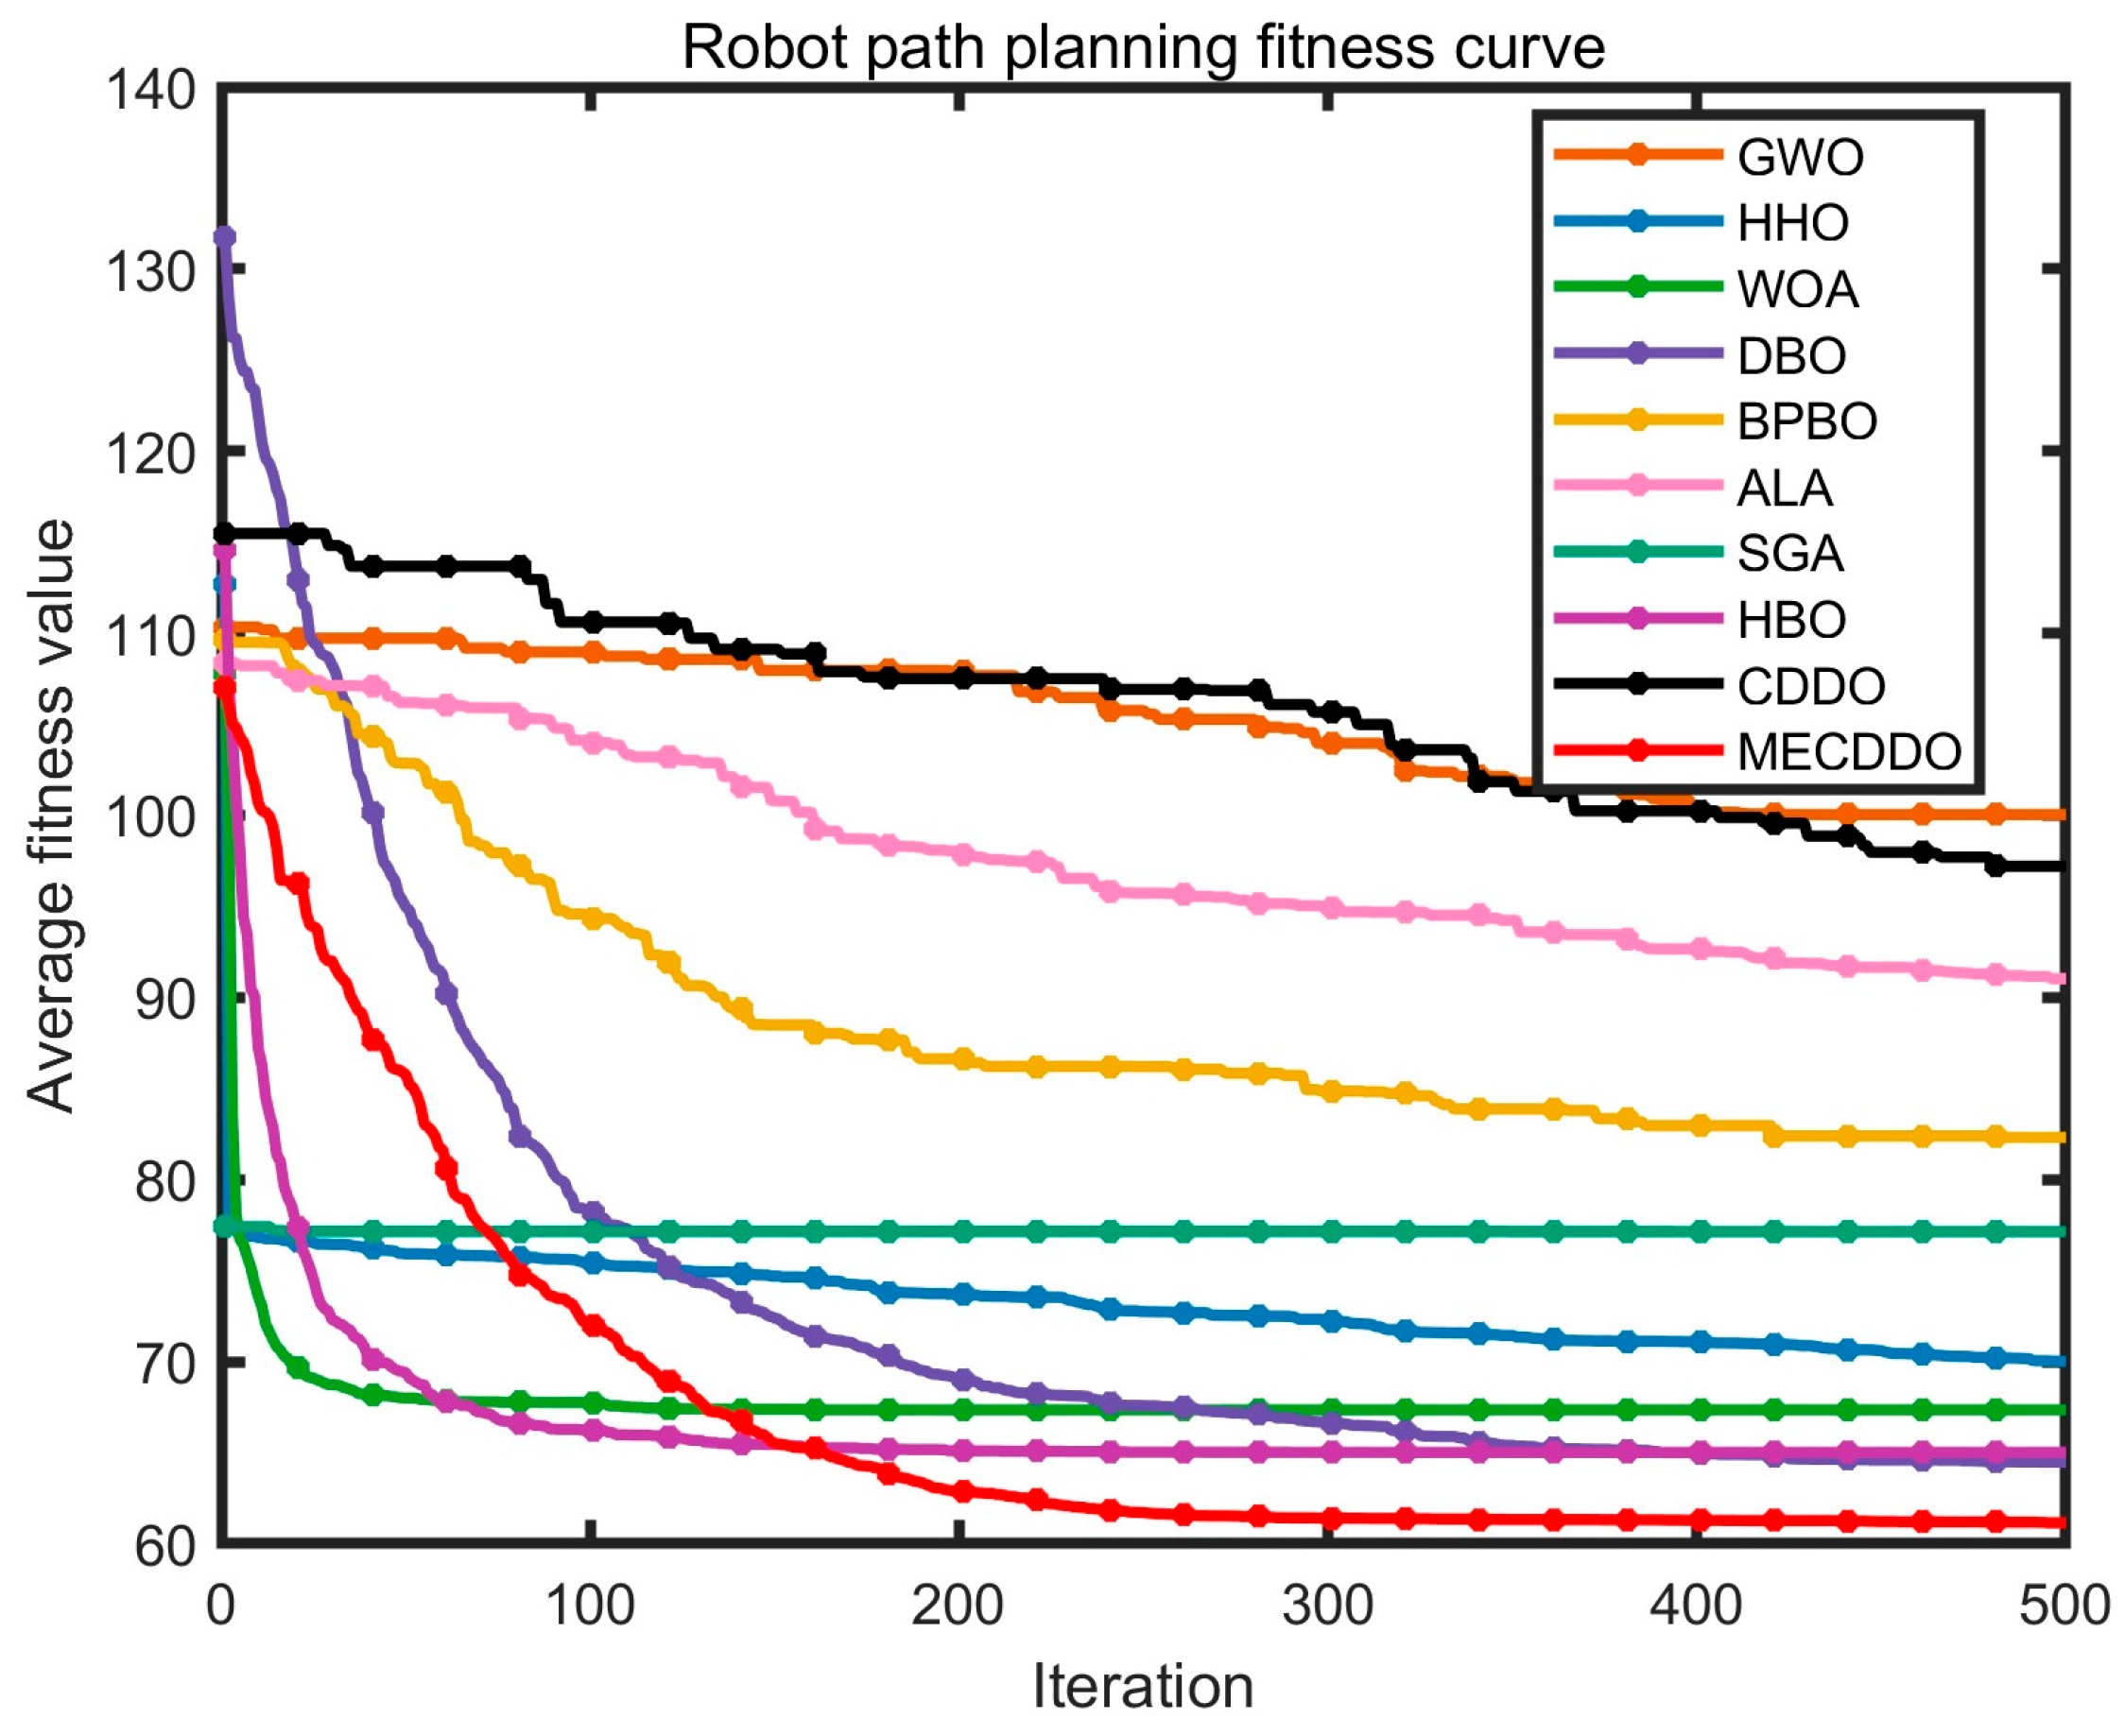

Disclaimer/Publisher’s Note: The statements, opinions and data contained in all publications are solely those of the individual author(s) and contributor(s) and not of MDPI and/or the editor(s). MDPI and/or the editor(s) disclaim responsibility for any injury to people or property resulting from any ideas, methods, instructions or products referred to in the content. |
© 2026 by the authors. Licensee MDPI, Basel, Switzerland. This article is an open access article distributed under the terms and conditions of the Creative Commons Attribution (CC BY) license.