


Abstract
Thermally grown amorphous SiO2 (a-SiO2) on Si is widely used in microfluidic and biointerface devices, where surface charge governs capillary flows. We used amplitude-modulation Kelvin probe force microscopy (AM-KPFM) in air to test whether low-power visible light modulates a-SiO2 surface potential and to derive mathematical charging-discharging models. Single-point contact potential difference (CPD) was recorded on ~0.6 µm p-type a-SiO2 on p-type monocrystalline Si during repeated illumination cycles with continuous-wave diode lasers at 405, 505, and 685 nm delivered by optical fiber. The 405 and 505 nm wavelengths produced reproducible negative CPD shifts with steady-state values of ~−28 mV and ~−16 mV, while 685 nm stayed within noise (±2.5 mV). The 405 nm response followed bi-exponential kinetics with fast (tens of seconds) and slow (hundreds of seconds) components dominated by the slow process; after switch-off, CPD relaxed only from ~−28 to ~−23 mV over ~103 s, indicating retention for ≥103–104 s. The 505 nm charging trace fit a single slower xponential, whereas discharging could not be fit robustly. These results demonstrate wavelength-dependent optical tuning of a-SiO2 surface potential and provide compact kinetic descriptors for comparing charging, discharging, and retention.
1. Introduction
1.1. Surface Charge Functionalization of a-SiO2-Based Microfluidic and Bio-Interface Devices
Amorphous silicon dioxide (a-SiO2) is widely used as a substrate in bio-micro-electro-mechanical systems (bio-MEMS) [1], microfluidics [2,3], and implantable devices [4] because it is available for a wide range of surface functionalization strategies [5]. Engineering the outermost surface layers—surface functionalization—is central to tailoring how a-SiO2 interacts with liquids and solids.
Mainly, two ways of functionalization are employed. Chemical modification is used to introduce specific functional groups, tune hydrophobicity/hydrophilicity, and control protein adsorption and biofouling [6]. Topographical structuring enables control wettability [7,8,9]. While chemical and topographical strategies provide robust static functionalities, they are difficult to reconfigure after fabrication.
A complementary, inherently dynamic axis of functionalization is surface charge [10]. The surface charge sets electrostatic boundary conditions that govern electroosmotic flow [11], electrophoretic transport [12], adsorption of charged species [13], and other processes at interfaces [14,15,16,17].
In biomedical contexts, surface charge influences protein adsorption and cell adhesion [18]. Effective interaction is strongly dependent on cell type, the composition and organization of the adsorbed protein layer, electrolyte composition, and the relevant contact-angle range [19,20].
The surface charge mat be used as a dynamic control parameter for wetting, flow, and adhesion within a-SiO2-based fluidic device instead of using purely chemical or surface morphology-based solutions. Practical approaches usually rely on electrical stimuli [21,22]. Electrical control via embedded electrodes (e.g., metal-oxide-semiconductor (MOS) or capacitor-like structures) may be difficult to integrate into sealed or chemically sensitive microfluidic environments. High fields needed for charging also introduce dielectric stress and long-term device degradation [23]. Alternatively, photostimulation can offer a complementary, contactless route: by generating charges optically in an oxide and/or in underlying semiconductor substrate and coupling charge carriers into oxide traps, the charge can be written, erased, and patterned without direct electrical contact to the oxide surface. The energy of the photon has to be enough to induce electron/hole excitations.
1.2. Scope of the Present Work and Approaches
The present work uses amplitude-modulation Kelvin probe force microscopy (KPFM) to monitor contact potential difference (CPD) changes on thermally grown a-SiO2 on p-type Si under visible-light excitation. Thermally grown SiO2/Si is chosen as a technologically ubiquitous and well-characterized model material. Single-point KPFM measurements are performed on SiO2/Si samples mounted on conductive substrates while continuous-wave diode lasers irradiate the sample at a fixed point beneath the KPFM tip. Three laser wavelengths—405, 505, and 685 nm—are used to sample different parts of the visible spectrum. These sources provide monochromatic, relatively high-intensity illumination with well-defined photon energies and penetration depths in Si, allowing any observed CPD changes to be associated with specific spectral bands.
For each wavelength, the CPD is recorded during illumination until an apparent quasi-steady state is reached, followed by dark relaxation over extended times. The resulting CPD–time curves are then fitted with phenomenological kinetic models (e.g., multi-exponential or stretched-exponential forms) to extract characteristic charging and discharging time constants and their amplitudes. The experiments and analysis are designed to address the following questions:
- Can visible light in the 400–700 nm range functionalize charge at a thermally grown a-SiO2/Si surface, as detected and quantified by local surface-potential changes measured by KPFM?
- If charge accumulation occurs, at which wavelengths is the effect observable, and what are the corresponding CPD amplitudes and steady-state shifts?
- What are the charging and discharging kinetics and how may they be described at different wavelengths for excitation?
By answering these questions, the work quantifies how visible light can be used as a dynamic, non-contact control input for charge functionalization of thermally grown SiO2/Si.
2. Materials and Methods
2.1. Measurement Principle and Experimental Approach
Before the questions can be answered, two methodological prerequisites must be established: (i) What trap domains and excitation constraints plausibly enable visible-light-driven charge accumulation in thermally grown SiO2/Si, and (ii) what measurement approach can resolve the resulting local surface-potential dynamics during illumination and relaxation. For this reason, the Materials and Methods Section begins with a brief rationale covering the excitation requirements and the suitability of single-point AM-KPFM for time-resolved CPD tracking, followed by the experimental implementation and analysis workflow.
2.1.1. Physical Basis for Optical Excitation and Charge Trapping in SiO2/Si
Light-driven, surface charge-based functionalization of a-SiO2 requires trap states that capture carriers and retain them over short and large time scales [24]. In thermally grown SiO2 on Si, candidate traps span multiple spatial domains (interface, near-interface oxide, bulk oxide, and outer surface) and can accumulate electrons (or holes) supplied via internal photoemission from Si [25]. Carrier transfer among domains (tunneling, hopping, defect-to-defect transitions) is complex and not resolved here; we therefore treat the trap ensemble phenomenologically as an energetically distributed set of chargeable states, without assigning a specific microscopic pathway.
Amorphous SiO2 has a wide bandgap (~9.1 eV) [26] but contains localized defect states from vacancies, strained bonds, and impurities, including oxygen-deficiency centers (ODC(I/II)), E′ centers, non-bridging oxygen hole centers (NBOHCs), and related complexes [27]. ODC centers show absorption bands near ~3.15, 5, 6.9, and 7.6 eV, while NBOHCs and peroxy radicals (PORs) exhibit a visible band near ~2.0 eV (≈620–650 nm) and higher-energy bands (e.g., ~4.8 eV for NBOHCs) [27]. These defects act as electron/hole traps and contribute to broad charge-retention distributions in SiO2 electrets and charge-trapping dielectrics [24,28]. Because amorphous SiO2 supports a continuum of local configurations, trap energies can be broadly distributed, producing stretched- or multi-exponential decay behavior [29].
Although NBOHCs and PORs can be directly excited by ~2.0 eV photons, their creation/transformation is tied to bond breaking and radiation damage [30], and excitation can drive trapping, de-trapping, and defect conversion [31]. Here they are treated as part of the overall trap ensemble, without assuming selective addressing by visible illumination.
Near the SiO2–air interface, silanol/water-related species introduce traps relevant to surface functionalization. Olthuis and Bergveld proposed that long-term negative charge in thermal SiO2 electrets is stored in neutral electron traps formed by silanol hydrolysis followed by reduction, producing immobile SiO− sites within the first tens of nanometers beneath the surface [32]. Representative outer-/near-surface electron traps are reported several eV below the SiO2 conduction band (e.g., ~5.5 eV below) [33], consistent with deep, long-lived traps that are largely inaccessible to direct visible excitation yet can retain charge supplied indirectly. Hydrogen-containing species and adsorbed water layers can also enable lateral conduction via hopping along hydrogen-bond networks, influencing retention and leakage [34]. Processing and hydration state therefore tune trap density/energetic depth and the partitioning/retention of optically injected charge.
In Si/SiO2 stacks, electronic behavior is governed by bulk and outer-surface traps as well as the Si/SiO2 interface and near-interface oxide region [35]. Thermally grown SiO2 on Si is the canonical gate dielectric in microelectronics [36]. Interface states (Pb centers and related defects) exchange charge rapidly with Si bands and strongly affect band bending and SPV [37]. Near-interface “border traps” communicate with Si via tunneling over microseconds to hours [38] and are implicated in bias-temperature instability and long-term MOS drift [39].
Together, interface, near-interface, bulk, and outer-surface traps form a vertically stratified landscape supporting charge accumulation across depths and time scales. Visible-light influence can be understood from band offsets, absorption, and carrier separation. The Si/SiO2 interface has a valence-band offset of ~4.5 eV and a conduction-band offset of ~3.1 eV, so dark charge exchange is dominated by defect-assisted/tunneling processes [40]. SiO2 is essentially transparent across 400–700 nm (bandgap ~9.1 eV), while crystalline Si (indirect bandgap 1.12 eV) [41] absorbs more strongly at shorter wavelengths; thus, carrier generation depths range from tens–few hundred nm near ~400 nm to several µm near ~700 nm.
For p-type Si with typical positive fixed oxide charge/interface states, the near-surface region is depleted or weakly inverted, creating upward band bending and a space-charge region. Under illumination, electron–hole pairs are generated within/below this region; electrons are driven toward the interface (field + diffusion), holes toward the bulk. Electrons can transiently fill interface states and near-interface oxide defects, modifying band bending and producing SPV [42], and a fraction can be trapped in oxide states, yielding a potential change that can persist after illumination.
Thus, visible light typically functionalizes charge indirectly: it generates carriers in Si that are separated and injected into the oxide-associated trap manifold, rather than directly exciting most oxide traps. Efficiency and kinetics depend on carrier generation relative to the space-charge region and the available trap spectrum. Shorter wavelengths (absorbed closer to the interface) are expected to couple more efficiently to interface/near-interface states than longer wavelengths (absorbed deeper), where recombination reduces carrier flux to the interface. Redistribution among trap domains by tunneling/hopping over long times is not resolved here and is treated phenomenologically via its net effect on the measured surface potential versus wavelength and time.
Because of the above, the central question is whether visible light (400–700 nm) can accumulate charge in thermally grown amorphous SiO2 on p-type Si and how the magnitude and dynamics of the resulting surface-potential changes depend on wavelength. Addressing this requires a method that tracks local surface potential in real time during illumination and subsequent relaxation, with sufficient sensitivity for small (mV-scale) shifts and time resolution spanning fast and slow components.
2.1.2. Single-Point AM-KPFM Measurement Principle and Kinetic Readout
Kelvin probe force microscopy is a non-contact atomic force microscopy mode that measures the local contact potential difference between a conductive tip and the sample by nulling the electrostatic force between them [43]. CPD reflects work-function differences and band bending; trapped charge in the oxide and at the interface alters the near-surface electrostatic potential and therefore shifts CPD. In single-point mode, KPFM monitors CPD at a fixed location while a stimulus (e.g., illumination or electrical bias) is applied, enabling real-time charging/discharging kinetics with millivolt sensitivity over timescales from seconds to hours.
KPFM has been used to image written charge patterns in dielectrics [44] and to quantify charge injection and decay in gate oxides and electrets [45], linking decay behavior to trap distributions and conduction pathways. Macroscopic Kelvin probe and surface photovoltage (SPV) methods have likewise been used to study light-induced band bending and defect charging in Si and Si/SiO2 devices [46], typically without nanoscale resolution and often using broadband or single-wavelength excitation. These studies show that illumination can modify interface charge and oxide trap occupation and that resulting potential shifts can persist. However, they do not resolve how sub-band-gap visible excitation across 400–700 nm maps onto local CPD magnitude and kinetics on thermally grown SiO2/Si at micro- and nanoscales.
Here, KPFM is used not to identify specific traps or transfer pathways, but to quantify the net response of the trap ensemble. Time-resolved CPD traces during illumination and relaxation are treated as charging–discharging curves and modeled with simple phenomenological forms (e.g., sums of exponentials or stretched exponentials) to extract characteristic amplitudes and time constants for distinct kinetic regimes. This allows us to determine whether visible illumination produces measurable wavelength-dependent surface-potential changes, quantify their magnitude, and characterize post-illumination relaxation and effective retention, without assigning individual kinetic components to specific microscopic mechanisms.
2.2. Sample Preparation
Thermally grown amorphous silicon dioxide (a-SiO2) layers were formed on p-type Si wafers by “ALFA RPAR”, a Latvian semiconductor manufacturer. The oxide thickness was reported by the manufacturer as 0.6 μm. The wafers were cut into ~5 × 5 mm2 pieces with a diamond-tipped scriber. Each piece was cleaned in a Bandelin Sonorex RK 31 (Berlin, Germany) ultrasonic bath using a multi-step solvent sequence (detergent in water, distilled water rinses, ethanol, isopropanol, acetone, then the same solvents in reverse order, and N2 drying as the final step). Immediately after washing, the cleaned pieces were mounted on TipsNano SU015 (Tallinn, Estonia) polycrystalline sapphire substrates with spring contacts using Amepox Electon AC40 (Lodz, Poland) conductive paste; after drying for 120 min, the spring contact was connected to the AFM ground. Each 5 × 5 mm2 piece was used once and discarded after a single measurement series.
2.3. KPFM Measurements Under Visible Illumination
Surface potential measurements were carried out using an amplitude-modulated Kelvin probe force microscopy (AM-KPFM) mode implemented on an NT-MDT Solver P-47 Pro (Zelenograd, Russia) AFM using a single TipsNano NSG03/Pt (Tallinn, Estonia) platinum-coated probe with a measured resonance frequency of ~82.7 kHz. The KPFM AC modulation was applied at the resonant frequency of the cantilever while the probe was kept static above the sample surface. KPFM was performed as strictly single-point measurements. The tip was positioned on a representative location within a previously imaged region, and the cantilever was maintained at a lift height of 50 nm above the surface during potential measurements. No lateral scanning was performed during the time-resolved charging/discharging sequences.
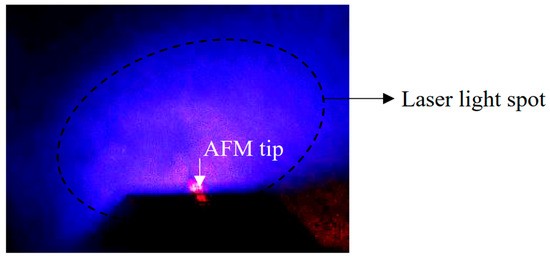
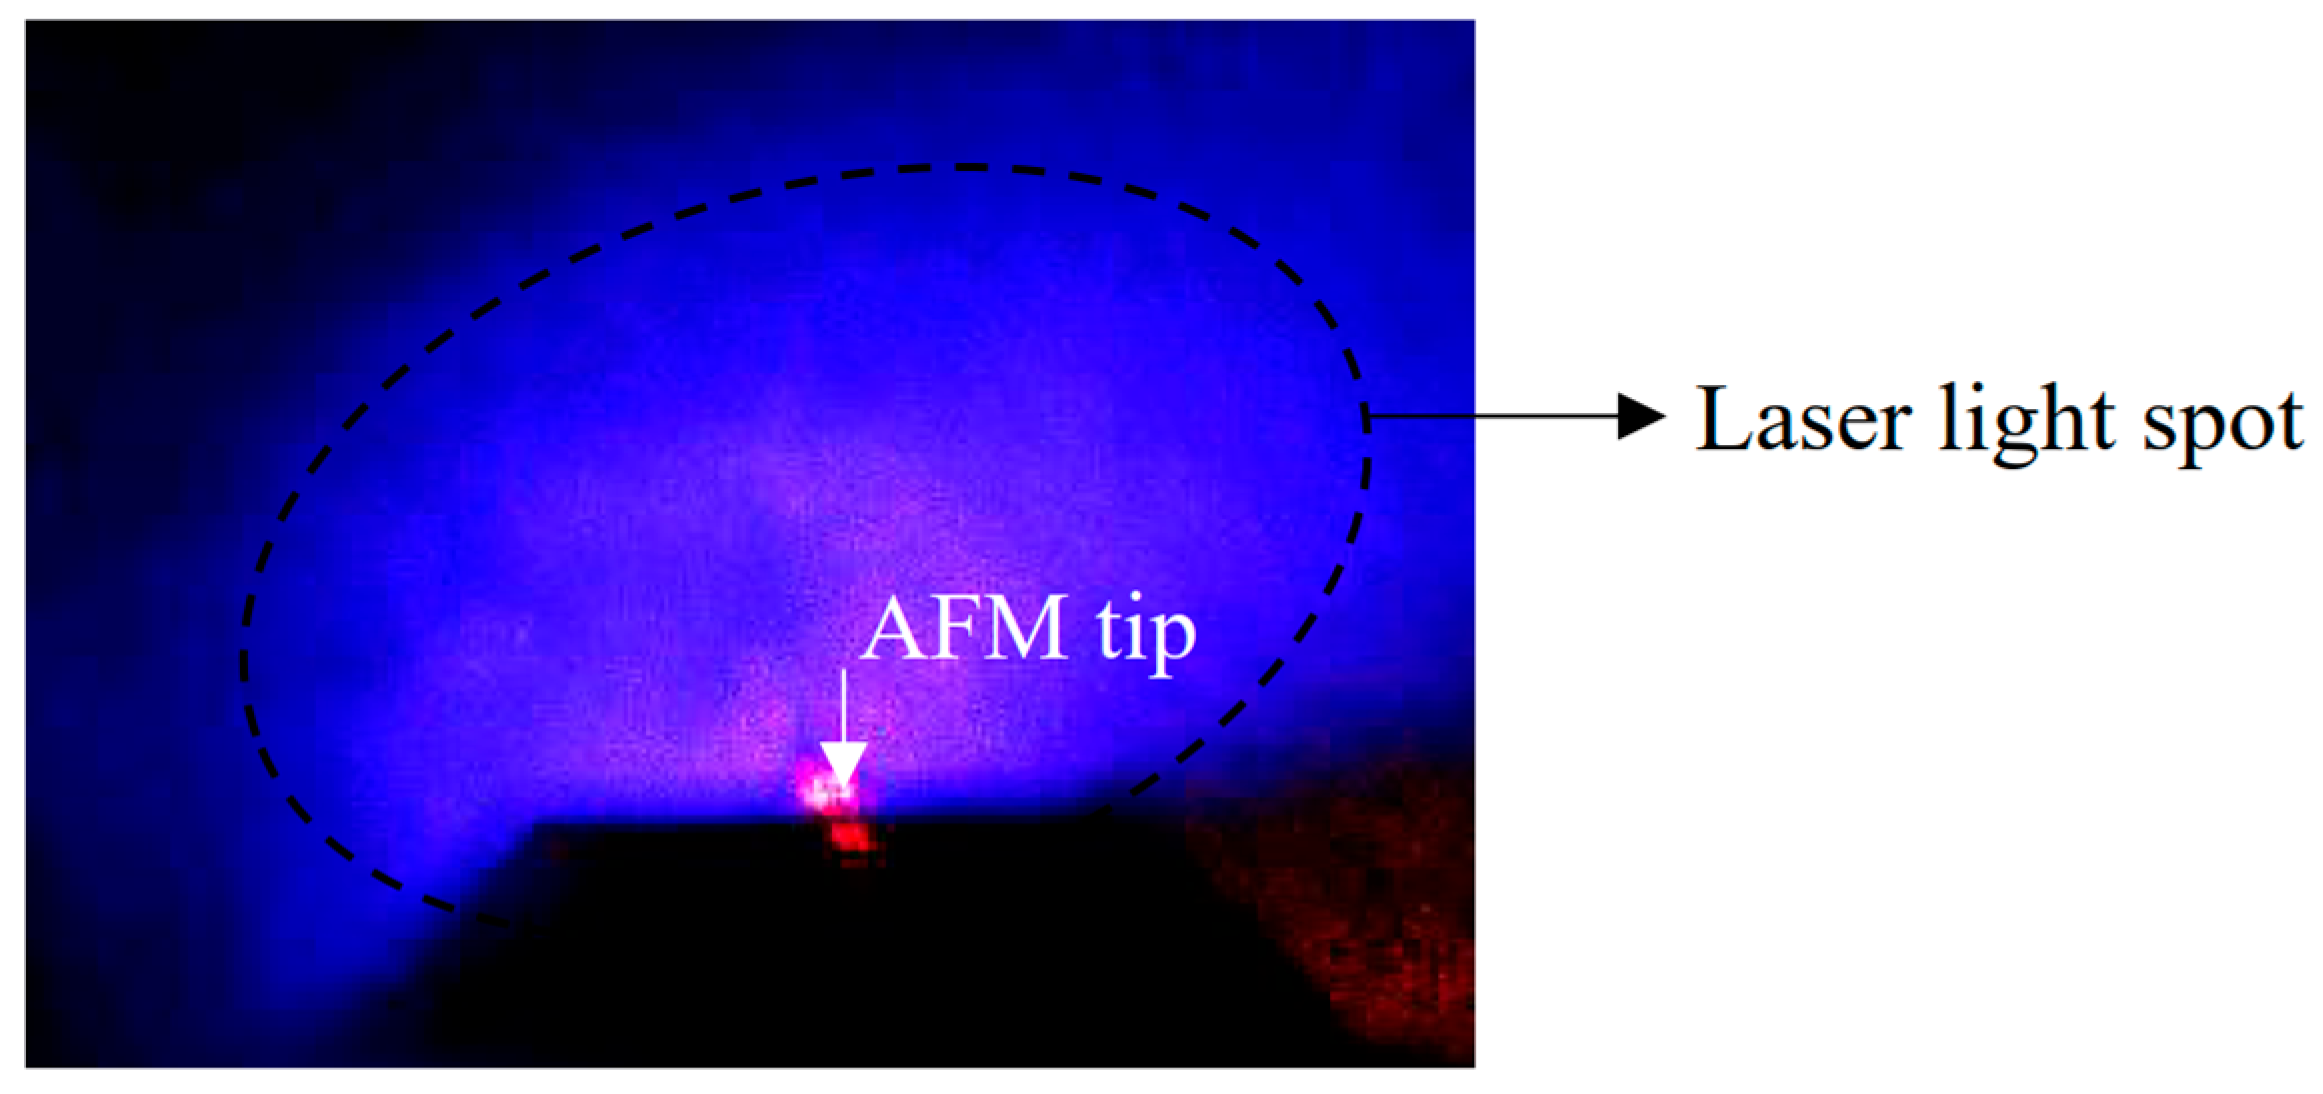
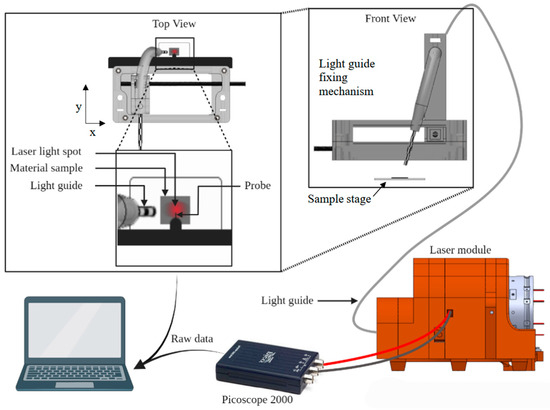
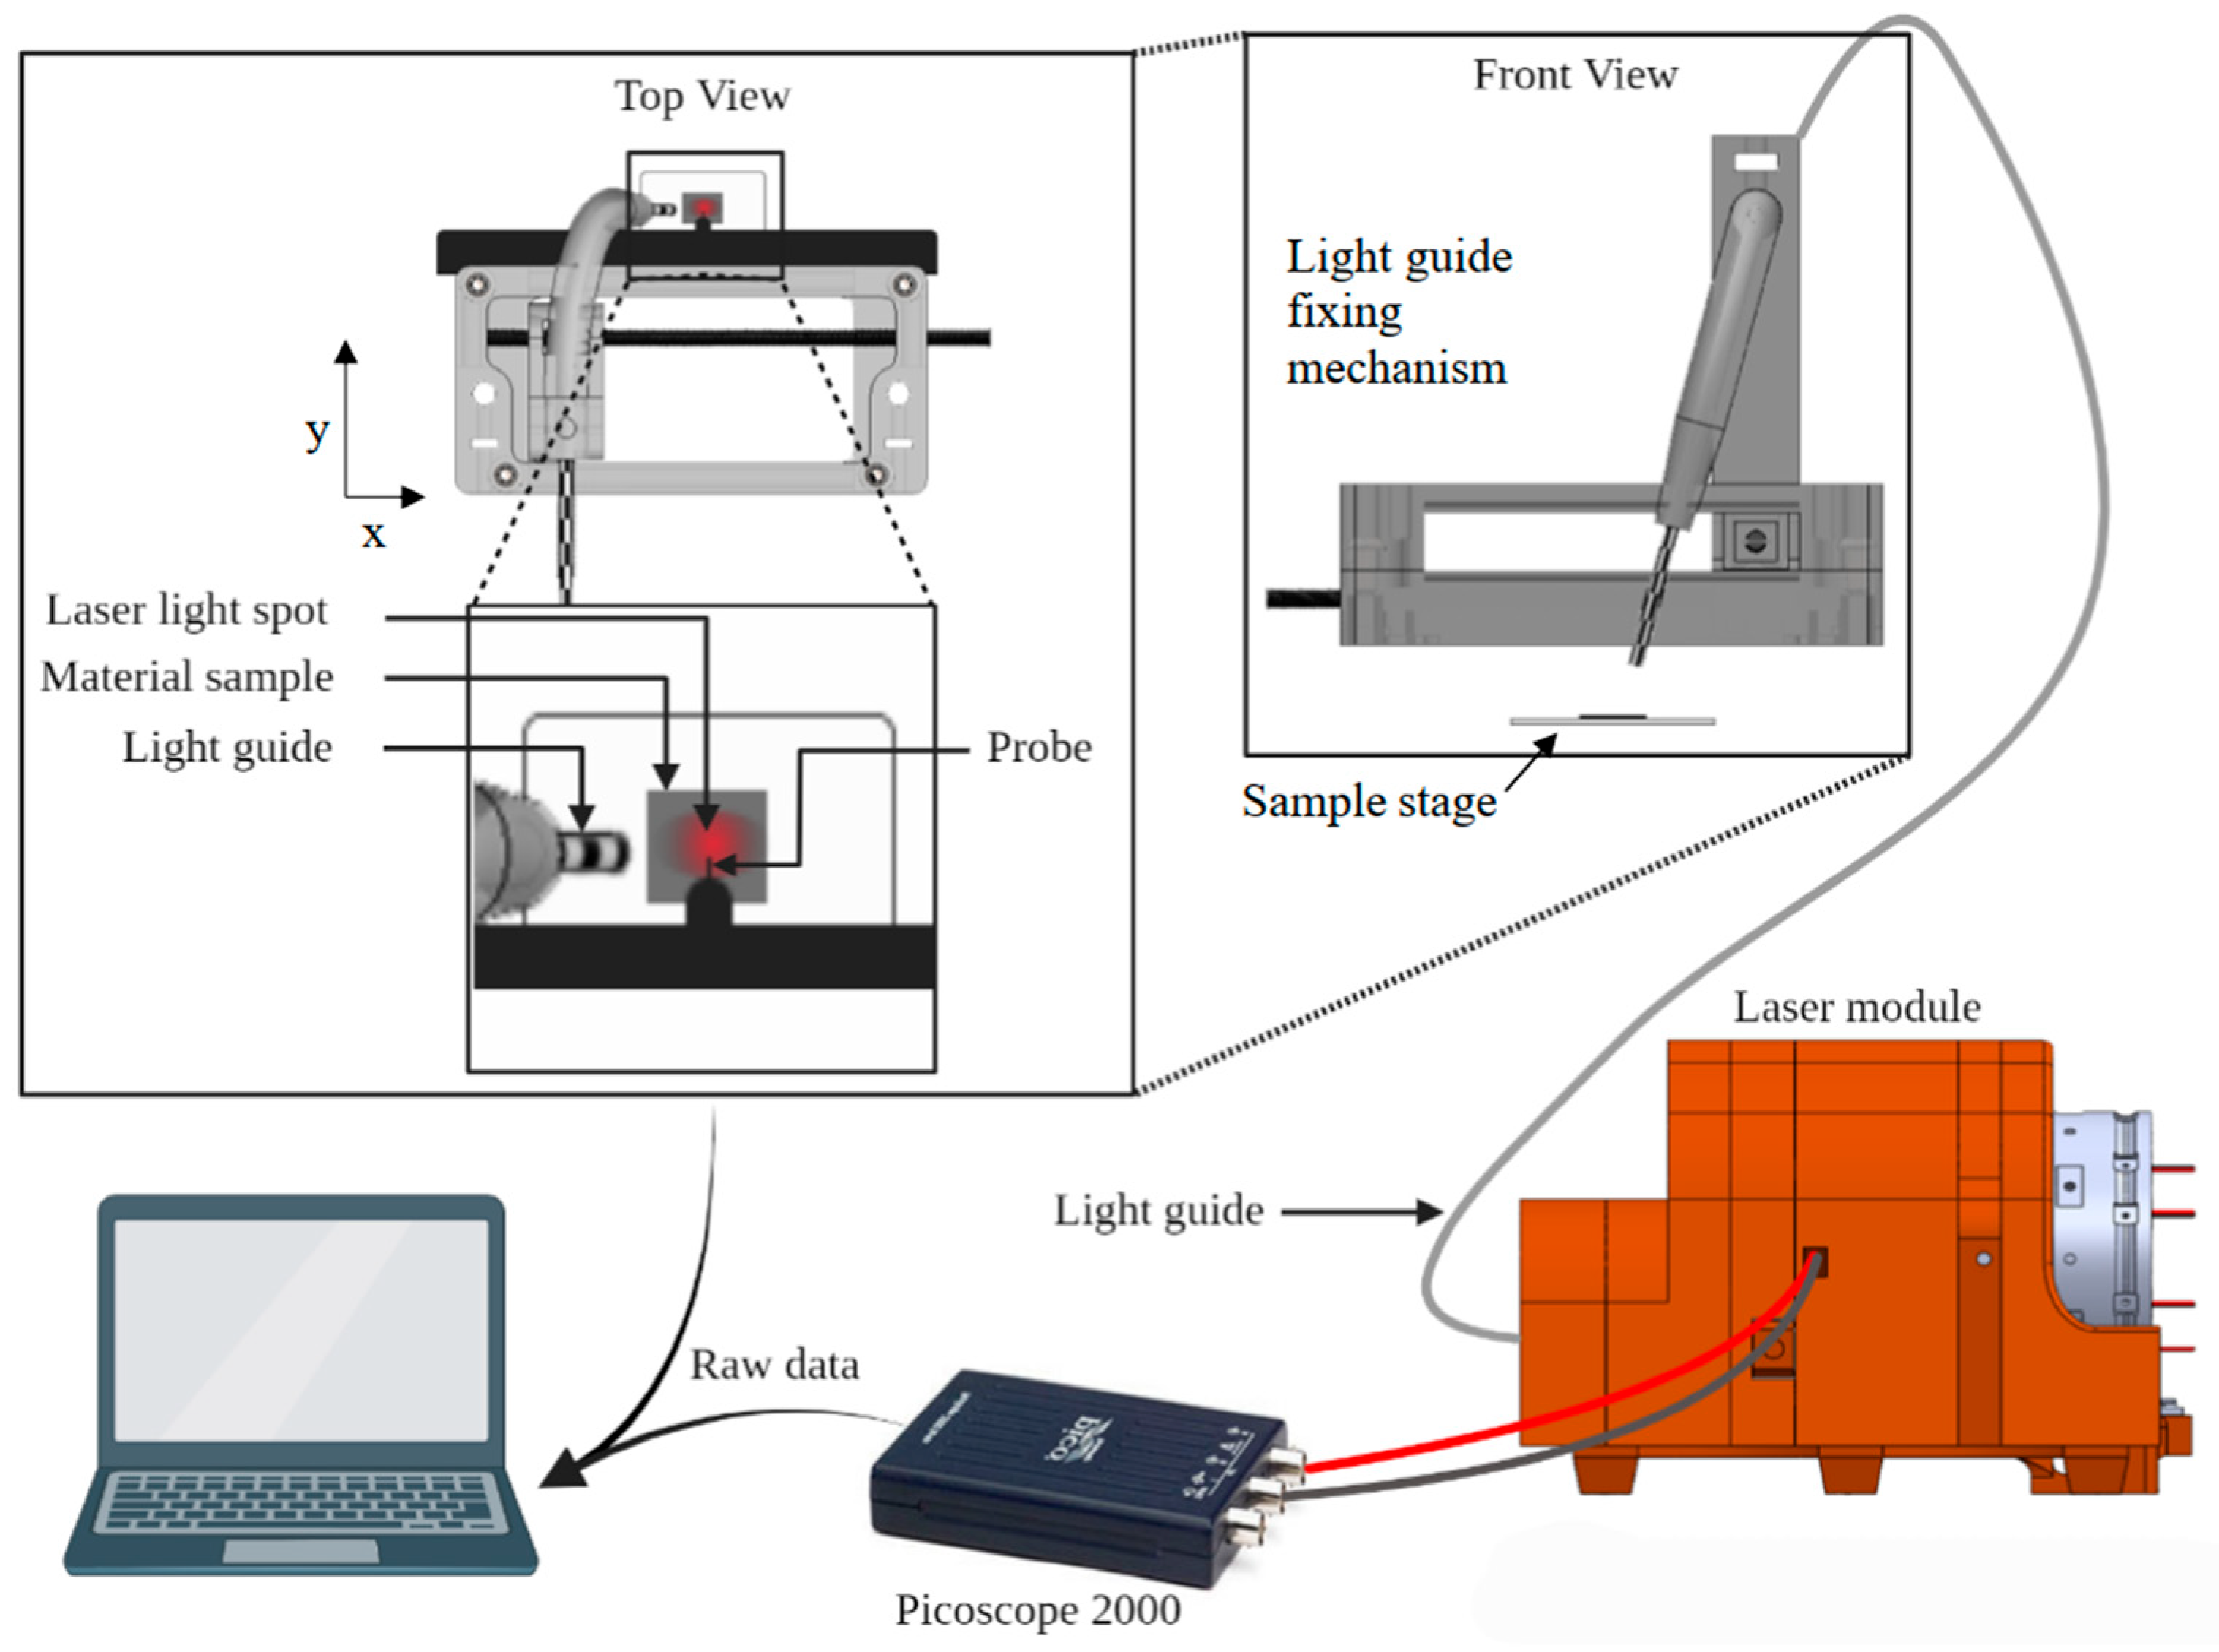
To illuminate the measurement point, laser light was delivered via an optical fiber to a custom 3D-printed fixture mounted on the AFM head (Figure 1). The fixture holds the fiber outlet above the sample and provides independent horizontal and angular adjustment so that the laser spot coincides with the KPFM measurement point while passing through the small window in the measuring head without blocking the AFM detection laser (Figure 2). The incidence angle was adjusted such that the region directly under the tip was uniformly illuminated and not shadowed by the cantilever. A sacrificial sample was used to set this alignment before mounting each measurement sample.
Figure 1.
Photograph depicting the illumination of the measurement location.
Figure 2.
Schematic of the illumination system.
The fiber was fed by a custom laser module containing three continuous-wave (CW) diode lasers at 405, 505, and 685 nm (Besram Technology, Wuhan, China) mounted in a rotating carriage (in the back of the laser module seen in Figure 2) a neutral-density filter selection module (included a 1/2, 1/4, 1/8, and 1/16 ND-filters) followed by a 80/20 beam splitter placed in the optical path sending the 20 part of the light to a diode that measured the output intensity and the 80 part through a mechanical shutter that offered on off control, followed by focusing optics connected to an optic fiber port. Only the laser in the active position of the carriage was coupled into the downstream optics at any given moment. Light power at the output end of the optic fiber was adjusted into the same range using neutral-density filtering and measured to be ~5 mW using a Hamamatsu S1336-8BQ Si photodiode (Ichino-cho, Chuo-ku, Hamamatsu City, Shizuoka, Japan) mounted in the laser module. The photodiode signal was recorded with a PicoScope 2000-series USB oscilloscope (Pico Technology, Cambridge, UK) and PicoLog 6 software.
The AFM was prepared for Kelvin probe operation following the manufacturer instructions available in the help section of the AFM software (NT-MDT Nova v1.1.0.1921). With the sample mounted and grounded, the tip was positioned approximately over the center of the 5 × 5 mm2 area. The sample was approached first manually to ~1 mm separation, then by the automatic approach routine to establish gentle tip–sample interaction. Time-resolved KPFM measurements were acquired in Kelvin probe mode (Pass II) as single-point measurements: the tip was parked at a fixed lateral position, the lift height was set to 50 nm, and CPD was recorded as a function of time.
The experiments were performed in an ambient laboratory environment at 22 ± 1 °C and 25 ± 5% RH. Relative humidity and temperature were maintained by the HVAC system of the facility. During the measurements, the sample was kept in the dark during the measurements by covering it with the protective dome of the Solver P-47 Pro.
For each wavelength (405, 505, 685 nm), a time-resolved KPFM sequence was recorded as follows:
- Before the measurement could proceed, one of the lasers would be turned on and rotated into the optical path where it would go through a beam splitter, sending 80% of the beam towards the optic fiber and 20% towards the photodiode connected to the USB oscilloscope. The readout from the oscilloscope was used to wait for the laser source to stabilize and to monitor its power output during the experiment. The mechanical shutter was closed at this point. The experiment would proceed when the output power of the laser became stable.
- After being inserted into the AFM sample holder, the sample approach sequence was started controlled by the AFM software (NT-MDT Nova v1.1.0.1921) where the AFM would automatically bring the sample into the vicinity of the probe, make a scan of the surface, then placed over a spot within that region with the distance between the tip of the probe and the sample being set at 50 nm.
- The sample was equilibrated in the dark for fifteen minutes until the contact CPD reached a stable baseline (dark CPD).
- Then the KPFM feedback loop was engaged and the CPD was recorded as a function of time using the same AFM control software with the mechanical shutter closed and the sample receiving no light. The dark CPD was recorded for 500 s.
- After an initial dark period and while continuing recording the CPD, the shutter was opened and the laser light was passed through the optic fiber onto the sample surface. The illumination continued for 800 s.
- At the end of the illumination interval, the mechanical shutter was closed, and the laser was switched off while the KPFM measurement continued in the dark, yielding the “discharging” transient.
- The sequence was repeated for different illumination wavelengths, with four repetitions per wavelength.
2.4. Data Analysis
Time-dependent CPD traces were exported and analyzed using Origin Pro to extract characteristic amplitudes and time constants. The charging transients were fitted using one-phase or two-phase exponential association models of the following form:
or
where V(t) is the CPD at time t, V∞ denotes the final CPD level reached after long times in the dark, A1 and A2 are the amplitudes of the fast and slow components, and τ1 and τ2 are their corresponding time constants. τc is the composite time constant for the whole charge curve. Discharging traces were described by analogous one-phase or two-phase exponential decays,
or
Vdark is the initial dark CPD, A1 and A2 for the discharge case are the amplitudes of the fast and slow components, respectively, and τ1 and τ2 are their corresponding time constants. τd is the composite time constant for the whole charge curve.
For each charging or discharging data set, both one-phase and two-phase models were fitted, and an extra sum-of-squares F-test was used to decide whether the addition of a second exponential term significantly improved the fit at the 95% confidence level. The fitted parameters (amplitudes, time constants, and asymptote values) and their standard errors were obtained from the nonlinear least-squares regression.
Beyond statistics, a two-exponential descriptor is physically plausible for SiO2/Si CPD transients because the measured surface potential can reflect at least two kinetically separable contributions: a rapidly responding near-interface/surface reservoir (e.g., interface states and shallow border traps and/or fast surface charge rearrangement) and a more slowly responding reservoir associated with deeper oxide/border traps and/or transport-mediated equilibration within the oxide. In ambient conditions, surface hydration can further introduce slow baseline equilibration that is not purely electronic. Accordingly, the fitted time constants are treated as effective kinetic descriptors of the observed CPD response within the available signal-to-noise and time window, rather than unique identifiers of a single microscopic mechanism or defect species.
To quantify the relative contribution of the fast component, a dimensionless parameter k was defined based on the fitted amplitudes. Because the sign of the amplitudes depends on the chosen convention for CPD increase or decrease, absolute values were used,
and analogous expressions were used for discharging traces. Thus, Pfast represents the fraction of the total asymptotic CPD change that is associated with the fast exponential component in the bi-exponential fit. High Pfast values indicate that most of the total CPD change occurs on the fast time scale, whereas low Pfast values indicate that the slow component dominates the net change, with the fast process providing only a minor contribution.
The short-term noise of the CPD signal was assessed from dark segments without illumination by calculating the standard deviation of V(t) within time windows where no systematic drift was observed. Signals whose magnitude remained comparable to this noise level over the entire illumination period were treated as below the effective detection limit of the experiment.
3. Results
3.1. Time-Resolved CPD Response Under 405 nm Illumination
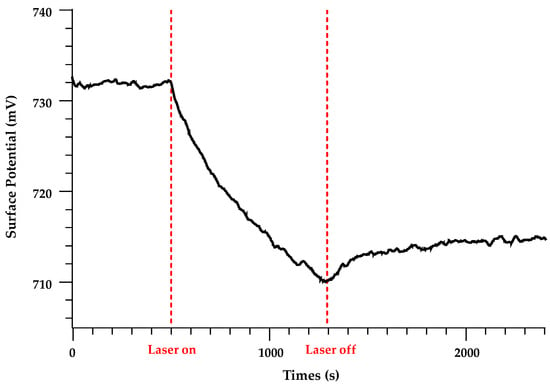
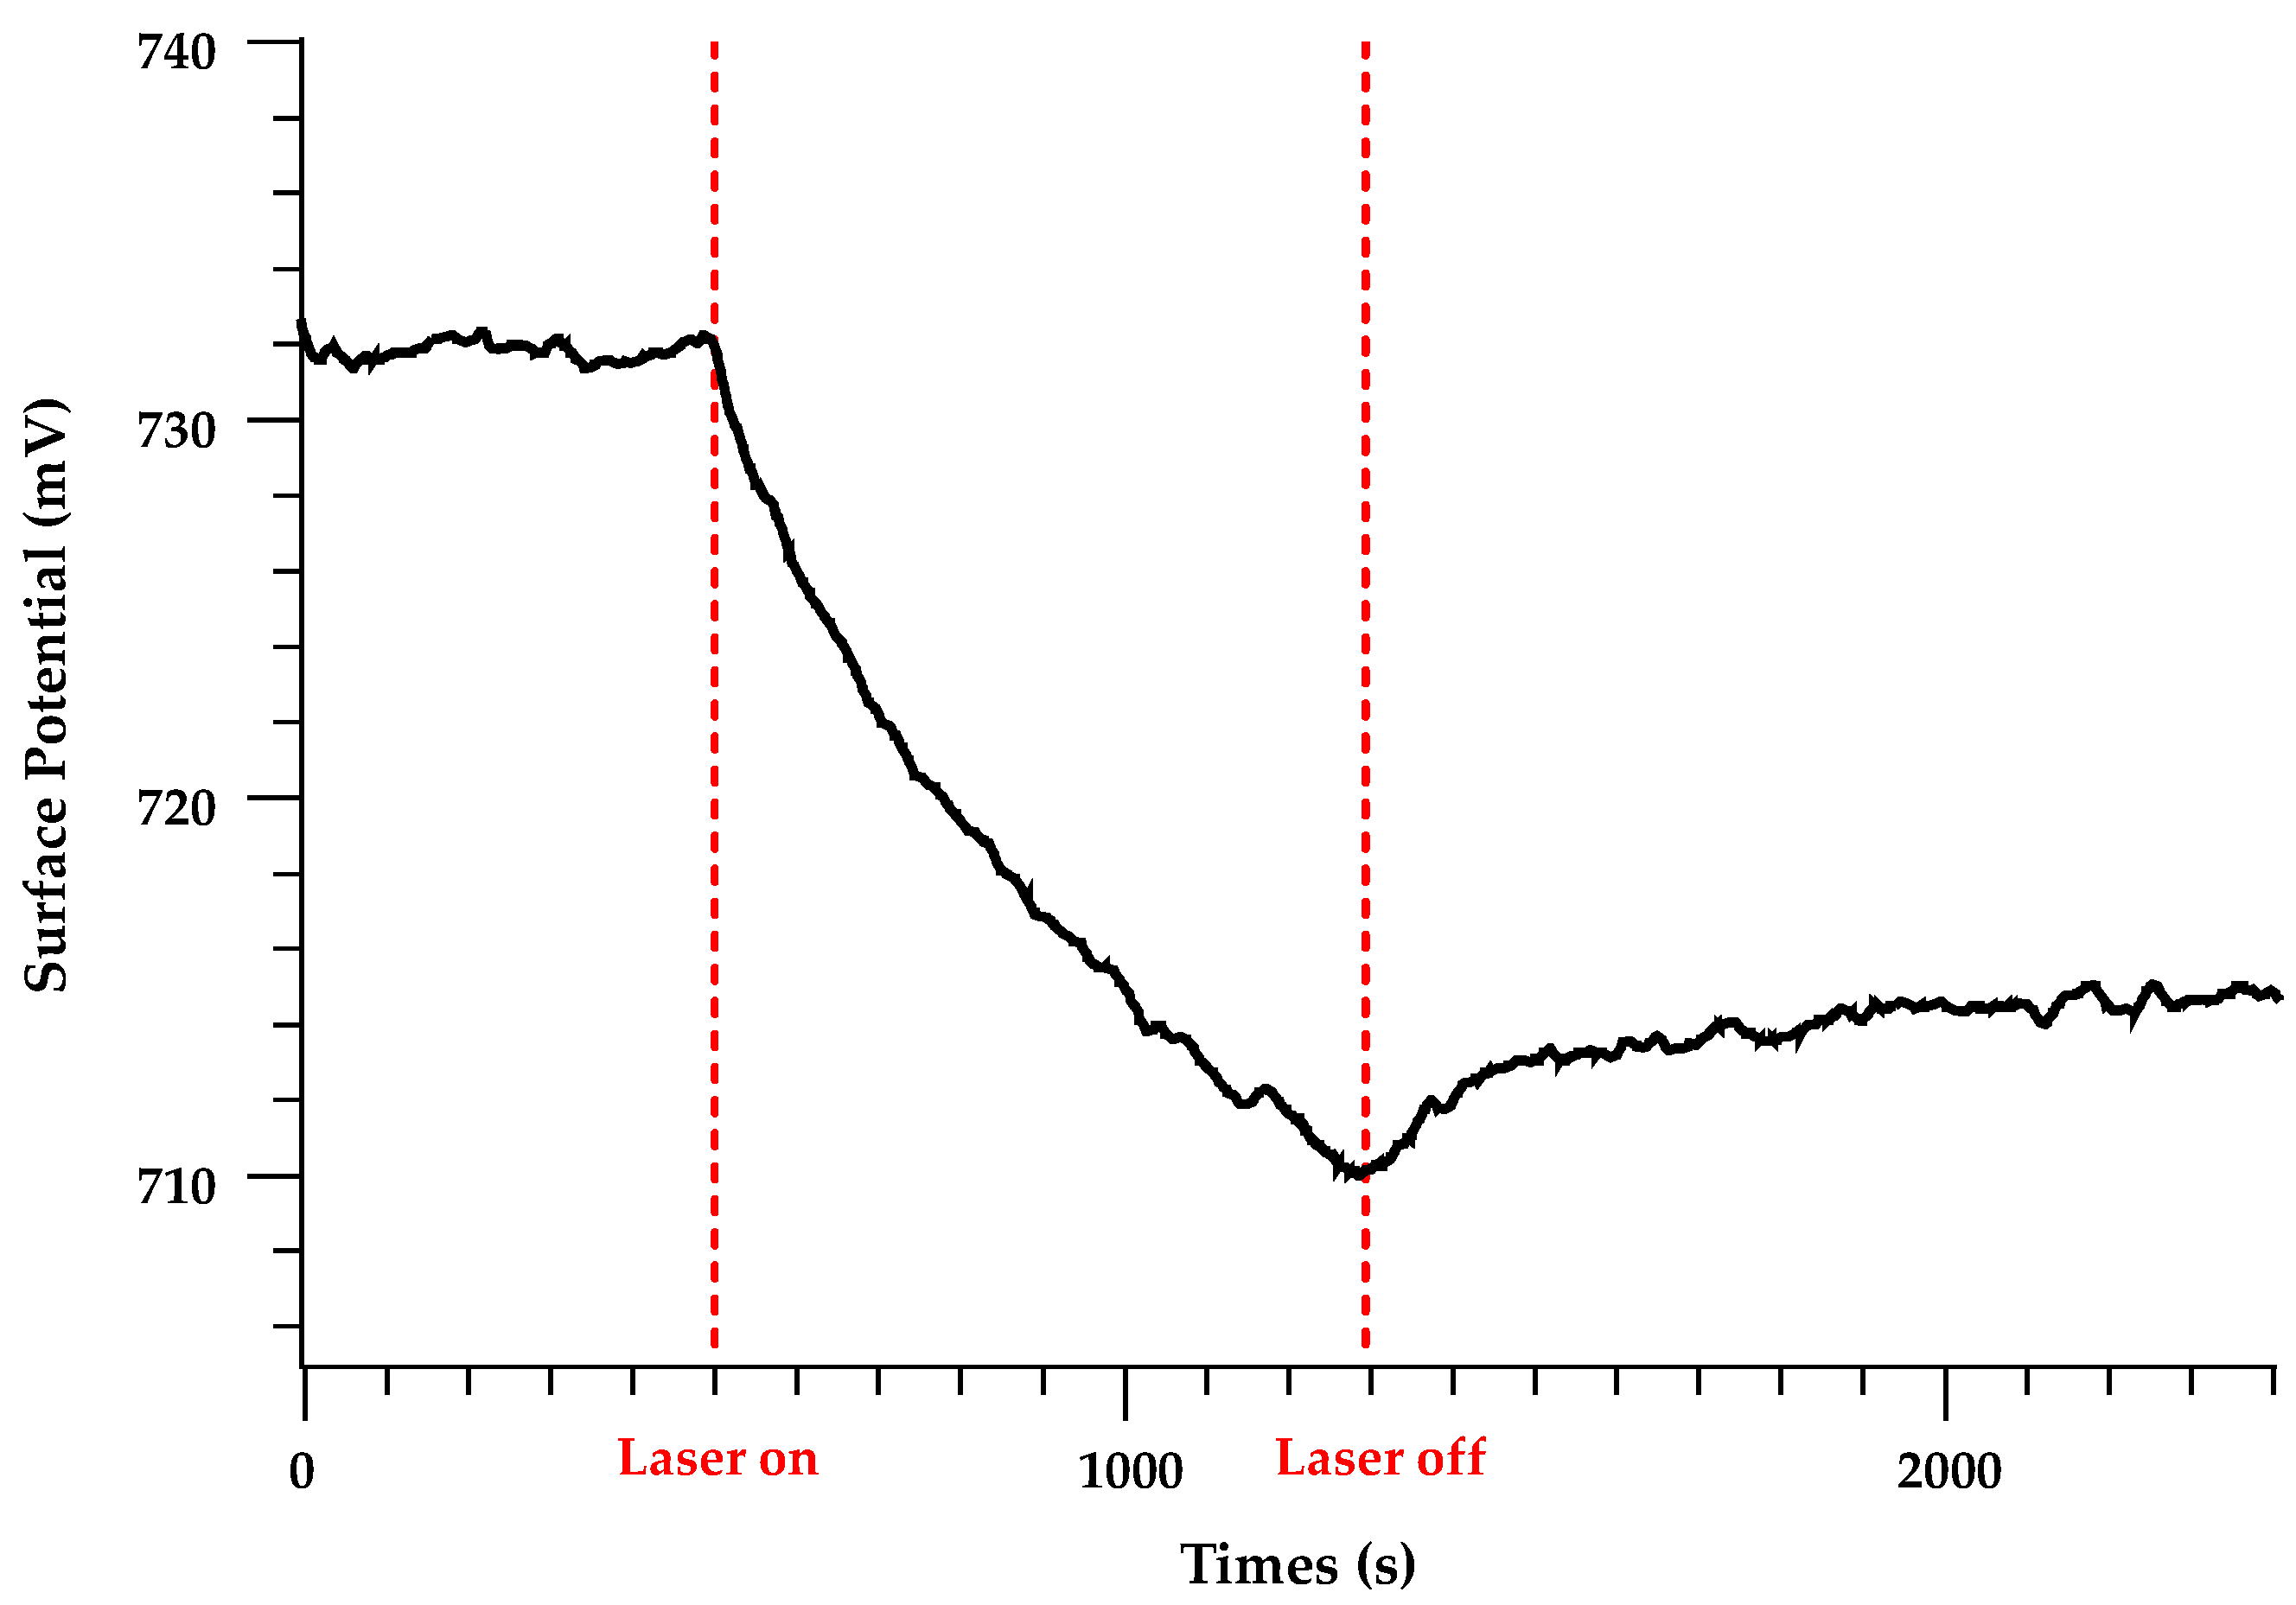
Time-resolved KPFM measurements under 405 nm illumination show a clear three-stage behavior at the measurement point. After an initial dark period, the CPD is stable within the instrumental noise. When the mechanical shutter is opened and the sample is exposed to the 405 nm beam, the CPD deviates monotonically from its dark value and approaches a new quasi-steady state over several thousand seconds (charging phase). When the shutter is closed again, the CPD relaxes back towards its dark value but does not fully return within the experimental time window, indicating the presence of long-lived trapped charge (discharging and retention). A representative data set for 405 nm is shown in Figure 3.
Figure 3.
Representative charging-discharging curve, λ = 405 nm. Steady state recorded up to Laser on, charging recorded between Laser on and Laser off, discharging recorded after Laser off.
For each wavelength, four charging–discharging cycles were recorded under identical conditions. The three most reproducible traces were selected and averaged to reduce random errors. The averaged CPD–time curves were then smoothed using a Savitzki-Golay filter with a window of 10 to remove instrumental noise and then used for subsequent comparison and kinetic analysis.
3.2. Comparison of Charging Curves at 405, 505, and 685 nm
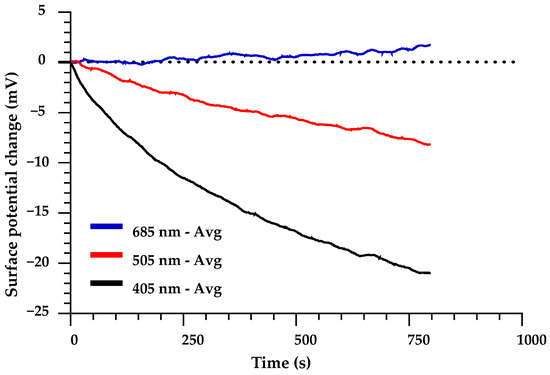
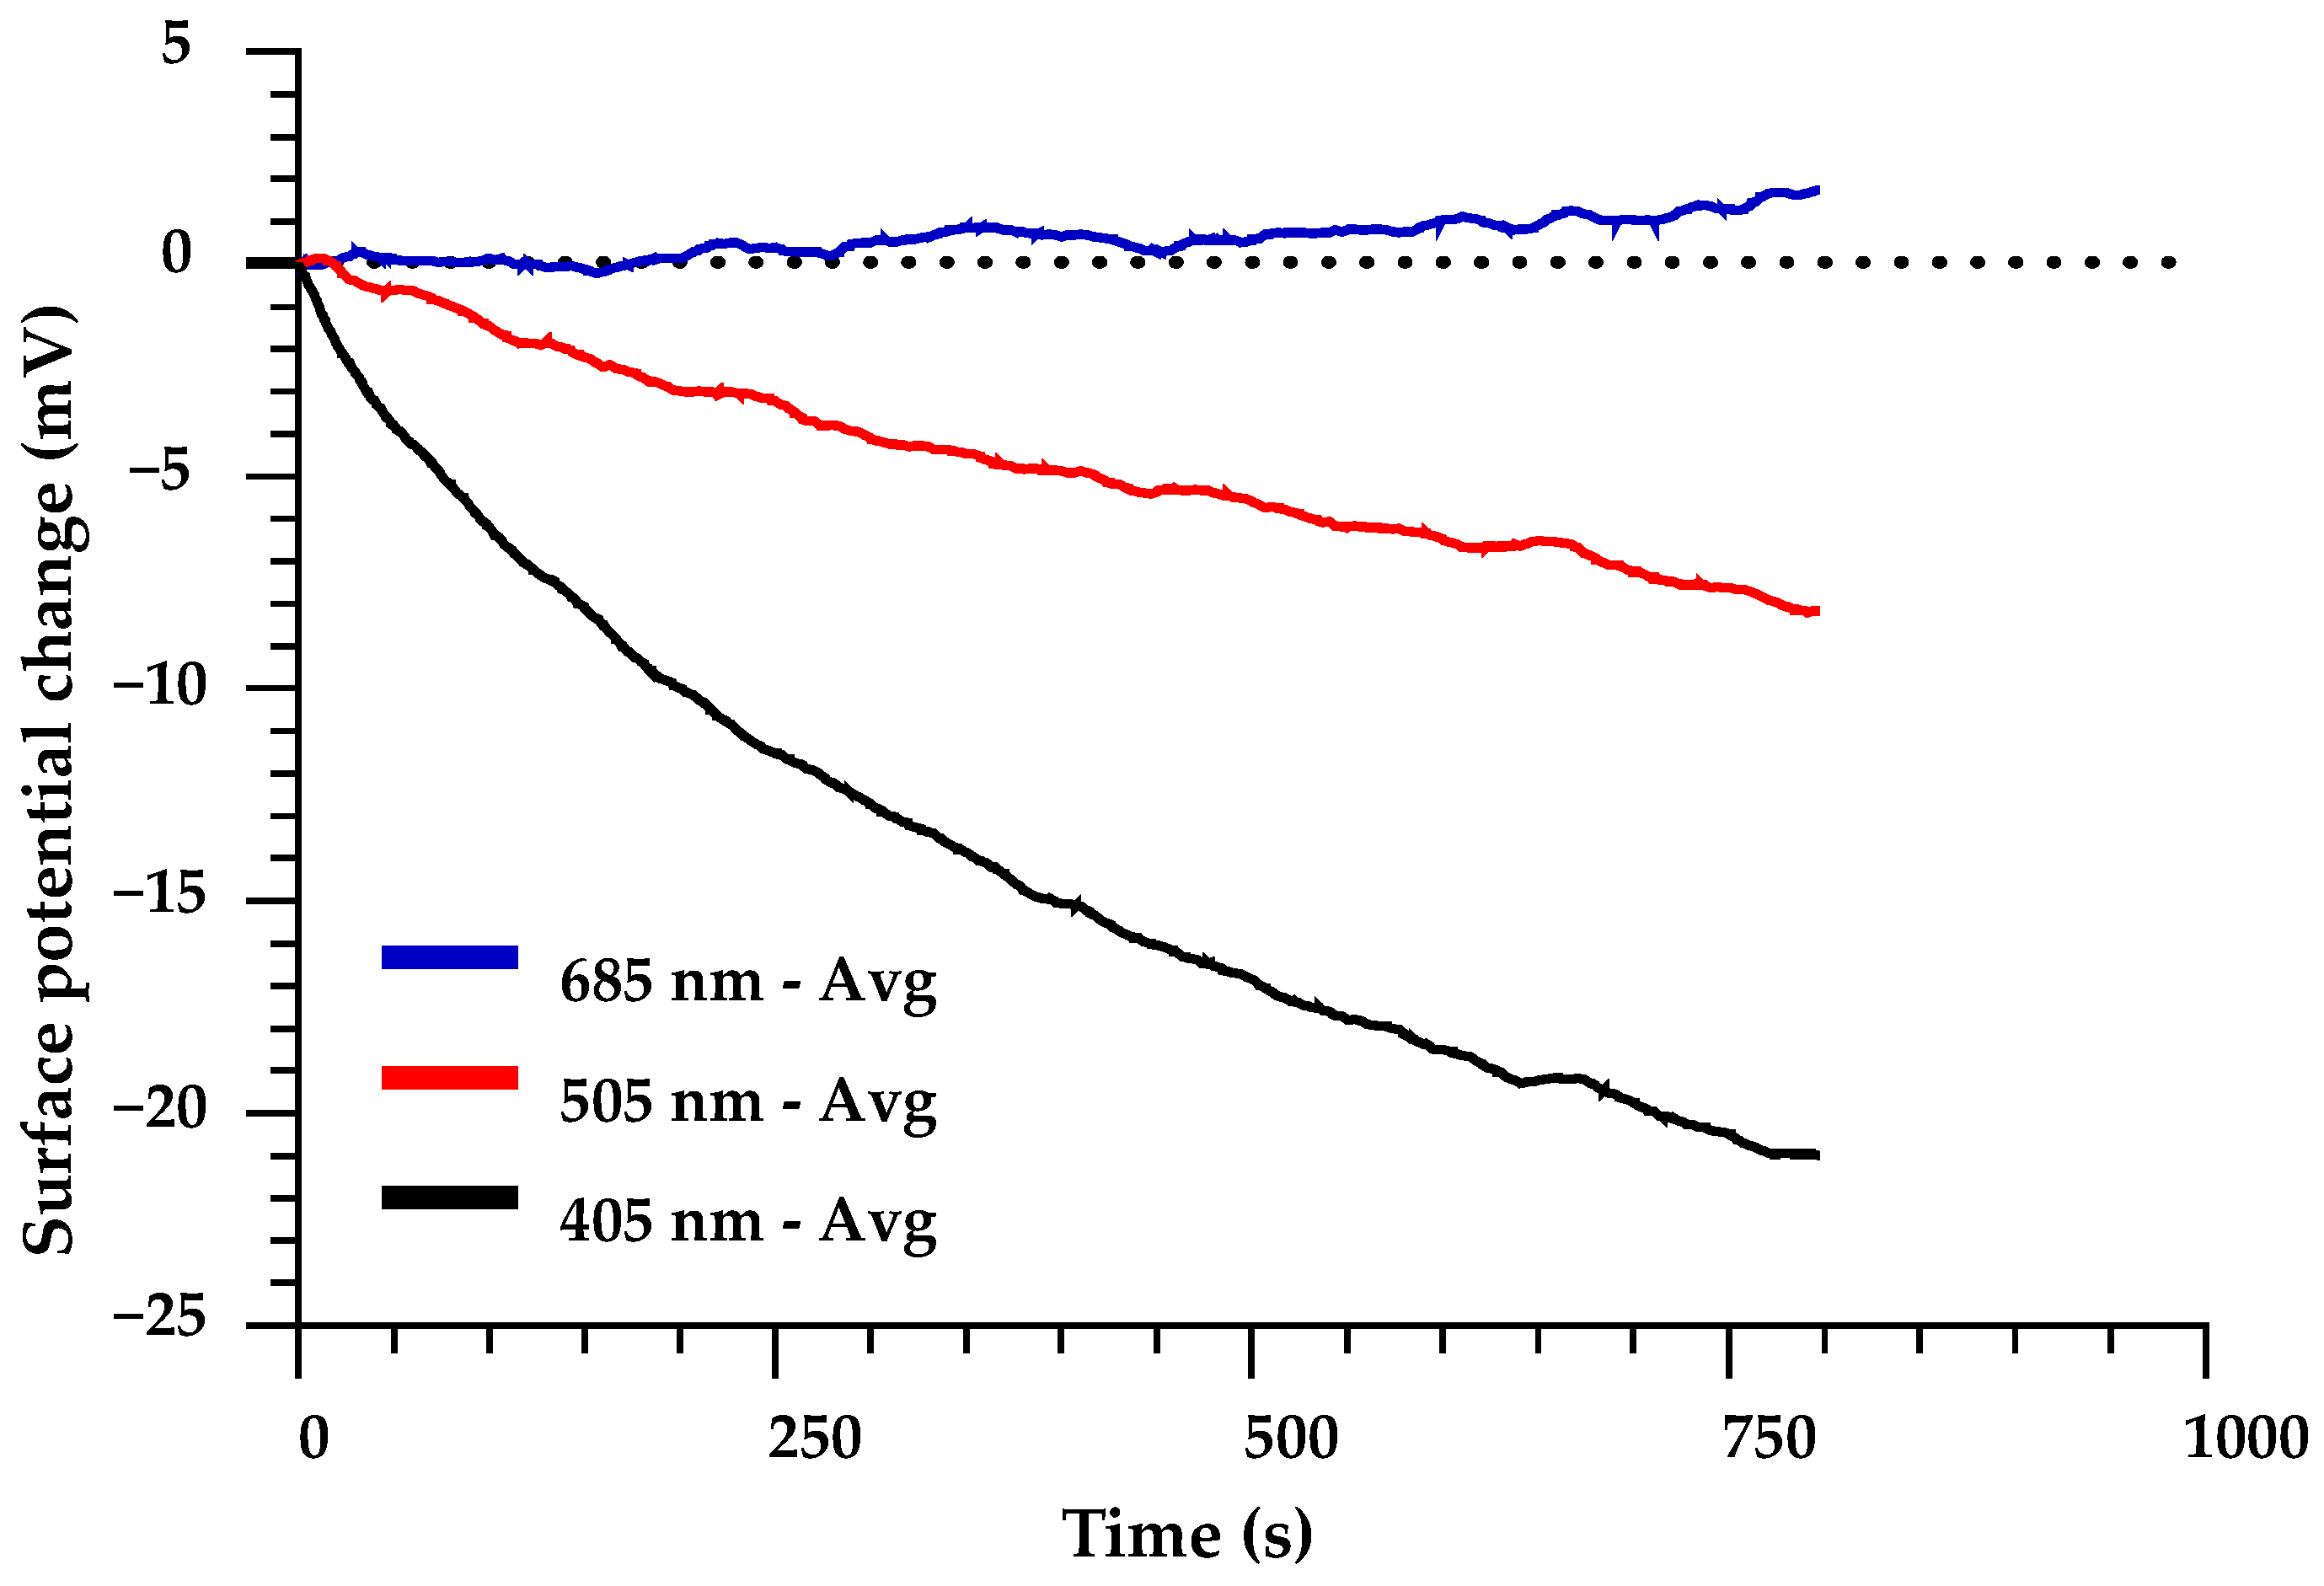
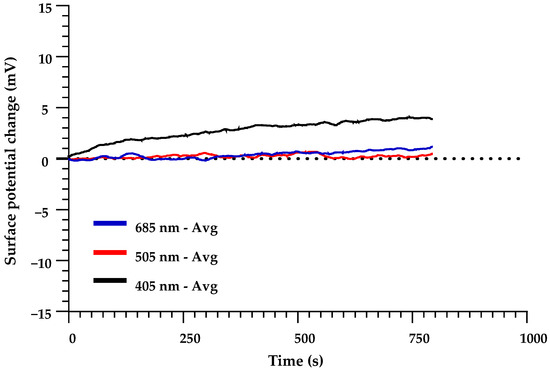
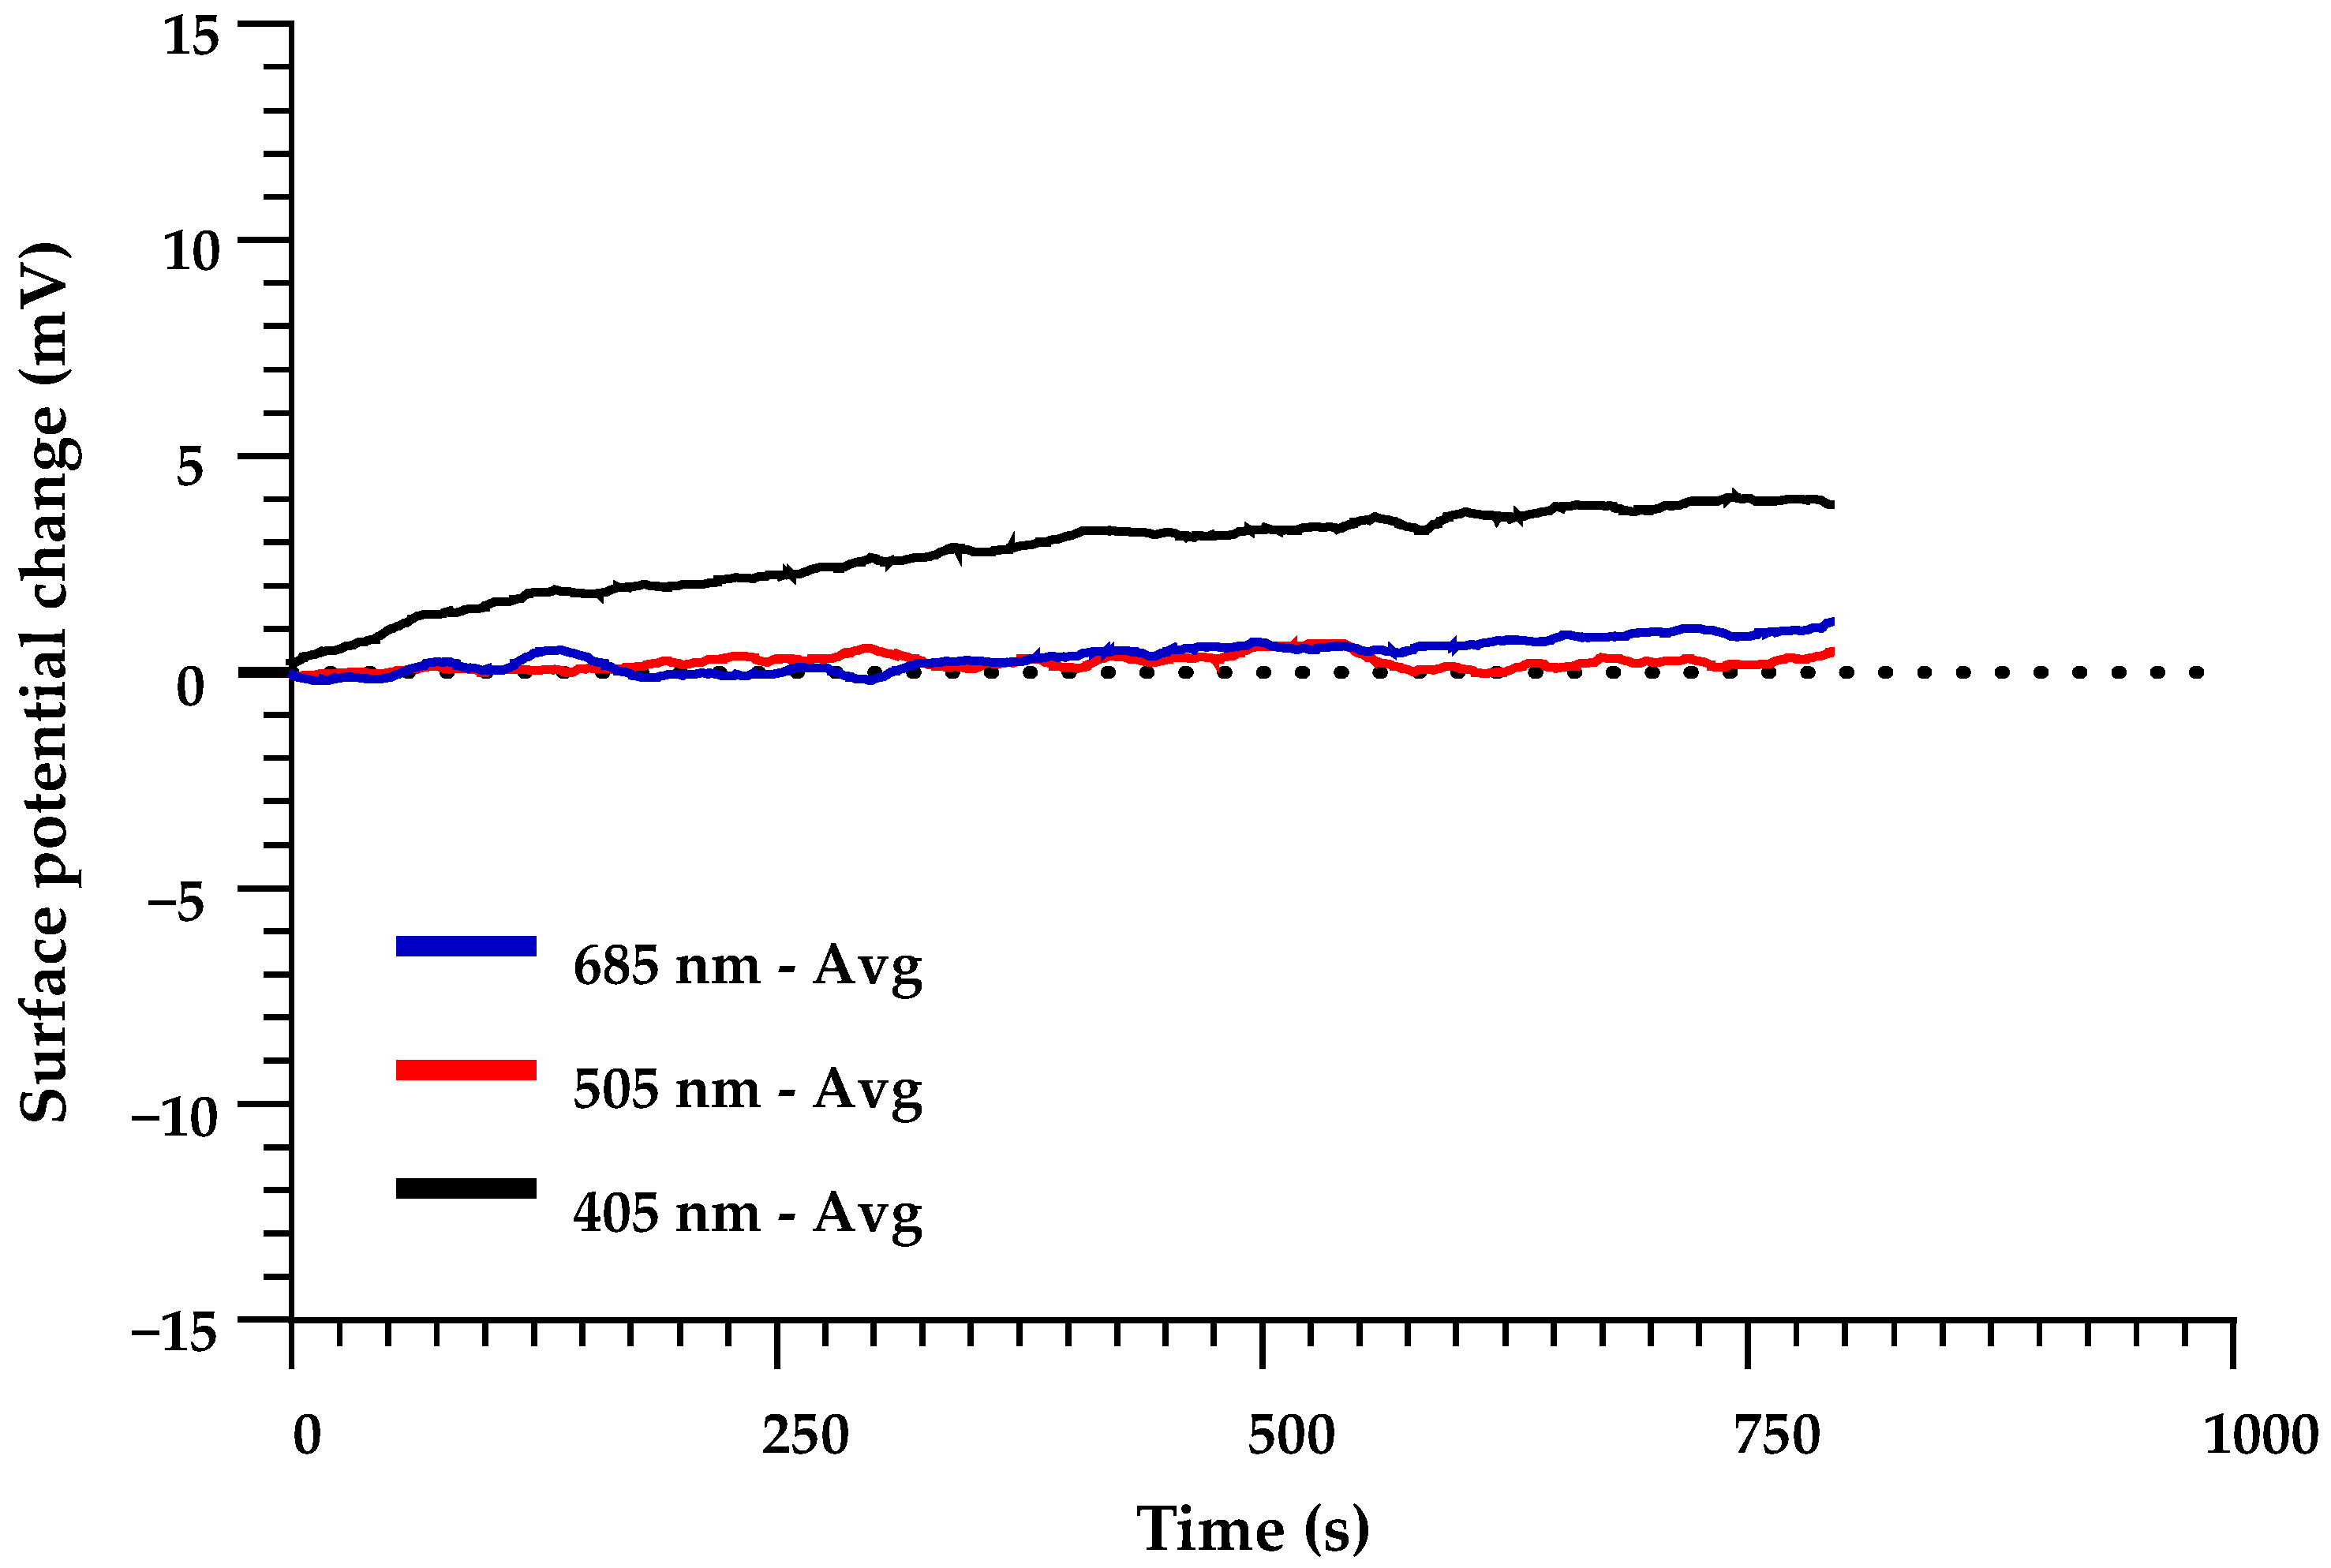
Figure 4 compares the average charging curves obtained with 405, 505, and 685 nm illumination. For clarity, the curves are normalized and truncated to emphasize the initial charging dynamics. The 405 nm excitation produces the largest absolute change in CPD, followed by 505 nm; the apparent response at 685 nm remains within the noise level of the measurement (±2.5 mV). The maximal absolute surface-potential change at 505 nm is roughly a third of that obtained at 405 nm.
Figure 4.
Comparison of the average charging curves.
3.3. Comparison of Discharging Curves and Qualitative Retention
Figure 5 summarizes the discharging behavior following illumination at each wavelength. The same normalization and truncation were performed on the discharging curves as was on the charge curves. After 405 nm excitation, the CPD exhibits a pronounced relaxation towards its dark value with a clearly non-single-exponential character and a non-zero offset that persists at long times. In contrast, the CPD traces recorded after 505 nm and 685 nm illumination display only very small variations, comparable to the instrumental uncertainty, and no robust discharging kinetics can be extracted from these curves.
Figure 5.
Comparison of the average discharging curves.
3.4. Kinetic Parameters from Exponential Fits: Charging
To quantify the charging kinetics, the average CPD traces were fitted with exponential models as described in Section 2.4. For 405 nm excitation, the charging curve is well described by a two-phase exponential function. The best-fit two-phase model yields a asymptote value of approximately −28 mV relative to the dark baseline and an excellent goodness of fit (R2 = 0.9996).
The resulting best-fit parameters and their uncertainties are summarized in the curve-fitting tables. Asymptote (P) is the asymptotic CPD value predicted by the model as . For normalized data it is equal to . The characteristic time scales of the processes are captured by τ and the half-life () of the process. For one-phase fits, τ is the single time constant of the process, and the corresponding half-life is defined as . For two-phase fits, the parameters τ1, τ2 (for the slow process), and their associated half-lives describe the fast and slow components of the bi-exponential response, respectively. The “Rate constant ratio” is defined as τ2/τ1 and provides a measure of the separation between the fast and slow time scales. For each fit, the “Goodness of fit” section reports the coefficient of determination (R2) and the sum of squares of residuals (Sum of Squares), which quantify how well the model describes the data; larger R2 and smaller Sum of Squares indicate better agreement between model and experiment. For each parameter, 95% confidence intervals are reported as the best-fit value plus and minus Δ in the “+Δ” and “−Δ” columns in Appendix A (Table A1).
The extracted parameters for 405 nm can be seen in Table 1. The presence of two distinct time scales and a dominant slow contribution indicates that the approach to steady state is governed by at least two kinetically distinguishable processes.
Table 1.
Best fit parameter values for charging and discharging curve fits.
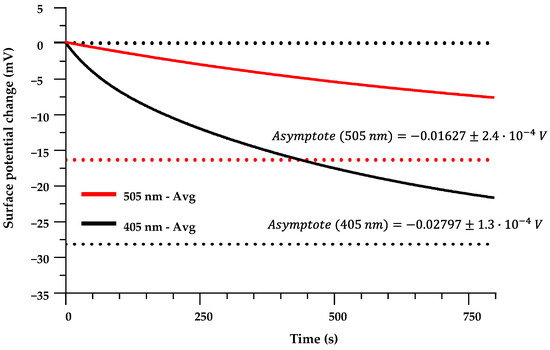
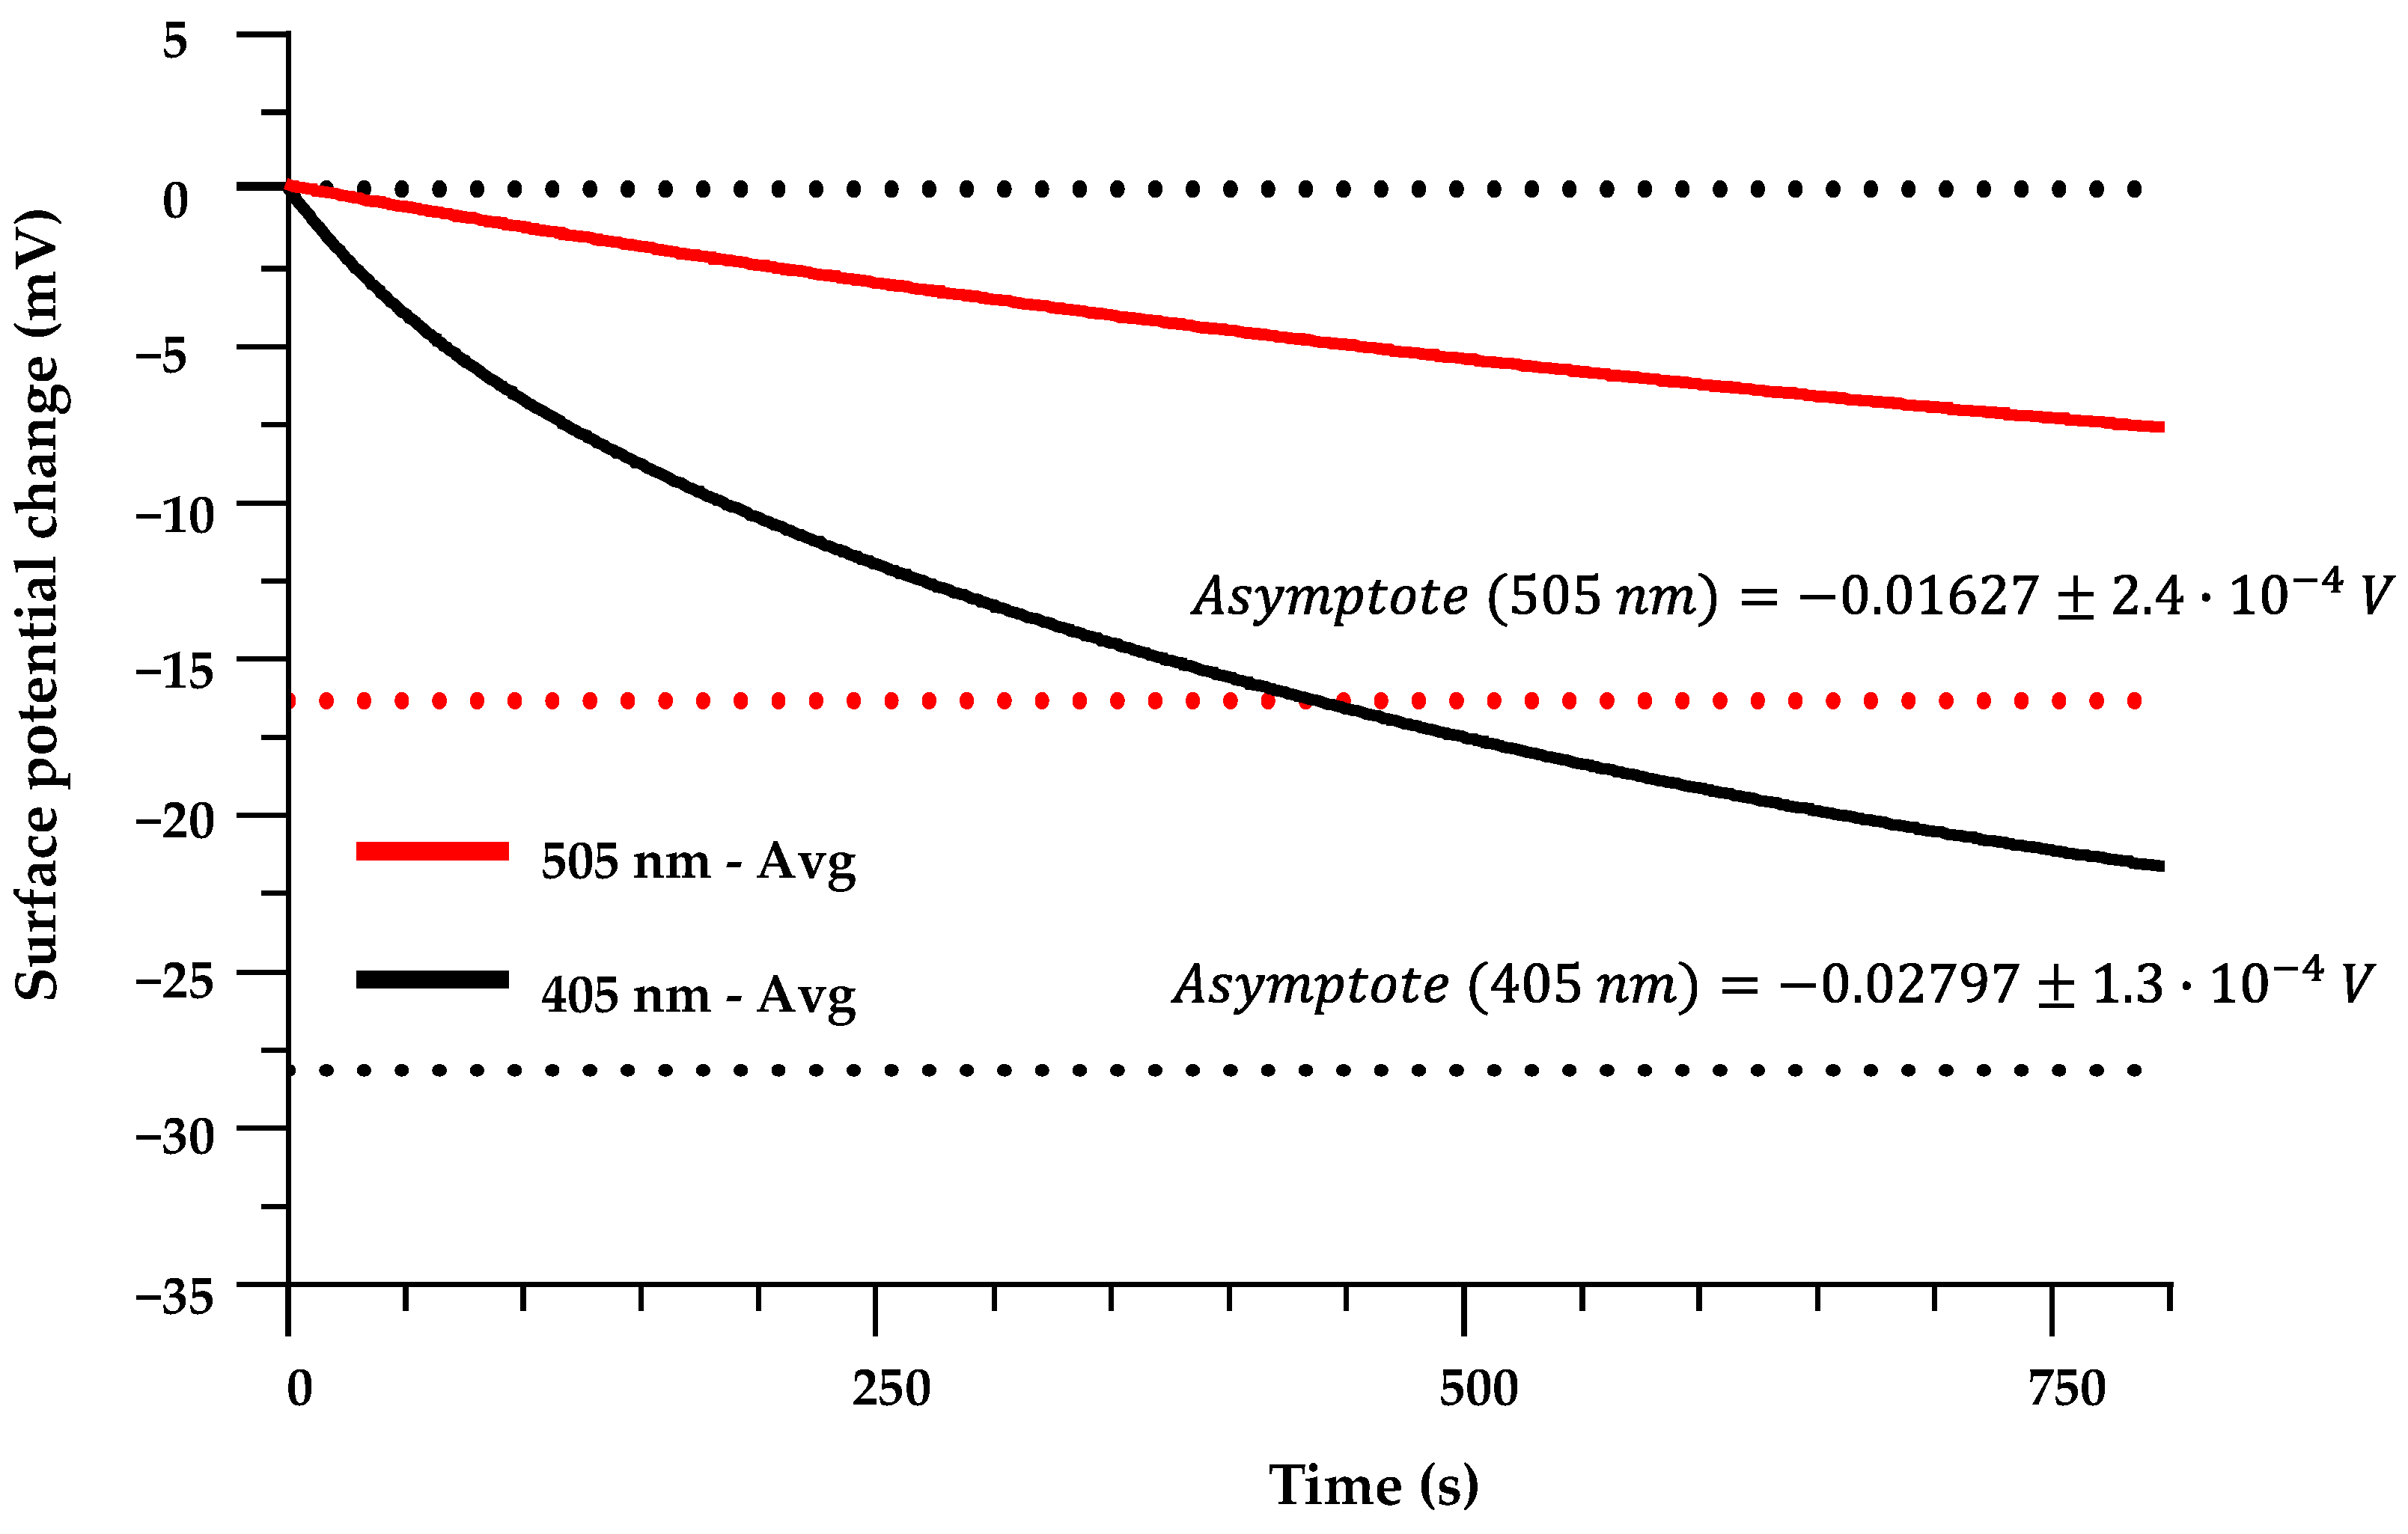
The resulting model equation for the curve approximating the charging process in the case of illumination with 405 nm light (see Figure 6) can be written as:
Figure 6.
Charging curve models for exposure to 505 nm and 405 nm light. Red dotted line is a representation of the asymptote for the 505 nm charging curve, lover black dotted line is a representation of the asymptote for the 405 nm charging curve.
For 505 nm excitation, attempts to fit a two-phase exponential model led to unstable parameter estimates and poor convergence. A one-phase exponential model provided a robust fit with R2 = 0.9934, the parameters for which can be seen in Table 1. When compared to the 405 nm charge curve, the 505 nm charging process is characterized by a smaller steady-state CPD change and a longer characteristic time constant, i.e., a slower approach to saturation.
The resulting model equation for the curve approximating the charging process in the case of illumination with 505 nm light (see Figure 6) can be written as:
For 685 nm, the averaged charging curve remained within the noise level and could not be meaningfully fitted with either one-phase or two-phase models. The 685 nm data are therefore treated as an upper bound on any possible light-induced CPD change at this wavelength rather than as a resolved kinetic response.
3.5. Kinetic Parameters from Exponential Fits: Discharging
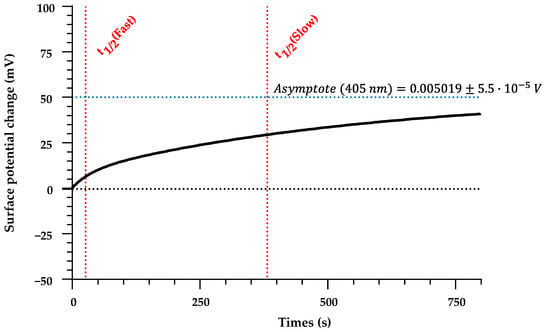
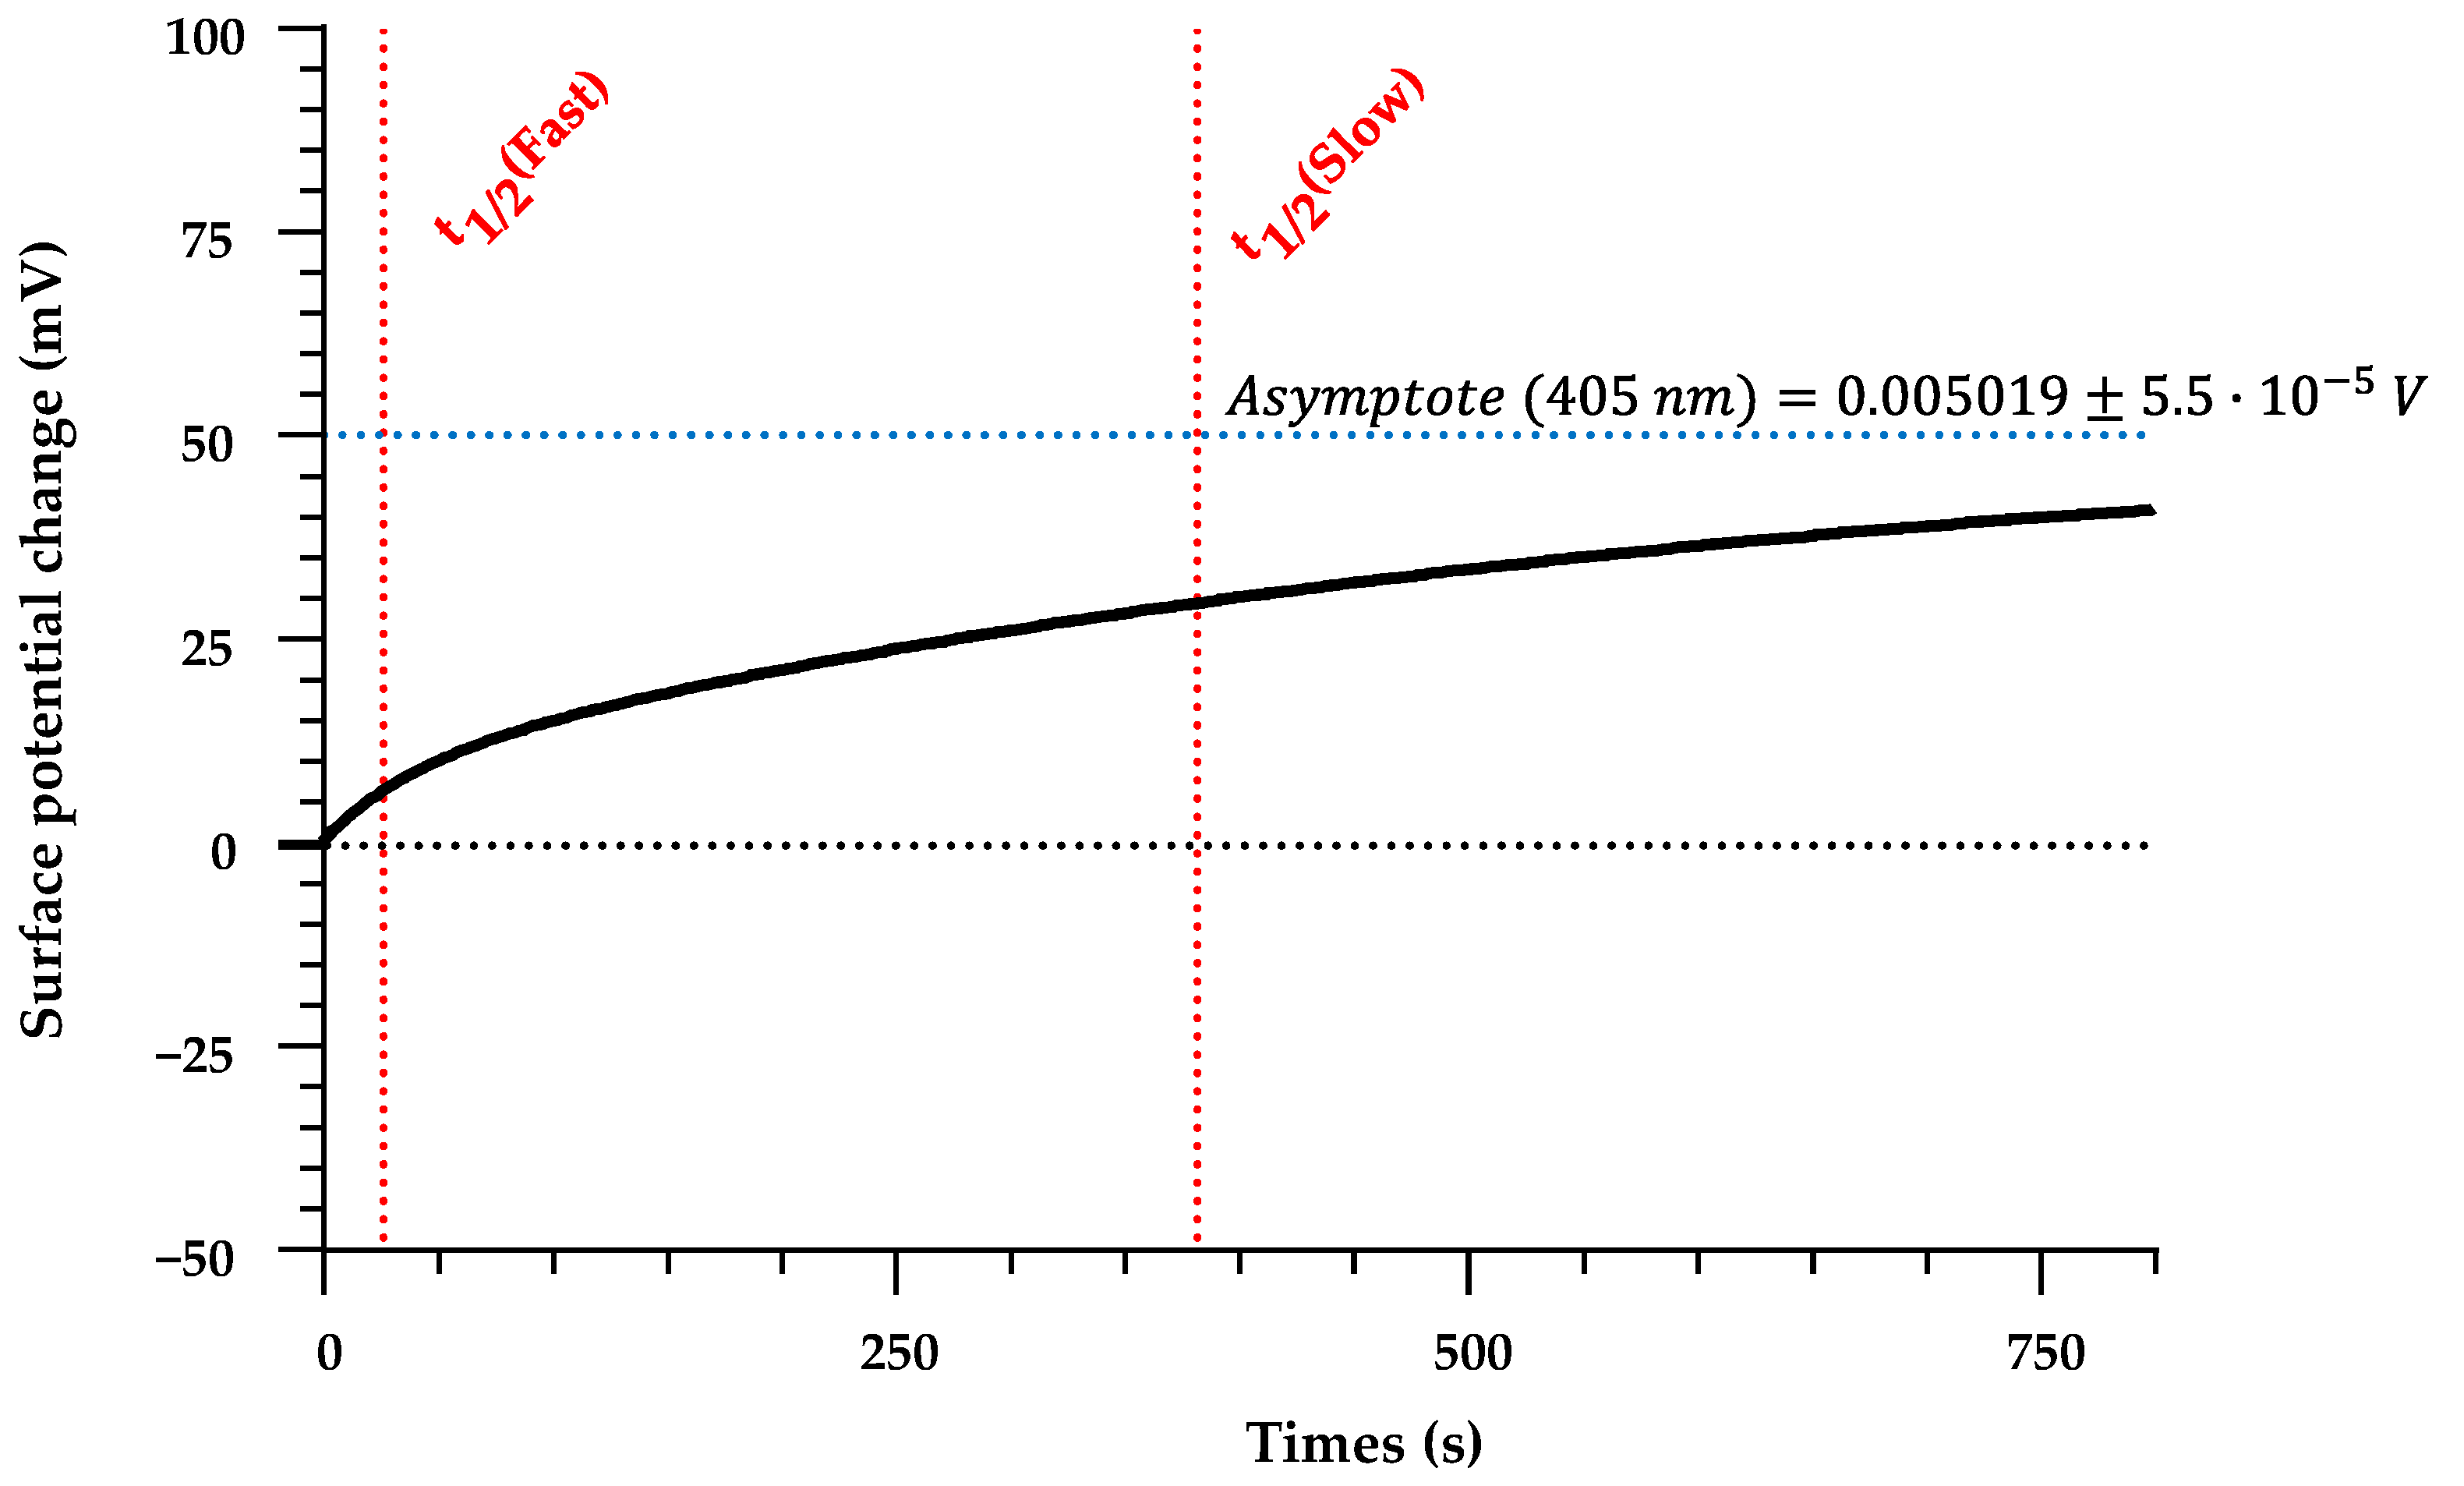
Quantitative analysis of the discharging kinetics was restricted to the 405 nm data, since the post-illumination signals at 505 nm and 685 nm were too weak for stable fitting. The averaged 405 nm discharging trace is well described by a two-phase exponential association model for a discharging curve given by Equation (4) and can be seen in Figure 7. The curve-fitting parameters for the 405 nm discharging curve can be seen in Table 1.
Figure 7.
Model of the 405 nm discharging curve. Blue horizontal line is a representation of the asymptote, red horizontal lines indicate the instants where t1/2 (fast) and t1/2 (slow) occur.
The combination of a much lower asymptote value compared to the charging amplitude and the presence of a slow tail indicates that a substantial fraction of the induced charge is released on time scales of tens to hundreds of seconds after the illumination is switched off, while a smaller fraction remains trapped in longer-lived states beyond the experimental window. For 505 nm, both one-phase and two-phase association fits to the discharging data yielded R2 < 0.2, consistent with the very small absolute signal being comparable to the instrument uncertainty; no reliable kinetic parameters were extracted in this case.
The resulting model equation for the discharging process in the case of illumination with 405 nm light can be written as:
3.6. Wavelength Dependence of Steady-State Surface-Potential Change
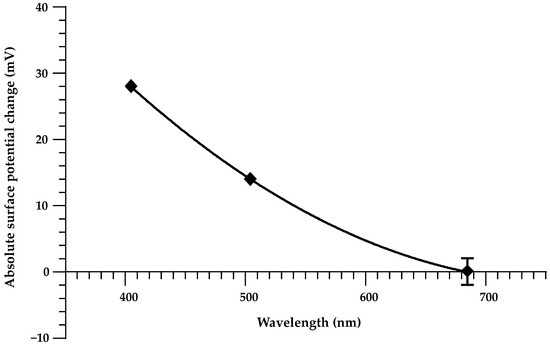
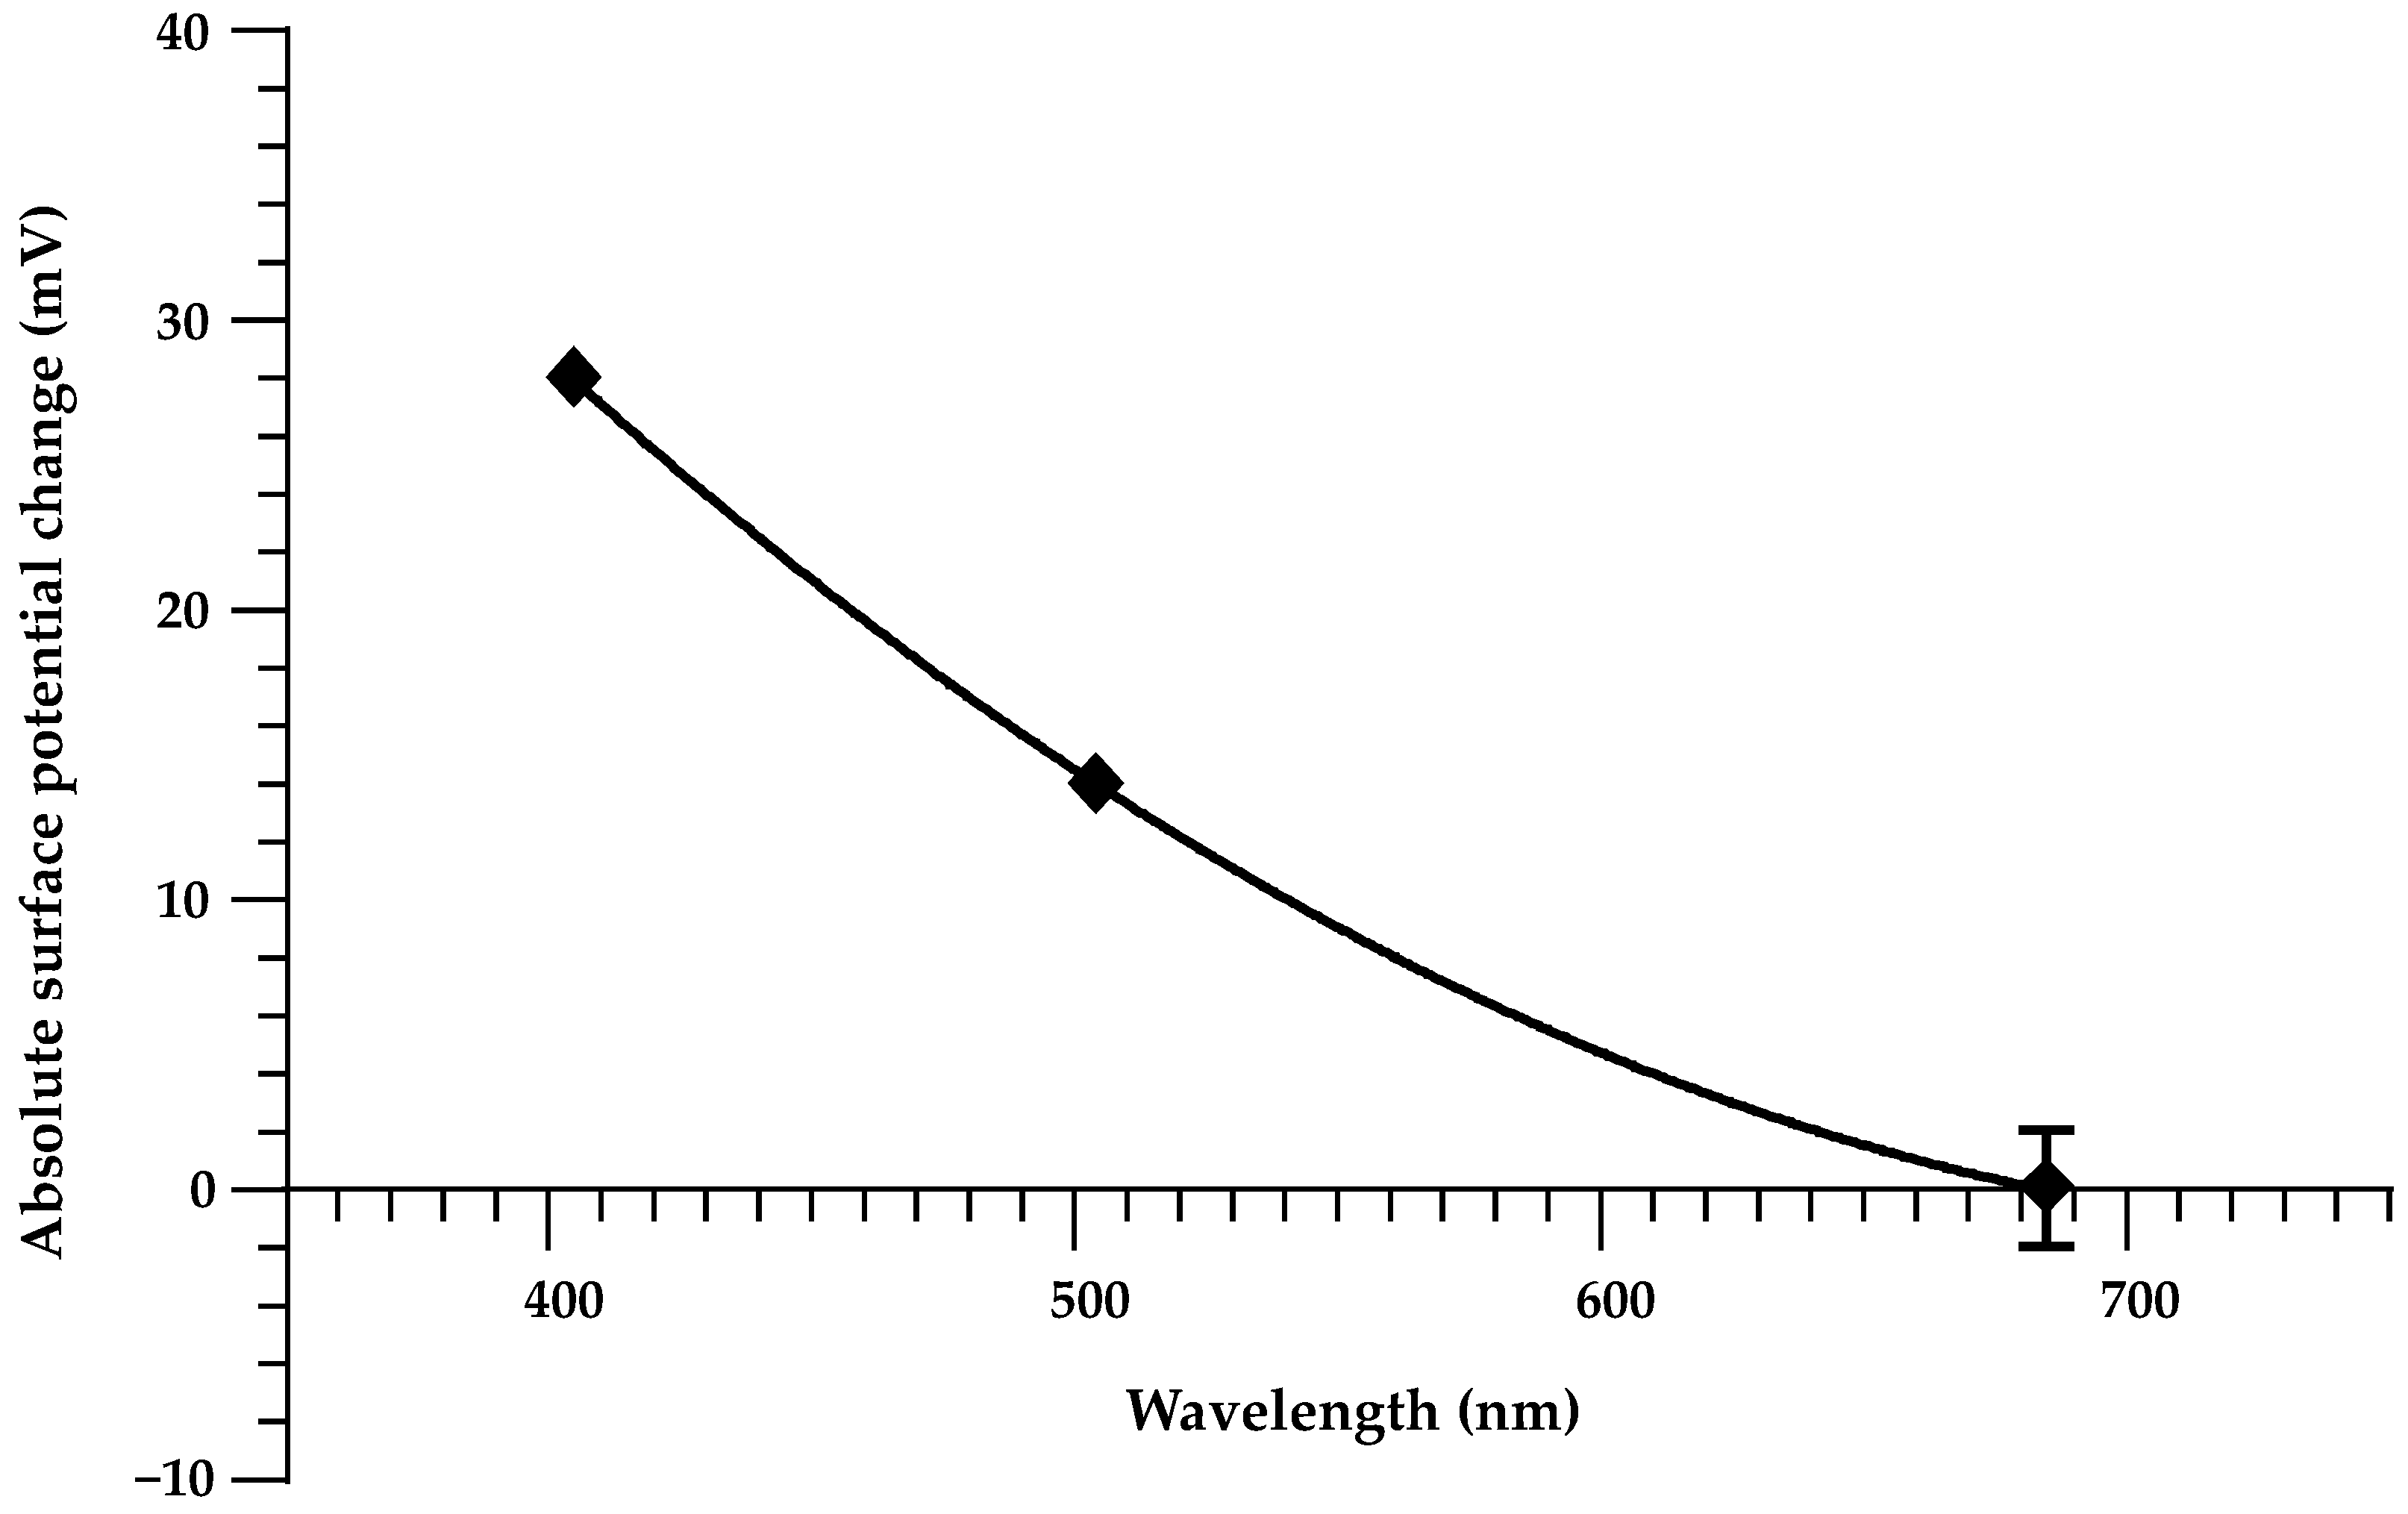
The absolute steady-state CPD changes extracted from the charging fits are summarized as a function of excitation wavelength in Figure 8. The plot shows the magnitude of the asymptote CPD shift |ΔCPD| for 405 nm and 505 nm, together with the absence of a resolvable response at 685 nm. The present data demonstrate a decrease in the achievable surface-potential modulation when going from 405 nm to 505 nm, and an effective vanishing of the response at 685 nm within the current sensitivity.
Figure 8.
Variation in the absolute surface potential changes with excitation wavelength.
4. Discussion
The experiments show that continuous visible illumination can induce repeatable and partially reversible changes in the local CPD of thermally grown a-SiO2 on p-type Si, with a clear wavelength dependence and distinct charging and discharging kinetics. At the probed locations, 405 nm excitation yields the largest steady-state CPD shift (asymptote ~−28 mV), 505 nm yields a smaller shift (~−16 mV), and no resolvable response is observed at 685 nm within a noise floor of ±2.5 mV. The laser intensities were equalized using the photodiode response, so the differences between 405 nm, 505 nm, and 685 nm do not arise from trivial variations in incident power. The wavelength ordering of the CPD response is most directly consistent with a photon-energy threshold for generating (and delivering) a sufficient population of charge carriers that can be trapped in, or near, the oxide/interface region. Under 405 nm illumination, the higher photon energy produces the largest CPD shift (asymptote ~−28 mV), while 505 nm yields a smaller but still measurable shift (~−16 mV). At 685 nm, no resolvable response is observed within the ±2.5 mV noise floor under the present intensity and geometry; thus, the 685 nm traces provide an upper bound on any light-induced CPD change at that wavelength rather than evidence of a strictly vanishing process. Differences in Si absorption depth and carrier-generation profiles across the visible spectrum could also influence the fraction of photocarriers that reach the Si/SiO2 interface (and therefore the trapping efficiency), but this contribution is not isolated in the present experiments. Establishing whether absorption-depth effects materially impact CPD modulation would require an additional experimental degree of freedom (e.g., varying Si thickness or illumination geometry, or otherwise controlling the carrier-generation depth profile).
The CPD kinetics indicate at least two characteristic time scales for charge evolution under 405 nm excitation. The charging curve requires a bi-exponential model, with a comparatively small fast component (τ1 (fast) on the order of tens of seconds) and a dominant slow component (τ2 (slow) on the order of several minutes). The discharging curve after 405 nm exposure shows a similar two-component structure, with fast and slow time constants again in the tens-of-seconds and several-hundred-seconds ranges. Importantly, over the accessible ~103 s discharging window the CPD relaxes only partially, from ~−28 mV to ~−23 mV relative to the dark baseline; a substantial fraction of the induced surface potential therefore remains after the main fast and intermediate components have decayed. The modest Pfast values (≈13.6% during 405 nm charging and ≈16.7% during 405 nm discharging) indicate that most of the net CPD change is governed by the slower kinetics on 102–103 s time scales, and the incomplete recovery to the initial CPD demonstrates that a significant fraction of the induced charge is retained on at least 103–104 s time scales. Determining whether this long-lived component ultimately decays further, or whether an additional, much slower process is present, requires measurements over substantially longer times.
It should be stressed that the bi-exponential form used here is a minimal phenomenological representation of at least two processes in the net CPD response. The “fast” and “slow” components should not be interpreted as single isolated microscopic processes; multiple mechanisms can contribute simultaneously to each apparent exponential term. For example, rapid filling/emptying of near-interface states and shallow border traps may contribute to an early-time response, while slower exchange with deeper oxide/border traps, transport-limited redistribution within the oxide, and hydration-assisted charge/dipole equilibration can contribute to late-time dynamics and retention. Accordingly, τ1 (fast) and τ2 (slow) are treated as effective time constants summarizing the observed CPD kinetics within the experimental conditions, rather than a one-to-one assignment to specific defect species.
When the CPD modulation amplitude is smaller and/or one kinetic regime dominates within the observation window, a single-exponential model can adequately describe the data while the second component becomes non-identifiable (e.g., its amplitude falls below noise, or its timescale lies outside the measured duration). In such cases, retaining a second exponential would risk overfitting without adding physically reliable information, so the simpler model is preferred. This was the case under 505 nm illumination: the charging trace is adequately described by a single slow exponential, and the post-illumination relaxation signal remains too close to the noise level to support a robust fit. This difference is consistent with 405 nm efficiently populating at least two kinetically separable contributions to the CPD transient, whereas under 505 nm the effective response is weaker and appears simpler within the accessible dynamic range. Given the limited number of wavelengths and probed locations, it is not possible to uniquely map each kinetic component to a specific microscopic defect type. However, the data show that time-resolved KPFM under controlled illumination can discriminate between qualitatively different kinetic and retention regimes even when the absolute CPD shifts are only a few tens of millivolts.
Another factor that may influence the magnitude of change in CPD value is the spatial heterogeneity of the sample studied. Thermally grown oxides can exhibit local variations in effective oxide thickness and defect density, and under ambient conditions local surface hydration can vary laterally. Because the time-resolved CPD traces were acquired in single-point AM-KPFM mode at one representative location per sample (with repeated illumination cycles averaged), such heterogeneity can influence both ΔCPD magnitude and the apparent kinetics. Regions with higher local trap density or stronger hydration are expected to show larger ΔCPD shifts and potentially faster apparent kinetics due to enhanced near-surface charge mobility, whereas drier or less defective regions may exhibit smaller shifts and longer retention. In microfluidic implementations, this issue becomes more acute because the functionalized surface is typically in direct contact with a liquid, and charge kinetics may differ from the present ambient measurements; the results should therefore be interpreted as local kinetic descriptors for a simplified case rather than spatially averaged device-level parameters.
In microfluidic contexts, the ΔCPD shifts observed here are modest compared with direct electrical biasing of MOS/capacitor-like structures, and whether they are functionally sufficient depends on the target mechanism and geometry. Photostimulation for charge-based functionalization of surfaces is therefore best viewed as a contactless tuning approach for cases where small-to-moderate surface-potential changes can still measurably influence interfacial phenomena (e.g., near-threshold electrostatic effects, adsorption/charge-state equilibria, or other surface-sensitive responses), rather than as a universal substitute for electrical gating. Once the required ΔCPD is within reach, optical delivery through a window or fiber becomes a practical advantage because it avoids electrodes and electrical feedthroughs in sealed or contamination-sensitive devices. The post-illumination relaxation indicates minute-to-hour retention under ambient humidity, consistent with “set-and-hold” adjustment over typical experimental timescales, while day-scale stability remains untested. Translating the effect into a device setting will require mapping ΔCPD amplitude and retention versus optical intensity, duty cycle, and humidity, and benchmarking those values against the potential shift required by the intended microfluidic function.
Finally, the dependence of the steady-state CPD on wavelength has been summarized using the asymptote values extracted from the exponential fits. With only two resolved amplitudes (405 and 505 nm) and an upper bound at 685 nm, any interpolation by simple functional forms remains descriptive rather than predictive. The curvature of such fits should therefore be interpreted as a convenient visualization of the measured points and the absence of a 685 nm response, not as a reliable law for extrapolating to other wavelengths or intensities. A more quantitative relationship between photon energy and achievable |ΔCPD| would require measurements at additional wavelengths, systematic variation in intensity, and independent characterization of the oxide defect spectrum on the specific samples used here.
5. Conclusions
Time-resolved AM-KPFM measurements on thermally grown a-SiO2/p-Si under controlled visible illumination show that low-power 405 nm and 505 nm light produce reproducible negative CPD shifts at the probed point, with steady-state asymptotes of approximately −28 mV and −16 mV, respectively, whereas 685 nm produces no resolvable change within the ±2.5 mV noise level.
The 405 nm charging and discharging curves require bi-exponential models, revealing fast (tens of seconds) and slow (several-hundred-seconds) kinetic components with the slow process dominating the net CPD change. After the light is switched off, the CPD relaxes only partially from ~−28 mV to ~−23 mV over the accessible ~103 s discharging window, indicating that a substantial fraction of the induced charge remains trapped on at least 103–104 s time scales. The 505 nm charging curve is well described by a single slow exponential, and its discharging signal is too weak for reliable kinetic analysis, indicating that the population of active states and their relaxation pathways differ between the two excitation energies.
The observed wavelength dependence and multi-component kinetics are consistent with a defect-mediated excitation and relaxation scenario, in which visible photons address oxide and interface states with different characteristic time scales for charge generation, transport, trapping, and retention. Within the resolution of the present experiment, the data demonstrate that such processes can be quantified using simple exponential parametrizations of KPFM CPD–time traces, including explicit characterization of partial charge retention on the order of 103–104 s.
Given the ambient measurement conditions, the single sample and location, and the limited set of wavelengths and intensities, the results are best viewed as a proof-of-concept for optical tuning of a-SiO2 surface potential rather than as definitive parameter values for device design. The methodology and kinetic descriptors established here provide a practical baseline for future, more systematic studies that aim to engineer visible-light-responsive oxide surfaces for microfluidic, bio-interface, and related applications.
Author Contributions
Conceptualization—Y.D. and H.S.; Methodology—H.S.; Validation—Y.D. and H.S.; Investigation—H.C.G.M. and H.S.; Data curation—H.C.G.M. and H.S.; Writing (original draft preparation)—H.C.G.M. and H.S.; Writing (review and editing)—H.S. and Y.D.; Visualization—H.C.G.M.; Supervision—Y.D. All authors have read and agreed to the published version of the manuscript.
Funding
The research was funded by the European Union Recovery and Resilience Facility project No. 5.2.1.1.i.0/2/24/I/CFLA/003. Manuscript is part of the project C4835.ZPD.PI.0090.P1 “Purification of ship ballast water from heavy metal ions to reduce pollution”.
Data Availability Statement
Data is contained within the article.
Acknowledgments
We extend our sincere gratitude to AS “ALFA RPAR” for providing the p-type Si wafers with the thermally grown SiO2 layer on the surface. During the preparation of this manuscript/study, the authors used ChatGPT-5.1 for the purposes of text editing and grammar correction. The authors have reviewed and edited the output and take full responsibility for the content of this publication.
Conflicts of Interest
The authors declare no conflicts of interest.
Abbreviations
The following abbreviations are used in this manuscript:
| AFM | atomic force microscopy |
| AM-KPFM | amplitude modulated Kelvin probe force microscopy |
| a-SiO2 | amorphous silicon dioxide |
| bio-MEMS | biomedical microelectromechanical systems. |
| CPD | contact potential difference |
| HVAC | heating, ventilation and air-conditioning |
| KPFM | Kelvin probe force microscopy |
| MOS | metal–oxide–semiconductor |
| NBOHC | non-bridging oxygen hole centers |
| ND | neutral density |
| ODC | oxygen-deficiency-related centers |
| PDMS | polydimethylsiloxane |
| POR | peroxy radicals |
| RH | relative humidity |
| SPV | surface photovoltage |
Appendix A
Table A1.
The 95% confidence bounds of extracted curve fitting parameters for 405 nm/505 nm charging and 405 nm discharging curves.
References
- Chircov, C.; Grumezescu, A.M. Microelectromechanical systems (MEMS) for biomedical applications. Micromachines 2022, 13, 164. [Google Scholar] [CrossRef] [Scilit] [PubMed]
- Nielsen, J.B.; Hanson, R.L.; Almughamsi, H.M.; Pang, C.; Fish, T.R.; Woolley, A.T. Microfluidics: Innovations in materials and their fabrication and functionalization. Anal. Chem. 2019, 92, 150–168. [Google Scholar] [CrossRef] [Scilit] [PubMed]
- Aralekallu, S.; Boddula, R.; Singh, V.P. Development of glass-based microfluidic devices: A review on its fabrication and biologic applications. Mater. Des. 2022, 225, 111517. [Google Scholar] [CrossRef] [Scilit]
- Al-Harbi, N.; Mohammed, H.; Al-Hadeethi, Y.; Bakry, A.S.; Umar, A.; Hussein, M.A.; Abbassy, M.A.; Vaidya, K.G.; Al Berakdar, G.; Mkawi, E.M.; et al. Silica-based bioactive glasses and their applications in hard tissue regeneration: A Review. Pharmaceuticals 2021, 14, 75. [Google Scholar] [CrossRef] [Scilit]
- Le Tiec, Y. Chemistry in Microelectronics; John Wiley & Sons Inc: Hoboken, NJ, USA, 2013. [Google Scholar]
- Shakeri, A.; Jarad, N.A.; Leung, A.; Soleymani, L.; Didar, T.F. Biofunctionalization of glass- and paper-based microfluidic devices: A Review. Adv. Mater. Interfaces 2019, 6, 1900940. [Google Scholar] [CrossRef] [Scilit]
- Wenzel, R.N. Resistance of solid surfaces to wetting by water. Ind. Eng. Chem. 1936, 28, 988–994. [Google Scholar] [CrossRef] [Scilit]
- Cassie, A.B.D.; Baxter, S. Wettability of porous surfaces. Trans. Faraday Soc. 1944, 40, 546–551. [Google Scholar] [CrossRef] [Scilit]
- Latthe, S.S.; Terashima, C.; Nakata, K.; Fujishima, A. Superhydrophobic surfaces developed by mimicking hierarchical surface morphology of lotus leaf. Molecules 2014, 19, 4256–4283. [Google Scholar] [CrossRef] [Scilit]
- Baltacis, K.; Bystrov, V.; Bystrova, A.; Dekhtyar, Y.; Freivalds, T.; Raines, J.; Rozenberga, K.; Sorokins, H.; Zeidaks, M. Physical fundamentals of biomaterials surface electrical functionalization. Materials 2020, 13, 4575. [Google Scholar] [CrossRef] [Scilit]
- Alizadeh, A.; Hsu, W.-L.; Wang, M.; Daiguji, H. Electroosmotic flow: From microfluidics to nanofluidics. Electrophoresis 2020, 42, 834–868. [Google Scholar] [CrossRef] [Scilit]
- Delgado, Á.V.; González-Caballero, F.; Hunter, R.J.; Koopal, L.K.; Lyklema, J. Measurement and interpretation of electrokinetic phenomena (IUPAC technical report). Pure Appl. Chem. 2005, 77, 1753–1805. [Google Scholar] [CrossRef] [Scilit]
- Trefalt, G.; Behrens, S.H.; Borkovec, M. Charge regulation in the electrical double layer: Ion adsorption and surface interactions. Langmuir 2016, 32, 380–400. [Google Scholar] [CrossRef] [Scilit] [PubMed]
- Rabe, M.; Verdes, D.; Seeger, S. Understanding protein adsorption phenomena at solid surfaces. Adv. Colloid Interface Sci. 2011, 162, 87–106. [Google Scholar] [CrossRef] [Scilit] [PubMed]
- Sulpizi, M.; Gaigeot, M.P.; Sprik, M. The silica–water interface: How the silanols determine the surface acidity and modulate the water properties. J. Chem. Theory Comput. 2012, 8, 1037–1047. [Google Scholar] [CrossRef] [Scilit]
- Huang, J.; Xia, L.; Xiao, X.; Li, G. Advances in microchip electrophoresis for the separation and analysis of biological samples. Chin. J. Chromatogr. 2023, 41, 641–650. [Google Scholar] [CrossRef] [Scilit]
- Stroock, A.D.; Whitesides, G.M. Controlling flows in microchannels with patterned surface charge and topography. Acc. Chem. Res. 2003, 36, 597–604. [Google Scholar] [CrossRef] [Scilit]
- Metwally, S.; Stachewicz, U. Surface potential and charges impact on cell responses on biomaterials interfaces for medical applications. Mater. Sci. Eng. C 2019, 104, 109883. [Google Scholar] [CrossRef] [Scilit]
- Chebodaeva, V.V.; Barynin, A.V.; Kozlova, S.G.; Kudryashova, A.E.; Kudryashov, S.V. Surface electric properties and their role in the bioactivity of implant materials: A comprehensive review. Crystals 2025, 15, 583. [Google Scholar] [CrossRef] [Scilit]
- Hermansson, M. The DLVO theory in microbial adhesion. Colloids Surf. B Biointerfaces 1999, 14, 105–119. [Google Scholar] [CrossRef] [Scilit]
- Hu, N.; Ai, Y.; Qian, S. Field effect control of electrokinetic transport in Micro/nanofluidics. Sens. Actuators B Chem. 2012, 161, 1150–1167. [Google Scholar] [CrossRef] [Scilit]
- Liu, H.; Pang, K.; Yobas, L.; Wang, K. Dielectric materials for electrowetting-on-dielectric actuation. Microsyst. Technol. 2009, 16, 449–460. [Google Scholar] [CrossRef] [Scilit]
- Werner, P. Dielectric breakdown I: A review of oxide breakdown. Microelectron. J. 1996, 27, 611–622. [Google Scholar] [CrossRef] [Scilit]
- Strand, J.; Kaviani, M.; Gao, D.; El-Sayed, A.-M.; Afanas’ev, V.V.; Shluger, A.L. Intrinsic charge trapping in amorphous oxide films: Status and challenges. J. Phys. Condens. Matter 2018, 30, 233001. [Google Scholar] [CrossRef] [Scilit] [PubMed]
- Fleetwood, D.M.; Pantelides, S.T.; Schrimpf, R.D. Oxide Traps, Border Traps, and Interface Traps in SiO2. In Defects in Microelectronic Materials and Devices, 1st ed.; CRC Press: Boca Raton, FL, USA, 2008; pp. 215–248. [Google Scholar]
- Astašauskas, V.; Bellissimo, A.; Kuksa, P.; Tomastik, C.; Kalbe, H.; Werner, W.S.M. Optical and electronic properties of amorphous silicon dioxide by single and Double Electron Spectroscopy. J. Electron Spectrosc. Relat. Phenom. 2020, 241, 146829. [Google Scholar] [CrossRef] [Scilit]
- Skuja, L. Optically active oxygen-deficiency-related centres in amorphous silicon dioxide. J. Non-Cryst. Solids 1998, 239, 16–48. [Google Scholar] [CrossRef] [Scilit]
- Gunther, P. Mechanism of charge storage in electron beam or corona charged silicon dioxide electrets. IEEE Trans. Electr. Insul. 1991, 26, 42–48. [Google Scholar] [CrossRef] [Scilit]
- Molinié, P. How fast does a static charge decay? an updated review on a classical problem. J. Electrost. 2024, 129, 103930. [Google Scholar] [CrossRef] [Scilit]
- Vaccaro, L.; Cannas, M.; Boizot, B.; Parlato, A. Radiation induced generation of non-bridging oxygen hole center in silica: Intrinsic and extrinsic processes. J. Non-Cryst. Solids 2007, 353, 586–589. [Google Scholar] [CrossRef] [Scilit]
- Kajihara, K.; Skuja, L.; Hirano, M.; Hosono, H. Formation and decay of nonbridging oxygen hole centers in SIO2 glasses induced by F2 laser irradiation: In situ observation using a pump and probe technique. Appl. Phys. Lett. 2001, 79, 1757–1759. [Google Scholar] [CrossRef] [Scilit]
- Olthuis, W.; Bergveld, P. On the charge storage and decay mechanism in silicon dioxide electrets. IEEE Trans. Electr. Insul. 1992, 27, 691–697. [Google Scholar] [CrossRef] [Scilit]
- Bussmann, E.; Williams, C.C. Single-electron tunneling force spectroscopy of an individual electronic state in a nonconducting surface. Appl. Phys. Lett. 2006, 88, 263108. [Google Scholar] [CrossRef] [Scilit]
- Umezawa, R.; Katsura, M.; Nakashima, S. Electrical conductivity at surfaces of silica nanoparticles with adsorbed water at various relative humidities. E-J. Surf. Sci. Nanotechnol. 2018, 16, 376–381. [Google Scholar] [CrossRef] [Scilit]
- Thoan, N.H.; Keunen, K.; Afanas’ev, V.V.; Stesmans, A. Interface State Energy Distribution and PB defects at si(110)/sio2 interfaces: Comparison to (111) and (100) silicon orientations. J. Appl. Phys. 2011, 109, 013710. [Google Scholar] [CrossRef] [Scilit]
- Robertson, J. High dielectric constant oxides. Eur. Phys. J. Appl. Phys. 2004, 28, 265–291. [Google Scholar] [CrossRef] [Scilit]
- Poindexter, E.H.; Gerardi, G.J.; Rueckel, M.-E.; Caplan, P.J.; Johnson, N.M.; Biegelsen, D.K. Electronic traps and Pb centers at the Si/SiO2 interface: Band-Gap Energy Distribution. J. Appl. Phys. 1984, 56, 2844–2849. [Google Scholar] [CrossRef] [Scilit]
- Grasser, T. Stochastic charge trapping in oxides: From random telegraph noise to bias temperature instabilities. Microelectron. Reliab. 2012, 52, 39–70. [Google Scholar] [CrossRef] [Scilit]
- Grasser, T.; Kaczer, B.; Goes, W.; Reisinger, H.; Aichinger, T.; Hehenberger, P.; Wagner, P.-J.; Schanovsky, F.; Franco, J.; Toledano Luque, M.; et al. The paradigm shift in understanding the bias temperature instability: From reaction–diffusion to switching oxide traps. IEEE Trans. Electron Devices 2011, 58, 3652–3666. [Google Scholar] [CrossRef] [Scilit]
- Illera, S.; Prades, J.D.; Cirera, A. Elastic tunneling charge transport mechanisms in silicon quantum dots /sio2 thin films and superlattices. J. Appl. Phys. 2015, 117, 174307. [Google Scholar] [CrossRef] [Scilit]
- Apicella, V.; Fasasi, T.A.; Wong, H.F.; Leung, D.C.W.; Ruotolo, A. Extending the near-infrared band-edge absorption spectrum of silicon by proximity to a 2D semiconductor. Appl. Surf. Sci. 2021, 538, 147803. [Google Scholar] [CrossRef] [Scilit]
- Kronik, L. Surface photovoltage phenomena: Theory, experiment, and applications. Surf. Sci. Rep. 1999, 37, 1–206. [Google Scholar] [CrossRef] [Scilit]
- Zaghloul, U.; Bhushan, B.; Coccetti, F.; Pons, P.; Plana, R. Kelvin probe force microscopy-based characterization techniques applied for electrostatic MEMS/NEMS devices and bare dielectric films to investigate the dielectric and substrate charging phenomena. J. Vac. Sci. Technol. A 2011, 29, 051101. [Google Scholar] [CrossRef] [Scilit]
- Checa, M.; Fuhr, A.S.; Sun, C.; Vasudevan, R.; Ziatdinov, M.; Ivanov, I.; Yun, S.J.; Xiao, K.; Sehirlioglu, A.; Kim, Y.; et al. High-speed mapping of surface charge dynamics using sparse scanning KELVIN PROBE FORCE MICROSCOPY. Nat. Commun. 2023, 14, 7196. [Google Scholar] [CrossRef] [Scilit]
- Wang, J.; Zhang, H.; Cao, G.; Xie, L.; Huang, W. Injection and retention characterization of trapped charges in Electret films by electrostatic force microscopy and Kelvin Probe Force Microscopy. Phys. Status Solidi (A) 2020, 217, 2000190. [Google Scholar] [CrossRef] [Scilit]
- Schroder, D.K. Surface voltage and surface photovoltage: History, theory and applications. Meas. Sci. Technol. 2001, 12, 16–31. [Google Scholar] [CrossRef] [Scilit]

Disclaimer/Publisher’s Note: The statements, opinions and data contained in all publications are solely those of the individual author(s) and contributor(s) and not of MDPI and/or the editor(s). MDPI and/or the editor(s) disclaim responsibility for any injury to people or property resulting from any ideas, methods, instructions or products referred to in the content. |
© 2026 by the authors. Licensee MDPI, Basel, Switzerland. This article is an open access article distributed under the terms and conditions of the Creative Commons Attribution (CC BY) license.