


Abstract
Motivation: Accurate spectral reconstruction of printed halftone images is essential for achieving high-fidelity color reproduction and robust color management across modern printing systems. However, traditional physics-based models, such as the Yule–Nielsen and Clapper–Yule formulations, rely on simplified empirical assumptions and often fail to capture the complex nonlinear and asymmetric interactions induced by multi-ink overlays and substrate light scattering. Meanwhile, existing data-driven approaches based on single learning models exhibit limited capability in modeling the complementary and symmetrical characteristics inherent in halftone structures, resulting in suboptimal prediction accuracy and generalization performance. Method: To address these limitations, we propose a Stacking Ensemble Spectral Prediction (SESP) framework. The proposed method adopts a two-layer stacking architecture that integrates heterogeneous base regressors, including Support Vector Regression (SVR), Random Forest (RF), and eXtreme Gradient Boosting (XGBoost 3.0.3), with Ridge Regression employed as the meta-learner for optimal prediction aggregation. This ensemble design enables effective modeling of both halftone pattern symmetry and complex substrate scattering behavior. Results: Extensive experiments conducted on printed halftone image datasets demonstrate the superior performance of the proposed SESP framework. Compared with the best-performing reference method (PCA-IPSO-DNN), SESP achieves relative reductions in RMSE and CIEDE2000 of 12.8% and 6.8% under illuminant A, 9.5% and 6.9% under D50, and 12.2% and 7.2% under D65, respectively. In addition, SESP consistently outperforms traditional physics-based models, including Yule–Nielsen and Clapper–Yule, in terms of both spectral prediction accuracy and colorimetric fidelity. These results confirm the effectiveness of the proposed framework in modeling the intricate nonlinear and asymmetric relationships between CMYK halftone patterns and spectral reflectance.
1. Introduction
The CMYK color model, grounded in the principle of subtractive color mixing, remains a foundational pillar of the modern printing industry, enabling the reproduction of a wide gamut of colors. By adjusting the relative concentrations of Cyan (C), Magenta (M), Yellow (Y), and Black (K) inks, this model achieves diverse visual effects through the selective absorption and reflection of incident light across various wavelengths [1]. Despite its widespread use, ensuring consistent and accurate color reproduction remains a significant technical challenge, primarily due to the complex interplay among substrate properties (e.g., paper, plastic), ink composition, and specific printing methodologies [2].
In halftone printing, the spectral reflectance of printed images is primarily determined by the ink-covered regions, where incident light undergoes significant attenuation. However, internal light scattering within substrates, such as paper, introduces optical dot gain, leading to nonlinear relationships between ink coverage and measured reflectance [3]. Additionally, halftoning techniques, such as mutually rotated clustered dots and error diffusion, define the spatial distribution of ink, further influencing the perceived color. The symmetrical structure of halftone patterns, along with the inherent symmetry in light scattering within multilayer ink–substrate systems, typically allows for predictable tone reproduction under controlled illumination conditions [4,5]. Nevertheless, external factors, particularly changes in lighting, can disrupt these symmetries, resulting in perceptual inconsistencies that complicate practical color management.
To address these challenges, spectral prediction models have become increasingly critical for achieving high-fidelity color reproduction [6]. Spectrum-based color management employs reflectance measurements across the visible spectrum (400–700 nm), providing a physically interpretable and perceptually uniform color representation. Unlike conventional colorimetric methods, which are susceptible to variations in illumination and observer differences, spectral approaches estimate reflectance spectra directly, offering a stable and invariant descriptor of color. This enables enhanced precision in modeling hue, saturation, and brightness, making spectral prediction models essential for high-performance color management workflows [7].
The primary objective of spectral reflectance prediction is to estimate the spectral characteristics of halftone colors based on controllable parameters, such as dot area coverage, thereby enabling accurate ink allocation and optimized visual quality. Over the past decades, a variety of physics-based models, including the Neugebauer equation [8,9,10], Yule–Nielsen model [11,12,13], Kubelka–Munk theory [14,15,16], Clapper–Yule model [17,18], and Williams–Clapper model [19,20], have established the theoretical foundation for understanding light scattering, ink overlap, and halftone interactions. However, these models often require extensive empirical calibration and struggle to capture the nonlinear and asymmetric effects arising from multi-ink overlays and substrate scattering in practical printing scenarios [21].
To overcome these limitations, recent research has increasingly turned to data-driven approaches, leveraging machine learning and deep neural networks to improve predictive accuracy and model adaptability. For instance, Liu et al. applied artificial neural networks (ANNs) for spectral reflectance prediction [22]; Lu et al. incorporated particle swarm optimization (PSO) into neural networks [23]. Additionally, Tian et al. introduced a PCA-IPSO-DNN model combining Neugebauer primaries with an optimized deep neural network [24]. While these methods enhance predictive performance, they typically treat spectral reconstruction as a purely statistical regression task, largely ignoring the optical symmetries, complementary ink interactions, and structural coupling mechanisms that govern halftone reflectance. Consequently, single-model learners often exhibit limited generalizability and lack physical interpretability across diverse printing conditions.
To bridge the gap between physically grounded modeling and data-driven learning, we propose a novel Stacking Ensemble Spectral Prediction (SESP) framework that unifies ensemble learning with optical theory. Specifically, SESP employs a two-layer stacking architecture integrating Support Vector Regression (SVR), Random Forest (RF), and eXtreme Gradient Boosting (XGBoost) as base learners, with Ridge Regression serving as a meta-learner to optimally combine their predictions. Importantly, this architecture is not an arbitrary ensemble but a physics-informed formulation that mirrors the optical decomposition-recombination mechanism underlying halftone reflectance formation. By leveraging the complementary strengths of heterogeneous learners, SESP achieves superior accuracy and robustness while preserving the intrinsic symmetries and nonlinearities of halftone imaging. This physics-aligned stacking transforms conventional ensemble learning into an optically consistent, symmetry-aware predictive model, effectively bridging statistical learning and domain-specific physical constraints. To the best of our knowledge, this work represents one of the first stacking-based spectral reconstruction strategies explicitly guided by halftone optical principles.
The main contributions of this study are summarized as follows:
- We propose a stacking-based spectral prediction framework (SESP) explicitly aligned with the optical decomposition-recombination mechanism of halftone reflectance. By embedding optical symmetries and complementary CMYK ink interactions into the model design, SESP transforms stacking from a purely empirical ensemble into a physically consistent modeling paradigm, enhancing interpretability and robustness.
- We select three complementary base learners (SVR, RF, and XGBoost) to capture distinct physical and statistical aspects of halftone imaging. At the meta-level, Ridge Regression performs an L2-regularized linear combination of base outputs, analogous to the additive-multiplicative optical superposition in classical halftone models (e.g., Yule–Nielsen and Clapper–Yule). This structured stacking architecture allows SESP to jointly model the global symmetries of halftone patterns and local irregularities caused by substrate scattering and dot interactions.
- We evaluate SESP on IT8.7/5 (TC1617x) printer test charts and demonstrate that it consistently outperforms both traditional physics-based models and single-regressor approaches. SESP achieves substantially lower prediction errors (RMSEs) and perceptual color differences () under varying illumination conditions, confirming that the physics-informed ensemble approach significantly improves predictive robustness and generalizability in practical printing workflows.
2. Spectral Prediction for Printed Halftone Images
The color appearance of halftone images results from complex optical interactions among inks, substrate materials, and the illumination conditions. Accurate prediction of spectral reflectance is crucial for device-independent color reproduction, consistent tone rendering, and effective color management across substrates and viewing environments. In halftone printing, the principal controllable variable is the dot area ratio of the CMYK channels, with the halftone dot serving as the fundamental optical unit influencing perceived color.
Although real-world prints are subject to mechanical dot gain (ink spreading) and optical dot gain (substrate scattering), the theoretical dot area ratio remains a practical, device-independent descriptor for modeling spectral behavior. However, these gain effects introduce nonlinearities, making accurate reflectance prediction under real-world conditions a challenging task.
Definition 1.
Spectral Prediction Model.
A spectral prediction model defines a nonlinear mapping between controllable printing parameters and the measured spectral reflectance. Specifically, let represent the input vector comprising CMYK dot area ratios, optionally augmented with substrate descriptors such as basis weight or surface finish. Let denote the corresponding reflectance values sampled at m discrete wavelengths (typically 400–700 nm at 10 nm intervals). Given a training set , the objective of spectral prediction is to learn a function that generalizes to unseen CMYK combinations while preserving fidelity in both spectral and perceptual domains. Accurate spectral estimates enable the derivation of tristimulus values and chromaticity coordinates under various standard illuminants (e.g., D50, D65), ensuring consistent color appearance throughout production workflows.
Existing spectral prediction methods can be broadly classified into two categories: physics-based models and data-driven approaches. Physics-based models draw from optical theory and empirical mixture laws, aiming to characterize phenomena such as light absorption, scattering, and ink-overlap effects using first-principles analysis or semi-empirical formulations. Conversely, data-driven methods bypass explicit physical modeling and directly learn the nonlinear mapping from printing parameters to spectral reflectance from measured data. While data-driven approaches offer greater flexibility for capturing complex optical behaviors, they require large, representative datasets for effective generalization.
2.1. Physics-Based Models
Physics-based models provide interpretable descriptions of the optical processes underlying spectral behavior. They are generally data-efficient and useful for understanding fundamental mechanisms. However, their accuracy is often constrained by simplifying assumptions, such as homogeneous material properties and linear relationships, which fail to capture the nonlinear and asymmetric effects arising from multi-ink overlays, substrate heterogeneity, and multiple scattering.
2.1.1. Murray–Davies Model
The Murray–Davies model is one of the earliest approaches to spectral prediction [25]. It calculates the reflectance spectrum of a printed patch as a linear combination of the unprinted substrate reflectance and the solid-ink reflectance, weighted by the fractional dot area coverage:
where represents the predicted reflectance at wavelength , denotes the ink dot area coverage (), is the reflectance of the solid-ink patch, and is the reflectance of the unprinted substrate.
While conceptually simple and computationally efficient, the Murray–Davies model neglects phenomena such as substrate scattering, ink translucency, and multi-ink optical interactions. As a result, it produces significant errors, particularly in regions where subsurface scattering dominates or where multi-ink overlays are present.
2.1.2. Neugebauer Equation and Yule–Nielsen Model
The Neugebauer equation [8,9,10] extends the Murray–Davies model by treating the patch reflectance as a weighted sum of Neugebauer primaries (i.e., the single-ink reflectances and their overprints):
where denotes the dot area fraction of the j-th primary and represents the reflectance of that primary.
Although the Neugebauer equation accounts for overprints inks, it neglects critical optical effects such as ink spreading, substrate scattering, and multiple internal reflections. The Yule–Nielsen model [11,12,13] introduces a correction factor n, known as the scattering exponent, to address optical dot gain:
This modification significantly improves prediction accuracy in halftone printing but requires calibration for each specific printing condition, limiting its generality.
2.1.3. Kubelka–Munk Theory
The Kubelka–Munk (K-M) theory [14,15,16] models light propagation in diffusely reflecting materials using wavelength-dependent absorption () and scattering () coefficients:
where is the relative reflectance function, and is the reflectance of an optically infinite layer.
While the K-M model has been widely applied to homogeneous materials such as paint and paper, the assumption of uniform material properties limits its applicability to halftone structures, which consist of discrete ink layers on a substrate. Extensions, such as Saunderson’s gloss correction and multilayer adaptations, improve its performance but still cannot fully characterize the intricate scattering and absorption behaviors of halftone structures.
2.1.4. Clapper–Yule and Williams–Clapper Models
The Clapper–Yule model [17,18] extends the K-M framework by incorporating both short-range and long-range light interactions between ink layers and the substrate. This enhancement accounts for internal reflections, ink translucency, and substrate scattering effects, thereby improving the modeling of complex optical phenomena in halftone images. The Williams–Clapper model [19,20] further refines the treatment of interlayer optical interactions, providing enhanced accuracy for multi-layer systems by considering additional scattering and absorption mechanisms.
Despite their improved realism, these models are computationally intensive and require extensive parameter calibration for specific printing systems, limiting their applicability in high-throughput production workflows.
2.1.5. Empirical Refinements
Hybrid physics-empirical approaches have been developed to bridge the gap between theoretical rigor and practical accuracy. For instance, the CYNSN model partitions the color space into localized regions, optimizing parameters within each region, which improves prediction accuracy [26,27]. However, these refinements increase computational complexity and require substantial calibration efforts, reflecting a trade-off between predictive accuracy and computational efficiency.
In summary, physics-based models remain valuable for their theoretical interpretability and modest data requirements. Nevertheless, their reliance on restrictive assumptions and extensive calibration limits adaptability to modern printing demands.
2.2. Data-Driven Models
Data-driven models employ statistical and machine learning techniques to approximate the nonlinear mapping from CMYK inputs to spectral reflectance. Unlike physics-based models, they learn directly from measured data, allowing adaptation to variations in inks, substrates, and printing systems through retraining rather than reformulation. However, their performance depends critically on the diversity and representativeness of the training set and their “black-box” nature limits interpretability and systematic error diagnosis.
2.2.1. Lookup-Table Interpolation
Lookup-table (LUT) interpolation represents one of the earliest data-driven approaches for spectral prediction [28]. These methods approximate spectral reflectance by interpolating pre-measured spectra from a finite set of CMYK combinations and their corresponding reflectances . Common interpolation techniques, such as trilinear, tetrahedral, and radial basis function interpolation, are used to estimate reflectance values for unsampled points in the color space.
LUT methods are computationally efficient and locally accurate when the color space is densely sampled. However, achieving high accuracy across a broad gamut requires prohibitively dense measurements, whereas sparse sampling risks severe interpolation artifacts in unmeasured regions [29]. Consequently, LUT interpolation is best suited for controlled environments where the color space can be exhaustively sampled.
2.2.2. Machine Learning Models
With advances in computational power and the availability of large spectral datasets, machine learning techniques have emerged as prominent tools for spectral prediction. These models approximate the nonlinear mapping between CMYK inputs and spectral reflectance by learning patterns directly from data.
Classical statistical regressors, such as Principal Component Regression (PCR) [30] and Partial Least Squares (PLS) [31], reduce spectral dimensionality by projecting reflectance data into a low-dimensional latent space before performing regression. This approach improves noise robustness and reduces model complexity, making these methods suitable for applications with limited training data.
Kernel-based methods, such as Support Vector Regression (SVR) [32] with radial basis function kernels, are capable of capturing highly nonlinear relationships and exhibit strong generalization performance. However, their performance depends heavily on careful hyperparameter tuning and the availability of sufficient training data.
Hybrid approaches have been introduced to address specific challenges in spectral prediction [33]. For instance, Liu et al. integrated a back-propagation neural network (BPANN) with the CYNSN model to account for subspace-specific ink-dot gain interactions [22]. Similarly, Lu et al. employed particle swarm optimization (PSO) to optimize BPANN initialization, thereby improving convergence and accuracy [23]. Radial Basis Function (RBF) networks, optimized using genetic algorithms (GAs), have also demonstrated superior generalization performance compared to traditional RBF and CYNSN models [34].
2.2.3. Deep Neural Networks
Deep neural networks (DNNs) approximate spectral prediction as a composition of nonlinear transformations:
where is the CMYK input vector and denotes trainable parameters. Shallow DNNs (1–2 hidden layers) often match or exceed classical regressors, while deeper architectures, fully connected or convolutional, effectively capture higher-order ink–substrate interactions and cross-channel dependencies. Regularization techniques such as dropout and weight decay are essential for preventing overfitting, particularly when training data is limited.
Recent developments have focused on physics-informed neural architectures, which integrate spectral priors or physical descriptors to improve generalization. For example, Moon et al. developed a spot-color prediction model trained on physical ink and substrate descriptors, demonstrating improved generalization [35]. Tian et al. proposed a PCA-IPSO-DNN framework that expands CMYK inputs into Neugebauer primaries, compresses outputs using Principal Component Analysis (PCA), and optimizes network parameters via an improved PSO algorithm [24]. Fan et al. introduced an HMSSA-BP model that integrates multispectral imaging data with perceptual quality metrics, such as Structural Similarity Index (SSIM) and Peak Signal-to-Noise Ratio (PSNR), to enhance prediction accuracy across diverse printing conditions [36].
Overall, data-driven approaches have evolved from simple interpolation to sophisticated machine learning and deep neural network architectures, achieving superior adaptability and accuracy for complex printing environments. However, they face challenges related to computational cost, data acquisition, and generalization in sparse or biased sampling scenarios. These limitations motivate the exploration of ensemble learning strategies, which combine the strengths of diverse predictors to achieve robust and scalable spectral prediction.
3. Stacking Ensemble Framework for Spectral Prediction
This section describes the architecture of the proposed Stacking Ensemble Spectral Prediction (SESP) framework, designed to achieve accurate spectral reflectance estimates for printed halftone images. SESP employs a two-tier stacking ensemble strategy [37,38], hierarchically integrating multiple heterogeneous base regressors through a meta-learner. Conceptually, the framework is inspired by the optical decomposition-recombination mechanism that governs halftone reflectance formation, enabling the model to capture both the symmetric structural regularities of halftone patterns and the nonlinear light-substrate scattering dynamics.
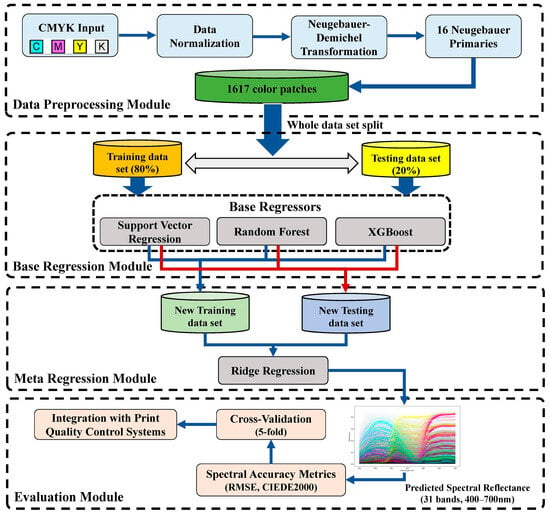
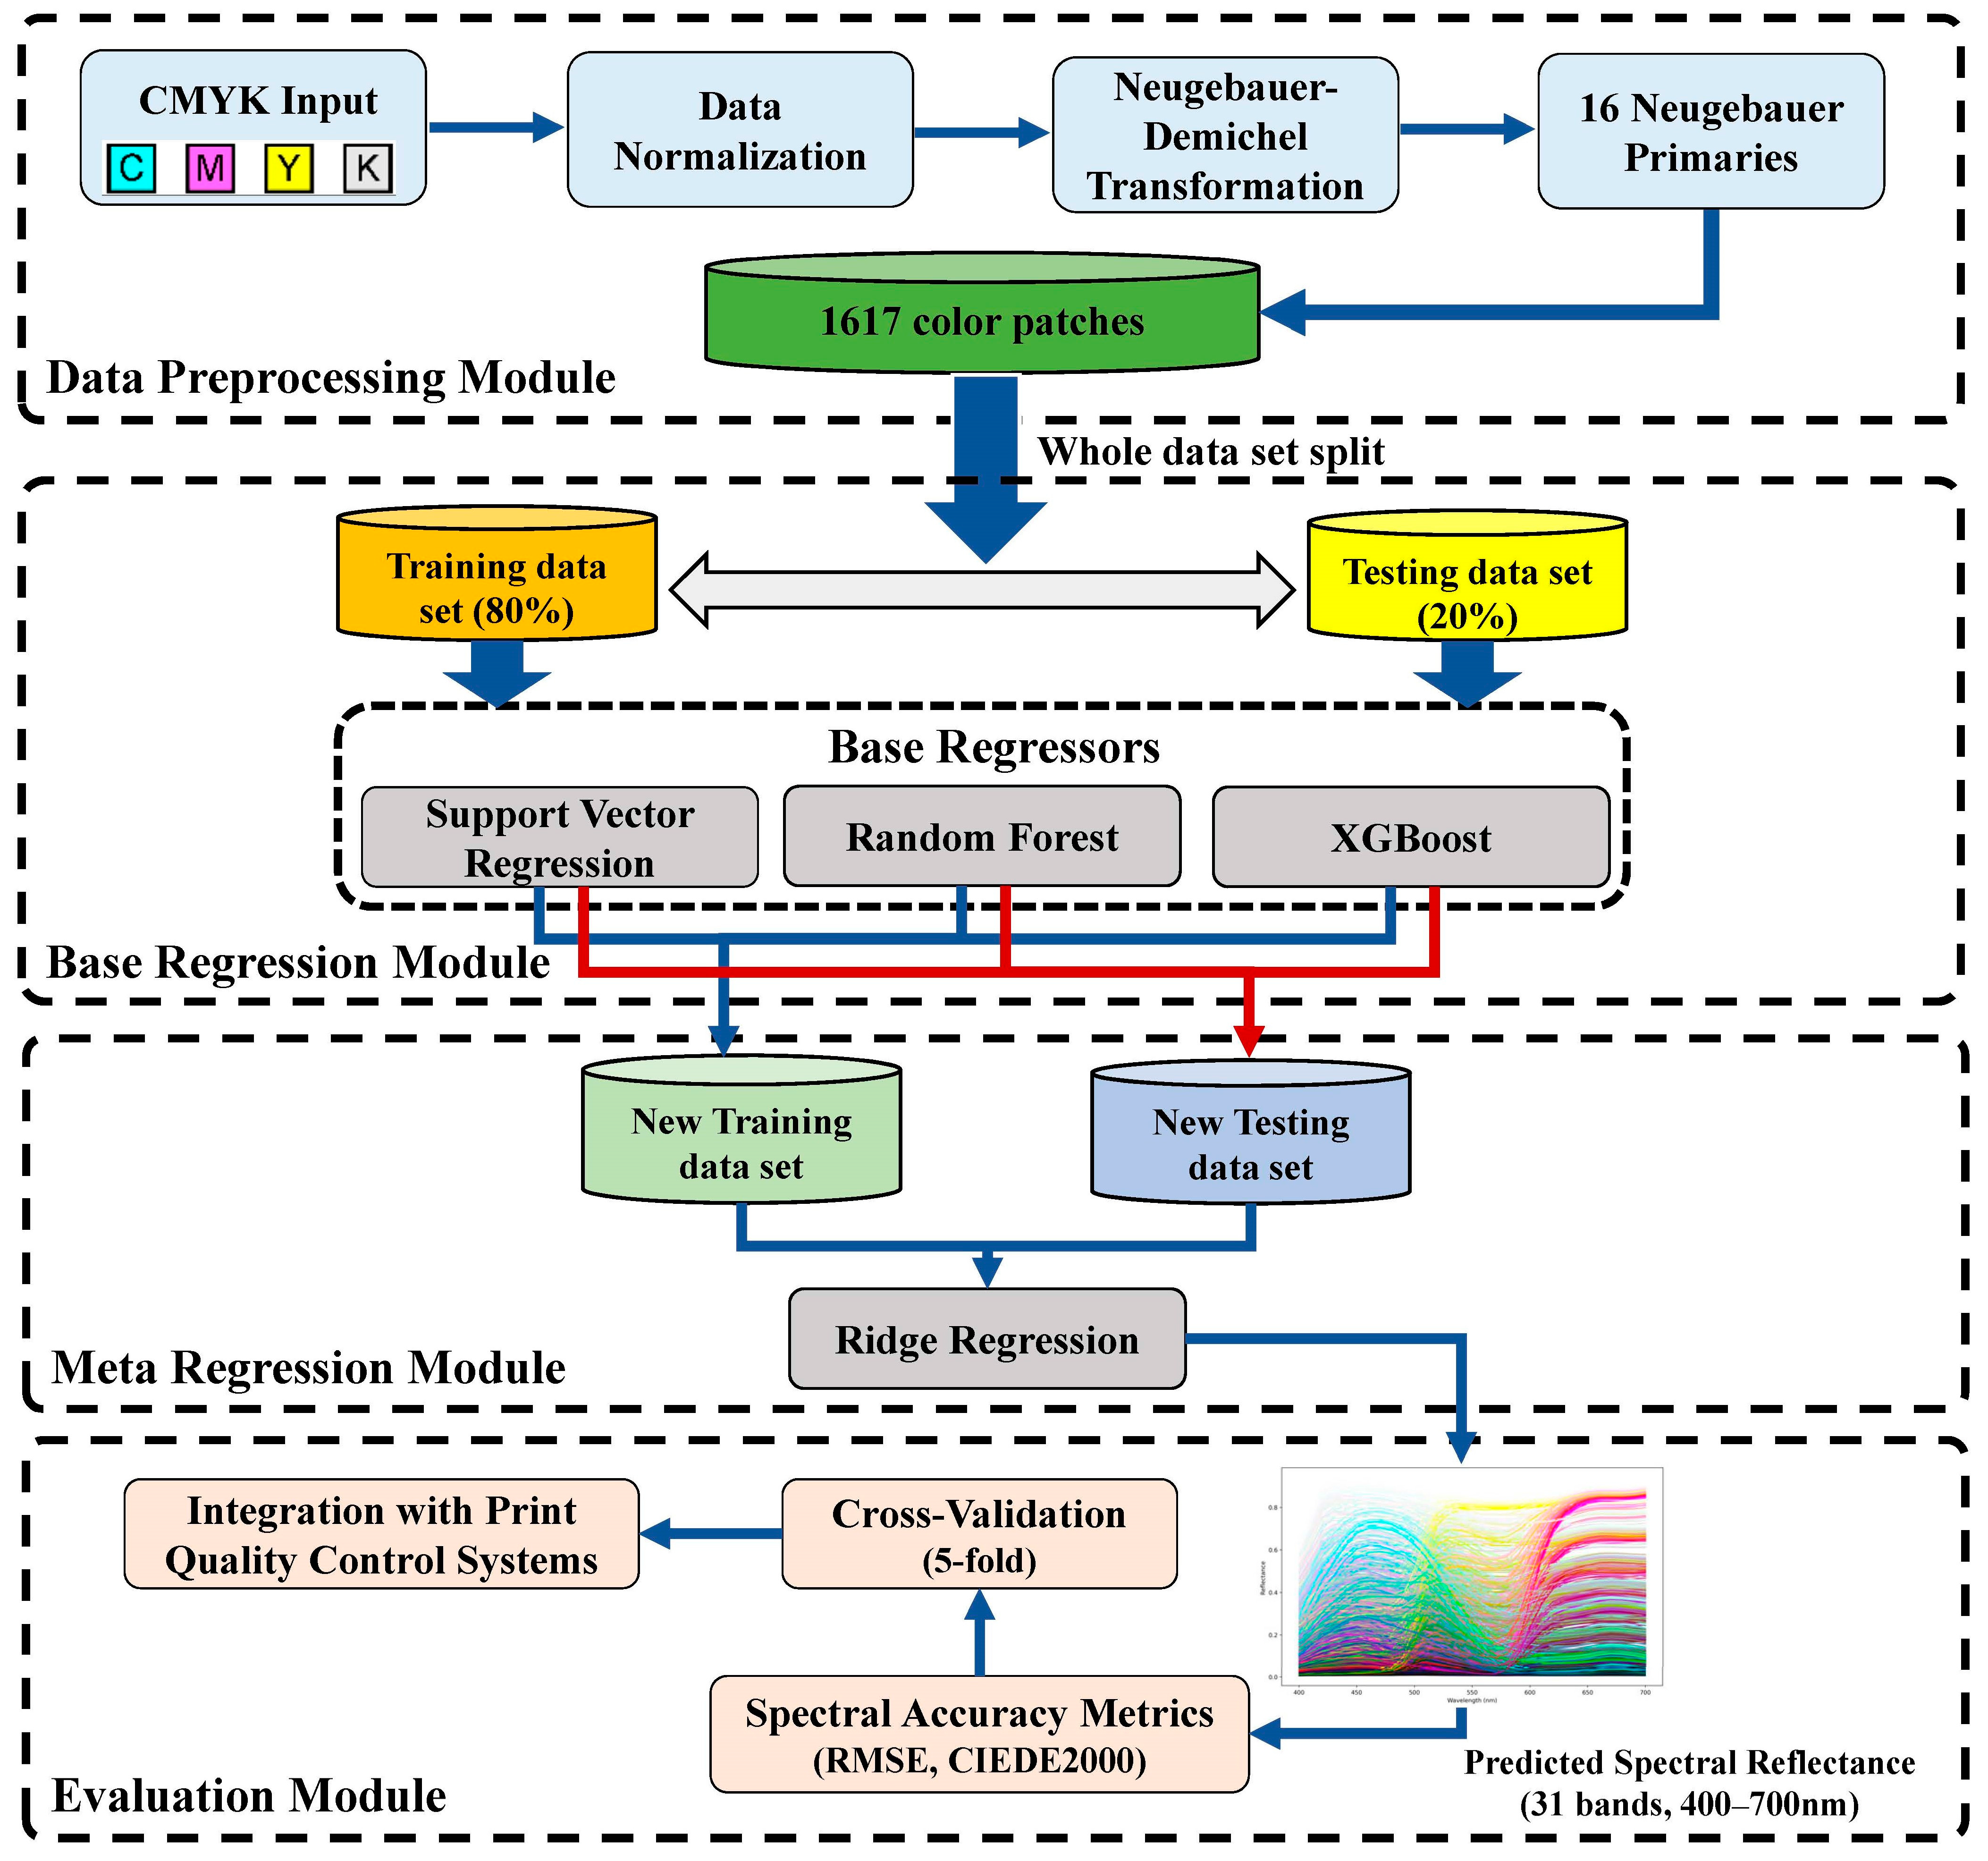
As illustrated in Figure 1, the SESP framework consists of four interconnected modules: the Data Preprocessing Module, which transforms raw CMYK inputs into spectral-relevant features suitable for regression tasks; the Base Regression Module, comprising three independently trained machine learning models, including SVR [32], RF [39], and XGBoost [40], each capturing different aspects of the input-output relationship; the Meta Regression Module, which utilizes Ridge Regression [41] to aggregate base-model predictions into a final spectral estimate; and the Evaluation Module, which assesses performance using both spectral fidelity and perceptual color metrics. This modular and hierarchical design ensures scalability, interpretability, and physical consistency, making SESP a robust solution for complex spectral prediction tasks in modern printing workflows.
Figure 1.
Architecture of the proposed Stacking Ensemble framework for Spectral Prediction.
3.1. Data Preprocessing Module
Unlike conventional halftone image reconstruction approaches that operate directly on raster images, the proposed SESP framework formulates multispectral reconstruction at the patch level, where each sample is represented by its printing parameters (CMYK area coverages) and the corresponding measured spectral reflectance. Therefore, no image-domain preprocessing operations, such as denoising, spatial filtering, edge enhancement, or segmentation, are applied in this study.
Instead, the preprocessing stage is designed to transform printing-parameter data into a numerically stable and physically interpretable feature space suitable for learning-based spectral prediction. The Data Preprocessing Module consists of two sequential steps: (1) normalization of CMYK area coverages and (2) Neugebauer–Demichel transformation.
3.1.1. CMYK Data Normalization
To eliminate bias from scale disparities and ensure consistency across input features, the raw CMYK input vectors are normalized to the range [0, 1] using min-max normalization:
where denotes the original CMYK data value, represents the normalized value, and and are the minimum and maximum values of the dataset, respectively. This normalization ensures consistent feature scaling across all regression models in the stacking ensemble and improves convergence stability.
3.1.2. Neugebauer–Demichel Transformation
To explicitly model nonlinear optical interactions from ink superposition in halftone printing, the normalized CMYK vector is transformed into 16 Neugebauer primaries using the Demichel equations [42]:
where c, m, y, and k represent the normalized fractional coverage areas of cyan, magenta, yellow, and black inks, respectively. These primaries quantify the fractional surface area coverage for all possible ink combinations, forming a physically meaningful and interpretable feature set.
By incorporating the 16 Neugebauer primaries into the feature space, this transformation captures the nonlinear scattering effects and ink overlaps inherent in halftone printing, significantly enhancing the model’s ability to learn the mapping between CMYK inputs and corresponding spectral reflectance values.
It should be emphasized that the goal of this work is spectral prediction for halftone patches, rather than end-to-end halftone image reconstruction. Representing halftone samples using CMYK area coverages and Neugebauer primaries is consistent with established practice in both physics-based models (e.g., Yule–Nielsen and Clapper–Yule) and modern machine-learning-based color characterization methods, ensuring fair and meaningful comparisons.
3.2. Base Regression Module
Spectral prediction for printed halftone patches involves a nonlinear and heterogeneous regression process, governed by both smooth optical scattering and irregular ink–substrate interactions. No single regression model is well suited to capture all these effects simultaneously. For this reason, the proposed SESP framework adopts a heterogeneous ensemble of base regressors rather than relying on a single predictor. The selection of base models is guided by three criteria: (i) diversity of learning mechanisms, (ii) complementarity of error characteristics, and (iii) consistency with the physical processes underlying halftone reflectance formation.
Based on these considerations, Support Vector Regression (SVR), Random Forest (RF), and eXtreme Gradient Boosting (XGBoost) are chosen as base learners. Each model captures a distinct aspect of the nonlinear CMYK-to-spectrum mapping and produces complementary prediction behaviors for stacking-based fusion.
3.2.1. Support Vector Regression (SVR)
SVR extends Support Vector Machine (SVM) principles to regression by using a ε-insensitive loss function, introducing a tolerance margin that improves robustness against noise [32]. With kernel-based modeling, typically using Radial Basis Function (RBF), SVR captures nonlinearities without explicit feature expansion efficiently.
In the context of halftone spectral prediction, SVR is well suited to modeling continuous and globally smooth nonlinear trends, such as light-substrate scattering and gradual reflectance transitions across ink coverage levels. Its regularized formulation provides stable baseline predictions and serves as a smooth approximation component within the ensemble.
3.2.2. Random Forest (RF)
Random Forest constructs an ensemble of decision trees using bootstrap sampling and feature bagging, which effectively reduces variance and mitigates overfitting [39]. RF is inherently robust to noise and outliers and does not rely on strong distributional assumptions.
From a physical perspective, RF is particularly effective at capturing localized and stochastic variations in halftone printing, including dot gain fluctuations, microstructural heterogeneity, and irregular halftone geometry. These effects often introduce discrete or piecewise spectral deviations that are difficult to represent using smooth functional models. RF therefore complements SVR by modeling structural variability that arises under realistic printing conditions.
3.2.3. eXtreme Gradient Boosting (XGBoost)
XGBoost improves upon traditional boosting methods by incorporating second-order gradients for optimization, L1 and L2 regularization to mitigate overfitting, and parallelized training for scalability [40]. By sequentially fitting weak learners to residual errors, XGBoost excels at modeling complex interactions and higher-order dependencies.
In halftone spectral reconstruction, XGBoost plays the role of a residual learner, capturing fine-scale discrepancies that remain after smooth and structural components have been modeled. This includes complex inter-channel coupling among CMYK inks and nonlinear absorption-scattering interactions introduced by multi-ink overlays. As such, XGBoost refines coarse spectral approximations and improves accuracy in challenging regions of the spectral space.
3.2.4. Complementarity Within the Stacking Framework
By combining SVR, RF, and XGBoost, the proposed ensemble integrates smooth nonlinear approximation, structural variability modeling, and residual correction within a unified framework. This decomposition reflects the multi-component nature of halftone reflectance formation and yields base predictions with complementary error patterns.
The heterogeneity of these base learners is essential for effective stacking: rather than competing, the models provide diverse and informative prediction signals that are subsequently aggregated by the meta-learner. This design allows the SESP framework to achieve improved spectral accuracy, robustness, and generalization compared to any individual base regressor.
3.3. Meta Regression Module
The second layer of the proposed SESP framework adopts a stacking-based meta-regression strategy to integrate predictions from heterogeneous base models and generate the final spectral reflectance estimates. Rather than simple averaging or heuristic fusion, this design explicitly exploits the complementary error characteristics of the base regressors while ensuring numerical stability and physical interpretability.
3.3.1. Stacking Procedure
To avoid information leakage and ensure unbiased meta-level learning, a strict two-stage stacking procedure is employed. At the base level, the training set is partitioned into five folds. For each fold, the three base models, SVR, RF, and XGBoost, are trained on four folds and used to generate predictions for the held-out fold. After completing all folds, out-of-fold (OOF) predictions are obtained for every training sample from each base regressor. These OOF predictions provide unbiased estimates of base-model behavior and serve as inputs for meta-level training.
Let the predictions from the three base models (SVR, RF, and XGBoost) for a given sample be denoted as , , , which are concatenated into a feature vector . To capture higher-order interactions, the vector is further expanded with nonlinear terms (e.g., , ).
3.3.2. Ridge Regression as Meta-Learner
Ridge Regression is employed as the meta-learner due to its effectiveness in high-dimensional regression and its ability to mitigate multicollinearity among correlated predictors [41]. The Ridge objective is defined as:
where is the ground-truth spectral reflectance of the i-th sample, is the nonlinear feature transformation, are the regression coefficients, and is the L2 regularization parameter.
The regularization term suppresses redundancy among base-model predictions, stabilizes the fusion process, and prevents overfitting in the spectral domain, where strong correlations across wavelengths are common.
3.3.3. Hyperparameter Selection
During inference, all base models are retrained on the full training set using fixed hyperparameters and applied to unseen test samples. The resulting base predictions are then fused by the trained meta-regressor to produce the final spectral estimates.
Hyperparameters for all models are selected via nested cross-validation prior to OOF prediction generation. Once determined, they remain fixed throughout training and testing. Test data are not used at any stage of model selection or meta-training, ensuring fair and unbiased evaluation.
3.3.4. Physical Interpretation
From a physical modeling perspective, the proposed stacking-based fusion aligns with classical halftone reflectance theories such as the Yule–Nielsen and Clapper–Yule models, in which multiple light transport components interact through both additive and nonlinear mechanisms. In SESP, base regressors approximate distinct optical behaviors, while the regularized meta-regressor learns their optimal combination, effectively emulating composite absorption–scattering interactions.
Unlike existing reconstruction techniques that rely on a single regression model or purely empirical fusion, SESP introduces a physics-guided stacking architecture that integrates heterogeneous predictors through a principled and reproducible procedure. This design constitutes the primary novelty of the proposed method and enables consistent improvements in spectral accuracy and robustness across different illuminants and evaluation metrics.
3.4. Evaluation Module
The Evaluation Module provides a comprehensive assessment of the SESP model in terms of predictive accuracy, robustness, and applicability to real-world printing systems.
3.4.1. Spectral Accuracy Metrics
To comprehensively assess SESP performance, two complementary metrics are employed. The first, Root Mean Square Error (RMSE), measures the average spectral deviation across 31 bands spanning the 400 to 700 nm range at 10 nm intervals, providing a quantitative evaluation of spectral accuracy. The second metric, CIEDE2000 () [43], captures perceptual color differences by considering human visual sensitivity to hue, lightness, and chroma, thereby offering a more perceptually aligned assessment of color fidelity.
Together, RMSE and provide a dual-perspective evaluation framework encompassing both physical fidelity and perceptual relevance.
3.4.2. Cross-Validation
A rigorous 5-fold cross-validation strategy is employed in a manner consistent with the hierarchical stacking architecture. The dataset is first partitioned into mutually exclusive training and test sets, where the test set is reserved exclusively for final performance evaluation and is not involved in any stage of model training or hyperparameter tuning.
Within the training set, five folds are constructed. In each fold, the base regressors (SVR, Random Forest, and XGBoost) are trained on four folds and used to generate predictions for the remaining fold. These out-of-fold (OOF) predictions are aggregated across folds and used to train the meta-learner. This procedure ensures that the meta-level model is trained only on predictions obtained from unseen data, effectively preventing information leakage.
Hyperparameters for all base learners and the meta-learner are optimized exclusively within the training set using cross-validation. Validation RMSE is used as the sole optimization criterion. Once selected, all hyperparameters are fixed and used consistently throughout training and testing.
For the final evaluation, each base model is retrained on the full training set using the selected hyperparameters and applied to the held-out test set. The trained meta-learner then fuses the base predictions to produce the final spectral estimates. This protocol guarantees unbiased evaluation and reliable generalization assessment [44].
3.4.3. Integration with Print Quality Control Systems
The SESP model is readily integrable into real-time print quality control systems, enabling continuous spectral monitoring and feedback. This supports closed-loop adjustments, maintains color consistency, reduces waste, and enhances energy efficiency, aligning with industry trends in sustainable, scalable, and cost-effective color management [45].
In summary, the SESP framework realizes a physics-informed stacking strategy that fuses ensemble learning within the optical and geometric constraints of halftone imaging. Its hierarchical architecture reflects the optical decomposition-recombination process underlying halftone reflectance formation. Through advanced preprocessing, heterogeneous regression modeling, meta-level integration, and rigorous evaluation, SESP achieves accurate, interpretable, and generalizable spectral reconstruction. The framework effectively bridges physics-based and data-driven paradigms, providing a practical and scalable solution for intelligent, device-independent color management and high-fidelity multispectral reconstruction.
4. Experiments and Evaluation
4.1. Data Collection
To obtain a high-quality spectral dataset suitable for performance comparison, we employed the IT8.7/5 (TC1617x) printer test chart, an industry-standard target for CMYK color characterization. The target contains 1617 color patches uniformly sampled across the CMYK color space, providing comprehensive coverage of single-, dual-, and multi-ink overprint combinations.
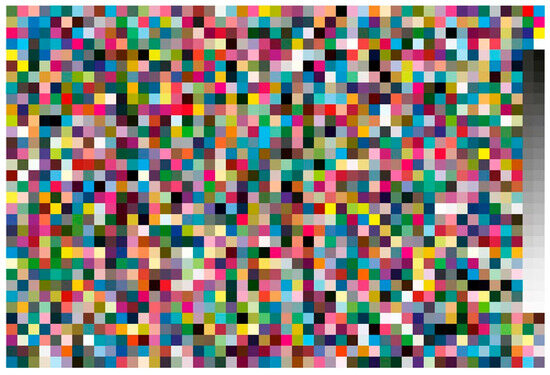
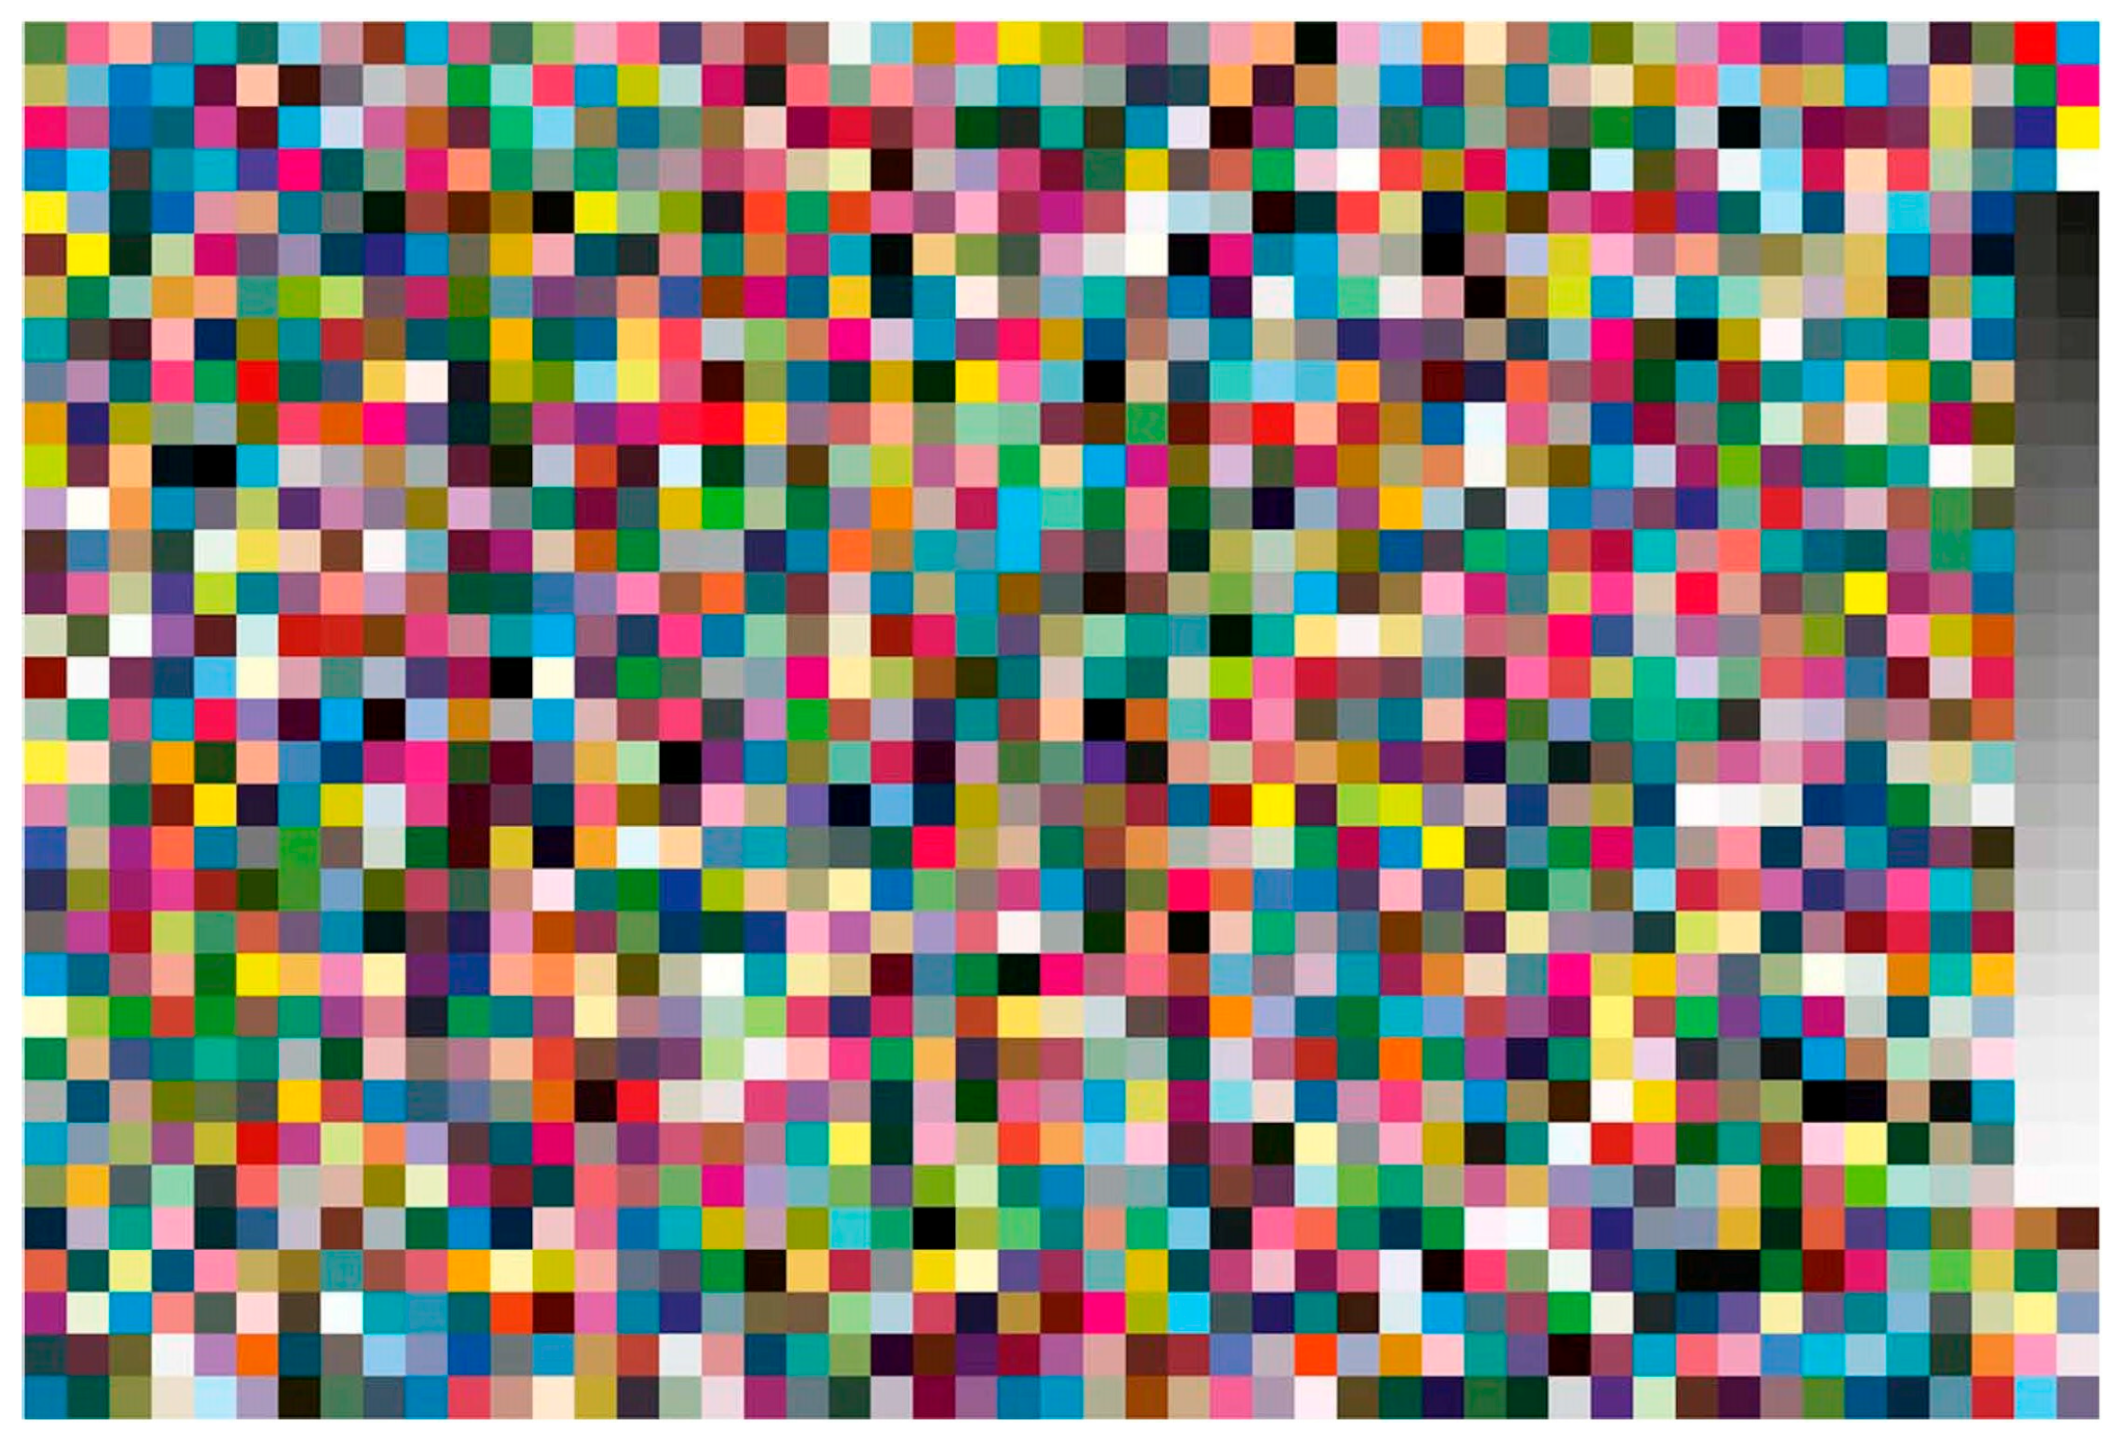
Compared to the earlier IT8.7/4 version, IT8.7/5 removes 29 redundant patches and incorporates 29 new patches from previously excluded columns (Columns 4 and 5), thereby increasing spectral variability and enhancing colorimetric granularity. As a result, the dataset includes low-, medium-, and high-density ink regions and captures nonlinear spectral interactions among CMYK channels. Furthermore, both square and round halftone dot geometries were included to account for structural variations in dot shape, which are known to influence optical dot gain and spectral reflectance behavior. A schematic representation of the chart layout is provided in Figure 2.
Figure 2.
Layout of the IT8.7/5 (TC1617x) printer test chart.
Printing was carried out using a Heidelberg XL75 four-color offset press (Heidelberg, Germany). Plate imaging was executed using the Heidelberg Supermaster system at 2540 dpi resolution with a 200 LPI (lines per inch) screen ruling. Both square and round halftone dot geometries were included to capture variability in dot shape characteristics. The print substrate was a 157 g/m2 double-coated art paper, supplied by Asia Pulp & Paper Co., Ltd. (APP) (Jakarta, Indonesia). To ensure repeatability and minimize process-induced variability, the printing was conducted under strictly controlled environmental conditions: ambient temperature was maintained between 23 °C and 25 °C, and relative humidity was held at 55 ± 5%. The dampening solution had a pH between 4.8 and 5.3 and included 10% isopropyl alcohol; its temperature was controlled between 10 °C and 12 °C. The standard printing sequence of black, cyan, magenta, and yellow (K-C-M-Y) was followed. All printed samples conformed to ISO 15339-2:2015 CRPC6 specifications, ensuring alignment with established tone reproduction standards [24]. After printing, sheets were air-dried for one hour to ensure stable ink fixation prior to measurement.
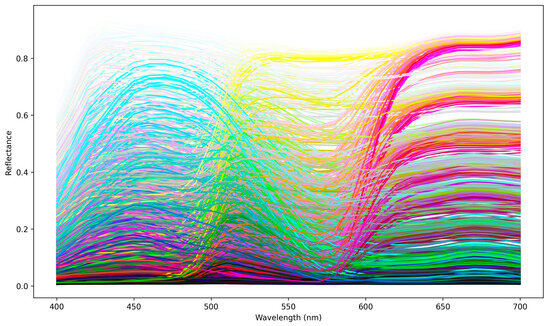
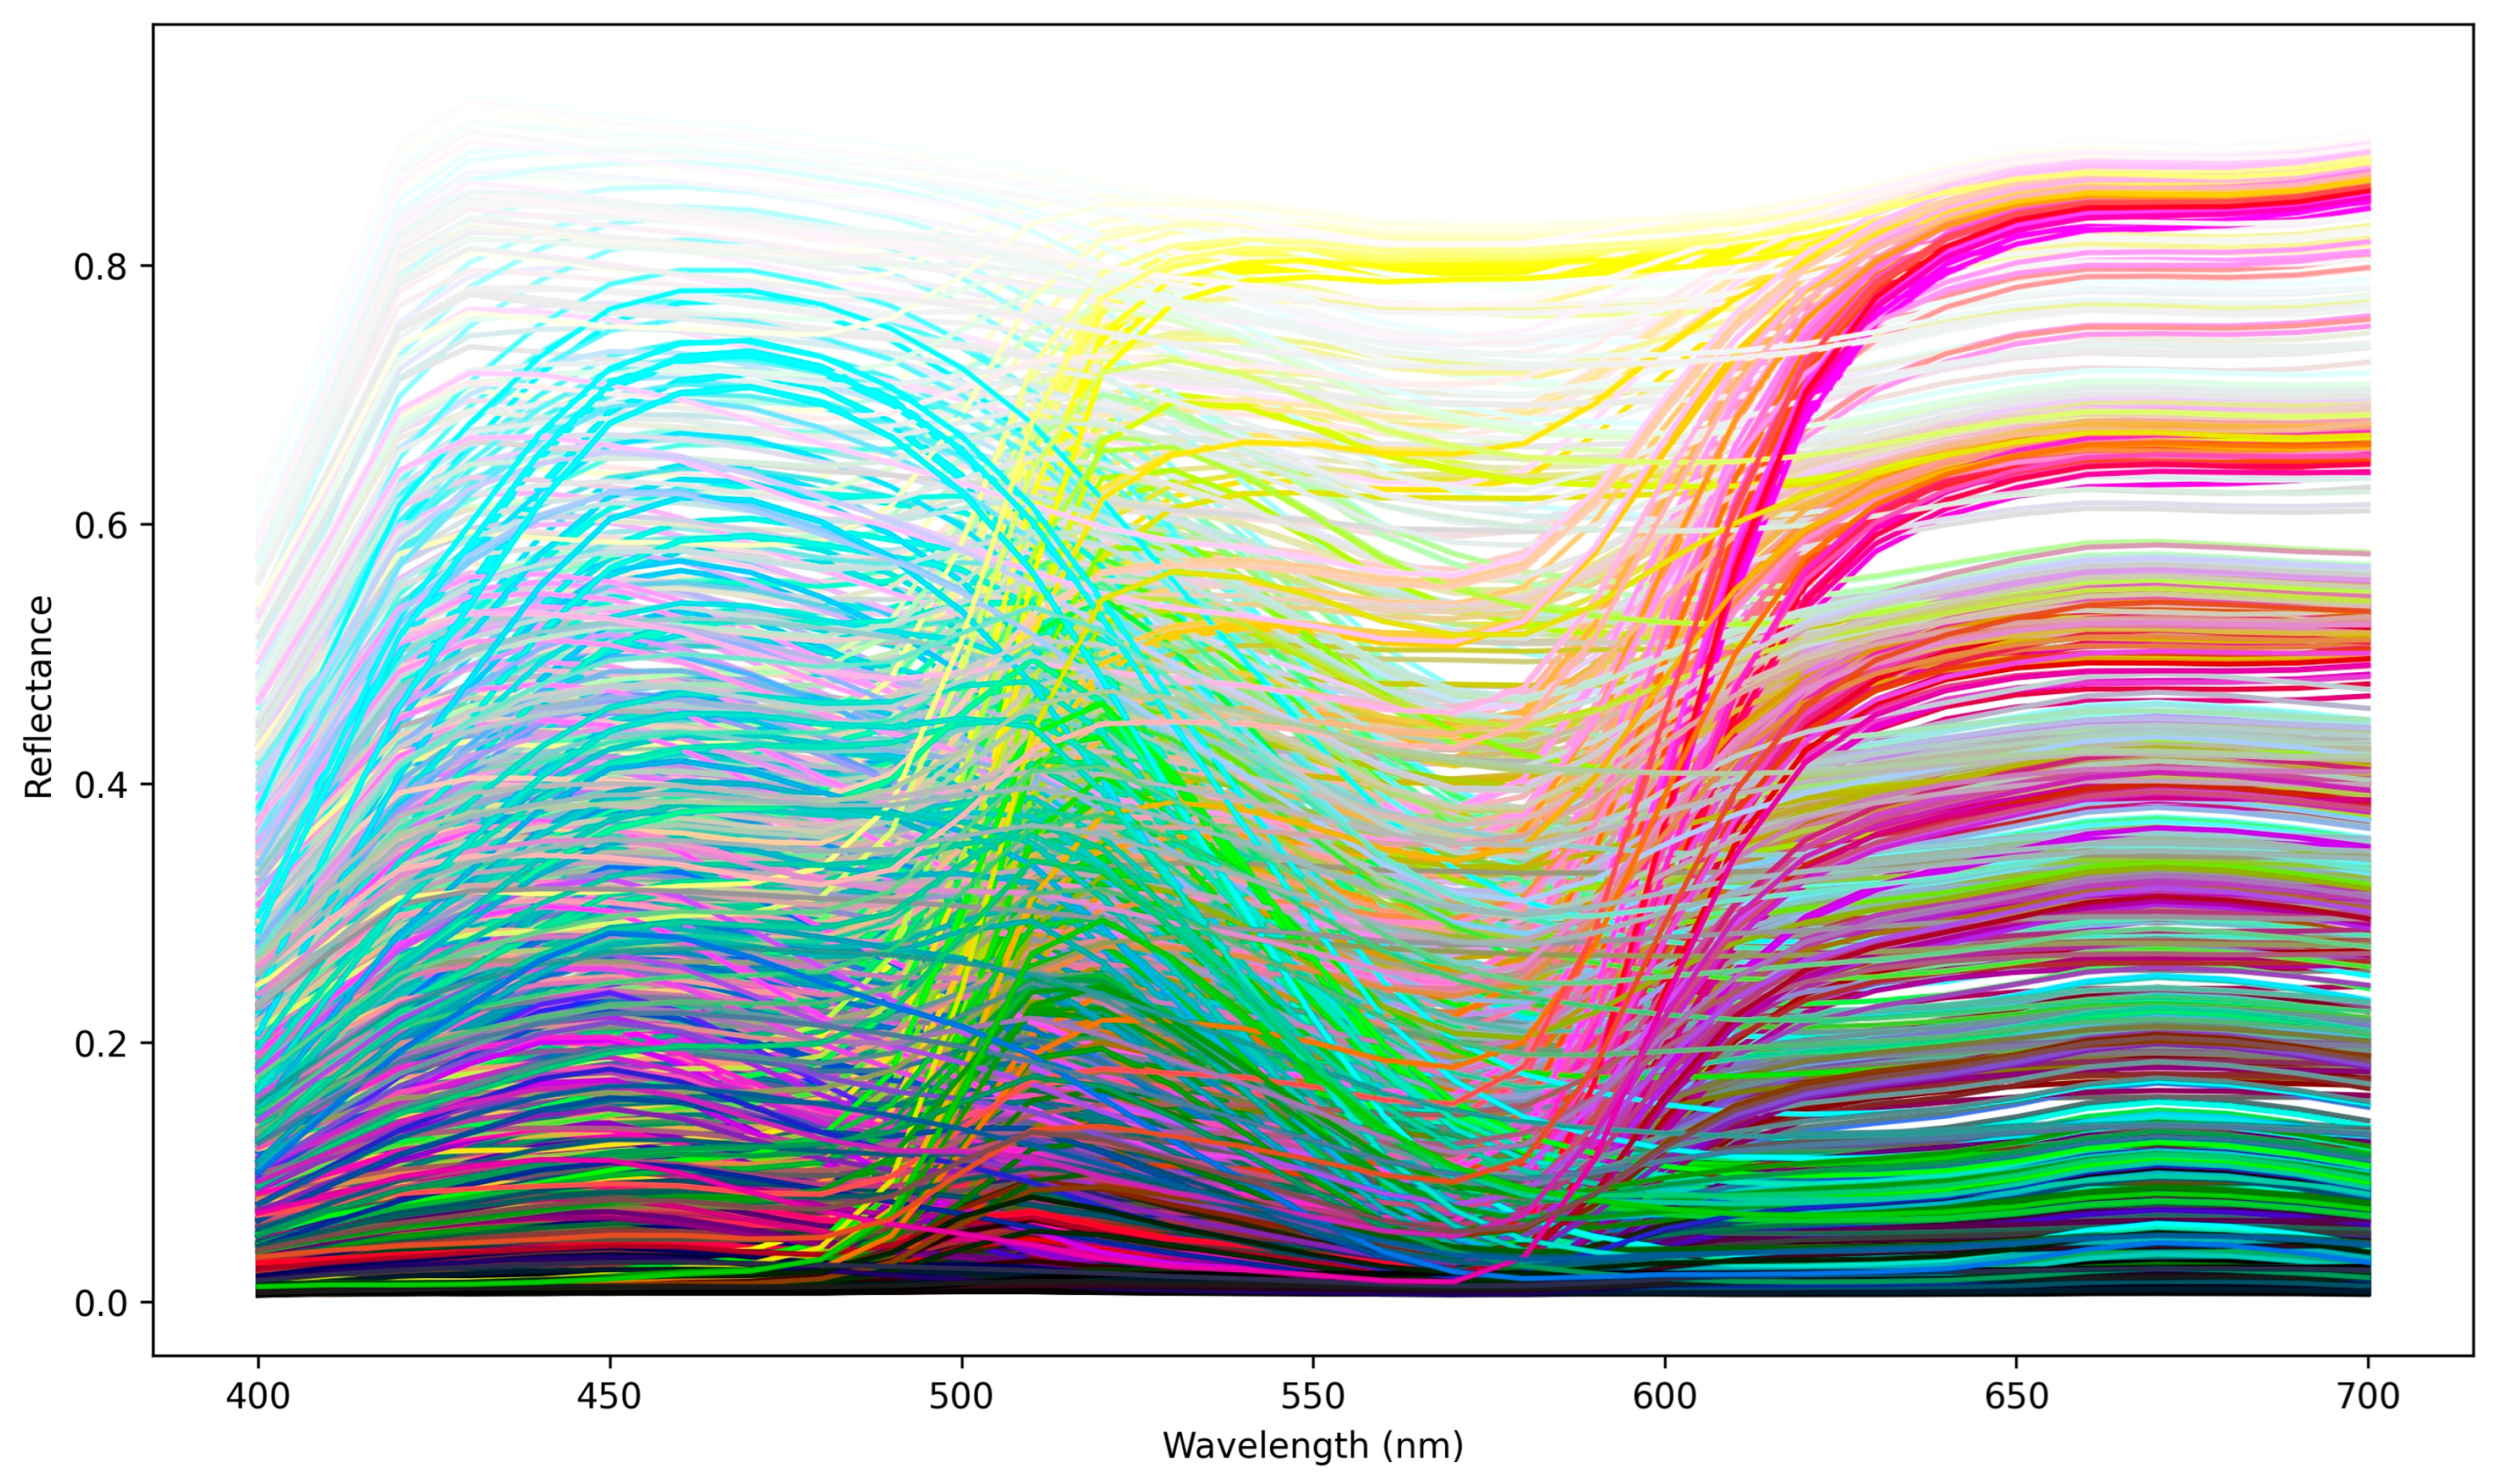
Spectral reflectance measurements were conducted using an X-Rite iSisXL2 spectrophotometer (X-Rite Incorporated, Grand Rapids, MI, USA) configured with 45°/0° ring illumination geometry. Spectral data were collected from 400 nm to 700 nm at 10 nm intervals. CIELAB colorimetric values were subsequently calculated under D50 illumination using the CIE 1931 2° standard observer. As illustrated in Figure 3, the measured spectral curves exhibit distinct absorption features in red (approximately 620 to 750 nm), yellow (approximately 570 to 590 nm), and cyan (approximately 485 to 495 nm) regions, which are consistent with the spectral behaviors of the respective CMYK inks.
Figure 3.
Spectral reflectance curves of 1617 color patches from the IT8.7/5 (TC1617x) chart.
To validate colorimetric accuracy, the measured results were compared to ISO 15339-2:2015 CRPC6 reference values. Table 1 presents the CIEDE2000 color differences () for representative solid patches. In the table, “S” refers to the substrate, while “C”, “M”, “Y”, “K”, “R”, “G”, and “B” denote solid cyan, magenta, yellow, black, red, green, and blue, respectively. All values were below the perceptual threshold of 2.0, indicating excellent conformance to industry standards.
Table 1.
Colorimetric comparison of printed patches against ISO 15339-2:2015 CRPC6 reference values.
Overall, the resulting dataset consists of 1617 samples with paired CMYK input values and 31-dimensional spectral reflectance outputs, acquired under controlled and standardized printing and measurement conditions. This dataset provides sufficient diversity and accuracy for evaluating the proposed stacking-based ensemble spectral prediction model and ensures reproducibility of the experimental results.
4.2. Baseline Methods
To facilitate a comprehensive evaluation of the proposed SESP model, we compared its performance with four representative baseline models, including both physics-based and data-driven methods:
- Yule–Nielson model [11]: An enhancement of the Neugebauer equation that introduces a nonlinear correction parameter (the effective dot gain exponent, n) to better account for optical dot gain and ink–substrate interactions.
- Clapper–Yule Model [17]: A classical radiative transfer-based optical model that extends the Kubelka–Munk theory and approximates light scattering and reflectance across ink layers and substrates. It assumes linear superposition of reflectance from individual ink layers.
- ANN-BP model [22]: A traditional artificial neural network employing backpropagation to learn the nonlinear relationship between CMYK inputs and spectral reflectance outputs.
- PCA-IPSO-DNN model [24]: A hybrid approach combining Principal Component Analysis (PCA) for dimensionality reduction with a Deep Neural Network (DNN) optimized using Improved Particle Swarm Optimization (IPSO). This method balances computational efficiency with high prediction accuracy in spectral reconstruction tasks.
This diverse set of baselines enables a comprehensive comparative analysis of the proposed ensemble strategy.
4.3. Evaluation Metrics
Model performance was evaluated using two widely adopted metrics: Root Mean Square Error (RMSE) and CIEDE2000 color difference (). These metrics jointly offer a comprehensive evaluation of both spectral fidelity and perceptual accuracy.
4.3.1. Root Mean Square Error (RMSE)
RMSE quantifies the average deviation between the predicted and measured spectral reflectance values across the visible range (400–700 nm), which is defined as:
where and represent the measured and predicted spectral reflectance values for the i-th color patch, and n is the total number of color patches.
As a wavelength-domain metric, RMSE directly reflects the numerical accuracy of spectral reconstruction without relying on any color space transformation or perceptual model. It is therefore widely adopted as a primary indicator of physical spectral fidelity in multispectral prediction and spectral characterization studies.
4.3.2. CIEDE2000 Color Difference ()
CIEDE2000 is recognized as the most perceptually uniform color difference metric, refining earlier formulas such as CIELAB ΔE*, CMC l:c (1984), and CIE94 [43,46]. It introduces improved weighting functions for lightness (L*), chroma (C*), and hue (H*), as well as a rotational correction term to account for interactions between chroma and hue.
In this study, predicted and measured spectra were converted into CIELAB color space using the CIE 1931 2° observer. was then calculated as:
where , , and denote the differences in lightness, chroma, and hue, respectively; , , and are the corresponding weighting functions; , , and are parametric factors (commonly set to 1 in printing applications); and accounts for the interplay between chroma and hue components.
By jointly reporting RMSE and , the evaluation captures both physical spectral reconstruction accuracy and human visual perception consistency, providing a more complete and application-relevant assessment of multispectral reconstruction performance in printing scenarios.
4.4. Experimental Results
4.4.1. Performance of the SESP Model
The proposed SESP model was evaluated using the IT8.7/5 dataset (1617 samples) under three standard illuminants (A, D50, D65) using the CIE 1931 2° standard observer. Table 2 reports the minimum, maximum, and mean RMSE and values under each illumination condition.
Table 2.
Spectral prediction performance of the SESP model under three standard illuminants.
As shown in Table 2, the SESP model achieves consistently high accuracy across all lighting conditions. For instance, under the D50/2° illuminant, the RMSE values range from 0.0002 to 0.0165 with a mean of 0.0038, while the corresponding values range from 0.019 to 2.337, with an average of 0.528. Comparable performance is observed under illuminants A and D65, confirming the robustness and stability of the model across varying lighting conditions. Notably, the mean values are significantly below the industry-accepted thresholds for perceptual accuracy (typically ), thus validating the model’s suitability for high-fidelity color reproduction.
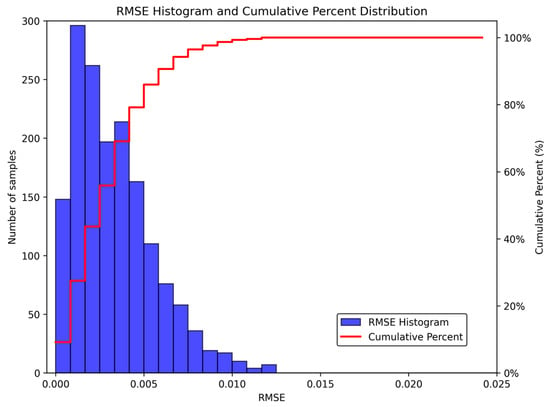
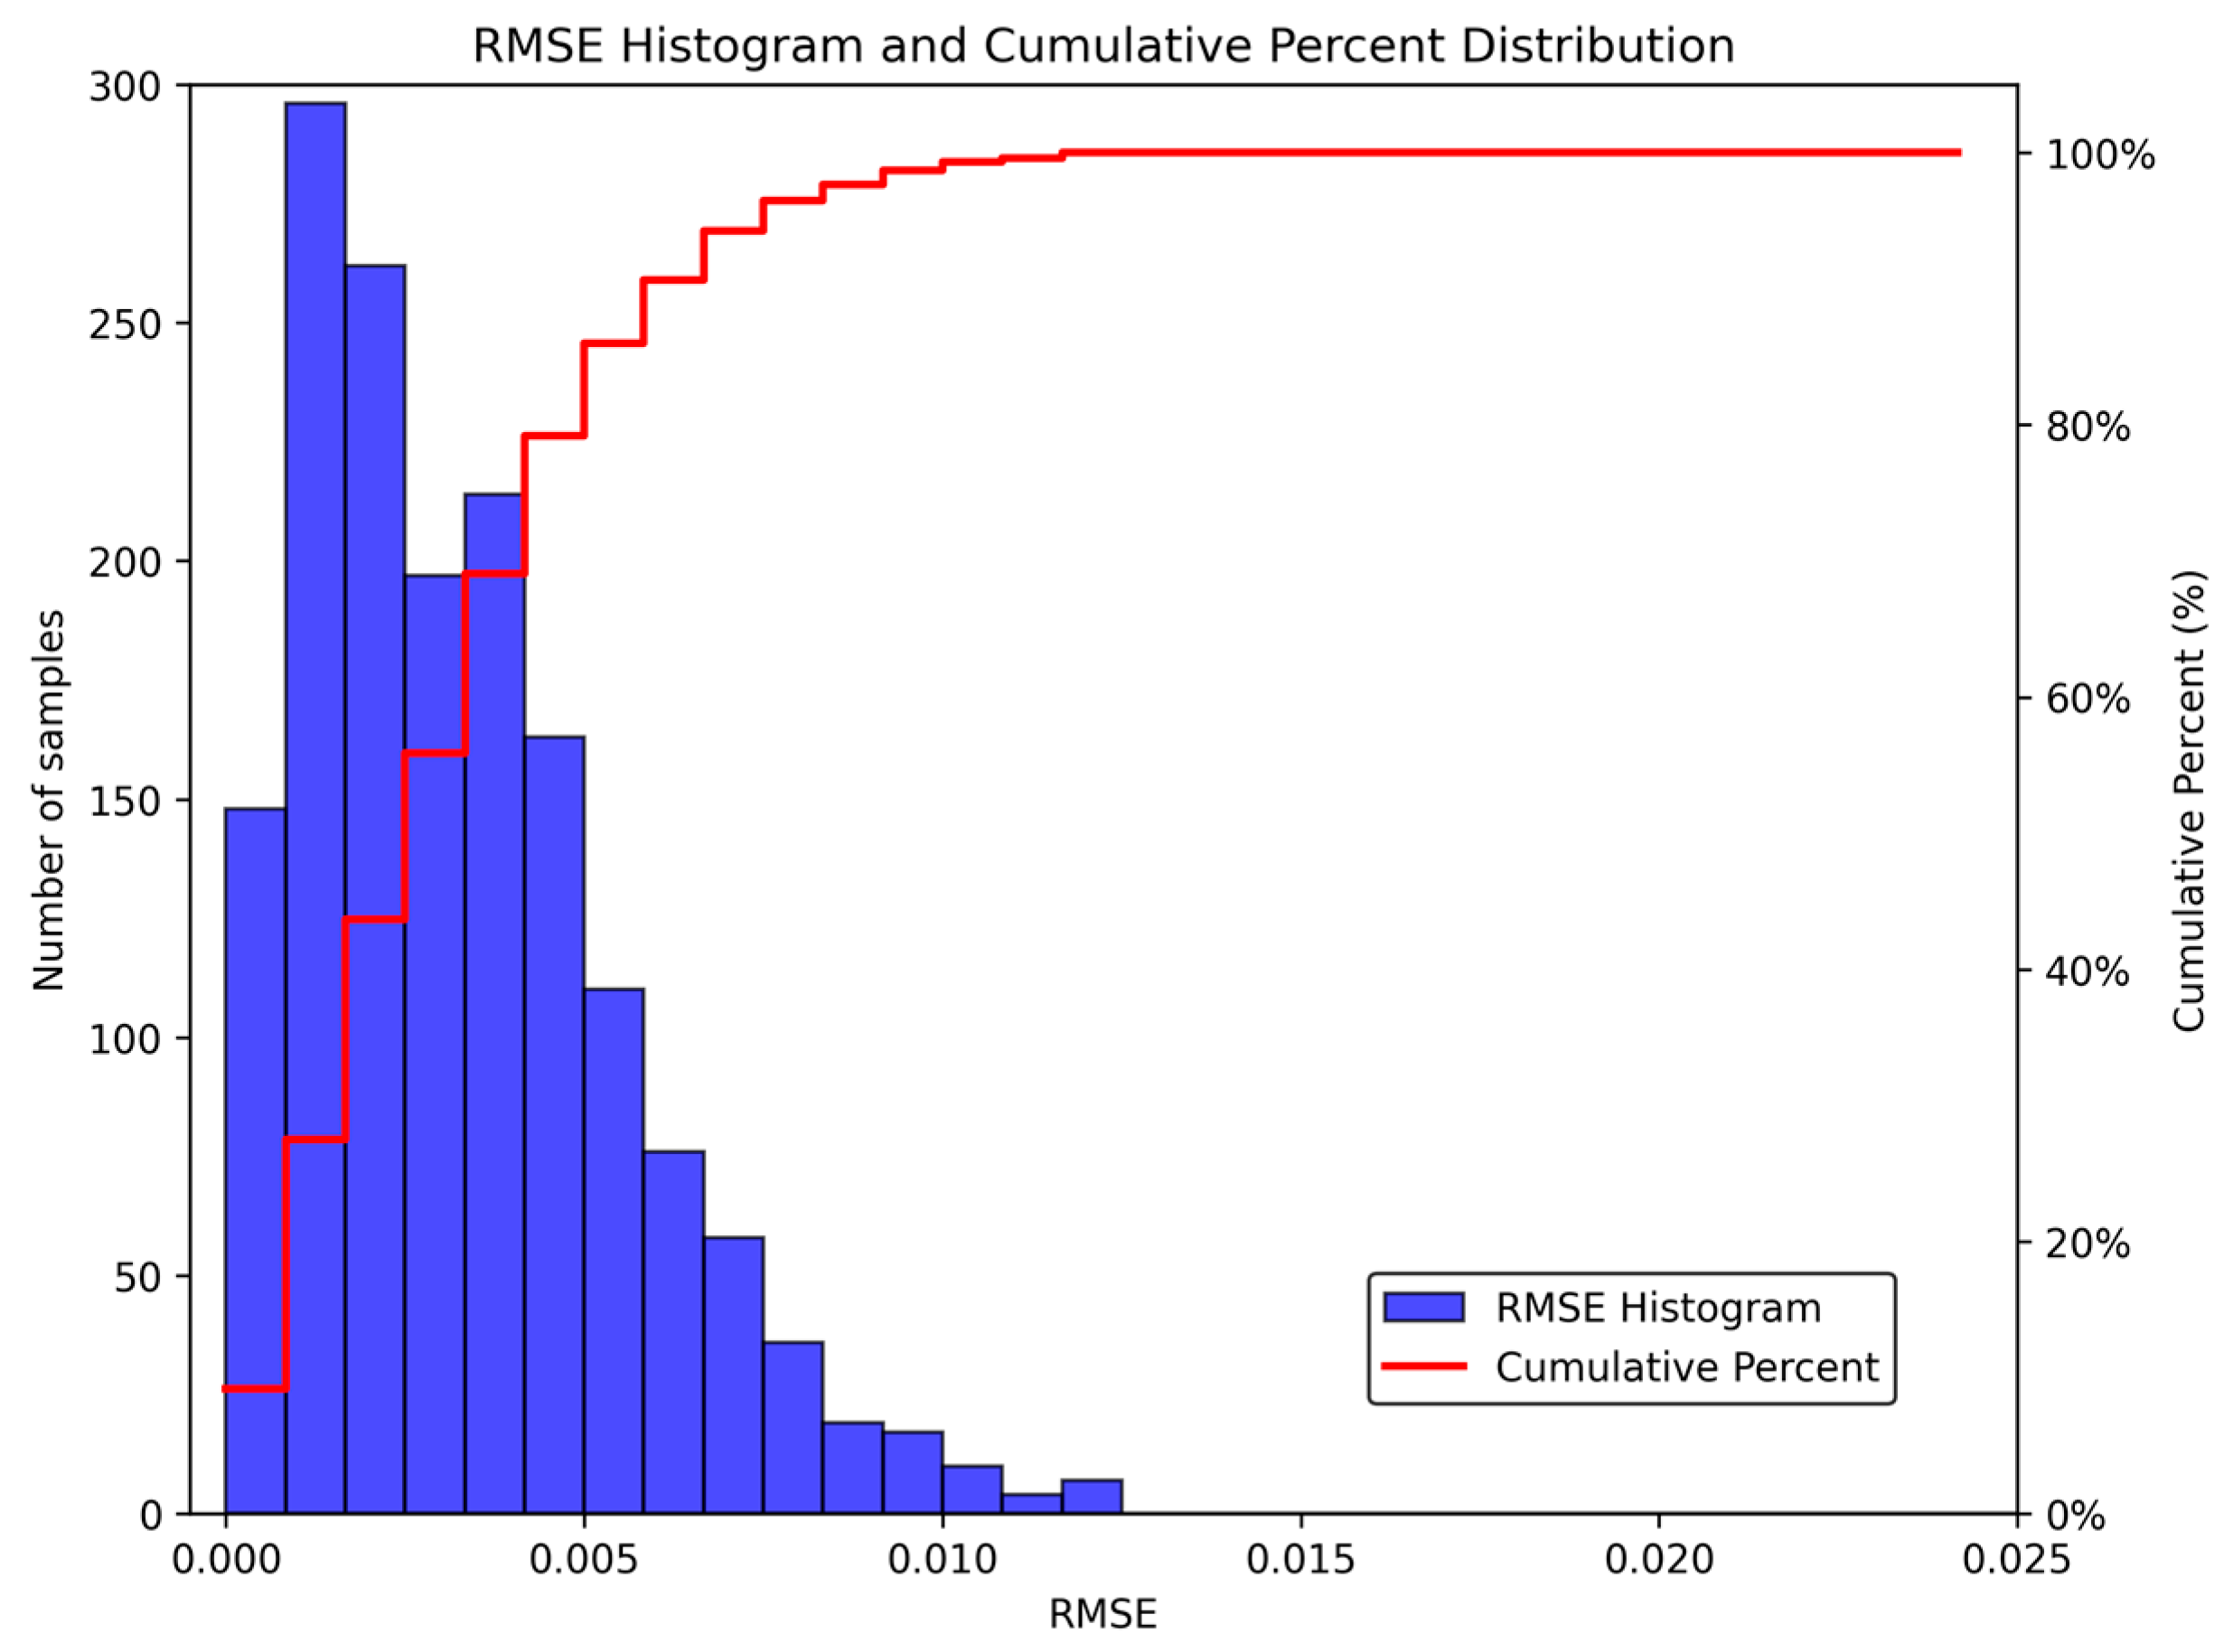
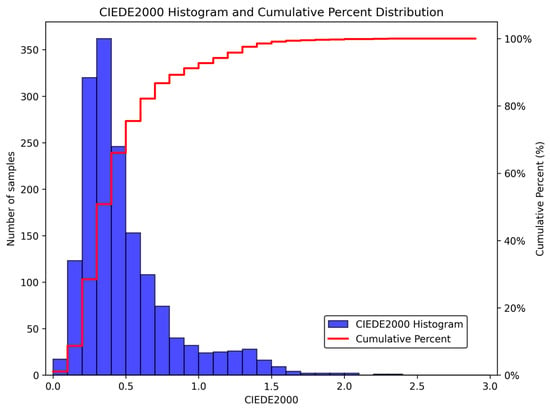
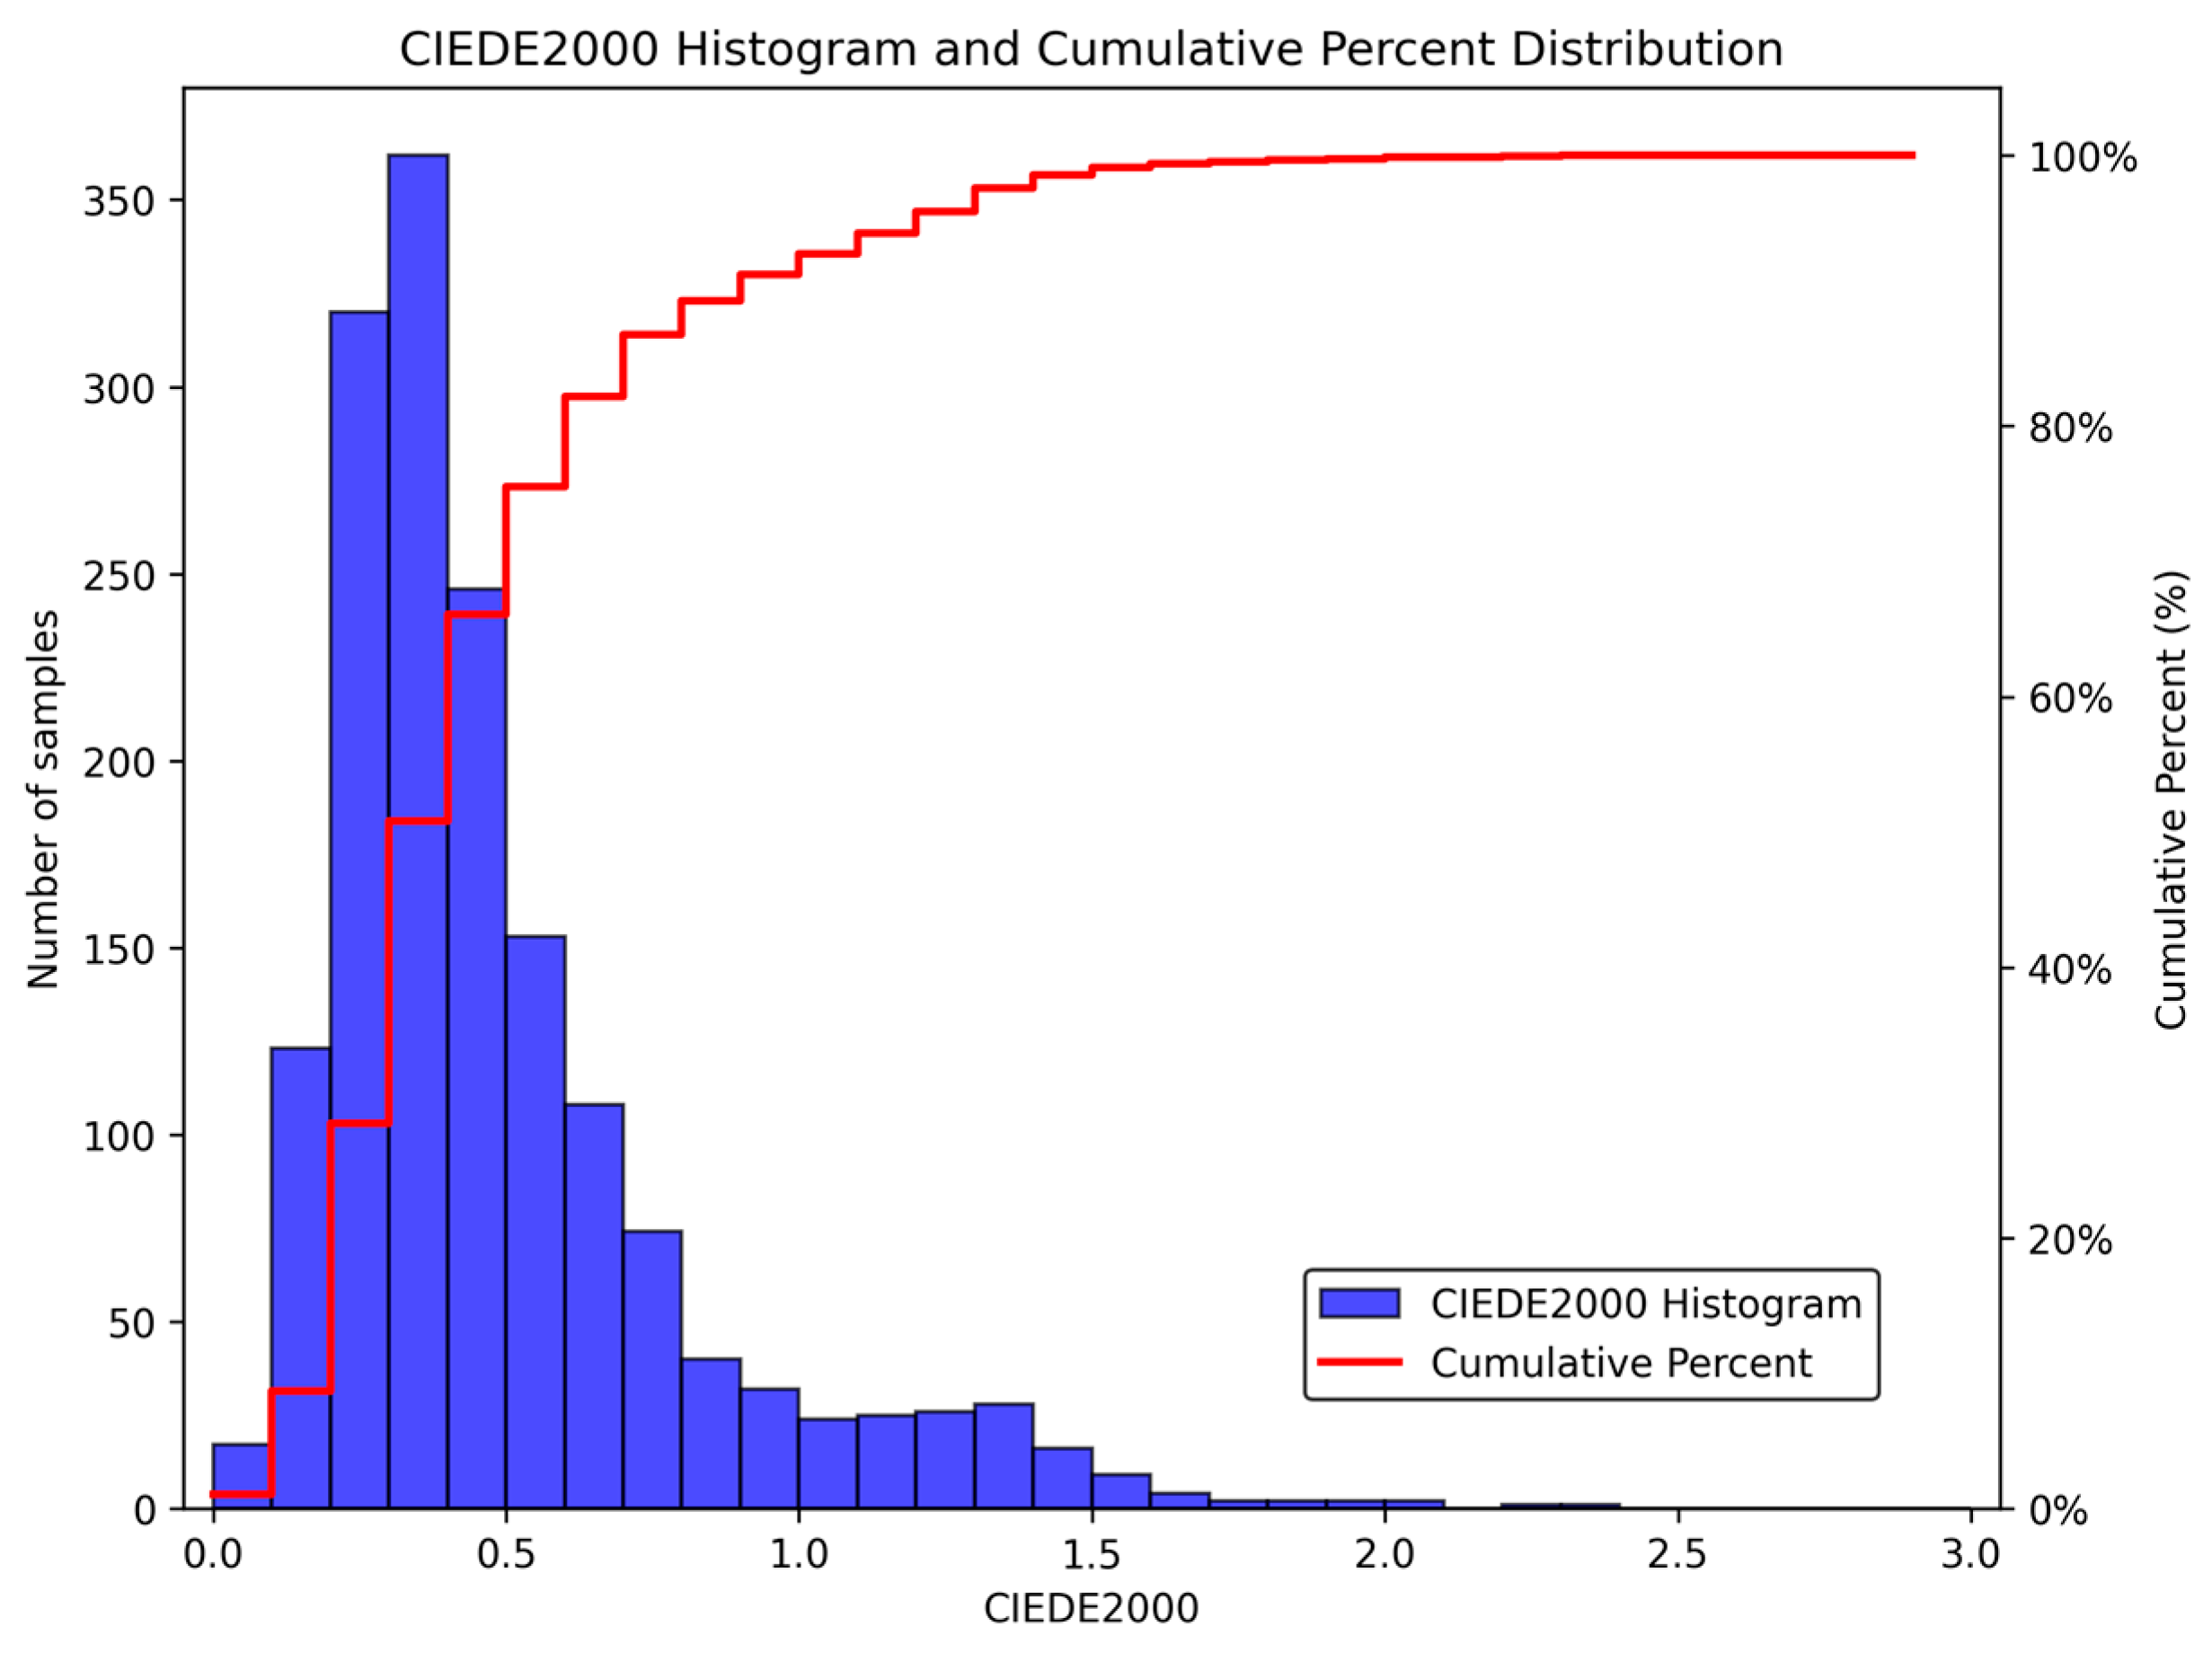
Figure 4 and Figure 5 illustrate the distribution of RMSE and values under the D50/2° condition. As shown in Figure 4, over 95% of the test samples exhibited RMSE values below 0.012, indicating a high degree of spectral agreement between predicted and measured reflectance curves. Similarly, Figure 5 shows that the vast majority of values remained within the perceptual limits, with only a few samples exceeding 1.5 NBS. These deviations remain well within acceptable limits for commercial color reproduction workflows, and addressing these minor outliers will be a focus of future work to further improve model precision.
Figure 4.
Distribution and cumulative histogram of RMSE values under D50/2° illumination.
Figure 5.
Distribution and cumulative histogram of CIEDE2000 values under D50/2° illumination.
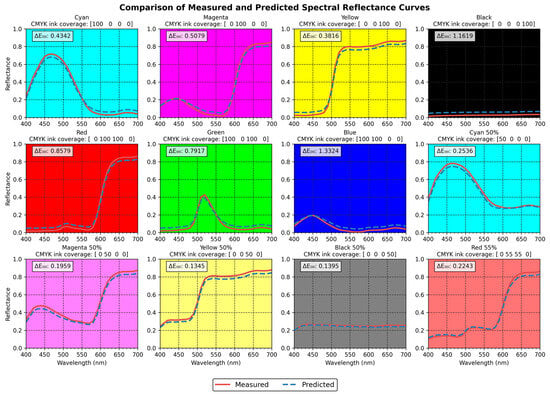
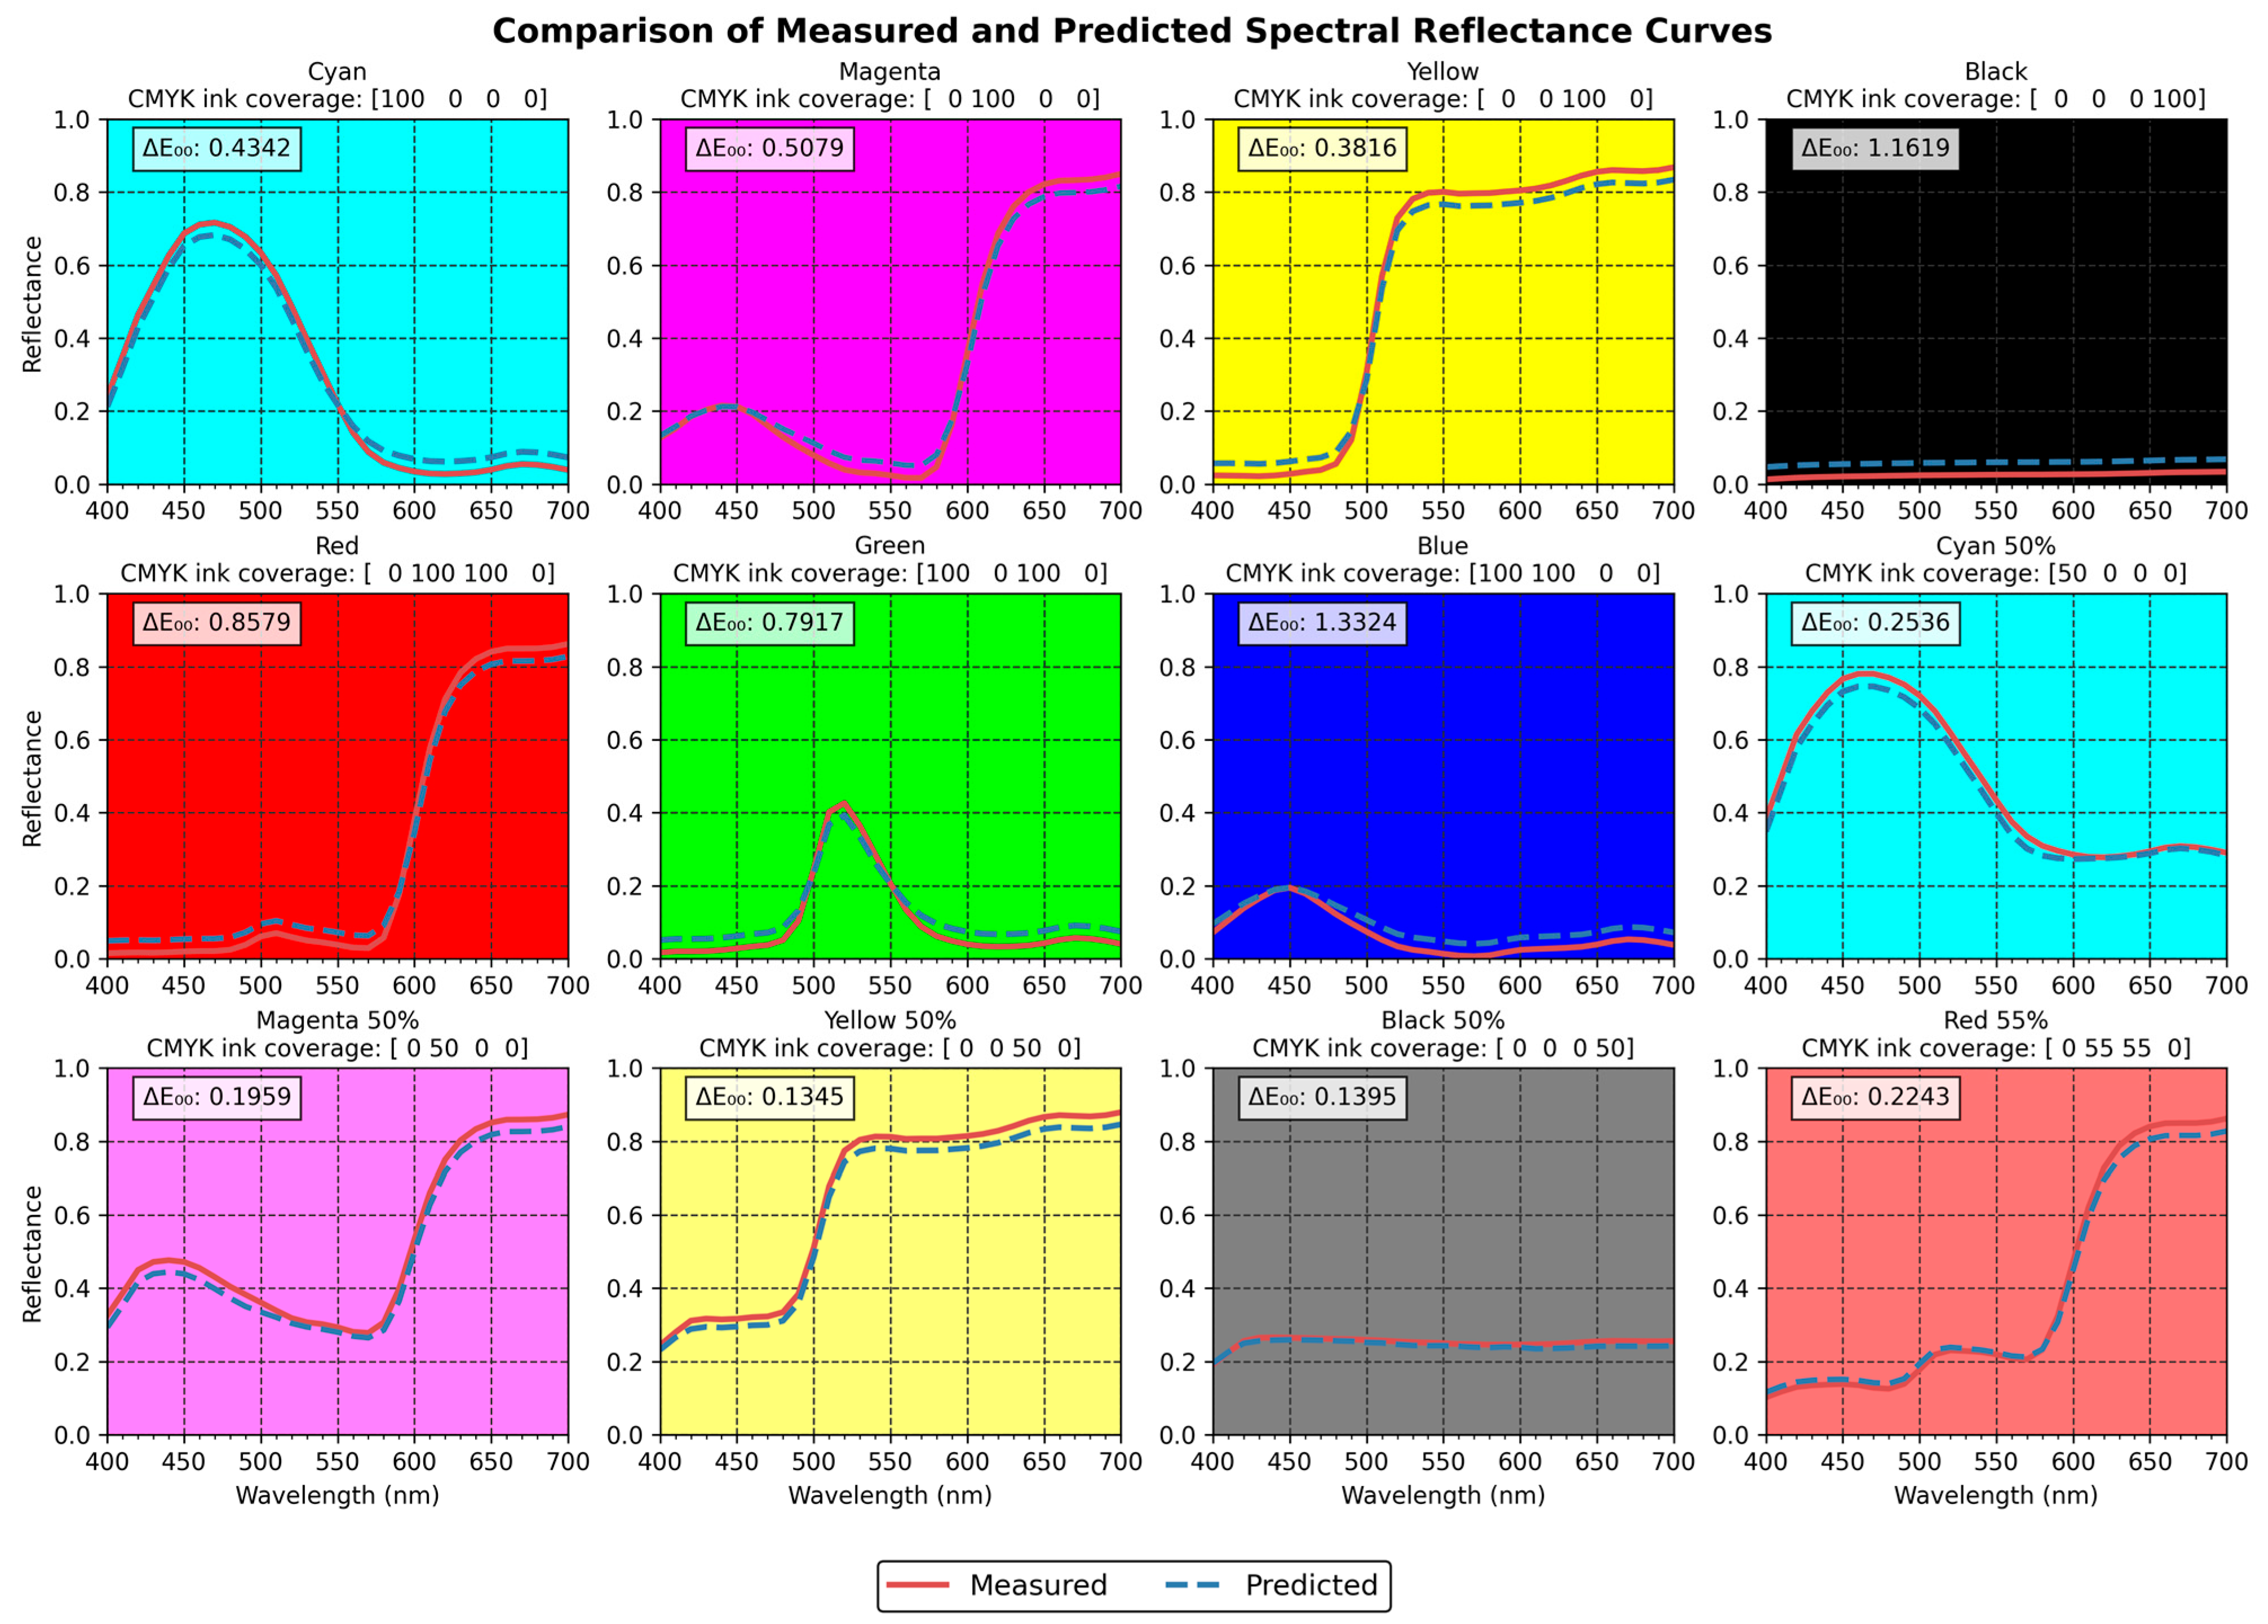
To visually validate the model’s spectral reconstruction quality, Figure 6 presents a comparison between the measured and predicted spectral reflectance curves for 12 representative color patches under the CIE D50/2° illuminant. These samples include primary colors (Cyan, Magenta, Yellow, Black), secondary colors (Red, Green, Blue), and five halftone combinations such as Cyan_50, Magenta_50, Yellow_50, Black_50, and Red_55. The specific CMYK configurations for these halftone combinations are as follows: Cyan_50 (50,0,0,0), Magenta_50 (0,50,0,0), Yellow_50 (0,0,50,0), Black_50 (0,0,0,50), and Red_55 (0,55,55,0).
Figure 6.
Comparison of measured and predicted spectral reflectance curves of 12 color patches.
In Figure 6, the red curves represent the measured spectra, while the blue curves correspond to SESP predictions. For all subplots, the reflectance axis is fixed to the range [0, 1] to ensure consistent visual comparison. Spectral reconstruction accuracy is assessed using the same metric adopted in the quantitative evaluation. The close alignment between the two curves confirms that the model accurately captures both macro-level spectral shape and micro-level spectral features across the entire visible spectrum. Notably, the model performs well in predicting high-saturation primaries and accurately reconstructing mid-tone and low-tone halftones. This confirms the SESP model’s ability to capture nonlinear effects such as ink overlap, dot gain, and substrate scattering, which are key challenges in halftone image spectral prediction.
4.4.2. Ablation Study of the SESP Model
To better understand performance differences among models and to clarify the role of ensemble learning, we analyze the behavior of individual regressors in relation to the characteristics of halftone spectral reconstruction. This task involves smooth substrate scattering, stochastic dot-level variations, and nonlinear multi-ink interactions, which impose heterogeneous modeling requirements that are not uniformly addressed by a single learning paradigm. Based on this consideration, the SESP model is compared with its constituent components (SVR, RF, XGBoost) under the same three illuminants. The corresponding results are presented in Table 3.
Table 3.
Comparative performance of individual regressors and the SESP model.
As shown in Table 3, none of the individual regressors consistently achieves optimal performance across all illuminants and metrics. SVR performs reliably for smooth nonlinear mappings, RF is more effective in capturing discrete and stochastic variations, and XGBoost exhibits advantages in modeling higher-order interactions. However, each model also shows inherent limitations when used in isolation. For example, under the D50/2° illuminant, the SESP model achieved a mean RMSE reduction of 15.6%, 20.1%, and 11.6%, and a mean reduction of 25.2%, 29.9%, and 16.1%, compared to SVR, RF, and XGBoost, respectively. These performance gaps highlight the complementary nature of the individual learners and motivate the use of an ensemble strategy to achieve more balanced and robust predictions.
To further investigate the contribution of each base learner, we conducted additional ablation studies by systematically removing one regressor at a time. The results are shown in Table 4. The ablation results reveal a consistent degradation in performance when any single regressor is excluded from the ensemble. Under D50/2°, RMSE increased by 10.5%, 7.9%, and 10.5%, while increased by 7.2%, 6.3%, and 7.8% when SVR, RF, and XGBoost were omitted, respectively. Similar trends are observed across the other illuminants, indicating that the contribution of each regressor is both stable and non-redundant.
Table 4.
Ablation study results for the SESP model under three standard illuminants.
Overall, these results suggest that the performance gains of SESP arise from the structured integration of complementary predictors rather than from increased model complexity alone. By aggregating diverse modeling behaviors through a stacking strategy, SESP captures the multi-scale nonlinear interactions inherent in printed halftone images more effectively than any individual regressor.
4.4.3. Comparison with Baseline Methods
Accuracy Evaluation
To comprehensively assess the effectiveness of the proposed SESP framework, we conducted quantitative comparisons against four representative baseline methods, including two classical physics-based models (Yule–Nielsen and Clapper–Yule) and two widely adopted data-driven approaches (ANN-BP and PCA-IPSO-DNN). The RMSE and values under three standard illuminants (A, D50, and D65) are summarized in Table 5.
Table 5.
Performance comparison of the SESP model and baseline methods.
As shown in Table 5, the SESP model consistently outperformed all baseline methods across all metrics and illuminants. Compared to the best-performing reference method (PCA-IPSO-DNN), SESP achieved relative reductions in RMSE and of 12.8% and 6.8% under illuminant A, 9.5% and 6.9% under D50, and 12.2% and 7.2% under D65, respectively. These results highlight the superior ability of SESP to model the intricate nonlinear and asymmetric relationships between CMYK halftone patterns and spectral reflectance.
A clear performance gap is also observed between data-driven approaches and classical physics-based models. While the Yule–Nielsen and Clapper–Yule formulations capture global light-ink interactions under simplifying assumptions, they are limited in modeling stochastic dot-level variations and higher-order nonlinear effects induced by halftone geometry and multi-ink overlap. The superior performance of learning-based methods, and in particular of the proposed ensemble framework, reflects the advantage of data-driven modeling in capturing these complex interactions beyond the scope of purely analytical formulations.
Statistical Significance Analysis
While the Yule–Nielsen and Clapper–Yule models produce deterministic outputs, the machine-learning-based methods (ANN-BP, PCA-IPSO-DNN, and SESP) involve stochastic training, introducing variance across runs. To ensure that SESP’s improvements are statistically significant rather than random, we conducted rigorous hypothesis testing. Each model was trained and evaluated using 5-fold cross-validation, repeated ten times under each illuminant (A, D50, and D65) with different random seeds. The resulting distributions of RMSE and values were analyzed using two-tailed paired t-tests. The corresponding p-values are reported in Table 6.
Table 6.
p-values from statistical significance tests comparing SESP with two data-driven baselines.
As observed in Table 6, all p-values are well below the conventional threshold (p < 0.05), confirming that the improvements achieved by SESP over both ANN-BP and PCA-IPSO-DNN are statistically significant across all illuminants. Consistent outcomes from non-parametric Wilcoxon signed-rank tests further reinforce the robustness of these findings. These results indicate that the improvements achieved by SESP over both ANN-BP and PCA-IPSO-DNN are statistically significant and reproducible.
It is worth noting that recent CNN-based spectral reconstruction methods have reported strong performance in pixel-level image-to-spectrum tasks by exploiting spatial context and large-scale pixel-registered datasets. In contrast, the present work focuses on patch-level CMYK-to-spectrum regression without spatial inputs, for which publicly available pixel-aligned halftone spectral datasets are currently lacking. This difference in problem formulation limits direct quantitative comparison with CNN-based approaches and is discussed as a future research direction in Section 6.
Beyond statistical significance, the observed accuracy gains are also practically meaningful. In industrial color reproduction, even modest reductions in can lead to visibly improved color consistency, reducing the need for iterative recalibration and test printing. Consequently, the improved accuracy of SESP has the potential to translate into tangible benefits in real-world printing workflows, including enhanced color stability, reduced material waste, and improved production efficiency.
Computational Efficiency and Scalability
To complement the accuracy evaluation, we further compared the training and inference efficiency of all methods. All models were implemented in Python 3.9 and executed on a Windows 10 system equipped with an Intel i7 CPU and 32 GB RAM. For fairness, all experiments were conducted under identical experimental settings using the IT8.7/5 (TC1617x) dataset. The results are summarized in Table 7.
Table 7.
Comparison of training and inference times of baseline methods and SESP.
As shown in Table 7, the SESP model requires 972 ms for training and 158 ms for inference. While slightly higher than the physics-based models, this is comparable to other advanced data-driven methods. The additional computational cost is primarily due to the ensemble integration of multiple regressors (SVR, RF, and XGBoost) within the stacking framework. In terms of model complexity, SESP consists of three base learners and a lightweight linear meta-learner. While SVR, RF, and XGBoost introduce different scaling behaviors, the overall complexity grows linearly with the number of base models, explaining the moderate runtime increase observed in practice.
Memory consumption is dominated by the storage of trained base models during training, while inference only requires loading these models without additional intermediate buffers. This memory footprint remains well within the capacity of standard color management systems. Moreover, training is typically performed offline in industrial workflows, making training time a non-critical factor. The architecture is inherently scalable, as base learners can be trained in parallel and the meta-learner introduces negligible overhead. Improved spectral accuracy can therefore be achieved without compromising practical deployment, ultimately reducing calibration cycles, test prints, and overall production costs.
In summary, the proposed SESP framework achieves statistically significant and practically meaningful improvements in spectral prediction accuracy, while maintaining computational efficiency and scalability suitable for industrial use. By balancing predictive precision with runtime performance, SESP establishes a robust, physics-aware, and industrially viable solution for multispectral reconstruction and high-fidelity color reproduction in modern printing applications.
5. Conclusions
This study proposes a novel Stacking Ensemble Spectral Prediction (SESP) framework for the multispectral reconstruction of printed halftone images. The SESP model employs a two-layer stacking architecture that integrates a diverse set of base regressors, including Support Vector Regression (SVR), Random Forest (RF), and eXtreme Gradient Boosting (XGBoost), with Ridge Regression serving as the meta-learner to optimally fuse predictive outputs. By leveraging the complementary strengths of these heterogeneous learners, the SESP model effectively captures both the symmetrical properties of halftone structures and the complex light scattering phenomena arising from substrate interactions.
Compared with classical physics-based models such as the Yule–Nielsen and Clapper–Yule formulations, the proposed SESP framework offers substantially greater modeling flexibility without relying on strong optical assumptions or manual parameter tuning. Experimental results consistently demonstrate notable reductions in both spectral reconstruction error (RMSE) and perceptual color difference (CIEDE2000). These findings indicate that data-driven ensemble learning can effectively complement traditional physical modeling approaches for multispectral prediction and achieve superior performance under controlled printing conditions.
Furthermore, the results highlight the importance of model diversity in improving robustness and generalization. By jointly modeling smooth nonlinear trends, localized variations, and residual interactions within a unified ensemble, SESP achieves stable performance across different illuminants and evaluation metrics. These characteristics make the proposed framework well suited for practical color management applications, including spectral calibration, ICC profile generation, and digital proofing, and underscore the potential of physics-aware ensemble learning in modern printing systems.
6. Discussion and Future Work
The experimental evaluation in this study is conducted using a standardized IT8.7/5 test chart printed on a coated substrate with a single offset printing system. Such controlled experimental conditions are commonly adopted in printing color science to ensure reproducibility and to isolate modeling performance from uncontrolled physical variability. The resulting constraints on material and process diversity therefore reflect a broader field-wide limitation rather than a shortcoming specific to this work. Previous studies on CMYK-to-spectral reconstruction have consistently reported limited cross-system generalizability due to substrate-dependent scattering behavior, ink penetration effects, and process-specific dot gain characteristics. In addition, large-scale, publicly available CMYK-spectral datasets remain scarce, as spectral acquisition is costly and difficult to standardize. Within this context, the experimental design adopted here enables meaningful benchmarking while allowing the performance gains of the proposed ensemble strategy to be clearly attributed.
As a data-driven method, SESP shares a common dependency with other learning-based spectral predictors on the representativeness of the training data. Substantial variations in substrates, ink sets, screening strategies, or environmental conditions may lead to performance degradation if these factors are not sufficiently covered during training. In practical printing workflows, however, spectral calibration and model retraining are routinely performed whenever production conditions change, making this requirement consistent with existing industrial practice. Although stacking ensembles introduce additional computational cost during training, this cost is incurred offline and can be effectively managed within standard color management pipelines, while inference complexity remains moderate and comparable to that of conventional spectral profiling approaches.
Recent advances in spectral reconstruction increasingly explore convolutional and transformer-based architectures, particularly for pixel-level tasks that benefit from rich spatial context and large-scale datasets. In contrast, the present study addresses patch-level CMYK-to-spectral regression based on ink coverage descriptors, where explicit spatial information is unavailable and dataset sizes are typically limited. Under these conditions, the inductive biases of deep spatial models are not naturally aligned with the problem formulation, and their data efficiency and interpretability may be constrained. The SESP framework is therefore intentionally designed as a lightweight and interpretable ensemble approach that achieves strong generalization without reliance on spatial priors, aligning well with established printing and color modeling practices.
Several directions may be explored to extend the present work. The development of pixel-aligned CMYK-spectral datasets using hyperspectral imaging systems would enable the incorporation of spatial predictors as additional base learners within the stacking framework. Physics-guided priors, such as spectral smoothness constraints or physically meaningful feature representations, may further enhance robustness and interpretability. Moreover, adaptive or uncertainty-aware fusion strategies could improve performance under domain shifts. Beyond printed halftone reconstruction, the stacking paradigm underlying SESP represents a general strategy for fusing complementary predictors and may be applicable to other multispectral estimation problems, including dynamic or multimodal scenarios, which constitute promising avenues for future research.
Author Contributions
Conceptualization and methodology, L.Z. and D.T.; formal analysis, L.Z. and J.G.; supervision, J.G. and J.Y.; data curation, D.T.; writing—original draft preparation, L.Z. and D.T.; writing—review and editing, L.Z., J.G. and J.Y. All authors have read and agreed to the published version of the manuscript.
Funding
This research is supported by the Explorer Program of Shanghai (No. 24TS1412400).
Data Availability Statement
The data presented in this study are available on request from the first author.
Conflicts of Interest
The authors declare no conflicts of interest.
References
- Ibraheem, N.A.; Hasan, M.M.; Khan, R.Z.; Mishra, P.K. Understanding color models: A review. ARPN J. Sci. Technol. 2012, 2, 265–275. [Google Scholar]
- Pjanic, P.; Hersch, R.D. Color changing effects with anisotropic halftone prints on metal. ACM Trans. Graph. 2015, 34, 1–12. [Google Scholar] [CrossRef] [Scilit]
- Roetling, P.G.; Loce, R.P. Digital halftoning. In Digital Image Processing Methods; CRC Press: Boca Raton, FL, USA, 2020; pp. 363–414. [Google Scholar]
- Arney, J.S.; Yamaguchi, S. Symmetry properties of halftone images I: Scattering symmetry and pattern symmetry. J. Imaging Sci. Technol. 1999, 43, 353–358. [Google Scholar] [CrossRef] [Scilit]
- Arney, J.S.; Tsujita, A. Symmetry properties of halftone images II: Accounting for ink opacity and dot sharpness. J. Imaging Sci. Technol. 1999, 43, 359–364. [Google Scholar] [CrossRef] [Scilit]
- Hersch, R.D.; Singla, A.K. An ink spreading model for dot-on-dot spectral prediction. In Color and Imaging Conference; Society of Imaging Science and Technology: Springfield, VA, USA, 2006; Volume 14, pp. 38–43. [Google Scholar]
- Hersch, R.; Brichon, M.; Bugnon, T.; Hébert, M. Deducing ink spreading curves from reflection spectra acquired within printed color images. J. Imaging Sci. Technol. 2009, 53, 030502–030507. [Google Scholar] [CrossRef] [Scilit]
- Rolleston, R.; Balasubramanian, R. Accuracy of various types of Neugebauer model. In Color and Imaging Conference; Society of Imaging Science and Technology: Springfield, VA, USA, 1993; Volume 1, pp. 32–37. [Google Scholar]
- Bugnon, T.; Hersch, R.D. Recovering neugebauer colorant reflectances and Ink-spreading curves from printed color images. Color Res. Appl. 2014, 39, 216–233. [Google Scholar] [CrossRef] [Scilit]
- Hersch, R.D. Spectral Neugebauer-based color halftone prediction model accounting for paper fluorescence. Appl. Opt. 2014, 53, 5380–5390. [Google Scholar] [CrossRef] [Scilit] [PubMed]
- Arney, J.; Arney, C.D.; Engeldrum, P.G. Modeling the Yule–Nielsen halftone effect. J. Imaging Sci. Technol. 1996, 40, 233–238. [Google Scholar] [CrossRef] [Scilit]
- Rossier, R.; Hersch, R.D. Calibrating the ink spreading curves enhanced Yule-Nielsen modified spectral Neugebauer model with the two-by-two dot centering printer model. In Color Imaging XIV: Displaying, Processing, Hardcopy, and Applications; SPIE: Philadelphia, PA, USA, 2009; Volume 7241, pp. 367–376. [Google Scholar]
- Rossier, R.; Hersch, R. Ink-dependent n-factors for the Yule-Nielsen modified spectral Neugebauer model. In Conference on Colour in Graphics, Imaging, and Vision; Society of Imaging Science and Technology: Springfield, VA, USA, 2010; pp. 202–210. [Google Scholar]
- Mourad, S.; Emmel, P.; Simon, K.; Hersch, R.D. Extending Kubelka-Munk’s theory with lateral light scattering. In NIP & Digital Fabrication Conference; Society of Imaging Science and Technology: Springfield, VA, USA, 2001; Volume 2, pp. 469–473. [Google Scholar]
- Yang, L.; Kruse, B. Revised kubelka–munk theory. i. theory and application. J. Opt. Soc. Am. A 2004, 21, 1933–1941. [Google Scholar] [CrossRef] [Scilit]
- Abebe, M.; Gerhardt, J.; Hardeberg, J.Y. Kubelka-Munk theory for efficient spectral printer modeling. In Color Imaging XVI: Displaying, Processing, Hardcopy, and Applications; SPIE: Philadelphia, PA, USA, 2011; Volume 7866, pp. 333–347. [Google Scholar]
- Rogers, G. A generalized Clapper–Yule model of halftone reflectance. Color Res. Appl. 2000, 25, 402–407. [Google Scholar] [CrossRef]
- Hébert, M.; Hersch, R.D. Extending the Clapper–Yule model to rough printing supports. J. Opt. Soc. Am. A 2005, 22, 1952–1967. [Google Scholar] [CrossRef] [Scilit] [PubMed]
- Shore, J.D.; Spoonhower, J. Reflection density in photographic color prints: Generalizations of the Williams–Clapper transform. J. Imaging Sci. Technol. 2001, 45, 484–488. [Google Scholar] [CrossRef] [Scilit]
- Simonot, L.; Hébert, M.; Hersch, R.D. Extension of the Williams–Clapper model to stacked nondiffusing colored coatings with different refractive indices. J. Opt. Soc. Am. A 2006, 23, 1432–1441. [Google Scholar] [CrossRef] [Scilit]
- Babaei, V.; Hersch, R.D. Yule-Nielsen based multi-angle reflectance prediction of metallic halftones. In Color Imaging XX: Displaying, Processing, Hardcopy, and Applications; SPIE: Philadelphia, PA, USA, 2015; Volume 9395, pp. 133–142. [Google Scholar]
- Liu, Q.; Wan, X.; Xie, D. Optimization of spectral printer modeling based on a modified cellular Yule–Nielsen spectral Neugebauer model. J. Opt. Soc. Am. A 2014, 31, 1284–1294. [Google Scholar] [CrossRef] [Scilit]
- Lu, S.; Wang, Q.; Yang, P.; Zhang, W. Research on digital printing color prediction model based on PSO-BP neural network. In Advances in Graphic Communication, Printing and Packaging: Proceedings of 2018 9th China Academic Conference on Printing and Packaging; Springer: Singapore, 2019; pp. 37–43. [Google Scholar]
- Tian, D.; Qiao, J.; Ge, J.; Su, N. Spectral Color Prediction based on Neugebauer Primary Colors and Improved PSO-DNN Model. J. Imaging Sci. Technol. 2025, 69, 1–9. [Google Scholar] [CrossRef] [Scilit]
- Arney, J.; Engeldrum, P.; Zeng, H. An expanded Murray-Davies model of tone reproduction in halftone imaging. J. Imaging Sci. Technol. 1995, 39, 502–508. [Google Scholar]
- Rossier, R.; Bugnon, T.; Hersch, R. Introducing ink spreading within the cellular Yule-Nielsen modified Neugebauer model. In Color and Imaging Conference; Society of Imaging Science and Technology: Springfield, VA, USA, 2010; pp. 295–300. [Google Scholar]
- Urban, P.; Rosen, M.R. Inverting the Cellular Yule-Nielsen modified Spectral Neugebauer Model. In Proceedings of the Ninth International Symposium on Multispectral Color Science and Application, Taipei, Taiwan, 30 May–1 June 2007; pp. 29–35. [Google Scholar]
- Balasubramanian, R. Reducing the cost of lookup table based color transformations. In Color and Imaging Conference; Society of Imaging Science and Technology: Springfield, VA, USA, 1999; Volume 7, pp. 65–68. [Google Scholar]
- Huang, Y.-H.; Chung, K.-L.; Dai, B.-R. Improved inverse halftoning using vector and texture-lookup table-based learning approach. Expert Syst. Appl. 2011, 38, 15573–15581. [Google Scholar] [CrossRef] [Scilit]
- Massy, W.F. Principal components regression in exploratory statistical research. J. Am. Stat. Assoc. 1965, 60, 234–256. [Google Scholar] [CrossRef]
- Garthwaite, P.H. An interpretation of partial least squares. J. Am. Stat. Assoc. 1994, 89, 122–127. [Google Scholar] [CrossRef]
- Smola, A.J.; Schölkopf, B. A tutorial on support vector regression. Stat. Comput. 2004, 14, 199–222. [Google Scholar] [CrossRef] [Scilit]
- Akanuma, A.; Stamate, D.; Bishop, J.M. Predicting colour reflectance with gradient boosting and deep learning. In IFIP International Conference on Artificial Intelligence Applications and Innovations; Springer Nature: Cham, Switzerland, 2023; pp. 149–160. [Google Scholar]
- Yu, H.-q.; Liu, Z.; Tian, Q.-h. A spectral prediction model of printer based on RBF neural network. Imaging Sci. Photochem 2015, 33, 238–243. [Google Scholar]
- Moon, J.; Yang, G.; Tae, H. A study on DNN-based practical model for predicting spot color. Appl. Sci. 2023, 13, 13100. [Google Scholar] [CrossRef] [Scilit]
- Fan, D.; Zhan, H.; Xu, F.; Zou, Y.; Zhang, Y. Research on multi-channel spectral prediction model for printed matter based on HMSSA-BP neural network. IEEE Access 2024, 13, 2340–2359. [Google Scholar] [CrossRef] [Scilit]
- Divina, F.; Gilson, A.; Goméz-Vela, F.; García Torres, M.; Torres, J.F.J.E. Stacking ensemble learning for short-term electricity consumption forecasting. Energies 2018, 11, 949. [Google Scholar] [CrossRef] [Scilit]
- Sultan, S.Q.; Javaid, N.; Alrajeh, N.; Aslam, M. Machine learning-based stacking ensemble model for prediction of heart disease with explainable ai and k-fold cross-validation: A symmetric approach. Symmetry 2025, 17, 185. [Google Scholar] [CrossRef] [Scilit]
- Breiman, L. Random forests. Mach. Learn. 2001, 45, 5–32. [Google Scholar] [CrossRef] [Scilit]
- Chen, T.; Guestrin, C. Xgboost: A scalable tree boosting system. In Proceedings of the 22nd ACM SIGKDD International Conference on Knowledge Discovery and Data Mining, San Francisco, CA, USA, 13–17 August 2016; pp. 785–794. [Google Scholar]
- McDonald, G.C. Ridge regression. Wiley Interdiscip. Rev. Comp. Stat. 2009, 1, 93–100. [Google Scholar] [CrossRef] [Scilit]
- Hersch, R.D. Demichel equations. In Encyclopedia of Color Science and Technology; Springer: New York, NY, USA, 2016; pp. 572–575. [Google Scholar]
- Luo, M.R.; Cui, G.; Rigg, B. The development of the CIE 2000 colour-difference formula: CIEDE2000. Color Res. Appl. 2001, 26, 340–350. [Google Scholar] [CrossRef] [Scilit]
- Perlich, C.; Świrszcz, G. On cross-validation and stacking: Building seemingly predictive models on random data. ACM SIGKDD Explor. Newsl. 2011, 12, 11–15. [Google Scholar] [CrossRef] [Scilit]
- Trapeznikova, O. Printing quality control automation. J. Phys. Conf. Ser. 2018, 998, 012038. [Google Scholar] [CrossRef] [Scilit]
- Robertson, A.R. The CIE 1976 color-difference formulae. Color Res. Appl. 1977, 2, 7–11. [Google Scholar] [CrossRef] [Scilit]

Disclaimer/Publisher’s Note: The statements, opinions and data contained in all publications are solely those of the individual author(s) and contributor(s) and not of MDPI and/or the editor(s). MDPI and/or the editor(s) disclaim responsibility for any injury to people or property resulting from any ideas, methods, instructions or products referred to in the content. |
© 2026 by the authors. Licensee MDPI, Basel, Switzerland. This article is an open access article distributed under the terms and conditions of the Creative Commons Attribution (CC BY) license.