


Abstract
We compared the effects of anthocyanin loading on the tensile properties and color response of chitosan/sodium alginate (CS/SA) composite films and used molecular dynamics simulations to examine local contacts between a representative pigment and the polysaccharide matrix. Among the six formulations containing 0–5 mL of extract, the 2 mL group had the highest recorded tensile strength (9.57 MPa) and extension at break (3.77 mm), 45.66% and 95.34% above the 0 mL group, respectively. In models M0–M5, which represented relative pigment counts, M2 had the highest short range peaks in the CS–SA and anthocyanin–matrix radial distribution functions (1.547 and 3.875, respectively) and the highest target hydrogen bond count per pigment molecule (2.49 ± 0.31) over the analysis window. M4 had the highest component binding energy per pigment molecule (486.39 ± 5.69 kcal mol−1), giving a different ranking from the tensile measurements. In the chicken packaging test at 4 °C, the 2 mL group showed the largest color difference at every measured time point from 48 to 120 h, reaching 31.1 at 120 h. Among the formulations tested, the 2 mL group combined the highest recorded tensile values with the largest color differences in the middle and late stages of storage.
1. Introduction
Chitosan and sodium alginate are widely available film-forming polymers commonly used in biodegradable food packaging films. Amino and hydroxyl groups on chitosan chains and carboxylate and hydroxyl groups on sodium alginate chains provide sites for electrostatic association and hydrogen bonding between components [1]. Blending these polysaccharides can modify film structure, while mechanical performance still depends on associations between chains and the distribution of components [2]. Adding natural active components to a CS/SA matrix can further alter contacts and arrangements among polar sites [3]. As functional films incorporate multiple active or responsive components [4], maintaining structural stability has become a formulation challenge [5]. Indicator films must retain their shape and withstand tensile deformation during handling. Understanding how pigments interact with the polysaccharide network can help preserve sufficient contact between chains and limit losses in mechanical performance when adding an indicator.
The chromophoric structures of anthocyanins change with the pH of their environment, enabling visual indication of food freshness [6]. Their hydroxyl groups can participate in noncovalent interactions in polysaccharide matrices, so pigment addition affects both color response and film structure. The relationship between pigment content and mechanical performance can be nonlinear [7]. In CS/SA films containing coffee peel anthocyanins, higher tensile performance was observed at a suitable loading. Work on films containing grape skin anthocyanins showed that the environment of the film-forming solution can change interactions between components and affect material properties [8]. Studies of polysaccharide films containing black goji anthocyanins [9], bilayer CS/SA indicator films [10], and roselle anthocyanin films [11] show that natural colorants can be immobilized in different polymer matrices for quality monitoring. Their structural effects depend on the formulation.
Pigment incorporation can create new contacts between components and alter the arrangement of existing polymer chains. The molecular structure and protonation state of anthocyanins and the conditions of film formation influence compatibility and the types of interaction [12]. The spatial arrangement of components also affects mechanical and indicator performance [13]. Related studies have examined pigment sources and matrix structure [14], the structure and function of packaging responsive to pH, methods for immobilizing natural colorants [15], and material stability during food freshness monitoring [16]. For a given polysaccharide formulation, pigment loading and macroscopic film strength alone offer limited insight into whether performance changes arise mainly from new pigment associations or from redistribution of existing associations between chains. Distinguishing these effects can help explain why reinforcement does not continue with increasing loading and provide a structural basis for selecting an appropriate range.
Molecular dynamics simulations describe local arrangements and interactions at selected atomic sites. In starch/glycerol systems, hydrogen bond energies have been compared with the properties of thermoplastic starch films [17]. In protein/sodium alginate films, analyses of intermolecular interactions have been combined with experimental measurements to examine reinforcement by additives [18]. Local structural descriptors are also used to study macroscopic properties in multiscale polymer modeling [19]. Simulations of condensed phases provide a methodological basis for analyzing molecular conformations and relaxation [20].
Experimental and simulation studies of anthocyanin composites have examined stabilization of anthocyanins by sodium alginate [21] and pigment immobilization and interactions between components in composite films [22]. Work on methylcellulose/chitosan nanofiber films has also examined the relationship between compatibility and physical properties [23]. These studies motivate the analysis of pigment–matrix contacts at the molecular scale. Here, we use radial distribution functions (RDFs), target hydrogen bond counts, and potential energy differences between frozen components to describe short range spatial distributions, donor–acceptor pairs in a specified direction, and the potential energy difference for defined component groups. These measures allow us to compare the effect of increasing pigment count with changes in participation per pigment molecule.
We compare the tensile records for formulations containing 0–5 mL of extract and use models M0–M5 to represent relative pigment loadings in a matrix of fixed composition. Density, cross RDFs, target hydrogen bonds, and potential energy differences between frozen components describe periodic cell packing, short range distributions of selected atom pairs, directional pairing, and component energetics, respectively. The experimental formulations and the models are matched by order of addition, and the groups are ranked separately for each measure.
We also compare the visible colors and color differences of films during chicken storage at 4 °C. The simulations describe local structure at a fixed chemical state, while the packaging tests characterize the color response during storage.
2. Materials and Molecular Dynamics Simulation Methods
2.1. Experimental Materials and Formulations
Chitosan (CS) and sodium alginate (SA) were of superior grade, and glycerol and absolute ethanol were of analytical grade. All were purchased from RHAWN (Shanghai Yien Chemical Technology Co., Ltd., Shanghai, China). The matrix comprised 1.8 g of CS and 0.2 g of SA at a dry mass ratio of 9:1. CS and SA accounted for 90% and 10%, respectively, of the combined dry polysaccharide mass of 2.0 g. Glycerol and pigment solids were excluded from these proportions. The packaging color response test used anthocyanins derived from grape skins.
A 1.8 g portion of CS was added to 90 mL of 2% (v/v) aqueous acetic acid and stirred at 500 rpm for 60 min at 25 °C. Separately, 0.2 g of SA was dissolved in 10 mL of distilled water under the same conditions. The SA solution was added dropwise to the CS solution under continuous stirring. Then, 2 mL of glycerol was added, and stirring continued for 30 min. Both polysaccharide stock solutions had a mass per volume concentration of 2% (2 g per 100 mL). The glycerol loading was 1.0 mL g−1 of dry polysaccharides. The tensile comparison and the chicken packaging test both included six groups with extract additions of 0, 1, 2, 3, 4, and 5 mL. Equation (1) defines the mass ratio of anthocyanin to dry polysaccharides.
In Equation (1), is the mass concentration of anthocyanin in the extract (g mL−1), is the volume of extract added (mL), and and are the dry masses of the two polysaccharides (g). The anthocyanin mass is calculated from the mass concentration and extract volume and divided by the total dry polysaccharide mass to obtain . The ratio is expressed as a percentage of dry polysaccharide mass. A mass fraction relative to all film solids would use a different denominator, as this calculation excludes glycerol and other extract solids. The experimental groups are defined by the volume of extract actually added.
After the anthocyanin extract was added, the mixture was stirred at 800 rpm for 15 min and cast in Petri dishes. The film preparation records list two drying procedures. One consisted of air drying at room temperature for 48 h. The other consisted of drying at 35 °C for 5 h followed by air drying at room temperature for 24 h. The films were peeled and cut into 4 cm × 4 cm pieces for the packaging test.
Tensile strength was calculated by dividing the maximum load by the initial cross sectional area. Percentage elongation at break was calculated as the ratio of the extension at break to the initial gauge length, expressed as a percentage. These definitions follow ASTM D882 [24] and are given in Equations (2) and (3), respectively. Here, is the maximum load (N), b is the initial width (mm), h is the initial thickness (mm), is the change in length at break (mm), and is the initial gauge length (mm). N mm−2 is equivalent to MPa. The mechanical comparison uses the original extension at break in mm and distinguishes it from percentage elongation at break.
2.2. Construction of Molecular Models and Force Field Parameters
Six models (M0–M5) were constructed with three dimensional periodic boundaries (See Table 1 for the specific parameters). The matrix was identical in all models and contained nine neutral CS chains (C120H222N20O81 per chain, corresponding stoichiometrically to 20 deacetylated repeat units), two SA chains (C48H58O49Na8 per polysaccharide anion with eight Na+ ions, corresponding stoichiometrically to eight repeat units), and 439 glycerol molecules (C3H8O3). Each cell contained 16 Na+ ions and no explicit water molecules. The chain lengths and charge states were specified as part of the model setup.
Table 1.
Modeling and Analysis Parameters in Materials Studio 2020.
The pigment was represented by the fixed cation topology C43H49O23+ saved in the project files. Models M0–M5 contained 0, 1, 2, 3, 4, and 5 pigment cations, respectively, with an equal number of acetate counterions (C2H3O2−). Each pigment cation contained 115 atoms and each acetate ion contained seven atoms. The common matrix contained 10,459 atoms. The total atom counts were 10,459, 10,581, 10,703, 10,825, 10,947, and 11,069. This fixed topology represented the pigment component of the extract. The extract composition and the proportions of its chemical forms were unmeasured.
The models with pigment were deliberately assigned one to five whole pigment molecules to create a series of relative integer loadings. M0–M5 were used to compare local structures at the specified model compositions. Equations (4)–(6) define the relationship between the experimental dry basis mass ratio, the expected occupancy of a periodic cell, and the integer number of molecules placed in the cell.
In these equations, is the experimental mass ratio of anthocyanin to dry polysaccharides, equal to the percentage in Equation (1) divided by 100. Here, is the total polysaccharide mass in the periodic cell, is the molar mass of the model anthocyanin, is the Avogadro constant, is the integer number of pigment molecules placed in the cell, and is the scaling factor for pigment loading. For a common matrix and a constant extract concentration, the expected occupancy is proportional to the extract volume. The one to five pigment molecules used here were specified as a relative loading series. These equations define the conversion, while quantitative agreement between absolute experimental and model compositions remains unestablished.
M0–M5 denote the relative loading models, and 0–5 mL denote the experimental groups. The groups are matched by order of addition. The integer molecule counts describe the relative loadings of the models, and the absolute anthocyanin concentration in the extract cannot be inferred from those counts.
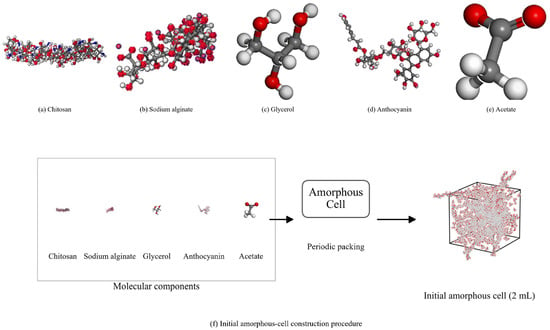
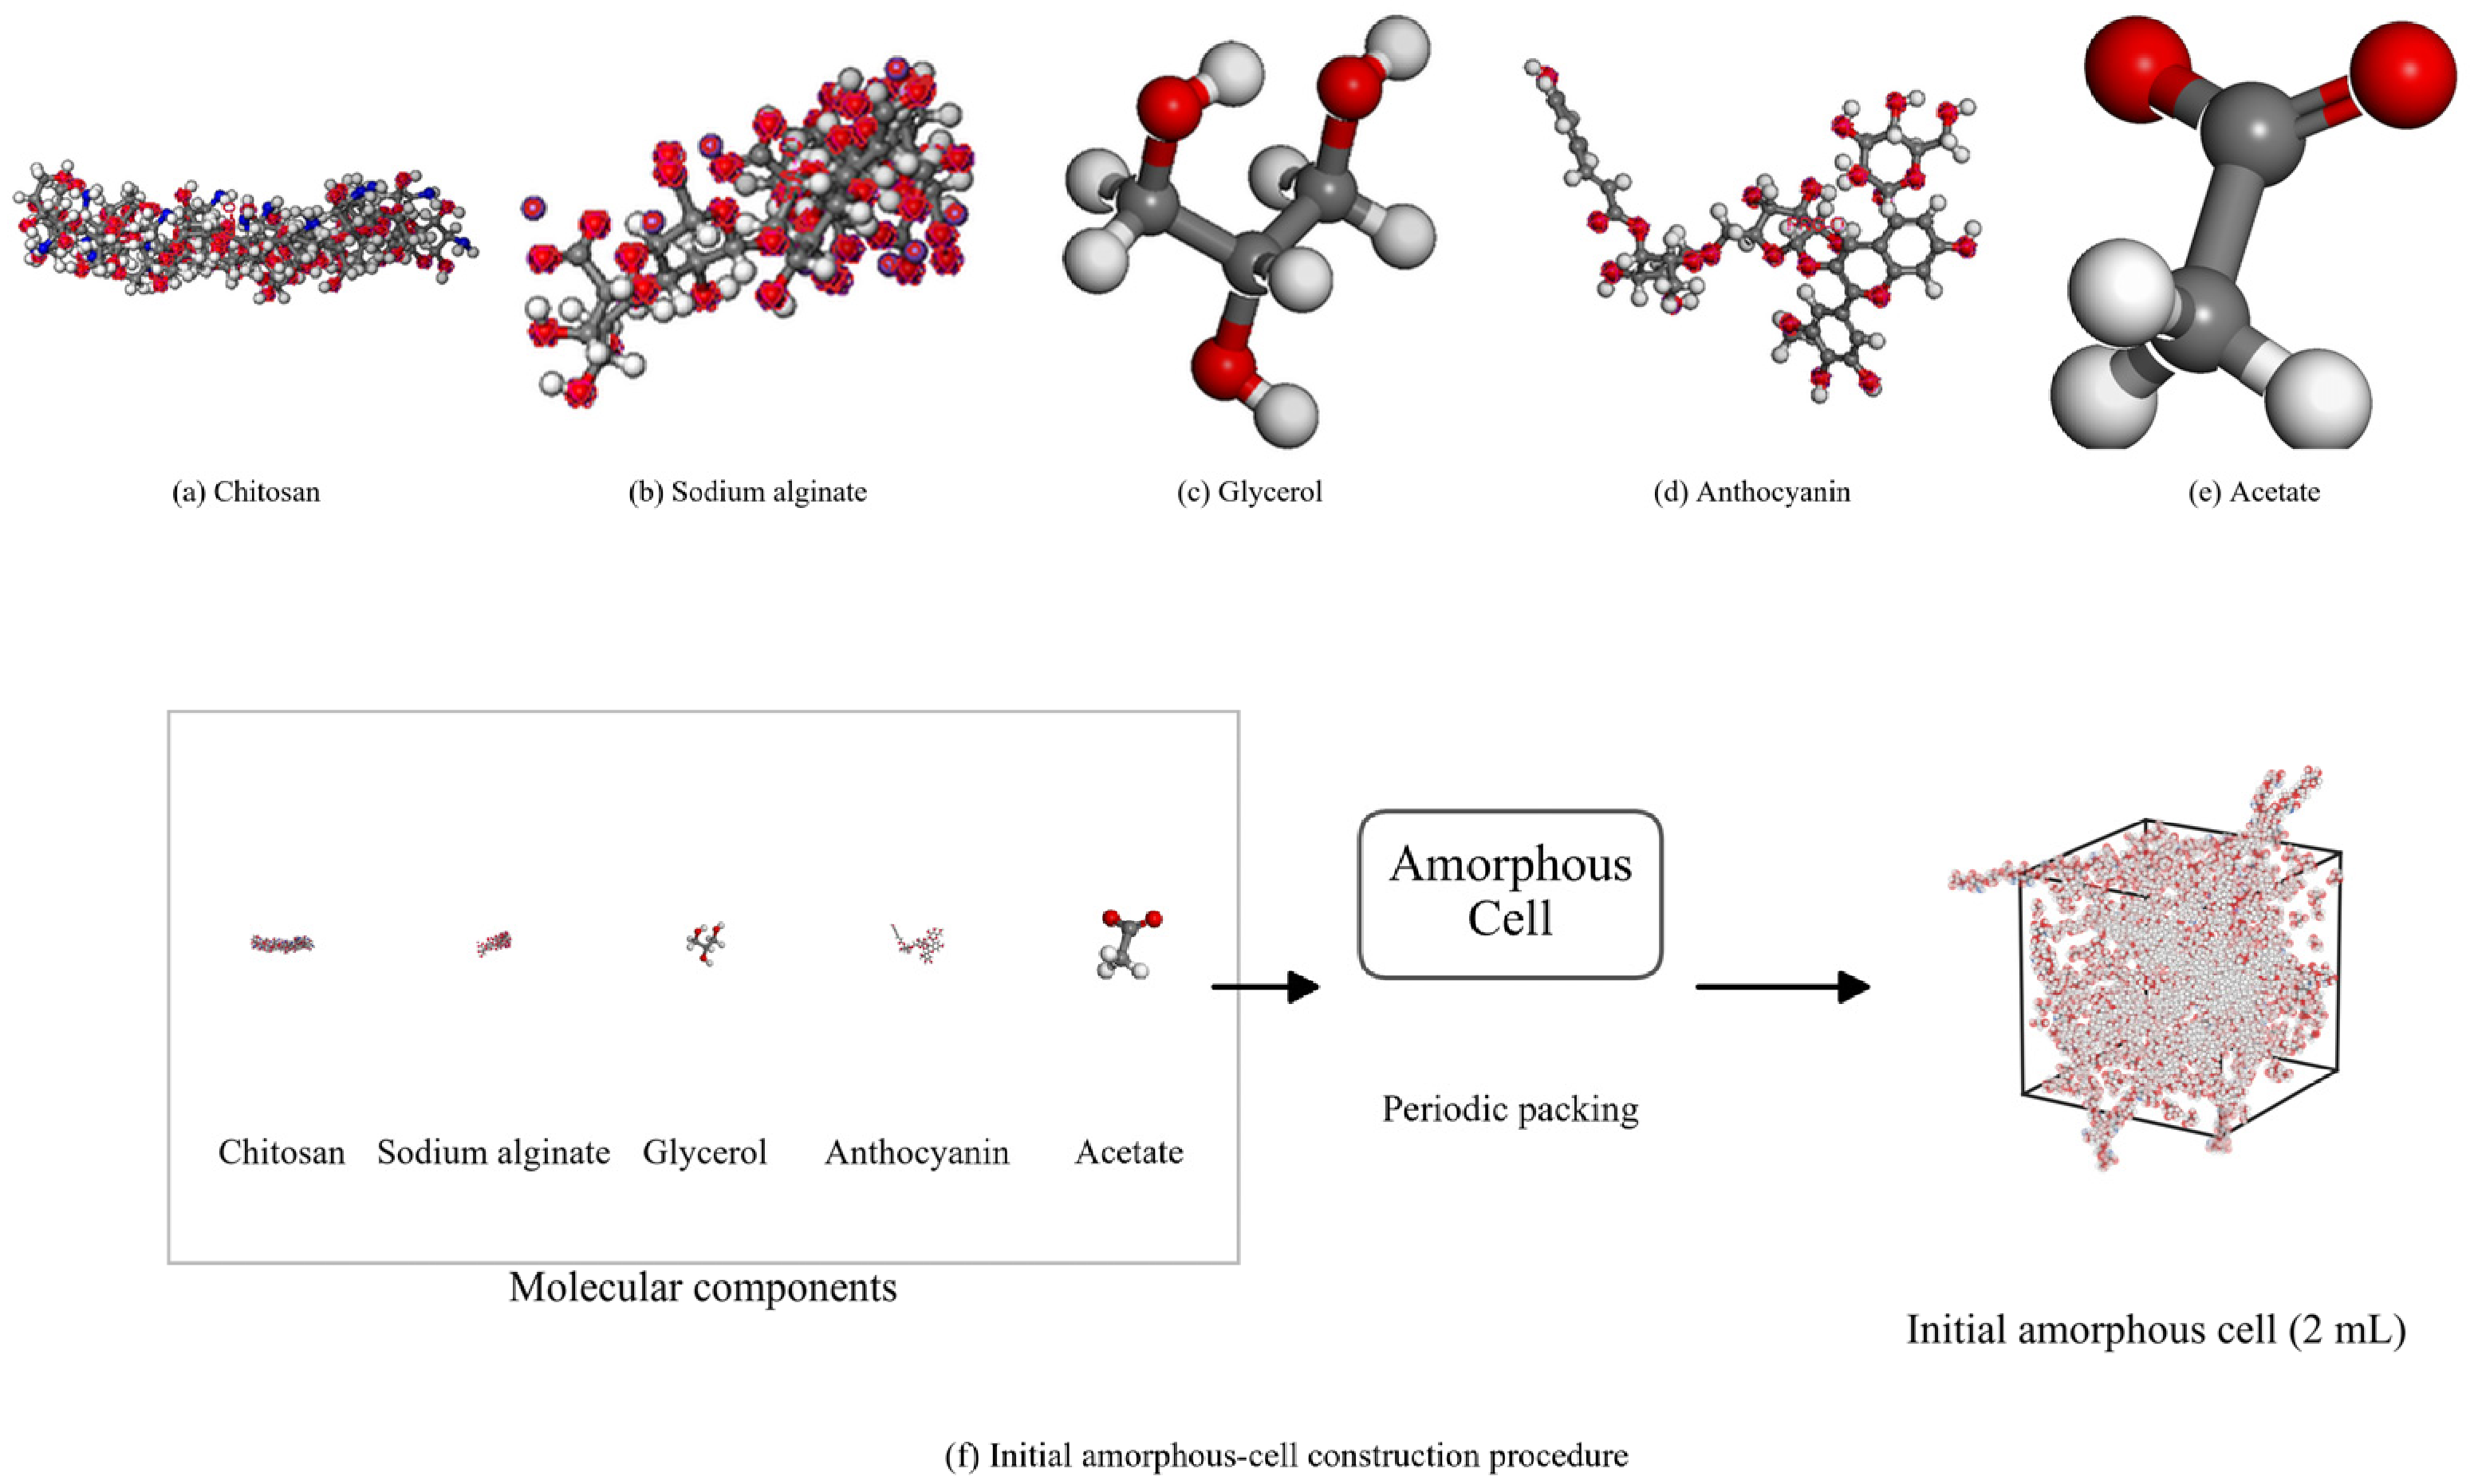
Three dimensional periodic amorphous cells were constructed in the Amorphous Cell module of BIOVIA Materials Studio 2020 at an initial packing density of 0.4 g cm−3. The method for constructing periodic polymer models is described in Reference [25]. Figure 1 shows the component structures and packing procedure.
Figure 1.
Molecular Components and Initial Amorphous Periodic Cell.
Figure 1a–e show CS, SA, glycerol, the representative anthocyanin cation, and its acetate counterion, respectively. Figure 1f shows how the initial periodic cell was constructed. The pigment topology and atomic charges were held fixed during the simulations.
Forcite used the COMPASS 2.8 force field [26], whose potential energy includes bonded terms, cross coupling terms, and nonbonded interactions. The “Use current” charge option read the atomic partial charges stored in the model files. The available project records do not specify how those charges were originally generated. Each of the six complete cells had a formal net charge of zero, and the residual sum of atomic partial charges was below 10−12 e. The Forcite logs for systems containing pigment recorded automatic assignment of some angle bending, torsion, and inversion parameters. The NPT, final NVT, and frozen single-point calculations used Ewald summation for electrostatics with an accuracy of 0.0001 kcal mol−1. Van der Waals interactions were calculated by atom-based summation with a cubic spline cutoff. The cutoff distance was 15.5 Å, the spline width was 1.0 Å, and the nonbonded buffer width was 0.5 Å. A long range correction was applied to the van der Waals interactions.
2.3. Geometry Optimization and Molecular Dynamics Simulations
After packing, the models were optimized in Forcite with the cell held fixed. The project records show that optimization used steepest descent and Smart algorithms in separate stages, with iteration limits varying by group and stage. For example, the initial steepest descent stage for M2 used energy and force thresholds of 0.001 kcal mol−1 and 0.5 kcal mol−1 Å−1, respectively, with a limit of 2000 iterations. The Smart optimization at Fine quality used thresholds of 0.0001 kcal mol−1 and 0.005 kcal mol−1 Å−1, respectively, with a limit of 20,000 iterations. Five annealing cycles were then run in the NVT ensemble, with temperature set points of 298.00 K at the start and 600.00 K at the midpoint of each cycle. Each cycle used five heating ramps with 2000 steps per ramp. The annealing run comprised 100,000 steps (100 ps) at a time step of 1 fs. The temperature was controlled with a Nosé thermostat (Q ratio of 0.01), and the initial velocities were assigned randomly. Automatic geometry optimization of the final configuration was disabled.
The models were simulated for 500 ps in the isothermal–isobaric (NPT) ensemble at a constant particle number, pressure, and temperature (298.15 K and 0.1 MPa), and density was recorded as a function of time. The final configuration from this stage was then used for 100 ps of NVT sampling with a time step of 1 fs. One frame was saved every 1000 steps (1 ps). RDF and hydrogen bond statistics used the 81 frames from 20 to 100 ps of the NVT stage. Frozen potential energy calculations used frames 21, 41, 61, 81, and 101, corresponding to 20, 40, 60, 80, and 100 ps when the initial configuration was counted as frame 1.
2.4. Density and Radial Distribution Function Analysis
Periodic cell density was calculated using Equation (7), with 50 ps windows for block statistics. The variables m and V represent the total mass and volume of the periodic cell, respectively. We report the mean model density over the recorded 500 ps NPT interval as a descriptor of overall packing during that interval. Experimental film density and full equilibration would require separate evidence. Local distributions were characterized using RDFs and hydrogen bonds.
The radial distribution function was calculated using Equation (8). It describes the distribution of B sites in a spherical shell around an A site relative to the reference number density of B sites [27].
Here, is the configurational average number of B sites in the spherical shell from r to r + Δr around each A site, and is the reference number density of B sites for the corresponding model. The denominator normalizes the count by the shell volume. Two atom pair selections were used: CS oxygen with SA oxygen, and anthocyanin hydroxyl hydrogen with CS/SA oxygen. Both used a maximum distance of 10 Å and a bin width of 0.02 Å. Both cross RDFs compare different molecular components, with no pairs drawn from within a single CS chain or a single SA chain. The matrix oxygen selection included oxygen sites in the selected CS and SA components without separating hydroxyl, glycosidic, acetyl, or carboxylate oxygen. The short range peak position gives a characteristic distance, and its height describes the local distribution relative to the corresponding reference number density. Absolute coordination numbers would require separate calculation.
2.5. Hydrogen Bonds and Component Interaction Energies
Hydrogen bonds were identified using CalculateHBonds. The geometric criteria were a hydrogen to acceptor distance H⋯A ≤ 2.5 Å and a donor–hydrogen–acceptor angle D–H⋯A ≥ 120°. D is the donor atom covalently bonded to the hydrogen atom H, and A is the acceptor atom. The count for the complete system included O–H and N–H donors and O and N acceptors. The target subset included only anthocyanin hydroxyl O–H donors paired with CS/SA oxygen acceptors. Other anthocyanin–matrix hydrogen bonds and bridging between different polysaccharide chains were outside the scope of this count. The mean over 81 frames was calculated using Equation (9) and normalized by the number of anthocyanin molecules using Equation (10).
Here, is the number of frames analyzed, is the number of anthocyanin molecules in that group, and is the mean target hydrogen bond count per anthocyanin molecule. The complete system count includes pairs involving polysaccharides, glycerol, and pigment. The target count characterizes anthocyanin–polysaccharide contacts in the specified donor–acceptor direction. The standard deviation reported after each mean describes fluctuations in the counts across frames from the same trajectory over the analysis window. Molecular dynamics simulations have also been used to examine hydrogen bonding and electrostatic interactions in protein/sodium alginate films [28].
Frozen single-point potential energies were calculated for the complete system, the matrix group, and the pigment group for each selected configuration. The matrix group retained CS, SA, all Na+ ions, and glycerol. The pigment group retained all anthocyanin cations and an equal number of acetate ions. Both groups had a formal net charge of zero, and their partial charges summed to approximately zero within the stored precision. To calculate the potential energy of each group, only the atoms in the other group were deleted. The original cell, coordinates, partial charges, COMPASS force field, and periodic nonbonded settings were retained. Equation (11) defines the component interaction energy, and Equation (12) defines component binding energy as its negative. No pigment group was present in M0, so this quantity was calculated only for M1–M5.
Component binding energy is reported as the mean and sample standard deviation of five selected configurations and normalized by the number of anthocyanin cations using Equation (13). The energy difference includes interactions of the pigment and acetate ions with the polysaccharides, Na+, and glycerol and depends on the specified periodic cell and Ewald treatment. The calculation used two electrically neutral groups. Individual charged species were kept in their respective groups, and the contribution of acetate was not isolated. The definition covers the potential energy difference at frozen configurations. It excludes entropy, structural relaxation after separation, and binding free energy.
The coefficient of variation (CV) was calculated using Equation (14), and the sample standard deviation was calculated using Equation (15) [29]. N is the number of selected configurations (N = 5), is the sample standard deviation of the binding energies for those configurations, and the mean binding energy is their arithmetic mean. The mean binding energy was positive in every group. The CV expresses the relative dispersion of the selected configurations as a percentage. The standard deviation across frames, the standard deviation across the five selected configurations, and the CV describe fluctuations within a single trajectory.
To examine the sensitivity of the existing sampling window to time blocking, the Forcite potential energy time series for the final NVT run of each model was averaged over 20 ≤ t < 60 ps and 60 ≤ t ≤ 100 ps. The mean of the earlier block was subtracted from the mean of the later block, and the difference was divided by the total atom count of the corresponding model. The comparison used two adjacent time segments of the existing trajectory. Reproducibility across independent initial configurations requires separate testing.
Relative changes in each measure compared with the specified reference group were calculated using Equation (16).
Here, is the value for the group being compared, and is the value for the reference group. The 0 mL group served as the reference for the tensile measures and the CS–SA RDF. For the remaining measures, the corresponding reference group with pigment and its value are specified individually. Relative changes were calculated using the original available precision and rounded to two decimal places.
2.6. Color Response and Color Difference in Chicken Packaging
The chicken packaging test included six extract addition levels (0, 1, 2, 3, 4, and 5 mL). Each 10 g portion of fresh minced chicken was placed in a 30 mL sample vial. A 4 cm × 4 cm piece of composite film was placed over the vial opening and secured with a rubber band. The vials were stored at 4 °C, and film color was observed every 24 h.CIELAB color coordinates were measured with a DS-02 colorimeter (CHNSpec). Equation (17) gives the standard CIELAB color difference [30]. L* denotes lightness, and a* and b* denote chromatic coordinates along the red–green and yellow–blue axes, respectively. The subscript ref denotes the reference color used for comparison.
Photographs show the visible color changes of the films covering the vials during storage. The color difference curves compare the magnitude and time course of the response across formulations. The original exported color difference values were retained. The readings at 0 h were nonzero, and the exported data did not specify the reference color coordinates. The available packaging test records do not include total volatile basic nitrogen (TVB-N), total viable counts, or pH measured at the same times as the color observations. The color differences were used to characterize the color response of the films during storage.
3. Results and Discussion
3.1. Effect of Anthocyanin Loading on the Mechanical Properties of the Composite Films
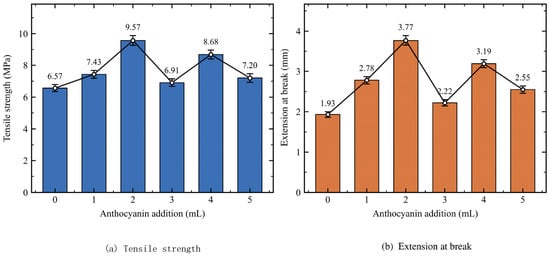
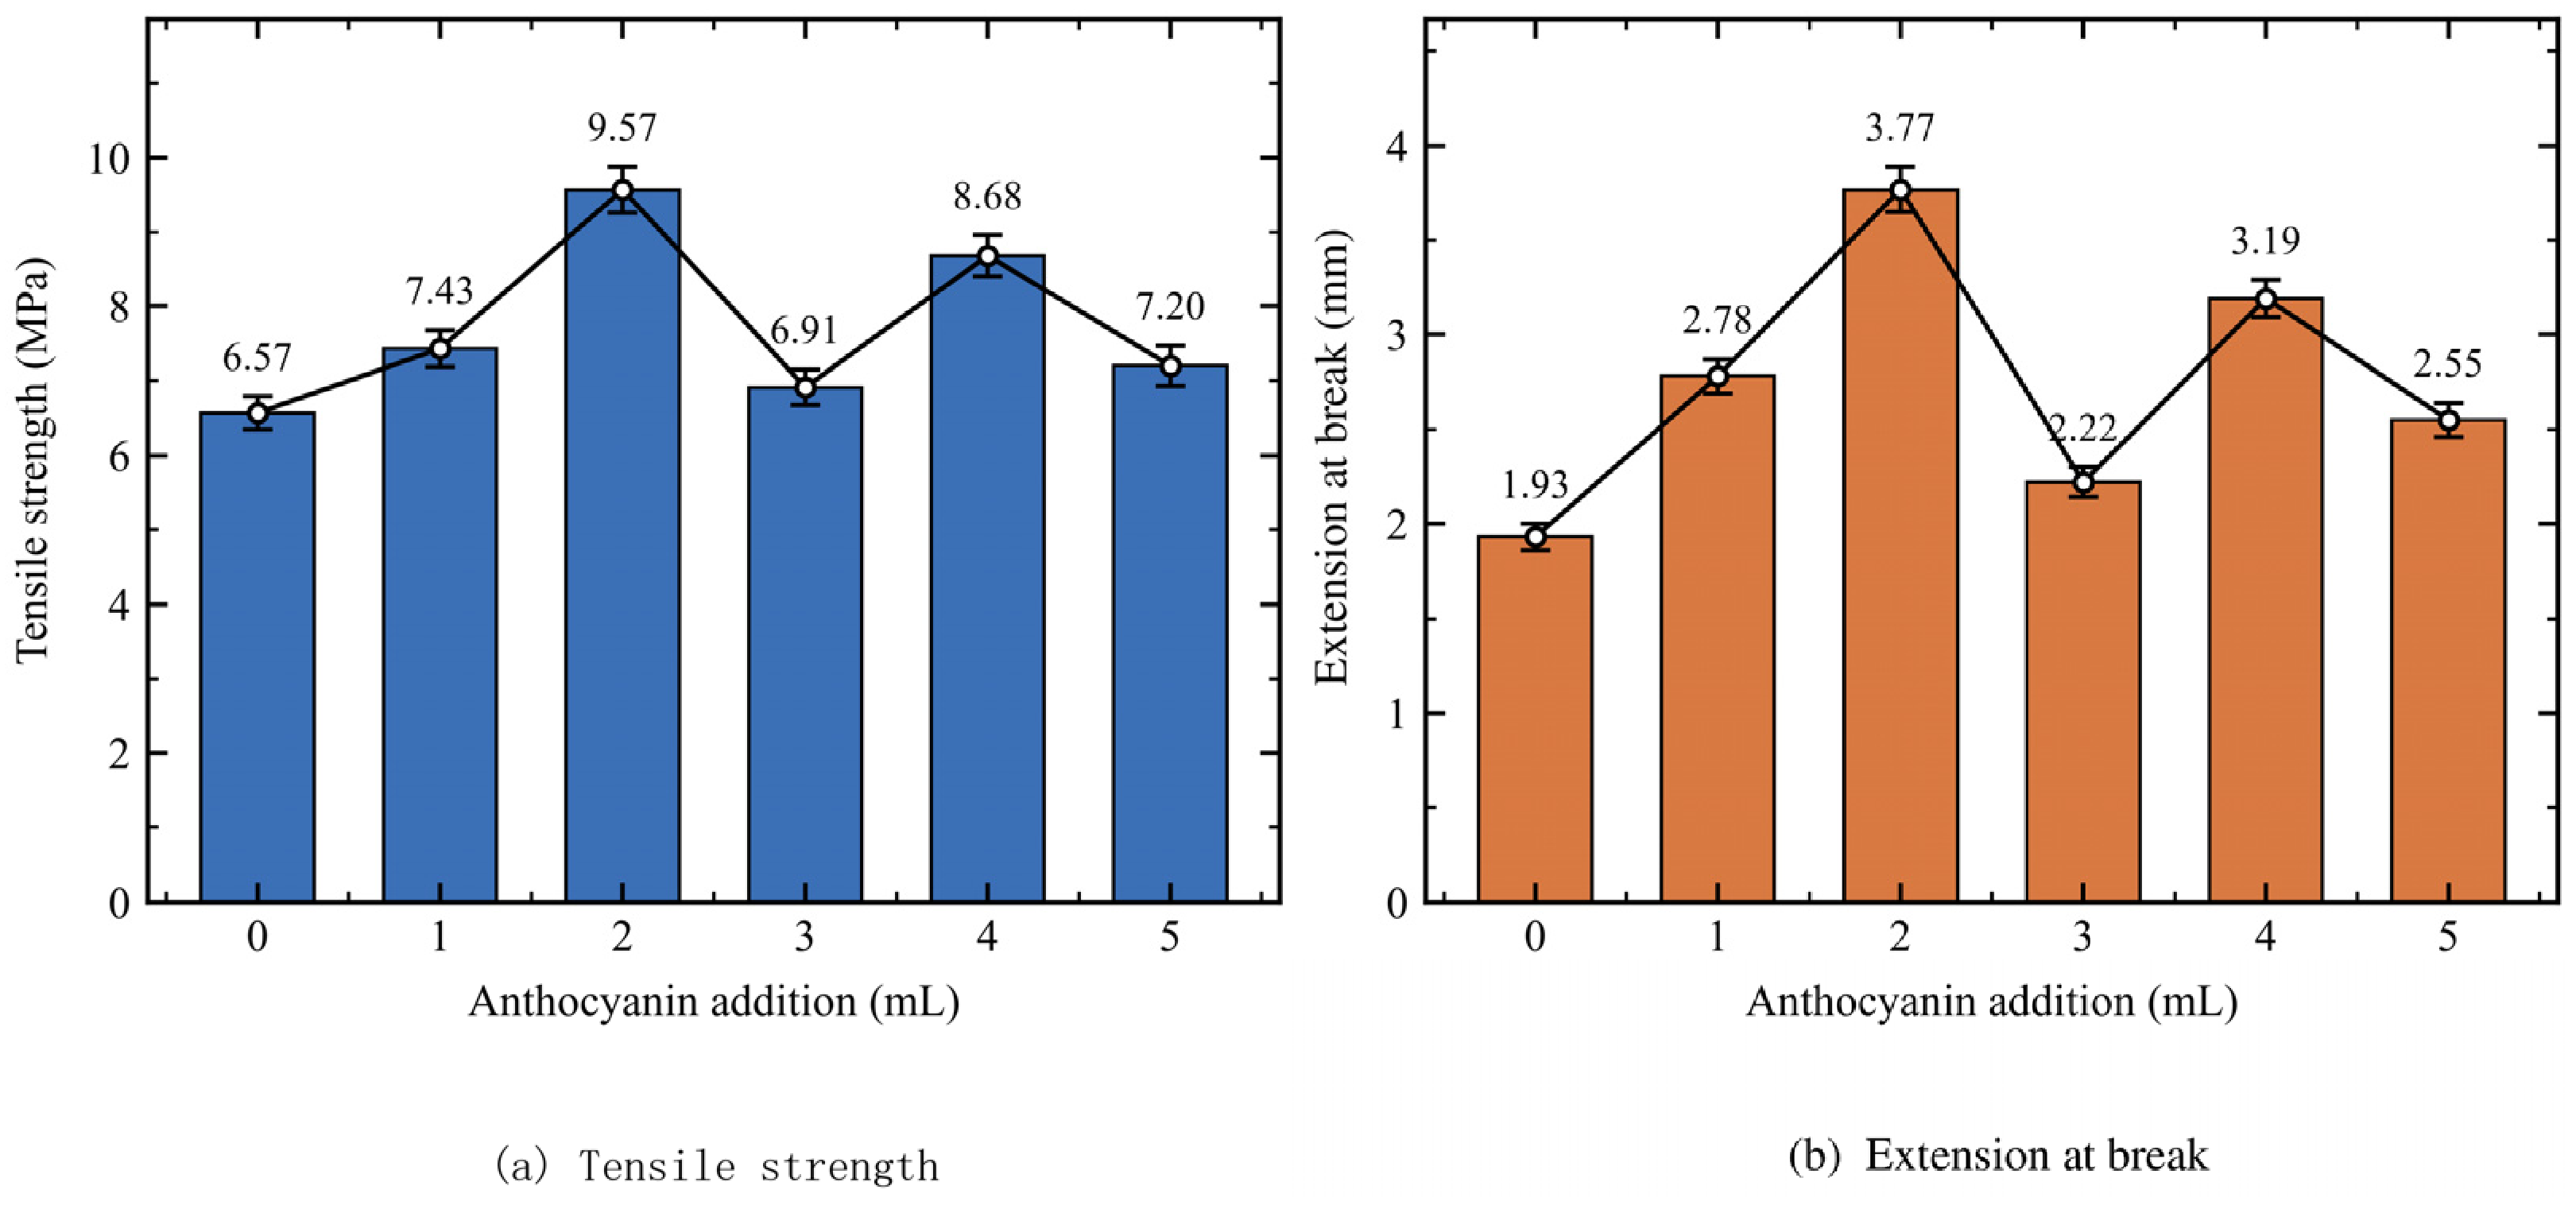
Table 2 and Figure 2 show the tensile results at each anthocyanin loading. Increasing the extract volume from 0 to 2 mL raised tensile strength from 6.57 to 9.57 MPa and extension at break from 1.93 to 3.77 mm, increases of 45.66% and 95.34%, respectively. At 3, 4, and 5 mL, tensile strengths were 6.91, 8.68, and 7.20 MPa, and extensions at break were 2.22, 3.19, and 2.55 mm, respectively. Both measures first increased and then declined with fluctuations. Values rose again at 4 mL but remained below those at 2 mL. Previous work on CS/SA anthocyanin films has also reported an appropriate loading range. Formulation studies of bilayer CS/SA films [31] and related films containing pigment [32] show that the effect of pigment on the mechanical response depends on matrix organization.
Table 2.
Mechanical Properties of CS/SA Composite Films at Different Anthocyanin Loadings.
Figure 2.
Effect of Anthocyanin Loading on Tensile strength and Extension at break ties of the Composite Films.
Figure 2a,b show tensile strength and extension at break, respectively. The latter retains the original unit of mm.
The 2 mL group had the highest recorded tensile strength and extension at break among the six formulations. The available data provide one verifiable set of summary values per formulation. The number of independent specimens, individual measurements, and the statistical definition of the original error bars in Figure 2 could not be verified. Table 2 and Figure 2 therefore support a descriptive comparison based on the reported values. The records do not identify which drying procedure was used for each group, so pigment loading alone cannot account for the observed mechanical differences. The rankings of simulated local contact measures and measured tensile values are reported separately.
3.2. Density Changes in the Simulated Systems
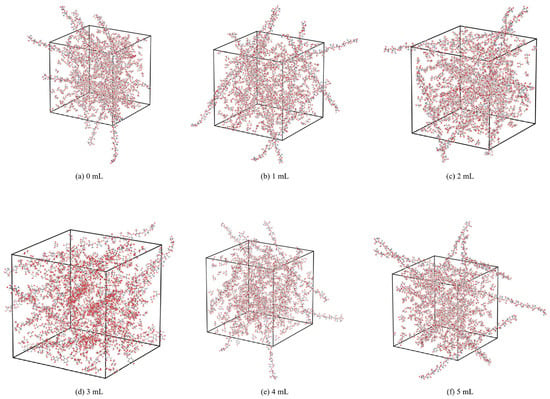
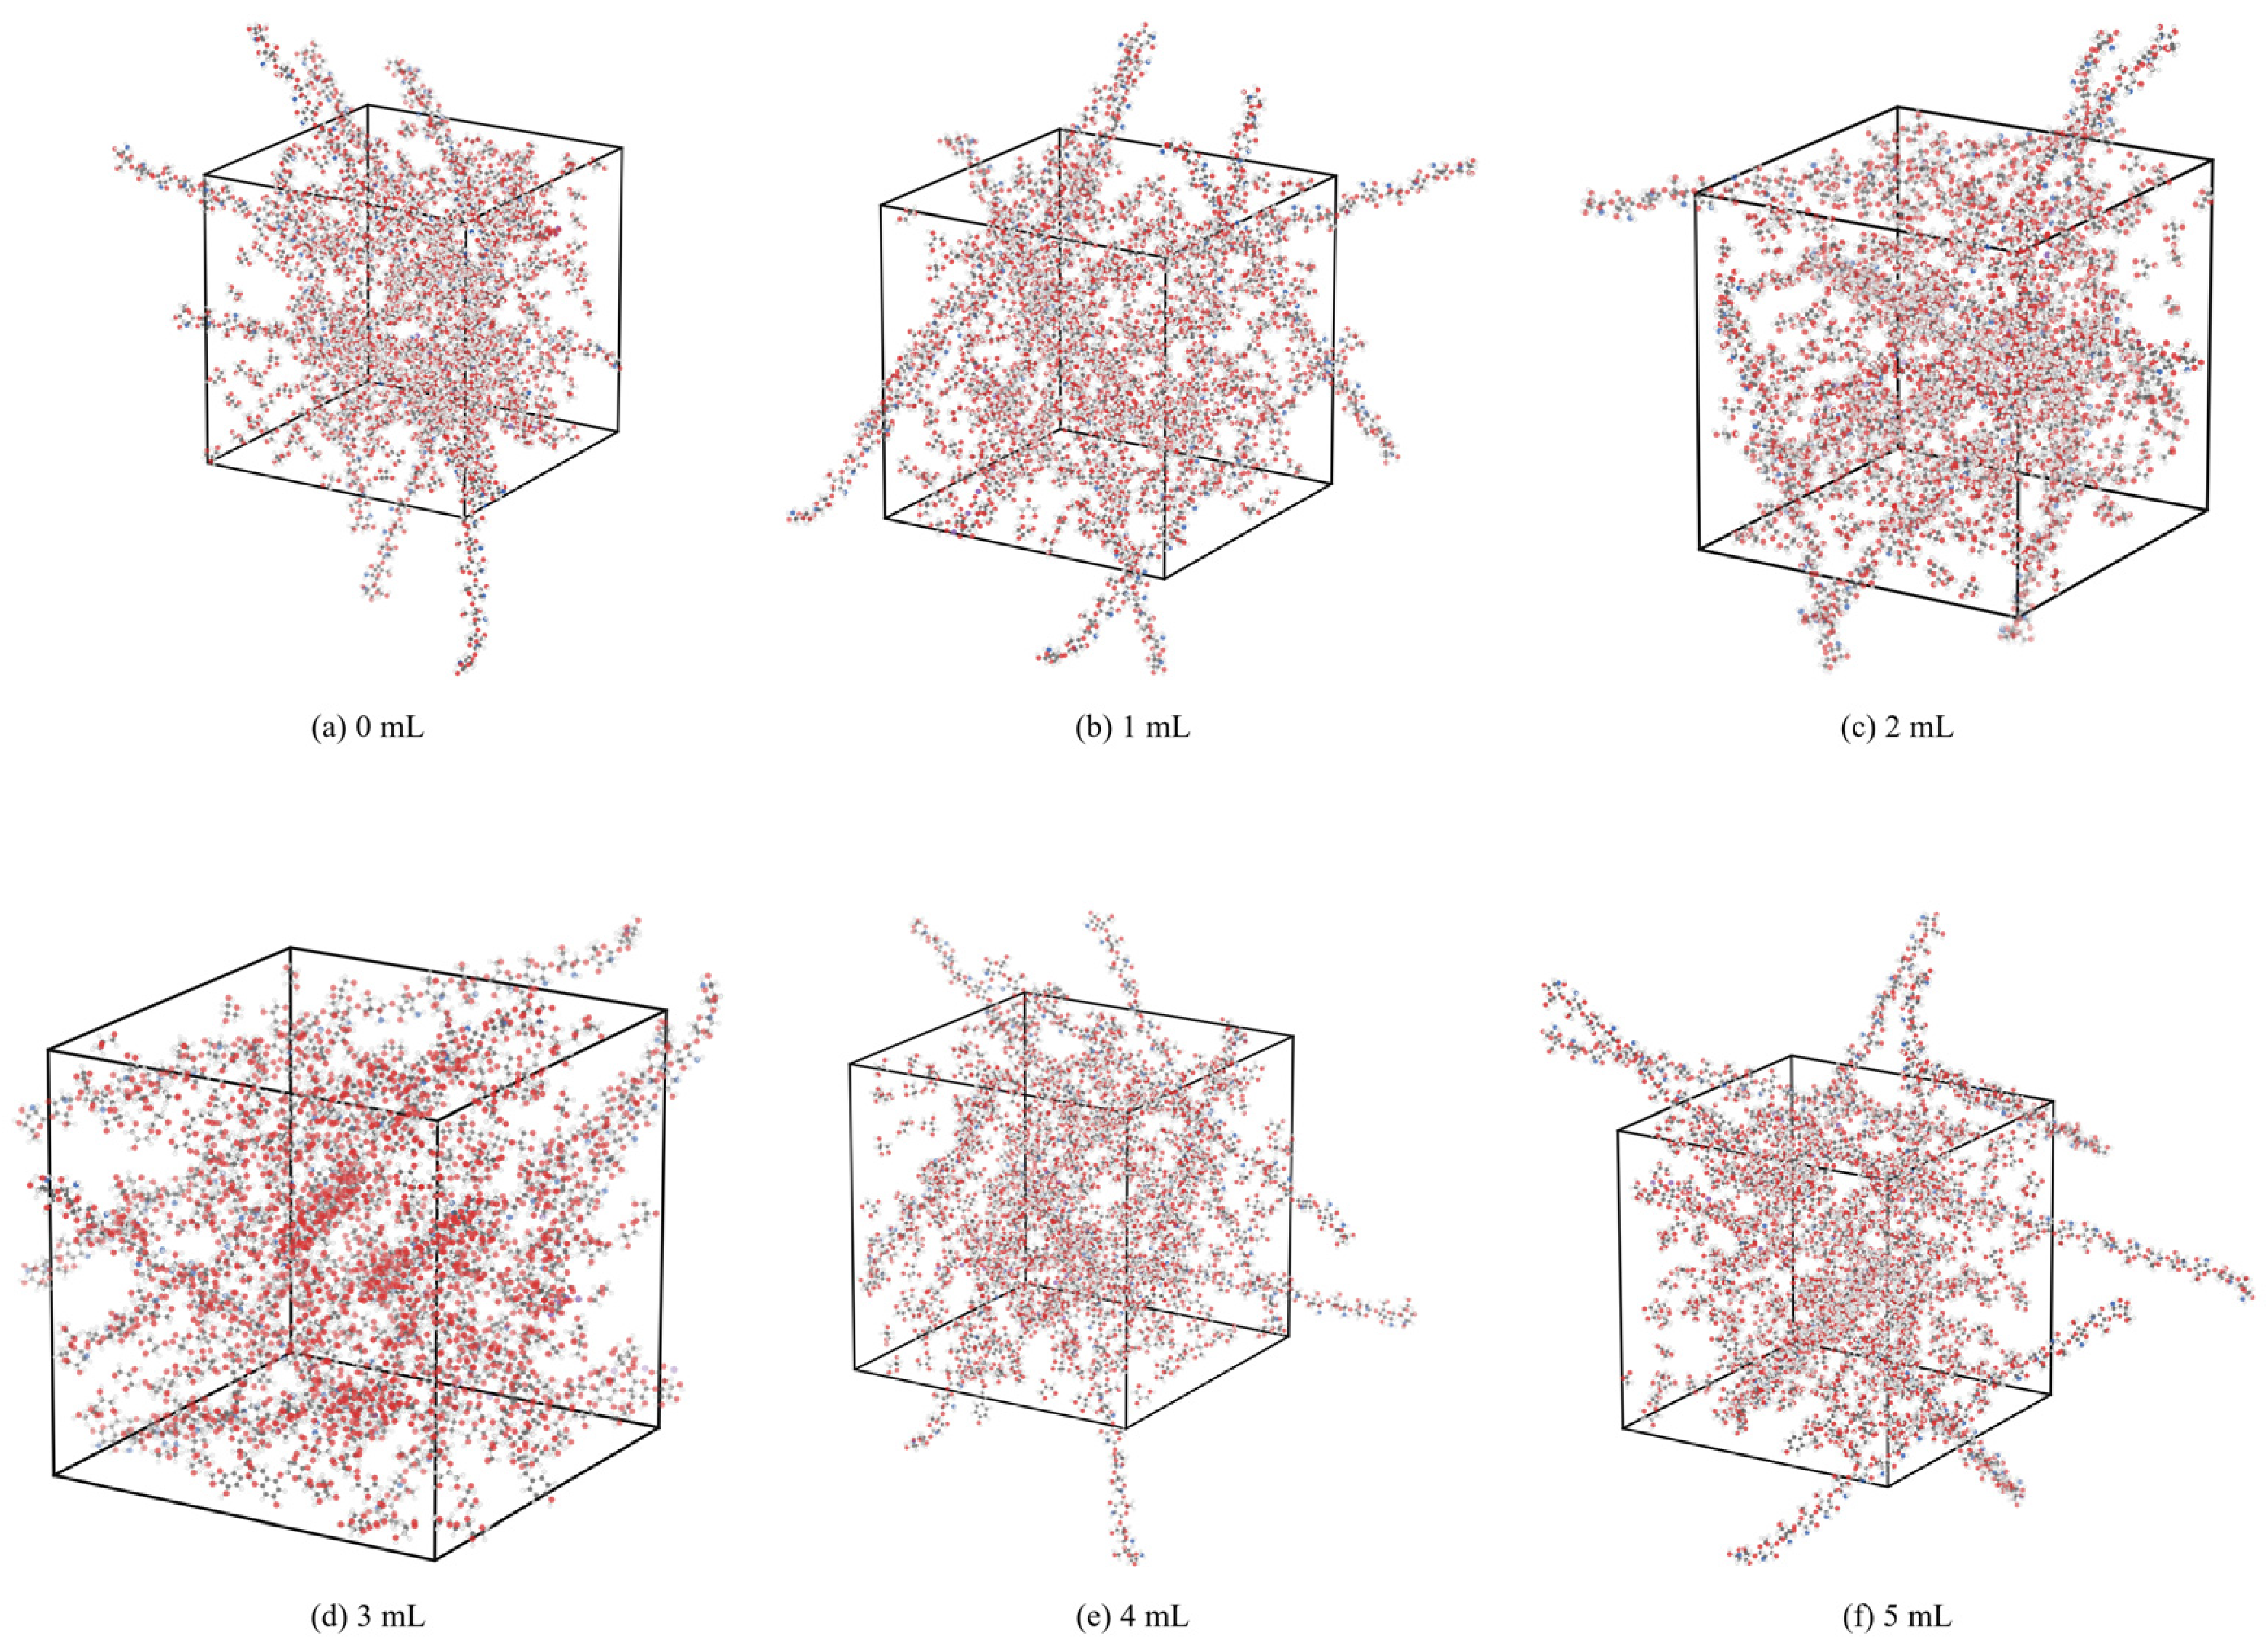
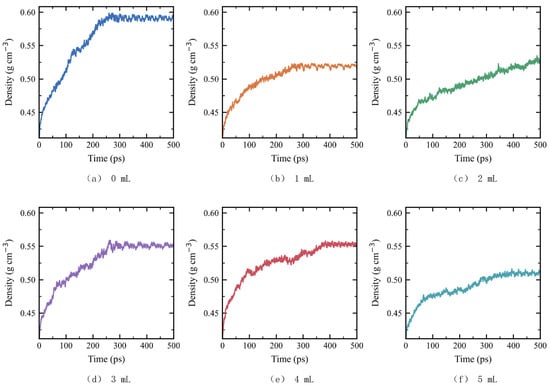
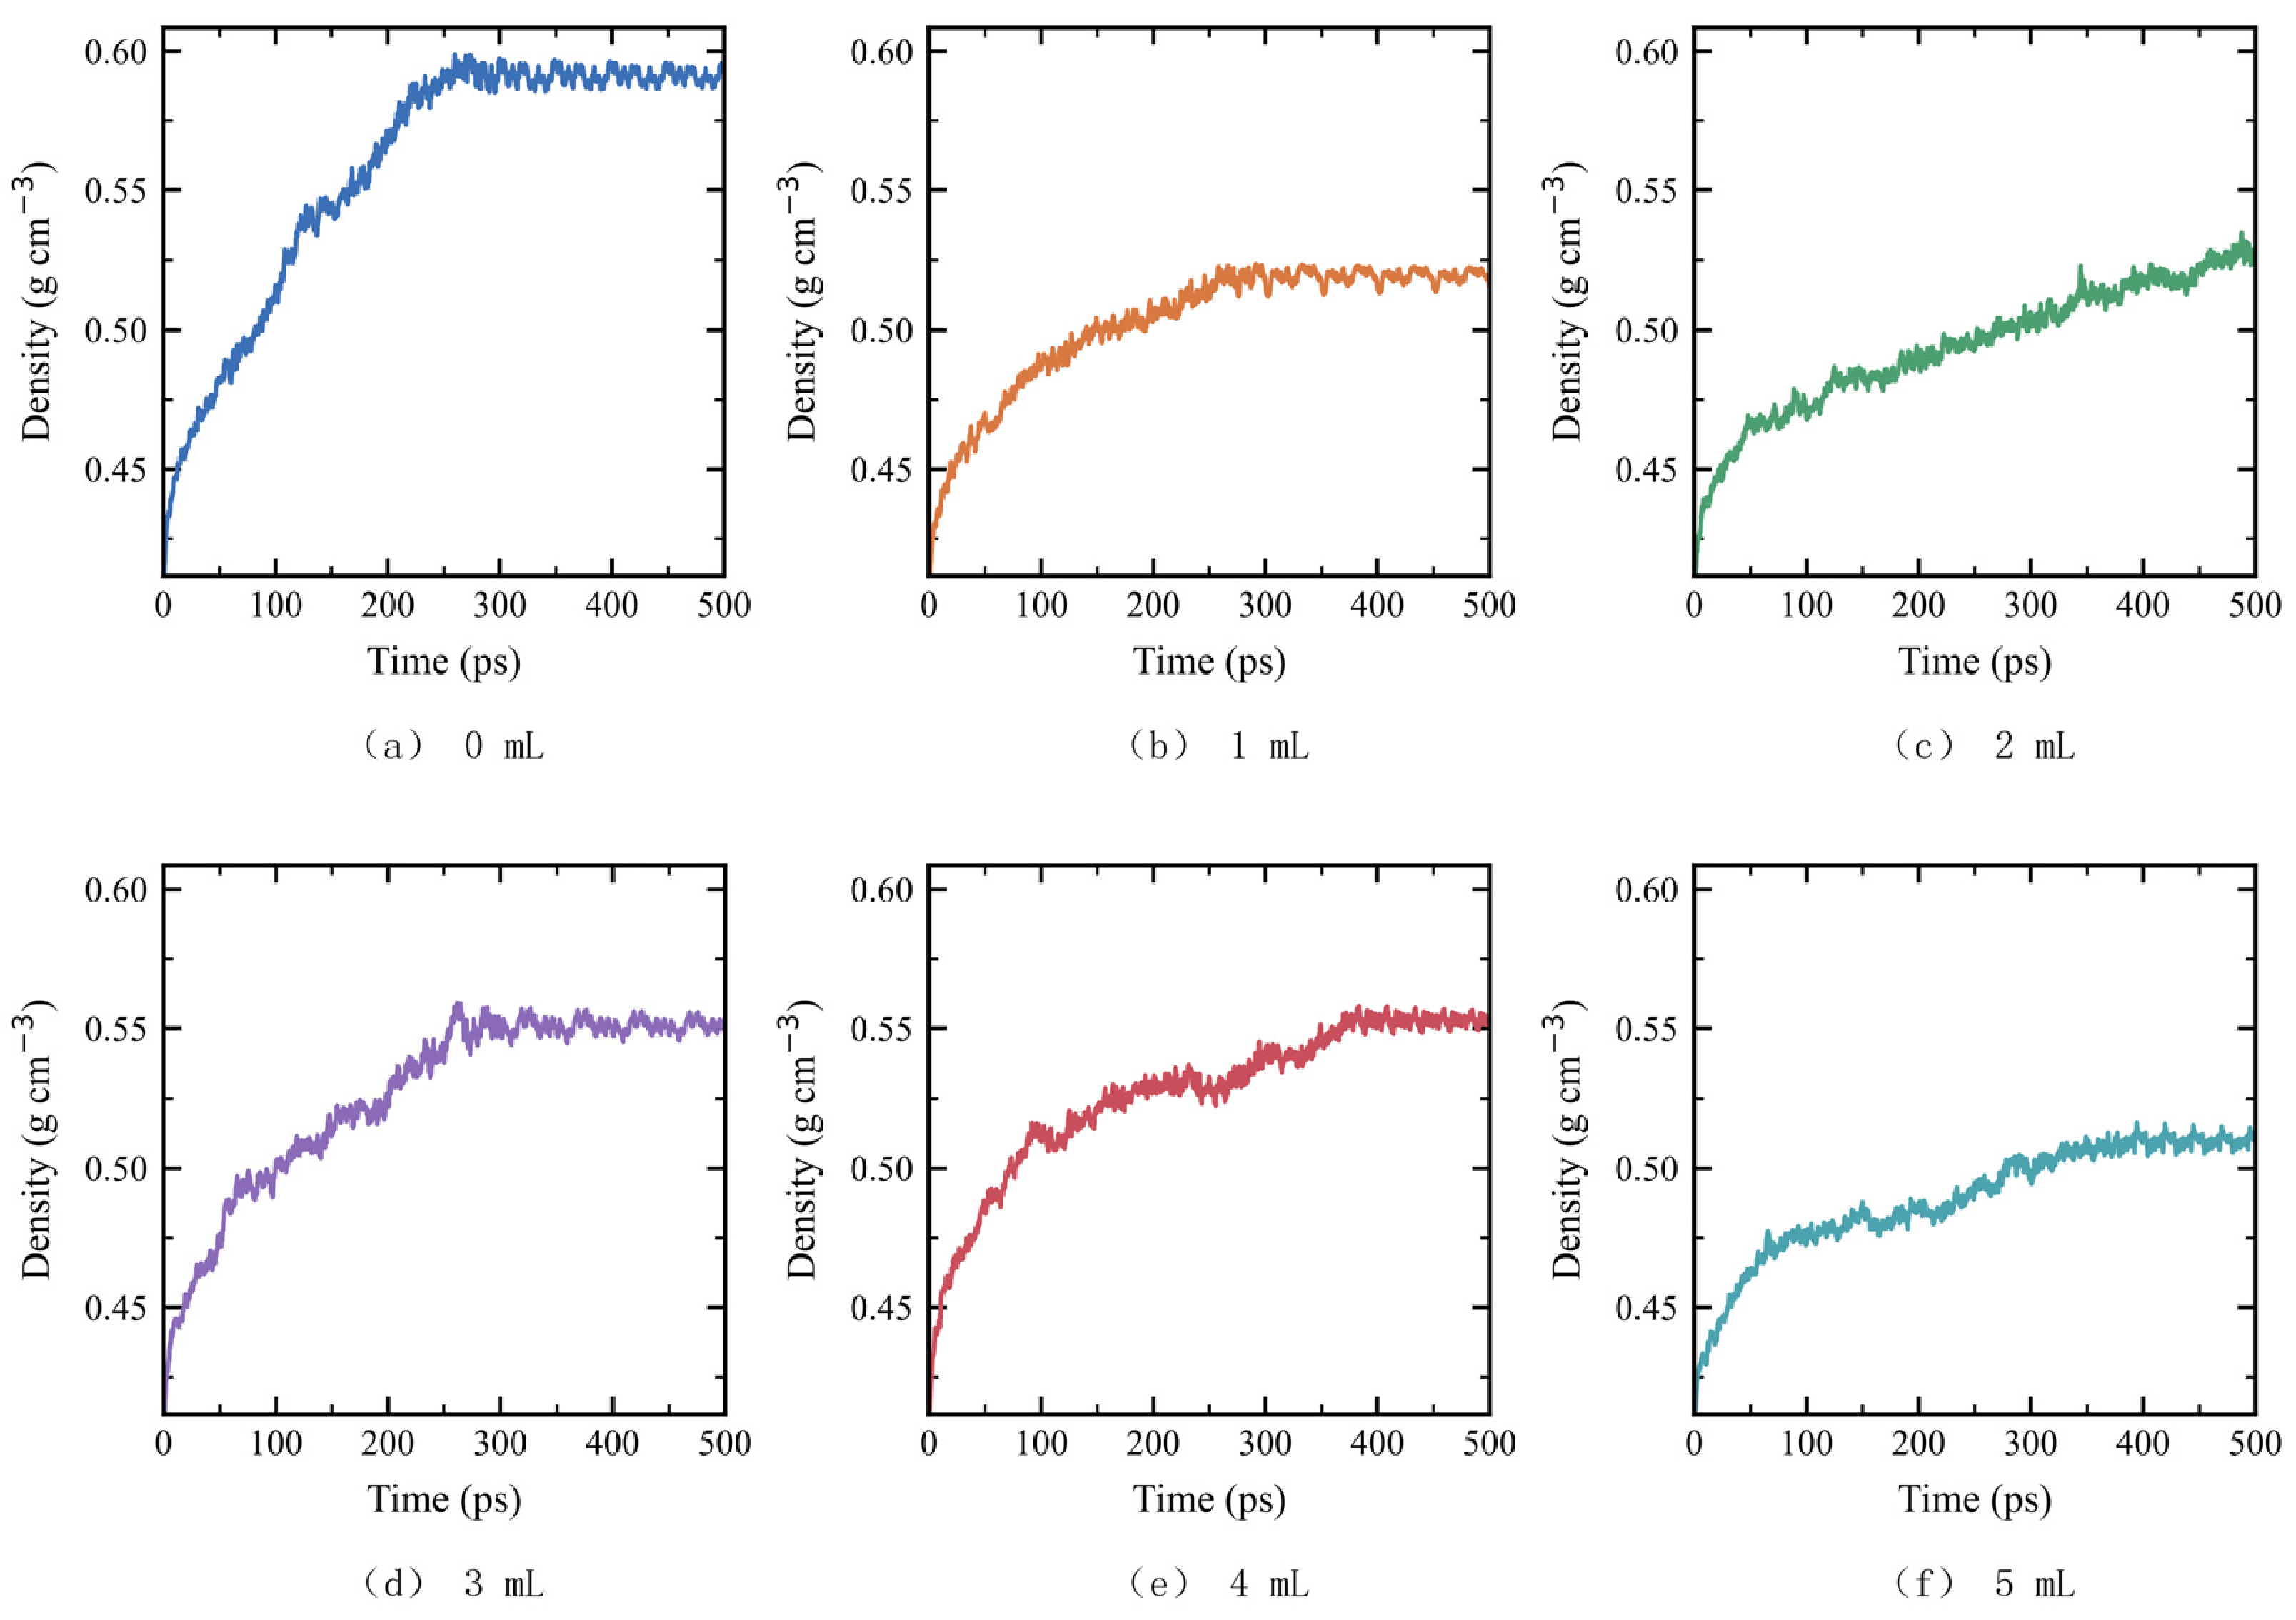
Figure 3 shows the six initial amorphous models, Figure 4 shows the NPT density profiles, and Table 3 reports the mean densities over the recorded interval. The mean model densities for M0–M5 were 0.594, 0.517, 0.526, 0.550, 0.551, and 0.512 g cm−3, respectively. All models containing pigment had lower mean densities than M0. The densities varied nonmonotonically with pigment count, reflecting differences in overall packing during the recorded interval. Experimental studies of sodium alginate films containing natural anthocyanins [33] and films containing both nanocrystals and pigment [34] have also examined how added components affect matrix organization.
Figure 3.
Initial Amorphous Periodic Cells of the Six Models.
Figure 4.
Changes in Model Density during the NPT Stage.
Table 3.
Composition and Mean Density over the NPT Interval for the Six Periodic Models.
The mean density of M2 was lower than those of M3 and M4, whereas the tensile strength of the corresponding 2 mL formulation was higher than those of the 3 and 4 mL formulations. We therefore use model density to describe packing at the cell scale and RDFs and hydrogen bonds to describe local contacts. Mean model density alone does not explain the tensile strength ranking.
Figure 3a–f show the six initial amorphous configurations, M0–M5, respectively.
The NPT stage lasted 500 ps for each model. Table 3 reports the density over the recorded interval. Model identifiers and experimental addition labels are matched according to the relative integer loading series described in Section 2.2.
3.3. Radial Distributions Between Polysaccharide Chains and Between Anthocyanin and the Matrix
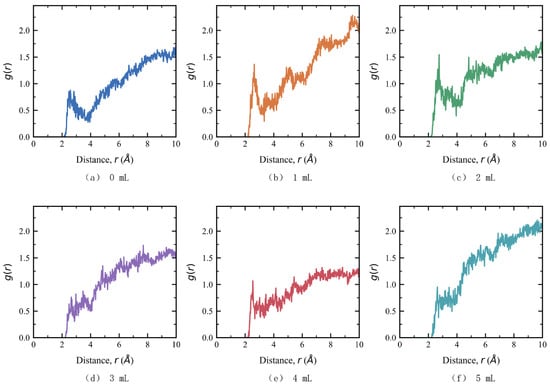
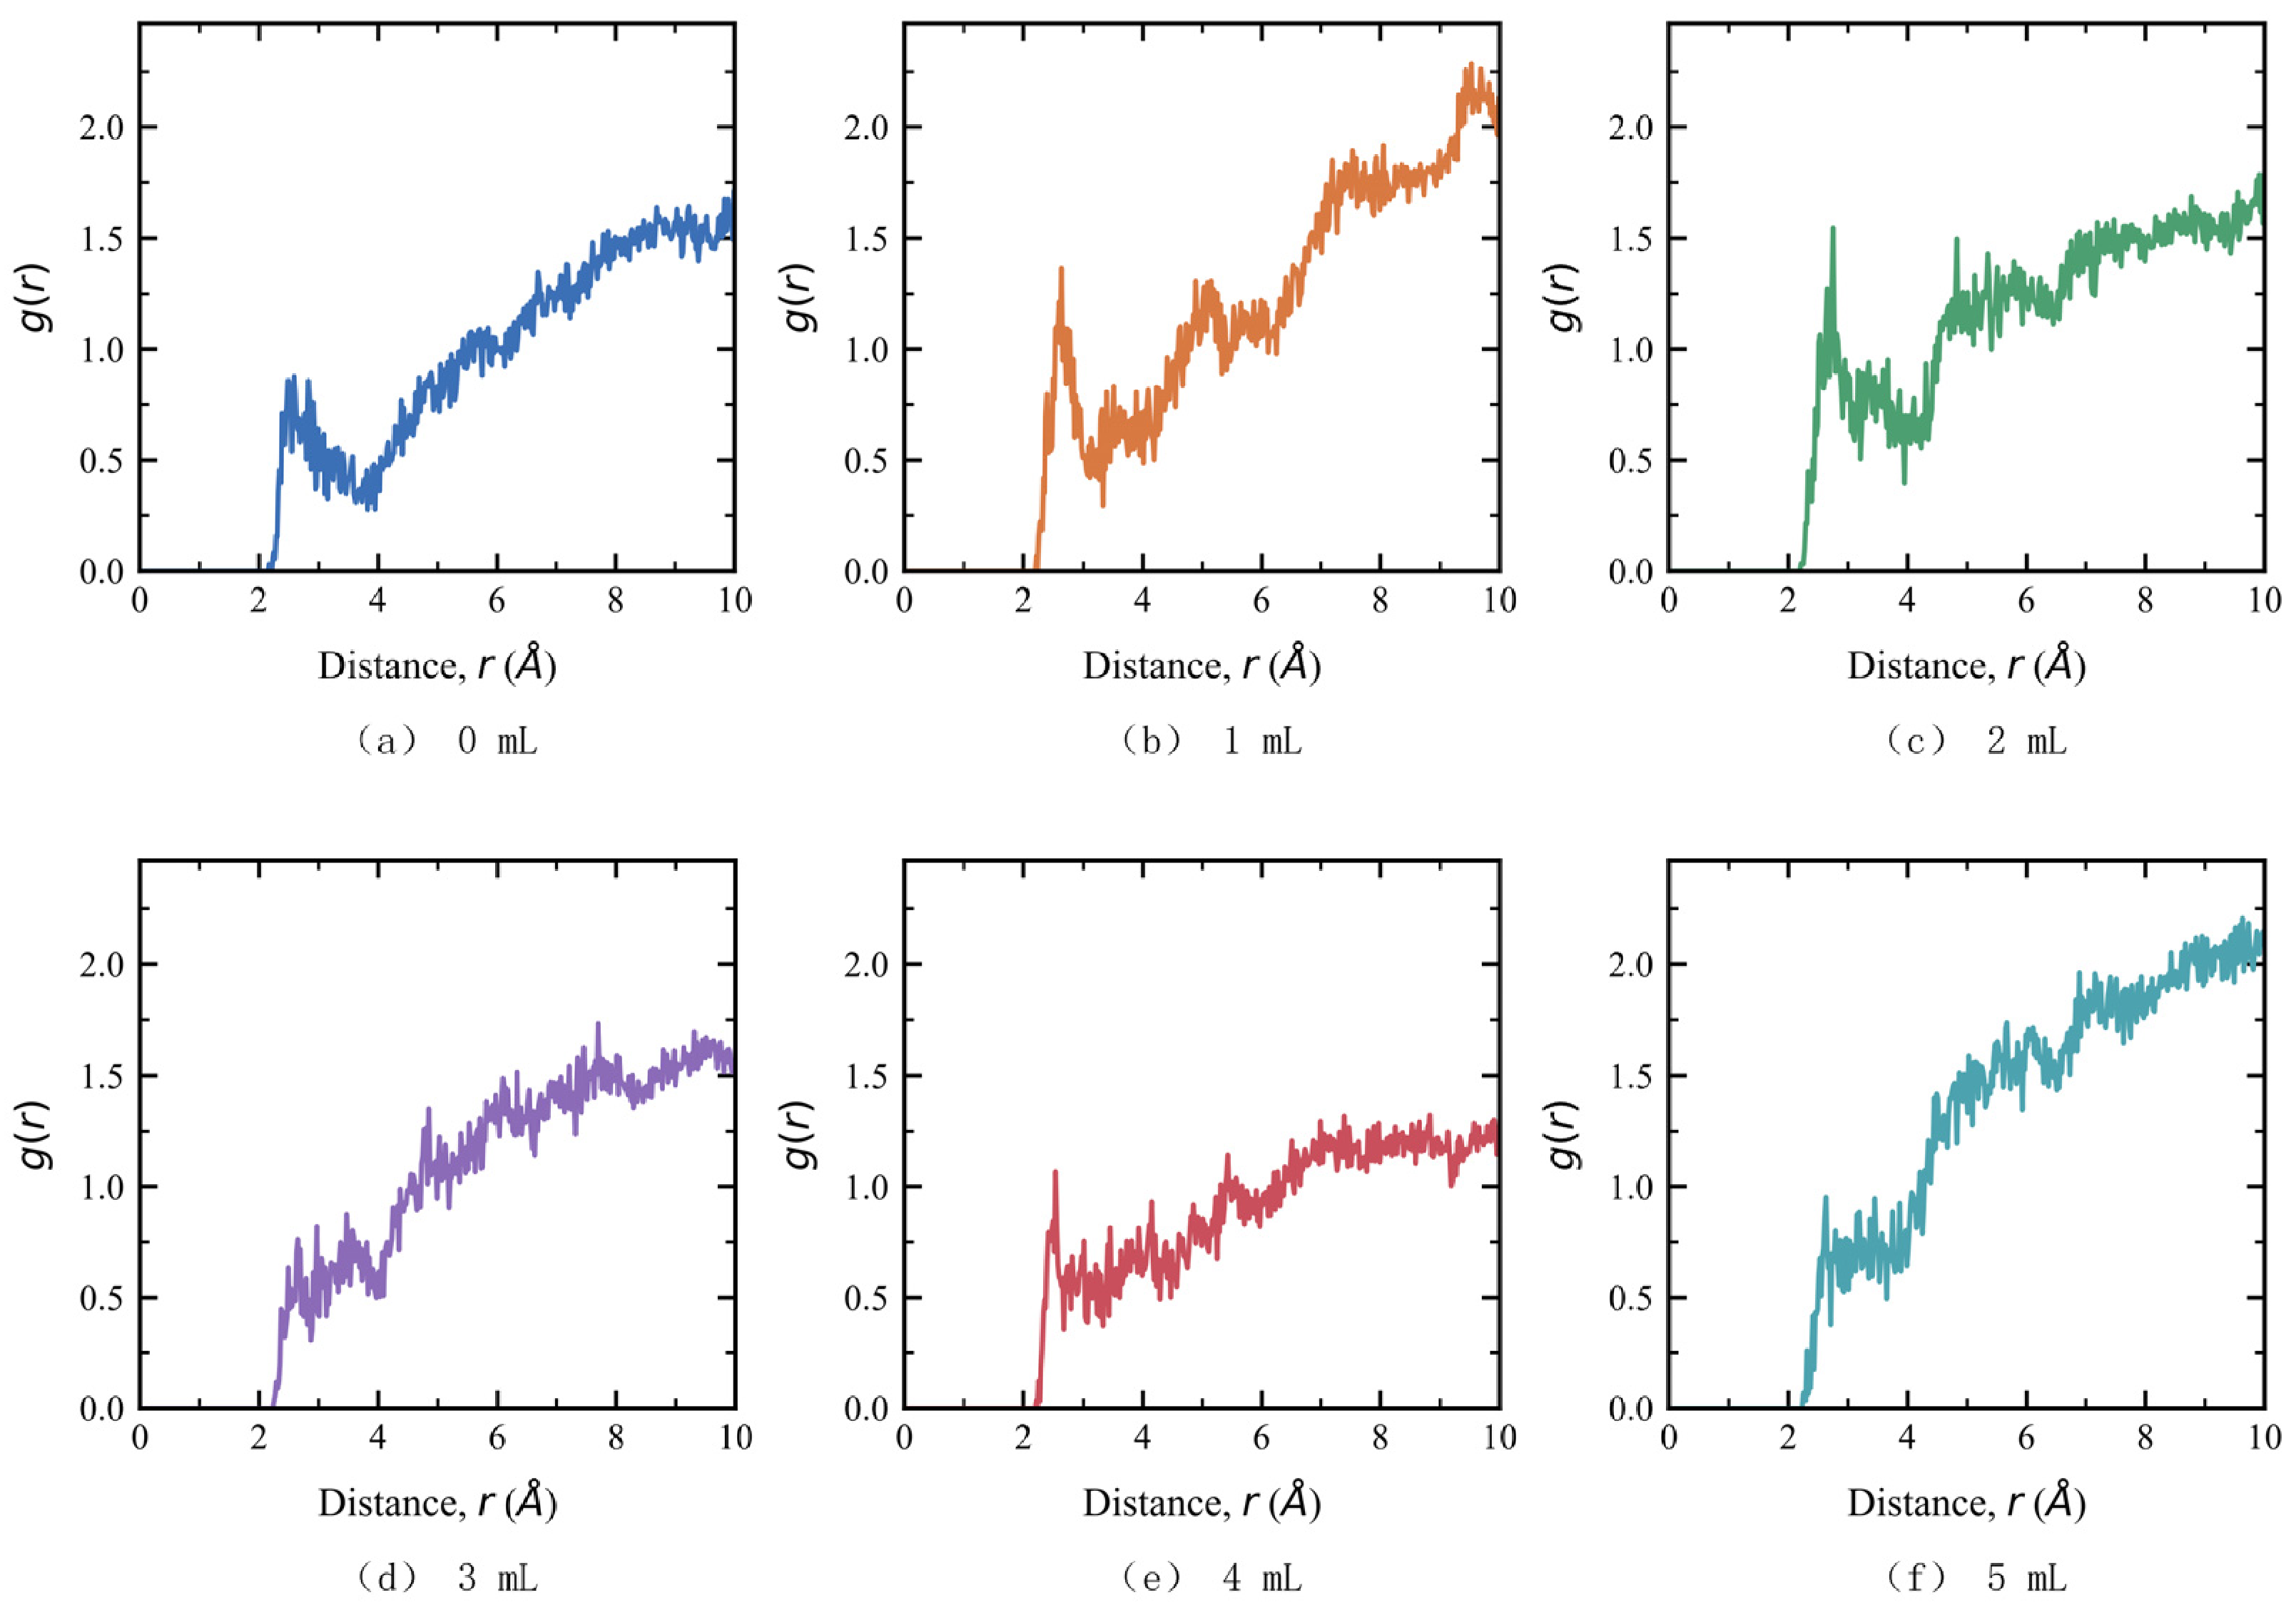
Figure 5 shows the cross RDFs for CS and SA oxygen sites, and Table 4 gives the short range local peak parameters. Peak positions for M0–M5 ranged from 2.53 to 2.75 Å, and peak heights were 0.876, 1.366, 1.547, 0.762, 1.068, and 0.953, respectively. Peak height increased from M0 through M2. Based on unrounded values, the M2 peak was 76.58% higher than that of M0. The peak height then fell in M3, rose in M4, and fell again in M5. M2 had the highest normalized local distribution at the corresponding characteristic distance. This result describes spatial distribution. The strength of association between CS and SA would require a separate measure.
Figure 5.
Cross RDF between CS and SA Oxygen Sites.
Table 4.
Short Range Local RDF Peak Parameters at Different Anthocyanin Loadings.
Both the CS–SA and anthocyanin–matrix short range peaks were highest in M2, indicating a shared maximum in the local distributions of the two selected atom pairs. In CS/gelatin films containing anthocyanin, reduced mechanical performance has been linked to competition for hydrogen bonds between the pigment and the matrix and disruption of existing interactions in the matrix [35]. Here, site competition and orientational constraints are considered possible explanations for changes in local contacts at higher loadings. The RDF itself compares normalized spatial distributions.
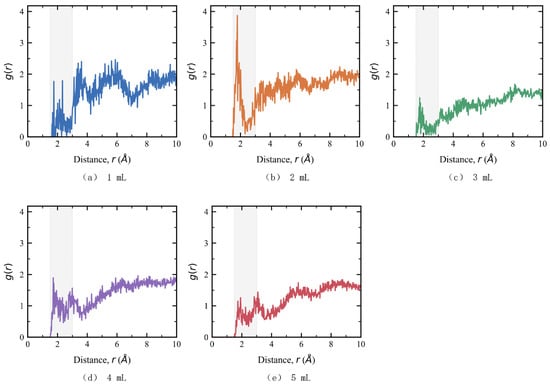
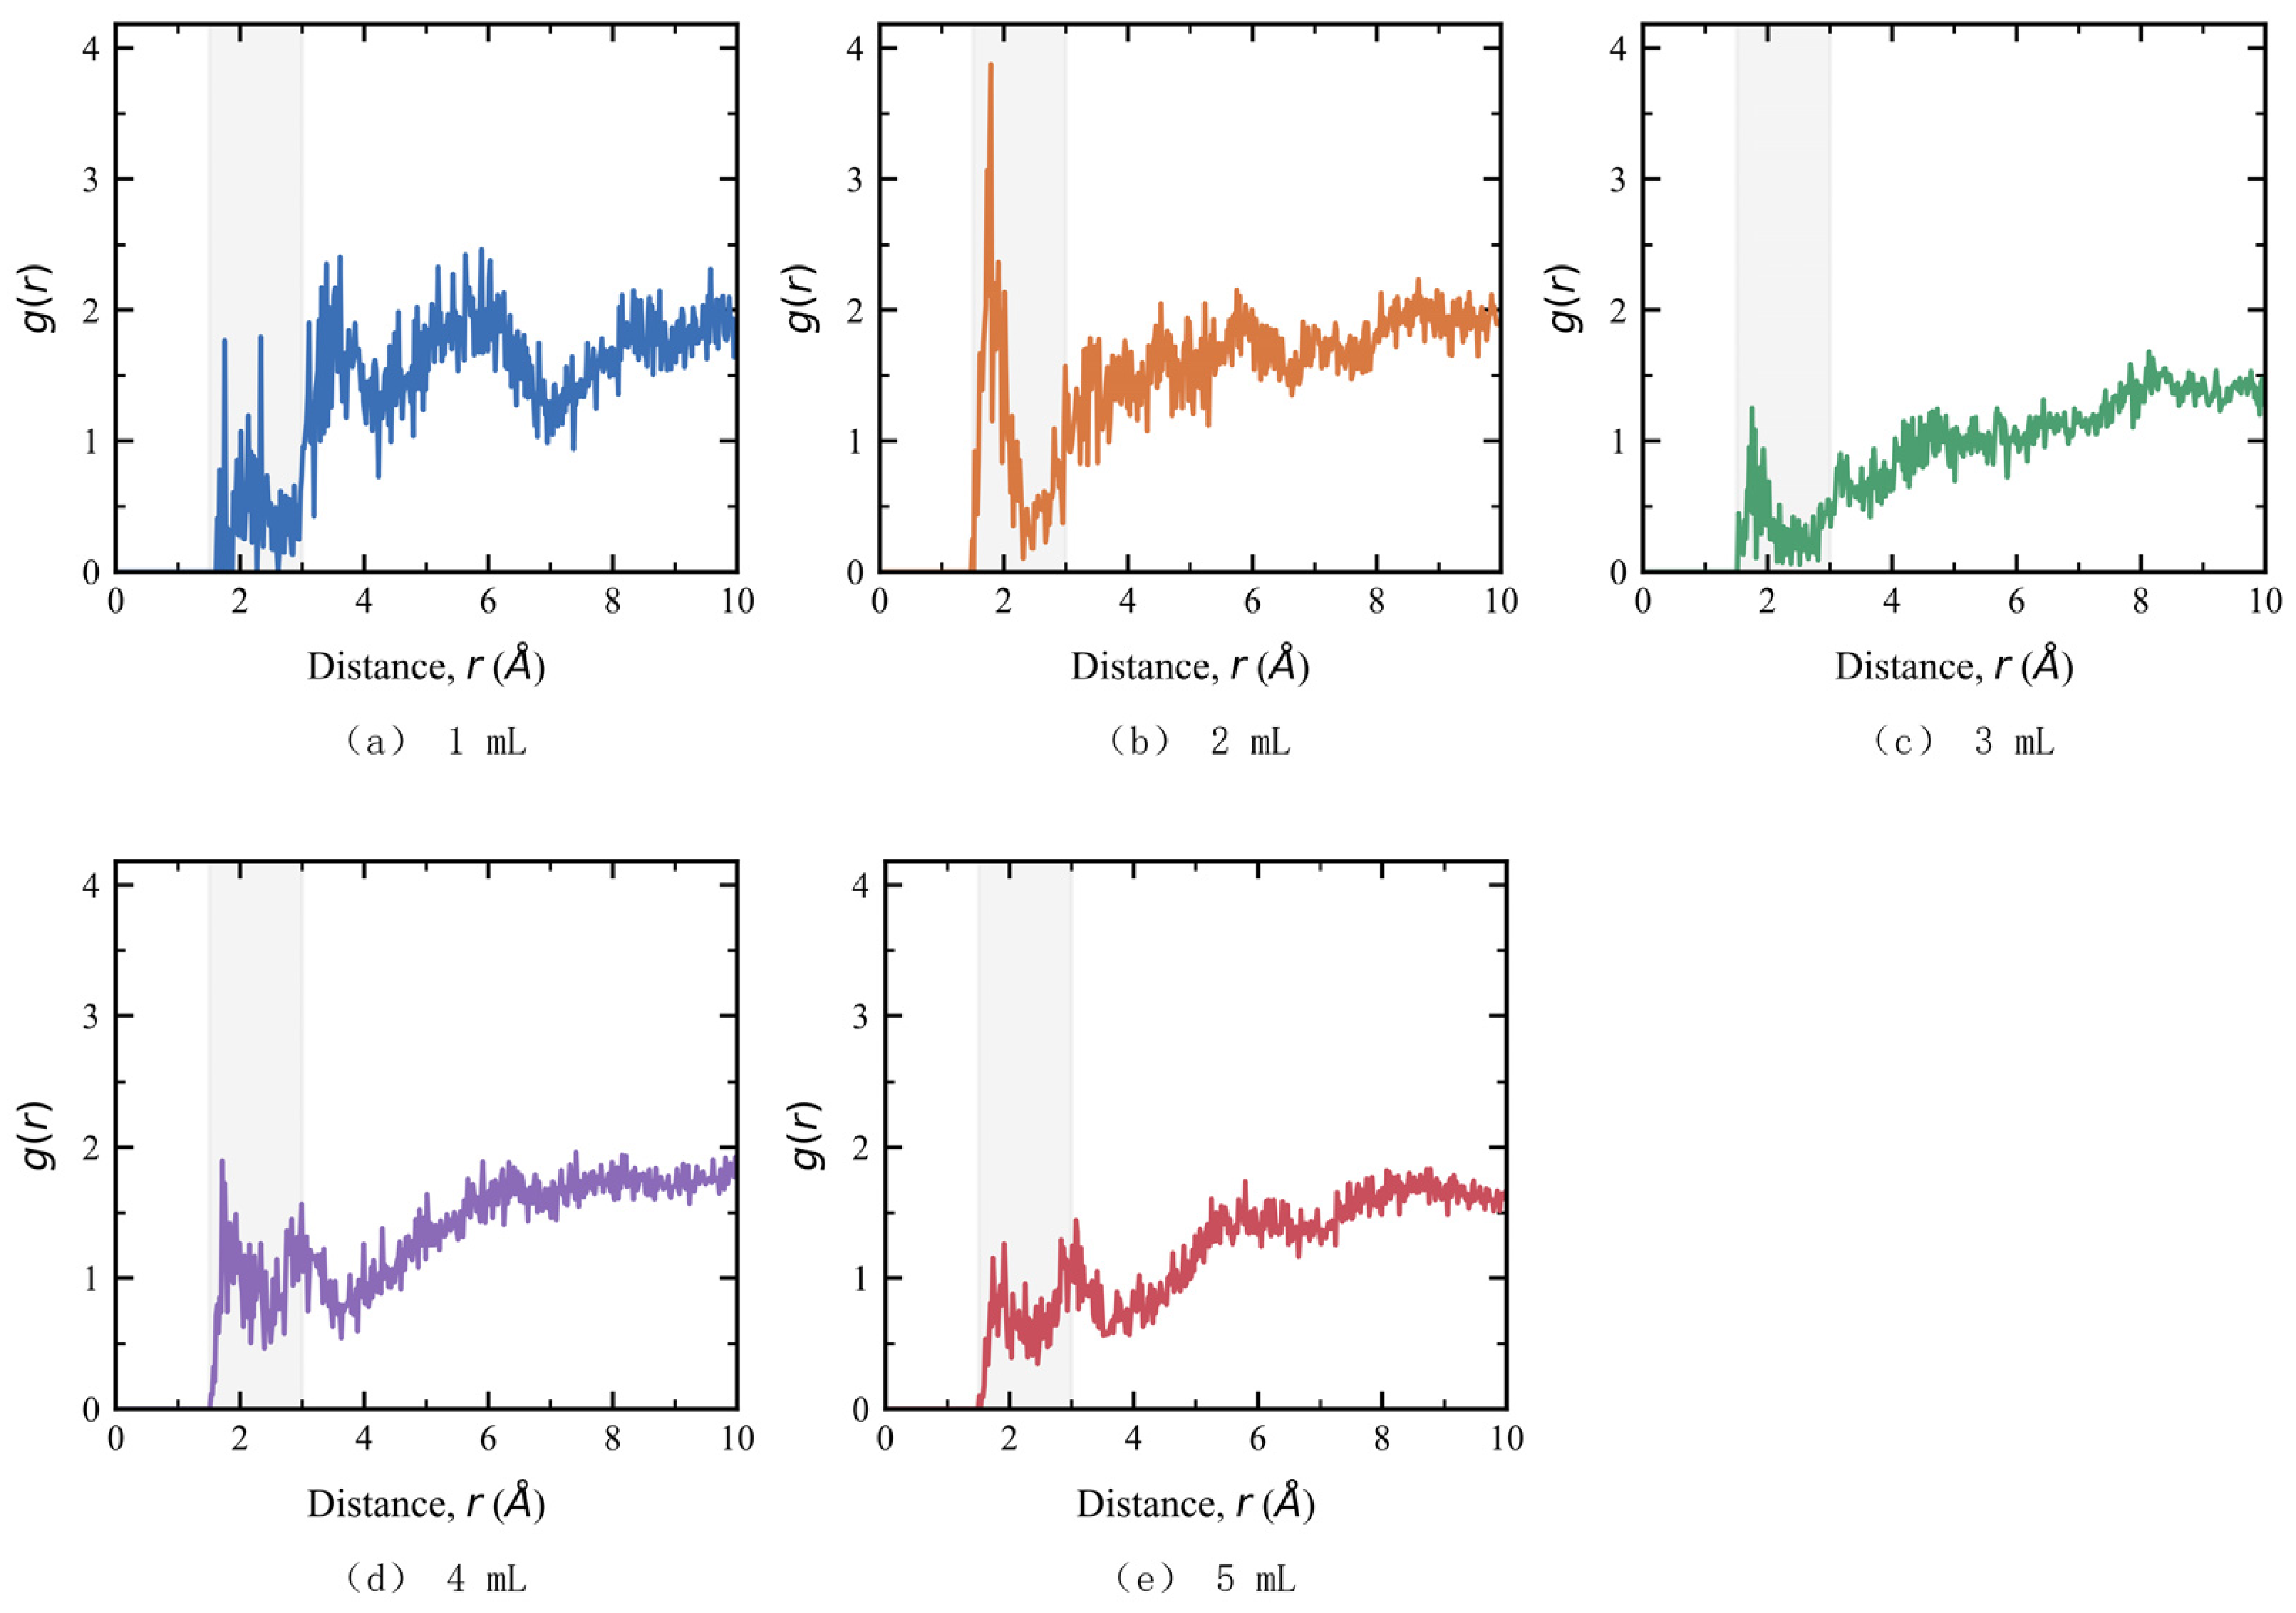
Figure 6 shows the RDFs between anthocyanin hydroxyl hydrogen and polysaccharide oxygen sites. For M1–M5, the peak positions were 1.75, 1.79, 1.75, 1.71, and 1.73 Å, and the peak heights were 1.767, 3.875, 1.252, 1.897, and 1.155, respectively. Based on the unrounded values, the M2 peak was 119.32% higher than the M1 peak. Peak positions varied over a range of 0.08 Å, whereas peak heights varied more across models. This indicates that loading altered the relative distribution near the selected short range distances. Both RDFs had their highest peak in M2. Bond energy and the number of contacts that carry load would require separate measurements. Studies of anthocyanin films reinforced with nanocellulose have also discussed how the arrangement of matrix and added components affects performance [36].
Figure 6.
RDF between Anthocyanin Hydroxyl Hydrogen and Polysaccharide Oxygen Sites (The shaded are marks the short range interval of 1.5–3.0 Å).
An RDF local peak is a relative maximum within a specified distance interval and can have a value below one. Simulations of chitosan/amylose blends have also used intermolecular RDFs to examine local structure and compatibility [37]. In Equation (8), g(r) < 1 indicates a local number density below the reference value, and g(r) > 1 indicates relative enrichment. We compare local distributions using the same atom selections. The O⋯O peak at 2.53–2.75 Å describes proximity. Anthocyanin–polysaccharide hydrogen bonds are identified separately using both distance and angle criteria.
From M2 to M5, both RDF peak heights decreased, increased, and then decreased again, following the same sequence as the measured tensile strengths of the 2–5 mL groups. The RDFs describe spatial proximity, while the target hydrogen bond counts quantify donor–acceptor pairs that meet the distance and angle criteria. Both measures provide complementary descriptions of the same trajectory.
3.4. Hydrogen Bonding Between Anthocyanin and the Polysaccharide Matrix
The mean hydrogen bond count for the complete system ranged from 2212.8 to 2299.3 and was highest in M5 (Table 5). This count includes pairs within and between polysaccharide chains and pairs involving glycerol and pigment. Its maximum occurred at a different loading from the maximum measured tensile strength. To match the atom selection for the anthocyanin–matrix RDF, we separately counted target pairs of anthocyanin hydroxyl donors with CS/SA oxygen acceptors. Spectroscopic analysis of sodium alginate films containing anthocyanins encapsulated in quaternized chitosan nanocomplexes has also linked hydrogen bonding to film properties [38]. Cellulose nanocrystals improved the mechanical properties of chitosan/anthocyanin films [39], and infrared spectra indicated interactions between blueberry anthocyanins and a pectin/sodium alginate/xanthan gum matrix [40].
Table 5.
Hydrogen Bonds in the Complete System and Target Anthocyanin–Polysaccharide Hydrogen Bonds.
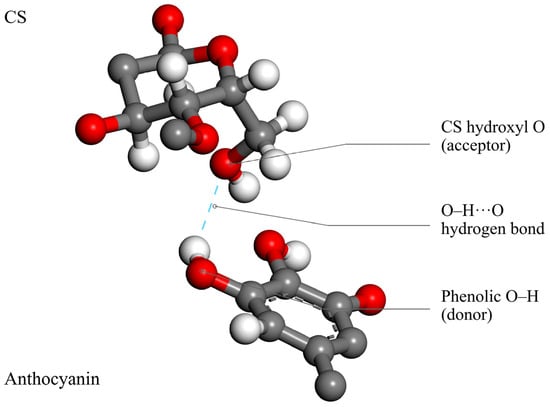
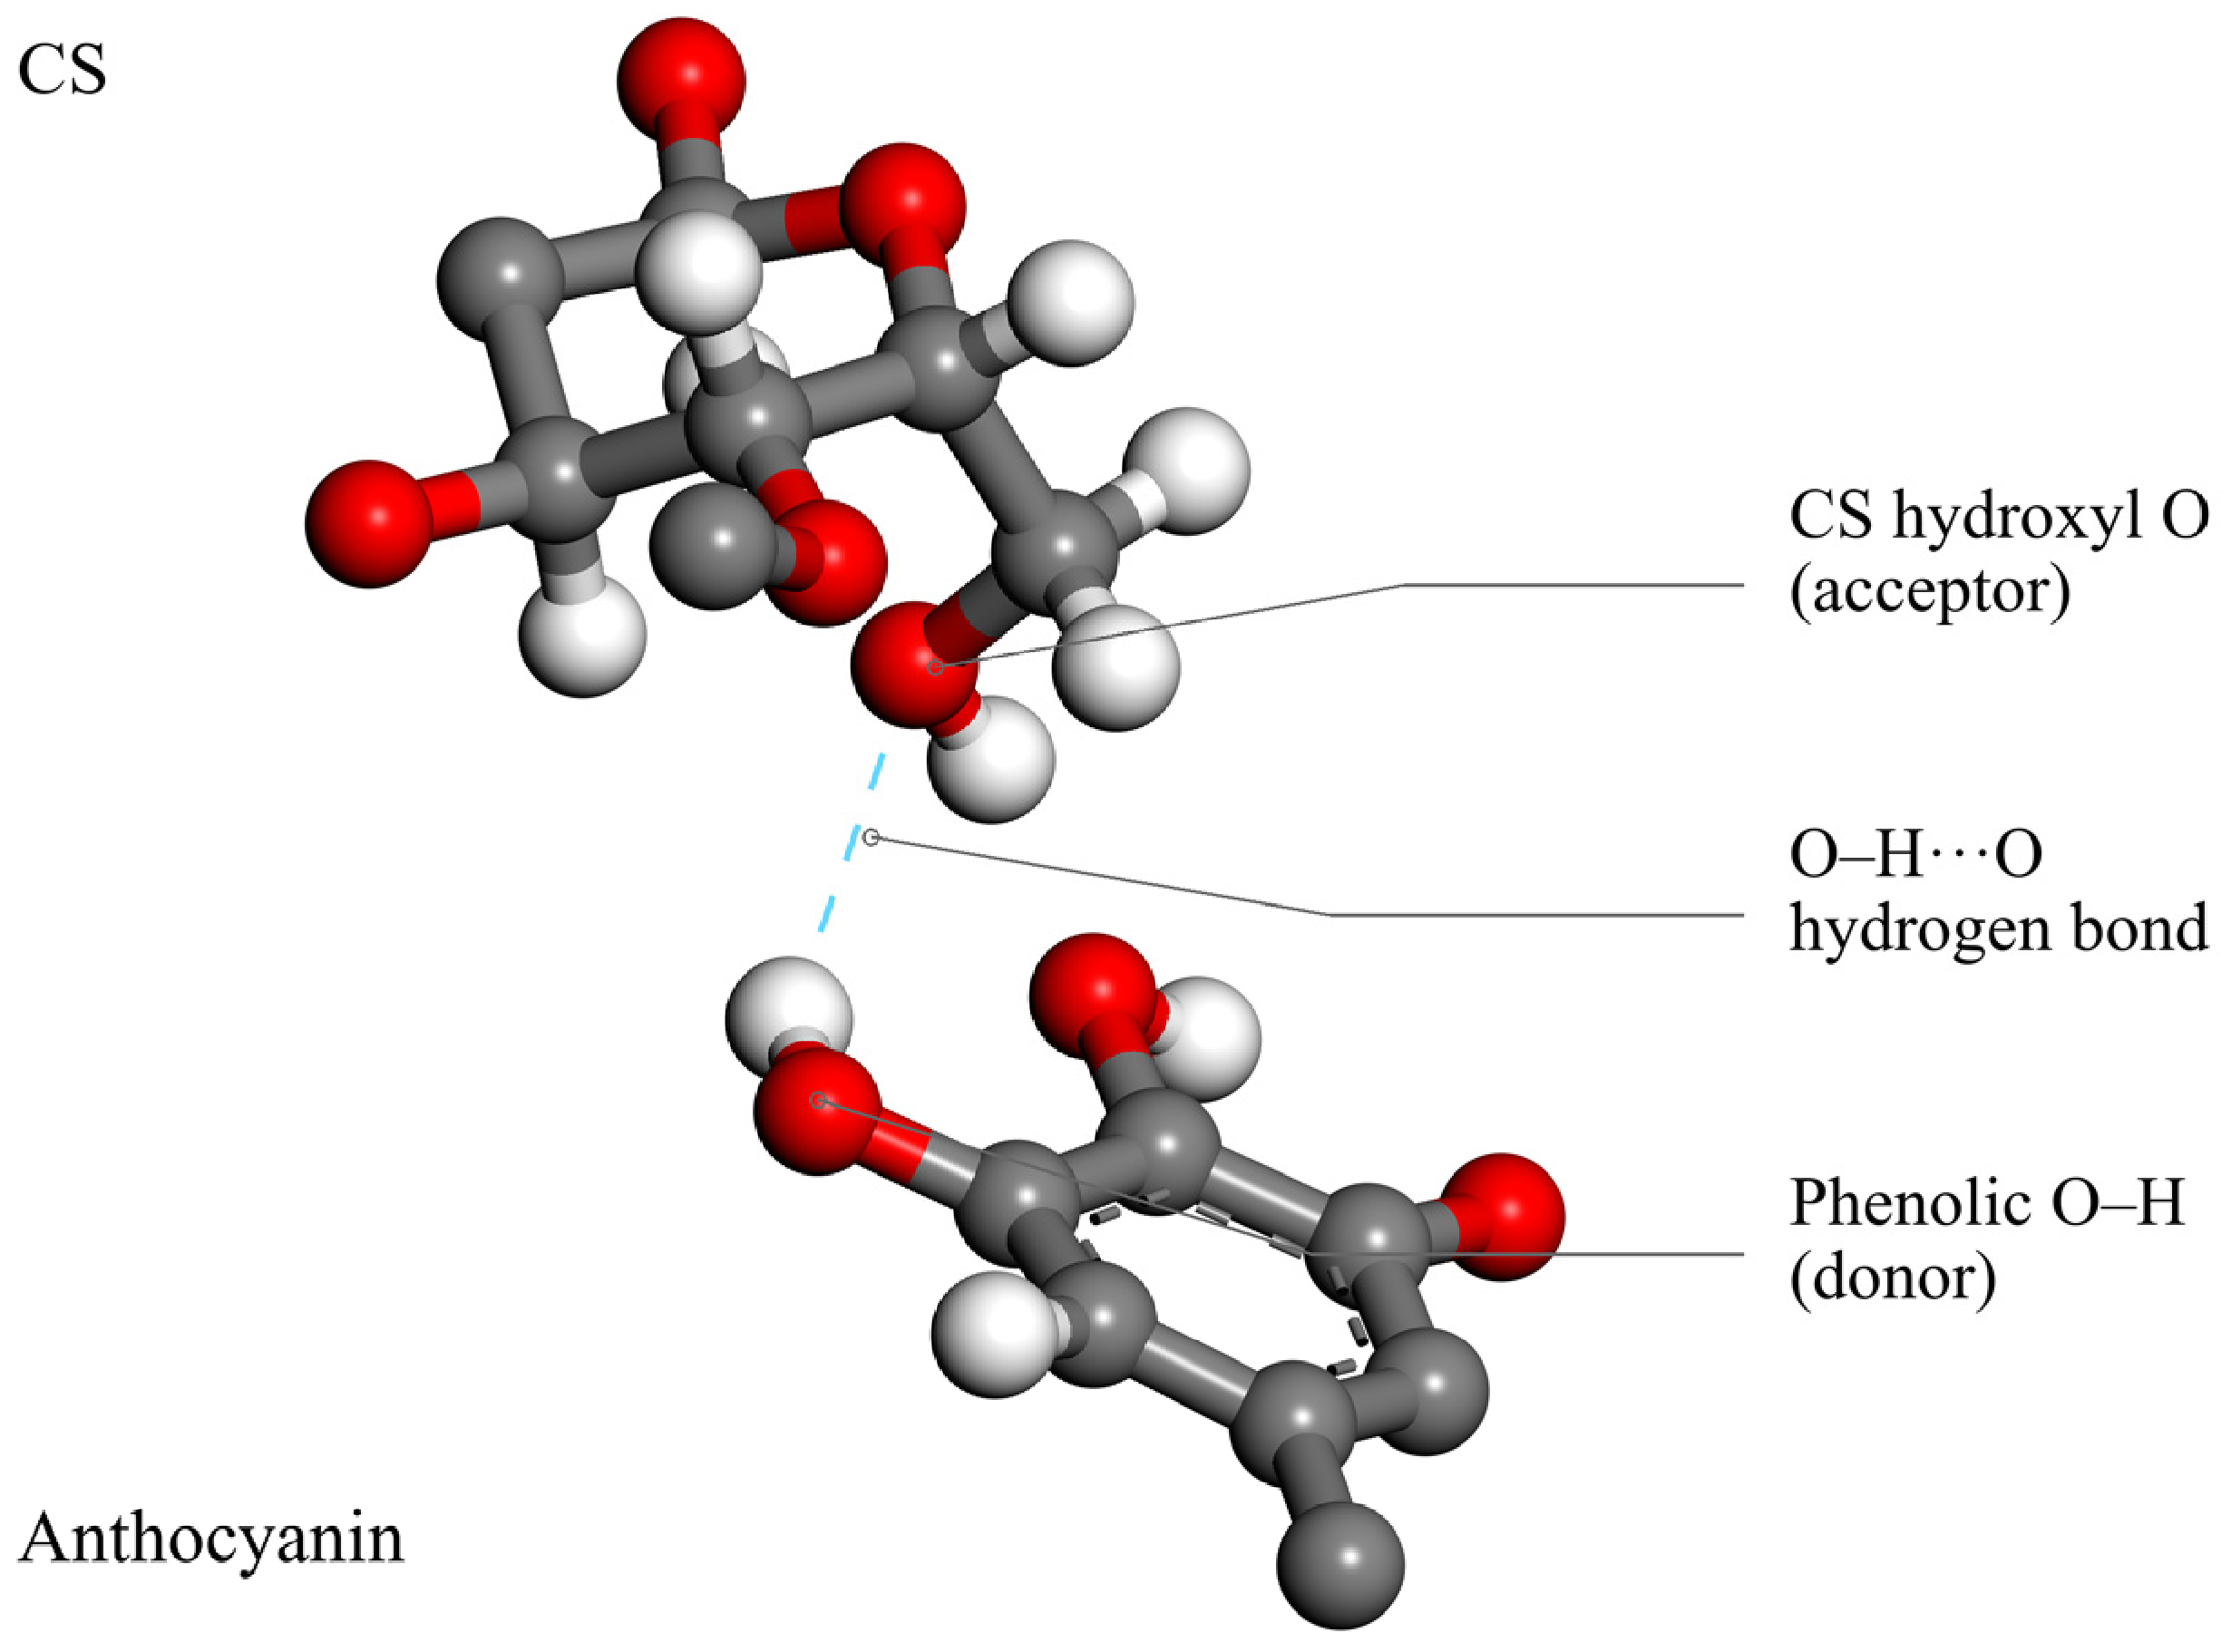
Figure 7 shows one anthocyanin hydroxyl O–H⋯O contact in M2, with the oxygen of a CS hydroxyl group as the acceptor. The figure shows local molecular fragments. Red, gray, and white spheres denote O, C, and H, respectively, and the dashed line marks the contact in this configuration. Mean participation was compared across models by counting pairs that met the distance and angle criteria along the trajectory.
Figure 7.
Local Hydrogen Bond Configuration between an Anthocyanin Phenolic Hydroxyl Group and a CS Hydroxyl Oxygen.
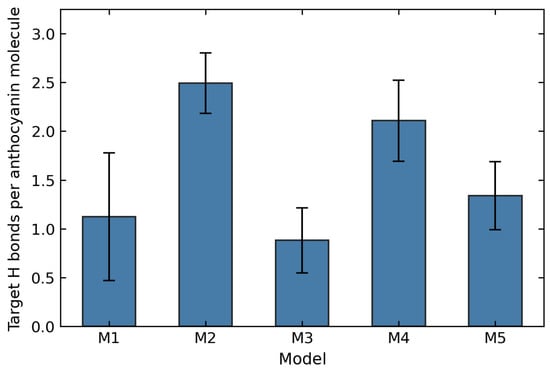
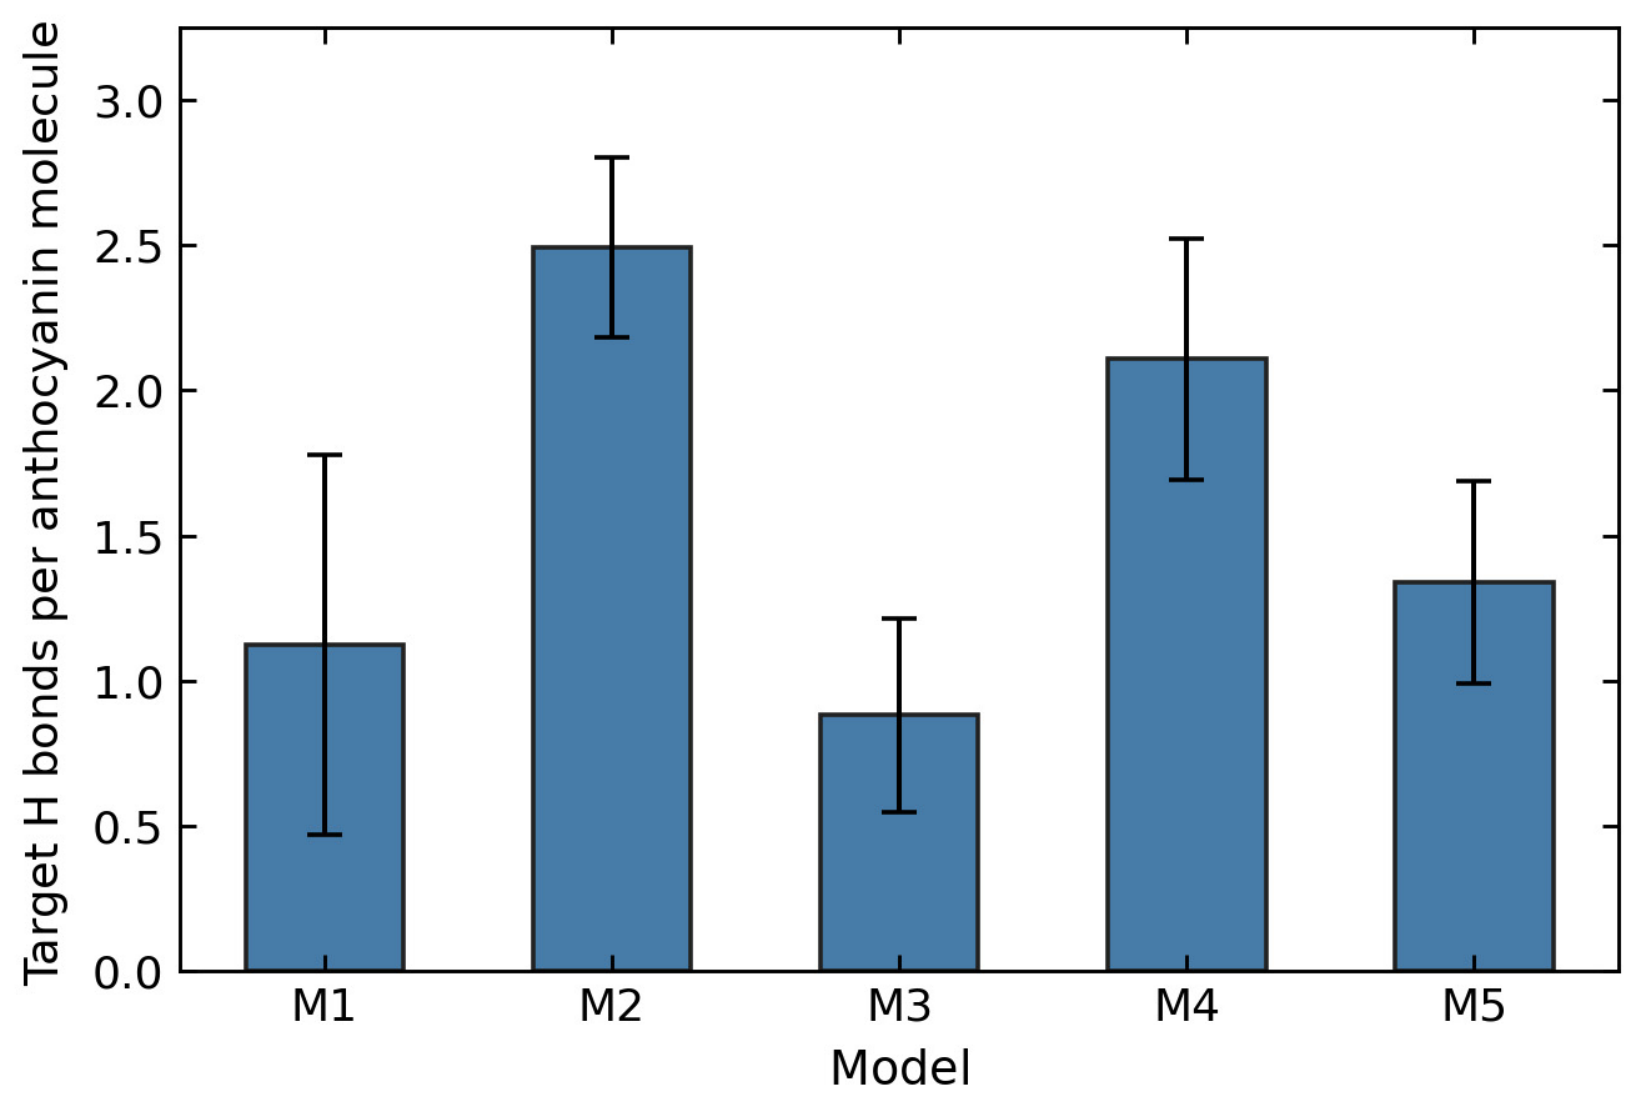
The total target hydrogen bond counts for the groups nominally labeled 1–5 mL were 1.12 ± 0.66, 4.99 ± 0.62, 2.64 ± 1.00, 8.43 ± 1.66, and 6.69 ± 1.74, respectively. The 4 mL group had the highest total count and contained more pigment molecules. After normalization by pigment count, the values were 1.12 ± 0.66, 2.49 ± 0.31, 0.88 ± 0.33, 2.11 ± 0.42, and 1.34 ± 0.35 per anthocyanin molecule (Figure 8). The M2 value was 121.97% higher than M1 and 18.30% higher than M4. From M2 to M4, the pigment count increased by 100% and the total target count increased by only 69.06%, while the target count per pigment molecule decreased by 15.47%. Directional pairing with polysaccharides therefore increased less than proportionally to the pigment count.
Figure 8.
Target Hydrogen Bond Count per Anthocyanin Molecule.
The error bars in Figure 8 represent the standard deviation of target hydrogen bond counts across 81 frames of the same trajectory. Both means and standard deviations were normalized by the number of anthocyanin molecules in each model. Figure 8 and Table 5 use the same statistics.
Over the analysis window, M2 had both the highest short range anthocyanin–matrix RDF peak and the highest target hydrogen bond count per pigment molecule. The two measures describe the short range distribution of the selected atom pairs and the directional pairs meeting the geometric criteria, respectively, using the same trajectory.
The target count per pigment molecule was lower in M3–M5 than in M2, indicating that the total number of polysaccharide pairs in the selected direction did not increase in proportion to pigment count. This suggests testable hypotheses about local site occupancy and orientation. Distinguishing these explanations requires analysis of contacts between pigment molecules, pairs across chains, and their lifetimes.
The RDFs and target hydrogen bond counts describe short range spatial distributions and directional pairing, respectively, in the same trajectories. M2 had the highest values for both local measures. The frozen component potential energy differences were then compared to assess whether the energy ranking agreed with those of local contacts and measured tensile strength.
3.5. Interaction Energy Between the Pigment Group and the Matrix
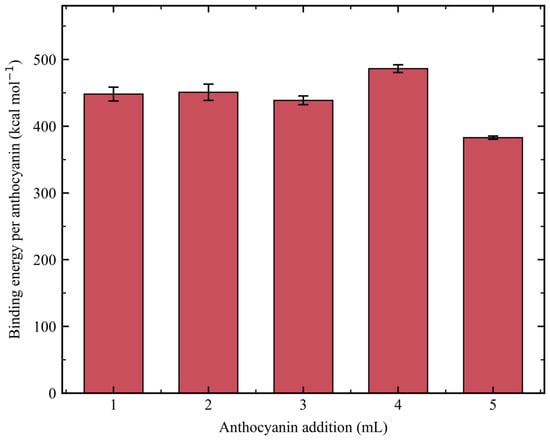
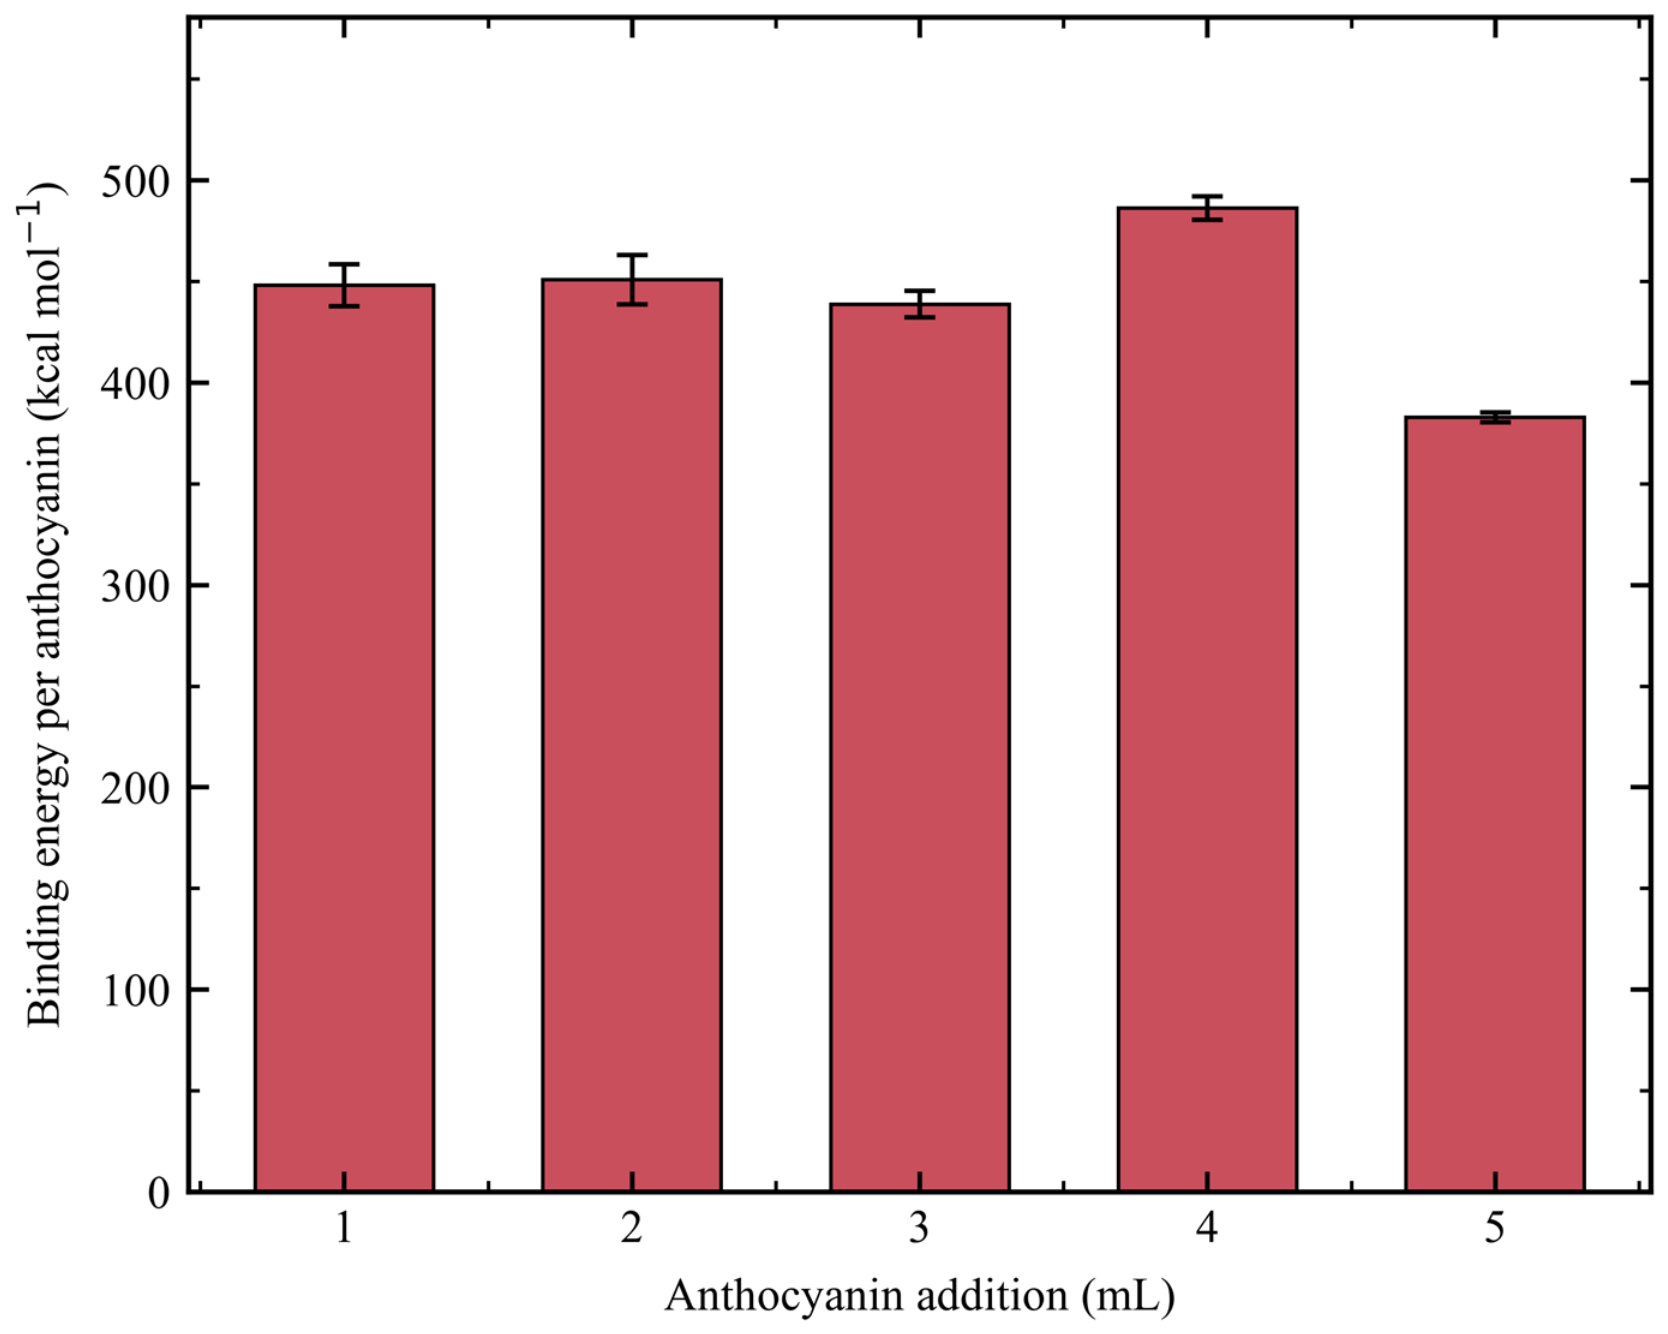
Table 6 lists the interaction energies and component binding energies. The total binding energies for M1–M5 were 448.31 ± 10.39, 901.94 ± 24.58, 1316.53 ± 19.91, 1945.55 ± 22.76, and 1914.39 ± 12.36 kcal mol−1, respectively. The corresponding interaction energies were negative by Equation (11). Total binding energy increased from M1 to M4 and decreased slightly in M5. The CVs were 2.32%, 2.72%, 1.51%, 1.17%, and 0.65%, respectively, and describe dispersion around the mean for the five selected configurations. To compare models with different pigment counts, the potential energy difference was divided by the number of pigment molecules.
Table 6.
Component Interaction and Binding Energies at Different Anthocyanin Loadings.
Figure 9 shows the component binding energy per anthocyanin molecule. The values for M1–M5 were 448.31 ± 10.39, 450.97 ± 12.29, 438.84 ± 6.64, 486.39 ± 5.69, and 382.88 ± 2.47 kcal mol−1, respectively. The value for M4 was 7.85% higher than that for M2. The tensile strength of the 4 mL formulation (8.68 MPa) was lower than that of the 2 mL formulation (9.57 MPa). Both RDF peaks and the target hydrogen bond count per anthocyanin molecule were also lower in M4 than in M2. The frozen component potential energy differences thus gave a different ranking from the local contact measures and tensile strengths. Work on composite films containing nanoscale polyphenol components has also considered matrix structure when interpreting component interactions and material performance [41].
Figure 9.
Component Binding Energy per Anthocyanin Molecule.
The error bars in Figure 9 are sample standard deviations across five frozen configurations. The binding energy per pigment molecule includes potential energy contributions from its accompanying components and the complete matrix. The target hydrogen bond count concerns a narrower set of contacts.
M4 had the highest component binding energy per pigment molecule, whereas M2 had the highest target hydrogen bond count per pigment molecule. The energy difference includes interactions involving acetate and matrix components such as Na+ and glycerol. The count includes only anthocyanin–polysaccharide pairs in the selected direction that meet the geometric criteria. The two rankings apply to their respective measures. Direct interactions between anthocyanin and the polysaccharides and the strength of individual hydrogen bonds would require separate calculations.
The differences in mean potential energy between the later and earlier 40 ps blocks, divided by the number of atoms, were −0.0030, −0.0023, +0.0005, −0.0051, +0.0013, and −0.0012 kcal mol−1 per atom for M0–M5, respectively. The mean potential energies for the full M2 cell were 12,108.38 and 12,113.34 kcal mol−1 in the earlier and later blocks, respectively. This comparison quantifies changes in mean potential energy within the existing sampling window. The ranking of local contacts remains based on one trajectory per model.
3.6. Comparison of Simulated Local Structure and Tensile Results
Table 7 compares experimental and simulation measures. The 2 mL formulation had the highest reported tensile strength and extension at break. In the corresponding M2 model, the short range CS–SA peak was 76.58% higher than in M0. The anthocyanin–matrix peak and the target hydrogen bond count per pigment molecule were 119.32% and 121.97% higher than in M1, respectively. From 2 to 5 mL, both short range peak heights and measured tensile strength decreased, increased, and then decreased again.
Table 7.
Changes in Key Measures for the 2 mL Formulation and the M2 Model Relative to the Specified Reference Groups.
Tensile strength fell to 6.91 MPa at 3 mL, rose to 8.68 MPa at 4 mL, and fell again to 7.20 MPa at 5 mL. Both RDF peaks followed the same sequence. The full rankings for the target hydrogen bond count per pigment molecule and component binding energy differed from the tensile strength ranking. A single local statistic or energy measure is therefore insufficient to explain the full tensile strength ranking. Studies of other chitosan-based anthocyanin films [42] and nanocrystal composite films [43] have also used complementary measures to examine component interactions and matrix arrangement. Microscopy has also been used to compare the morphology of chitosan/poly(vinyl alcohol) films prepared with anthocyanin extracts from two plant sources [44].
Table 7 specifies the reference group and denominator for each comparison. The binding energy per pigment molecule for M2 was 7.28% lower than M4 and 17.78% higher than M5. Conversely, M4 was 7.85% higher than M2 because reversing the comparison changes the denominator. The increase in the CS–SA peak height, calculated from 1.5470 and 0.8761, was 76.58%. Table 7 retains the digits used to calculate these percentages. The displayed precision reflects the calculation inputs.
The 2 mL group had the highest tensile values in the available records. The corresponding M2 model had the highest values for both short range RDF peaks and the target hydrogen bond count per pigment molecule within the specified trajectory window. This agreement between group rankings identifies local pigment–polysaccharide pairing as a structural feature for further testing. The current analysis did not calculate connectivity across chains, contact lifetimes, or stress transfer during tensile deformation. Assessment of mechanical reproducibility and the effects of drying requires individual specimen measurements and comparisons under uniform film preparation conditions.
Both RDF peaks and the target hydrogen bond count per pigment molecule rose from M3 to M4 and fell again in M5. Likewise, the measured tensile strength rose from 3 to 4 mL and fell at 5 mL. This rebound describes a change in the reported values. Structural recovery would require separate evidence. Studies of films with multiple active components have also examined how component interactions relate to formulation performance [45]. In this study, neither an increase in pigment count nor a higher component binding energy corresponded to sustained gains in mechanical performance.
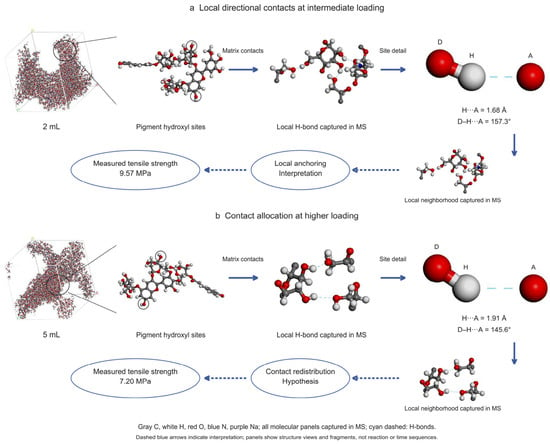
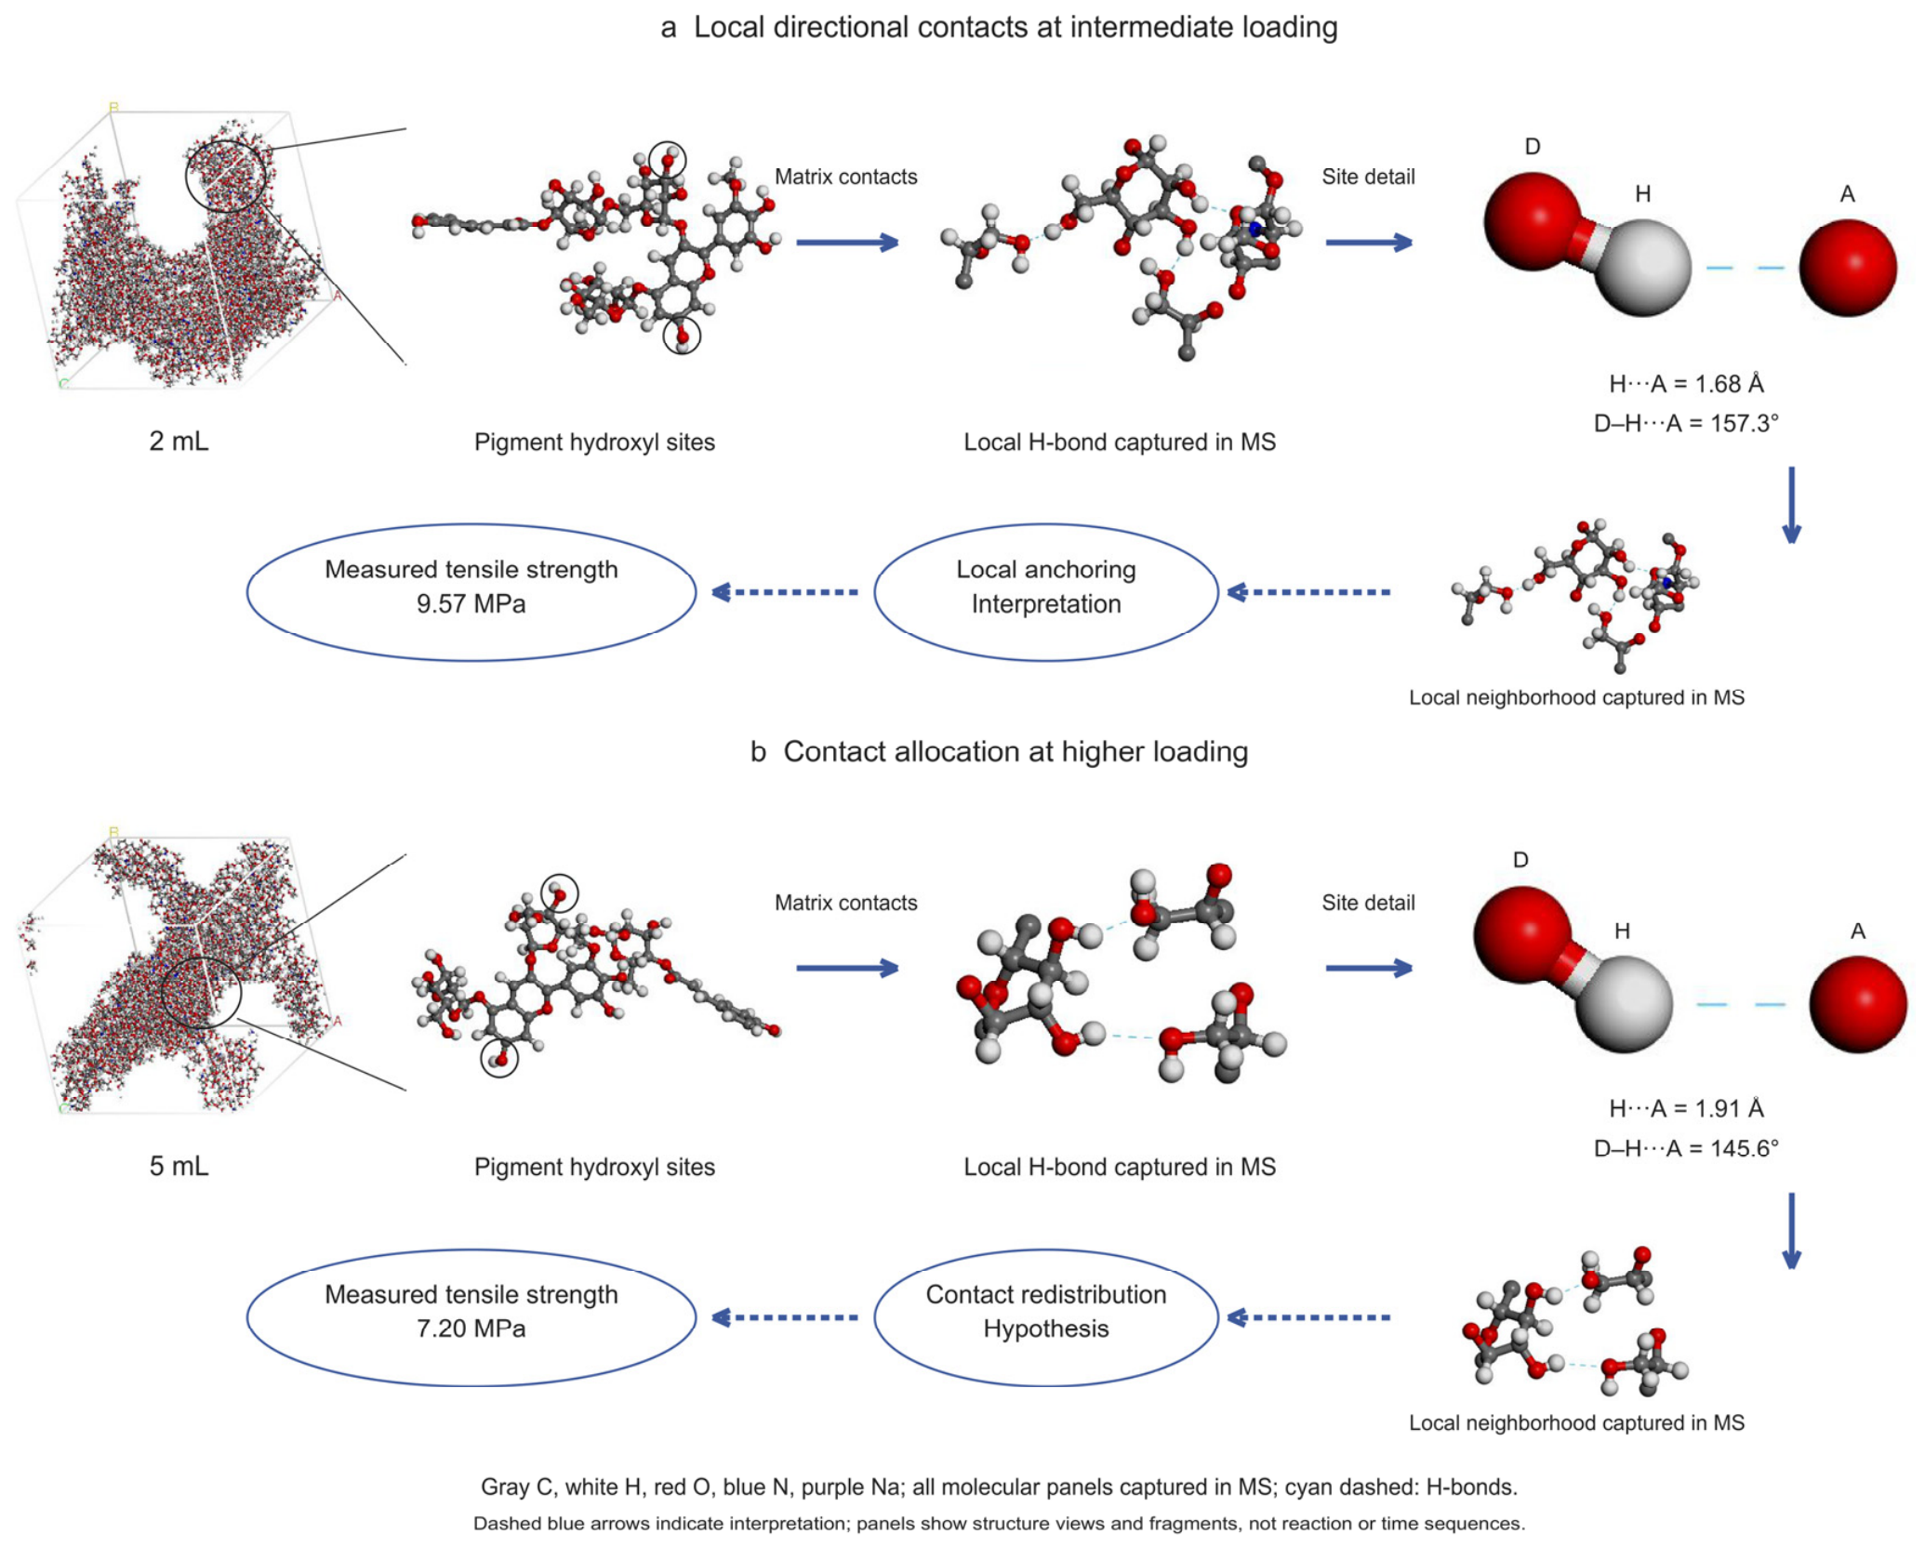
Figure 10 compares the periodic models, local contact geometries, and tensile records for M2 and M5 and their corresponding formulations. Both examples show an anthocyanin alcohol hydroxyl O–H group contacting a CS hydroxyl oxygen. The H⋯A distance and D–H⋯A angle were 1.68 Å and 157.3° in the M2 example and 1.91 Å and 145.6° in the M5 example, respectively. Both contacts meet the hydrogen bond criteria. These values describe the configurations shown.
Figure 10.
Local Hydrogen Bond Configurations and Their Association with the Tensile Response for the 2 and 5 mL Groups.
Figure 10a,b correspond to the nominal 2 mL and 5 mL groups, respectively. D is the donor, H is the hydrogen atom covalently bonded to D, and A is the acceptor. Gray, white, red, blue, and purple spheres denote C, H, O, N, and Na, respectively. Cyan dashed lines indicate the illustrated hydrogen bonds. Solid blue arrows link successive structural views, and dashed blue arrows connect the interpretations of the local configurations to the measured tensile strengths.
The examples in Figure 10 show anthocyanin–CS contacts meeting the geometric criteria in both M2 and M5. The target hydrogen bond counts per pigment molecule were 2.49 ± 0.31 and 1.34 ± 0.35 over the trajectory window for M2 and M5, respectively. The corresponding formulations had tensile strengths of 9.57 and 7.20 MPa. This comparison shows how local pairing and tensile values vary between the two groups. The mechanism of load transfer requires independent structural and mechanical evidence.
3.7. Visual Response of the Composite Films in Chicken Packaging
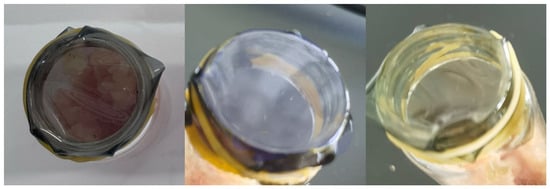
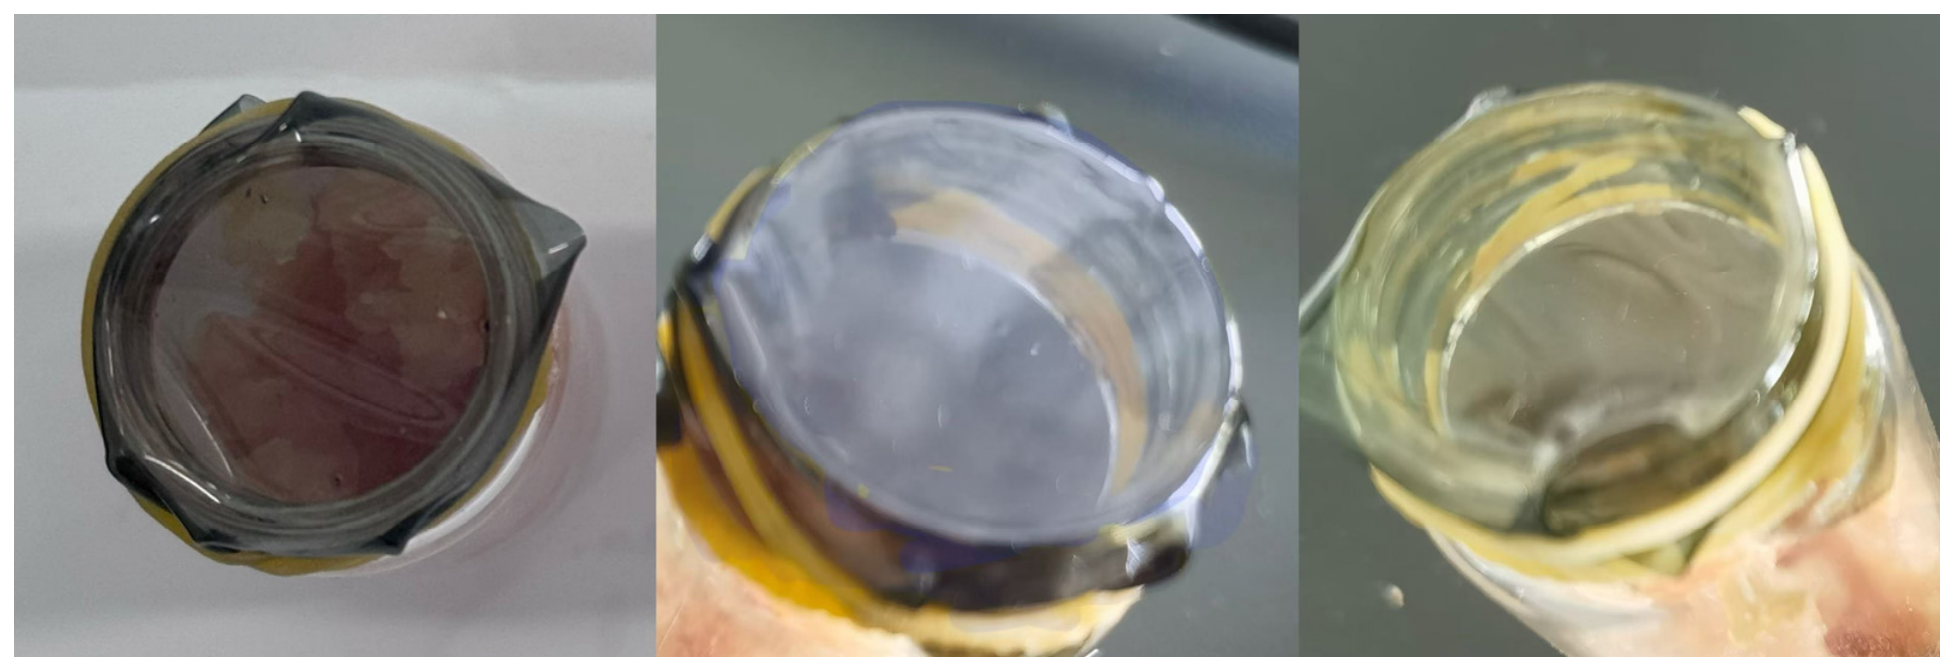
Figure 11 shows three representative colors of the indicator films in the chicken packaging test at 4 °C: purple, bluish, and yellow green. The sensitivity of anthocyanins to acidity and alkalinity provides a basis for the color response to changes in the packaging environment [6,8]. The test recorded film color and color differences. Calibration of each color against chicken quality would require spoilage indicators measured at the same times.
Figure 11.
Representative Colors of the Composite Films during the Chicken Packaging Test.
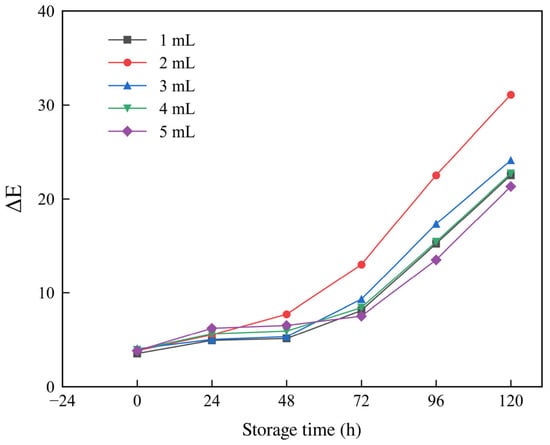
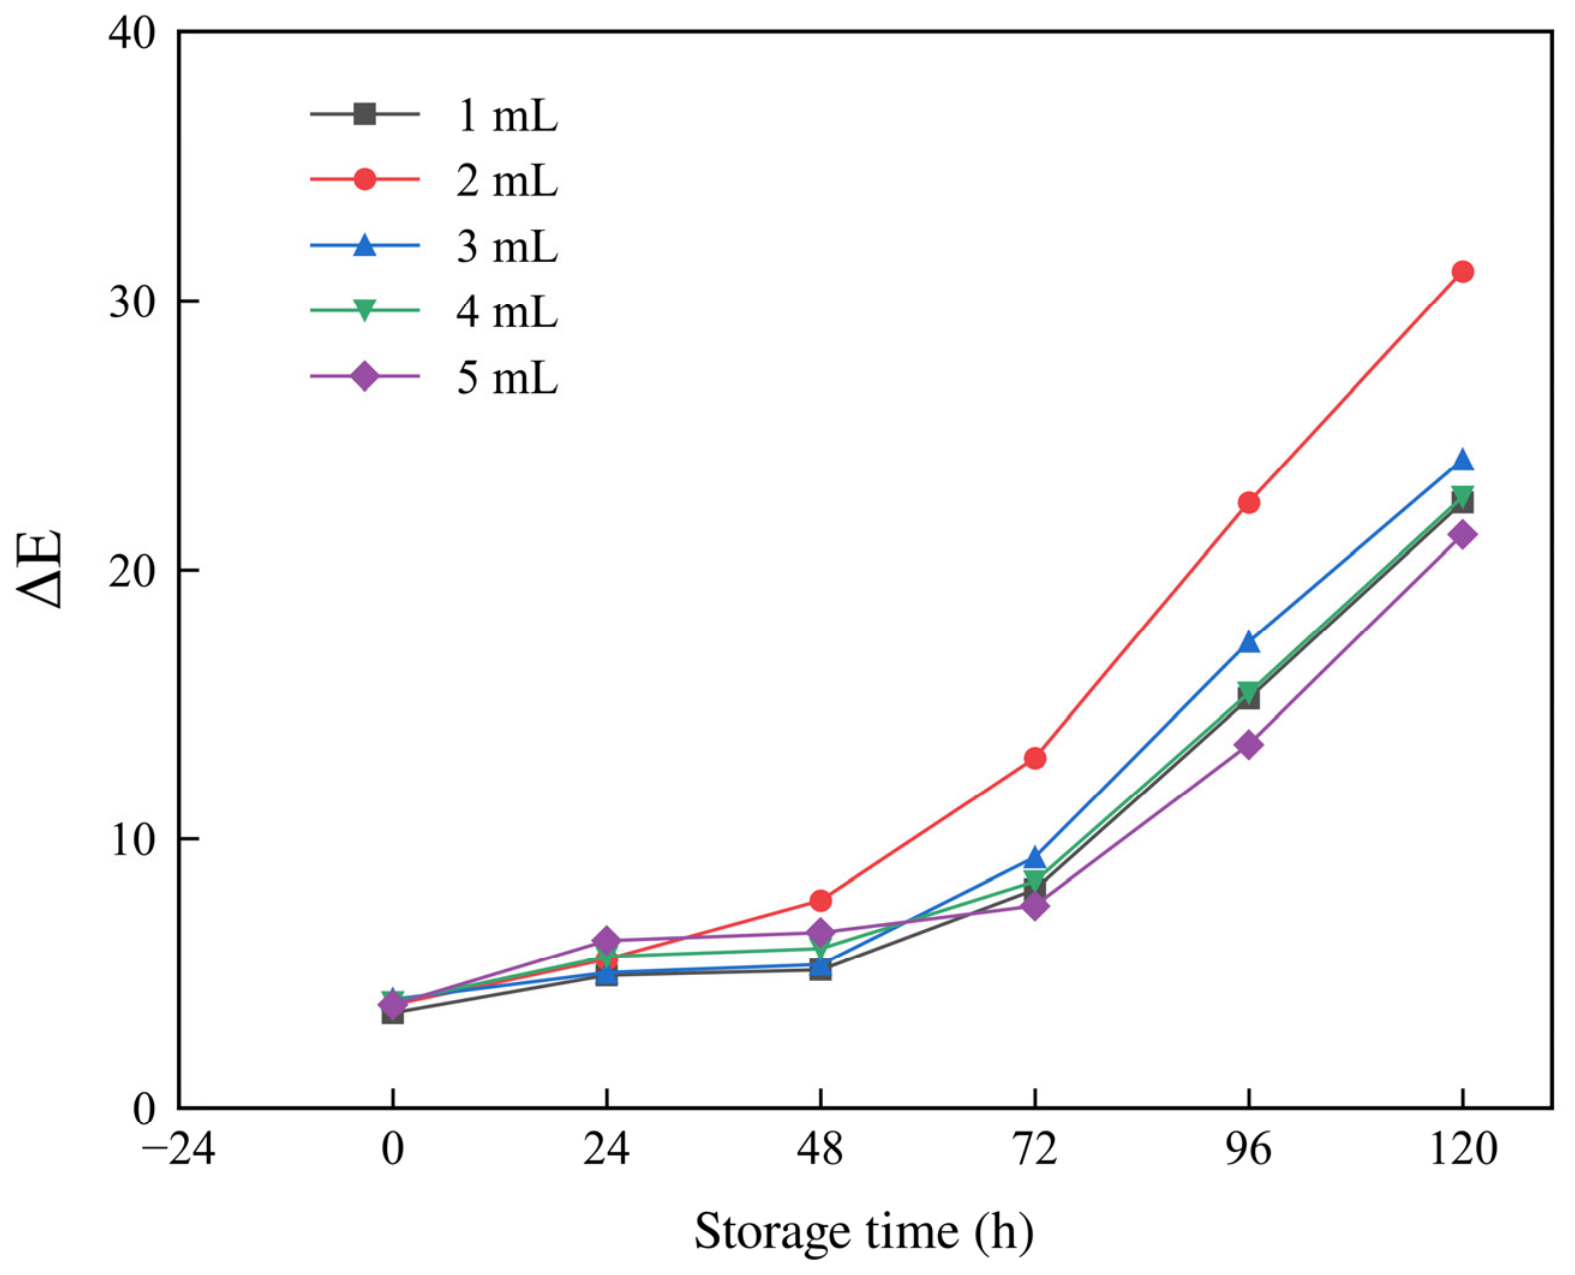
At 4 °C, ΔE increased with storage time for all formulations containing pigment (Figure 12). At 24 h, the 5 mL group had the highest ΔE (6.2). At 48 h, ΔE was 7.7 in the 2 mL group and 6.5 in the 5 mL group. The 2 mL group reached ΔE values of 13.0, 22.5, and 31.1 at 72, 96, and 120 h, respectively, the highest at each time point. At 120 h, the values for the 1, 3, 4, and 5 mL groups were 22.5, 24.1, 22.7, and 21.3, respectively. These data describe the color response under the tested packaging conditions. To classify freshness using color, ΔE would need to be compared with TVB-N, total viable counts, and pH for the same batches and time points before color difference thresholds can be set.
Figure 12.
Color Difference during Storage in Chicken Packaging for Composite Films at Different Anthocyanin Loadings.
Among the tested formulations, the 2 mL group had the highest recorded tensile strength and extension at break and the largest color difference at every measured time point from 48 to 120 h. These three observations inform the selection of a formulation for subsequent validation.
4. Conclusions
This study compared the tensile records, molecular structure within a defined sampling window, and color response during chicken packaging for CS/SA composite films at different anthocyanin loadings. The main findings are summarized below.
- Among the six formulations containing 0–5 mL of extract, the 2 mL group had the highest tensile strength (9.57 MPa) and extension at break (3.77 mm), 45.66% and 95.34% above the 0 mL group, respectively. Both measures initially increased and then declined with fluctuations. Quantifying uncertainty between groups and the effects of drying would require verifiable replicate data.
- Within the final NVT analysis window, M2 had the highest short range CS–SA and anthocyanin–matrix RDF peaks (1.547 and 3.875, respectively) and the highest target hydrogen bond count per anthocyanin molecule (2.49 ± 0.31). M4 had the highest component binding energy per pigment molecule. Local pairing, component potential energy differences, and tensile measurements describe distinct properties. The structural rankings are based on one final NVT trajectory per model and characterize local structure within the analysis window.
- In the chicken packaging test at 4 °C, the 2 mL group had the largest color difference at every measured time point from 48 to 120 h, reaching 31.1 at 120 h. Among the formulations tested, this group combined the highest recorded tensile values with the largest color differences in the middle and late stages of storage. These observations support selecting it for further validation. The relationship between color and the extent of chicken spoilage still requires calibration against spoilage indicators measured at the same times.
Author Contributions
Conceptualization, J.D.; Methodology, X.Z.; Software, Y.L.; Investigation, J.H. and X.Z.; Resources, J.D.; Writing—original draft, Y.L.; Writing—review & editing, J.D.; Supervision, J.D.; Project administration, J.D.; Funding acquisition, J.D. All authors have read and agreed to the published version of the manuscript.
Funding
This research was supported by the 2026 Joint Fund Cultivation Program of the Heilongjiang Provincial Natural Science Foundation, under the project “Preparation of Biodegradable Intelligent Packaging Materials and Investigation of Their Regulation Mechanisms” (PL2026E106), and the Graduate Research Innovation Project of Harbin University of Commerce (YJSCX2026-845HSD).
Data Availability Statement
The original contributions presented in this study are included in the article. Further inquiries can be directed to the corresponding author.
Acknowledgments
The authors thank the Department of Science and Technology of Heilongjiang Province for supporting this work through the 2026 Provincial Natural Science Foundation Joint Fund Cultivation Project, “Preparation of Biodegradable Intelligent Packaging Materials and Investigation of Their Regulation Mechanisms” (PL2026E106), and acknowledge funding from the Graduate Research Innovation Project of Harbin University of Commerce (YJSCX2026-845HSD).
Conflicts of Interest
The authors declare no conflict of interest.
References
- He, M.; Zheng, Y.; Shen, J.; Shi, J.; Zhang, Y.; Xiao, Y.; Che, J. Chitosan/Sodium Alginate Multilayer pH-Sensitive Films Based on Layer-by-Layer Self-Assembly for Intelligent Packaging. J. Renew. Mater. 2024, 12, 215–233. [Google Scholar] [CrossRef] [Scilit]
- He, B.; Gao, Y.; Lou, W.; Wang, J.; Xin, S.; Ma, K.; Li, L. Biodegradable food packaging films: Material source, mechanical and water vapor barrier properties, and improvement strategies—A comprehensive review. Food Res. Int. 2025, 211, 116431. [Google Scholar] [CrossRef] [Scilit] [PubMed]
- Hu, D.; Liu, X.; Qin, Y.; Yan, J.; Yang, Q. A novel intelligent film with high stability based on chitosan/sodium alginate and coffee peel anthocyanin for monitoring minced beef freshness. Int. J. Food Sci. Technol. 2022, 57, 4673–4686. [Google Scholar] [CrossRef] [Scilit]
- Abdullah; Cai, J.; Hafeez, M.A.; Wang, Q.; Farooq, S.; Huang, Q.; Tian, W.; Xiao, J. Biopolymer-based functional films for packaging applications: A review. Front. Nutr. 2022, 9, 1000116. [Google Scholar] [CrossRef] [Scilit] [PubMed]
- Amin, U.; Khan, M.K.I.; Maan, A.A.; Nazir, A.; Riaz, S.; Khan, M.U.; Sultan, M.; Munekata, P.E.S.; Lorenzo, J.M. Biodegradable active, intelligent, and smart packaging materials for food applications. Food Packag. Shelf Life 2022, 33, 100903. [Google Scholar] [CrossRef] [Scilit]
- Zhao, L.; Liu, Y.; Zhao, L.; Wang, Y. Anthocyanin-based pH-sensitive smart packaging films for monitoring food freshness. J. Agric. Food Res. 2022, 9, 100340. [Google Scholar] [CrossRef] [Scilit]
- Yong, H.; Liu, J. Recent advances in the preparation, physical and functional properties, and applications of anthocyanins-based active and intelligent packaging films. Food Packag. Shelf Life 2020, 26, 100550. [Google Scholar] [CrossRef] [Scilit]
- Xiang, H.; Chen, X.; Gao, X.; Li, S.; Zhu, Z.; Guo, Z.; Cheng, S. Fabrication of ammonia and acetic acid-responsive intelligent films based on grape skin anthocyanin via adjusting the pH of film-forming solution. Int. J. Biol. Macromol. 2024, 258, 128787. [Google Scholar] [CrossRef] [Scilit] [PubMed]
- Wang, S.; Zhuang, D.; Li, R.; Liu, Z.; Zhu, J. Study on preservation and monitoring effect of sodium alginate-konjac glucomannan films loaded with tea polyphenols and Lycium ruthenicum anthocyanins. Int. J. Biol. Macromol. 2024, 264, 130483. [Google Scholar] [CrossRef] [Scilit] [PubMed]
- Wu, G.; Su, W.; Huo, L.; Guo, Q.; Wei, J.; Zhong, H.; Li, P. Sodium alginate/chitosan-based intelligent multifunctional bilayer film for shrimp freshness retention and monitoring. Int. J. Biol. Macromol. 2024, 277, 133908, Erratum in Int. J. Biol. Macromol. 2025, 305, 142030. [Google Scholar] [CrossRef] [Scilit] [PubMed]
- Zhang, J.; Zou, X.; Zhai, X.; Huang, X.; Jiang, C.; Holmes, M. Preparation of an intelligent pH film based on biodegradable polymers and roselle anthocyanins for monitoring pork freshness. Food Chem. 2019, 272, 306–312. [Google Scholar] [CrossRef] [Scilit] [PubMed]
- Oliveira Filho, J.G.D.; Braga, A.R.C.; Oliveira, B.R.D.; Gomes, F.P.; Moreira, V.L.; Pereira, V.A.C.; Egea, M.B. The potential of anthocyanins in smart, active, and bioactive eco-friendly polymer-based films: A review. Food Res. Int. 2021, 142, 110202. [Google Scholar] [CrossRef] [Scilit] [PubMed]
- Ma, P.; Wang, Y.; Fan, K. Intelligent packaging films based on anthocyanins: A review of structural properties, biodegradable polymers, application and prospects in food freshness monitoring. Food Chem. X 2026, 34, 103634. [Google Scholar] [CrossRef] [Scilit] [PubMed]
- Neves, D.; Andrade, P.B.; Videira, R.A.; de Freitas, V.; Cruz, L. Berry anthocyanin-based films in smart food packaging: A mini-review. Food Hydrocoll. 2022, 133, 107885. [Google Scholar] [CrossRef] [Scilit]
- Priyadarshi, R.; Ezati, P.; Rhim, J.W. Recent Advances in Intelligent Food Packaging Applications Using Natural Food Colorants. ACS Food Sci. Technol. 2021, 1, 124–138. [Google Scholar] [CrossRef] [Scilit]
- Zhu, B.; Zhong, Y.; Wang, D.; Deng, Y. Active and Intelligent Biodegradable Packaging Based on Anthocyanins for Preserving and Monitoring Protein-Rich Foods. Foods 2023, 12, 4491. [Google Scholar] [CrossRef] [Scilit] [PubMed]
- Yang, J.; Tang, K.; Qin, G.; Chen, Y.; Peng, L.; Wan, X.; Xiao, H.; Xia, Q. Hydrogen bonding energy determined by molecular dynamics simulation and correlation to properties of thermoplastic starch films. Carbohydr. Polym. 2017, 166, 256–263. [Google Scholar] [CrossRef] [Scilit] [PubMed]
- Li, J.; Qin, X.; Liu, X.; Li, J.; Zhong, J. Enhanced mechanical, barrier and antioxidant properties of rice protein/sodium alginate-based films by incorporating cellulose nanocrystals and rosemary extract. Food Packag. Shelf Life 2022, 34, 101000. [Google Scholar] [CrossRef] [Scilit]
- Gooneie, A.; Schuschnigg, S.; Holzer, C. A Review of Multiscale Computational Methods in Polymeric Materials. Polymers 2017, 9, 16. [Google Scholar] [CrossRef] [Scilit] [PubMed]
- Rigby, D.; Roe, R.J. Molecular dynamics simulation of polymer liquid and glass. I. Glass transition. J. Chem. Phys. 1987, 87, 7285–7292. [Google Scholar] [CrossRef] [Scilit]
- Tao, W.; Yang, C.; Wang, M.; Li, J.; Zhou, W.; Li, M.; Xing, J.; Zhao, Y.; Yang, Y. Sodium alginate as a stabilizer for anthocyanins in Dendrobium officinale: Insights from experimental approach and molecular dynamics. Food Chem. 2025, 488, 144838. [Google Scholar] [CrossRef] [Scilit] [PubMed]
- Huang, J.; Liu, J.; Chen, M.; Yao, Q.; Hu, Y. Immobilization of roselle anthocyanins into polyvinyl alcohol/hydroxypropyl methylcellulose film matrix: Study on the interaction behavior and mechanism for better shrimp freshness monitoring. Int. J. Biol. Macromol. 2021, 184, 666–677. [Google Scholar] [CrossRef] [Scilit] [PubMed]
- Alizadeh-Sani, M.; Tavassoli, M.; Mohammadian, E.; Ehsani, A.; Khaniki, G.J.; Priyadarshi, R.; Rhim, J.W. pH-responsive color indicator films based on methylcellulose/chitosan nanofiber and barberry anthocyanins for real-time monitoring of meat freshness. Int. J. Biol. Macromol. 2021, 166, 741–750. [Google Scholar] [CrossRef] [Scilit] [PubMed]
- ASTM D882-18; Standard Test Method for Tensile Properties of Thin Plastic Sheeting. ASTM International: West Conshohocken, PA, USA, 2018. [Google Scholar] [CrossRef] [Scilit]
- Theodorou, D.N.; Suter, U.W. Detailed molecular structure of a vinyl polymer glass. Macromolecules 1985, 18, 1467–1478. [Google Scholar] [CrossRef] [Scilit]
- Sun, H. COMPASS: An ab Initio Force-Field Optimized for Condensed-Phase Applications: Overview with Details on Alkane and Benzene Compounds. J. Phys. Chem. B 1998, 102, 7338–7364. [Google Scholar] [CrossRef] [Scilit]
- Allen, M.P.; Tildesley, D.J. Computer Simulation of Liquids, 2nd ed.; Oxford University Press: Oxford, UK, 2017. [Google Scholar] [CrossRef] [Scilit]
- Wei, L.; Li, J.; Qin, X.; Wang, Q.; Zhong, J. Enhancing the antioxidant properties and compatibility of protein/sodium alginate film by incorporating Zanthoxylum bungeanum essential oil Pickering emulsion. Food Chem. 2024, 445, 138771. [Google Scholar] [CrossRef] [Scilit] [PubMed]
- National Institute of Standards and Technology. Coefficient of Variation. Dataplot Reference Manual. 2017. Available online: https://www.itl.nist.gov/div898/software/dataplot/refman2/auxillar/coefvari.htm (accessed on 3 November 2026).
- ISO/CIE 11664-4:2019; Colorimetry—Part 4: CIE 1976 L*a*b* Colour Space. ISO: Geneva, Switzerland, 2019.
- Cao, S.; Wang, S.; Wang, Q.; Lin, G.; Niu, B.; Guo, R.; Yan, H.; Wang, H. Sodium alginate/chitosan-based intelligent bilayer film with antimicrobial activity for pork preservation and freshness monitoring. Food Control 2023, 148, 109615. [Google Scholar] [CrossRef] [Scilit]
- Qin, Y.; Wang, Y.; Chen, H.; Zhu, B.; Brennan, C.; Huang, Y. Chitosan/Sodium Alginate Composite Intelligent Film Incorporating Campanumoea lancifolia Anthocyanins for Monitoring Shrimp Freshness. ACS Food Sci. Technol. 2026, 6, 1055–1064. [Google Scholar] [CrossRef] [Scilit]
- Santos, L.G.; Alves-Silva, G.F.; Martins, V.G. Active-intelligent and biodegradable sodium alginate films loaded with Clitoria ternatea anthocyanin-rich extract to preserve and monitor food freshness. Int. J. Biol. Macromol. 2022, 220, 866–877. [Google Scholar] [CrossRef] [Scilit] [PubMed]
- Lei, Y.; Yao, Q.; Jin, Z.; Wang, Y.C. Intelligent films based on pectin, sodium alginate, cellulose nanocrystals, and anthocyanins for monitoring food freshness. Food Chem. 2023, 404, 134528. [Google Scholar] [CrossRef] [Scilit] [PubMed]
- Qin, Y.; Wang, Y.; Tang, Z.; Chen, K.; Wang, Z.; Cheng, G.; Chi, H.; Soteyome, T. A pH-sensitive film based on chitosan/gelatin and anthocyanin from Zingiber striolatum Diels for monitoring fish freshness. Food Chem. X 2024, 23, 101639. [Google Scholar] [CrossRef] [Scilit] [PubMed]
- Li, L.; Wang, W.; Zheng, M.; Sun, J.; Chen, Z.; Wang, J.; Ma, Q. Nanocellulose-enhanced smart film for the accurate monitoring of shrimp freshness via anthocyanin-induced color changes. Carbohydr. Polym. 2023, 301, 120352. [Google Scholar] [CrossRef] [Scilit] [PubMed]
- Liu, H.; Zhong, Y.; Li, S.; Li, J.; Li, Z.; Lin, L.; Zhou, W. Molecular Dynamics Simulation of Compatibility in Chitosan/Amylose Blends. Mod. Food Sci. Technol. 2015, 31, 136–142. (In Chinese) [Google Scholar] [CrossRef]
- Zhang, Q.; Lin, G.; Wang, H.; Jin, M.C.; Dang, H.; Zhang, J.; Guo, R.; Yan, H.; Niu, B.; Wang, H. Development of smart packaging film incorporated with sodium alginate-chitosan quaternary ammonium salt nanocomplexes encapsulating anthocyanins for monitoring milk freshness. Int. J. Biol. Macromol. 2024, 263, 130336. [Google Scholar] [CrossRef] [Scilit] [PubMed]
- Zheng, D.; Cao, S.; Li, D.; Wu, Y.; Duan, P.; Liu, S.; Li, X.; Zhang, X.; Chen, Y. Fabrication and characterization of chitosan/anthocyanin intelligent packaging film fortified by cellulose nanocrystal for shrimp preservation and visual freshness monitoring. Int. J. Biol. Macromol. 2024, 264, 130692. [Google Scholar] [CrossRef] [Scilit] [PubMed]
- Li, Y.; Hu, Z.; Huo, R.; Cui, Z. Preparation of an indicator film based on pectin, sodium alginate, and xanthan gum containing blueberry anthocyanin extract and its application in blueberry freshness monitoring. Heliyon 2023, 9, e14421. [Google Scholar] [CrossRef] [Scilit] [PubMed]
- Fan, S.; Wang, W.; Yang, Q.; Zhu, C.; Tian, M.; Richel, A.; Fauconnier, M.L.; Hou, C.; Zhang, D. Reinforcement of chitosan/polyvinyl alcohol film by quercetin self-assembled nanocrystals for fresh meat preservation. Food Chem. 2025, 493, 145826. [Google Scholar] [CrossRef] [Scilit] [PubMed]
- Hao, Y.; Kang, J.; Guo, X.; Sun, M.; Li, H.; Bai, H.; Cui, H.; Shi, L. pH-responsive chitosan-based film containing oregano essential oil and black rice bran anthocyanin for preserving pork and monitoring freshness. Food Chem. 2023, 403, 134393. [Google Scholar] [CrossRef] [Scilit] [PubMed]
- Wu, C.; Sun, J.; Zheng, P.; Kang, X.; Chen, M.; Li, Y.; Ge, Y.; Hu, Y.; Pang, J. Preparation of an intelligent film based on chitosan/oxidized chitin nanocrystals incorporating black rice bran anthocyanins for seafood spoilage monitoring. Carbohydr. Polym. 2019, 222, 115006. [Google Scholar] [CrossRef] [Scilit] [PubMed]
- Singh, S.; Nwabor, O.F.; Syukri, D.M.; Voravuthikunchai, S.P. Chitosan-poly(vinyl alcohol) intelligent films fortified with anthocyanins isolated from Clitoria ternatea and Carissa carandas for monitoring beverage freshness. Int. J. Biol. Macromol. 2021, 182, 1015–1025. [Google Scholar] [CrossRef] [Scilit] [PubMed]
- Goudarzi, J.; Moshtaghi, H.; Shahbazi, Y. Kappa-carrageenan-poly(vinyl alcohol) electrospun fiber mats encapsulated with Prunus domestica anthocyanins and epigallocatechin gallate to monitor the freshness and enhance the shelf-life quality of minced beef meat. Food Packag. Shelf Life 2023, 35, 101017. [Google Scholar] [CrossRef] [Scilit]

Disclaimer/Publisher’s Note: The statements, opinions and data contained in all publications are solely those of the individual author(s) and contributor(s) and not of MDPI and/or the editor(s). MDPI and/or the editor(s) disclaim responsibility for any injury to people or property resulting from any ideas, methods, instructions or products referred to in the content. |
© 2026 by the authors. Licensee MDPI, Basel, Switzerland. This article is an open access article distributed under the terms and conditions of the Creative Commons Attribution (CC BY) license.