


Abstract
To address the strong contact nonlinearity associated with explicit thread modeling and the high computational cost of long-term wear simulations during the cyclic operation of symmetric high-repeatability precision locators, an experimentally calibrated equivalent axial displacement method is proposed. Material parameters and the evolution of clamping force were obtained through tensile tests of T8A carbon tool steel, ball-on-flat reciprocating wear tests, and a 2000-cycle clamping test. The measured clamping force under a reference tightening torque of 3.5 N·m was then used to calibrate the equivalent axial displacement in a thread-free finite element model. On this basis, the Archard wear model was incorporated to investigate load transfer and wear evolution across multiple contact interfaces. The results show that the equivalent model can satisfactorily reproduce the overall evolution trend of the experimentally measured clamping force while preserving the principal load-transfer paths. The wear distribution is jointly governed by local contact pressure and relative sliding, with the inner wall of the locator-body bore identified as the primary wear-sensitive region. Cyclic wear continuously modifies the contact geometry, contact stiffness, and load distribution, resulting in a stagewise evolution of the clamping force. This experimentally calibrated thread-free model connects calculated local wear evolution with the measured global clamping response under the tested condition, providing an engineering basis for evaluating wear-sensitive contacts in precision locators.
1. Introduction
The long-term reliability of precision positioning systems depends on the stability of their internal contact interfaces during repeated operation. These systems transmit clamping loads through contacting components, where normal loading and localized relative sliding can cause progressive material removal. Progressive changes in contact geometry and stiffness can redistribute internal loads and alter the overall clamping response. Consequently, understanding how local contact wear influences macroscopic functional behavior is important for evaluating the service performance of precision positioning systems. This issue motivates the combined experimental and numerical investigation of cyclic wear and clamping-force evolution in precision locators.
As shown in Figure 1, symmetric high-repeatability precision locators are used in high-precision clamping, repeatable positioning, and aerospace assembly, where their positioning accuracy and service stability affect assembly quality and manufacturing consistency [1,2,3,4]. In the locator investigated here, the loading screw drives a contact system comprising a central ball, circumferential balls, a ball retaining sleeve, and a locator body. Repeated tightening and release produce evolving normal loads and localized sliding at these internal interfaces. Their interactions make it necessary to examine both local material removal and the resulting changes in the overall clamping response.
Figure 1.
(a) Assembly using positioning-device clamping and (b) symmetric high-repeatability precision locator.
Under reciprocating or cyclic contact, wear depends on the sequence of loading and sliding as well as their magnitudes. Fouvry et al. [5] related wear in oscillating contacts to frictional energy dissipation, while studies of elastic–plastic shakedown and slip-regime effects demonstrated the importance of cyclic deformation and the distinction between partial slip and gross sliding [6,7]. Mohd Tobi et al. [8] coupled incremental wear with a kinematic-hardening model for Ti–6Al–4V and showed that gross sliding and partial slip produce different plastic-strain and damage distributions. Tang et al. [9] further demonstrated in Cu and Mg that sliding reversal interacts with prior cold work through the Bauschinger effect, with material-dependent consequences for wear resistance. More recently, Ozen and Huber [10] identified surface roughening and debris-bed formation as competing contributors to transient wear during dry reciprocating tests on Al 6082 T6. These findings show why accumulated sliding distance alone cannot fully describe cyclic wear across different material and loading histories.
Archard’s law [11] remains a practical starting point for engineering wear calculations because it relates material loss to normal load and sliding distance through hardness and an empirical wear coefficient. Its simplicity, however, does not imply that a single coefficient is transferable among material states or contact conditions [12]. Tang et al. [13] found that hardness-based predictions overestimated the benefit of cold work to wear resistance when the accompanying change in elastic modulus was considered. Based on more than 400 reciprocating tests on self-mated 100Cr6 steel, Reichelt and Cappella [14] showed that the proportionality assumed by Archard’s law was not universally maintained across the investigated parameter range. Studies of hard-on-soft hip implant contacts further illustrate the need to assess Archard-based predictions for the material pairing of interest [15]. Choudhry et al. [16] subsequently linked the wear coefficient to deformation energy to improve predictions of adhesive wear at asperity contacts. Accordingly, experimentally determined coefficients should be treated as parameters specific to the investigated conditions, with their transferability assessed against the target structural response.
Predicting cyclic wear also requires accounting for the feedback between material removal and contact mechanics. McColl et al. [17] and Hegadekatte et al. [18] combined contact calculations with incremental wear evaluation and geometry updates. Kasarekar et al. [19] explicitly tracked rough-surface profile changes and the associated redistribution of contact pressure in partial-slip fretting, showing that even small roughness amplitudes can influence wear calculations. Bastola et al. [20] extended this approach to three-dimensional reciprocating and continuous sliding in Abaqus, updating both contacting surfaces and validating the predicted wear profiles experimentally. More recently, Won et al. [21] incorporated surface-topology evolution into a multiscale frictional-contact finite element framework to represent running-in, evolving interface tractions, and spatial wear distributions. Related fretting studies have also shown the importance of wear-induced contact changes for fatigue assessment [22]. Together, these studies establish that subsequent wear increments should be evaluated using the updated surface geometry and contact state.
Subsequent work has examined how friction assumptions, asperity-scale material removal, and surface topography influence contact and wear predictions [23,24,25,26]. Such methods have been applied to railway axle press fits, small-module gears, transient gear meshing, and compliant connectors [27,28,29,30]. Wang et al. [31] further linked wear evolution in reciprocating rod seals to changes in macroscopic performance. For precision locators, these studies motivate an assessment that follows the evolving pressure and sliding distributions at interacting interfaces and evaluates their consequences for clamping performance. In this study, wear progression denotes cumulative material removal rather than debris accumulation.
For mechanical connection structures incorporating threaded actuation, the threaded pair plays an important role in the generation of preload and the transmission of load. Pai and Hess [32] developed a three-dimensional finite element model of a threaded connection to investigate thread contact behavior and joint relaxation under dynamic shear loading. Nassar and Housari [33] further analyzed the effects of thread pitch and initial preload on the self-loosening behavior of threaded connections, while Nassar and Yang [34] established a theoretical model for the loosening of preloaded threaded joints subjected to vibrational loading. To investigate thread wear and changes in preload performance during cyclic loading, Zhang et al. [35] combined finite element analysis with experiments to study the loosening process induced by thread wear under transverse cyclic loading, demonstrating that local slip and material removal in the thread contact region can significantly alter the preload state of the joint.
Despite these advances, linking wear at several interacting contacts to the clamping performance of a thread-driven locator remains challenging. Explicitly resolving thread engagement adds contact nonlinearity and computational cost, while the wear of interest develops at the downstream ball and body contacts. An efficient model should therefore preserve the main load-transfer path, update the contact geometry as material is removed, and relate the evolving contact state to the measured clamping force. The applicability of the experimentally determined wear coefficient must also be considered when assessing this reduced representation.
To address this problem, this study develops an experimentally calibrated, thread-free finite element model for the cyclic wear analysis of a high-repeatability precision locator. Explicit thread engagement is replaced by an equivalent axial displacement calibrated against the measured initial clamping force at a tightening torque of 3.5 N·m. Tensile tests and ball-on-flat reciprocating wear tests on heat-treated T8A steel supply the mechanical and tribological inputs, while cyclic tests on the assembled locator provide the clamping-force evolution over 2000 cycles. The wear coefficients measured at 20 N and 30 N are used as alternative inputs, and incremental Archard wear updating couples local pressure and relative sliding to contact-surface evolution. The study evaluates the resulting relationship between internal wear and the overall clamping response under the tested condition, providing an engineering basis for assessing critical contact regions in precision locators.
2. Experimental Materials and Methods
To obtain the material constitutive parameters and tribological parameters required for the finite element model, mechanical property tests and ball-on-flat reciprocating wear tests were conducted on heat-treated T8A steel specimens. Cyclic clamping-force tests were performed separately on the assembled precision locator to evaluate its cyclic mechanical response and validate the equivalent-loading model.
2.1. Specimen Preparation and Material Testing
The material investigated in this study was T8A carbon tool steel, a grade designated under the Chinese national standard GB/T 1299-2025 (Tool and mould steels) [36]. T8A carbon tool steel was selected as the test material because it is used to manufacture the key contact components of the positioning device investigated in this study. The tests were conducted to obtain the mechanical and wear parameters required for modelling these components. The T8A steel specimens were supplied in machined form by Xupengyuan Technology (Shenzhen, China). The main chemical composition of the material is listed in Table 1. Prior to heat treatment, the specimen surfaces were cleaned with anhydrous ethanol to remove oil contamination and adhered impurities, followed by natural drying. The T8A steel specimens were water quenched and then low-temperature tempered as consecutive stages of one heat-treatment sequence. The heat-treatment process parameters are listed in Table 2.
Table 1.
Main chemical composition of T8A carbon tool steel.
Table 2.
Heat-treatment process parameters of T8A steel.
To obtain the actual mechanical response of heat-treated T8A steel to provide an experimental basis for defining the material properties in the subsequent finite element model, uniaxial tensile tests were conducted on the heat-treated T8A steel with reference to ISO 6892-1:2019 [37] (Metallic materials—Tensile testing—Part 1: Method of test at room temperature). The experimental system consisted of a universal testing machine (Instron 3345, Instron Corporation, Norwood, MA, USA), a PMLAB DIC-3D digital image correlation (DIC) system (Nanjing PMLAB Sensor Tech Co., Ltd., Nanjing, China) equipped with two CCD cameras (GRAS-50S5M-C, Point Grey Research Inc., Richmond, BC, Canada), and an auxiliary light source, as shown in Figure 2. During tensile loading, the two DIC cameras were positioned directly in front of the specimen, while auxiliary illumination was used to enhance the image brightness and grayscale contrast within the measurement region, ensuring that the camera field of view covered the parallel gauge section and the adjacent transition regions. Meanwhile, the testing machine synchronously recorded macroscopic mechanical data, including axial load, displacement, and loading time, whereas the DIC system continuously acquired surface images of the specimen.
Figure 2.
(a) Uniaxial tensile test and (b) DIC acquisition system.
The tensile specimen adopted a flat dog-bone geometry designed with reference to ISO 6892-1:2019 [37]. Considering the loading capacity of the available tensile testing machine, selected in-plane geometric dimensions were adjusted relative to the standard configuration, while the specimen thickness was maintained at 2 mm. The characteristic central parallel gauge section and smooth fillet transitions were retained; the detailed dimensions, physical specimen, speckle pattern, and post-fracture morphology are shown in Figure 3. For DIC measurements, a random black-and-white speckle pattern was prepared over the gauge section and adjacent fillet transition regions, as shown in Figure 3c. This high-contrast surface texture provides identifiable optical features that can be tracked by correlating successive images acquired during loading, allowing surface displacement and strain fields to be determined.
Figure 3.
T8A steel tensile specimen and DIC test: (a) specimen morphology; (b) specimen geometry; (c) black-and-white speckle pattern on the specimen surface; (d) fractured specimen.
The room-temperature uniaxial tensile test was conducted with reference to ISO 6892-1:2019 [37] under displacement control at a crosshead speed of 2 mm/min until final fracture. By temporally synchronizing and correlating the macroscopic load–displacement data with the local strain fields measured by DIC, the macroscopic stress–strain response and local strain-evolution behavior of the heat-treated T8A steel were obtained. These experimental results were used to characterize the mechanical response of the material in its actual heat-treated condition and to provide an experimental basis for determining the material parameters in the subsequent finite element model and for analyzing the numerical results.
2.2. Ball-on-Flat Reciprocating Wear Test
Ball-on-flat reciprocating dry wear tests were conducted on the heat-treated T8A steel specimens using an MFT-5000 tribometer (Rtec Instruments, Inc., San Jose, CA, USA). The counterbody was a GCr15 bearing steel ball supplied by Yiwu Shuibei Trading Co., Ltd. (Yiwu, China), with a nominal hardness of 63 ± 2 HRC and a supplier-specified surface roughness of Ra ≤ 0.1 μm. As shown in Figure 4, a spherical counterbody and a flat specimen were used to form a local contact pair, with the spherical counterbody maintained in contact with the specimen surface under a constant normal load and subjected to periodic reciprocating sliding along a fixed direction. This contact configuration generates repeated loading and relative sliding within a confined wear-track region, thereby providing controlled test conditions for determining the wear parameters of the material under localized cyclic contact.
Figure 4.
Ball-on-flat reciprocating wear test setup: (a) overall testing machine; (b) loading fixture; (c) schematic diagram of the apparatus.
The reciprocating wear tests were conducted under dry contact to characterize the material pair under controlled conditions without introducing additional variables associated with grease formulation and lubrication-film evolution. Schultheiss et al. [38] demonstrated that thickener type, additive type, and solid lubricant type significantly influence wear behavior. Han et al. [39] further showed that thickener content and anti-wear additives affect film formation and surface wear under cyclic variable loading. Introducing grease would therefore couple the measured material response with lubricant-dependent effects. Dry contact was selected to establish a baseline characterization of the material pair. The reciprocating wear-test conditions are summarized in Table 3.
Table 3.
Reciprocating wear test conditions.
The selection of the normal-load conditions was informed by previous experimental–numerical wear studies [40,41,42], in which wear coefficients were obtained from controlled friction and wear tests and subsequently incorporated into numerical wear models. In particular, Chen et al. [40] employed an MFT-5000 tribometer and included a 30 N normal-load condition in their experiments. Following this approach, normal loads of 20 N and 30 N were adopted in the present study to investigate the wear behavior of heat-treated T8A steel under two comparative loading conditions. The corresponding experimentally determined wear coefficients were subsequently used as input parameters for Simulations A and B, respectively.
After completion of the wear tests, the three-dimensional morphology of the wear-track region was characterized using a VK-3000 system (KEYENCE Corporation, Osaka, Japan). The acquired three-dimensional surface data were subsequently processed using the VK-X3000 Analysis Application (KEYENCE Corporation, Osaka, Japan) to analyze the wear-track topography. Before measurement, the specimen surface was appropriately cleaned to remove wear debris, loosely adhered particles, and other contaminants remaining from the wear process, thereby minimizing their influence on the surface topography measurements. The specimen was then fixed on the stage, and representative regions of the wear track were selected for focusing and scanning to obtain three-dimensional surface morphology maps and wear-distribution information. The worn surface morphologies were examined using a field-emission scanning electron microscope (FE-SEM, JSM-7610FPlus, JEOL Ltd., Akishima, Tokyo, Japan) equipped with an energy-dispersive X-ray spectroscopy (EDS) system for elemental analysis.
Differences Between Laboratory Wear Tests and Actual Service Conditions
The ball-on-flat reciprocating wear test described in Section 2.2 provides an experimentally controlled representation of localized spherical contact with the heat-treated T8A steel surface. In this test, one spherical counterbody slides against a flat specimen under the controlled conditions summarized in Table 3. These conditions allow a specific wear rate to be determined reproducibly for the investigated contact configuration; however, they do not reproduce the complete loading and contact history of an assembled positioning device.
During actual cyclic tightening, the prescribed input is a torque of 3.5 N·m rather than a constant normal load at a single contact interface. The load is transmitted from the loading screw through the central and circumferential balls to the ball retaining sleeve and the locator body. The device is repeatedly tightened, clamped, unloaded, and reset over 2000 cycles. Consequently, different contact interfaces experience nonuniform and evolving local pressure, sliding distance, contact geometry, and load sharing. The controlled test therefore captures the basic sphere–flat contact characteristic but cannot reproduce all the multibody interactions of service.
A further distinction concerns the transferability of the measured wear coefficient. Under the controlled conditions, the specific wear rates determined at 20 and 30 N were 4.2518 × 10⁻⁵ and 3.8747 × 10⁻⁵ mm3/(N·m), respectively, a difference of approximately 8.9%. Thus, even within the investigated load range, the measured specific wear rate is not strictly independent of the testing condition. Previous studies have also emphasized the dependence of wear behavior and model parameters on contact configuration, slip conditions, and the description of wear mechanisms [12,16,17]. In the actual locator, variations in local contact pressure, relative motion, and evolving surface conditions may cause the effective local wear coefficient to differ from the laboratory values. The direction and magnitude of this deviation cannot be quantified from the present tests alone, because no in situ wear coefficient was independently measured at the internal contacts.
In the subsequent Archard-based finite element analysis, the experimentally determined 20 N and 30 N coefficients are therefore treated as alternative, condition-specific input values rather than universal constants or direct measurements of the local in-service coefficients. The finite element solution accounts for differences among contact interfaces through the calculated contact pressure and relative sliding, but using a fixed input coefficient does not fully account for changes in the effective wear coefficient during prolonged service [11,12,16]. Comparing the two coefficient inputs with the measured evolution of clamping force provides an assessment of the model’s macroscopic response under these assumptions; it does not independently establish the exact wear rate at every internal interface. Direct in-service wear measurements under matched contact conditions would be required to further quantify coefficient-transfer uncertainty.
2.3. Cyclic Clamping Force Test of the Positioning Device
During repeated tightening of the positioning device, the internal contact interfaces are continuously subjected to cyclic contact and relative sliding, while the wear generated in a single cycle is too small to be directly quantified through macroscopic observation. Therefore, the clamping force was employed as an indirect response parameter reflecting the overall contact state and wear evolution, and its variation with the number of cycles was analyzed to characterize the cyclic service behavior of the positioning device. To determine the evolution of clamping force in the heat-treated T8A locator under cyclic tightening conditions, and to validate the capability of the thread-free finite element model to reproduce the mechanical response of the actual structure, a test platform was established using a bearing torque–pressure fatigue testing system to conduct cyclic clamping force tests. As shown in Figure 5, the test system mainly consists of a servo drive unit with an MCT530 motor driver, a BYSN-20 torque sensor, a force sensor, a guide-rail test frame, a test fixture, and a control system, enabling torque input, clamping-force feedback, cycle-count control, and real-time acquisition of experimental data. The maximum loading torque of the system is 11 N·m, and the force measurement range is 0–10 kN.
Figure 5.
Torque-loading apparatus and precision-locator schematic: (a) physical configuration of the torque-loading test bench; (b) schematic of the internal structure of the positioning device.
A constant-torque mode was employed to simulate the service condition in which the positioning device is repeatedly tightened to a prescribed torque in engineering applications, with the input torque of the positioning device set to 3.5 N·m. Under this condition, the positioning device can maintain a stable locking state while avoiding the pronounced increase in contact pressure and wear severity in critical contact regions that may result from excessive torque; therefore, this condition was selected as the baseline loading condition for the cyclic clamping force test and finite element model validation in this study. During the experiment, the servo drive system repeatedly operated the positioning device through a “tightening–clamping–unloading–resetting” cycle, while the torque sensor and force sensor synchronously recorded the torque and clamping-force responses in each cycle. A total of 2000 loading cycles were applied to the T8A positioning device, and one representative clamping-force data point was extracted every 200 cycles to establish the response curve of clamping force as a function of cycle number. A dedicated fixture was used to mount and secure the specimen during the cyclic test, ensuring that the central axis of the positioning device was aligned with the servo loading axis and the direction of force feedback. One end of the test specimen was connected to the driving end, while the other end was positioned by the fixture and supporting structure to restrict possible deflection and lateral displacement during cyclic tightening. This clamping configuration ensured stable transmission of the external torque to the internal structure of the positioning device and enabled the clamping force measured by the force sensor to primarily reflect the axial locking response of the positioning device.
3. Cyclic Wear Analysis Based on the Equivalent Loading Method
3.1. Equivalent Loading Method with Simplified Bolt Modeling
During tightening, the threaded pair converts the applied torque into axial thrust. The loading screw transmits this thrust through the central and circumferential balls to the ball retaining sleeve and locator body. The analysis addresses downstream contact load transfer and cyclic wear; thread-flank contact, wear, and loosening are beyond its scope. Therefore, the threaded loading section is separated from the target contact system, and its influence on the internal structure is represented by an equivalent mechanical action applied at the connecting interface Γ.
The virtual work transmitted from the threaded loading section to the internal contact system through the connecting interface can be expressed as:
where tΓ denotes the interface traction vector, and δu denotes the virtual displacement at the interface.
The resultant force and resultant moment on the connecting interface are given by:
where x0 denotes the reference point of the connecting interface, and x denotes the position vector of an arbitrary point on the interface.
When the connecting section is assumed to remain approximately planar, its virtual displacement can be expressed as:
where δu0 and δθ denote the virtual translation and virtual rotation of the reference point, respectively. Substituting Equation (4) into Equation (1) yields
δu = δu0 + δθ × (x − x0),
δWΓ = FΓ ⋅ δu0 + MΓ ⋅ δθ,
Equation (5) indicates that the effect of the threaded loading section on the internal contact system can be represented by the resultant force and resultant moment acting on the connecting interface, without explicitly retaining the pointwise contact loads on the thread flanks.
During operation of the positioning device, the loading screw and the internal ball system remain approximately coaxial, and the load is transmitted primarily along the screw axis. Therefore, the generalized load acting on the connecting interface can be approximately expressed as:
FΓ ≈ Fae1, MΓ ≈ 0,
The corresponding virtual work at the interface can be expressed as:
where Fa denotes the axial thrust generated by the threaded pair, and e1 denotes the unit vector along the screw axis. Equation (7) indicates that, when axial load transfer is dominant, the primary effect of the complex threaded engagement on the downstream contact system can be equivalently represented by an axial action along the screw axis.
δWΓ ≈ Faδu1,
Since the positioning device is externally subjected to a tightening torque T, a theoretical relationship between the input torque and the resulting axial action must also be established. According to classical threaded-fastener theory, by considering thread lead and flank friction while neglecting bearing-surface friction outside the scope of the present study, the following relationship can be obtained for a V-thread with a small lead angle [43,44]:
where T is the input torque, p is the thread lead, d2 is the pitch diameter of the thread, α is the thread profile angle, and μt is the coefficient of friction of the threaded pair.
To facilitate the characterization of the above theoretical conversion relationship, the nominal torque-to-axial-force conversion coefficient CT is defined as:
The target axial thrust can then be expressed as:
3.2. Calibration and Application of Equivalent Axial Displacement
Equivalent axial-displacement control is used to improve convergence in the nonlinear contact analysis. Because the thread-friction coefficient is uncertain, the thrust calculated from Equation (10) provides only an initial displacement estimate. The final displacement is calibrated against the measured initial clamping force at 3.5 N·m. Figure 6 illustrates the resulting loading representation.
Figure 6.
Equivalent loading in the thread-free finite element model: (a) original torque-loading mode; (b) equivalent axial-displacement loading mode.
The quasi-static equilibrium equation of the thread-free finite element model can be expressed as:
where u denotes the nodal displacement vector, Fint is the internal force vector of the model, Fext is the external load vector, and R is the residual force vector.
R(u) = Fint(u) − Fext = 0,
During equivalent axial displacement calibration, the external load applied at the loading reference point is given by:
The displacement of the reference point along the screw axis under the target axial thrust is obtained by solving Equation (12). This displacement is defined as the equivalent axial displacement:
where denotes the initial displacement estimate corresponding to the theoretical axial thrust. Considering the uncertainty in the thread-friction parameters in Equation (10), the theoretical axial thrust and are used only to determine the initial state of the equivalent displacement. In this study, displacement-controlled loading is adopted, and the experimentally measured initial clamping force Fexp under the reference condition of 3.5 N·m is used as the calibration target. For a prescribed axial displacement U, the axial reaction force at the loading reference point of the thread-free model can be expressed as:
FR(U) = RF1(U),
The displacement calibration error is defined as:
The condition ηF(Ueq) ≤ ηallow is adopted as the convergence criterion for the equivalent displacement, based on which the final equivalent axial displacement Ueq is determined. The theoretical axial thrust obtained from Equation (10) is mainly used to provide the initial estimate of the equivalent displacement, whereas the final boundary condition is calibrated against the measured reference clamping force. On this basis, Ueq is taken as the maximum axial displacement amplitude in the subsequent cyclic wear analysis. Considering the tightening, holding, unloading, and resetting stages, the axial displacement history over one complete cycle can be expressed as:
where A(t) is a dimensionless amplitude function used to describe the tightening, holding, unloading, and resetting stages. To ensure stable motion of the loading screw along its axial direction, the remaining nonworking degrees of freedom are constrained according to the actual assembly conditions. Under displacement-controlled loading, the axial force at the loading end is no longer prescribed as a constant input but is obtained from the finite element model as the reaction force at the reference point:
where n denotes the cycle number. As wear progresses under cyclic loading, the local contact geometry, contact area, and load distribution continuously evolve; therefore, even when the same maximum displacement amplitude Ueq is maintained in each cycle, the axial reaction force predicted by the model can still vary with the number of cycles, thereby enabling the evolution of local wear to be correlated with changes in the overall clamping performance.
U1(t) = UeqA(t),
Figure 6 illustrates the torque-to-displacement loading equivalence. The model omits thread-flank contact while retaining the main axial load-transfer mechanism and the critical wear interfaces.
Applicability and Limitations of Equivalent Loading
The equivalent model describes the axial action on the retained contact system. It does not resolve thread-flank pressure, thread wear, rotational self-loosening, or detailed torsional interactions. Slip and wear at threaded interfaces can affect clamping force [32,35]; these mechanisms remain limitations of the reduction.
The applicability of this method is not inherently restricted to the specific geometric dimensions of the investigated positioning device. However, for different structural configurations, its axial load-transfer assumption must be reassessed for the new contact configuration.
The cyclic response has been assessed only at 3.5 N·m for the tested assembly. Calibration does not identify the thread-friction coefficient or its subsequent evolution. The fixed displacement amplitude also excludes cycle-dependent changes in torque-to-thrust conversion caused by thread wear, friction evolution, or self-loosening.
For other torques or thread-friction conditions, Equations (8)–(10) must be reassessed and the displacement recalibrated against corresponding clamping-force measurements, followed by assessment against cyclic measurements for that condition. Neither displacement nor actual clamping force necessarily scales proportionally with torque because the contacts respond nonlinearly. If thread degradation changes the transmitted loading during cycling, an independently determined cycle-dependent boundary condition is required; predicting that degradation requires explicit thread-contact and rotational modeling.
3.3. Incremental Cyclic Wear Analysis
The calibrated displacement from Section 3.2 drives repeated axial loading and unloading. With the repeated motion of the central ball and circumferential balls, periodic contact pressure and relative sliding occur between the balls, the loading screw, and the locator body. For the contact pairs investigated in this study, surface material loss is primarily governed by the combined effects of local normal load and tangential sliding.
For an arbitrary position x on the contact surface, the local wear increment can be expressed as:
where w(x) denotes the local wear depth, p(x) is the local contact pressure, ds(x) is the increment in relative sliding distance, and kw is the wear coefficient. In this study, kw is determined from independent wear tests and is used as an experimentally calibrated material contact-wear parameter in the finite element model rather than being obtained through numerical inverse identification.
dw(x) = kwp(x) ds(x),
If one loading cycle is discretized into n finite element increments, the cumulative wear depth at node x over one complete cycle can be expressed as:
p(x,tj) and Δs(x,tj) denote the contact pressure and the incremental sliding distance at node x during the j-th increment, respectively. It can be seen from the above equation that the spatial variation in wear among different contact locations is determined by the local contact state, with the spatial distributions of contact pressure and sliding distance jointly governing the nonuniform evolution of wear.
After multiple loading cycles, the cumulative wear depth of the contact surface can be expressed as:
where m denotes the number of completed loading cycles. As material removal progresses, the original contact geometry changes, resulting in redistribution of the contact pressure and relative sliding in subsequent cycles. Therefore, p(x,tj) and Δs(x,tj) do not remain constant throughout the entire wear process but are progressively updated as the contact-surface state evolves.
3.4. Thread-Free Finite Element Model for Cyclic Wear
The three-dimensional thread-free model retains the loading screw, central and circumferential balls, ball retaining sleeve, and locator body. The three circumferential balls are initially arranged symmetrically about the locator axis, and cyclic loading follows Section 3.2.
A graded mesh was used, with local refinement of the ball components and critical contact regions (Figure 7). The model contained 27,056 nodes and 21,267 solid elements: 19,895 eight-node reduced-integration bricks (C3D8R) and 1372 quadratic tetrahedra (C3D10). The minimum element size was approximately 0.15 mm. C3D10 elements were used in geometrically complex and transition regions.
Figure 7.
Finite element model: (a) mesh discretization; (b) boundary condition settings.
The bottom region of the locator was fully fixed (Figure 7b). The calibrated axial displacement Ueq was applied at the loading reference point, and the nonworking degrees of freedom were constrained to maintain axial motion of the loading screw.
General contact was used to describe the internal interfaces. Tangential behavior followed a Coulomb friction model with a friction coefficient of 0.05 and a slip tolerance of 0.005. Normal behavior was defined by a tabulated nonlinear pressure–overclosure relationship.
The coefficient of friction for the lubricated internal ball contacts was selected based on the experimentally measured dry-sliding coefficient and published engineering reference data. Table IV of the NASA Fastener Design Manual [45] reports a dry sliding coefficient of friction of 0.42 and a sliding coefficient of friction of 0.029 under greasy conditions for hard-steel-on-hard-steel contacts. The ratio between these values, approximately 14.48, was used as an approximate engineering reference to estimate the potential reduction in friction associated with lubrication. Applying this ratio to the experimentally measured dry-sliding coefficient of approximately 0.75 yields an estimated value of 0.75/14.48 ≈ 0.052. Accordingly, a nominal coefficient of friction of 0.05 was adopted in the Coulomb friction model for the internal ball contacts. However, the friction coefficients reported in the NASA manual correspond to specific contact conditions, and their ratio does not represent a universally applicable conversion factor between dry and lubricated contacts. Therefore, the adopted coefficient of 0.05 is regarded as an approximate engineering estimate based on published reference data rather than a directly measured friction coefficient for the actual lubricated internal contacts. The comparison with the experimentally measured clamping-force evolution in Section 4.2 provides support for the overall modeling approach under the investigated loading and contact conditions, but does not independently establish the exact friction coefficient of the internal contact interfaces.
The wear calculation employs the incremental Archard wear model described in Section 3.3, in which the wear coefficient k is determined from the ball-on-flat reciprocating wear tests presented in Section 2.2. The material wear volume can be expressed as:
where A denotes the cross-sectional area of the wear scar, and L denotes the wear-scar length.
V = A ⋅ L,
The cumulative sliding distance S is calculated based on the reciprocating frequency, test duration, and single reciprocating stroke, and the specific wear rate of the material is subsequently obtained as:
where FN denotes the normal load applied during the wear test, and k denotes the specific wear rate of the material.
The use of experimentally determined wear coefficients as inputs to engineering wear models has precedents in the literature. Chen et al. [40] obtained wear coefficients from reciprocating sliding tests using an MFT-5000 tester and incorporated the experimental parameters into a planetary gear wear–dynamics model. Ratsimba et al. [41] used wear coefficients measured in round-against-flat fretting tests, together with finite element contact pressures and slip distributions, to predict wear in an aeroengine spline coupling. Similarly, Xue et al. [42] determined wear coefficients through material-specimen tests and applied an Archard-based finite element approach to predict wear in an aeroengine floating spline coupling.
Following this experimental–numerical approach, the present study uses the specific wear rate obtained from Equation (22) as the wear parameter in the local Archard relationship in Equation (18). The finite element model determines the contact pressure and incremental relative sliding associated with the positioning-device geometry and loading, and Equations (19) and (20) accumulate the resulting wear increments over successive cycles. Thus, the reciprocating tests supply the experimentally determined material-removal parameter, while the engineering model supplies the local contact variables required to calculate wear progression.
These studies establish a methodological precedent for using wear coefficients measured in laboratory specimen tests as inputs to engineering-component wear models. Following this approach [40,41,42], the present study determines the wear coefficient through reciprocating wear tests and incorporates it into the Archard-based model of the positioning device. The experimentally determined coefficient characterizes material removal per unit normal load and sliding distance, while the finite element analysis provides the local contact pressure and relative sliding required for the wear calculation. The use of the test-derived coefficient in the present model therefore follows the experimental–numerical framework adopted in these previous engineering applications.
As discussed in the subsection “Differences Between Laboratory Wear Tests and Actual Service Conditions” in Section 2.2, the coefficients measured at 20 and 30 N are applied as alternative effective inputs for evaluating the sensitivity of the predicted wear and clamping response. They should not be interpreted as independently verified wear coefficients for each internal contact interface.
The cumulative wear depth was recorded as CWEAR. A cycle-scaling factor of 200 was used, so ten numerical loading–unloading cycles represent 2000 service cycles. In each numerical cycle, the wear increment was calculated from the current contact pressure and relative sliding and applied over the represented cycle block. The contact state was then updated before the next block. Figure 8 summarizes the workflow from parameter input and equivalent-displacement calibration to cyclic contact analysis, wear updating, and response evaluation.
Figure 8.
Workflow for equivalent-loading-based cyclic wear analysis.
3.5. Influence of Initial Surface Conditions and Manufacturing Tolerances on Cyclic Wear Analysis
The thread-free finite element model developed in Section 3.4 employs idealized component geometries while preserving the principal internal load-transfer path and critical contact interfaces. The equivalent axial displacement is calibrated using the experimentally measured clamping force to investigate cyclic contact and wear responses rather than microscopic surface interactions.
Previous studies have shown that surface roughness and asperity geometry can influence local contact conditions and wear predictions [19,24]. For the present locator, manufacturing deviations may also change initial contact engagement and load sharing. According to the Archard wear relationship in Equation (18), the resulting changes in contact pressure and relative sliding may modify local wear progression. However, the direction and magnitude of these effects cannot be quantified here because component-specific initial surface measurements and comparative analyses are unavailable.
The present study does not include component-specific measurements of initial surface topography or a validated procedure for incorporating microscopic surface features into the finite element model. Nevertheless, the results presented below demonstrate agreement in the overall cyclic clamping-force response and provide numerical wear-distribution results and qualitative experimental correspondence of local wear locations. These findings support the present analysis within its adopted geometric assumptions but do not establish the quantitative accuracy of microscopic wear depths.
4. Results and Discussion
4.1. Mechanical and Friction–Wear Properties of T8A Steel
4.1.1. Tensile Mechanical Response
Figure 9 presents the stress–strain response of the heat-treated T8A steel specimen. At the initial stage of loading, the stress increases approximately linearly with strain, indicating that the material is predominantly in the elastic deformation regime. As the strain increases, the curve gradually deviates from the initial linear relationship, indicating the onset of the elastic–plastic transition. The stress then continues to increase and eventually reaches a peak strength of approximately 800 MPa. Published experimental work on T8A steel has shown that its hardness, impact toughness, and wear resistance depend on the heat-treatment history [46]. The peak stress of approximately 800 MPa reported here was measured in the present tensile test and is specific to the tested specimen and treatment condition. The limited macroscopic plastic deformation observed in Figure 9 describes the response of this specimen rather than a universal property of the T8A grade.
Figure 9.
Stress–strain curve of the heat-treated T8A steel specimen.
To further reveal the local deformation behavior of the material during tensile loading, DIC was employed to measure the full-field microstrain distribution at different loading stages, as shown in Figure 10. The evolution of the microstrain field shows good agreement with the macroscopic stress–strain response. At the initial loading stage (70 s), corresponding to the elastic deformation regime of the stress–strain curve, the overall microstrain level of the specimen is relatively low, with the field dominated by blue and green regions and only a few localized areas exhibiting higher microstrain. This indicates that deformation is relatively uniform at this stage, with no pronounced localization of plastic deformation. As the loading time increases to 100 s and 150 s, corresponding to the gradual increase in stress and transition into the elastic–plastic regime, the microstrain level increases markedly, accompanied by the progressive expansion of the yellow and red regions. Although the specimen still undergoes overall continuous deformation, distinct strain localization begins to develop in some regions, indicating reduced deformation compatibility among different regions due to microstructural heterogeneity. At loading times of 150 s and 170 s, the DIC strain fields exhibit spatially heterogeneous deformation, with relatively high-strain regions distributed within the specimen gauge section. The maximum axial microstrain values are approximately 6.64 × 10³ με and 6.33 × 10³ με, respectively, and both remain below 1.0 × 10⁴ με. At 200 s, the maximum axial microstrain increases to approximately 1.03 × 10⁴ με, indicating a higher local strain level at this later loading stage. The spatial variations in the strain field show that different regions of the gauge section undergo different amounts of axial deformation as loading proceeds. At the final loading stage (230 s), the stress approaches 800 MPa, while the microstrain field exhibits pronounced localization, with the maximum microstrain reaching approximately 1.95 × 10⁴ με. The high-strain regions become further concentrated and expanded, whereas some regions remain at relatively low strain levels, indicating an increasing degree of deformation heterogeneity and the progressive dominance of localized plastic deformation. Such strain localization is generally closely associated with subsequent damage accumulation and crack initiation.
Figure 10.
Evolution of the εyy distribution in the specimen gauge section with loading time: (a) 70 s; (b) 100 s; (c) 150 s; (d) 170 s; (e) 200 s; (f) 230 s.
Overall, the heat-treated T8A steel specimen exhibits a peak tensile stress of approximately 800 MPa under the investigated test conditions. The macroscopic stress–strain curve shows an approximately linear response during the initial loading stage, followed by nonlinear deformation as the applied load increases. Meanwhile, the DIC microstrain fields reveal the progressive development of strain localization, with an increasingly heterogeneous strain distribution at later loading stages. These observations indicate that the macroscopic tensile response is accompanied by the progressive concentration of local deformation. The combined stress–strain and DIC results provide an experimental basis for characterizing the mechanical response of the heat-treated T8A steel and determining the material parameters used in the subsequent finite element analysis.
4.1.2. Friction and Wear Response and Wear Parameters
Figure 11 presents the evolution of the coefficient of friction and the specific wear rate of the heat-treated T8A steel specimen under normal loads of 20 N and 30 N. Under both loading conditions, the coefficient of friction exhibits a distinct running-in stage before gradually reaching a relatively stable frictional state. Under the 20 N condition, the coefficient of friction increases rapidly at the initial stage of loading, whereas under 30 N the increase is comparatively more gradual. With increasing sliding time, the two curves gradually converge and remain at similar levels during the steady-state stage. These results indicate that, within the normal-load range of 20–30 N, variations in normal load mainly affect the initial running-in behavior of the friction interface, while having a relatively limited influence on the steady-state frictional condition.
Figure 11.
Friction and wear response of T8A steel under different normal loads: (a) variation in coefficient of friction with time; (b) specific wear rate.
The specific wear rates at 20 N and 30 N were 4.2518 × 10⁻⁵ and 3.8747 ×10⁻⁵ mm3/(N·m), respectively, corresponding to a decrease of approximately 8.87%. Since the specific wear rate is normalized by normal load and sliding distance, the calculated wear volume at 30 N was approximately 36.7% higher than that at 20 N under the same sliding distance. Thus, the lower specific wear rate does not indicate a reduction in total material loss.
Load-dependent changes in wear have also been reported for other steels. Mohan et al. [47] observed that the dry-sliding wear rate of HSLA steel initially increased with load and subsequently decreased, attributing the latter trend to increased oxidation and coverage of the wear tracks by oxide products. Wang et al. [48] showed that tribo-oxides and the supporting steel matrix jointly govern wear: when adequately supported by the matrix, tribo-oxides can reduce direct metallic contact and adhesive material removal. These studies provide a mechanistic basis for considering changes in the interfacial state when interpreting the load dependence of the present specific wear rates.
As shown in Figure 12a,b, the worn surface at 20 N exhibits grooves along the sliding direction, together with scattered wear debris and localized debris accumulation. These features are consistent with a contribution from abrasive wear. At 30 N, grooves remain visible at low magnification (Figure 12c), while the higher-magnification image reveals pronounced plastic flow and local surface flaking (Figure 12d). These morphological differences suggest greater local surface deformation and material detachment under the higher normal load.
Figure 12.
SEM morphologies and EDS spectra of the worn T8A steel surfaces under different normal loads: (a) 20 N, 50×; (b) 20 N, 500×; (c) 30 N, 50×; (d) 30 N, 500×; (e) EDS spectrum and elemental composition at 20 N; (f) EDS spectrum and elemental composition at 30 N.
The EDS results in Figure 12e,f show that the oxygen content increases from 7.74 wt.% at 20 N to 18.12 wt.% at 30 N, while the relative Fe content decreases from 89.31 wt.% to 76.52 wt.%. The higher oxygen concentration suggests greater involvement of oxygen-containing surface products, potentially associated with oxidation and oxidized wear debris. In light of the mechanisms discussed in [47,48], these products may partially moderate direct metallic interaction, while the SEM observations indicate that plastic flow and local detachment become more pronounced at the higher load.
The lower specific wear rate at 30 N may therefore reflect the competing effects of increased deformation and detachment and changes in surface products and debris participation. These interfacial changes provide a plausible explanation for the less-than-proportional increase in wear volume relative to the applied load: total material loss increases, while material removal per unit load and sliding distance decreases.
Accordingly, the present results do not support a general conclusion that the friction and wear parameters are load-independent over 20–30 N. The two measured wear coefficients are retained separately as the inputs to Simulation A and Simulation B, respectively, so that the numerical analysis accounts for both experimentally determined parameter values rather than replacing them with a single averaged coefficient.
4.2. Experimental Evaluation of the Thread-Free Cyclic Wear Model
Figure 13 compares measured and simulated clamping-force evolution of the heat-treated T8A locator over 2000 cycles at 3.5 N·m. Simulation A employs the wear coefficient obtained from the wear test conducted under a normal load of 20 N, whereas Simulation B uses the wear coefficient determined under a normal load of 30 N, in order to evaluate the influence of different wear parameters on the predicted cyclic clamping performance of the positioning device. The experimental clamping force exhibits a pronounced stage-dependent and non-monotonic evolution, increasing rapidly during the initial cycles, followed by a gradual reduction in the growth rate and transition into a relatively stable range. After approximately 1200 cycles, the clamping force decreases to a certain extent and subsequently stabilizes again with moderate fluctuations. These results indicate that the positioning device undergoes pronounced adjustment of its internal contact state during cyclic loading, and the corresponding wear-evolution mechanism is further discussed in Section 4.4.
Figure 13.
Comparison of clamping-force evolution between the experiment and the thread-free finite element model over 2000 cycles.
Compared with the experimental results, both simulations are capable of reproducing the main trend of clamping-force evolution with increasing cycle number. When the wear coefficients obtained from the 20 N and 30 N wear tests are adopted, Simulation A yields a coefficient of determination RA2 of 0.956 and a mean absolute percentage error (MAPE) of 0.45%, whereas Simulation B achieves an RB2 of 0.997 and a MAPE of 0.12%. Both sets of numerical results capture the increase in clamping force during the initial cycles, the stage-wise decrease after approximately 1200 cycles, and the subsequent recovery. The R2 and MAPE values indicate that the model predictions remain highly consistent with the experimental data under different wear-coefficient inputs. The local fluctuations in the experimentally measured clamping force may be associated with variations in the actual contact conditions during repeated tightening. Assembly clearances and ball-position deviations may alter the engagement of individual contact pairs, leading to changes in contact deformation and load sharing within the internal ball-contact system. Surface roughness may affect the effective contact area and local contact stiffness through asperity deformation, whereas wear debris retained or displaced at the interfaces may temporarily modify local friction and contact conditions. These variations can affect the transmission of axial load and consequently contribute to fluctuations in the measured clamping force. Such effects are consistent with previous studies on evolving contact conditions and surface characteristics [24,25,26]. However, these factors were not independently characterized in the present experiments and are therefore considered possible contributors rather than individually verified causes.
It should be noted that agreement between the simulated and measured clamping-force histories supports the model’s ability to reproduce the overall functional response under the selected wear-coefficient inputs, but does not independently verify the local in-service wear coefficients or the absolute wear depth at each contact interface. The limitations of coefficient transfer from the controlled ball-on-flat wear tests are discussed in the subsection “Differences Between Laboratory Wear Tests and Actual Service Conditions” in Section 2.2.
4.3. Contact Load Transfer and Wear Response Under Equivalent Axial Displacement
4.3.1. Internal Contact Load-Transfer Characteristics
Figure 14 shows localized von Mises stress concentrations at the contact interfaces under the reference clamping condition. The stress decreases away from these contacts, indicating that the retained ball-contact system transmits load through discrete contact regions.
Figure 14.
Von Mises stress distribution in the precision locator under the reference clamping condition: (a) overall model and local contact region; (b) ball retaining sleeve; (c) bore wall of the locator body; (d) bottom of the loading screw.
The peak von Mises stresses were approximately 56.93 MPa in the ball retaining sleeve, 220 MPa at the locator-body bore wall, and 17.26 MPa at the bottom of the loading screw (Figure 14b–d). The sleeve and bore-wall concentrations correspond to the circumferential-ball contacts, with pronounced stress gradients extending into the surrounding material.
These differences reflect local contact geometry and constraints rather than a monotonic increase in transmitted axial load. The high bore-wall stress identifies a region of strong local loading; its wear response must also be assessed using contact pressure and relative sliding, as discussed in Section 4.3.2.
4.3.2. Wear Distribution in Critical Contact Regions
Figure 15 shows the CWEAR distribution in the critical contact regions of the locator under cyclic loading. Wear is concentrated at the contact interfaces and nearby regions, forming localized patches at the discrete ball contacts.
Figure 15.
CWEAR distribution in the critical contact regions of the heat-treated T8A locator: (a) overall positioning device; (b) ball retaining sleeve region; (c) bore-wall region of the locator body; (d) bottom region of the loading screw.
Significant differences in wear level are observed among the different contact regions. In the ball retaining sleeve region, the maximum CWEAR is approximately 5.471 × 10⁻⁷, with wear mainly concentrated at the local contact locations corresponding to the circumferential balls and distributed discretely along the circumferential direction, as shown in Figure 15b. The bore-wall region of the locator body exhibits greater cumulative wear depth, with a maximum CWEAR of 2.696 × 10⁻⁶; the high-value regions are mainly located at the three contact positions between the circumferential balls and the bore wall, forming spatially separated local wear patches, as shown in Figure 15c. In the bottom region of the loading screw, the maximum CWEAR is approximately 3.923 × 10⁻⁷, with wear concentrated at the contact center between the loading screw and the central ball and gradually decreasing toward the surrounding area, as shown in Figure 15d. Overall, the bore-wall region exhibits the highest wear level, followed by the ball retaining sleeve, while the bottom region of the loading screw shows a comparatively lower wear level, indicating that different contact pairs exhibit markedly different wear sensitivities under the same overall clamping condition.
Combined with the internal contact load-transfer characteristics discussed above, the regions of high wear show a strong spatial correspondence with the primary load-transfer path, although their evolution is not governed solely by the local stress level. According to the Archard wear model, the local wear increment is jointly controlled by contact pressure and relative sliding; therefore, the differences in wear among various regions essentially reflect the coupled effects of local load-bearing level, contact geometry, and relative motion state. In particular, the circumferential ball–bore-wall contact region sustains relatively high local loads while also experiencing pronounced relative sliding, resulting in greater cumulative wear depth and stronger regional sensitivity.
Based on the numerical results, three anti-wear measures are recommended for the circumferential ball–bore-wall contact interfaces: optimizing the local contact geometry and fit, applying wear-resistant surface coatings, and improving lubrication conditions. These recommendations are supported by previous experimental studies. Shima et al. [49] demonstrated that modifying ball-bearing raceway curvature reduced fretting wear, providing a basis for improving local contact geometry. Piotrowska et al. [50] reported that diamond-like carbon (DLC) coatings reduced friction and wear in bearing contacts, supporting the application of wear-resistant surface protection. Furthermore, Han et al. [39] demonstrated that appropriate anti-wear additives in grease mitigated fretting wear under cyclic variable loading. Therefore, these measures offer practical approaches for improving the wear resistance of the bore-wall contact regions identified in this study.
4.4. Cyclic Wear Behavior of the Locator
Because the overall wear of the positioning device remained relatively slight after 2000 cycles and the surface changes at most critical contact regions were difficult to clearly distinguish from macroscopic photographs, the ball retaining sleeve, which exhibited comparatively pronounced wear traces, was selected as a representative component for comparative analysis between the experimental morphology and the finite element predictions.
As shown in Figure 16a, visible scuff marks and surface changes occur in localized regions on the inner contact surface of the ball retaining sleeve. Three regions are highlighted by red ellipses and arrows to aid visual inspection. Figure 16b shows three localized CWEAR concentrations at the circumferential ball–sleeve contacts. This comparison provides a qualitative illustration of the localized nature of surface damage at these contacts. However, the photograph does not provide wear-depth or wear-volume measurements; therefore, neither the absolute CWEAR values nor the relative wear magnitudes among the three contact positions can be quantitatively validated from this image.
Figure 16.
Qualitative comparison of wear in the ball retaining sleeve: (a) experimental wear morphology; (b) simulated CWEAR distribution.
During tightening, the internal ball-contact system distributes the axial thrust to the ball retaining sleeve and locator body. Because the contact between the circumferential balls and the ball retaining sleeve is characterized by localized discrete contact, the load is concentrated within limited contact regions; meanwhile, a certain degree of relative sliding occurs between the balls and the contact surfaces during repeated loading and unloading. Therefore, under the combined effects of local contact pressure and relative sliding, progressive material removal occurs in the contact regions, leading to an increase in wear depth. With increasing cycle number, local wear further modifies the original contact geometry and actual contact area, resulting in redistribution of contact pressure and load and subsequently affecting the wear location and wear rate in later cycles.
The above changes in contact state are mechanically consistent with the stage-dependent evolution of the clamping force described previously. As shown in Figure 13, during the initial cycles, the contact pairs undergo running-in and re-conformation, during which the local contact area and load distribution are continuously adjusted, resulting in relatively pronounced variations in clamping force; as the contact state gradually stabilizes, the clamping force also tends to become relatively steady. With further cycling, changes in contact geometry and contact stiffness induced by local wear may lead to a stage-wise decrease or fluctuation in clamping force; once the worn contact surfaces re-establish a relatively stable mating condition, the overall clamping response tends to stabilize again. Therefore, the variation in clamping force during cyclic operation of the positioning device does not simply correspond to a monotonic increase in wear, but rather results from the combined effects of local wear, contact-state adjustment, and load redistribution. Taken together, the experimental wear morphology, CWEAR distribution, and clamping-force response indicate that cyclic wear of the positioning device is characterized by progressive local contact damage that alters the internal load-transfer state and subsequently affects the evolution of the overall clamping response, demonstrating that local wear locations and contact-state reconstruction are key factors governing the long-term clamping stability of the positioning device.
5. Conclusions
An experimentally calibrated thread-free model was developed to connect local cyclic wear with the global clamping response of a precision locator. The main conclusions are as follows:
(1) The threaded actuation was represented by an equivalent axial displacement calibrated against the measured initial clamping force at 3.5 N·m. The theoretical torque–thrust relation supplied the initial estimate, while calibration determined the displacement applied to the retained multi-contact system. Application to other torque or thread-friction conditions requires separate calibration and assessment.
(2) Mechanical-property and reciprocating wear tests supplied the material inputs for heat-treated T8A steel. The specific wear rates measured at 20 N and 30 N were retained separately in Simulations A and B, respectively. These experimentally determined coefficients were treated as condition-specific inputs to the incremental Archard wear calculation.
(3) The thread-free finite element model revealed the load-transfer and wear-distribution characteristics of the positioning device under the coupled action of multiple internal contact pairs. The load follows the principal multi-contact load-transfer path, while the spatial distribution of wear is jointly governed by local contact pressure and relative sliding. Among the investigated regions, the bore wall of the locator body exhibits the highest CWEAR level and is identified as the primary wear-sensitive region. The ball retaining sleeve and the bottom region of the loading screw exhibit comparatively lower wear levels, indicating pronounced nonuniform wear among different contact pairs due to differences in local load-bearing conditions and relative motion states.
(4) Under the calibrated displacement amplitude, wear-induced changes in contact geometry and stiffness modified the internal load distribution and reaction force, connecting local material removal to the global clamping response. Both simulations reproduced the main stages of the measured clamping-force history over 2000 cycles at 3.5 N·m. This agreement supports the model’s global response under the tested condition; local wear depths remain numerical predictions and are not independently validated by the clamping-force comparison.
Author Contributions
Conceptualization, Z.G., D.W. and M.L.; Methodology, Z.H., D.W., Z.G. and M.L.; Software, Z.H. and D.L.; Validation, Z.H., W.G. and S.Z.; Formal Analysis, Z.H., M.L. and D.L.; Investigation, Z.H., W.G., S.Z. and M.L.; Resources, D.W. and Z.G.; Data Curation, Z.H., S.Z. and D.L.; Writing—Original Draft Preparation, Z.H.; Writing—Review and Editing, Z.G., D.W., M.L., D.L. and S.Z.; Visualization, Z.H. and W.G.; Supervision, Z.G. and D.W.; Project Administration, D.W. and Z.G.; Funding Acquisition, Z.G. All authors have read and agreed to the published version of the manuscript.
Funding
This research was funded by the National Natural Science Foundation of China (grant numbers 12302239).
Data Availability Statement
The raw data supporting the conclusions of this article will be made available by the authors on request.
Acknowledgments
During the preparation of this manuscript, the authors used an AI tool for language polishing and improving the readability of the manuscript. The authors have reviewed and edited the output and take full responsibility for the content of this publication.
Conflicts of Interest
Authors Dawei Wang, Shuaijun Zhou, and Min Liu were employed by AVIC SAC Commercial Aircraft Company Ltd. The remaining authors declare that the research was conducted in the absence of any commercial or financial relationships that could be construed as a potential conflict of interest.
References
- Zhao, X.; Tan, R.; Wang, Z.; Zou, X.; Hu, Z.; Sun, T. The design and implementation of a high-precision positioner fixture. Micromachines 2021, 12, 1227. [Google Scholar] [CrossRef] [Scilit] [PubMed]
- Acero, R.; Aguilar, J.J.; Brosed, F.J.; Santolaria, J.; Aguado, S.; Pueo, M. Design of a multi-point kinematic coupling for a high precision telescopic simultaneous measurement system. Sensors 2021, 21, 6365. [Google Scholar] [CrossRef] [Scilit] [PubMed]
- Zhang, X.; Meng, S.; Wang, B.; Zheng, L.; Zhang, R.; Li, X. Integrated assembly, measurement, and adjustment method of reconfigurable flexible fixture for aircraft panels based on augmented reality and human-computer interaction. J. Manuf. Syst. 2025, 79, 117–133. [Google Scholar] [CrossRef] [Scilit]
- Wang, Y.; Meng, S.; Zheng, L.; Zhang, X.; Zhang, Z. Positioning accuracy evaluation and corrective adjustment of reconfigurable assembly fixtures based on geometric constraints. Comput. Ind. Eng. 2026, 216, 111963. [Google Scholar] [CrossRef] [Scilit]
- Fouvry, S.; Liskiewicz, T.; Kapsa, P.; Hannel, S.; Sauger, E. An energy description of wear mechanisms and its applications to oscillating sliding contacts. Wear 2003, 255, 287–298. [Google Scholar] [CrossRef] [Scilit]
- Fouvry, S.; Kapsa, P.; Vincent, L. An elastic–plastic shakedown analysis of fretting wear. Wear 2001, 247, 41–54. [Google Scholar] [CrossRef] [Scilit]
- Ding, J.; Leen, S.B.; McColl, I.R. The effect of slip regime on fretting wear-induced stress evolution. Int. J. Fatigue 2004, 26, 521–531. [Google Scholar] [CrossRef] [Scilit]
- Mohd Tobi, A.L.; Ding, J.; Bandak, G.; Leen, S.B.; Shipway, P.H. A study on the interaction between fretting wear and cyclic plasticity for Ti–6Al–4V. Wear 2009, 267, 270–282. [Google Scholar] [CrossRef] [Scilit]
- Tang, Y.Q.; Kumar, A.; Chen, D.L.; Li, D.Y.; Li, Q.Y.; Li, W. Bauschinger effect on wear of cold-worked Cu and Mg—A study combining molecular dynamics modeling and experimental investigation. Wear 2023, 522, 204726. [Google Scholar] [CrossRef] [Scilit]
- Ozen, E.B.; Huber, J.E. Experimental investigation of dry reciprocating wear behaviour using an annular common edge contact configuration. Tribol. Lett. 2025, 73, 78. [Google Scholar] [CrossRef] [Scilit]
- Archard, J.F. Contact and rubbing of flat surfaces. J. Appl. Phys. 1953, 24, 981–988. [Google Scholar] [CrossRef] [Scilit]
- Meng, H.C.; Ludema, K.C. Wear models and predictive equations: Their form and content. Wear 1995, 181–183, 443–457. [Google Scholar] [CrossRef] [Scilit]
- Tang, Y.; Pan, H.; Li, D.Y. Contribution of cold-work to the wear resistance of materials and its limitation—A study combining molecular dynamics modeling and experimental investigation. Wear 2021, 476, 203642. [Google Scholar] [CrossRef] [Scilit]
- Reichelt, M.; Cappella, B. Large scale multi-parameter analysis of wear of self-mated 100Cr6 steel—A study of the validity of Archard’s law. Tribol. Int. 2021, 159, 106945. [Google Scholar] [CrossRef] [Scilit]
- Mattei, L.; Di Puccio, F. How accurate is the Archard law to predict wear of UHMWPE in hard-on-soft hip implants? A numerical and experimental investigation. Tribol. Int. 2023, 187, 108768. [Google Scholar] [CrossRef] [Scilit]
- Choudhry, J.; Almqvist, A.; Larsson, R. Improving Archard’s wear model: An energy-based approach. Tribol. Lett. 2024, 72, 93. [Google Scholar] [CrossRef] [Scilit]
- McColl, I.R.; Ding, J.; Leen, S.B. Finite element simulation and experimental validation of fretting wear. Wear 2004, 256, 1114–1127. [Google Scholar] [CrossRef] [Scilit]
- Hegadekatte, V.; Huber, N.; Kraft, O. Modeling and simulation of wear in a pin on disc tribometer. Tribol. Lett. 2006, 24, 51–60. [Google Scholar] [CrossRef] [Scilit]
- Kasarekar, A.T.; Bolander, N.W.; Sadeghi, F.; Tseregounis, S. Modeling of fretting wear evolution in rough circular contacts in partial slip. Int. J. Mech. Sci. 2007, 49, 690–703. [Google Scholar] [CrossRef] [Scilit]
- Bastola, A.; Stewart, D.; Dini, D. Three-dimensional finite element simulation and experimental validation of sliding wear. Wear 2022, 504–505, 204402. [Google Scholar] [CrossRef] [Scilit]
- Won, J.Y.; Jeong, H.; Kyeong, J.; Oh, W.; Lee, M.G. Surface topology-based wear evolution model integrated with multiscale frictional contact in finite element analysis. Int. J. Solids Struct. 2026, 336, 114012. [Google Scholar] [CrossRef] [Scilit]
- Madge, J.J.; Leen, S.B.; Shipway, P.H. The critical role of fretting wear in the analysis of fretting fatigue. Wear 2007, 263, 542–551. [Google Scholar] [CrossRef] [Scilit]
- Mattei, L.; Di Puccio, F. Frictionless vs. frictional contact in numerical wear predictions of conformal and non-conformal sliding couplings. Tribol. Lett. 2022, 70, 115. [Google Scholar] [CrossRef] [Scilit]
- Zhang, H.; Goltsberg, R.; Etsion, I. Modeling adhesive wear in asperity and rough surface contacts: A review. Materials 2022, 15, 6855. [Google Scholar] [CrossRef] [Scilit] [PubMed]
- Mäntylä, A.; Hintikka, J.; Frondelius, T.; Vaara, J.; Lehtovaara, A.; Juoksukangas, J. Prediction of contact condition and surface damage by simulating variable friction coefficient and wear. Tribol. Int. 2020, 143, 106054. [Google Scholar] [CrossRef] [Scilit]
- Schewe, M.; Wilbuer, H.; Menzel, A. Simulation of wear and effective friction properties of microstructured surfaces. Wear 2021, 464–465, 203491. [Google Scholar] [CrossRef] [Scilit]
- Shu, Y.; Liu, Z.; Yang, G. Finite element simulation of fretting wear on railway axle press-fit specimens. Tribol. Int. 2023, 178, 108024. [Google Scholar] [CrossRef] [Scilit]
- Sun, Y.; Li, Y.; Zhang, Q.; Qin, X.; Chen, K. Wear analysis and simulation of small module gear based on Archard model. Eng. Fail. Anal. 2023, 144, 106990. [Google Scholar] [CrossRef] [Scilit]
- Zhao, X.; Fan, W.; Wang, Z.; Wen, Z.; Wang, P. An explicit finite element approach for simulations of transient meshing contact of gear pairs and the resulting wear. Wear 2023, 523, 204802. [Google Scholar] [CrossRef] [Scilit]
- He, Y.; Wang, B.; Zhao, F.; Hong, X.; Fang, L.; Xu, W.; Liao, M.; Tian, F. Dynamic wear modeling and experimental verification of guide cone in passive compliant connectors based on the Archard model. Polymers 2025, 17, 2091. [Google Scholar] [CrossRef] [Scilit] [PubMed]
- Wang, J.; Li, J.; Ma, C. A performance degradation analysis method for a reciprocating rod seal in the wear process under mixed lubrication conditions. Proc. Inst. Mech. Eng. Part J J. Eng. Tribol. 2023, 237, 681–697. [Google Scholar] [CrossRef] [Scilit]
- Pai, N.G.; Hess, D.P. Three-dimensional finite element analysis of threaded fastener loosening due to dynamic shear load. Eng. Fail. Anal. 2002, 9, 383–402. [Google Scholar] [CrossRef] [Scilit]
- Nassar, S.A.; Housari, B.A. Effect of thread pitch and initial tension on the self-loosening of threaded fasteners. J. Press. Vessel Technol. 2006, 128, 590–598. [Google Scholar] [CrossRef] [Scilit]
- Nassar, S.A.; Yang, X. A mathematical model for vibration-induced loosening of preloaded threaded fasteners. J. Vib. Acoust. 2009, 131, 021009. [Google Scholar] [CrossRef] [Scilit]
- Zhang, M.; Zeng, D.; Lu, L.; Zhang, Y.; Wang, J.; Xu, J. Finite element modelling and experimental validation of bolt loosening due to thread wear under transverse cyclic loading. Eng. Fail. Anal. 2019, 104, 341–353. [Google Scholar] [CrossRef] [Scilit]
- GB/T 1299-2025; Tool and Mould Steels. State Administration for Market Regulation, Standardization Administration of China: Beijing, China, 2025.
- ISO 6892-1:2019; Metallic Materials—Tensile Testing—Part 1: Method of Test at Room Temperature. International Organization for Standardization (ISO): Geneva, Switzerland, 2019.
- Schultheiss, H.; Tobie, T.; Stahl, K. The Effect of Selected Grease Components on the Wear Behavior of Grease-Lubricated Gears. J. Tribol. 2016, 138, 011602. [Google Scholar] [CrossRef] [Scilit]
- Han, Y.; Wang, J.; Du, H.; Li, W.; Zhao, J.; Bai, Z.; Hu, M.; Liu, H. Film Thickness Decay and Wear Behavior of Grease-Lubricated Point Contact under Cyclic Variable Loads. Lubricants 2024, 12, 42. [Google Scholar] [CrossRef] [Scilit]
- Chen, J.; Dong, N.; Min, J. Study on the Coupling Relationship between Wear and Dynamics in Planetary Gear Systems. Machines 2023, 11, 986. [Google Scholar] [CrossRef] [Scilit]
- Ratsimba, C.H.H.; McColl, I.R.; Williams, E.J.; Leen, S.B.; Soh, H.P. Measurement, analysis and prediction of fretting wear damage in a representative aeroengine spline coupling. Wear 2004, 257, 1193–1206. [Google Scholar] [CrossRef] [Scilit]
- Xue, X.; Wang, S.; Yu, J.; Qin, L. Wear Characteristics of the Material Specimen and Method of Predicting Wear in Floating Spline Couplings of Aero-Engine. Int. J. Aerosp. Eng. 2017, 2017, 1859167. [Google Scholar] [CrossRef] [Scilit]
- Motosh, N. Development of design charts for bolts preloaded up to the plastic range. J. Eng. Ind. 1976, 98, 849–851. [Google Scholar] [CrossRef] [Scilit]
- Gong, H.; Liu, J.; Ding, X. Calculation of the effective bearing contact radius for precision tightening of bolted joints. Adv. Mech. Eng. 2016, 8, 1–8. [Google Scholar] [CrossRef] [Scilit]
- Barrett, R.T. Fastener Design Manual; NASA Reference Publication 1228; National Aeronautics and Space Administration: Cleveland, OH, USA, 1990.
- Liu, Y.; Yu, W.P.; Zhang, J.D.; Tian, B.H. Effect of deep cryogenic treatment on microstructure and mechanical properties of T8A steel. Trans. Mater. Heat Treat. 2010, 31, 48–52. [Google Scholar]
- Mohan, S.; Prakash, V.; Pathak, J.P. Wear characteristics of HSLA steel. Wear 2002, 252, 16–25. [Google Scholar] [CrossRef] [Scilit]
- Wang, S.Q.; Wei, M.X.; Zhao, Y.T. Effects of the tribo-oxide and matrix on dry sliding wear characteristics and mechanisms of a cast steel. Wear 2010, 269, 424–434. [Google Scholar] [CrossRef] [Scilit]
- Shima, M.; Li, Q.; Aihara, S.; Yamamoto, T.; Sato, J.; Waterhouse, R.B. Design effects on the fretting wear behaviour of ball bearings. Tribol. Int. 1997, 30, 773–778. [Google Scholar] [CrossRef] [Scilit]
- Piotrowska, K.; Madej, M.; Milewski, K. Tribological Properties of DLC Coatings in Model-Based and Real-Life Tests. Materials 2025, 18, 4251. [Google Scholar] [CrossRef] [Scilit] [PubMed]
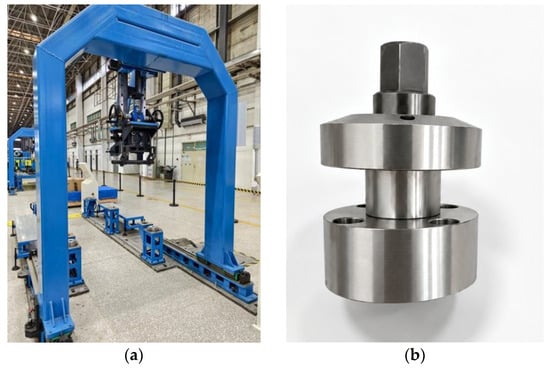
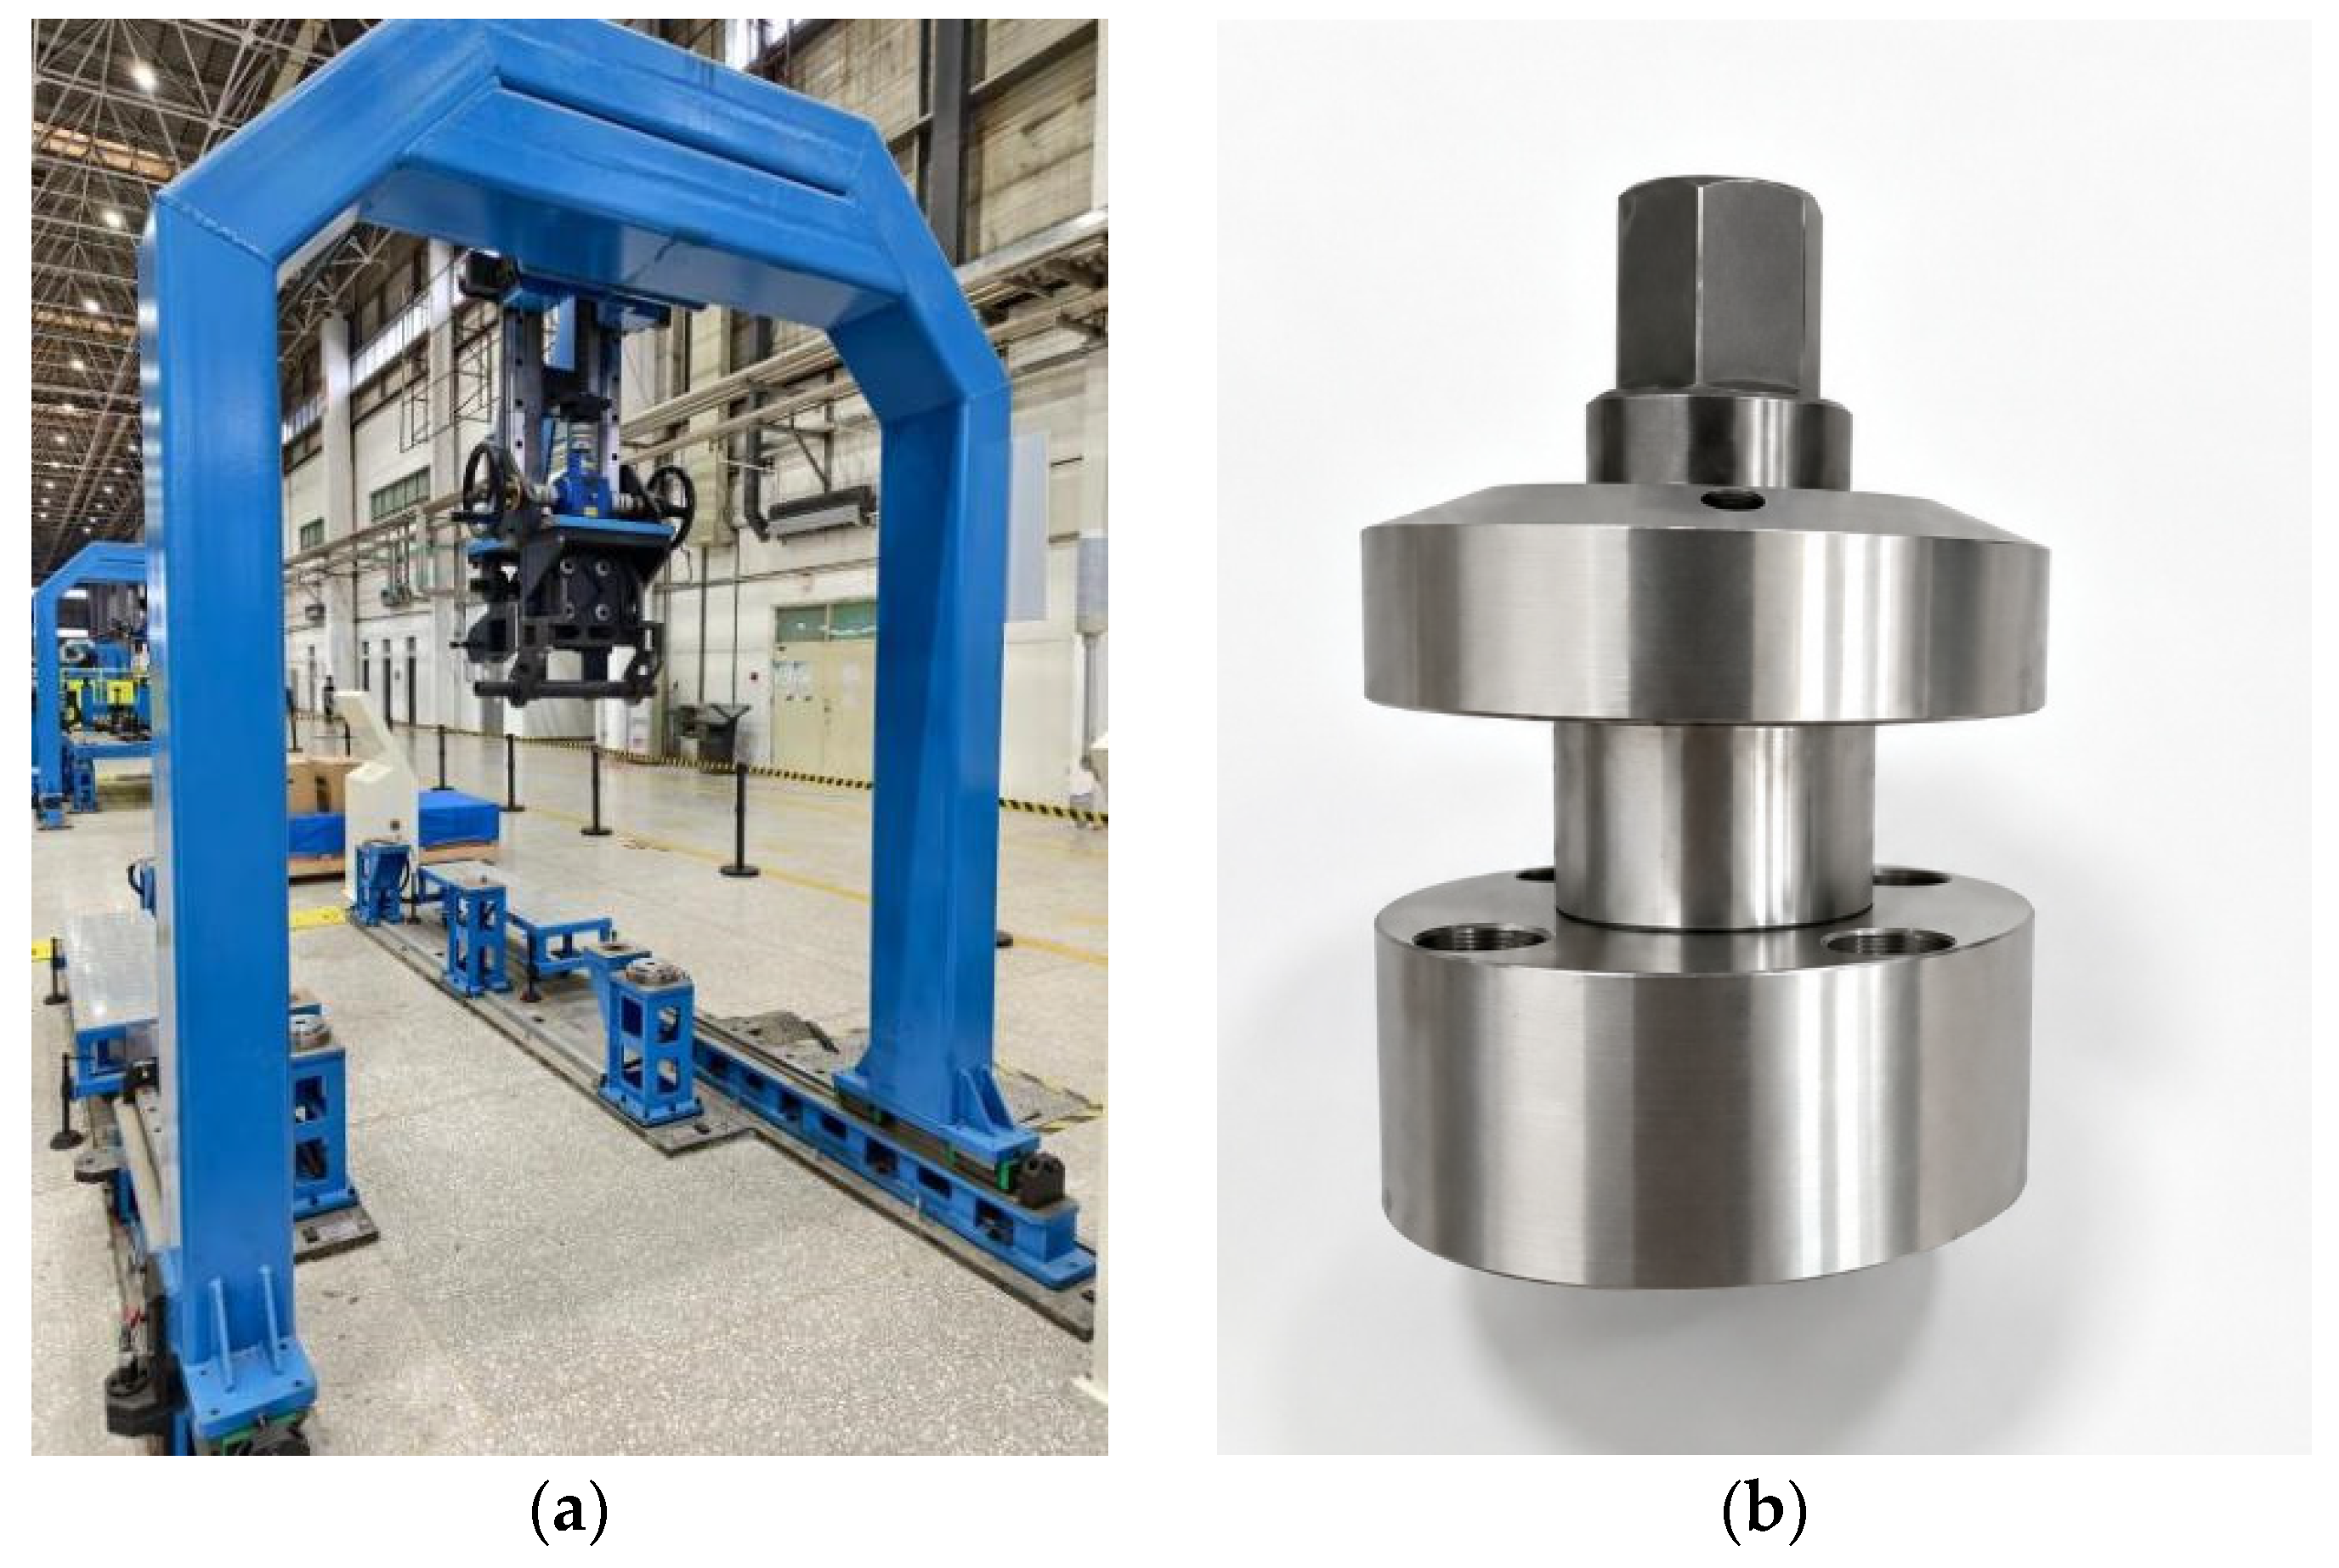
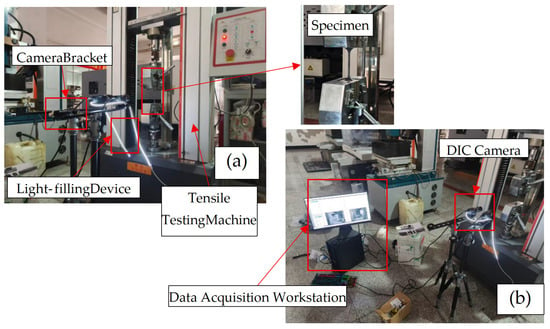
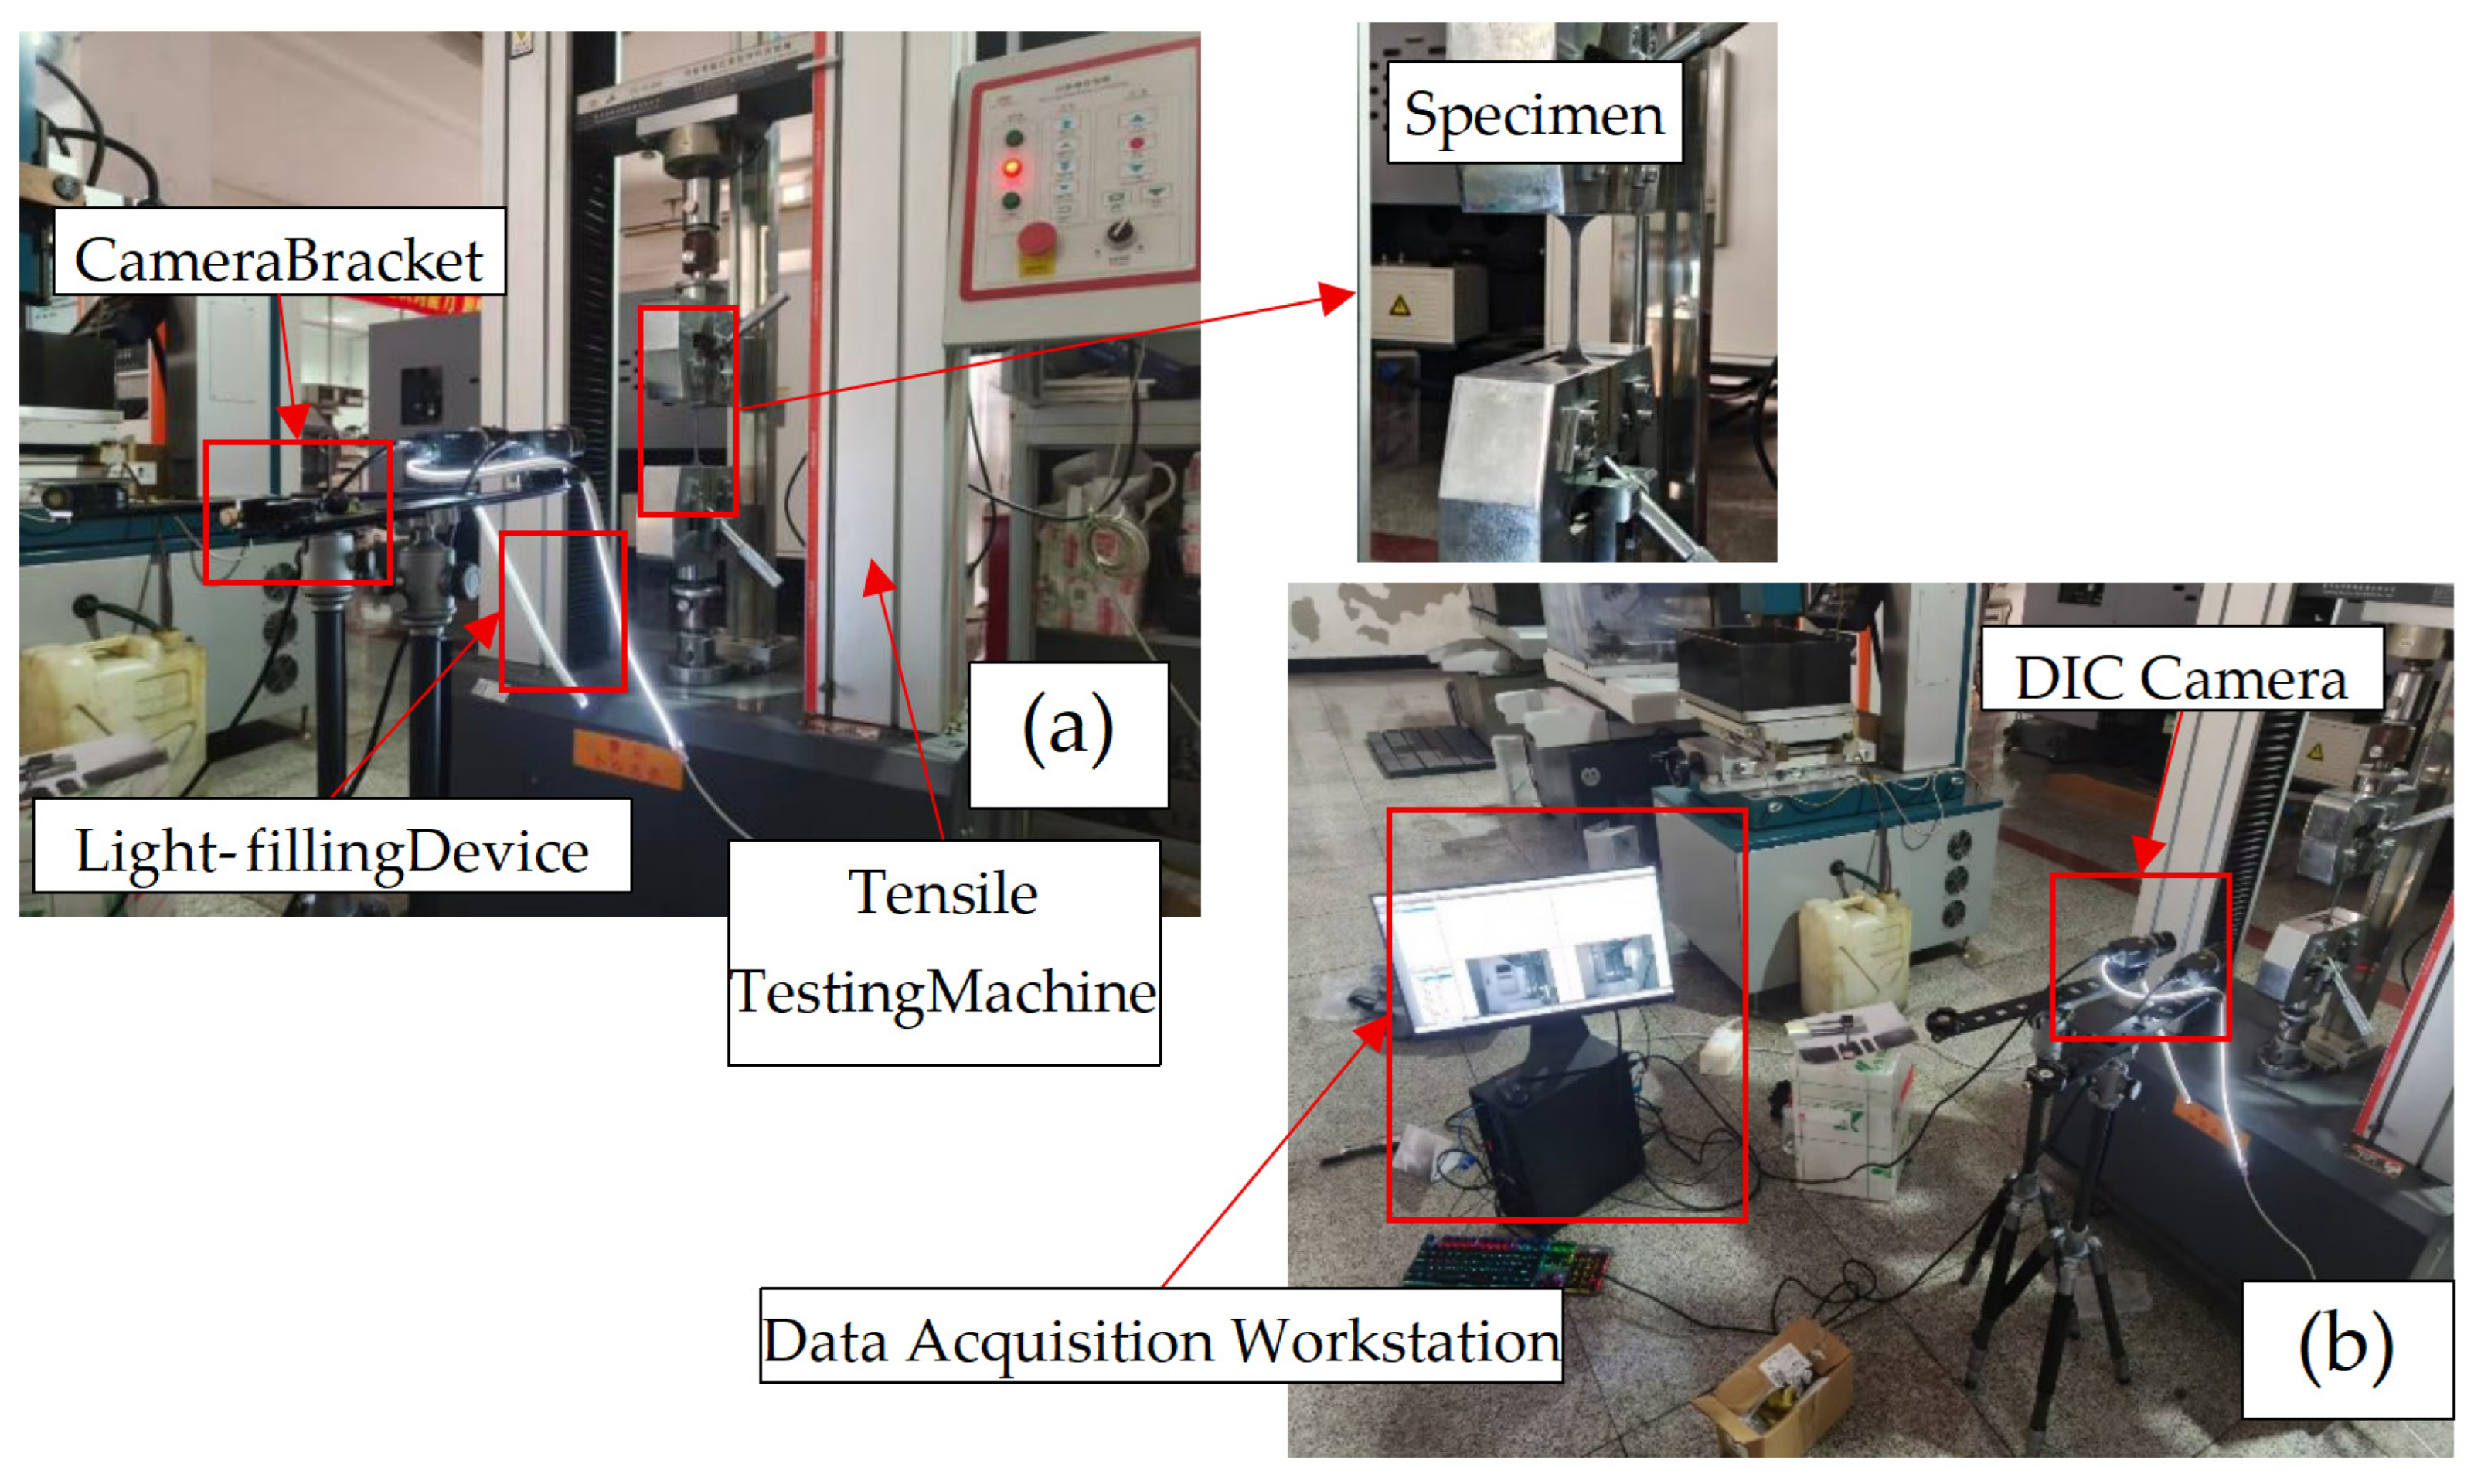
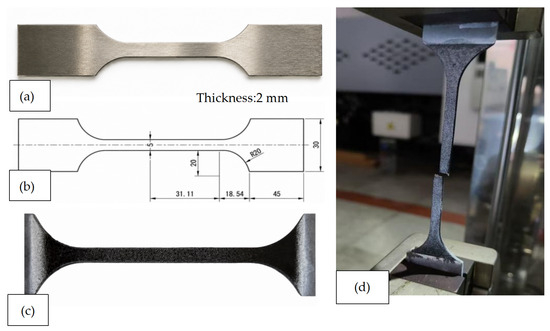
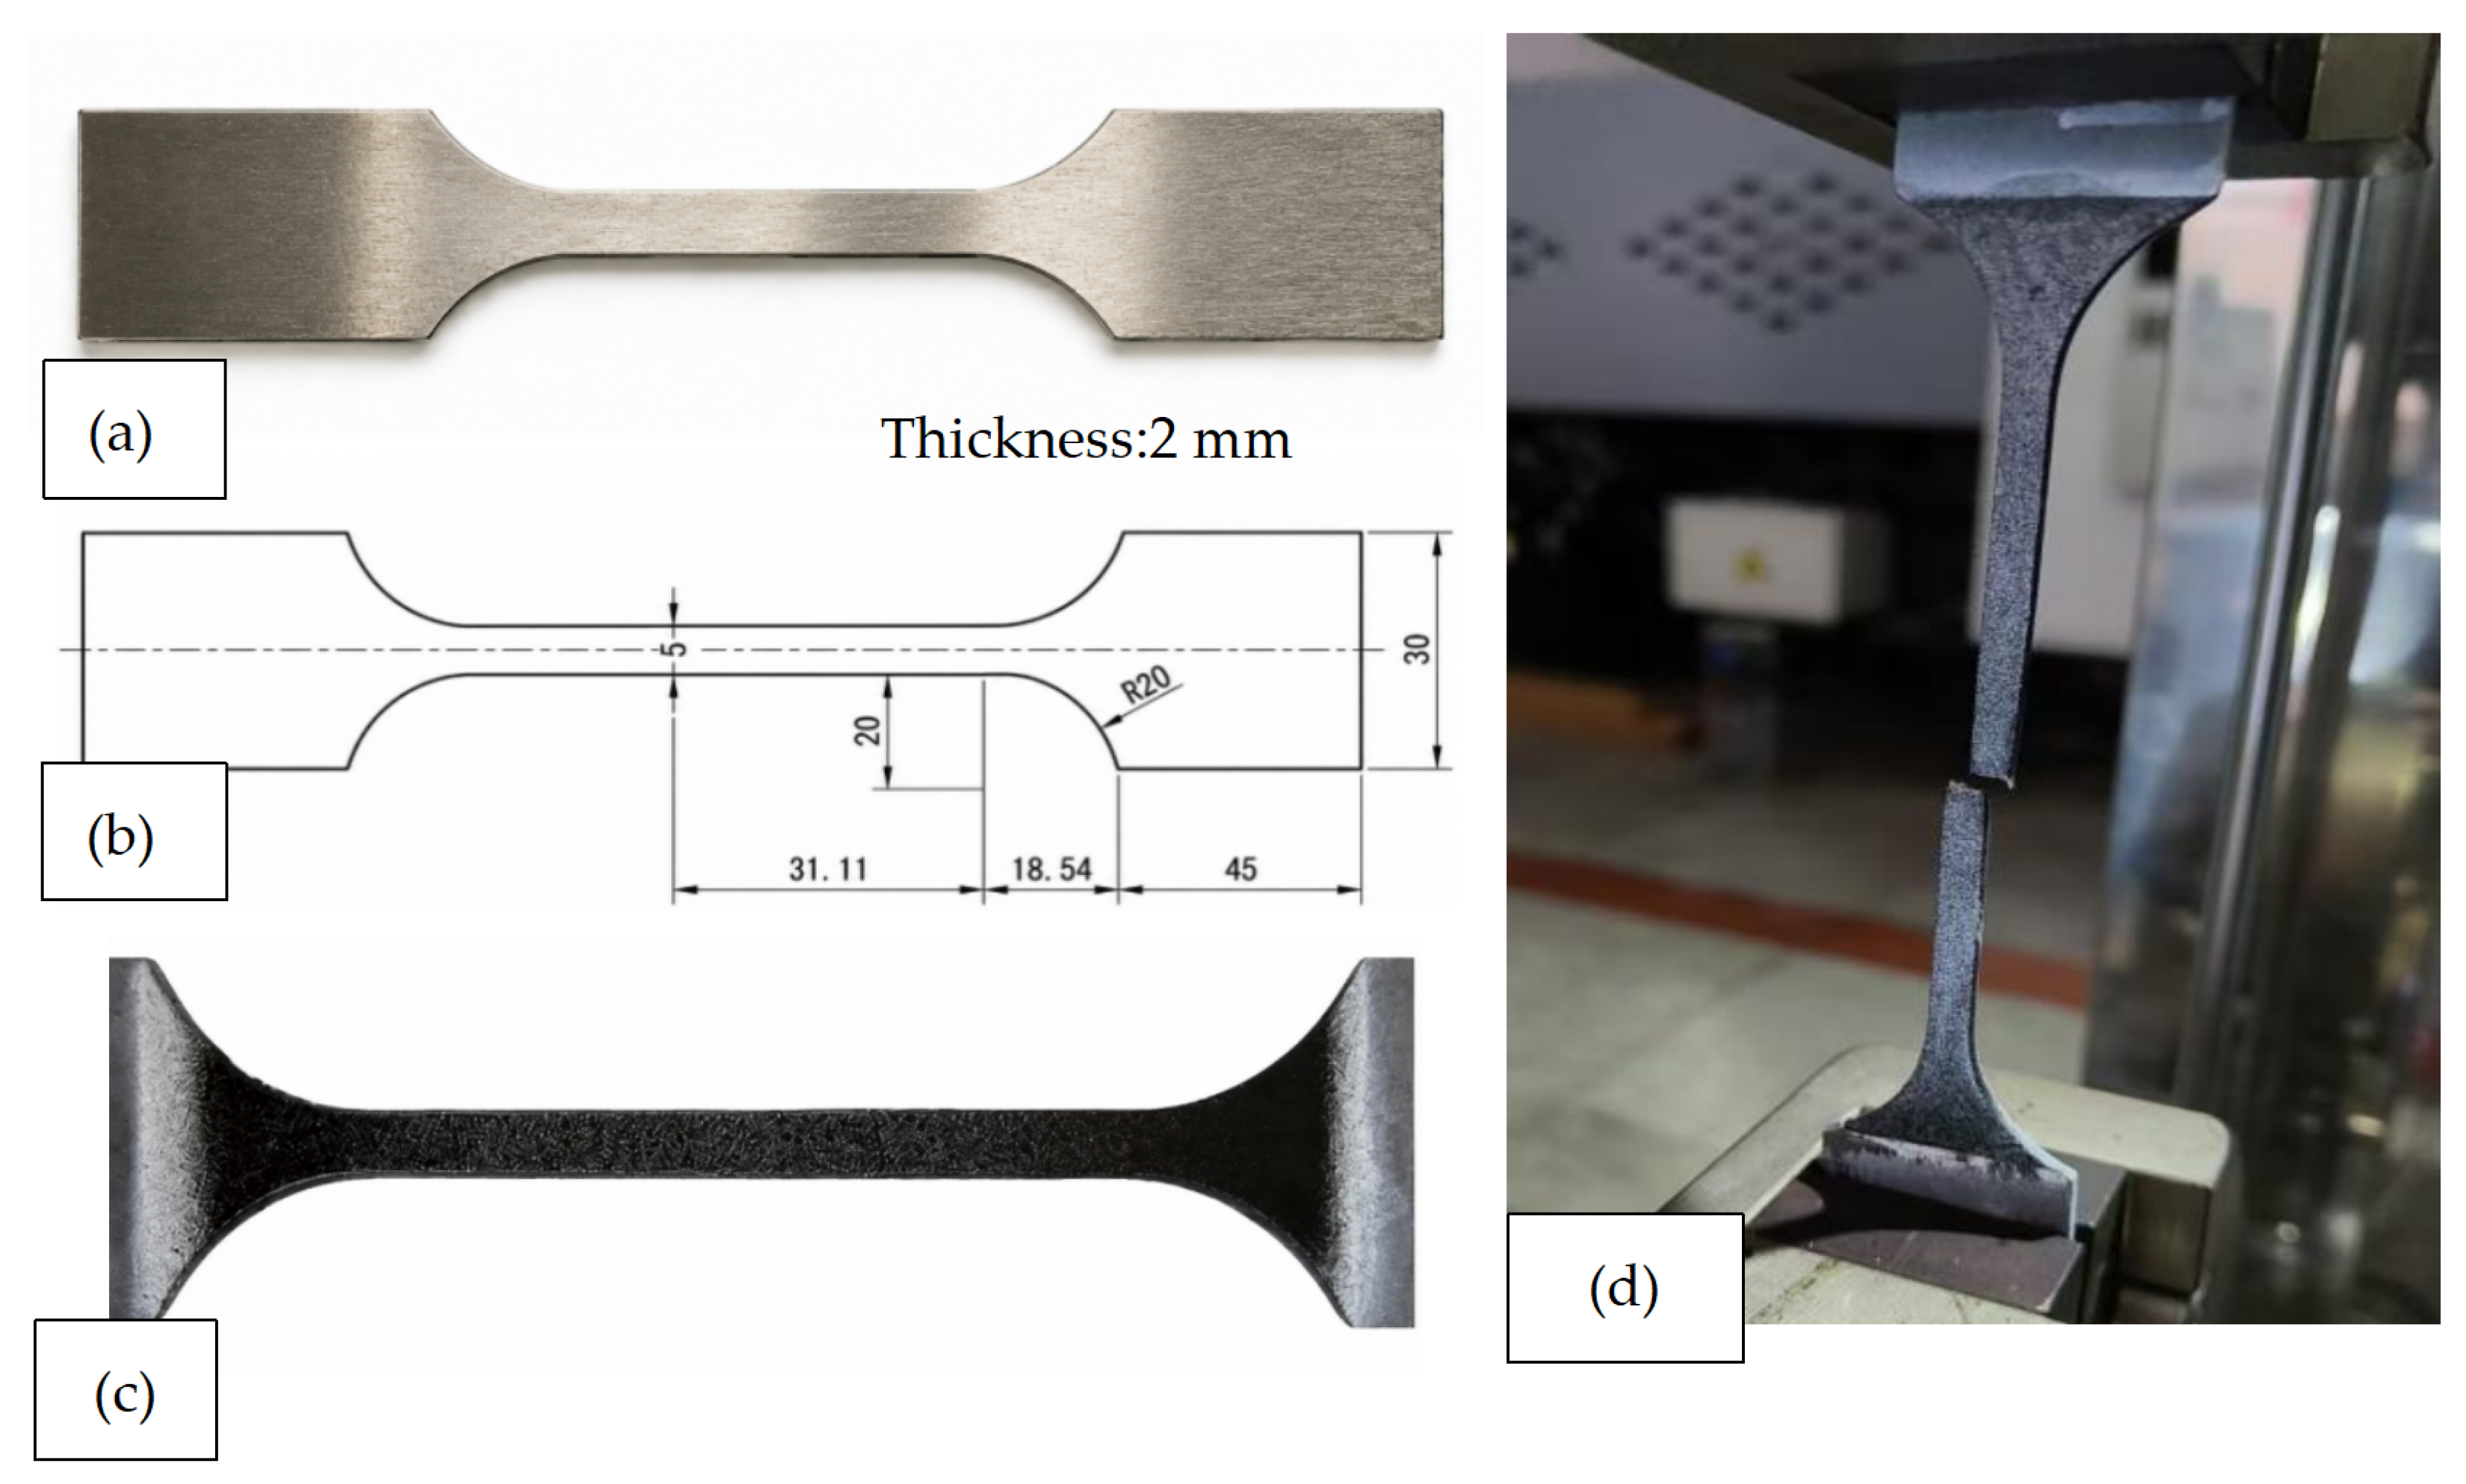
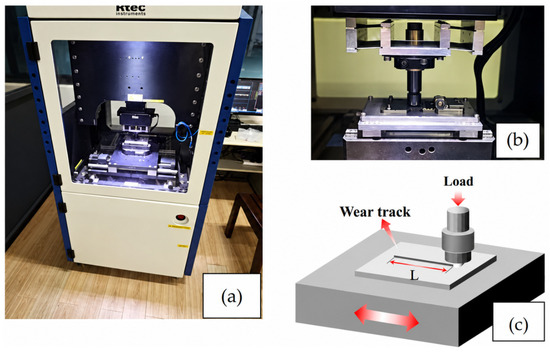
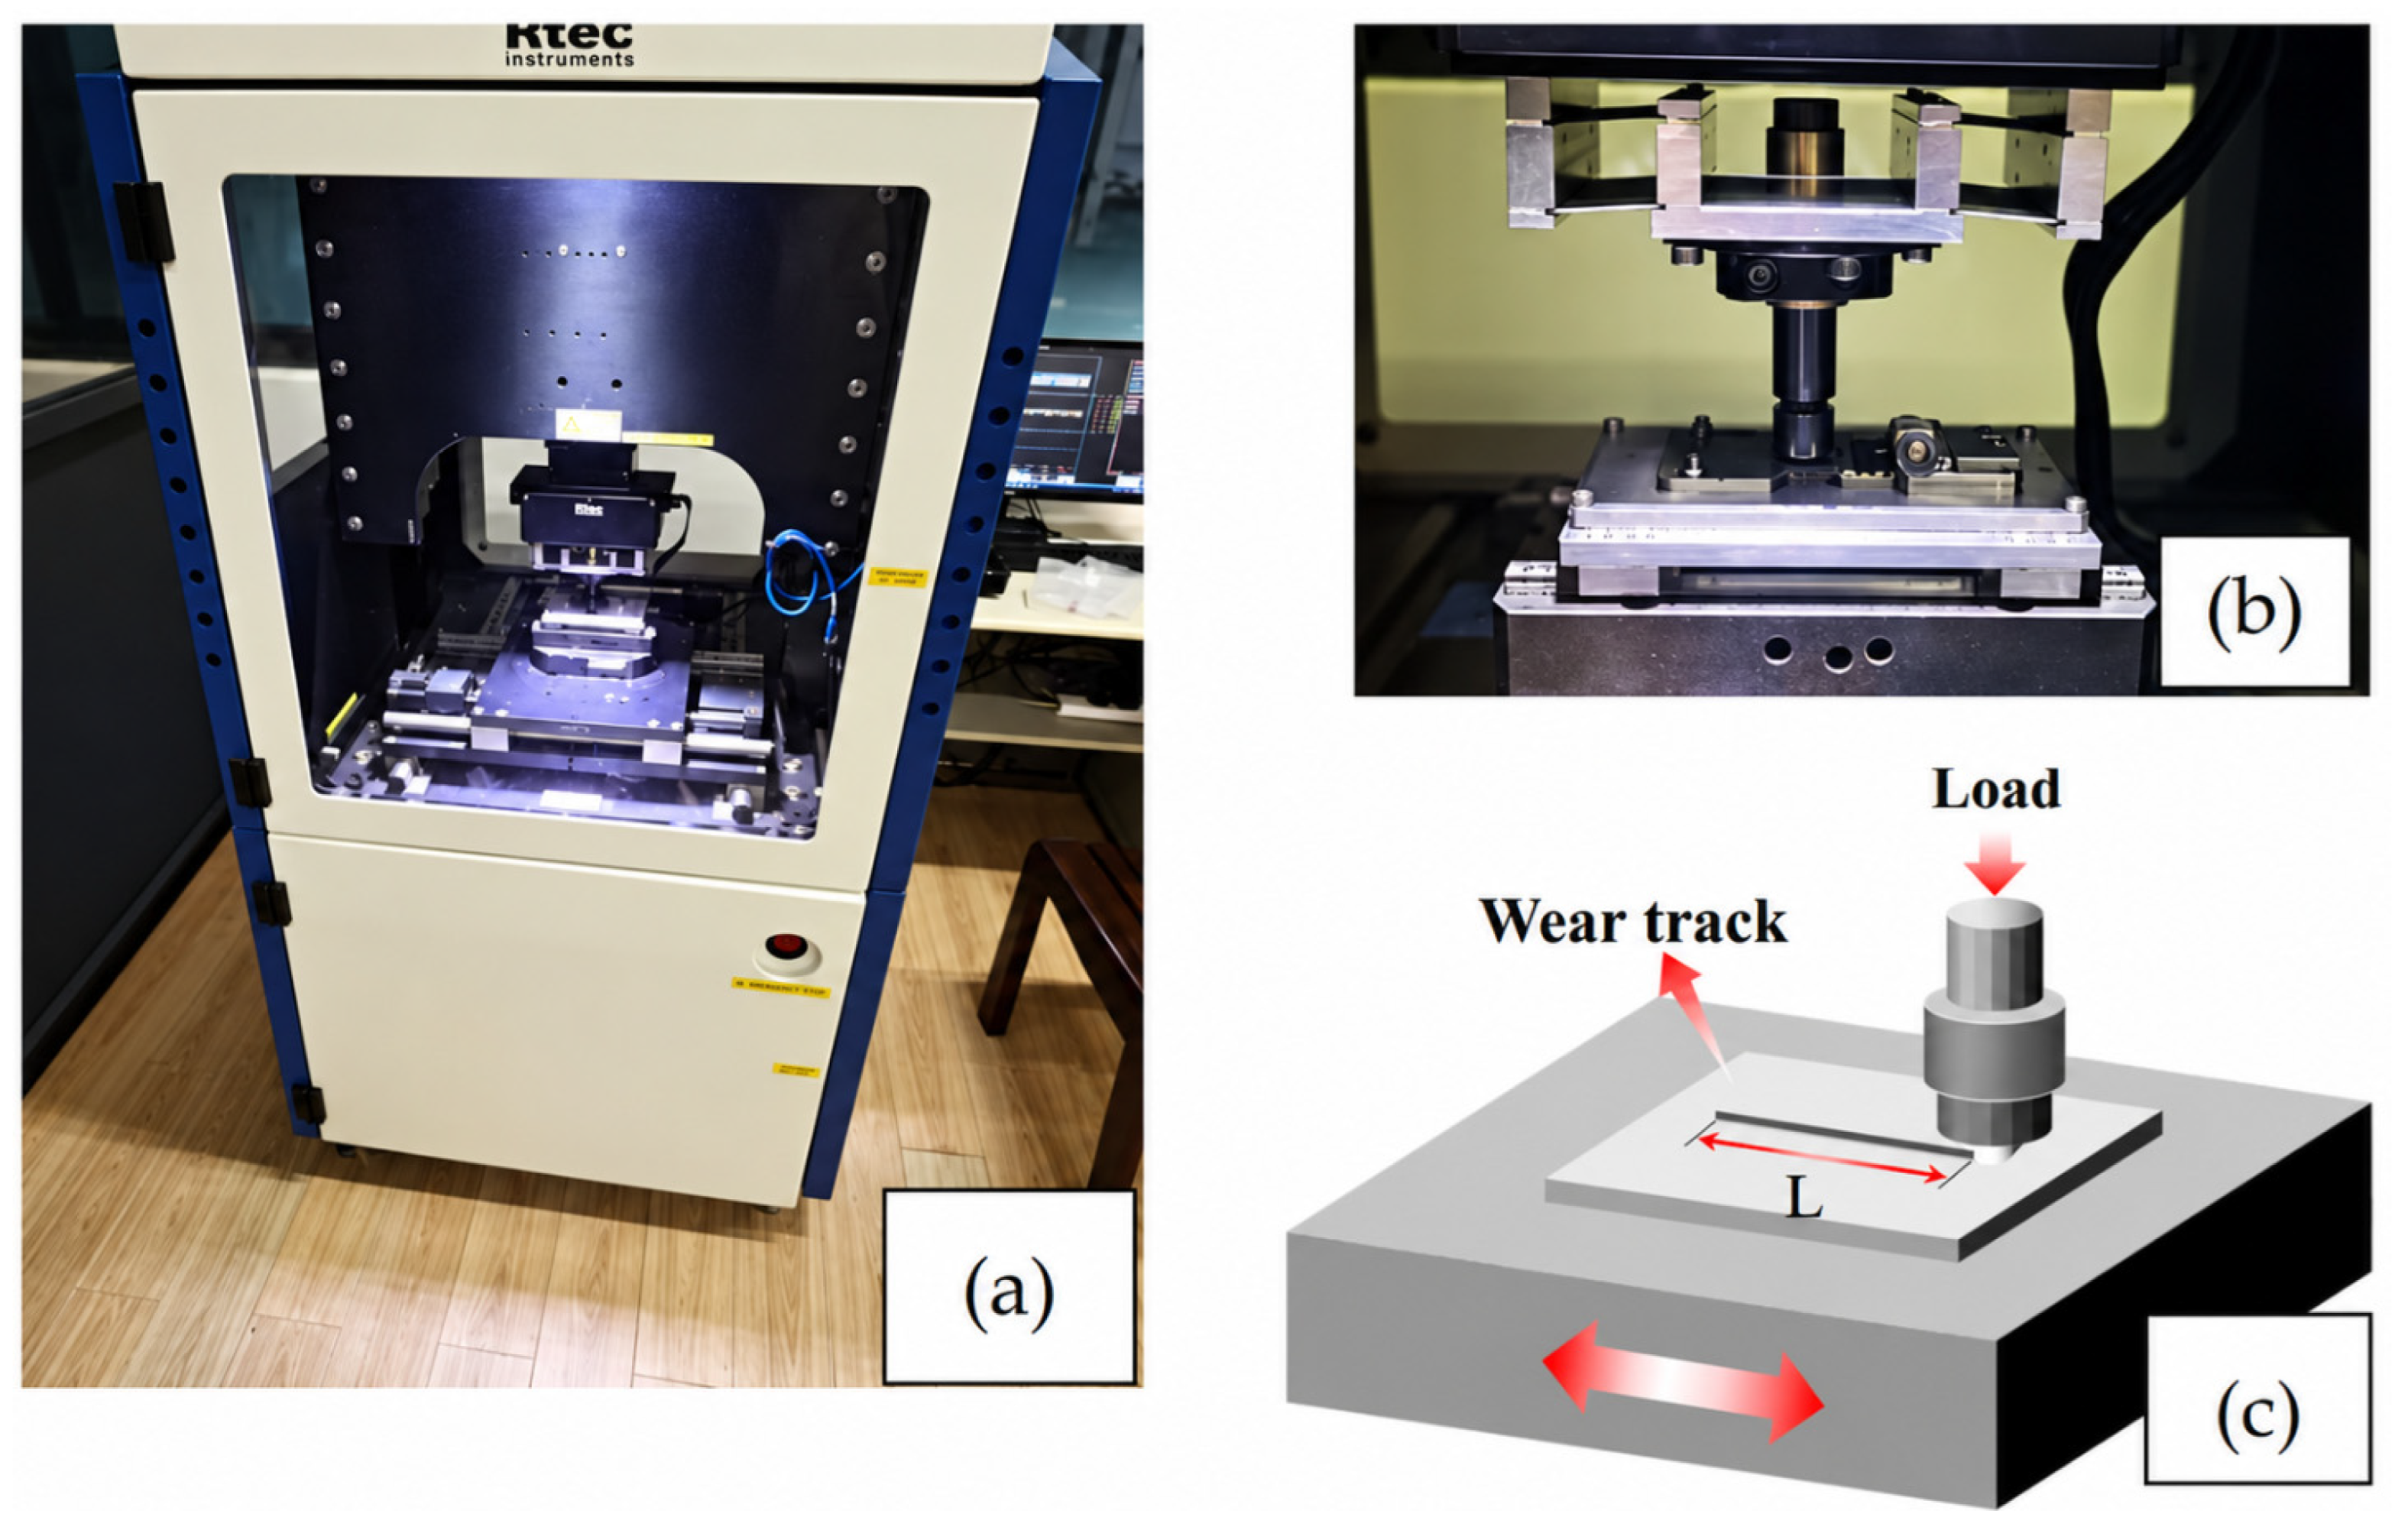
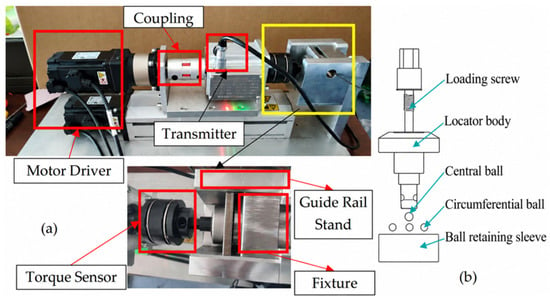
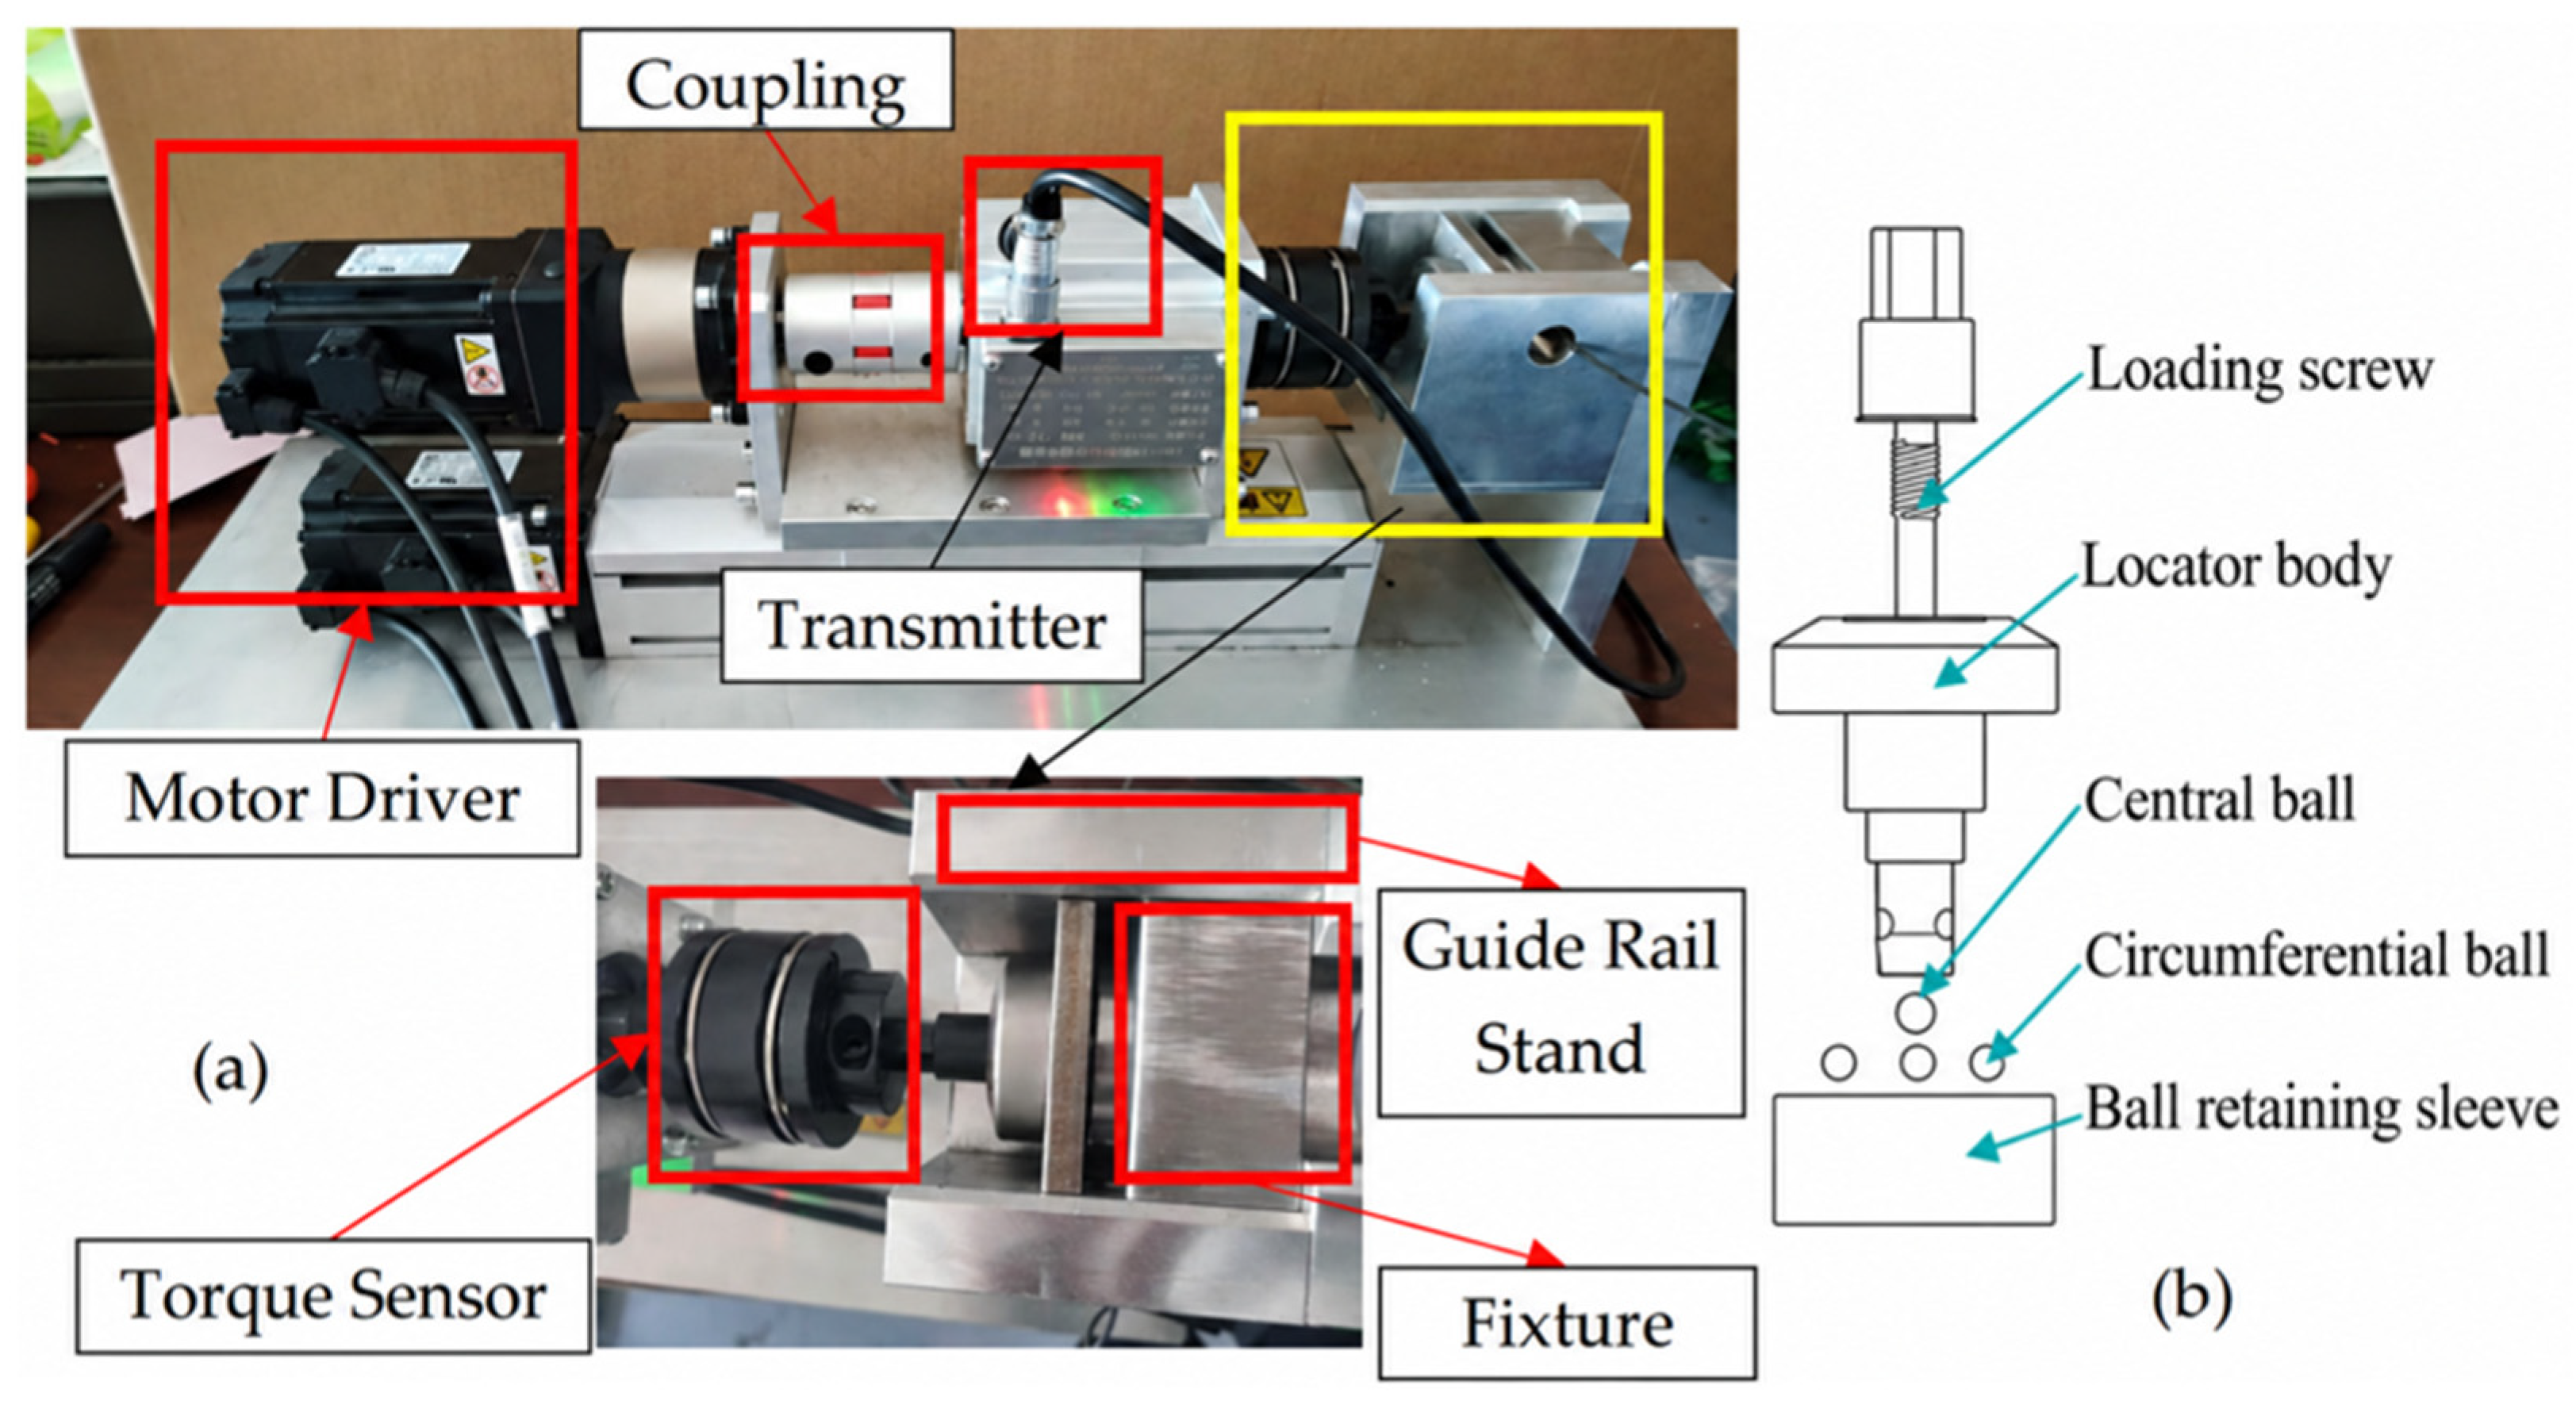
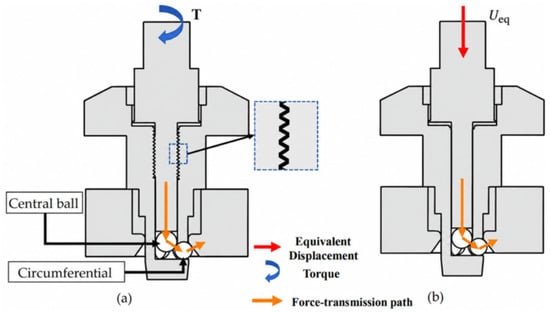
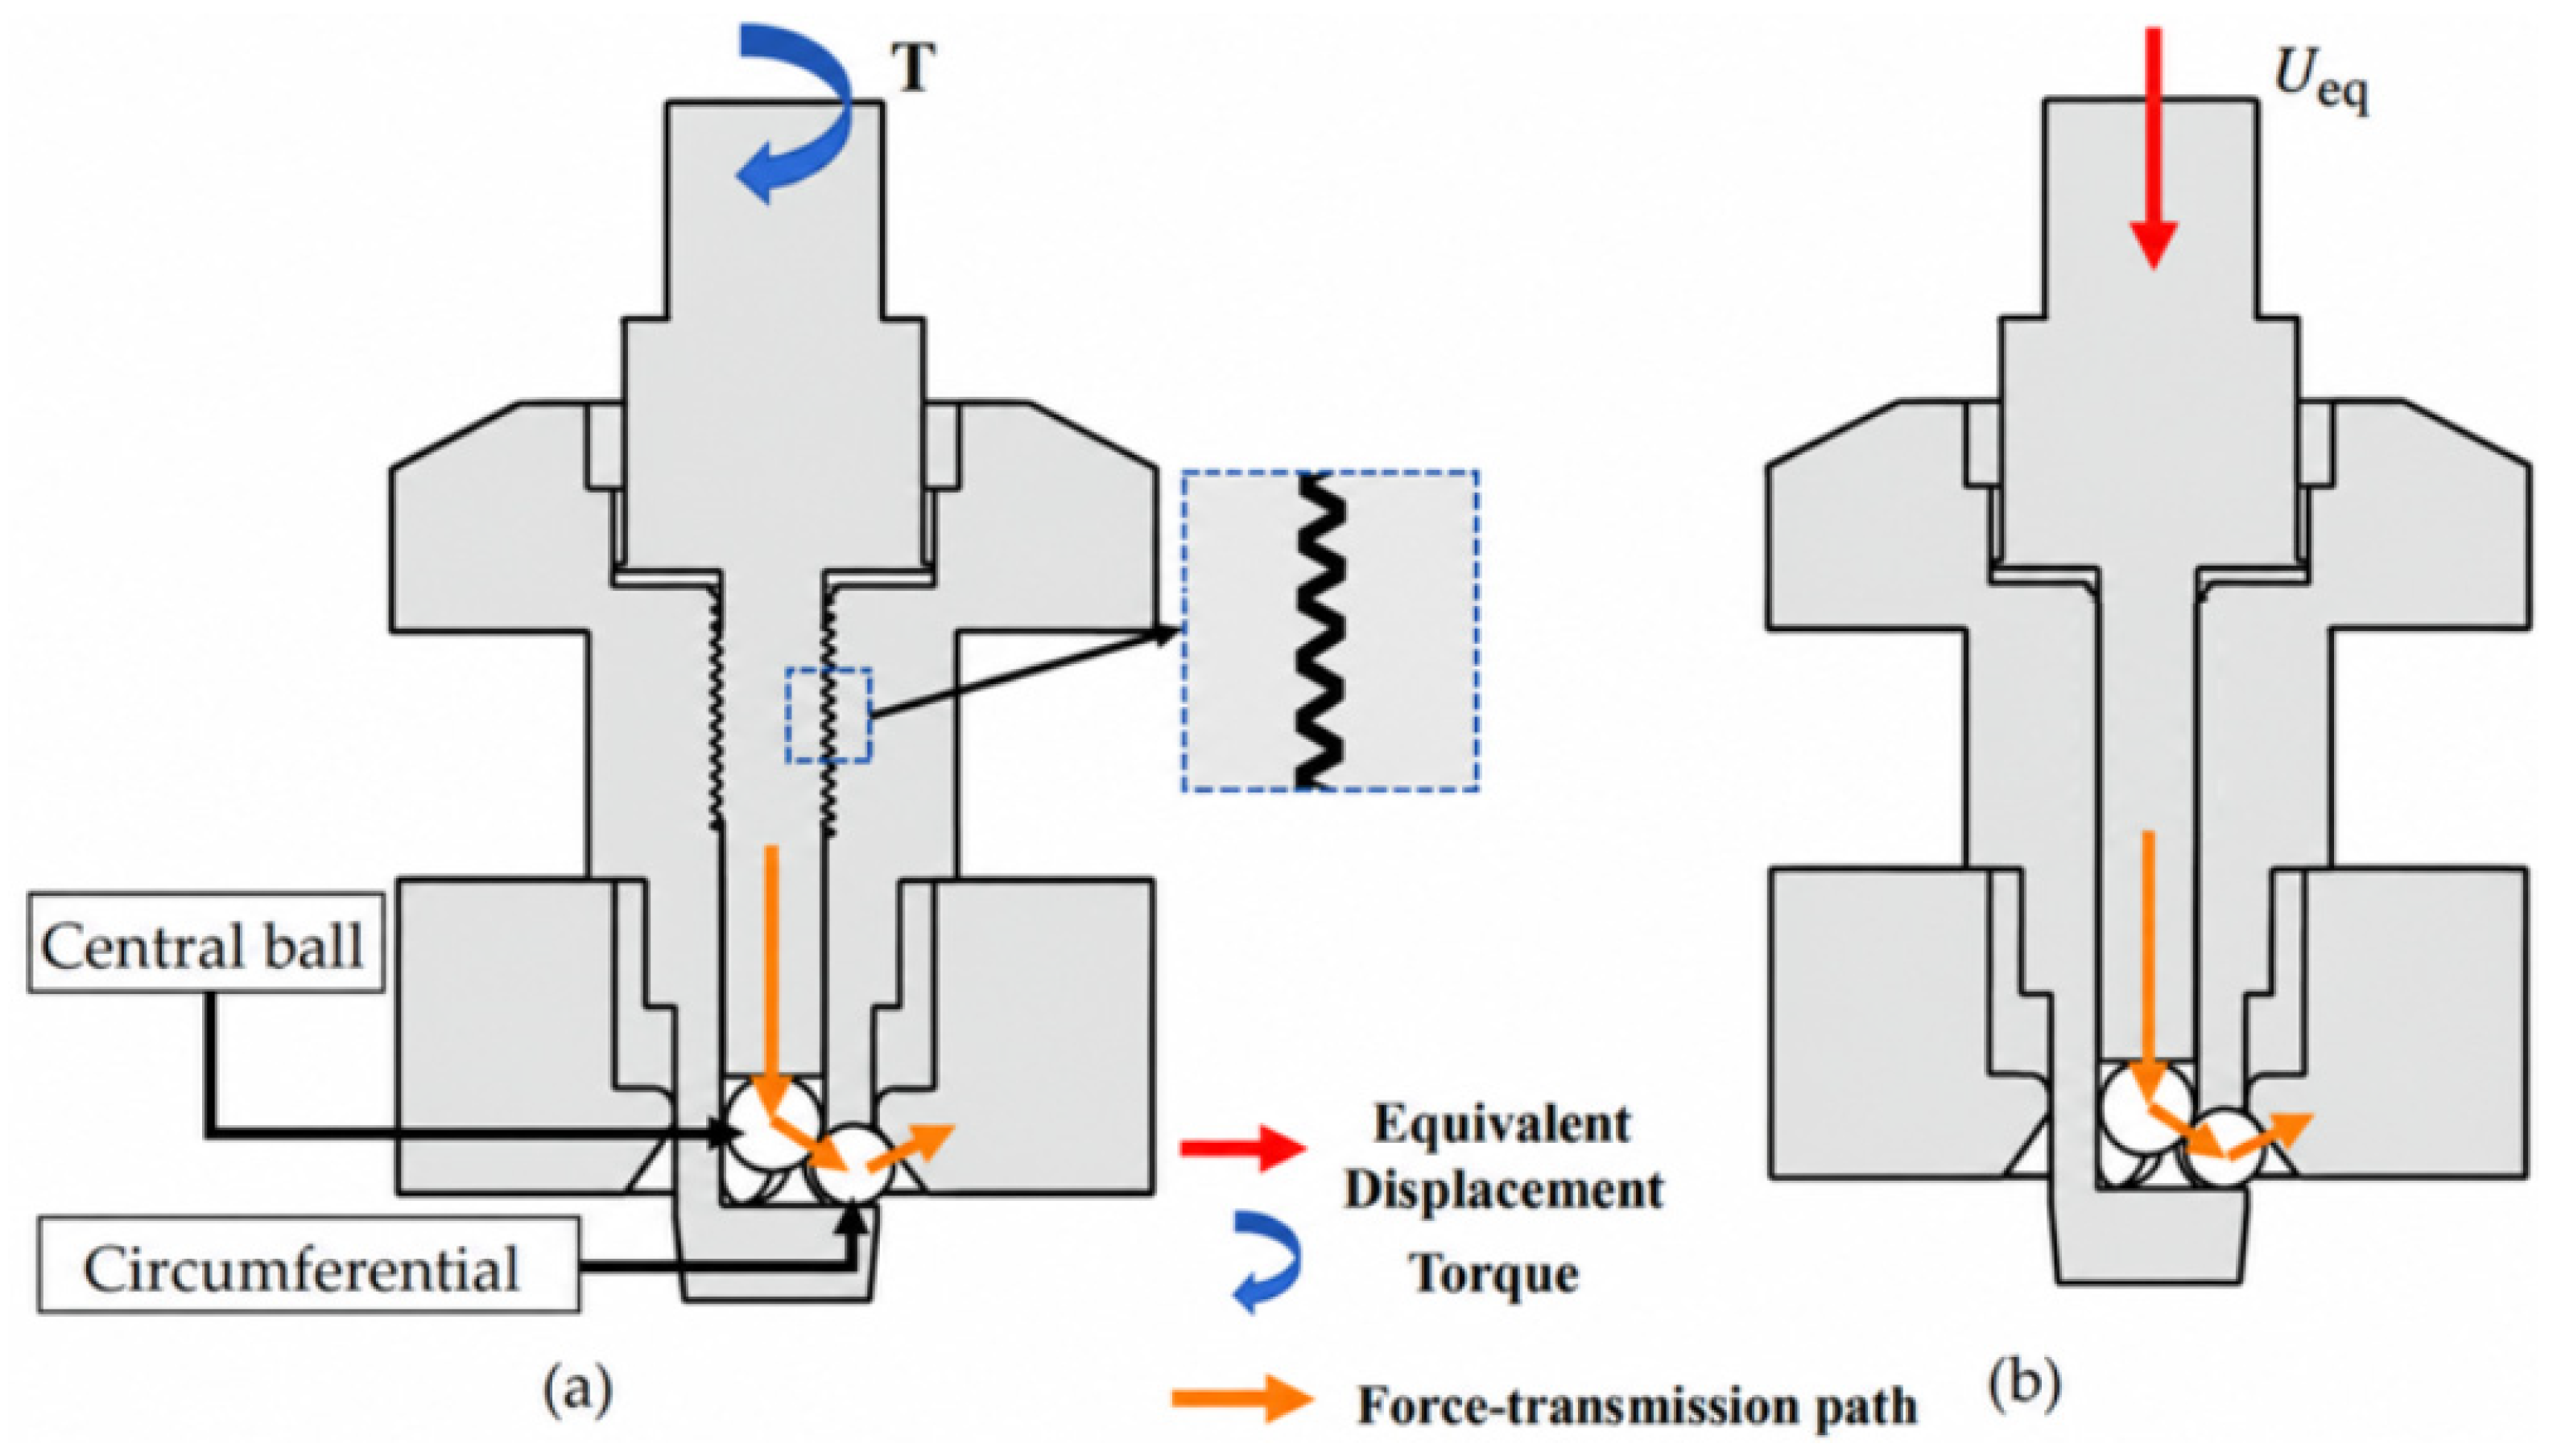
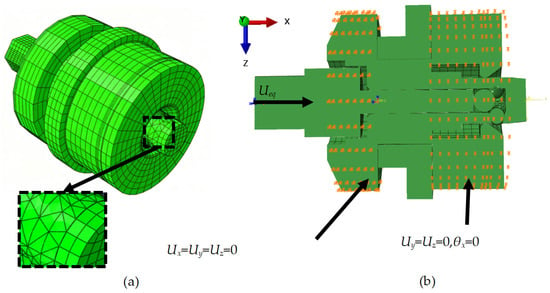
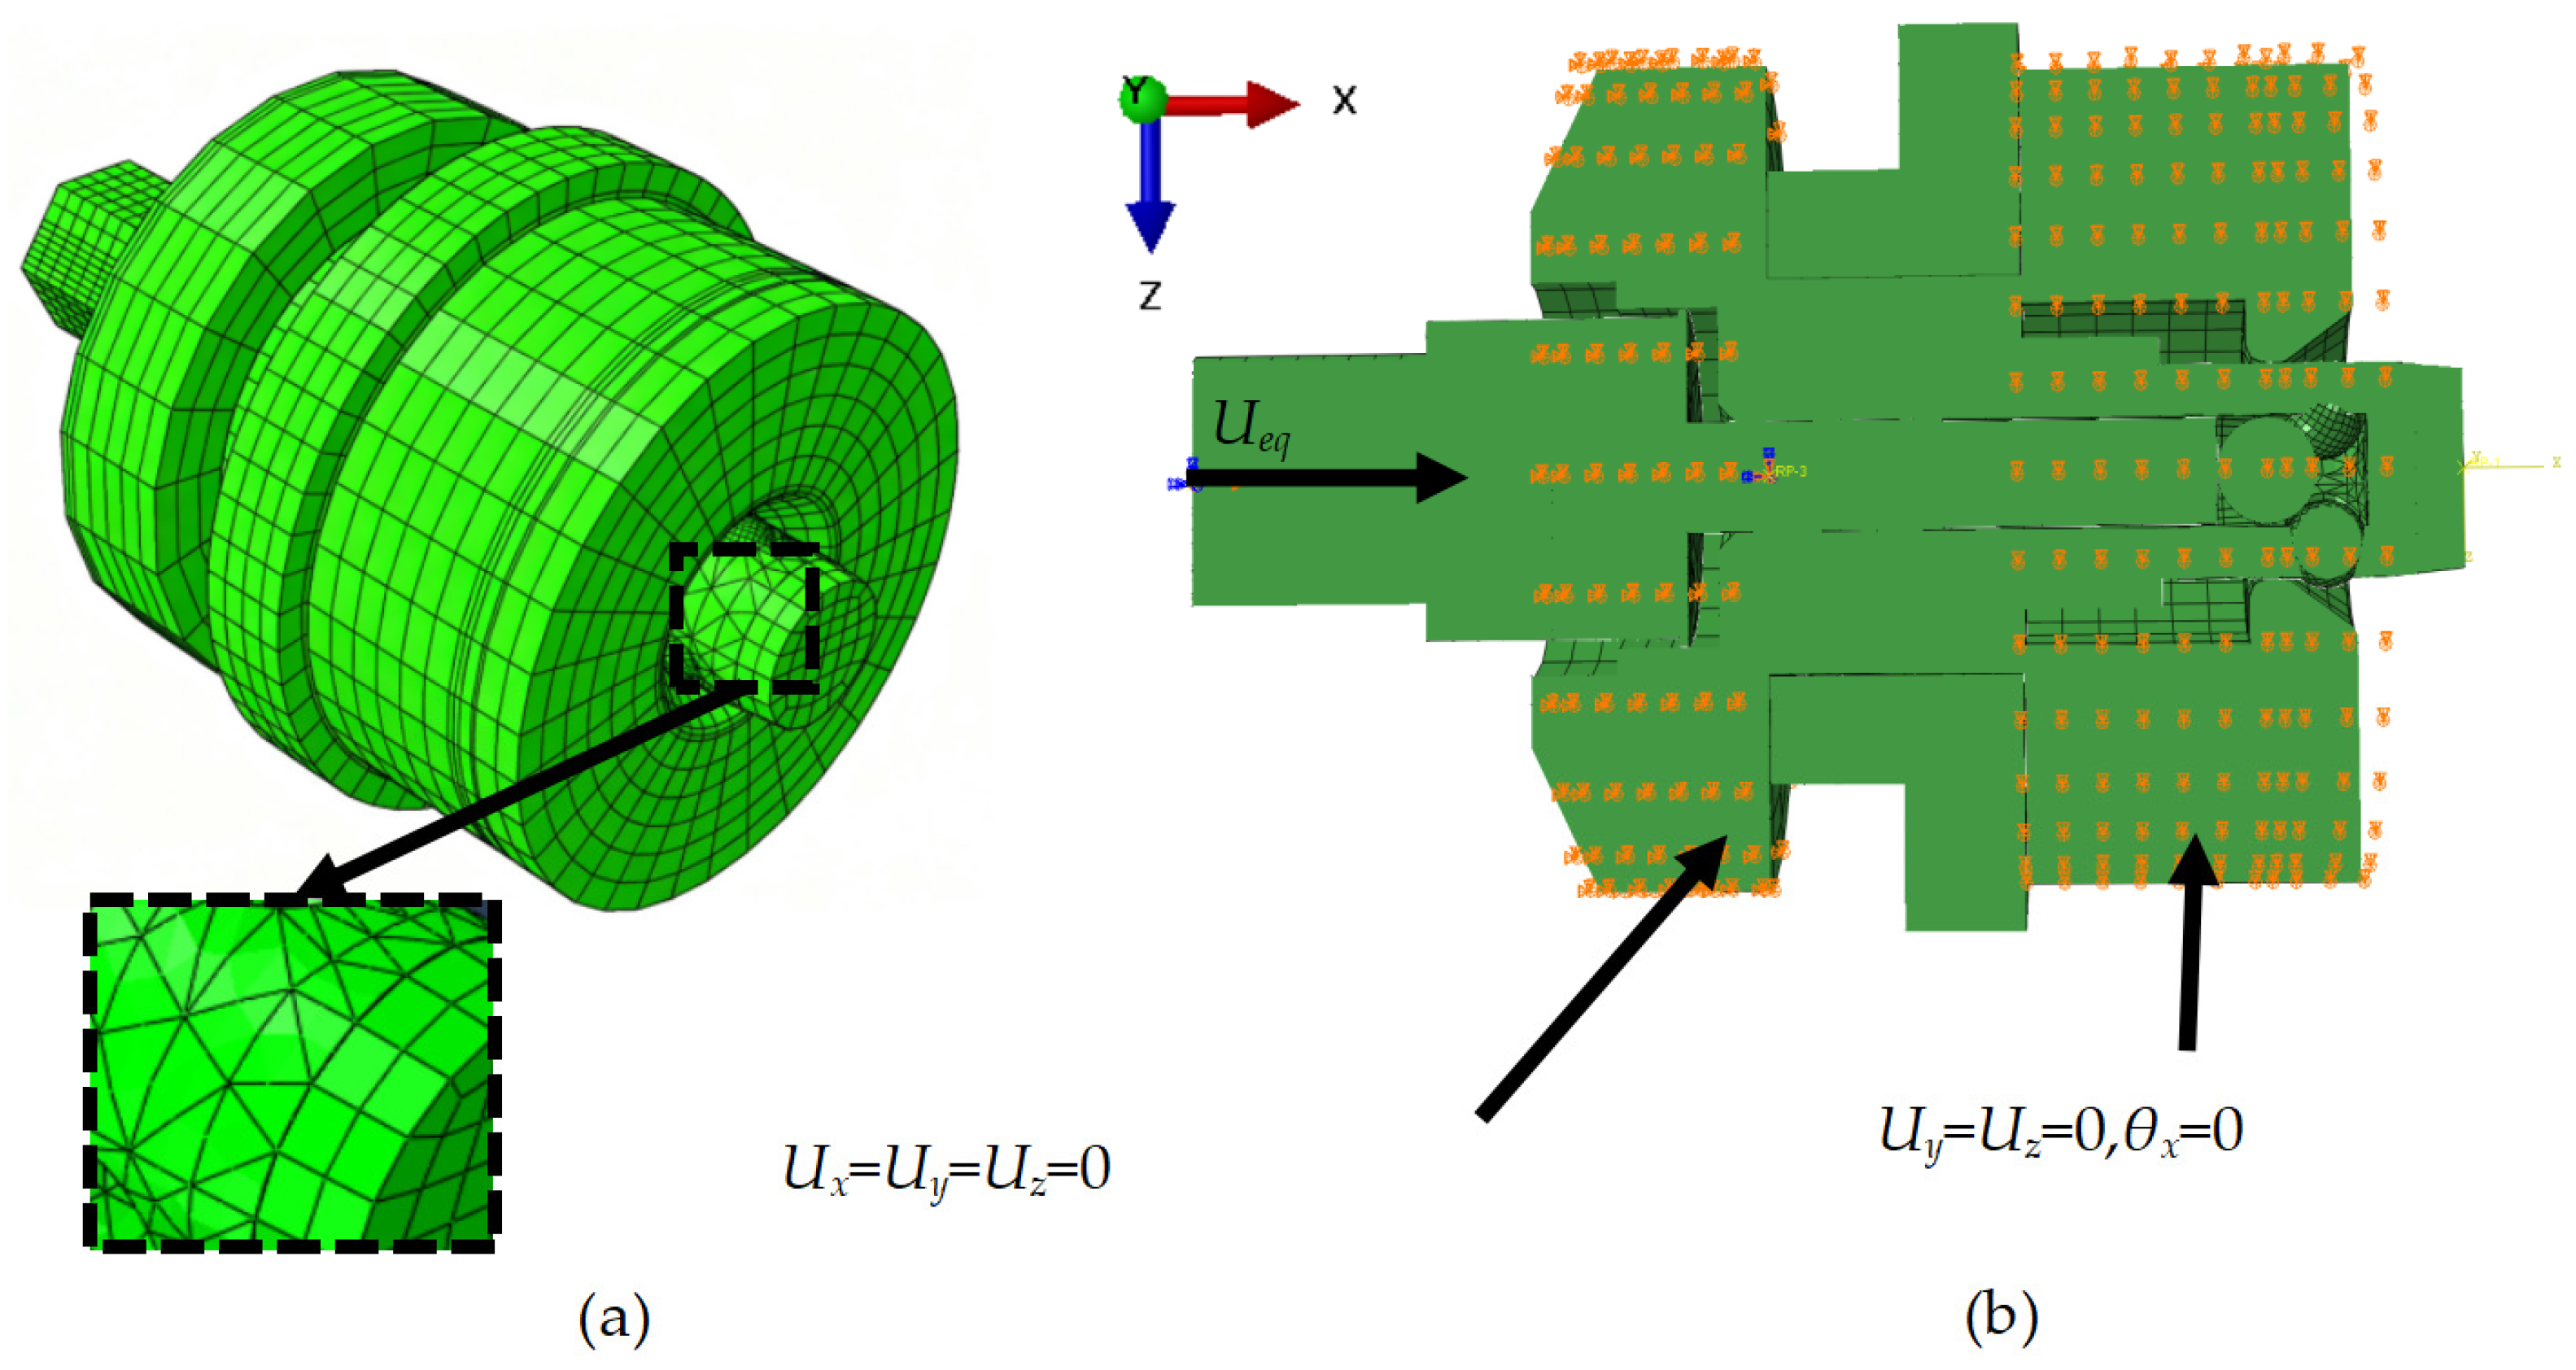
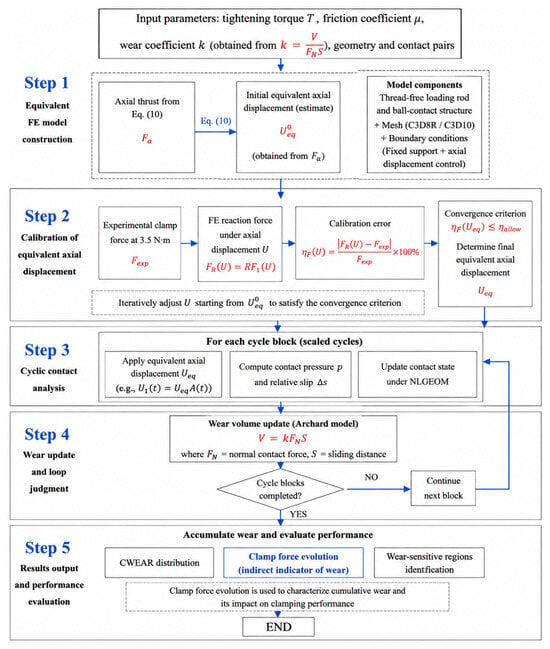
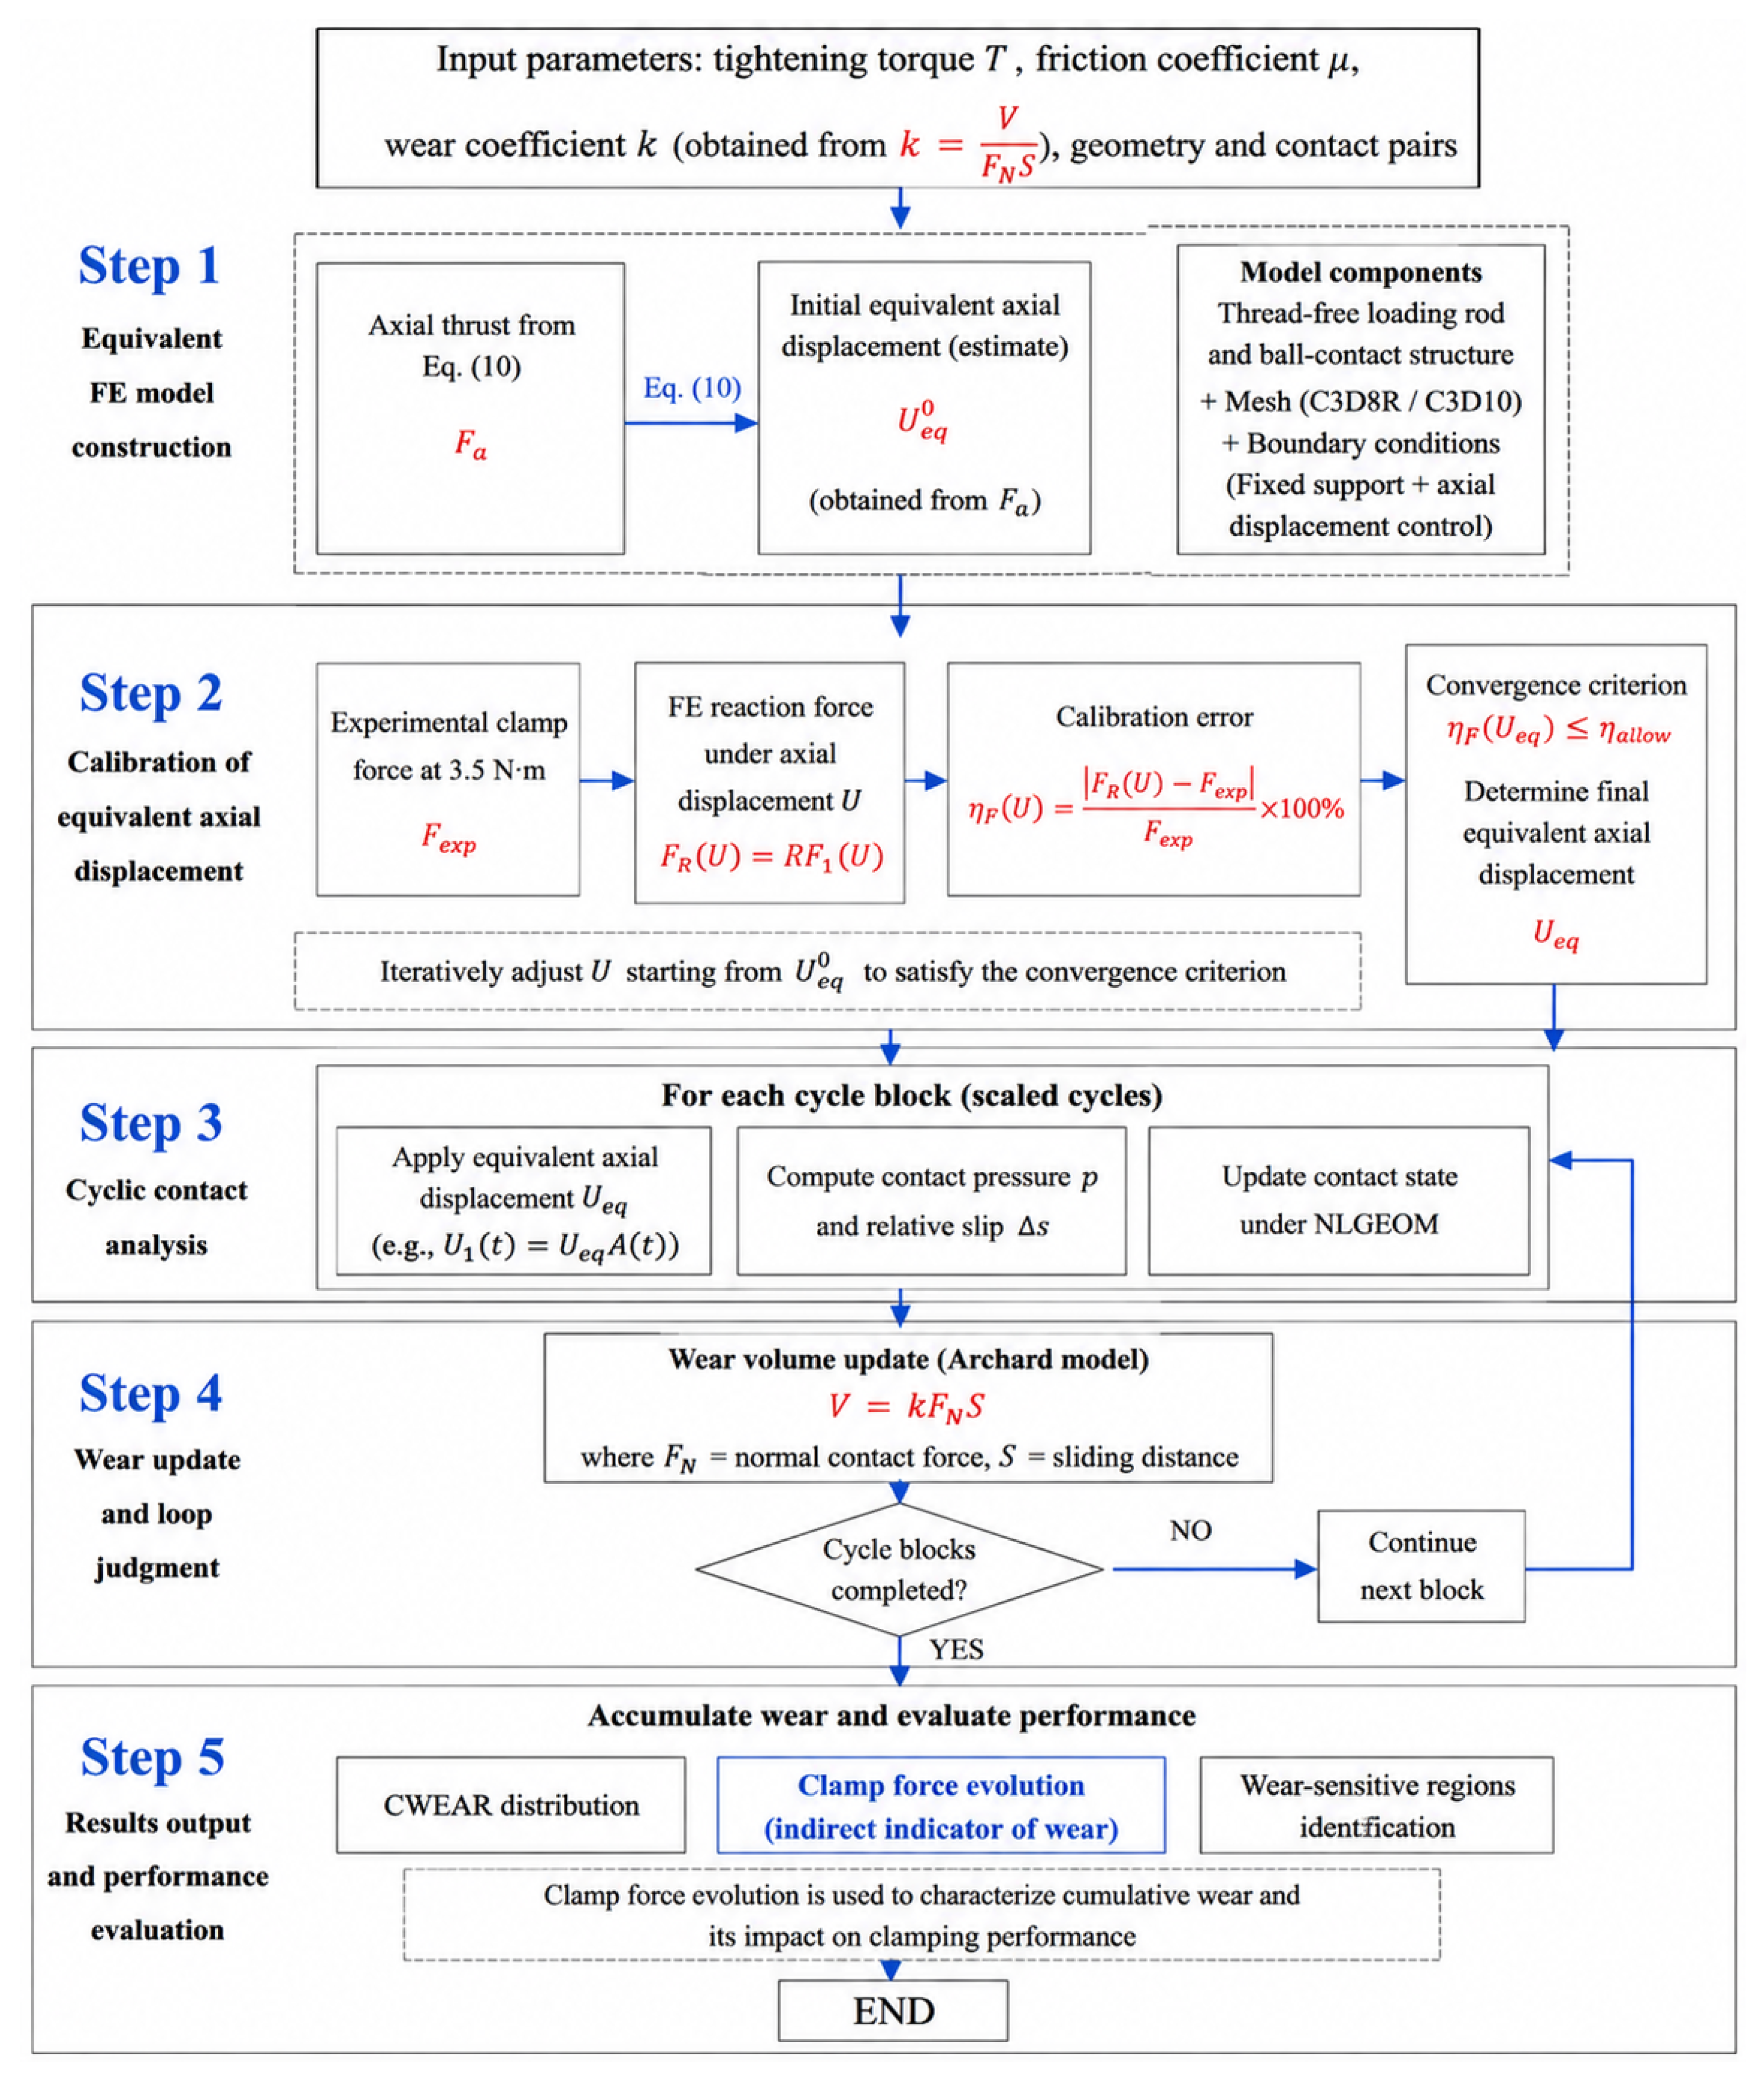
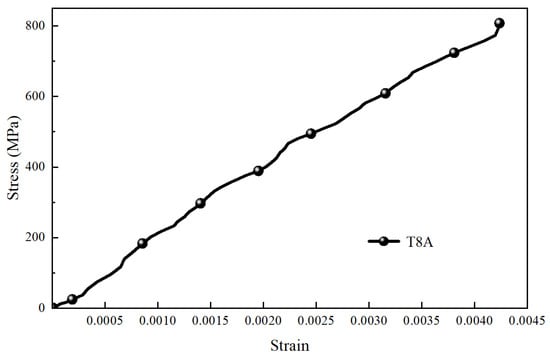
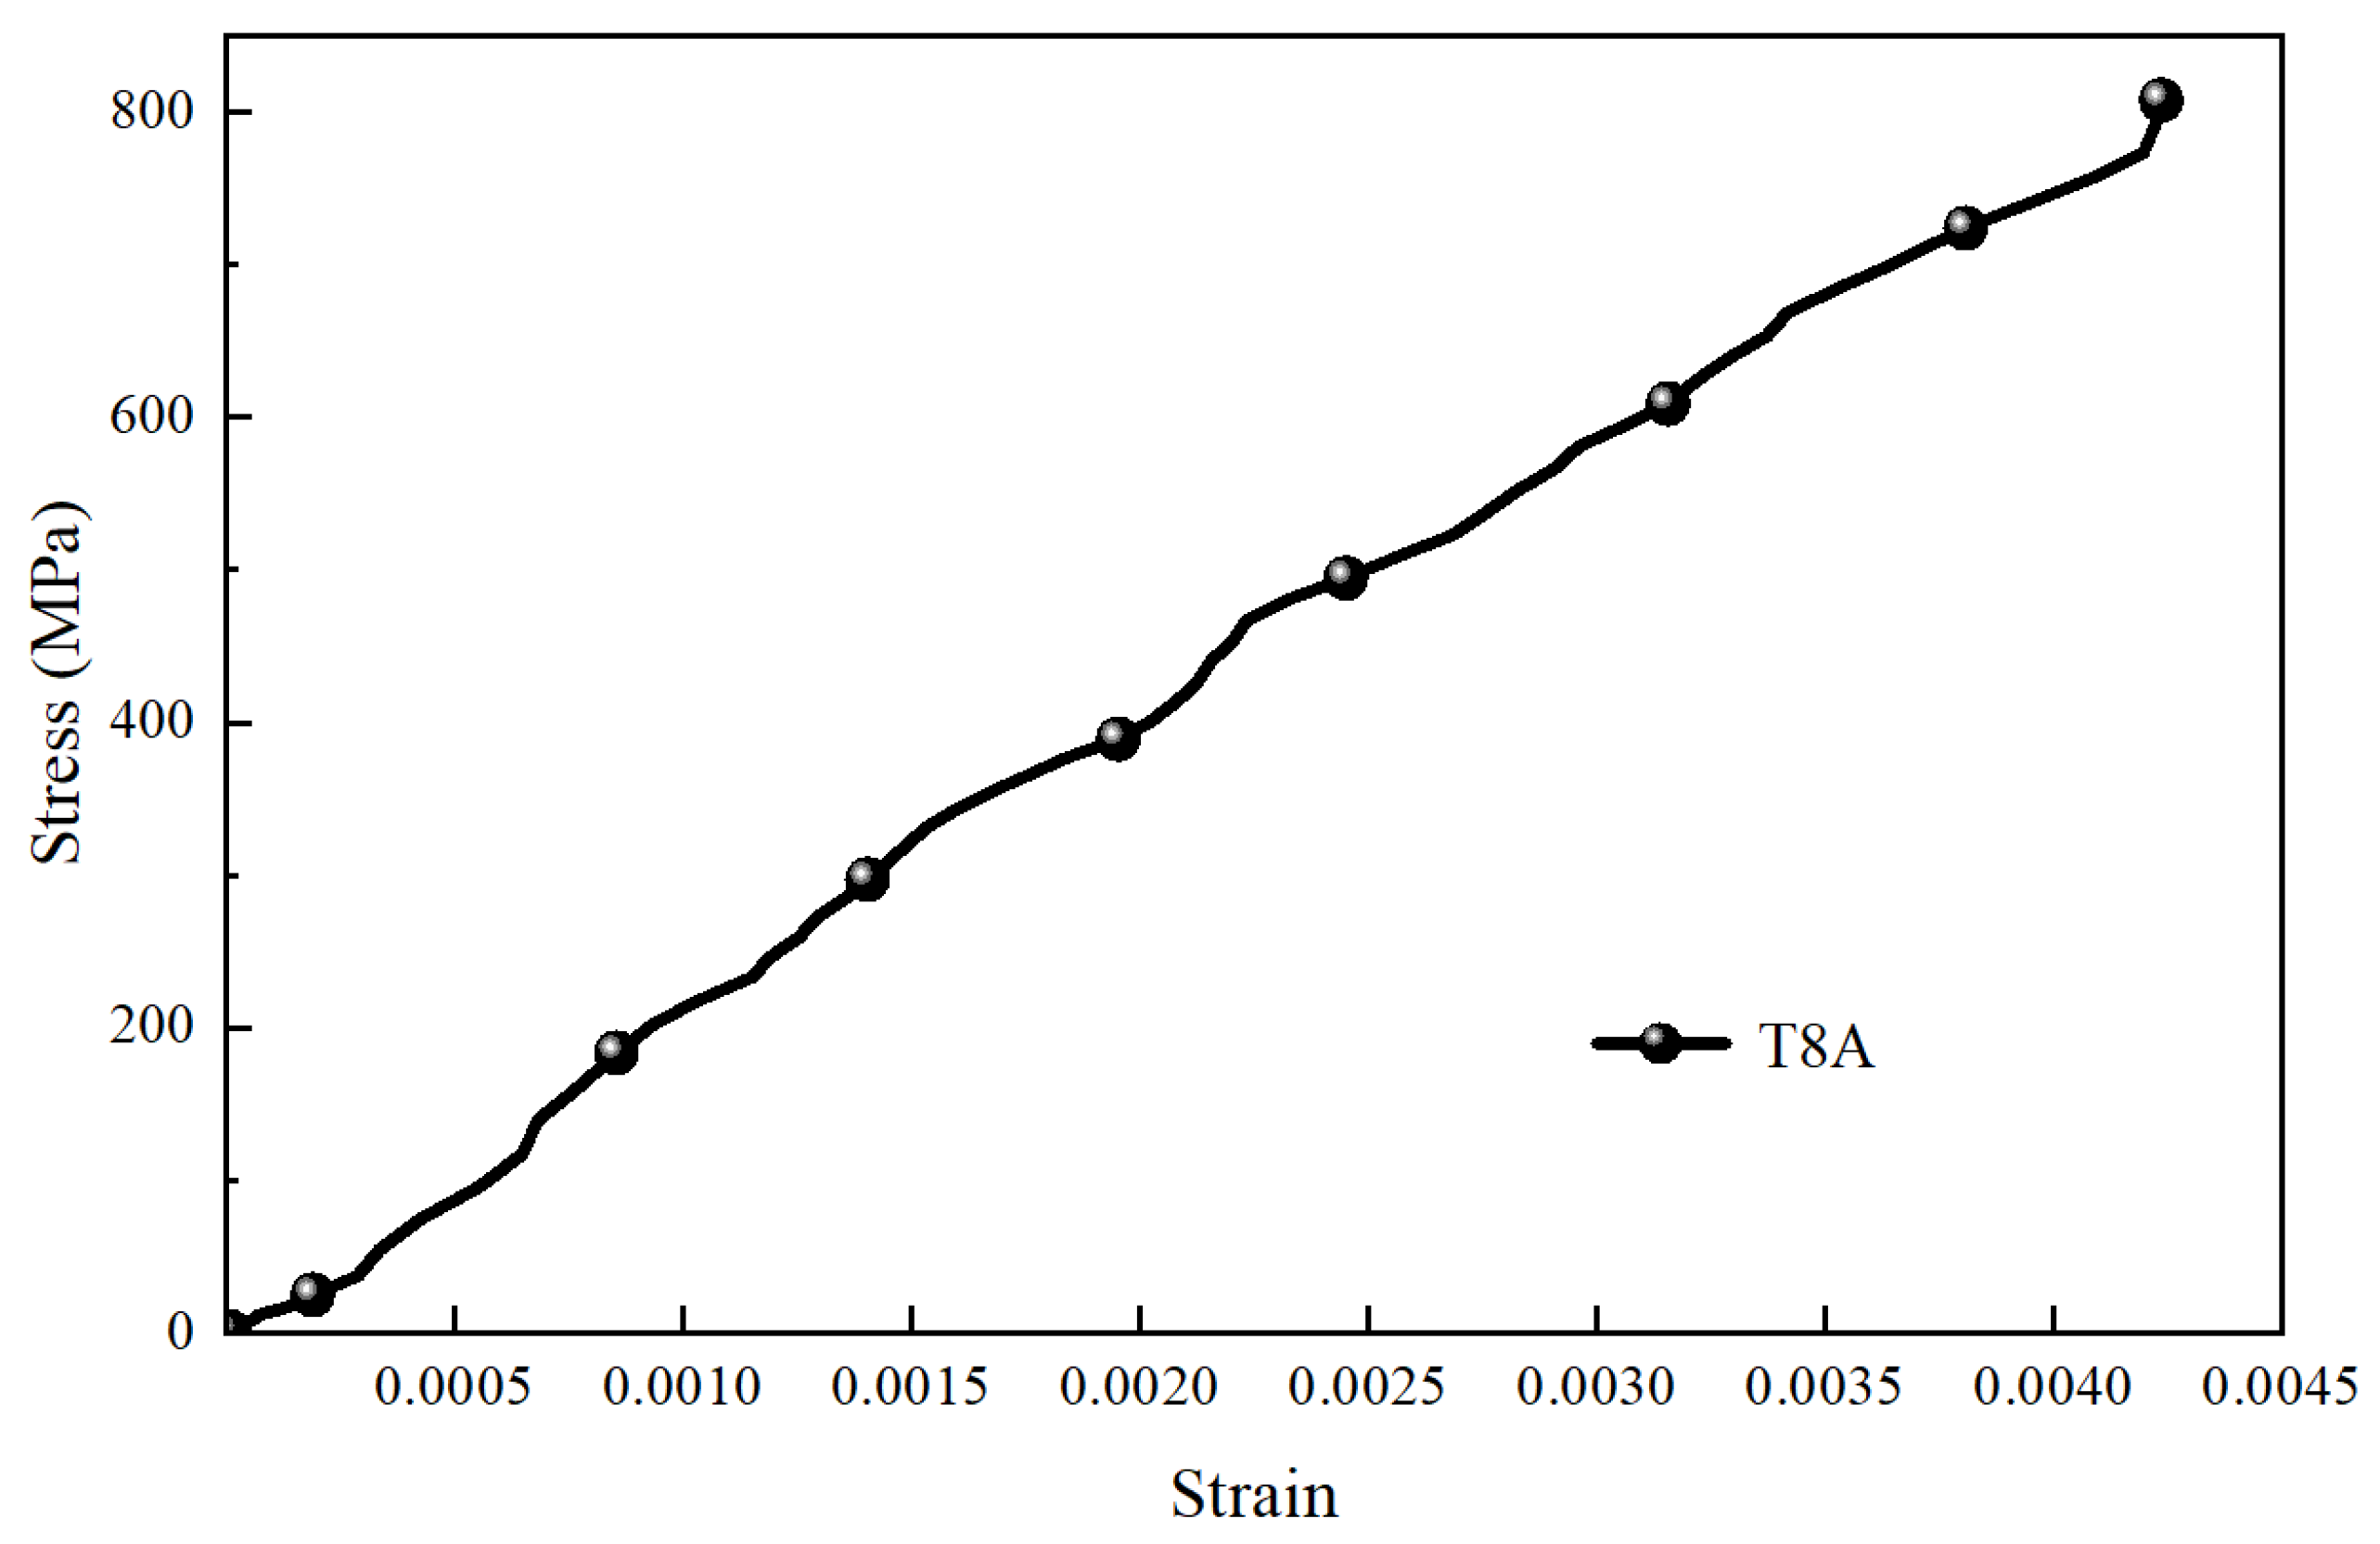
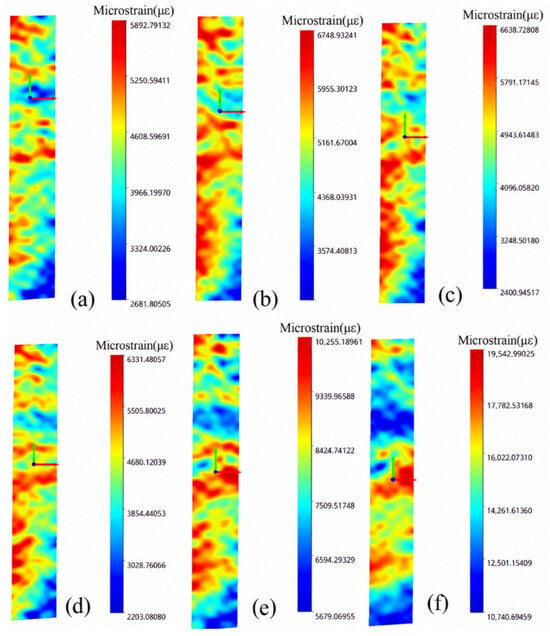
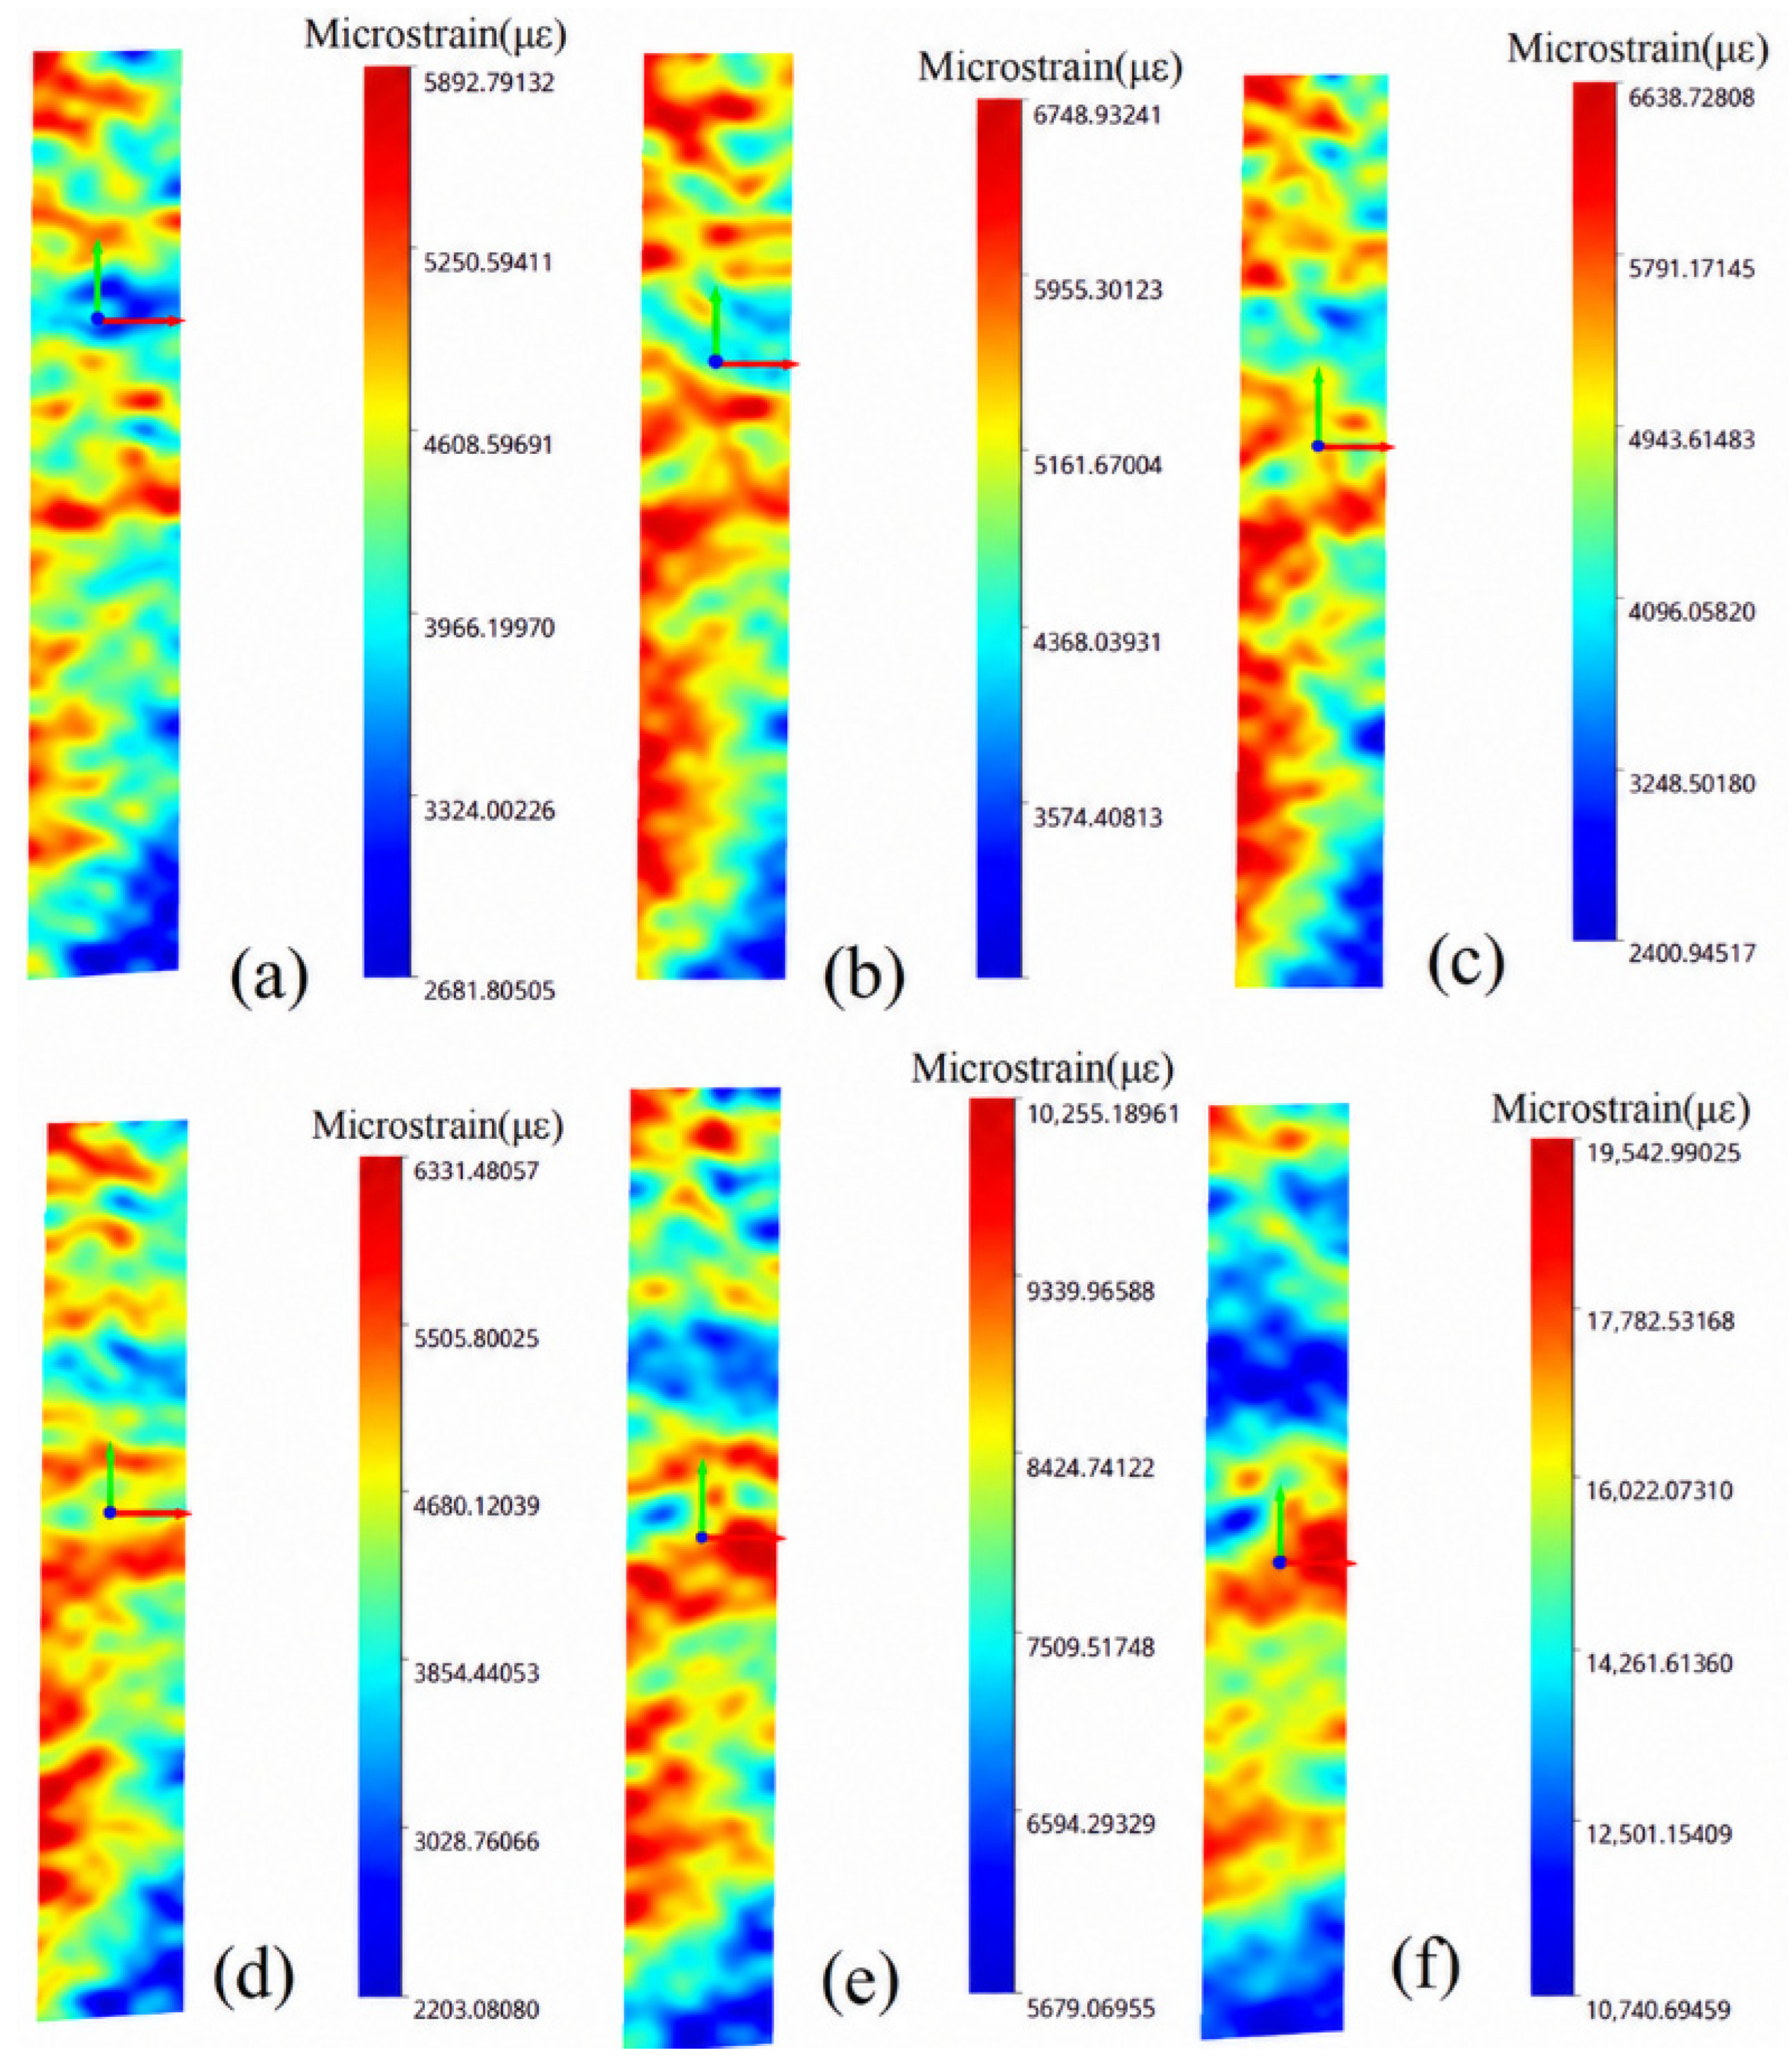
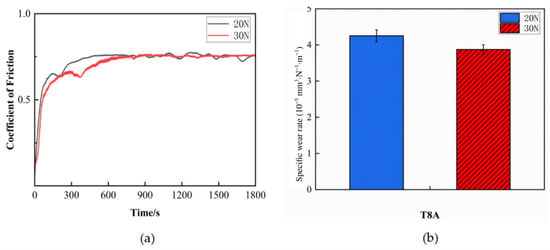
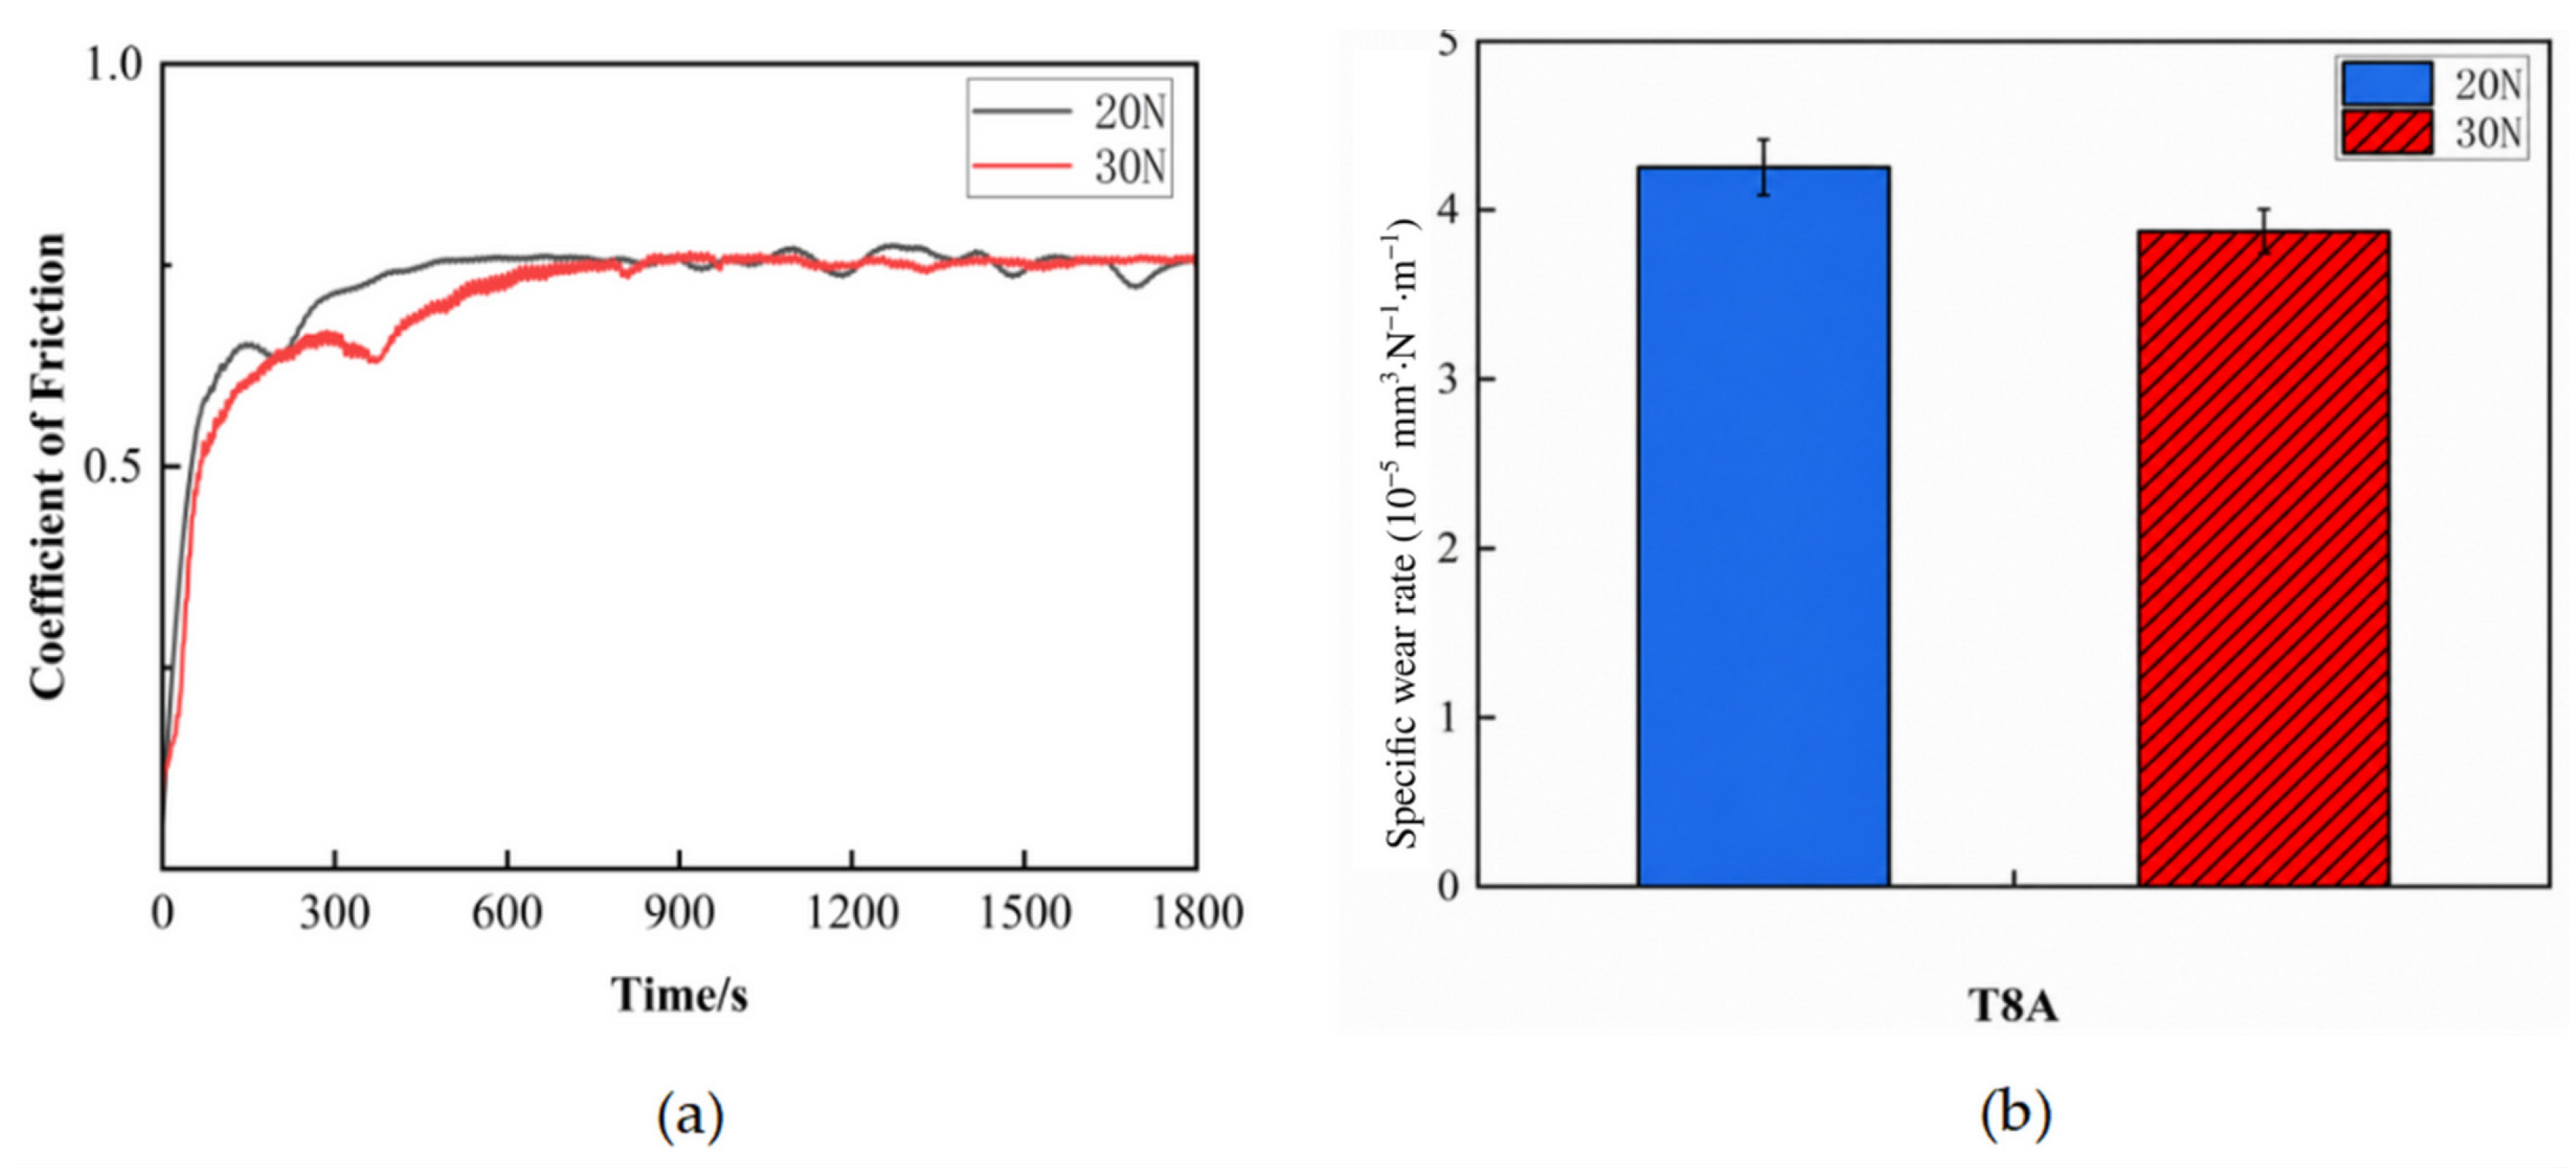
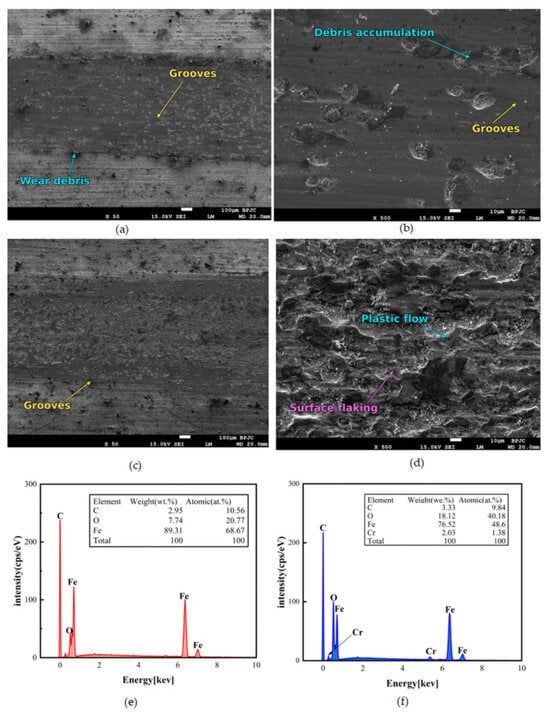
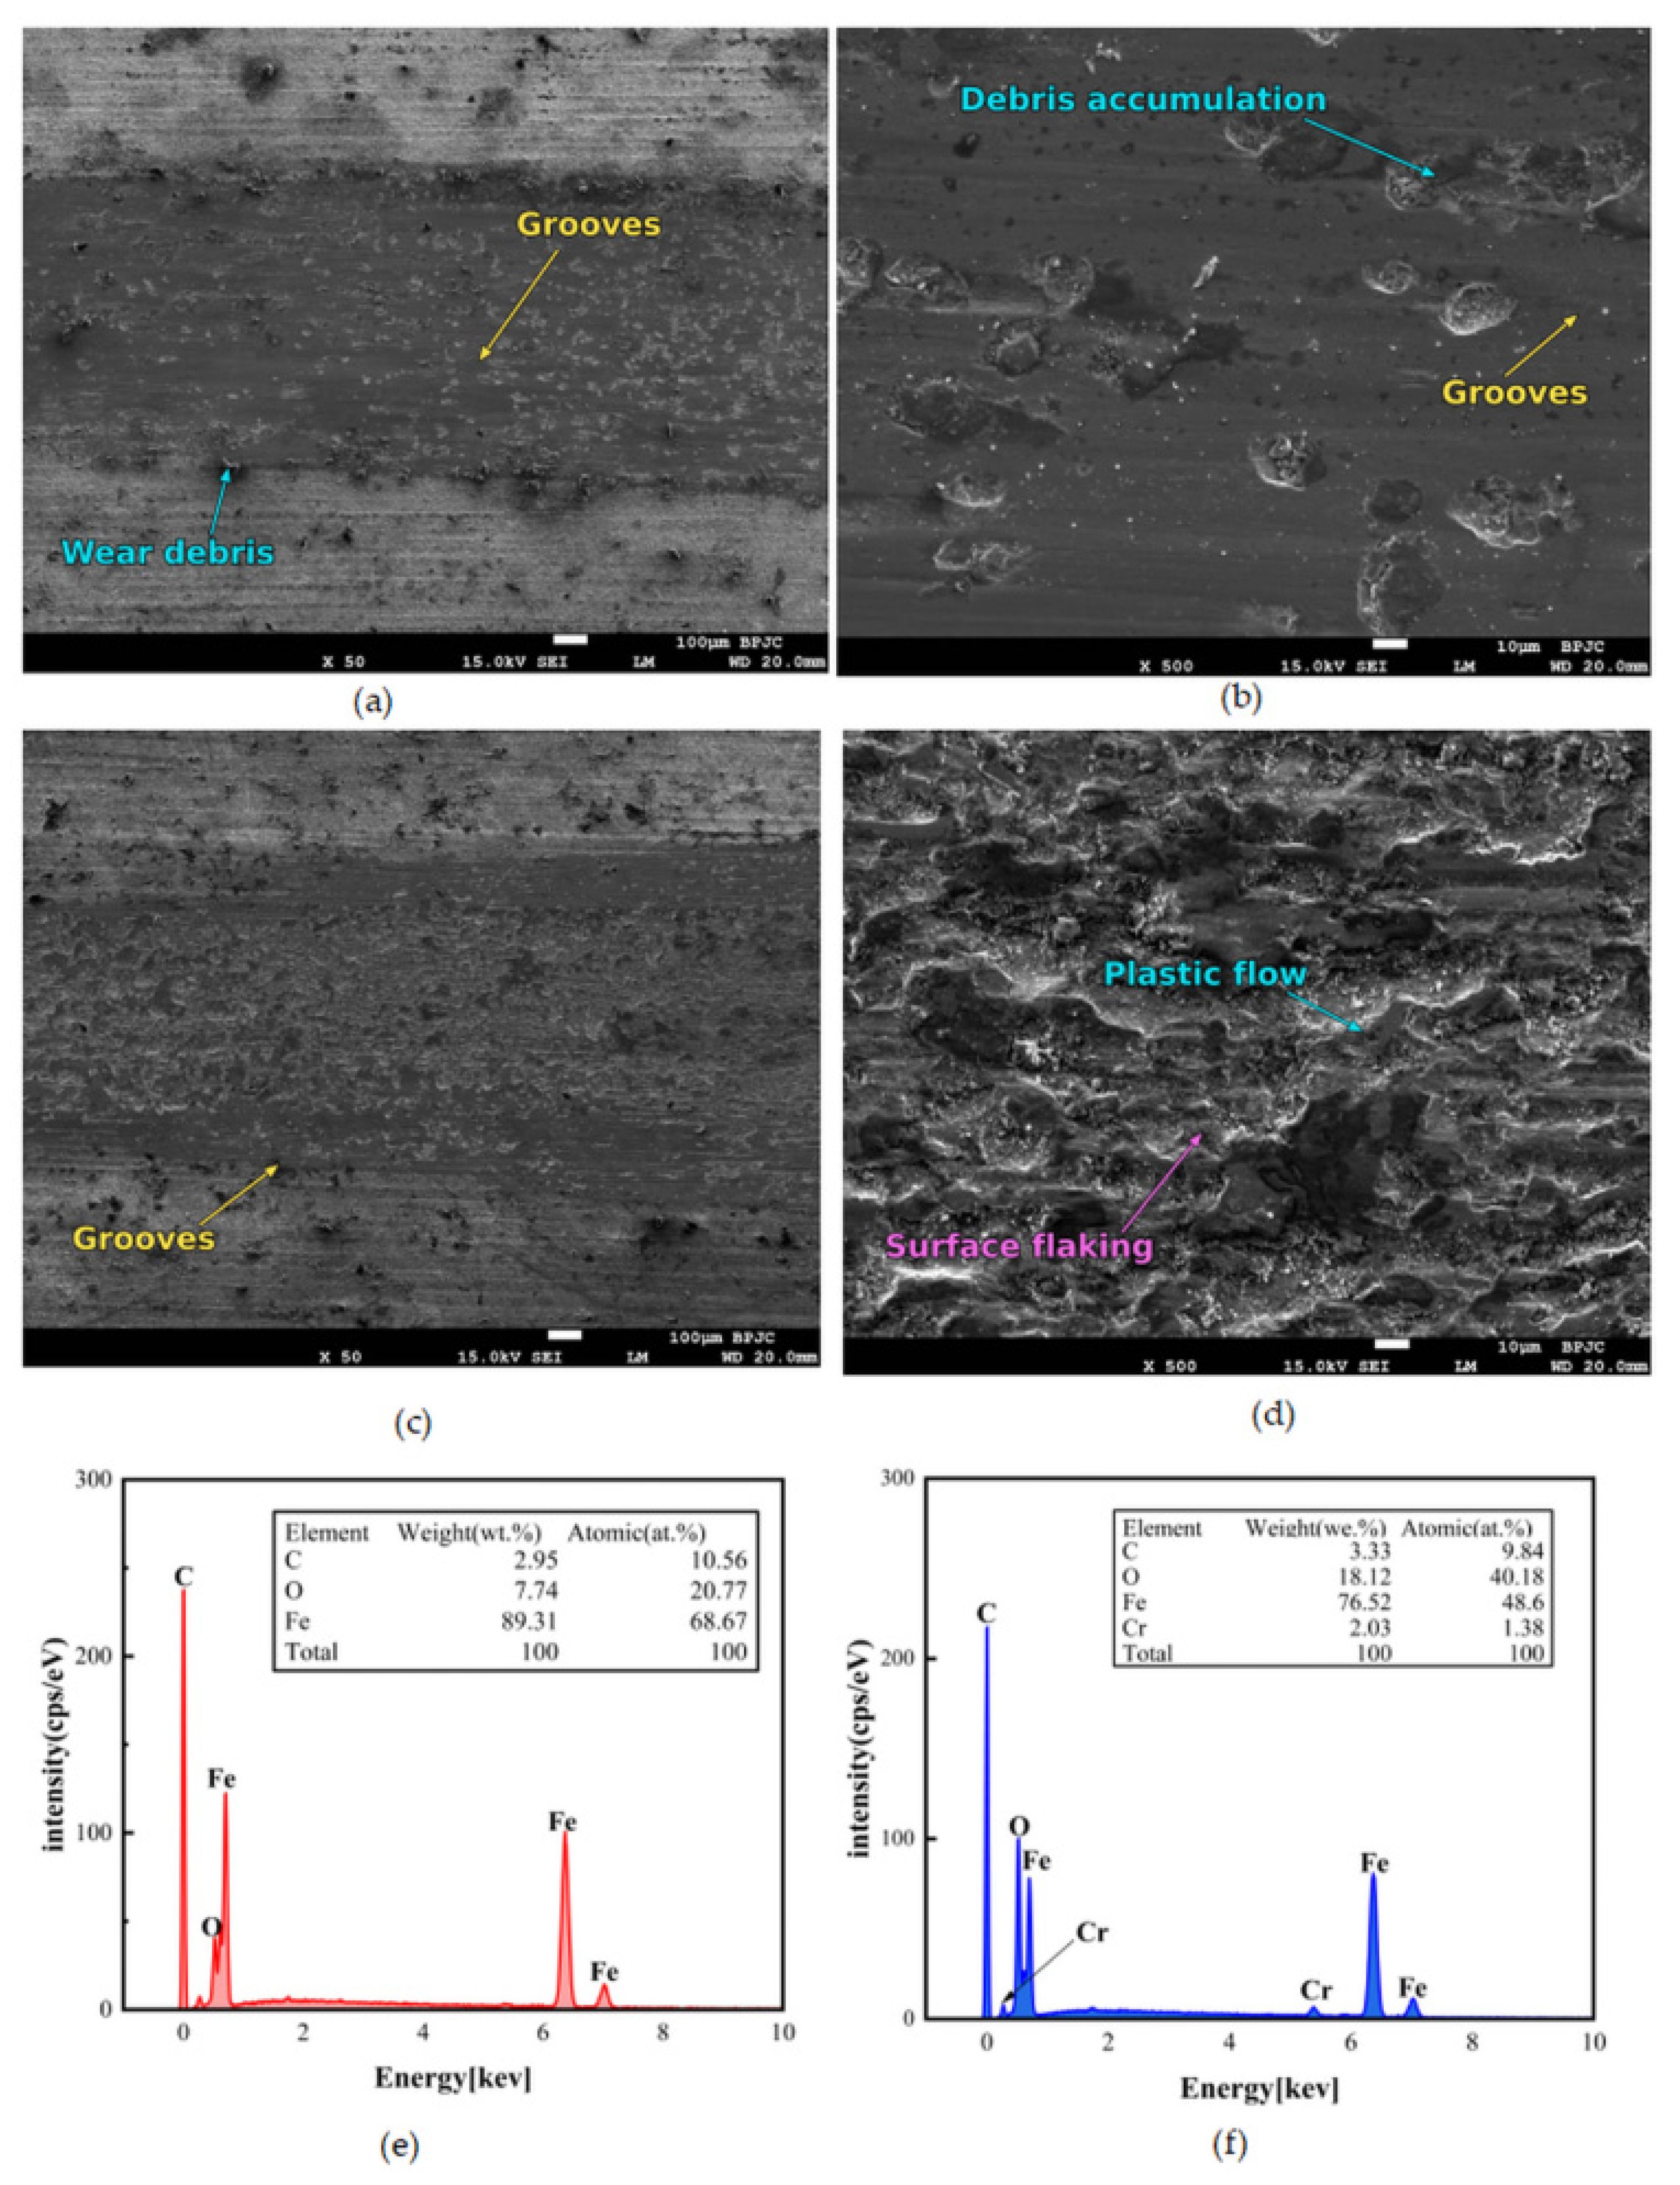
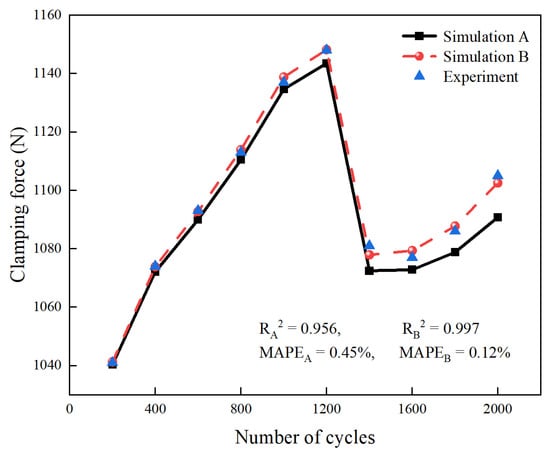
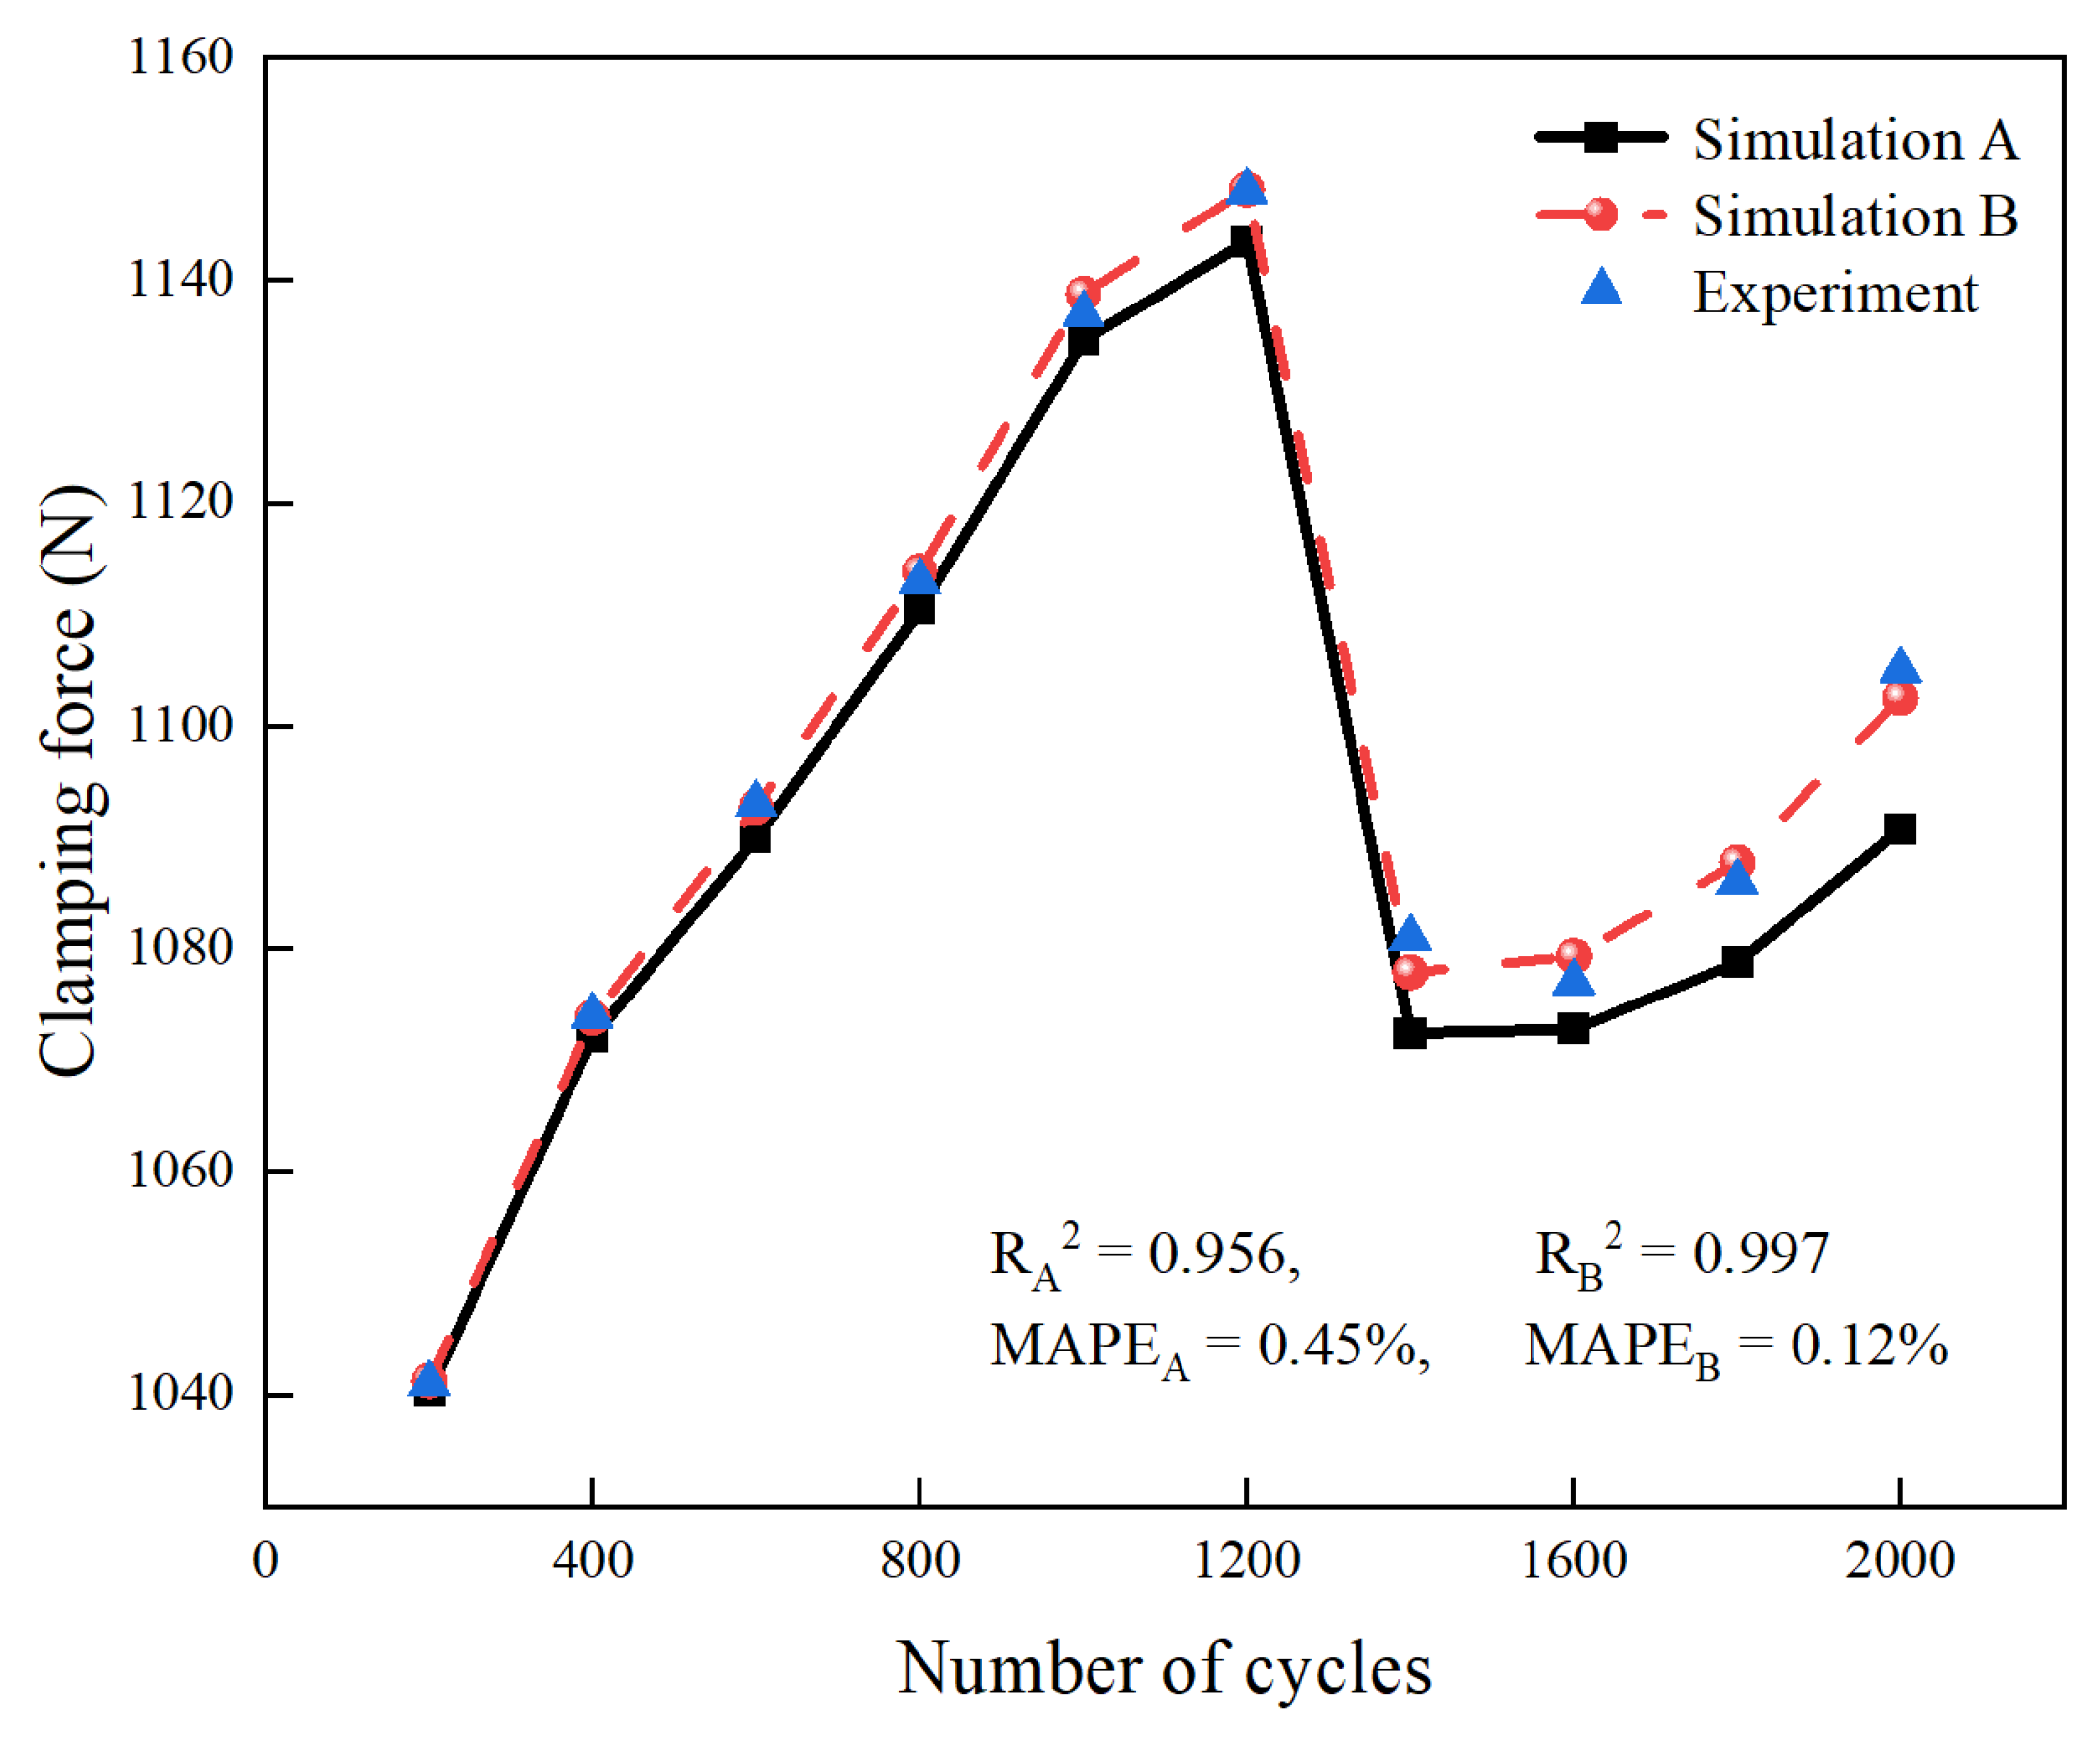
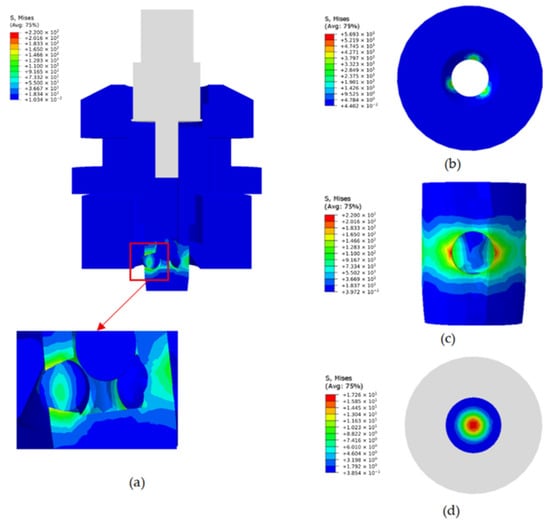
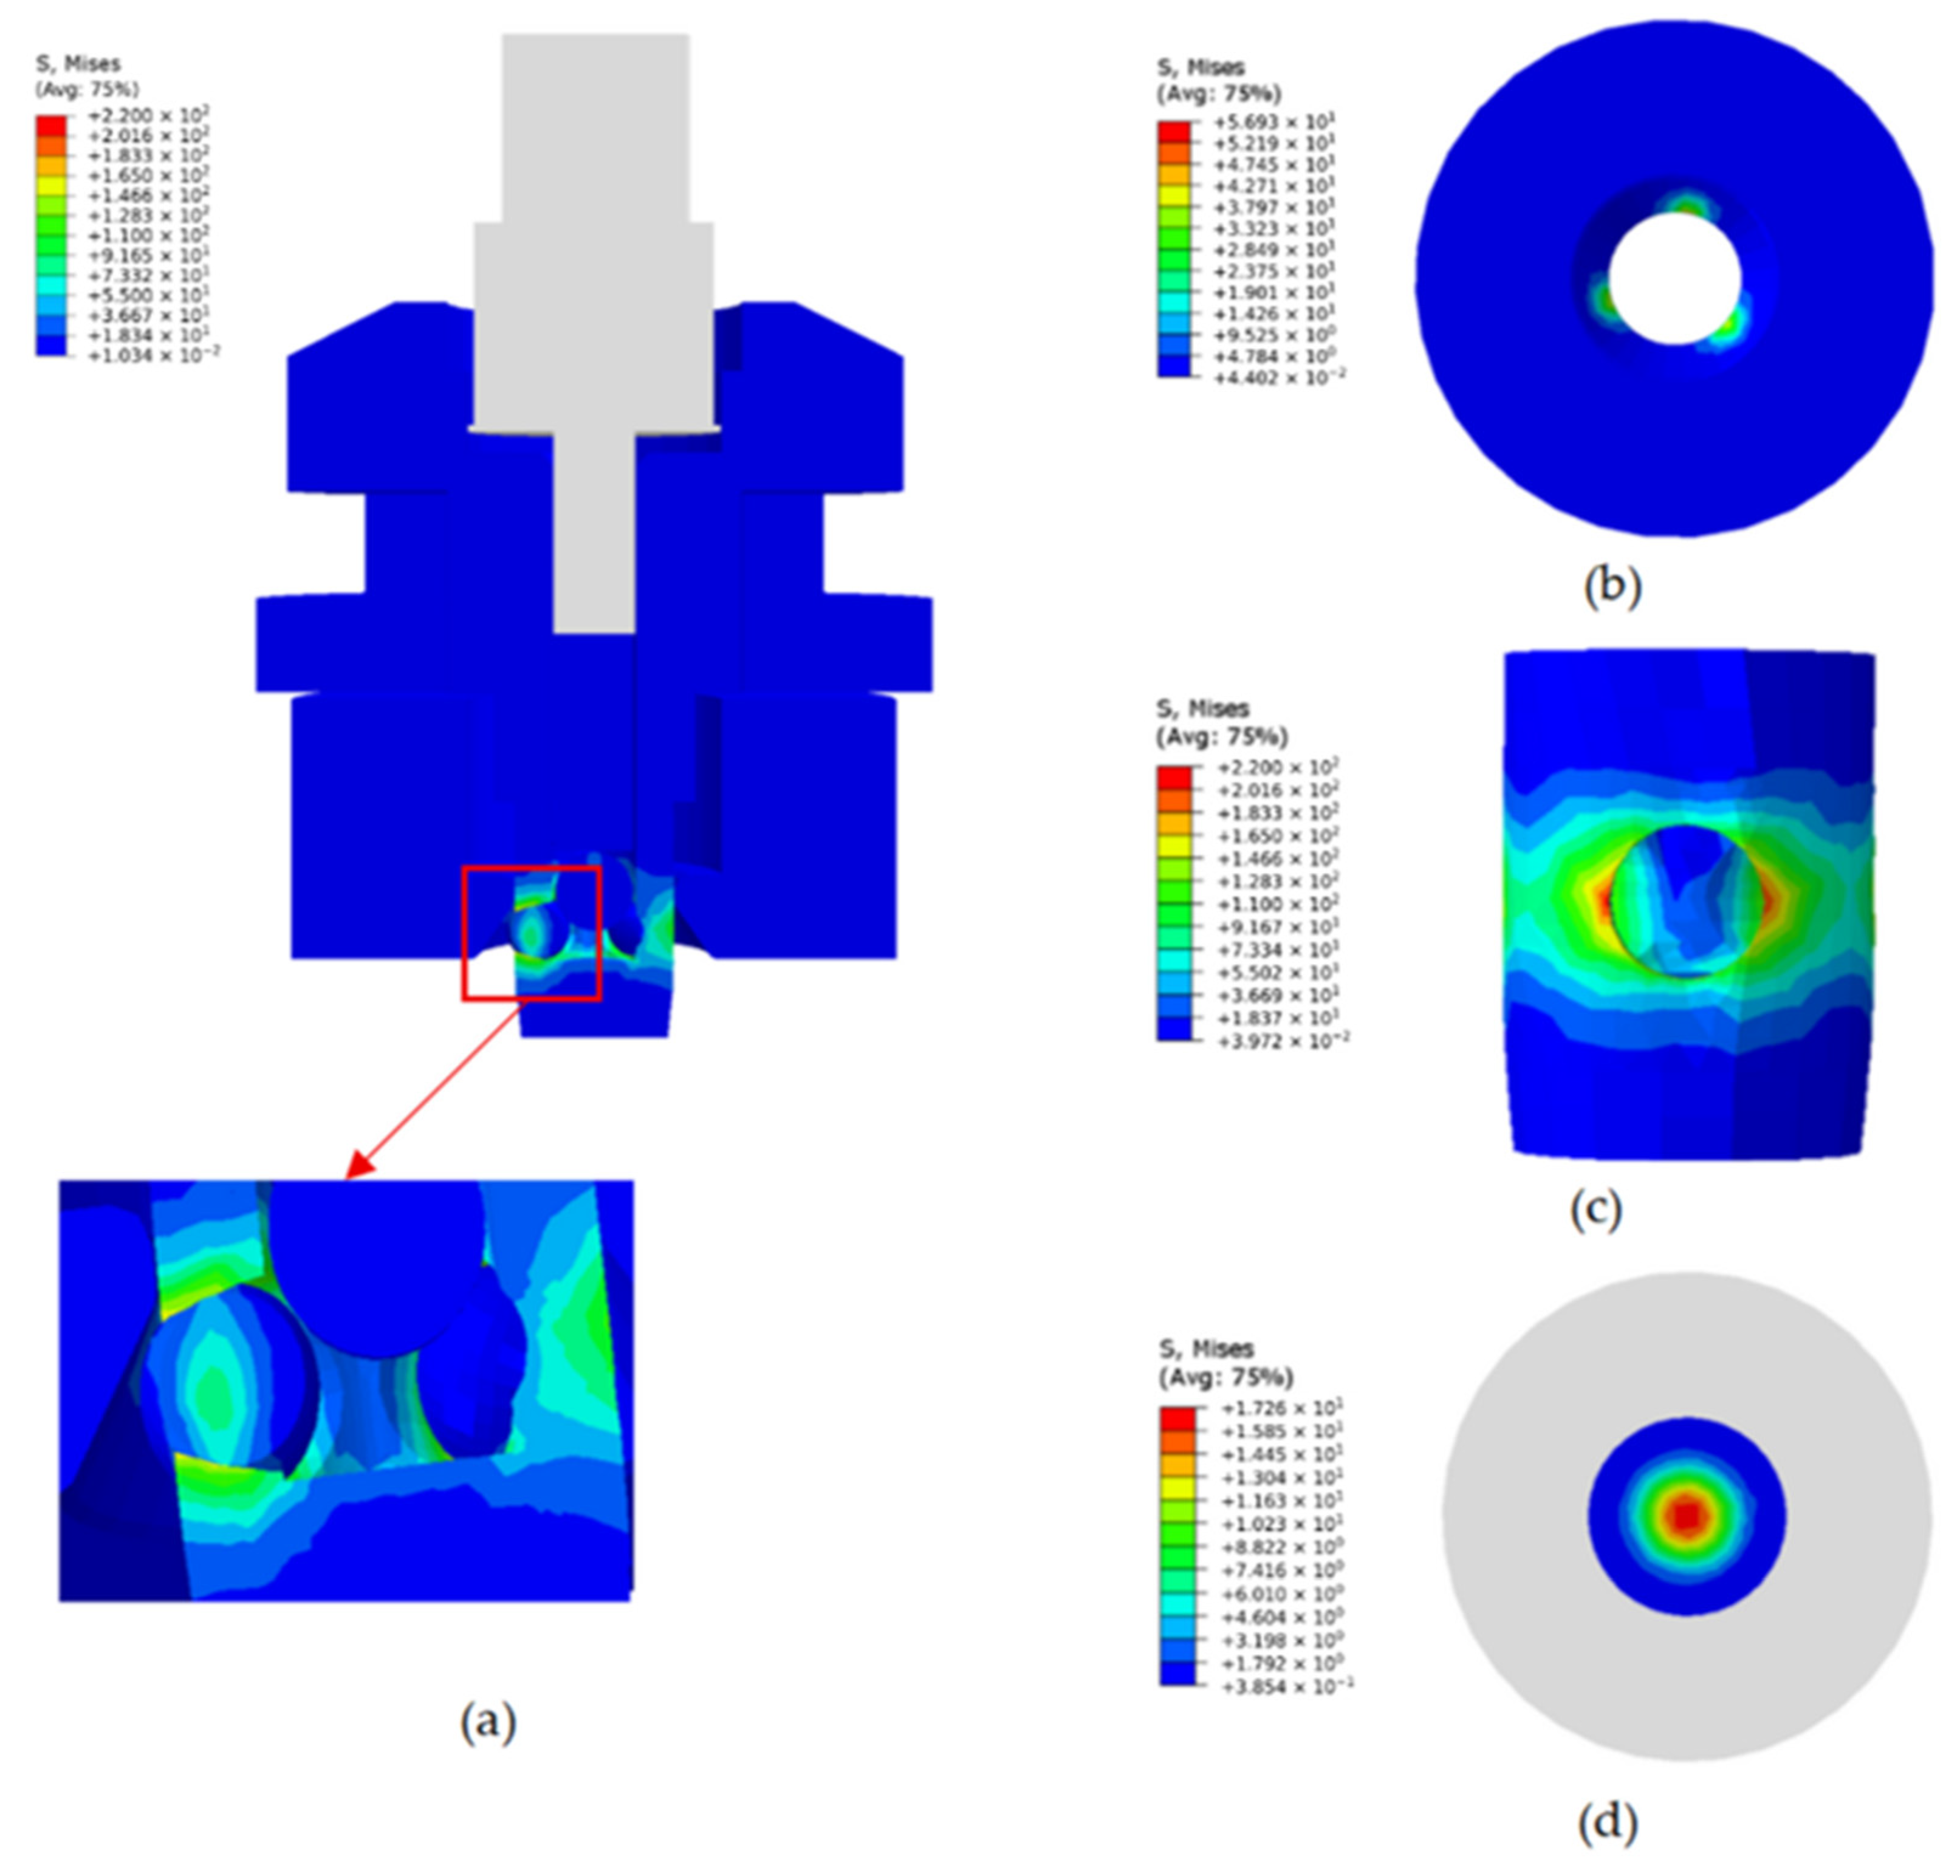
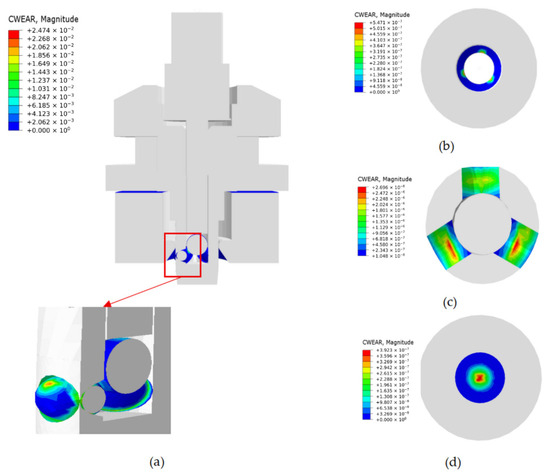
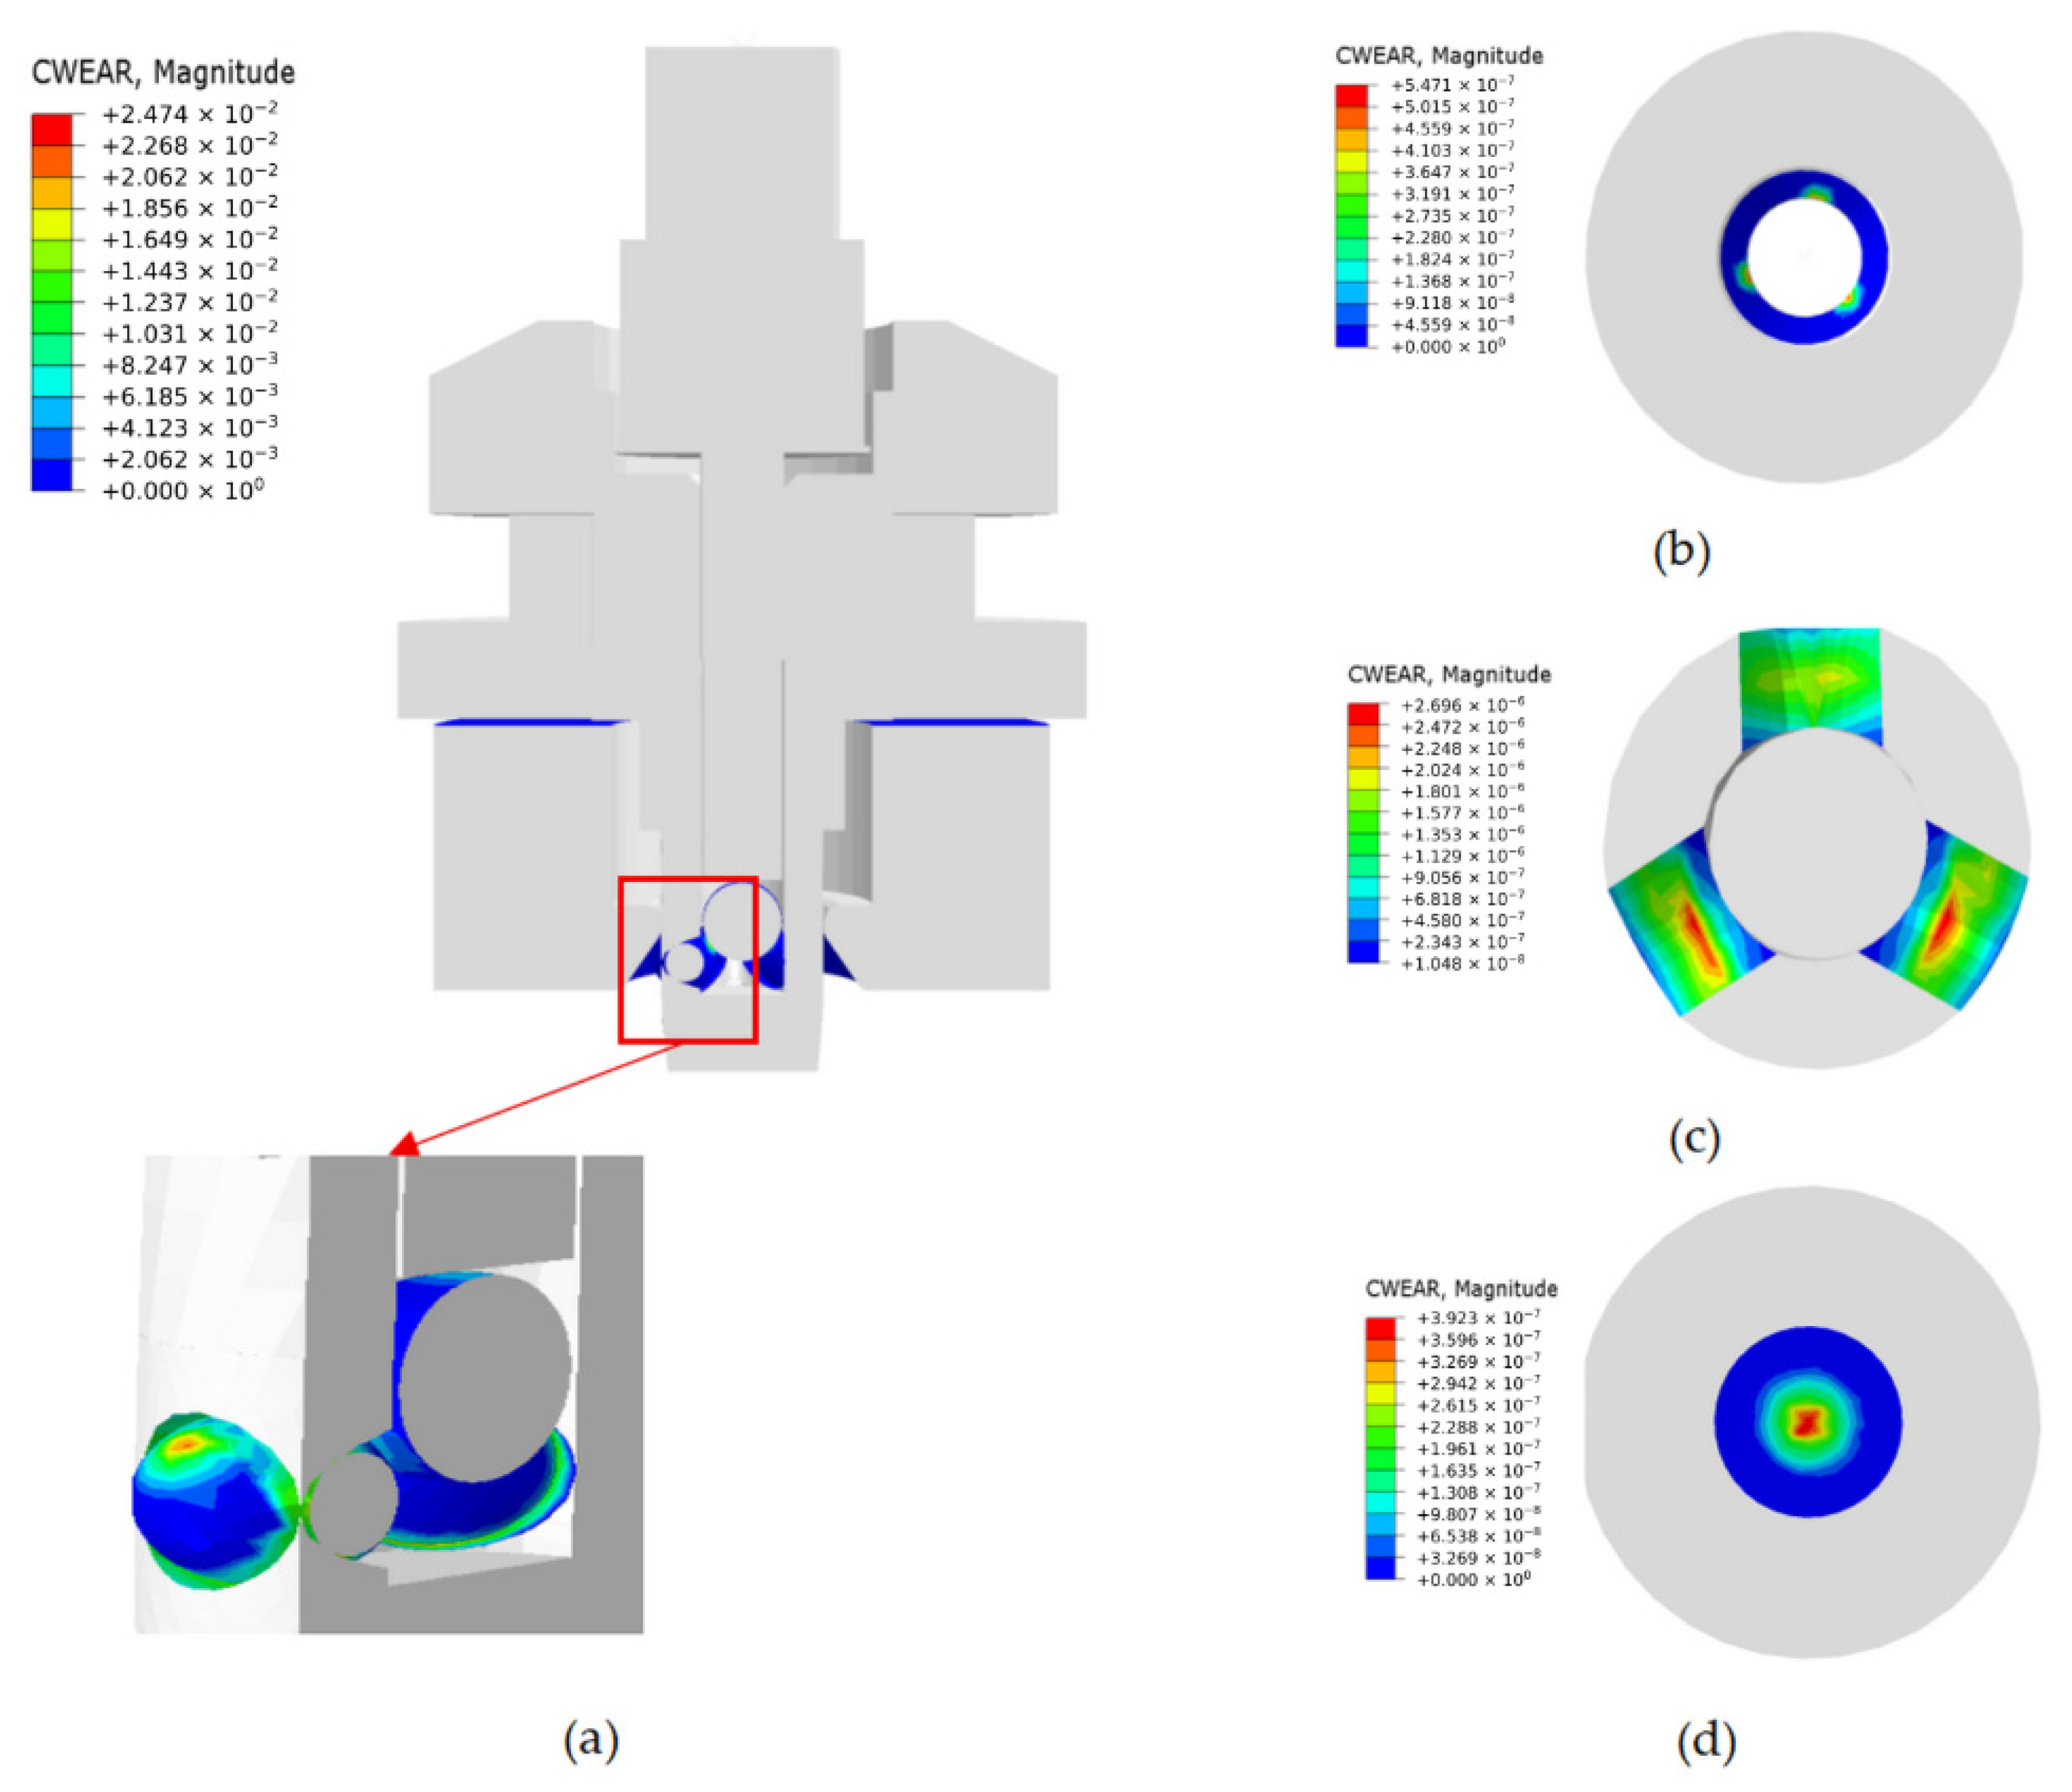
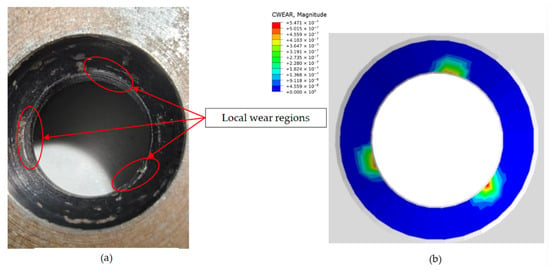
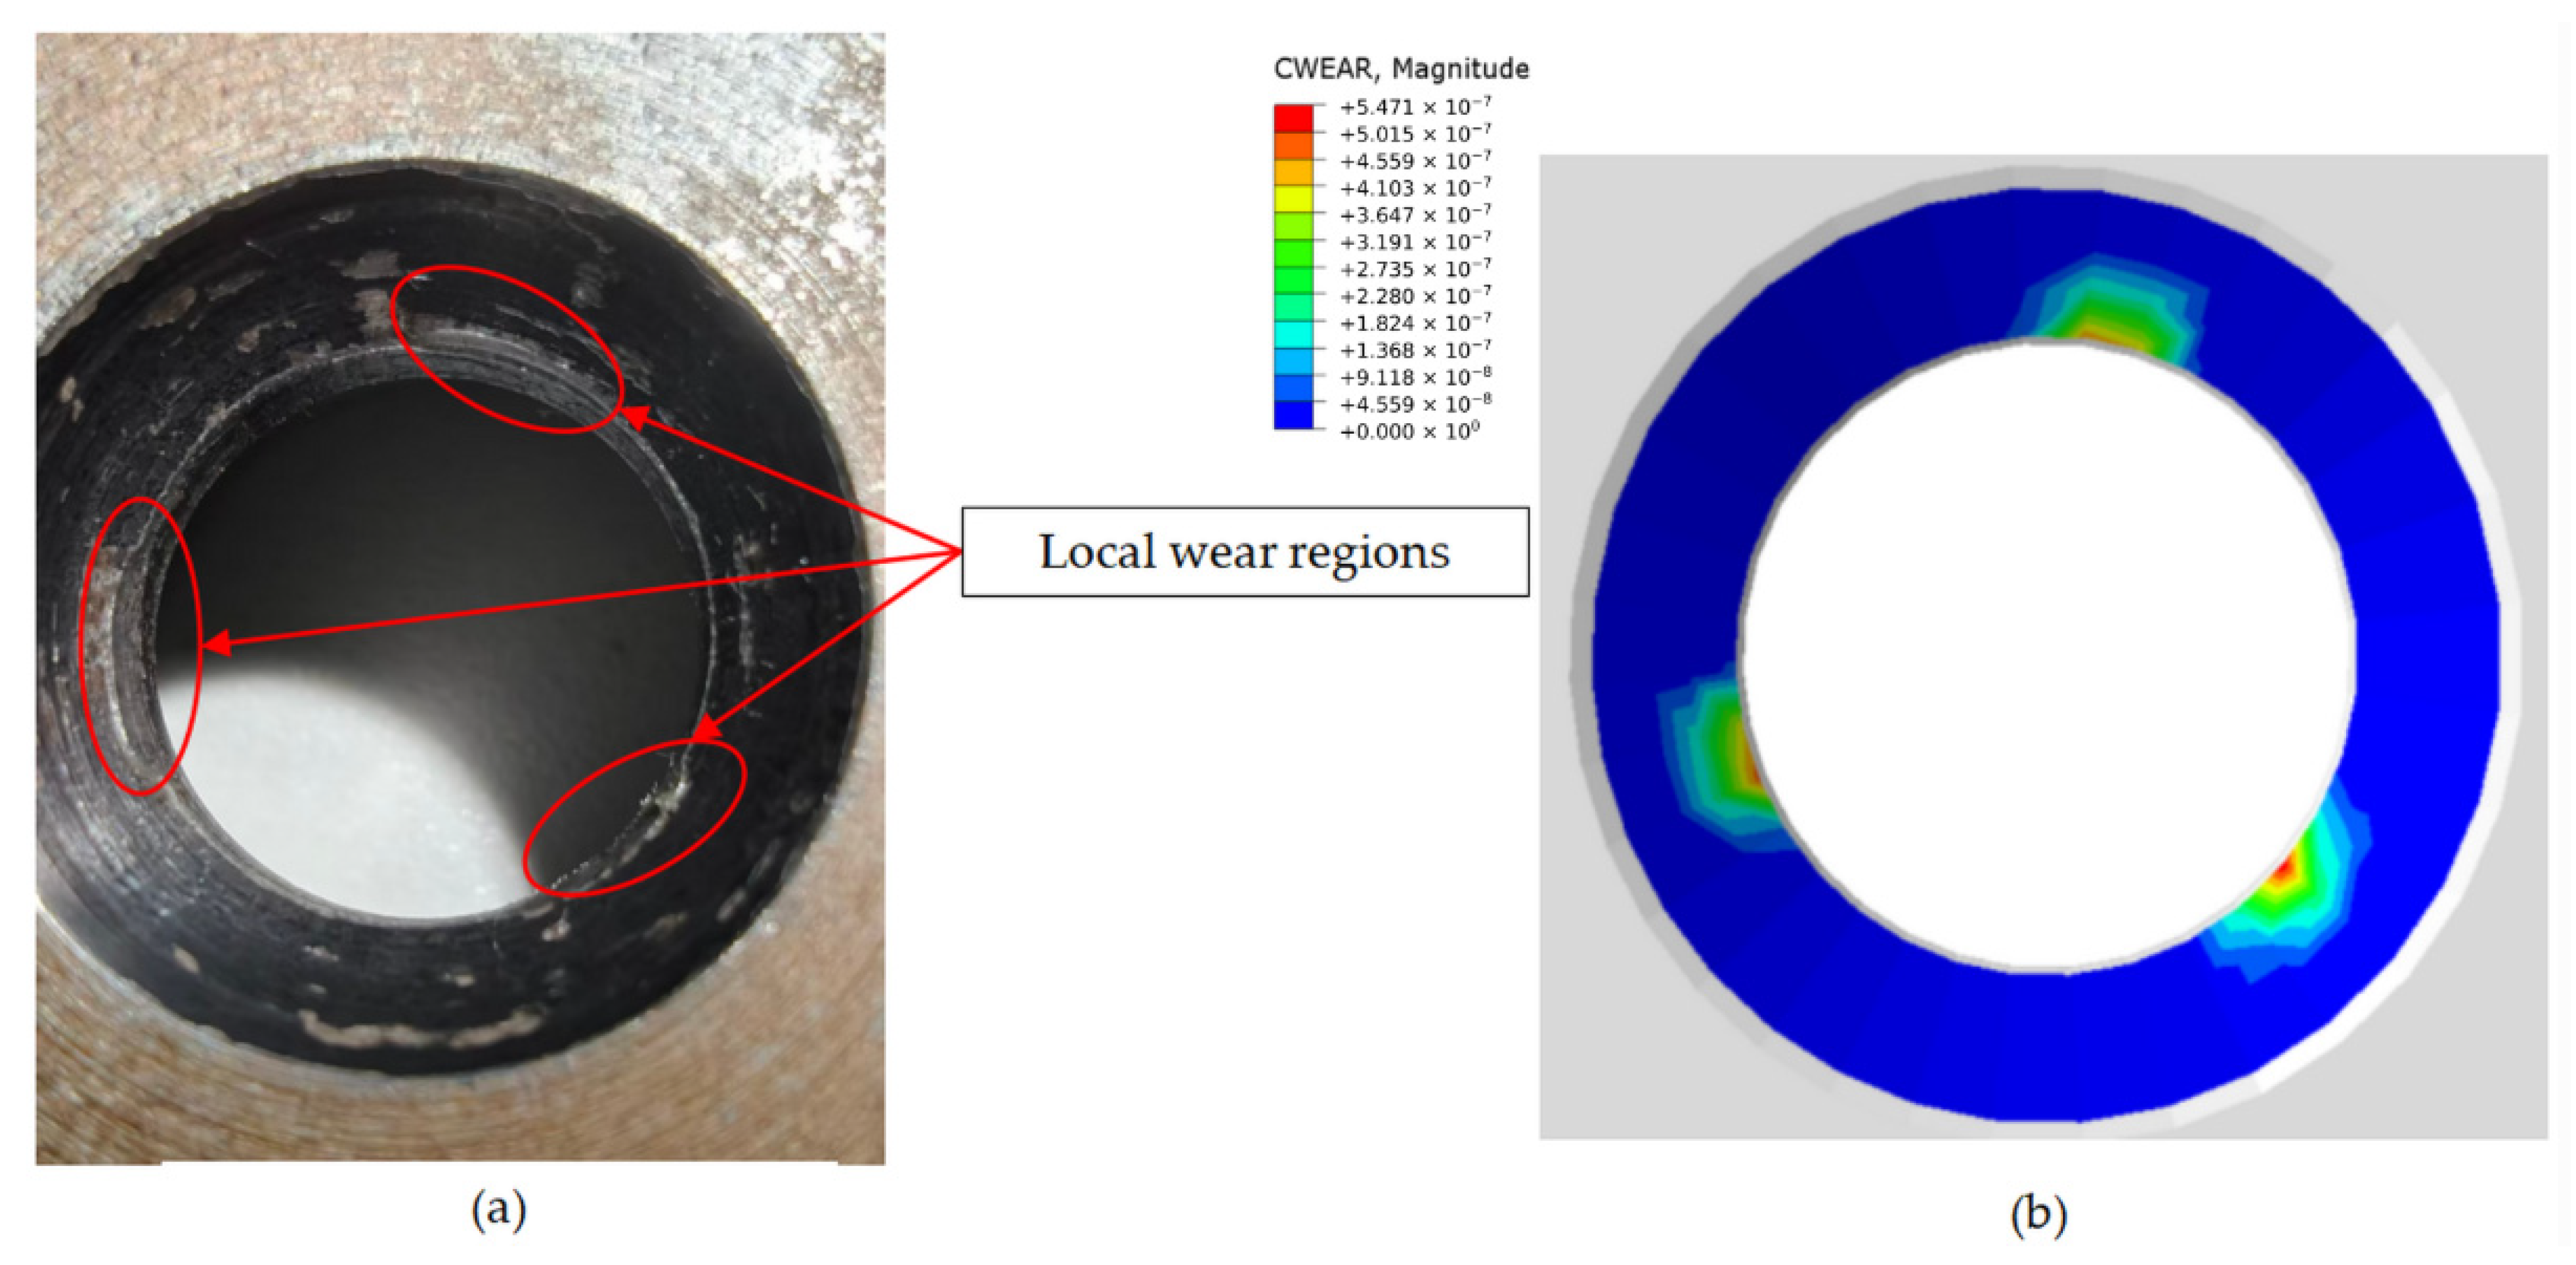

Disclaimer/Publisher’s Note: The statements, opinions and data contained in all publications are solely those of the individual author(s) and contributor(s) and not of MDPI and/or the editor(s). MDPI and/or the editor(s) disclaim responsibility for any injury to people or property resulting from any ideas, methods, instructions or products referred to in the content. |
© 2026 by the authors. Licensee MDPI, Basel, Switzerland. This article is an open access article distributed under the terms and conditions of the Creative Commons Attribution (CC BY) license.