


Abstract
The water-blocking buffer layer of high-voltage cross-linked polyethylene (XLPE) power cables is prone to degradation during long-term operation due to factors such as moisture and ablation. The degradation may cause an increase in leakage current, which is affected by frequency. However, the correlation between buffer layer status and leakage current under various frequencies needs further investigation. Accordingly, this paper investigates leakage current characteristics of cable water-blocking buffer layers with different statuses under multi-frequency excitation. Firstly, a multi-frequency leakage current test platform was established. Afterwards, composite specimens consisting of XLPE insulation and a water-blocking buffer layer were prepared in four different states: normal, moisture-affected, slightly ablated, and severely ablated. The leakage current responses of different specimens under various voltage frequencies were systematically examined. The results show that, under moisture-affected conditions, the leakage current increases by 15–30% compared with the normal state. The voltage–current phase difference decreases significantly in the low-frequency range by 9–64°. The total harmonic content increases markedly as the frequency decreases, with the 3rd, 5th, and 7th harmonics exhibiting the highest sensitivity. Ablated samples have limited influence on the leakage current. But localized spikes appear in the waveform. Under normal conditions, the leakage current waveform follows the applied sinusoidal voltage, forming a natural symmetry in both frequency and time domains. However, moisture ingress and ablation defects break this symmetry by introducing harmonic distortion in the frequency domain and pulse-shaped spikes in the time domain, respectively. The method utilizes low-frequency leakage-current harmonics and harmonic–residual spikes to identify buffer layer moisture and ablation defects. The proposed method enables the effective identification of different buffer layer states and provides a technical approach for the defect diagnosis of water-blocking buffer layers in high-voltage cables.
1. Introduction
In recent years, with the increase in urban power demand, high-voltage cross-linked polyethylene (XLPE) power cables have become increasingly important energy carriers owing to their excellent insulation performance and resistance to harsh environments [1]. As a key functional layer between the metallic sheath and the insulation shield of high-voltage cables, the water-blocking buffer layer provides multiple functions, including longitudinal water-blocking, radial buffering, and electric-field homogenization. However, during long-term cable operation, the water-blocking buffer layer may suffer performance degradation due to moisture and ablation [2,3]. The degradation can further lead to local electric-field distortion and an abnormal increase in leakage current. In severe cases, this may induce insulation breakdown accidents [4]. Recently, the Chinese power grid has frequently detected instances of moisture and ablation in the water-blocking buffer layer of high-voltage cables, and similar incidents have been reported in countries such as Japan, Singapore, and Australia. These defects are highly latent; there are currently no effective detection methods available, and they affect large sections of cables [5,6]. Therefore, accurate diagnosis of the moisture and ablation defects in the water-blocking buffer layer is of great engineering significance for ensuring the safety of cable lines.
At present, the main detection methods for buffer layer defects in high-voltage cables include ultrasonic testing [7], the broadband impedance method [8], partial discharge detection [9], X-ray imaging [10], and gas chromatography [11]. Extensive studies have been conducted on defects in cable water-blocking buffer layers. Ref. [7] developed an acoustic model of the porous buffer layer and showed by simulation that strong discharge at buffer layer valleys can generate detectable ultrasonic signals. But this method can only detect severe ablation and has low sensitivity to early defects. Ref. [12] used broadband impedance spectroscopy (BIS) to identify buffer layer moisture and ablation defects, but the results can vary greatly with different operators and circumferential electrode positions. Ref. [13] revealed that moisture-induced white powder increases resistivity and distorts the electric field, thereby inducing partial discharge. However, since this study requires analyzing the powder inside the cable, the cable must be destroyed. Ref. [14] established an H2-dominated damage grading method for buffer layers based on gas chromatography and thermogravimetric–infrared analysis. However, this method requires drilling holes in the aluminum sheath, which compromises the cable’s structure. Ref. [15] optimized three-dimensional imaging parameters using X-ray CT to detect buffer layer defects, but the equipment is bulky and involves radiation risks. Overall, existing methods still have limitations in terms of non-destructiveness and sensitivity to early defects. Moreover, most existing studies focus on a single defect state, either moisture-affected defects or ablation. A unified detection and discrimination method applicable to both is still lacking.
Leakage current analysis provides a feasible approach for the early diagnosis of water-blocking buffer layer defects because of its sensitive response to insulation degradation and its ability to avoid structural damage to cables [16]. Leakage current is defined as the current flowing through the insulation layer or along the surface of the insulation material under applied voltage, comprising capacitive current (due to dielectric polarization), resistive current (due to insulation conductivity), and discharge current (due to local breakdown or partial discharge activities) [17]. For high-voltage cross-linked polyethylene (XLPE) insulated cables, changes in the leakage current characteristics can reflect the condition of the cable insulation. Under ideal conditions, the excitation voltage and leakage current of the buffer layer are expected to exhibit a quasi-linear and symmetric relationship in both the time and frequency domains. Time-domain symmetry means the current waveform is expected to preserve the sinusoidal symmetry of the voltage. Frequency-domain symmetry indicates the current spectrum is expected to be dominated by the fundamental frequency with negligible harmonic distortion. However, moisture ingress and ablation defects may disrupt this symmetry, causing distortion in the leakage current waveform. If such symmetry-breaking signatures can be identified and quantified experimentally, they may provide a basis for distinguishing different buffer layer defects. The excitation voltage and leakage current waveforms of the buffer layer in high-voltage cables also exhibit a natural time–frequency symmetrical relationship. Moisture and ablation disrupt this symmetry in both the frequency and time domains. However, traditional methods mostly use leakage current characteristics at power frequency as diagnostic indicators, resulting in insufficient sensitivity when defects are at an early stage. In addition, analysis based on a single feature is unable to account for different defect states. Therefore, it is urgent to develop a buffer layer condition identification method that can distinguish moisture-affected defects and ablation defects.
To address these issues, this paper investigates the leakage current characteristics of buffer layers under multi-frequency excitation. Firstly, a multi-frequency leakage current test platform was established. Afterwards, composite specimens consisting of XLPE insulation and a water-blocking buffer layer were prepared in four different states: normal, moisture-affected, slightly ablated, and severely ablated. Leakage current signals under each state are then collected at different voltage levels over a wide frequency range. Next, the effects of different defects on current responses are analyzed in terms of amplitude, phase difference, harmonic characteristics, and local spikes, revealing the time–frequency-domain differences between moisture-affected defects and ablation defects. On this basis, a buffer layer condition identification method based on harmonic and residual spike features is proposed. Innovatively, low-frequency harmonic features are first incorporated. Different defects are distinguished using features such as spike density, energy ratio, maximum score, maximum spike amplitude, and the comprehensive Harmonic–Residual Energy (HRE) score. Through this staged discrimination strategy, effective identification of four buffer layer conditions—normal, moisture-affected, slightly ablated, and severely ablated—can be achieved.
2. Experimental Specimens and Methods
To simulate the operating environment of the water-blocking buffer layer in high-voltage cables, test specimens were prepared by combining XLPE insulation with the water-blocking buffer layer. In practical cable structures, XLPE serves as the main insulation layer and plays a critical role in electrical isolation and voltage withstand capability [18]. Outside the XLPE layer, the insulation screen and the water-blocking buffer layer are arranged sequentially. The insulation screen mainly functions to homogenize the electric-field distribution on the outer surface of the main insulation [19]. Owing to its small thickness and resistivity between that of insulating and semiconductive materials, its influence on leakage current is relatively limited. Therefore, the insulation screen was neglected, and the XLPE sheet was directly laminated with the water-blocking buffer layer to form the test specimen.
2.1. Preparation of XLPE Sheets
XLPE insulation specimens were prepared from XLPE pellets using a hot-pressing crosslinking process with a flat vulcanizing press. The weighed XLPE pellets were uniformly placed in a mold and preheated at 175 °C to ensure complete melting and plasticization. Subsequently, a stepwise pressurization process was applied for compression molding to promote uniform crosslinking and eliminate internal bubbles. In the first stage, a pressure of 4 MPa was applied and maintained for 6 min. In the second stage, the pressure was increased to 6 MPa and maintained for 6 min. Afterwards, the pressure was further increased to 8 MPa and maintained for 6 min. After the three stages, the specimens were slowly cooled to room temperature and then demolded, yielding XLPE insulation sheets.
2.2. Preparation of Defective Water-Blocking Buffer Layer Specimens
The water-blocking buffer layer used in this paper was from Zhongtian Technology Submarine Cable Co., Ltd., which is located in Nantong, Jiangsu Province, China. It was cut to dimensions matching those of the XLPE insulation sheets. The cut water-blocking buffer layer and the XLPE sheet were then stacked and placed in a clamping device. To control the moisture content accurately, the buffer layer sample was first weighed using a precision electronic balance (resolution: 0.001 g) to obtain the initial mass. Water was then injected dropwise using a syringe while the sample remained on the balance. The real-time mass reading was continuously monitored, and water addition continued until the mass increase reached the target value corresponding to the desired moisture content (e.g., for 15% moisture content, water was added until the mass increased by 15%). After water addition, the sample was kept at room temperature for 10 min to allow sufficient water absorption and uniform distribution throughout the buffer layer. Subsequent leakage current tests were conducted only after the completion of the moisture-conditioning treatment.
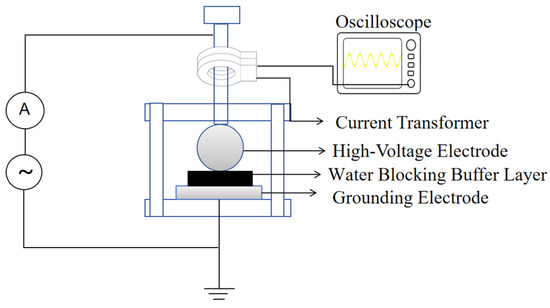
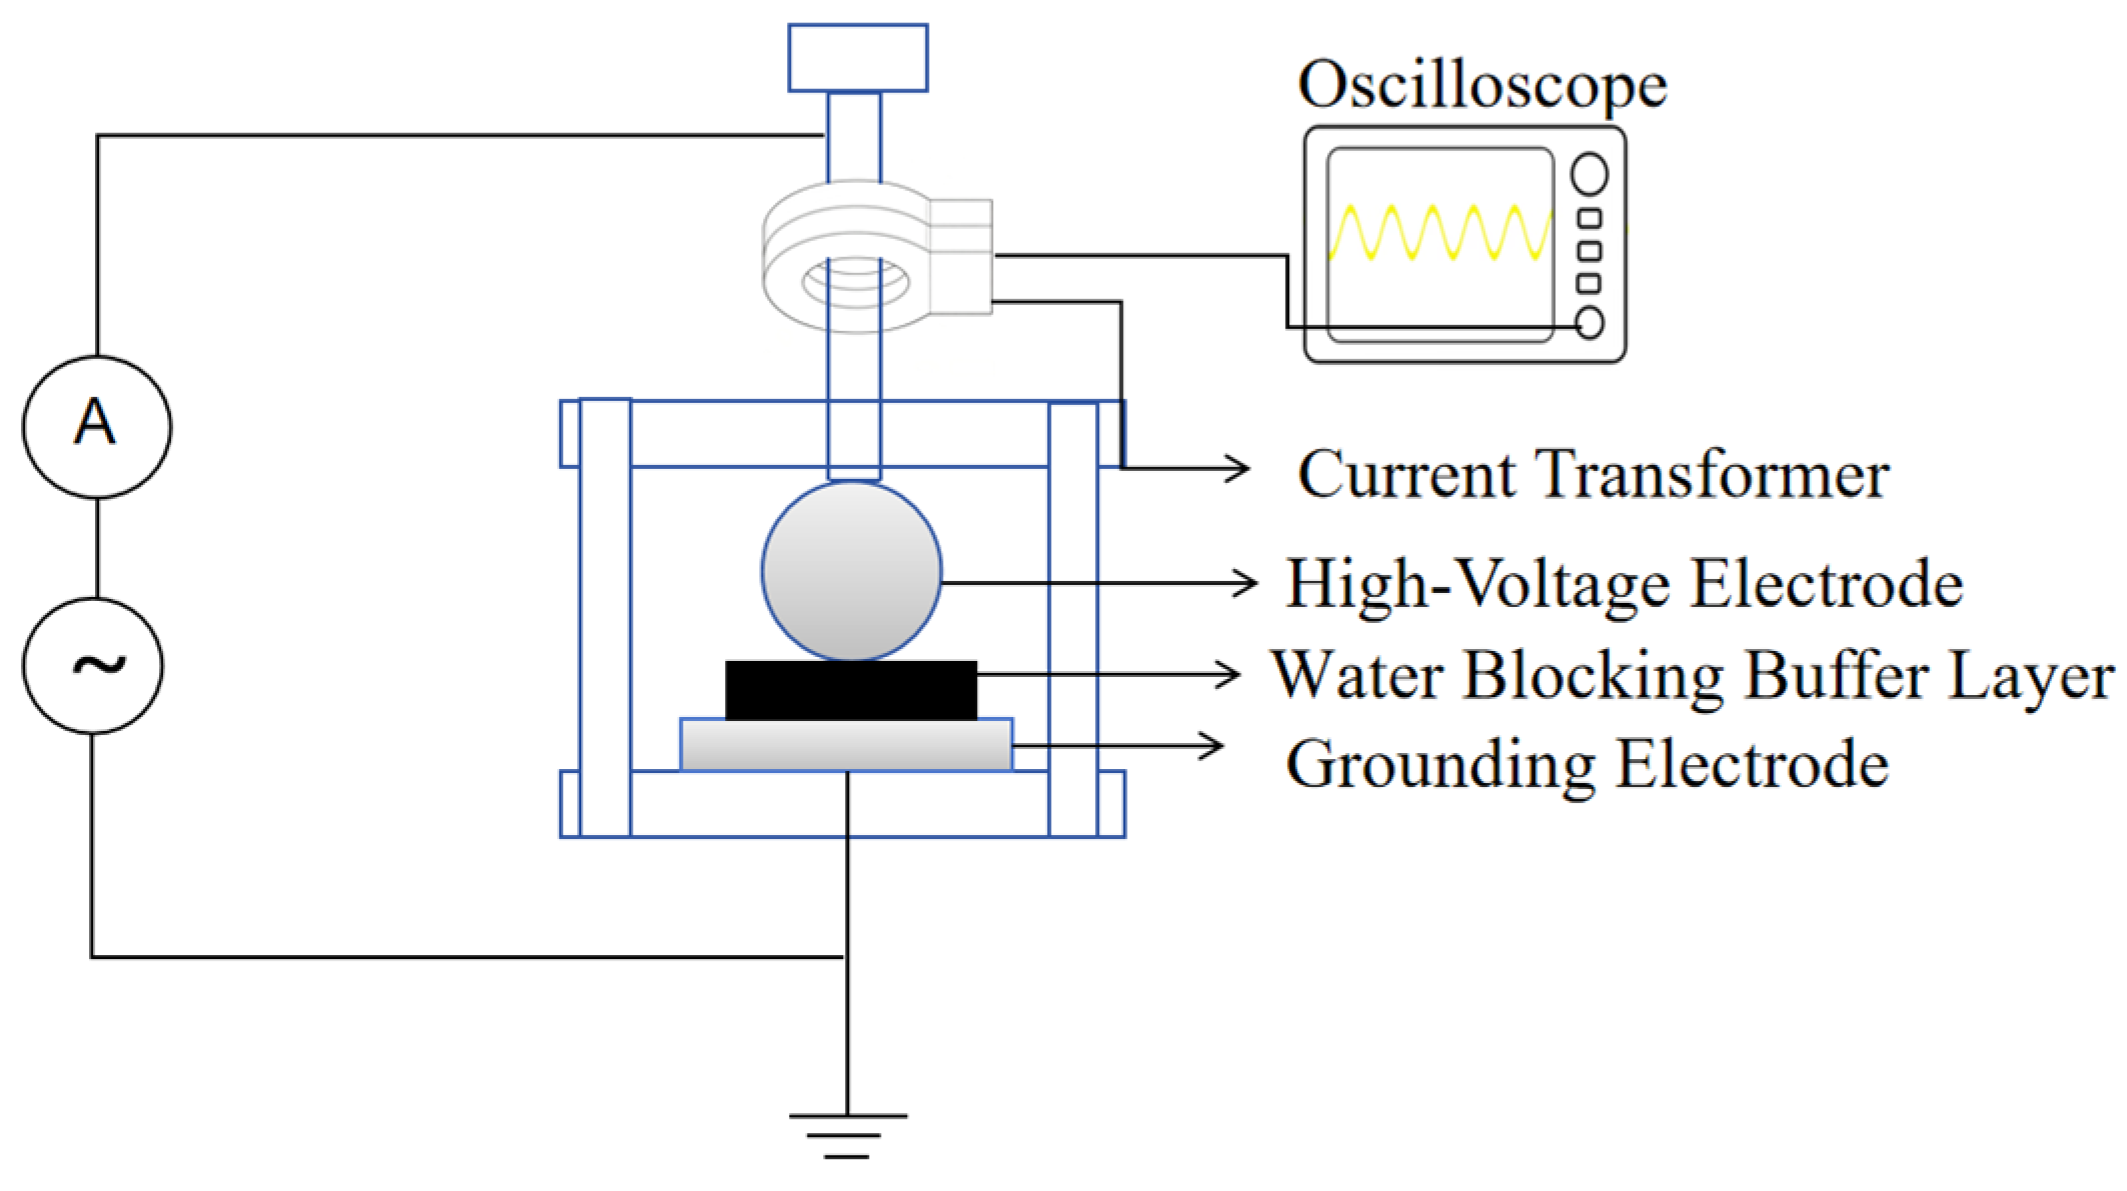
The experimental platform to generate defects in the water-blocking buffer layer is shown in Figure 1. It consists of a constant-current source, a high-voltage electrode, a ground electrode, a current transformer, an oscilloscope, and the water-blocking buffer layer. The high-voltage electrode was spherical, corresponding to the corrugated aluminum sheath, whereas the ground electrode was plate-shaped. The high-voltage electrode rod could be rotated and pressed downward, and a mark was made on the rod to ensure a consistent pressing depth in each test. A current transformer and an oscilloscope were used to verify the accuracy of the applied current in each experiment.
Figure 1.
Test facility to generate defects in water-blocking buffer layer.
By varying the state of the buffer layer and the output current amplitude of the power supply, three groups of buffer layers were configured as follows:
- (1)
- Dry water-blocking buffer layer, 20 mA current, 12 h energization;
- (2)
- Moisture-absorbed water-blocking buffer layer (15% water content), 20 mA current, 2 h energization;
- (3)
- Moisture-absorbed water-blocking buffer layer (15% water content), 60 mA current, 12 h energization.
The ablation current levels (20 mA and 60 mA), duration (12 h), and moisture content (15%) were determined iteratively by monitoring the appearance of white powder during the ablation process. Ablation was stopped once it was determined that the appearance of the ablated buffer layer was similar to that described in Reference [13].
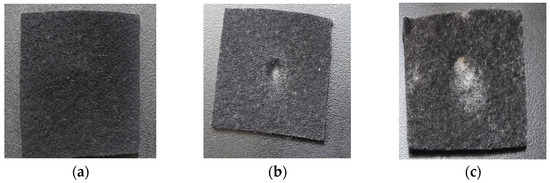
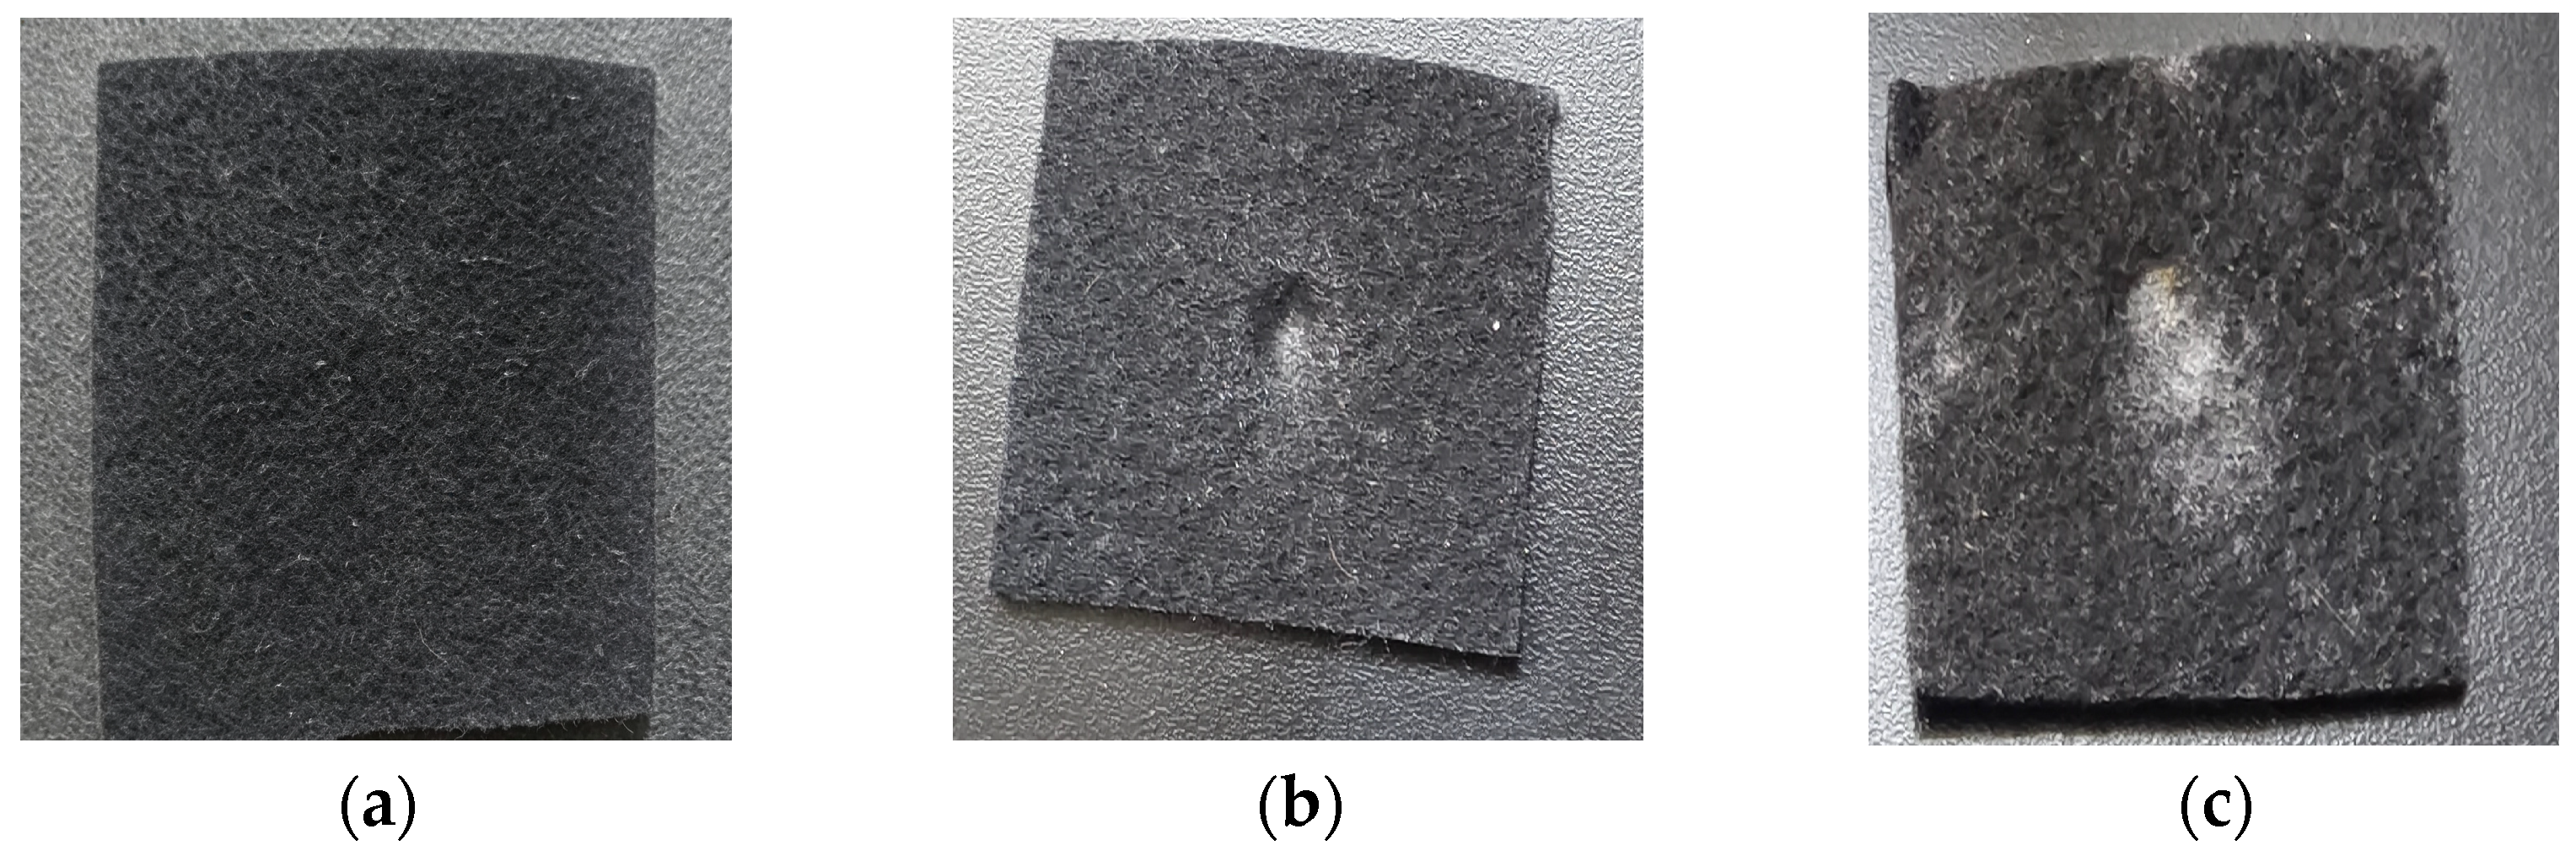
The results are shown in Figure 2, where the test groups from left to right correspond to groups (1), (2), and (3), respectively. As shown in Figure 2, no obvious change was observed in the buffer layer of group (1); group (2) exhibited certain ablation traces, with pore-like marks appearing; group (3) showed more pronounced pore-like marks with a larger affected area. However, oscilloscope monitoring during the tests revealed no current surge in any group, indicating that the pore-like marks were not breakdown channels. Based on the experimental results, groups (1), (2), and (3) were classified as normal, slight ablation, and severe ablation, respectively.
Figure 2.
Ablation specimens. (a) Normal, (b) slight ablation, (c) severe ablation.
2.3. Experimental Methods
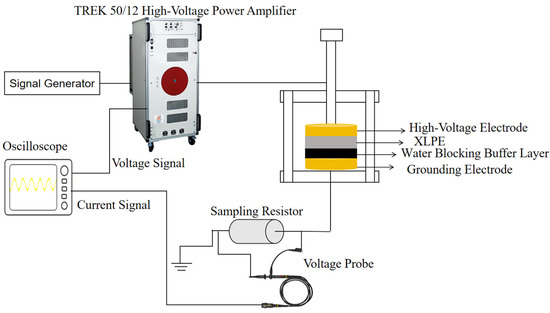
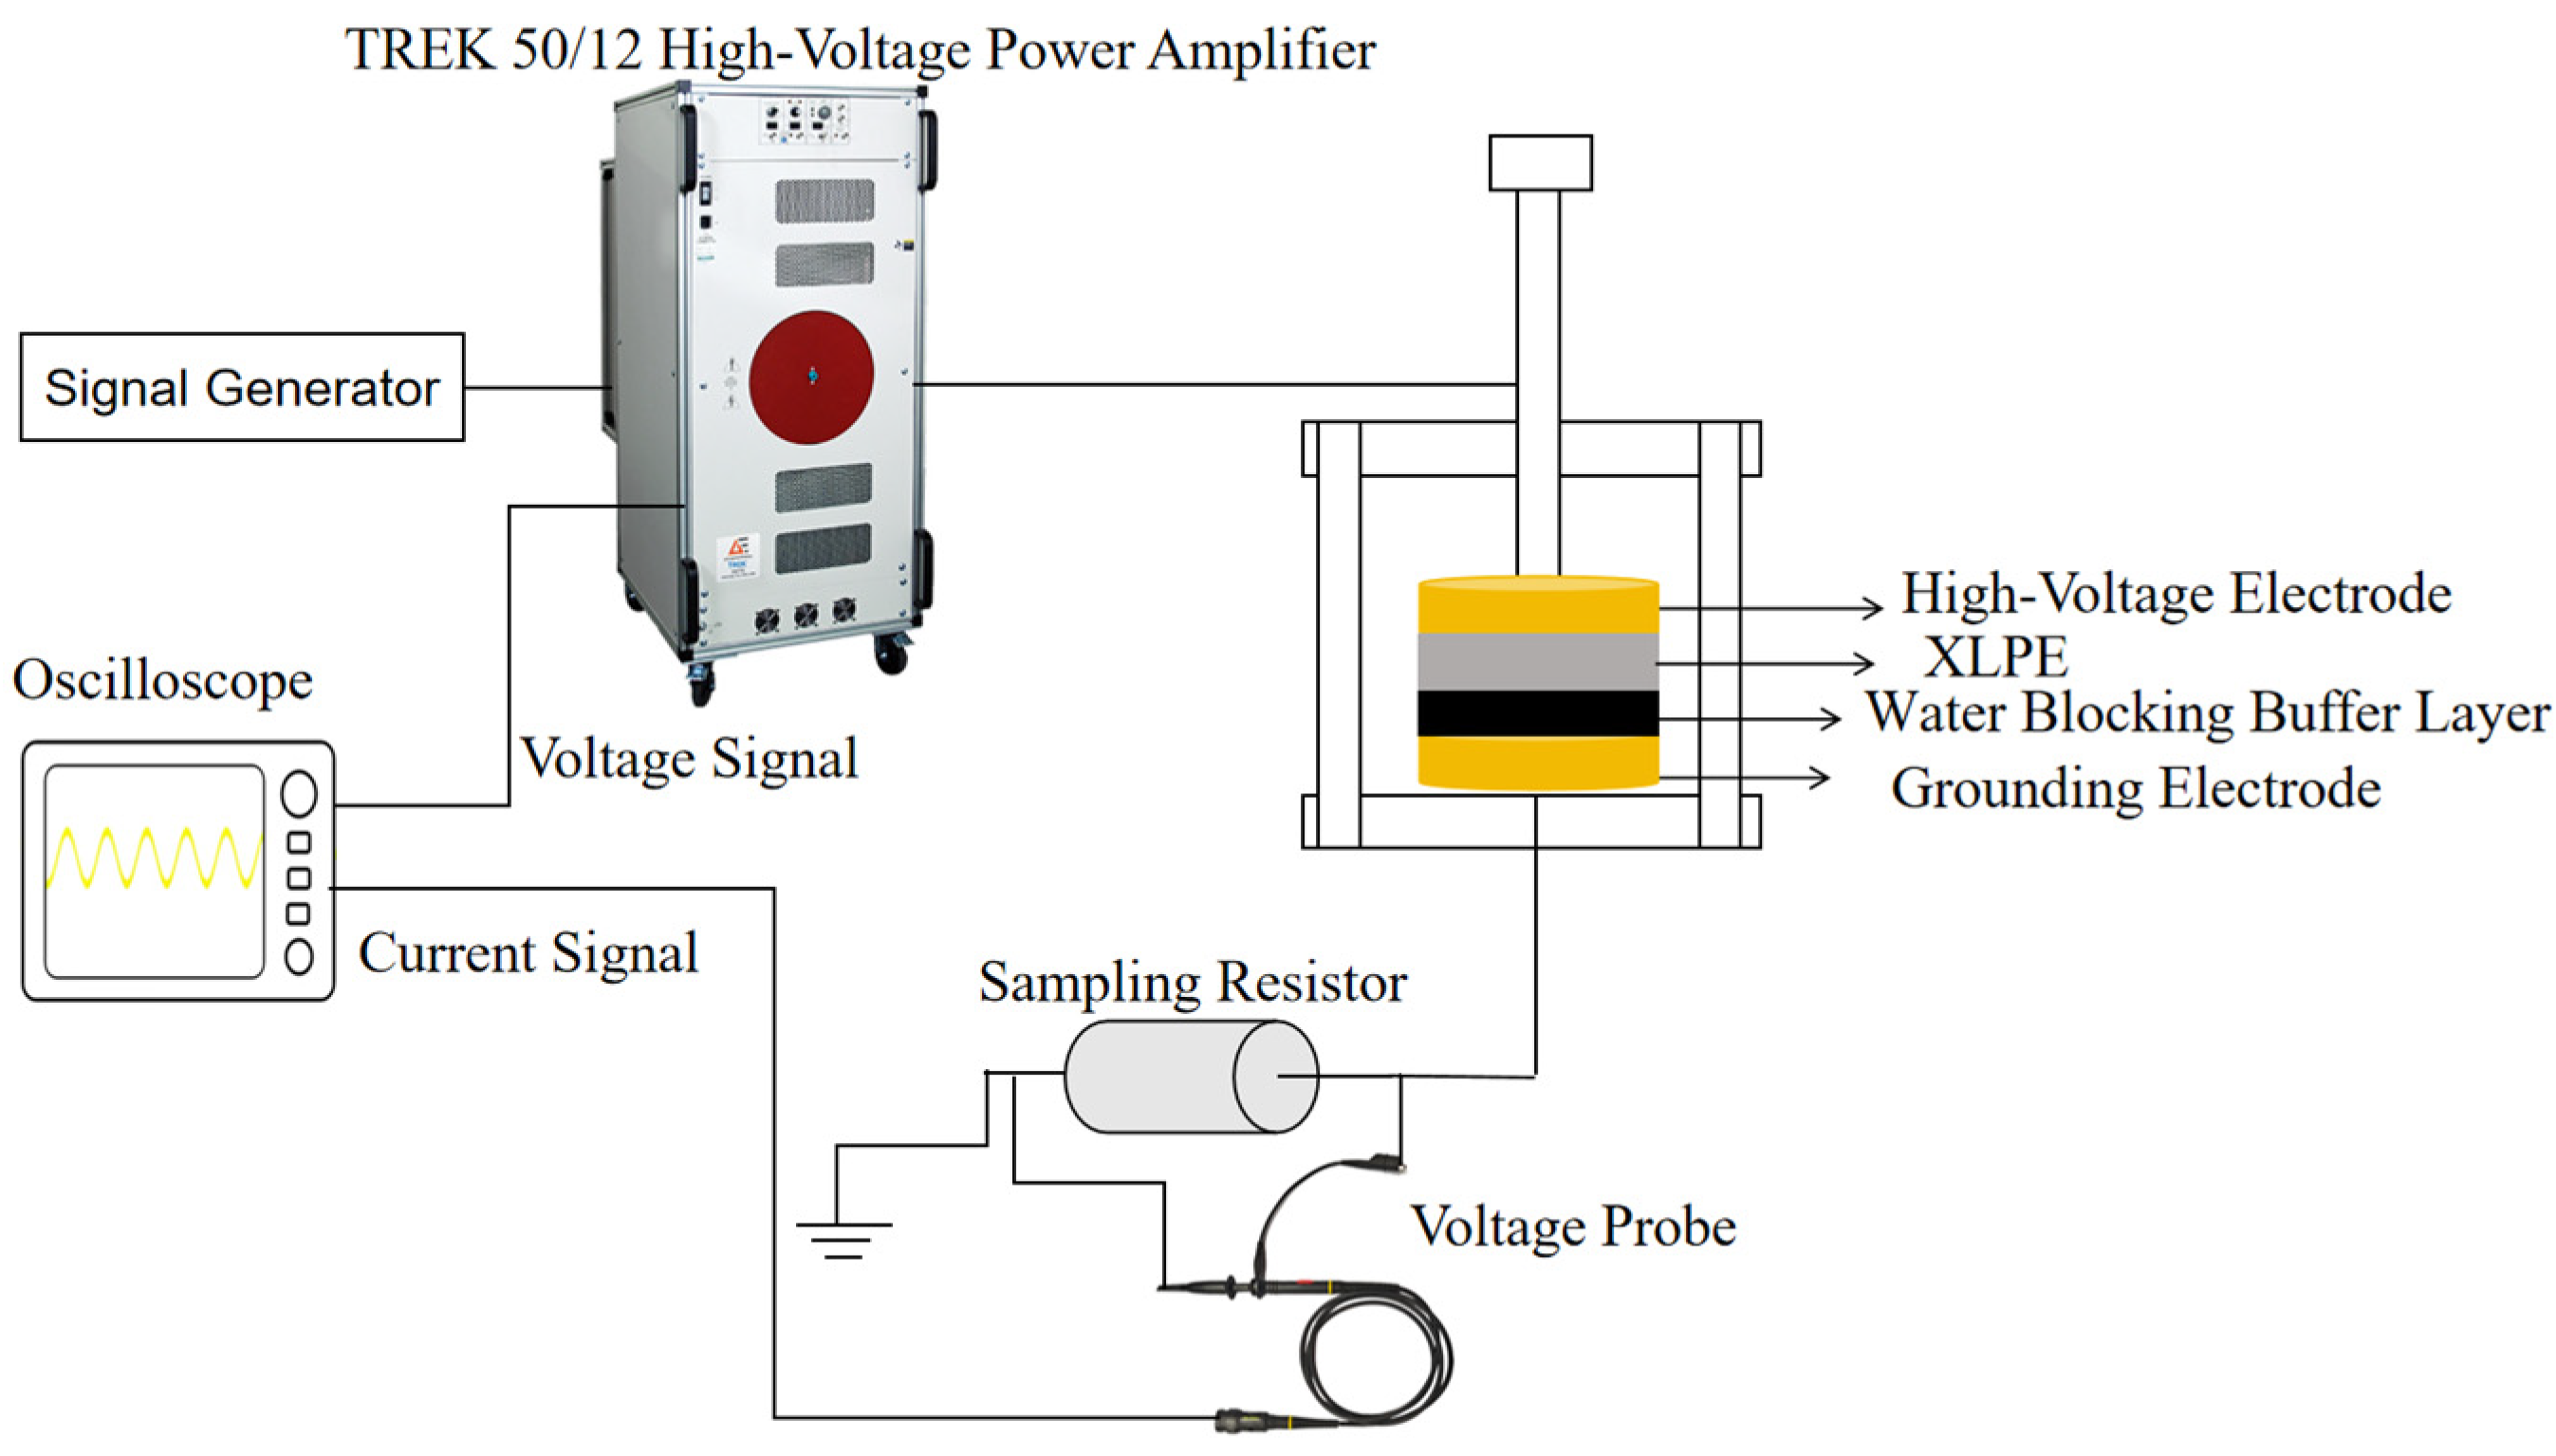
The leakage current monitoring system is shown in Figure 3. It mainly consists of a signal generator, a TREK 50/12 high-voltage power amplifier, an oscilloscope, a sampling resistor, a voltage probe and the specimen. The TREK 50/12 high-voltage power amplifier was supplied by TREK, Inc., Lockport, NY, USA. The signal generator, oscilloscope, sampling resistor and voltage probe were manufactured by RIGOL Technologies, Inc., Suzhou, China. The signal generator was connected to the TREK 50/12 high-voltage power amplifier to control the frequency and amplitude of the applied voltage. The input-to-output ratio of the TREK amplifier was 1:5000. The high-voltage lead was connected to the upper electrode of the pressurizing fixture, while the lower electrode was connected to the sampling resistor and then grounded. The diameters of the upper and lower electrodes were both 4 cm. The voltage probe was connected across the sampling resistor and then to the oscilloscope to acquire the leakage current signal. The resistance of the sampling resistor was 10 kΩ. The voltage-monitoring port of the TREK amplifier was also connected to the oscilloscope to acquire the applied-voltage signal.
Figure 3.
Leakage current monitoring system.
Before the experiments, the XLPE and water-blocking buffer layer samples were cut into specimens of 4 × 4 cm. The specimens were placed in the pressurizing fixture, and the high-voltage electrode rod was then positioned to ensure close contact. A mark was made on the high-voltage electrode rod to ensure the same compression level in each test. Excitations with different voltage amplitudes and frequencies were applied to the specimens, and the leakage current signals were recorded.
For each buffer layer condition, four independent specimens were prepared. Under each frequency–voltage combination, leakage current measurements were repeated three times for each specimen to ensure reproducibility. Based on signal quality and consistency with the repeated tests, a set of representative data was selected from each specimen for analysis.
3. Experimental Results and Analysis
3.1. Testing and Analysis of XLPE/Moisture-Affected Buffer Layer
3.1.1. Testing of XLPE/Moisture-Affected Buffer Layer
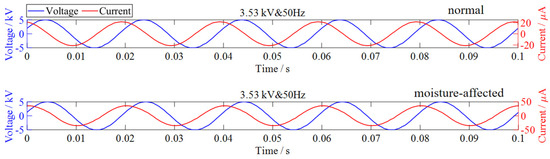
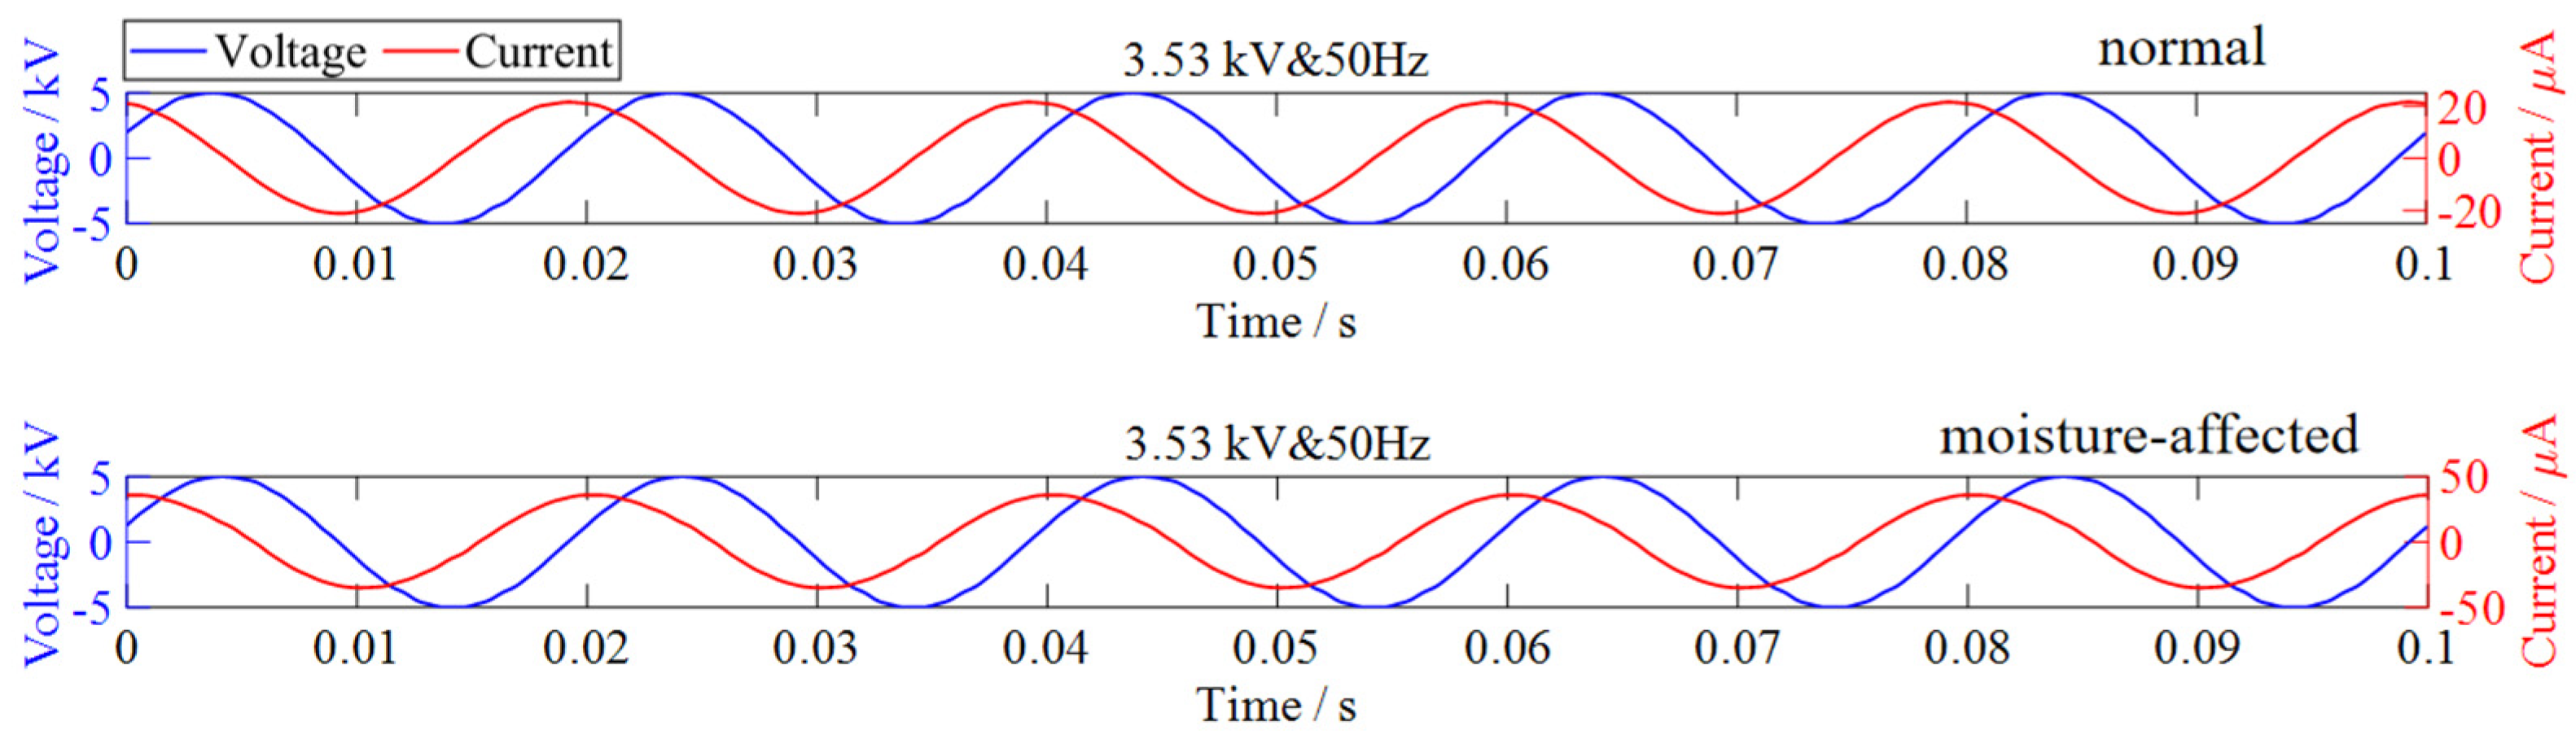
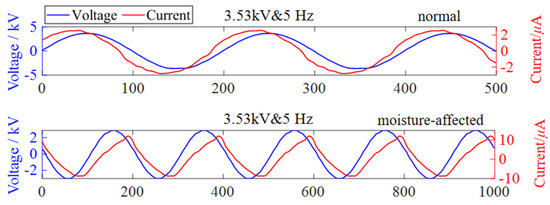
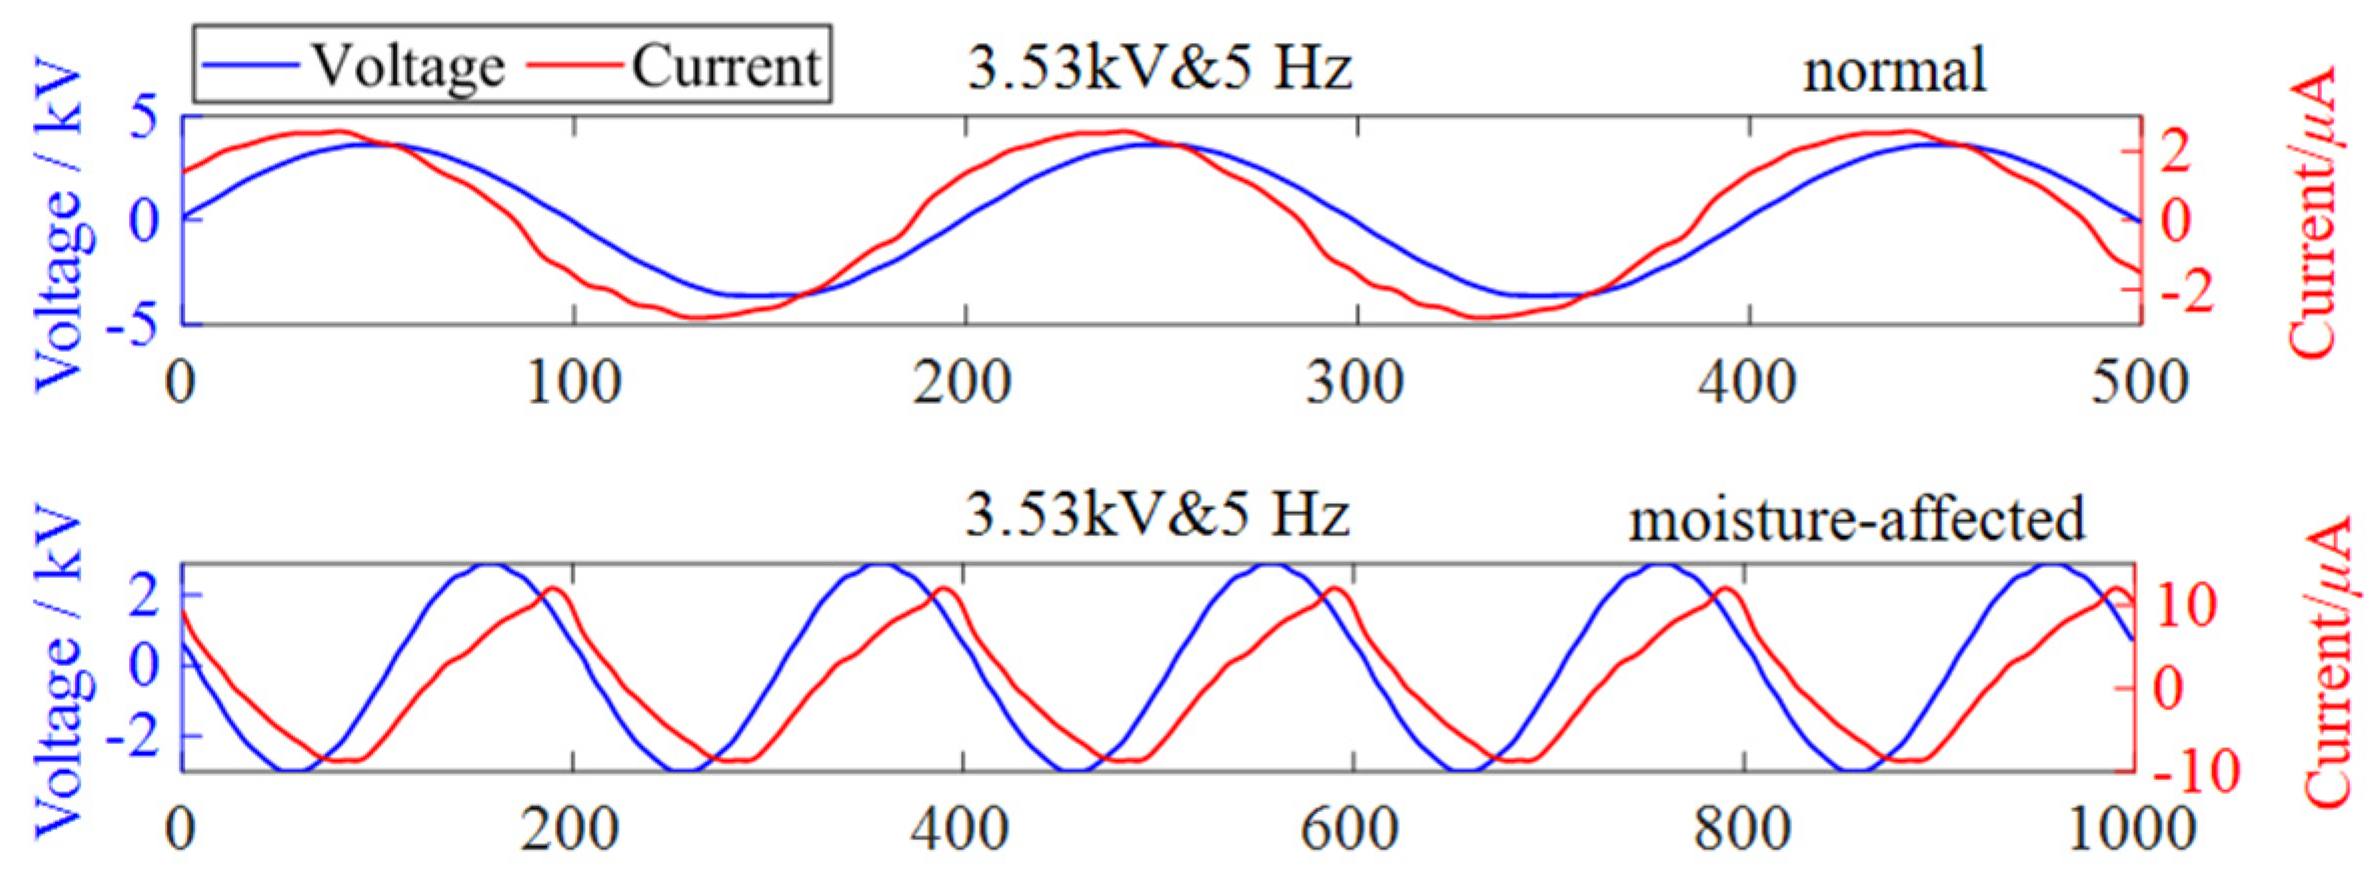
Voltage excitations with different amplitudes (0.88, 1.76, 2.65 and 3.53 kV) at power frequency and different frequencies (5, 10, 25, 50, 150, 250, 350, 450, 550, 650, 750, 850, 950, and 1050 Hz) at the same amplitude were applied to the XLPE/normal buffer layer and the moisture-affected buffer layer, respectively. Figure 4 shows the voltage–current waveforms under a 3.53 kV voltage excitation at power frequency, while Figure 5 shows the voltage–current waveforms under a 5 Hz voltage excitation at the same amplitude (3.53 kV).
Figure 4.
Voltage–current waveforms under the 3.53 kV voltage excitation at power frequency.
Figure 5.
Voltage–current waveforms for a 5 Hz voltage excitation at 3.53 kV.
3.1.2. Results Analysis of XLPE/Moisture-Affected Buffer Layer
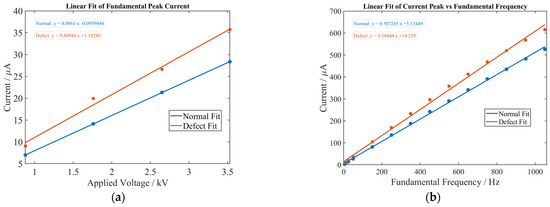
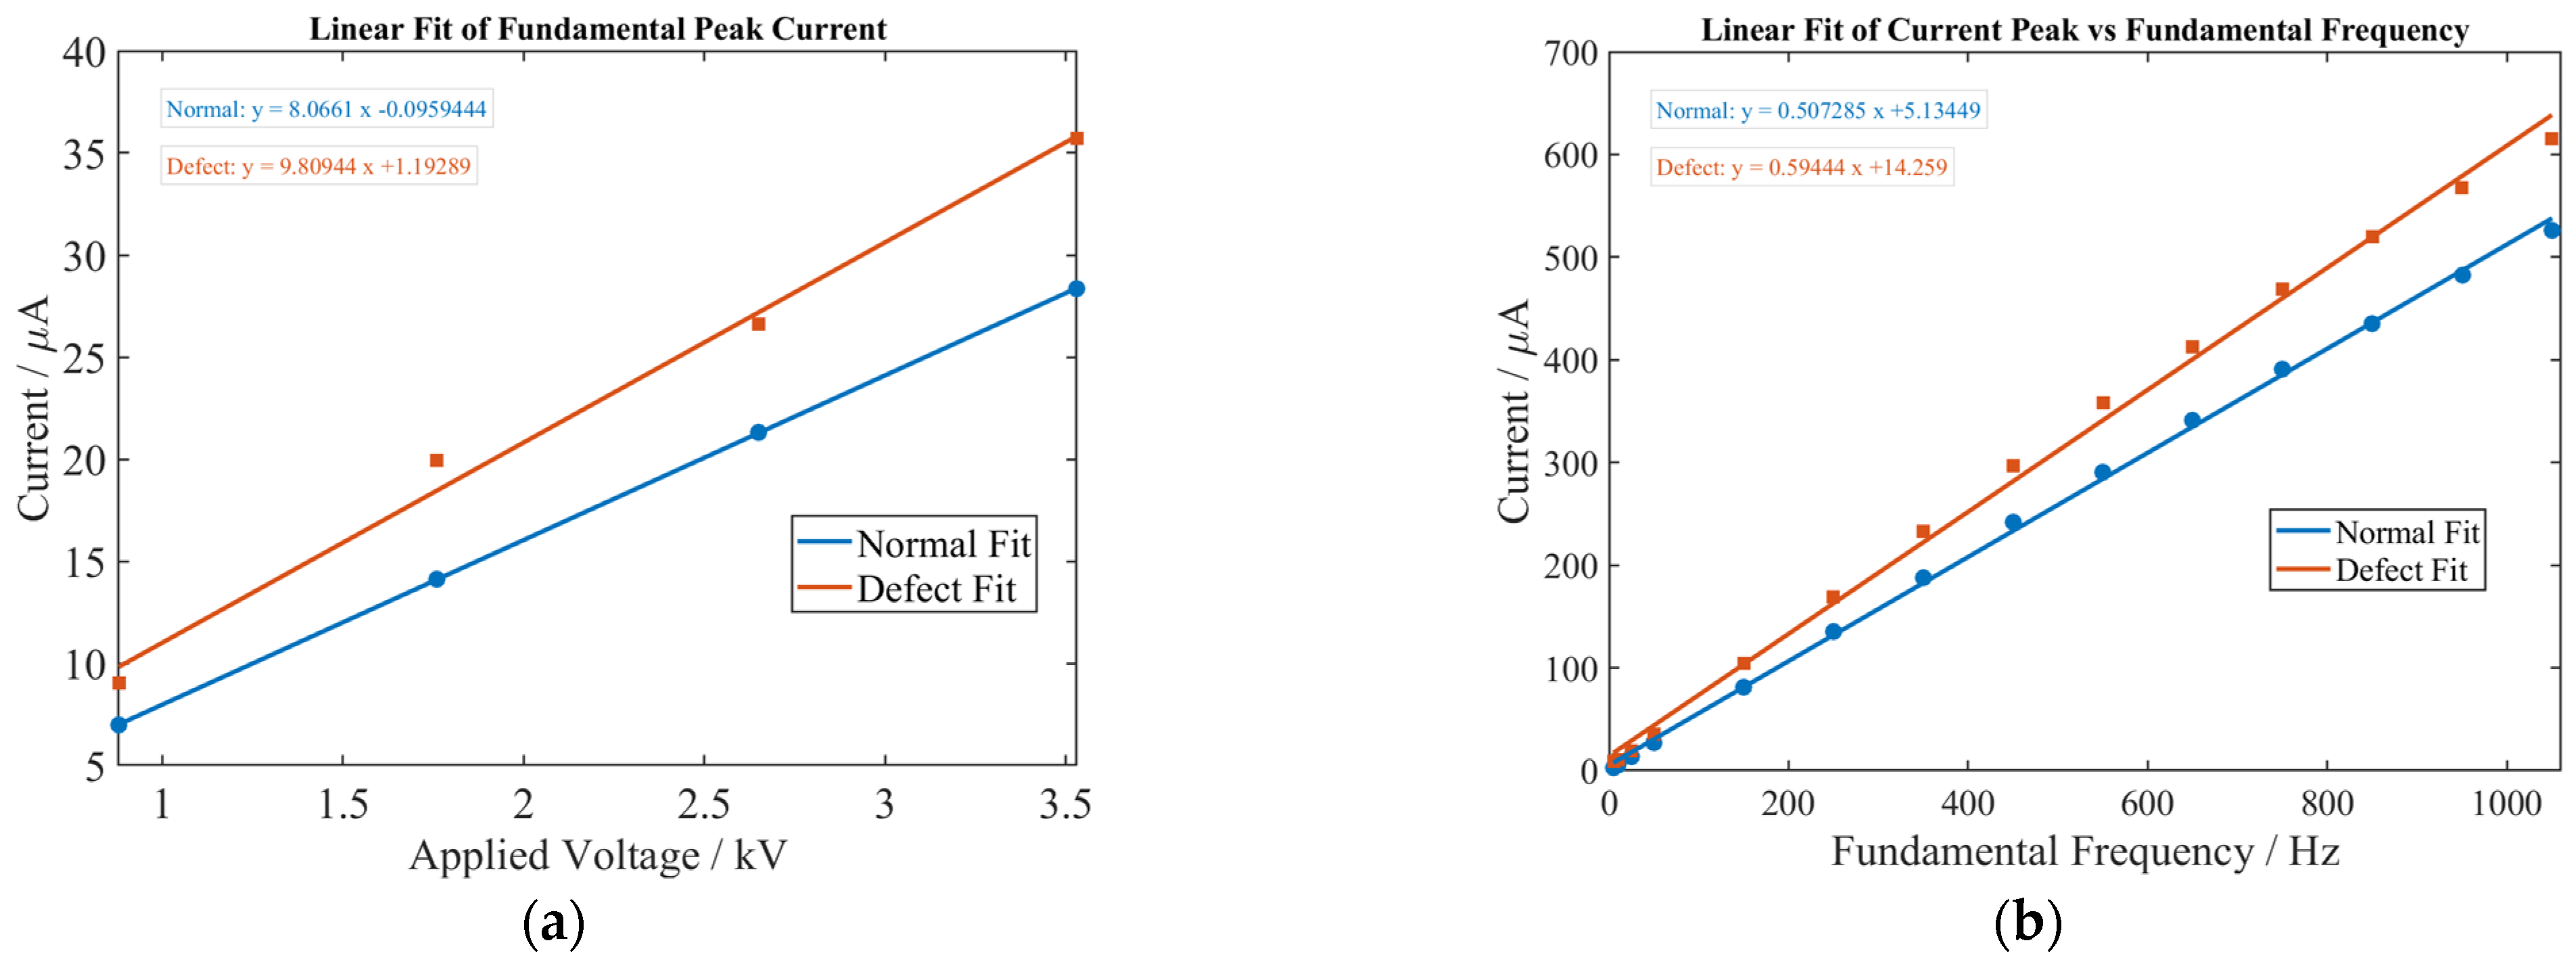
The peak current values under different voltage amplitudes and frequencies were fitted into two sets of curves for comparative analysis, as shown in Figure 6. It can be observed that, for both normal and moisture-affected buffer layers, the peak leakage current increases with increasing voltage level, exhibiting an approximately linear relationship, as expressed in Equation (1). In addition, the peak leakage current also increases with frequency [17], and an approximately linear relationship is likewise observed, as expressed in Equation (2):
where x denotes the voltage level and y denotes the peak leakage current.
where f denotes the voltage frequency and y denotes the peak leakage current.
Figure 6.
Fitted curves of current peak values. (a) Different voltage levels. (b) Different frequencies.
In the tests with a normal buffer layer, as the voltage increased from 0.88 kV to 3.53 kV, the peak leakage current increased from 7 μA to 28 μA, corresponding to an approximately fourfold increase. Similarly, in the tests with a moisture-affected buffer layer, the peak leakage current increased from 9 μA to 35.7 μA, also by nearly four times. However, the leakage current signals of the moisture-affected buffer layer were generally higher than those of the normal buffer layer, with an increase of 20–30%. Moreover, at different frequencies, the leakage current signals of the moisture-affected buffer layer were also consistently enhanced compared with those of the normal buffer layer, by approximately 15–30%.
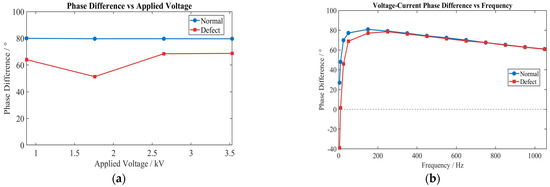
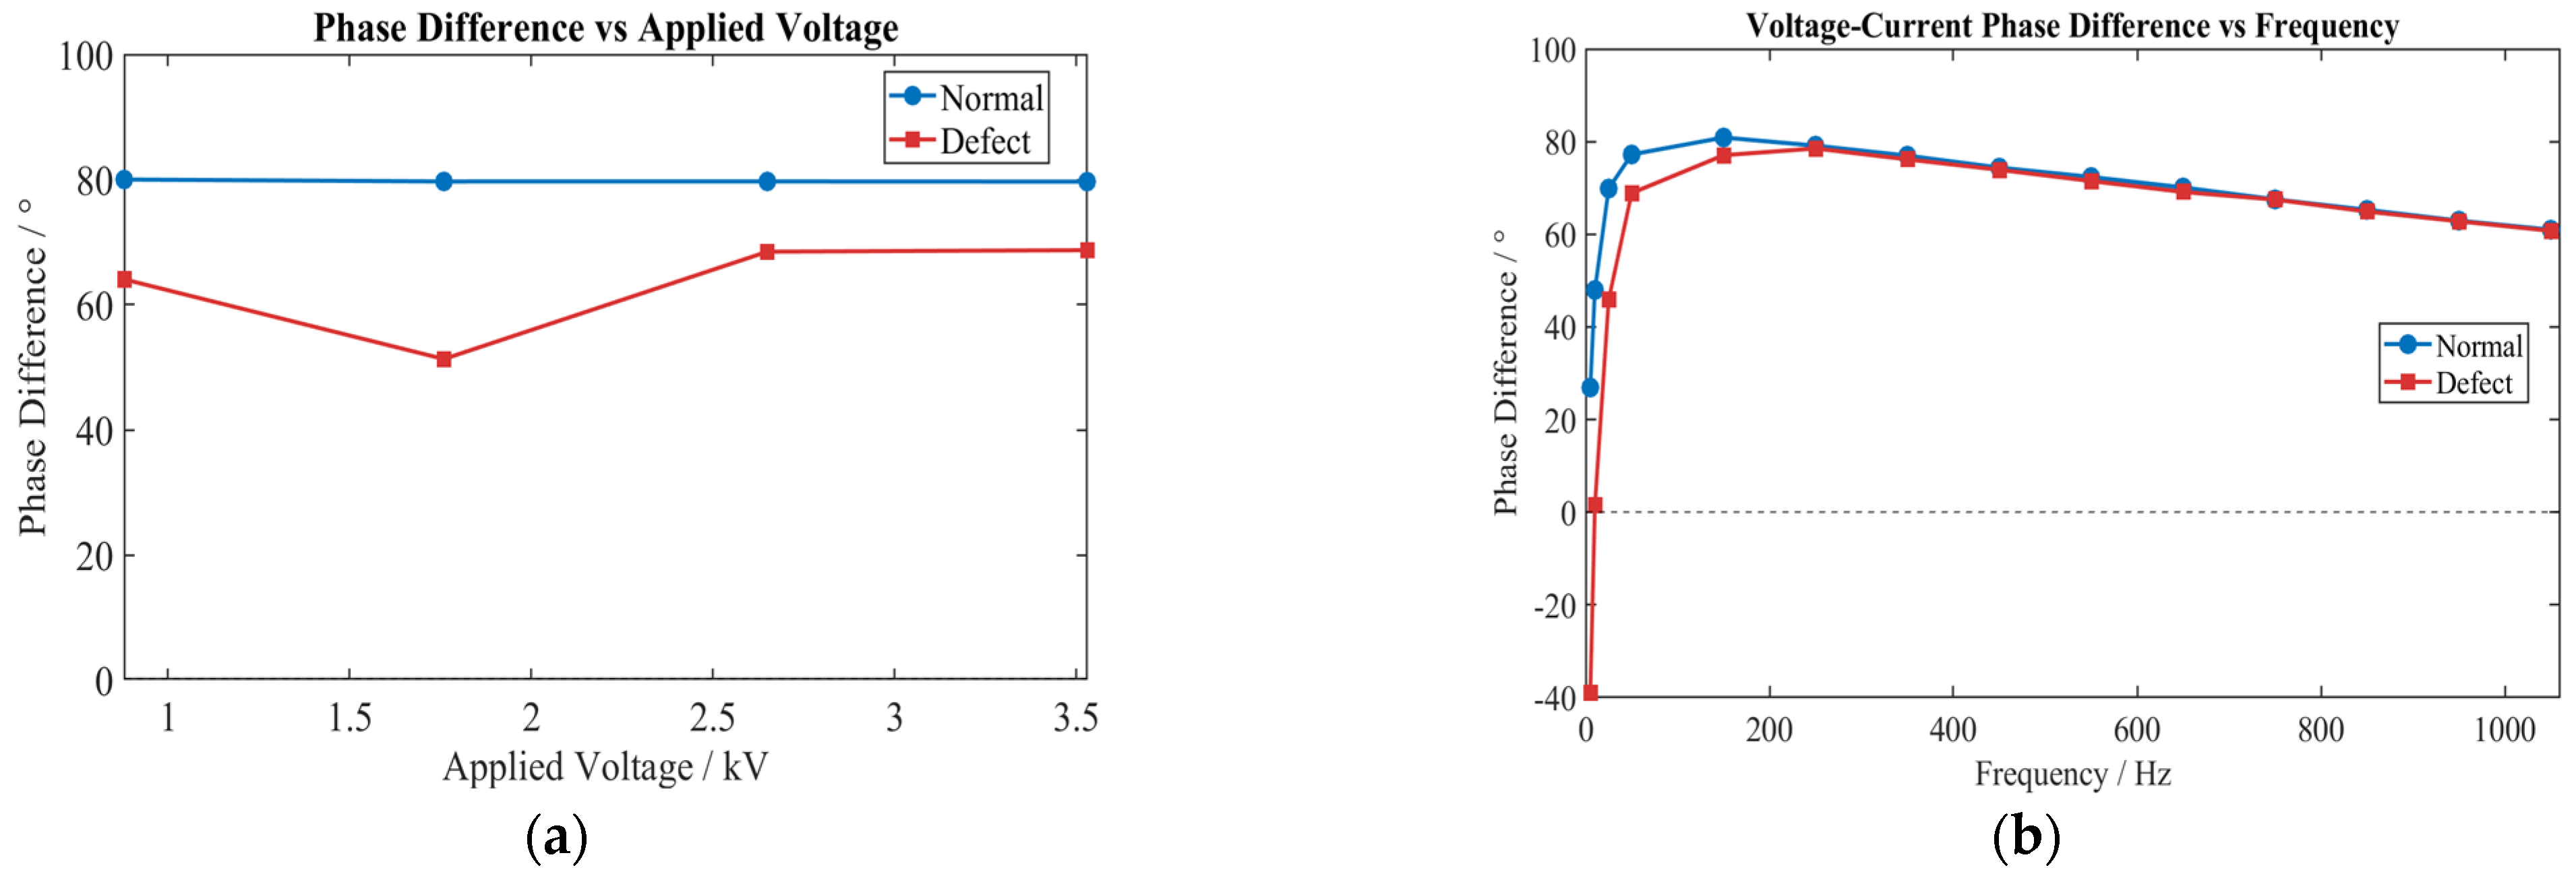
The voltage–current phase differences at different voltage levels and frequencies were also comparatively analyzed, as shown in Figure 7. The results indicate that the voltage level is essentially independent of the voltage–current phase angle difference. However, when the buffer layer is moisture-affected, the phase angle difference decreases consistently at all voltage levels, with a reduction of approximately 20%. In contrast, the voltage frequency markedly affects the phase difference. Under both conditions, the voltage–current phase difference first increases and then decreases with increasing frequency, reaching a maximum at 150 Hz and stabilizing at approximately 80°. Table 1, presents the difference in phase angle between the two conditions. It can be seen that, when the buffer layer is moisture-affected and the applied voltage frequency is below 50 Hz, the lower the frequency, the more rapidly the phase difference decreases. The phase angle difference between the two conditions increases from 9° at 50 Hz to 64° at 5 Hz.
Figure 7.
Phase difference curves. (a) Different voltage levels. (b) Different frequencies.
Table 1.
Phase difference deviations at low frequencies.
The observed decrease in voltage–current phase difference under moisture-affected defects, particularly at low frequencies, can be attributed to the increase in the resistive current component caused by water ingress. Under normal conditions, the buffer layer behaves as a lossy dielectric with a capacitive-dominated response. The leakage current consists primarily of capacitive current, which leads the voltage by 90°, and a small resistive component, which is in phase with the voltage. The resulting phase difference stabilizes at approximately 80°, indicating that the capacitive component dominates.
When moisture penetrates the buffer layer, water and ions form low-resistance conductive paths, significantly increasing the conductance G and thus the resistive current [20]. Since the resistive current is in phase with the voltage, the overall phase difference shifts from 80° (capacitive-dominated) toward 0° (resistive-dominated).
The frequency dependence of the phase shift arises from the interfacial polarization [21]. At low frequencies (≤50 Hz), interfacial polarization processes (particularly at moisture channels and fiber-matrix interfaces) have sufficient time to develop fully, resulting in enhanced conductivity and a pronounced increase in resistive current. Consequently, the phase difference decreases sharply.
3.2. Testing and Analysis of XLPE/Ablated Buffer Layer
3.2.1. Testing of XLPE/Ablated Buffer Layer
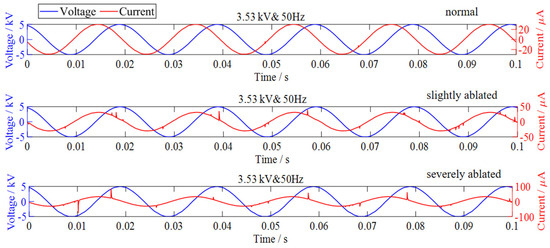
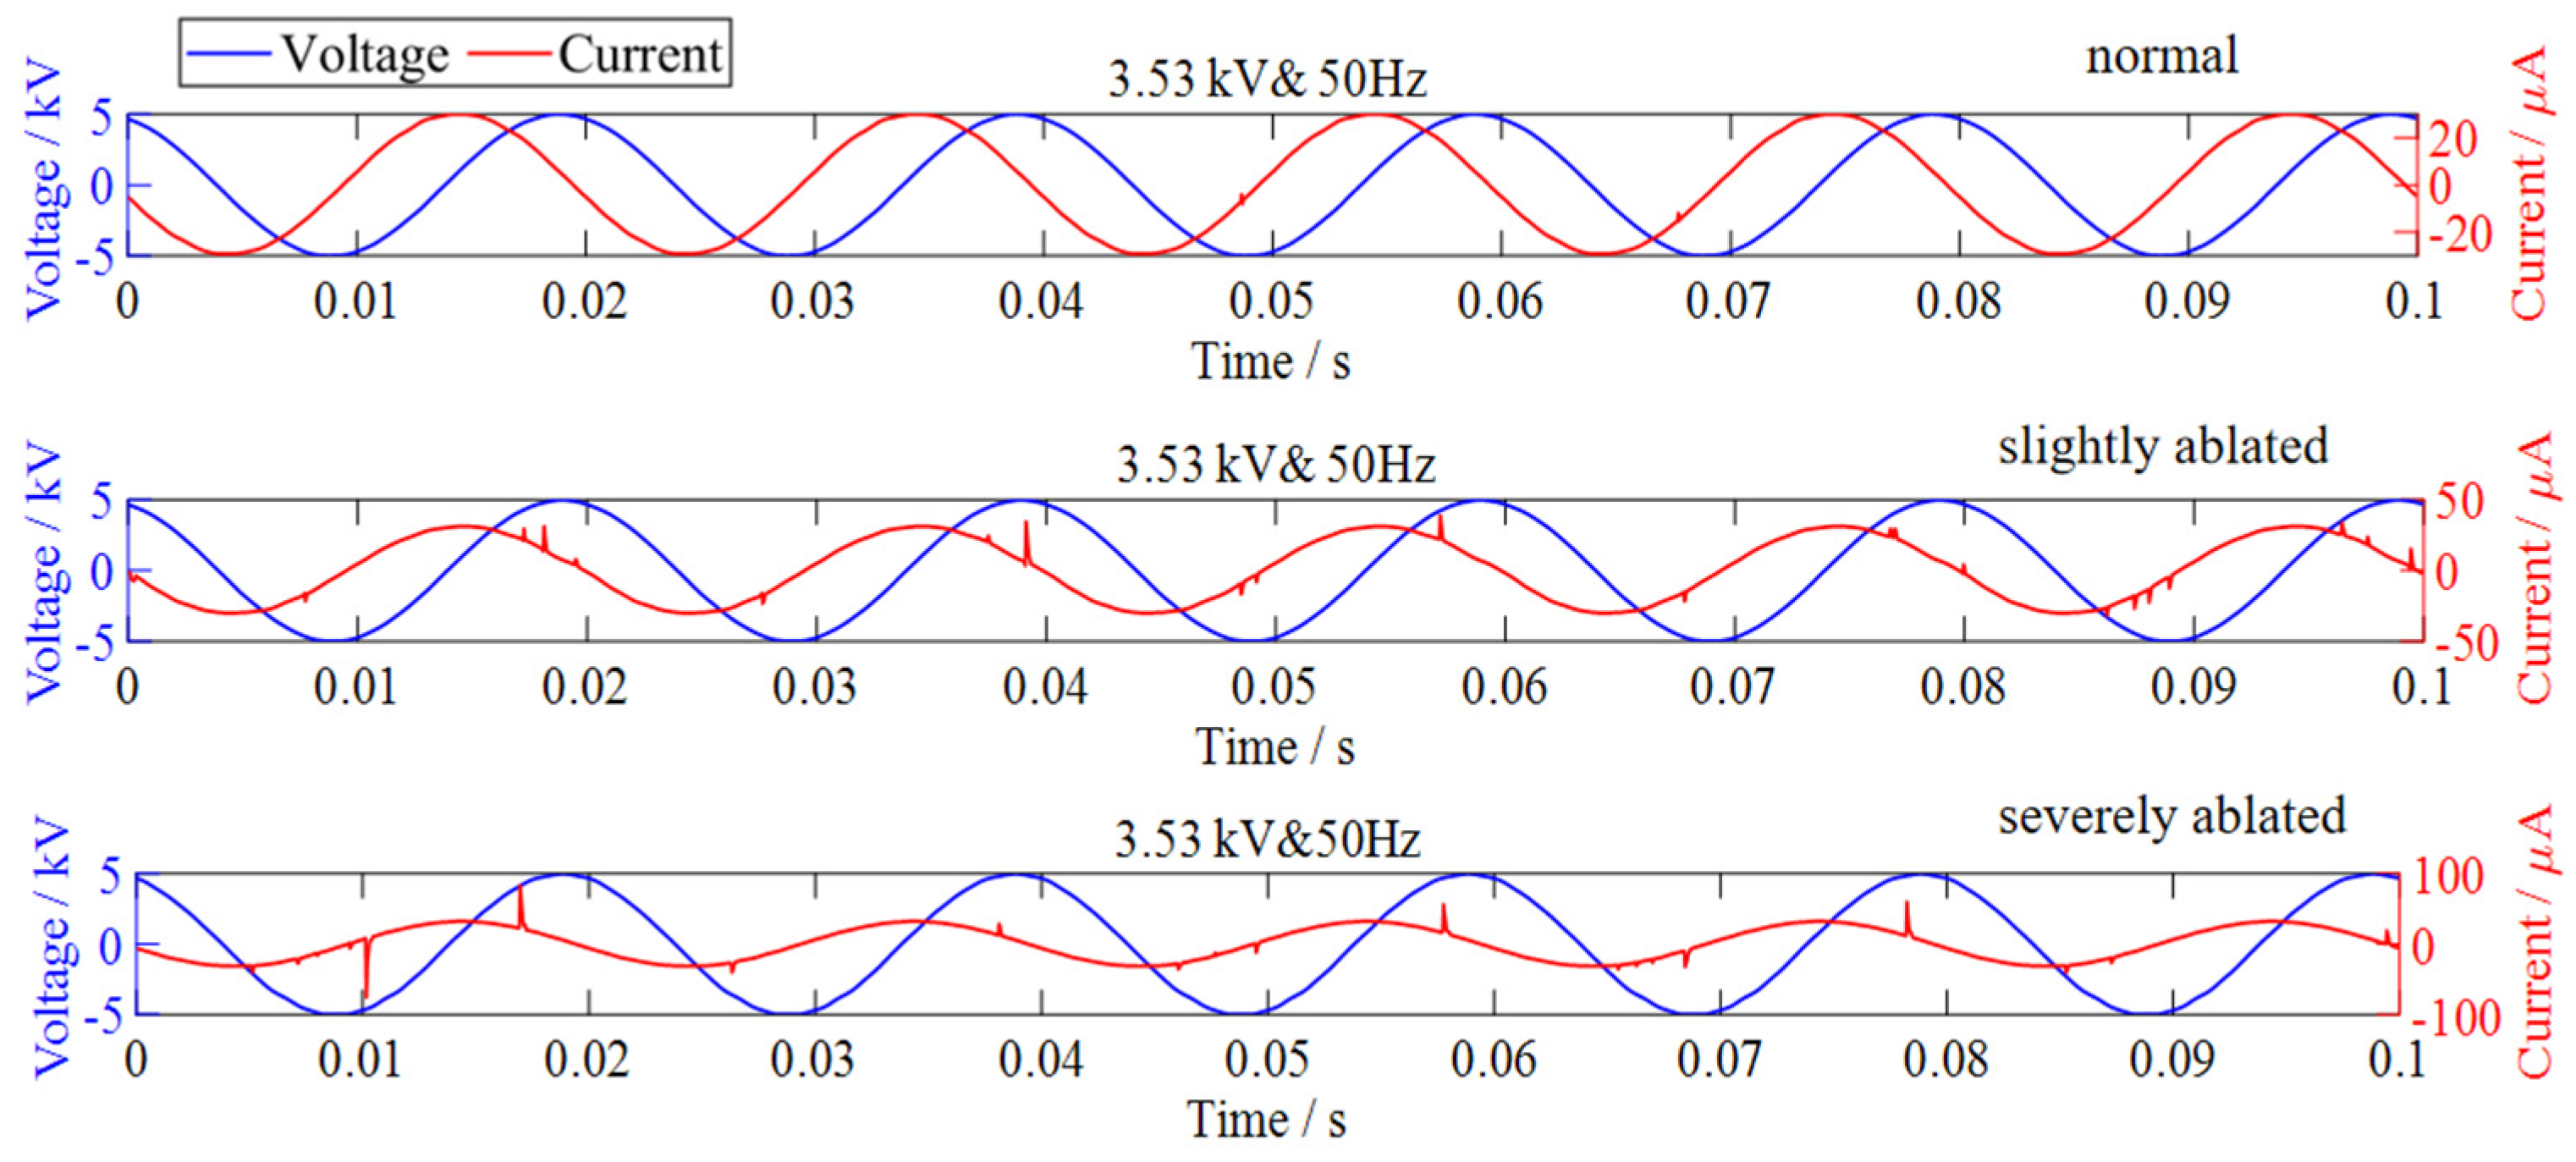
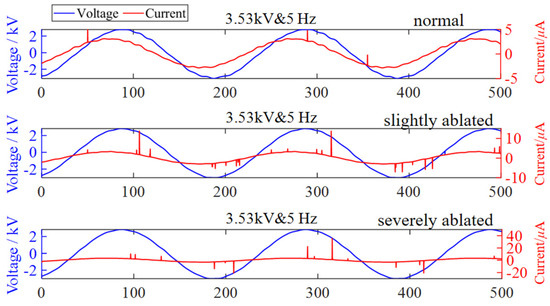
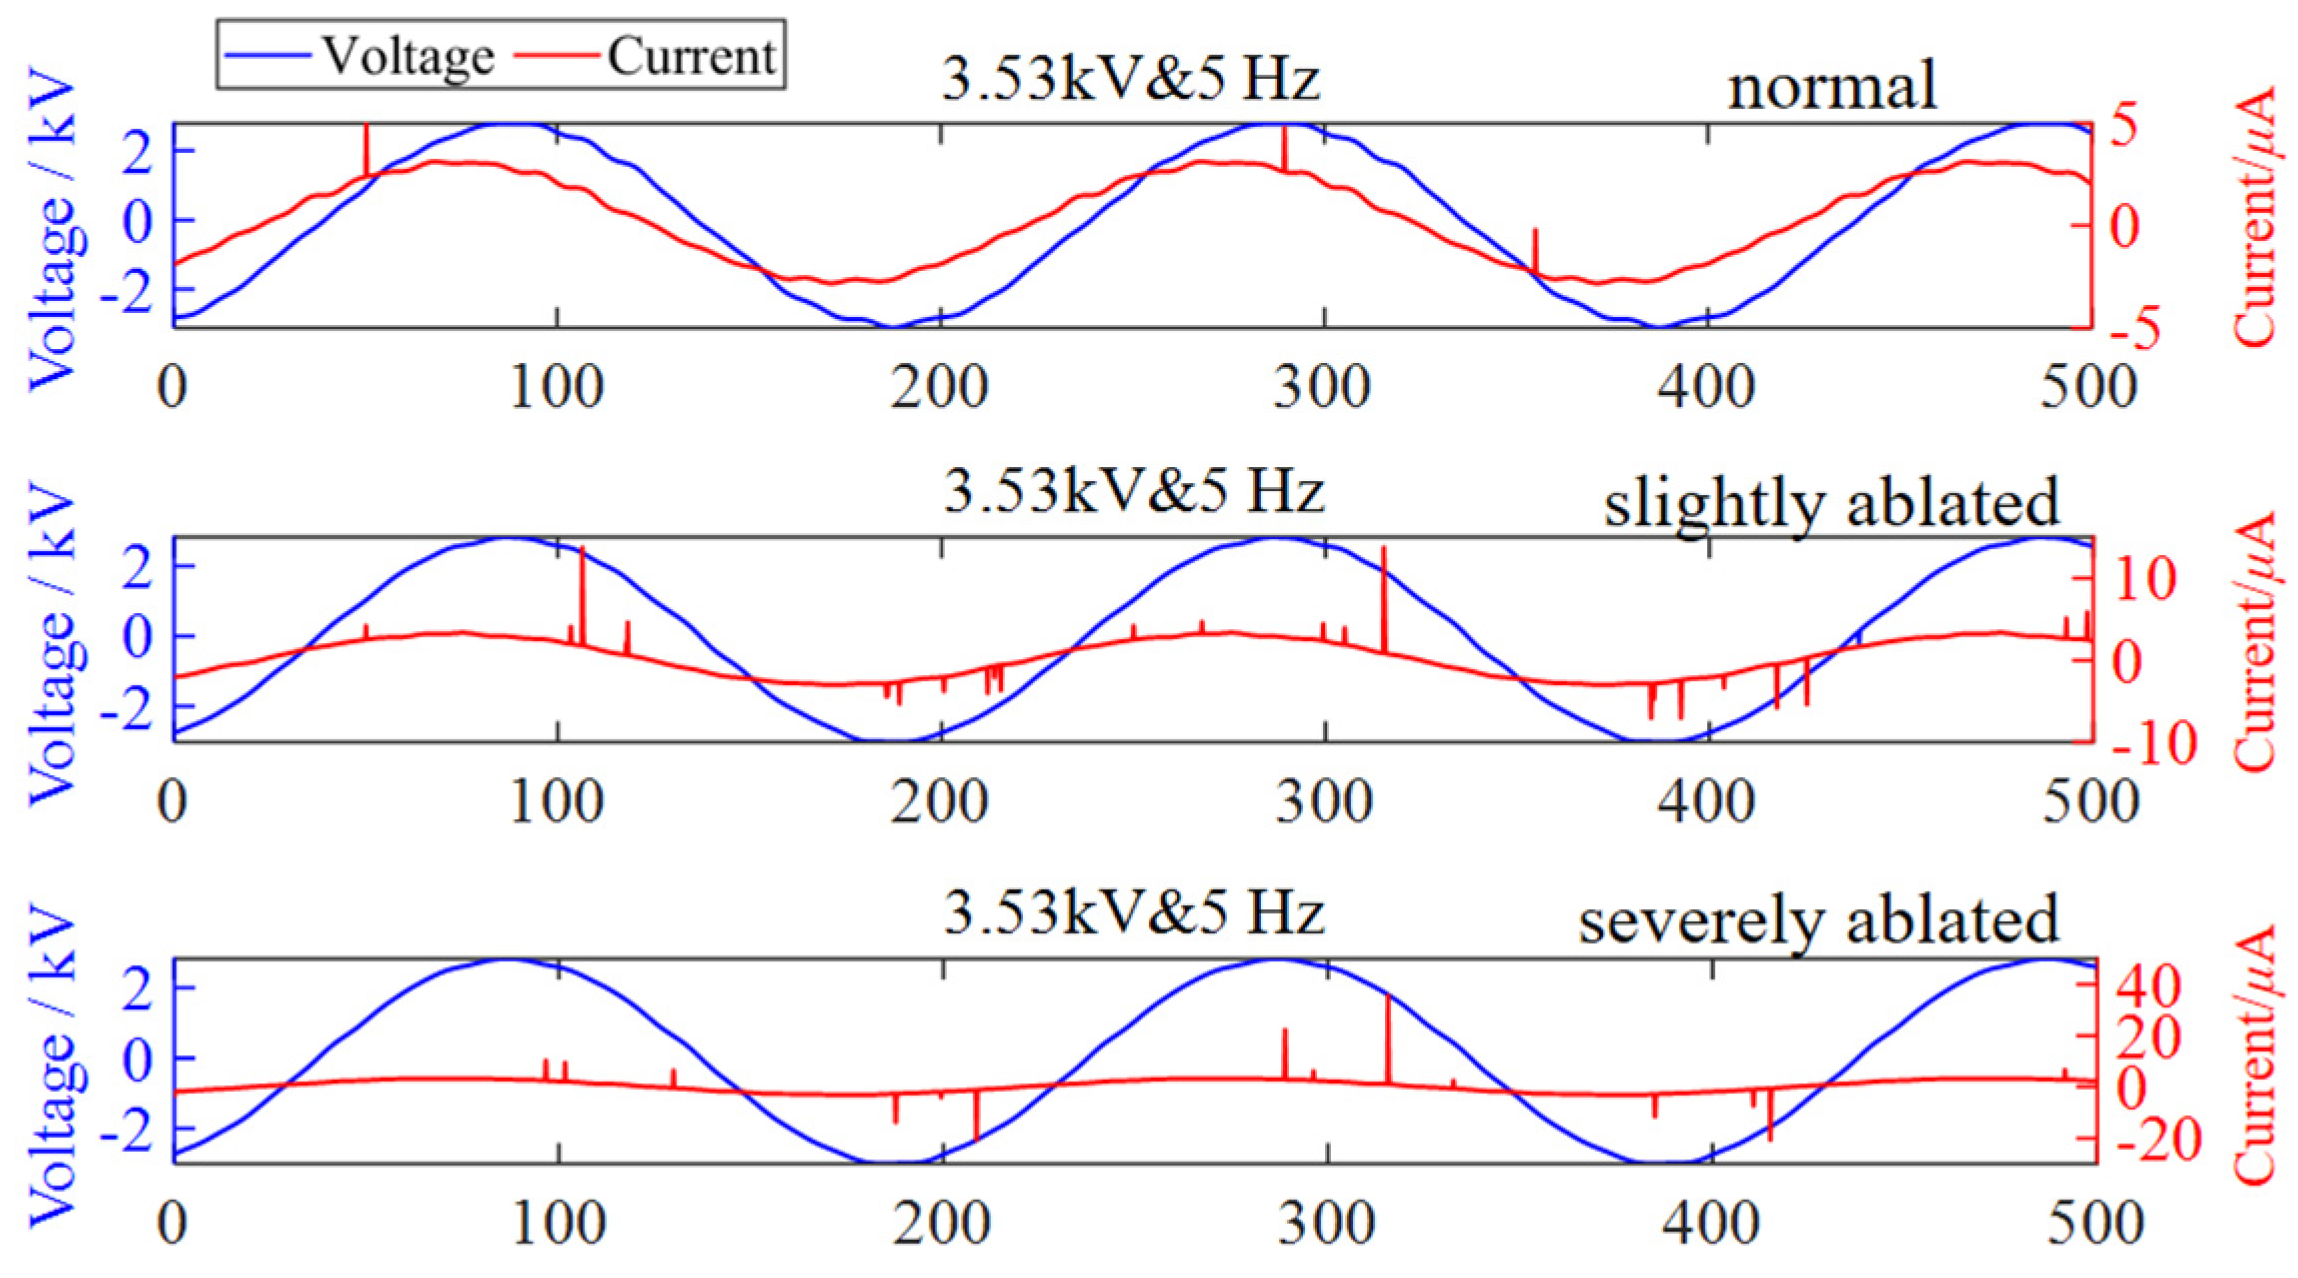
Voltage excitations with different amplitudes (0.88, 1.76, 2.65 and 3.53 kV) at power frequency and different frequencies (5, 10, 25, 50, 150, 250, 350, 450, 550, 650, 750, 850, 950, and 1050 Hz) at the same amplitude were applied to XLPE buffer layers in normal, slightly ablated, and severely ablated conditions, respectively. Figure 8 shows the voltage–current waveforms under a 3.53 kV voltage excitation at power frequency, while Figure 9 shows the voltage–current waveforms under a 5 Hz voltage excitation at the same amplitude (3.53 kV).
Figure 8.
Voltage–current waveforms under the 3.53 kV voltage excitation at power frequency.
Figure 9.
Voltage–current waveforms for a 5 Hz voltage excitation at 3.53 kV.
3.2.2. Results Analysis of XLPE/Ablated Buffer Layer
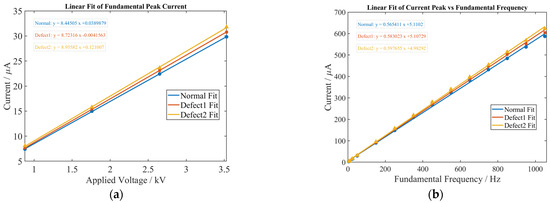
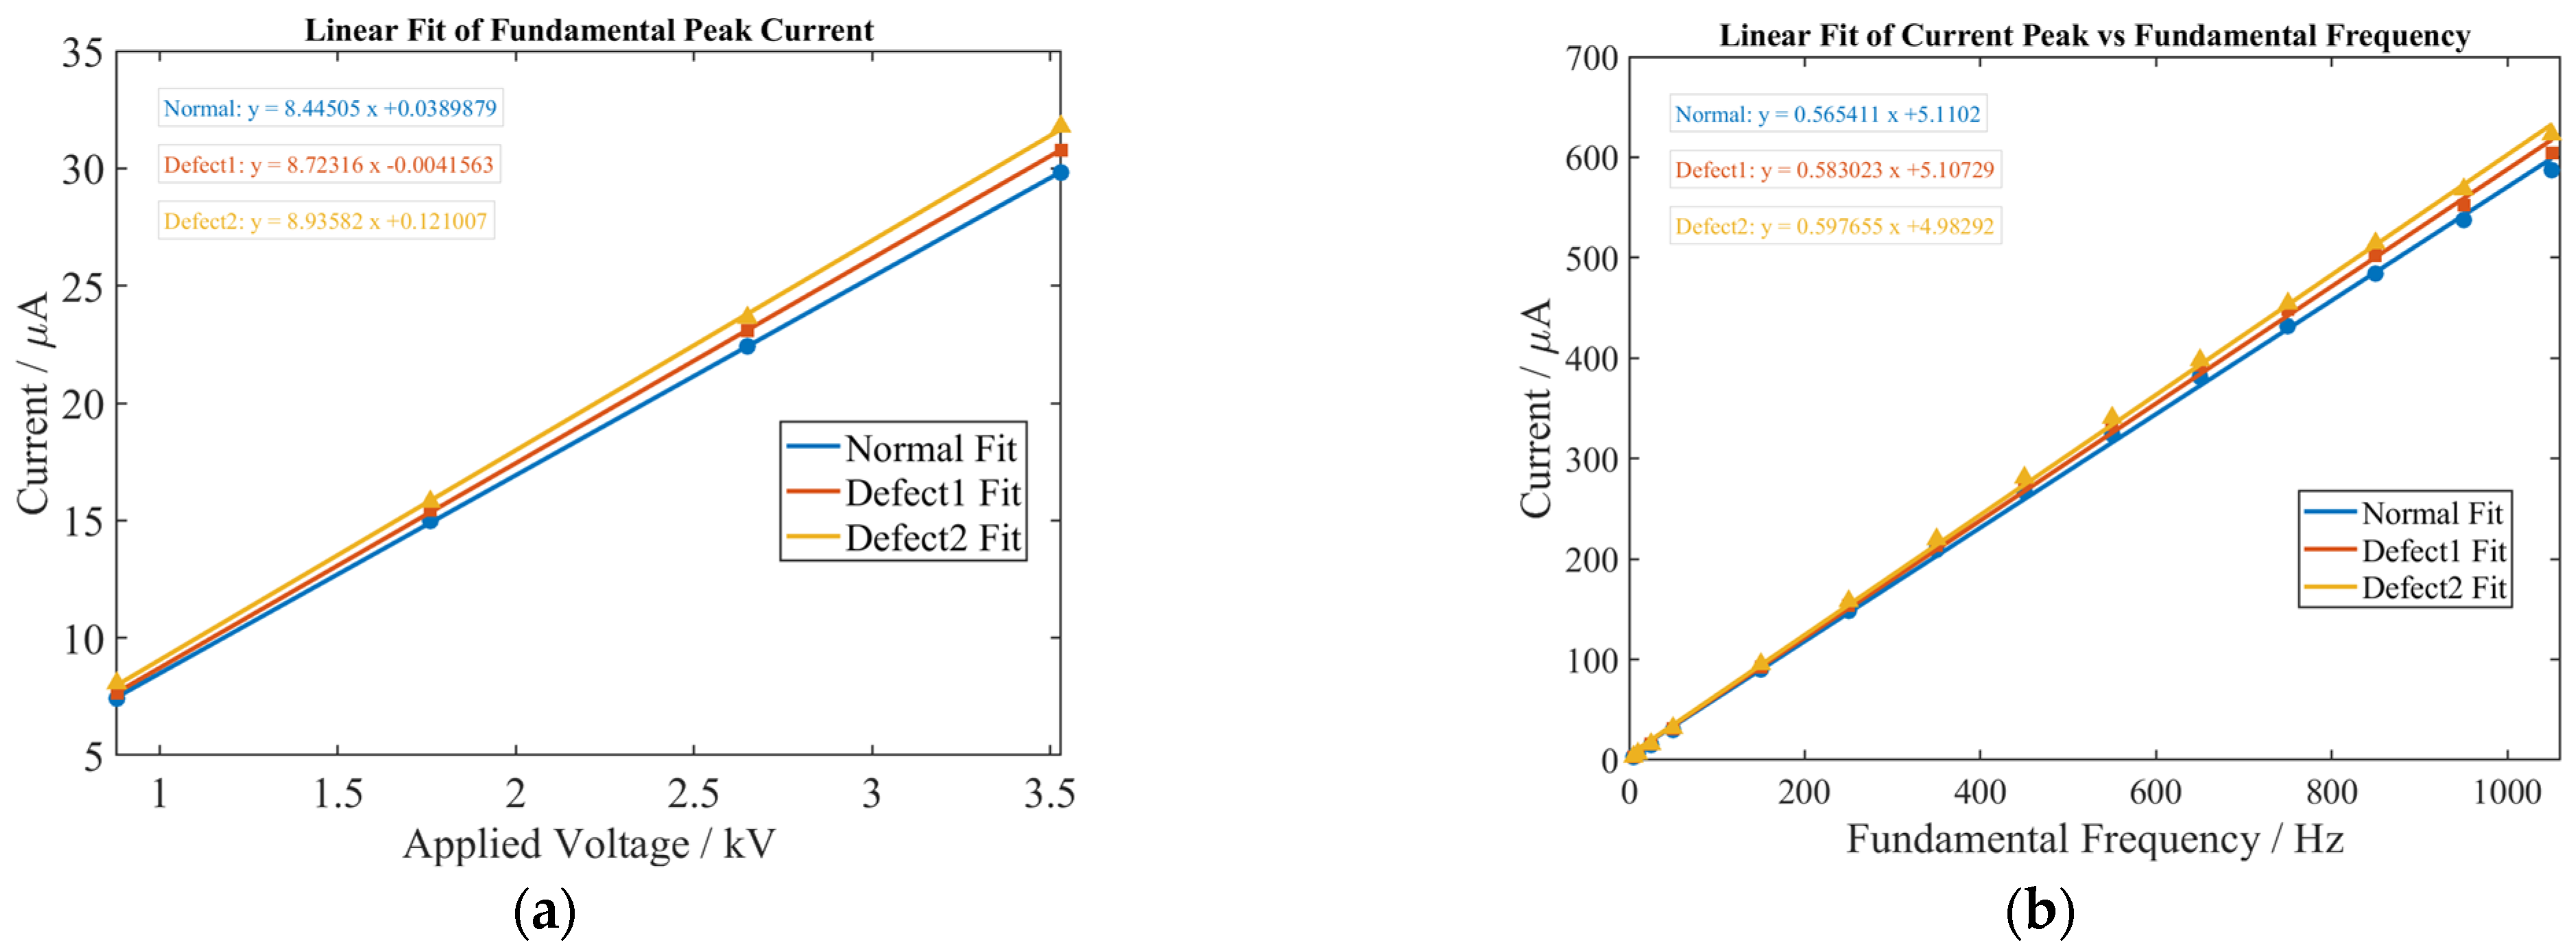
The peak current values at different voltage levels and frequencies were fitted into two sets of curves for comparative analysis, as shown in Figure 10. Similarly, the leakage current peak increases with increasing voltage level, exhibiting an approximately linear relationship, as expressed in Equation (3). The leakage current peak also increases with increasing voltage frequency, as given in Equation (4). When slight or severe ablation occurs in the buffer layer, the peak current increases marginally.
where x denotes the voltage level and y denotes the peak leakage current.
where f denotes the voltage frequency and y denotes the peak leakage current.
Figure 10.
Fitted curves of current peak values. (a) Different voltage levels. (b) Different frequencies.
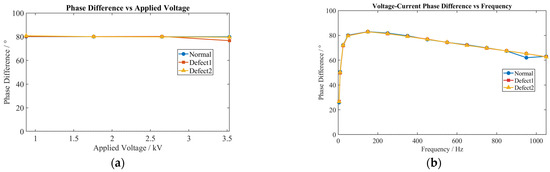
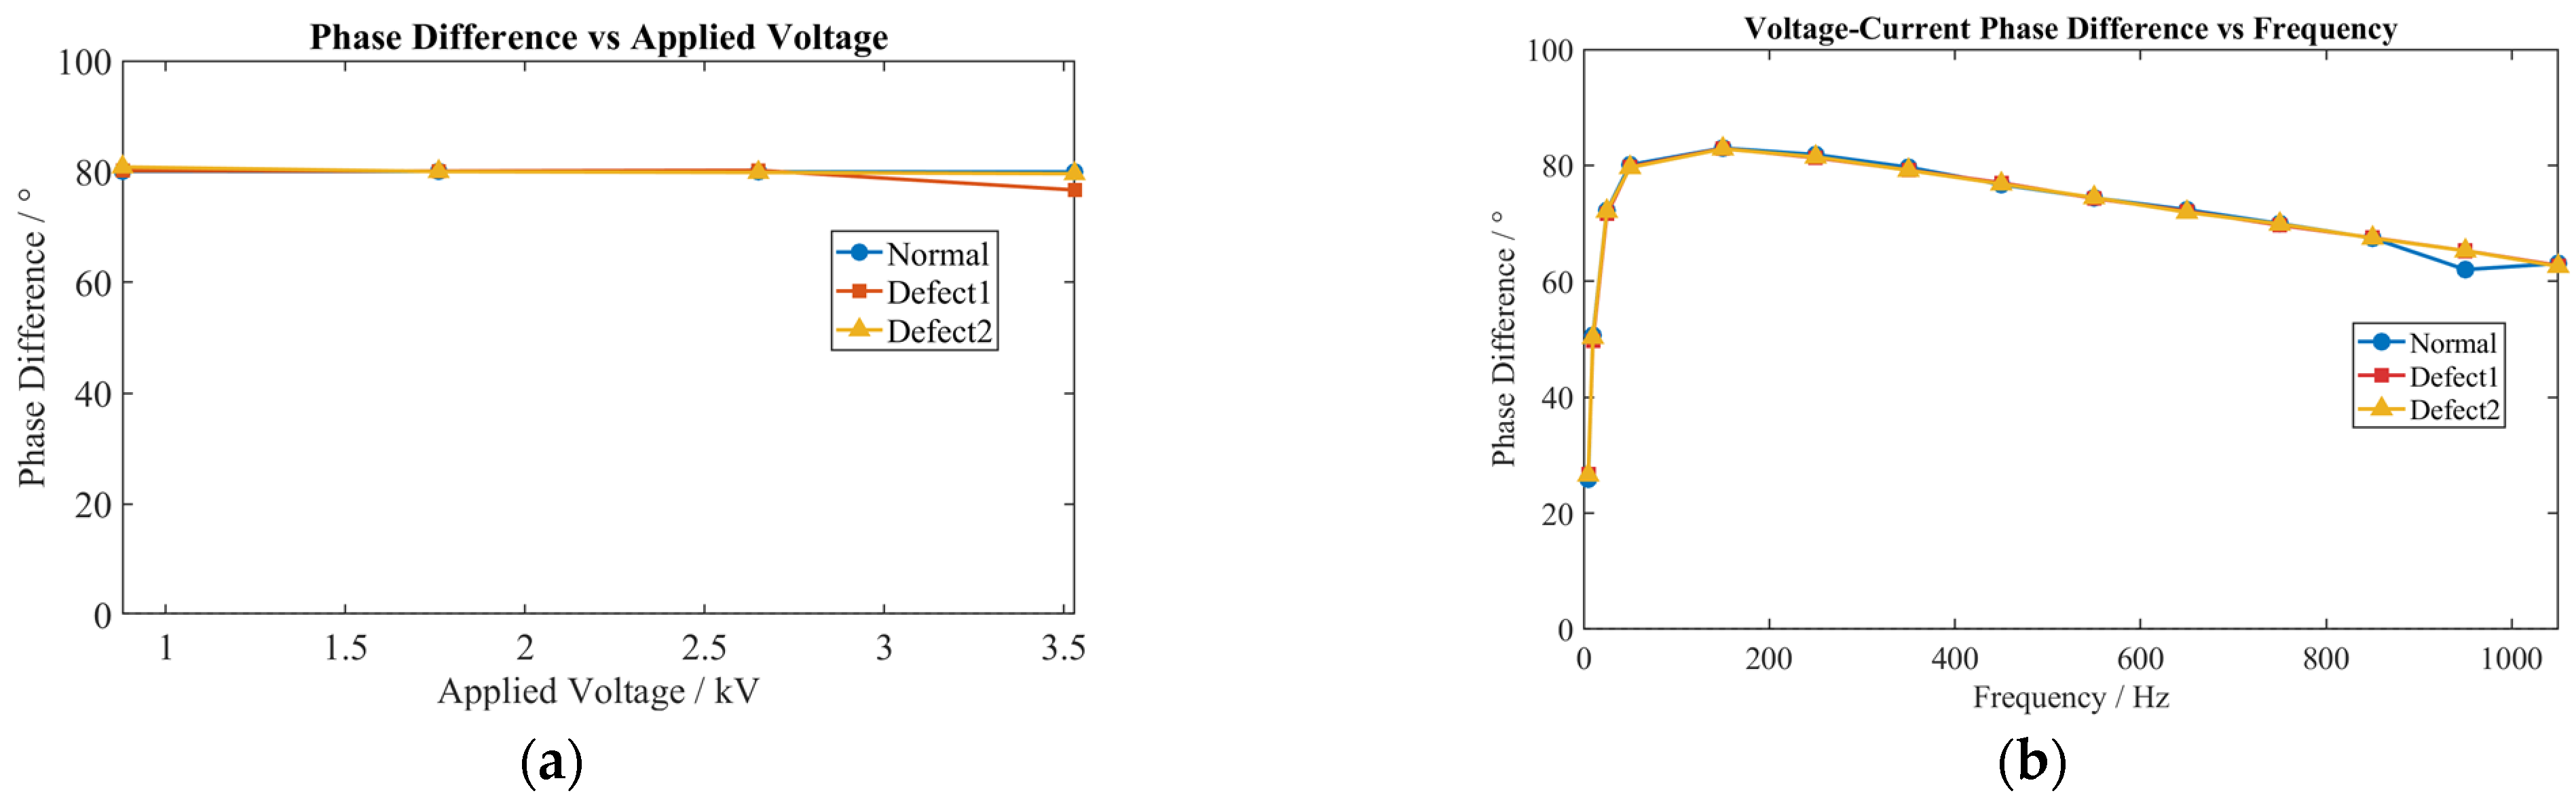
The voltage–current phase differences at different voltage levels and frequencies were also compared, as shown in Figure 11. The results indicate that the voltage level has negligible influence on the voltage–current phase difference, whereas the voltage frequency significantly affects its variation. Under all three conditions, the voltage–current phase difference first increases and then decreases with frequency, reaching a maximum at 150 Hz and stabilizing at approximately 80°. Meanwhile, the phase difference curves under the three conditions remain essentially consistent, indicating that ablation defects have little effect on the voltage–current phase difference.
Figure 11.
Phase difference curves. (a) Different voltage levels. (b) Different frequencies.
In contrast to moisture-affected defects, the effect of ablation defects on the voltage–current phase difference is negligible, as shown in Figure 11. The phase difference curves under normal, slight ablation, and severe ablation conditions remain essentially consistent across all frequencies, stabilizing at approximately 80° in the mid-frequency range. This behavior indicates that ablation does not significantly alter the resistive–capacitive balance of the buffer layer.
Ablation causes localized structural damage (white powder, surface roughness) but does not create distributed conductive paths as moisture does [20]. The white powder formed by the moisture–metal reaction is typically concentrated in isolated areas with high resistivity [20]. Therefore, ablation does not significantly increase the conductive or resistive current components; the leakage current remains capacitance-dominated, and the phase difference remains close to 80°.
4. Buffer Layer Condition Identification Based on Harmonic and Residual Spike Features
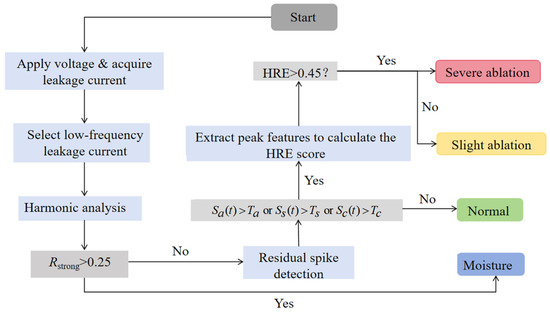
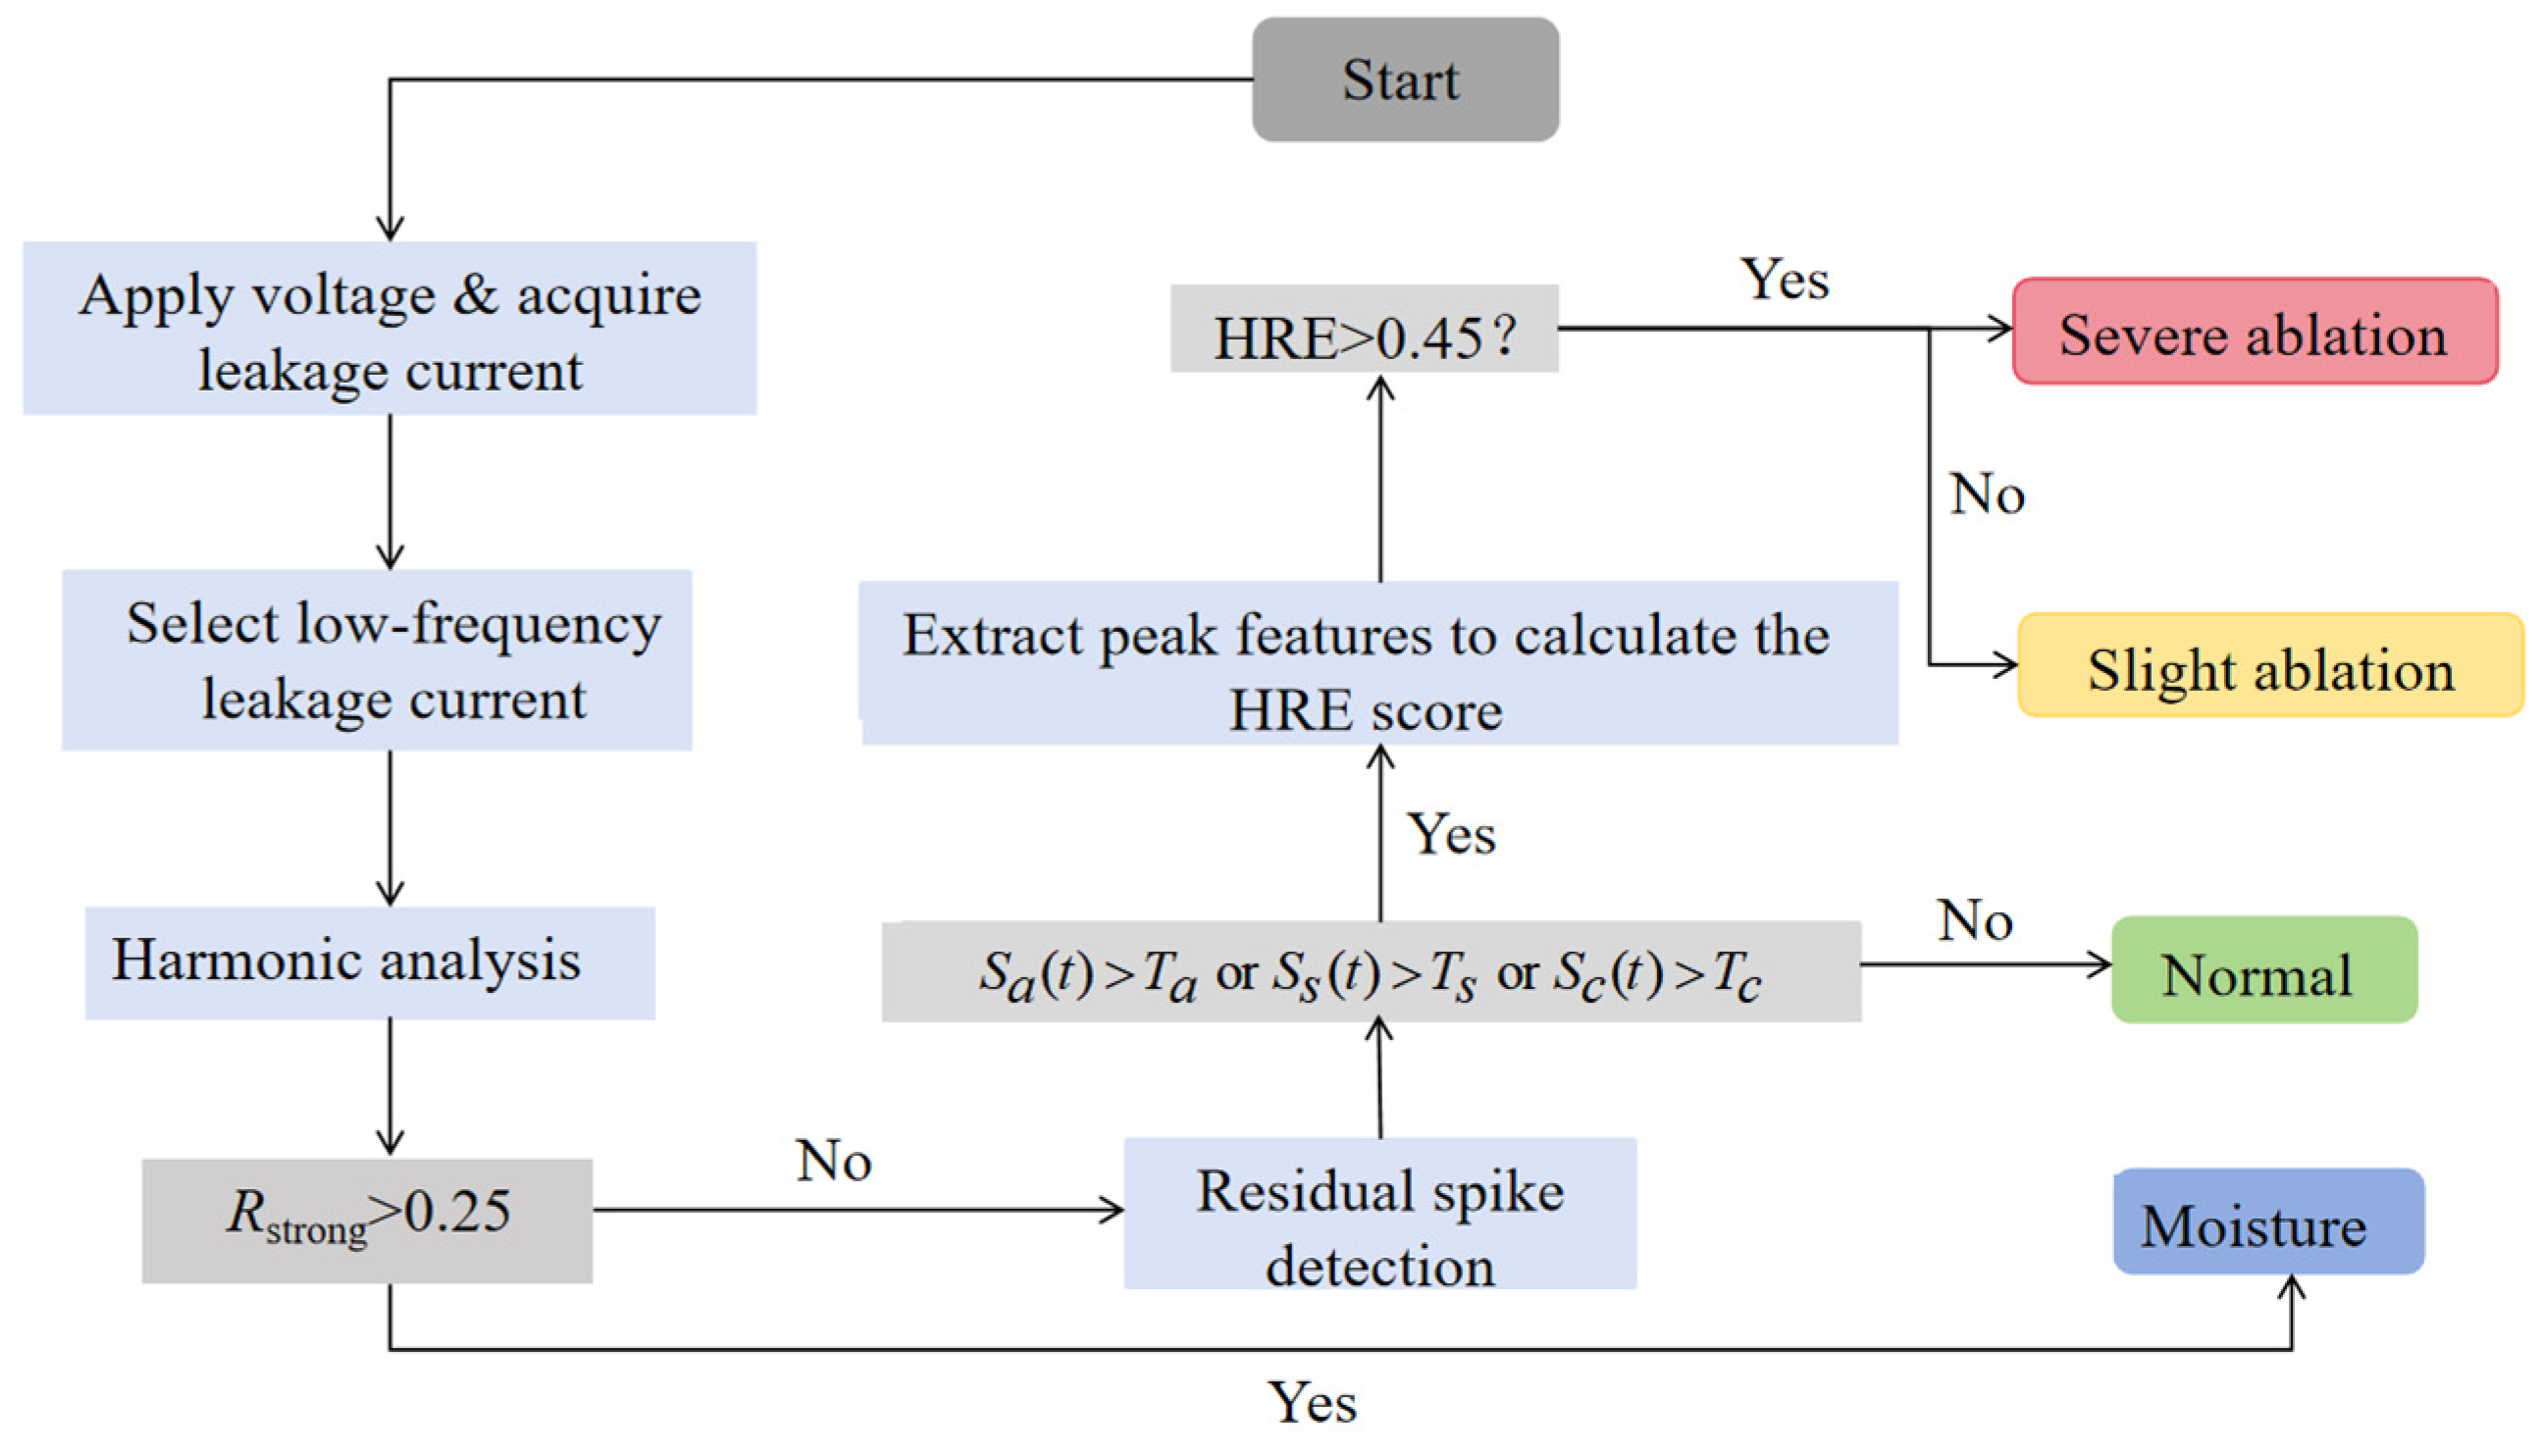
This paper proposes a buffer layer state identification method that combines low-frequency leakage current harmonic features with residual spike features. By exploiting the different manifestations of moisture-affected defects and ablation in leakage current signals, the proposed method identifies four buffer layer states—normal, moisture-affected, slightly ablated, and severely ablated—through a staged decision process. The flowchart is shown in Figure 12. and the detailed procedure is as follows:
Figure 12.
Flowchart of buffer layer state identification.
- (1)
- Voltage application and leakage current acquisition. The specimen is first energized under power-frequency voltage, and the voltage is gradually increased to a level close to the operating electric field to ensure a stable operating state. Subsequently, at the final voltage level, voltages with different frequencies are applied, and the corresponding leakage current signals are acquired.
- (2)
- Harmonic analysis of low-frequency leakage current. Low-frequency (≤50 Hz) leakage current signals are selected for total harmonic distortion analysis, and the strong harmonic response ratio Rstrong is calculated. When Rstrong > 0.25, this indicates that the low-frequency leakage current exhibits pronounced overall harmonic characteristics. In this case, the buffer layer is determined to be moisture-affected.
- (3)
- Residual spike detection. If Rstrong ≤ 0.25, the sample is considered to lack overall harmonic characteristics. In this case, the waveform must be further examined for local spike anomalies. If Sa(t) > Ta or Ss(t) > Ts or Sc(t) > Tc are not satisfied, this indicates that no spikes were detected, and the sample can be normal.
- (4)
- Ablation identification based on spike events. If spike events are detected in the residual signal, the buffer layer is considered to have ablation defects. Unlike moisture-affected defects, ablation generally does not continuously alter the overall harmonic structure; instead, it is mainly manifested as local abrupt changes or transient spikes. Therefore, spike features must be further extracted to evaluate the ablation severity.
- (5)
- Assessment of ablation severity. For samples determined to have ablation, features such as peak density, energy ratio, maximum score, and maximum peak amplitude are first extracted. An HRE score is then calculated based on these features. If the HRE score is greater than 0.45, the ablation is classified as severe. If the HRE score is no more than or equal to 0.45, it is classified as slight ablation.
Under low-frequency voltage excitation, abnormalities in the buffer layer are more likely to induce distortion or localized anomalous variations in the leakage current waveform. Moisture ingress typically alters the low-order harmonic components. But relying solely on harmonic and peak features makes it difficult to determine whether ablation has occurred in the buffer layer. It is necessary to further extract local spike features from the leakage current signal to identify whether ablation has occurred and to assess its severity.
4.1. Harmonic Analysis of Leakage Current in the Moisture-Affected Buffer Layer
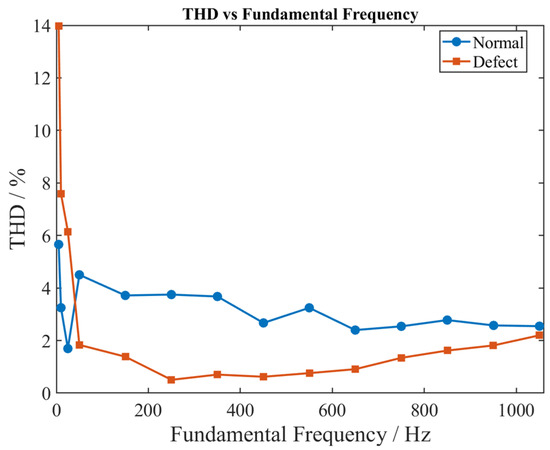
Harmonic analysis was performed on the leakage current under multi-frequency excitation. Figure 13. shows the variation in total harmonic distortion at different frequencies under the two conditions. Under high-frequency excitation, the total harmonic distortion remains essentially stable at approximately 2–3% for both the normal and moisture-affected buffer layers. Under low-frequency excitation, however, the total harmonic distortion of the moisture-affected buffer layer increases as the frequency decreases. When the frequency decreases from 50 Hz to 5 Hz, the total harmonic distortion increases from 2% to 14%. Compared with the normal buffer layer at the same frequencies, the total harmonic distortion at low frequencies increases by 4% at 25 Hz, 4.9% at 10 Hz, and 8.2% at 5 Hz.
Figure 13.
Total harmonic distortion diagram.
The observed low-frequency harmonic enhancement under moisture can be attributed to nonlinear conduction and polarization introduced by water ingress. Under normal conditions, the buffer layer behaves as a resistor–capacitor network, and the current waveform closely follows the applied voltage, resulting in low total harmonic distortion. When moisture penetrates the buffer layer, interfacial polarization at moisture channels exhibits nonlinear dependence [20]. At low frequencies (5–50 Hz), polarization processes have sufficient time to develop, and their nonlinear response generates harmonic distortion, with THD increasing from 2% (normal) to 14% (moisture-affected) at 5 Hz. At high frequencies, polarization cannot follow the rapid field variation, and THD remains low, similar to the normal state [21].
Table 2 presents the harmonic contents at different frequencies under the two conditions. As shown, the harmonic contents at the corresponding frequencies are generally higher in the moisture-affected state than in the normal state, indicating that moisture enhances the nonlinear distortion of the current waveform. In particular, at 5 Hz, the 2nd, 3rd, 4th, 6th, 7th, and 8th harmonics increase markedly, with the 3rd harmonic showing the most pronounced change, rising from 4.284% to 11.44%. At 10 Hz, the 3rd, 5th, 6th, 7th, and 9th harmonics increase substantially under the moisture-affected condition, among which the 3rd harmonic exhibits the largest increase. At 25 Hz, the 2nd, 3rd, 4th, 5th, and 7th harmonics are also significantly higher than those in the normal state. Overall, after moisture exposure, the harmonics—particularly the 3rd, 5th, and 7th harmonics—exhibit strong sensitivity across different frequencies.
Table 2.
Harmonic content of each order.
The dominance of odd-order harmonics is characteristic of symmetric non-linearity, where the current distortion is symmetric with respect to positive and negative voltage half-cycles [22]. The 3rd harmonic shows the strongest sensitivity, increasing from 4.28% to 11.44% at 5 Hz. The 5th and 7th harmonics also increase significantly. Even-order harmonics (2nd, 4th, 6th, 8th) appear only weakly and inconsistently, indicating that the nonlinearity is predominantly symmetric. This frequency-dependent harmonic behavior confirms that moisture-induced distortion is dominated by low-frequency electrochemical processes rather than high-frequency dielectric effects [23].
At the same time, samples with frequencies no higher than 50 Hz are selected to form a low-frequency sample set, and the strong low-frequency harmonic response ratio, Rstrong, is calculated:
In the equation, qm represents the leakage current at a single frequency, and DL represents the THDm of leakage current for one specific defect across multiple frequencies.
From Equation (5), we obtain: Rstrong [moisture-affected, slight ablation, severe ablation] = [0.75, 0, 0]. Therefore, 0.25 is selected as the classification threshold to distinguish ablation and moisture-affected defects.
4.2. Spike Identification and Feature Extraction Based on Harmonic Residuals
To further analyze the local transient characteristics induced by buffer layer ablation, harmonic–residual-based spike identification is performed on the low-frequency leakage current signal. Firstly, a multi-order harmonic model is used to fit the dominant periodic components of the current signal. Local spike anomalies are then extracted from the residual signal. This procedure suppresses the influence of the fundamental and harmonic background on spike detection, thereby enhancing the local transient features. Spike points are subsequently detected based on amplitude anomalies, slope anomalies, and an integrated anomaly score. Spike events are obtained through merging and extension. Finally, features including spike density, energy ratio, maximum score, maximum spike amplitude, and the Harmonic–Residual Energy (HRE) score are extracted for the subsequent classification of ablation severity.
The acquired leakage current signal is denoted as x(t). The DC offset of the signal is first removed, yielding:
Subsequently, within the prescribed frequency search range, the dominant frequency f0 of the signal was estimated using the Fourier transform. After obtaining the initial dominant frequency, a multi-order harmonic fitting model was established [24]:
where c denotes the DC component, and Ak and φk denote the amplitude and phase of the k-th harmonic, respectively; k is the harmonic order. To avoid exceeding the Nyquist frequency, the harmonic orders actually included in the fitting must satisfy the corresponding constraint:
where Fs is the sampling frequency.
During harmonic fitting, a linear harmonic model was first used to obtain the initial parameters. Then, nonlinear least-squares optimization was further applied to refine the dominant frequency, amplitude, and phase parameters. To reduce the influence of local outliers on the fitting results, robust weights were introduced during the fitting process. Points with large residuals were assigned smaller weights, so that the harmonic background model mainly represented the periodic components of the signal and was not excessively affected by local spikes.
After harmonic fitting, the detrended signal was subtracted from the harmonic background signal to obtain the residual signal:
The residual signal mainly retains local abnormal components in the original signal that cannot be well explained by the harmonic model; therefore, it is suitable for spike detection.
In the residual-based spike identification stage, both residual amplitude anomalies and residual slope anomalies were considered. First, the median mr of the residual signal and the robust scale σr based on the median absolute deviation were calculated [25]:
where ε is a very small positive constant used to avoid division by zero. The amplitude anomaly score of each sampling point was then computed:
Using only amplitude anomalies may fail to identify local abrupt changes with rapid variations. Therefore, the first-order difference of the residual was further introduced [26]:
Its robust median mΔr and robust scale σΔr were similarly calculated:
The slope anomaly score was then obtained:
To jointly account for amplitude anomalies and rate-of-change anomalies, a composite anomaly score was constructed:
The coefficient 0.5 was used to reduce the weight of the slope term in the composite score, thereby avoiding excessive false detections caused by small local fluctuations.
Based on the above three anomaly scores, a sampling point was marked as a spike point if it satisfied any of the specified criteria:
where Ta, Ts, and Tc denote the amplitude anomaly threshold, slope anomaly threshold, and composite anomaly threshold, respectively. In this study, they were set to Ta = 4.0, Ts = 4.0, and Tc = 5.0.
After the initial spike points were obtained, merging and expansion were further performed to prevent the same local anomaly from being divided into multiple independent events. If the interval between two adjacent spike segments was smaller than a predefined time threshold, they were merged into a single spike event. In this study, the merging interval was set to Tmerge = 0.05 ms. Meanwhile, both ends of each spike event were appropriately expanded, with the expansion time set to Texpand = 0.02 ms.
After merging and expansion, the complete set of spike events was obtained. The final number of detected spike events is Ne. The number of spike points is Np. The total number of sampling points is N, and the signal duration is T. Spike-related features can then be further extracted.
First, the spike-point proportion PP was defined:
The spike density D was defined as the number of spike events per unit time, reflecting the frequency of spike occurrence:
The spike energy ratio E was defined as the ratio of the residual energy within spike regions to the total residual energy:
where Ω denotes the set of all spike points, and E reflects the contribution of spike regions to the total residual-signal energy. A larger spike amplitude or longer spike duration leads to a correspondingly higher value.
The maximum anomaly score Ms was defined as the maximum composite anomaly score within the spike regions, characterizing the abnormality of the strongest spike point:
The maximum spike amplitude Amax was defined as the maximum absolute residual value within the spike regions, reflecting the largest local fluctuation amplitude:
Finally, to comprehensively evaluate the degree of spike abnormality, the HRE score was constructed,
where w1, w2, w3, and w4 are the weights of the corresponding features. In this study, these weights were set accordingly.
The weights 0.10, 0.25, 0.25 and 0.40 in Equation (23) assign the smallest role to spike density and the leading role to maximum spike amplitude, with energy ratio and maximum score sharing the remaining contribution equally. To examine the full range of possible weights, 733 weight combinations were retained (each ≥ 0.05, sum = 1). All 733 schemes preserve the order “severe ablation > slight ablation,” with a median separability of 0.58. The weights in this paper achieve a separability of 0.86, which is 48% above the median. Sensitivity analysis confirms that reducing the density weight and increasing the amplitude weight improves separability. However, such excessive adjustments compromise physical interpretability. The selected weights therefore represent a balanced allocation that maintains both strong separability and physical consistency.
4.3. Analysis of Residual Spike Features in Current Signals of Ablated Buffer Layers
Residual spike features were extracted and analyzed from three sets of data obtained in buffer layer ablation tests. Five features were extracted to distinguish ablation severity, i.e., spike density, energy ratio, maximum score, maximum spike amplitude, and HRE score. The test data of the normal buffer layer, slightly ablated buffer layer, and severely ablated buffer layer were divided into three groups: normal, Defect 1, and Defect 2. Each group contained only leakage current signals measured at low frequencies (5, 10, 25, and 50 Hz). To facilitate feature comparison among different states, the normal-state samples were used as the reference, and normalization was applied to all features [27].
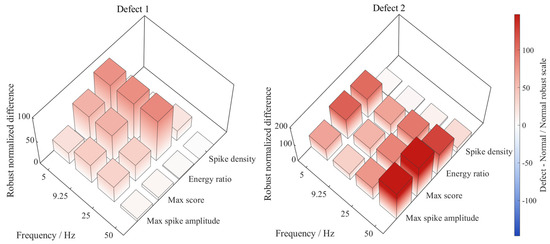
Figure 14 presents the three-dimensional differences in the first four spike features (spike density, energy ratio, maximum score and maximum spike amplitude) for slight ablation (Defect 1) and severe ablation (Defect 2) relative to the normal state. It can be observed that the four spike features of slight ablation exhibit positive deviations from the normal state under all frequency conditions. However, the overall differences are moderate, with the maximum value being approximately 100. Among them, spike density and energy ratio show relatively high differences at 5 Hz, indicating that spike anomalies caused by slight ablation are more readily detected at low frequencies. The feature differences of severe ablation are significantly larger than those of slight ablation, with the maximum value exceeding 200. Severe ablation exhibits pronounced positive deviations under multiple frequency conditions, suggesting that more abnormal energy is concentrated in the spike regions of the residual signal and that local abrupt variations are stronger. Therefore, as the ablation degree increases, residual spike anomalies become more severe.
Figure 14.
Three−dimensional difference plot of four core spike features.
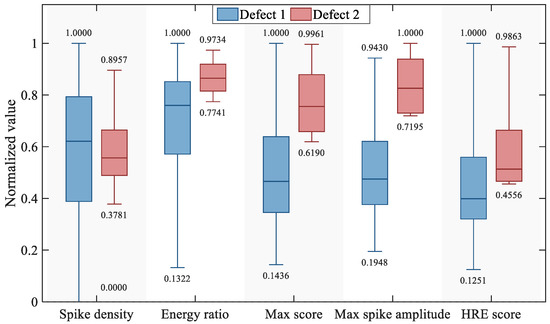
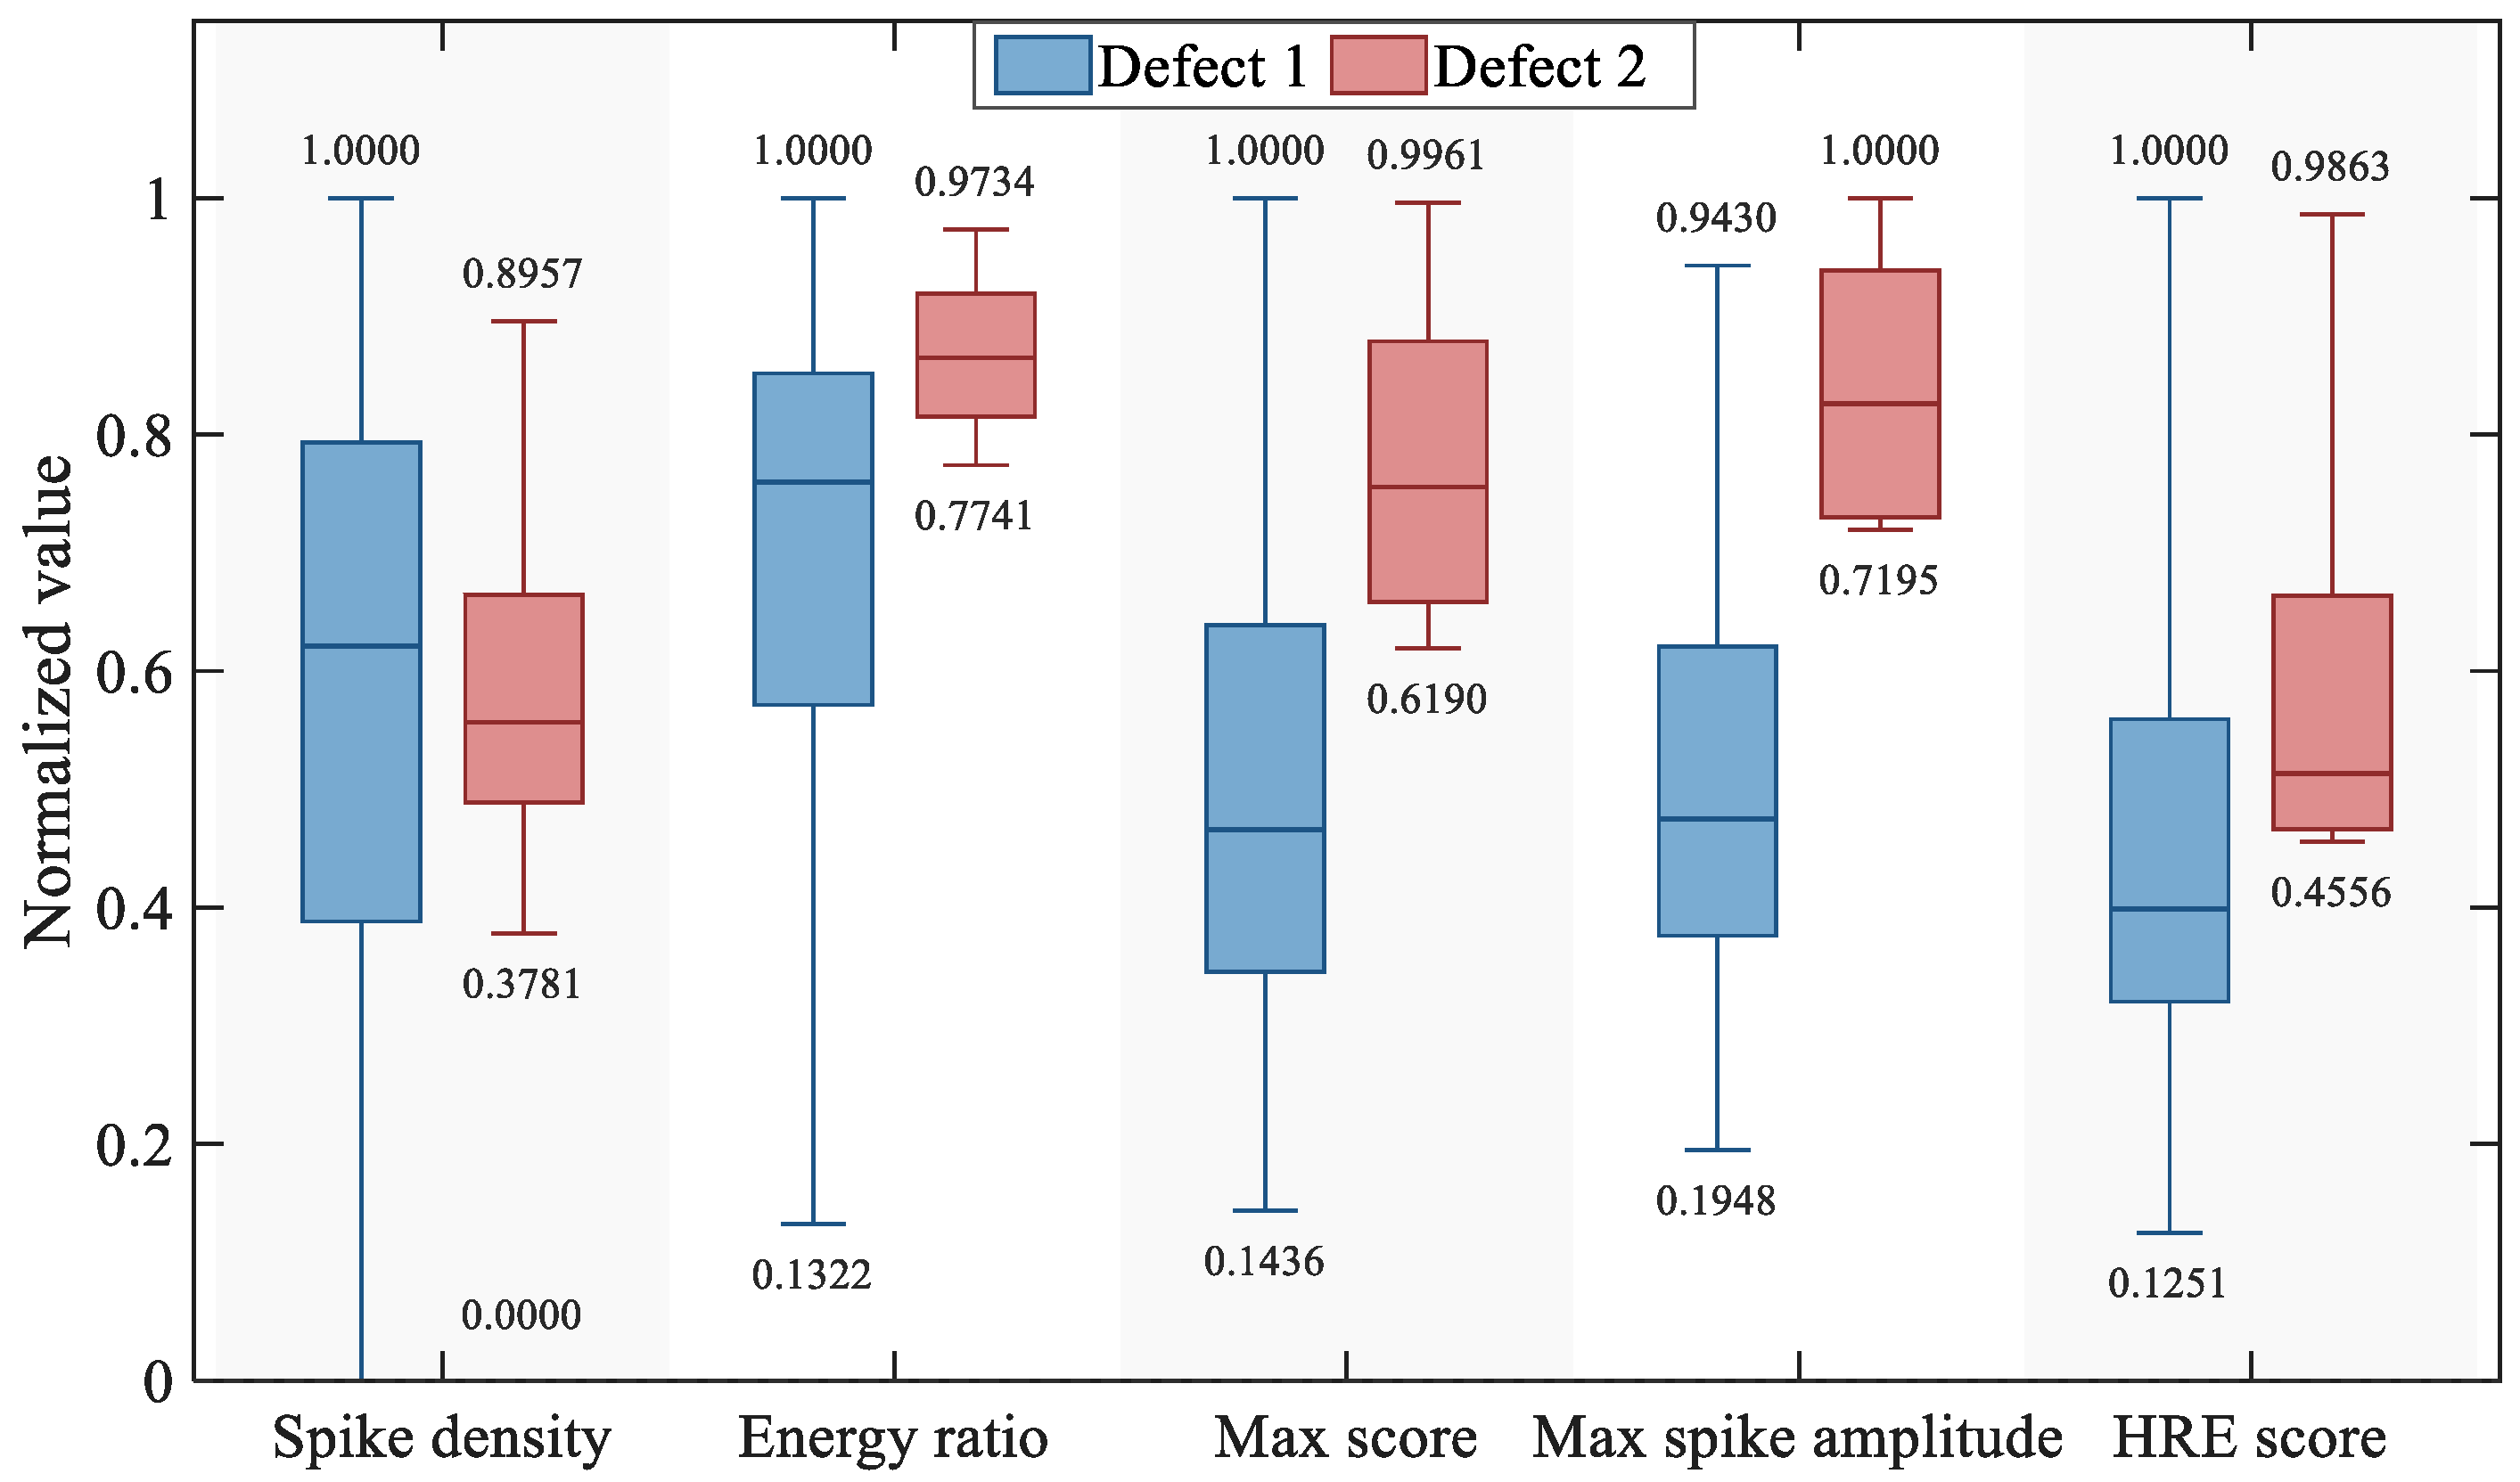
Figure 15 compares slight ablation (Defect 1) and severe ablation (Defect 2) using box plots of five normalized spike features. The blue boxes represent slight ablation, and the red boxes represent severe ablation. The vertical axis denotes the normalized feature values. The energy ratio, maximum score, and maximum spike amplitude show the most evident discrimination capability for ablation severity. For severe ablation, the boxes of these three features are generally located in higher-value ranges, with lower bounds of 0.741, 0.6190, and 0.7195, respectively, which are close to or exceed the median levels of slight ablation. The distributions of the two states show limited overlap, indicating that more abnormal energy is concentrated in the spike regions under severe ablation and that the local abrupt variations are larger. In contrast, the spike-density distributions of the two ablation states overlap considerably, and slight ablation exhibits a wider distribution range. As a comprehensive indicator, the HRE score of severe ablation is overall higher than that of slight ablation, enabling a relatively stable characterization of the severity difference between the two ablation states. The median HRE fraction for severe ablation was 0.5131, and for slight ablation, it was 0.3990. Therefore, the midpoint between the two—0.45—was adopted as the threshold for distinguishing between slight and significant ablation. Overall, the discriminative capability of a single feature is limited, whereas joint analysis of multidimensional spike features can more reliably distinguish slight ablation from severe ablation in the buffer layer.
Figure 15.
Normalized box plot of spike features.
5. Conclusions
To address defect diagnosis in the water-blocking buffer layer of high-voltage XLPE cables, this study established a multi-frequency leakage current test platform and prepared composite specimens consisting of XLPE insulation and water-blocking buffer layers. Four typical states were simulated: normal, moisture-affected, slightly ablated, and severely ablated. By applying excitation voltages with different voltage levels (0.88–3.53 kV) and multiple frequencies (5–1050 Hz), leakage current signals under various states were acquired and analyzed. The effects of moisture-affected defects and ablation defects on leakage current amplitude and phase difference were investigated. On this basis, moisture ingress and ablation were interpreted as two distinct forms of voltage–current symmetry breaking: moisture mainly produces frequency-domain asymmetry through low-order harmonic distortion, whereas ablation mainly produces time-domain asymmetry through local residual spikes. By distinguishing these two types of symmetry-breaking signatures, a buffer-layer state identification method based on harmonic and residual-spike features was proposed. Through staged decision-making, the proposed method can identify the four states. The main conclusions are as follows.
- (1)
- The leakage current response characteristics of buffer layer defects under multi-frequency excitation were revealed. The experimental results show that both moisture-affected defects and ablation defects increase the leakage current peak value, and the peak value exhibits an approximately linear relationship with voltage level and excitation frequency. Under the moisture-affected state, the leakage current increases by 15–30% compared with the normal state, whereas ablation defects have only a minor effect on the current peak value. In addition, moisture-affected defects significantly reduce the voltage–current phase difference, particularly in the low-frequency range of 5–50 Hz, where the difference reaches 9–64° and becomes more pronounced as the frequency decreases. In contrast, ablation defects have negligible influence on the phase difference.
- (2)
- The frequency-domain feature differences among different defect states were identified. Harmonic analysis shows that moisture ingress significantly enhances the nonlinear distortion of the leakage current waveform under low-frequency excitation. For the moisture-affected buffer layer, the total harmonic distortion increases markedly as the frequency decreases, rising from approximately 2% at 50 Hz to 14% at 5 Hz. Among the harmonic components, the 3rd, 5th, and 7th harmonics are the most sensitive, with the 3rd harmonic increasing from 4.284% to 11.44% at 5 Hz. In contrast, the harmonic characteristics of ablation defects are not prominent; ablation is mainly manifested as local abrupt waveform changes rather than variations in the overall harmonic structure.
- (3)
- A buffer layer state identification method based on harmonic and residual spike features was proposed. Through a staged decision process, the method enables the identification of four buffer layer states: normal, moisture-affected, slightly ablated, and severely ablated. This provides a technical approach for defect diagnosis of water-blocking buffer layers in high-voltage cables.
Author Contributions
Conceptualization, X.H. (Xingwang Huang); methodology, X.H. (Xingwang Huang); software and validation, J.S.; formal analysis, J.S.; investigation, H.L.; resources, data curation, writing—original draft preparation, X.H. (Xiaobin Hu); writing—review and editing, visualization, X.H. (Xiaobin Hu), J.S., and H.L.; supervision, project administration, funding acquisition, X.H. (Xingwang Huang), J.S., and H.L. All authors have read and agreed to the published version of the manuscript.
Funding
This research was supported by a science and technology project grant from State Grid Corporation of China (Project No.: kj2025-096).
Data Availability Statement
The dataset is available on request from the authors.
Conflicts of Interest
Author Xingwang Huang, Jingang Su and Hongliang Liu were employed by the company State Grid Hebei Electric Power Research Institute. This research was supported by a science and technology project grant from State Grid Corporation of China (Project No.: kj2025-096). The funder was not involved in the study design, collection, analysis, interpretation of data, the writing of this article or the decision to submit it for publication.
References
- Liu, H.; Wang, S.; Wu, Y.; Xu, S.; Li, X.; Wang, N.; Zhang, C.; Li, S. Additive Interaction Effect on High-Temperature Stability of XLPE Insulation for High-Voltage Cables. High Volt. 2025, 10, 1390–1399. [Google Scholar] [CrossRef] [Scilit]
- Zhou, W.; Li, L.; Cheng, H.; Wu, X.; Liu, G. Gas Production Analysis for the Buffer Layer of High-Voltage Cross-Linked Polyethylene Cables. High Volt. 2024, 9, 1149–1158. [Google Scholar] [CrossRef] [Scilit]
- Liu, J.; Ma, M.; Liu, X.; Xu, H. High-Voltage Cable Buffer Layer Ablation Fault Identification Based on Artificial Intelligence and Frequency Domain Impedance Spectroscopy. Sensors 2024, 24, 3067. [Google Scholar] [CrossRef] [Scilit] [PubMed]
- Liu, Y.; Chen, J.; Hu, L. Mechanism and Experimental Study on Discharge Ablation of High Voltage XLPE Cable Buffer Layer. Insul. Mater. 2021, 54, 102–108. [Google Scholar]
- Gustavsen, B.; Høyer-Hansen, M.; Hatlo, M.; Midttveit, S. Voltages and AC Corosion on Metallic Tubes in Umbilical Cables Caused by Magnetic Induction from Power Cable Charging Currents. IEEE Trans. Power Deliv. 2019, 34, 596–605. [Google Scholar] [CrossRef] [Scilit]
- Nordås, S.; Hellesø, S.M.; Svere, H. Measurements and Modeling of Water Diffusion in Water Blocking Tapes for High Voltage Extruded Cables. In Proceedings of the International Symposium on Electrical Insulating Materials, Yokkaichi, Japan, 7–11 September 2008. [Google Scholar] [CrossRef] [Scilit]
- He, W.; Wu, Z.; Deng, B.; Xiang, H.; Ren, X.; Wang, Q. Simulation Research on Ultrasonic Detection Technology of Buffer Layer Ablation Defects in High Voltage Cables. High Volt. Appar. 2022, 58, 230–237, 260. [Google Scholar]
- Huang, J.; Zhou, K.; Zhao, Q.; Xu, Y.; Meng, P.; Yuan, H.; Fu, Y.; Lin, S. Diagnosis and Localization of Moisture Defects in HV Cable Water Blocking Buffer Layer Based on Characteristic Impedance Variation. IEEE Trans. Dielectr. Electr. Insul. 2024, 31, 3322–3330. [Google Scholar] [CrossRef] [Scilit]
- Eigner, A.; Rethmeier, K. An Overview on the Current Status of Partial Discharge Measurements on AC High Voltage Cable Accessories. IEEE Electr. Insul. Mag. 2016, 32, 48–55. [Google Scholar] [CrossRef] [Scilit]
- Liu, B.; Wang, W.; Liu, T.; Xu, Z.; Kong, X.; Zhou, X.; Cheng, Y. Image Optimization Method for Ablation Defects in High-Voltage Cable Buffer Layers Based on X-Ray Detection Technique. Front. Phys. 2025, 13, 1604821. [Google Scholar] [CrossRef] [Scilit]
- Chen, Y.; Zhou, K.; Kong, J.; Zhao, Q.; Li, Y.; Xu, X.; Song, P. A Review of Failure Analysis and Detection Methods for Buffer Layers in High-Voltage Cables. IEEE Electr. Insul. Mag. 2023, 39, 7–15. [Google Scholar] [CrossRef] [Scilit]
- Hao, Y.; Zhao, P.; Hui, B.; Cheng, Y.; Zhu, W.; Fu, M.; Li, X. Broadband Impedance Spectrum Detection of Buffer Layer Defects in 110 kV Crosslinked Polyethylene Cable with Corrugated Aluminium Sheath. High Volt. 2023, 8, 967–976. [Google Scholar] [CrossRef] [Scilit]
- Cheng, Y.; Hao, Y.; Chen, Y.; Hui, B.; Fu, M.; Yang, L.; Li, L. Effects of Condition of Water Blocking Tape on the Buffer Layer Failures of High Voltage XLPE Cables in Electric Field and Temperature Field. Eng. Fail. Anal. 2022, 131, 105823. [Google Scholar] [CrossRef] [Scilit]
- Li, Y.; Liu, Y.; Zhao, Q.; Zhou, K.; Chen, Y.; Kong, J. Mechanism of Status Evaluation for Water Blocking Buffer Layer of High-Voltage Cable Based on Characteristic Gas Analysis. IEEE Trans. Dielectr. Electr. Insul. 2024, 31, 2216–2225. [Google Scholar] [CrossRef] [Scilit]
- Xie, Y.; Liu, J.; Feng, C.; Zhang, J.; Liu, S.; Chen, D. Study on Technical Parameters of X-Ray Stereoscopic Imaging of Ablative Defects for Water Blocking Buffer Layer in High Voltage Cable. J. Phys. Conf. Ser. 2022, 2401, 012057. [Google Scholar] [CrossRef] [Scilit]
- Liu, Y.; Wang, H.; Zhang, H.; Du, B. Thermal Aging Evaluation of XLPE Power Cable by Using Multidimensional Characteristic Analysis of Leakage Current. Polymers 2022, 14, 3147. [Google Scholar] [CrossRef] [Scilit] [PubMed]
- Geng, P.; Song, J.; Tian, M.; Lei, Z.; Du, Y. Influence of Thermal Aging on AC Leakage Current in XLPE Insulation. AIP Adv. 2018, 8, 025115. [Google Scholar] [CrossRef] [Scilit]
- Zhang, Y.; Wu, Z.; He, J.; Zhang, D.; Hu, M. Electrical Treeing Behaviours in Cross-Linked Polyethylene Cables after Thermal Ageing. High Volt. 2023, 8, 749–759. [Google Scholar] [CrossRef] [Scilit]
- Wei, Y.; Liu, M.; Li, X.; Li, G.; Li, N.; Hao, C.; Lei, Q. Effect of Temperature on Electric-Thermal Properties of Semi-Conductive Shielding Layer and Insulation Layer for High-Voltage Cable. High Volt. 2021, 6, 805–812. [Google Scholar] [CrossRef] [Scilit]
- Tian, Y.; Zhu, G.; Miao, Q.; Huang, J.; Huang, X.; Li, S.; Li, L. Study on the Ablation Process and Failure Mechanism of the Buffer Layer in High-Voltage XLPE Cable. Int. J. Electrochem. Sci. 2024, 19, 100662. [Google Scholar] [CrossRef] [Scilit]
- Suo, C.; Li, Z.; Zheng, H.; Sun, Y. Dynamic Characteristics Analysis on Interface Polarization and Depolarization of Nonlinear Double-Layered Dielectrics. IEEE Trans. Dielectr. Electr. Insul. 2017, 24, 1511–1526. [Google Scholar] [CrossRef] [Scilit]
- Zhu, Y.; Otsubo, M.; Honda, C.; Hashimoto, Y.; Ohno, A. Mechanism for change in leakage current waveform on a wet silicone rubber surface-a study using a dynamic 3-D model. IEEE Trans. Dielectr. Electr. Insul. 2005, 12, 556–565. [Google Scholar] [CrossRef]
- Bonanos, N.; Pissis, P.; Macdonald, J.R. Impedance Spectroscopy of Dielectrics and Electronic Conductors. In Characterization of Materials; Kaufmann, E.N., Ed.; John Wiley & Sons, Inc.: Hoboken, NJ, USA, 2012. [Google Scholar]
- Sun, J.; Aboutanios, E.; Smith, D.B.; Fletcher, J.E. Robust Frequency, Phase, and Amplitude Estimation in Power Systems Considering Harmonics. IEEE Trans. Power Deliv. 2020, 35, 1158–1168. [Google Scholar] [CrossRef] [Scilit]
- de la Rosa de Sa, S.; Lubiano, M.A.; Sinova, B.; Gil, M.Á.; Filzmoser, P. Location-Free Robust Scale Estimates for Fuzzy Data. IEEE Trans. Fuzzy Syst. 2021, 29, 1682–1694. [Google Scholar] [CrossRef]
- Khastan, A. New Solutions for First Order Linear Fuzzy Difference Equations. J. Comput. Appl. Math. 2017, 312, 156–166. [Google Scholar] [CrossRef] [Scilit]
- Gao, Y.; Feng, Y.; Xie, Y.; Pan, J.; Nie, F. Normalized Robust PCA With Adaptive Reconstruction Error Minimization. IEEE Trans. Knowl. Data Eng. 2024, 36, 2587–2599. [Google Scholar] [CrossRef] [Scilit]

Disclaimer/Publisher’s Note: The statements, opinions and data contained in all publications are solely those of the individual author(s) and contributor(s) and not of MDPI and/or the editor(s). MDPI and/or the editor(s) disclaim responsibility for any injury to people or property resulting from any ideas, methods, instructions or products referred to in the content. |
© 2026 by the authors. Licensee MDPI, Basel, Switzerland. This article is an open access article distributed under the terms and conditions of the Creative Commons Attribution (CC BY) license.