


Abstract
Robust detection of emergency vehicle sirens remains difficult due to modern soundproofing, competing audio, and variable traffic noise. Although many simulation-based studies have been reported, relatively few systems have been realized in hardware, and many proposed approaches rely on complex or artificial intelligence-based processing with limited interpretability. This work presents a physical implementation of a low-complexity yelp siren detector that leverages the symmetries of the yelp signal, together with its characterization under realistic conditions. The design is not based on conventional signal processing or machine learning pipelines. Instead, it uses a simple analog envelope-based principle with threshold-crossing rate analysis and a fixed comparator threshold. Its performance was evaluated using an open dataset of more than 1000 real-world audio recordings spanning different road conditions. Detection accuracy, false-positive behavior, and robustness were systematically evaluated on a real hardware implementation using multiple deployable decision rules. Among the evaluated detection rules, a representative operating point achieved a true positive rate of 0.881 at a false positive rate of 0.01, corresponding to a Matthews correlation coefficient of 0.899. The results indicate that a fixed-threshold realization can provide reliable yelp detection with very low computational requirements while preserving transparency and ease of implementation. The study establishes a pathway from conceptual detection principle to deployable embedded hardware.
1. Introduction
During emergencies, speed and efficiency of response are essential. Reducing the time required for emergency vehicles to reach a scene or transport individuals to medical facilities directly affects outcomes. To enable rapid movement through traffic, emergency vehicles rely on audio and visual warnings to request right of way. However, public safety also depends on nearby drivers detecting these warnings promptly and reliably.
Despite the use of sirens and lights, emergency vehicles may still go unnoticed in dense or noisy traffic environments. Statistics from the United States indicate that in 2021, 198 fatalities were associated with accidents involving emergency vehicles [1,2]. A longitudinal analysis covering 2010–2023 (Figure 1) shows that police vehicles were disproportionately involved in these incidents. Sirens are intended to provide a distinct acoustic cue, with common types including yelp, wail, phaser, and hi-lo signals. The yelp siren is distinguished by a repetitive pattern that conveys a stable underlying symmetry. This property supports the use of low-complexity detection strategies.
Figure 1.
Yearly fatalities from crashes involving police vehicles, ambulances, and fire trucks (2010–2023).
Modern vehicles increasingly incorporate soundproofing to improve cabin comfort, and music and infotainment systems can further mask siren signals, collectively reducing driver awareness, particularly for individuals with reduced auditory sensitivity. As a result, automatic siren detection has emerged as an important enabling function for driver assistance features such as audio ducking, visual alerts, or haptic feedback.
Research interest in automatic siren detection has grown accordingly. Commercial and industrial efforts, such as those by Bosch [3], iHear [4], and Waymo [5], have explored both signal processing and AI-based solutions. Traditional digital signal processing approaches [6,7,8,9,10,11,12,13,14,15,16,17,18] and more recent machine-learning and deep-learning methods [19,20,21,22,23,24,25,26,27,28,29] can achieve good classification accuracy, but often at the cost of increased computational complexity, reduced interpretability, and higher energy consumption, which are critical considerations for embedded systems. In parallel, perception capabilities are increasingly being extended beyond the vehicle itself to roadside sensing infrastructure. Recent work has demonstrated that roadside perception systems can provide enhanced situational awareness over wider spatial ranges than onboard sensors, particularly in complex traffic environments such as intersections. For example, an interactive Siamese network-based framework was proposed for multi-vehicle tracking using roadside detectors, achieving improved accuracy and recall for highly maneuvering targets through adaptive similarity modeling and global trajectory optimization [30]. Other studies, such as [31] and [32], have demonstrated that lower-complexity detection strategies can remain competitive in realistic environments.
Earlier works in [32,33,34] introduced an analog-inspired framework for Yelp siren detection based on envelope extraction and threshold-crossing rate analysis, supported by theoretical modeling. The implementation in [34] demonstrated this principle in simulation, confirming its low computational requirements and suitability for embedded deployment. In [35], the framework of [34] was advanced to a deployment-oriented Simulink implementation that enforces realistic constraints. Importantly, the resulting system maintained strong detection accuracy and, when evaluated on newly synthesized test data, achieved better performance than representative machine-learning baselines and competitive results with state-of-the-art solutions. In summary, while earlier works [32,33,34,35] established the feasibility of envelope-based and rate-based yelp siren detection, they primarily focused on theoretical modeling, simulation-based evaluation, or block-level implementation. In contrast, the present study emphasizes a complete physical realization and systematic experimental validation on real hardware. By explicitly capturing component tolerances, analog noise, comparator behavior, and embedded timing effects, the proposed work enables assessment of robustness and deployment feasibility beyond what can be inferred from simulation or model-based implementations alone.
Whereas much of the existing literature reports simulation-based results, the present work includes physical hardware realization and controlled evaluation, capturing the effects of component tolerances and implementation constraints. Similar concerns regarding the gap between simulation and real-world behavior have been reported in other sensing domains within intelligent vehicles. For instance, recent work on ultrasonic radar testing for automatic parking systems demonstrated that simulation-based evaluations often fail to capture important hardware- and environment-induced effects, motivating the use of sensor-in-the-loop and hardware-in-the-loop testing frameworks to improve realism and reliability [36].
The characteristic symmetry of the yelp siren’s repeating sweep is reflected in a consistent rate at which the processed signal crosses a reference threshold, allowing the detection task to be carried out with low computational effort. Performance was evaluated using an open dataset of more than 1000 real-world recordings spanning diverse traffic and noise conditions, and compared with representative solutions reported in the literature.
The contributions of this work are as follows:
- A complete physical realization of a low-complexity yelp siren detector implemented using analog filtering, envelope extraction, fixed-threshold comparison, and interrupt-driven transition-rate evaluation on an embedded microcontroller, without reliance on spectral analysis or machine-learning models.
- Experimental validation on real hardware rather than simulation, demonstrating that the proposed detection principle remains effective under practical non-idealities such as component tolerances, analog noise, comparator hysteresis, and embedded timing constraints.
- A systematic performance characterization using a large open dataset of real-world recordings (over 1000 audio files), enabling statistically meaningful evaluation of detection accuracy, false-positive behavior, and robustness across diverse traffic and noise conditions.
- A structured comparison of deployable temporal decision rules, including single-event, consecutive-event, and sliding-window formulations, revealing predictable trade-offs between sensitivity and false-alarm suppression as the temporal consistency parameter is varied.
- Identification of a robust operating point for fixed-threshold detection, showing that a window-based rule with appropriate parameter selection achieves competitive accuracy and very low false-positive rates while preserving simplicity and interpretability.
- An analysis of failure modes and practical limits, demonstrating that remaining false positives arise from rare quasi-periodic mechanical noise events, and showing how near-zero false-positive operation can be achieved at the cost of reduced sensitivity within the same rate-based framework.
The remainder of this paper is organized as follows. Section 2 presents the detection principle, system architecture, hardware implementation, and evaluation methodology. Section 3 reports the quantitative performance results for all evaluated detection rules. Section 4 discusses the observed behaviors, comparison with related work, operating-point selection, and practical limitations. Section 5 concludes the paper.
2. Materials and Methods
In this section, the complete detection pipeline is presented, from signal characterization to hardware realization and test protocol. First, the characteristic properties of the yelp siren and their implication for a threshold-crossing rate detector are described. Next, the functional system architecture and its implementation using analog filtering, envelope extraction, and microcontroller-based rate evaluation are detailed, together with the corresponding hardware design. Finally, the evaluation methodology, test signals, decision rules, and performance metrics used to quantify detection quality are outlined.
2.1. Characteristics of the Yelp Siren Signal
The yelp siren is one of the most commonly used and easily identifiable acoustic warning signals emitted by emergency vehicles, due to its ability to attract attention rapidly and signal urgency in traffic environments. Acoustically, the yelp siren is a frequency-modulated signal, in which the fundamental frequency continuously sweeps between a lower and upper bound, repeating at a characteristic rate typically expressed in cycles per minute (CPM). A spectrogram illustrating this behavior is shown in Figure 2. All the plots in this work were created using MATLAB R2024b (MathWorks Inc., Natick, MA, USA).
Figure 2.
Spectrogram of a yelp siren signal in road traffic noise.
The audio signal was read from file and converted to mono by selecting the left channel. The spectrogram was obtained using a short-time Fourier transform. A Hann window of 40 ms duration (1920 samples at 48 kHz) was applied with 50 percent overlap. For each frame, a 2048-point FFT was computed. The magnitude spectrum was converted to decibels. To maintain a consistent visual scale, the spectrogram was normalized relative to the 99th percentile spectral magnitude and displayed across a 70 dB dynamic range below that reference. Only the frequency range from 0 to 10 kHz was shown. The spectrogram was displayed using the turbo colormap to ensure clear contrast in both screen and printed formats. After second 11, a strong policeman whistle sound can be observed. The high-frequency whistle component lies well outside the passband of the proposed detector and is therefore strongly attenuated by the analog front end, such that it does not influence the detection process.
Because the sweep repeats, the instantaneous frequency passes through the same frequency region multiple times per second, leading to recurring moments in which the signal’s energy aligns with any selected frequency between its minimum and maximum sweep limits. This repetition introduces a stable and recognizable structure in both the time and frequency domains. Although specific parameters such as the sweep rate, sweep range, and minimum and maximum frequencies vary across siren models and manufacturers, the overall modulation pattern remains consistent. A detailed overview of such characteristic parameter ranges is provided in [37].
This repeating sweep pattern can be regarded as expressing a form of symmetry: even though the exact numerical values may shift, the structure of the sweep remains similar from cycle to cycle. As a result, when the signal is observed through a band-pass filter centered within the sweeping range, the output envelope exhibits recurrent peaks corresponding to each sweep cycle. The resulting threshold-crossing rate is dictated by the sweep repetition and therefore remains stable as long as the signal envelope remains above the threshold, providing robustness to moderate variations in loudness. This structural behavior forms the basis of the detection approach adopted in this work, where the recurring sweep symmetry is reflected in a measurable threshold-crossing rate. The detection principle is presented in detail further.
2.2. System Overview
The system is designed to detect the presence of a yelp siren by leveraging the repeated sweep pattern that characterizes this type of emergency signal. The yelp siren exhibits a recurring variation in its instantaneous frequency. As the sweep progresses, the signal periodically passes through particular frequency regions, producing a rhythmic pattern that can serve as a distinguishing signature. This property can be visualized in Figure 3, where a detail of the spectrogram shown in Figure 2 is illustrated, namely between seconds 2 and 6, and only up to 2000 Hz.
Figure 3.
Spectrogram of siren signal in road noise-detail.
A high-level functional block diagram of the system is shown in Figure 4.
Figure 4.
Block diagram of the low complexity yelp siren detection system.
The goal of the detector is to determine when the instantaneous frequency of the input signal matches a fixed reference frequency, and to measure how often this event occurs. For yelp sirens, this frequency-crossing rate is distinctive and can be used as a reliable indicator of their presence.
The processing can be viewed as consisting of three main stages. First, a Signal Filtering Module emphasizes the moments when the signal’s instantaneous frequency passes through the reference frequency. At these moments, the signal energy at the output of this stage increases, while it remains low otherwise. Second, a Signal Detection Module converts these energy fluctuations into a binary signal indicating whether the reference region is being crossed (high) or not (low). This binary representation captures the timing pattern associated with the yelp sweep. Third, a Data Processing Module counts the transitions of this binary signal over a fixed time interval. If the resulting transition rate falls within a range characteristic of the yelp siren, the system concludes that the siren is present and issues a detection output towards the user communication module that informs the driver. This principle-level overview describes how the system identifies the yelp siren pattern.
Unlike approaches based on spectral analysis, machine learning, or large-scale signal modeling, the proposed method relies solely on the temporal structure of the sweep and does not require training data, classification boundaries, or computationally intensive feature extraction. The detection decision is derived from a directly interpretable rate measurement, making the system easy to tune, verify, and integrate into embedded environments with limited processing resources. At the system level, this translates to a processing load limited to simple threshold comparisons, integer counter updates on comparator transitions, and periodic summation over a short buffer, with a memory footprint consisting only of a small set of scalar variables. Further, we provide implementation details for the three processing blocks.
The Signal Filtering Module is implemented as a band-pass filter centered at a reference frequency within the sweep range of the yelp siren. When the instantaneous frequency of the input signal passes through , the filter output exhibits an amplitude increase. As the sweep continues, these increases occur periodically, converting the continuous frequency modulation into a sequence of amplitude pulses whose repetition rate reflects the sweep rate.
The Signal Detection Module extracts a slowly varying representation of these pulses using an envelope detector. Since the output of the band-pass filter oscillates near , working directly with that waveform would require additional processing effort. In contrast, its envelope directly tracks the local energy level. This envelope is compared to a fixed threshold to produce a binary signal indicating whether the sweep is currently intersecting the reference frequency region.
The Data Processing Module is a microcontroller that counts the transitions of this binary signal over a fixed observation interval. The resulting transition rate is then compared to two boundary values specific to yelp sirens. If the measured rate falls within this interval, the system concludes that a yelp siren is present and activates the detection output. The User Communication Module receives the detection output and presents it to the driver in an easily perceivable form. Depending on the intended integration level, this may include dashboard indicators, audio cues, or haptic feedback. This module does not influence the detection process itself and is therefore not discussed in detail here. In the present implementation, a simple LED serves as the driver alert. The implementation details for the functional blocks are provided in the following subsection.
2.3. Hardware Implementation
This subsection describes the physical realization of the detection architecture outlined in Section 2.2. The system is implemented using a compact set of modules arranged to follow the same signal flow as the conceptual model: power supply, band-pass filtering, envelope detection, threshold comparison, and transition-rate evaluation. The design emphasizes low component count, standard off-the-shelf parts, and straightforward adjustability to support prototyping and embedded integration. No specialized digital signal processing hardware or training-based algorithms are required; the detection behavior derives directly from the structure of the analog processing stages and the rate evaluation logic. By maintaining simplicity in both the signal path and the decision mechanism, the system remains interpretable, resource-efficient, and suitable for deployment in constrained environments.
The prototype is powered from a 5 V USB source, allowing the system to be operated and tested directly from a computer. Since the analog processing stages make use of operational amplifiers that require a dual supply, the 5 V input is converted to ±12 V using a compact DC–DC converter module. The converter accepts 2.8 ÷ 5.5 V at its input and provides up to 30 mA per rail, which is sufficient for the signal filtering and envelope detection circuitry. While a 5 V USB source is not representative of an automotive environment, this does not limit in-vehicle deployment. Standard vehicle electrical systems provide a nominal 12 V supply, from which the same ±12 V rails can be derived using a suitable DC–DC converter. In addition, the ±12 V supply ensures sufficient voltage headroom for the analog stages, improving linearity and preventing clipping at higher input levels. Thus, the power architecture used in the prototype can be transferred directly to automotive integration, with adaptation only at the input supply interface.
The first stage of the system is a band-pass filtering block implemented using a multiple-feedback active filter topology. The objective of this stage is to isolate a narrow region of the yelp siren’s sweep range so that the recurring passage of the instantaneous frequency through this region produces a measurable variation in the output amplitude. The target design parameters for the filter were a nominal center frequency of and a quality factor of , which corresponds to a bandwidth of . These values were selected to ensure that the filter output exhibits clearly separated amplitude events during the sweep cycle, while remaining realizable with standard component values. It has been reported in the literature that no strict regulatory limits exist regarding the instantaneous frequency bounds of the yelp siren signal, and that substantial variability is observed across manufacturers and vehicle types [35]. When extreme cases are considered, the instantaneous frequency sweep of the yelp siren may span a broad range, approximately from 100 Hz to 2500 Hz. The 1 kHz chosen value lies within the central portion of the reported yelp sweep range, ensuring that the instantaneous frequency of the siren crosses the selected reference region reliably during each sweep cycle, even under substantial inter-model variability. By avoiding proximity to the lower or upper extremes of the sweep range, the likelihood of missed crossings due to truncated sweeps or reduced sweep excursions is minimized.
The final component selection was performed using standard E-series values. A realized center frequency of resulted based on these values, circuit synthesis and simulation. The band-pass filter schematic was designed in Labcenter Electronics Proteus 8, which also provided the PCB layout environment used later in the hardware prototype. Figure 5 shows the implemented filter schematic. The detector architecture employs a single band-pass filter to minimize system complexity while exploiting the regular sweep structure of the signal.
Figure 5.
Schematic of the implemented band-pass filter.
The output of the band-pass filter is a narrowband signal at approximately , whose amplitude increases when the instantaneous frequency of the input signal passes through the selected frequency region. To obtain a representation suitable for transition-rate measurement, this signal is converted to an envelope. The envelope detector is implemented as a half-wave rectifier followed by a low-pass RC network, using a diode, a capacitor, and a resistor, resulting in a cutoff frequency of 3.386 Hz.
Since the amplitude at the filter output can be small, an inverting amplifier with a gain magnitude of 10 is placed before the rectifier stage to ensure that the envelope remains within a range suitable for threshold comparison. The resulting envelope is then applied to a comparator with a fixed reference level set using a potentiometer. For the experiments, the threshold was set to 600 mV. The comparator output is a binary signal indicating whether the envelope exceeds the threshold. This binary sequence contains transitions whose timing reflects the periodicity of the frequency sweep in the original signal. These transitions are processed in the next stage to determine whether the observed rate corresponds to that of a yelp siren. The schematic of the envelope detector and comparator implementation is shown in Figure 6.
Figure 6.
Schematic of the gain stage, envelope detector, and comparator used to generate binary threshold-crossing events.
The binary output of the thresholding stage is processed by a microcontroller that evaluates the rate of high–low transitions, each corresponding to a passage of the instantaneous frequency of the input signal through the band-pass region. Because the comparator operates from a ±12 V supply, its output voltage swing exceeds the allowable input range of the microcontroller. To ensure safe interfacing, the comparator output is passed through a protection stage consisting of a Zener diode limiter and a series resistor, which constrain the logic-level signal to approximately 5.1 V. This microcontroller protection circuit is illustrated in Figure 7.
Figure 7.
Protection and interface circuitry used to limit the comparator output to microcontroller-safe logic levels.
The siren detection algorithm on the microcontroller is based on monitoring the threshold-crossing rate of the audio signal over a sliding one-second window and applying a threshold test to this feature. The processed audio signal is provided to a digital GPIO pin configured as an external interrupt input. This pin is set to trigger on any logic transition, and on each such event an interrupt service routine executes that increments a global counter. This counter therefore represents the number of zero crossings of the audio signal accumulated since the last analysis interval.
Temporal structuring of the measurements is implemented using a hardware timer (Timer1) configured in compare-match mode to generate an interrupt every 100 ms. At each timer interrupt, the firmware copies the current zero-crossing count into a circular buffer of length 10, which thus stores the number of crossings observed in each of the last ten 100 ms intervals, corresponding to a sliding window of one second. After inserting the new value, the code resets the counter for the next interval and computes the sum of all ten buffer entries. This sum represents the total number of zero crossings observed during the last second. If this one-second zero-crossing count lies within a predefined range (between 6 and 12 crossings in the current implementation), the signal is classified as a siren: the microcontroller asserts a digital output driving an on-board LED and transmits the string “Siren” over the UART interface (115,200 baud). This decision step is executed at most once every 100 ms, as it is tied to the timer interrupt. If the condition is not satisfied, the LED is switched off, and no detection message is sent. The main program loop remains empty. All acquisition, feature accumulation and decision logic are handled within the interrupt service routines for the GPIO and timer, ensuring deterministic timing and very low computational complexity. The real-time behavior of the system is supported by the interrupt structure of the firmware: only a GPIO interrupt for transition counting and a Timer1 compare-match interrupt at 100 ms are used, and since interrupts are non-nested on the target microcontroller and the main loop remains empty, timing conflicts are not expected under normal operation.
The processing module is implemented on an Arduino Nano (Arduino SA, Somerville, MA, USA), chosen for its interrupt-capable digital input, stable timing reference for transition counting, straightforward programmability, and low cost. The architecture does not rely on floating-point operations or sampling. The microcontroller may be substituted with any similar embedded platform without altering the analog front end or detection logic. The algorithm is presented in detail in Appendix A. Detection results are forwarded to the user communication module. In the present prototype, the alert output is a visual LED indication, though any notification mechanism (audio, dashboard display, haptic feedback) may be integrated.
To facilitate reproducibility and to provide a consolidated view of the physical implementation, the key design parameters of each processing stage were summarized in Table 1. The stages are listed in the order of the signal flow, and the corresponding electrical values reflect the exact configuration used in the evaluation. This table complements the detailed descriptions given above and allows the complete architecture to be reviewed at a glance.
Table 1.
Summary of design parameters for each stage of the implemented detection system.
The complete detector was assembled on a custom printed circuit board designed in Proteus 8 (Labcenter Electronics Ltd., York, UK). The board integrates the power conversion stage, band-pass filter, envelope detector, comparator circuitry, and the interface header for connection to the microcontroller. The PCB was realized as a single-layer board using the press-and-peel fabrication method, which was chosen to support rapid prototyping and low production cost. For this reason, the routing and layer structure prioritize manufacturability and assembly convenience.
The board dimensions are approximately 11 cm × 6 cm. Standard practical constraints were applied during layout, including a minimum trace width and spacing of 0.5 mm and drill sizes of 0.8 or 1.0 mm depending on component lead diameter. A continuous ground region was included to simplify routing and to provide a stable reference for the analog stages, while keeping the layout compatible with single-layer fabrication.
The resulting PCB supports stable operation of all stages described previously and provides a physically robust platform for testing and characterization. A photograph of the assembled board and the corresponding layout are provided in Figure 8 and Figure 9.
Figure 8.
Assembled printed circuit board corresponding to the implemented detection system.
Figure 9.
Layout of the printed circuit board used for the siren detection prototype.
Oscilloscope (Hantek 5102P; Qingdao Hantek Electronic Co., Ltd., Qingdao, China) measurements were recorded at representative points in the analog chain to verify that the implemented circuitry produces the expected intermediate signal representations. A periodically swept sine signal was used as the test stimulus, generated artificially and played in a continuous loop. This signal provided controlled and repeatable sweep cycles, enabling clear visualization of the amplitude bursts, envelope formation, and threshold-crossing behavior that form the basis of the detection approach. A separate reference-tone measurement was also performed to document the nominal playback level used during evaluation.
Figure 10 shows the input signal on channel 1 (yellow, top) and the corresponding output of the band-pass filter and gain stage on channel 2 (blue, bottom). As the instantaneous frequency of the test sweep traverses the resonance frequency of the band-pass filter, the output of the filter exhibits pronounced amplitude bursts, while remaining near zero elsewhere. This behavior matches the intended function of the filtering stage: the continuous frequency modulation is converted into discrete narrowband pulses, each corresponding to a passage of the sweep through the filter passband. The amplified output ensures that these bursts reach sufficient amplitude for subsequent envelope extraction.
Figure 10.
The input signal on channel 1 (yellow, top) and the band-pass–filtered output on channel 2 (blue, bottom). Each burst corresponds to the sweep momentarily matching the filter’s resonance frequency.
Figure 11 displays the output of the band-pass filter and gain stage on channel 1, together with the output of the envelope detector (shown in Figure 6) on channel 2. The envelope follows the peaks produced by the filter while suppressing the carrier oscillation near the center frequency. The result is a sequence of well-separated envelope maxima, each aligned with one sweep cycle. The RC time constant of the detector produces a smooth and stable envelope profile without excessive smoothing, ensuring that individual events remain distinguishable for threshold comparison.
Figure 11.
The band-pass output on channel 1 (yellow, top) and the output of the envelope detector on channel 2 (blue, bottom).
Figure 12 presents the envelope detector output on channel 1 and the logic-level signal applied to the microcontroller input on channel 2. This signal corresponds to the output of the comparator, followed by the protection stage that limits the voltage swing to approximately 5.1 V to ensure compatibility with the microcontroller’s digital input. The comparator threshold used in the hardware implementation was set to 600 mV. On the oscilloscope screen, which was configured at 500 mV/division, this threshold corresponds to 1.2 vertical divisions. The envelope waveform on Channel 1 can therefore be seen crossing the threshold at predictable moments during each sweep cycle, producing clean rising and falling edges at the comparator output. These transitions form the binary event sequence accumulated by the microcontroller over the sliding one-second window.
Figure 12.
Envelope signal on channel 1 (yellow, top) and corresponding logic-level comparator output on channel 2 (blue, bottom), showing clean transitions generated whenever the envelope crosses the fixed threshold, forming the binary events counted by the microcontroller.
Figure 13 shows the calibration measurement used to document the playback level. A fixed 1 kHz reference tone was reproduced at the maximum output amplitude of the sound card. Channel 1 records the input signal, whose digital amplitude spans the nominal range of −1 to +1. This snapshot provides a reproducible reference point for anyone attempting to replicate the experimental setup, allowing the analog gains and sound-card level to be aligned with the conditions used in the present evaluation. In an acoustic transmission scenario involving loudspeakers, microphones, and analog front-end processing, an equivalent calibration procedure can be applied. In this case, the loudspeaker is driven with the same 1 kHz reference tone at the output level defined as the maximum, and the microphone and analog gain stages are adjusted such that the signal presented at the input of the detection system reaches the same reference level used in this work. By aligning the acoustic capture chain in this manner, the operating point of the detector remains consistent with the reported experiments, and the fixed comparator threshold of 600 mV can be retained without modification.
Figure 13.
Calibration snapshot showing the 1 kHz reference tone used to standardize playback level.
Together, the oscilloscope captures confirm that the implemented analog chain produces the intended sequence of transformations: narrowband amplitude pulses at the filter output, a clean envelope with well-separated peaks, and a binary transition signal suitable for the microcontroller-based rate evaluation. These measurements validate the functional behavior of each stage and demonstrate the consistency between the conceptual detection principle and its physical realization.
An approximate power budget was derived to support embedded deployment considerations. The Arduino Nano board is specified to draw approximately 19 mA at 5 V when powered using the USB connector. The analog front end is dominated by the quiescent currents of the op-amp and comparator stages supplied from the ±12 V rails; for commonly used audio op-amps operating at low signal levels, this corresponds to currents in the low milliampere range, resulting in an estimated additional consumption on the order of 0.1–0.3 W, depending on the specific devices used. Under typical operating conditions, the total power consumption of the detector electronics, excluding the indicator LED used during experiments, is therefore expected to remain below approximately 0.4 W. As a conservative upper bound, the employed ±12 V DC–DC converter is rated to supply up to 30 mA per rail, corresponding to a maximum analog-rail power of 0.72 W; when combined with the Arduino Nano consumption, this places the absolute upper bound of the complete system below approximately 0.85 W.
2.4. Evaluation Methodology
The performance of the implemented detector was evaluated using a controlled testing setup in which recorded audio signals were played back into the input of the hardware system, and the resulting detection output was monitored and logged. The evaluation focused on verifying whether the transition-rate based detection principle remains effective under real-world acoustic variability and non-ideal hardware behavior.
2.4.1. Test Signals
The test signals were drawn from a publicly available dataset of recordings containing emergency vehicle sirens and general driving noise [38]. The dataset includes over 1000 audio clips recorded under varying driving conditions, background noise levels, and siren proximity. These recordings contain naturally occurring amplitude fluctuations, reverberation, Doppler effects, and partial occlusions, making them suitable for assessing robustness. The names of the files used in the experiments are provided in Appendix B.
All recordings were played back at the maximum output level of the sound card to ensure consistency. A reference amplitude measurement at 1 kHz is included in Section 2.3, to establish the nominal test playback level. Since the proposed detection system does not involve any training, learning, or data-driven parameter optimization, the dataset was not divided into training, validation, or test subsets. All available recordings were used exclusively for evaluation purposes. The detector parameters, including filter characteristics and decision thresholds, were fixed a priori based on the system design and were not adjusted using the evaluation data. This ensures that the reported performance reflects the behavior of a fully specified detector operating on previously unseen signals, rather than results influenced by data-dependent tuning.
2.4.2. Test Setup
The evaluation setup is shown in Figure 14 and consists of the following elements:
Figure 14.
Experimental setup showing playback, hardware prototype, and measurement instruments used for the evaluation.
- A computer used to play audio signals from the dataset at a controlled output level;
- The hardware detection board described in Section 2.3;
- A digital oscilloscope used to monitor signals at multiple points in the processing chain.
The playback output of the computer was connected directly to the input of the hardware detector using a shielded audio cable to ensure a stable and repeatable stimulus. All ground references were shared between the computer, detection board, and oscilloscope. Direct electrical playback was used to preserve the fidelity and reproducibility of the original real-world recordings; acoustic replay through loudspeakers and microphones would introduce experiment-specific reverberation and transducer effects, making the evaluation dependent on the test environment rather than on the detector itself.
2.4.3. Detection Procedures
Each test signal (siren or environmental noise) was played from the computer into the hardware prototype. As soon as the detection conditions were met, the embedded system issued “Siren” messages over the serial interface. All transmitted messages were recorded into a CSV (Comma-Separated Values) file containing four fields:
- file—the audio file name (.wav) being played;
- class—ground-truth label (“siren” or “noise”);
- t_seconds—time stamp of the serial message (in seconds);
- raw_serial—complete message string received over the serial port.
Each occurrence of the token “Siren” corresponded to a detection event emitted by the algorithm running on the device. The resulting event times were reconstructed offline to recover the full time series of detections for each file. The playing and capturing of the tokens were performed using Python 3.14 (Python Software Foundation, Beaverton, OR, USA). All later analyses were performed on this CSV log, without rerunning the embedded system.
Three families of detection procedures were tested. All were designed to be deployable, meaning they could operate causally on an incoming event stream in real time.
- 1.
- Single-Event Rule
The simplest decision rule: a file is classified as siren if at least one “Siren” event is present in its log. This simulates a detector that triggers on any isolated positive response. It serves as the baseline performance of the hardware device.
- 2.
- Consecutive-Event Rules
These rules require a minimum number of consecutive events within a short time interval and can be summarized as: trigger if N consecutive detections occur with a time gap If the gap between two events exceeds the threshold, the counter resets. This rule enforces temporal consistency and eliminates spurious isolated detections. The parameter was varied from 3 to 8 to study the trade-off between responsiveness and robustness.
- 3.
- Window-Based Rules
Instead of strict consecutiveness, these rules check for density of events in a sliding time window of fixed length (1 s) and can be summarized as: trigger if at least N events occur within any 1 s time window. This approach captures periodic siren patterns even if a few events are missed, while still rejecting sparse false alarms. The threshold was varied between 4 and 10.
2.4.4. Performance Metrics
To evaluate the detection procedures, each audio file was given a binary decision (“siren detected” or “siren not detected”), based on the previously described rules. Comparing these decisions with the ground-truth labels yields the confusion matrix, which forms the basis of all performance metrics. Each file contributes to exactly one of four categories: true positive (TP—the detector correctly identifies a siren file as siren), false negative (FN—the detector fails to detect the siren when playing a siren file), false positive (FP—the detector incorrectly classifies a noise file as siren), true negative (TN—the detector correctly identifies a noise file as noise). These values are used in all the other metrics derived, presented below.
While the evaluation presented in this work focuses on file-level classification performance rather than explicit latency benchmarking, the detection latency of the embedded system is bounded and deterministic. Detection decisions are evaluated periodically and depend on the accumulation of threshold-crossing events required by the selected rule. Under conservative configurations, such as window-based rules with larger values of and lower crossing densities, the effective latency may approach 2 s. In contrast, permissive configurations and higher crossing rates yield substantially faster responses, faster than one second. The resulting trade-off between responsiveness and robustness is reflected in the comparative performance trends reported in Section 3.
- 1.
- True Positive Rate (TPR/Sensitivity/Recall)
TPR quantifies the proportion of actual siren files that were correctly detected. It measures the detector’s ability to identify siren signals when they are present. This metric is computed using:
High TPR corresponds to a low miss rate.
- 2.
- False Positive Rate (FPR)
FPR measures the proportion of noise-only files that were incorrectly classified as containing a siren. It reflects a detector’s propensity to raise false alarms. It is calculated as:
- 3.
- Precision (Positive Predictive Value, PPV)
Precision quantifies the reliability of a positive decision by expressing the proportion of positive detections that correspond to true siren files. The metric is calculated with:
- 4.
- F1-score
The F1-score provides a single combined indicator of detection quality by taking the harmonic mean of precision and sensitivity. It is useful when a balance between missed detections and false alarms is desired. It is computed as:
- 5.
- Balanced accuracy
Balanced accuracy accounts for class imbalance by averaging the sensitivity (TPR) and specificity (1−FPR). It reflects overall classification performance without being biased toward the majority class. The formula is:
- 6.
- Matthews Correlation Coefficient (MCC)
MCC is a correlation-based metric that summarizes the entire confusion matrix. It is particularly informative when the classes are imbalanced, since it considers all four matrix entries. The coefficient ranges from −1 (perfect misclassification) to +1 (perfect classification), with 0 indicating a performance no better than random. It is calculated as:
To quantify the statistical reliability of the reported TPR and FPR values, 95% confidence intervals were computed using the Wilson score interval [39]. A confidence interval indicates the range of plausible values for the true underlying performance if the experiment were repeated many times with similar data. The Wilson method was chosen because it remains accurate even when proportions are close to 0 or 1, where the standard normal approximation tends to become biased. In practical terms, the interval captures the expected variation due to the finite number of test files and allows comparison of detection rules while accounting for statistical uncertainty.
- 1.
- Specificity
Specificity quantifies the proportion of noise-only files that were correctly identified as negative. It complements the false positive rate by describing how reliably the detector avoids false alarms when no siren is present. The metric is defined as:
High specificity indicates stable negative decisions and low susceptibility to spurious detections. It forms a natural counterpart to sensitivity when characterizing binary detection systems.
- 2.
- Youden’s J statistic
Youden’s J statistic provides a single measure of overall discrimination performance by combining sensitivity and specificity into a unified index. The value ranges from 0 (no discriminatory ability) to 1 (perfect separation between classes). It is computed as:
The J statistic can be interpreted as the maximum vertical distance between the receiver operating characteristic (ROC) curve and the diagonal line associated with random guessing. By combining correct positive and correct negative decisions, it offers a compact measure that captures both types of classification capability.
- 3.
- Accuracy
Accuracy measures the proportion of all correctly classified files—both siren and noise—relative to the total number of evaluated files. It is defined as:
Although accuracy can be misleading in imbalanced datasets, it remains widely used in the siren-detection literature. It is therefore included here to enable direct comparison with previously reported results and with other baseline methods discussed later in the manuscript.
3. Results
This section presents the outcomes of the evaluation performed on all detection rules. The results are organized to show how each configuration behaved on the test dataset, first through summary tables of the main performance metrics and then through graphical views that illustrate the trends across rules.
3.1. Overview of Evaluation Dataset
The evaluation dataset is available in [38] and contains 253 yelp siren files and 868 road-noise files selected according to the file names provided in Appendix B. The embedded platform produced raw serial outputs during playback, from which all detection events were reconstructed offline. Each detection rule was applied independently to these time series, ensuring identical conditions for all methods.
3.2. Performance Comparison
Before examining the detailed tables and figures, it is useful to summarize the main numerical outcomes. Across all evaluated rules, true positive rates ranged from 0.881 to 0.945, while false positive rates ranged from 0.01 to 0.046. The best overall balance was achieved by the window-based rule with , which attained a true positive rate of 0.881 at a false positive rate of 0.01, corresponding to an accuracy of 96.52% and a Matthews correlation coefficient of 0.899. These values represent the recommended operating point when robust detection with minimal false alarms is required.
Table 2 and Table 3 summarize the performance of all evaluated detection rules. Table 2 reports the confusion-matrix values and the main derived metrics (True Positive Rate—TPR, False Positive Rate—FPR, Precision, F1-score, Balanced Accuracy, Specificity, Youden’s J statistic, and Matthews Correlation Coefficient—MCC), and Table 3 provides confidence intervals together with additional indicators. These results allow direct comparison across all rules because they were evaluated on the same dataset.
Table 2.
Performance metrics for all detection rules. Bold values indicate the best performance per metric.
Table 3.
Confidence intervals and additional performance indicators for all detection rules. Bold values denote the best values per metric.
Based on the derived metrics in Table 2 and Table 3, the rule Window N = 10 achieved the largest number of best-performing values across all metrics, with strengths in FPR, Precision, F1-score, MCC, and Specificity. When FPR is excluded from this comparison, the rule still retained the highest number of best values. The highest balanced accuracy was produced by rule Consecutive N = 3, and the highest specificity corresponded to rules Consecutive N = 10 and Window N = 10.
Several graphical summaries further illustrate the behavior of the detection rules. The TPR–FPR scatter plot (Figure 15) shows the operating points of all rules. The lowest FPR was obtained by rules Consecutive N = 10 and Window N = 10, while the highest TPR corresponded to single event rule. Within each rule family, increasing the parameter N shifted the operating point toward lower false-positive rates and moderately lower sensitivity.
Figure 15.
TPR–FPR plot showing the operating points of all evaluated detection rules.
The Precision–Recall plot (Figure 16) shows the complementary relationship between precision and recall. The highest precision was obtained by rules Consecutive N = 10 and Window N = 10, and the highest recall again corresponded to the single event rule.
Figure 16.
Precision–recall plot showing the operating points of all evaluated detection rules.
The MCC ranking (Figure 17) provides a single-metric ordering across all configurations. The highest MCC value was achieved by rule Window N = 10, with several neighboring configurations attaining closely similar values.
Figure 17.
Ranking of all detection rules by MCC.
Finally, a Pareto frontier was constructed using TPR and FPR as competing objectives (Figure 18). The Pareto-optimal set consisted of a mixture of consecutive and window-based rules, which represent all configurations that cannot be simultaneously improved in both metrics.
Figure 18.
Pareto frontier of TPR vs. FPR, showing all non-dominated detection rules.
Together, these plots provide a comprehensive depiction of the trade-offs between sensitivity, false-alarm suppression, and overall classification balance across the tested detection rules. Several configurations produced closely similar performance across multiple metrics, as indicated by the small variation among the top-performing rules.
4. Discussion
This section provides an integrated interpretation of the detector’s performance and its relevance for practical deployment. The main empirical findings are first summarized to highlight the behaviors consistently observed across all rule families. These behaviors are then explained in terms of the underlying detection mechanism, clarifying how temporal consistency requirements shape sensitivity and robustness. The results are further positioned relative to representative approaches in the literature, enabling a direct understanding of how the fixed-threshold, rate-based design compares with established signal-processing and learning-based methods. Considerations related to operating-point selection and limitations of the present evaluation are subsequently addressed to outline the conditions under which the detector is expected to operate reliably.
4.1. Summary of Main Findings
The evaluation across all detection rules showed that reliable siren detection can be achieved using a fixed-threshold, rate-based approach implemented on low-complexity embedded hardware with limited processing capability. When applied to a diverse data set of real recordings, the rules produced consistent behavior and exhibited clear performance trends as the decision parameter N was varied. The rule Window N = 10 attained the largest number of best-performing metrics, with notable strengths in FPR, Precision, F1-score, MCC, and Specificity, while several neighboring configurations achieved closely similar results. The highest sensitivity was obtained by the single event rule, whereas the lowest false-positive rate corresponded equally to Consecutive and Window rules with N = 10. Balanced accuracy and specificity were maximized by rule Consecutive N = 3 and, again, Consecutive and Window rules with N = 10, respectively. The MCC analysis further indicated that rule Window N = 10 achieved the highest overall classification balance, with a compact group of rules forming a cluster of near-optimal performance. The Pareto frontier analysis identified 11 out of 18 configurations that cannot be simultaneously improved in both sensitivity and false-alarm suppression. Taken together, these findings show that several rule configurations achieve strong performance across different criteria, and that the parameter N provides a predictable tuning mechanism for navigating the trade-off between sensitivity and robustness.
4.2. Interpretation of Rule Behaviors
The observed performance trends can be explained by the structure of the detection mechanism and the way temporal constraints influence threshold-crossing activity. The single-event rule displayed the highest sensitivity because it triggers on any isolated threshold-crossing event. Even weak or partially occluded siren segments are therefore sufficient to produce a positive response. This permissive behavior, however, also increases vulnerability to noise-driven excursions of the band-pass output, which accounts for the elevated false-positive rates observed for this rule.
For both consecutive-based and window-based rules, increasing the decision parameter N produced a monotonic reduction in false positives accompanied by a corresponding reduction in sensitivity. This outcome follows directly from the temporal consistency requirement: larger values of N demand either longer uninterrupted sequences of crossings or a denser accumulation of them within the analysis window. As a result, isolated noise-triggered crossings are rejected, but brief interruptions in the sweep-induced sequence may also prevent detection. The consistency of these monotonic trends across metrics confirms that the rate-based decision process behaves predictably when temporal thresholds are adjusted.
The window-based rules, particularly at larger N, achieved strong robustness because the sliding-window criterion tolerates occasional missed crossings while still capturing the densest parts of the sweep cycle. This provides resilience against fluctuations in envelope amplitude, minor deviations in sweep periodicity, and variations introduced by real-world acoustics. In contrast, consecutive-based rules require strictly uninterrupted sequences, making them more sensitive to local gaps in threshold-crossing activity but highly effective in filtering out sporadic noise events.
The strong performance of the rules with N = 10 reflects the stability and regularity of the yelp sweep present in the recordings. The sweep produces a characteristic number of threshold crossings per second, and this feature is captured effectively when a long consecutive sequence or a dense sliding window is required. At the same time, the peak in balanced accuracy at N = 3 under the consecutive rule shows that moderate temporal consistency already yields a favorable compromise between sensitivity and false-alarm suppression before stricter constraints begin to reduce recall more sharply.
Taken together, these behaviors show that the detector responds to temporal constraints in a manner consistent with the underlying sweep structure of the siren signal. Both dense-window and long-consecutive rules capitalize on the periodicity of the sweep, and their relative strengths arise from how each formulation handles variability in crossing patterns produced by real in-cabin audio conditions.
4.3. Comparison with Literature
To contextualize the performance of the proposed detector, Table 4 summarizes representative results reported in prior work together with high-level implementation characteristics. Accuracy is the primary metric reported in most of these studies; therefore, accuracy was computed for all rules evaluated in the present work to enable direct comparison. In addition to accuracy, the reported implementation details provide qualitative insight into differences in algorithmic complexity, processing pipelines, and degree of deployment realism across the compared systems.
Table 4.
Accuracy comparison with selected systems and representative implementation characteristics.
Table 4 shows that prior work spans a broad accuracy range, from approximately 80% for early pitch-based or classical spectrogram approaches to above 98% for recent deep-learning systems that rely on convolutional, Mel-Frequency Cepstral Coefficients (MFCC)-based, or transformer-driven architectures, which typically involve substantially higher model complexity and more elaborate data-processing pipelines. These methods differ considerably in computational requirements, data-processing pipelines, and reliance on large training datasets.
To make the comparison consistent, accuracy was computed for each rule evaluated in this study. The highest value, obtained by the window-based rule with N = 10, reached 96.52%, which exceeds the performance of several traditional digital signal processing (DSP) and Support Vector Machine (SVM)-based methods [6,7,10,18,22], and is comparable to the accuracy reported for early Convolutional Neural Networks (CNN)-based systems [23]. Although this value remains below the accuracy of recent deep-learning pipelines that reach 98–99% [19,28,30], the difference must be interpreted in light of the markedly different algorithmic complexity, processing pipelines, and computational demands of these approaches.
A central distinction between the present detector and many methods listed in Table 4 is the simplicity and interpretability of the underlying processing pipeline. High-performing deep-learning approaches typically require multi-stage feature extraction, high-dimensional spectral representations, model training, and inference on computationally intensive architectures. In contrast, the detector evaluated in this work operates using a fixed-threshold, rate-based mechanism implemented on low-complexity embedded hardware with limited processing capability. Achieving 96.52% accuracy on real in-cabin recordings under such constraints demonstrates that the periodic sweep structure of the yelp siren provides a sufficiently strong and stable cue to support effective detection without reliance on spectrograms, machine-learning classifiers, or neural-network inference.
4.4. False Positive Analysis
A small subset of environmental-noise recordings produced false detections under the single-event rule. The affected files were: road31.wav, road32.wav, road33.wav, road70.wav, road71.wav, road103.wav, road104.wav, road105.wav, road142.wav, road143.wav, road225.wav, road243.wav, road244.wav, road245.wav, road255.wav, road258.wav, road259.wav, road267.wav, road270.wav, road271.wav, road273.wav, road367.wav, road394.wav, road410.wav, road411.wav, road414.wav, road416.wav, road419.wav, road432.wav, road435.wav, road533.wav, road534.wav, road549.wav, road562.wav, road574.wav, road688.wav, road797.wav, road806.wav, road807.wav, and road828.wav. This list documents the behavior of the least selective configuration; however, detailed inspection was not performed for this larger set, since the single-event rule is not intended as the primary operating point.
A targeted analysis was performed for the highest-performing configuration, the Window N = 10 rule. All false alarms under this rule were restricted to nine recordings: road33.wav, road104.wav, road105.wav, road244.wav, road245.wav, road259.wav, road435.wav, road688.wav, and road807.wav. These nine cases account for approximately 1% of the 868 noise-only files, indicating that false detections arose only under specific acoustic conditions. The identical false-positive set observed for the Consecutive N = 10 rule further suggests that these events were driven by the recordings themselves rather than by the particular temporal formulation of the decision rule.
Inspection of the nine recordings revealed a consistent underlying mechanism. Each contained a short segment of periodic or quasi-periodic impulsive energy that produced threshold-crossing sequences within the accepted transition-rate interval. In road33.wav, ten events occurred between approximately 8.93 s and 9.83 s, generated by a rigid object striking the ground periodically as a wheel rotated. A similar pattern appeared toward the end of road105.wav. In road244.wav, a quieter impulse sequence around second 4 produced detections, whereas road259.wav contained impacts originating from a vibrating metallic vehicle component near second 7. Comparable undulating or vibrating structures were encountered in road435.wav (around second 3) and road688.wav (around second 7). Although the physical causes varied, each case involved a brief mechanically induced periodicity that momentarily resembled the transition density produced by a yelp sweep.
These observations show that false alarms at this operating point were caused not by typical broadband road noise but by rare mechanical events with structured temporal characteristics. The Window N = 10 rule therefore offers high robustness: false positives were confined to a small number of explainable cases while a high sensitivity was retained.
4.5. Practical Operating Point Selection
Based on the comprehensive evaluation in Section 3, the window-based rule with is identified as the recommended operating point, providing the most favorable balance between sensitivity, false-positive suppression, and overall classification robustness.
The choice of an appropriate operating point depends on the balance between sensitivity and robustness required by the intended application. As shown in Section 3, the single-event rule yields the highest sensitivity but also the highest false-positive rate, making it suitable only when occasional false alarms are acceptable and rapid response is essential.
Rules with moderate temporal requirements, such as consecutive thresholds with small N, provide an effective compromise by suppressing isolated noise-driven events while maintaining high detection rates. For example, Consecutive N = 3 achieved the highest balanced accuracy, illustrating that moderate consistency constraints already deliver substantial improvements in robustness.
The strongest suppression of false positives was obtained for larger values of N. The Window N = 10 rule achieved the highest overall accuracy, precision, F1-score, specificity, and MCC among all tested configurations, and it lay on the Pareto frontier in the TPR–FPR space. Its performance reflects a favorable balance in which robust false-positive suppression is achieved without excessive loss of sensitivity.
To evaluate the feasibility of even stricter operation, additional configurations were examined. Increasing the threshold to Consecutive N = 12 reduced the number of false positives to one (road244.wav), with a true positive rate of 83.3%. A two-second window with N = 14 yielded the same single false positive with a slightly higher true positive rate of 84.9%. Zero false positives were achieved with Consecutive N = 18 (TPR = 76.2%) and with a two-second window using N = 18 (TPR = 79.4%). These results confirm that near-zero or zero-false-positive operation is achievable within the same rate-based detection framework, but only at the cost of a marked reduction in sensitivity.
Across all rule families, the monotonic influence of N provides a predictable mechanism for adapting the detector to different deployment requirements. Lower thresholds favor responsiveness, whereas higher thresholds improve robustness. The Window N = 10 rule represents a practical balance in this trade-off and is therefore well suited for applications in which false alarms must be minimized without compromising detection reliability.
4.6. Limitations
The dataset used in this study is large and diverse, and it includes many realistic acoustic conditions such as traffic noise, honks, police whistles, and various industrial or construction-related sounds. While broad, it does not cover every acoustic situation that may occur during driving. Certain environments, such as rural areas with pronounced wind noise, roadside musical events, or other unusual soundscapes, were not represented and could introduce acoustic structures not encountered in the present evaluation.
The main challenge for the detector arises when non-siren sounds exhibit periodic or quasi-periodic behavior near the selected reference frequency, as these can resemble fragments of the threshold-crossing pattern used for detection. Such cases were infrequent in the dataset, and the effect was significantly reduced for rules with larger values of N, at the expected cost of lower sensitivity.
The evaluation relied on a standardized playback-based methodology that is commonly employed in the literature on siren and audio-event detection. This approach ensures consistent conditions across tests and enables fair comparison with prior work. Nevertheless, integrated vehicle-level testing may introduce additional factors, such as microphone placement, cabin acoustics, vibration, and electrical noise, which remain to be assessed in future studies.
The analog front end relies on a multiple-feedback band-pass filter whose center frequency and quality factor are set by passive component values. Using the ideal filter relations, the nominal design yields Hz and . Under common general-purpose tolerances (±1% resistors and ±10% capacitors), a worst-case corner analysis predicts variations in the range of approximately 874–1090 Hz and variations of approximately 18–22.4. These bounds indicate that moderate component tolerances primarily shift the reference frequency and bandwidth while preserving the qualitative detection mechanism, since the yelp siren sweep spans a wide frequency range and crosses the passband reliably even under such deviations. Only a single hardware prototype was fabricated and evaluated in this study; therefore, statistical assessment of performance variability across multiple boards was not possible. A systematic experimental analysis of sensitivity to component tolerances would require the fabrication and characterization of multiple realizations and is considered outside the scope of the present work.
In addition to static component tolerances, temperature variation may also affect the analog front end through the temperature coefficients of passive components. Based on the ideal multiple-feedback relations and representative general-purpose temperature coefficients (approximately 50 ppm/°C for metal-film resistors, 30 ppm/°C for the smaller capacitor, and 100 ppm/°C for the larger capacitor), the expected temperature-induced drift of the band-pass parameters remains moderate. Over a representative 125 °C operating span, the resulting center-frequency shift is on the order of ±1.4% around the nominal design point, while the associated quality-factor variation is below ±0.5% around Q ≈ 20. Such gradual parameter shifts primarily translate into a small displacement of the effective reference region within the siren sweep and are therefore not expected to invalidate the underlying detection mechanism. Temperature effects and automotive electromagnetic interference (EMI) were not explicitly evaluated experimentally, as the present study relied on a single laboratory prototype. While the analog filtering and envelope-based processing inherently attenuate high-frequency disturbances, a comprehensive assessment of temperature robustness and EMI susceptibility would require controlled temperature variation infrastructure and standardized environmental and EMC testing.
Besides the limitations discussed above, the present study did not explicitly isolate scenarios involving overlapping sirens or extreme acoustic interference. Importantly, however, the evaluation was conducted exclusively on a large set of real-world recordings, which inherently include uncontrolled variability in traffic density, background noise, reverberation, and incidental acoustic events. When multiple sirens are simultaneously present, their combined sweep activity may increase the density of threshold-crossing events and, in unfavorable cases, shift the measured rate outside the predefined acceptance interval. Nevertheless, the relatively broad rate window used in this study mitigates this effect for many overlap configurations.
5. Conclusions
In this work, a complete and deployable hardware realization of a low-complexity yelp siren detector was presented and systematically evaluated under realistic acoustic conditions. In contrast to a large portion of the existing siren-detection literature, where validation is predominantly performed in simulation or through offline processing pipelines, the present study reported a physical implementation whose behavior inherently reflects real component tolerances, analog non-idealities, and embedded timing constraints. The proposed system was based on a fixed-threshold, rate-based detection principle that exploits the inherent periodic sweep symmetry of the yelp siren, rather than relying on conventional spectral analysis, feature extraction, or machine-learning-based classification. By translating the frequency-modulated sweep into a sequence of threshold-crossing events and evaluating their temporal density, reliable siren detection was achieved with minimal computational overhead and high interpretability.
The detector was implemented using a compact analog front end combined with a simple interrupt-driven microcontroller algorithm. All processing was performed without digital sampling, floating-point arithmetic, or trained models, resulting in a transparent and resource-efficient architecture suitable for embedded deployment. Oscilloscope measurements confirmed that each processing stage behaved as intended, demonstrating a clear correspondence between the conceptual detection principle and its physical realization.
Performance evaluation was conducted using more than 1000 real-world audio recordings containing yelp sirens and diverse environmental noise conditions. Across all tested rule families, consistent and predictable performance trends were observed as the temporal decision parameter was varied. The window-based rule with N = 10 provided the most favorable overall operating point, achieving the highest accuracy (96.52%), precision, F1-score, specificity, and Matthews correlation coefficient, while maintaining a low false-positive rate of approximately 1%. Several neighboring configurations exhibited closely similar performance, indicating that the detector is robust to moderate parameter variation.
Comparison with representative methods reported in the literature showed that the proposed hardware system outperformed multiple traditional DSP- and SVM-based approaches and achieved accuracy comparable to early CNN-based solutions, despite operating under substantially stricter computational and architectural constraints. Although recent deep-learning systems reported higher peak accuracies, these gains were obtained at the cost of increased complexity, reduced interpretability, and reliance on large training datasets. The results of this study demonstrate that a carefully designed, symmetry-driven detection mechanism can close much of the performance gap while preserving simplicity and transparency, while also providing evidence that these benefits persist when the algorithm is embodied in real hardware rather than an idealized simulation environment.
False-positive analysis revealed that remaining misclassifications were caused by rare, mechanically induced periodic noise events that temporarily mimicked the temporal structure of a yelp sweep. These cases were consistent across rule formulations and were effectively suppressed by increasing the temporal consistency requirement, confirming that near-zero or zero–false-positive operation is achievable within the same detection framework, albeit with an expected reduction in sensitivity. The monotonic and predictable influence of the decision parameter provides a straightforward means of adapting the detector to application-specific requirements.
Overall, the findings establish that fixed-threshold, rate-based siren detection constitutes a viable and competitive alternative to more complex approaches when low power consumption, interpretability, and deployability are primary design objectives. The presented system demonstrates a complete pathway from detection principle to functional embedded hardware, validated under realistic conditions and reflecting practical implementation constraints. Future work may focus on adaptive thresholding mechanisms, in-vehicle testing, and the exploration of multi-band extensions to assess the associated performance–complexity trade-offs, with the aim of further enhancing robustness and broadening applicability while preserving the core advantages of the proposed architecture, as well as extension of the framework to additional siren types discrimination. Extending the rate-based framework to other siren types represents an interesting direction for future work. Wail sirens, which exhibit slower frequency modulation, could in principle be addressed by adapting temporal decision parameters, albeit at the cost of increased detection latency. Hi-lo sirens, which alternate between quasi-stationary tones rather than continuous sweeps, would likely require architectural extensions such as multiple band-pass channels and modified temporal logic. The feasibility and robustness of such extensions, including their sensitivity to inter-manufacturer variability, remain open questions.
Author Contributions
Conceptualization, E.-V.D. and R.A.D.; methodology, E.-V.D. and R.-A.B.; software, E.-V.D. and R.A.D.; validation, E.-V.D., R.A.D., R.-A.B. and R.R.; formal analysis, E.-V.D.; investigation, E.-V.D. and R.-A.B.; resources, R.-A.B.; data curation, E.-V.D.; writing—original draft preparation, E.-V.D., R.R. and R.A.D.; writing—review and editing, E.-V.D., R.A.D., R.-A.B. and R.R.; visualization, E.-V.D.; supervision, R.A.D. and R.R.; project administration, R.A.D.; funding acquisition, not applicable. All authors have read and agreed to the published version of the manuscript.
Funding
This research received no external funding.
Data Availability Statement
The data used in this study are available at https://doi.org/10.1038/s41597-022-01727-2, reference number [38]. The list of exact signals that were used in the evaluation process is available in Appendix B.
Conflicts of Interest
The authors declare no conflicts of interest.
Appendix A
The algorithm implemented on the Arduino board is divided into three parts, one initialization and two interrupt service routines, presented below, and is based on the following parameters:
- , total observation window
- , sub-window duration
- , number of sub-windows in 1 s
- , minimum crossings per second for siren
- , maximum crossings per second for siren
| Algorithm A1. Initialization |
| 1 sirenDetected ← FALSE |
| 2 count ← 0 // crossings in current 0.1 s interval |
| 3 index ← 0 // circular buffer index |
| 4 for n ← 0 to Nsub − 1 do |
| 5 crossings[n] ← 0 // buffer of last 10 sub-window counts |
| 6 end for |
| 7 Configure external interrupt on GPIO input pin to trigger on any edge. |
| 8 Configure hardware timer to generate an interrupt every Tsub = 0.1 s. |
| 9 Configure LED pin as output and set LED ← OFF. |
| 10 Configure UART at 115200 baud. |
| Algorithm A2. GPIO pin interrupt service routine |
| 1 count ← count + 1 // increment number of threshold crossings |
| Algorithm A3. 100 ms interrupt service routine |
| 1 crossings[index] ← count // store current sub-window count |
| 2 count ← 0 // reset counter for next 0.1 s sub-window |
| 3 index ← index + 1 // advance circular buffer index |
| 4 if index = Nsub then |
| 5 index ← 0 |
| 6 end if |
| 7 sumCross ← 0 // compute total crossings over last 1 s |
| 8 for n ← 0 to Nsub − 1 do |
| 9 sumCross ← sumCross + crossings[n] |
| 10 end for |
| 11 if (Cmin ≤ sumCross) and (sumCross ≤ Cmax) then |
| 12 sirenDetected ← TRUE // rate within target interval → siren detected |
| 13 Set LED ← ON |
| 14 Transmit UART message “Siren” |
| 15 else |
| 16 sirenDetected ← FALSE |
| 17 Set LED ← OFF |
| 18 end if |
Appendix B
| Yelp Siren Signal Files from the Dataset in [38] Used in the Experiments | |||
| ambulance10.wav | ambulance297.wav | ambulance663.wav | ambulance723.wav |
| ambulance100.wav | ambulance298.wav | ambulance664.wav | ambulance725.wav |
| ambulance101.wav | ambulance299.wav | ambulance665.wav | ambulance726.wav |
| ambulance102.wav | ambulance30.wav | ambulance666.wav | ambulance727.wav |
| ambulance103.wav | ambulance316.wav | ambulance667.wav | ambulance728.wav |
| ambulance104.wav | ambulance317.wav | ambulance668.wav | ambulance729.wav |
| ambulance105.wav | ambulance318.wav | ambulance669.wav | ambulance730.wav |
| ambulance106.wav | ambulance319.wav | ambulance670.wav | ambulance731.wav |
| ambulance107.wav | ambulance320.wav | ambulance671.wav | ambulance732.wav |
| ambulance109.wav | ambulance321.wav | ambulance672.wav | ambulance733.wav |
| ambulance110.wav | ambulance322.wav | ambulance673.wav | ambulance734.wav |
| ambulance111.wav | ambulance323.wav | ambulance674.wav | ambulance735.wav |
| ambulance112.wav | ambulance324.wav | ambulance675.wav | ambulance736.wav |
| ambulance119.wav | ambulance325.wav | ambulance676.wav | ambulance737.wav |
| ambulance120.wav | ambulance330.wav | ambulance677.wav | ambulance738.wav |
| ambulance121.wav | ambulance331.wav | ambulance678.wav | ambulance741.wav |
| ambulance122.wav | ambulance332.wav | ambulance679.wav | ambulance745.wav |
| ambulance123.wav | ambulance333.wav | ambulance680.wav | ambulance746.wav |
| ambulance124.wav | ambulance334.wav | ambulance681.wav | ambulance747.wav |
| ambulance125.wav | ambulance338.wav | ambulance682.wav | ambulance755.wav |
| ambulance126.wav | ambulance339.wav | ambulance684.wav | ambulance757.wav |
| ambulance127.wav | ambulance34.wav | ambulance685.wav | ambulance767.wav |
| ambulance129.wav | ambulance340.wav | ambulance686.wav | ambulance768.wav |
| ambulance13.wav | ambulance341.wav | ambulance687.wav | ambulance769.wav |
| ambulance14.wav | ambulance342.wav | ambulance688.wav | ambulance770.wav |
| ambulance142.wav | ambulance344.wav | ambulance689.wav | ambulance771.wav |
| ambulance143.wav | ambulance345.wav | ambulance690.wav | ambulance773.wav |
| ambulance144.wav | ambulance346.wav | ambulance691.wav | ambulance774.wav |
| ambulance145.wav | ambulance35.wav | ambulance692.wav | ambulance775.wav |
| ambulance146.wav | ambulance36.wav | ambulance693.wav | ambulance789.wav |
| ambulance147.wav | ambulance364.wav | ambulance694.wav | ambulance790.wav |
| ambulance148.wav | ambulance365.wav | ambulance695.wav | ambulance791.wav |
| ambulance15.wav | ambulance366.wav | ambulance696.wav | ambulance792.wav |
| ambulance16.wav | ambulance367.wav | ambulance698.wav | ambulance804.wav |
| ambulance2.wav | ambulance37.wav | ambulance699.wav | ambulance805.wav |
| ambulance27.wav | ambulance375.wav | ambulance700.wav | ambulance806.wav |
| ambulance277.wav | ambulance376.wav | ambulance701.wav | ambulance807.wav |
| ambulance278.wav | ambulance377.wav | ambulance702.wav | ambulance808.wav |
| ambulance279.wav | ambulance378.wav | ambulance703.wav | ambulance809.wav |
| ambulance28.wav | ambulance379.wav | ambulance704.wav | ambulance810.wav |
| ambulance280.wav | ambulance38.wav | ambulance705.wav | ambulance816.wav |
| ambulance281.wav | ambulance412.wav | ambulance706.wav | ambulance817.wav |
| ambulance282.wav | ambulance449.wav | ambulance709.wav | ambulance818.wav |
| ambulance286.wav | ambulance464.wav | ambulance711.wav | ambulance833.wav |
| ambulance288.wav | ambulance516.wav | ambulance712.wav | ambulance834.wav |
| ambulance289.wav | ambulance529.wav | ambulance713.wav | ambulance835.wav |
| ambulance29.wav | ambulance634.wav | ambulance714.wav | ambulance836.wav |
| ambulance291.wav | ambulance635.wav | ambulance716.wav | ambulance837.wav |
| ambulance292.wav | ambulance654.wav | ambulance717.wav | ambulance844.wav |
| ambulance293.wav | ambulance655.wav | ambulance718.wav | ambulance849.wav |
| ambulance294.wav | ambulance656.wav | ambulance720.wav | ambulance854.wav |
| ambulance295.wav | ambulance658.wav | ambulance721.wav | ambulance855.wav |
| ambulance296.wav | ambulance662.wav | ambulance722.wav | ambulance856.wav |
| ambulance861.wav | ambulance892.wav | ambulance914.wav | ambulance93.wav |
| ambulance862.wav | ambulance893.wav | ambulance915.wav | ambulance930.wav |
| ambulance863.wav | ambulance894.wav | ambulance916.wav | ambulance94.wav |
| ambulance870.wav | ambulance895.wav | ambulance917.wav | ambulance95.wav |
| ambulance871.wav | ambulance896.wav | ambulance92.wav | ambulance96.wav |
| ambulance880.wav | ambulance897.wav | ambulance924.wav | ambulance97.wav |
| ambulance881.wav | ambulance898.wav | ambulance925.wav | ambulance98.wav |
| ambulance886.wav | ambulance900.wav | ambulance926.wav | ambulance99.wav |
| ambulance887.wav | ambulance907.wav | ambulance927.wav | ambulance889.wav |
| ambulance888.wav | ambulance908.wav | ambulance928.wav | ambulance909.wav |
| ambulance929.wav | |||
| Road Noise Signal Files from the Dataset in [38] Used in the Experiments | ||||
| road1.wav | road139.wav | road179.wav | road218.wav | road258.wav |
| road10.wav | road14.wav | road18.wav | road219.wav | road259.wav |
| road100.wav | road140.wav | road180.wav | road22.wav | road26.wav |
| road101.wav | road141.wav | road181.wav | road220.wav | road260.wav |
| road102.wav | road142.wav | road182.wav | road221.wav | road261.wav |
| road103.wav | road143.wav | road183.wav | road222.wav | road262.wav |
| road104.wav | road144.wav | road184.wav | road223.wav | road263.wav |
| road105.wav | road145.wav | road185.wav | road224.wav | road264.wav |
| road106.wav | road146.wav | road186.wav | road225.wav | road265.wav |
| road107.wav | road147.wav | road187.wav | road226.wav | road266.wav |
| road108.wav | road148.wav | road188.wav | road227.wav | road267.wav |
| road109.wav | road149.wav | road189.wav | road228.wav | road268.wav |
| road11.wav | road15.wav | road19.wav | road229.wav | road269.wav |
| road110.wav | road150.wav | road190.wav | road23.wav | road27.wav |
| road111.wav | road151.wav | road191.wav | road230.wav | road270.wav |
| road112.wav | road152.wav | road192.wav | road231.wav | road271.wav |
| road113.wav | road153.wav | road193.wav | road232.wav | road272.wav |
| road114.wav | road154.wav | road194.wav | road233.wav | road273.wav |
| road115.wav | road155.wav | road195.wav | road234.wav | road274.wav |
| road116.wav | road156.wav | road196.wav | road235.wav | road275.wav |
| road117.wav | road157.wav | road197.wav | road236.wav | road276.wav |
| road118.wav | road158.wav | road198.wav | road237.wav | road277.wav |
| road119.wav | road159.wav | road199.wav | road238.wav | road278.wav |
| road12.wav | road16.wav | road2.wav | road239.wav | road279.wav |
| road120.wav | road160.wav | road20.wav | road24.wav | road28.wav |
| road121.wav | road161.wav | road200.wav | road240.wav | road280.wav |
| road122.wav | road162.wav | road201.wav | road241.wav | road281.wav |
| road123.wav | road163.wav | road202.wav | road242.wav | road282.wav |
| road124.wav | road164.wav | road203.wav | road243.wav | road283.wav |
| road125.wav | road165.wav | road204.wav | road244.wav | road284.wav |
| road126.wav | road166.wav | road205.wav | road245.wav | road285.wav |
| road127.wav | road167.wav | road206.wav | road246.wav | road286.wav |
| road128.wav | road168.wav | road207.wav | road247.wav | road287.wav |
| road129.wav | road169.wav | road208.wav | road248.wav | road288.wav |
| road13.wav | road17.wav | road209.wav | road249.wav | road289.wav |
| road130.wav | road170.wav | road21.wav | road25.wav | road29.wav |
| road131.wav | road171.wav | road210.wav | road250.wav | road290.wav |
| road132.wav | road172.wav | road211.wav | road251.wav | road291.wav |
| road133.wav | road173.wav | road212.wav | road252.wav | road292.wav |
| road134.wav | road174.wav | road213.wav | road253.wav | road293.wav |
| road135.wav | road175.wav | road214.wav | road254.wav | road294.wav |
| road136.wav | road176.wav | road215.wav | road255.wav | road295.wav |
| road137.wav | road177.wav | road216.wav | road256.wav | road296.wav |
| road138.wav | road178.wav | road217.wav | road257.wav | road297.wav |
| road298.wav | road35.wav | road402.wav | road456.wav | road529.wav |
| road299.wav | road350.wav | road403.wav | road457.wav | road53.wav |
| road3.wav | road351.wav | road404.wav | road458.wav | road533.wav |
| road30.wav | road352.wav | road405.wav | road459.wav | road534.wav |
| road300.wav | road353.wav | road406.wav | road46.wav | road54.wav |
| road301.wav | road354.wav | road407.wav | road460.wav | road541.wav |
| road302.wav | road355.wav | road408.wav | road461.wav | road542.wav |
| road303.wav | road356.wav | road409.wav | road462.wav | road543.wav |
| road304.wav | road357.wav | road41.wav | road463.wav | road544.wav |
| road305.wav | road358.wav | road410.wav | road464.wav | road545.wav |
| road306.wav | road359.wav | road411.wav | road465.wav | road546.wav |
| road307.wav | road36.wav | road412.wav | road466.wav | road547.wav |
| road308.wav | road360.wav | road413.wav | road467.wav | road548.wav |
| road309.wav | road361.wav | road414.wav | road468.wav | road549.wav |
| road31.wav | road362.wav | road415.wav | road469.wav | road55.wav |
| road310.wav | road363.wav | road416.wav | road47.wav | road550.wav |
| road311.wav | road364.wav | road417.wav | road470.wav | road551.wav |
| road312.wav | road365.wav | road418.wav | road471.wav | road552.wav |
| road313.wav | road366.wav | road419.wav | road472.wav | road553.wav |
| road314.wav | road367.wav | road42.wav | road473.wav | road554.wav |
| road315.wav | road368.wav | road420.wav | road474.wav | road555.wav |
| road316.wav | road37.wav | road421.wav | road475.wav | road556.wav |
| road317.wav | road370.wav | road422.wav | road476.wav | road557.wav |
| road318.wav | road371.wav | road423.wav | road477.wav | road558.wav |
| road319.wav | road372.wav | road424.wav | road478.wav | road559.wav |
| road32.wav | road373.wav | road425.wav | road479.wav | road56.wav |
| road320.wav | road374.wav | road426.wav | road48.wav | road560.wav |
| road321.wav | road375.wav | road427.wav | road480.wav | road561.wav |
| road322.wav | road376.wav | road428.wav | road481.wav | road562.wav |
| road323.wav | road377.wav | road429.wav | road482.wav | road563.wav |
| road324.wav | road378.wav | road43.wav | road483.wav | road564.wav |
| road325.wav | road379.wav | road430.wav | road484.wav | road565.wav |
| road326.wav | road38.wav | road431.wav | road485.wav | road566.wav |
| road327.wav | road380.wav | road432.wav | road486.wav | road567.wav |
| road328.wav | road381.wav | road433.wav | road487.wav | road568.wav |
| road329.wav | road382.wav | road434.wav | road488.wav | road569.wav |
| road33.wav | road383.wav | road435.wav | road489.wav | road57.wav |
| road330.wav | road384.wav | road436.wav | road49.wav | road570.wav |
| road331.wav | road385.wav | road438.wav | road490.wav | road571.wav |
| road332.wav | road386.wav | road439.wav | road491.wav | road572.wav |
| road333.wav | road387.wav | road44.wav | road492.wav | road573.wav |
| road334.wav | road388.wav | road440.wav | road493.wav | road574.wav |
| road335.wav | road389.wav | road441.wav | road494.wav | road575.wav |
| road336.wav | road39.wav | road442.wav | road495.wav | road576.wav |
| road337.wav | road390.wav | road443.wav | road496.wav | road577.wav |
| road338.wav | road391.wav | road444.wav | road497.wav | road578.wav |
| road339.wav | road392.wav | road445.wav | road498.wav | road579.wav |
| road34.wav | road393.wav | road446.wav | road499.wav | road58.wav |
| road340.wav | road394.wav | road447.wav | road5.wav | road580.wav |
| road341.wav | road395.wav | road448.wav | road50.wav | road581.wav |
| road342.wav | road396.wav | road449.wav | road500.wav | road582.wav |
| road343.wav | road397.wav | road45.wav | road51.wav | road583.wav |
| road344.wav | road398.wav | road450.wav | road519.wav | road584.wav |
| road345.wav | road399.wav | road451.wav | road52.wav | road585.wav |
| road346.wav | road4.wav | road452.wav | road520.wav | road586.wav |
| road347.wav | road40.wav | road453.wav | road521.wav | road587.wav |
| road348.wav | road400.wav | road454.wav | road522.wav | road588.wav |
| road349.wav | road401.wav | road455.wav | road528.wav | road589.wav |
| road59.wav | road641.wav | road694.wav | road746.wav | road799.wav |
| road590.wav | road642.wav | road695.wav | road747.wav | road8.wav |
| road591.wav | road643.wav | road696.wav | road748.wav | road80.wav |
| road592.wav | road644.wav | road697.wav | road749.wav | road800.wav |
| road593.wav | road645.wav | road698.wav | road75.wav | road801.wav |
| road594.wav | road646.wav | road699.wav | road750.wav | road802.wav |
| road595.wav | road647.wav | road7.wav | road751.wav | road803.wav |
| road596.wav | road648.wav | road70.wav | road752.wav | road804.wav |
| road597.wav | road649.wav | road700.wav | road753.wav | road805.wav |
| road598.wav | road65.wav | road701.wav | road754.wav | road806.wav |
| road599.wav | road650.wav | road702.wav | road755.wav | road807.wav |
| road6.wav | road651.wav | road703.wav | road756.wav | road808.wav |
| road60.wav | road652.wav | road704.wav | road757.wav | road809.wav |
| road600.wav | road653.wav | road705.wav | road758.wav | road81.wav |
| road601.wav | road654.wav | road706.wav | road759.wav | road810.wav |
| road602.wav | road655.wav | road707.wav | road76.wav | road811.wav |
| road603.wav | road656.wav | road708.wav | road760.wav | road812.wav |
| road604.wav | road657.wav | road709.wav | road761.wav | road813.wav |
| road605.wav | road658.wav | road71.wav | road762.wav | road814.wav |
| road606.wav | road659.wav | road710.wav | road763.wav | road815.wav |
| road607.wav | road66.wav | road711.wav | road764.wav | road816.wav |
| road608.wav | road660.wav | road712.wav | road765.wav | road817.wav |
| road609.wav | road661.wav | road713.wav | road766.wav | road818.wav |
| road61.wav | road662.wav | road714.wav | road767.wav | road819.wav |
| road610.wav | road663.wav | road715.wav | road768.wav | road82.wav |
| road611.wav | road664.wav | road716.wav | road769.wav | road820.wav |
| road612.wav | road665.wav | road717.wav | road77.wav | road821.wav |
| road613.wav | road666.wav | road718.wav | road770.wav | road822.wav |
| road614.wav | road667.wav | road719.wav | road771.wav | road823.wav |
| road615.wav | road668.wav | road72.wav | road772.wav | road824.wav |
| road616.wav | road669.wav | road720.wav | road773.wav | road825.wav |
| road617.wav | road67.wav | road721.wav | road774.wav | road826.wav |
| road618.wav | road670.wav | road722.wav | road775.wav | road827.wav |
| road619.wav | road671.wav | road723.wav | road776.wav | road828.wav |
| road62.wav | road672.wav | road724.wav | road777.wav | road829.wav |
| road620.wav | road673.wav | road725.wav | road778.wav | road83.wav |
| road621.wav | road674.wav | road726.wav | road779.wav | road830.wav |
| road622.wav | road675.wav | road727.wav | road78.wav | road831.wav |
| road623.wav | road676.wav | road728.wav | road780.wav | road832.wav |
| road624.wav | road677.wav | road729.wav | road781.wav | road833.wav |
| road625.wav | road678.wav | road73.wav | road782.wav | road834.wav |
| road626.wav | road679.wav | road730.wav | road783.wav | road835.wav |
| road627.wav | road68.wav | road731.wav | road784.wav | road836.wav |
| road628.wav | road680.wav | road732.wav | road785.wav | road837.wav |
| road629.wav | road681.wav | road733.wav | road786.wav | road838.wav |
| road63.wav | road682.wav | road734.wav | road787.wav | road839.wav |
| road630.wav | road683.wav | road735.wav | road788.wav | road84.wav |
| road631.wav | road684.wav | road736.wav | road789.wav | road840.wav |
| road632.wav | road685.wav | road737.wav | road79.wav | road841.wav |
| road633.wav | road686.wav | road738.wav | road790.wav | road842.wav |
| road634.wav | road687.wav | road739.wav | road791.wav | road843.wav |
| road635.wav | road688.wav | road74.wav | road792.wav | road844.wav |
| road636.wav | road689.wav | road740.wav | road793.wav | road845.wav |
| road637.wav | road69.wav | road741.wav | road794.wav | road846.wav |
| road638.wav | road690.wav | road742.wav | road795.wav | road847.wav |
| road639.wav | road691.wav | road743.wav | road796.wav | road848.wav |
| road64.wav | road692.wav | road744.wav | road797.wav | road849.wav |
| road640.wav | road693.wav | road745.wav | road798.wav | road85.wav |
| road850.wav | road863.wav | road876.wav | road889.wav | road900.wav |
| road851.wav | road864.wav | road877.wav | road89.wav | road901.wav |
| road852.wav | road865.wav | road878.wav | road890.wav | road902.wav |
| road853.wav | road866.wav | road879.wav | road891.wav | road91.wav |
| road854.wav | road867.wav | road88.wav | road892.wav | road92.wav |
| road855.wav | road868.wav | road880.wav | road893.wav | road93.wav |
| road856.wav | road869.wav | road881.wav | road894.wav | road94.wav |
| road857.wav | road87.wav | road882.wav | road895.wav | road95.wav |
| road858.wav | road870.wav | road883.wav | road896.wav | road96.wav |
| road859.wav | road871.wav | road884.wav | road897.wav | road97.wav |
| road86.wav | road872.wav | road885.wav | road898.wav | road98.wav |
| road860.wav | road873.wav | road886.wav | road899.wav | road99.wav |
| road861.wav | road874.wav | road887.wav | road9.wav | |
| road862.wav | road875.wav | road888.wav | road90.wav | |
References
- Injury Facts. Emergency Vehicles. Injury Facts. Available online: https://injuryfacts.nsc.org/motor-vehicle/road-users/emergency-vehicles/ (accessed on 10 July 2025).
- Taxman, Pollock, Murray & Bekkerman, LLC. Emergency Vehicle Accidents Statistics USA-2023. Taxman, Pollock, Murray & Bekkerman, LLC. 2023. Available online: https://tpmblegal.com/emergency-vehicle-accidents-statistics/ (accessed on 10 July 2025).
- Bosch Global. Embedded Siren Detection. Bosch Global. Available online: https://www.bosch.com/stories/embedded-siren-detection/ (accessed on 10 July 2025).
- New Atlas. Hear System Promises Simple Inexpensive Siren Detection for Drivers. New Atlas. 2020. Available online: https://newatlas.com/automotive/ihear-siren-detection-system/ (accessed on 10 July 2025).
- Waymo. Recognizing the Sights and Sounds of Emergency Vehicles. Waymo. Available online: https://waymo.com/blog/2017/07/recognizing-sights-and-sounds-of (accessed on 10 July 2025).
- Liaw, J.-J.; Wang, W.-S.; Chu, H.-C.; Huang, M.-S.; Lu, C.-P. Recognition of the Ambulance Siren Sound in Taiwan by the Longest Common Subsequence. In Proceedings of the 2013 IEEE International Conference on Systems, Man, and Cybernetics, Manchester, UK, 13–16 October 2013; pp. 3825–3828. [Google Scholar]
- Marchegiani, L.; Posner, I. Leveraging the Urban Soundscape: Auditory Perception for Smart Vehicles. In Proceedings of the 2017 IEEE International Conference on Robotics and Automation (ICRA), Singapore, 29 May–3 June 2017; pp. 6547–6554. [Google Scholar]
- Beritelli, F.; Casale, S.; Russo, A.; Serrano, S. An Automatic Emergency Signal Recognition System for the Hearing Impaired. In Proceedings of the 2006 IEEE 12th Digital Signal Processing Workshop & 4th IEEE Signal Processing Education Workshop, Teton National Park, WY, USA, 24–27 September 2006; pp. 179–182. [Google Scholar]
- Nellore, K.; Hancke, G.P. Traffic Management for Emergency Vehicle Priority Based on Visual Sensing. Sensors 2016, 16, 1892. [Google Scholar] [CrossRef] [Scilit] [PubMed]
- Schröder, J.; Goetze, S.; Grützmacher, V.; Anemüller, J. Automatic Acoustic Siren Detection in Traffic Noise by Part-Based Models. In Proceedings of the 2013 IEEE International Conference on Acoustics, Speech and Signal Processing, Vancouver, BC, Canada, 26–31 May 2013; pp. 493–497. [Google Scholar]
- Chakrabarty, D.; Elhilali, M. Abnormal Sound Event Detection Using Temporal Trajectories Mixtures. In Proceedings of the 2016 IEEE International Conference on Acoustics, Speech and Signal Processing (ICASSP), Shanghai, China, 20–25 March 2016; pp. 216–220. [Google Scholar]
- Miyazaki, T.; Kitazono, Y.; Shimakawa, M. Ambulance Siren Detector Using FFT on dsPIC. In Proceedings of the 1st IEEE/IIAE International Conference on Intelligent Systems and Image Processing 2013 (ICISIP2013), Kitakyushu, Japan, 24 September 2013. [Google Scholar]
- Anacur, C.A.; Saracoglu, R. Detecting of Warning Sounds in the Traffic Using Linear Predictive Coding. Int. J. Intell. Syst. Appl. Eng. 2019, 7, 195–200. [Google Scholar] [CrossRef] [Scilit]
- Ebizuka, Y.; Kato, S.; Itami, M. Detecting Approach of Emergency Vehicles Using Siren Sound Processing. In Proceedings of the 2019 IEEE Intelligent Transportation Systems Conference (ITSC), Auckland, New Zealand, 27–30 October 2019; pp. 4431–4436. [Google Scholar]
- Fatimah, B.; Preethi, A.; Hrushikesh, V.; Singh, B.A.; Kotion, H.R. An Automatic Siren Detection Algorithm Using Fourier Decomposition Method and MFCC. In Proceedings of the 2020 11th International Conference on Computing, Communication and Networking Technologies (ICCCNT), Kharagpur, India, 1–3 July 2020; pp. 1–6. [Google Scholar]
- Mulimani, M.; Koolagudi, S.G. Segmentation and Characterization of Acoustic Event Spectrograms Using Singular Value Decomposition. Expert Syst. Appl. 2019, 120, 413–425. [Google Scholar] [CrossRef] [Scilit]
- Mielke, M.; Schäfer, A.; Brück, R. Integrated circuit for detection of acoustic emergency signals in road traffic. In Proceedings of the 17th International Conference Mixed Design of Integrated Circuits and Systems—MIXDES 2010, Wroclaw, Poland, 24–26 June 2010; IEEE: Toruń, Poland, 2010; pp. 562–565. [Google Scholar]
- Meucci, F.; Pierucci, L.; Del Re, E.; Lastrucci, L.; Desii, P. A Real-Time Siren Detector to Improve Safety of Guide in Traffic Environment. In Proceedings of the 2008 16th European Signal Processing Conference, Lausanne, Switzerland, 25–29 August 2008; pp. 1–5. [Google Scholar]
- Mittal, U.; Chawla, P. Acoustic Based Emergency Vehicle Detection Using Ensemble of Deep Learning Models. Procedia Comput. Sci. 2023, 218, 227–234. [Google Scholar] [CrossRef] [Scilit]
- Marchegiani, L.; Newman, P. Listening for Sirens: Locating and Classifying Acoustic Alarms in City Scenes. IEEE Trans. Intell. Transp. Syst. 2022, 23, 17087–17096. [Google Scholar] [CrossRef] [Scilit]
- Chinvar, D.C.; Rajat, M.; Bellubbi, R.L.; Sampath, S.; Guddad, K. Ambulance Siren Detection Using an MFCC Based Support Vector Machine. In Proceedings of the 2021 IEEE International Conference on Mobile Networks and Wireless Communications (ICMNWC), Tumkur, India, 3–4 December 2021; pp. 1–5. [Google Scholar]
- Carmel, D.; Yeshurun, A.; Moshe, Y. Detection of Alarm Sounds in Noisy Environments. In Proceedings of the 2017 25th European Signal Processing Conference (EUSIPCO), Kos, Greece, 28 August–2 September 2017; pp. 1839–1843. [Google Scholar]
- Boddapati, V.; Petef, A.; Rasmusson, J.; Lundberg, L. Classifying Environmental Sounds Using Image Recognition Networks. Procedia Comput. Sci. 2017, 112, 2048–2056. [Google Scholar] [CrossRef] [Scilit]
- Murphy, K.P. Probabilistic Machine Learning: Advanced Topics; The MIT Press: Cambridge, MA, USA, 2023. [Google Scholar]
- Géron, A. Hands-On Machine Learning with Scikit-Learn, Keras, and TensorFlow: Concepts, Tools, and Techniques to Build Intelligent Systems; O’Reilly Media: Beijing, China; Boston, MA, USA; Farnham, UK; Sebastopol, CA, USA; Tokyo, Japan, 2023; ISBN 978-1-0981-2597-4. [Google Scholar]
- Goodfellow, I.; Bengio, Y.; Courville, A. Deep Learning; The MIT Press: Cambridge, MA, USA, 2016. [Google Scholar]
- Kingma, D.P.; Ba, J. Adam: A Method for Stochastic Optimization. In Proceedings of the Third International Conference on Learning Representations (ICLR), San Diego, CA, USA, 7–9 May 2015. [Google Scholar]
- Tran, V.-T.; Tsai, W.-H. Acoustic-Based Emergency Vehicle Detection Using Convolutional Neural Networks. IEEE Access 2020, 8, 75702–75713. [Google Scholar] [CrossRef] [Scilit]
- Banchero, L.; Vacalebri-Lloret, F.; Mossi, J.M.; Lopez, J.J. Enhancing Road Safety with AI-Powered System for Effective Detection and Localization of Emergency Vehicles by Sound. Sensors 2025, 25, 793. [Google Scholar] [CrossRef] [Scilit]
- Wang, S.; Wang, Y.; Chen, S.; Zhou, Z.; Liu, X.; Li, Z. Interactive Siamese Network-Based Roadside Perception for Multi-Vehicle Tracking. IEEE Trans. Intell. Transp. Syst. 2025, 26, 22482–22496. [Google Scholar] [CrossRef] [Scilit]
- Choudhury, K.; Nandi, D. Improvement of Wail Siren Signal Detection in Noisy Environment Using Goertzel Filter with Sliding Window. Results Eng. 2025, 27, 106828. [Google Scholar] [CrossRef] [Scilit]
- Dobre, R.A.; Niţă, V.A.; Ciobanu, A.; Negrescu, C.; Stanomir, D. Low Computational Method for Siren Detection. In Proceedings of the 2015 IEEE 21st International Symposium for Design and Technology in Electronic Packaging (SIITME), Brasov, Romania, 22–25 October 2015; pp. 291–295. [Google Scholar]
- Dobre, R.A.; Negrescu, C.; Stanomir, D. Improved Low Computational Method for Siren Detection. In Proceedings of the 2017 IEEE 23rd International Symposium for Design and Technology in Electronic Packaging (SIITME), Constanta, Romania, 26–29 October 2017; pp. 318–323. [Google Scholar]
- Dobre, R.-A.; Dumitrascu, E.-V. High-Performance, Low Complexity Yelp Siren Detection System. Alex. Eng. J. 2024, 109, 669–684. [Google Scholar] [CrossRef] [Scilit]
- Dumitrascu, E.V.; Rughiniș, R.; Dobre, R.A. Design and Evaluation of a Hardware-Constrained, Low-Complexity Yelp Siren Detector for Embedded Platforms. Electronics 2025, 14, 3535. [Google Scholar] [CrossRef] [Scilit]
- Zhu, B.; Cao, X.; Zhang, P.; Zhao, J.; Han, J.; Tang, R. High-Fidelity Ultrasonic Radar In-the-Loop Accelerated Test for Automatic Parking Systems. IEEE Trans. Intell. Transp. Syst. 2025, 26, 17055–17067. [Google Scholar] [CrossRef] [Scilit]
- Wagner, R.P. Guide to Test Methods, Performance Requirements, and Installation Practices for Electronic Sirens Used on Law Enforcement Vehicles; National Institute of Standards and Technology: Gaithersburg, MD, USA, 2000; NCJ 181622. [Google Scholar]
- Asif, M.; Usaid, M.; Rashid, M.; Rajab, T.; Hussain, S.; Wasi, S. Large-Scale Audio Dataset for Emergency Vehicle Sirens and Road Noises. Sci. Data 2022, 9, 599. [Google Scholar] [CrossRef] [Scilit] [PubMed]
- Wilson, E.B. Probable inference, the law of succession, and statistical inference. J. Am. Stat. Assoc. 1927, 22, 209–212. [Google Scholar] [CrossRef]
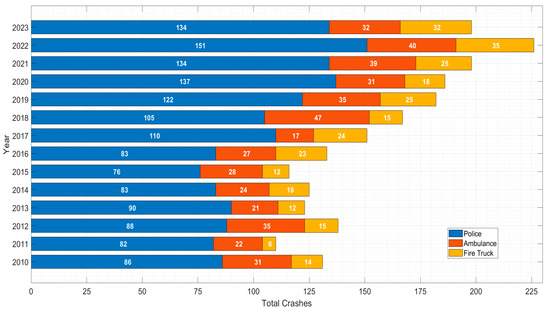
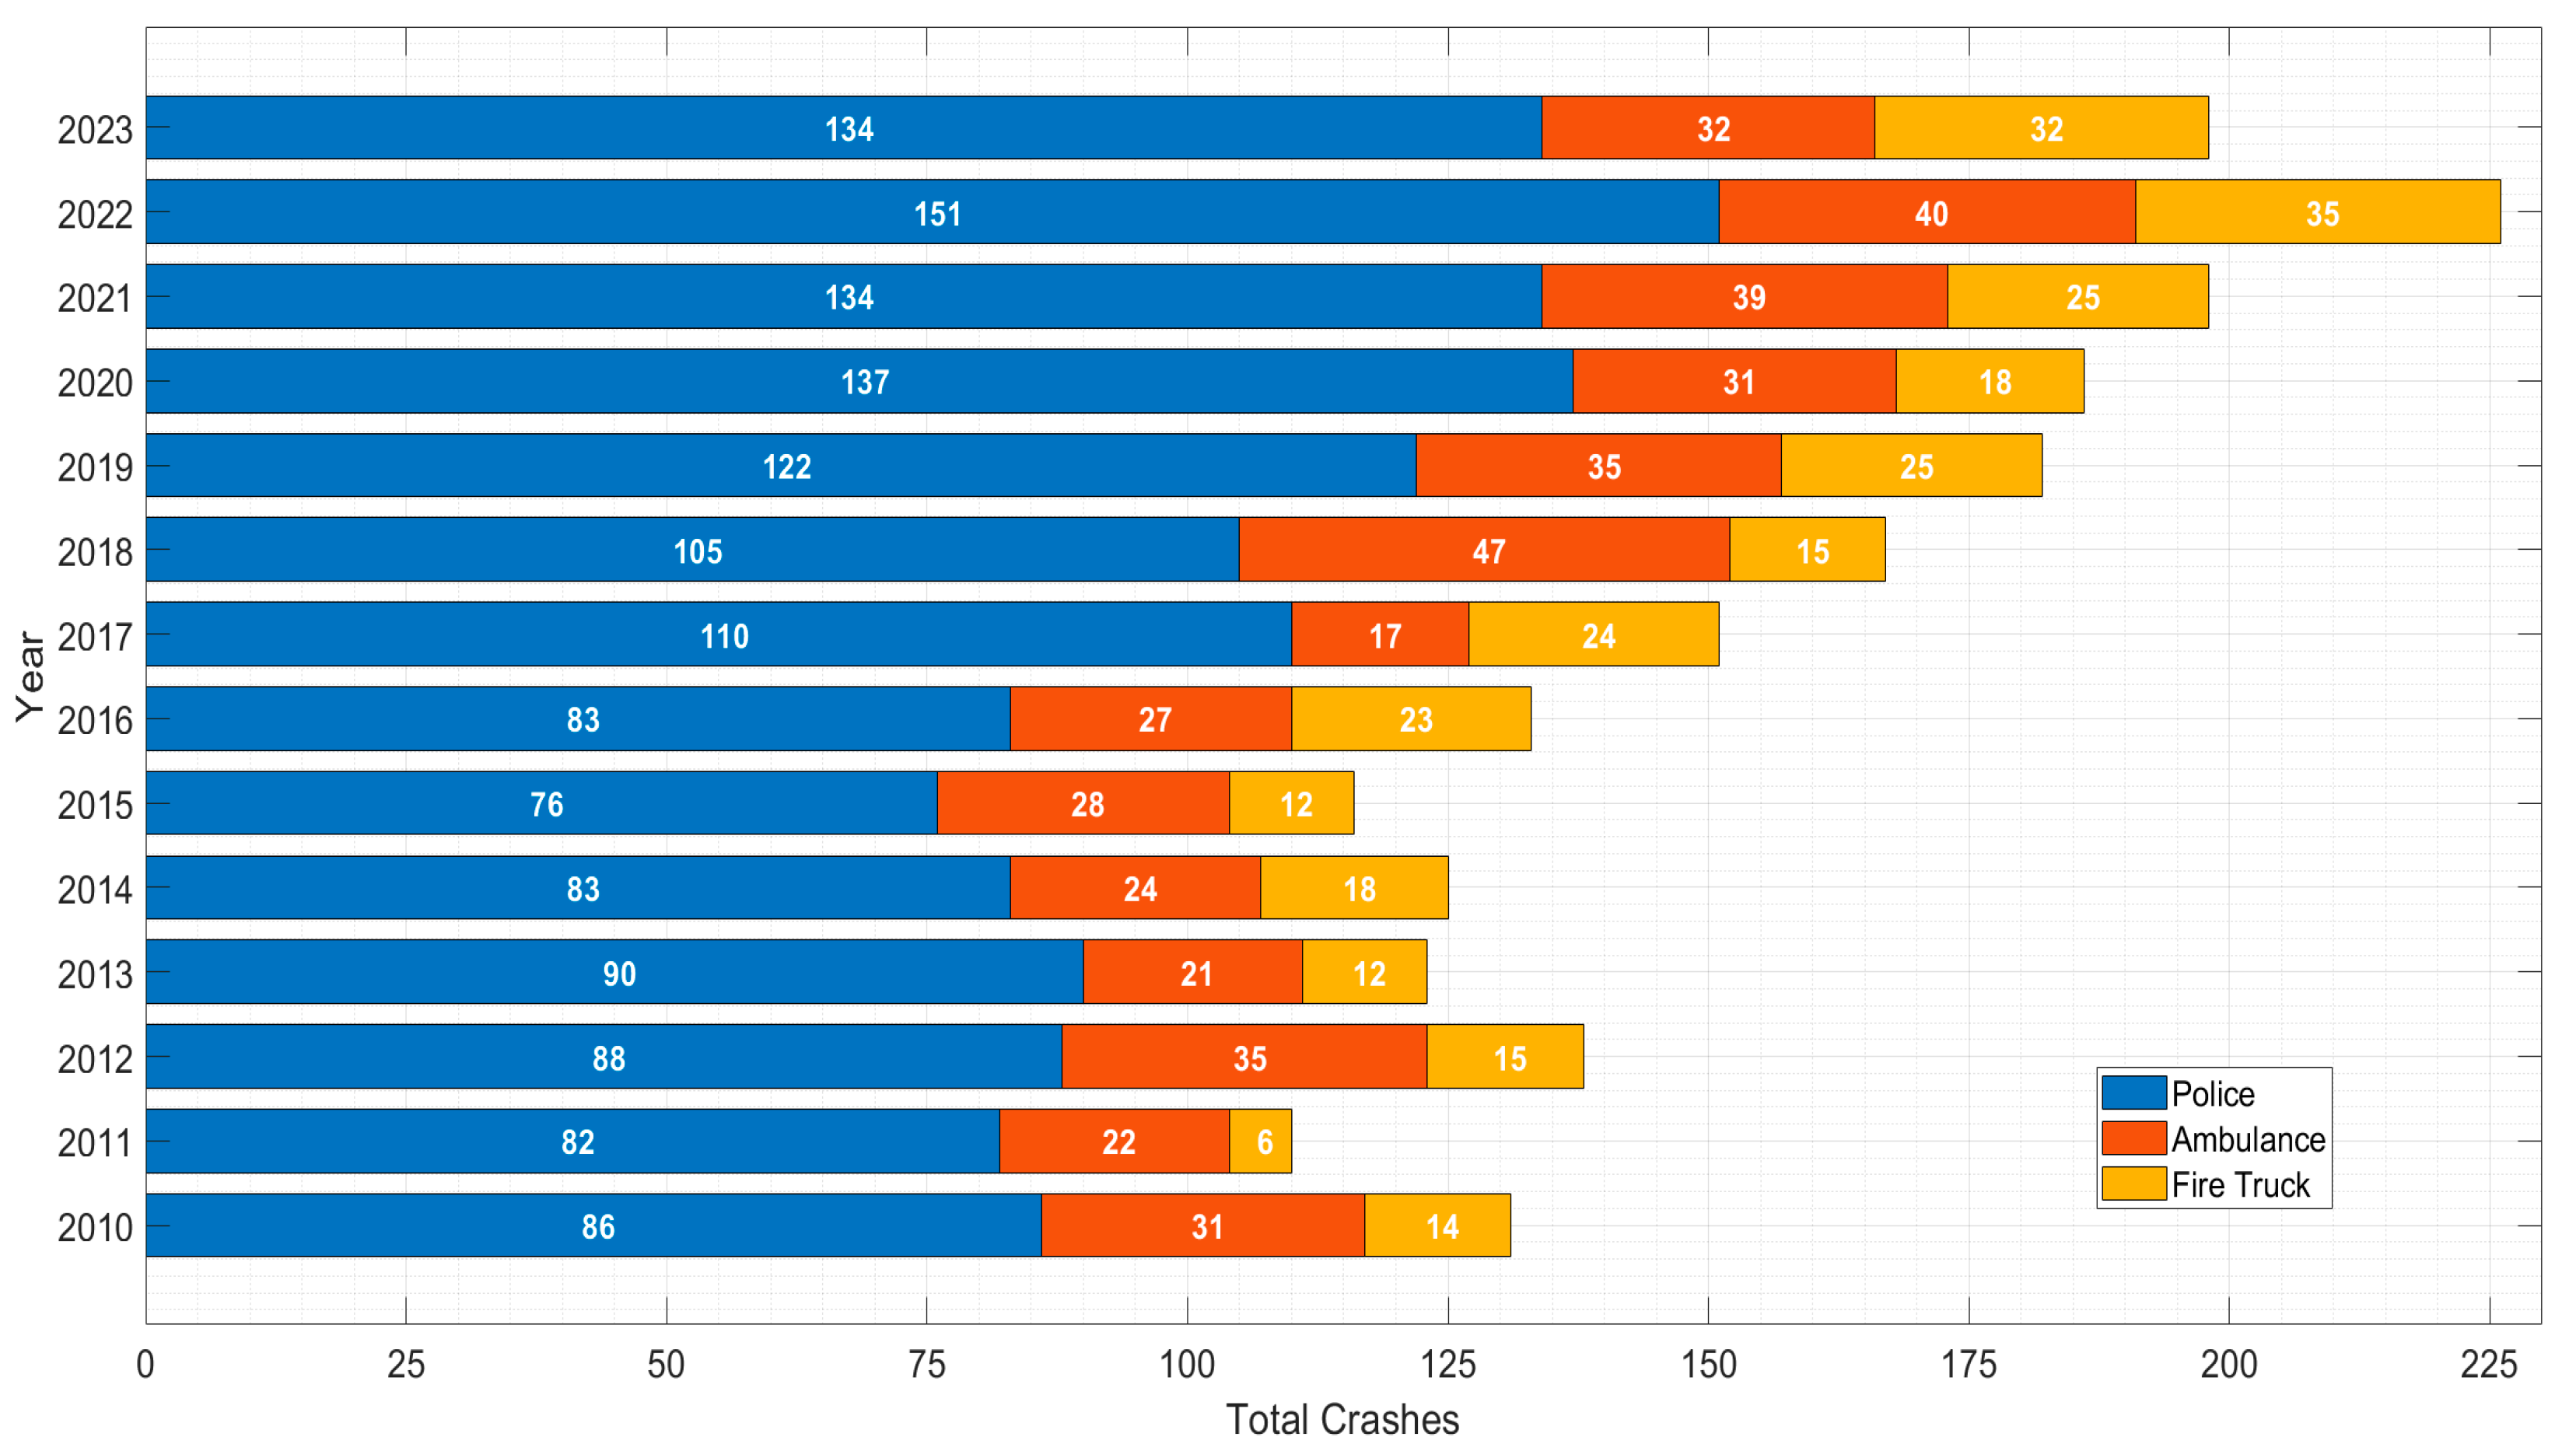
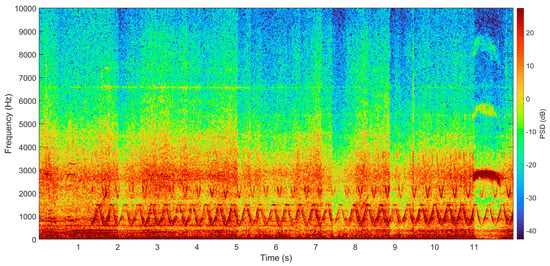
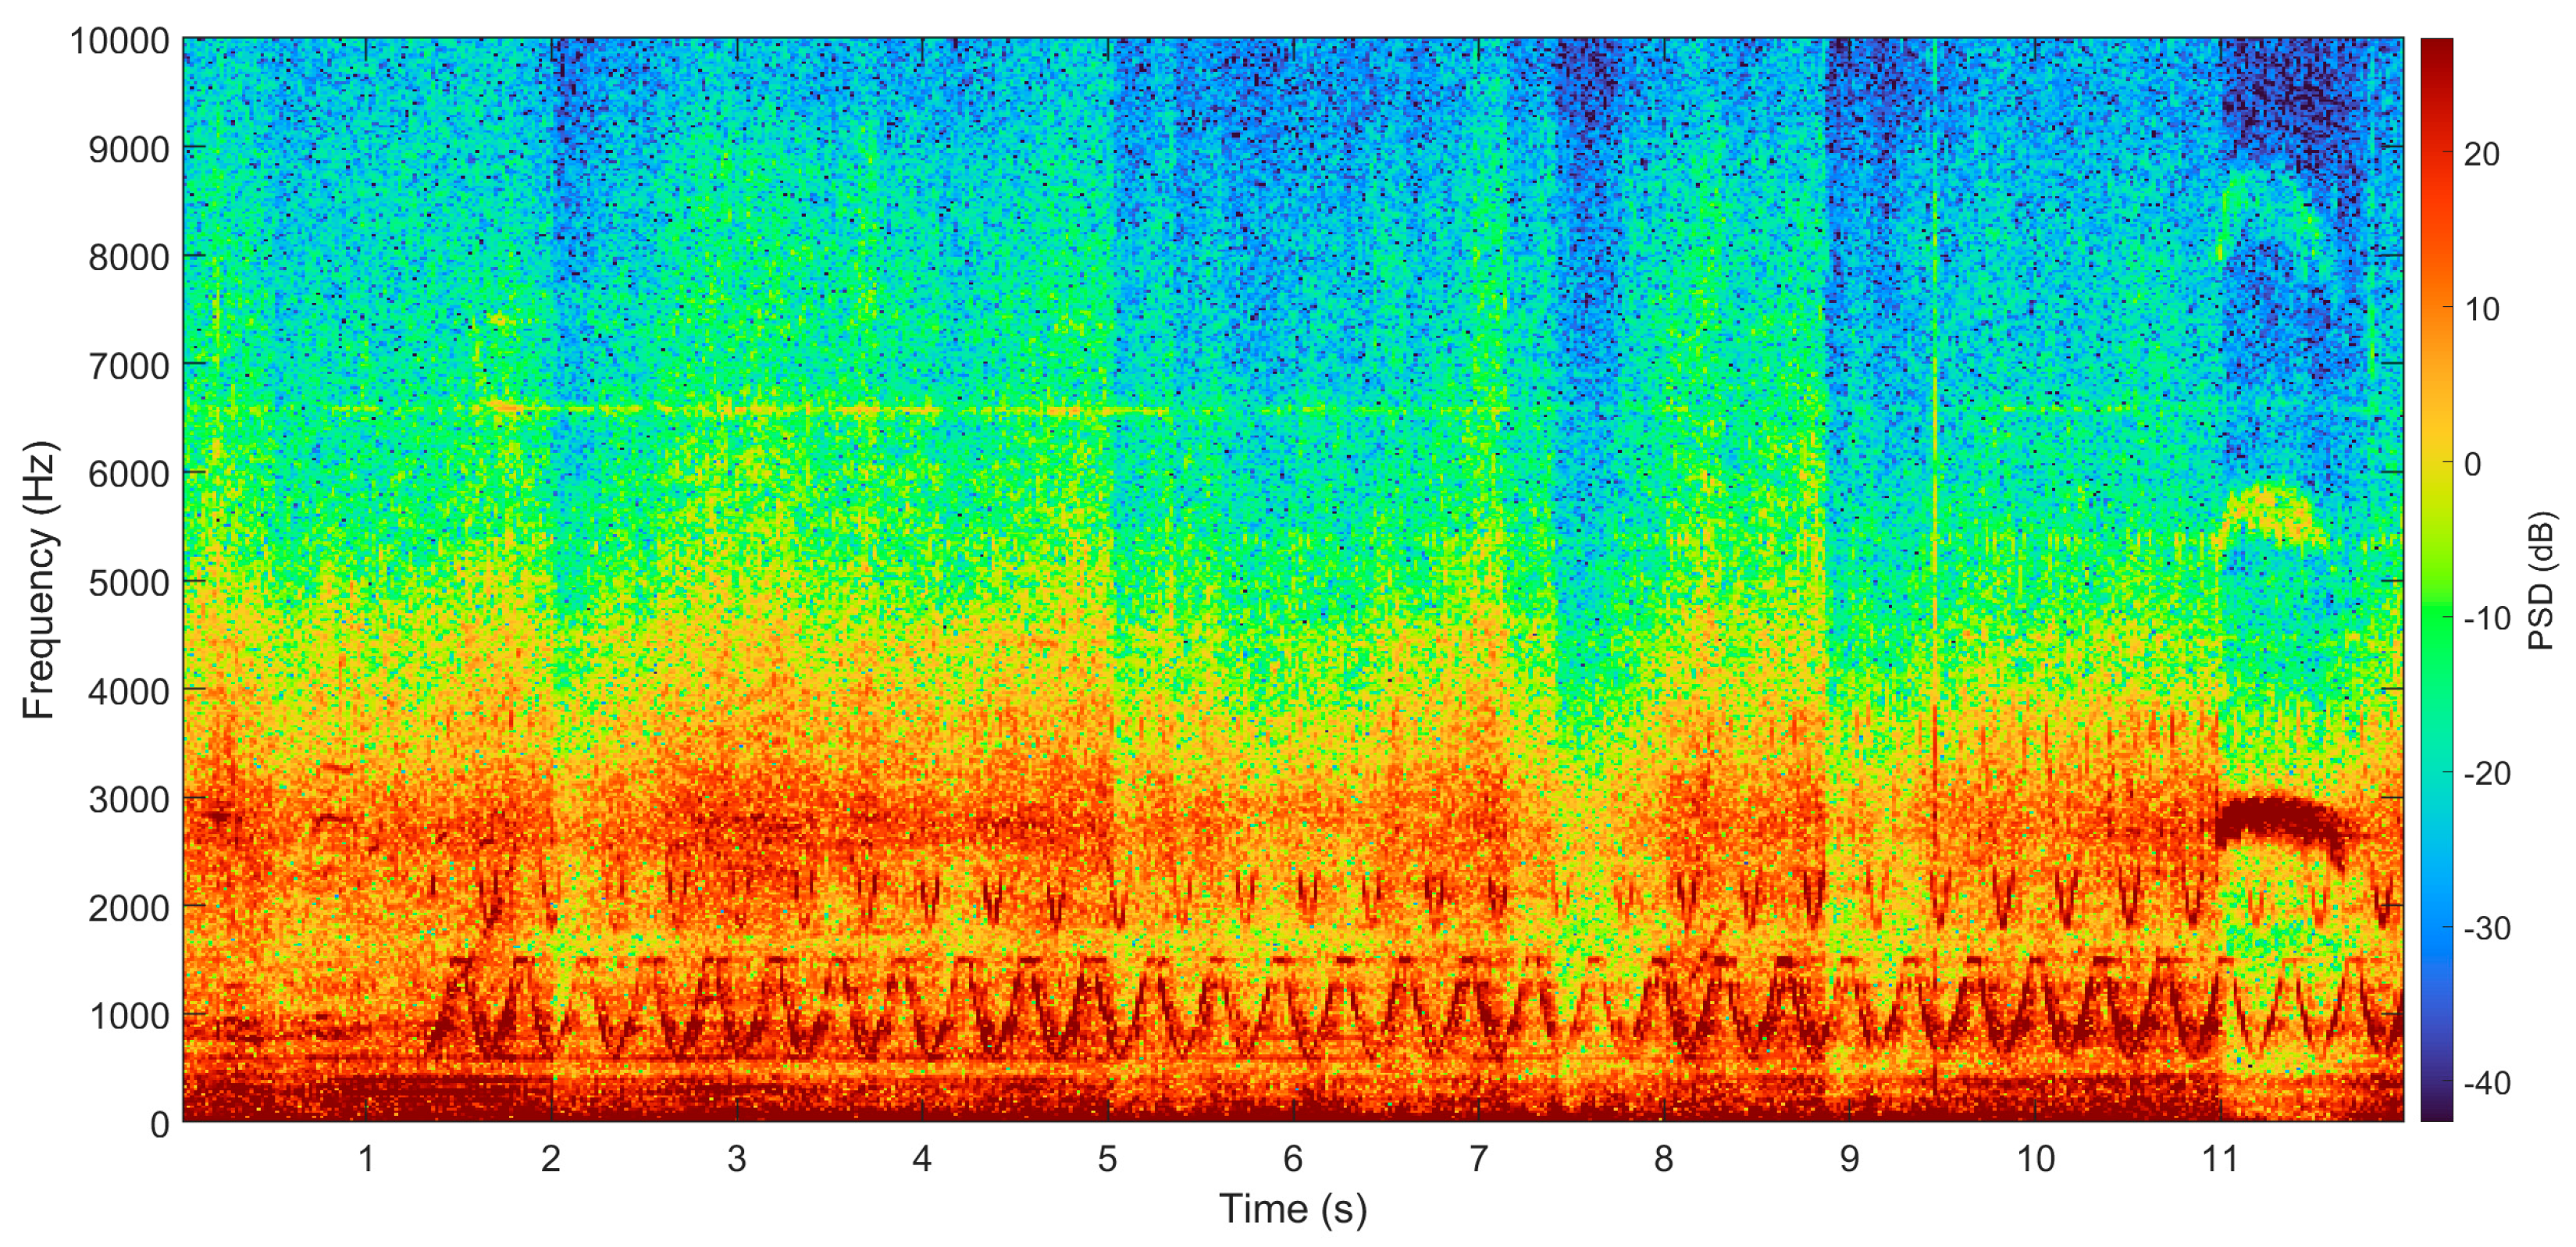
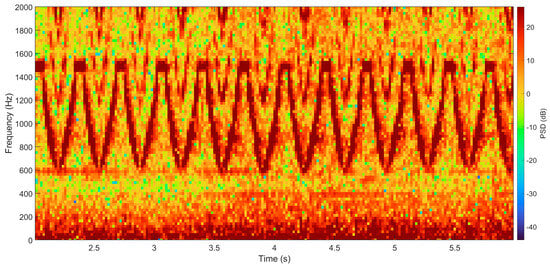
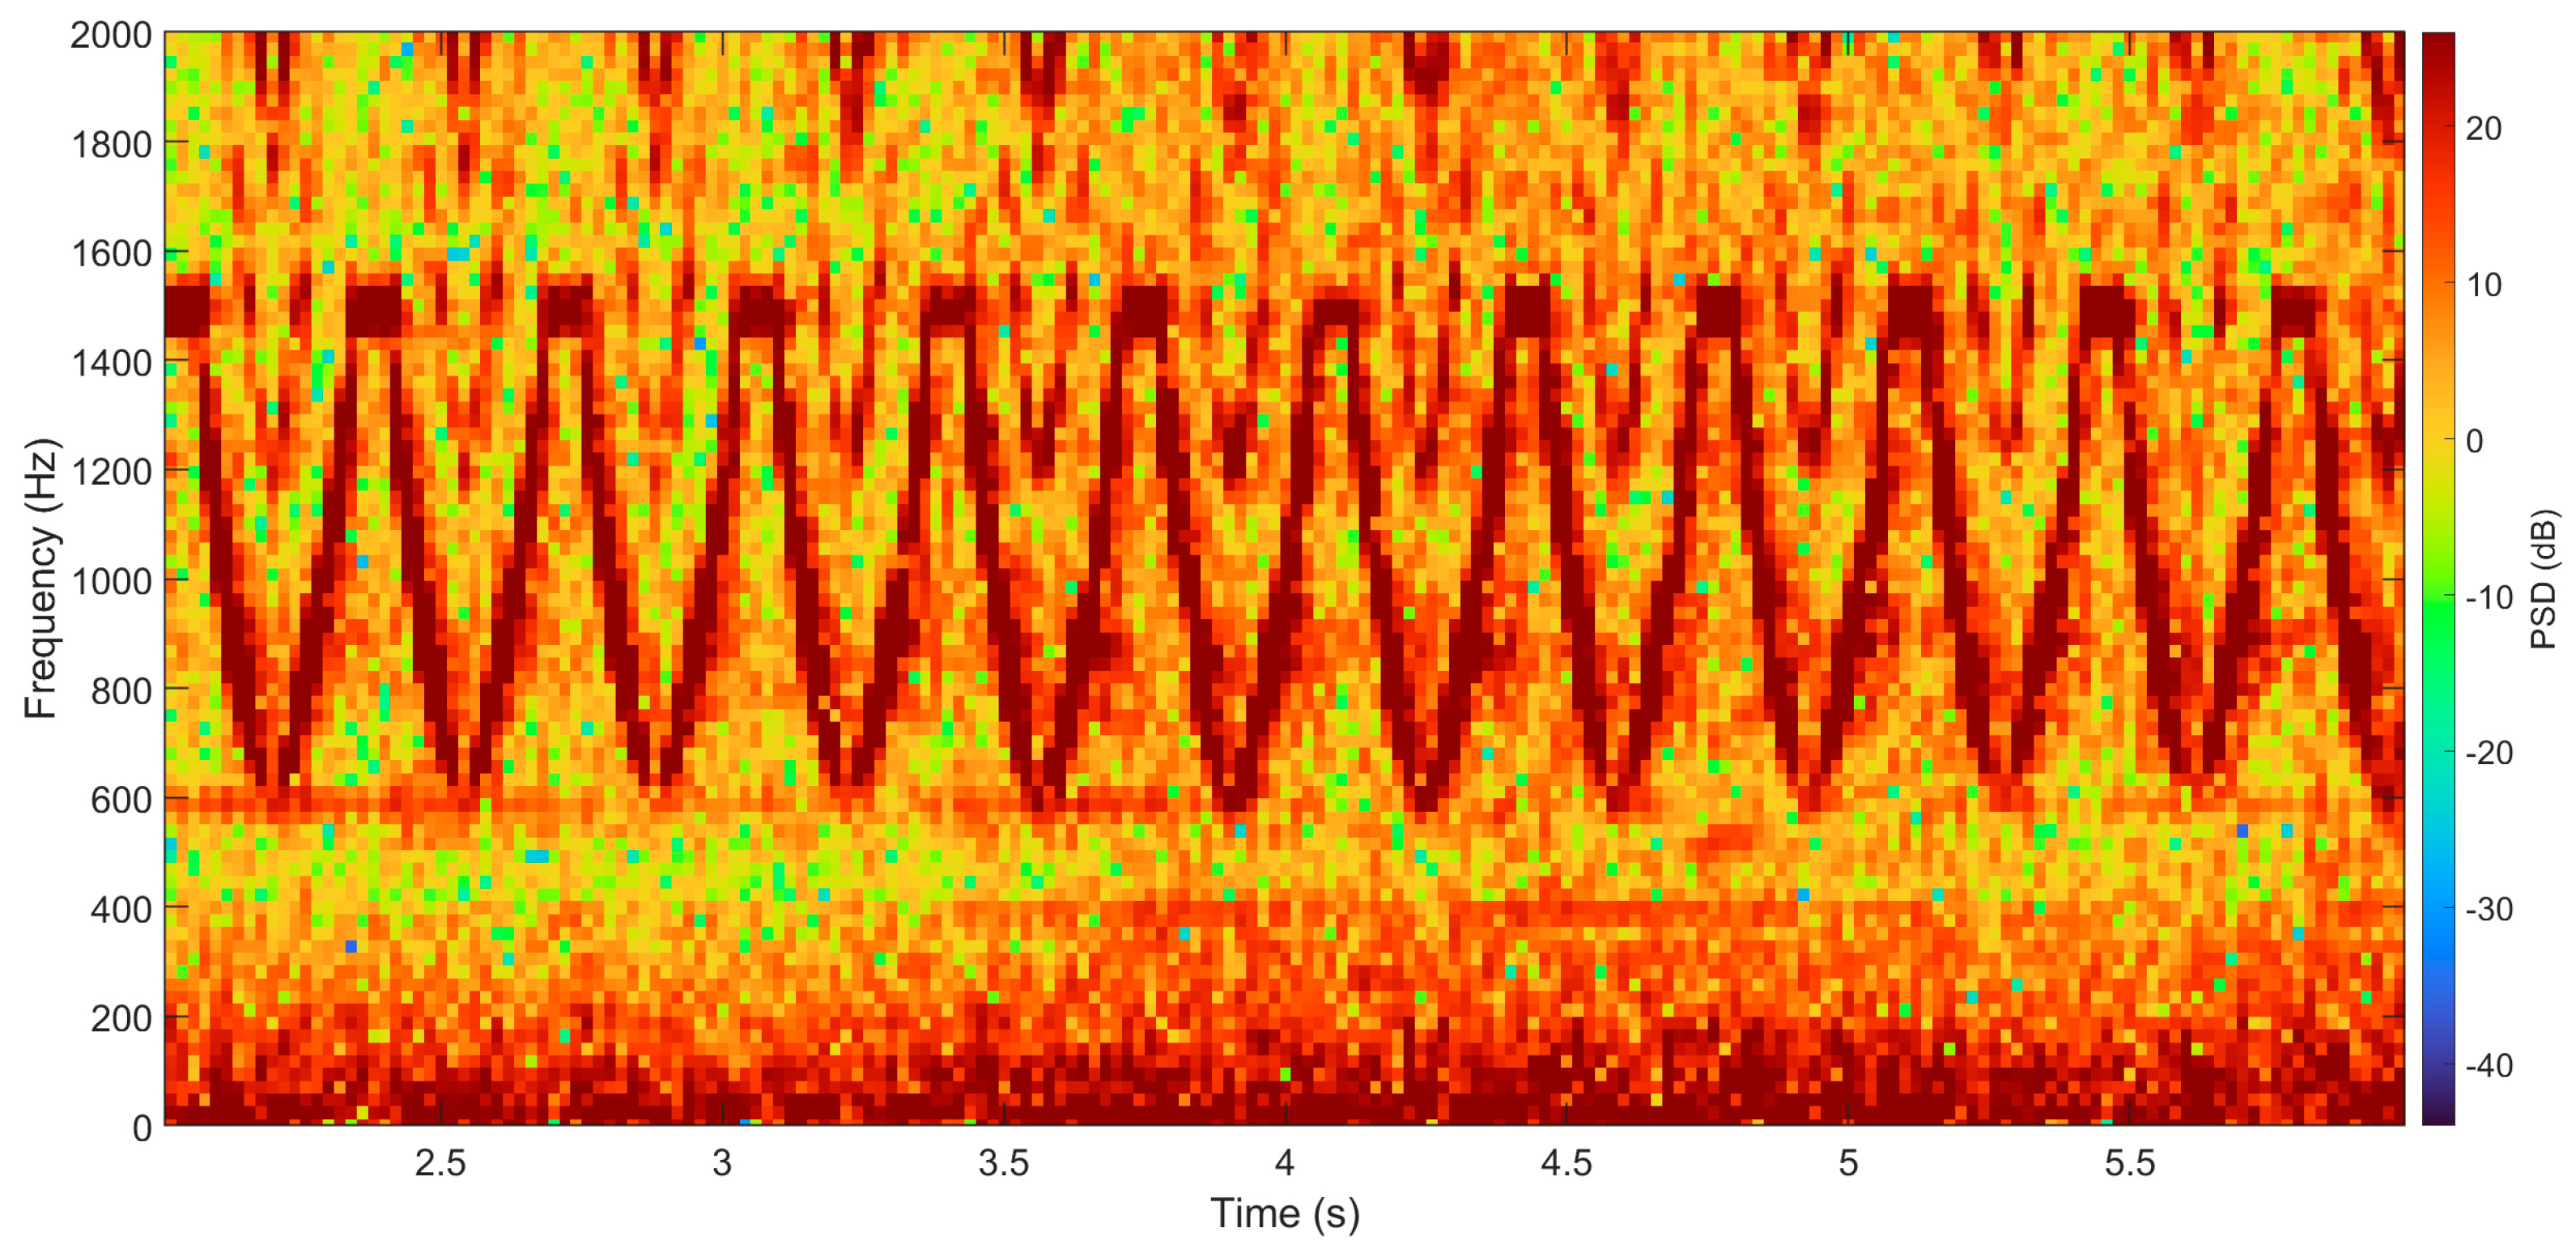
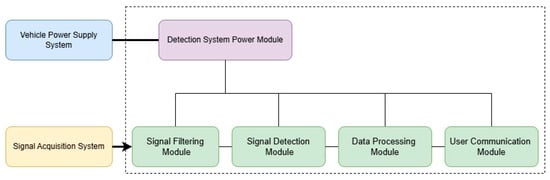
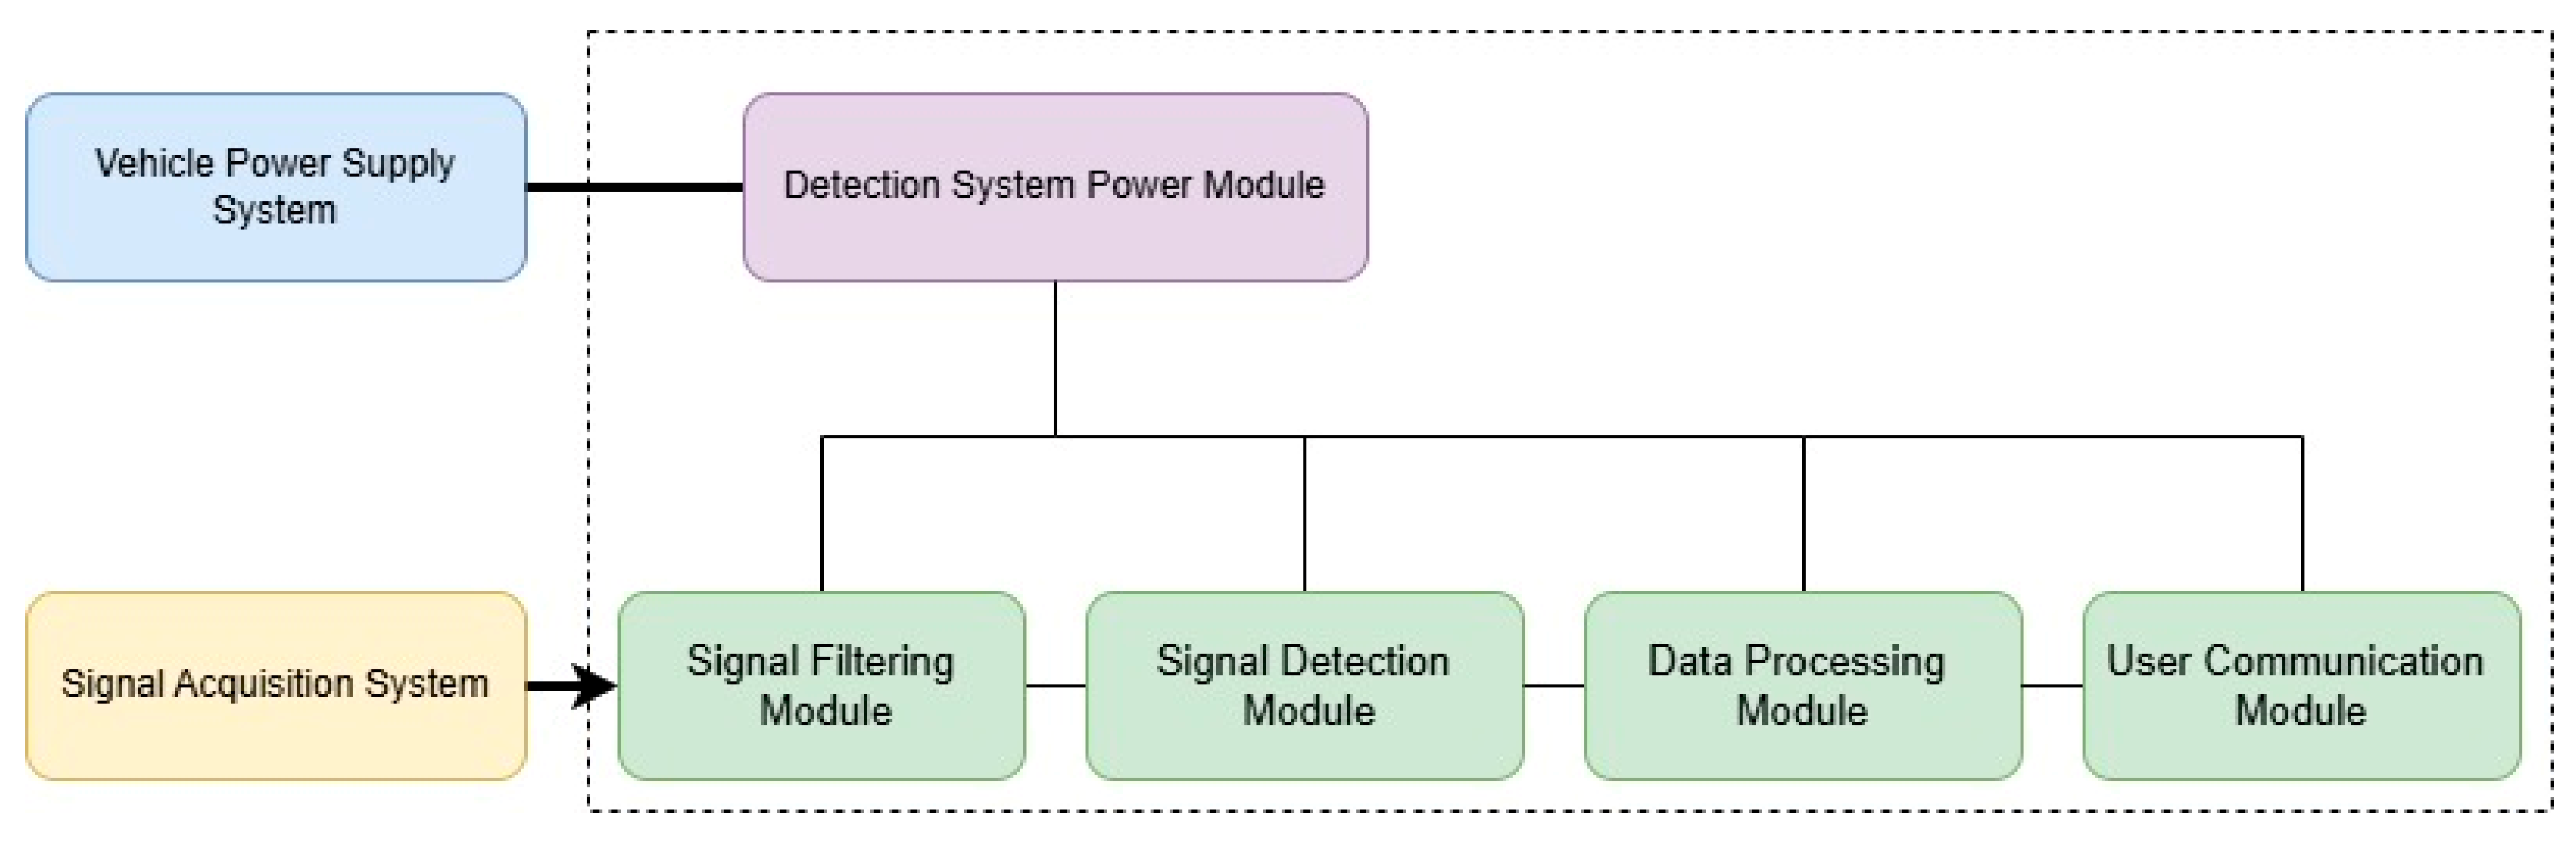
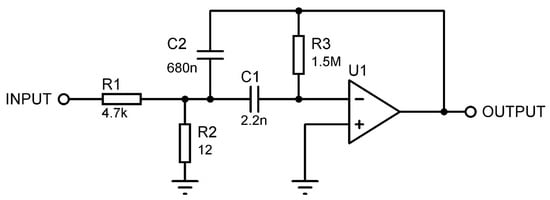
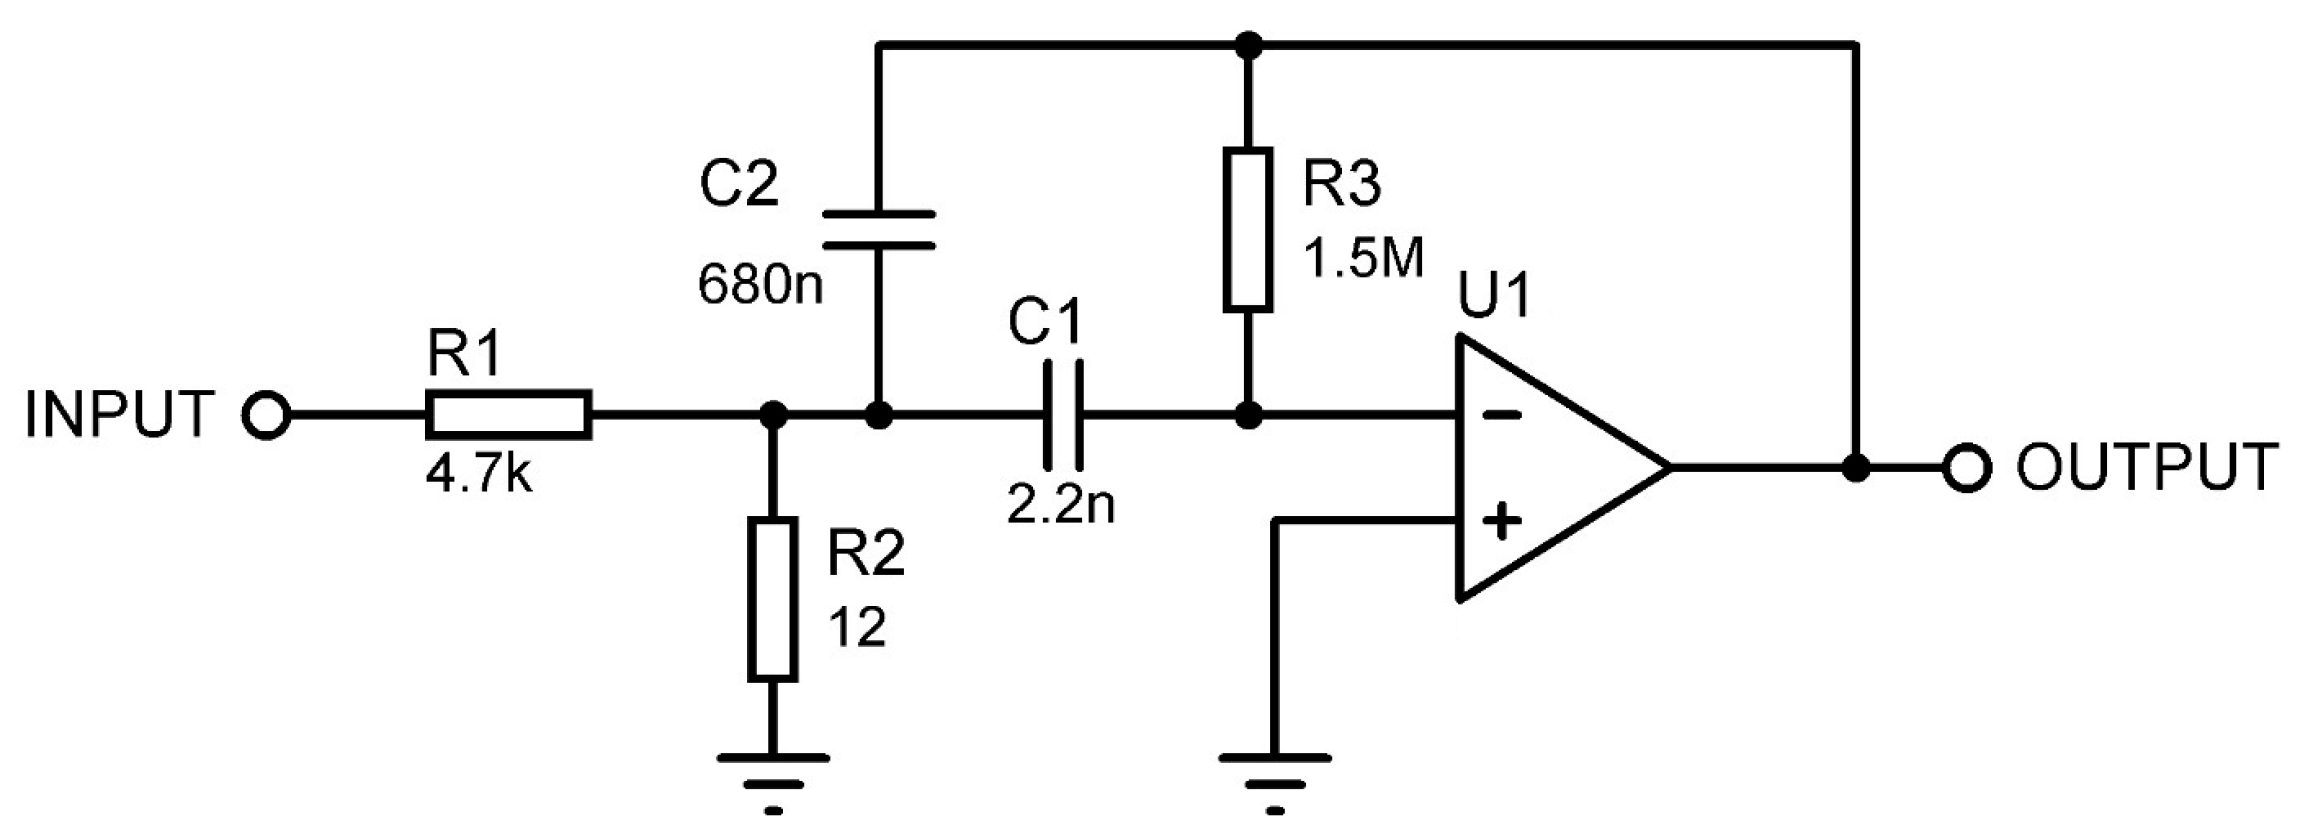
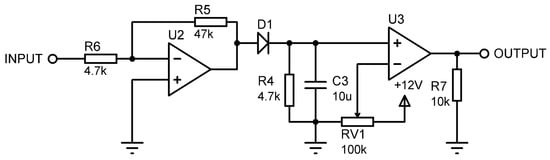
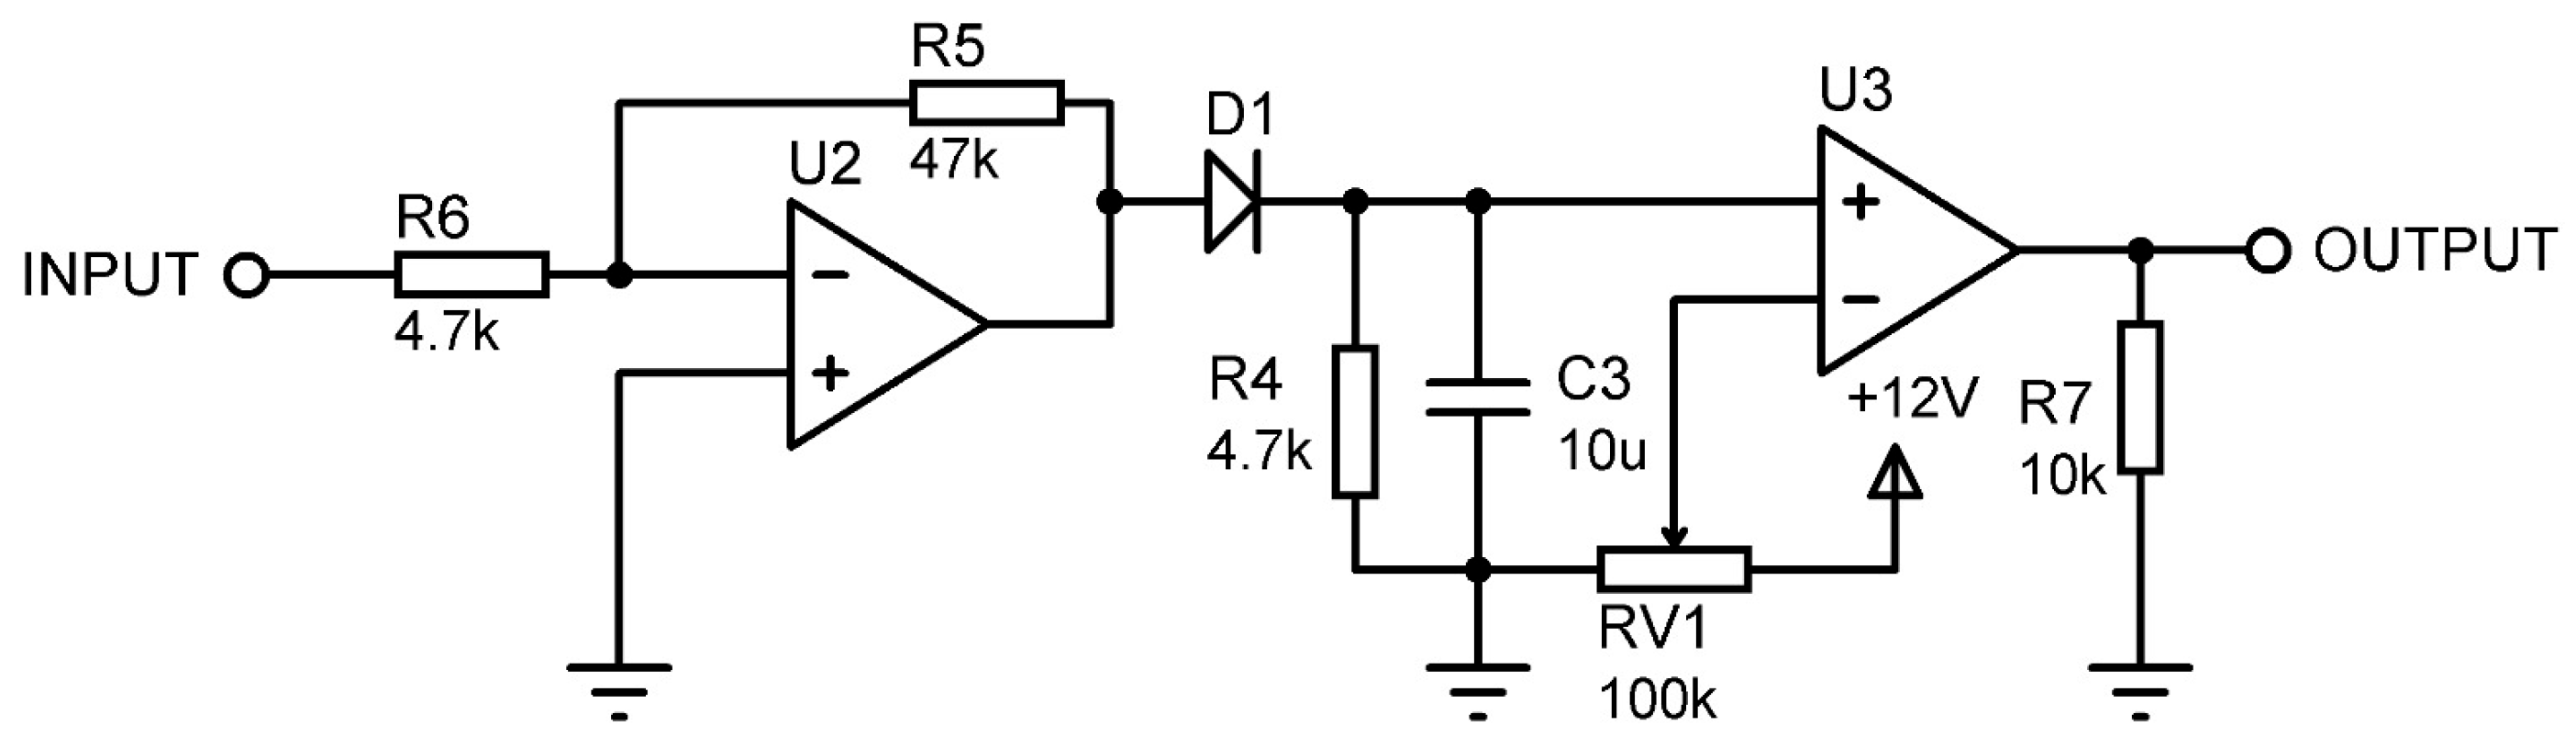
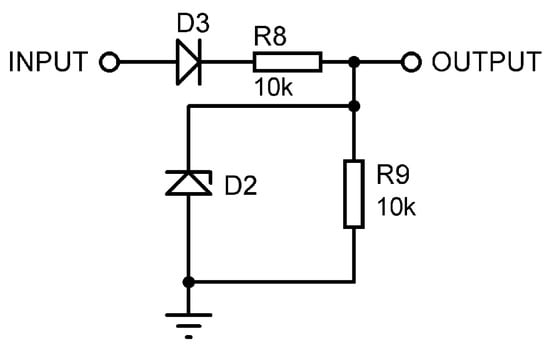
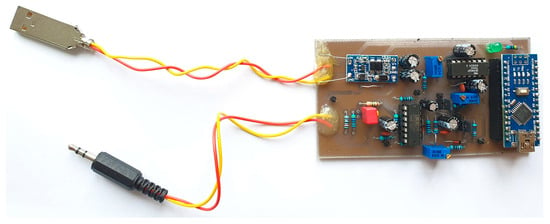
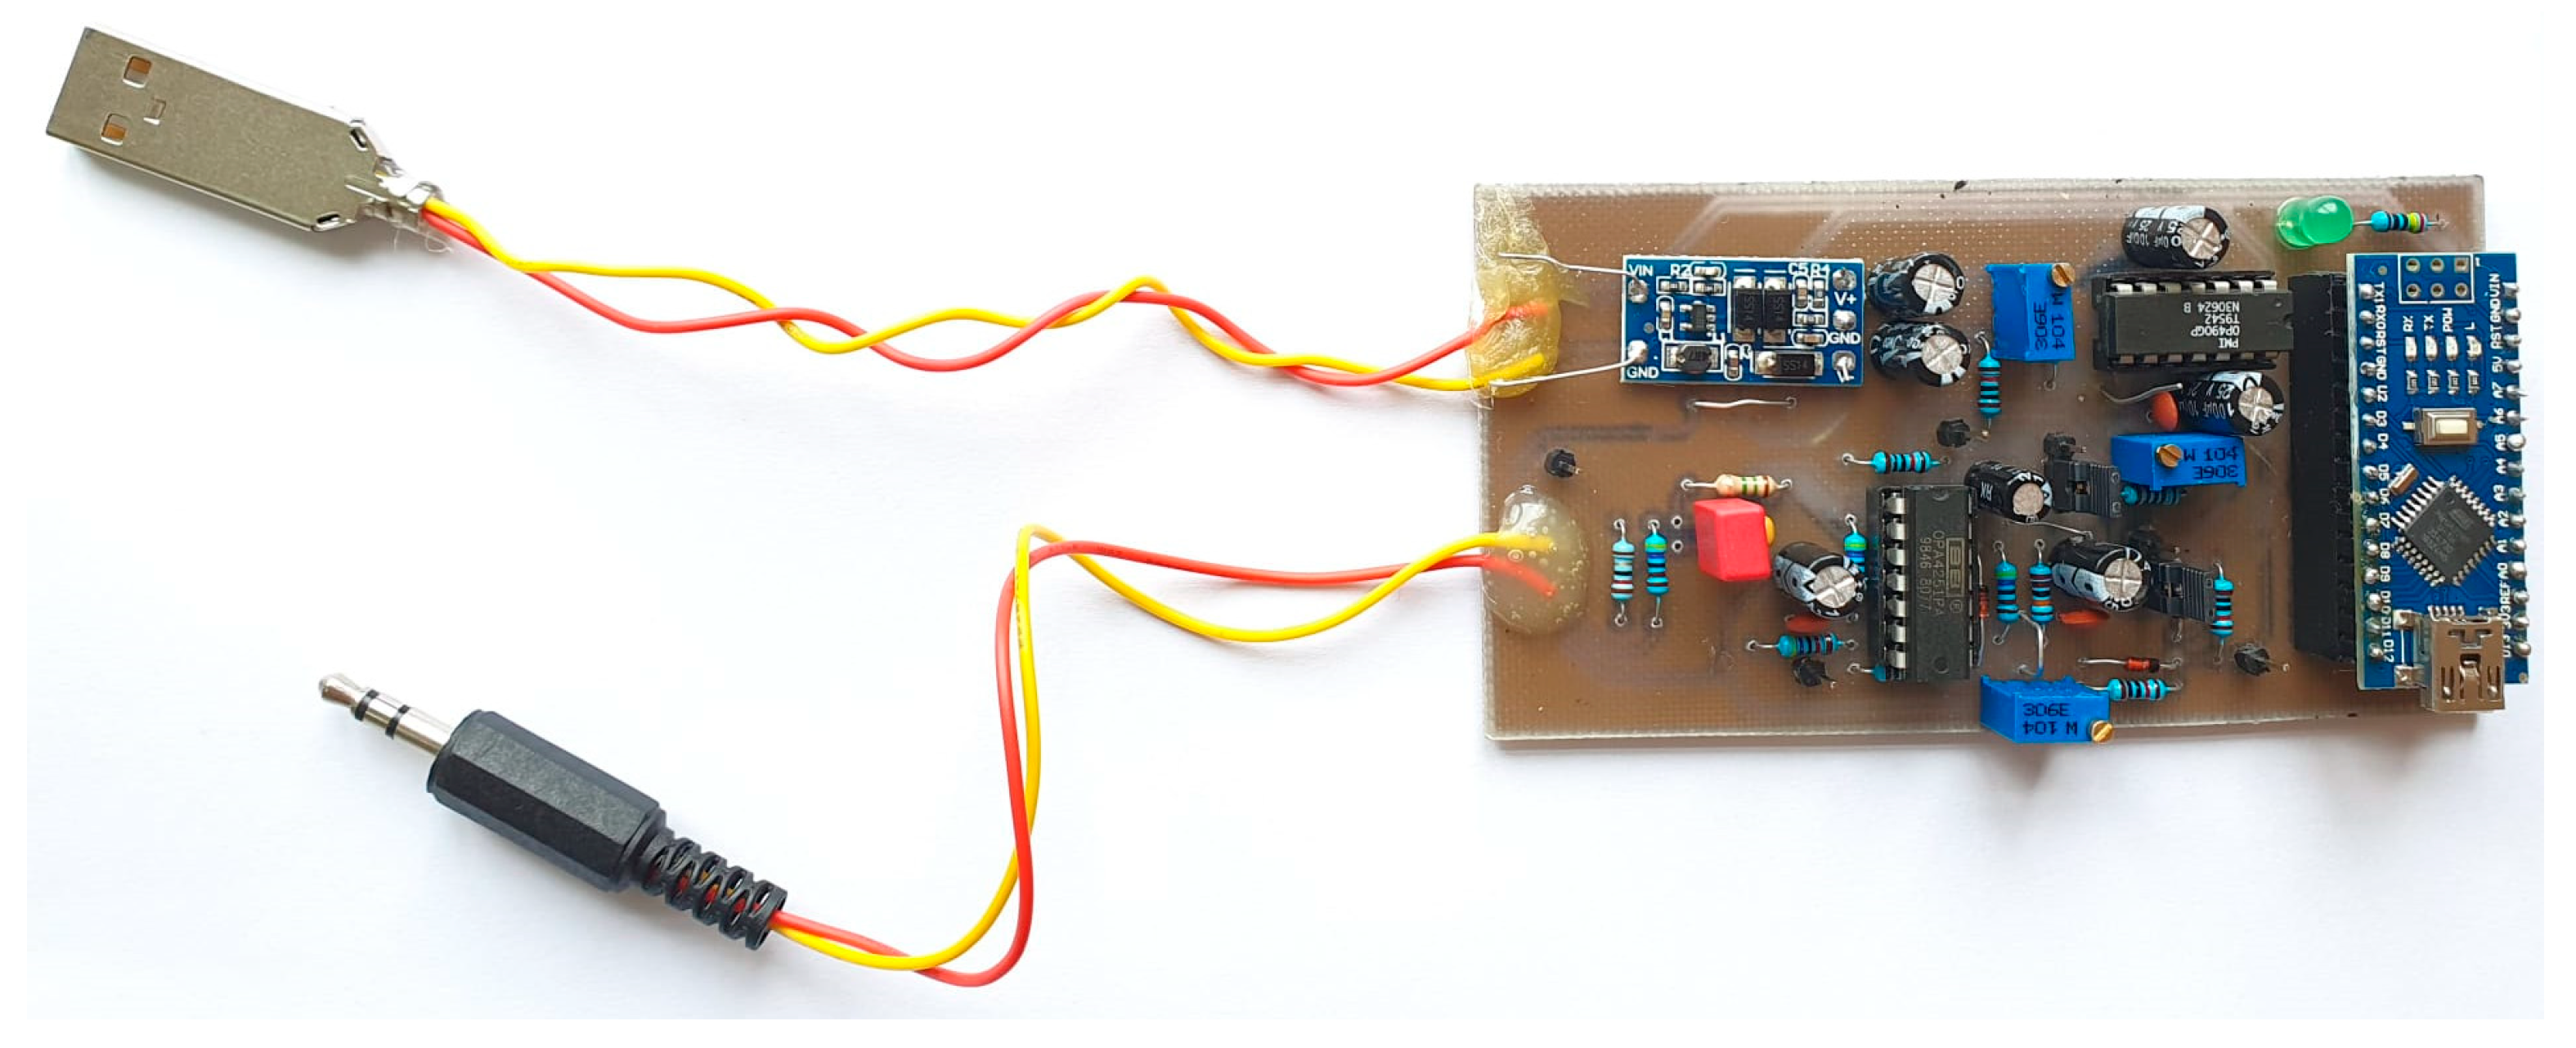
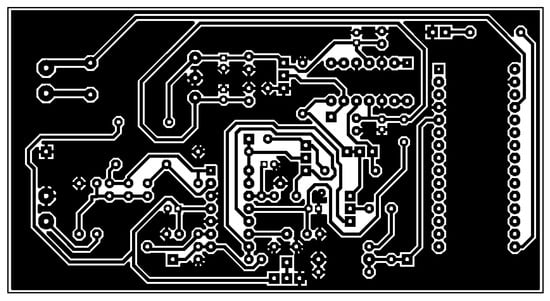
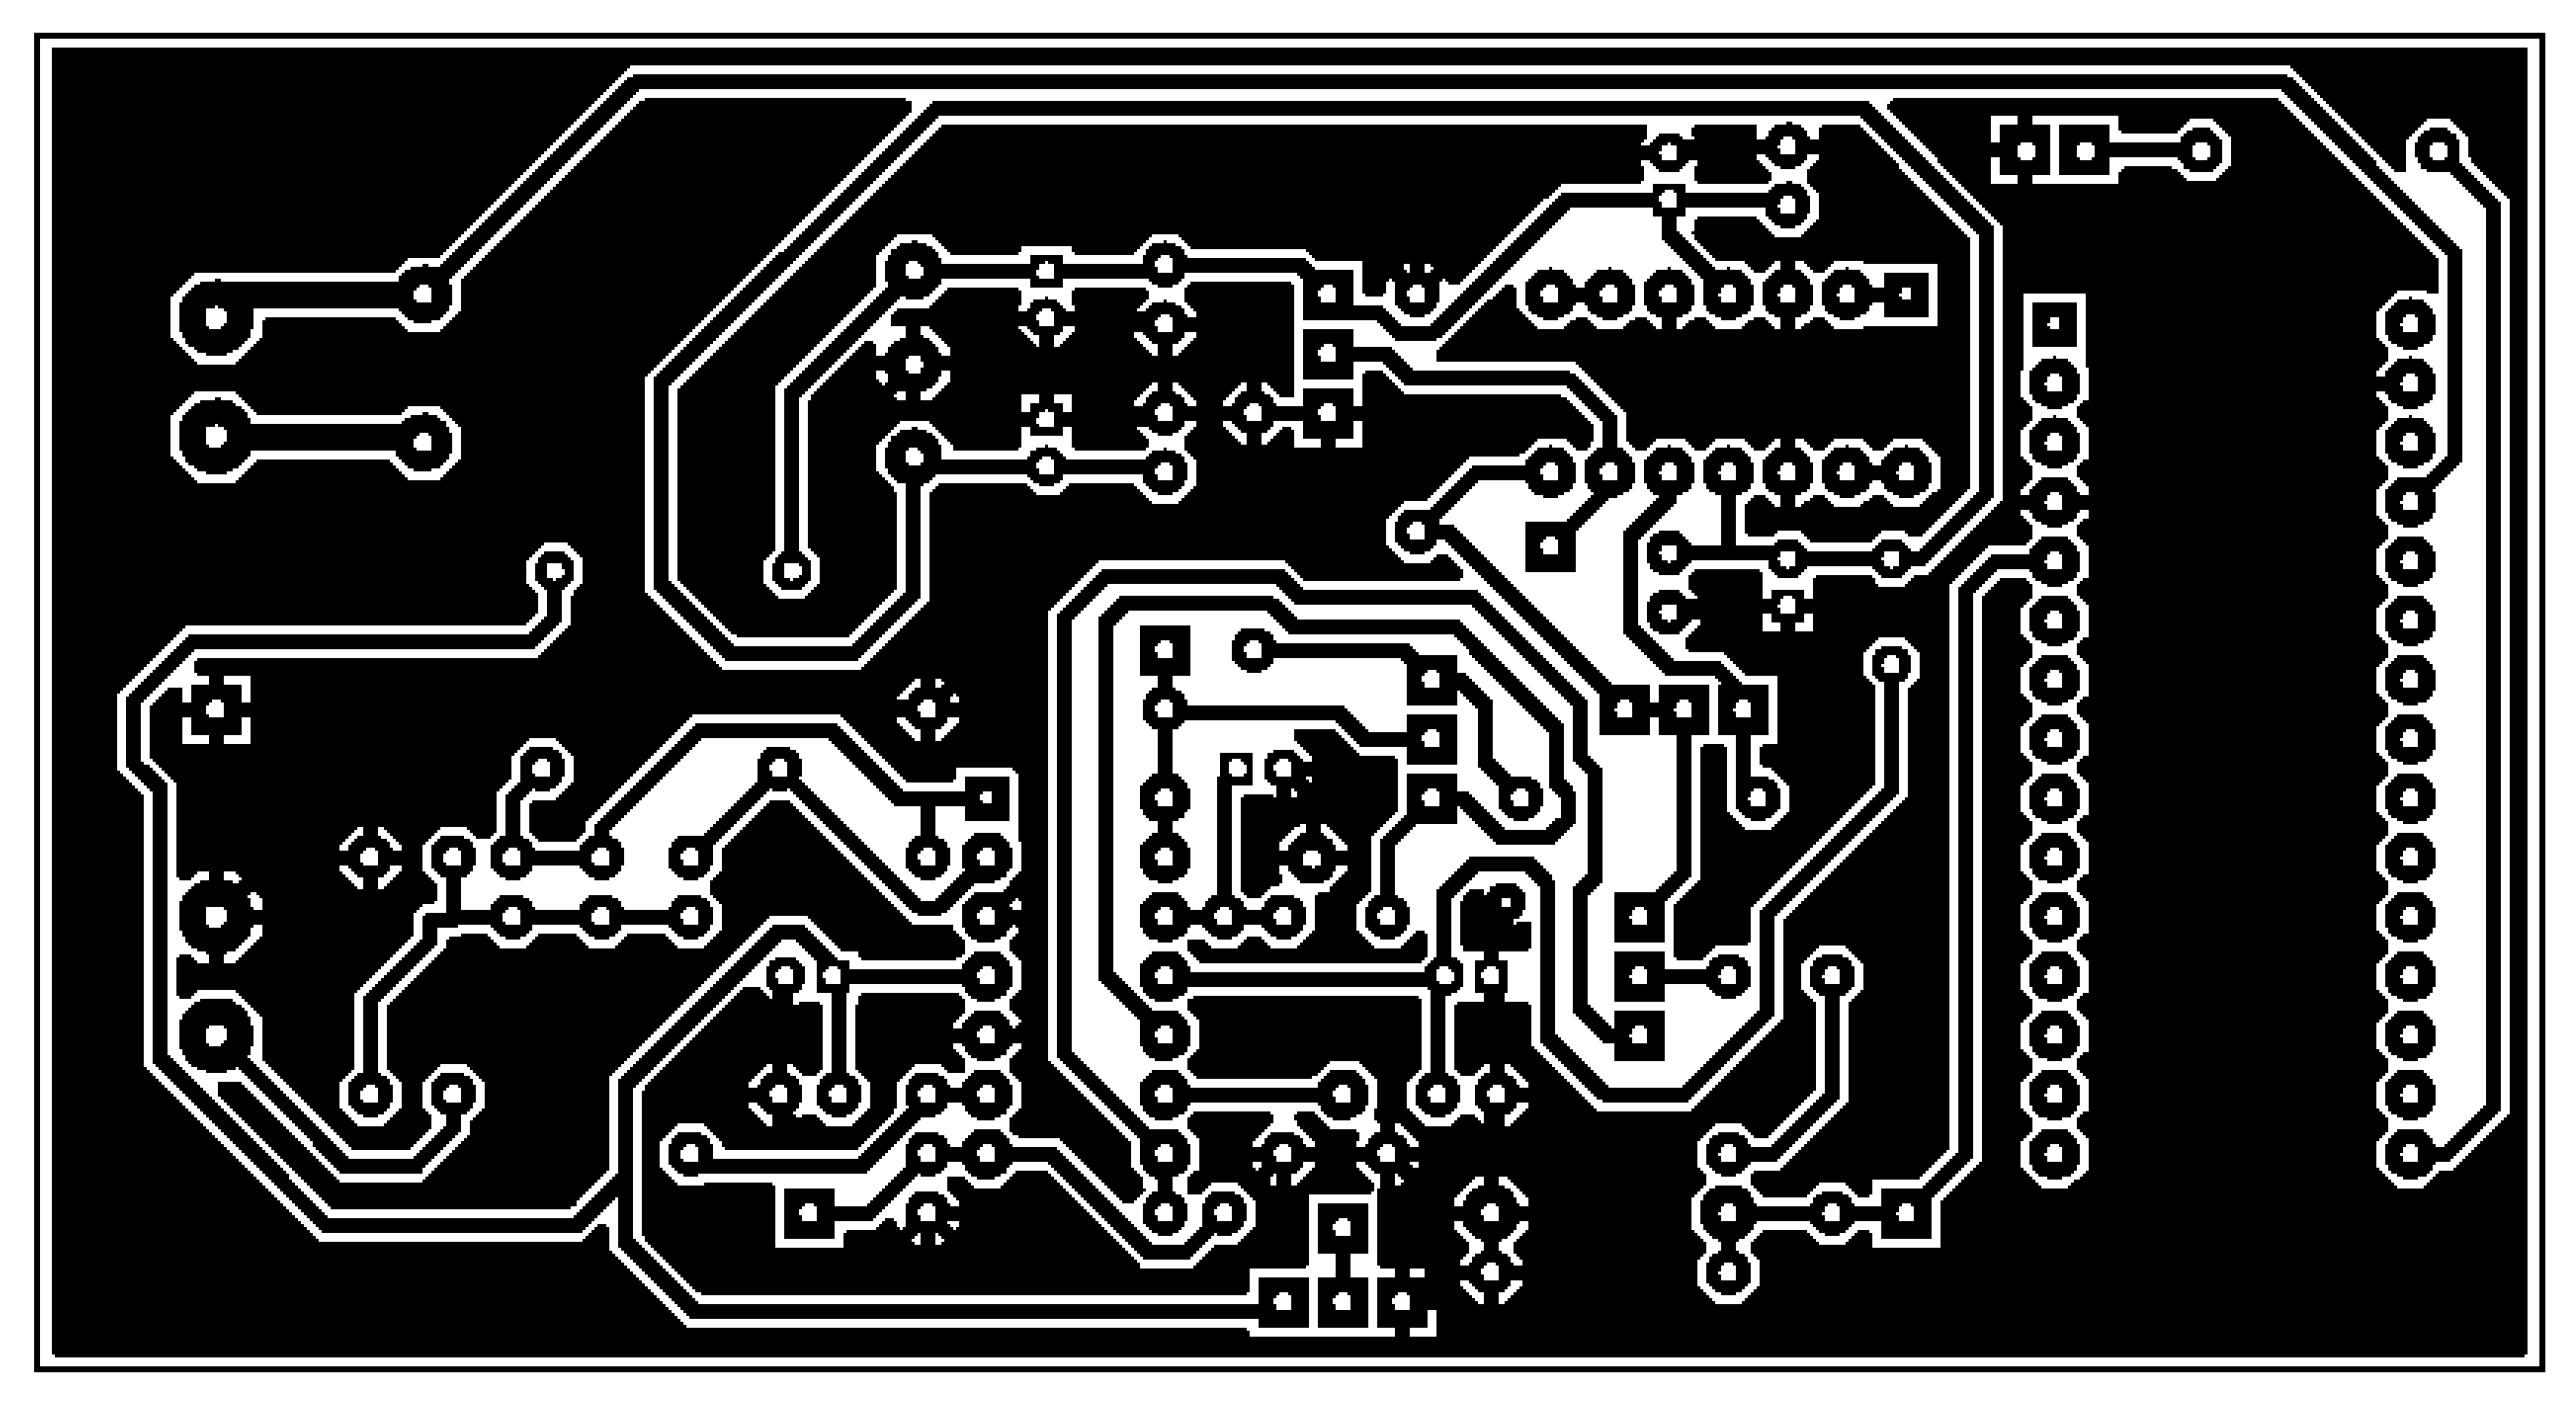
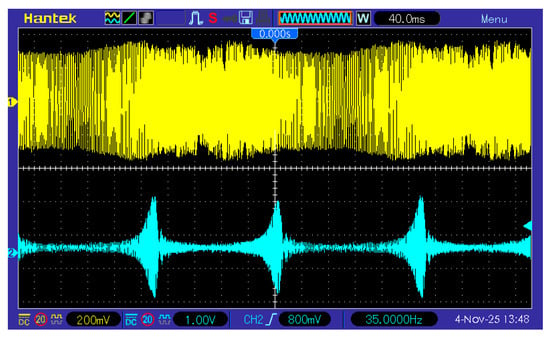
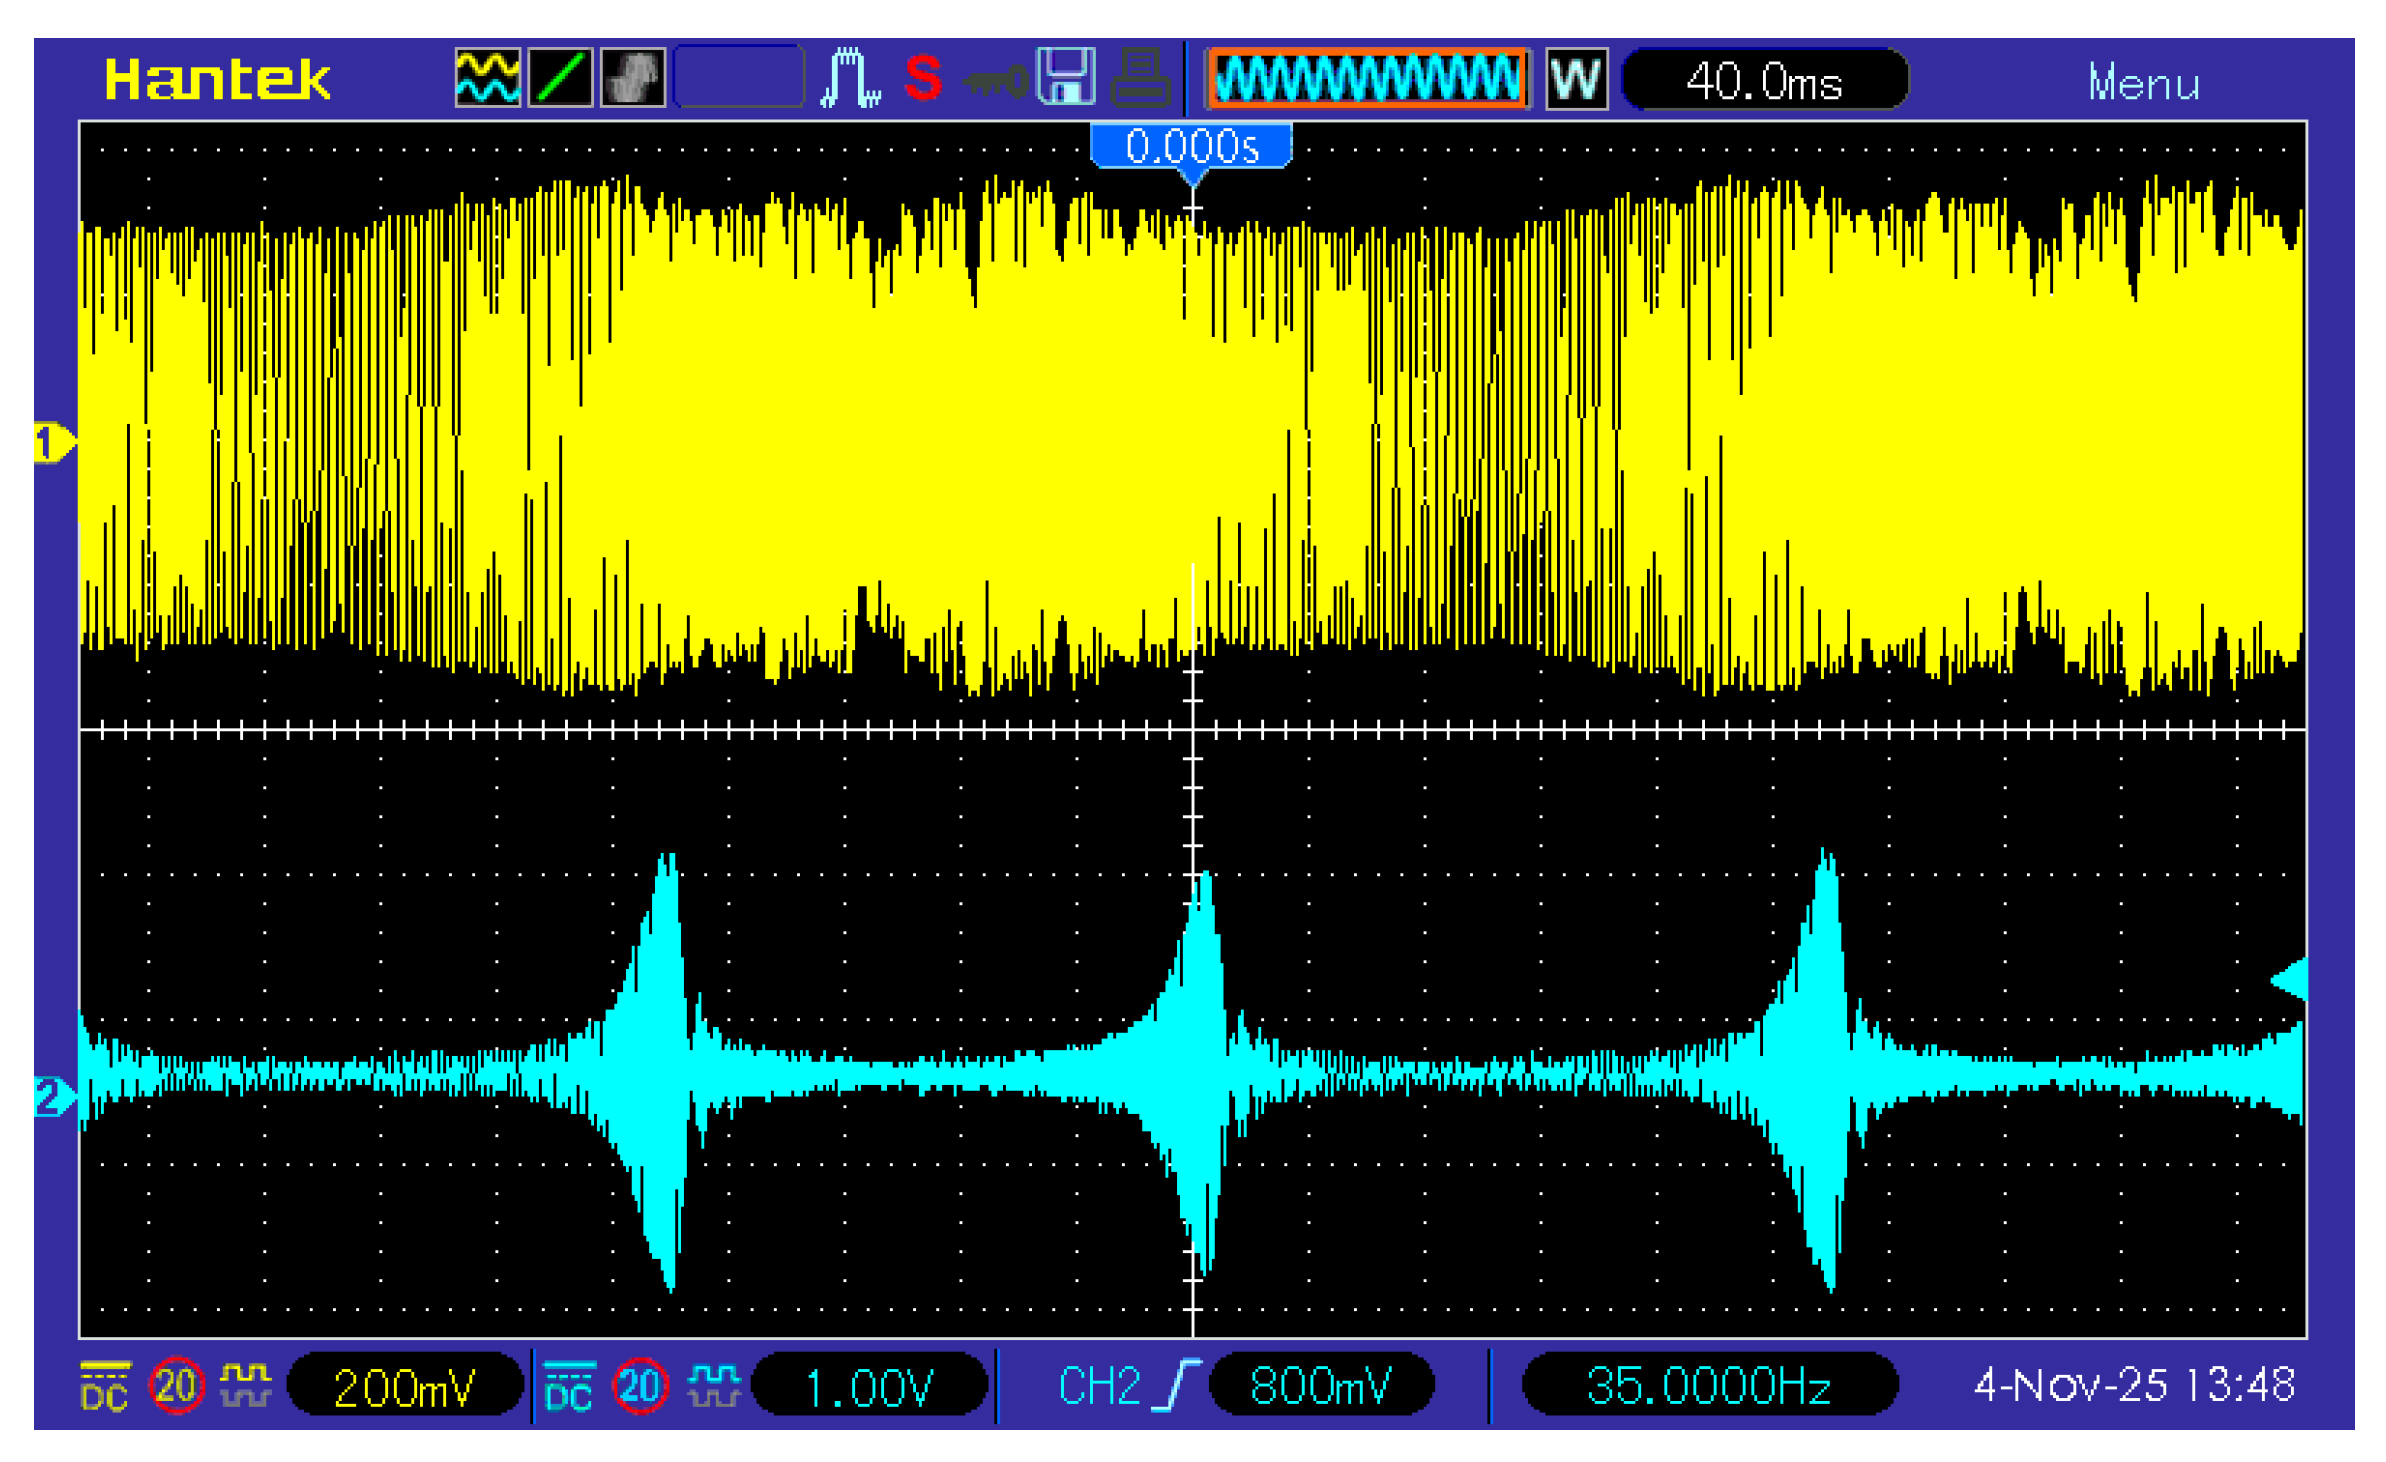
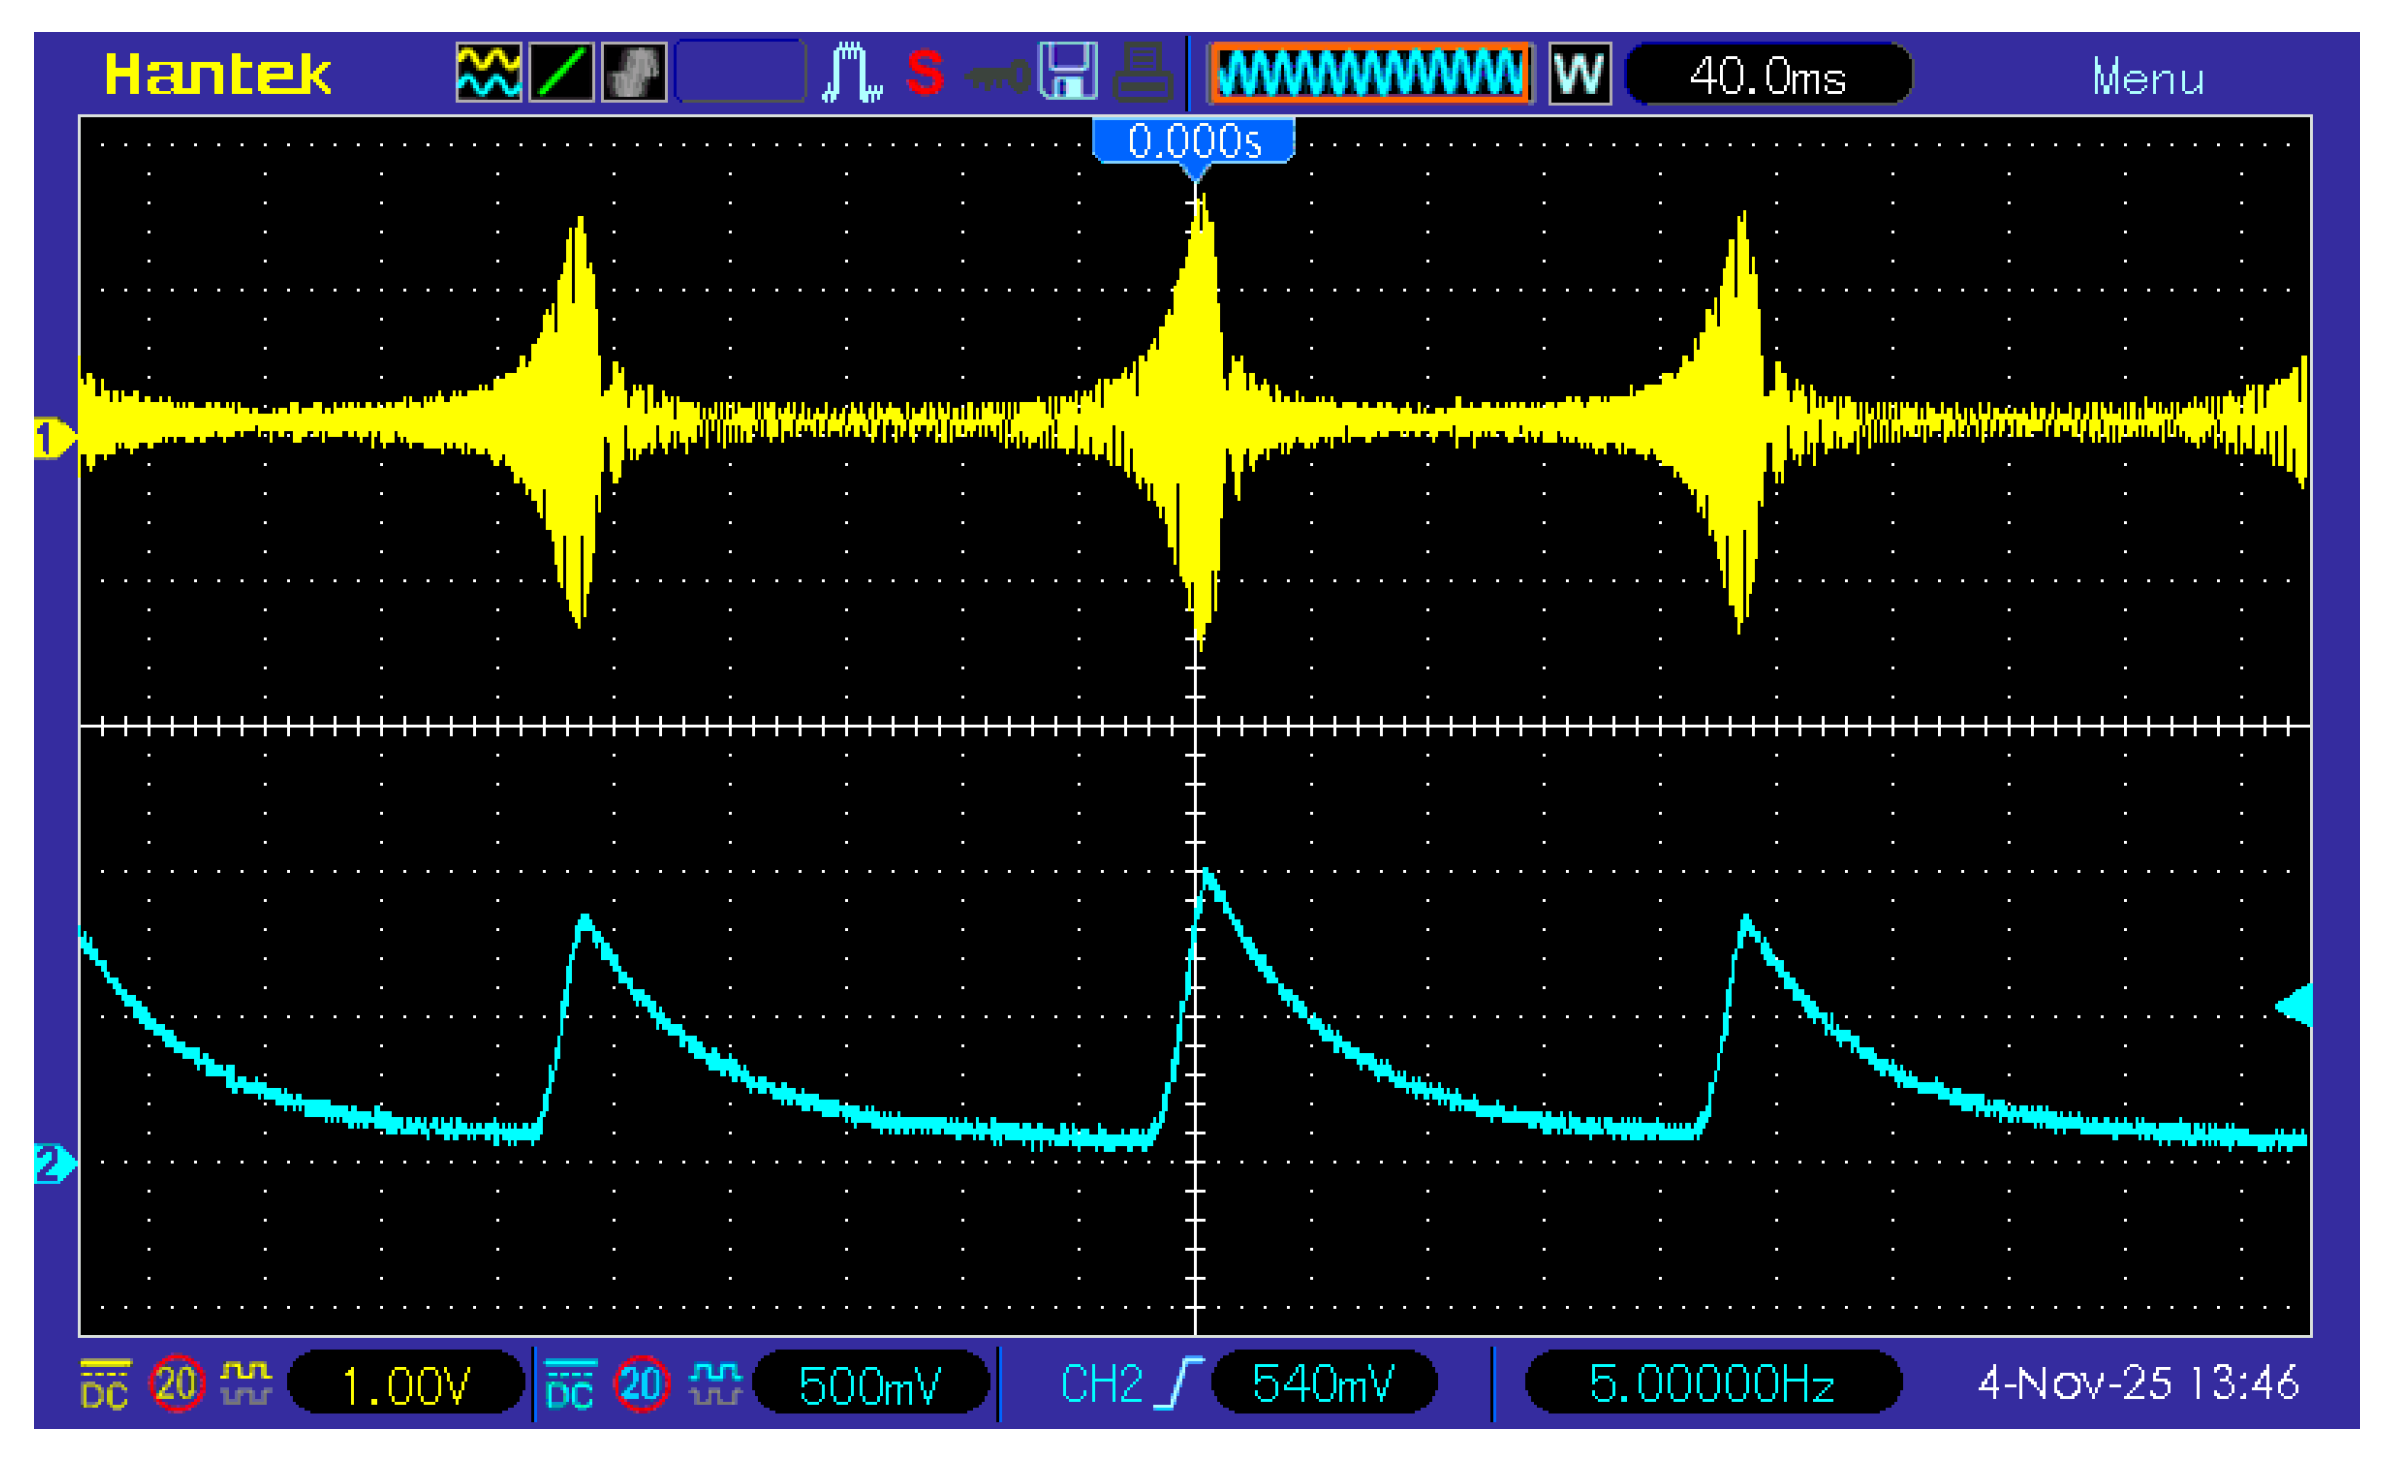
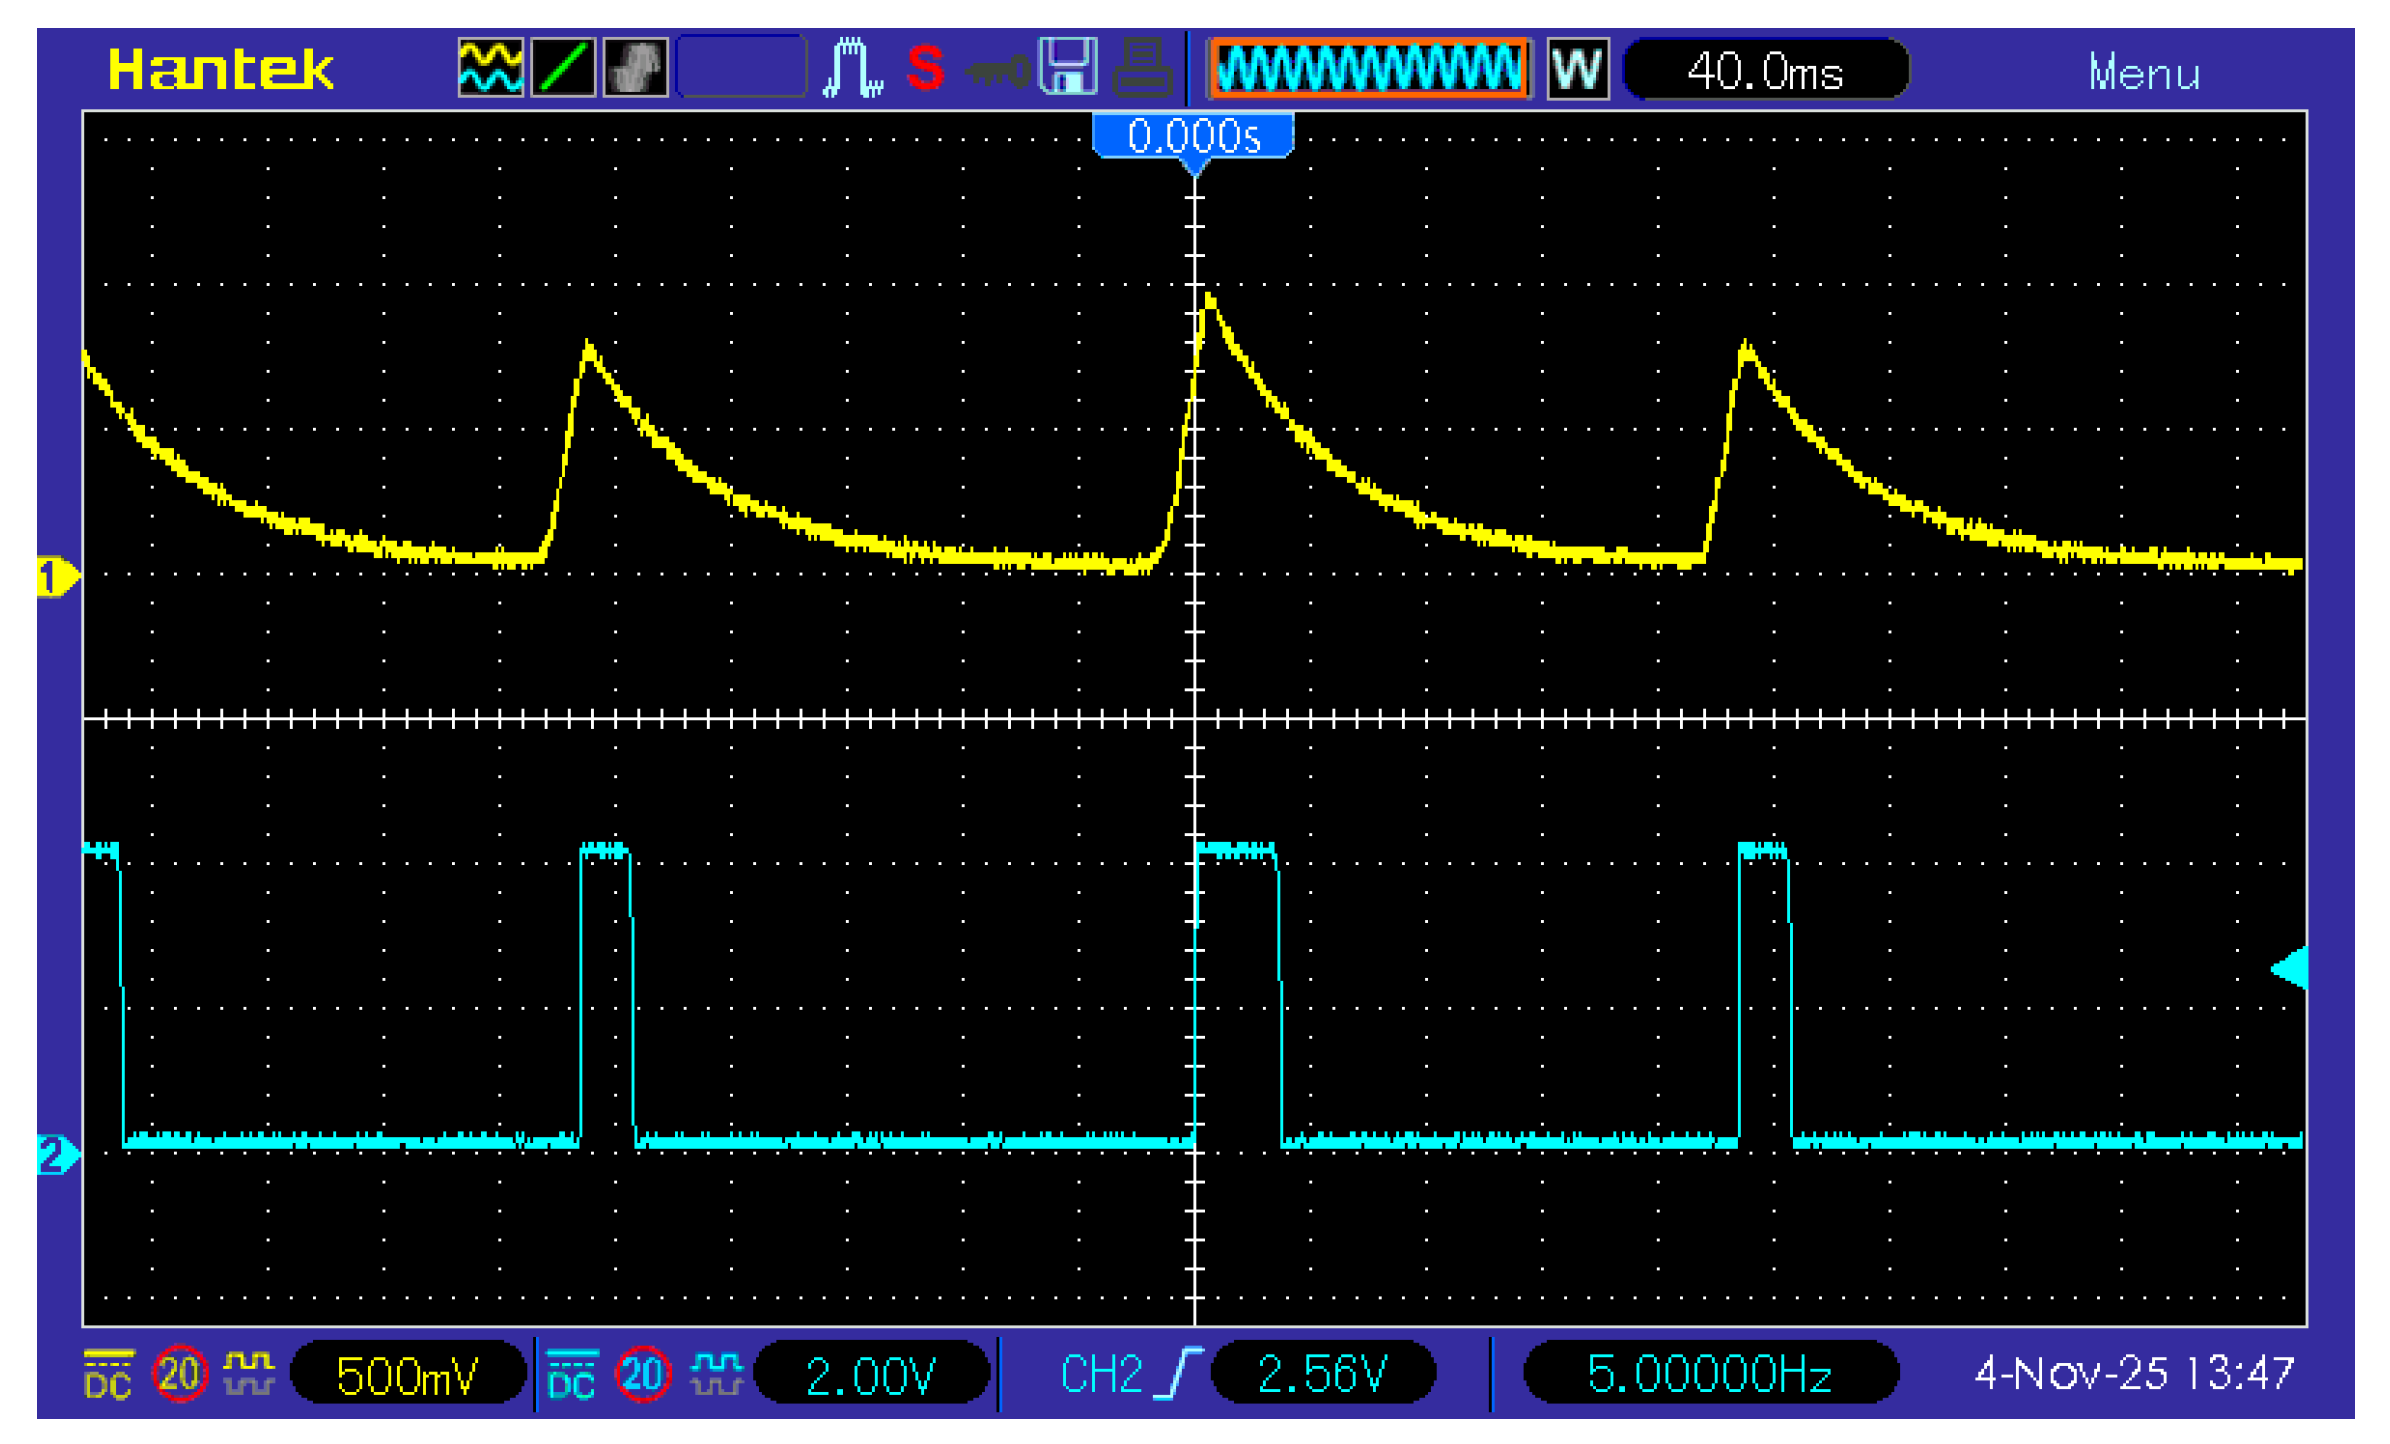
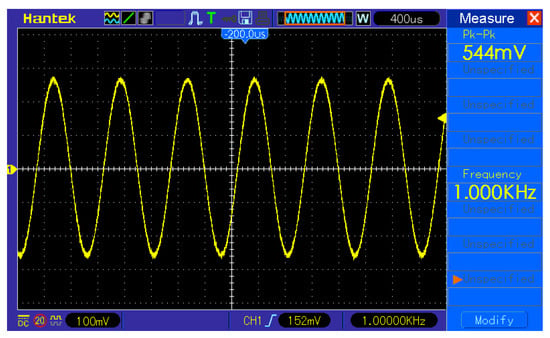
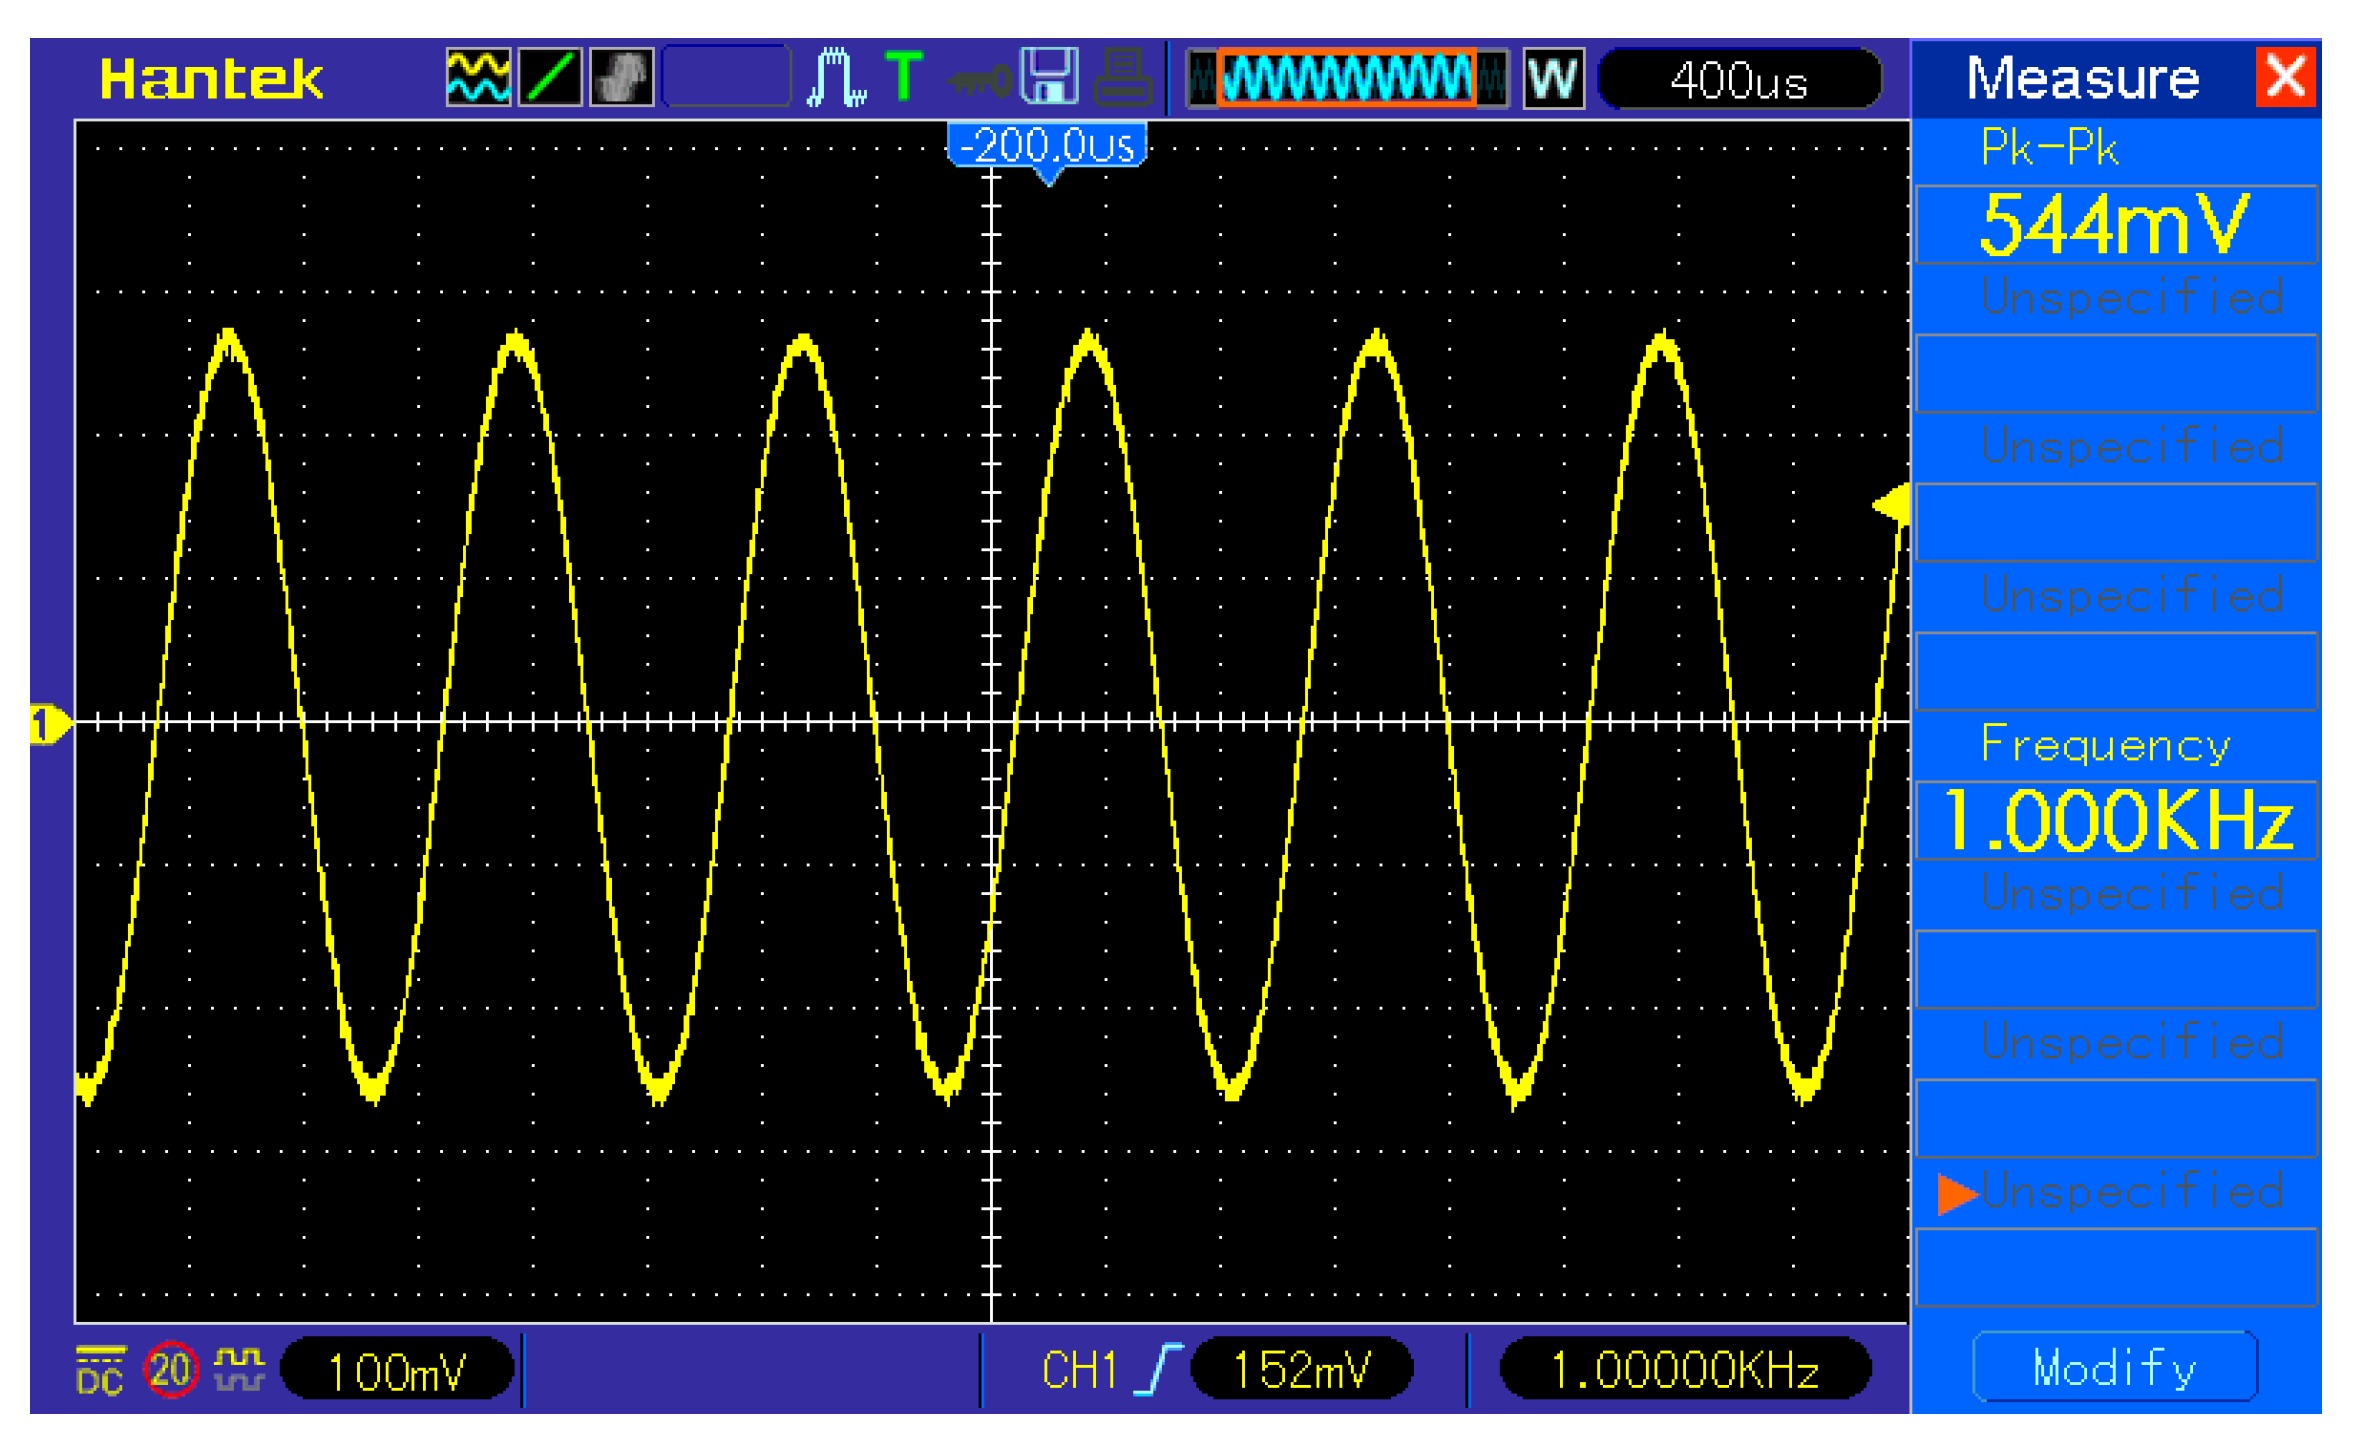
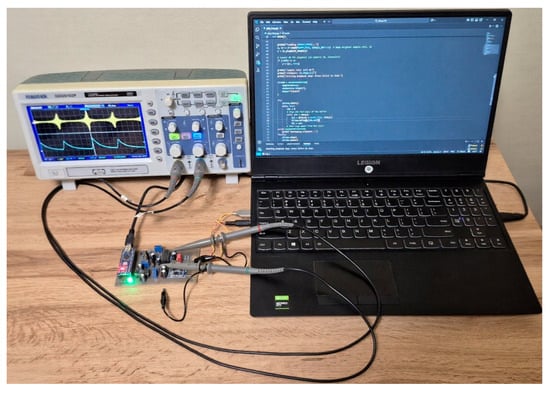
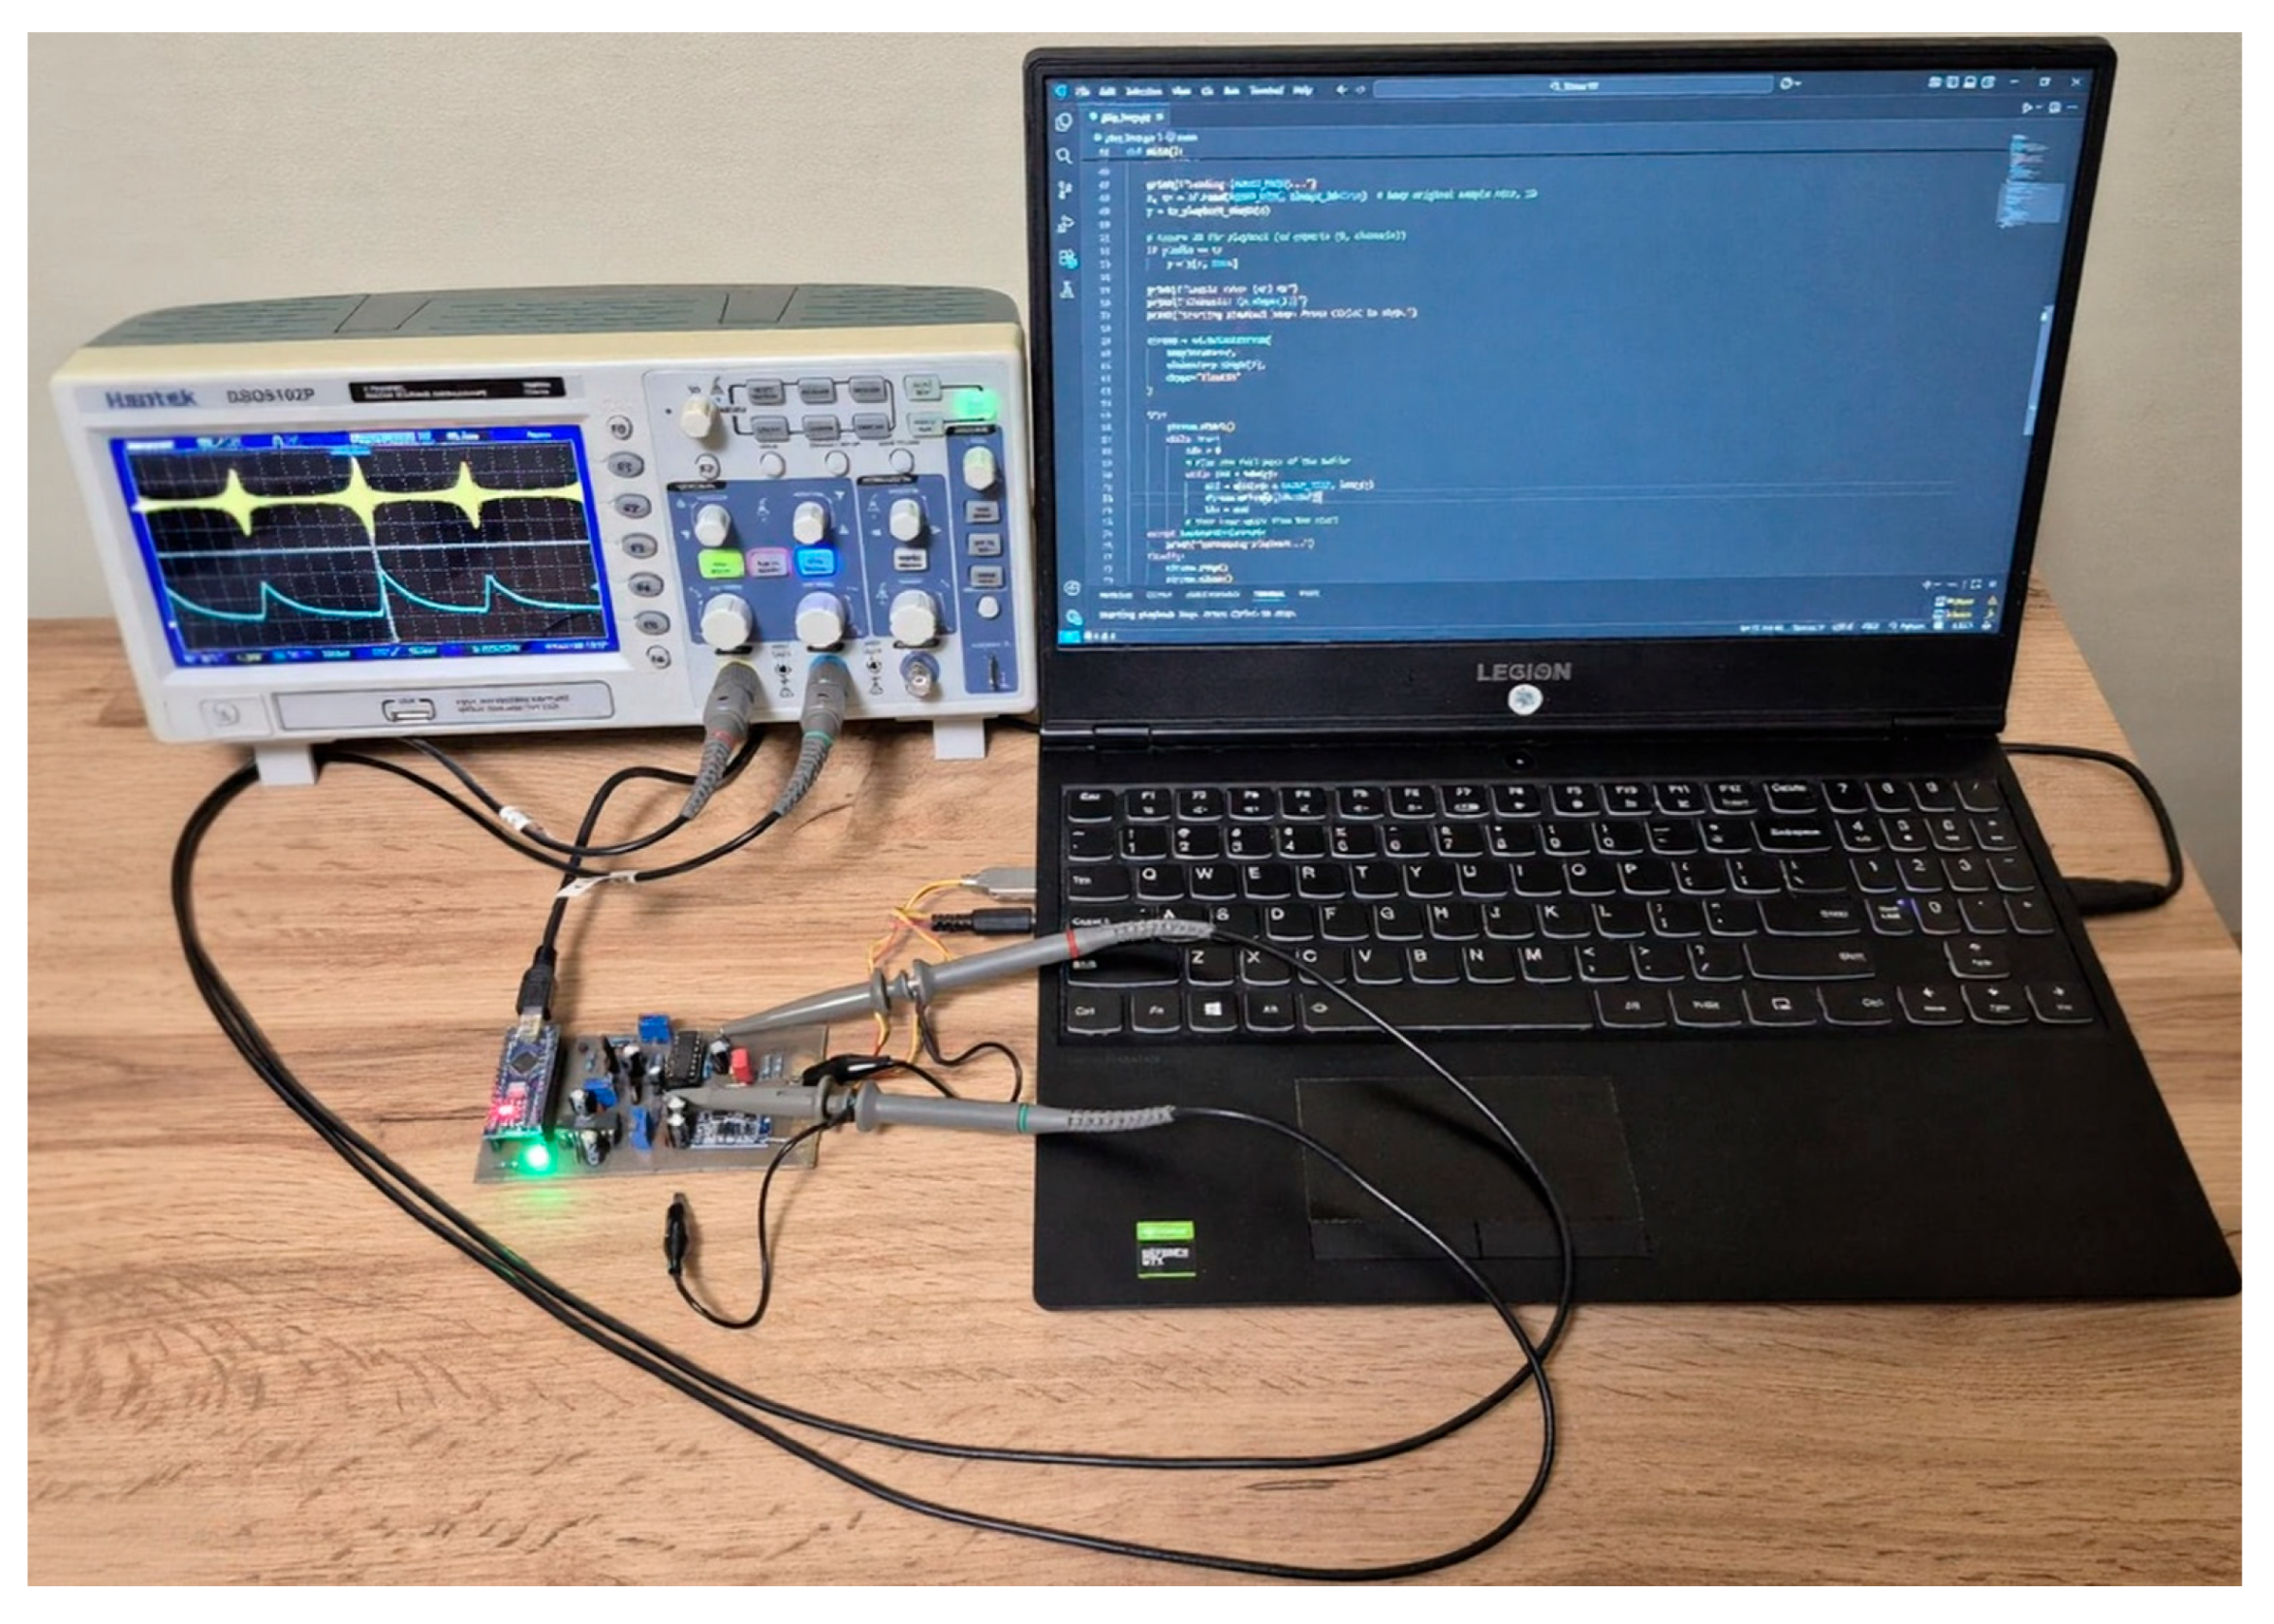
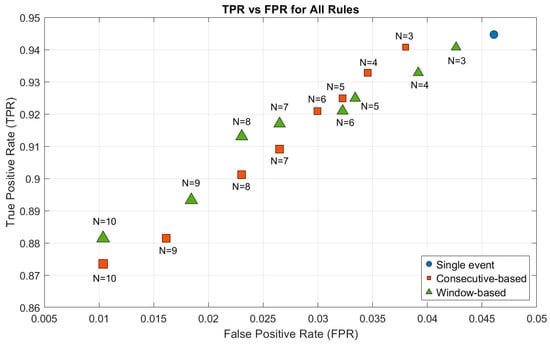
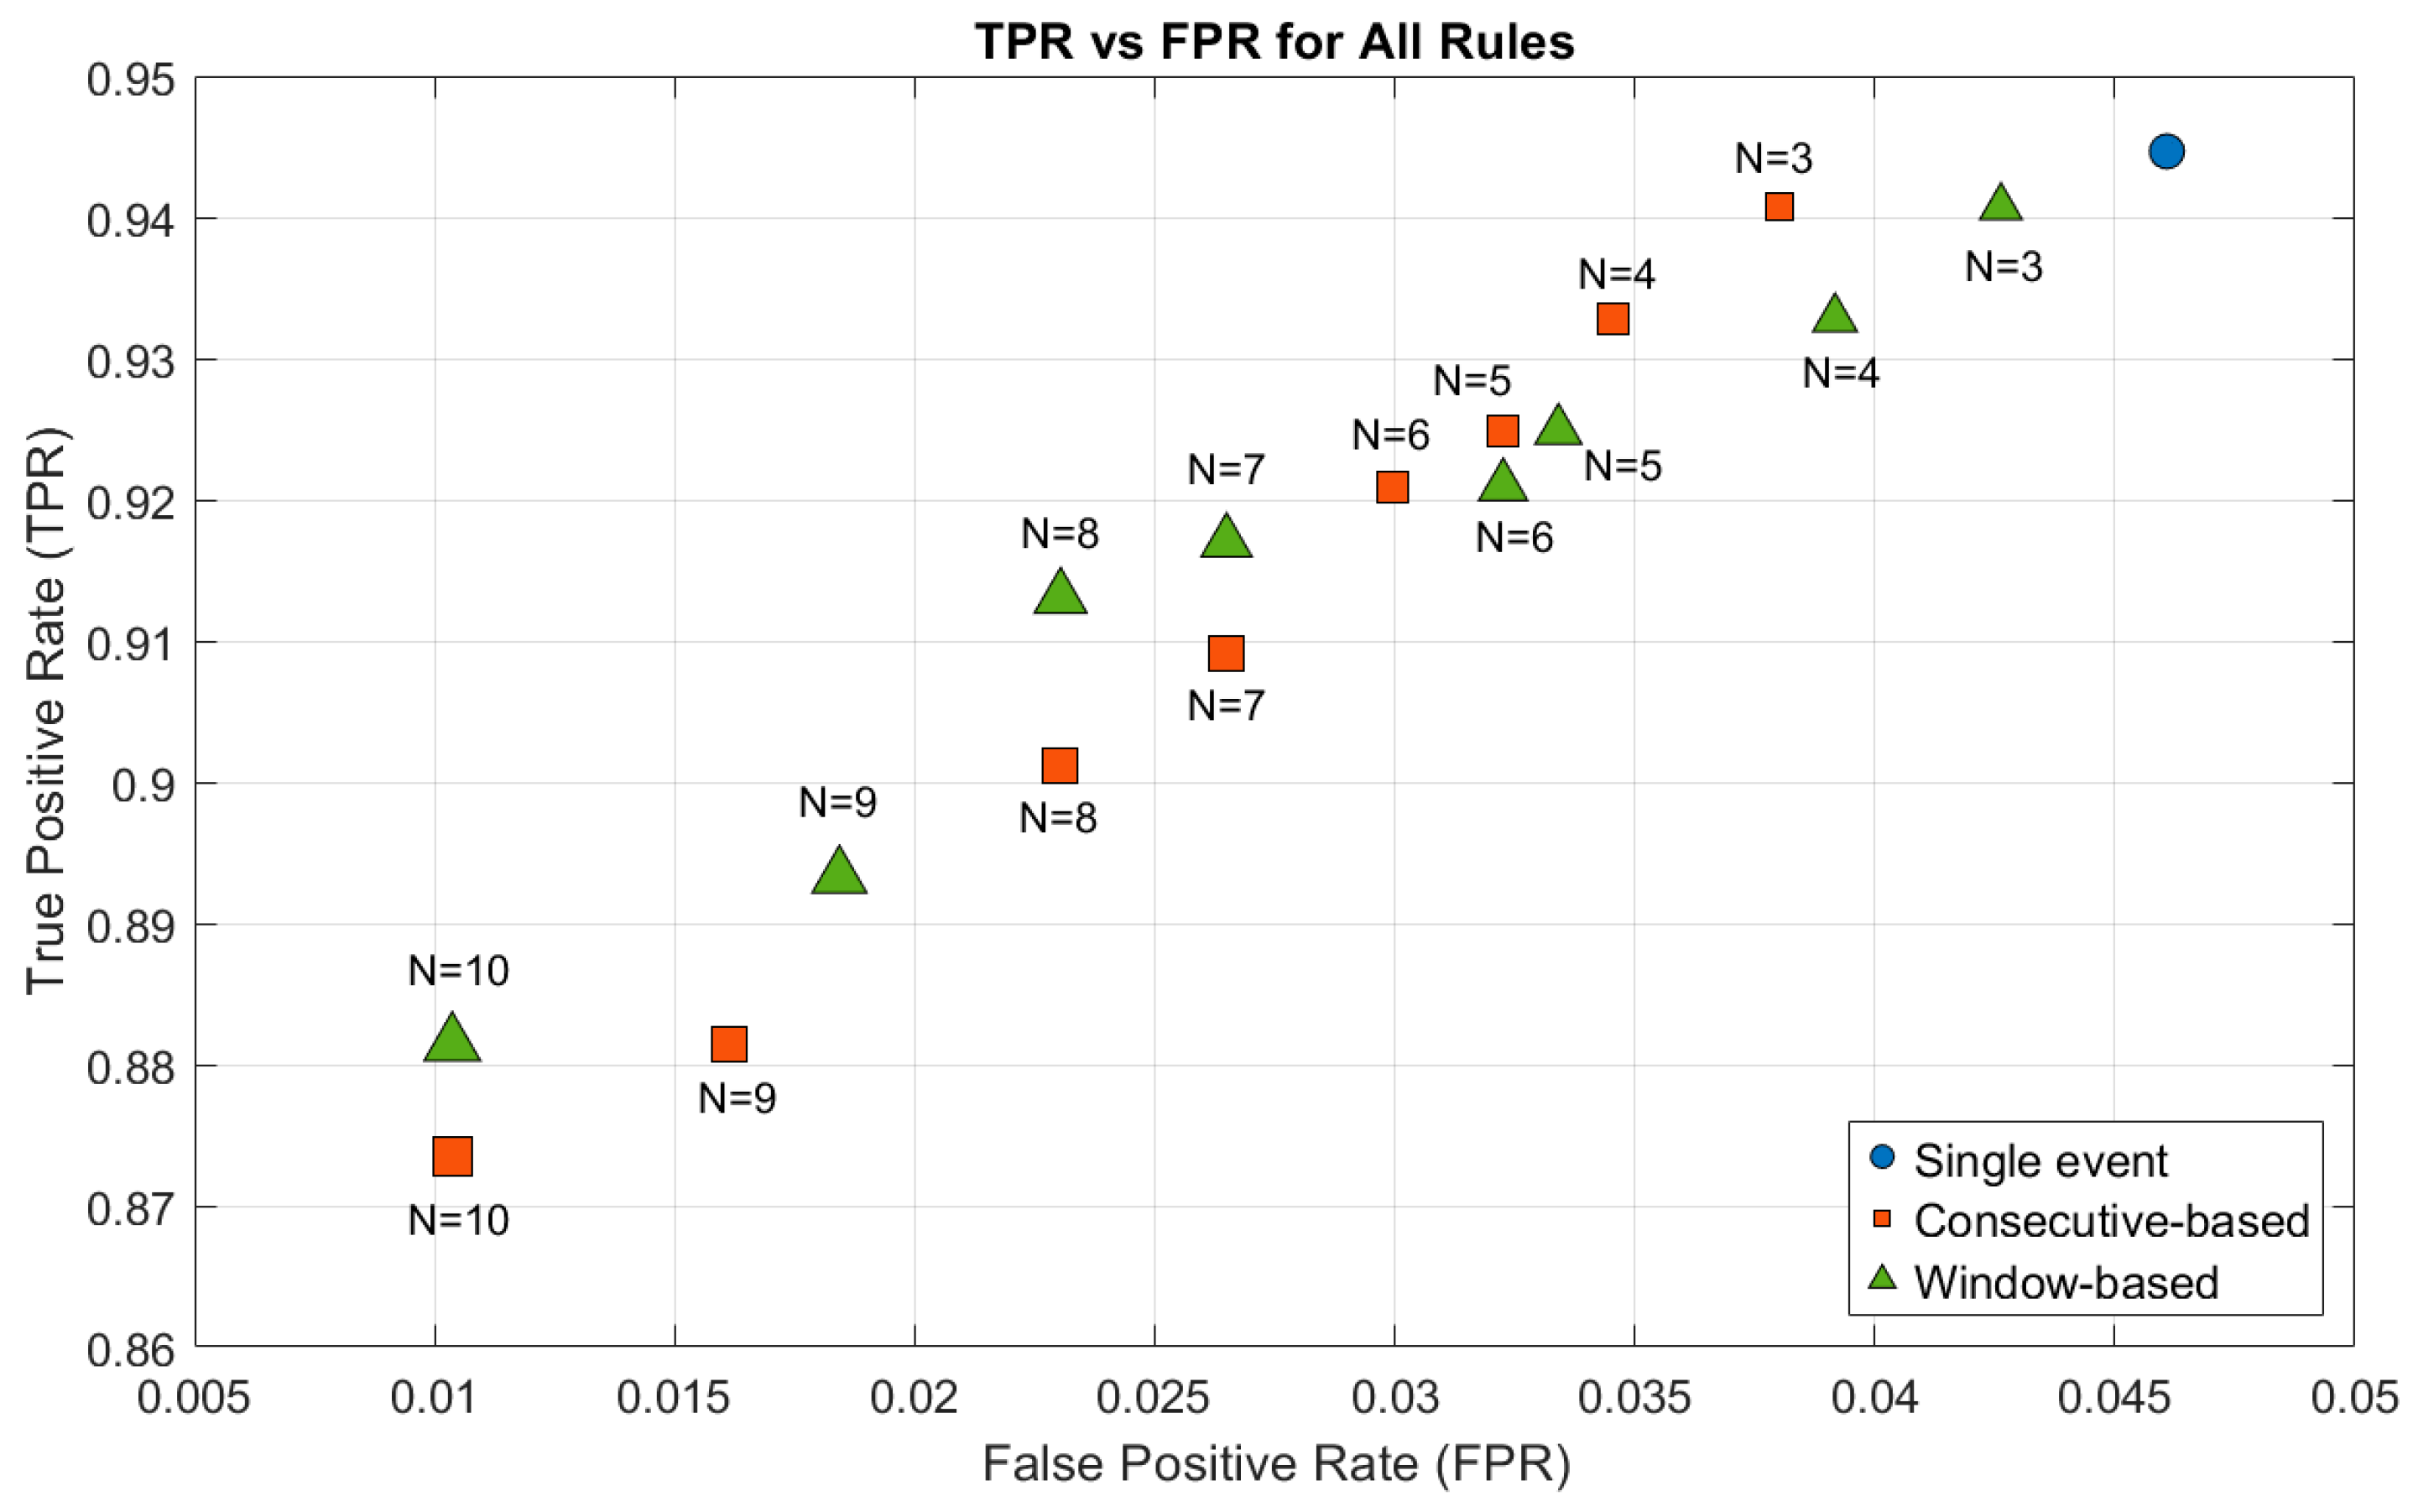
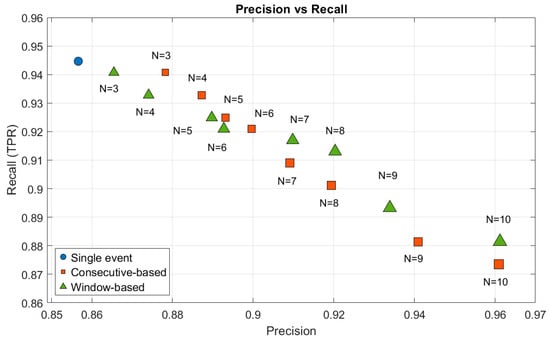
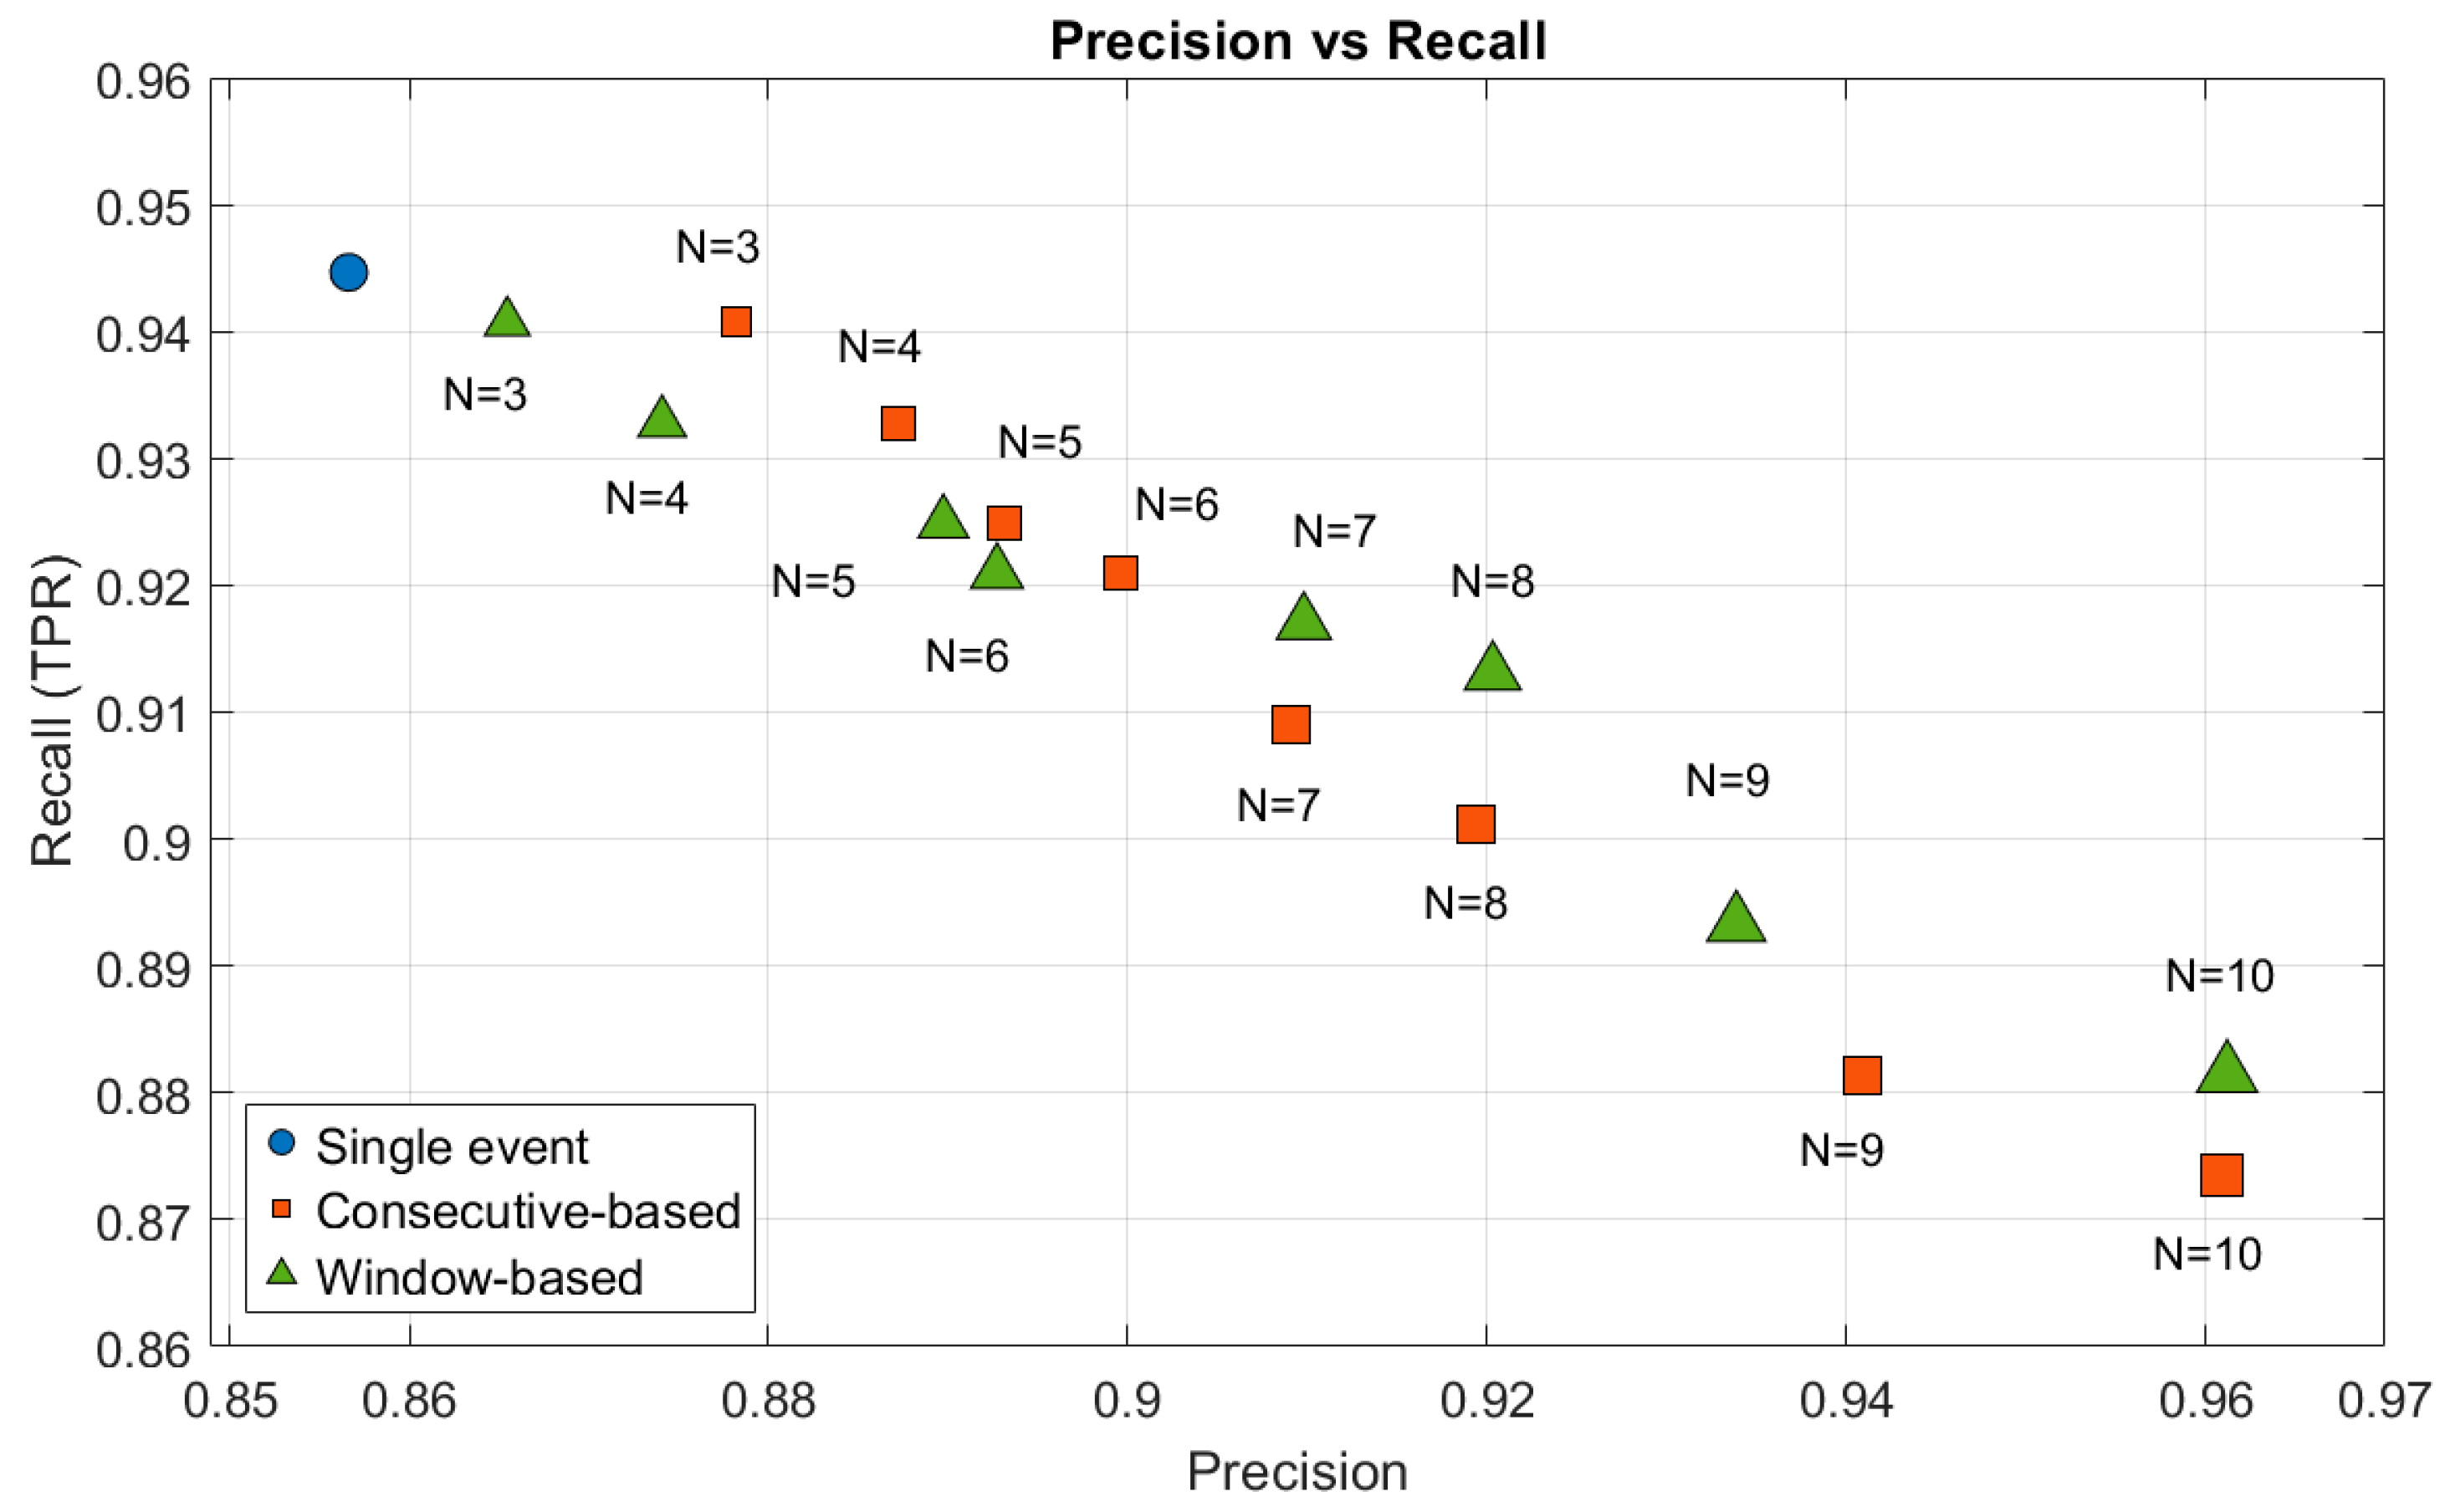
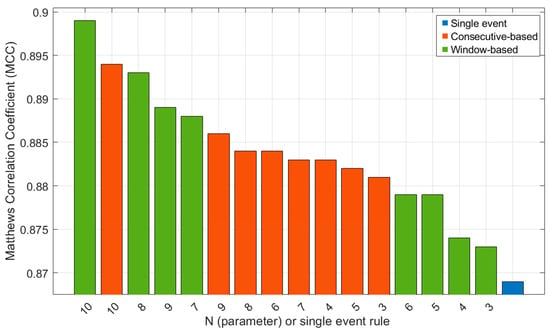
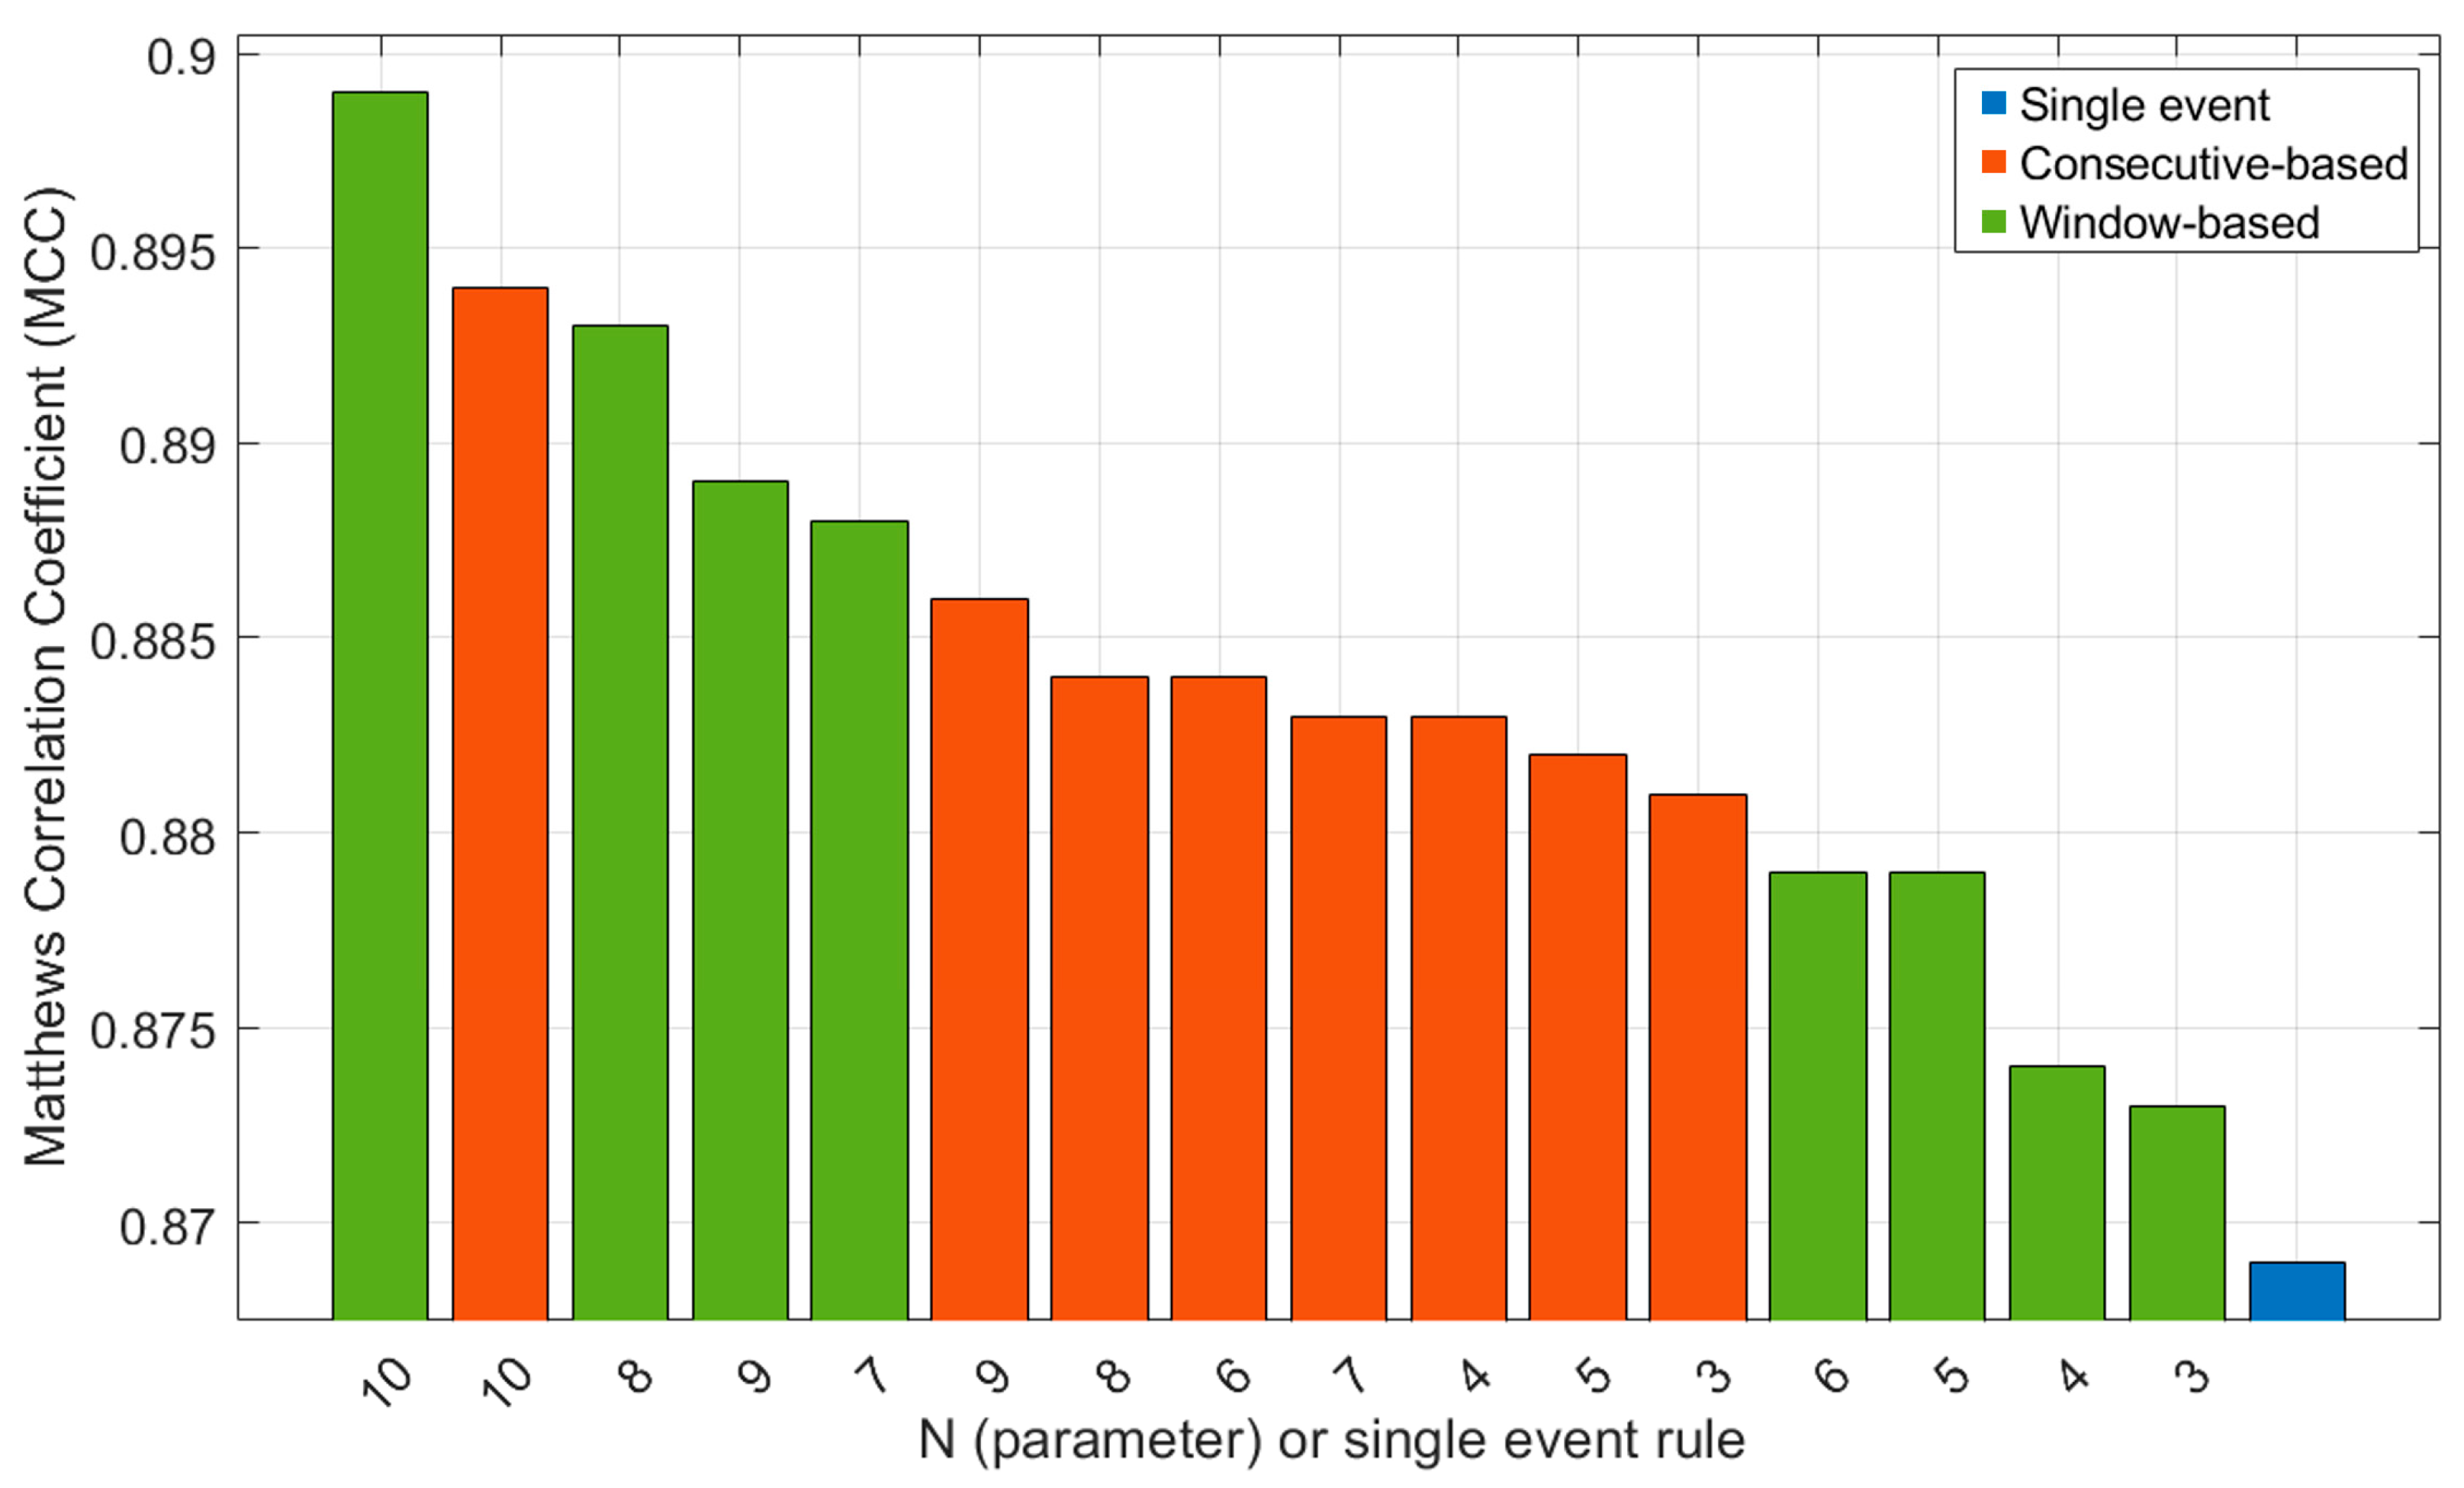
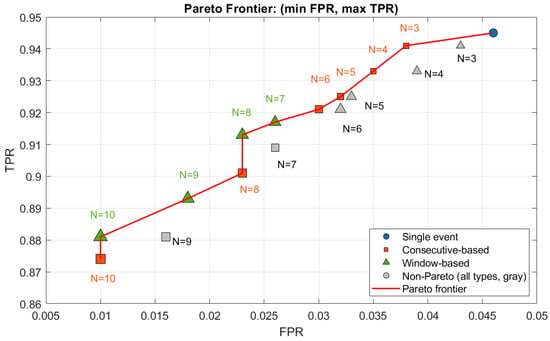
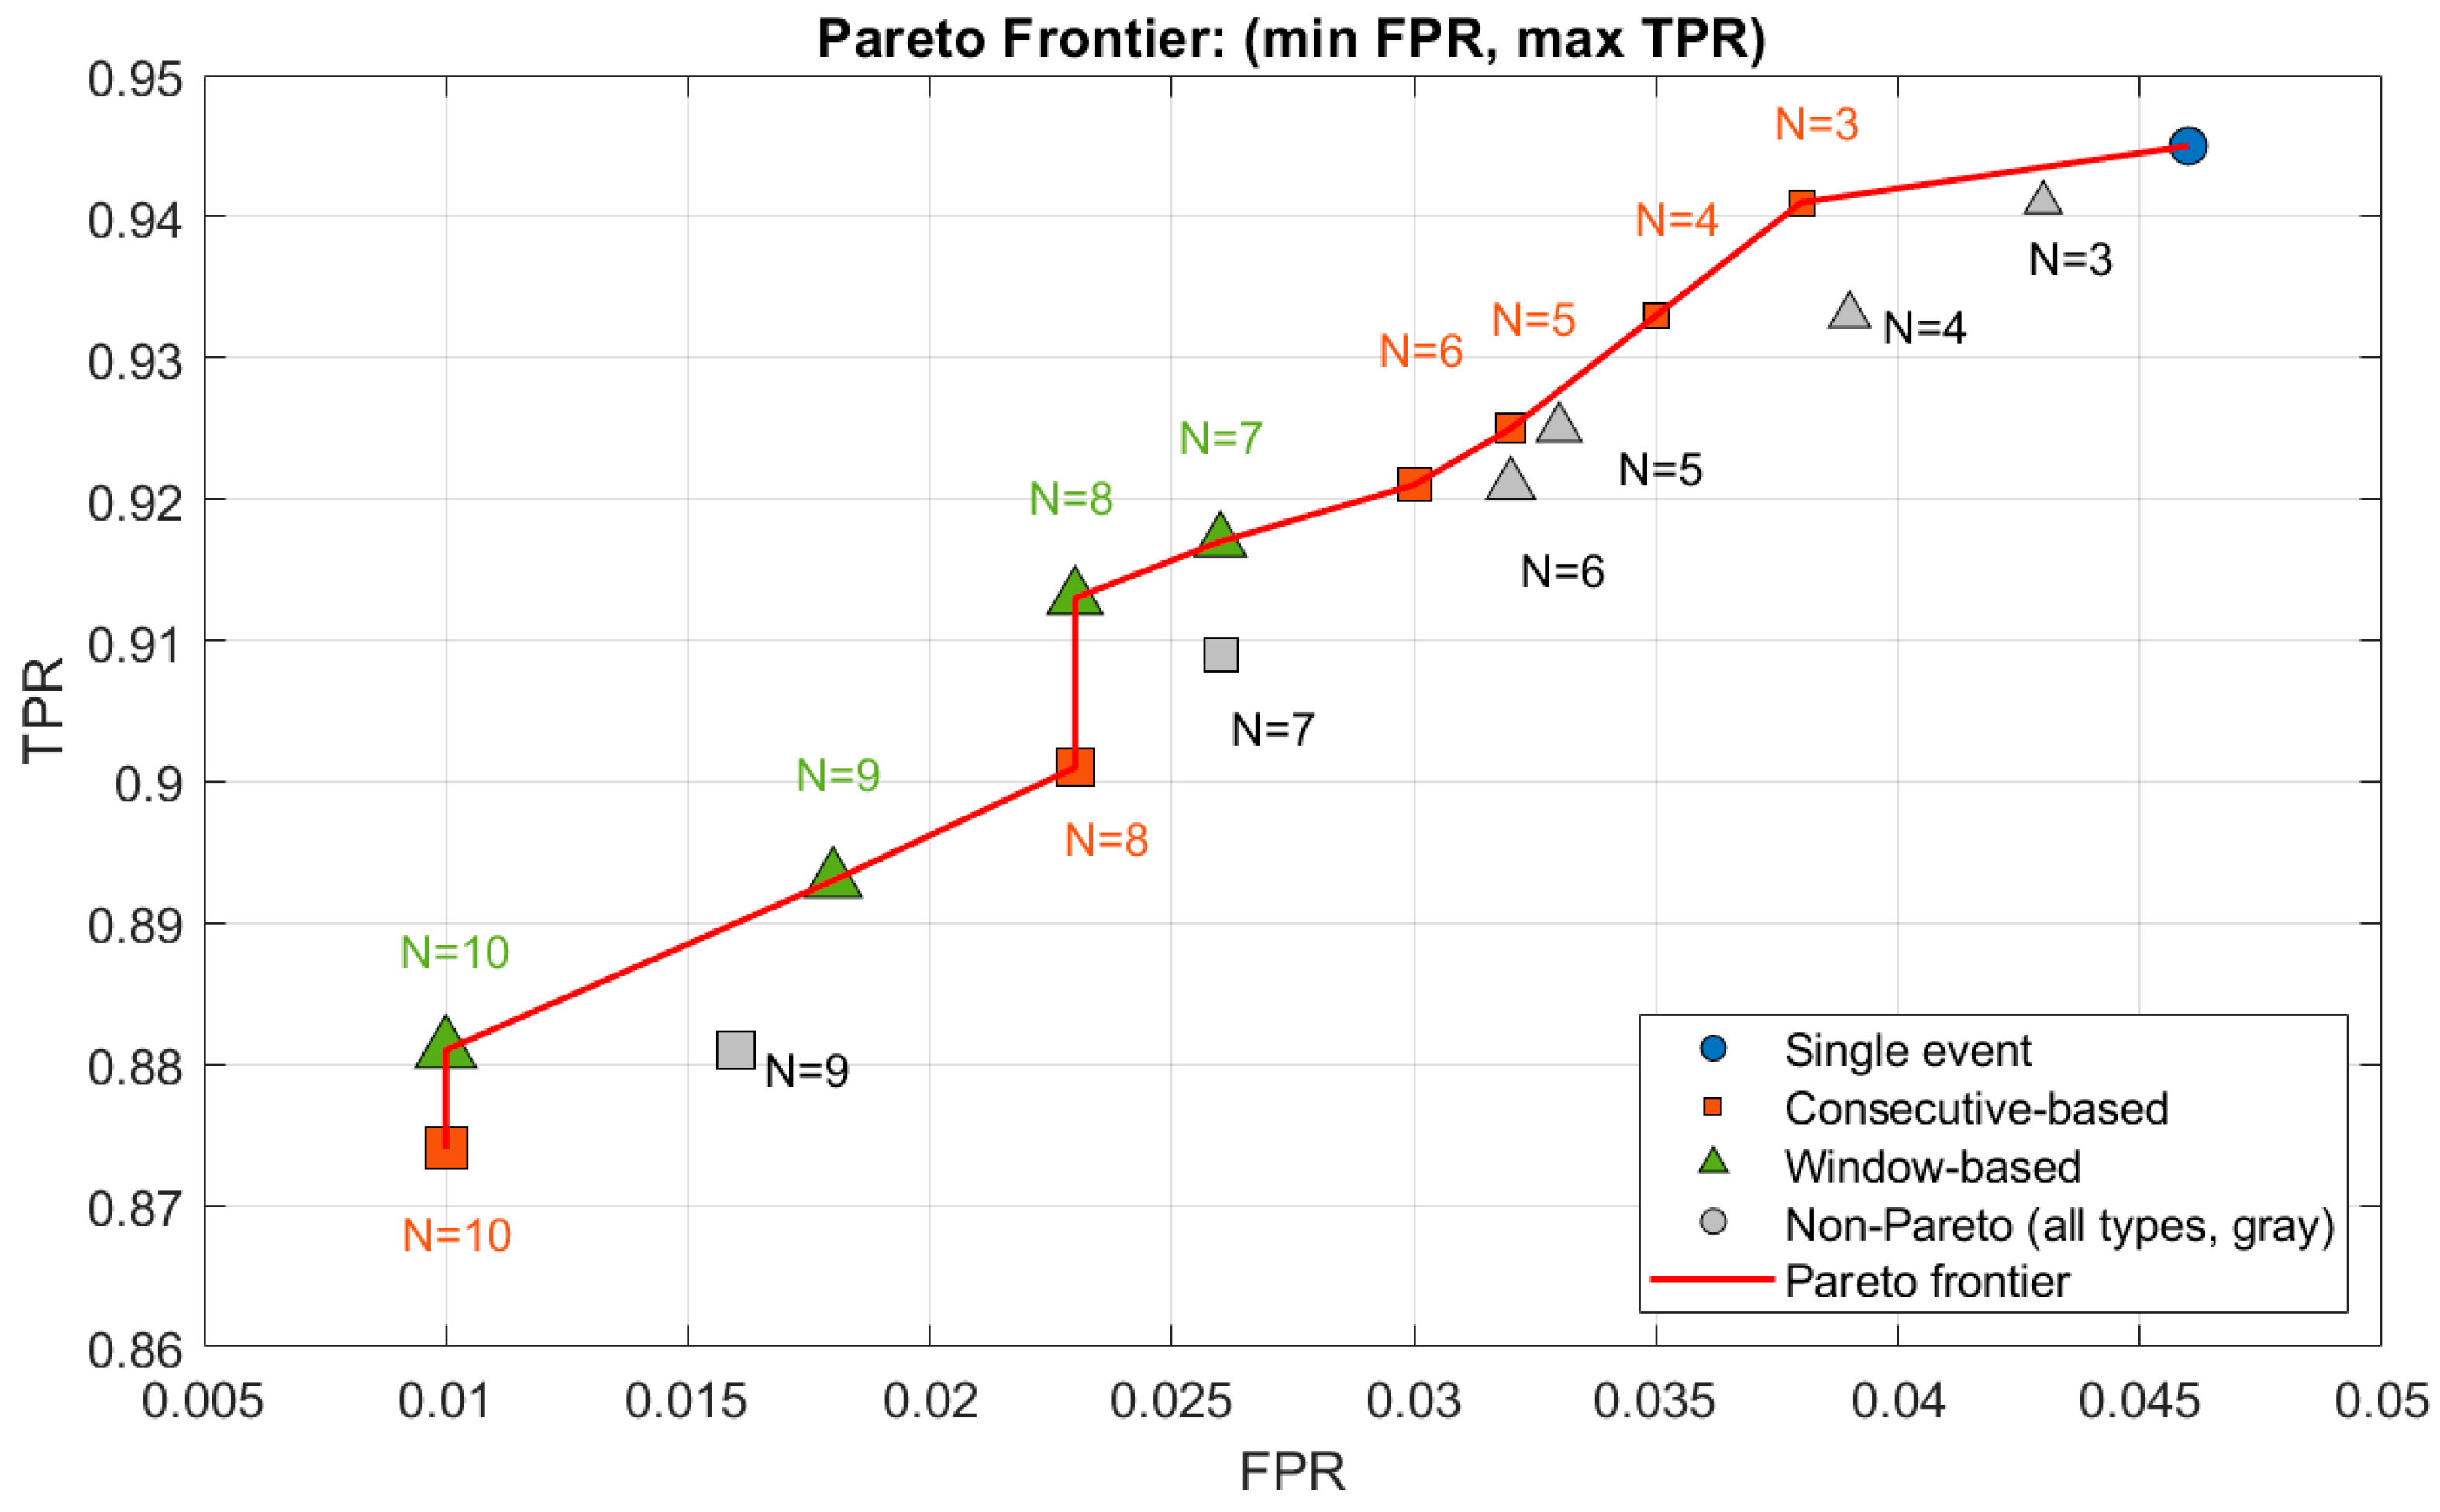

Disclaimer/Publisher’s Note: The statements, opinions and data contained in all publications are solely those of the individual author(s) and contributor(s) and not of MDPI and/or the editor(s). MDPI and/or the editor(s) disclaim responsibility for any injury to people or property resulting from any ideas, methods, instructions or products referred to in the content. |
© 2026 by the authors. Licensee MDPI, Basel, Switzerland. This article is an open access article distributed under the terms and conditions of the Creative Commons Attribution (CC BY) license.