


Abstract
This study investigates the spatiotemporal distribution of heavy metals in urban soils of Thessaloniki, Greece, over a four-year monitoring period (2021–2024). A total of 664 soil samples were collected across diverse land-use types during both wet (winter) and dry (summer) seasons. Soil physicochemical properties were analyzed alongside cadmium (Cd), copper (Cu), lead (Pb), and zinc (Zn) concentrations. The results reveal distinct, element-specific accumulation dynamics driven by continuous anthropogenic inputs. Statistical and geospatial analyses confirm that Cd exhibits a highly significant, progressive accumulation and spatial expansion toward residential areas. In contrast, Cu and Pb demonstrate a gradual, chronic enrichment, eventually reaching a saturation point where winter precipitation is insufficient to offset summer deposition. Zn presents as a severe but temporally stable contamination burden, anchored to the northwestern industrial–port sector. Furthermore, the alkaline properties of the local urban soils were found to act as an effective sink, immobilizing contaminants and preventing downward leaching. The Geo-accumulation Index (Igeo) confirms a progressive decline in soil quality driven primarily by cadmium, while the other trace elements exhibit persistent, stable profiles. Overall, this study establishes a vital geochemical baseline of total heavy metal loading in Mediterranean urban soils, emphasizing the need for targeted emission controls and future mobile-fraction assessments to guide sustainable urban management.
1. Introduction
The environmental integrity of rapidly expanding urban centers represents a constant challenge for global public health and ecological sustainability [1]. Within these complex ecosystems, soil serves as a critical interface for the accumulation, transformation, and eventual release of persistent pollutants [2,3]. Among the most hazardous contaminants, heavy metals (HMs) have remained a focal point of environmental research for over half a century [4] due to their recalcitrant nature, toxicity, and capacity for long-term bioaccumulation [5]. Unlike organic pollutants, HMs are non-biodegradable, meaning their entry into the urban pedosphere—whether via atmospheric deposition, industrial effluents, or vehicular emissions—often results in a permanent geochemical signature that threatens both soil functionality and human health [3,4].
Urban soils constitute a unique and highly heterogeneous pedological class, frequently shaped by intensive anthropogenic perturbations [6]. These soils are characterized by significant spatial discontinuities and diverse physical properties [7], largely influenced by the proximity of industrial installations, infrastructure development, and dense transportation networks [6,8,9]. In metropolitan environments, green spaces and residential parks often act as unintended sinks for these trace elements [10], creating potential exposure pathways for the urban population, particularly vulnerable groups like children [10,11,12].
Previous environmental assessments in Thessaloniki have established that heavy metal contamination is primarily driven by vehicular emissions and industrial activities [13]. Recent evaluations of urban green zones specifically identified cadmium (Cd) as a prominent pollutant posing significant ecological risks, alongside moderate, traffic-related contamination from copper (Cu), lead (Pb), and zinc (Zn) [14,15]. Furthermore, studies analyzing road dust have highlighted distinct seasonal patterns, with contaminant concentrations typically peaking during the dry summer months. However, because these foundational studies largely provided short-term evaluations or focused on specific sub-environments, they capture only a transient snapshot of urban soil quality. Consequently, a critical need arises to determine whether these elevated concentrations represent stable, localized anomalies or a progressive degradation of the urban pedosphere. Addressing this gap, the present study aims to evaluate the continuous spatiotemporal accumulation of key heavy metals across a highly heterogeneous urban matrix over a four-year period (2021–2024), testing the hypothesis that these contaminants are experiencing long-term environmental enrichment and expanding geographically from established industrial hotspots into residential areas.
More specifically, the city of Thessaloniki, Greece, presents a distinct case study for spatiotemporal pollution monitoring [16]. As a major commercial and passenger hub, the city features a high-activity port [14] and a central railway network that links Northern Greece with the Balkans and Central Europe [17]. Furthermore, the regional climate is defined by intensive seasonal cycles, with heavy pluvial episodes in the winter and prolonged arid conditions in the summer [18]. These meteorological shifts significantly govern the mechanical resuspension of contaminated street dust and the subsequent surface loading of soils. While previous assessments have evaluated urban soil quality in Greek metropolitan areas [8,9,12,16,19,20], there is a critical need for extended monitoring to distinguish between transient fluctuations and progressive, long-term elemental enrichment.
This research addresses this gap by presenting a comprehensive four-year assessment (2021–2024) of heavy metal accumulation in Thessaloniki’s urban soils. By expanding the temporal scale beyond typical “snapshot” studies, this work provides empirical evidence of the steady decline in soil quality and the consolidation of geochemical hotspots. The study employs advanced geostatistical techniques and the Geo-accumulation Index (Igeo) [21] to evaluate the influence of seasonal variations and diverse land-use categories, ranging from high-traffic arterial roads to residential neighborhoods, on the distribution of Cd, Cu, Pb, and Zn.
The primary objective of this research is to evaluate the spatiotemporal distribution and accumulation trends of key heavy metals within the urban soils of Thessaloniki over a continuous four-year monitoring period (2021–2024). Specifically, the study aims to: (a) Investigate the geospatial variations in Cd, Cu, Pb, and Zn concentrations across study area, including industrial-port interfaces, high-traffic corridors, and urban green zones, (b) Quantify the impact of seasonal meteorological cycles (wet vs. dry periods) on the surface retention and atmospheric deposition of heavy metals, (c) Utilize spatial interpolation (Kriging) and pollution indices (Igeo) to identify persistent contamination hotspots and map the geographic expansion of “over-limit” areas over time.
2. Materials and Methods
2.1. Study Area and Sampling
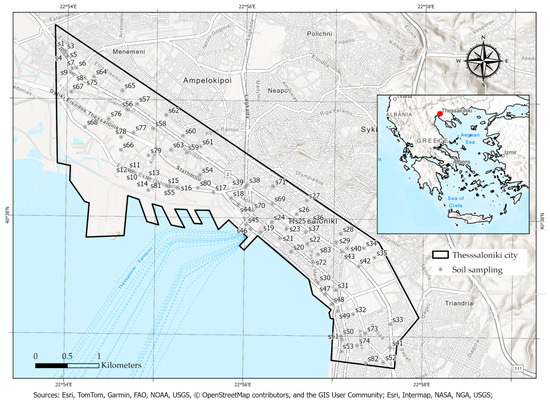
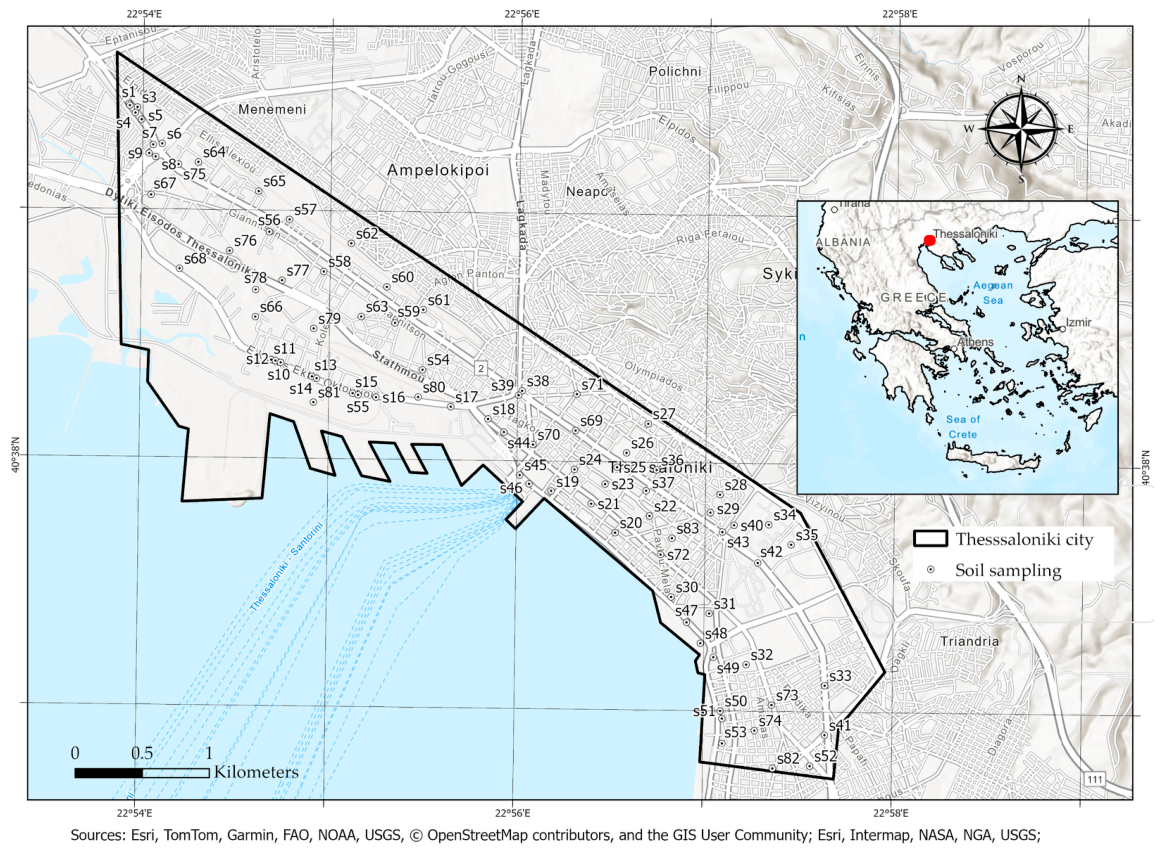
Soil sampling was conducted across the urban area of Thessaloniki city over a four-year period (2021–2024) to assess the spatiotemporal distribution of heavy metals, as illustrated in Figure 1. A total of 664 soil samples were obtained, derived from 83 sampling sites (amounting to 83 samples per campaign). These sites were strategically selected to represent diverse land-use categories, including high-traffic arterial roads, residential neighborhoods, urban parks, and mixed-use zones. To capture temporal variations and ensure consistency, sampling was performed twice annually: in March, following the wet season (winter—W), and in September, following the dry season characterized by high summer temperatures and preceding the autumn rainfall (summer—S).
Figure 1.
Study Area (Thessaloniki city, Northern Greece).
Spatial representativeness at each site was ensured through the application of the envelope sampling method. Specifically, five sub-samples were extracted from the four corners and the center of a 1 × 1 m square plot. These sub-samples were homogenized in a clean plastic container to form a single composite sample for each location. Approximately 1 kg of soil was collected from the upper horizon (0–10 cm depth) using a specialized wooden sampler, devoid of metallic components to preclude cross-contamination. Briefly, soil samples were air-dried at room temperature, gently disaggregated manually using a porcelain mortar and pestle, and sieved through a 2 mm polyethylene sieve to remove coarse fragments and plant residues. Finally, the samples were secured in labeled polyethylene bags and transported to the Laboratory of Soil Science at Aristotle University of Thessaloniki.
The geographical extent and land-use heterogeneity of the study area, as depicted in the spatial reference maps, provide a representative foundation for evaluating the urban soil quality of Thessaloniki. The following sections detail the physicochemical characteristics of the collected specimens and present a comparative analysis of heavy metal concentrations across the identified spatiotemporal scales.
2.2. Soil Physicochemical Analysis
To evaluate the fundamental soil parameters governing the mobility and bioavailability of heavy metals, a suite of physicochemical analyses was performed on all collected specimens. These assessments included the determination of soil pH, electrical conductivity (EC), and particle size distribution, in accordance with established laboratory protocols [22]. Soil pH and EC were measured in aqueous suspension with a soil-to-liquid ratio of 1:2.5 (w/v) [23]. Potentiometric measurements for pH were obtained using a calibrated digital pH meter, while EC was determined via a high-precision conductivity meter.
The textural characterization of the soil samples was conducted to quantify the relative proportions of sand, silt, and clay. This was achieved using the Bouyoucos hydrometer method following the chemical dispersion of clay particles with a sodium hexametaphosphate solution [24]. These physicochemical descriptors provide the necessary context for interpreting spatial retention and transport mechanisms of cadmium (Cd), copper (Cu), lead (Pb), and zinc (Zn) within the urban soil matrix of Thessaloniki.
Prior to analysis, soil specimens underwent acid digestion using a 3:1 (v/v) mixture of concentrated hydrochloric and nitric acid (aqua regia) within a heated, closed-vessel digestion system. The resulting digests were subsequently filtered through acid-resistant Whatman No. 42 filter paper to remove insoluble silicate residues and other particulate material prior to elemental analysis by flame atomic absorption spectrophotometry. The filtrates were then diluted to a fixed volume with ultra-pure water and quantified against individual multi-point calibration curves established for each target analyte.
Heavy metal concentrations were determined using a Shimadzu AA-6300 (Shimadzu Corporation, Kyoto, Japan) flame atomic absorption spectrophotometer. The instrumental detection limits were approximately Cd (0.005 mg L−1), Cu (0.020 mg L−1), Pb (0.050 mg L−1), and Zn (0.005 mg L−1). Although the laboratory is also equipped with a Shimadzu AA-7000 atomic absorption spectrophotometer fitted with a GFA-7000 graphite furnace atomizer for ultra-trace elemental analysis, the concentrations of all investigated metals in the digested soil samples were well above the detection and quantification limits of the flame AAS. Therefore, flame atomic absorption spectrophotometry provided adequate sensitivity for accurate quantification. Quality assurance was performed using the certified reference material BCR CRM 141R (Calcareous Loam Soil, Institute for Reference Materials and Measurements, European Commission), which was processed using the same aqua regia digestion and analytical procedure as the soil samples. Recoveries for Cd, Cu, Pb and Zn ranged from 97.4 to 102.3%.
2.3. Evaluation of Soil Contamination via Geo-Accumulation Index (Igeo)
The contamination levels of the selected heavy metals in the urban soils of Thessaloniki were evaluated by using Geo-accumulation index (Igeo), a widely used pollution index, initially proposed for sediments [22], but also employed for soils [23]. The Geo-accumulation index (Igeo) can be calculated using the following expression:
where Ci denotes the measured concentration of the i element in the urban soil samples, Bi represents the corresponding geochemical background concentration (i.e., Upper Continental Crust—UCC values) of the same element (Table 1), and 1.5 serves as a correction factor to account for natural variations in the background matrix caused by lithological differences.
Table 1.
Geochemical background values in literature and soil guideline values (Bi = UCC).
To quantify the extent of soil contamination, the Geo-accumulation Index (Igeo) was calculated for each heavy metal. This index categorizes soil quality into seven progressive classes: class 0, uncontaminated (Igeo < 0); class 1, uncontaminated to moderately contaminated (0 < Igeo < 1); class 2, moderately contaminated (1 < Igeo < 2); class 3, moderately to heavily contaminated (2 < Igeo < 3); class 4, heavily contaminated (3 < Igeo < 4); class 5, heavily to extremely contaminated (4 < Igeo < 5); and class 6, extremely contaminated (Igeo > 5).
The geochemical background values (Bi) adopted for the Igeo calculation correspond to the Upper Continental Crust values (Bi = UCC, Table 1): 0.09 mg kg−1 for Cd, 28.0 mg kg−1 for Cu, 17.0 mg kg−1 for Pb, and 67.0 mg kg−1 for Zn. These values also align with previous pedogeochemical surveys conducted in the broader Mediterranean urban environment [15]. A constant factor of 1.5 was incorporated into the Igeo equation to account for potential lithogenic variations and to ensure that minor fluctuations in the background levels are not misinterpreted as anthropogenic enrichment.
Table 1 presents the Grade-I (Geochemical background concentrations) values and Grade-II alongside established regulatory benchmarks (Table 1). Across all four elements, the baseline Grade-I environmental quality thresholds represent the upper limits of natural background concentrations; consequently, heavy metal contents falling below these values indicate unpolluted, high-quality soil conditions.
The computational workflow was executed within ArcGIS Pro v.3.6 (ESRI, Redlands, CA, USA) by generating new attribute fields for every metal-season-year combination. The values were derived using the “Calculate Field” tool via a Python 3 expression based on the standard Igeo formula [1]. Within the software, the base-2 logarithm was computed using an equivalent base-10 transformation: math.log10(!Field!/(1.5 × Background))/math.log10(2). For example, the Igeo for Cd in the summer 2021 campaign was calculated using the background value (BCd) of 0.09 mg/kg: math.log10(!Cd_S2021!/(1.5 ∗ 0.09))/math.log10(2). Similarly, for Cu in the summer 2024 campaign, the expression utilized the respective background value (BCu = 28 mg/kg): math.log10(!Cu_S2024!/(1.5 ∗ 28))/math.log10(2). This systematic approach ensured a robust spatiotemporal evaluation of soil quality across the four-year monitoring period (2021–2024), accounting for both seasonal fluctuations and long-term accumulation trends.
2.4. Spatial Interpolation Process
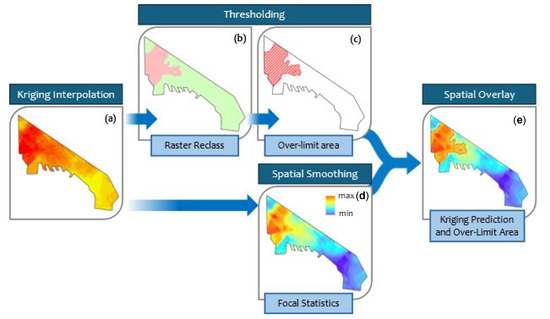
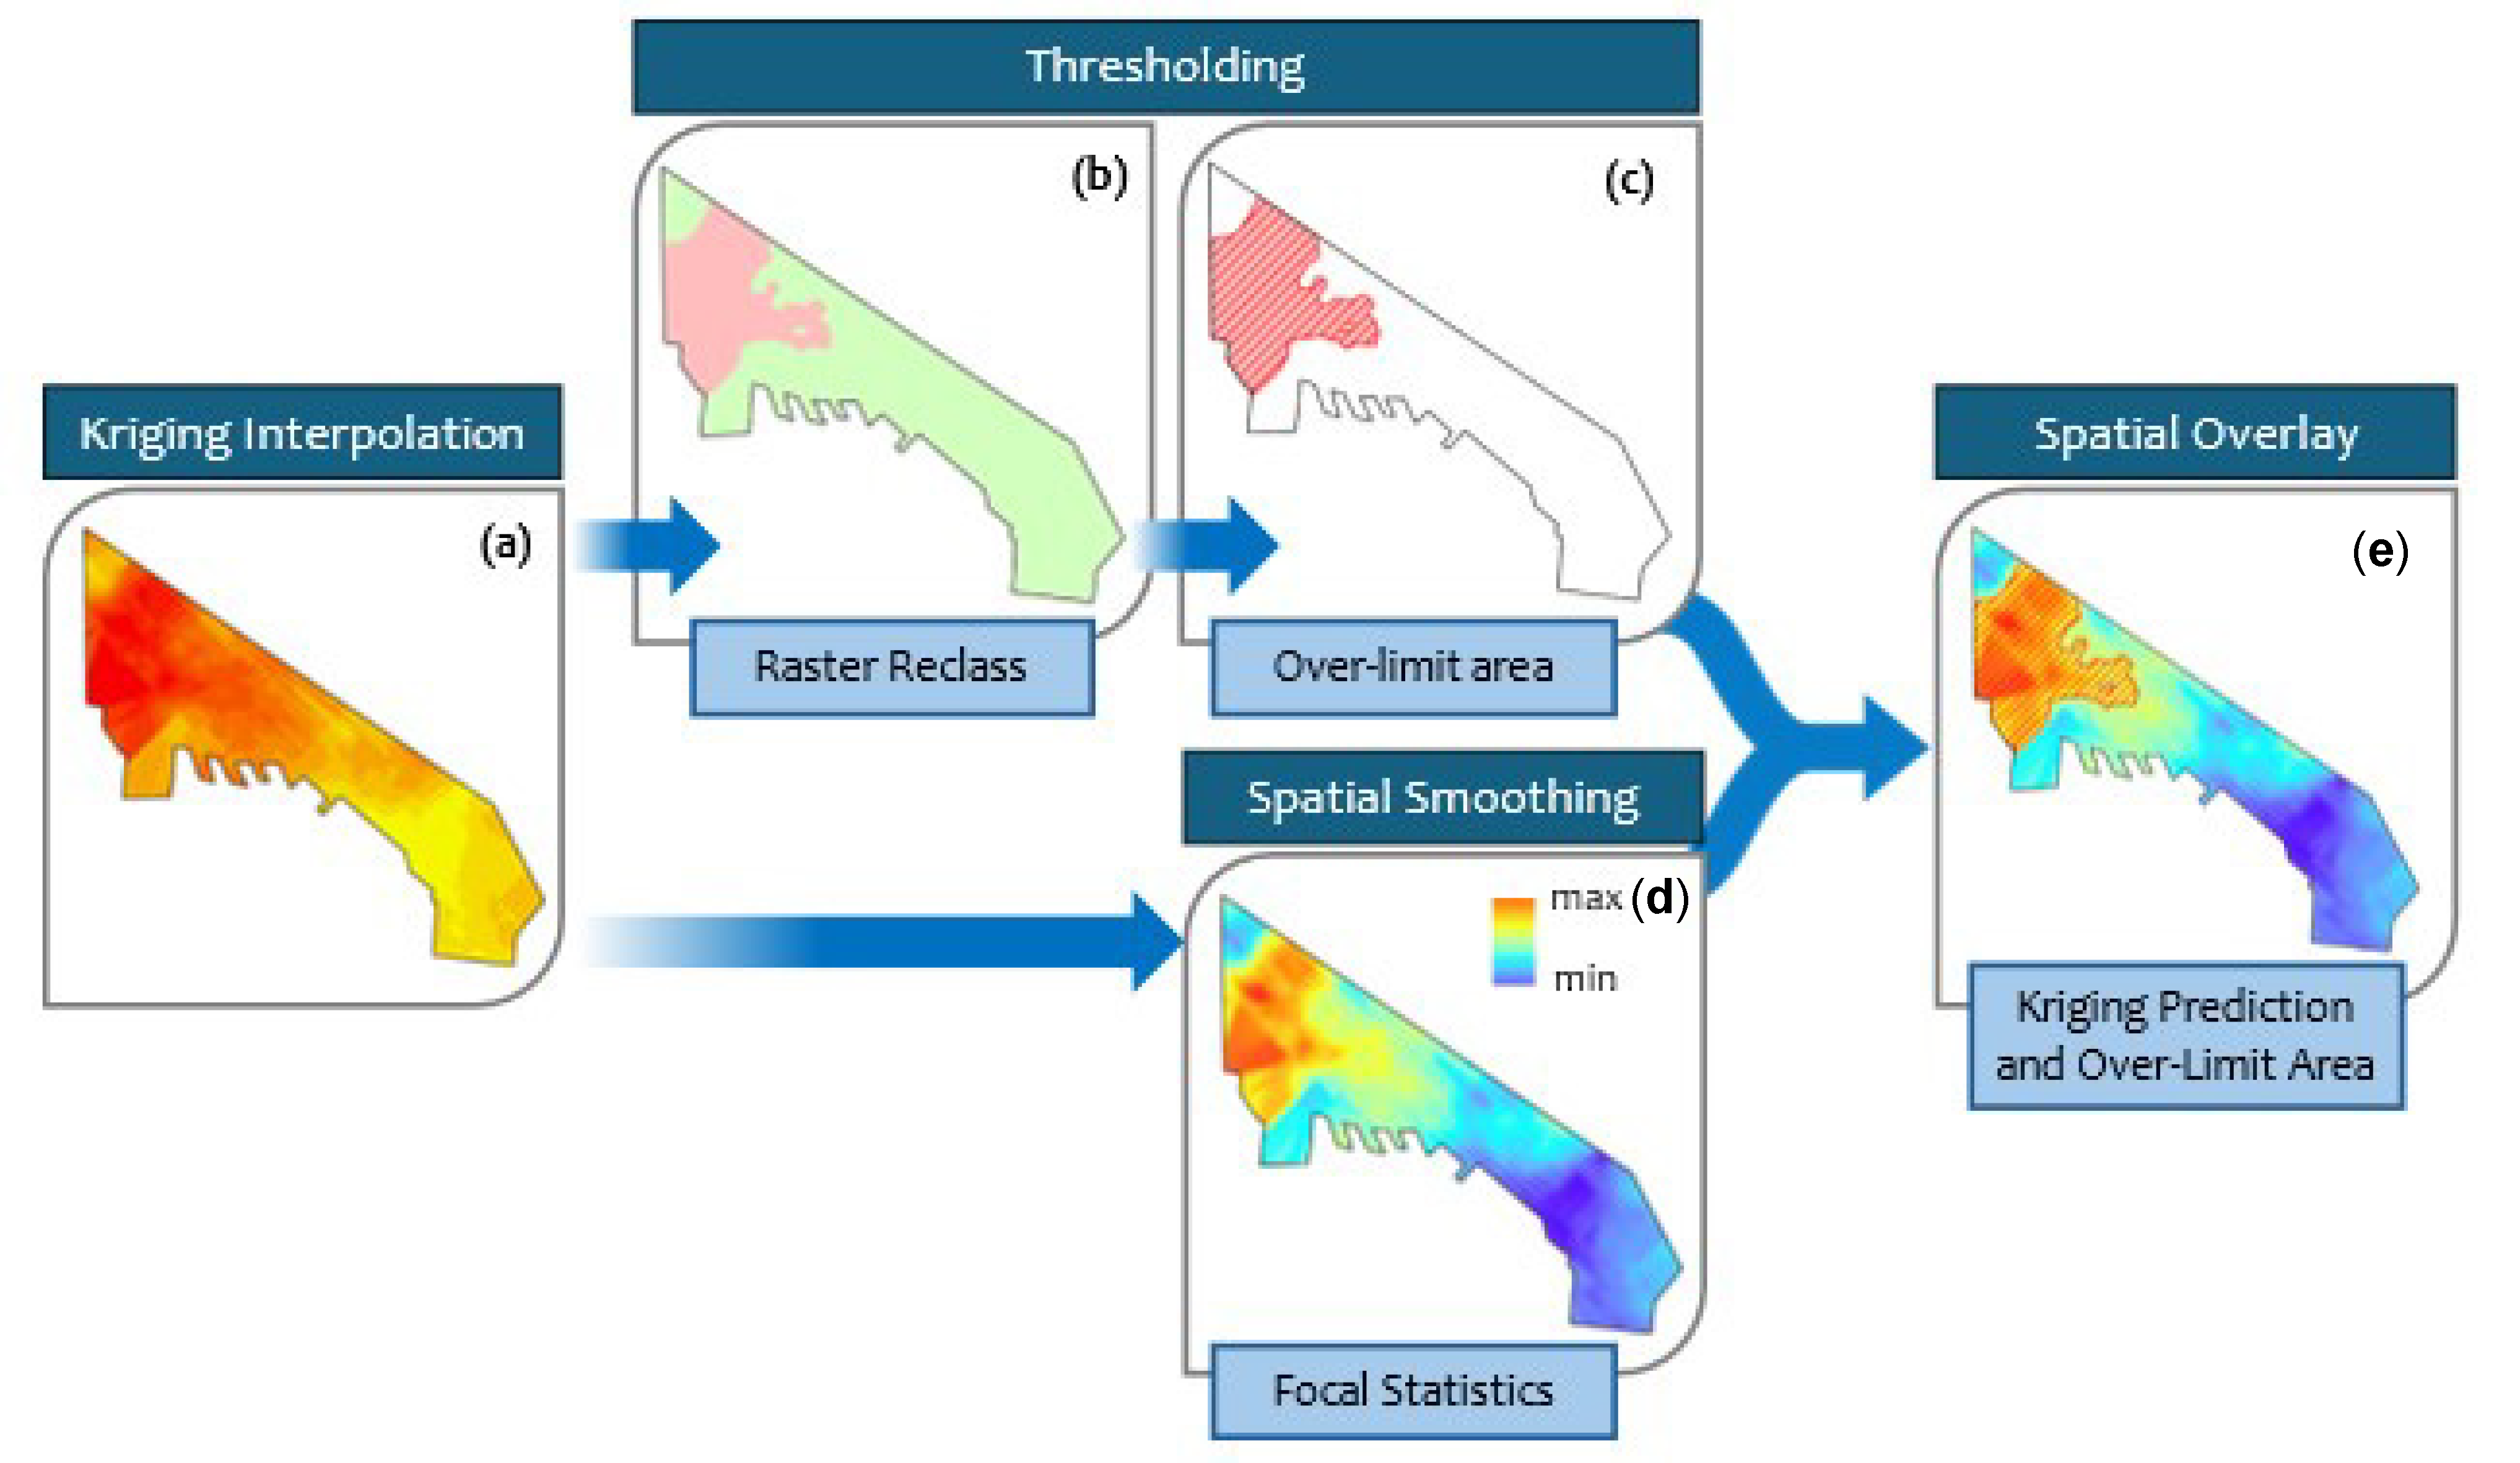
First, Ordinary Kriging interpolation was applied to the initial heavy metal data to generate a continuous raster surface of predicted values (ArcGIS Pro v.3.6) across the urban area of Thessaloniki city. Each raster then was reclassified to isolate the specific geographic zones where values exceed the predefined safety limit (Table 1) reflecting the “over-limit area”. In addition, spatial smoothing was applied (ArcGIS Pro, Focal Statistics) to the interpolated surface to reduce local noise and better highlight broader spatial trends. Finally, these two outputs were combined (Figure 2). It should be noted that the Focal Statistics smoothing attenuates, in some cases, local point-level extremes relative to the raw dataset (Table A2). The result is a single spatial overlay map that displays the smoothed prediction values as a background color gradient surface, with the critical over-limit areas clearly overlaid using a hatched pattern.
Figure 2.
Spatial analysis workflow combining Kriging interpolation, raster reclassification, and focal statistics to identify and map over-limit areas, (a) the result of Kriging interpolation; (b) raster reclassification based on the threshold limit; (c) definition of the over-limit area; (d) application of spatial smoothing via Focal Statistics; and (e) final spatial overlay integrating the Kriging prediction and the over-limit area.
This specific workflow was applied solely to Cd to map the areas exceeding safety limits. Since Cu, Pb, and Zn concentrations on the smoothed kriged surface remained below thresholds (Table 1), their analysis relied strictly on the initial Kriging interpolation. For these metals, contour lines were used to illustrate the spatial distribution and concentration gradients across the study area. The performance of the interpolation models was evaluated using a cross-validation approach within the GIS environment (ArcGIS Pro v.3.6). Standard accuracy metrics, including mean error (ME) and root mean square error (RMSE), indicated satisfactory predictive performance and confirmed the reliability of the generated spatial distribution maps.
3. Results
3.1. Physicochemical Properties of Urban Soils
Appendix A Table A1 presents the descriptive statistics of the physicochemical properties, and Appendix A Table A2 presents site-level coordinates, land-use classification, and heavy metal concentration ranges (Cd, Cu, Pb, Zn), across the 83 sampling sites, of the soil samples collected across the urban area of Thessaloniki over the four-year monitoring period (2021–2024). Table 2 summarizes the seasonal and annual mean (±SD) heavy metal concentrations recorded during each of the eight sampling campaigns. Analysis of the four-year dataset (Table 2) reveals that, regarding Cu and Pb, mean concentrations during the dry summer periods remained notably stable, showing only marginal fluctuations from 2021 to 2024. A significant shift occurred in the winter campaigns, however: from 2023 onwards the winter concentrations of both Cu and Pb increased to closely align with the summer averages, a convergence suggesting a chronic saturation effect within the urban soil matrix. Cd exhibited the most pronounced change, rising from a mean of 0.77 mg kg−1 in the winter of 2021 to 1.21 mg kg−1 by the summer of 2024. Pb showed a comparable, if more gradual, upward trend, reaching a total mean of 32.49 mg kg−1. Zn, despite recording the highest total mean concentration of the four metals (127.64 mg kg−1), did not display a consistent temporal increase (see Section 3.2 statistical analysis below); its elevated values instead reflect persistent, spatially localized hotspots rather than a citywide upward trend. This reflects a gradual, chronic enrichment process rather than an abrupt, short-term degradation of soil quality.
Table 2.
Descriptive statistics (mean ± standard deviation) of soil heavy metal concentrations in Thessaloniki (2021–2024).
A seasonal pattern was observed for Cd and Zn throughout the study period, with mean concentrations consistently higher during the summer (dry) campaigns than the winter (wet) periods in every monitored year. Cu and Pb followed this same pattern through 2023, but in 2024 the trend reversed slightly: winter means (51.91 and 34.77 mg kg−1 for Cu and Pb, respectively) marginally exceeded the corresponding summer means (51.42 and 34.31 mg kg−1), consistent with the winter-summer convergence (saturation effect) described above. For instance, in 2024 the mean concentration of Cd increased from 0.90 mg kg−1 in the winter to 1.21 mg kg−1 in the summer, representing a seasonal influx of approximately 34%. This variation may be attributed to the lack of pluvial leaching during the dry months and the intensified atmospheric deposition of urban particulates.
The maximum recorded values for Zn (402.52 mg kg−1) and Pb (62.26 mg kg−1) significantly exceed the baseline levels for European urban soils [29], confirming the presence of localized contamination hotspots concentrated in the central urban core. The spatial distribution of the heavy metals exhibited high heterogeneity across the urban matrix, quantitatively supported by high Relative Standard Deviation (RSD) values: Cd (44.1%), Cu (47.8%), Pb (51.0%), and Zn (69.2%). This extensive spatial variability indicates that accumulation is primarily driven by localized anthropogenic inputs. Natural pedogenic processes alone cannot account for an increase in total elemental content in the area, confirming an anthropogenic origin for the observed accumulation. These elevated concentrations are primarily concentrated in the central urban core, necessitating targeted mitigation strategies to address long-term accumulation.
3.2. Analysis of Heavy Metal Distributions Based on Regulatory Safety Limits and Environmental Quality Thresholds
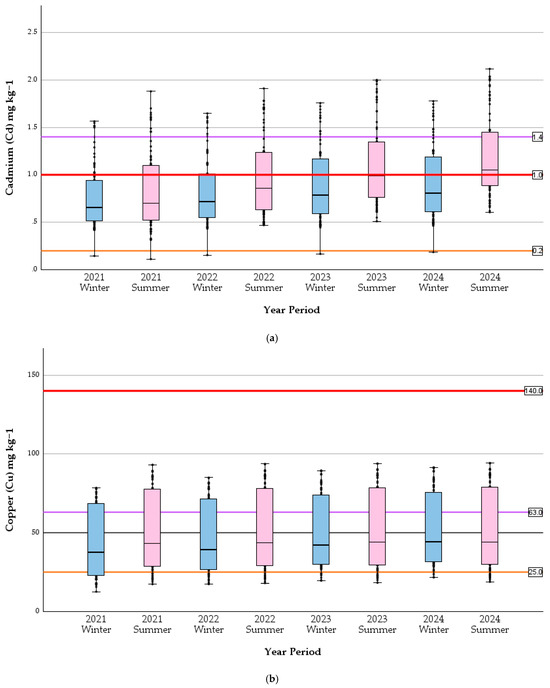
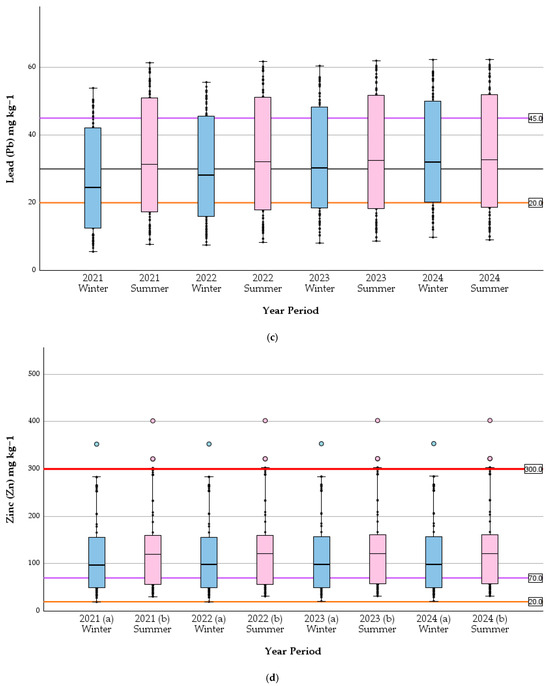
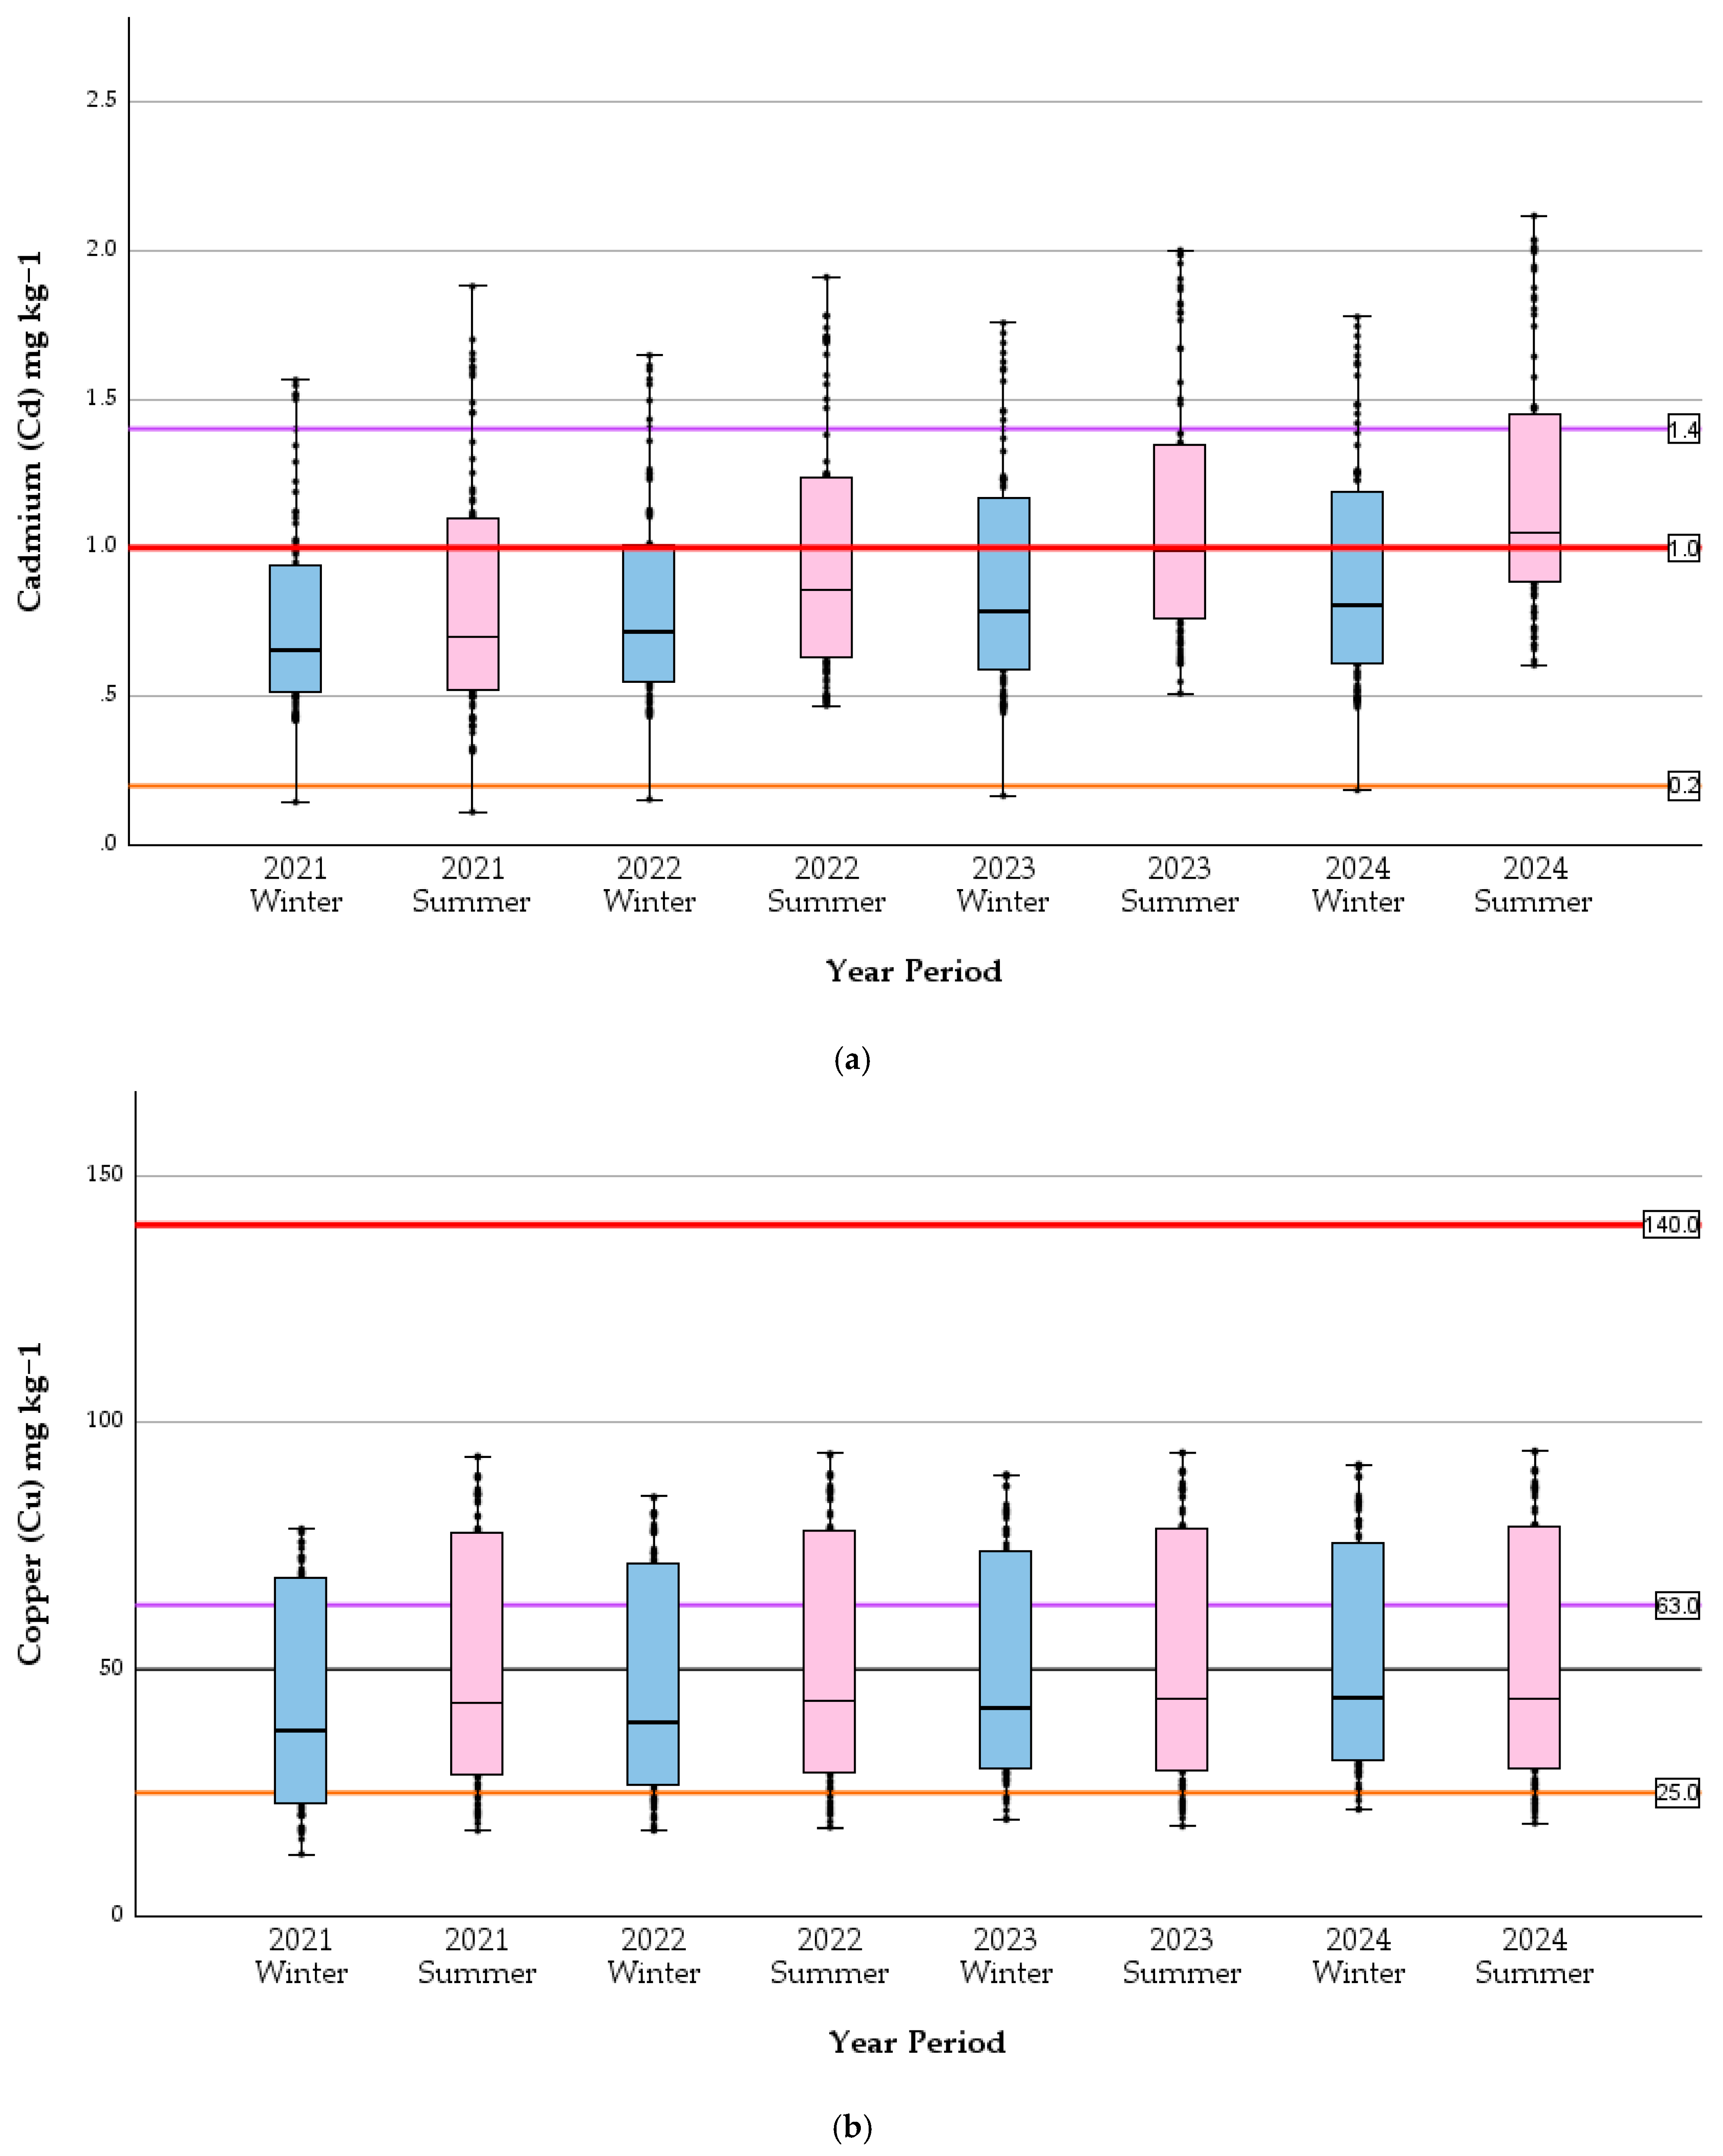
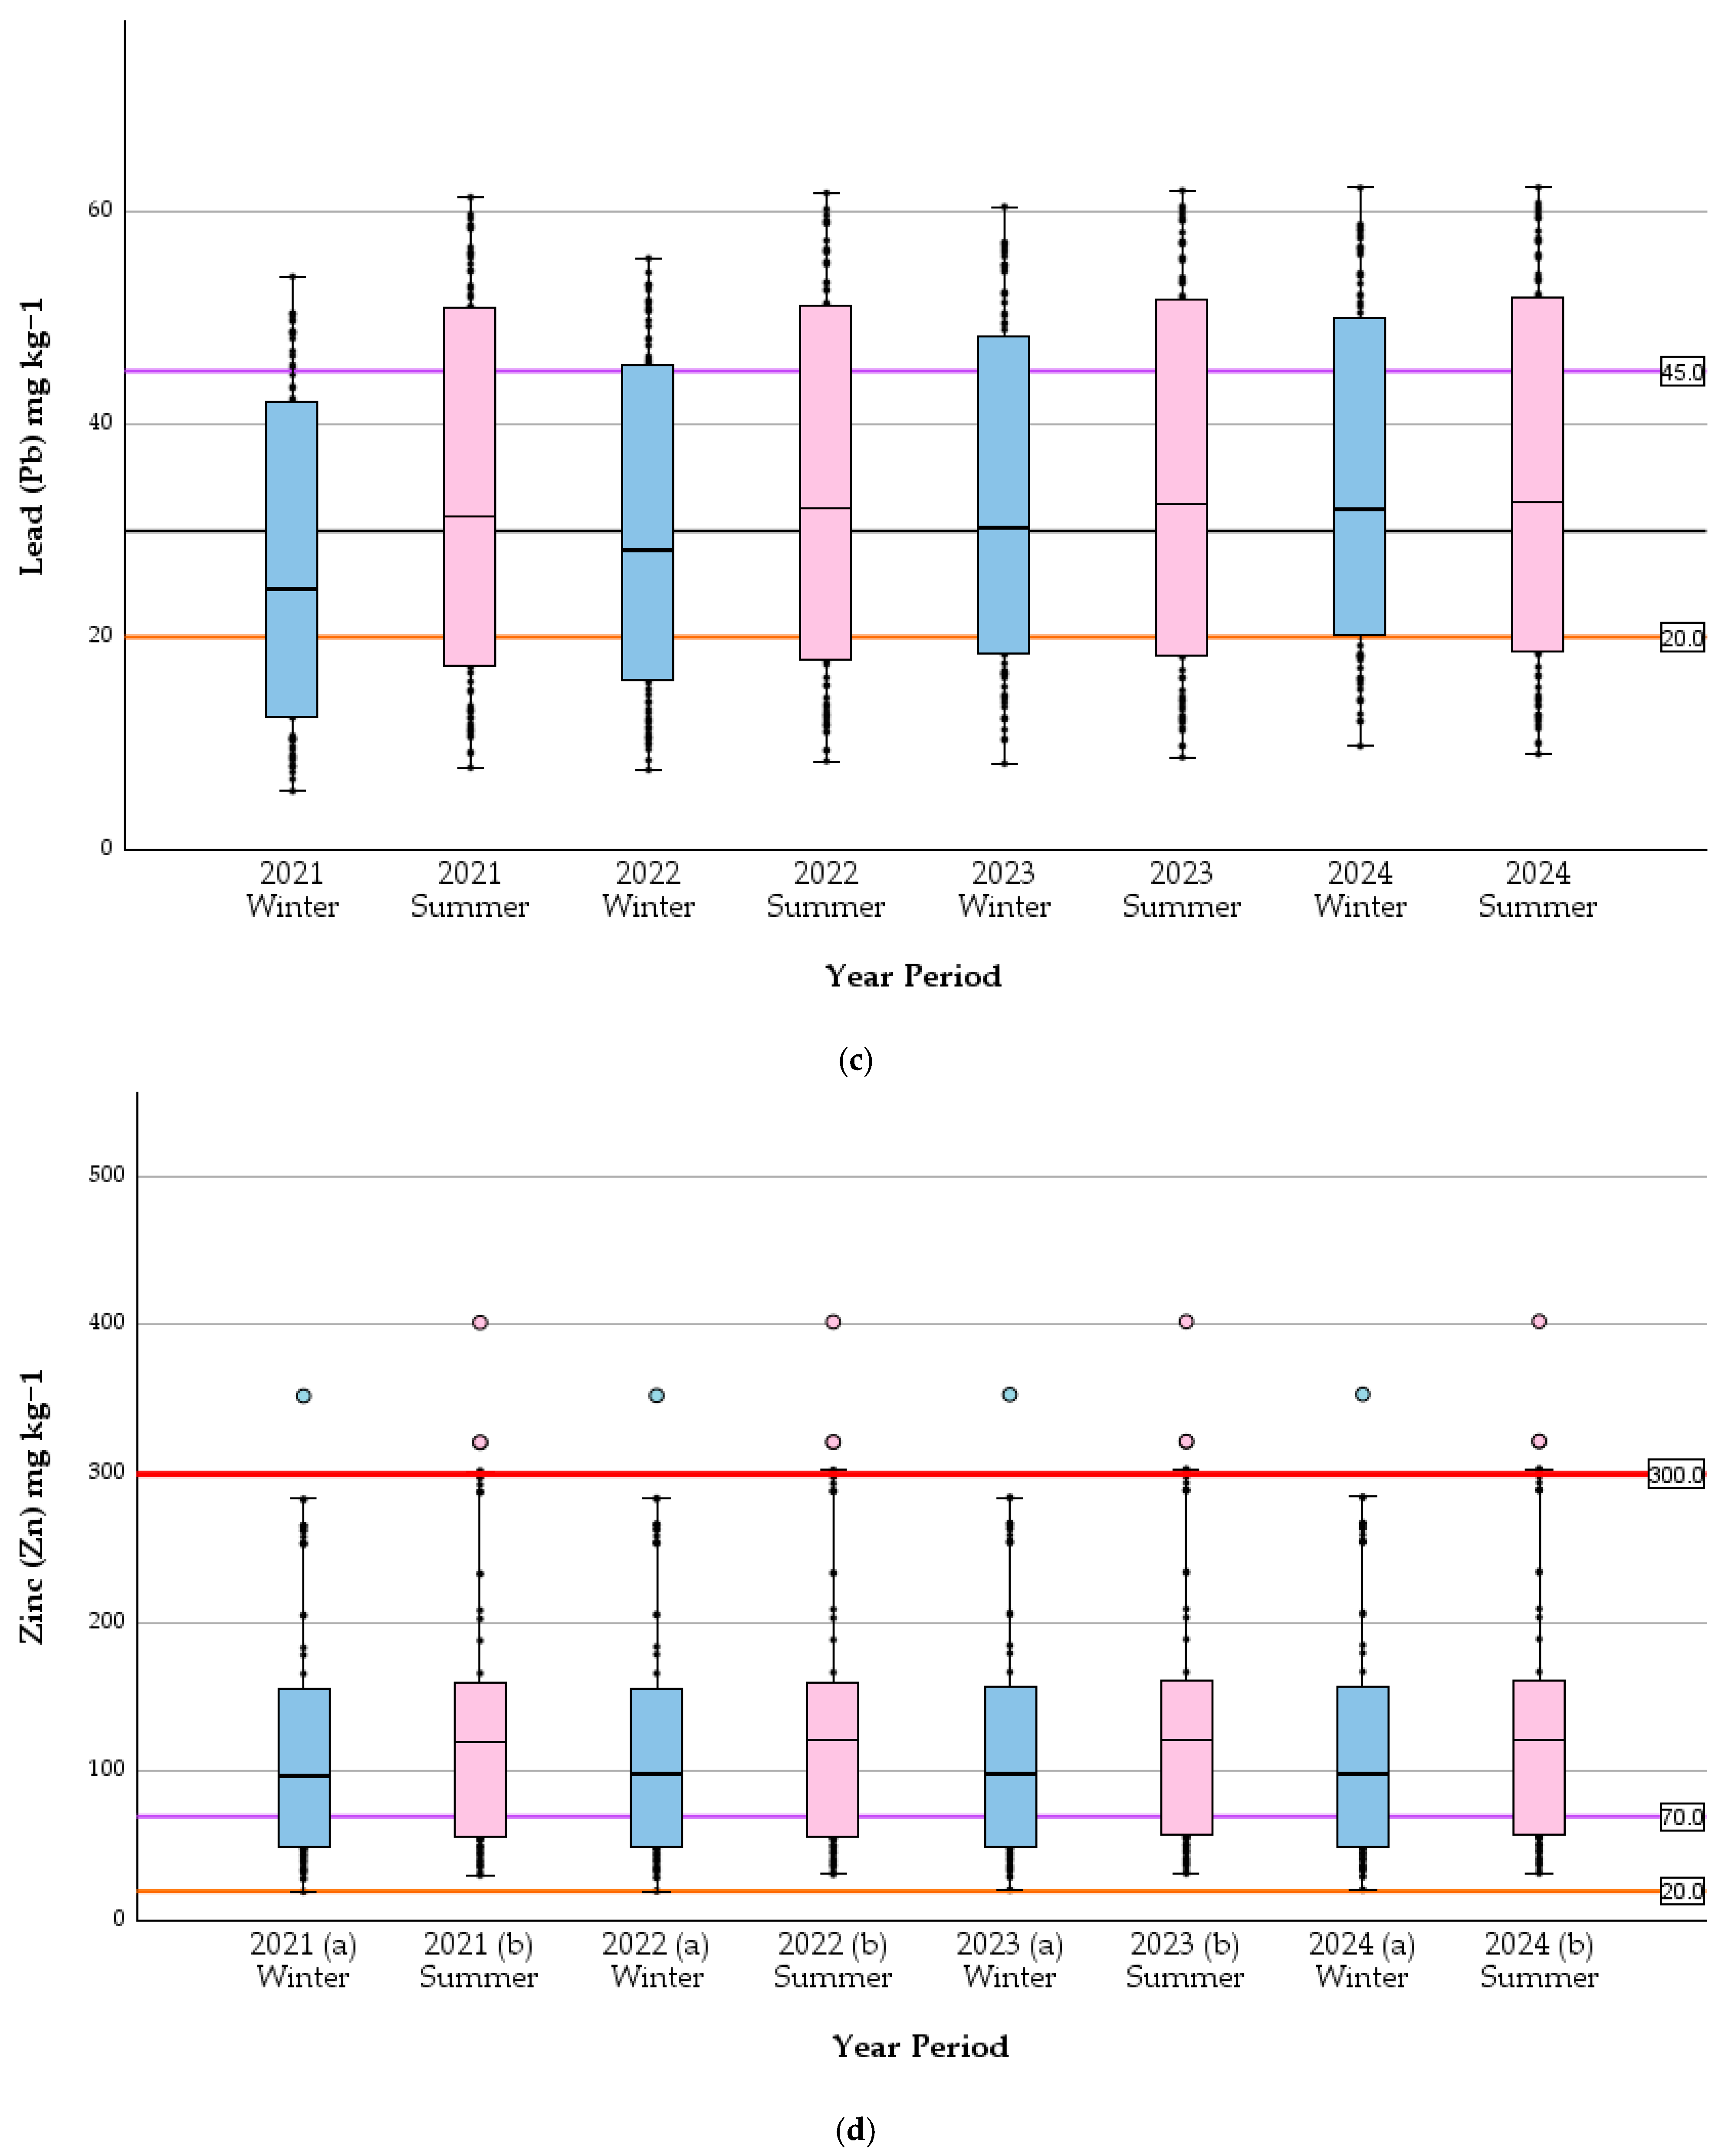
The temporal evolution of soil heavy metal concentrations and their compliance with environmental quality standards are illustrated in the multi-panel boxplots (Figure 3). The distribution analysis confirms a progressive shift toward higher median values from 2021 to 2024, particularly evident for Cd, with Cu and Pb also showing a significant, more gradual increase; Zn medians remain comparatively stable despite pronounced local hotspots (Kruskal–Wallis test: H(3) = 0.258, p = 0.968). The list of geochemical background values is provided in Table 2 ([24,30]).
Figure 3.
Seasonable distribution of soil heavy metal concentrations ((a) Cd, (b) Cu, (c) Pb, and (d) Zn) in Thessaloniki for the period 2021–2024. The boxplots represent the median, interquartile range (IQR), and outliers for (a) winter (blue) and (b) summer (pink) sampling campaigns. The horizontal reference lines indicate the regulatory safety limit (red), Grade-I geochemical background concentration (orange), and Grade-II threshold (maroon). Concentrations are expressed in mg kg−1.
Regarding Cd, the median concentrations across all campaigns consistently exceed the Grade-I threshold (orange line), with the most recent summer campaigns (2023–2024) approaching or surpassing the established regulatory limit (red line). This upward trend is accompanied by an increase in upper-quartile variability, suggesting a widening of the contamination impact across the sampling sites. For Pb and Cu, while median values remain large between the Grade-I and Grade-II (maroon line) thresholds, a significant number of sampling sites exhibit values exceeding the Grade-II values, particularly during the dry (summer) periods. The persistent presence of outliers above the regulatory red line in the Zn boxplots underscores the existence of severe localized contamination hotspots, likely associated with the industrial and transport infrastructure near the city’s port and railway axis. Cu concentrations, while frequently exceeding the Grade-II threshold (maroon line, 63.0 mg kg−1) at individual sites, remained below the regulatory safety limit (140 mg kg−1; Table 1) throughout the monitoring period (maximum recorded value is 94.21 mg kg−1 in s14, Table A2), indicating chronic enrichment without acute regulatory exceedance.
The seasonal contrast is visually prominent across all elements, with summer distributions (pink boxes) showing higher medians and broader interquartile ranges compared to their winter counterparts (blue boxes). This cyclical pattern, superimposed on the long-term increasing trend, indicates that urban soil recovery during wet periods is insufficient to offset the cumulative deposition occurring during the dry months.
To rigorously evaluate the temporal accumulation patterns observed in the spatial interpolations, non-parametric statistical testing was applied to the datasets. Given the non-normal distribution and high spatial variance of the data, a Kruskal–Wallis H test was utilized to determine the statistical significance of concentration changes across the 2021–2024 monitoring period.
For Cd, the statistical analysis revealed a highly significant continuous enrichment across the monitoring years (H(3) = 44.42, p < 0.001). Pairwise comparisons using Dunn’s test with a Bonferroni correction confirmed that Cd levels in 2024 were significantly higher than the 2021 baseline (p < 0.001). This confirms that the spatial expansion of Cd contamination observed in the interpolation models represents a true, progressive accumulation within the urban soil matrix.
A similar, though more gradual, accumulation trend was observed for both Pb and Cu. The Kruskal–Wallis test indicated significant overall differences across the four years for Pb (H(3) = 9.758, p = 0.021) and Cu (H(3) = 8.632, p = 0.035). Post-hoc testing revealed that while the year-over-year variations for these elements were marginal, the total accumulation from the 2021 baseline to 2024 was statistically significant for both Pb (p = 0.024) and Cu (p = 0.040).
Conversely, for Zn, the analysis revealed no significant overall difference in concentrations across the four monitoring years (H(3) = 0.258, p = 0.968). This indicates that while Zn exhibits severe, localized contamination hotspots in the northwestern sector, the overall baseline concentration has remained statistically stable over the four-year period. The visual expansion observed in the spatial interpolation models is likely a reflection of spatial variance rather than a statistically significant temporal trend. Therefore, Zn contamination in Thessaloniki is best characterized as a persistent, chronic environmental burden rather than a rapidly escalating one.
Consequently, these statistically validated patterns in heavy metal concentration dynamics underscore the critical need for continuous environmental surveillance and targeted urban management strategies.
3.3. Seasonal Assessment of Heavy Metal Accumulation in Urban Soils of Thessaloniki
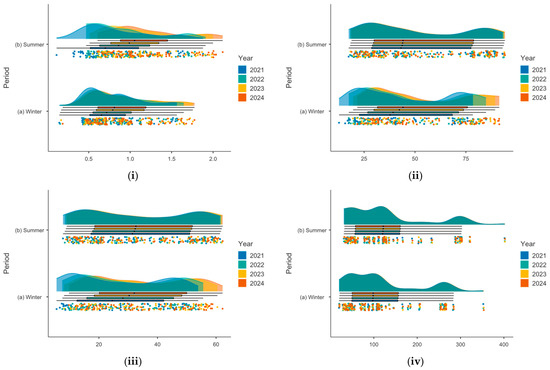
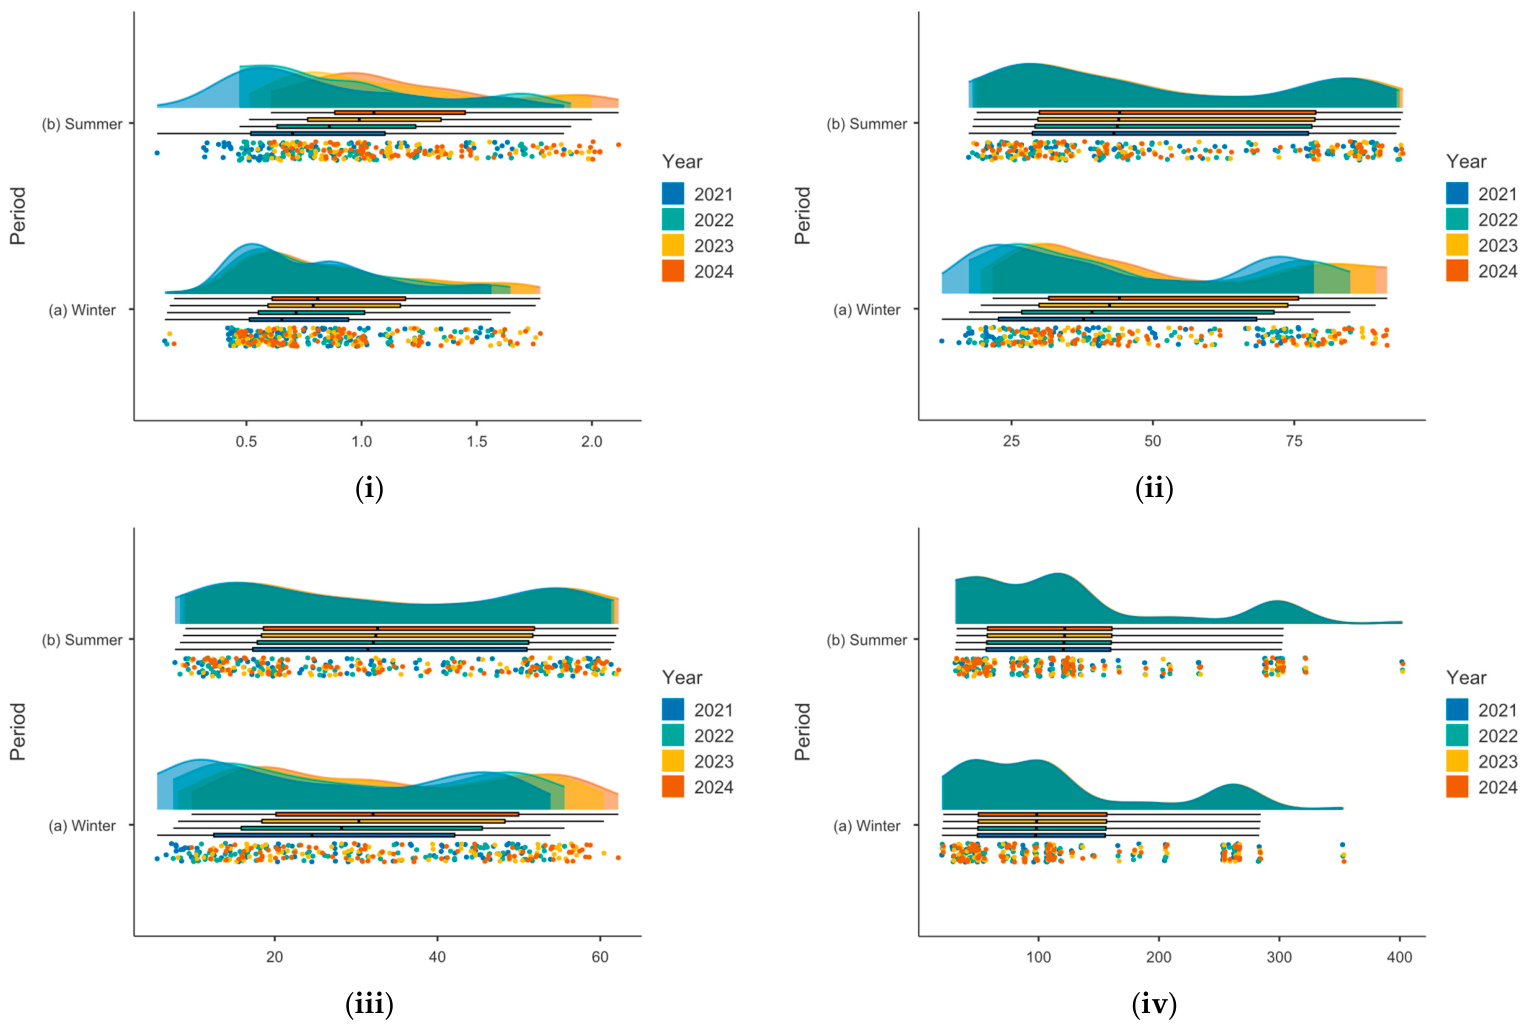
Figure 4 visualizes the distribution and concentration of four specific heavy metals in the urban soils of Thessaloniki, segmented by season (winter and summer) over four years (2021–2024). The data is presented using raincloud plots, which effectively combine density distributions, standard boxplots, and raw jittered data points to provide a comprehensive view of how the heavy metals accumulate (Jamovi v.2.6.44).
Figure 4.
Raincloud plots illustrate the seasonal assessment (winter vs. summer) of heavy metal accumulation in the urban soils of Thessaloniki: (i) Cd, (ii) Cu, (iii) Pb, and (iv) Zn. The data spans a four-year period from 2021 to 2024, displaying data density (top curves), quartiles and medians (boxplots), and individual sample measurements (scattered dots).
These raincloud plots (Figure 4) provide insights into the environmental dynamics, revealing specific distributional characteristics and concentration extremes for each metal assessed, as follows:
- Cd (Figure 4i): Regarding the winter season, the concentration of Cd during the winter months is generally lower and more tightly clustered, with the highest density of measurements falling roughly between 0.5 and 1.0 mg kg−1. In contrast, the summer months show a broader distribution with a notable shift toward higher values. The density plots stretch further to the right, and the individual data points reveal several instances of Cd accumulation approaching 2.0, suggesting that summer conditions may contribute to higher or more variable cadmium levels in the soil.
- Cu (Figure 4ii): The winter distribution for Cu shows a widespread range between 25 and 75 mg kg−1. The density curves suggest a slight bimodal tendency (multiple peaks), indicating potential localized hotspots or varying sources of Cu during colder months. The summer distribution is similarly broad but appears slightly flatter and more uniform across the years. The boxplots for both seasons remain relatively central, indicating that while the extremes may fluctuate, the median Cu accumulation remains somewhat consistent between seasons.
- Pb (Figure 4iii): Pb concentration shows a very wide and consistent distribution ranging from roughly 10 to 60 mg kg−1 across both seasons. The density curves for both winter and summer are relatively flat, meaning soil samples vary widely without one overwhelmingly dominant central concentration. The median values (indicated by the solid line in the boxplots) remain stable across the 2021–2024 period, implying a persistent baseline of lead in the urban soil regardless of the season.
- Zn (Figure 4iv): Zn exhibits the most skewed distribution of the four metals. Most of the data points for both seasons are heavily concentrated at the lower end of the scale, roughly between 0 and 150 mg kg−1. The density plots have a sharp primary peak but feature a very long right tail. The raw scatter points highlight distinct clusters of highly elevated zinc levels reaching up to 300 and 400 mg kg−1. These extreme values appear in both winter and summer across multiple years, pointing to localized areas of high zinc contamination rather than widespread, uniform accumulation.
The multi-year data (2021–2024) indicates that heavy metal accumulation in Thessaloniki’s urban soils exhibits distinct behavioral patterns depending on the metal. Cadmium shows the most apparent seasonal variation, with higher variance and accumulation in the summer. Lead and copper display broad, persistent distributions year-round, while zinc is characterized by generally lower baselines punctuated by extreme, localized high-concentration outliers.
3.4. Spatiotemporal Assessment of Heavy Metal Accumulation in Urban Soils of Thessaloniki
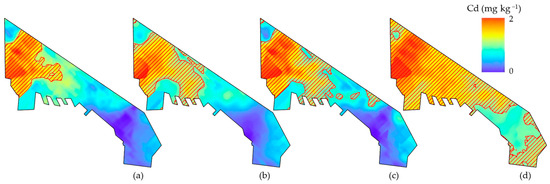
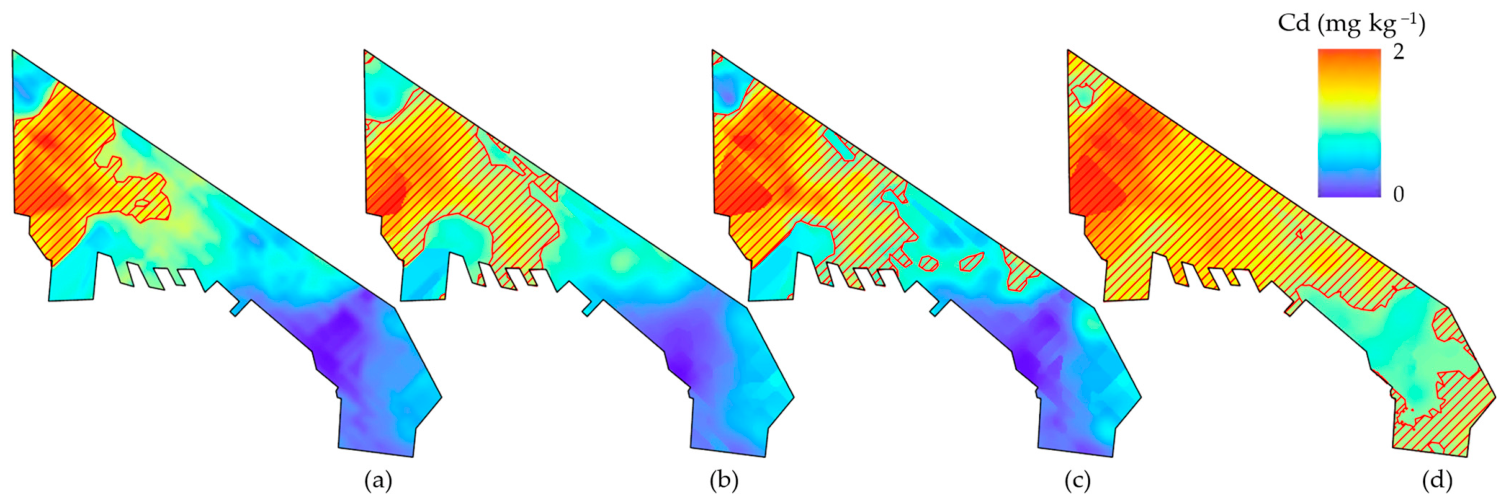
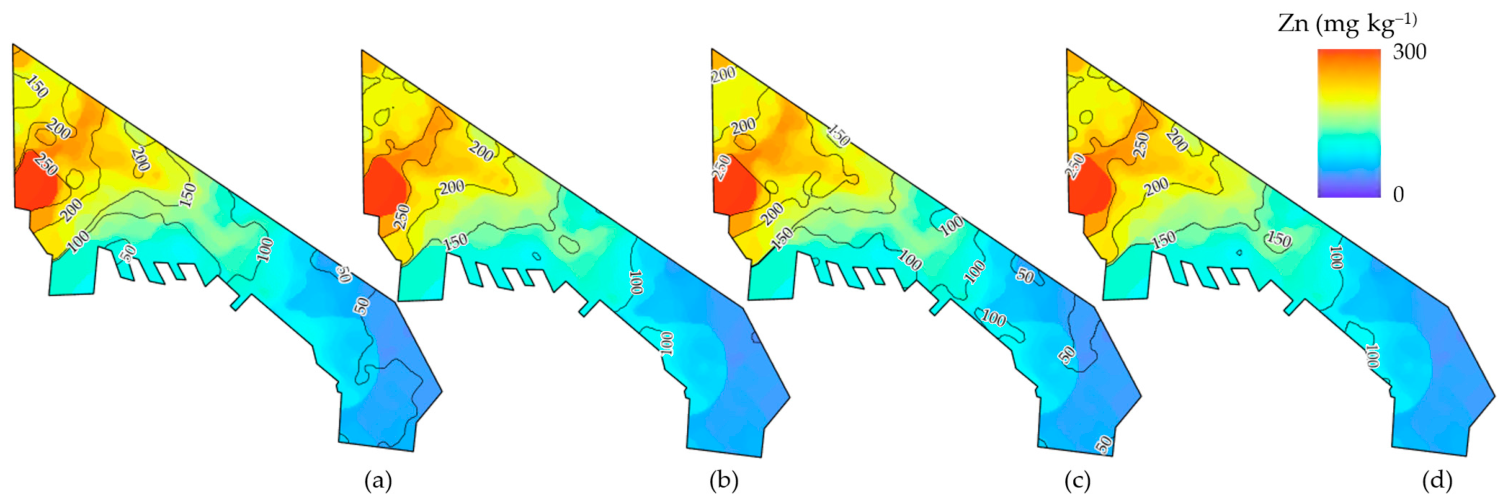
The monitoring of Thessaloniki’s urban soil matrix (2021–2024) provides evidence of progressive heavy metal accumulation, particularly regarding Cd (Figure 5) and Zn (Figure 6). The integration of geospatial analysis and descriptive statistics confirms that anthropogenic pressures, derived primarily from the industrial northwestern sector and the port infrastructure, have led to a systematic expansion of contamination plumes. The accumulation hotspots observed in the northwestern sector are directly linked to a dense network of industrial installations located in the broader Sindos and Kalochori areas. Key contributors to this localized pollution include large-scale petroleum refineries, metallurgical and metal processing plants, and extensive port logistics infrastructure [14,31]. The transport of particulate matter from these western emission sources into the urban core is strongly governed by the city’s meteorological regime. During the warmer months, weak southern sea breezes frequently trap airborne pollutants within the coastal basin, limiting dispersion. Conversely, regional north-northwesterly winds, such as the Vardar wind, act as a primary transport mechanism, effectively carrying resuspended industrial dust and vehicular emissions directly into adjacent residential neighborhoods.
Figure 5.
Spatiotemporal assessment of cadmium (Cd) accumulation in the urban soils of Thessaloniki for the period 2021–2024. The Kriging spatial interpolation maps illustrate the Cd concentrations (mg kg−1) during: (a) winter 2021, (b) summer 2021, (c) winter 2024, and (d) summer 2024. Areas with diagonal hatching indicate zones where concentrations exceed the established regulatory safety thresholds (1 mg kg−1).
Figure 6.
Spatiotemporal variation in Zn concentrations in the urban soil horizon of Thessaloniki (2021–2024). The panels display the Kriging interpolated geochemical surfaces for: (a) winter 2021, (b) summer 2021, (c) winter 2024, and (d) summer 2024. Isoline contours indicate concentration gradients (mg/kg), highlighting areas of significant elemental enrichment.
The observed seasonal variations, characterized by elevated concentrations during the dry summer months, underscore the role of atmospheric deposition and the absence of pluvial leaching as key drivers of surface soil degradation. Given that multiple sampling sites now consistently exceed regulatory safety benchmarks, the implementation of localized remediation strategies and stricter emissions controls is imperative. This assessment establishes a vital geochemical baseline, serving as a prerequisite for informed urban planning and the protection of public health within the metropolitan area of Thessaloniki.
The geostatistical analysis of Zn concentrations (Figure 6) reveals an intensive and persistent contamination pattern primarily focused on the western and northwestern sectors of the Thessaloniki metropolitan area. The spatial distribution is characterized by well-defined high-concentration areas, where values frequently exceed 250 mg kg−1, particularly in proximity to the industrial-port interface and major transportation hubs. The temporal progression from 2021 to 2024 (Figure 6a–d) demonstrates a steady consolidation of these geochemical anomalies. The core hotspots of Zn remain geographically anchored to specific anthropogenic sources without significant temporal escalation (consistent with the non-significant Kruskal–Wallis result, Section 3.2), indicating a persistent, spatially confined contamination burden rather than a progressively worsening one.
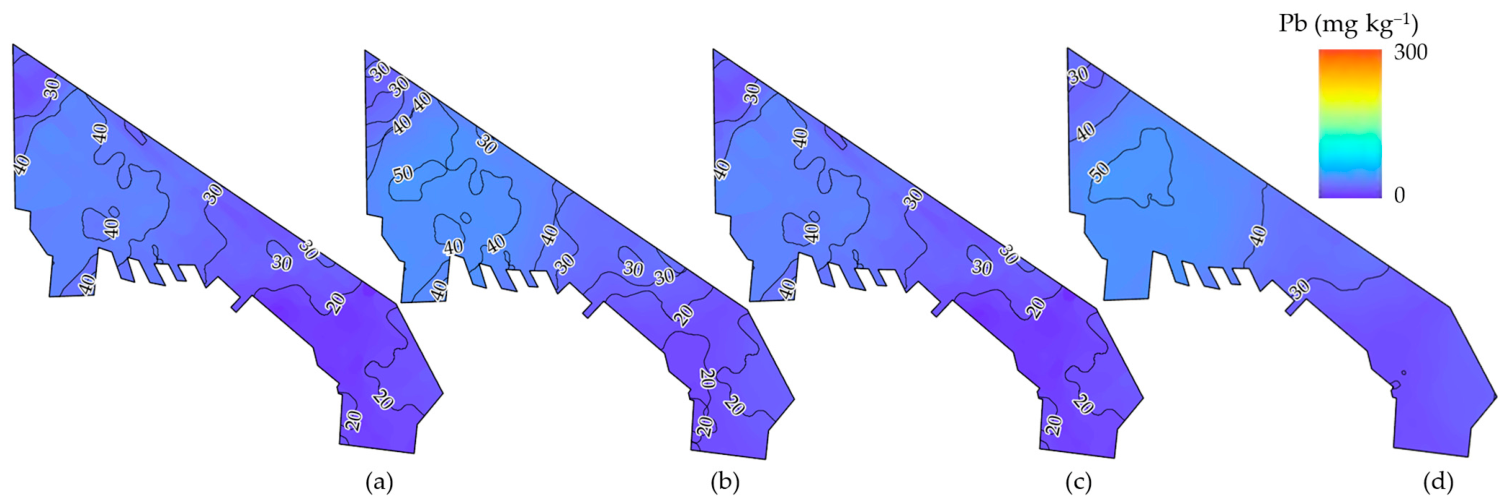
The geostatistical mapping of Pb (Figure 7) reveals a relatively more diffuse contamination pattern compared to other trace elements, yet it maintains a distinct spatial orientation toward the northwestern and central urban sectors. The baseline measurements from winter 2021 (a) indicate that a significant portion of the city’s northwestern fringe already exhibited concentrations exceeding 40 mg kg−1, a trend that persists and intensifies throughout the monitoring period. The transition from 2021 to 2024 (c, d) highlights a subtle but steady expansion of the 50 mg kg−1 contour lines, particularly within the densely populated residential and commercial areas. Unlike the highly localized “hotspots” of Zn, Pb accumulation appears more widespread, likely reflecting the historical legacy of leaded gasoline and the ongoing impact of urban atmospheric particulates and vehicular emissions. Seasonal fluctuations are present but less pronounced than those observed for Cd; however, the summer 2024 campaign (d) displays the most extensive spatial footprint of elevated Pb levels. This cumulative trend suggests that the rate of lead deposition significantly exceeds the natural cleansing mechanisms of the urban soil, leading to a persistent geochemical signature that requires long-term environmental surveillance to mitigate potential risks to the urban population.
Figure 7.
Spatiotemporal distribution and contour mapping of Pb concentrations in the urban soils of Thessaloniki for the years 2021 and 2024. The Kriging interpolation maps represent the interpolated surfaces for: (a) winter 2021, (b) summer 2021, (c) winter 2024, and (d) summer 2024.
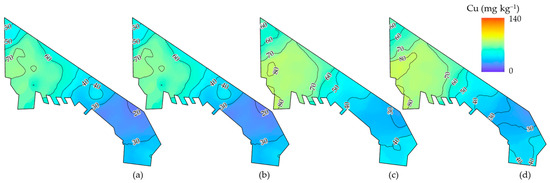
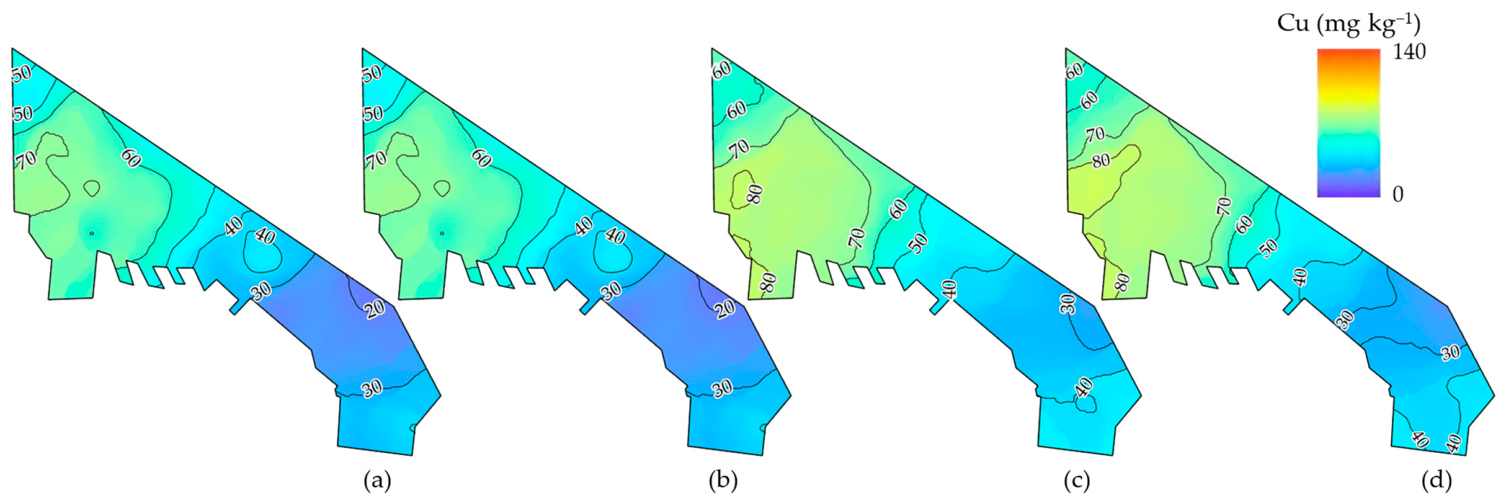
The assessment of Cu distribution (Figure 8) reveals a prominent enrichment zone concentrated in the northwestern and western sectors of Thessaloniki, aligning with the city’s primary industrial activities and transport corridors. The initial measurements from 2021 (a, b) show that median concentrations were largely contained within the 50–70 mg kg−1 range across the western fringe. However, by the 2024 (c, d), an intensification of the contamination profile is observed, with the 80 mg kg−1 isoline expanding substantially to encompass a broader urban area. This temporal shift indicates a steady accumulation of Cu within the topsoil horizon, likely driven by the continuous wear of vehicular brake pads and industrial emissions characteristic of the peri-urban industrial zone. Notably, the comparison between the winter (c) and summer (d) periods of 2024 illustrates a seasonal peak, with the highest concentrations and the most extensive spatial coverage occurring during the dry season. This suggests that while winter precipitation may provide a marginal dilution effect, it is insufficient to counteract the high rates of atmospheric deposition and the lack of leaching during the summer months. The resulting data confirm that copper levels are progressively exceeding regional baseline values, marking a transition toward more degraded pedological conditions that necessitate ongoing environmental surveillance.
Figure 8.
Spatiotemporal mapping of Cu concentrations in the urban soils of Thessaloniki (2021–2024). The Kriging interpolation maps depict the Cu spatial distribution for: (a) winter 2021, (b) summer 2021, (c) winter 2024, and (d) summer 2024. Contour values (mg kg−1) delineate the intensity of copper enrichment across the metropolitan study area.
To summarize, the four-year monitoring period (2021–2024) reveals a disconcerting trend of geochemical degradation across the Thessaloniki urban soil matrix. While Cd and Zn exhibit the most aggressive expansion of high-concentration “hotspots” in the industrial northwest, Pb and Cu show a more diffuse but steady progressive migration into the residential core. Across all four elements (Cd, Cu, Pb, and Zn) the data confirm a consistent seasonal peak during summer campaigns, where atmospheric deposition and a lack of pluvial leaching accelerate surface accumulation. This collective escalation highlights a systemic failure of the urban soil to naturally attenuate heavy metal influx, transitioning the city’s pedological environment into a state of chronic contamination that necessitates immediate environmental policy intervention.
3.5. Spatiotemporal Evaluation of Soil Contamination via Geo-Accumulation Index (Igeo)
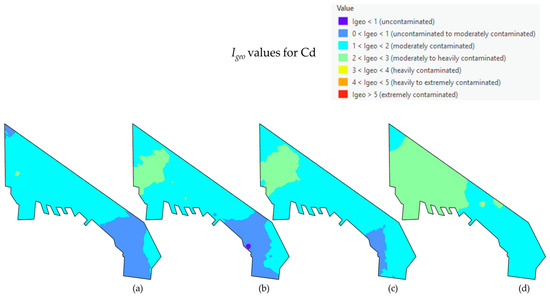
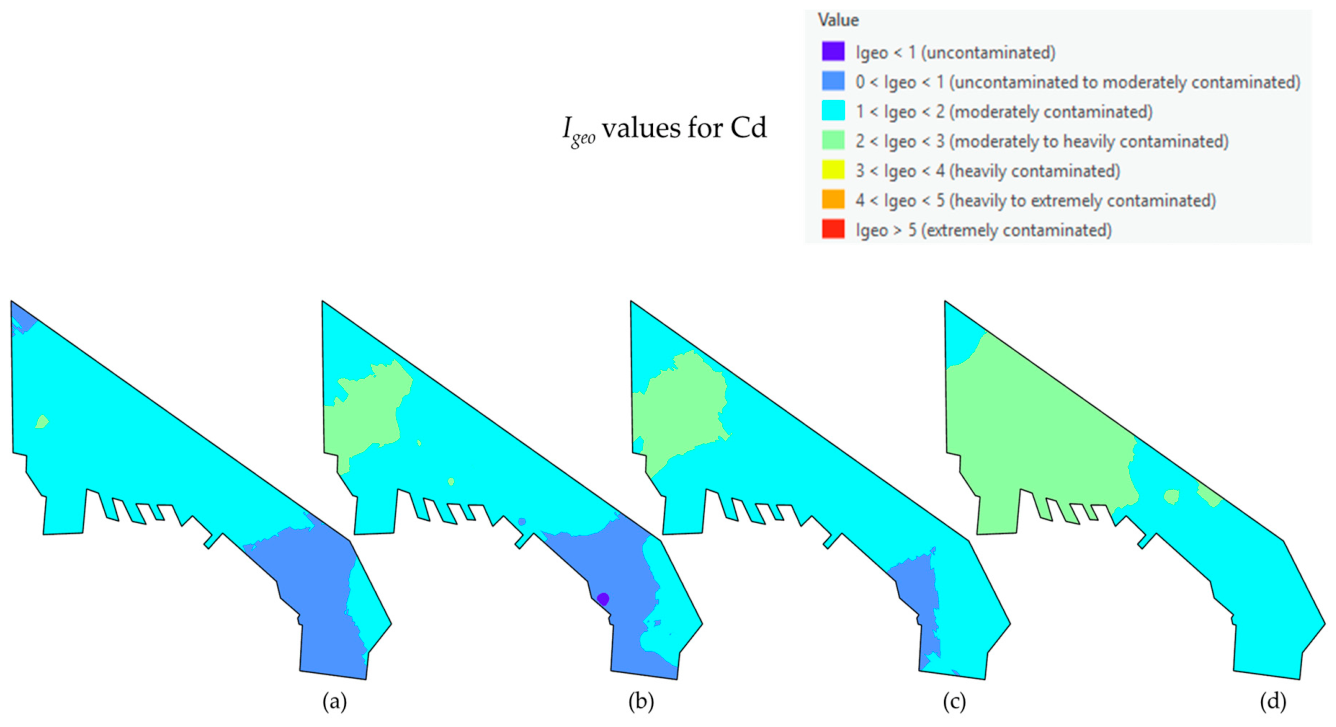
The spatial mapping of the geo-accumulation index (Igeo) for Cd highlights a progressive, multi-year deterioration of environmental quality across the study site (Figure 9). A persistent spatial gradient shows the contamination spread: the central and northwestern sectors consistently bear the highest Cd loads, while the southeastern coastal extremity remains the least impacted.
Figure 9.
Spatial distribution maps of the geo-accumulation index (Igeo) for Cd across the study area. Panels illustrate seasonal variations in contamination levels across four distinct periods: (a) winter 2021, (b) summer 2021, (c) winter 2024, and (d) summer 2024. Values are categorized according to the Müller scale, ranging from uncontaminated (Igeo < 0) to extremely contaminated (Igeo > 5). The predominantly cyan and light green regions signify a transition from moderate to heavy contamination (1 < Igeo < 3), with notable spatial gradients observed in the central and coastal sectors of the study site.
Looking at the temporal evolution from 2021 to 2024, conditions visibly worsen (Figure 9a–d). Winter 2021 (a) establishes a baseline dominated by moderate contamination (1 < Igeo < 2, cyan). Over time, a distinct hotspot of moderate-to-heavy contamination (2 < Igeo < 3, light green) emerges in the central region during summer 2021 (b) and expands to its maximum spatial extent by summer 2024 (d). Concurrently, the least contaminated zones are shrinking. The areas of lower accumulation (0 < Igeo < 1, light blue) at the southeastern sector in the 2021 samples almost completely disappear by the final 2024 sampling, suggesting a site-wide accumulation trend that outpaces any potential seasonal recovery.
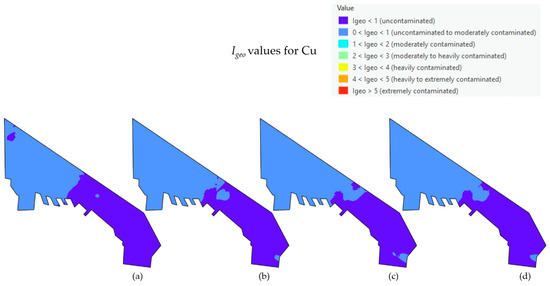
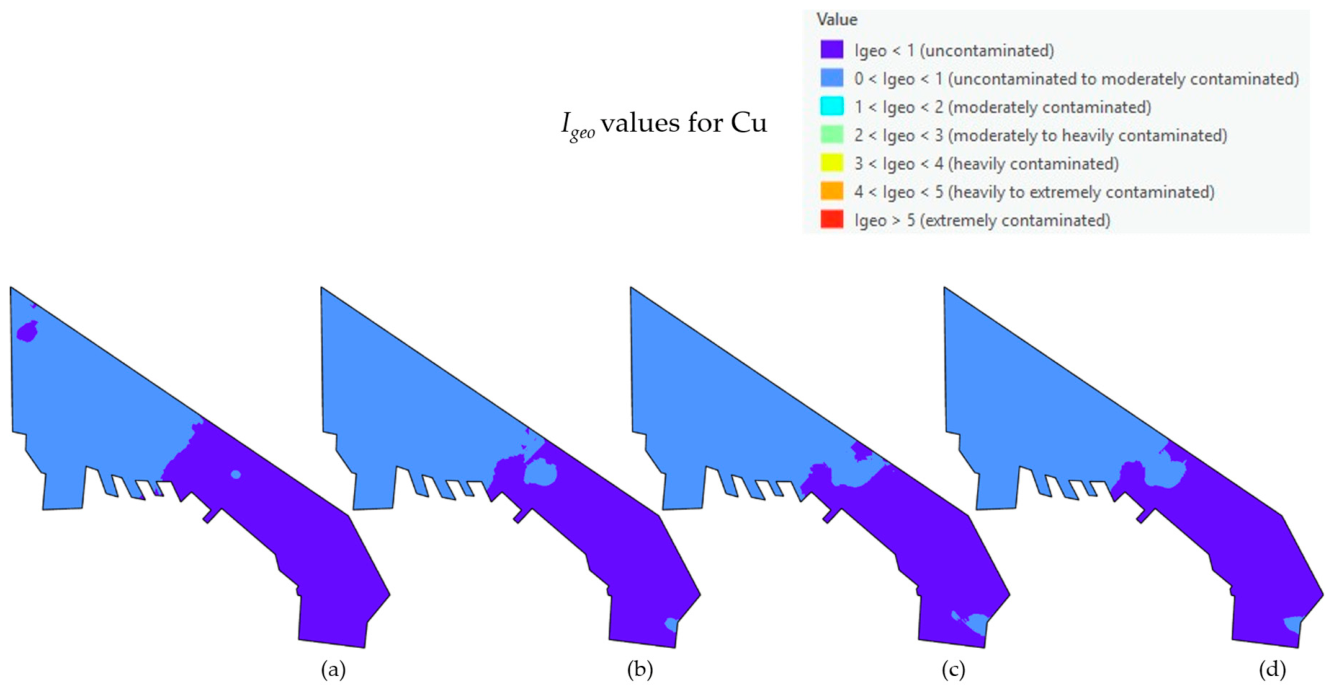
Figure 10 presents the spatiotemporal variation in the geo-accumulation index (Igeo) for Cu. Across all four sampling campaigns from winter of 2021 to summer of 2024 (Figure 10a–d), Cu contamination levels remain strictly confined to the lower tiers of the Müller scale [22]. The index values exclusively occupy the “uncontaminated” (Igeo < 0) and “uncontaminated to moderately contaminated” (0 < Igeo < 1) classifications. Spatially, a distinct geographic partition is observed; the northwestern sector of the study area consistently records Igeo values between 0 and 1, whereas the southeastern region maintains values below zero. Temporal analysis indicates a highly stable spatial distribution over the examined period, with minimal seasonal or annual fluctuations and no localized hotspots exceeding class 1.
Figure 10.
Spatial distribution maps of the geo-accumulation index (Igeo) for Cu across the study area. Panels represent distinct sampling periods (e.g., (a) winter 2021, (b) summer 2021, (c) winter 2024, and (d) summer 2024). Values are classified according to the Müller scale.
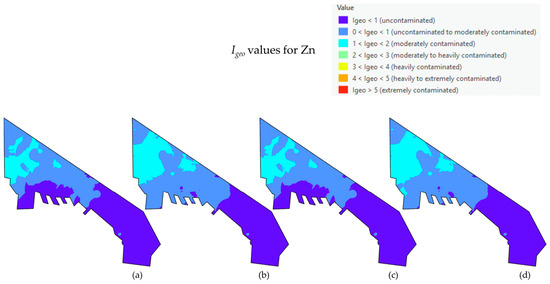
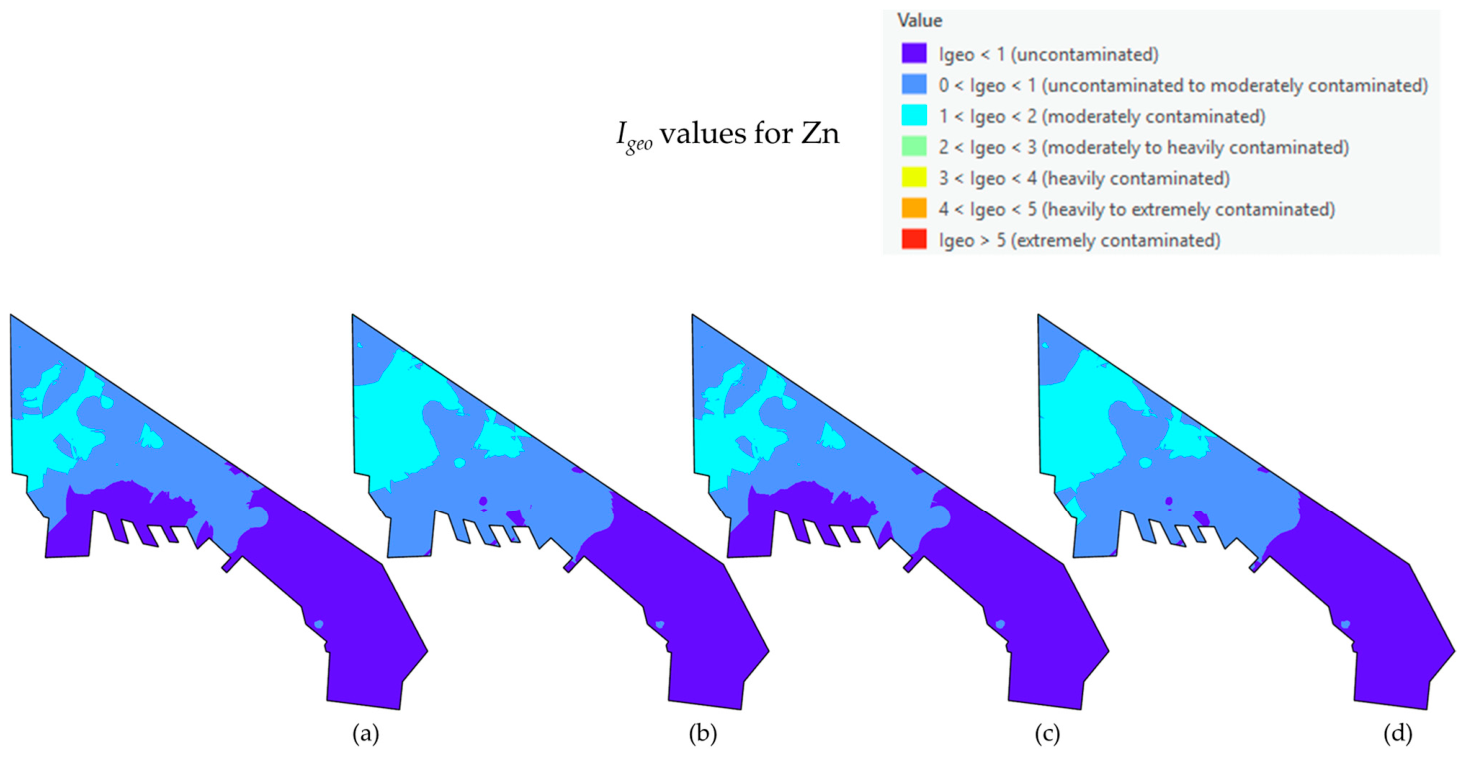
Regarding Zn, the spatial distribution of the geo-accumulation index () reveals a persistent, highly localized pattern of contamination (Figure 11). Across all four sampling campaigns (2021–2024), the highest values are heavily anchored to the northwestern industrial and port sectors, where the soil frequently registers as “moderately contaminated” (1 < < 2) to “moderately to heavily contaminated” (2 < < 3). In stark contrast, the broader central and southeastern residential areas remain predominantly within the “uncontaminated to moderately contaminated” (0 < < 1) or strictly “uncontaminated” ( < 0) categories. Crucially, and in alignment with the statistical evaluations, the temporal sequence of these maps does not illustrate a severe geographic expansion or escalating index severity over the four-year period. Instead, the for Zn confirms a stable, chronic environmental burden that is tightly bound to established anthropogenic emission sources in the western urban fringe, rather than a rapidly deteriorating city-wide condition.
Figure 11.
Spatial distribution maps of the geo-accumulation index (Igeo) for Zn across the study area. Panels represent distinct sampling periods (e.g., (a) winter 2021, (b) summer 2021, (c) winter 2024, and (d) summer 2024). Values are classified according to the Müller scale.
Spatial distribution maps of the geo-accumulation index (Igeo) were constructed for Cd, Zn, and Cu across the four distinct sampling periods (winter 2021, summer 2021, winter 2024, and summer 2024). In contrast, corresponding multi-temporal maps for Pb were omitted from visual presentation because across the study area and all monitoring phases, the computed Igeo values based on the smoothed interpolated surface remained consistently low (Igeo < 1), although individual raw sampling points occasionally exceeded this level (Table A2), signifying uncontaminated conditions according to the Müller scale. Consequently, the generation of spatial distribution maps for Pb across the years was deemed redundant, as the lack of spatial and temporal variation would yield identical, uninformative visual patterns.
4. Discussion
4.1. Evidence of Progressive Heavy Metal Accumulation in Urban Soils of Thessaloniki
The findings of the present study indicate that the urban soils of the Thessaloniki metropolitan area are subject to continuous anthropogenic loading of heavy metals. Rather than approaching equilibrium conditions, the system demonstrates a clear tendency toward progressive accumulation, suggesting that inputs from atmospheric deposition and local emission sources consistently exceed the natural capacity for dilution or removal. This pattern is consistent with earlier observations in Thessaloniki, where urban environmental compartments, including vegetation and road dust, have been shown to act as sinks of heavy metals originating from anthropogenic activities [13,20,32].
The multi-year monitoring approach employed in the present study extends these earlier findings by demonstrating that heavy metal accumulation is not static but evolves over time. The observed increase in mean concentrations across the monitoring period suggests that the processes driving contamination are persistent and cumulative, reinforcing the interpretation that urban soils in Thessaloniki are undergoing gradual geochemical enrichment.
When evaluating soil quality against established regulatory safety limits (Table 1), it is evident that Cd is the primary driver of acute soil degradation in Thessaloniki, being the only element to consistently approach or exceed critical safety thresholds. In contrast, the concentrations of Cu, Pb, and Zn do not indicate an immediate toxic hazard, as their city-wide averages remain well below extreme safety limits. However, the environmental degradation associated with these elements manifests as a chronic, low-level geochemical enrichment. While they do not breach acute toxicity thresholds, their statistically significant departure from natural Grade-I background levels and the persistent expansion of localized contamination hotspots underscore a gradual decline in the overall ecological baseline of the urban pedosphere.
4.2. Seasonal Controls on Heavy Metal Dynamics
The dataset reveals a pronounced seasonal influence, with consistently higher heavy metal concentrations recorded during the summer (dry) periods. This pattern reflects the Mediterranean climate of Thessaloniki, where reduced precipitation limits leach while promoting the retention of contaminants in surface soils. Simultaneously, the resuspension and redeposition of particulate matter increase surface loading during dry conditions.
Previous studies in Thessaloniki report similar seasonal trends, with higher metal concentrations observed during summer months [20]. While winter precipitation may partially redistribute contaminants, the present results indicate that this process is insufficient to counterbalance continuous anthropogenic inputs, thereby reinforcing long-term accumulation.
Furthermore, the progressive accumulation of these heavy metals is strongly mediated by the intrinsic physicochemical properties of the urban soil matrix. The analyzed soils exhibited predominantly slightly to moderately alkaline pH values, alongside varied textural classifications (primarily loams and sandy loams). In such alkaline environments, trace metals like Cd, Pb, Cu, and Zn tend to precipitate as insoluble carbonates or hydroxides, and their mobility is significantly reduced. Consequently, the soil acts as a highly effective, long-term sink. The continuous anthropogenic deposition from industrial and vehicular sources, combined with the retentive capacity of the alkaline soil matrix, severely limits vertical leaching, forcing the metals to accumulate progressively in the upper pedological horizon.
4.3. Spatial Distribution and Identification of Contamination Hotspots
The spatial analysis performed in the present study reveals a highly heterogeneous distribution of heavy metals across the Thessaloniki urban landscape. Elevated concentrations are primarily concentrated within the northwestern industrial sector and the central urban core, areas characterized by intense traffic, port activity, and industrial emissions. This spatial pattern is consistent with previous studies, which have repeatedly identified major road junctions, transport corridors, and industrial zones as primary hotspots of contamination [13]. Similarly, road dust investigations have shown that urban sites with heavy traffic load exhibit significantly higher concentrations of elements such as Cu, Zn, and Pb, reflecting the influence of vehicular emissions and abrasion processes [20].
A key observation is the spatial expansion of contamination zones over time. While earlier studies reported localized hotspots, the present results indicate that elevated concentrations are progressively extending into adjacent residential and mixed-use areas. This pattern suggests that contamination is no longer confined to discrete emission sources but is spreading across the broader urban matrix under continuous anthropogenic pressure.
4.4. Source Attribution of Heavy Metals in Thessaloniki Urban Environment
The interpretation of heavy metal sources in the present study aligns closely with the source identification patterns reported in previous research conducted within the Thessaloniki metropolitan area. The dominant contribution of traffic-related processes is evident, particularly for elements such as Cu, Zn, and Pb, which are widely associated with non-exhaust vehicular emissions including brake wear, tire abrasion, and mechanical degradation of vehicle components [13,20]. Industrial and port-related activities also represent significant sources, especially in the northwestern sector of the city. Previous studies using multivariate statistical approaches have demonstrated that heavy metal variability in Thessaloniki is largely explained by a combination of vehicular emissions, fuel combustion, and industrial processes [20]. In addition to contemporary sources, certain elements—particularly lead—also exhibit characteristics indicative of historical contamination. The widespread distribution of Pb in urban environments has been attributed to the legacy of lead fuel use and its long-term persistence in environmental matrices [20].
Recent soil-based studies further support this interpretation, indicating that elevated concentrations of Cd, Cu, Pb, and Zn are primarily linked to anthropogenic activities, while other elements show stronger geogenic control [15]. Overall, the consistency between the present findings and previous studies confirms that heavy metal contamination in Thessaloniki is predominantly controlled by anthropogenic sources, with traffic and industrial activities acting as the primary drivers.
4.5. Environmental Significance and Soil Quality Degradation
The Geo-accumulation Index (Igeo) confirms a progressive decline in soil quality, particularly for Cd and Zn, indicating increasing levels of contamination. Previous studies in Thessaloniki have similarly reported moderate to high contamination levels and associated ecological risks [15,20].
The present results further show that areas of low contamination are diminishing over time, suggesting a transition toward more persistent and widespread pollution. Given the role of urban soils as long-term contaminant reservoirs, this trend raises concerns regarding potential secondary exposure pathways, including dust resuspension and human contact.
4.6. Spatiotemporal Interpretation in Relation to Previous Studies
The combined spatial and temporal analysis confirms that heavy metal contamination in Thessaloniki is both heterogeneous and dynamic. The patterns observed closely align with earlier findings while extending them using multi-year monitoring data (Table 3). Spatially, the persistence of contamination hotspots in the northwestern industrial zone and the city center corresponds with previous studies identifying these areas as major emission sources [13,20]. Temporally, the seasonal fluctuations observed are consistent with earlier evidence linking higher concentrations to dry summer conditions [20].
Table 3.
Summary of key studies on heavy metal contamination in Thessaloniki, including environmental media, dominant contaminants, major findings, and comparison with the present study to highlight spatiotemporal trends and research advancements.
The most important contribution of the present study is the identification of a long-term accumulation pattern. While earlier investigations were largely based on short-term observations, the extended temporal scale adopted here reveals a gradual intensification and spatial expansion of contamination across the urban environment. This progression indicates that the urban soil system is increasingly unable to counterbalance ongoing pollutant inputs, resulting in a transition from localized contamination toward a more persistent and cumulative environmental burden. The observed trends emphasize the need for sustained monitoring and targeted mitigation strategies to manage the environmental and public health implications of soil contamination in Thessaloniki.
5. Conclusions
The four-year monitoring period (2021–2024) demonstrates a clear pattern of progressive heavy metal accumulation in the urban soils of Thessaloniki, confirming the increasing impact of anthropogenic activities on soil quality. The results highlight a strong seasonal influence, with consistently higher concentrations recorded during the summer periods, indicating that reduced precipitation and enhanced atmospheric deposition play a key role in metal retention within surface soils.
Spatial analysis identifies the northwestern industrial and port area, along with major traffic corridors, as the primary zones of contamination. The evaluation of the geo-accumulation index and subsequent statistical analyses confirm a distinct elemental divergence in soil quality trends across the urban matrix. Cd exhibits a clear, progressive decline in soil quality, with contamination levels and spatial extent significantly increasing over the four-year period. Cu and Pb demonstrate a slower, more gradual accumulation; while their year-over-year changes are marginal, their total enrichment from 2021 to 2024 is statistically significant, reflecting a persistent anthropogenic influx that has saturated the soil’s natural leaching capacity. Conversely, the spatial distribution and statistical evaluations for Zn indicate a severe but temporally stable contamination profile. Zn remains firmly anchored to the northwestern industrial and port hotspots, representing a chronic, localized environmental burden rather than a rapidly escalating, city-wide degradation.
These findings emphasize the critical need for targeted environmental management strategies, particularly the stricter control of non-exhaust vehicular emissions and industrial atmospheric discharges in the western sector. However, because the present study evaluates total heavy metal concentrations, it inherently represents the maximum potential contamination reservoir. To accurately determine the immediate ecological and public health risks—and to justify any future localized reclamation or corrective actions—subsequent investigations must evaluate the mobile and bioavailable fractions of these elements. Ultimately, this four-year monitoring effort establishes a vital geochemical baseline, serving as a prerequisite for informed, data-driven urban environmental planning in the metropolitan area of Thessaloniki.
Author Contributions
Conceptualization, T.M.K., T.K.A. and E.E.G.; methodology, T.M.K. and T.K.A.; software, T.M.K.; validation, T.M.K., E.E.G. and T.K.A.; formal analysis, T.M.K.; investigation, T.M.K. and E.E.G.; resources, E.E.G., O.-D.K. and I.P.; data curation, T.M.K., I.P. and E.E.G.; writing—original draft preparation, T.M.K.; writing—review and editing, T.M.K., E.E.G. and T.K.A.; visualization, T.M.K.; supervision, T.M.K., E.E.G. and T.K.A.; project administration, E.E.G. All authors have read and agreed to the published version of the manuscript.
Funding
This research received no external funding.
Data Availability Statement
Data available on request from the corresponding author due to intellectual property restrictions of our Laboratories.
Conflicts of Interest
The authors declare no conflicts of interest.
Appendix A
Table A1.
Descriptive statistics of the physicochemical parameters of soil samples (2021–2024).
Table A2.
Spatial distribution, land-use classification (LUC), and concentration ranges of heavy metals (Cd, Cu, Pb, and Zn) across sampling locations (s1–s83). Concentrations are reported in mg kg−1 of dry soil matter.
References
- Awewomom, J.; Dzeble, F.; Takyi, Y.D.; Ashie, W.B.; Ettey, E.N.Y.O.; Afua, P.E.; Sackey, L.N.A.; Opoku, F.; Akoto, O. Addressing Global Environmental Pollution Using Environmental Control Techniques: A Focus on Environmental Policy and Preventive Environmental Management. Discov. Environ. 2024, 2, 8. [Google Scholar] [CrossRef] [Scilit]
- Meravi, N.; Singh, P.K.; Prajapati, S.K. Seasonal Variation of Dust Deposition on Plant Leaves and Its Impact on Various Photochemical Yields of Plants. Environ. Chall. 2021, 4, 100166. [Google Scholar] [CrossRef] [Scilit]
- Afifa; Arshad, K.; Hussain, N.; Ashraf, M.H.; Saleem, M.Z. Air Pollution and Climate Change as Grand Challenges to Sustainability. Sci. Total Environ. 2024, 928, 172370. [Google Scholar] [CrossRef] [Scilit] [PubMed]
- Ondrasek, G.; Shepherd, J.; Rathod, S.; Dharavath, R.; Rashid, M.I.; Brtnicky, M.; Shahid, M.S.; Horvatinec, J.; Rengel, Z. Metal Contamination—A Global Environmental Issue: Sources, Implications & Advances in Mitigation. RSC Adv. 2025, 15, 3904–3927. [Google Scholar] [CrossRef] [Scilit] [PubMed]
- Dawam, M.; Gobara, M.; Oraby, H.; Zorainy, M.Y.; Nabil, I.M. Advances in Membrane Technologies for Heavy Metal Removal from Polluted Water: A Comprehensive Review. Water Air Soil Pollut. 2025, 236, 461. [Google Scholar] [CrossRef] [Scilit]
- Bonilla-Bedoya, S.; López-Ulloa, M.; Mora-Garcés, A.; Macedo-Pezzopane, J.E.; Salazar, L.; Herrera, M.Á. Urban Soils as a Spatial Indicator of Quality for Urban Socio-Ecological Systems. J. Environ. Manag. 2021, 300, 113556. [Google Scholar] [CrossRef] [Scilit] [PubMed]
- Rodríguez-Espinosa, T.; Pérez-Gimeno, A.; Almendro-Candel, M.B.; Navarro-Pedreño, J. Constructing Soils to Mitigate Land Occupation by Urban Expansion and Metabolism to Improve Healthy Cities. Land 2024, 13, 1383. [Google Scholar] [CrossRef] [Scilit]
- Aslanidis, P.S.C.; Golia, E.E. Urban Sustainability at Risk Due to Soil Pollution by Heavy Metals—Case Study: Volos, Greece. Land 2022, 11, 1016. [Google Scholar] [CrossRef] [Scilit]
- Papadimou, S.G.; Kantzou, O.D.; Chartodiplomenou, M.A.; Golia, E.E. Urban Soil Pollution by Heavy Metals: Effect of the Lockdown during the Period of COVID-19 on Pollutant Levels over a Five-Year Study. Soil Syst. 2023, 7, 28. [Google Scholar] [CrossRef] [Scilit]
- Veitch, J.; Flowers, E.; Ball, K.; Deforche, B.; Timperio, A. Exploring Children’s Views on Important Park Features: A Qualitative Study Using Walk-Along Interviews. Int. J. Environ. Res. Public Health 2020, 17, 4625. [Google Scholar] [CrossRef] [Scilit] [PubMed]
- Ribeiro, H.; Santana, K.V.d.S.; Oliver, S.L. Natural Environments in University Campuses and Students’ Well-Being. Int. J. Environ. Res. Public Health 2024, 21, 413. [Google Scholar] [CrossRef] [Scilit] [PubMed]
- Gkoltsou, V.S.; Papadimou, S.G.; Bourliva, A.; Skilodimou, H.D.; Golia, E.E. Heavy Metal Levels in Green Areas of the Urban Soil Environment of Larissa City (Central Greece): Health and Sustainable Living Risk Assessment for Adults and Children. Sustainability 2025, 17, 4421. [Google Scholar] [CrossRef] [Scilit]
- Bourliva, A.; Christophoridis, C.; Papadopoulou, L.; Giouri, K.; Papadopoulos, A.; Mitsika, E.; Fytianos, K. Characterization, Heavy Metal Content and Health Risk Assessment of Urban Road Dusts from the Historic Center of the City of Thessaloniki, Greece. Environ. Geochem. Health 2017, 39, 611–634. [Google Scholar] [CrossRef] [Scilit] [PubMed]
- Sfetsas, T.; Ghoghoberidze, S.; Karnoutsos, P.; Tziakas, V.; Karagiovanidis, M.; Katsantonis, D. Spatial and Temporal Patterns of Trace Element Deposition in Urban Thessaloniki: A Syntrichia Moss Biomonitoring Study. Atmosphere 2024, 15, 1378. [Google Scholar] [CrossRef] [Scilit]
- Papadopoulos, I.; Golia, E.E.; Kantzou, O.D.; Papadimou, S.G.; Bourliva, A. Exploring Heavy Metals Exposure in Urban Green Zones of Thessaloniki (Northern Greece): Risks to Soil and People’s Health. Toxics 2025, 13, 632. [Google Scholar] [CrossRef] [Scilit] [PubMed]
- Golia, E.E.; Emmanouil, C.; Charizani, A.; Koropouli, A.; Kungolos, A. Assessment of Cu and Zn Contamination and Associated Human Health Risks in Urban Soils from Public Green Spaces in the City of Thessaloniki, Northern Greece. Euro-Mediterr. J. Environ. Integr. 2023, 8, 517–525. [Google Scholar] [CrossRef] [Scilit]
- Svigkas, N.; Loupasakis, C.; Papoutsis, I.; Kontoes, C.H.; Alatza, S.; Tzampoglou, P.; Tolomei, C.; Spachos, T. InSAR Campaign Reveals Ongoing Displacement Trends at High Impact Sites of Thessaloniki and Chalkidiki, Greece. Remote Sens. 2020, 12, 2396. [Google Scholar] [CrossRef] [Scilit]
- Philandras, C.M.; Nastos, P.T.; Paliatsos, A.G.; Repapis, C.C. Study of the Rain Intensity in Athens and Thessaloniki, Greece. Adv. Geosci. 2010, 23, 37–45. [Google Scholar] [CrossRef] [Scilit]
- Argyraki, A.; Kelepertzis, E.; Botsou, F.; Paraskevopoulou, V.; Katsikis, I.; Trigoni, M. Environmental Availability of Trace Elements (Pb, Cd, Zn, Cu) in Soil from Urban, Suburban, Rural and Mining Areas of Attica, Hellas. J. Geochem. Explor. 2018, 187, 201–213. [Google Scholar] [CrossRef] [Scilit]
- Bourliva, A.; Kantiranis, N.; Papadopoulou, L.; Aidona, E.; Christophoridis, C.; Kollias, P.; Evgenakis, M.; Fytianos, K. Seasonal and Spatial Variations of Magnetic Susceptibility and Potentially Toxic Elements (PTEs) in Road Dusts of Thessaloniki City, Greece: A One-Year Monitoring Period. Sci. Total Environ. 2018, 639, 417–427. [Google Scholar] [CrossRef] [Scilit] [PubMed]
- Schwermetalle in Den Sedimenten Des Rheins—Veränderungen Seit 1971—ScienceOpen. Available online: https://www.scienceopen.com/document?vid=879b4fc9-0fe1-44a4-8e33-b23cb9b12c98 (accessed on 16 April 2026).
- Muller, G. Index of Geoaccumulation in Sediments of the Rhine River. GeoJournal 1969, 2, 108–118. [Google Scholar]
- Adimalla, N.; Wang, H. Distribution, Contamination, and Health Risk Assessment of Heavy Metals in Surface Soils from Northern Telangana, India. Arab. J. Geosci. 2018, 11, 684. [Google Scholar] [CrossRef] [Scilit]
- Kabata-Pendias, A. Trace Elements in Soils and Plants, 4th ed.; CRC Press: Boca Raton, FL, USA, 2010; pp. 1–520. [Google Scholar] [CrossRef] [Scilit]
- Rudnick, R.L.; Gao, S. Composition of the Continental Crust. In Treatise on Geochemistry; Elsevier: Amsterdam, The Netherlands, 2003; Volume 3, pp. 1–64. [Google Scholar] [CrossRef] [Scilit]
- Rudnick, R.L.; Gao, S. Composition of the Continental Crust. In Treatise on Geochemistry: Second Edition; Elsevier: Amsterdam, The Netherlands, 2014; Volume 4, pp. 1–51. [Google Scholar] [CrossRef] [Scilit]
- EarthRef.Org Reference Database (ERR)—McLennan 2001. Available online: https://earthref.org/ERR/984/ (accessed on 5 August 2026).
- Resources|CCME. Available online: https://www.ccme.ca/en/resources (accessed on 5 August 2026).
- Salminen, R.; Batista, M.J.; Bidovec, M.; Demetriades, A.; De Vivo, B.; De Vos, W.; Duris, M.; Gilucis, A.; Gregorauskiene, V.; Halamic, J.; et al. Geochemical Atlas of Europe. Part 1: Background Information, Methodology and Maps; Geological Survey of Finland: Espoo, Finland, 2005. [Google Scholar]
- Hans Wedepohl, K. The Composition of the Continental Crust. Geochim. Cosmochim. Acta 1995, 59, 1217–1232. [Google Scholar] [CrossRef] [Scilit]
- Karagkiozidis, D.; Koukouli, M.E.; Bais, A.; Balis, D.; Tzoumaka, P. Assessment of the NO2 Spatio-Temporal Variability over Thessaloniki, Greece, Using MAX-DOAS Measurements and Comparison with S5P/TROPOMI Observations. Appl. Sci. 2023, 13, 2641. [Google Scholar] [CrossRef] [Scilit]
- Sawidis, T.; Marnasidis, A.; Zachariadis, G.; Stratis, J. A Study of Air Pollution with Heavy Metals in Thessaloniki City (Greece) Using Trees as Biological Indicators. Arch. Environ. Contam. Toxicol. 1995, 28, 118–124. [Google Scholar] [CrossRef] [Scilit]

Disclaimer/Publisher’s Note: The statements, opinions and data contained in all publications are solely those of the individual author(s) and contributor(s) and not of MDPI and/or the editor(s). MDPI and/or the editor(s) disclaim responsibility for any injury to people or property resulting from any ideas, methods, instructions or products referred to in the content. |
© 2026 by the authors. Licensee MDPI, Basel, Switzerland. This article is an open access article distributed under the terms and conditions of the Creative Commons Attribution (CC BY) license.