


Abstract
This article presents a spatial assessment of rangeland productivity, forage resources, and the potential carrying capacity of saiga (Saiga tatarica (L., 1766)) habitats within the Korgalzhyn State Nature Reserve (Kazakhstan). This research integrated field geobotanical surveys, remote sensing data, and spatial modelling approaches. During fieldwork conducted in July 2025, 44 geobotanical descriptions were completed. Long-term Sentinel-2 imagery (2015–2025), spectral vegetation indices, and ensemble machine learning algorithms (Random Forest and Gradient Boosted Decision Trees) were used to model rangeland productivity. The study area includes 16 types of rangelands. The forage resource base is primarily formed by dry-steppe communities dominated by Stipa, Festuca, and Artemisia. At the same time, halophytic vegetation containing Atriplex, Bassia, and Halocnemum provides additional forage resources under arid and saline conditions. The total annual forage reserve was estimated at 3,308,921.2 centners, and the potential annual carrying capacity was calculated at 363,033 saiga individuals across 313,868 ha. These values represent the theoretical forage-carrying capacity of the territory and should not be interpreted as actual population estimates. The results demonstrate the effectiveness of integrating remote sensing, field observations, and machine learning methods for assessing forage resources and spatial heterogeneity of rangeland ecosystems in the steppe regions of Kazakhstan.
1. Introduction
Arid rangeland ecosystems are among the most climate-sensitive natural systems, where precipitation regimes and soil moisture availability largely determine primary productivity. Under sharply continental climatic conditions, interannual fluctuations in temperature and moisture availability cause substantial variations in aboveground phytomass production and the spatial structure of vegetation cover. For large migratory herbivores, such changes are transformed into variability in forage availability, habitat quality, and population demographic parameters. Therefore, quantitative assessment of rangeland productivity, total forage resources, and carrying capacity constitutes a key component of evidence-based management of steppe populations of wild ungulates.
Saiga tatarica (L., 1766) is a specialized steppe species of Central Asia and one of the most characteristic representatives of arid steppe and desert ecosystems. At the end of the 20th century, the species experienced a sharp decline in numbers and is currently considered threatened with extinction [1]. Kazakhstan is a key area for saiga conservation, where the bulk of the world’s range is concentrated, and three isolated populations exist in Betpak-Dala, Ustyurt, and Ural.
In spring 2025, aerial surveys and field assessments estimated the saiga population in Kazakhstan at approximately 3.9–4.1 million individuals, nearly three times the historical maximum recorded in 1974 (~1.2 million individuals). The Betpak-Dala population reached 1.6 million individuals with an annual growth rate ranging from 37.7% to 44.7%. Due to the significant increase in abundance, the authorities initiated population-regulation measures for the Ural and Betpak-Dala populations. The planned management measures include removing up to 20% of the population in selected regions [2].
Carrying capacity of rangeland is defined as the maximum number of animals (in standardized conventional units) that a rangeland can sustainably support without degrading its resource base [3]. However, habitat carrying capacity varies over time with the availability of natural food, climatic conditions, and the number of consumers, thereby determining the dynamics of the optimal population size.
The present study was conducted within the Korgalzhyn State Nature Reserve, which is part of the range of the Betpak-Dala saiga population. The Reserve was established in 1968 to preserve unique wetland ecosystems. The Reserve occupies 543,171 ha in Central Kazakhstan [4,5]. The area was designated as a Ramsar Wetland of International Importance in 1976 [6], was included in the UNESCO World Heritage List in 2008, and was recognized in 2012 as the core zone of Kazakhstan’s first UNESCO Biosphere Reserve. The total area of the biosphere Reserve amounts to 1,603,171 ha [7].
Within the Reserve, wetlands account for approximately 42% of the territory, while 58% are dry-steppe landscapes that form the rangeland basis of the saiga range. The area combines extensive freshwater and saline lakes with shoreline complexes and vast areas of natural steppe rangelands characterized by high spatial mosaic.
The Korgalzhyn Reserve represents one of the key spring–summer habitats of the Betpak-Dala saiga population. During this period, seasonal aggregations of animals form in association with migratory movements, intensive utilization of forage resources, and reproductive activities. Consequently, evaluating rangeland productivity and potential carrying capacity during the spring–summer season is particularly important, as forage availability is one of the main factors of habitat sustainability.
The selection of this protected area as the study site was motivated by its strict conservation status, which prohibits hunting and other forms of direct animal removal, thereby enabling assessment of forage resources under minimal direct anthropogenic impact. At the same time, the biosphere Reserve is located within a relatively densely populated area. It includes significant agricultural land and abandoned fields, which create a distinct land-use structure and may affect the condition of rangeland ecosystems.
Despite the ecological significance of the region, a spatially explicit assessment of rangeland resources, combining field geobotanical data, analysis of the floristic structure of the forage base, productivity calculations, and comparison with the climatic conditions of a particular growing season, has not been conducted. The quality of the forage base depends not only on total biomass production but also on species composition and the proportion of preferred forage plants consumed by saiga.
According to the botanical–geographical regionalization, the study area belongs to the Eurasian steppe region, the Trans-Volga-Kazakhstan province, and the Central Kazakhstan steppe sub-province. The northern and eastern parts of the Reserve are within the Ishim district, whereas the southern part is within the Western Kazakh Uplands district [8].
The Reserve is situated at elevations of 300–350 m above sea level and is confined to the Teniz Depression, while its western part belongs to the Kazakh Uplands (Saryarka). The relief is characterized by a slightly undulating plain that gradually descends toward lake basins and lacks pronounced topographic elevations. The absolute height differences are insignificant, typically not exceeding 10–20 m and only locally reaching 30–40 m. Areas of denudation (flat watershed surfaces with gentle slopes) and accumulation (weakly embedded river valleys and lake basins) are distinguished in the relief. Low-hill topography is widespread in the western, southern, and southeastern parts of the Reserve. In contrast, other areas are locally dissected by networks of small gullies and abandoned channels characteristic of steppe and semi-desert steppe environments [9,10,11].
The Reserve is located within the dry-steppe subzone, where chestnut soils predominate. The soil cover is characterized by high mosaicism and includes complexes of solonetz soils. In topographic depressions with additional moisture supply and on saline Tertiary clays, hydromorphic and semi-hydromorphic soils of varying salinity levels are developed.
Six main vegetation types are widely represented within the Reserve: steppe, desert-halophytic, meadow, marsh, shrub, and aquatic vegetation. Steppe vegetation is one of the dominant vegetation formations and includes feather grass, fescue-feather grass and forb-grass communities occurring on plains and inter-hill areas. These communities are dominated by bunch grasses, including Stipa lessingiana, S. sareptana, S. capillata, and Festuca valesiaca, in combination with xerophytic and mesoxerophytic forb species.
Desert-halophytic vegetation consists of communities formed by drought-resistant dwarf semi-shrubs associated with saline habitats, including solonetz and solonchak soils. They are represented by Artemisia schrenkiana, A. pauciflora, A. nitrosa, and Atriplex cana communities. Along the shores of saline lakes, saltwort communities show a marked change from the waterline to the land (Salicornia europaea, Suaeda acuminata, Halocnemum strobilaceum).
Shrub vegetation is represented primarily by Spiraea hypericifolia thickets and willow communities (Salix vinogradovii, S. triandra).
Meadow vegetation occurs in the relief depressions and river floodplains and includes communities dominated by Elymus repens, Poa pratensis, and Calamagrostis epigejos. Under conditions of excessive moisture, reed grass (Phragmites australis), reed mace (Typha angustifolia), and sedge (Carex melanostachya) marshes develop. Communities of aquatic macrophytes (Stuckenia pectinata, Potamogeton perfoliatus, Ceratophyllum demersum, and Myriophyllum spicatum) are represented in coastal and open-water areas of lakes. In contrast, saline lakes are characterized by the occurrence of Ruppia maritima and filamentous algae [8].
The Reserve also contains abandoned fallow lands (former croplands) and local areas of occasional grazing by domestic livestock, which further enhance the spatial heterogeneity of vegetation cover. Assessments of productivity, forage resources, and carrying capacity were conducted across all mapped vegetation communities, including fallow lands, which were identified as a separate land-use category on the rangeland map based on satellite image interpretation because they currently provide forage for saiga. Evidence of livestock grazing was recorded during field surveys (tracks, dung deposits, and proximity to settlements and water sources). However, grazing was considered occasional, spatially restricted, and therefore negligible at the scale of the entire Reserve. Consequently, no separate correction for livestock grazing was applied in the forage-resource or carrying-capacity calculations.
The study area is located inside the continent and is equidistant from the oceans and seas. The nearest large water bodies are the Caspian Sea, approximately 400–450 km to the west, and the Aral Sea, approximately 350 km to the southeast. This geographical setting determines a temperate continental climate with pronounced seasonality: cold winters and hot summers, large annual temperature amplitudes, low and uneven humidity and a predominance of precipitation during the warm season [12,13]. Climatic conditions favor the development of steppe landscapes, and wetlands form in the depressions associated with the lakes Tengiz and Korgalzhyn [11,13,14].
According to Koeppen’s classification, the territory of the Korgalzhyn State Nature Reserve belongs to the BSk/BWk climate (temperate continental, with dry, cold winters and hot summers), with year-to-year variations. The warmest month is July, with a mean temperature of approximately 22 °C, whereas January is the coldest month, with a mean temperature of about −16 °C. The area is relatively dry in terms of precipitation: the wettest month is June, with an average of 38 mm of precipitation (Figure 1). The annual precipitation is approximately 290 mm, reflecting the climate’s continental nature and the predominance of arid conditions. Wind conditions are highly seasonal, with the strongest winds occurring in March, when average wind speeds reach approximately 27 km/h, whereas relatively calm conditions often characterize summer periods. This seasonal contrast influences evapotranspiration rates and contributes to the formation and maintenance of steppe landscapes [10,11,15].
Figure 1.
Mean monthly air temperature (A) and precipitation (B) for the Korgalzhyn State Nature Reserve based on a 30-year climatic record obtained from the Kazhydromet climate database [16].
The growing season lasts approximately seven months (about 200 days), extending from April to October. In recent decades, the duration of the warm period has tended to increase due to a shorter cold season. The duration of drought periods with stable temperatures above 36 °C was also recorded [16].
The present study is based on an integrated assessment that combines: (1) data on plant consumption by saiga, (2) field geobotanical observations and measurements of aboveground biomass, (3) spatial modelling of seasonal rangeland productivity using satellite imagery and seasonal productivity data derived from the Kazakhstan forage resource map, and (4) analysis of climatic conditions during 2025 in comparison with long-term averages for the period of 2000–2025. This approach shifts from assessing overall vegetation productivity to a spatially differentiated quantitative evaluation of forage resources and the potential carrying capacity of saiga habitats, accounting for the structure of rangeland ecosystems.
The purpose of this study was to assess rangeland productivity and carrying capacity for saiga within the Korgalzhyn State Nature Reserve using field research, remote sensing, and climate analysis.
The research objectives were to: (1) quantify seasonal rangeland productivity and forage resources; (2) develop a map of rangeland types; (3) evaluate climatic conditions in 2025 relative to long-term climatic averages; and (4) estimate the potential carrying capacity of saiga habitats within the Korgalzhyn State Nature Reserve.
2. Materials and Methods
2.1. Study Area
The Korgalzhyn State Nature Reserve encompasses the Tengiz–Korgalzhyn lake system, one of the most important wetland complexes in Central Asia. It is a natural complex of freshwater and saltwater reservoirs with extensive coastal territories, which account for approximately 41% of its total area, thereby determining the pronounced spatial mosaic of vegetation and limiting the representation of typical rangeland communities.
The Reserve is located in central Kazakhstan within the Korgalzhyn district of Akmola region and partly within the Nura district of Karaganda region. In the western part, it borders the Kostanay region (Figure 2).
Figure 2.
Map of the research area with field survey points, clipping plots, points used to develop GB models, and meteorological stations.
2.2. Field Vegetation Surveys
Field studies were conducted between 21 and 30 July 2025 within the Reserve and adjacent steppe landscapes. A total of 44 geobotanical descriptions were obtained, including 13 descriptions within the Reserve. In addition, 22 clipping plots were established to obtain field measurements of aboveground biomass. These measurements were not used for model training but served to compare field biomass with the mapped summer yield estimates (Supplementary Tables S1 and S2). To calibrate the models for spatial biomass extrapolation, additional data were used covering an area within a radius of up to 120 km from the borders. This allowed the full range of variation in vegetation structure and spectral characteristics typical of the region’s rangeland ecosystems to be represented.
Model calibration was performed using the expanded dataset, whereas estimates of rangeland productivity, forage resources, and carrying capacity were calculated within the Reserve boundaries. The calibration dataset primarily included natural rangeland communities, while sites showing substantial anthropogenic disturbance were used to assess model uncertainty.
Vegetation surveys were conducted using classical field-based geobotanical, soil and cartographic methods [17,18,19,20,21,22]. Research plots measuring 100 m2 were established across the study area. Geographic coordinates were recorded using a GPS device Garmin 67S (Garmin Ltd., Schaffhausen, Switzerland). For each plot, comprehensive geobotanical descriptions were compiled, including coordinates, landscape features, soil characteristics, hydrological regime, degree of anthropogenic disturbance, and total projective coverage.
The existing recommendations were used to assess the degree of anthropogenic disturbance of vegetation [23,24].
Vegetation mapping was based on field geobotanical surveys, 1:200,000-scale topographic maps, satellite imagery, including Landsat 8 (18 May 2024), GeoEye-1 (4 May 2023), and WorldView-2 (30 April 2022 and 2 September 2022), and the Kazakhstan Rangeland Map (1:1,500,000) [25] developed between 2016 and 2018. Rangeland boundaries were delineated through expert visual interpretation of satellite imagery integrated with field geobotanical observations collected during the mapping process. Because the map was produced by expert interpretation rather than automated image classification, an independent statistical accuracy assessment (e.g., confusion matrix or kappa statistic) was not performed.
Additional information was obtained from archival sources, published literature, and previous field investigations [8,26,27,28,29].
The floristic composition of plant communities was determined. For each species, the following parameters were assessed: phenological stage, vigor (on a five-point scale), occurrence (Bykov’s scale), morphometric traits (plant height and habitus), and abundance, expressed as percentages according to Drude’s scale [30].
The life form spectrum was analyzed according to the Raunkier classification: hemicryptophytes (Hc), geophytes (G), therophytes (Th), chamaephytes (Ch), and phanerophytes (Ph) [31].
Ecological groups were defined based on species’ moisture preferences and habitat affinities (including xerophytes, mesoxerophytes, mesophytes and halophytes). Classification was based on regional floristic sources and ecological literature [32,33,34,35,36,37,38,39].
Plant species identification was conducted using standard taxonomic keys, including the nine-volume Flora of Kazakhstan [32,33,34,35,36,37,38,39] and Illustrated Guide for Identification of Plants of Kazakhstan [40,41]. Taxonomic nomenclature was standardized according to the Plants of the World Online database [42].
Rangeland productivity was estimated using the clipping method, which is widely applied to herbaceous and semi-shrub vegetation [43,44,45,46,47,48]. At each site of the geobotanical description, biomass was harvested from 1 m × 1 m quadrats established in three replicates. Vegetation was clipped either by species or by economic groups, including ephemeral plants, perennial grasses, wormwood/sagebrush, saltwort (annual and perennial), and shrubs. In small-grass desert rangelands, vegetation was clipped at a height of approximately 1 cm above the soil surface. In semi-shrub and shrub communities, only current-year shoots and young leaves were harvested. Harvested biomass was weighed in the field to determine raw phytomass, then dried to an air-dry state and weighed again.
For each clipping plot, biomass values obtained from the three replicate quadrats were averaged. Within-site variability was assessed by calculating the mean, standard deviation (SD), and coefficient of variation (CV). These descriptive statistics are presented in Supplementary Table S1.
Pasture yield was calculated in accordance with the official Methodology for Large-Scale Geobotanical Surveys of Natural Forage Lands of the Republic of Kazakhstan (Order of the Minister of Agriculture of the Republic of Kazakhstan No. 314, 3 October 2022) [48] and expressed in centners per hectare (c/ha; 1 centner = 100 kg), as prescribed by the methodology. This unit was retained throughout this manuscript to ensure methodological consistency and comparability with national geobotanical assessments.
2.3. Floristic Composition and Forage Value Assessment
The analysis of floristic composition in relation to forage value for the saiga (S. tatarica) was based on the integration of field geobotanical surveys conducted in 2025, including lists of species and their abundance, published data on the flora of the Tengiz–Korgalzhyn lake system [8]. This approach ensured comprehensive taxonomic coverage of the vegetation communities occurring within the study area.
The forage significance of plant species was evaluated using literature data on saiga diet composition under different seasonal conditions [49,50,51,52], thereby allowing the identified species to be correlated with saiga’s known feeding preferences. Based on this assessment, a list of plant species contributing to the vegetation cover of the study area was compiled (Table S3 in the Supplementary Material).
Species were classified into three forage value categories: primary forage species (regularly consumed), secondary forage species (seasonally or occasionally consumed), and non-forage species (species with little or no forage importance).
Quantitative analysis was based on calculating species frequency (%) from geobotanical descriptions. According to this metric, species were assigned to three occurrence groups: core forage species (≥30% of descriptions), common species (10–29%) and rare species (<10%). The ≥30% threshold was adopted as a working criterion for identifying the most frequent and functionally significant components of the forage base.
2.4. Remote Sensing Analysis
Remote sensing analysis was performed to spatially extrapolate seasonal rangeland productivity and aboveground biomass across the study area using field-derived biomass measurements and vegetation spectral characteristics.
Training data were obtained from the Kazakhstan forage resource map developed by the Kazakh Research Institute of Livestock and Foraging [25], which contains information on plant communities and their seasonal productivity (scale 1:1,500,000). The 22 clipping plots collected in July 2025 were not used for model training and served only as an independent field-based comparison dataset (Supplementary Tables S1 and S2).
A fragment corresponding to the AOI was clipped from the forage resource map. A centroid was obtained for each polygon, with a total of 165 points. These point data were used to train machine learning models (Figure 2).
For the specified AOI, seasonally averaged mosaics of Sentinel-2 images were generated in Google Earth Engine. The mosaic periods were defined according to L.V. Lebed [53] as 1–15 May, 1–15 June and 15–30 September. Mosaics were generated for the period 2015–2025. The multi-year image archive was averaged over eleven years to smooth interannual and seasonal variability in vegetation conditions and to ensure greater consistency with the generalized characteristics reflected in the rangeland map. All indices’ calculations were performed in Google Earth Engine (Table S4 in Supplementary Material), and all resulting rasters were subsequently processed in ArcGIS Pro 3.5. The set of spectral indices includes classic vegetation indices based on the red and NIR bands, vegetation indices incorporating the red-edge band, and the NDMI index, which estimates vegetation moisture content.
To mask water bodies in the original seasonal mosaics for model construction, the water body area was calculated using MNDWI [54]. The list of spectral indices used in this work is presented in Table S4 in the Supplementary Material [55,56,57,58,59,60,61,62,63,64].
The ArcGIS Pro 3.5 Forest-based and Boosted Classification and Regression tool was used to calculate seasonal biomass. When training the models, the number of trees was adjusted; the remaining parameters were left at their default settings. Validation of gradient boosted (XGBoost) models in ArcGIS Pro 3.5 was performed using the Forest-based and Boosted Classification and Regression tool, which automatically calculates accuracy metrics, plots residuals, and supports hold-out validation. Validation of trained models was performed on 10% of excluded training data (hold-out validation) over 3 iterations.
Classification accuracy was assessed using the ratio of correctly classified points to total number of points (Table 1).
Table 1.
Assessment of model classification accuracy.
The gradient boosting algorithm (GB) achieved a classification accuracy of 90% across all configurations, whereas the highest Random Forest accuracy did not exceed 73%. Therefore, the GB model with 500 trees was used to calculate seasonal biomass.
The confusion matrix is a matrix-based intensity chart. The X-axis represents the predicted category of objects in the training data, whilst the Y-axis represents their actual category. The diagonal cells show how many times the model correctly predicted the category. Higher values in the diagonal cells indicate that the model is performing well. Confusion matrices obtained for each season model with 500 trees demonstrated that the models used in the current study are well-suited to fulfil their main task, with acceptable bias (Figure 3).
Figure 3.
Confusion matrices of seasonal models. The Y-axis represents actual yield; the X-axis represents predicted yield: (A) spring model, (B) summer model, (C) autumn model.
The coefficient of determination (R2) between actual and predicted seasonal yields ranges from 0.69 to 0.86, indicating a good fit of the model to the actual yield data (Figure 4).
Figure 4.
R-squared coefficient for seasonal models: (A) spring season, (B) summer season, (C) autumn season. The blue points represent correctly classified observations, whereas the orange points represent misclassified observations.
In the next stage of the simulation, the importance of each variable was assessed for various GB configurations, with the top five variables considered for each training option. Three indices—IRECI, RECI and NDI45—were among the top five important variables for all training variants; NDMI was among the top five most important variables twice, whilst all other indices were included either once (MSAVI, Green NDVI, MTVI) or not at all. Based on this distribution, four indices were included in the final model: RECI, IRECI, NDI45 and NDMI.
The final seasonal yield rasters were processed using the Zonal Statistics function; for each yield class, the area (Projection: Asia North Equidistant Conic) in hectares and the corresponding gross seasonal biomass were calculated. These area-weighted indicators formed the basis for estimating forage reserves and carrying capacity.
Spatial Autocorrelation (Global Moran’s I) (Spatial Statistics Tools) in ArcGIS Pro 3.5 was applied to assess the spatial autocorrelation of the training dataset. The tool returned Moran’s values from 0.05 (spring biomass distribution) to 0.13 (summer and autumn biomass), showing none or low spatial autocorrelation of the training data.
2.5. Biomass-Based Estimation of Forage Resources and Carrying Capacity
Spatially distributed estimates of aboveground biomass, derived from modelling using remote sensing data (Section 2.2 and Section 2.4), were used to assess forage resources and the carrying capacity of rangelands. For each rangeland type and season, the area-weighted average yield (Yw) was calculated to account for spatial heterogeneity in productivity among individual vegetation polygons. The area-weighted average yield was calculated as the ratio of the sum of polygon-specific yields multiplied by their respective areas to the total area of polygons belonging to a given rangeland type (1). The range of values reflects the spatial heterogeneity of yields within a rangeland type.
where:
- Yw—area-weighted average yield, c/ha;
- Yp—yield of an individual polygon, c/ha;
- Sp—area of an individual polygon, ha.
Winter biomass yield was estimated using species-specific seasonal biomass development and retention coefficients provided in Appendix 18 of the national geobotanical survey methodology of Kazakhstan [48]. An overall winter biomass retention coefficient was calculated for each mapped rangeland type based on the principal dominant species listed in the map legend (Table S5, Supplementary Materials) and applied to the modelled yield of the reference season corresponding to maximum (100%) biomass development.
The estimation of forage resources was performed in two stages. In the first stage (2), the specific annual forage reserve (F, c/ha) was calculated as the sum of area-weighted average seasonal yields for each rangeland type, adjusted by the forage utilization coefficient:
where:
- Yw,i—area-weighted average yield in season i (c/ha);
- i—season: spring, summer, autumn and winter;
- U—utilization coefficient (proportion of aboveground phytomass removed through grazing).
In the second stage, the total forage reserve (Ftotal, centners) within the study area was calculated as follows:
where:
- S—the rangeland area (ha).
Since not all produced plant biomass is available for consumption by saiga, the utilization coefficient (U) accounts for limitations associated with the unpalatability of certain species, inaccessibility, and biomass losses due to trampling. In this study, U is interpreted as the proportion of aboveground phytomass removed by grazing and is functionally equivalent to the harvest efficiency concept widely used in international rangeland management.
According to published studies, utilization coefficients vary considerably depending on environmental conditions and methodological approaches. In rangeland management systems of the United States, utilization is not considered a fixed value. The USDA Natural Resources Conservation Service (NRCS) emphasizes that the acceptable level of biomass removal depends on ecological conditions, grazing systems, and vegetation cover status [65]. Under arid rangeland conditions with continuous grazing, lower utilization rates (approximately 25%) are often recommended to maintain ecosystem resilience.
Broader utilization ranges have been reported in different regions of the world, depending on natural conditions and rangeland management systems. For arid rangelands of India, including Rajasthan, utilization coefficients of 30–50% (0.30–0.50) have been suggested [66]. In rangeland management practices in East Africa (with Uganda as an example), a guideline recommends using about 50% of the available forage biomass to maintain productivity and restore vegetation cover [67]. In more arid environments, lower coefficients of approximately 30% have been recommended, particularly for the Mendoza Plain in Argentina [68] and arid rangelands in the Eastern Somali region of Ethiopia [3].
Studies from the southwestern United States indicate that utilization coefficients range between 25% and 50%, with lower values (25–40%) preferred under arid conditions due to the high interannual variability in productivity driven by precipitation fluctuations [69]. The choice of the utilization coefficient is a key parameter determining the final assessment of rangeland carrying capacity.
Previously, the utilization coefficient of U = 0.55 (55%) was applied in Kazakhstan [70] to assess saiga forage resources, representing the proportion of biomass that could be removed while maintaining the ability of rangelands to recover. However, the substantial increase in the Betpak-Dala saiga population, from approximately 400,000 individuals in the late 1980s to 1.6 million in 2025 [2], has increased grazing pressure, necessitating a more conservative assessment of sustainable forage use.
Considering the utilization coefficient range reported in the literature (0.25–0.55) and the heterogeneous structure of vegetation cover within the study area, U = 0.45 was adopted as the reference utilization coefficient for the principal carrying-capacity calculation. This value was selected to represent relatively favorable but sustainable forage-use conditions while maintaining consistency with previous assessments of saiga forage resources.
The calculated annual forage reserve reflects the total productivity of rangelands over the entire vegetation cycle. In practice, forage resources are utilized within seasonal forage reserves, which determine carrying capacity during specific periods of the year.
Rangeland carrying capacity was estimated using the classical carrying-capacity calculation scheme described by Fadeyev and Ivanov [70] and modified in the present study by replacing seasonal yield with the specific forage reserve (F). In contrast to the original calculation scheme, seasonal rangeland yield (Y) was replaced by the specific forage reserve (F, c/ha), calculated from the area-weighted average seasonal yield while accounting for the forage utilization coefficient. Depending on the objective of the analysis, both annual and seasonal (spring–summer) forage reserves were calculated.
Carrying capacity was estimated by comparing the available forage resources during a given period with the forage requirements of animals over the same period.
The potential number of animals that could be supported by forage resources within each rangeland type during a specified period was calculated as the ratio of the total available forage reserve to the forage requirement of a single animal during that period (4):
where:
- Hi—number of animals that can be supported by forage resources of a given rangeland type during a specified period (individuals);
- Fi—specific forage reserve for the corresponding period (c/ha);
- S—area of the rangeland type (ha);
- K—daily forage requirement per animal (kg/day);
- qi—duration of the grazing period (days);
- 100—conversion factor from centners to kilograms (1 centner = 100 kg).
A two-parameter sensitivity analysis was performed to evaluate the influence of the forage utilization coefficient (U) and the daily forage intake parameter (K) on the estimated carrying capacity. Carrying capacity was recalculated using U values of 0.25, 0.35, 0.45, and 0.55 and K values of 0.8, 1.5, 1.9, and 2.5 kg/day, while all other model parameters remained unchanged. The scenario defined by U = 0.45 and K = 2.5 kg/day was retained as the reference scenario throughout this study. The complete results of the sensitivity analysis are presented in Table S6 (Supplementary Materials).
Published estimates of the daily forage intake of saiga vary substantially depending on season and feeding conditions. Abaturov et al. [52] reported values ranging from 0.8 to 1.9 kg of dry mass per day, whereas Fadeyev and Ivanov [70] reported approximately 2.5 kg/day. The latter value was adopted as the reference parameter (K) in the principal carrying-capacity calculation. Because carrying capacity is inversely proportional to daily forage intake, selecting K = 2.5 kg/day yields a conservative carrying-capacity estimate and reduces the likelihood of overestimating the number of animals that the available forage can support.
The duration of the autumn–winter grazing period (September–February) was assumed to be 181 days, whereas the spring–summer grazing period (March–August) was assumed to be 184 days. Thus, the annual carrying-capacity calculation covered a total period of 365 days. Carrying capacity was calculated separately for each rangeland type using the adopted daily forage intake (K) and the corresponding duration of each grazing period.
2.6. Climatic Analysis for 2025
Climatic conditions were analyzed using data from the meteorological stations of Korgalzhyn, Yegindykol, Arkalyk, and Berlik [71], located in the vicinity of the study area (Figure 1), for the period from January to December 2025. Based on these data, monthly mean air temperatures and monthly precipitation totals were calculated, along with their climatic normals (2000–2025) and deviations from the long-term averages.
Mean monthly temperature and precipitation values averaged across the four stations, together with their deviations from long-term means, are presented in Table S7 in the Supplementary Material. Graphical representations of temperature and precipitation patterns are shown in Figure 5.
Figure 5.
(A) Mean monthly air temperature and climatic norm; (B) Mean monthly precipitation totals and climatic norm (2025, four meteorological stations):  —normal.
Analysis of the temperature regime revealed positive deviations from the climatic norm during most months of 2025. The most pronounced anomalies were recorded in January (+5.1 °C) and November (+4.7 °C). Slight negative deviations were observed in August and October. Overall, 2025 can be characterized as an exceptionally warm year, particularly during winter and early spring (Figure 5A).
The distribution of precipitation during the year was significantly uneven. A pronounced precipitation deficit was observed over several months, with the largest negative anomaly recorded in October, when precipitation was only about 7% of the climatic norm. Moisture deficits were also observed in February, March, July and December. In contrast, excessive precipitation occurred during several periods, with the highest values recorded in May (up to 150% of the climatic norm). Above-average precipitation was also observed in June, August and September, whereas precipitation in April and November was close to long-term averages (Figure 5B).
The combined analysis of temperature and precipitation patterns indicates that positive temperature anomalies were frequently accompanied by precipitation deficits, particularly during winter (February) and at the end of the year (December). This indicates the formation of stable anticyclonic conditions that contribute to warm, dry weather.
Based on the climatic data obtained, the Selyaninov Hydrothermal Coefficient (HTC) was calculated. The HTC value for 2025 was 0.49, indicating arid conditions and a pronounced moisture deficit during the growing season.
Taken together, the temperature and precipitation characteristics indicate that 2025 was an exceptionally warm and arid year, reflecting intensified arid conditions within the study area.
3. Results
3.1. Spatial Distribution and Rangeland Productivity
A rangeland map of the Korgalzhyn State Nature Reserve was developed for the first time at a scale of 1:200,000 (Figure 6; reduced in size for publication). The map legend was constructed according to a regional typological classification approach. Two hierarchical classification levels were distinguished. The first-rank headings group rangelands into five major classes: dry-steppe rangelands, herbaceous marshes and meadow rangelands, saline rangelands, agricultural lands and water bodies. The second-rank headings represent specific rangeland types distinguished by dominant plant communities, environmental conditions and soil cover. The legend of the map consists of 16 units (Figure 7), which are described in Table 2.
Figure 6.
Rangeland map of the Korgalzhyn State Nature Reserve.
Figure 7.
Area distribution of the major rangeland types.
Table 2.
Legend of the rangeland map of the Korgalzhyn Nature Reserve, including vegetation types, seasonal productivity, forage reserves and carrying capacity.
Rangelands of the Korgalzhyn State Nature Reserve are characterized by pronounced spatial heterogeneity and are represented by five major classes.
Class I—Dry-steppe rangelands (types 1–6 in the map legend; Table 2), including bunch grasses, sagebrush-bunch grass, sagebrush, and shrub communities. This is the most widespread and forage-valuable class, occupying 39.9% of the Reserve area. The area-weighted average specific forage reserve of dry-steppe rangelands ranges from 10.2 to 11 c/ha, while the total potential annual carrying capacity of this class is 255,826 saiga individuals.
Class II—Herbaceous marshes and meadow rangelands (types 7–11), represented by reed grass, reed mace, bulrush, meadow and halophytic meadow communities, occupy 17.7% of the Reserve area.
Class III—Saline rangelands (types 12–14), including halocnemum, glasswort, orach-sagebrush, and other halophytic vegetation, occupy 5.2% of the Reserve area.
Class IV—Agricultural lands (type 15), represented by hayfields and abandoned lands, account for 3.1% of the territory.
Class V—Water bodies (type 16) occupy 34.2% of the Reserve area. Although they do not contribute directly to the saiga forage base, they play an important role in maintaining the hydrological regime and providing access to drinking water.
Characteristics of individual rangeland types are presented in Table 2.
Area-weighted average yield of the Reserve’s rangelands varied seasonally, ranging from 3.0 to 6.7 c/ha in spring, 5.4 to 7.0 c/ha in summer, 6.1 to 8.9 c/ha in autumn, and 3.0 to 4.8 c/ha in winter. The highest productivity values were observed during autumn, reflecting the accumulation of aboveground phytomass by the end of the growing season.
Comparison of the mapped summer yield estimates with biomass measurements from 22 clipping plots showed that 14 plots (63.6%) were within the yield range of the corresponding mapped rangeland type (Table S2, Supplementary Materials). The mean measured biomass was 7.80 c/ha, compared with a mean mapped summer yield of 6.10 c/ha; the mean bias was +1.70 c/ha, the MAE was 2.81 c/ha, and the RMSE was 4.81 c/ha. This comparison was used to assess the agreement of the field measurements with the productivity ranges assigned to the mapped rangeland types, rather than as a temporally matched validation of the summer yield estimates.
The total annual forage reserve of all rangeland types (types 1–15) was estimated at 3,826,398.3 centners, with an average specific value of 10.5 c/ha. The forage reserve in the spring–summer period reached 1,969,116.7 centners (on average 5.4 c/ha), in the autumn–winter period—1,857,281.6 centners (5.1 c/ha). The potential annual carrying capacity of the territory was estimated at 419,616 saiga individuals, while the carrying capacity for the spring–summer period was estimated at 428,324 individuals.
Herbaceous marshes and tall-herb meadow communities (types 7–8) occurring on marsh and meadow-marsh soils are generally not used by saiga as feeding habitats and primarily function as temporary shelter areas and transit areas during movements to watering sites. Therefore, these vegetation types were excluded from the final assessment of forage resources and the territory’s carrying capacity.
After excluding these habitats, the total annual forage reserve was estimated at 3,308,921.2 centners, with an average specific forage reserve of 10.4 c/ha. The forage reserve in the spring–summer period amounted to 1,727,778.4 centners (5.5 c/ha), while the autumn–winter reserve reached 1,581,142.8 centners (5 c/ha). Under the reference scenario (U = 0.45; K = 2.5 kg/day), the potential annual carrying capacity of the territory was estimated at 363,033 saiga individuals, whereas the spring–summer carrying capacity was estimated at 375,965 individuals. Sensitivity analysis showed that carrying-capacity estimates varied depending on the assumed values of U and K. The complete results are presented in Table S6 (Supplementary Materials).
3.2. Plant Species Composition and Forage Structure of Rangeland Ecosystems
Based on published sources and field observations, a checklist of forage plant species occurring within the Reserve was compiled (see Table S3 in the Supplementary Material). The list includes 60 species belonging to 13 families. The most species-rich families were Amaranthaceae (28.4%) (Bassia prostrata, Atriplex cana, Halocnemum strobilaceum, etc.), Poaceae (18.3%) (Festuca valesiaca, Stipa sareptana, etc.), and Asteraceae (18.3%) (Artemisia austriaca, Galatella villosa, etc.), reflecting the zonal characteristics of the region (Figure 8A). The prominent participation of these families indicates the dominance of xerophytic and halophytic elements typical of arid and partially saline habitats.
Figure 8.
Characteristics of forage species: (A) distribution of forage species among the dominant plant families (%), (B) seasonal structure of forage species (number of species).
The floristic structure of the forage base exhibits a pronounced desert-steppe character and is primarily composed of species adapted to moisture stress, high solar radiation, and unstable environmental conditions.
Analysis of seasonal species composition revealed considerable variation in the distribution of forage plants throughout the year. During the early spring period, 9 forage species were recorded (Poa bulbosa, Eremopyrum orientale, Bassia prostrata, Ephedra distachya, Lepidium perfoliatum, Chorispora tenella, etc.). The spring–summer period included 45 species (Festuca valesiaca, Stipa sareptana, Galatella tatarica, Artemisia lercheana, Spiraea hypericifolia, Limonium gmelini, etc.). In contrast, 53 species were recorded during the summer–autumn period (Artemisia austriaca, A. nitrosa, Camphorosma monspeliaca, Pyankovia brachiata, Caroxylon laricinum, Polygonum aviculare, Silene wolgensis, etc.). During winter, forage significance was retained by only 15 species (Anabasis salsa, Atriplex cana, Bassia prostrata, Halocnemum strobilaceum, Artemisia lercheana, A. pauciflora, etc.) (Figure 8B).
The seasonal dynamics of forage species reflect the ecological characteristics of arid and saline ecosystems. The highest species richness was observed during the spring–summer and summer–autumn periods, corresponding to peak plant growth and forage availability. The winter aspect was much less pronounced due to the cessation of vegetation growth, partial loss of vegetation cover, and reduced accessibility under persistent snow cover and ice crusts.
Several species exhibited broad seasonal occurrence, including Bassia prostrata, Artemisia spp., Atriplex cana, which retained forage importance across multiple seasons. In contrast, some species were restricted to specific phenological periods, forming seasonal forage complexes.
Year-round forage species were relatively few but played an important role in maintaining forage availability during unfavorable periods of the year (Bassia prostrata, Anabasis salsa, Atriplex cana, Artemisia lercheana, A. schrenkiana, A. pauciflora).
The life form spectrum of forage plants (Figure 9A) was characterized by a pronounced predominance of hemicryptophytes (43.3%) (Festuca valesiaca, Stipa sareptana, Artemisia lerchiana, Galatella tatarica), and therophytes (31.6%) (Atriplex tatarica, Ceratocarpus arenarius, Lepidium perfoliatum, Descurainia sophia). Chamaephytes accounted for 21.7% (Bassia prostrata, Anabasis salsa, Atriplex cana, Camphorosma monspeliaca), whereas geophytes and phanerophytes were represented by only one species each (1.7%) (Poa bulbosa and Spiraea hypericifolia).
Figure 9.
Life-form spectrum (A) and ecological structure (B) of forage species.
The predominance of hemicryptophytes indicates the significant role of perennial herbaceous plants that are resistant to grazing pressure and unfavorable environmental conditions, a pattern characteristic of steppe ecosystems. The high proportion of therophytes reflects the flora’s adaptation to short periods of moisture availability and pronounced climate seasonality.
Chamaephytes play an important role in the formation of a stable vegetation cover under conditions of soil salinity and wind erosion. Geophytes and phanerophytes have little involvement and do not affect the structure of the forage structure.
Ecological analysis showed that the composition of forage plants is dominated by xerophytes (40%) (Bassia prostrata, Festuca valesiaca, Stipa sareptana, Artemisia lercheana). Halophytes accounted for 28.3% (Anabasis salsa, Atriplex cana, Halocnemum strobilaceum, Limonium gmelini), while mesoxerophytes comprised 30% (Galatella tatarica, Convolvulus arvensis, Sibbaldianthe bifurca, Spiraea hypericifolia) (Figure 9B). The proportion of mesophytes is insignificant (1.7%).
The distribution of forage plants reflects habitat conditions characterized by pronounced aridity, high soil salinity, and limited water availability. The predominance of xerophytic and halophytic species indicates a high degree of adaptation of the forage base to extreme environmental conditions.
Analysis of species frequency revealed that most forage species were rare (58.3%), with medium-frequency species accounting for 21.7% and highly frequent species for 20% (Figure 10).
Figure 10.
Frequency distribution of species.
Highly frequent species included Festuca valesiaca, Artemisia austriaca, A. pauciflora, A. lercheana, Galatella villosa, Spiraea hypericifolia and Stipa sareptana. These species form the structural basis of the vegetation cover and play a key role in saiga nutrition.
Medium-frequency species, such as Bassia prostrata, Camphorosma monspeliaca, Tanacetum achilleifolium, Agropyron cristatum and Koeleria pyramidata, have local importance and contribute to seasonal forage complexes. Rare species, including Atriplex tatarica, Pyankovia brachiata, Frankenia hirsuta, Polygonum aviculare and Sibbaldianthe bifurca, play a secondary role and are characterized by restricted distribution.
Species forming the core forage flora (frequency ≥ 30%) are of particular importance. These include Atriplex cana, Artemisia pauciflora, A. austriaca, A. nitrosa, A. lercheana, A. schrenkiana, Galatella villosa, Galatella tatarica, Stipa sareptana, Festuca valesiaca, Limonium gmelinii and Spiraea hypericifolia. These species are characterized by high occurrence frequency, tolerance to environmental stress, substantial forage value, and play a key role in providing forage resources throughout the year. Among them, Festuca valesiaca, species of the genus Artemisia (Artemisia lercheana, A. austriaca, and A. pauciflora), and species of the genus Stipa (Stipa sareptana and S. lessingiana) are particularly important, providing the basis of the forage base during much of the annual cycle.
4. Discussion
4.1. Spatial Heterogeneity of Rangeland Ecosystems and Forage Resources
The rangeland ecosystems of the Korgalzhyn State Nature Reserve are characterized by pronounced spatial heterogeneity due to a combination of dry-steppe, halophytic, meadow, marsh, and coastal aquatic plant communities. This mosaic structure determines the distribution of forage resources and creates habitats that differ in productivity and accessibility for saiga. Dry-steppe communities dominate the Reserve, whereas meadow and halophytic habitats create local zones of increased forage availability. Wetland complexes and lake systems form natural spatial barriers that influence the seasonal redistribution and concentration of animals within the Reserve.
The obtained results indicate that the forage value of rangelands depends not only on aboveground phytomass production but also on floristic composition. Communities with moderate productivity may have a high forage value due to the predominance of plant species preferred by saiga. In contrast, highly productive marsh communities are used only to a limited extent. This finding highlights the importance of integrated assessments of rangeland resources that account for vegetation cover structure and quantitative biomass characteristics.
Particularly important for the formation of the forage base are sagebrush and halophytic communities dominated by species of the genera Artemisia, Atriplex, Bassia, and Halocnemum in combination with steppe grass such as Stipa and Festuca. Despite soil salinity and the relatively low productivity of some habitats, these communities provide a stable forage resource throughout much of the year because dwarf semi-shrubs retain aboveground biomass during drought periods and throughout winter. This pattern reflects the saiga’s adaptation to arid and saline steppe ecosystems.
4.2. Seasonal Use of Rangeland and Carrying Capacity of Saiga Habitats
According to observations conducted by Reserve staff, saiga occur within the Reserve throughout the year, although their abundance varies depending on season and weather conditions. During 2021–2025, the number of animals recorded within the Reserve ranged from 2345 to 6000 individuals in winter to 16,544 to 40,000 individuals during the spring–summer period. During severe winters characterized by deep snow cover and ice-crust formation, part of the population migrates beyond the Reserve boundaries and returns in spring following snowmelt and the appearance of snow-free patches. The most stable concentrations of animals are associated with the central part of the Reserve and the western shore of Lake Tengiz, where fescue, feather grass, sagebrush, saltwort, and halophytic communities are widespread. The main factors supporting the presence of saiga within the Reserve include low anthropogenic disturbance, protective conditions and high spatial heterogeneity of rangelands.
The carrying-capacity estimates obtained in this study represent the theoretical forage-supported potential of the territory rather than the actual number of animals. They indicate the maximum number of individuals that could potentially be supported by the available forage resources under the assumed forage-utilization coefficient. The model does not account for seasonal migrations, hydrological conditions, the spatial inaccessibility of certain forage resources, snow depth, ice-crust formation, uneven grazing, stress-related effects, and trampling impacts. Consequently, the calculated values should not be interpreted as recommendations regarding permissible population size.
The apparent discrepancy between the theoretical carrying-capacity estimate (363,033 individuals under the reference scenario) and the observed seasonal abundance of saiga within the Reserve (2345–6000 individuals in winter and 16,544–40,000 individuals in spring–summer during 2021–2025) does not indicate an overestimation of carrying capacity. The maximum observed spring–summer abundance therefore represents approximately 11% of the theoretical carrying capacity estimated under the reference scenario. Rather, it reflects the fact that the Korgalzhyn State Nature Reserve represents only a seasonal part of the much larger Betpak-Dala saiga range, and only a fraction of the population occupies the Reserve at any given time. In addition, available forage resources are only partially utilized at any given time because saiga are unevenly distributed across the Reserve according to migratory behavior, breeding areas, watering sites, and habitat preferences rather than occupying all suitable rangelands simultaneously. This discrepancy therefore reflects ecological patterns of habitat use rather than overestimation of the forage resources available within the Reserve.
According to the literature data (Section 2.5), forage utilization coefficients reported for arid and semi-arid rangelands typically range from 30% to 55%, reflecting both natural heterogeneity of rangeland ecosystems and differences among methodological approaches used to estimate available forage biomass. In the present study, the coefficient U = 0.45 was adopted as the reference utilization coefficient. Continued growth of the saiga population may increase grazing pressure and reduce the proportion of phytomass that can be sustainably utilized, thereby shifting the appropriate management scenario toward lower values of the forage utilization coefficient (U). A sensitivity analysis demonstrated that carrying-capacity estimates are strongly influenced by the assumed values of the forage utilization coefficient (U) and daily forage intake parameter (K). Across the evaluated parameter combinations, annual carrying-capacity estimates ranged from approximately 201,684 to 1.39 million individuals, whereas the reference scenario (U = 0.45; K = 2.5 kg/day) yielded an estimate of 363,033 individuals. These findings confirm that the reported carrying-capacity estimate is highly sensitive to assumptions regarding forage utilization and daily forage intake. Accordingly, it should be interpreted as a scenario-dependent estimate rather than as a fixed ecological threshold or recommended population size.
4.3. Climate Variability, Remote Sensing, and Machine Learning Approaches
According to data from Kazhydromet, climatic conditions in 2025 were characterized by positive temperature anomalies and relatively favorable moisture conditions during spring. Mean monthly air temperatures reached −3.8 °C in March (+2.0 °C above the climatic norm), 11.1 °C in April (+4.1 °C), and 17.7 °C in May (+2.7 °C). May was the wettest month, with 47.1 mm of precipitation (150% of the climatic norm). The calculated Selyaninov Hydrothermal Coefficient (HTC ≈ 0.5) corresponded to arid conditions and indicated a substantial moisture deficit during the growing season [10,14]. Such conditions contributed to the early vegetation development and increased rangeland productivity during the initial stages of the growing season.
As demonstrated in previous studies, rangeland productivity in arid ecosystems exhibits substantial interannual variability, driven by the amount and seasonal distribution of precipitation [62]. Even with similar annual precipitation totals, productivity may differ considerably depending on the timing of humidification and soil hydrological conditions. The use of satellite data for a single year may lead to either overestimation or underestimation of forage resources. In this context, the use of a multi-year archive of satellite images for 2015–2025 is an important strength of the present study, as it reduces the influence of short-term climatic anomalies and provides more stable estimates of rangeland productivity.
The field-based comparison showed that 63.6% of the clipping-plot measurements were within the mapped summer yield ranges. This moderate agreement can be partly explained by differences in both the observation period and the climatic conditions represented by the two datasets. The mapped summer yield was derived from Sentinel-2 mosaics for 1–15 June averaged over 2015–2025, whereas field biomass was measured between 21 and 30 July 2025, after approximately six additional weeks of seasonal vegetation development. Moreover, 2025 was characterized by above-normal spring temperatures, high precipitation in May, and a precipitation deficit in July, which may have altered the timing of biomass accumulation and senescence relative to the multi-year average. Therefore, deviations at individual plots may reflect phenological changes between early June and late July, the climatic specificity of 2025, and local vegetation heterogeneity, in addition to uncertainty in the mapped estimates.
Previous studies have shown that aboveground biomass estimation in grassland ecosystems is strongly influenced by moisture conditions and canopy structure, particularly in semi-arid environments [72,73]. Traditional vegetation indices such as NDVI may exhibit saturation effects under dense vegetation cover, whereas indices sensitive to soil background and moisture conditions often provide more stable biomass estimates [73]. This is especially relevant for the heterogeneous rangeland systems of the Korgalzhyn Reserve, where dry-steppe, halophytic, meadow, and wetland communities coexist within a relatively small area.
The application of ensemble machine learning algorithms, including Random Forest (RF) and Gradient Boosted Decision Trees (GBDT), improved the robustness of biomass modelling and spatial extrapolation. Arid steppe ecosystems are characterized by complex non-linear relationships among biomass, spectral indices, soil background, and moisture availability, which limit the applicability of simple regression approaches. Ensemble methods reduce overfitting and improve model generalization by combining multiple decision trees and averaging their outputs [74,75]. In addition, gradient boosting algorithms can capture complex interactions among spectral, topographic, and climatic variables and often demonstrate higher predictive accuracy in biomass estimation tasks [76,77]. The use of these approaches has likely improved the stability of productivity estimates across environmentally heterogeneous dry-steppe, halophytic, meadow, and wetland communities within the Reserve.
The expansion of the calibration dataset beyond the Reserve boundaries should be regarded as a methodological approach to reduce model uncertainty and improve its applicability to similar rangeland landscapes. All final calculations of forage resources and carrying capacity were performed within the territory of the Korgalzhyn State Nature Reserve.
The Kazakhstan Rangeland Map used as the reference dataset was developed between 2016 and 2018, resulting in substantial temporal overlap with the 2015–2025 Sentinel-2 archive used in this study. Although some temporal differences may still contribute to uncertainty, the coarse spatial resolution (1:1,500,000) of the reference map may introduce local uncertainty into biomass estimates.
4.4. Study Limitations and Future Research Directions
Despite the use of multi-year satellite archives and an expanded calibration dataset, estimates of rangeland productivity and carrying capacity remain uncertain. In addition, no alternative spatially continuous dataset containing seasonal biomass information was available for the study area. Consequently, the Kazakhstan Rangeland Map was the only suitable reference dataset for model training, although its coarse spatial resolution may have introduced local uncertainty into biomass estimates. This uncertainty is associated with the high interannual variability in vegetation cover in arid steppe ecosystems, the pronounced spatial heterogeneity of rangeland communities, and the limited information available on saiga’s actual spatial use of the territory. An additional source of uncertainty is the dynamic nature of saiga migrations and seasonal redistribution patterns, which are difficult to incorporate into static carrying-capacity models fully. Under these conditions, integrating remote sensing data, GPS tracking data, and long-term field observations represents the most promising approach to improving assessments of the spatiotemporal dynamics of forage resources and saiga habitat use.
An additional limitation of this study is that the rangeland map was developed using expert visual interpretation supported by field geobotanical observations acquired during the mapping process. Consequently, the same field observations contributed to map compilation and were not available as an independent validation dataset. Therefore, quantitative classification accuracy metrics (e.g., confusion matrix or kappa statistic) were not calculated. Future studies should include an independent validation dataset to provide a formal assessment of thematic map accuracy.
Winter biomass estimates also remain uncertain because quantitative data on the relative contribution of dominant species to aboveground biomass were unavailable. Therefore, principal dominant species within each community and component communities within complex rangeland types were assigned equal weights when calculating the overall winter biomass retention coefficients. Future studies should combine direct winter biomass measurements with quantitative estimates of species contributions to community biomass.
The sensitivity analysis presented in this study evaluates the influence of alternative assumptions concerning the forage utilization coefficient (U) and daily forage intake parameter (K) on estimated carrying capacity but does not represent a probabilistic uncertainty analysis or statistical confidence interval. Both parameters were assumed to remain spatially and temporally constant, although they may vary among seasons, vegetation types, climatic conditions, population densities, and animal physiological states. Future studies should derive locally calibrated, season-specific values of U and K and incorporate their spatial variability into carrying-capacity assessments.
The clipping-plot measurements demonstrated that within-site variability in aboveground biomass differed substantially among sampling sites (Supplementary Table S1), reflecting the naturally heterogeneous structure of dry-steppe and halophytic vegetation. Although three 1 m × 1 m quadrats cannot capture all microsite variability, this sampling design represents a practical compromise between statistical representativeness and field feasibility in large-scale geobotanical surveys. The observed variability therefore primarily reflects natural vegetation heterogeneity rather than methodological inconsistency.
5. Conclusions
This study presents the first spatially explicit assessment of rangeland productivity, forage resources, and the potential carrying capacity of saiga (S. tatarica) habitats within the Korgalzhyn State Nature Reserve. The results demonstrate that the forage base of the Reserve is characterized by pronounced spatial heterogeneity and is determined by both the quantity of aboveground phytomass and the floristic composition of rangeland communities.
The forage resources are primarily derived from dry-steppe rangelands dominated by feather grass, fescue, and sagebrush communities, while halophytic communities provide additional forage stability under arid climatic conditions and saline soils. The most important forage species belong to the genera Festuca, Stipa, Artemisia, Atriplex and Bassia, which help maintain forage availability throughout the year.
The total annual forage reserve of rangeland types 1–15 was estimated at 3,826,398.3 centners, with an average specific value of 10.5 c/ha. After excluding tall-grass meadow and marsh communities that are not utilized by saiga as feeding habitats, the total annual forage reserve amounted to 3,308,921.2 centners, with an average specific value of 10.4 c/ha. Under the reference scenario (U = 0.45; K = 2.5 kg/day), the potential annual carrying capacity of the study area was estimated at 363,033 saiga individuals, and the carrying capacity for the spring–summer period at 375,965 individuals. Sensitivity analysis confirmed that carrying-capacity estimates are highly sensitive to the assumed values of the forage utilization coefficient (U) and daily forage intake parameter (K). Accordingly, the reported values should be interpreted as scenario-dependent estimates of the territory’s theoretical forage potential rather than as actual population size, fixed ecological thresholds, or direct recommendations for permissible stocking levels.
The integration of multi-year Sentinel-2 satellite data (2015–2025), field measurements of aboveground phytomass, and ensemble machine learning algorithms (Random Forest and Gradient Boosted Decision Trees) improved the robustness of spatial productivity extrapolation under conditions of highly heterogeneous vegetation cover. The results retain a certain degree of uncertainty associated with interannual climatic variability, seasonal saiga migrations, patterns of rangeland utilization and the spatial accessibility of forage resources.
Overall, the findings demonstrate the potential of integrating remote sensing, field observations, and spatial modelling approaches for assessing forage resources and the potential carrying capacity of saiga habitats in arid steppe ecosystems characterized by high interannual climatic variability.
Supplementary Materials
The following supporting information can be downloaded at: https://www.mdpi.com/article/10.3390/land15081433/s1, Table S1: Quadrat-level air-dry aboveground biomass measurements and descriptive statistics for the clipping plots; Table S2: Comparison of measured summer aboveground biomass at clipping plots with mapped summer yield estimates for the corresponding rangeland types; Table S3: List of forage plant species and their contribution; Table S4: List of spectral indices used in the current paper; Table S5. Calculation of winter biomass retention coefficients and estimated winter yield for mapped rangeland types based on dominant species according to the national geobotanical survey methodology; Table S6: Sensitivity of the estimated annual carrying capacity to alternative forage utilization coefficients (U) and daily forage intake rates (K); Table S7: Climatic parameters in 2025 and deviations from climatic normals (mean values from four meteorological stations).
Author Contributions
Conceptualization, A.I. and D.M.; methodology, A.I., D.M. and L.D.; validation, A.I., D.M., Z.S., G.Y. and R.I.; formal analysis, A.I., D.M., L.D., B.O., V.P. and A.C.; investigation, A.I., D.M., Z.S., B.O., G.Y., A.C., A.B. and R.I.; writing—original draft, A.I., D.M., L.D., B.O., A.C., G.Y. and V.P.; writing—review and editing, A.I., L.D. and Z.S.; visualization, A.I., D.M., A.B., Z.S., A.C. and B.O.; supervision, A.I.; project administration, A.I.; funding acquisition, A.I. All authors have read and agreed to the published version of the manuscript.
Funding
This research was funded by the Forestry and Wildlife Committee Ministry of Ecology and Natural Resources of the Republic of Kazakhstan (Grant No. BR23591114) “Development of a system for sustainable use of the Betpak-Dala and Ustyurt saiga populations”.
Data Availability Statement
The original contributions presented in this study are included in the article/Supplementary Materials. Further inquiries can be directed to the corresponding author.
Acknowledgments
The authors gratefully acknowledge the staff of the Korgalzhyn State Nature Reserve for their assistance during field surveys and for providing valuable information on the seasonal occurrence and abundance of saiga populations within the Reserve. The authors used ChatGPT 5.5 (OpenAI, San Francisco, CA, USA) and Grammarly (https://app.grammarly.com, 3 August 2026) for language editing, translation, stylistic refinement of this manuscript, and assistance in developing literature search strategies. All cited references were independently selected, verified against sources, and critically evaluated by the authors, who take full responsibility for the final content of this manuscript.
Conflicts of Interest
The authors declare no conflicts of interest.
References
- The IUCN Red List of Threatened Species: Saiga tatarica—Published in 2023. Available online: https://www.iucnredlist.org/species/19832/233712210 (accessed on 14 March 2026).
- Record Saiga Numbers in Kazakhstan and the Need to Regulate the Population. In Saiga News; 2025; p. 10. Available online: https://www.saigaresourcecentre.com/sites/default/files/2025-12/saiga_news-31_en_web.pdf (accessed on 23 April 2026).
- Meshesha, D.T.; Mohammed, M.; Yosuf, D. Estimating carrying capacity and stocking rates of rangelands in Harshin District, Eastern Somali Region, Ethiopia. Ecol. Evol. 2019, 9, 13309–13319. [Google Scholar] [CrossRef] [Scilit] [PubMed]
- On Approval of the List of Specially Protected Natural Areas of Republican Significance. Resolution of the Government of the Republic of Kazakhstan No. 593 of 26 September 2017. Available online: https://adilet.zan.kz/rus/docs/P1700000593 (accessed on 23 April 2026).
- Korgalzhyn State Nature Reserve. General Information. Available online: https://korgalzhynkorygy.kz/o-zapovednike/obshhie-svedeniya/ (accessed on 26 July 2026).
- Ramsar Sites Information Service (RSIS). Kourgaldzhin and Tengiz Lakes (Site No. 107). Available online: https://rsis.ramsar.org/ris/107?language=en (accessed on 24 July 2026).
- Biosphere Reserve Korgalzhyn. Kazakhstan National Committee of the UNESCO Programme “Man and the Biosphere” (MAB). Available online: https://www.kazmab.kz/index.php/biosfernye-rezervaty1/natsionalnaya-set/korgalzhyn/opisanie (accessed on 23 June 2026).
- Burlibaev, M.Z.; Kurochkina, L.Y.; Kashcheev, V.A.; Erokhov, S.N.; Ivashchenko, A.A. (Eds.) Globally Significant Wetlands of Kazakhstan; The Teniz-Korgalzhyn Lake System: Astana, Kazakhstan, 2007; Volume 2. [Google Scholar]
- Aubekerov, B.K. Geomorphology and Modern Landscapes of Kazakhstan; Kazakh University: Almaty, Kazakhstan, 2010. [Google Scholar]
- Lavrenko, E.M. Steppes of Eurasia; Nauka: Leningrad, Union of Soviet Socialist Republics, 1991. [Google Scholar]
- Medeu, A.R. Climate and Water Resources of Kazakhstan; Kazhydromet: Almaty, Kazakhstan, 2015; 280p. [Google Scholar]
- Intergovernmental Panel on Climate Change. Climate Change 2021: The Physical Science Basis; Cambridge University Press: Cambridge, UK, 2021. [Google Scholar]
- Alisov, B.P. Climate of the Union of Soviet Socialist Republics; Moscow State University Press: Moscow, Union of Soviet Socialist Republics, 1974. [Google Scholar]
- Baisholanov, K.T. Agroclimatic Resources of Kazakhstan; Kazhydromet: Almaty, Kazakhstan, 2009. [Google Scholar]
- Kottek, M.; Grieser, J.; Beck, C.; Rudolf, B.; Rubel, F. World Map of the Köppen–Geiger climate classification updated. Meteorol. Z. 2006, 15, 259–263. [Google Scholar] [CrossRef] [Scilit] [PubMed]
- Kazhydromet. Climate Database. Available online: http://ecodata.kz:3838/dm_climat_ru (accessed on 11 April 2026).
- Tyurin, I.V.; Gerasimov, I.P.; Ivanova, E.N.; Nosin, V.A. (Eds.) Soil Survey: Guidelines for Field Investigations and Soil Mapping; Academy of Sciences of the Union of Soviet Socialist Republics: Moscow, Union of Soviet Socialist Republics, 1959. [Google Scholar]
- Lavrenko, E.M.; Korchagina, A.A. (Eds.) Field Geobotany; Nauka: Moscow, Union of Soviet Socialist Republics, 1964; Volume 3. [Google Scholar]
- Bykov, B.A. Geobotany, 3rd ed.; Nauka: Alma-Ata, Kazakhstan, 1978. [Google Scholar]
- Sochava, V.B. Vegetation Cover in Thematic Maps; Nauka: Novosibirsk, Union of Soviet Socialist Republics, 1979. [Google Scholar]
- Berlyant, A.M. Geoinformational Mapping; Moscow State University: Moscow, Union of Soviet Socialist Republics, 1997. [Google Scholar]
- Shishov, L.L.; Tonkonogov, V.D.; Lebedeva, I.I.; Gerasimova, M.I. Classification and Diagnostics of Soils of Russia; Oykumena: Smolensk, Russia, 2004. [Google Scholar]
- Gunin, P.D.; Vostokova, E.A. (Eds.) Methodological recommendations for assessing and mapping of the current state of ecosystems of the Mongolian People’s Republic; Main Administration of Geodesy and Cartography of the Mongolian People’s Republic: Ulaanbaatar, Mongolia, 1989. [Google Scholar]
- Rachkovskaya, E.I.; Ogar, N.P.; Marynich, O.V. Factors of anthropogenic transformation and their influence on the vegetation of Kazakhstan steppes. Steppe Bull. 1999, 5, 22–25. [Google Scholar]
- KRILFP Pasture Resources Map. Available online: http://kazniizhik-pastures.kz/Maps/FodderResources#map=5/7447496.57/6226471.78/0 (accessed on 11 April 2026).
- Sultanova, B.M.; Baibulov, A.B. The current state of virgin and fallow field vegetation of the experimental farm of the A.I. Baraev Kazakh Research Institute of Grain Farming, Akmola Region. In Proceedings of the Botanical Research in Kazakhstan: Proceedings of the 2nd International Youth Botanical Conference, Almaty, Kazakhstan, 8–10 April 2003; pp. 17–20. [Google Scholar]
- Baibulov, A.B. Vegetation of fallow monitoring sites in the area of the Korgalzhyn Nature Reserve (Akmola Region, Kazakhstan). In Proceedings of the Current Issues of Modern Biology and Biotechnology: Proceedings of the 58th Scientific Conference of Young Scientists and Students, Almaty, Kazakhstan, 12–16 April 2004; p. 12. [Google Scholar]
- Baibulov, A.B.; Shparfov, A.; Akhmetov, A.T.; Erokhina, O.G.; Kubakova, K.E.; Sidorova, T.V. Integrated ecosystem studies of the Tengiz–Korgalzhyn lake system. Terra 2006, 1, 145–150. [Google Scholar]
- Baibulov, A.B.; Shparfov, A.; Akhmetov, A.T.; Erokhina, O.G.; Kubakova, K.E. Patterns of the spatial structure of vegetation in the Tengiz-Korgalzhyn Depression. In Proceedings of the International Scientific Conference “Biodiversity of Asian Steppes”, Kostanay, Kazakhstan, 3–4 April 2007; pp. 21–23. [Google Scholar]
- Drude, O. Die Ökologie der Pflanzen; Vieweg: Braunschweig, Germany, 1913. [Google Scholar]
- Raunkiaer, C. Statistik der Lebensformen als Grundlage für die biologische Pflanzengeographie. Beih. Zum Bot. Zentralblatt. 1910, 27, 171–206. [Google Scholar]
- Pavlov, N.V. (Ed.) Flora of Kazakhstan; Publishing House of the Academy of Sciences of the Kazakh SSR: Alma-Ata, Kazakhstan, 1956; Volume 1. [Google Scholar]
- Pavlov, N.V. (Ed.) Flora of Kazakhstan; Publishing House of the Academy of Sciences of the Kazakh SSR: Alma-Ata, Kazakhstan, 1958; Volume 2. [Google Scholar]
- Pavlov, N.V. (Ed.) Flora of Kazakhstan; Publishing House of the Academy of Sciences of the Kazakh SSR: Alma-Ata, Kazakhstan, 1960; Volume 3. [Google Scholar]
- Pavlov, N.V. (Ed.) Flora of Kazakhstan; Publishing House of the Academy of Sciences of the Kazakh SSR: Alma-Ata, Kazakhstan, 1961; Volume 4–5. [Google Scholar]
- Pavlov, N.V. (Ed.) Flora of Kazakhstan; Publishing House of the Academy of Sciences of the Kazakh SSR: Alma-Ata, Kazakhstan, 1963; Volume 6. [Google Scholar]
- Pavlov, N.V. (Ed.) Flora of Kazakhstan; Publishing House of the Academy of Sciences of the Kazakh SSR: Alma-Ata, Kazakhstan, 1964; Volume 7. [Google Scholar]
- Pavlov, N.V. (Ed.) Flora of Kazakhstan; Nauka: Alma-Ata, Kazakhstan, 1965; Volume 8. [Google Scholar]
- Pavlov, N.V. (Ed.) Flora of Kazakhstan; Nauka: Alma-Ata, Kazakhstan, 1966; Volume 9. [Google Scholar]
- Goloskokov, V.P. (Ed.) Illustrated Guide for Identification of the Plants of Kazakhstan; Nauka: Alma-Ata, Kazakhstan, 1969; Volume 1. [Google Scholar]
- Goloskokov, V.P. (Ed.) Illustrated Guide for Identification of the Plants of Kazakhstan; Nauka: Alma-Ata, Kazakhstan, 1972; Volume 2. [Google Scholar]
- Royal Botanic Gardens, Kew. Plants of the World Online. Available online: https://powo.science.kew.org/ (accessed on 11 April 2026).
- Ramensky, L.G.; Tsatsenkin, I.A.; Chizhikov, O.N.; Antipin, N.A. Ecological Assessment of Rangelands Based on Vegetation Cover; Selkhozgiz: Moscow, Union of Soviet Socialist Republics, 1956. [Google Scholar]
- Braun, D. Methods of Vegetation Study and Survey; Foreign Literature Publishing House: Moscow, Union of Soviet Socialist Republics, 1957. [Google Scholar]
- Nechaeva, N.T. Methodology for Estimating Forage Reserves on Desert Pastures; Academy of Sciences of the Turkmen SSR: Ashgabat, Union of Soviet Socialist Republics, 1957. [Google Scholar]
- Kurochkina, L.Y.; Osmanova, L.T. Pastures of Sandy Deserts of Kazakhstan; Kainar: Alma-Ata, Kazakhstan, 1973. [Google Scholar]
- Larin, I.V.; Beguchev, P.P.; Rabotnov, T.A.; Leontyeva, I.P. Meadow and Pasture Management; Kolos: Leningrad, Union of Soviet Socialist Republics, 1975. [Google Scholar]
- On approval of the Methodology for Large-Scale (1:1,000–1:100,000) Geobotanical Surveys of Natural Forage Lands of the Republic of Kazakhstan. Order of the Minister of Agriculture of the Republic of Kazakhstan No. 314 of 3 October 2022. Available online: https://adilet.zan.kz/rus/docs/V2200030043 (accessed on 23 June 2026).
- Dimeyeva, L.A.; Salmukhanbetova, Z.K.; Malakhov, D.V.; Wunderlich, J. Rangeland diversity as a forage resource for wild ungulates in the Barsa Kelmes Nature Reserve (Kazakhstan). Appl. Ecol. Environ. Res. 2022, 20, 2931–2962. [Google Scholar] [CrossRef] [Scilit]
- Sokolov, V.E. (Ed.) Saiga: Phylogeny, Systematics, Ecology, Conservation and Use; Printing House of the Russian Academy of Agricultural Sciences: Moscow, Russia, 1998; pp. 122–136. [Google Scholar]
- Abaturov, B.D. Nutrition and Forage Resources of Wild Herbivorous Mammals in Steppe Ecosystems; KMK Scientific Press Ltd.: Moscow, Russia, 2021. [Google Scholar]
- Abaturov, B.D.; Larionov, K.O.; Kolesnikov, M.P.; Nikonova, O.A. Status and forage availability of saiga antelope (Saiga tatarica) on pastures with different vegetation types. J. Zool. 2005, 84, 377–390. [Google Scholar]
- Lebed, L.V. Recommendations for the Organisation of Aerial Photometric Surveys of Agricultural Land in Kazakhstan; Kazhydromet: Almaty, Kazakhstan, 1989; 71p. [Google Scholar]
- Xu, H. Modification of Normalised Difference Water Index (NDWI) to Enhance Open Water Features in Remotely Sensed Imagery. Int. J. Remote Sens. 2006, 27, 3025–3033. [Google Scholar] [CrossRef] [Scilit]
- Frampton, W.J.; Dash, J.; Watmough, G.; Milton, E.J. Evaluating the capabilities of Sentinel-2 for quantitative estimation of biophysical variables in vegetation. ISPRS J. Photogramm. Remote Sens. 2013, 82, 83–92. [Google Scholar] [CrossRef] [Scilit]
- Rouse, J.W., Jr.; Haas, R.H.; Schell, J.A.; Deering, D.W. Monitoring Vegetation Systems in the Great Plains with ERTS. In Proceedings of the Third ERTS Symposium, Washington, DC, USA, 10–14 December 1973; NASA SP-351; U.S. Government Printing Office: Washington, DC, USA, 1974; Volume 1, pp. 309–317. [Google Scholar]
- Gitelson, A.; Merzlyak, M.N. Remote Sensing of Chlorophyll Concentration in Higher Plant Leaves. Adv. Space Res. 1998, 22, 689–692. [Google Scholar] [CrossRef] [Scilit]
- Qi, J.; Chehbouni, A.; Huete, A.R.; Kerr, Y.H.; Sorooshian, S. A Modified Soil-Adjusted Vegetation Index. Remote Sens. Environ. 1994, 48, 119–126. [Google Scholar] [CrossRef] [Scilit]
- Gitelson, A.A.; Gritz, Y.; Merzlyak, M.N. Relationships between Leaf Chlorophyll Content and Spectral Reflectance and Algorithms for Non-Destructive Chlorophyll Assessment in Higher Plant Leaves. J. Plant Physiol. 2003, 160, 271–282. [Google Scholar] [CrossRef] [Scilit] [PubMed]
- Haboudane, D.; Miller, J.R.; Pattey, E.; Zarco-Tejada, P.J.; Strachan, I.B. Hyperspectral Vegetation Indices and Novel Algorithms for Predicting Green LAI of Crop Canopies: Modelling and Validation in the Context of Precision Agriculture. Remote Sens. Environ. 2004, 90, 337–352. [Google Scholar] [CrossRef] [Scilit]
- Daughtry, C.S.T.; Walthall, C.L.; Kim, M.S.; Brown de Colstoun, E.; McMurtrey, J.E. Estimating Corn Leaf Chlorophyll Concentration from Leaf and Canopy Reflectance. Remote Sens. Environ. 2000, 74, 229–239. [Google Scholar] [CrossRef] [Scilit]
- Delegido, J.; Verrelst, J.; Alonso, L.; Moreno, J. Evaluation of Sentinel-2 red-edge bands for empirical estimation of green LAI and chlorophyll content. Sensors 2011, 11, 7063–7081. [Google Scholar] [CrossRef] [Scilit] [PubMed]
- Gao, B.-C. NDWI—A normalized difference water index for remote sensing of vegetation liquid water from space. Remote Sens. Environ. 1996, 58, 257–266. [Google Scholar] [CrossRef] [Scilit]
- Huete, A.R. A soil vegetation adjusted index (SAVI). Remote Sens. Environ. 1988, 25, 295–309. [Google Scholar] [CrossRef] [Scilit]
- USDA Natural Resources Conservation Service. National Range and Pasture Handbook; Part 645, Subpart N—Glossary of Terms; USDA NRCS: Washington, DC, USA, 2022. Available online: https://directives.nrcs.usda.gov/sites/default/files2/1712930399/33928.pdf (accessed on 9 April 2026).
- Hocking, D.; Mattick, A. Dynamic Carrying Capacity Analysis as Tool for Conceptualizing and Planning Range Management Improvements, with a Case Study from India. Available online: http://www.odi.org.uk/networks/pdn/papers/34c.pdf (accessed on 9 April 2026).
- Mugerwa, J.S. Management and utilization of rangeland: The case of Uganda. In Proceedings of the 2nd FAO Regional Workshop on Grazing Resources for East Africa, Kampala, Uganda, 30 March–3 April 1992. [Google Scholar]
- Guevara, J.C.; Estevez, O.R.; Torres, E.R. Utilization of the rain-use efficiency factor for determining potential cattle production in the Mendoza plain, Argentina. J. Arid. Environ. 1996, 33, 347–353. [Google Scholar] [CrossRef] [Scilit]
- Smith, L.; Ruyle, G.; Maynard, J.; Barker, S.; Meyer, W.; Stewart, D.; Coulloudon, B.; Williams, S.; Dyess, J. Principles of Obtaining and Interpreting Utilization Data on Rangelands (AZ1375); The University of Arizona Cooperative Extension: Tucson, AZ, USA, 2007; Available online: https://extension.arizona.edu/sites/extension.arizona.edu/files/pubs/az1375-2016.pdf (accessed on 9 April 2026).
- Fadeyev, V.A.; Ivanov, A.I. Population Size of Saiga in Kazakhstan Depending on Forage Resources. In Ecology and Behavior of Mammals of Kazakhstan; Nauka: Alma-Ata, Kazakhstan, 1988; pp. 37–47. [Google Scholar]
- State Climate Cadastre. Available online: http://ecodata.kz:3838/app_persona/ (accessed on 11 April 2026).
- Eisfelder, C.; Kuenzer, C.; Dech, S. Derivation of biomass information for semi-arid areas using remote-sensing data. Int. J. Remote Sens. 2012, 33, 2937–2984. [Google Scholar] [CrossRef] [Scilit]
- Barrachina, M.; Cristóbal, J.; Tulla, A.F. Estimating above-ground biomass on mountain meadows and pastures through remote sensing. Int. J. Appl. Earth Obs. Geoinf. 2015, 38, 184–192. [Google Scholar] [CrossRef] [Scilit]
- Breiman, L. Random Forests. Mach. Learn. 2001, 45, 5–32. [Google Scholar] [CrossRef] [Scilit]
- Belgiu, M.; Drăguţ, L. Random Forest in remote sensing: A review of applications and future directions. ISPRS J. Photogramm. Remote Sens. 2016, 114, 24–31. [Google Scholar] [CrossRef] [Scilit]
- Friedman, J.H. Greedy Function Approximation: A Gradient Boosting Machine. Ann. Stat. 2001, 29, 1189–1232. Available online: http://www.jstor.org/stable/2699986 (accessed on 11 April 2026). [CrossRef] [Scilit]
- Zhang, Y.; Liu, J.; Shen, W. A Review of Ensemble Learning Algorithms Used in Remote Sensing Applications. Appl. Sci. 2022, 12, 8654. [Google Scholar] [CrossRef] [Scilit]
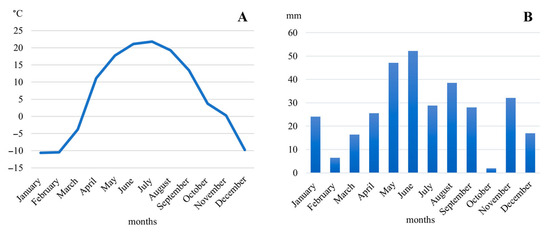
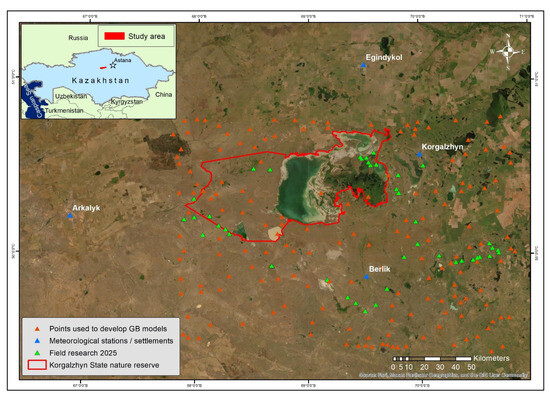
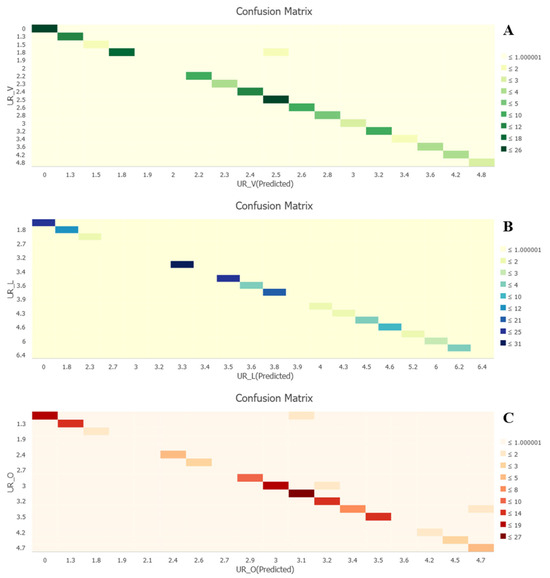
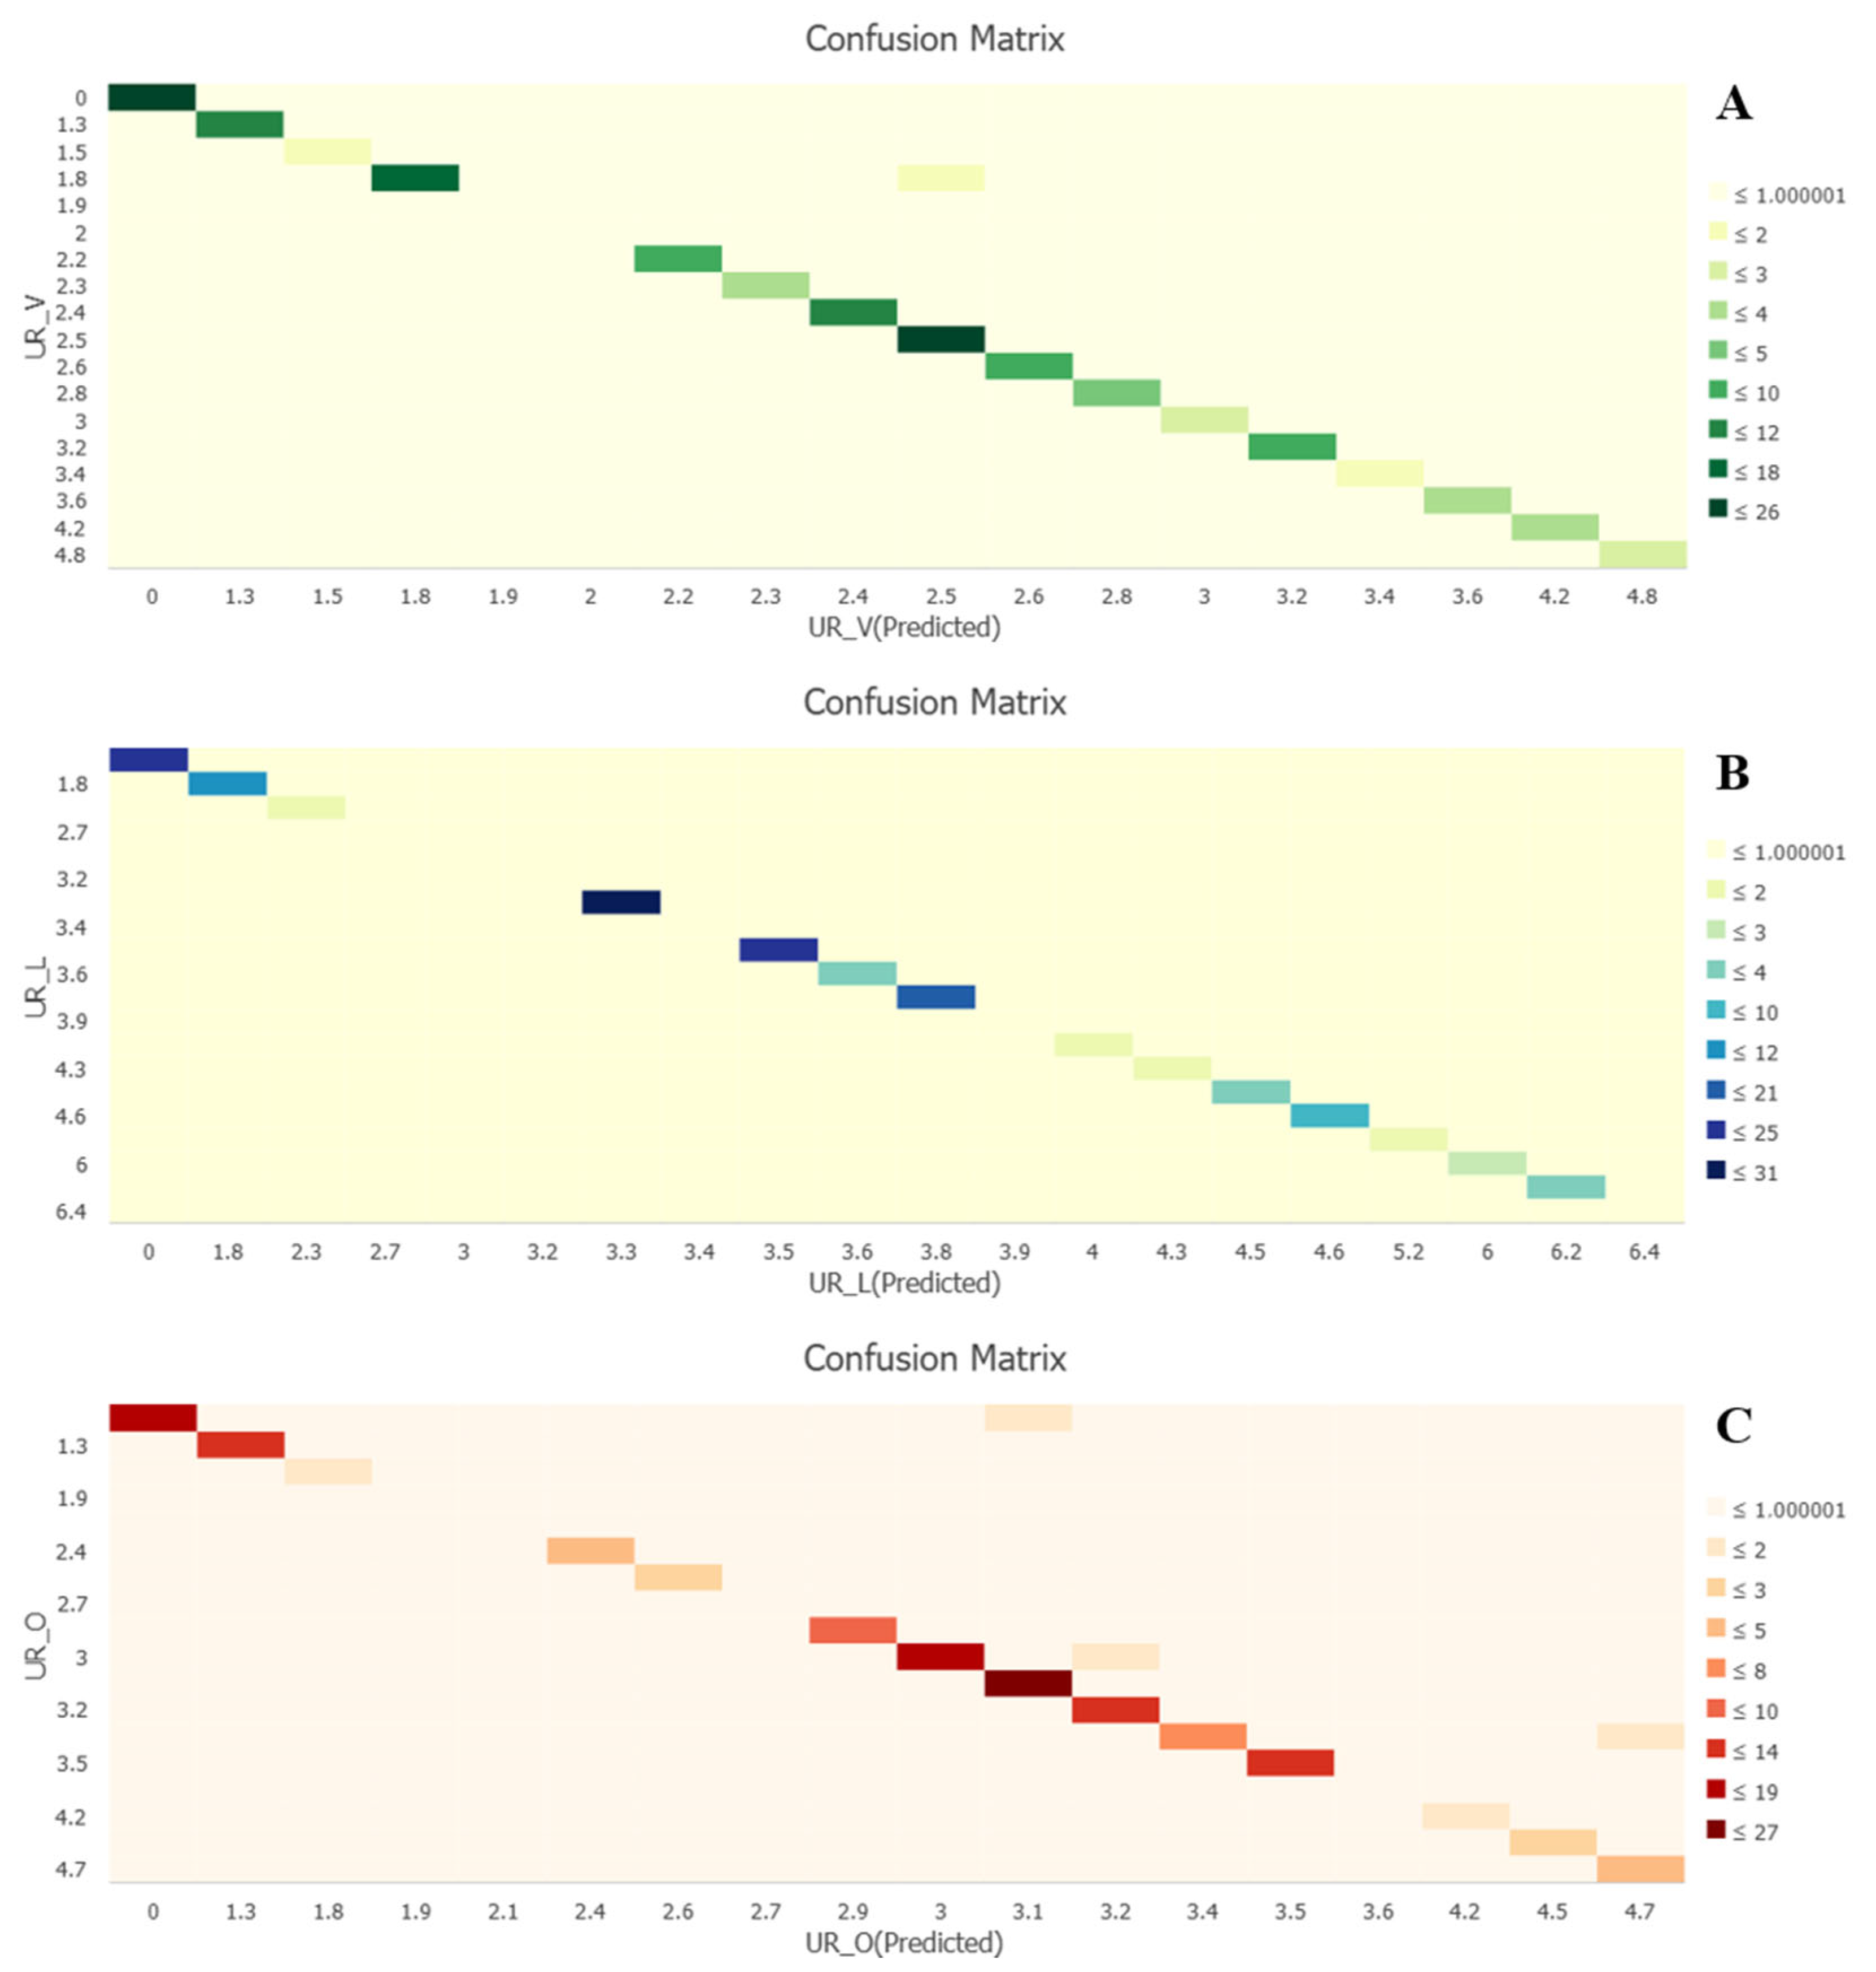
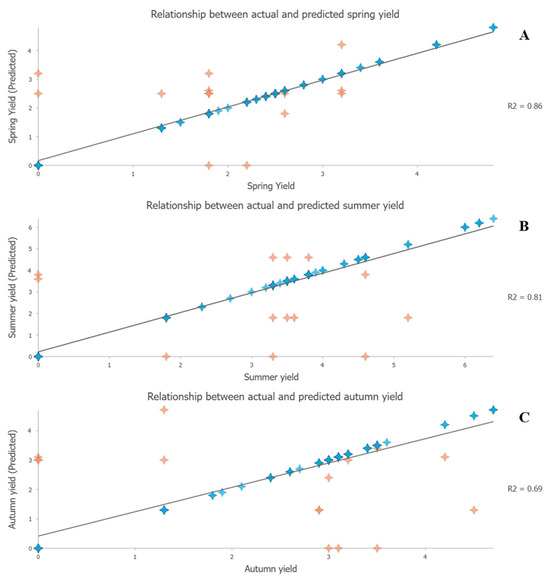
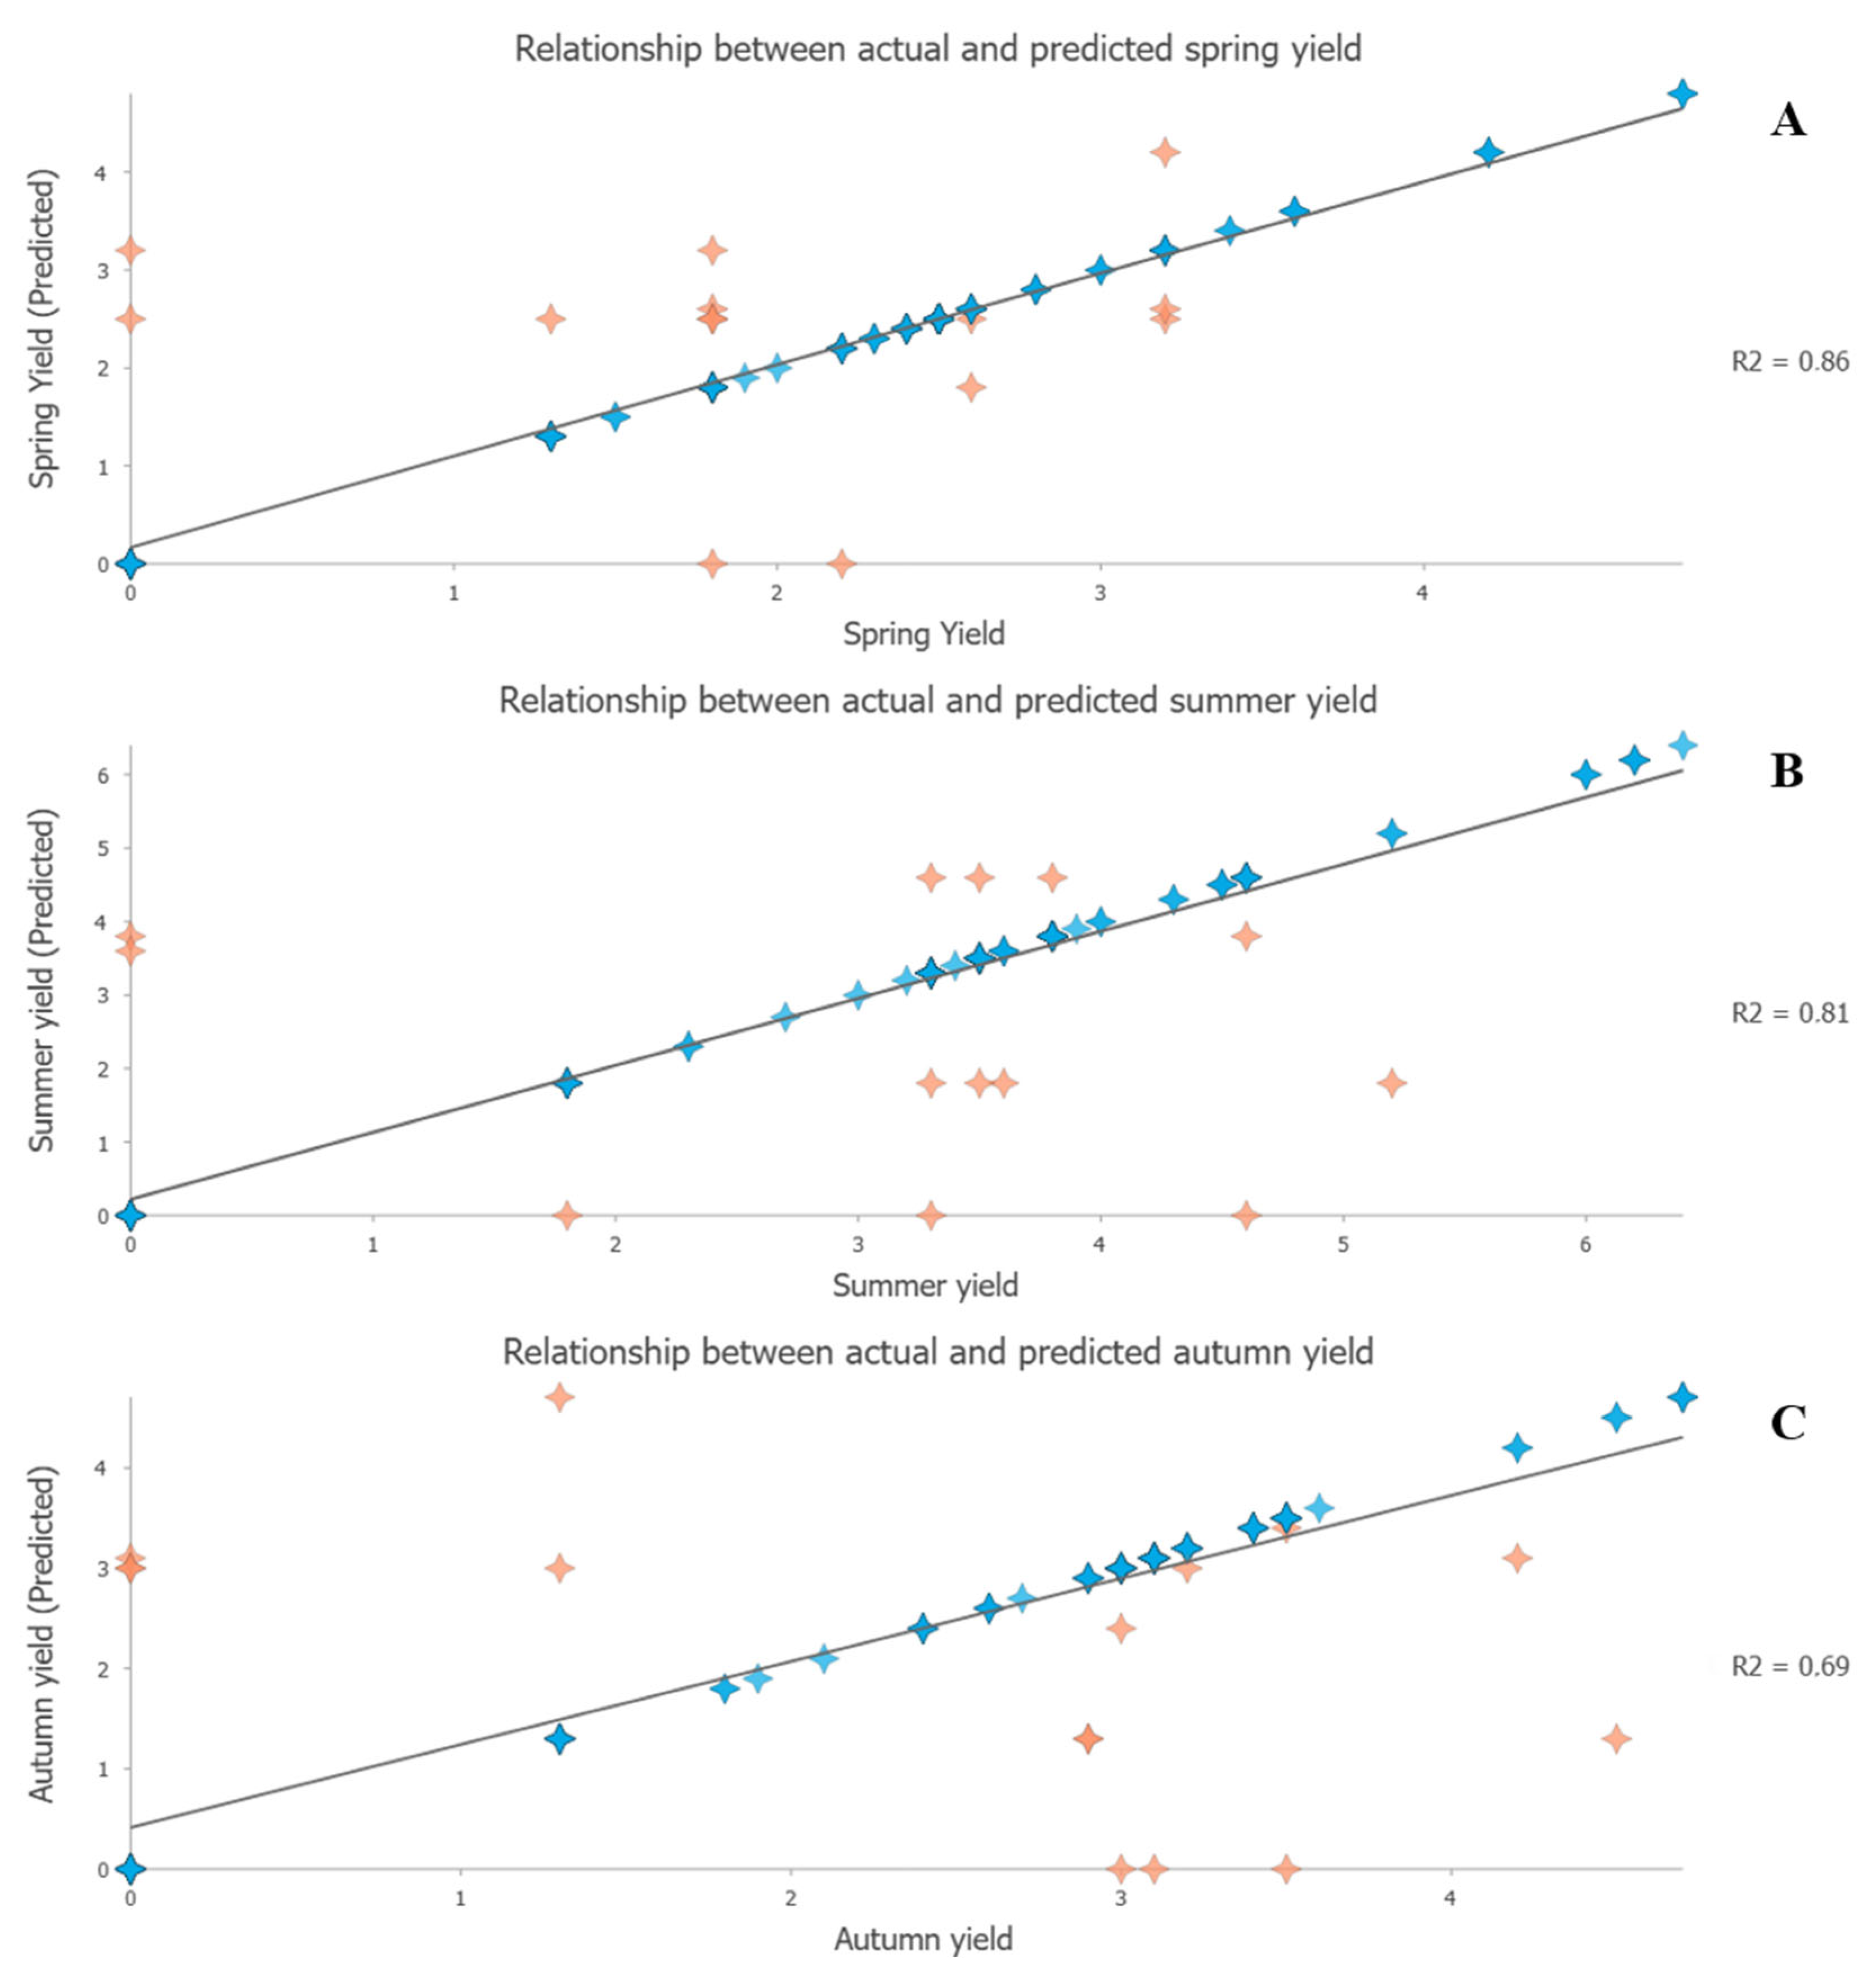
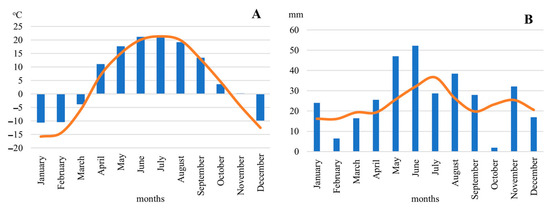
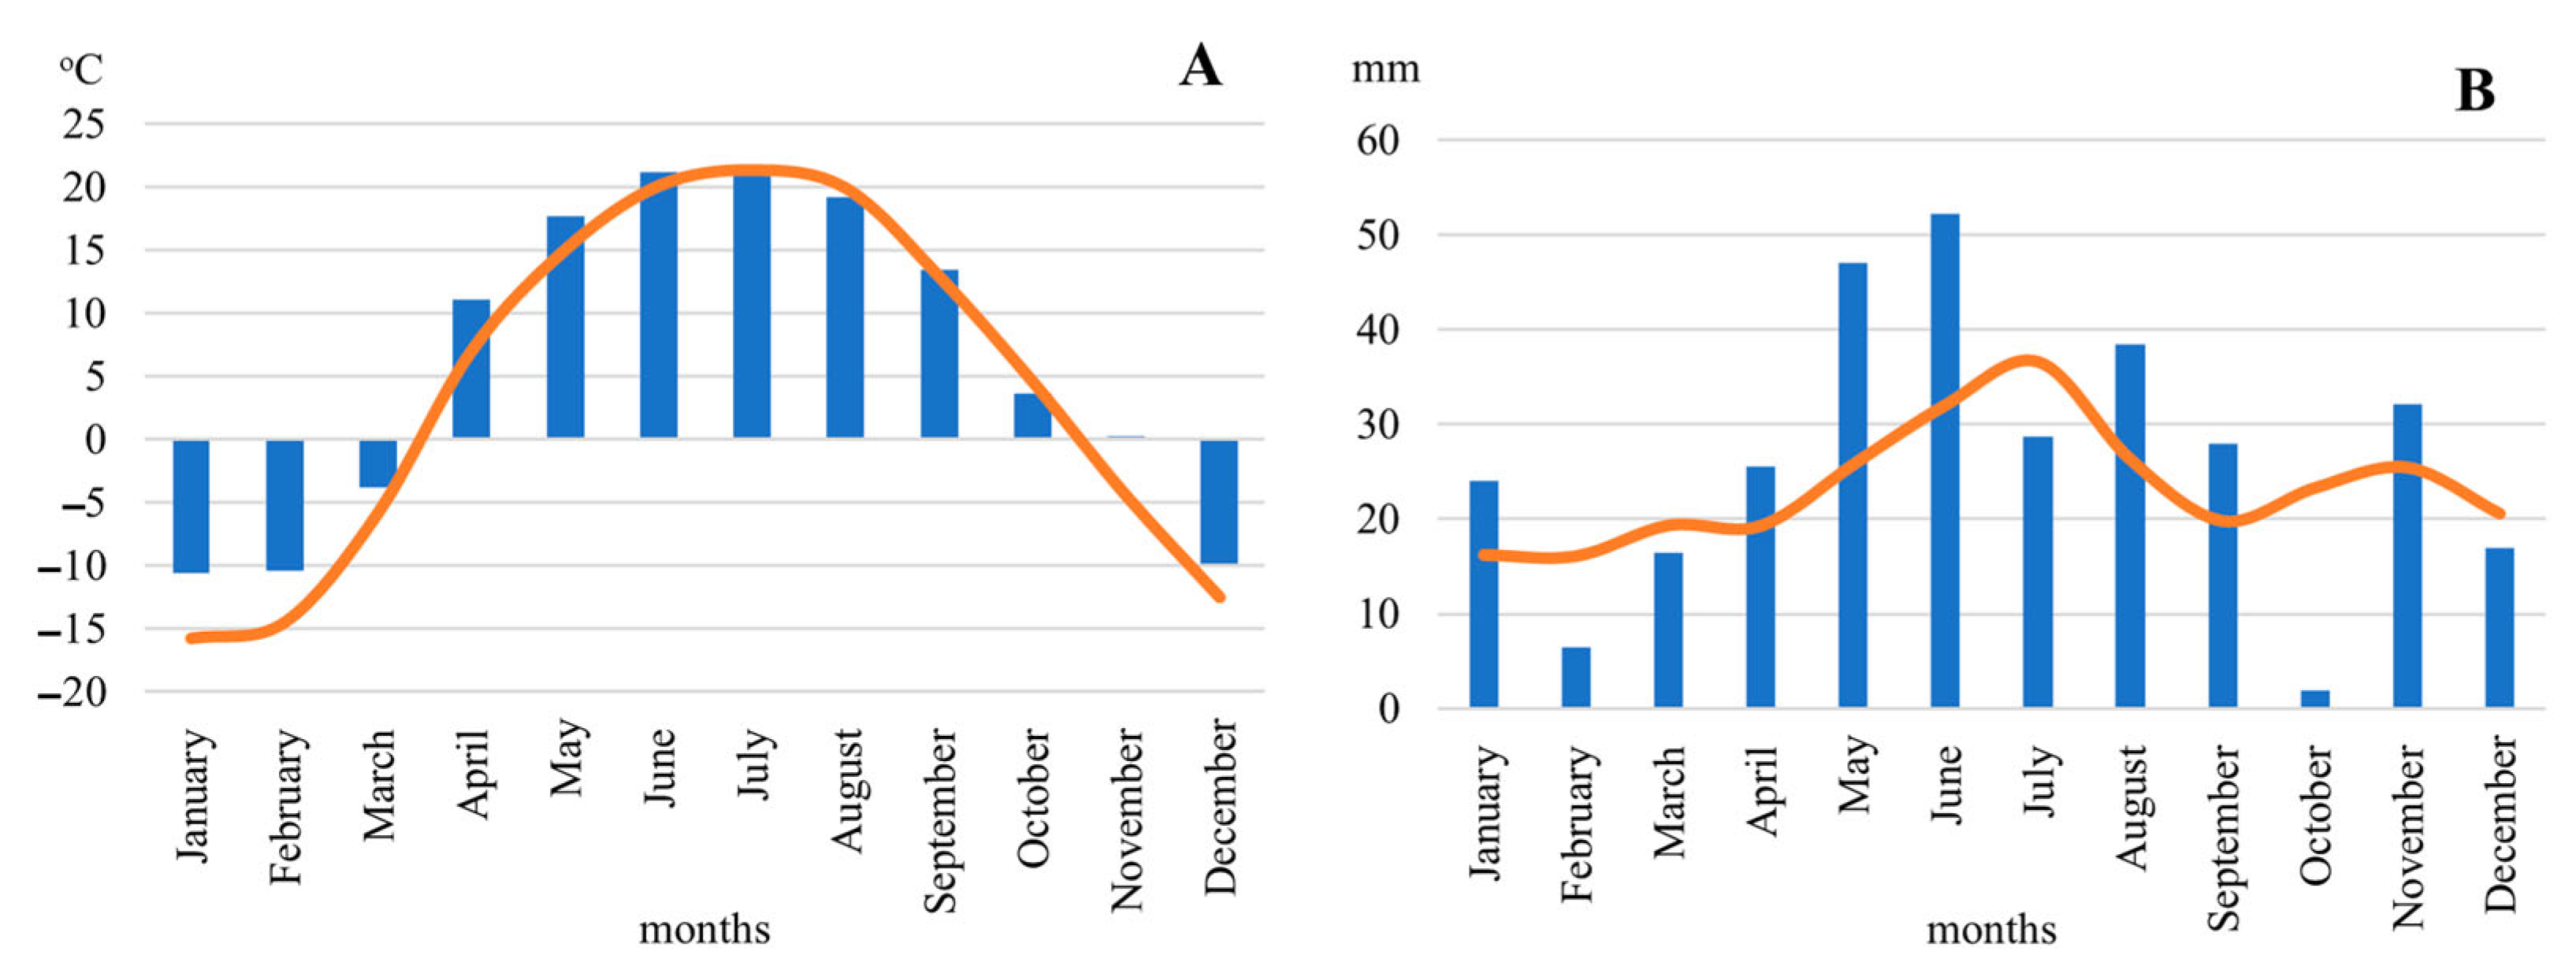
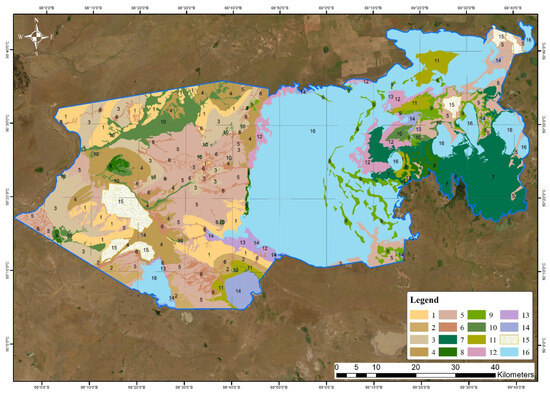
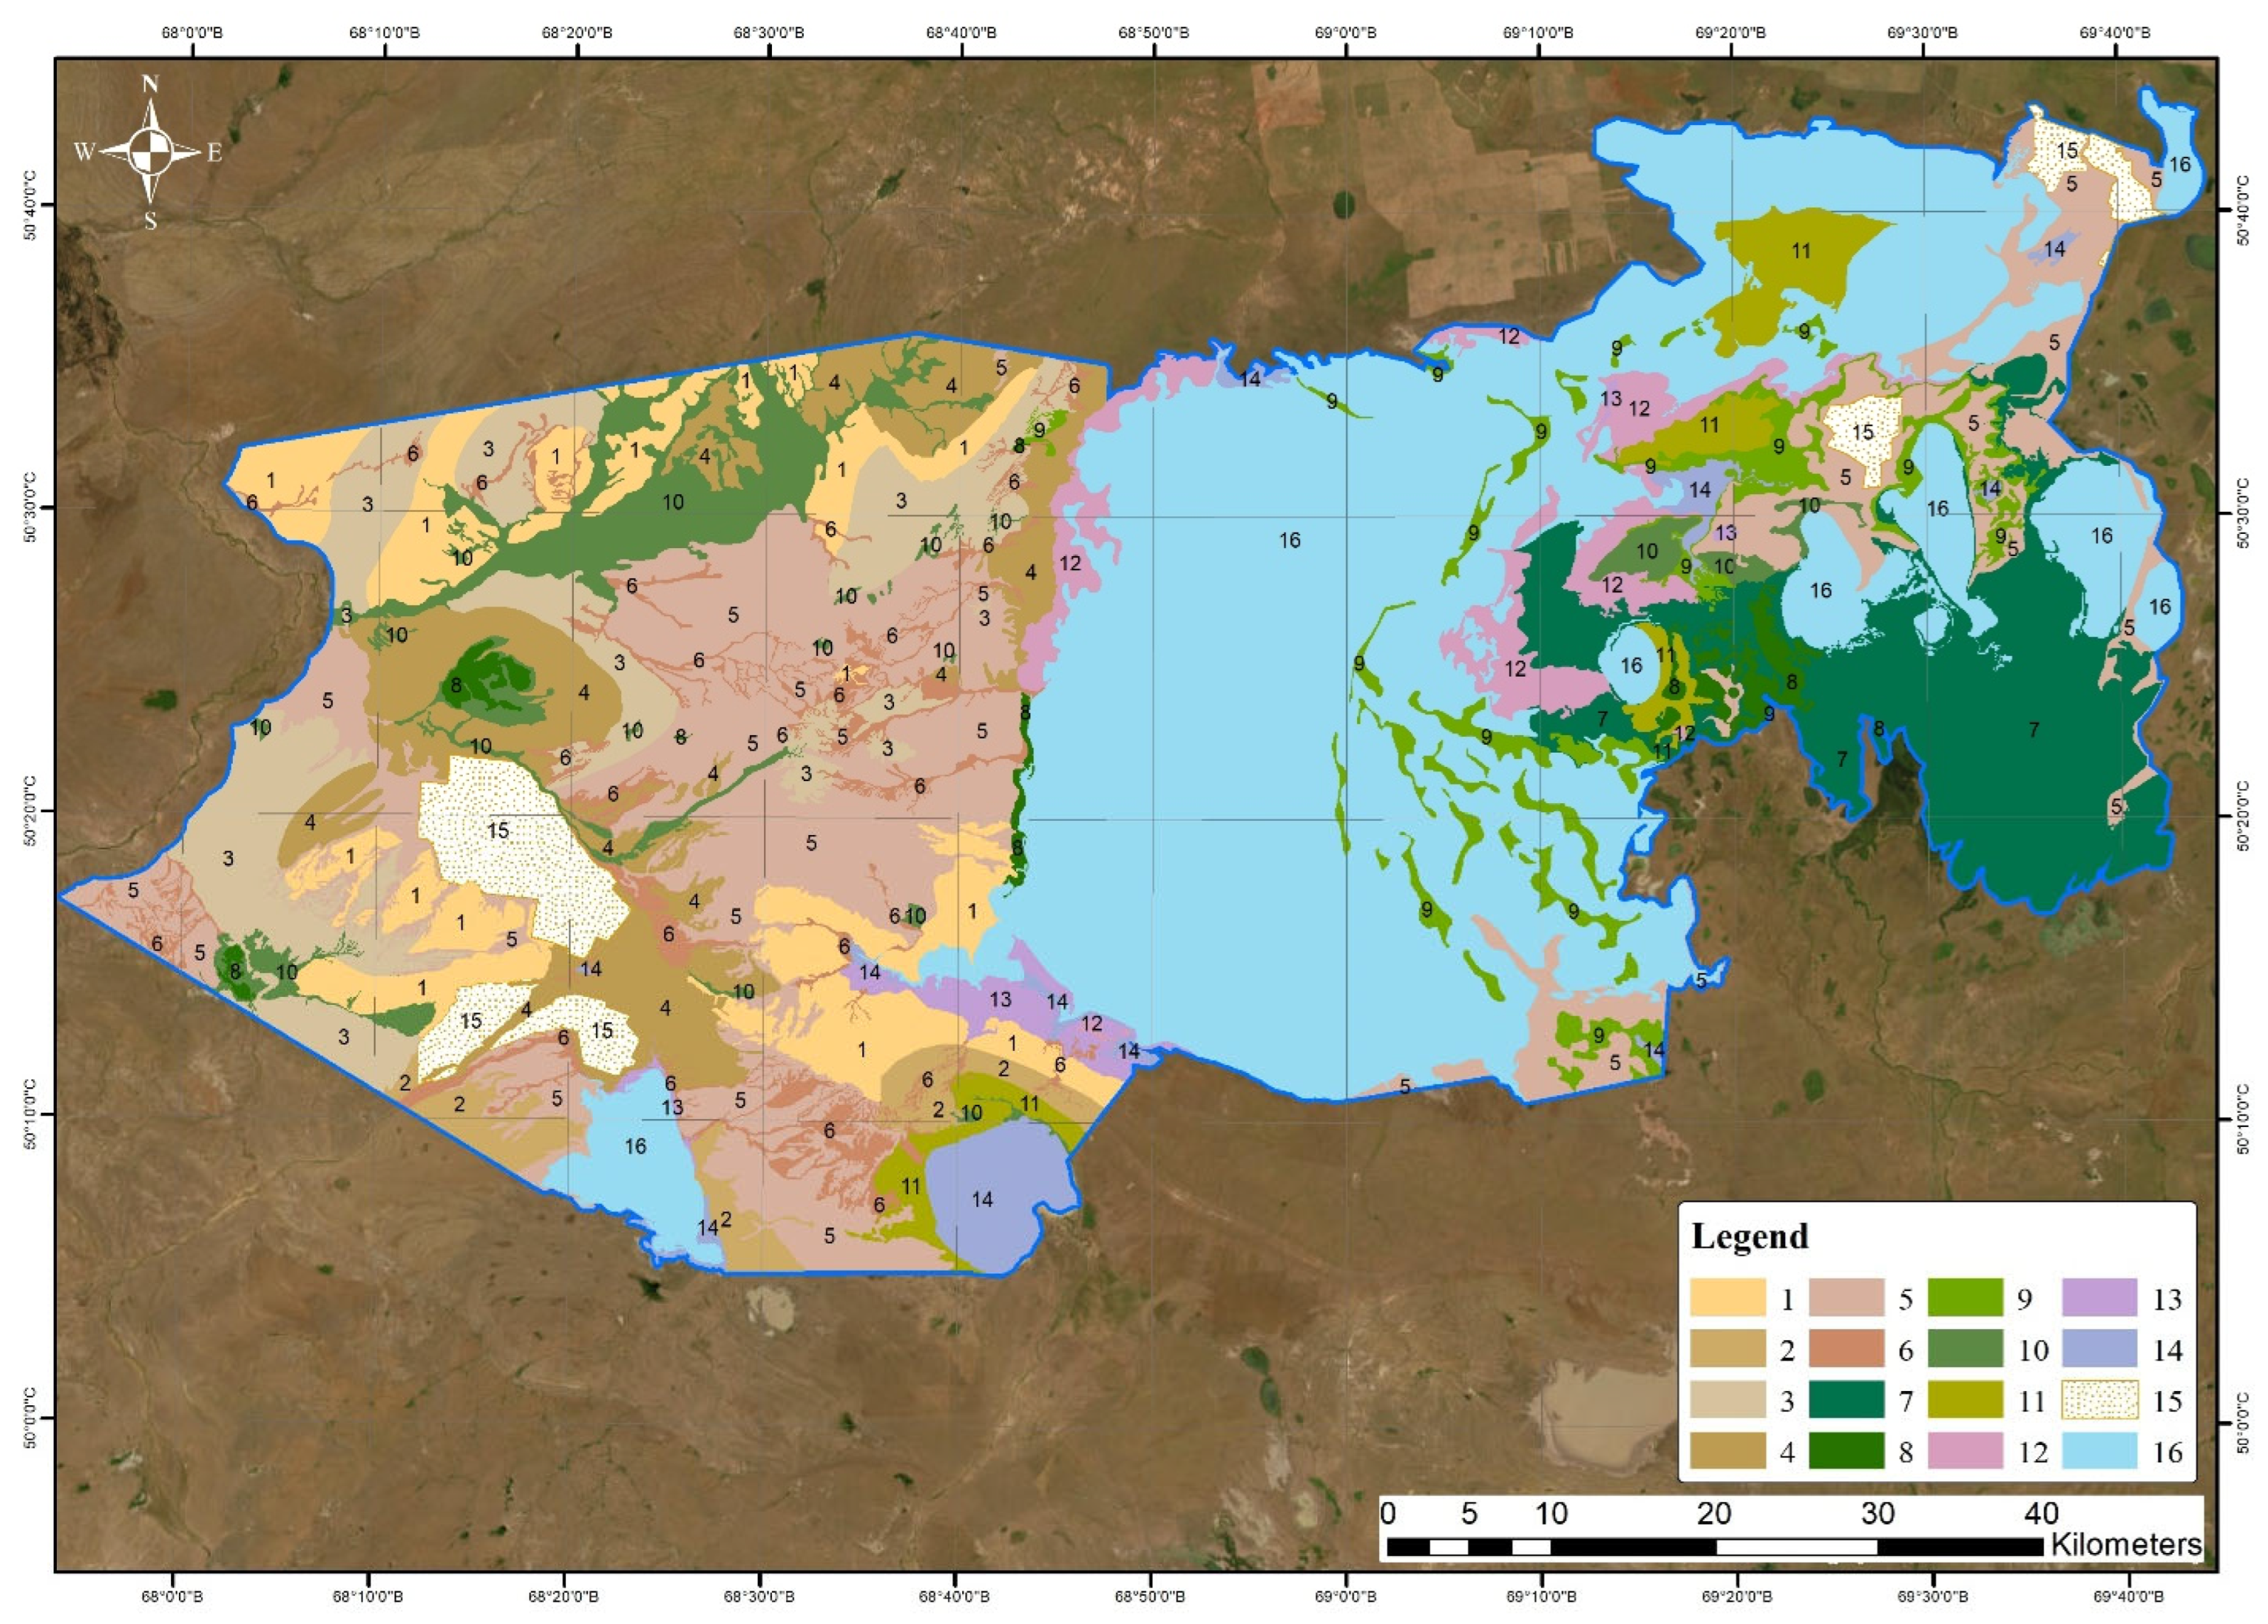
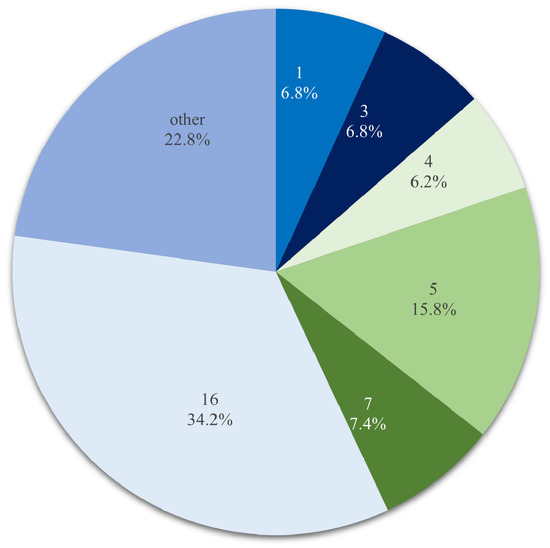
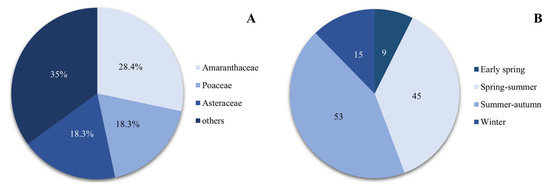
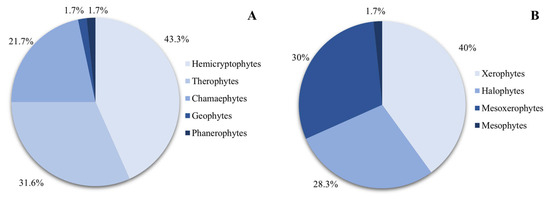
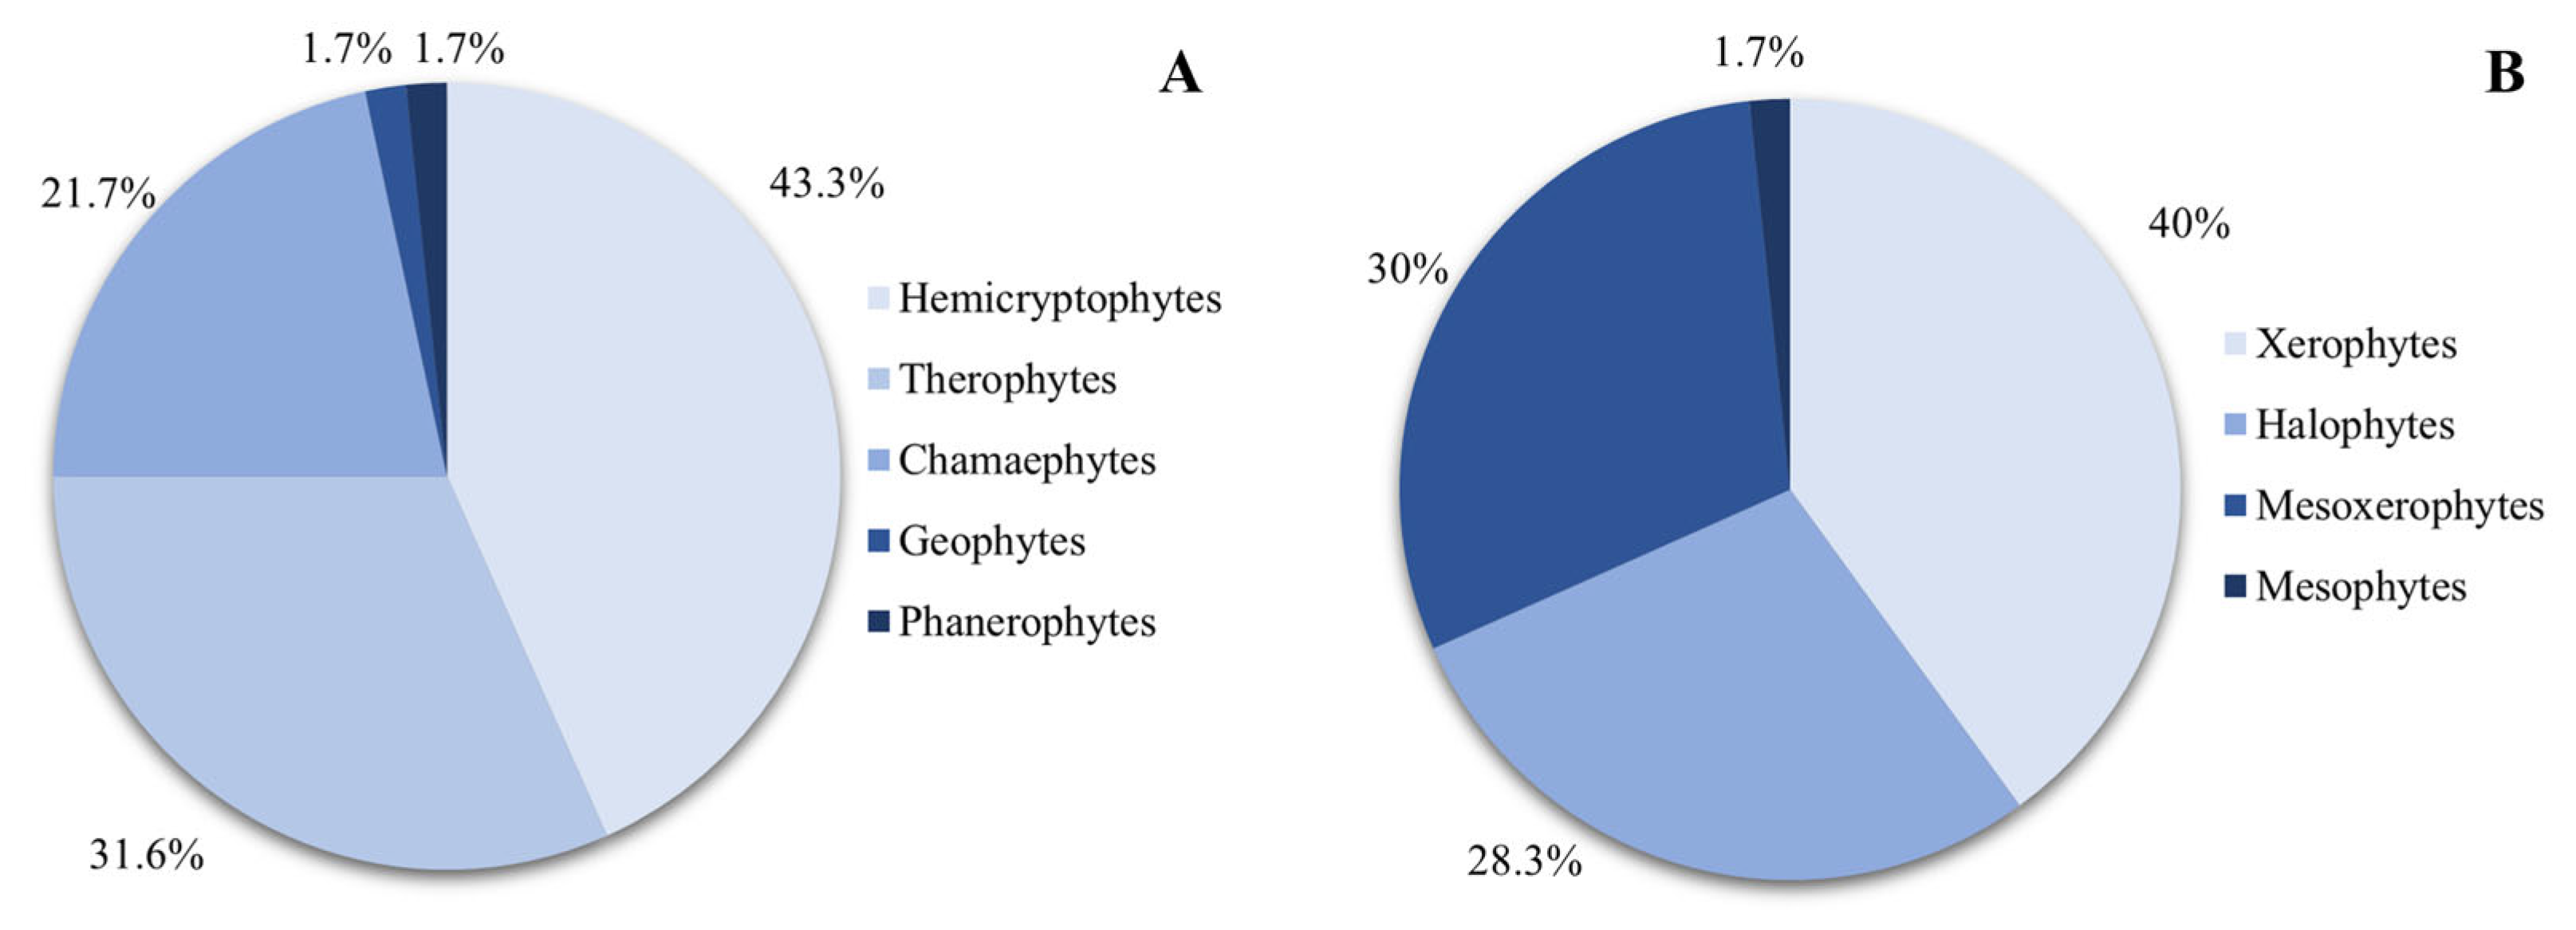
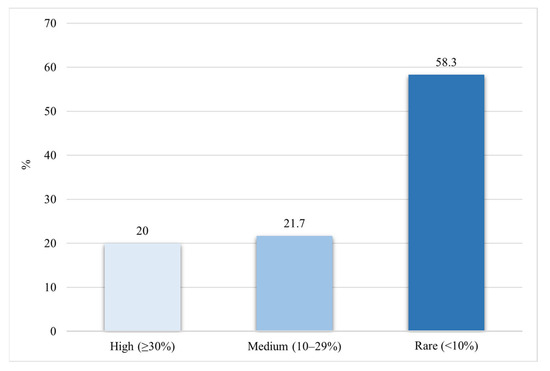
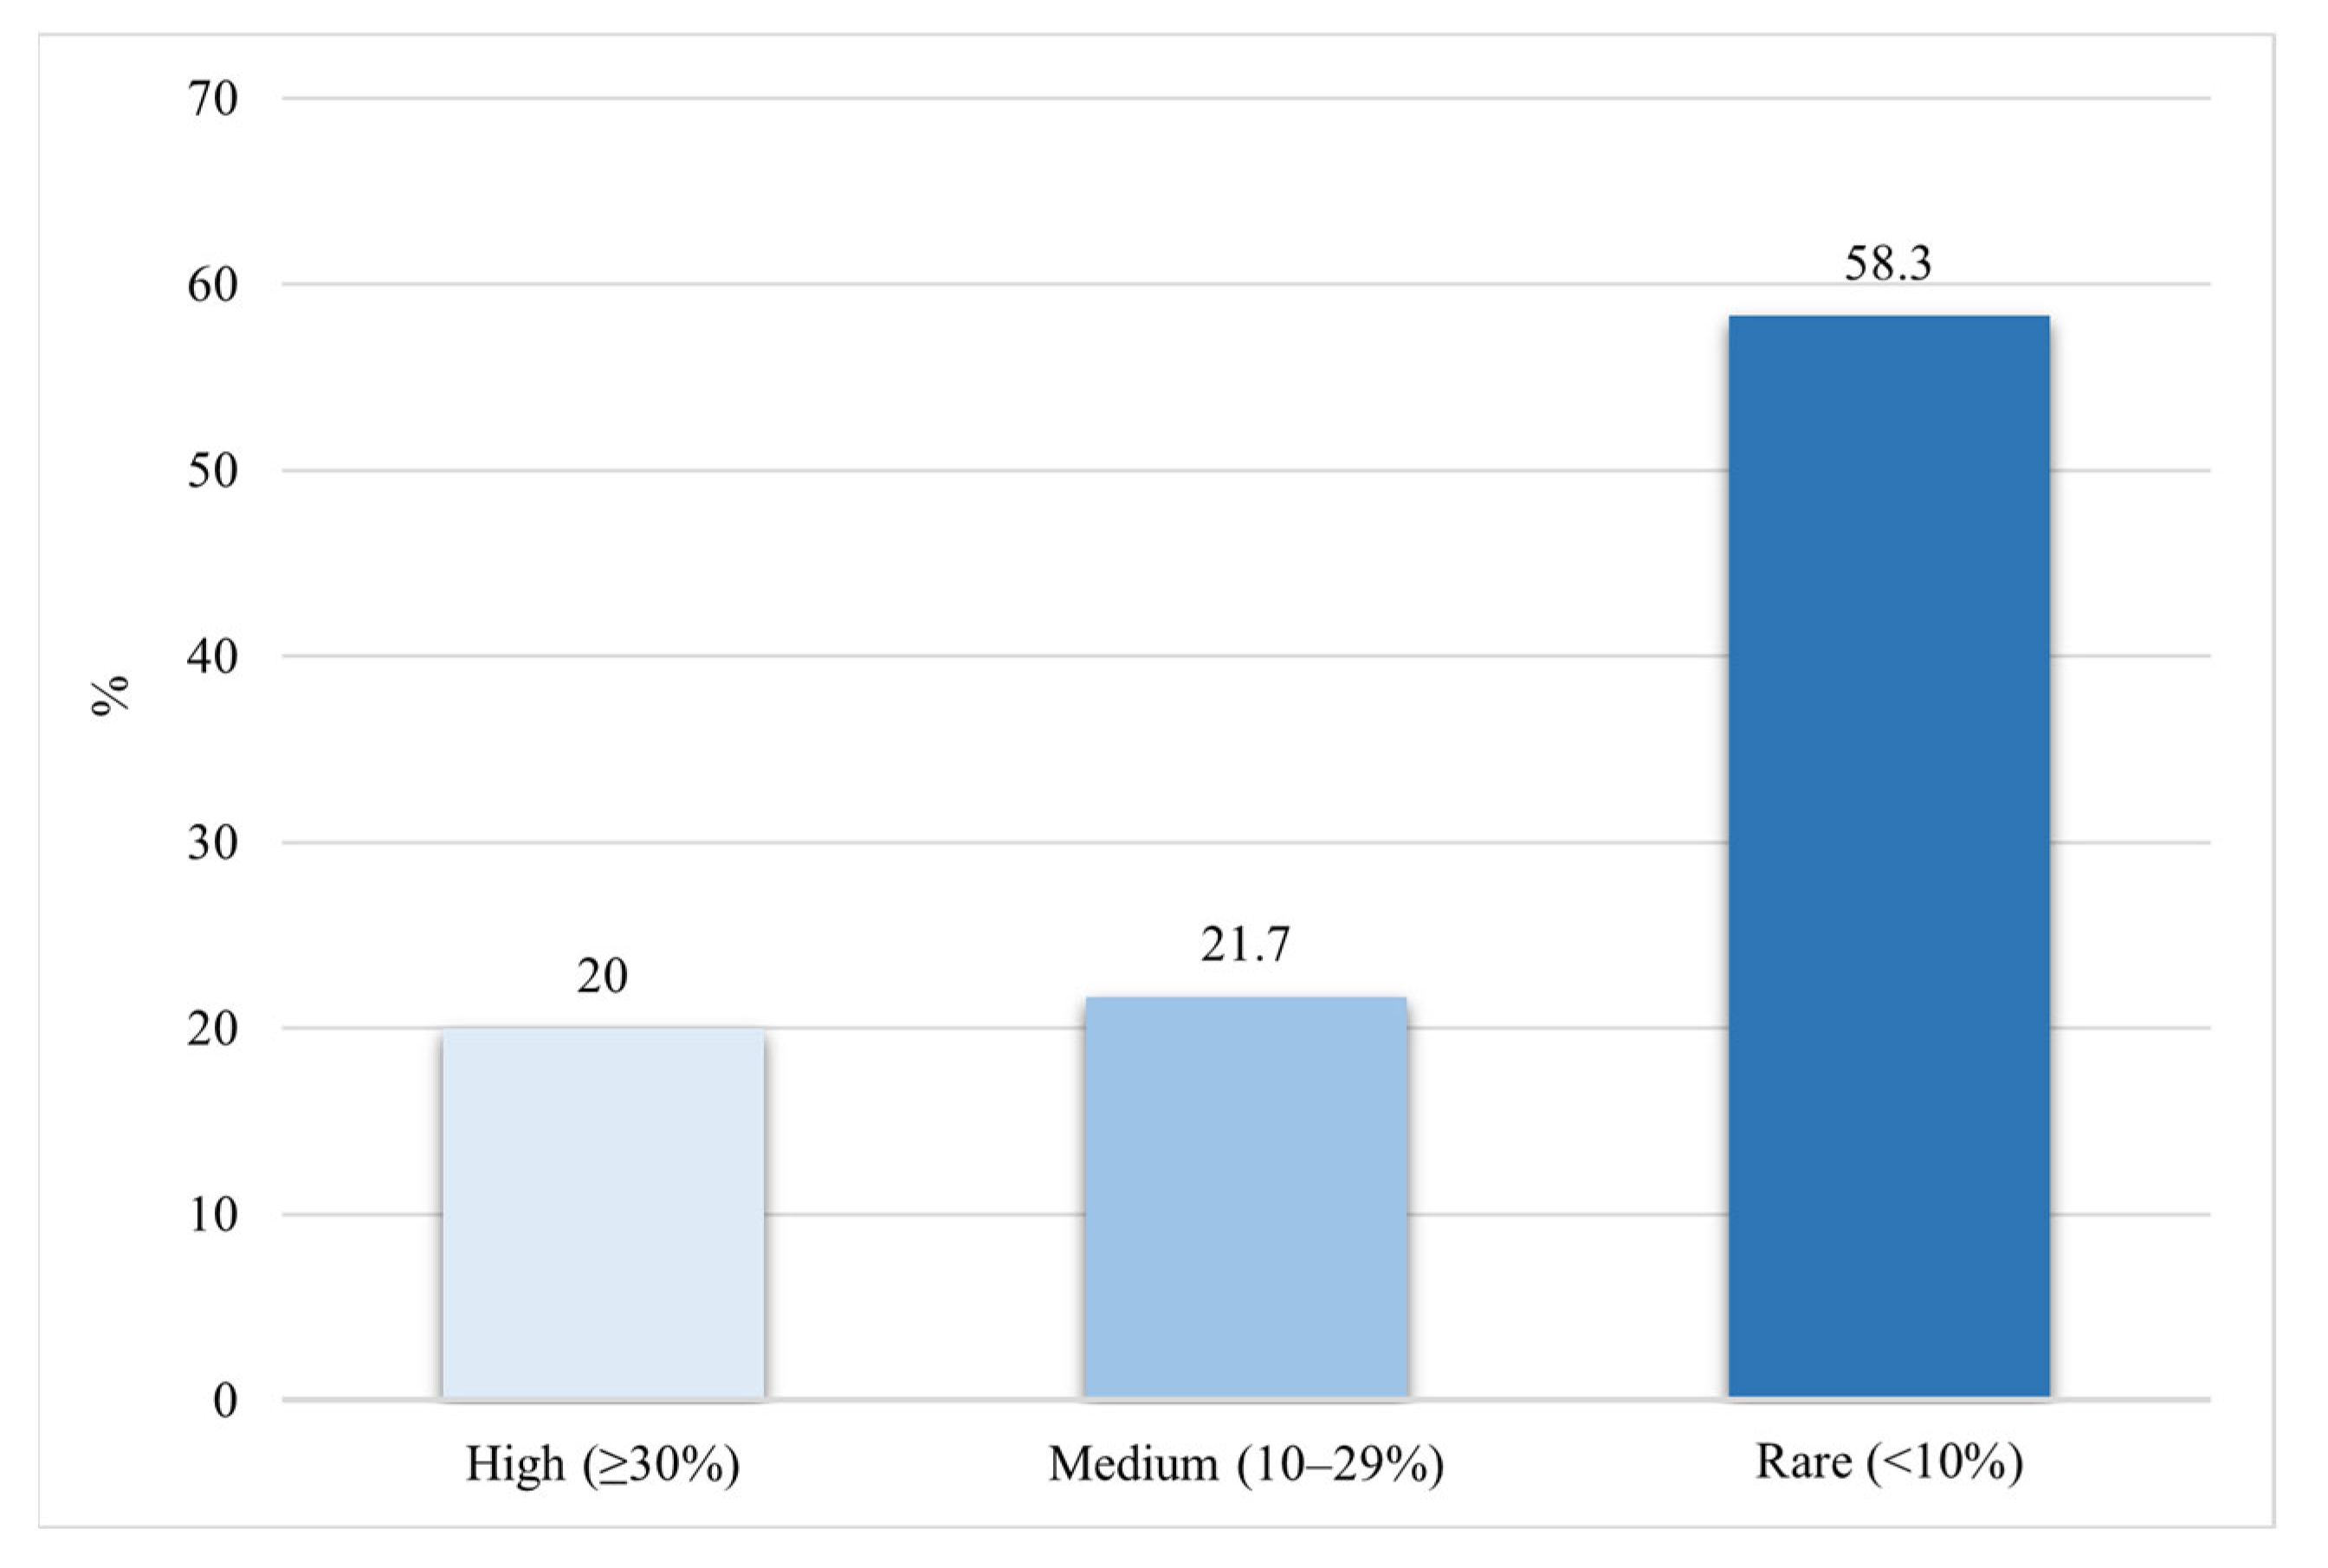

Disclaimer/Publisher’s Note: The statements, opinions and data contained in all publications are solely those of the individual author(s) and contributor(s) and not of MDPI and/or the editor(s). MDPI and/or the editor(s) disclaim responsibility for any injury to people or property resulting from any ideas, methods, instructions or products referred to in the content. |
© 2026 by the authors. Licensee MDPI, Basel, Switzerland. This article is an open access article distributed under the terms and conditions of the Creative Commons Attribution (CC BY) license.