


Abstract
Urban wetlands and agricultural lands are among the most important socio-ecological systems in urban areas. They support food production, biodiversity conservation, water regulation, climate resilience, and human well-being. However, rapid urbanization negatively affects wetland–agricultural coexistence (WAC) by destroying habitats, fragmenting landscapes, and intensifying land-use conflicts. Our study proposed a Wetland–Agriculture Coexistence Index (WACI) to assess the spatial pattern of WAC in Colombo, Sri Lanka. We considered four components for the WACI framework: wetland condition (WC), agricultural condition (AC), urban pressure (UP), and hydrological connectivity (HC). The WACI was developed using Landsat 8/9, Sentinel-1 Synthetic Aperture Radar (SAR), and Advanced Land Observing Satellite (ALOS) data, along with road network, population, and hydrological network data. Variables used in this study include land surface temperature (LST), Enhanced Vegetation Index (EVI), Modified Soil-Adjusted Vegetation Index (MSAVI), Bare Soil Index (BSI), soil moisture, elevation, slope, population density, distance to roads, hydrological connectivity, and built-up %, which were normalized and integrated into four dimensions using an equal-weighted approach to develop the WACI. The results showed substantial spatial heterogeneity in WAC across Colombo. The average WACI was 0.51, indicating a moderate WAC. This study further identified that favorable environmental conditions, rich hydrological connectivity, and low urban pressure increased coexistence potentials. The spatial pattern of WACI identified priority areas for conservation, restoration, and sustainable urban planning implications in Colombo. Our WACI framework provides a practical and transferable method for assessing WAC in urban areas. The findings of this study support balanced urban wetland–agricultural management, conservation, food security, and long-term sustainability of rapidly urbanizing cities.
1. Introduction
According to the United Nations, two-thirds of the global population will be concentrated in urban areas by 2050, and about 90% of this population is expected to concentrate in small urban areas and towns in Africa and Asia [1]. Population growth and urban expansion are influenced by factors such as climate change [2,3] and pandemic impacts [4]. Rapid socio-economic and environmental changes in urban areas are transforming food insecurity, malnutrition, and health problems, affecting the food system (e.g., the COVID-19 pandemic) [5,6,7,8,9]. In this context, the coexistence and integration of urban wetlands and agricultural lands have been shown to be practical strategies for enhancing food security and urban sustainability in global cities [10,11,12,13].
Urban wetlands are among the most valuable ecosystems in urban areas. They provide many ecosystem services, including flood mitigation, groundwater recharge, water purification, carbon sequestration, and urban cooling [14,15,16]. Urban wetlands often support adjacent urban and peri-urban agricultural systems [12,17,18]. They improve hydrological conditions, soil moisture, local microclimates, and ecosystem resilience in the systems [14,19,20]. Therefore, urban wetlands play an important role in sustaining WAC, providing flood mitigation, food production, and urban food security [21,22,23]. However, rapid urban expansion substantially modifies the WAC, negatively impacting its combined ecosystem services [12,22]. These changes influence the long-term stability of WAC in urban areas, especially in tropical cities in the Global South.
Agricultural lands in urban and peri-urban areas are vital to urban sustainability [24,25,26]. The productivity and sustainability of the agricultural systems depend on surrounding environmental and anthropogenic conditions [24,27]. Among them, urban wetlands are crucial because they enhance the overall quality of the urban agricultural systems [20]. However, the degradation of urban wetland ecosystems significantly reduces the capacity of agricultural lands and their food productivity [28,29,30]. Identifying these important interactions, the Food and Agriculture Organization (FAO) and the Convention on Wetlands (Ramsar Convention) emphasized the need to strengthen the WAC through integrated urban planning strategies [5,20]. Their recent policy recommendation highlights that wetlands and agricultural systems in urban areas should not be considered as individual land areas, but rather as interconnected socio-ecological systems, because they generate multiple environmental and socio-economic benefits when effectively managed [31]. However, practical tools for assessing the degree of WAC in urban areas remain limited.
Advancements in state-of-the-art technologies (e.g., remote sensing) and geospatial methodologies enable us to monitor environmental conditions, land-use changes, vegetation health, and soil moisture conditions in urban areas [32,33]. Past studies have used satellite-derived indicators such as land surface temperature (LST), vegetation indices (e.g., enhanced vegetation index (EVI), Modified Soil Adjusted Vegetation Index (MSAVI), and Normalized Difference Vegetation Index (NDVI)), and soil moisture products to assess urban development, land-use transition, and changes in wetlands or agricultural systems in urban areas [34,35,36,37]. Most studies have examined wetlands and agricultural systems separately despite their robust ecological and functional interconnections within urban areas [10,38,39,40,41]. Research on WAC in rapidly urbanizing cities also remains limited.
Although many studies have examined changes in urban wetlands or agricultural lands, their cooling effects, ecosystem services, and urban food security [10,14,42], several important knowledge gaps remain: (i) Previous studies have mainly focused on evaluating wetlands and agricultural systems separately, neglecting that these systems act as an interconnected socio-ecological system within the same urban landscape. (ii) Existing studies primarily focus on land use/land cover (LULC) changes or ecosystem service valuation. They overlook the assessment of the degree of WAC using spatially explicit indicators. (iii) No comprehensive index has been proposed to combine the important components, such as wetland condition (WC), agricultural condition (AC), urban pressure (UP), and hydrological connectivity (HC), into a single framework. These research gaps are more prevalent and critical to address in tropical cities of the Global South, e.g., Colombo, Sri Lanka, where rapid urban expansion and its pressure on urban wetlands and agricultural systems are evident [14].
Accordingly, our study develops a novel WACI to assess WAC capacity in rapidly urbanizing areas. Our framework integrates wetland and agricultural conditions within a single analytical framework. It further includes the degrees of hydrological and spatial connectivity between wetlands and agricultural lands in urban areas. The WACI further combines satellite-derived indicators with socio-economic and urbanization-related variables. These allow the evaluation of WAC from both ecological and human dimensions. Finally, our WACI provides a transferable methodology that can be applied to other urban wetlands and agricultural systems in the Global South.
This study has three main objectives: (i) to develop a novel WACI to evaluate WAC in Colombo; (ii) to quantify WC, AC, UP, and HC using geospatial datasets; and (iii) to identify spatial patterns of WAC in Colombo, providing policy recommendations for sustainable urban agriculture, wetland conservation, food security, and climate-resilient urban planning.
2. Materials and Methods
Our methodology consists of five main stages: (i) data collection; (ii) data preprocessing and drivers’ derivation; (iii) spatial processing and extraction; (iv) calculation and normalization of WACI components; and (v) integration of these components to quantify the WACI (Figure 1). Finally, we offer conservation priority areas, management, and policy recommendations for sustainable WAC in Colombo.
Figure 1.
Overview of the methodological framework of this study.
2.1. Study Area
Colombo (6°55′37″ N, 79°51′40″ E) is the commercial capital of Sri Lanka (Figure 2), as well as one of the rapidly growing metropolitan regions in South Asia. The Ramsar Convention has recognized Colombo as one of the world’s first Ramsar Wetland Cities due to its rich urban wetland system and high biodiversity [20]. Colombo has a complex ecological system including wetlands, marshes, rivers, lakes, canals, home gardens, and urban agricultural lands. The wetland cluster in the northern and central parts of Colombo serves as an important flood detention area, called the Colombo Flood Detention Area (CFDA) (Figure 2). The entire area, called the Colombo Wetland Complex (CWC), plays a major role in the flood mitigation and sustainability of the city [43]. The southern part of the city is home to the country’s largest freshwater lake (Bolgoda Lake, together called the Bolgoda wetland cluster), which is important for ecosystem sustainability and for fresh water for adjacent agriculture and human needs [14]. Moreover, two major rivers of the country flow through the northern (Kelani River) and southern (Kalu River) parts of the city, forming a rich hydrological network within the city [43]. These hydrological conditions are vital for sustaining WAC in Colombo.
Figure 2.
Study area: Colombo, Sri Lanka. The yellow circle represents the wetland cluster designated as a Ramsar Wetland City in 2018. The Red circle represents the Colombo Flood Detention Area (CFDA). Together, these areas are called the Colombo Wetland Complex (CWC). The light purple circle indicates Bolgoda Lake and its associated wetlands, collectively known as the Bolgoda Wetland Cluster.
According to the 2024 census, Colombo has 2.38 million residents [44], and the city contributes more than 50% of Sri Lanka’s Gross Domestic Product (GDP) [45]. Colombo experiences a tropical monsoon climate [46]. The city belongs to the wet zone. The dry season is from December to February. The wet season is from May to September. The mean annual temperature and mean annual rainfall are 29 °C and 2500 mm, respectively [47].
In recent decades, urban development, population growth, infrastructure expansion, and land-use transformation have changed the urban temperatures, hydrological conditions, and ecological corridors connecting wetlands and agricultural systems in Colombo [14,48,49,50]. Accordingly, our study focuses on the 2024 dry season. It has relatively clear atmospheric conditions and reduced cloud cover. It provides more consistent and reliable remote sensing data. Using data from the same seasonal period also helps minimize variation in seasonal changes in vegetation, surface water, and agricultural conditions. Therefore, the findings show a WACI assessment and baseline condition for the 2024 dry season. We created a 25 km buffer from the city center. The 25 km buffer was selected to include the urban and peri-urban wetland and agricultural system in Colombo, including major wetland clusters, agricultural lands, hydrological pathways, and urban development areas, and to exclude unrelated rural landscapes.
2.2. Data Sources
This study used multiple remote sensing, geospatial, and socio-economic datasets to assess WC, AC, UP, and HC in Colombo (Table 1).
Table 1.
Data used in the study.
2.3. LULC Mapping
We used Landsat 8 and 9 data from the 2024 dry season and applied a supervised classification method to generate a LULC map for Colombo. We considered six LULC classes: Water, Built-up, Forest, Grassland, Agriculture/Paddy, and Bare land. For validation, we collected georeferenced samples from the Survey Department of Sri Lanka [53] and high-resolution Google Earth imagery [55]. This study also used Sentinel-1 Synthetic Aperture Radar (SAR) data to identify wetlands and agricultural lands, given its sensitivity to surface moisture and vegetation conditions [52], which are important to this study. A total of 600 reference samples were collected, and the overall accuracy of the map was calculated.
2.4. Wetland and Agricultural Area Extraction
This study used the Survey Department data, Google Earth, and published maps to extract wetland and agricultural patches in the study area [14,53,55]. We also used Sentinel-1 SAR data as a reference [52]. We identified 189 wetland patches and 218 agricultural patches for this study. Each patch was assigned a unique ID (i.e., Wetland ID and Agricultural ID), facilitating spatial joining and attribute extraction in ArcGIS 10.8.2 software.
2.5. Derivation of Environmental and Socio-Economic Variables
2.5.1. EVI
This study used EVI to assess vegetation health, productivity, and ecological condition in wetlands and agricultural lands. EVI is suitable for monitoring dense vegetation. EVI was calculated as [56]:
where B5 refers to the Near-Infrared (NIR) band, B4 refers to the red band, and B2 refers to the blue band of Landsat 8 and 9. A high EVI value indicates healthy and dense vegetation, and a lower value indicates sparse or stressed vegetation.
2.5.2. MSAVI
MSAVI was calculated to assess vegetation health and agricultural productivity. MSAVI was selected because agricultural areas often contain exposed soil surfaces, making MSAVI more suitable for evaluating crop conditions. MSAVI was calculated as [57]:
where B5 is the Near-Infrared (NIR) band, and B4 is the red band of Landsat 8 and Landsat 9. Higher MSAVI values indicate healthier vegetation and greater agricultural productivity.
2.5.3. LST
LST was derived from thermal infrared (TIRS) bands of Landsat 8 and 9. LST was selected because it represents thermal stress and environmental degradation of wetland and agricultural systems within urban areas. Higher LST values indicate greater heat stress and lower environmental suitability. LST was calculated as [58,59]:
refers to the brightness temperature (Kelvin), obtained from satellite thermal band data, λ is the wavelength of the thermal band (meters), refers to the surface emissivity, and ln() is the natural logarithm of the surface emissivity. ρ = h × c/σ, a constant derived from h—Planck’s constant, c—speed of light, or σ—the Boltzmann constant.
2.5.4. Soil Moisture
We used soil moisture data from Sentinel-1 SAR Ground Range Detected (GRD) imagery [52]. Sentinel-1 operates in the C-band microwave region and provides data in dual polarizations, including Vertical Transmit–Vertical Receive (VV) and Vertical Transmit–Horizontal Receive (VH) [52]. The spatial resolution is 10 m and has been resampled to 30 m. SAR data are sensitive to surface moisture, vegetation structure, and surface roughness. Therefore, it is suitable for monitoring wetlands and agricultural lands under all weather conditions. Furthermore, microwave signals can penetrate cloud cover, allowing reliable observations in tropical environments. Our study used Sentinel-1 data to estimate relative soil moisture in the study area using Google Earth Engine (GEE).
2.5.5. BSI
The BSI was used to identify exposed soil surfaces and degradation of wetlands and agricultural lands in the urban environment. In the WACI framework, BSI was used as an indicator of wetland and agricultural degradation. Lower BSI values are considered more favorable for WAC. BSI was calculated as [60,61]:
where B6 is the Shortwave Infrared 2 (SWIR 2) band, B5 is the Near-Infrared (NIR) band, B4 is the red band, and B2 is the blue band of Landsat 8 and Landsat 9.
2.5.6. Elevation and Slope
We used ALOS DEM data for this study [54]. Based on the DEM, we derived the slope of the study area. Low elevations and gentle slopes are generally suitable for wetland persistence, agricultural activities, and hydrological connectivity within the lowland landscape of Colombo.
2.5.7. Population Density
Population density was used as an indicator of anthropogenic pressure on wetland–agriculture systems in Colombo. We used the 2024 population census data for this study and derived the population density of the study area [44]. Areas with high population density generally show greater development pressure and resource demand. We used a 1 km buffer for each wetland and agricultural patch in this study.
2.5.8. Distance to Road
This study used road data from the Survey Department of Sri Lanka [53], and Euclidean distance was used to generate the distance to road map. Wetlands and agricultural areas located far from roads have lower disturbance and fragmentation. Therefore, we used a 1 km buffer for each wetland and agricultural patch in this study.
2.5.9. Built-Up Percentage
Built-up percentage was extracted from the LULC map (see Section 2.3). Built-up expansion is considered a major source of urban pressure because it increases habitat fragmentation (both wetland and agriculture), reduces hydrological connectivity, and causes thermal stress in the urban environment. A 1 km buffer was used for each wetland and agricultural patch in this study.
2.6. Development of the WACI for Colombo
Figure 3 shows the framework used to develop the WACI in this study. We used 11 driving variables to quantify four major components of the WACI framework: WC, AC, UP, and HC. Finally, these components were integrated to generate the WACI for Colombo. The following sections describe the derivation of each component and the development of the WACI framework in detail.
Figure 3.
Development of the WACI for Colombo. It includes four dimensions: WC, AC, UP, and HC. These dimensions are derived from normalized variables independently and combined using an equal-weighted method to produce the final WACI.
Before calculating the WACI, we normalized all variables (from 0 to 1). Variables of environmental degradation and urban pressure (e.g., LST, BSI, built-up %, slope, elevation, and population density) were used with reversed-normalized values. This indicates that reversed-normalized values consistently show more favorable conditions for WAC. For example, a wetland with a normalized LST value of 0.80 (high temperature) would receive a reversed value of 0.20. It shows less favorable environmental conditions. Conversely, a wetland with a normalized LST value of 0.20 would receive a reversed value of 0.80 (Cooling), indicating more favorable conditions for WAC.
2.6.1. WC Assessment
To assess the WC, we extracted variables from wetland polygons. The following variables were used for each wetland: EVI, Soil Moisture, MSAVI, LST, BSI, Elevation, and Slope. The WC component was calculated as:
where , , , and represent the reversed-normalized values. W is a wetland.
2.6.2. AC Assessment
We extracted the following variables (EVI, Soil Moisture, MSAVI, LST, BSI Elevation, and Slope) from the agriculture polygons (same as the WC assessment). The AC component was calculated as:
where , , , and show the reversed-normalized values. a is agriculture.
2.6.3. UP Assessment
UP was calculated using a 1 km buffer around each wetland and agriculture patch. Built-up %, population density, and distance to road were extracted from the buffer zone and utilized to quantify external anthropogenic pressures on WAC. UP was calculated as:
where and represent the reversed-normalized values.
2.7. HC Assessment
In this study, we developed a hydrologically adjusted area-weighted distance connectivity to quantify wetland–agriculture HC. To do this, all wetland patches and agricultural patches located within 1 km of the hydrological network were identified using the Generate Near Table tool in ArcGIS 10.8.2. We used HydrologicalScore as follows: 1 indicates a direct hydrological connection between urban wetlands and agricultural lands, 0.5 indicates an indirect hydrological connection, and 0 indicates no hydrological connection.
For the sensitivity analysis of the buffer creation, we used 500 m and 1 km buffers and calculated the HC of each wetland. The mean HC values were 0.29 for a 500 m buffer and 0.40 for a 1 km buffer, indicating significant HC with the 1 km buffer. HC was calculated as follows:
where DistanceScore = 1 − (Distance/1000). Higher HC values indicate strong ecological and hydrological interactions between wetlands and agricultural areas.
2.8. Normalization of Variables
We normalized all variables to a common scale ranging from 0 to 1 as follows:
Variables showing environmental degradation and urban pressure were reversed: Built-up % = 1 − Built-up %, Low population density = 1 − Population density, Cooling = 1 − LST, Low BSI = 1 − BSI, Low Slope = 1 − Slope, and Low Elevation = 1 − Elevation.
2.9. Development of the WACI
The final WACI was developed using four components: (i) WC; (ii) AC; (iii) UP; and (iv) HC, which were calculated using an equal-weighted aggregation method. This was because there is no scientific evidence indicating that one component is more crucial than another. The objective of our WACI was to provide an integrated and balanced assessment of WAC. Therefore, the equal-weighted method was used to maintain transparency, reduce bias, and ensure the transferability of the WACI framework. The final index was calculated as:
where WACI values range from 0 to 1, the higher values indicate stronger WAC, while lower values indicate degraded WAC within the area.
3. Results
3.1. Spatial Distribution of LULC in Colombo
Figure 4 and Table 2 show the spatial distribution of LULC and the area percentage in the study area. The overall accuracy of the LULC map was 94%. The results indicate that built-up areas (25%) are mainly located in the northern, western, southern, and central parts of the study area (around the urban core area, near Colombo Port City, Borella, Wellawatte, and Ratmalana). It shows a clear urban–rural gradient in Colombo. The large extents of the grassland (33%) and forest (22%) are primarily located in the central, eastern, and southeastern areas. Water (2%) is mainly associated with the Colombo wetland system, canals, lakes, and coastal areas. Agricultural lands (14%) are mainly concentrated in the eastern, middle, and southern parts of the study area, with a majority of peri-urban agricultural areas. These areas also show relatively low urban development intensity compared to the urban core areas.
Figure 4.
LULC map of the study area in 2024.
Table 2.
Statistics of LULC classes in the study area.
However, we can identify that the built-up areas are expanding beyond the city, consuming its natural lands. A ribbon-type development can be observed in the middle part of the city. These expansions fragment the natural landscape, including urban wetlands and agricultural systems, placing tremendous pressure on the WAC in Colombo. The remaining urban wetlands and agricultural lands in the central and peri-urban areas indicate their importance for maintaining ecosystem services, food production, and urban climate in Colombo.
3.2. Spatial Distribution of the Driving Variables
The variables used in this study show substantial spatial heterogeneity across the wetland and agricultural areas of Colombo (Figure 5). For example, higher soil moisture values were primarily observed in major wetland areas and near agricultural areas. This indicates that the hydrological processes in these areas support favorable moisture conditions that sustain WAC. Higher EVI (Figure 5a) and MSAVI (Figure 5b) values are observed in the central and eastern parts of the city, especially in peri-urban areas. Compared with the LULC map (Figure 4), these areas have a large proportion of forest, grassland, and agricultural land. These areas are rich in healthy vegetation and higher ecosystem productivity, as well as greater agricultural potential than the urban core areas. Furthermore, higher LST values (Figure 5c) are observed around urban cores and compact built-up areas, as well as along road networks. The distance to road (Figure 5i) shows substantial spatial differences in Colombo, connecting the suburbs but fragmenting wetlands and agricultural lands, and relatively higher temperatures, especially in peri-urban agricultural areas.
Figure 5.
Spatial distribution of driving variables used in this study: (a) EVI, (b) MSAVI, (c) LST, (d) Soil Moisture, (e) BSI, (f) Elevation, (g) Slope, (h) Population Density, (i) Distance to Road, and (j) Built-up.
Table 3 shows the normalized mean values of the driving variables (wetland and agriculture) in the study area. The reversed LST values show higher values in agriculture (0.65) compared to wetlands (0.61). The results indicate that agricultural areas provide relatively cooler environmental conditions than wetlands, because most agricultural lands are in peri-urban areas and are more connected to natural lands (forests and grasslands) and water areas. In contrast, urban wetlands are mainly concentrated in high-density built-up areas in the central part of Colombo. Urban wetlands in Colombo show slightly higher vegetation conditions (EVI: 0.55 and MSAVI: 0.54) compared with agricultural lands (0.51 and 0.50, respectively). Soil moisture is higher in wetlands (0.53) than in agriculture (0.27). The results suggest spatial variation in moisture conditions and management practices in the study area. Elevation and slope show higher reversed values in wetlands (elevation: 0.89; slope: 0.82) than in agricultural areas (0.68 and 0.65, respectively) (Table 3). It indicates that wetlands are generally located in low-elevation areas with flat terrain, compared with agricultural areas.
Table 3.
Summary statistics of normalized variables for wetlands and agricultural lands.
Furthermore, wetlands also show a higher reserved value of built-up % (0.32) than agricultural lands (0.47), indicating that urban wetlands in Colombo are more exposed to urban development than agricultural areas. Compared with the LULC maps (Figure 4), urban wetlands are mainly located in the central and southern parts of the city, and agricultural areas are mainly concentrated in the transition areas between urban and peri-urban areas. The reserve value of population density was 0.75 for wetlands and 0.76 for agricultural areas, suggesting that surrounding urban wetlands have slightly higher population density than agricultural areas. Hydrological connectivity showed a relatively higher mean value (0.40), emphasizing the importance of HC between the systems in Colombo.
3.3. WC in Colombo
Figure 6 shows the spatial distribution of WC in Colombo. From good to excellent, WCs were primarily located in the central and eastern parts, especially along major hydrological corridors in Colombo. Most of the excellent condition wetlands were in the city’s central part and are part of the Ramsar Wetland City area. These areas indicate healthy environmental conditions due to rich vegetation, soil moisture availability, lower thermal stress, low elevation, and flat terrain. Poor- to moderate-condition wetlands were in the western coastal belt, near the Colombo Port City area, and the Moratuwa area. These wetlands are under high urban pressure, extensive urban development, dense infrastructure, and relatively low hydrological connectivity. Furthermore, these wetlands showed degraded environmental conditions due to reduced vegetation, high temperatures, and a fragmented urban landscape. The spatial pattern of WC suggests that WC improves with increasing distance from the city center, and that wetting conditions and surrounding natural vegetation remain untouched. Our findings emphasize the importance of protecting natural vegetation and water resources around the wetlands, reducing urban development pressure, and maintaining the integrity of wetland–agriculture in Colombo.
Figure 6.
Spatial distribution of WC in Colombo. The WC values were classified into five categories using the natural breaks (Jenks).
3.4. AC in Colombo
The spatial distribution of AC showed substantial heterogeneity in the study area (Figure 7). Good and excellent ACs were located in the southern, eastern, and southeastern parts of Colombo. These areas showed lower urban development pressure, higher soil moisture, and greater connectivity with other natural lands such as forests and grasslands. Most of the agricultural lands near and directly abutting wetlands in the middle part of the city were in good-to-excellent condition, indicating a rich WAC. The agricultural system near the wetlands and along the water corridors also showed good vegetation health (high EVI and MSAVI), higher soil moisture, lower LST (indicating increased cooling effect), as well as reduced urban pressure. In these two categories (good and excellent), agricultural areas showed large patches and low fragmentation in the urban landscape.
Figure 7.
Spatial distribution of AC in Colombo. The AC values were classified into five categories using the natural breaks (Jenks).
Poor and very poor ACs were mainly located in rapidly urbanizing and fragmented landscape areas. These areas are further influenced by road infrastructure and population pressures (Figure 5). Some agricultural lands in the southeast part were in poor condition due to low moisture, greater exposure to bare soil (BSI), and relatively high fragmentation. Moderate ACs were widely distributed in the peri-urban areas between highly urbanized and relatively natural environments. The spatial pattern suggests that higher ACs are more dominant in areas with lower urban pressure and greater connectivity to adjacent wetlands and water corridors between wetland and agricultural lands. Our findings indicate that protecting interactions between wetlands and agriculture is important for sustainable food production and enhancing the climate resilience of urban agricultural systems in Colombo.
3.5. UP in Colombo
The UP assessment of urban wetlands is shown in Figure 8a. The spatial distribution of UP is uneven in Colombo. The UP component was calculated using three variables—built-up %, population density, and distance to roads—within a 1 km buffer around the wetlands. Many wetlands are embedded within urban cores, and the central parts (e.g., Borella, Kotte, Battaramulla) exhibit very high and high UP levels due to greater exposure to urban development-related stress. Furthermore, intensively built-up areas, road networks, and a large accumulation of population can be seen surrounding these wetlands. These accumulations may result in increased landscape fragmentation, altered natural hydrological pathways (especially between the wetland and agricultural systems), and enhanced urban thermal stress, negatively impacting the WAC in the city. Wetlands in the southern part of Colombo and some in the middle part experienced low-to-very-low UP. These wetlands showed lower population density, lower built-up %, and greater separation from major road networks in Colombo (Figure 5 and Figure 8a). The UP is gradually decreasing away from the city center, showing a clear urban–peri-urban gradient. The findings indicate that UP poses a major threat to urban wetlands and may substantially constrain WAC in Colombo.
Figure 8.
Spatial distribution of UP in Colombo; (a) UP on urban wetlands, and (b) UP on urban agriculture. The UP values were classified into five categories using natural breaks (Jenks).
Figure 8b shows the substantial spatial heterogeneity of UP on agricultural lands in Colombo. The UP of agricultural lands was calculated within a 1 km buffer around the agricultural patches. The results indicate that many agricultural systems are embedded within urban core areas and areas with high levels of anthropogenic activity. Very high and high UP agricultural lands were primarily concentrated in the middle, northwestern, and southern parts of the city, as well as along major road networks. These areas were also located in intensively built-up areas and high population density, resulting in increased competition between agricultural land and urban development. Such conditions further lead to land fragmentation and reduce the continuity, integrity, and productivity of agricultural land in Colombo. Several agricultural lands in the eastern and southeastern parts of the city reveal outward urban development from the urban core, highlighting its impact on the peri-urban agricultural system.
Some agricultural lands in the southern and southeastern regions were classified as low or very low UP. These areas showed considerably lower built-up % and population densities than the high and very high UP categories (Figure 5). These areas have larger, more continuous agricultural patches and show significant interactions with surrounding wetlands, natural vegetation, and hydrological networks. The result further indicates that urban pressure (i.e., urbanization) is one of the major factors shaping the distribution and ACs in Colombo, decreasing WAC and threatening the long-term sustainability of urban food production systems.
3.6. HC in Colombo
The spatial distribution of HC shows that urban wetlands are functionally connected to surrounding agricultural areas through the hydrological network (Figure 9). Connectivity was calculated using wetland patches as the base units. They represent each wetland’s capacity to connect with adjacent agricultural areas in Colombo. Highly- and well-connected wetlands are located in the southern, central, and northeastern parts of the study area. These wetlands support strong interactions with surrounding agricultural lands via a high degree of HC. They provide water, nutrients, and sediments, as well as ecological processes, between the two systems. These processes further enhance ecosystem services and resilience with other land-use types (e.g., forest and grassland) in Colombo. The large, continuous wetland–agriculture areas indicate that they retain as much of their original ecological structure despite surrounding urban development and higher WAC.
Figure 9.
Spatial distribution of HC in Colombo. The HC values were classified into five categories using natural breaks (Jenks).
Highly isolated and poorly connected wetlands were found in the urban core areas (the central part and the southern and northeastern parts). Compared with the LULC map (Figure 4), these areas have undergone urban expansion and infrastructure development, as well as landscape fragmentation. These transformations decrease the trade-off between wetlands and agricultural lands. Furthermore, the capacity of the wetlands to meet the water needs of surrounding agricultural systems is significantly limited. The fragmented urban landscape further suggests that urban development has significantly impacted traditional HC in Colombo.
In the sensitivity analysis, the mean value at a 500 m buffer was 0.29, and at a 1 km buffer was 0.40. The results indicate that connectivity values increased as the buffer increased from 500 m. The strongest interactions were observed within the 1 km threshold. The results suggest that local-level HC plays the dominant role in determining WAC patterns in Colombo. We stopped the sensitivity analysis at the 1 km buffer because all hydrological networks were connected to at least one wetland or agricultural land in the study area.
3.7. Spatial Distribution of WACI
The spatial distribution of the WACI shows considerable heterogeneity across Colombo (Figure 10). The mean WACI value was 0.51. It indicates a moderate level of WAC in the study area. Among the four components of WACI, WC had the highest mean value (0.62), followed by AC (0.59), UP (0.43), and LC (0.40) (Table 4).
Figure 10.
Spatial distribution of WACI in Colombo. The WACI values were classified into five categories using natural breaks (Jenks).
Table 4.
Mean and SD values of the WC, AC, UP, HC, and WACI in the study.
Good and excellent coexistence areas were mainly located in the central wetland corridor, including the Kotte–Battaramulla area, the southern part, and several wetlands in the eastern part. Compared to the WC, AC, UP, and HC assessments, these areas show higher values, providing healthy wetland and agricultural conditions, significant HC, and relatively lower levels of urban pressure. A relatively large wetland patch in the eastern area shows greater WAC in Colombo. We further identified that some parts of this area may have been previously used for agricultural production; however, it currently shows abundant paddy land or marshy land with rich water, high soil moisture conditions, dense, healthy vegetation, and higher cooling effects. Therefore, this area plays a dominant role in peri-urban areas with greater HC, which must be safely managed or protected for future WAC in Colombo. Furthermore, the areas of good and excellent coexistence categories represent important socio-ecological systems in Colombo. Consequently, these areas should be considered priority zones for conservation and integrated urban landscape management.
Poor and very poor coexistence areas can be identified around the urban core, including Borella, Wellawatta, Ratmalana, and Moratuwa. High-intensity urban areas, fragmented urban landscapes, and relatively low hydrological networks can be observed in these areas. These areas are further away from the nearest agricultural areas. Therefore, it may reduce the capacity of WAC and its functions as interconnected systems. Our results emphasize the importance of maintaining ecological connectivity and minimizing urban pressure to strengthen the long-term resilience and sustainability of WAC in these areas.
4. Discussion
4.1. The Role of Urban Wetlands for Sustainable Urban–Peri-Urban Agriculture
Our results show that urban wetlands play a dominant role in sustaining urban agricultural systems in Colombo. Agricultural lands adjacent to and abutting urban wetlands showed significant improvements in vegetation health, soil moisture conditions, cooling capacity, low fragmentation, and stronger HC (Figure 5, Figure 7 and Figure 9). It indicates that urban wetlands provide optimal environmental conditions for WAC and its productivity [62]. The findings support the recognition that urban wetlands should not be considered as conservation areas. They should be considered as multifunctional ecosystems that contribute to sustainable food production and ecosystem resilience in urban areas [20,63]. This connection can describe some ecological processes. For example, (i) Urban wetlands provide water to agricultural areas [64]. They retain water during wet periods and slowly release it during dry periods. (ii) Urban wetlands can also cool the surrounding environment via evapotranspiration and shading, mitigating the urban heat island (UHI) effect [65]. (iii) Wetlands are important for nutrient and sediment transportation in urban areas [66]. They can enhance optimal environmental conditions for sustainable WAC.
Colombo provides a significant study for understanding WAC. As one of the world’s first Ramsar Wetland Cities (designated in 2018) [67] and a rapidly urbanizing tropical coastal city in the Global South, it has a complex mosaic of urban wetlands, home gardens, and urban agricultural lands, including paddy areas. Therefore, the city serves as a natural laboratory for understanding how urban wetland ecosystems support WAC sustainability under rapid urbanization and anthropogenic activities. The relationship between WAC further emphasizes the interdependence (e.g., urban wetlands and agricultural areas rely on each other for water regulation and food production) and the interaction (e.g., urban wetlands and agricultural lands affect vegetation health and moisture availability) of these systems [50,68]. It suggests that urban wetland degradation may directly affect the sustainability of WAC in urban areas.
4.2. HC as One of the Major Drivers of WAC
Our study identified that HC plays a fundamental role in governing connectivity between urban wetlands and agricultural systems (Figure 9). It suggests that WAC is determined not only by the socio-economic conditions of individual wetlands and agricultural areas, but also by the degree of HC of these systems [69,70]. In other words, urban wetlands’ services extend beyond their physical boundaries and depend on the degree of HC and the movement of ecological processes within the urban landscape [71,72]. Hydrologically well-connected wetlands regulate water, energy, nutrients, and sediments to the surrounding areas and improve the condition of WAC [73,74,75].
In this study, HC was calculated using a hydrologically adjusted area-weighted distance connectivity method (see Section 2.7). The hydrological pathways between wetlands and agricultural systems are crucial in tropical urban areas. Because they experience significant rainfall fluctuations and rising temperatures due to urban development and land-use changes [76], these changes may affect the sustainability of the WAC and agricultural productivity [77]. HC urban wetlands provide evapotranspiration and a cooling effect to adjacent areas, including agricultural areas, improving microclimate conditions [78,79].
HC helps nutrients and organic matter movement between wetlands and agricultural systems [80,81]. Seasonal water fluctuations promote nutrient and sediment exchange [82]. They enhance soil fertility and support vegetation and crop growth [83,84]. Therefore, urban wetlands should be considered functional components of urban landscapes, as they sustain the agricultural system. However, land-use changes and landscape fragmentation negatively impact the HC in urban areas [78,85]. These modifications may increase the possibility of isolating urban wetlands from surrounding agricultural lands. Our results on UP in urban wetlands show a similar pattern (Figure 8a). For example, urban wetlands near the urban core areas show isolated and relatively low HC, as do the northeastern and middle parts. Such isolation and fragmentation may decrease the exchange of water, nutrients, sediments, and ecosystem interactions, and decrease the capacity of urban wetlands to support urban agricultural systems. Long-term declines in hydrological pathways may reduce agricultural system degradation and increase vulnerability to drought and heat stress [86,87]. Therefore, HC management suggests an important adaptation strategy for sustaining WAC in rapidly urbanizing cities under climate change. Conversely, an urban-agricultural system with strong HC may provide greater resilience to extreme weather events such as floods, droughts, and the UHI effect in urban areas [88].
Many studies have reported on the impact of wetland and agricultural HC on ecosystem services separately [64,89]; relatively few studies have assessed hydrological interactions between wetlands and agricultural systems in urban areas [90]. Therefore, our study provides new evidence that HC is one of the major drivers of the ecological mechanism underlying WAC. The results further indicate that future urban planners and policymakers should prioritize the conservation and restoration of hydrological corridors to enhance the ecological interactions between the two systems in urban areas. They may act as an ecosystem-based adaptation to help these systems thrive under rapid urbanization and climate change. Accordingly, HC should be considered not only as a physical connection between the urban wetland and agriculture, as well as the surface water system, but also as a foundation for sustaining WAC in urban areas in the future.
4.3. UP as a Primary Challenge for the Sustainability of WAC
Urban expansion is one of the major threats to sustaining wetlands and agricultural lands, as well as to their coexistence [91,92]. Our findings indicate that anthropogenic activities, urban development, population growth, rapid land-use changes, and transportation expansion not only impact wetland and agricultural systems in urban core areas, but also in peri-urban areas. For example, wetlands around the urban core areas, such as Beire Lake, the wetland cluster near Diyawanna Lake, some wetlands near Aththidiya, and the northeastern wetlands, showed high UP (Figure 8a). Some agricultural areas near the above-mentioned places showed high-to-very-high UP, indicating that, as a system, they are under tremendous pressure from urban expansion and human activities (Figure 4 and Figure 8b). Peri-urban agricultural lands also showed an increased UP in the middle and eastern parts. Therefore, urban planners should prioritize these areas for conservation. Future urban expansion in Colombo may compromise these ecosystems’ capacity to maintain their ecological functions and interactions, negatively impacting WAC.
Urban expansion is now extending into urban fingers and peri-urban areas (Figure 4). Colombo exhibits ribbon-type development along the road network, especially in the urban–rural transition areas (Figure 4). This developmental pattern and infrastructure development have resulted in the gradual fragmentation of the peri-urban agricultural system and modified hydrological pathways within and around these systems. Many studies have reported that urban expansion negatively impacts urban wetland systems and increases thermal stress [93]. Athukorala et al. (2025) studied the cooling effect of urban wetlands in Colombo [78]. They found that the cooling efficiency of urban wetlands has decreased due to surrounding urban development. Our UP results indicate that urban wetlands and agricultural lands exposed to high-intensity urban development showed poor WC, AC, and HC. The mean WACI of 0.51 indicates that Colombo has a moderate level of WAC, raising the question of whether urban wetlands can still support urban agriculture systems in Colombo. The question is reasonable because Colombo has many urban wetlands and a rich hydrological network that interconnects and integrates functions between two systems. However, the moderating value indicates that the urban expansion in Colombo transforms the composition and configuration of the urban landscape, resulting in a negative impact on the WAC.
Urban expansion impacts WAC through multiple and interconnected processes. LULC changes modify the natural hydrological pathways linking wetlands and agricultural lands [94]. These modifications may reduce infiltration and increase surface runoff, negatively affecting water exchange between the two ecosystems [14,77]. Road network expansion linking suburban areas may fragment urban wetlands and agricultural landscapes [22]. These changes can significantly impact habitat quality, reducing their spatial connectivity and functional capacity [14,22]. Conversion of natural land to built-up areas intensifies the UHI effect [78]. These changes can decrease the capacity of WAC. Such impacts are particularly evident in tropical cities, where WAC plays a crucial role in increasing food security and climate adaptation.
Our findings explored the distinct urban–rural gradient in Colombo. The higher UP is located around the urban cores and along the major transportation corridors (Figure 8a,b). The lower UP is observed in urban fringe areas. Moderate to high levels of UP in agricultural systems in peri-urban areas indicate that the impacts of rural development extend beyond the city center (Figure 8a,b). This pattern emphasizes that future urban development in peri-urban agricultural landscapes is highly vulnerable to land-use change and environmental degradation. Therefore, policymakers and urban planners should consider integrated land-use planning, the conservation of ecological corridors, and the advancement of ecosystem-based urban development strategies for sustainable WAC in Colombo.
4.4. Implications for Sustainable Urban Planning and Food Security
The spatial pattern of WACI revealed substantial heterogeneity across Colombo. The findings further indicate that WAC potential differs considerably among the urban wetland systems in Colombo. Good-to-excellent WAC was mainly concentrated around the Kotte–Battaramulla areas, including Thalangama and Akurugoda wetlands, Diyawanna Lake, Beddagana wetland, the southern regions, especially around the largest freshwater lake in Sri Lanka (Bolgoda Lake), Aththidya wetland areas, and several wetlands in the eastern part of the city (Figure 10). These areas experience healthy wetland vegetation (Figure 6), favorable agricultural conditions (Figure 7), low urban pressure (Figure 8a), and stronger HC (Figure 9). These areas further reveal critical socio-ecological systems in Colombo that provide many ecosystem services, including flood control, urban cooling, biodiversity, and sustainable food production [14,78]. Consequently, these regions should be considered priority areas for conservation and integrated landscape management.
Wetlands in urban core areas such as Beira Lake, around the Rajagiriya marsh, Hean canal and marsh, and wetlands in dense urbanized western coastal areas showed poor WAC (Figure 10). These areas indicate low HC (Figure 9), reflecting the negative impacts of urban development and the alteration of hydrological pathways connecting both systems. Urban planners should consider ecological restoration and sustainable planning strategies to enhance the resilience of WAC in these areas. Overall, we observed that the middle part of the Wetland cluster (this urban wetland cluster was identified as one of the highly sensitive areas within the Colombo area and declared by the Ramsar Convention as the Ramsar wetland city in 2018), including CWC, and the wetland cluster in the southern part (Bolgoda wetland, the largest freshwater lake in the country) show higher WAC due to conservation and protection by the governments (Figure 2 and Figure 10). Furthermore, these areas act as the heart of the WAC in Colombo. Therefore, further protection and monitoring of these areas are required to maximize the WAC.
Our study supports the FAO and the Convention on Wetlands. They recently emphasized the urgent need to manage wetlands and agricultural lands as interconnected systems in urban areas [5,20]. Furthermore, our findings contribute directly to Sustainable Development Goals (SDGs) [95], particularly Zero Hunger (SDG 2), Sustainable Cities and Communities (SDG 11), Climate Action (SDG 13), and Life on Land (SDG 15). This study also supports national-scale regulations, such as environmental regulations by the Central Environmental Authority (CEA), the Wildlife Department in Sri Lanka, the Agrarian Service Department, the Urban Development Authority, and the Road Development Authority.
WAC is particularly important in rapidly urbanizing tropical cities. It has been shown that increasing population growth, rapid land-use conversion, and infrastructure development put substantial pressure on the WAC. Optimizing urban WAC can contribute to local food production, especially fresh foods for citizens, reduce vulnerability to food supply disruptions, and enhance adaptive capacity to climate change. For the long-term sustainability of the WAC, water capacity and its quality must be monitored, as polluted water and heavy metals may run off from upland urban areas into waterways, exchange between systems, and reduce the WAC and food productivity [81,82,92]. Overall, urban planners and policymakers should give substantial weight to the WAC in urban areas and should integrate conservation and sustainability into future urban planning strategies.
4.5. Transferability of the WACI Framework
To the best of our knowledge, no framework has previously integrated WC, AC, UP, and HC to assess WAC in urban areas. Our WACI framework addresses this limitation. We used 11 driving variables to assess WACI for Colombo, separating them into four components. In addition, this study identifies priority areas for WAC management and sustainable urban planning.
Our WACI framework relies on satellite observations and geospatial datasets. It can readily be applied to other Ramsar Wetland Cities and rapidly urbanizing areas. More variables can be used in the WACI, depending on the study area and data availability. For example, in our WACI, we did not use the climate component. Future studies can apply climate-related variables to calculate WACI in cities. The most important point is that during the variable normalization, all variables should keep the same order. Some variables need reverse normalization (see Section 2.8). Therefore, our WACI provides a novel and transferable approach for strengthening the integration of WAC within urban socio-ecological systems. Future studies should apply WACI using multi-year and seasonal (e.g., wet and dry seasons) data to assess seasonal variability, interannual changes, and long-term trends in WAC. Understanding the underlying process by integrating temporal observations, hydrological processes, land-use change, conservation policies, agricultural management practices, and socio-economic factors will improve our understanding of WAC in rapidly urbanizing cities. The WACI should be considered as an “ecological spatial evaluation tool” for assessing the WAC. Although the WACI includes UP through variables such as population density, distance to road, and built-up %, it does not include socio-economic variables such as agricultural economic value, farmers’ livelihood dependence, land ownership, or policy implementation. Therefore, future research should integrate these socio-economic indicators to provide a more comprehensive assessment of WAC and to support sustainable urban planning and policy development.
The specific variables, thresholds, and scoring criteria within each dimension (WC, AC, UP, and HC) may require adaptation to local environmental and socio-economic conditions. For example, our study was designed to use a conceptual scoring system for assessing hydrological connectivity (1, 0.5, and 0). It shows three influential levels of connectivity between wetlands and agricultural systems. We suggest that future studies should score additional classes such as 0.75 and 0.25, and include quantitative hydrological information (streamflow, flow capacity, and discharge) to distinguish the strength of hydrological connectivity within the systems. It will enhance the HC of the WACI and develop a more continuous and detailed connectivity metric. AC may differ from their crop types, irrigation systems, and practices. Therefore, the WACI should be applied with city-specific data to ensure its applicability across diverse urban conditions while maintaining methodological consistency.
5. Conclusions
Our study developed a novel WACI to evaluate the spatial coexistence of urban wetlands and agricultural systems in Colombo, Sri Lanka. We used 11 driving variables and grouped them into four dimensions: WC, AC, UP, and HC. Our framework successfully achieved its objectives by quantifying the socio-ecological conditions and the spatial patterns of WACI in Colombo. Our findings showed considerable spatial heterogeneity in WAC in Colombo. The mean WACI value was 0.51, indicating a moderate level of WAC. Good-to-excellent WACs were mainly located in the Ramsar wetland city wetland cluster and the southern and eastern wetland systems. Poor WACs were identified in highly urbanized areas. These findings emphasize the importance of identifying priority areas for conservation and integrated landscape management in Colombo. Our findings suggest that protecting and conserving hydrological pathways and reducing landscape fragmentation surrounding urban wetland and agricultural areas are vital for sustainable WAC within urban socio-ecological systems. Our findings further indicate that UP is one of the major impacts on WAC. Therefore, policymakers and urban planners should consider integrating WAC into city planning.
Our study represents the first attempt to integrate WC, AC, UP, and HC to assess WAC within a single spatial framework. The proposed WACI provides a novel, transferable framework for identifying priority areas and supporting ecosystem-based planning and management. Our WACI framework can readily be applied to other Ramsar Wetland Cities and rapidly urbanizing areas, contributing to sustainable urban development, WAC, food security, and climate adaptation.
Author Contributions
Conceptualization, D.A.; methodology, D.A. and Y.I.; software, D.A.; validation, D.A., Y.I., Y.M. and T.M.; formal analysis, D.A.; investigation, D.A., Y.I., Y.M. and T.M.; resources, D.A.; data curation, D.A.; writing—original draft preparation, D.A.; writing—review and editing, D.A., Y.I., Y.M. and T.M.; visualization, D.A., Y.I., Y.M. and T.M.; supervision, Y.M. All authors have read and agreed to the published version of the manuscript.
Funding
This research was supported by the Japan Society for the Promotion of Science (JSPS) through a Postdoctoral Fellowship (Grant No. 24KF0178) awarded to Darshana Athukorala.
Data Availability Statement
The original contributions presented in the study are included in the article; further inquiries can be directed to the corresponding author.
Conflicts of Interest
The authors declare no conflicts of interest.
Abbreviations
The following abbreviations are used in this manuscript:
| WAC | Wetlands–Agricultural Coexistence |
| WACI | Wetland–Agriculture Coexistence Index |
| WC | Wetland Condition |
| AC | Agricultural Condition |
| UP | Urban Pressure |
| HC | Hydrological Connectivity |
| FAO | Food and Agriculture Organization |
| LST | Land Surface Temperature |
| EVI | Enhanced Vegetation Index |
| MSAVI | Modified Soil Adjusted Vegetation Index |
| BSI | Bare Soil Index |
| LULC | Land Use/Land Cover |
| TIRS | Thermal Inferred Senser |
| SAR | Synthetic Aperture Radar |
| ALOS | Advanced Land Observing Satellite |
| DEM | Digital Elevation Model |
| CFDA | Colombo Flood Detention Area |
| CWC | Colombo Wetland Complex |
| NIR | Near-Infrared |
| GEE | Google Earth Engine |
| SWIR | Shortwave Infrared |
| UHI | Urban Heat Island |
| SDGs | Sustainable Development Goals |
References
- World Urbanization Prospects. Available online: https://population.un.org/wup/ (accessed on 25 June 2026).
- Chen, G.; Li, X.; Liu, X.; Chen, Y.; Liang, X.; Leng, J.; Xu, X.; Liao, W.; Qiu, Y.; Wu, Q.; et al. Global Projections of Future Urban Land Expansion under Shared Socioeconomic Pathways. Nat. Commun. 2020, 11, 537. [Google Scholar] [CrossRef] [Scilit] [PubMed]
- Luo, M.; Lau, N.C. Urban Expansion and Drying Climate in an Urban Agglomeration of East China. Geophys. Res. Lett. 2019, 46, 6868–6877. [Google Scholar] [CrossRef] [Scilit]
- Sun, L.; Wu, C.; Li, J.; Du, B.; Zhang, L. Global Pandemic Reshaped Urban Expansion: Insights into the Policy and Spatial Expansion Pattern in Global 400+ Cities. GISci. Remote Sens. 2026, 63, 2642617. [Google Scholar] [CrossRef] [Scilit]
- Food and Agriculture Organization of the United Nations. Available online: https://www.fao.org/home/en (accessed on 25 June 2026).
- He, C.; Liu, Z.; Xu, M.; Ma, Q.; Dou, Y. Urban Expansion Brought Stress to Food Security in China: Evidence from Decreased Cropland Net Primary Productivity. Sci. Total Environ. 2017, 576, 660–670. [Google Scholar] [CrossRef] [Scilit] [PubMed]
- D’Amour, C.B.; Reitsma, F.; Baiocchi, G.; Barthel, S.; Güneralp, B.; Erb, K.H.; Haberl, H.; Creutzig, F.; Seto, K.C. Future Urban Land Expansion and Implications for Global Croplands. Proc. Natl. Acad. Sci. USA 2017, 114, 8939–8944. [Google Scholar] [CrossRef] [Scilit] [PubMed]
- Wei, G.; He, B.J.; Liu, Y.; Li, R. How Does Rapid Urban Construction Land Expansion Affect the Spatial Inequalities of Ecosystem Health in China? Evidence from the Country, Economic Regions and Urban Agglomerations. Environ. Impact Assess. Rev. 2024, 106, 107533. [Google Scholar] [CrossRef] [Scilit]
- Li, W.; Xie, S.; Wang, Y.; Huang, J.; Cheng, X. Effects of Urban Expansion on Ecosystem Health in Southwest China from a Multi-Perspective Analysis. J. Clean. Prod. 2021, 294, 126341. [Google Scholar] [CrossRef] [Scilit]
- Gunapala, R.; Gangahagedara, R.; Wanasinghe, W.C.S.; Samaraweera, A.U.; Gamage, A.; Rathnayaka, C.; Hameed, Z.; Baki, Z.A.; Madhujith, T.; Merah, O. Urban Agriculture: A Strategic Pathway to Building Resilience and Ensuring Sustainable Food Security in Cities. Farming Syst. 2025, 3, 100150. [Google Scholar] [CrossRef] [Scilit]
- Liu, Y.; Chanse, V.; Chicca, F. Enhancing Post-Disaster Food Security Through Urban Agriculture in the Context of Climate Change. Land 2025, 14, 799. [Google Scholar] [CrossRef] [Scilit]
- Mozumder, C.; Tripathi, N.K. Geospatial Scenario Based Modelling of Urban and Agricultural Intrusions in Ramsar Wetland Deepor Beel in Northeast India Using a Multi-Layer Perceptron Neural Network. Int. J. Appl. Earth Obs. Geoinf. 2014, 32, 92–104. [Google Scholar] [CrossRef] [Scilit]
- Alikhani, S.; Nummi, P.; Glatzel, S. Understanding Policy Approaches to Urban Wetlands: Governance and Management Strategies in Two EU Metropolitan Areas—Helsinki and Vienna. Wetlands 2025, 45, 115. [Google Scholar] [CrossRef] [Scilit]
- Athukorala, D.; Murayama, Y.; Bandara, C.M.M.; Lokupitiya, E.; Hewawasam, T.; Gunatilake, J.; Karunaratne, S. Effects of Urban Land Change on Ecosystem Service Values in the Bolgoda Wetland, Sri Lanka. Sustain. Cities Soc. 2024, 101, 105050. [Google Scholar] [CrossRef] [Scilit]
- Athukorala, D.; Estoque, R.C.; Murayama, Y.; Matsushita, B. Impacts of Urbanization on the Muthurajawela Marsh and Negombo Lagoon, Sri Lanka: Implications for Landscape Planning towards a Sustainable Urban Wetland Ecosystem. Remote Sens. 2021, 13, 316. [Google Scholar] [CrossRef] [Scilit]
- Díaz-Pinzón, L.; Sierra, L.; Trillas, F.; Herrera, L. The Socio-Cultural Value of Urban Wetlands: Insights into Local Sustainable Management. J. Environ. Manag. 2025, 395, 127933. [Google Scholar] [CrossRef] [Scilit] [PubMed]
- Urban and Peri-Urban Agriculture, Food and Agriculture Organization of the United Nations. Available online: https://www.fao.org/urban-peri-urban-agriculture/en (accessed on 25 June 2026).
- Dingha, C.B. Constraints to Wise Use of Urban and Peri-Urban Wetlands: Evidence and Options for Sustainability in Bamenda, Cameroon. Wetlands 2026, 46, 61. [Google Scholar] [CrossRef] [Scilit]
- RAMSAR Wetlands & Agriculture: Partners for Growth. 2nd World Wetlands Day. 2014, pp. 1–16. Available online: https://www.ramsar.org/document/wetlands-agriculture-partners-growth-world-wetlands-day-2014-leaflet (accessed on 28 June 2026). [PubMed]
- The Ramsar Convention on Wetlands. Available online: https://www.ramsar.org/ (accessed on 25 June 2026).
- Pinke, Z.; Acs, T.; Decsi, B.; Kardos, M.K.; Arvai, M.; Fabók, V.; Farkas, J.Z.; Gribovszki, Z.; Hidy, D.; Kalicz, P.; et al. Synergies in Agriculture and Nature Conservation through Hydrological Restoration of Ecologically Valuable and Cultivated Wetlands in the Drought-Prone Hungarian Plain (Central and Eastern Europe). Geogr. Sustain. 2026, 7, 100464. [Google Scholar] [CrossRef] [Scilit]
- Athukorala, D.; Estoque, R.C.; Murayama, Y.; Matsushita, B. Ecosystem Services Monitoring in the Muthurajawela Marsh and Negombo Lagoon, Sri Lanka, for Sustainable Landscape Planning. Sustainability 2021, 13, 11463. [Google Scholar] [CrossRef] [Scilit]
- Gubamwoyo, S.; Hein, T.; Heiskanen, J.; Kisha, D.G.; Pellikka, P.; Gruber, G.; Omondi, V.A.; Leitner, S.M.; Weigelhofer, G.; Mwamodenyi, J.M.; et al. Assessing Land Use Changes and Agricultural Practices in Highland Valley-Bottom Wetlands in Taita Hills, Kenya. J. Environ. Manag. 2025, 389, 126122. [Google Scholar] [CrossRef] [Scilit] [PubMed]
- Bayr, U.; Krøgli, S.O.; Eiter, S. Assessing Land Suitability and Potential for Extending the Area for Urban Agriculture in Norway Using GIS-MCDA. Urban For. Urban Green. 2025, 112, 128912. [Google Scholar] [CrossRef] [Scilit]
- Buscher, J. Exploring Trends in Bioeconomy and Urban Agriculture for Cities—A Meta-Review for Identifying Major Tasks for Urban Planning. Cities 2026, 176, 107189. [Google Scholar] [CrossRef] [Scilit]
- Ding, X.; Li, W.; Sun, X.; Peng, Y. Assessing the Potential of Urban Agriculture at the Community Scale: Spatial Heterogeneity, Influencing Factors, and Planning Implications. J. Environ. Manag. 2026, 409, 130046. [Google Scholar] [CrossRef] [Scilit] [PubMed]
- Huan, Y.; Nijhuis, S.; Tillie, N. Urban Agriculture as an Interface for Policy–Practice Integration: A Landscape-Informed, Multi-Layer Framework across Havana, New York City and Chongming Island. Landsc. Urban Plan. 2026, 273, 105687. [Google Scholar] [CrossRef] [Scilit]
- Dinh, T.T.; Nguyen, H.; Phuong, N.T. Machine Learning-Based Analysis of Wetland Loss and Agricultural Expansion Dynamics in the Long Xuyen Quadrangle, Vietnamese Mekong Delta (1990–2023). Environ. Chall. 2025, 20, 101265. [Google Scholar] [CrossRef] [Scilit]
- Kundu, S.; Kundu, B.; Rana, N.K.; Mahato, S. Wetland Degradation and Its Impacts on Livelihoods and Sustainable Development Goals: An Overview. Sustain. Prod. Consum. 2024, 48, 419–434. [Google Scholar] [CrossRef] [Scilit]
- Matsuzaki, S.S.; Kohzu, A.; Kadoya, T.; Watanabe, M.; Osawa, T.; Fukaya, K.; Komatsu, K.; Kondo, N.; Yamaguchi, H.; Ando, H.; et al. Role of Wetlands in Mitigating the Trade-off between Crop Production and Water Quality in Agricultural Landscapes. Ecosphere 2019, 10, e02918. [Google Scholar] [CrossRef] [Scilit]
- Convention on Wetlands; FAO. Agriculture and Wetlands, Maintaining and Restoring Wetlands for Sustainable Food Production and Ecosystem Health; Convention on Wetlands: Gland, Switzerland, 2025; ISBN 9782940786138. [Google Scholar]
- Li, J.; Tang, B.; He, W.; Yang, S.; Cao, K.; Chen, H.; Ji, L.; Xu, Y.; Li, Y.; Sun, S. Biodiversity Assessment of Urban Green Space Based on Remote Sensing—A Case Study of Hangzhou Bay Urban Agglomeration. Remote. Sens. 2026, 18, 1898. [Google Scholar] [CrossRef] [Scilit]
- Yilgan, F.; Dogan, T.; Ustuner, M.; Guliyeva, S.; Kaya, S.; Gallacher, C. Assessing the Changes of Vegetation Density, Urbanization and Surface Urban Heat Islands in Prague Using Landsat-8 Spectral Remote Sensing Indices. Adv. Space Res. 2026, 78, 415–433. [Google Scholar] [CrossRef] [Scilit]
- Ndekelu, L.N.; Zhang, H.K.; Bwangoy, J.R.; Henebry, G.M.; Maimaitijiang, M.; Zhang, X.; Lumbuenamo, R.; Liu, P.W.; Gao, L. A Time Series Deep Learning Algorithm for Soil Moisture Retrieval from Sentinel-1 Data Using Transformer. Sci. Remote Sens. 2026, 13, 100414. [Google Scholar] [CrossRef] [Scilit]
- Athukorala, D.; Murayama, Y.; Karunaratne, S.; Wijenayake, R.; Morimoto, T.; Fernando, S.L.J.; Herath, N.S.K. Spatio-Temporal Changes in Mangroves in Sri Lanka: Landsat Analysis from 1987 to 2022. Land 2025, 14, 1820. [Google Scholar] [CrossRef] [Scilit]
- Mirchooli, F.; Kiani-Harchegani, M.; Khaledi Darvishan, A.; Falahatkar, S.; Sadeghi, S.H. Spatial Distribution Dependency of Soil Organic Carbon Content to Important Environmental Variables. Ecol. Indic. 2020, 116, 106473. [Google Scholar] [CrossRef] [Scilit]
- Gupta, L.; Dixit, J. Environmental and Sustainability Indicators Urban Climate Stress Assessment Integrating Spectral Indices, Random Forest-Based Land Use and Land Cover Dynamics, and Urban Flood Inundation Using Google Earth Engine. Environ. Sustain. Indic. 2026, 31, 101376. [Google Scholar] [CrossRef] [Scilit]
- Kenmegne, R.L.T.; Hemchi, H.M.; Bissonnette, J.F. How to Integrate Wetlands in Urban Planning to Achieve Greater Resilience? The Case of Douala IV Urban Municipality (Cameroon). J. Urban Manag. 2025, 15, 964–977. [Google Scholar] [CrossRef] [Scilit]
- Muchelo, R.O.; Bishop, T.F.A.; Ugbaje, S.U.; Akpa, S.I.C. Patterns of Urban Sprawl and Agricultural Land Loss in Sub-Saharan Africa: The Cases of the Ugandan Cities of Kampala and Mbarara. Land 2024, 13, 1056. [Google Scholar] [CrossRef] [Scilit]
- Basu, T.; Das, A.; Pham, Q.B.; Al-Ansari, N.; Linh, N.T.T.; Lagerwall, G. Development of an Integrated Peri-Urban Wetland Degradation Assessment Approach for the Chatra Wetland in Eastern India. Sci. Rep. 2021, 11, 4470. [Google Scholar] [CrossRef] [Scilit] [PubMed]
- Hu, T.; Liu, J.; Zheng, G.; Li, Y.; Xie, B. Quantitative Assessment of Urban Wetland Dynamics Using High Spatial Resolution Satellite Imagery between 2000 and 2013. Sci. Rep. 2018, 8, 7409. [Google Scholar] [CrossRef] [Scilit] [PubMed]
- Evans, D.L.; Falagán, N.; Hardman, C.A.; Kourmpetli, S.; Liu, L.; Mead, B.R.; Davies, J.A.C. Ecosystem Service Delivery by Urban Agriculture and Green Infrastructure—A Systematic Review. Ecosyst. Serv. 2022, 54, 101405. [Google Scholar] [CrossRef] [Scilit]
- The Central Environmental Authority (CEA); The World Conservation Union (IUCN); International Water Management Institute (IWMI). National Wetland Directory of Sri Lanka; The Central Environmental Authority (CEA): Battaramulla, Sri Lanka; The World Conservation Union (IUCN): Gland, Switzerland; International Water Management Institute (IWMI): Colombo, Sri Lanka, 2006; ISBN 9558177547. [Google Scholar]
- Department of Census and Statistics, Sri Lanka. Available online: https://www.statistics.gov.lk/ (accessed on 25 June 2026).
- Central Bank of Sri Lanka. Available online: https://www.cbsl.gov.lk/ (accessed on 25 June 2026).
- Blunn, L.; Xie, X.; Grimmond, S.; Luo, Z.; Sun, T.; Perera, N.; Ratnayake, R.; Emmanuel, R. Spatial and Temporal Variation of Anthropogenic Heat Emissions in Colombo, Sri Lanka. Urban Clim. 2024, 54, 101828. [Google Scholar] [CrossRef] [Scilit]
- Department of Meteorology. Available online: https://meteo.gov.lk/ (accessed on 25 June 2026).
- Hettiarachchi, M.; Morrison, T.H.; Wickramsinghe, D.; Mapa, R.; De Alwis, A.; McAlpine, C.A. The Eco-Social Transformation of Urban Wetlands: A Case Study of Colombo, Sri Lanka. Landsc. Urban Plan. 2014, 132, 55–68. [Google Scholar] [CrossRef] [Scilit]
- Manawadu, L.; Wijeratne, V.P.I.S. Anthropogenic Drivers and Impacts of Urban Flooding—A Case Study in Lower Kelani River Basin, Colombo, Sri Lanka. Int. J. Disaster Risk Reduct. 2021, 57, 102076. [Google Scholar] [CrossRef] [Scilit]
- Wadumestrige Dona, C.G.; Mohan, G.; Fukushi, K.; Dissanayaka, N. Exploring the Economic and Environmental Benefits of Colombo Wetlands in Urban Planning with Nature-Based Solutions. Soc. Impacts 2025, 5, 100106. [Google Scholar] [CrossRef] [Scilit]
- Landsat—NASA Science. Available online: https://science.nasa.gov/mission/landsat/ (accessed on 25 June 2026).
- Sentinel-1. Available online: https://sentinels.copernicus.eu/copernicus/sentinel-1 (accessed on 25 June 2026).
- Survey Department of Sri Lanka. Available online: https://survey.gov.lk/ (accessed on 25 June 2026).
- ALOS Global Digital Surface Model “ALOS World 3D—30m (AW3D30)”. Available online: https://www.eorc.jaxa.jp/ALOS/en/dataset/aw3d30/aw3d30_e.htm (accessed on 25 June 2026).
- Google Earth. Available online: https://earth.google.com/web/@0,0,0a,22251752.77375655d,35y,0h,0t,0r/data=CgRCAggBQgIIAEoNCP___________wEQAA (accessed on 25 June 2026).
- Landsat Enhanced Vegetation Index, U.S. Geological Survey. Available online: https://www.usgs.gov/landsat-missions/landsat-enhanced-vegetation-index (accessed on 27 June 2026).
- Landsat Soil Adjusted Vegetation Index, U.S. Geological Survey. Available online: https://www.usgs.gov/landsat-missions/landsat-soil-adjusted-vegetation-index (accessed on 27 June 2026).
- Estoque, R.C.; Murayama, Y. Monitoring Surface Urban Heat Island Formation in a Tropical Mountain City Using Landsat Data (1987–2015). ISPRS J. Photogramm. Remote Sens. 2017, 133, 18–29. [Google Scholar] [CrossRef] [Scilit]
- Athukorala, D.; Murayama, Y. Spatial Variation of Land Use/Cover Composition and Impact on Surface Urban Heat Island in a Tropical Sub-Saharan City of Accra, Ghana. Sustainability 2020, 12, 7953. [Google Scholar] [CrossRef] [Scilit]
- Nguyen, C.T.; Chidthaisong, A.; Diem, P.K.; Huo, L.Z. A Modified Bare Soil Index to Identify Bare Land Features during Agricultural Fallow-Period in Southeast Asia Using Landsat 8. Land 2021, 10, 231. [Google Scholar] [CrossRef] [Scilit]
- Panahi, H.; Azizi, Z.; Kiadaliri, H.; Almodaresi, S.A.; Aghamohamadi, H. Bare Soil Detecting Algorithms in Western Iran Woodlands Using Remote Sensing. Smart Agric. Technol. 2024, 7, 100429. [Google Scholar] [CrossRef] [Scilit]
- Kissiedu, N.E.; Asibey, M.O.; Asare, O.A.; Asare, E.T.M. Wetland Transformation and the Implications for Ecological Resilience in Peri-Urban Ghana. Land Use Policy 2025, 157, 107671. [Google Scholar] [CrossRef] [Scilit]
- Convention on Wetlands. Briefing Note No. 13: Wetlands and Agriculture: Impacts of Farming Practices and Pathways to Sustainability; Secretariat of the Convention on Wetlands: Gland, Switzerland, 2022. [Google Scholar]
- Alikhani, S.; Nummi, P. Urban Wetlands: A Review on Ecological and Cultural Values. Water 2021, 13, 3301. [Google Scholar] [CrossRef] [Scilit]
- Xue, Z.; Hou, G.; Zhang, Z.; Lyu, X.; Jiang, M.; Zou, Y.; Shen, X.; Wang, J.; Liu, X. Quantifying the Cooling-Effects of Urban and Peri-Urban Wetlands Using Remote Sensing Data: Case Study of Cities of Northeast China. Water 2019, 182, 92–100. [Google Scholar] [CrossRef] [Scilit]
- Soto-Montes-de-Oca, G.; Cruz-Bello, G.M.; Martínez-Mendoza, A.; Hiscock, K.M. Understanding and Managing Nutrient Pollution in Peri-Urban Wetlands: The Ciénegas Del Lerma, Mexico. J. Environ. Manag. 2025, 374, 124042. [Google Scholar] [CrossRef] [Scilit] [PubMed]
- The Convention on Wetlands, Accredited Wetland Cities 2018. Available online: https://www.ramsar.org/our-work/activities/wetland-city-accreditation/2018 (accessed on 27 June 2026).
- Colombo’s Wetlands Find New Defenders in Stories, Histories and Heritage—IWMI. Available online: https://www.iwmi.org/news/colombos-wetlands-find-new-defenders-in-stories-histories-and-heritage/ (accessed on 27 June 2026).
- Préau, C.; Tournebize, J.; Lenormand, M.; Alleaume, S.; Boussada, V.G.; Luque, S. Habitat Connectivity in Agricultural Landscapes Improving Multi-Functionality of Constructed Wetlands as Nature-Based Solutions. Ecol. Eng. 2022, 182, 106725. [Google Scholar] [CrossRef] [Scilit]
- Vera-Herrera, L.; Romo, S.; Soria, J. How Agriculture, Connectivity and Water Management Can Affect Water Quality of a Mediterranean Coastal Wetland. Agronomy 2022, 12, 486. [Google Scholar] [CrossRef] [Scilit]
- Zedler, J.B.; Kercher, S. Wetland Resources: Status, Trends, Ecosystem Services, and Restorability. Annu. Rev. Environ. Resour. 2005, 30, 39–74. [Google Scholar] [CrossRef] [Scilit]
- Zorrilla-Miras, P.; Palomo, I.; Gómez-Baggethun, E.; Martín-López, B.; Lomas, P.L.; Montes, C. Effects of Land-Use Change on Wetland Ecosystem Services: A Case Study in the Doñana Marshes (SW Spain). Landsc. Urban Plan. 2014, 122, 160–174. [Google Scholar] [CrossRef] [Scilit]
- Mitchell, M.E.; Newcomer-Johnson, T.; Christensen, J.; Crumpton, W.; Richmond, S.; Dyson, B.; Canfield, T.J.; Helmers, M.; Lemke, D.; Lechtenberg, M.; et al. Potential of Water Quality Wetlands to Mitigate Habitat Losses from Agricultural Drainage Modernization. Sci. Total Environ. 2022, 838, 156358. [Google Scholar] [CrossRef] [Scilit] [PubMed]
- Li, S.; Yang, H.; Lacayo, M.; Liu, J.; Lei, G. Impacts of Land-Use and Land-Cover Changes on Water Yield: A Case Study in Jing-Jin-Ji, China. Sustainability 2018, 10, 960. [Google Scholar] [CrossRef] [Scilit]
- Hou, L.; Zhang, H.; Li, L.; Zhao, J.; Li, X. A Method for Calculating Water Demand for Sediment Transport Based on the Principles of River Dynamics. Water 2023, 15, 3514. [Google Scholar] [CrossRef] [Scilit]
- Pathirana, A.; Denekew, H.B.; Veerbeek, W.; Zevenbergen, C.; Banda, A.T. Impact of Urban Growth-Driven Landuse Change on Microclimate and Extreme Precipitation—A Sensitivity Study. Atmos. Res. 2014, 138, 59–72. [Google Scholar] [CrossRef] [Scilit]
- Xue, S.; Guo, X.; He, Y.; Cai, H.; Li, J.; Zhu, L.; Ye, C. Effects of Future Climate and Land Use Changes on Runoff in Tropical Regions of China. Sci. Rep. 2024, 14, 30922. [Google Scholar] [CrossRef] [Scilit] [PubMed]
- Athukorala, D.; Murayama, Y.; Herath, N.S.K.; Bandara, C.M.M.; Singh, R.K.; Fernando, S.L.J. Exploring the Cooling Effects of Urban Wetlands in Colombo City, Sri Lanka. Remote Sens. 2025, 17, 1919. [Google Scholar] [CrossRef] [Scilit]
- Deng, H.; Feng, J.; Chen, X.; Xiong, Y.; Cao, J.; Liu, K. Regulation of Water Body Cooling Effects in Dense Urban Areas: Roles of Spatial Configuration, Spatial Size, and Built Environment. Sustain. Cities Soc. 2026, 137, 107149. [Google Scholar] [CrossRef] [Scilit]
- Dar, S.A.; Bhat, S.U.; Rashid, I.; Kumar, P.; Sharma, R.; Aneaus, S. Deciphering the Source Contribution of Organic Matter Accumulation in an Urban Wetland Ecosystem. Land Degrad. Dev. 2022, 33, 2390–2404. [Google Scholar] [CrossRef] [Scilit]
- Byekwaso, F.; Langergraber, G.; Weigelhofer, G.; Kaggwa, R.; Kansiime, F.; Hein, T. Anthropogenic and Natural Factors Impacting Microbiological and Physicochemical Surface Water Quality along an Urban Tropical Wetland. J. Water Sanit. Hyg. Dev. 2026, 16, 108–123. [Google Scholar] [CrossRef] [Scilit]
- Saha, T.K.; Sajjad, H.; Sharma, Y.; Das, M.; Ali, R. Assessing and Predicting Wetland Water Quality Using Water Quality Index and Ensemble Machine Learning Models: A Case Study of Deepor Beel (Ramsar Site), Assam, India. Wetlands 2026, 46, 8. [Google Scholar] [CrossRef] [Scilit]
- Petrone, K.C.; Fellman, J.B.; Hood, E.; Donn, M.J.; Grierson, P.F. The Origin and Function of Dissolved Organic Matter in Agro-Urban Coastal Streams. J. Geophys. Res. Biogeosci. 2011, 116, G01028. [Google Scholar] [CrossRef] [Scilit]
- Chowdhury, M.S. Incorporation of Seasonal Land Cover to Develop Seasonally Integrated Land Cover Map for Change Detection in Dhaka Mega City. Sci. Rep. 2026, 16, 468. [Google Scholar] [CrossRef] [Scilit] [PubMed]
- Karimi, V.; Tan, Y.; Naderi, L.; Keshavarz, M.; Singh, G.G. Drivers of Collective Action in Agricultural Water Conservation: Applying the Social Identity Model to Iranian Farmers in a Wetlands Basin. Agric. Water Manag. 2025, 322, 110015. [Google Scholar] [CrossRef] [Scilit]
- Atugonza, C.; Mbabazize, D.; Nyamaizi, S. Climate Change and Water Resource Degradation: Understanding Relationships. J. Water Resour. Prot. 2026, 18, 102–131. [Google Scholar] [CrossRef]
- Anaba, C.I.; Addaney, M.; Kabo-bah, A.T. Implications of Wetlands Degradation on Urban Water Security and Climate Resilience: A Systematic Review and Meta-Synthesis of Assessment Techniques. Wetlands 2026, 46, 47. [Google Scholar] [CrossRef] [Scilit]
- Wu, S.; Yang, H.; Luo, P.; Luo, C.; Li, H.; Liu, M.; Ruan, Y.; Zhang, S.; Xiang, P.; Jia, H.; et al. The Effects of the Cooling Efficiency of Urban Wetlands in an Inland Megacity: A Case Study of Chengdu, Southwest China. Build. Environ. 2021, 204, 108128. [Google Scholar] [CrossRef] [Scilit]
- Su, T.; Yongmei. Evolution of Urban–Agricultural–Ecological Spatial Structure Driven by Irrigation and Drainage Projects and Water–Heat–Vegetation Response. Agriculture 2026, 16, 142. [Google Scholar] [CrossRef] [Scilit]
- Dodangeh, P.; Shah-Hosseini, R.; Homayouni, S. Wetland Monitoring Using a Comprehensive Drought Indicator Based on Meteorological, Agricultural, Hydrological, and Anthropogenic Parameters. Earth Syst. Environ. 2025, 10, 157–184. [Google Scholar] [CrossRef] [Scilit]
- Li, Y.; Zhu, X.; Sun, X.; Wang, F. Landscape Effects of Environmental Impact on Bay-Area Wetlands under Rapid Urban Expansion and Development Policy: A Case Study of Lianyungang, China. Landsc. Urban Plan. 2010, 94, 218–227. [Google Scholar] [CrossRef] [Scilit]
- Margenat, A.; Matamoros, V.; Díez, S.; Cañameras, N.; Comas, J.; Bayona, J.M. Occurrence and Human Health Implications of Chemical Contaminants in Vegetables Grown in Peri-Urban Agriculture. Environ. Int. 2019, 124, 49–57. [Google Scholar] [CrossRef] [Scilit] [PubMed]
- Ayambire, R.A.; Amponsah, O.; Peprah, C.; Takyi, S.A. A Review of Practices for Sustaining Urban and Peri-Urban Agriculture: Implications for Land Use Planning in Rapidly Urbanising Ghanaian Cities. Land Use Policy 2019, 84, 260–277. [Google Scholar] [CrossRef] [Scilit]
- Jayasoriya, V.; Christeen, S.K.P.; Muthukumaran, S.; Thejani Nilusha, R. Predicting Wetland Vulnerability Under Urban Sprawl with an Integrated CA–Markov Model: The Case of Colombo, Sri Lanka. Urban Sci. 2026, 10, 128. [Google Scholar] [CrossRef] [Scilit]
- Sustainable Development Goals. Available online: https://sdgs.un.org/goals (accessed on 27 June 2026).
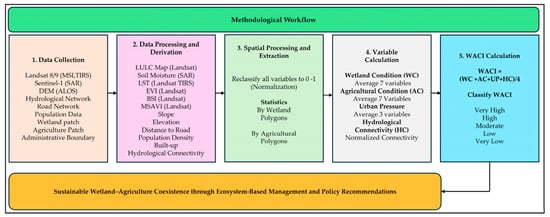
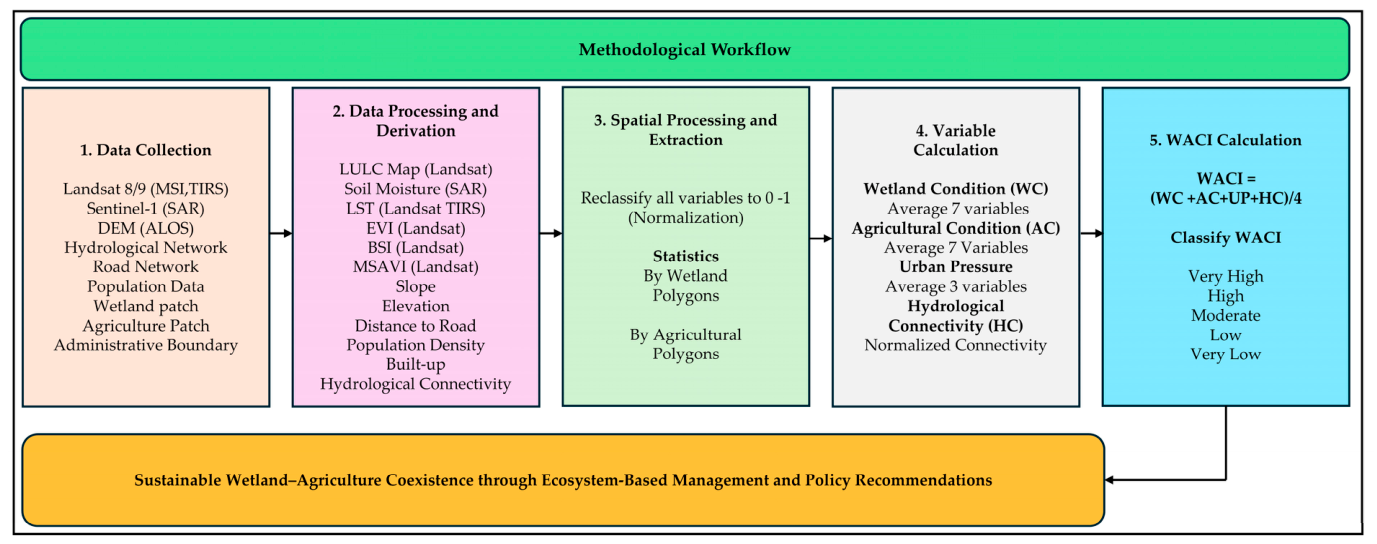
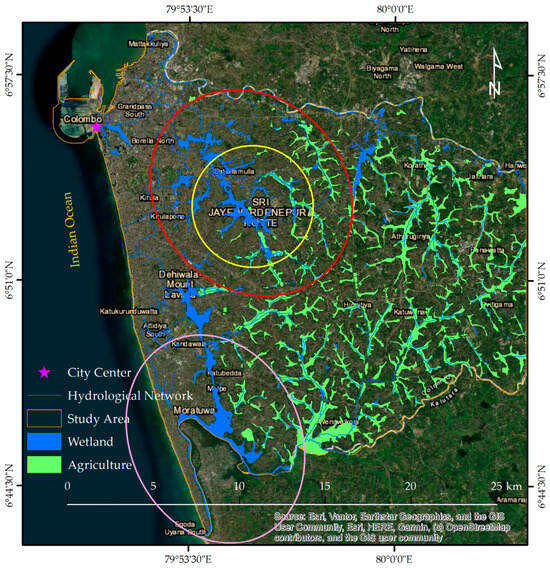
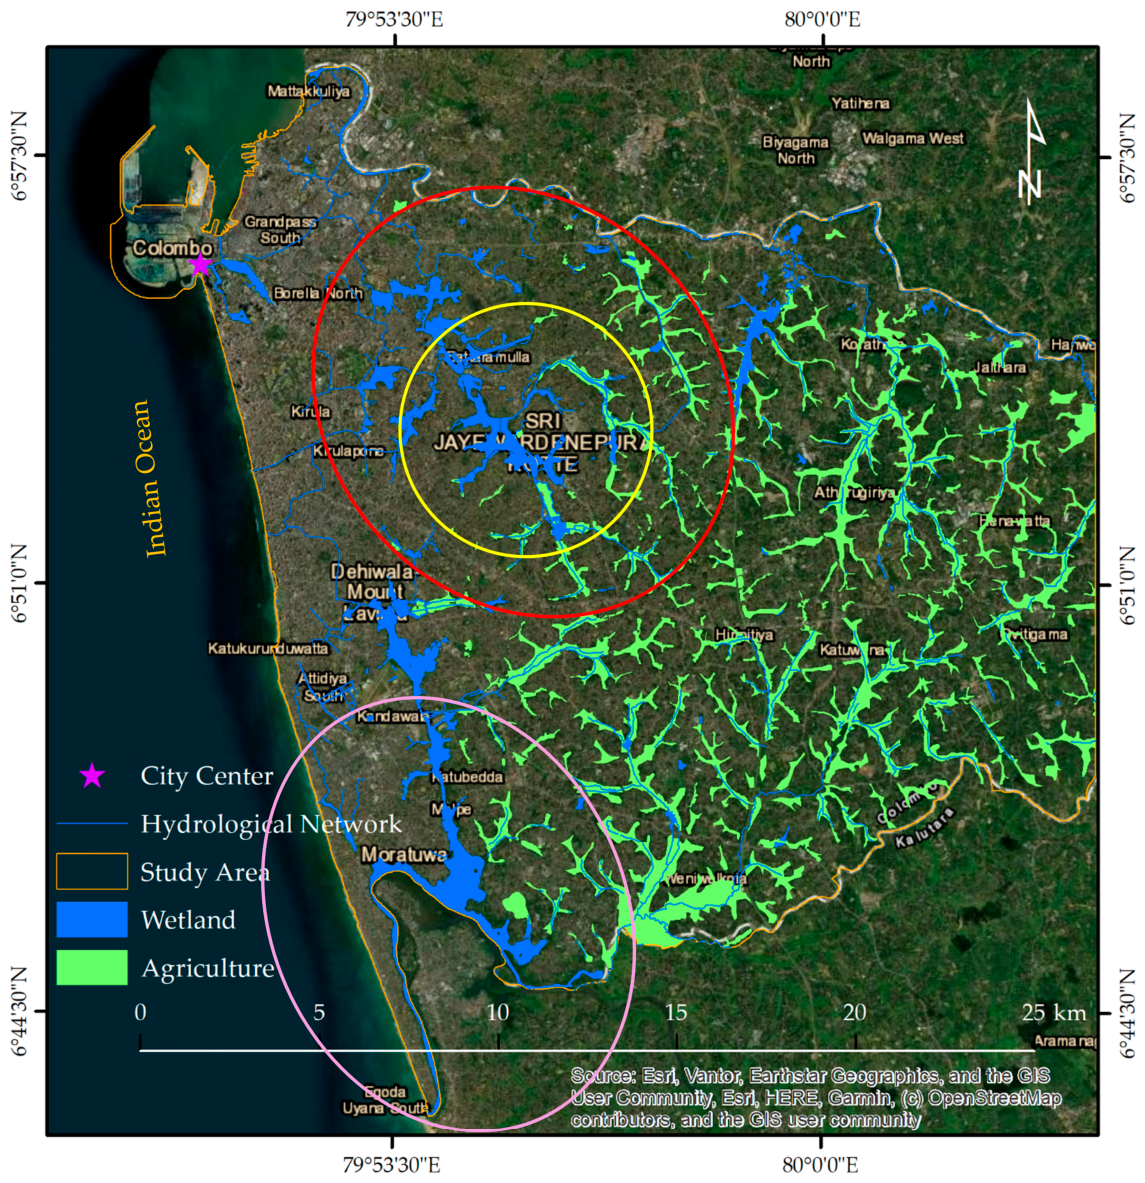
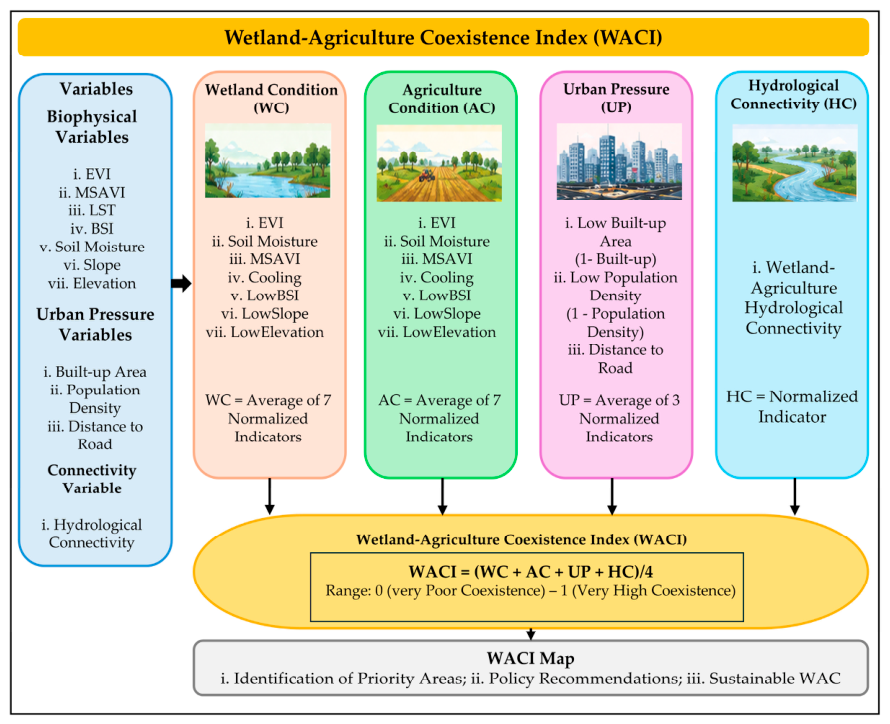
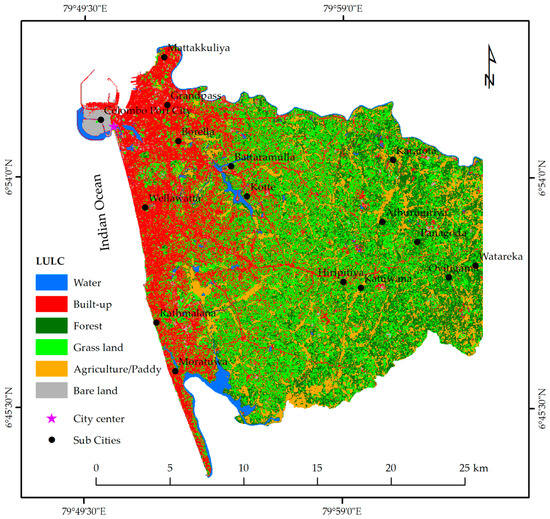
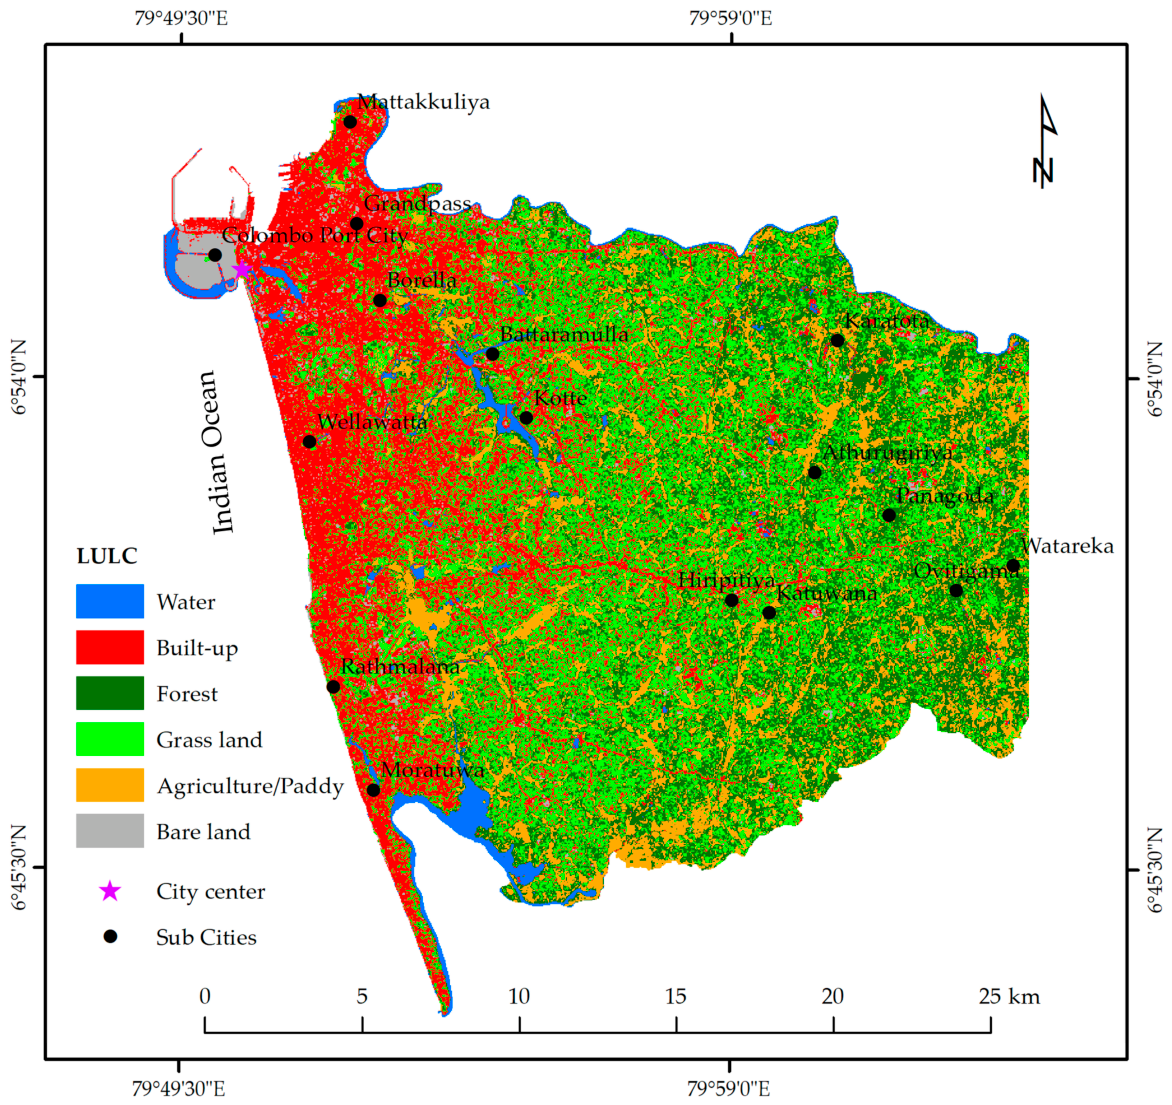
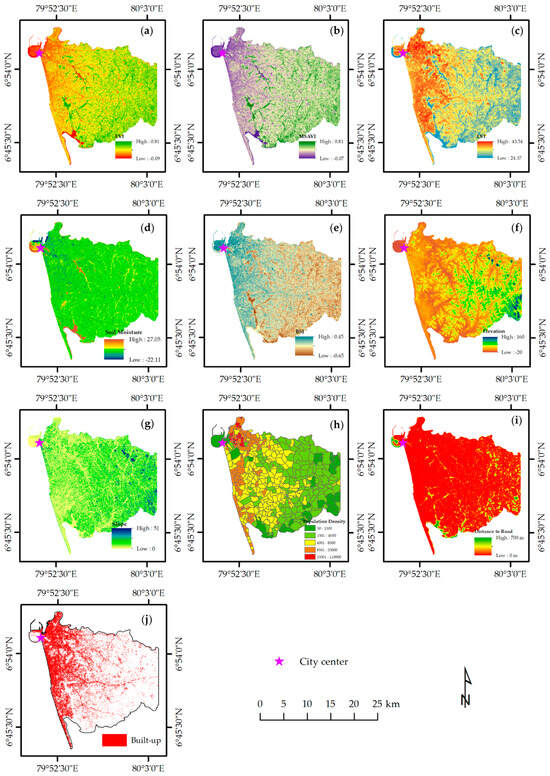
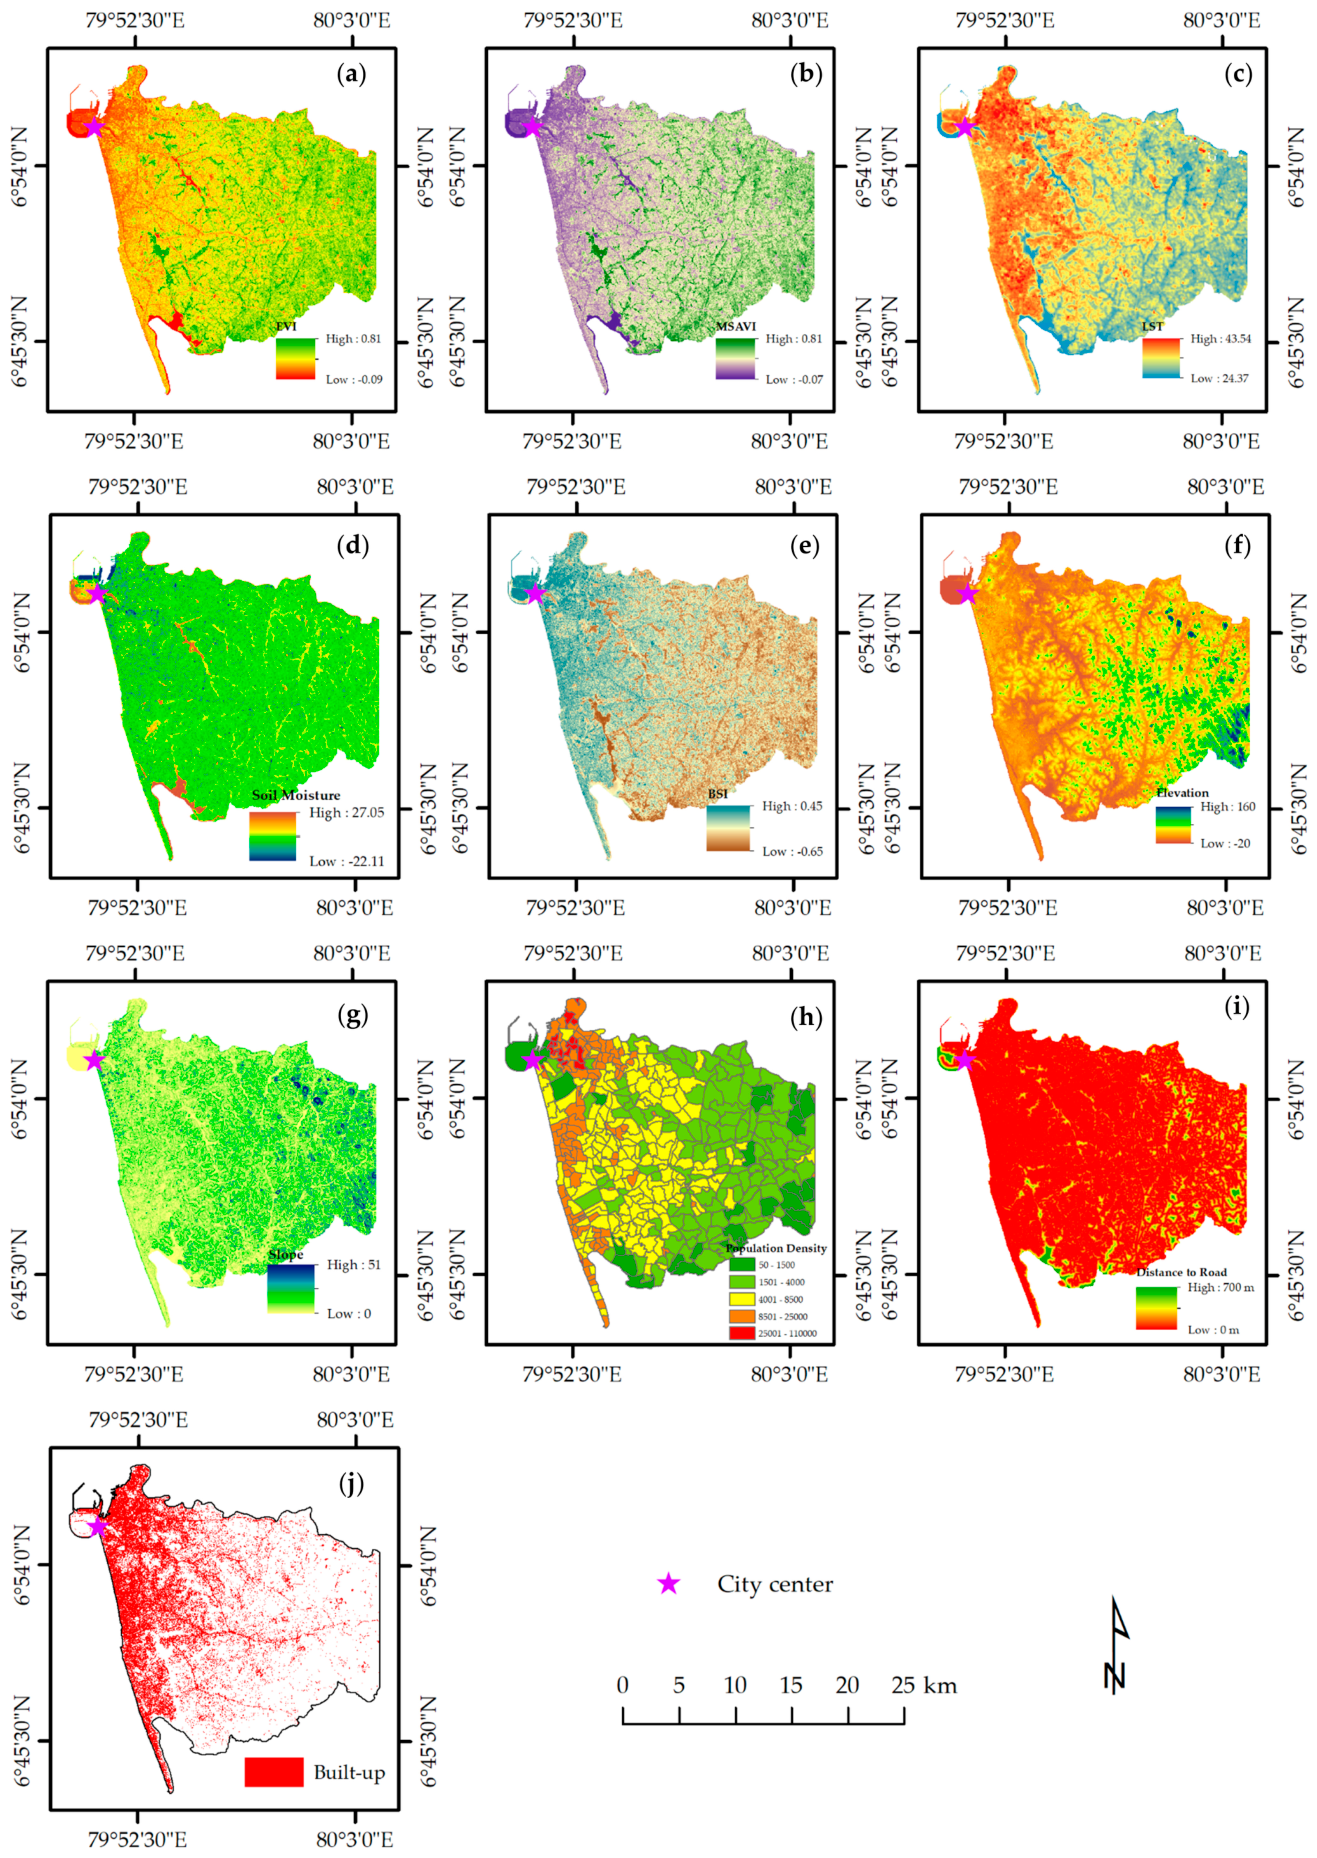
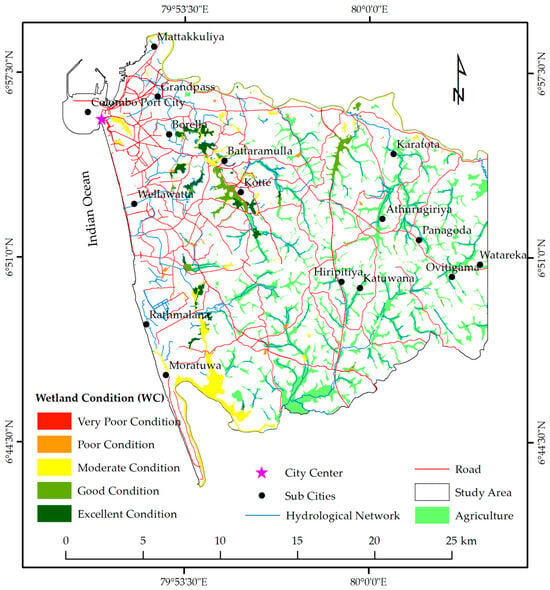
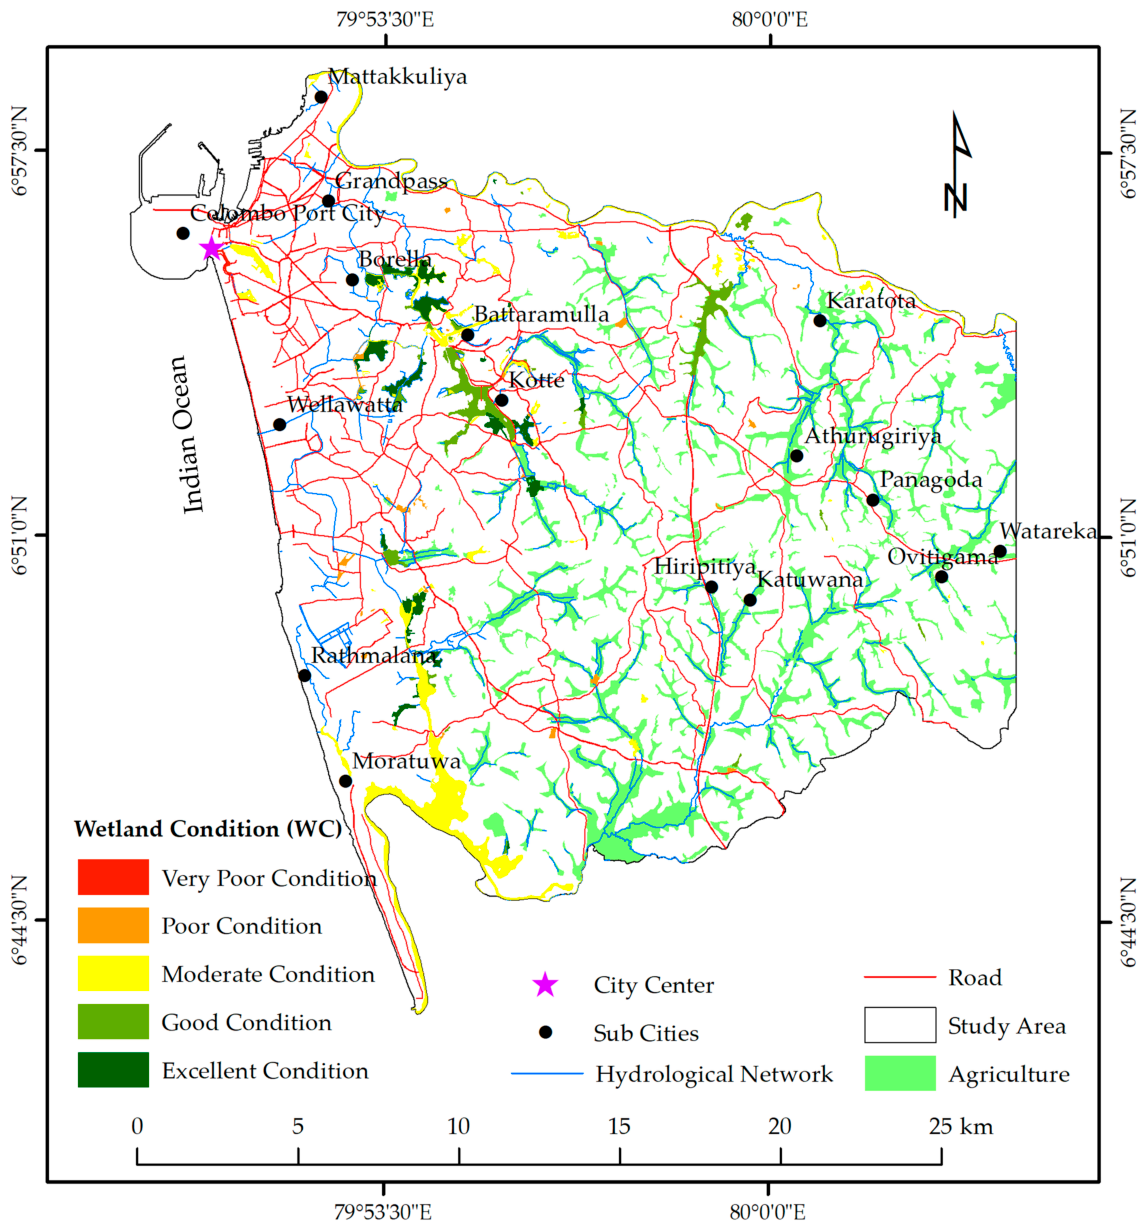
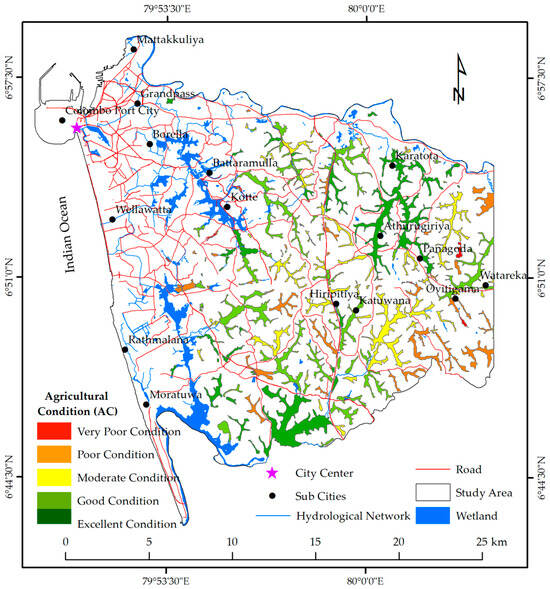
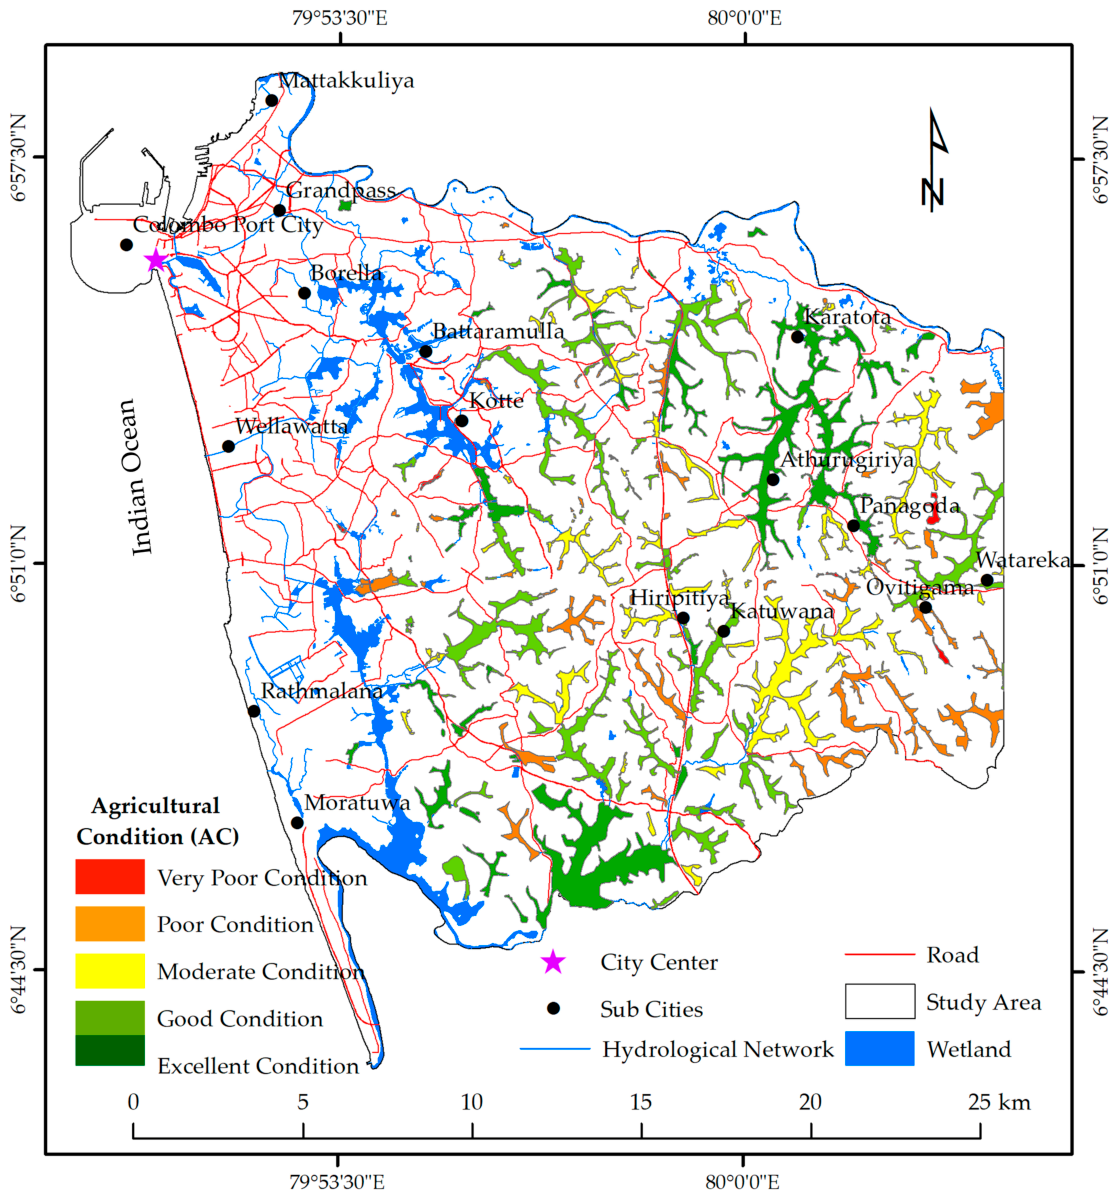
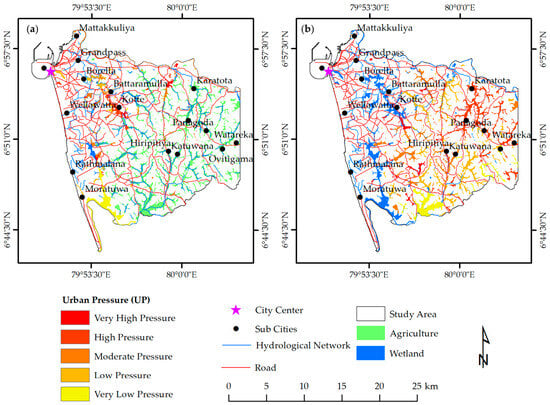
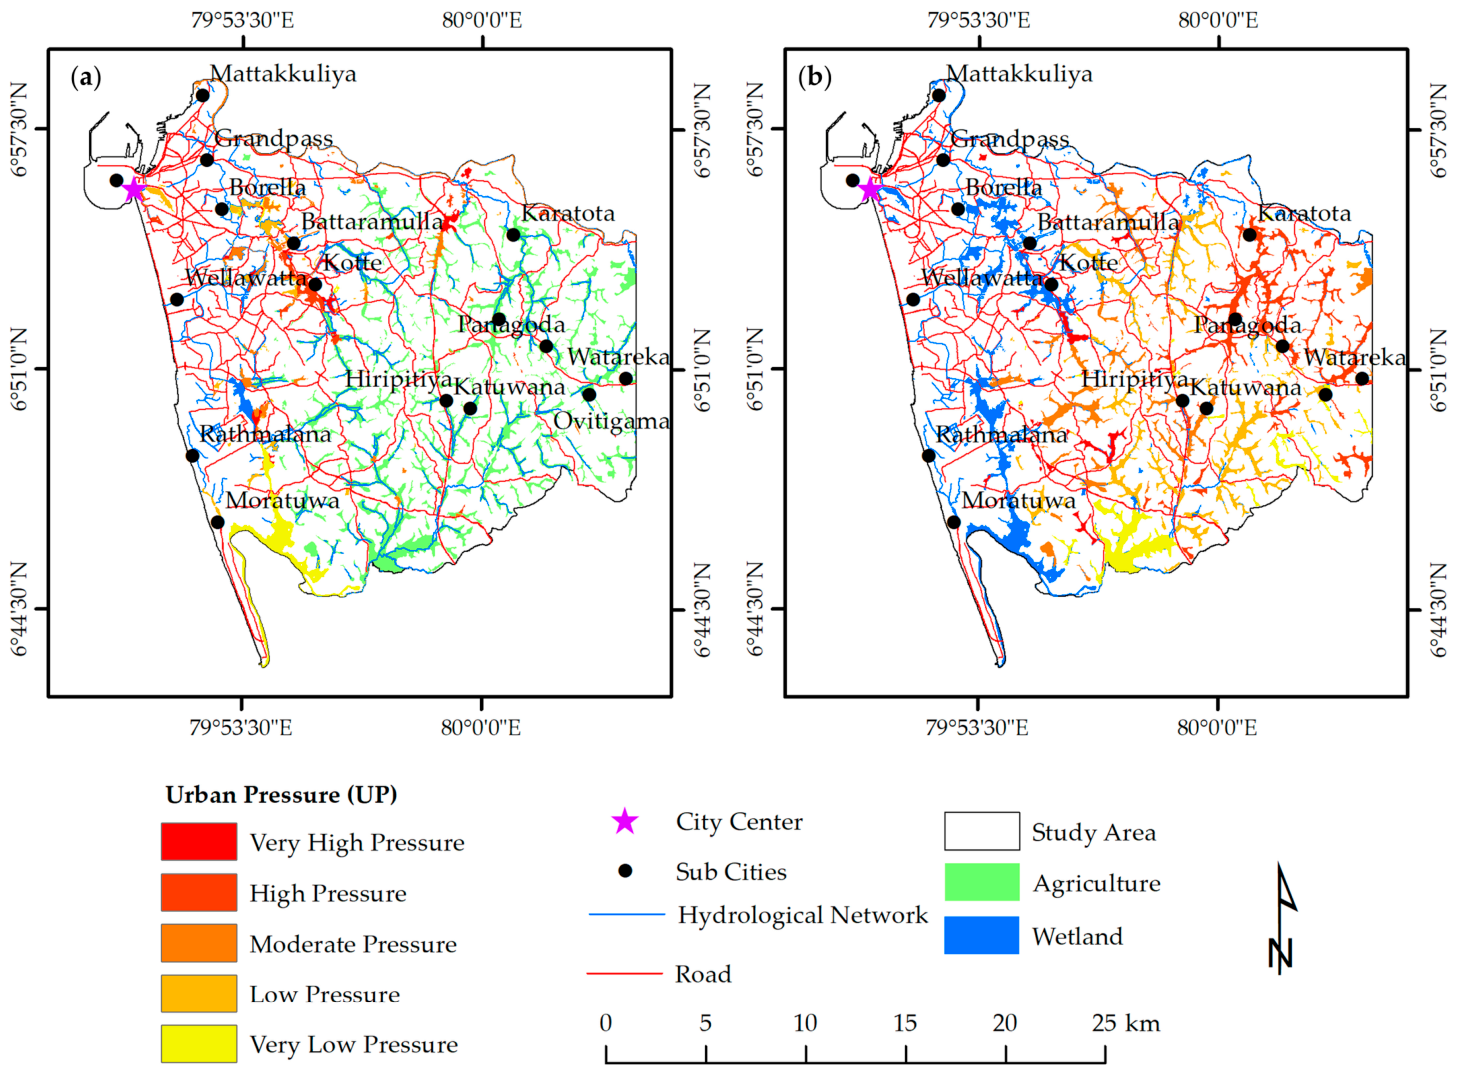
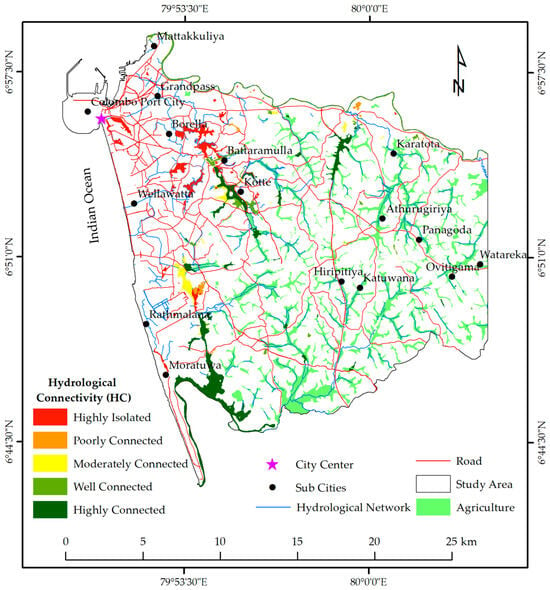
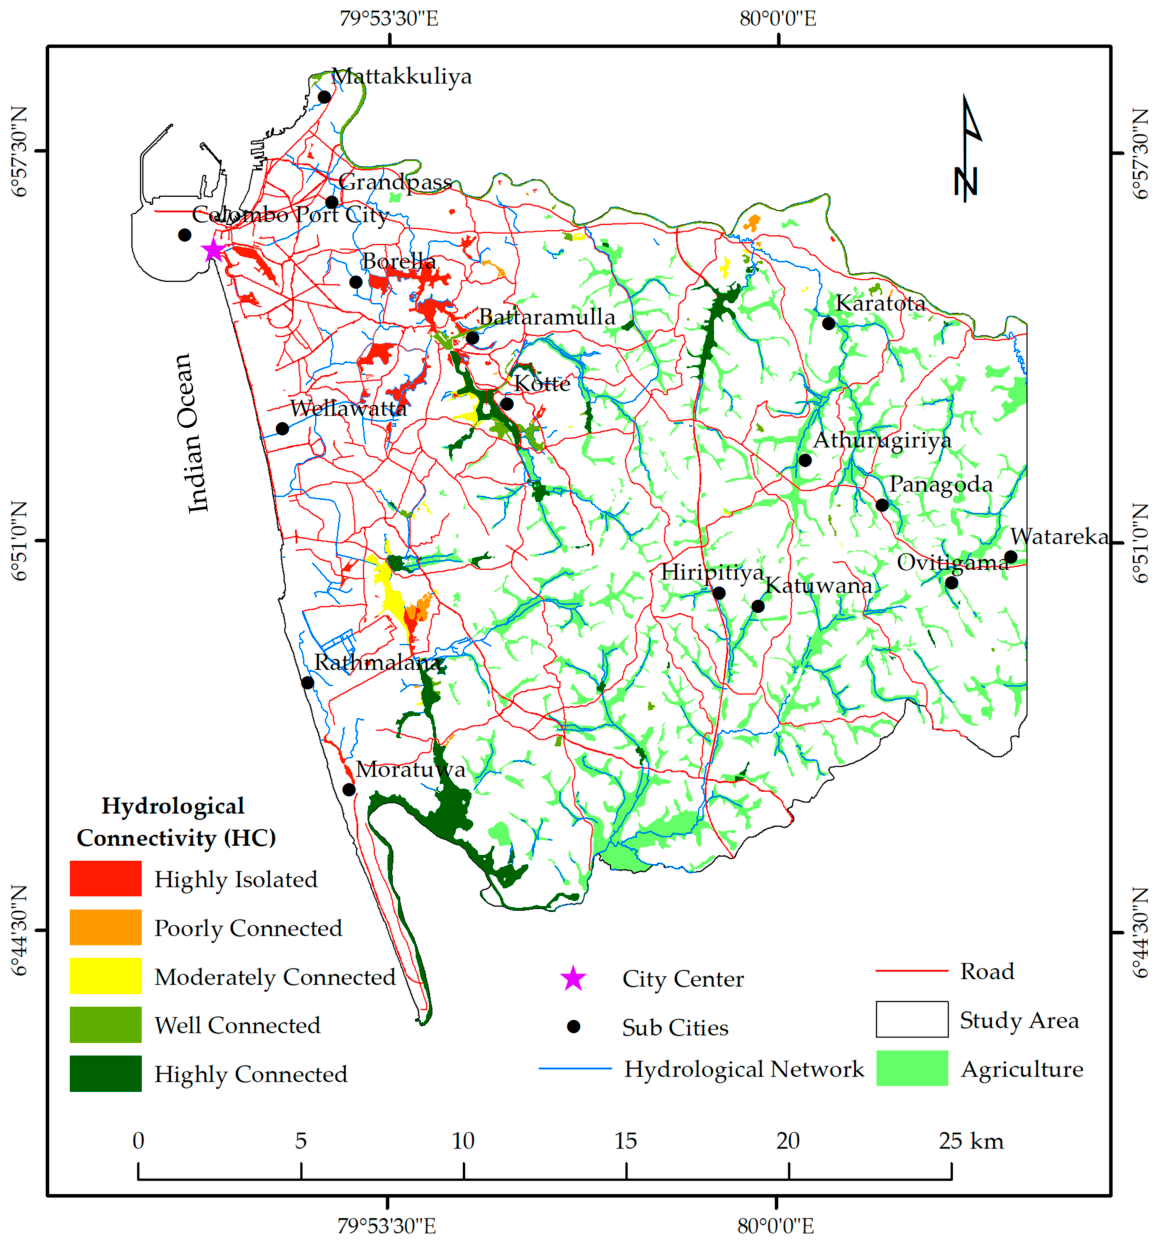
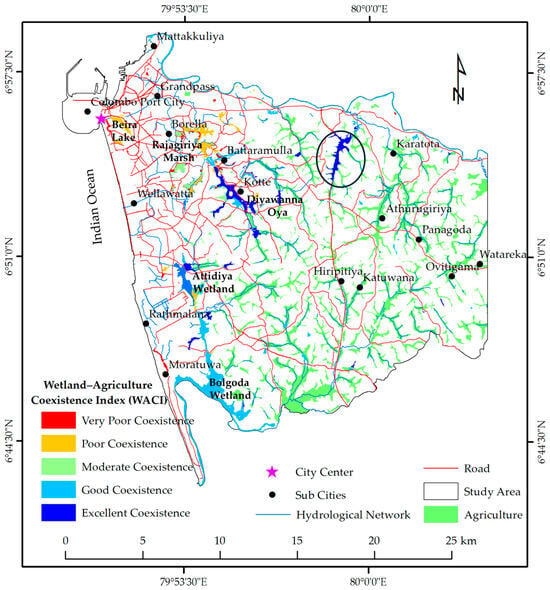
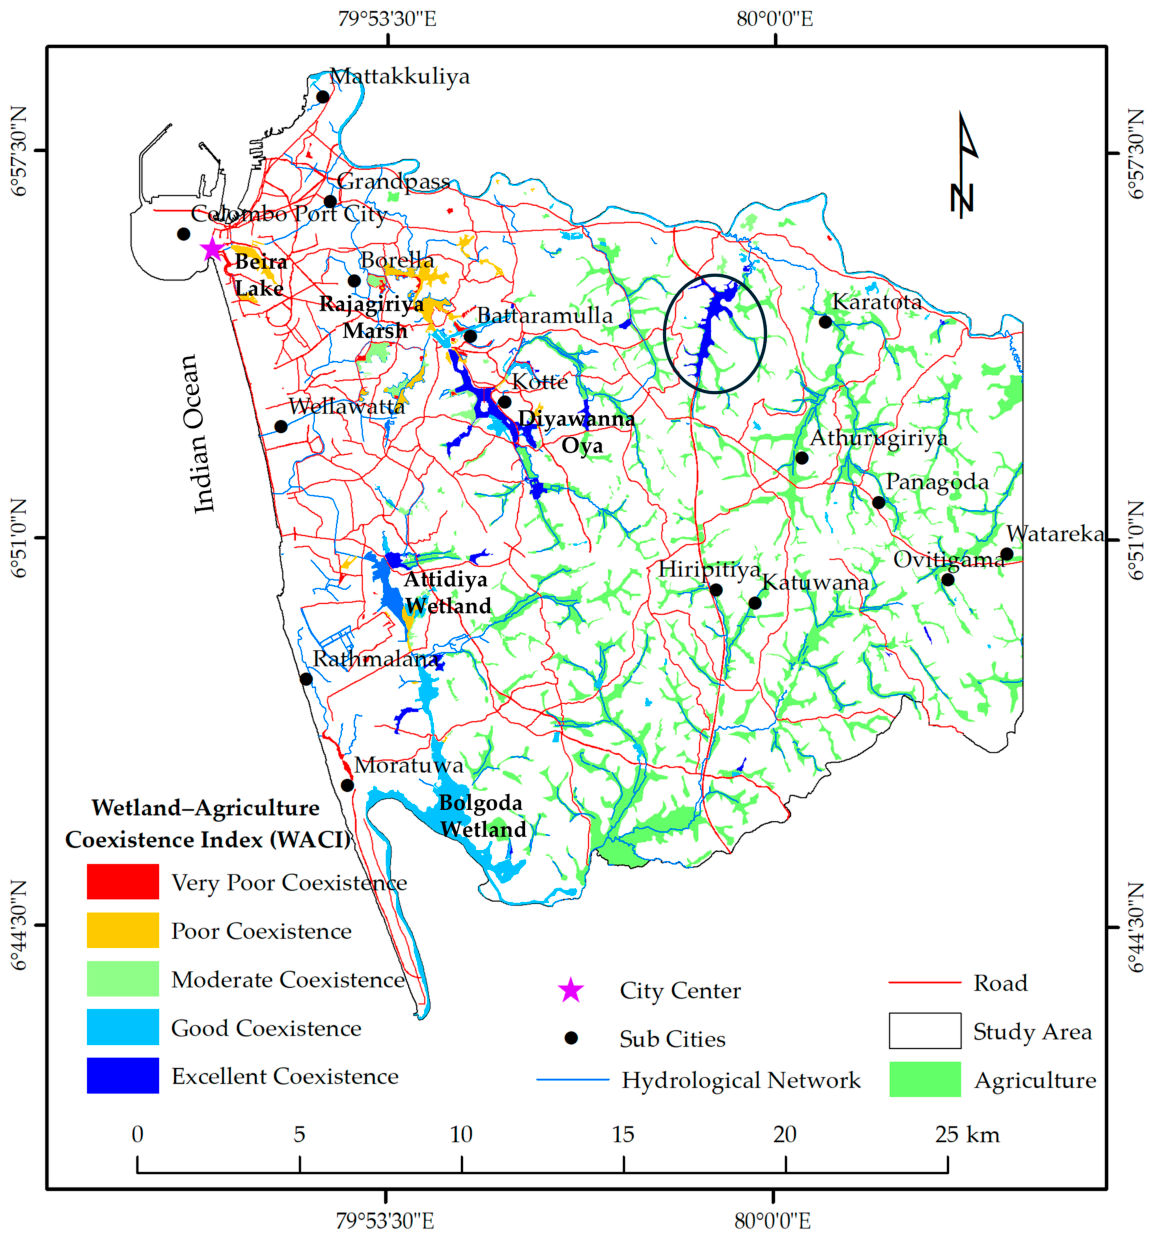

Disclaimer/Publisher’s Note: The statements, opinions and data contained in all publications are solely those of the individual author(s) and contributor(s) and not of MDPI and/or the editor(s). MDPI and/or the editor(s) disclaim responsibility for any injury to people or property resulting from any ideas, methods, instructions or products referred to in the content. |
© 2026 by the authors. Licensee MDPI, Basel, Switzerland. This article is an open access article distributed under the terms and conditions of the Creative Commons Attribution (CC BY) license.