


Abstract
The multifunctionality of urban parks significantly enhances citizen well-being. Uncovering the potential spatiotemporal non-stationary relationships between the built environment and park vibrancy will provide more effective information for urban green space governance. This study estimates park vibrancy based on Baidu heatmap data and depicts the spatiotemporal distribution of vibrancy across three types of urban parks in Chengdu. A Geographically and Temporally Weighted Regression (GTWR) model was applied to explore the dynamic spatiotemporal impacts of internal and external built-environment variables on park vibrancy. The results indicated that the GTWR model demonstrated superior goodness-of-fit compared to the linear regression model. The associations between multidimensional built-environment factors and park vibrancy exhibited notable spatiotemporal heterogeneity. Furthermore, the influence of greenery on park vibrancy was highly context-dependent, varying across perspectives (2D vs. 3D) and granularities (overall vs. local). For instance, normalized difference vegetation index (NDVI), reflecting overall green volume, was negatively associated with park vibrancy, whereas the coverage and fractal dimension of tree canopy, characterizing local vegetation structure, showed predominantly positive associations. These findings provide rich analytical perspectives and effective methodologies for examining and revealing the mechanisms influencing urban-park vibrancy, and can guide policymakers and urban planners in formulating more targeted park-management strategies.
1. Introduction
Urban parks serve as vital public venues for recreational activities and constitute a crucial component of urban infrastructure, facilitating social cohesion and environmental sustainability [1]. The interplay among various functions and services within urban parks produces synergistic effects that trigger chain reactions impacting the social [2], economic [3], and ecological [4] dimensions of the city, thereby exerting a profound and positive influence on human well-being. For instance, urban parks promote the physical and mental health of residents by enhancing environmental comfort, encouraging outdoor activities, and facilitating social interactions [5]. In the field of urban-park research, previous studies have primarily focused on the ecological benefits of parks [6]. In recent years, there has been a growing body of research quantitatively and qualitatively assessing the multifaceted benefits of urban parks, including their impacts on society [7], economy [8], health [9], and recreation [10]. The multifunctionality of urban parks underpins their growing significance in urban areas. Understanding the interactive effects between human activities and park environments is paramount to leveraging their full potential. Consequently, evaluating patterns of park use and elucidating the determinants behind them have become subjects of escalating interest for both policymakers and urban planners.
The concept of vibrancy was first introduced by Jacobs in her influential work The Death and Life of Great American Cities, referring to a city’s capacity to attract residents to engage in diverse activities within a specific area [11]. Higher urban vibrancy enhances resident interaction and well-being, while also increasing social capital and community engagement [12]. Therefore, vibrancy is crucial for developing a livable, engaging, and sustainable city that appeals to both residents and visitors [13], and it is rational to introduce park vibrancy as a metric to evaluate urban parks’ services provided to residents. Traditional vibrancy assessment methods encompass field surveys, face-to-face interviews, and the distribution of questionnaires through both online and offline channels [13,14], but these methods are characterized by low efficiency and high costs [15]. Consequently, an increasing number of studies have adopted data-driven survey methodologies facilitated by big data analytics, and various big data sources such as social media check-in data [16], Wi-Fi access data [17], heatmap data [18], urban sensor data [19], and mobile phone signaling data [20] are increasingly utilized by researchers to characterize urban vibrancy.
Multiple studies have demonstrated that built-environment factors, encompassing both surrounding and park attributes, significantly influence park vibrancy [15,21]. Beyond the conventional two-dimensional and overhead indicators, recent research has begun to incorporate three-dimensional, human-scale perceptual metrics and fine-grained vegetation landscape patterns [22,23]. However, few studies have yet integrated these two categories of indicators into a unified built-environment measurement system to reveal their impact on park vibrancy.
Existing studies tend to employ statistical regression models and machine-learning approaches to uncover the relationship between park vibrancy and the built environment [15,20]. However, most of these methods implicitly assume that the built-environment–vibrancy relationship is spatially and temporally stationary, treating the influence of environmental factors on park visits as constant across locations and time. This assumption overlooks the possibility that the same environmental factor may affect park vibrancy differently, or even oppositely, in different places and at different times, a spatiotemporal non-stationarity that global-regression models and machine-learning approaches cannot capture [24,25]. The GTWR model, which calibrates regression coefficients locally across both space and time, provides the most direct means of revealing this non-stationarity.
To address the aforementioned deficiencies, this study uses Baidu heatmap data to characterize park vibrancy and constructs a dataset of internal and external environmental variables using multisource big data. From a 2D–3D perspective, this study introduces a 3D greening factor (green view index) and local greening factors (coverage, fragmentation index, and fractal dimension of tree canopy). The overarching objective is to employ the GTWR model to uncover the spatiotemporal non-stationarity of environmental factors’ influence on park vibrancy. Furthermore, the results will be translated into policy recommendations to assist urban planners in formulating targeted interventions aimed at revitalizing urban parks. Specifically, this study addresses the following research questions:
- How is the urban-park vibrancy distributed spatially, and how does it fluctuate over time?
- Do internal and external built-environment factors influence park vibrancy, and what spatiotemporal heterogeneity characterizes these effects?
- How do the effects of 2D–3D greening indicators on park vibrancy differ across observational perspectives and analytical granularities?
2. Literature Review
2.1. Built-Environment Factors Affecting Park Vibrancy
Relevant urban studies have demonstrated that built-environment attributes significantly influence travel and activity patterns of residents [26,27], prompting many studies to include variables such as density, design, and diversity in their analyses when exploring links between the built environment and urban vibrancy [13,28,29]. As public leisure spaces for city dwellers, urban parks are very likely to be strongly associated with these attributes. According to previous literature, built-environment variables relevant to park vibrancy are broadly grouped into two categories, which are surrounding attributes and park attributes, covering aspects such as demand, land use, accessibility, vegetation, size and location.
First, surrounding attributes, including demand (e.g., floor-area ratio and building density), land use (e.g., commercial facility density and land-use mix), and accessibility (e.g., road density and the number of bus stops), play a crucial role in determining park visits [30,31]. The development intensity and land use mix around parks are significantly associated with visitor numbers [32], and resident density nearby is a major driver of park visits [15]. Lyu and Zhang found that parks surrounded by high-density buildings attract more visitors [33]. Accessibility-related factors also exert a non-negligible influence on park vibrancy. For instance, Zhang and Zhou revealed that the number of bus stops nearby significantly boosts visits across all parks [34]. However, when parks were disaggregated by type, it was found that this variable showed no significant association with visitation to smaller parks, such as neighborhood parks. Some other accessibility-related variables, such as sidewalk and intersection availability, as well as road density, also positively influence park visitation [35]. Second, park attributes are likewise linked to its vibrancy. Factors such as size [34], location [21], internal facilities [15], and vegetation [36] all correlate with park visits. For example, larger parks may attract more visitors due to their greater number of trees, walking paths, and space for activities [21]. Similarly, parks equipped with a greater number of recreational amenities, sports facilities, and restrooms also record higher visitation [35]. Additionally, vegetation and greenery are also vital for park vibrancy. For instance, excessively high normalized difference vegetation index (NDVI) values may, to some extent, diminish a park’s visits [36,37].
However, much of the existing literature on park vibrancy has focused predominantly on two-dimensional, overhead metrics of the built environment and aggregate-level measures of greenery. This has largely come at the expense of three-dimensional, human-scale, perceptual variables and fine-grained, vegetation landscape patterns that capture qualitative aspects. Technological progress in computing has fueled the advent of innovative methodologies and data sources. Among these, street-view platforms (e.g., Baidu and Google Street View) deliver rich datasets on urban street environments. A key advantage of street-view imagery over traditional top-down remote sensing is its capacity to mimic the human visual experience, thereby reflecting the actual perception of the built environment. This capability establishes it as a vital foundation for investigating subjective dimensions like streetscape perception [29]. As a result, street view imagery has been extensively utilized in urban spatial research, spanning applications from urban greening assessment [38,39,40] and building identification [41] to urban environmental quality evaluation [42]. Prior studies have shown that streetscape as seen from the human-eye perspective plays a vital role in shaping vibrancy [43,44]. In addition, the vegetation in a park influences and shapes the recreational activities of visitors [45], and its landscape strongly affects visitors’ emotions [23], thereby indirectly impacting the park’s recreational vibrancy. Therefore, this study examines, based on existing research, what factors associated with these two aspects influence park vibrancy, and delineates their positive or negative effects.
2.2. Methods for Analyzing the Associated Factors of Park Visits
To examine the links between built-environment variables at both the internal and external dimensions and park vibrancy, existing studies have employed a variety of methods, including linear regression [32], logistic regression [46], geographically weighted regression (GWR) [47], geographical detector [48], structural equation model [49], and machine learning [20]. These methods have effectively explored the relationships between built-environment variables and park vibrancy. For instance, Lyu and Zhang conducted correlation and multiple regression analyses to investigate the usage of 57 urban parks in Wuhan, while also examining the factors influencing park visitation [33]. Gao et al. employed the geographical detector to systematically examine the independent and interactive effects of influencing factors on visitor volume across different types of urban parks [15]. Leveraging an interpretable machine-learning approach (XGBoost model combined with the SHAP framework), Zhang et al. systematically examined the non-linear effects and interactions of built-environment factors on pocket park vibrancy in Chongqing [20]. Cui et al. used Baidu heat map data to profile the dynamics of visitor vibrancy in urban parks [50]. By applying the geographical detector and Multi-scale Geographically Weighted Regression (MGWR) models, Cui et al. elucidated the underlying drivers of this vibrancy and thereby revealed their inherent spatial heterogeneity.
However, the influence of the built environment on vibrancy is spatiotemporally non-stationary [51], and most of the aforementioned methods are unable to reveal such relationships. The GTWR model extends the Geographically Weighted Regression (GWR) model by explicitly incorporating the temporal dimension [52], thereby coupling spatial and temporal factors into a unified analytical framework. The GTWR model offers a key advantage over global-regression models like linear regression by allowing for local calibration of regression coefficients across space and time, thus more accurately capturing the inherent spatiotemporal dynamics between drivers and the response variable. Motivated by the need to address the gap in understanding the spatiotemporal non-stationarity of built-environment–park-vibrancy associations, this study adopts the GTWR model as the primary regression model.
3. Materials and Methods
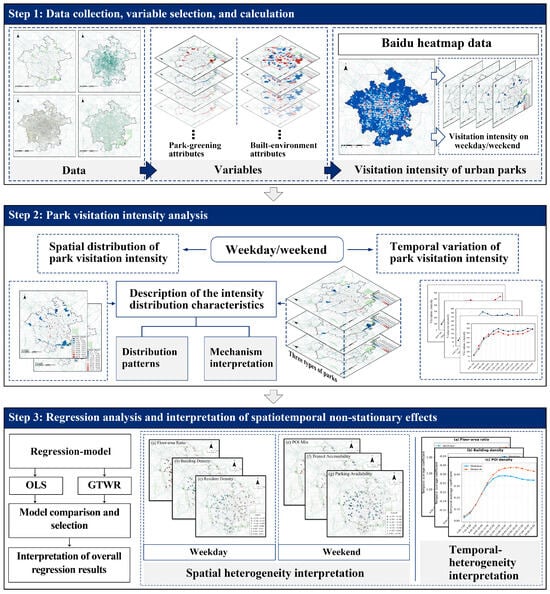
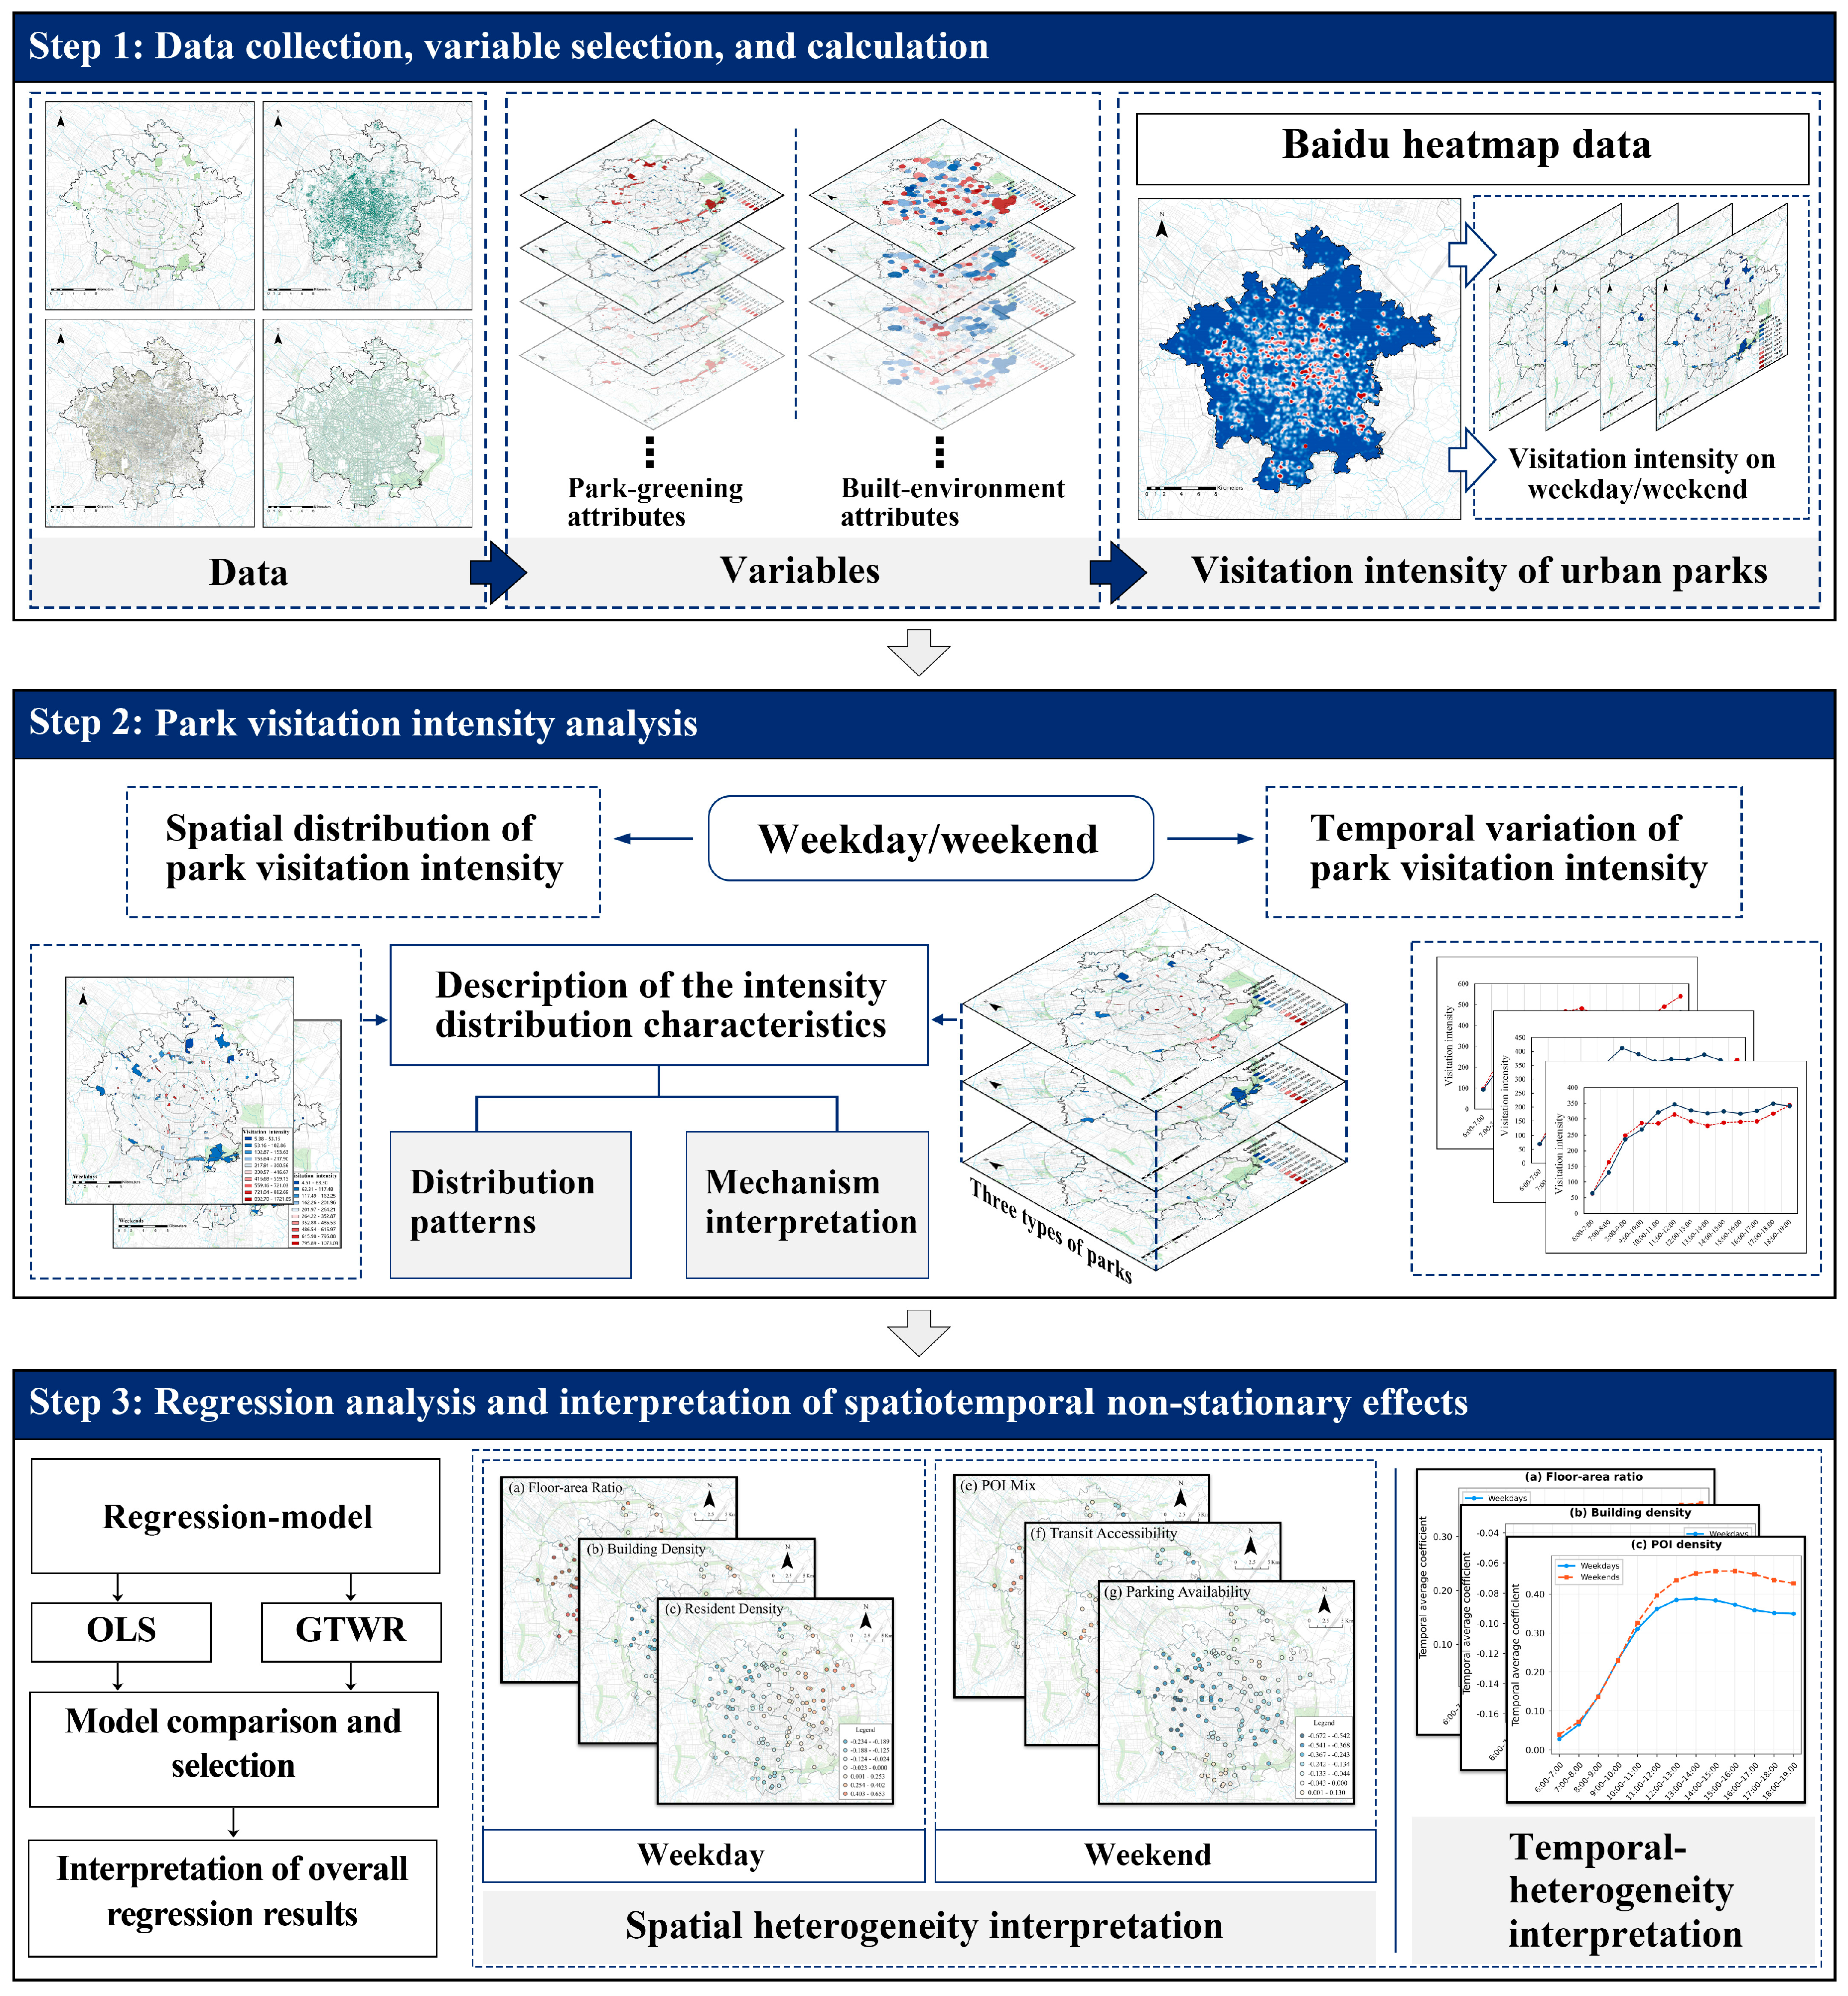
The framework of this study is shown in Figure 1, which consists of the following three parts: (1) Data collection, variable selection and calculation, (2) analysis of urban-park vibrancy based on Baidu heat map data, and (3) regression analysis and interpretation of spatiotemporal non-stationary effects of built-environment factors on park vibrancy with the employment of the GTWR model.
Figure 1.
Framework of this study.
3.1. Study Area
The study area encompasses the five traditional core districts of central Chengdu, namely Qingyang, Jinjiang, Jinniu, Chenghua, and Wuhou districts, spanning approximately 424 km2. Chengdu, the capital and largest city of Sichuan Province in southwestern inland China, is a nationally designated central city, a renowned historic and cultural center, and the pivot of the Chengdu–Chongqing Economic Zone. In 2018 the municipal government formally launched the Beautiful, Livable Park City initiative. Thanks to the city’s unique physical setting and strong policy support, parks and green spaces have since been developed on a priority basis.
The five districts differ markedly in area and population (according to the 2024 Chengdu Statistical Yearbook). Wuhou district, which encompasses the high-tech industrial development zone, has the largest population (approximately 1.9 million). Jinjiang district, the traditional commercial core, is the smallest in area (approximately 61 km2) but the most densely populated. Jinniu and Chenghua districts are larger residential and mixed-use areas with populations of approximately 1.28 and 1.40 million, respectively, while Qingyang district, the historic core, has a population of approximately 0.96 million. This heterogeneity in population distribution and urban form contributes to the spatially varying park vibrancy observed in this study.
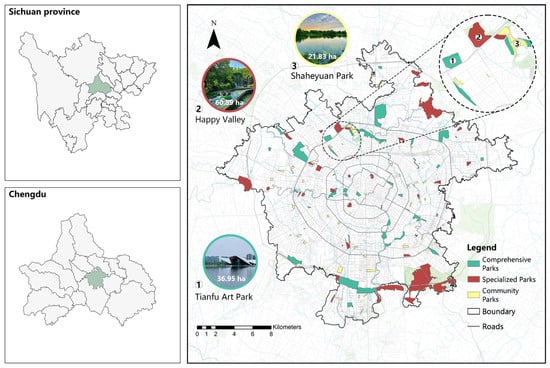
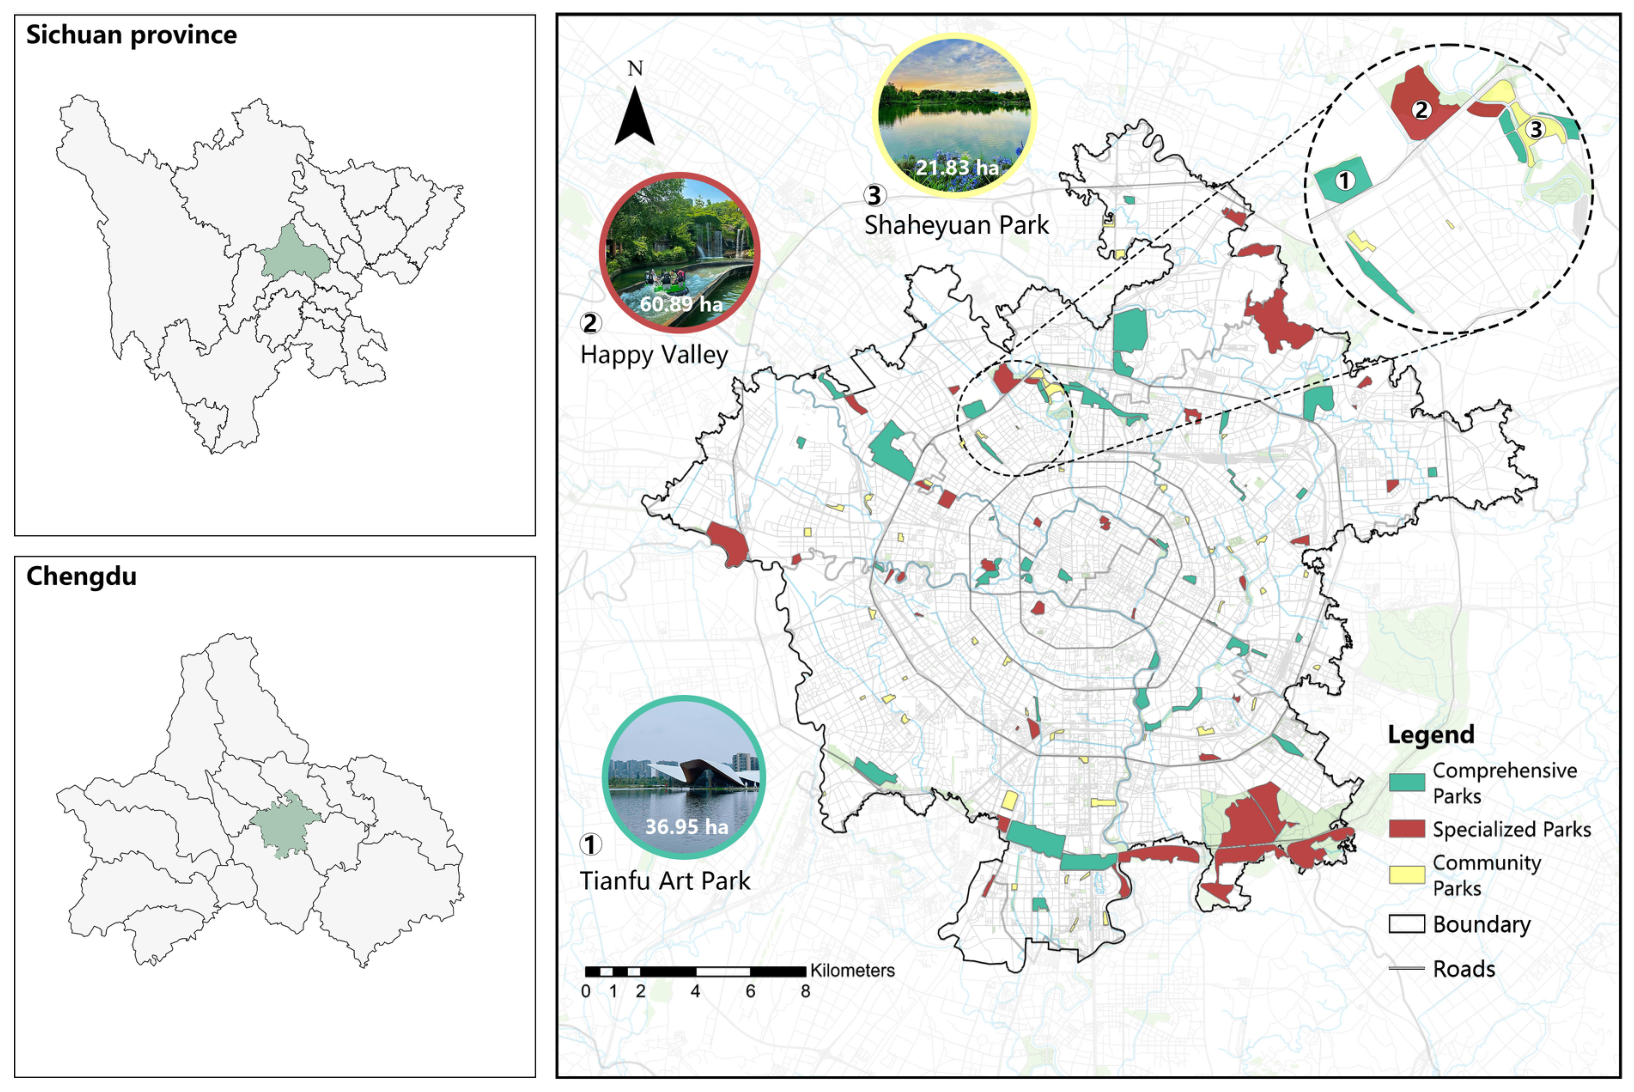
Following Chengdu’s Urban Green Space Classification, which divides parks into comprehensive, specialized, and community types according to size and function, this study identified 40 comprehensive, 38 specialized, and 47 community parks. Identification was based on Amap’s area of interest (AOI) data, the municipal green-space master plan, supplementary documents, and field verification (Figure 2).
Figure 2.
Spatial distribution of urban parks in the study area.
3.2. Data Sources
3.2.1. Baidu Heatmap Data
Park vibrancy is measured with Baidu Heatmap, a big-data product that aggregates anonymized location requests from hundreds of millions of users to generate a continuous surface of relative population density. Kernel-density estimates are converted into a color gradient and displayed on Baidu Maps [48,53]. Although the layer does not give absolute headcounts, studies have shown it to be a reliable proxy for the spatiotemporal dynamics of urban activity [54].
Recent studies have shown that the population conforms to the similar distribution and evolution regularity based on Baidu heatmap data from Monday to Friday (weekdays), and on Saturdays and Sundays (weekends) [53]. We therefore acquired heatmaps for central Chengdu from 10 to 14 April 2023 (Mon–Fri) and 15 to 16 April 2023 (Sat–Sun) to capture weekday and weekend patterns, respectively. Data were collected at 60-min intervals between 6:00 and 19:00, yielding 91 daytime maps of park vibrancy. The selected week was free of public holidays and major special events, and had mild, comfortable weather (mean maximum temperature 29.5 °C and mean minimum 16.4 °C), making it a representative period for park use without extreme conditions. Night-time baseline density (00:00–6:00, weekdays only) was also recorded to represent the residential population.
To derive park-level vibrancy, the Baidu heatmap data at each hourly time step were converted from point records to a continuous raster surface using inverse distance weighting (IDW) interpolation in ArcGIS 10.2. The mean raster value within each park’s AOI was then extracted by zonal statistics, yielding an hourly vibrancy value for each park. Restricting the extraction to the park boundary excludes surrounding streets and buildings, so the resulting value reflects the average population density within the park rather than a direct visitor count.
To mitigate the non-independence arising from repeated observations of the same park across days, the hourly heat values were averaged across days within each day type. For each park, the 13 h observations were averaged over the five weekdays (10–14 April) and over the two weekend days (15–16 April), respectively. Three regression datasets were then constructed (the whole week, averaged over all seven days; weekdays; and weekends), each containing 125 parks × 13 h, thereby removing the day-level repeated measures while preserving the spatial and hourly temporal dimensions.
3.2.2. Baidu Streetscape Image Data
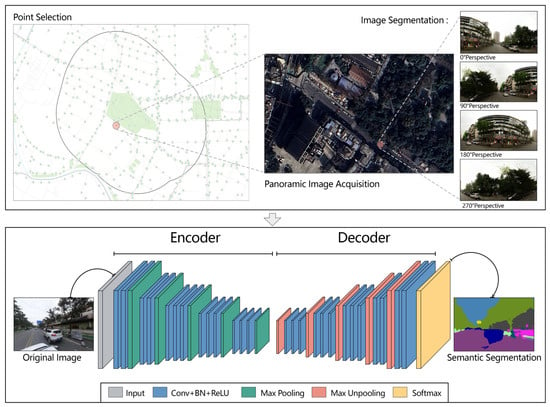
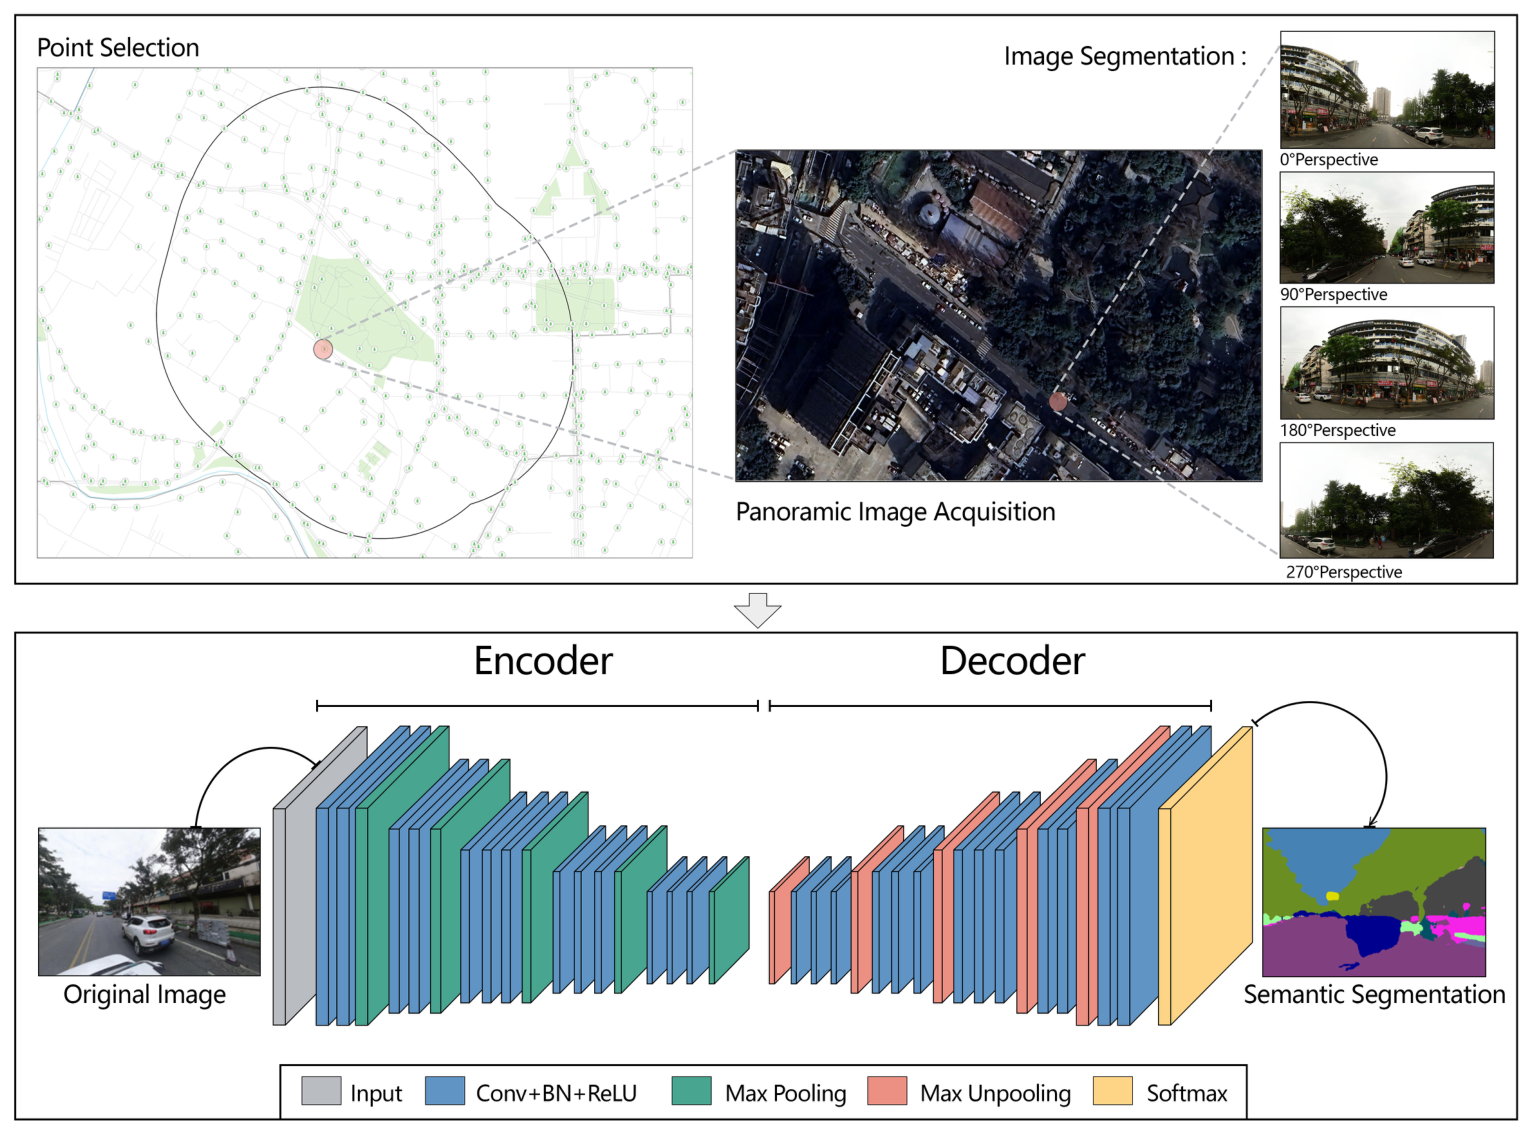
Street-view imagery depicts the physical environment from a perspective highly similar to human vision, effectively representing static 360-degree panoramic streetscapes [22]. Using deep-learning technology, this study quantitatively extracted visual factors from streetscape images obtained from Baidu streetscape map service launched in 2013, which include sky, green vegetation, buildings, and other elements. Along the street center lines, sampling points were placed in ArcGIS 10.2. Then this study converted their coordinates to the Baidu reference system, and downloaded the corresponding panoramas via the Baidu Map’s API. Each panorama was split into four quadrants before semantic segmentation to reduce distortion-induced error (Figure 3).
Figure 3.
Collection and semantic segmentation of streetscape images.
3.2.3. Other Basic Data
The park directory was obtained from the Chengdu Park City Construction Administration Bureau. This study used the geocoding service of the AMap API to search for each park and get coordinates of points located on their circumference. Python 3.9 was used to connect the individual points with lines and then construct polygons that define the AOIs for each park. Finally, each AOI was checked against recent satellite imagery in ArcGIS to confirm the accuracy of the boundaries.
The remaining data sources include four categories: satellite imagery, building information, road information, and points of interest (POI). The high-resolution satellite imagery data were downloaded from Google Satellite Map and originated from the WorldView series satellites operated by DigitalGlobe, Inc. of the United States (Westminster, CO, USA), with a relatively high spatial resolution, enabling clear identification of various land-cover types [55]. POIs, building information, and road data were collected from Amap (https://www.amap.com; accessed on 20 August 2023). NDVI data were derived from cloud- and shadow-free Landsat observations processed on the Google Earth Engine platform.
3.3. Built-Environment Variables
Built-environment variables influencing park vibrancy encompass numerous aspects. Based on existing research, this study selected 16 built-environment variables from surrounding (external) and park (internal) attributes (Table 1).
Table 1.
Definitions of built environmental variables.
3.3.1. Surrounding Attributes
The surrounding environmental characteristics influencing urban-park vibrancy are complex and can be further categorized into four distinct factors: demand-related factors, land-use-related factors, accessibility-related factors, and streetscape-related factors. A 500-m buffer zone was established to reflect the surrounding environment features. This scale is consistent with the ‘parks accessible within 500 m’ target adopted in Chengdu’s park city plans (2019–2035).
Demand-related factors include building capacity and resident density. Building capacity is typically quantified using floor-area ratio and building density [51]. Resident density could be inferred from Baidu heatmap data, specifically the average hourly heat intensity within the buffer zone from 0:00 to 6:00 on weekdays. Because most residents are at home during the night, this night-time window reflects the resting, and therefore residential, population, minimizing the influence of daytime work and leisure activities. This day–night population contrast is well documented in Baidu heat map studies [53]. The night-time baseline was validated against WorldPop gridded population data [56], showing a strong correlation with the buffer-level population density, confirming its adequacy as a proxy for resident density. Land-use-related factors refer to the diversity of activities available around the park, including POI density and POI mix. Accessibility-related factors reflect surrounding transportation conditions, including transportation infrastructure and road characteristics. This study employed transit accessibility, parking availability, and road density as accessibility variables. Shannon’s entropy was used to compute POI mix and its formula is:
where represents the ratio of the number of a certain type of POI facility to the total number of all POIs, and is defined as the number of POI types.
For streetscape-related factors, green view index and streetscape mix were utilized to characterize perceptions of greenness and environmental richness, respectively. This study chose the visual impact semantic algorithm SegNet based on the fully convolutional network (FCN) released by Cambridge University to conduct semantic segmentation on street-view images and calculated the area of each visual factor [57]. Then, the proportion of green vegetation in the images was extracted to represent the green-view index. As with the POI mix, Shannon entropy was employed to quantify categorical diversity within each scene. Green view index and streetscape mix are calculated as follows:
where means the sum of the pixel areas of green vegetation, represents the total pixel area of one street view image, is the ratio of the pixel area of a certain type of streetscape visual factor to the total pixel area, and is the number of visual factor types.
3.3.2. Park Attributes
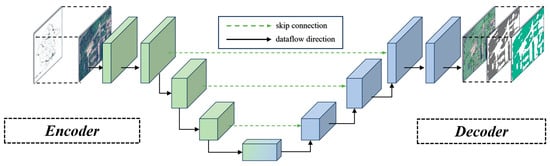
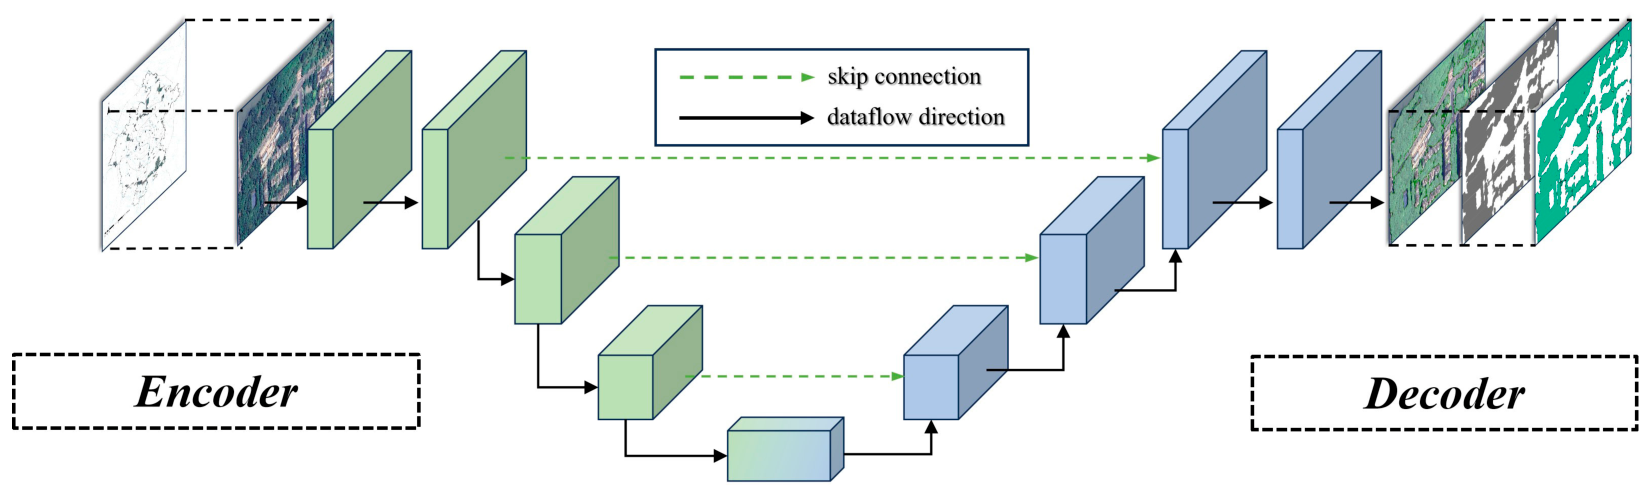
This study categorized park attributes into two parts including size and location factors, and vegetation factors. Park area and distance to CBD were selected to be size and location variables and Tianfu Square was chosen as the city center. Vegetation factors consisted of NDVI and tree canopy landscape patterns, in which the latter were calculated from high-definition satellite images. This study employed the deep learning module integrated within ArcGIS Pro 3.7, selecting the fully convolutional neural network U-Net with symmetric encoder–decoder architecture to conduct pixel classification of tree canopies in high-resolution satellite imagery (Figure 4). This algorithm is commonly used for semantic segmentation in satellite images [58]. With over 2000 training samples manually annotated, the samples were randomly split into training and test sets at a ratio of 8:2. After five iterations, the model achieved an overall pixel accuracy of 87% on the test set, effectively identifying tree-canopy patches in urban parks.
Figure 4.
The process of tree-canopy identification.
Subsequently, based on the recognition results, we used ArcGIS 10.2 to further quantify the landscape patterns of tree canopies, including relative tree-canopy fragmentation index and fractal dimension, which reflect the fragmentation degree and shape complexity of tree-canopy patches, respectively [59,60].
3.4. Methodology
3.4.1. Ordinary Least Squares (OLS) Linear Regression Model
Given the potential multicollinearity among predictors, this study first performed a collinearity check before running any regression. The variance inflation factors (VIFs) ranged from 1.59 to 5.33, all below the conventional threshold of 10, indicating no serious multicollinearity in the dataset (Table A3). Consequently, the regression models could be safely estimated.
First, this study employed the OLS regression model to examine the relationship between the built environment and park vibrancy. Linear regression is the simplest and most straightforward technique for predicting a continuous dependent variable. It expresses the relationship between the dependent variable and a set of independent variables as follows:
where is the dependent variable, is the constant term, is the th independent variable ( = 1, 2, 3 …, ), is the coefficient of , and is a vector of random error terms.
3.4.2. Geographically and Temporally Weighted Regression Model
The OLS model cannot reveal the spatiotemporal dynamic influence of independent variables on the dependent variable. To integrate regression analysis with such effects, this study further employed the GTWR model to explore the spatiotemporal relationship between built-environment variables and park vibrancy. The GTWR model is expressed as follows:
where yi denotes the dependent variable at location , is the th independent variable at location ( = 1, 2, 3, …, n), are the spatiotemporal coordinates of location in the observation, with representing longitude, latitude, and time, respectively, and is the intercept. is the set of regression coefficients at location , and it varies across space and time. The GTWR model can simultaneously capture spatiotemporal non-stationarity [51]. The local regression coefficients of the GTWR model are obtained by locally weighted least-squares estimation. The estimated parameters are expressed as follows:
where the weighting matrix is an diagonal matrix, and . () is the spatiotemporal distance decay function determined by the spatiotemporal separation and the bandwidth . This study adopted the Gaussian kernel function to compute the spatiotemporal weight matrix with the greatest efficiency as follows:
where denotes the spatiotemporal distance between parks and , represents bandwidth, and it is a parameter greater than 0. According to [61], is calculated as follows:
where and are the scaling factors for spatial and temporal distances, respectively.
The bandwidth and scaling factors were calibrated using leave-one-out cross-validation, with the optimal parameter combination determined by minimizing the prediction error.
We report, for each variable, the proportion of parks with positive and negative coefficients and the standard deviation of the park-level mean coefficients (Table A1).
4. Results
4.1. Spatiotemporal Variations of Urban-Park Vibrancy
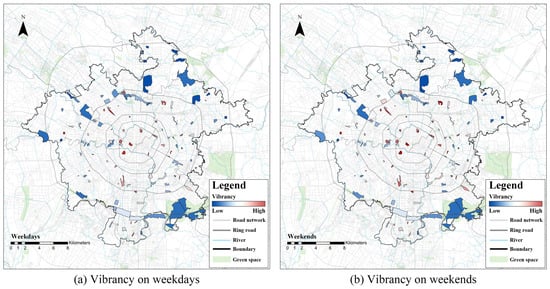
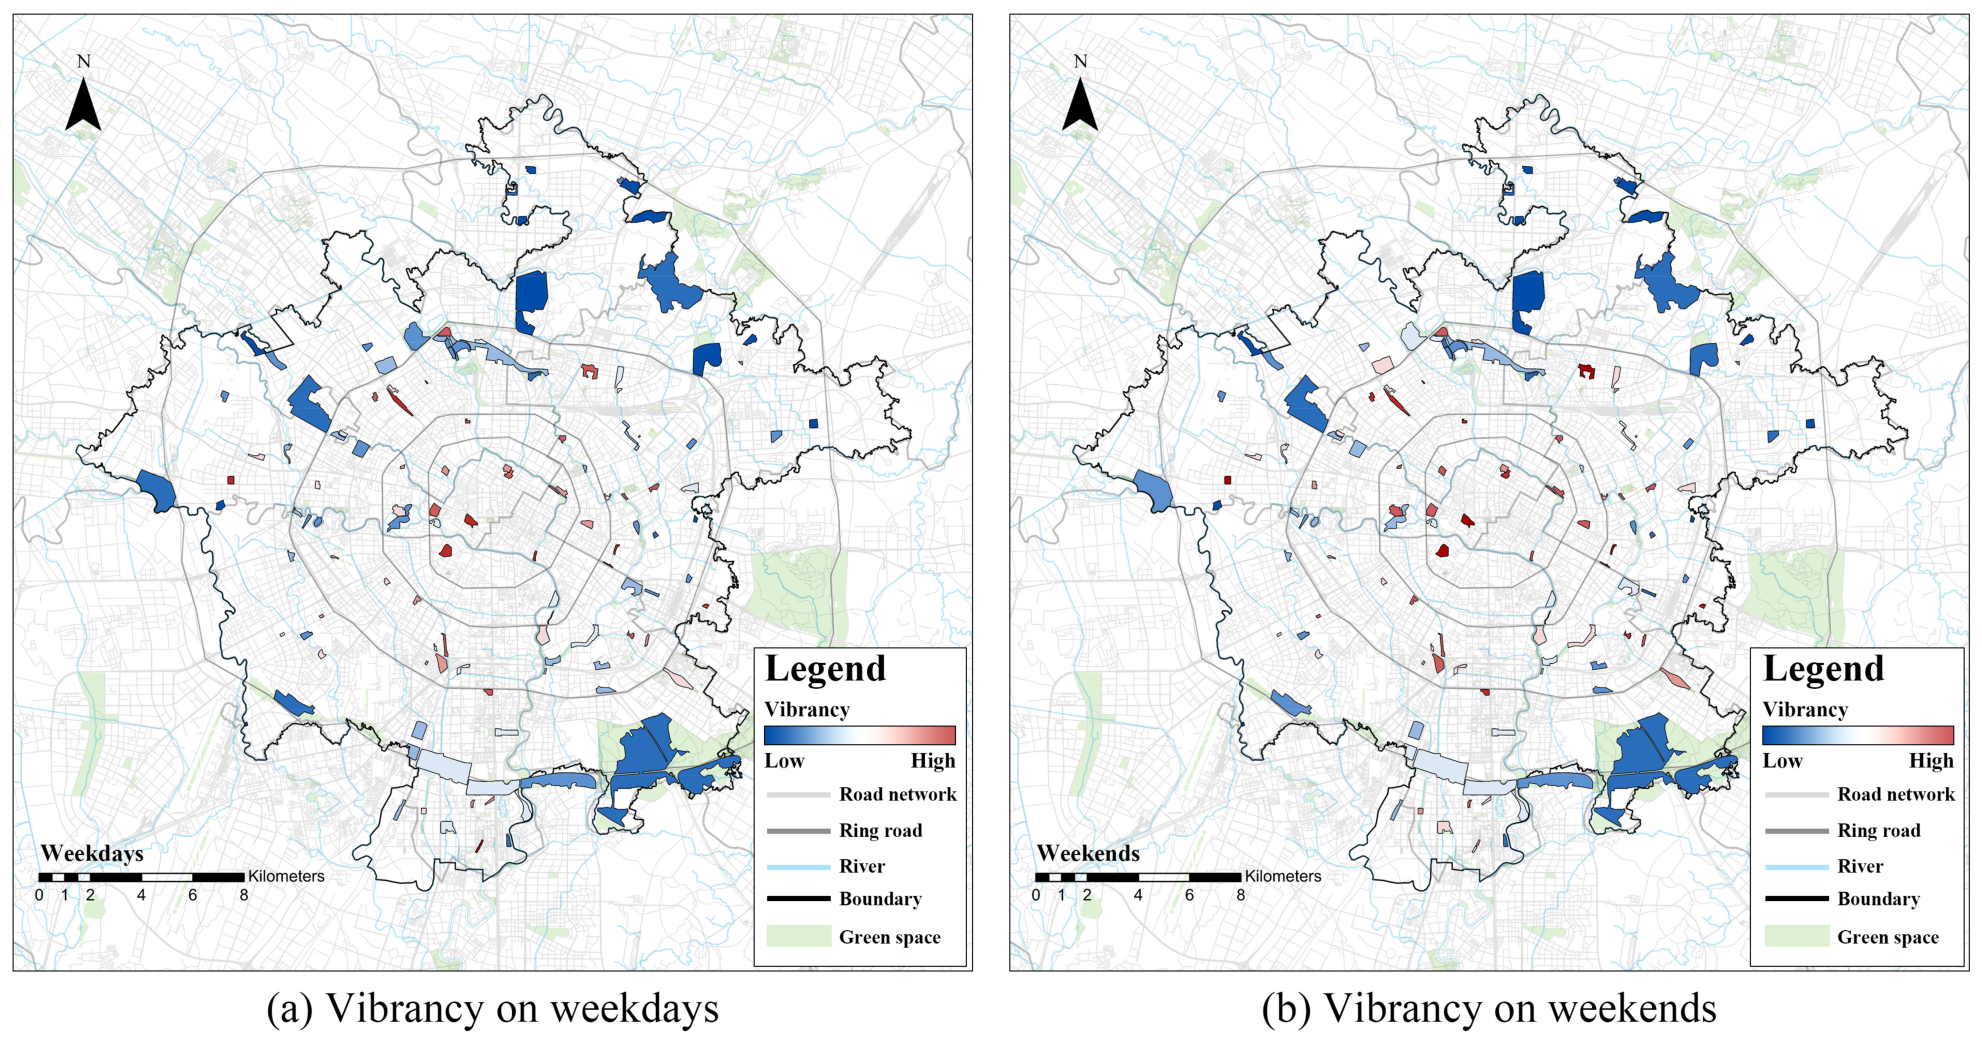
Figure 5 shows the spatial distribution of the average hourly vibrancy of parks on weekdays and weekends. Overall, whether on weekdays or weekends, most parks with high vibrancy are concentrated in the downtown area. Among peripheral districts, parks in the southern part of Wuhou District exhibit relatively higher vibrancy levels. Chen et al. have mapped Chengdu’s overall urban vibrancy, and park vibrancy in this study closely mirrors that pattern [13]. Downtown parks feature more comprehensive public facilities and better commercial amenities nearby, and the fast-developing high-tech zone in southern Wuhou District positions its parks to capture vibrancy more readily.
Figure 5.
Spatial distribution of park vibrancy on weekdays and weekends.
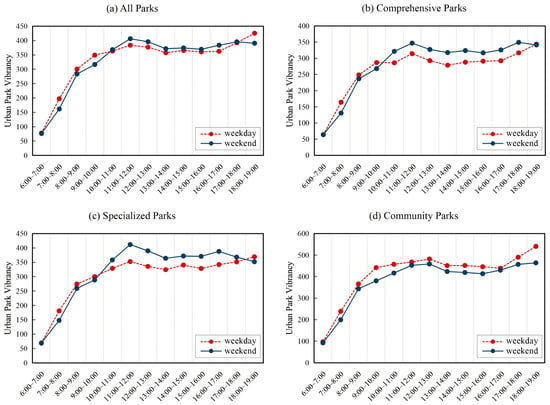
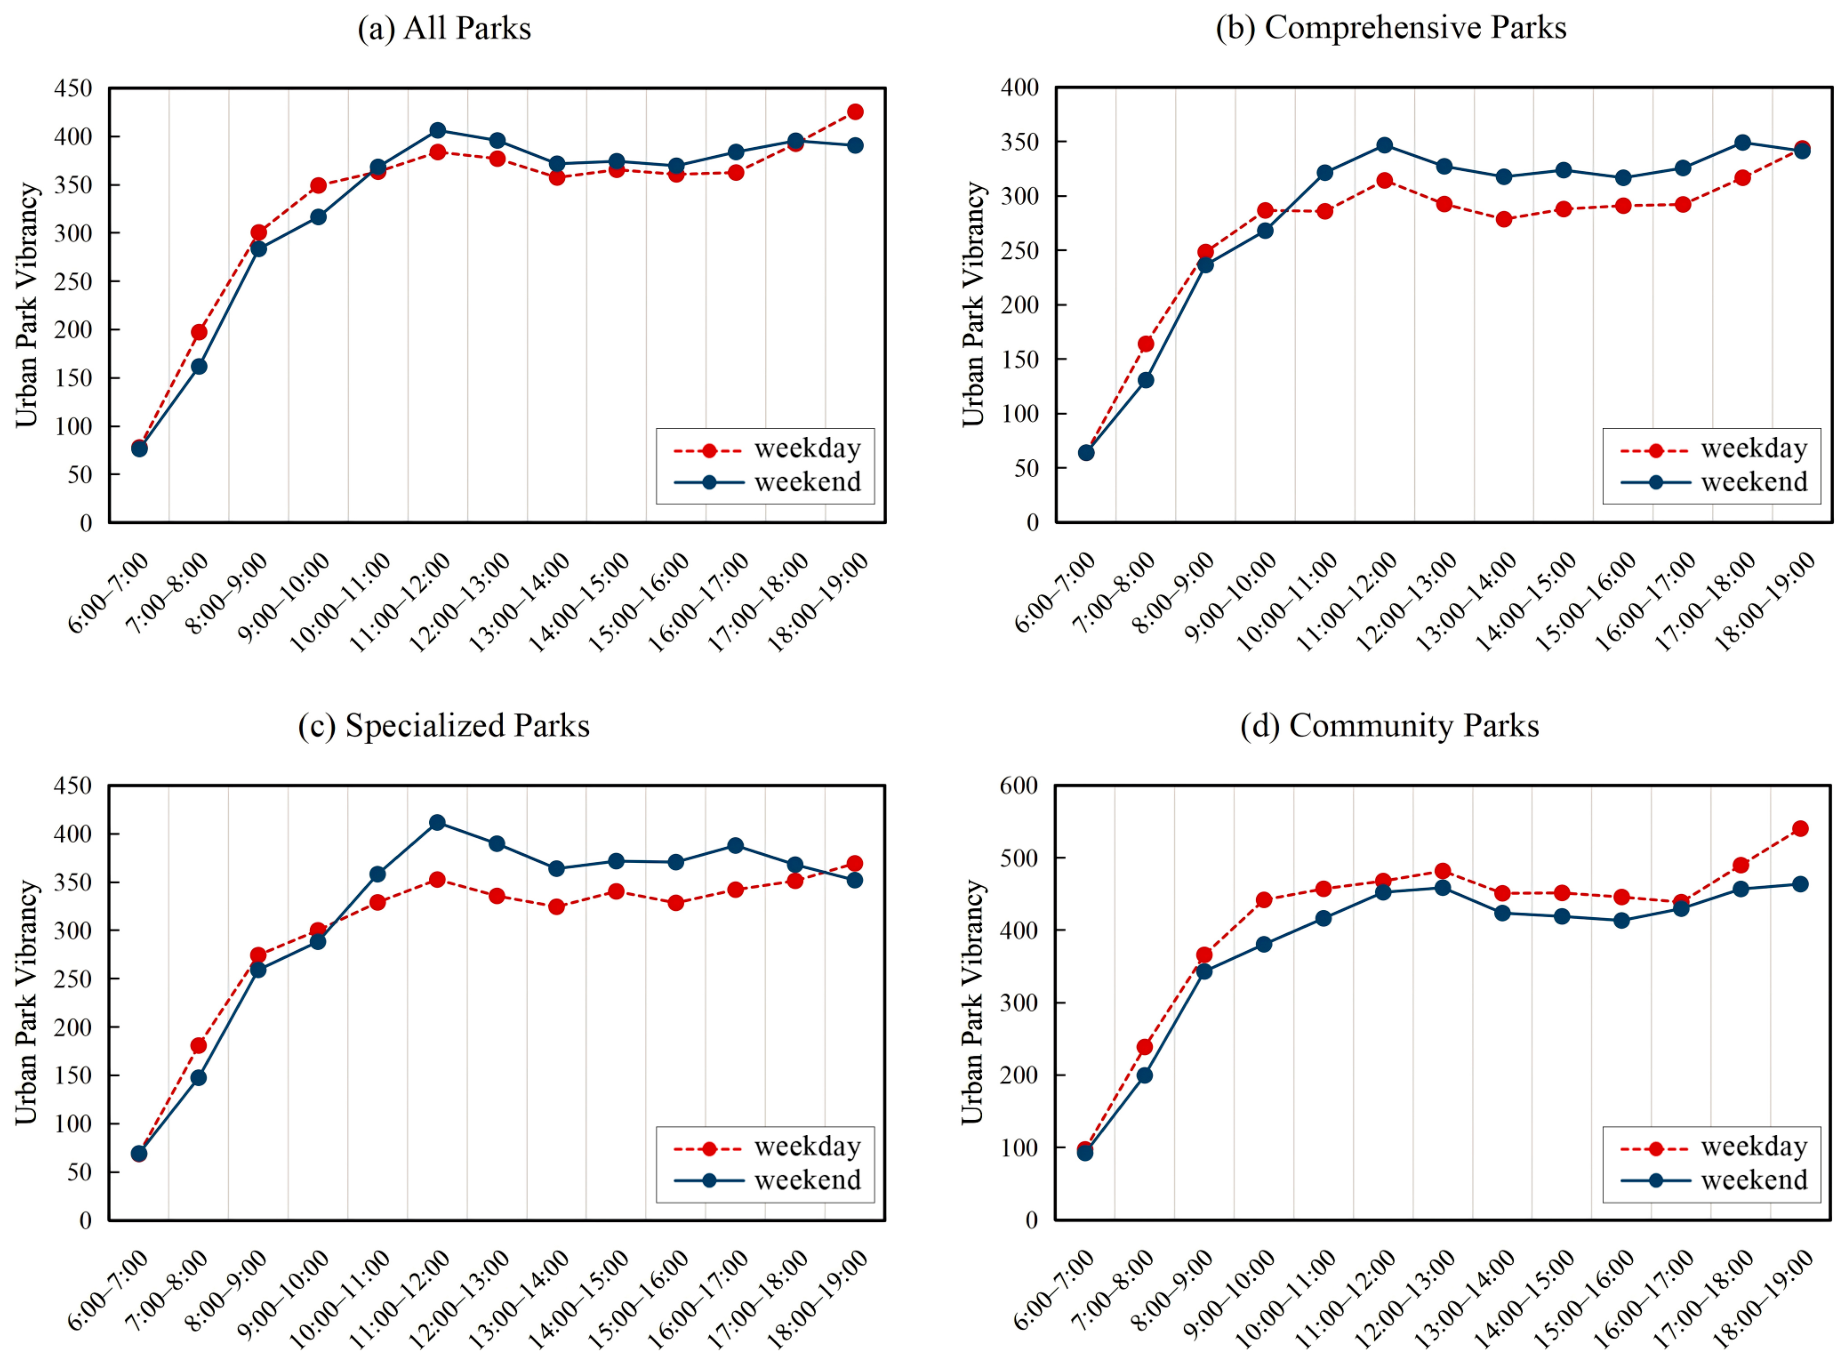
The hourly average vibrancy values of all parks, comprehensive parks, community parks, and specialized parks between 6:00 and 19:00 are illustrated in Figure 6. Both on weekdays and weekends, the vibrancy levels of all park types show a noticeable upward trend during morning hours (6:00–12:00), then remain stable during the afternoon hours (12:00–19:00). For all parks, comprehensive parks, and specialized parks, vibrancy from 6:00 to 9:00 on weekdays exceeds that of the equivalent weekend window. Conversely, weekend vibrancy of these parks overtakes weekday vibrancy values at 9:00–11:00 and maintains its lead for most subsequent hours after 11:00. Community parks exhibit higher vibrancy during all daytime hours on weekdays compared to weekends. This may be somewhat related to the predominant user groups of community parks [62]. One possible explanation, consistent with time–geography theory [63], is that community parks are predominantly frequented by non-working populations, particularly the elderly, whose weekend time is more constrained by family obligations, leading to a relative decrease in weekend visitation to these community parks.
Figure 6.
Variations of park vibrancy by time period on weekdays and weekends.
4.2. Model Comparisons and Regression Analysis
Using OLS regression and GTWR models, we investigated the varying relationships between built-environment variables and urban-park vibrancy across the whole week, weekdays, and weekends. Table 2, Table 3 and Table 4 present the summary regression results for the OLS and GTWR models. The R2 values for the OLS model were 0.5448, 0.5634, and 0.4357, respectively, markedly lower than those of the GTWR model (0.8522, 0.8674, and 0.8017). This indicates that the GTWR model provides better support for investigating the factors influencing park vibrancy.
Table 2.
OLS and GTWR summary results for a week.
Table 3.
OLS and GTWR summary results for weekdays.
Table 4.
OLS and GTWR summary results for weekends.
Weekday OLS demonstrated positive associations with park vibrancy for floor area ratio, POI density, POI mix, road density, park area, and tree canopy coverage, whereas building density, parking availability, green view index and NDVI were negatively associated with park vibrancy. The weekend OLS model revealed that both the coefficients and significance levels of some variables changed substantially. Specifically, resident density and fractal dimension of tree canopy became significantly positively associated with park vibrancy, and distance to CBD became significantly negatively associated with park vibrancy.
The GTWR model revealed the associations between built-environment variables and the spatiotemporal vibrancy of parks [51]. Based on the mean coefficient, standard deviation, and the proportion of parks with positive and negative coefficients for each variable, we reveal the changing trends in the relationship between built-environment variables and park vibrancy (Table 2, Table 3, Table 4 and Table A1). On weekdays, the mean coefficients were positive for floor area ratio, POI density, road density, tree canopy coverage, and fractal dimension of tree canopy, and the majority of parks also showed positive associations. In contrast, the mean coefficients were negative for building density, parking availability, green view index, distance to the CBD, and NDVI. On weekends, the mean coefficients of some variables changed considerably. For example, the strength of the association with park vibrancy increased for floor-area ratio, tree-canopy coverage, and fractal dimension of tree canopy, whereas the mean coefficient of transit accessibility reversed from −0.013 on weekdays to 0.006 on weekends.
To examine whether the associations differ by park type, the mean GTWR coefficients were further compared across comprehensive, specialized, and community parks (Table A2). The direction of the coefficients is largely consistent across the three types, supporting the pooled analysis. The main differences concerned community parks, for which resident density showed a negative association with park vibrancy on weekdays, and for which park area and distance to the CBD showed stronger associations with park vibrancy than in the other two types.
4.3. Analysis of Spatiotemporal Non-Stationarity in Regression Coefficients
4.3.1. Temporal Heterogeneity of Average Coefficients
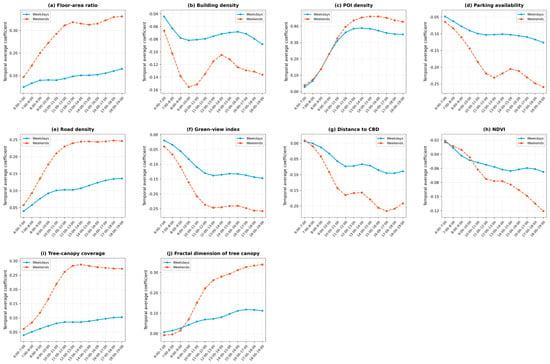
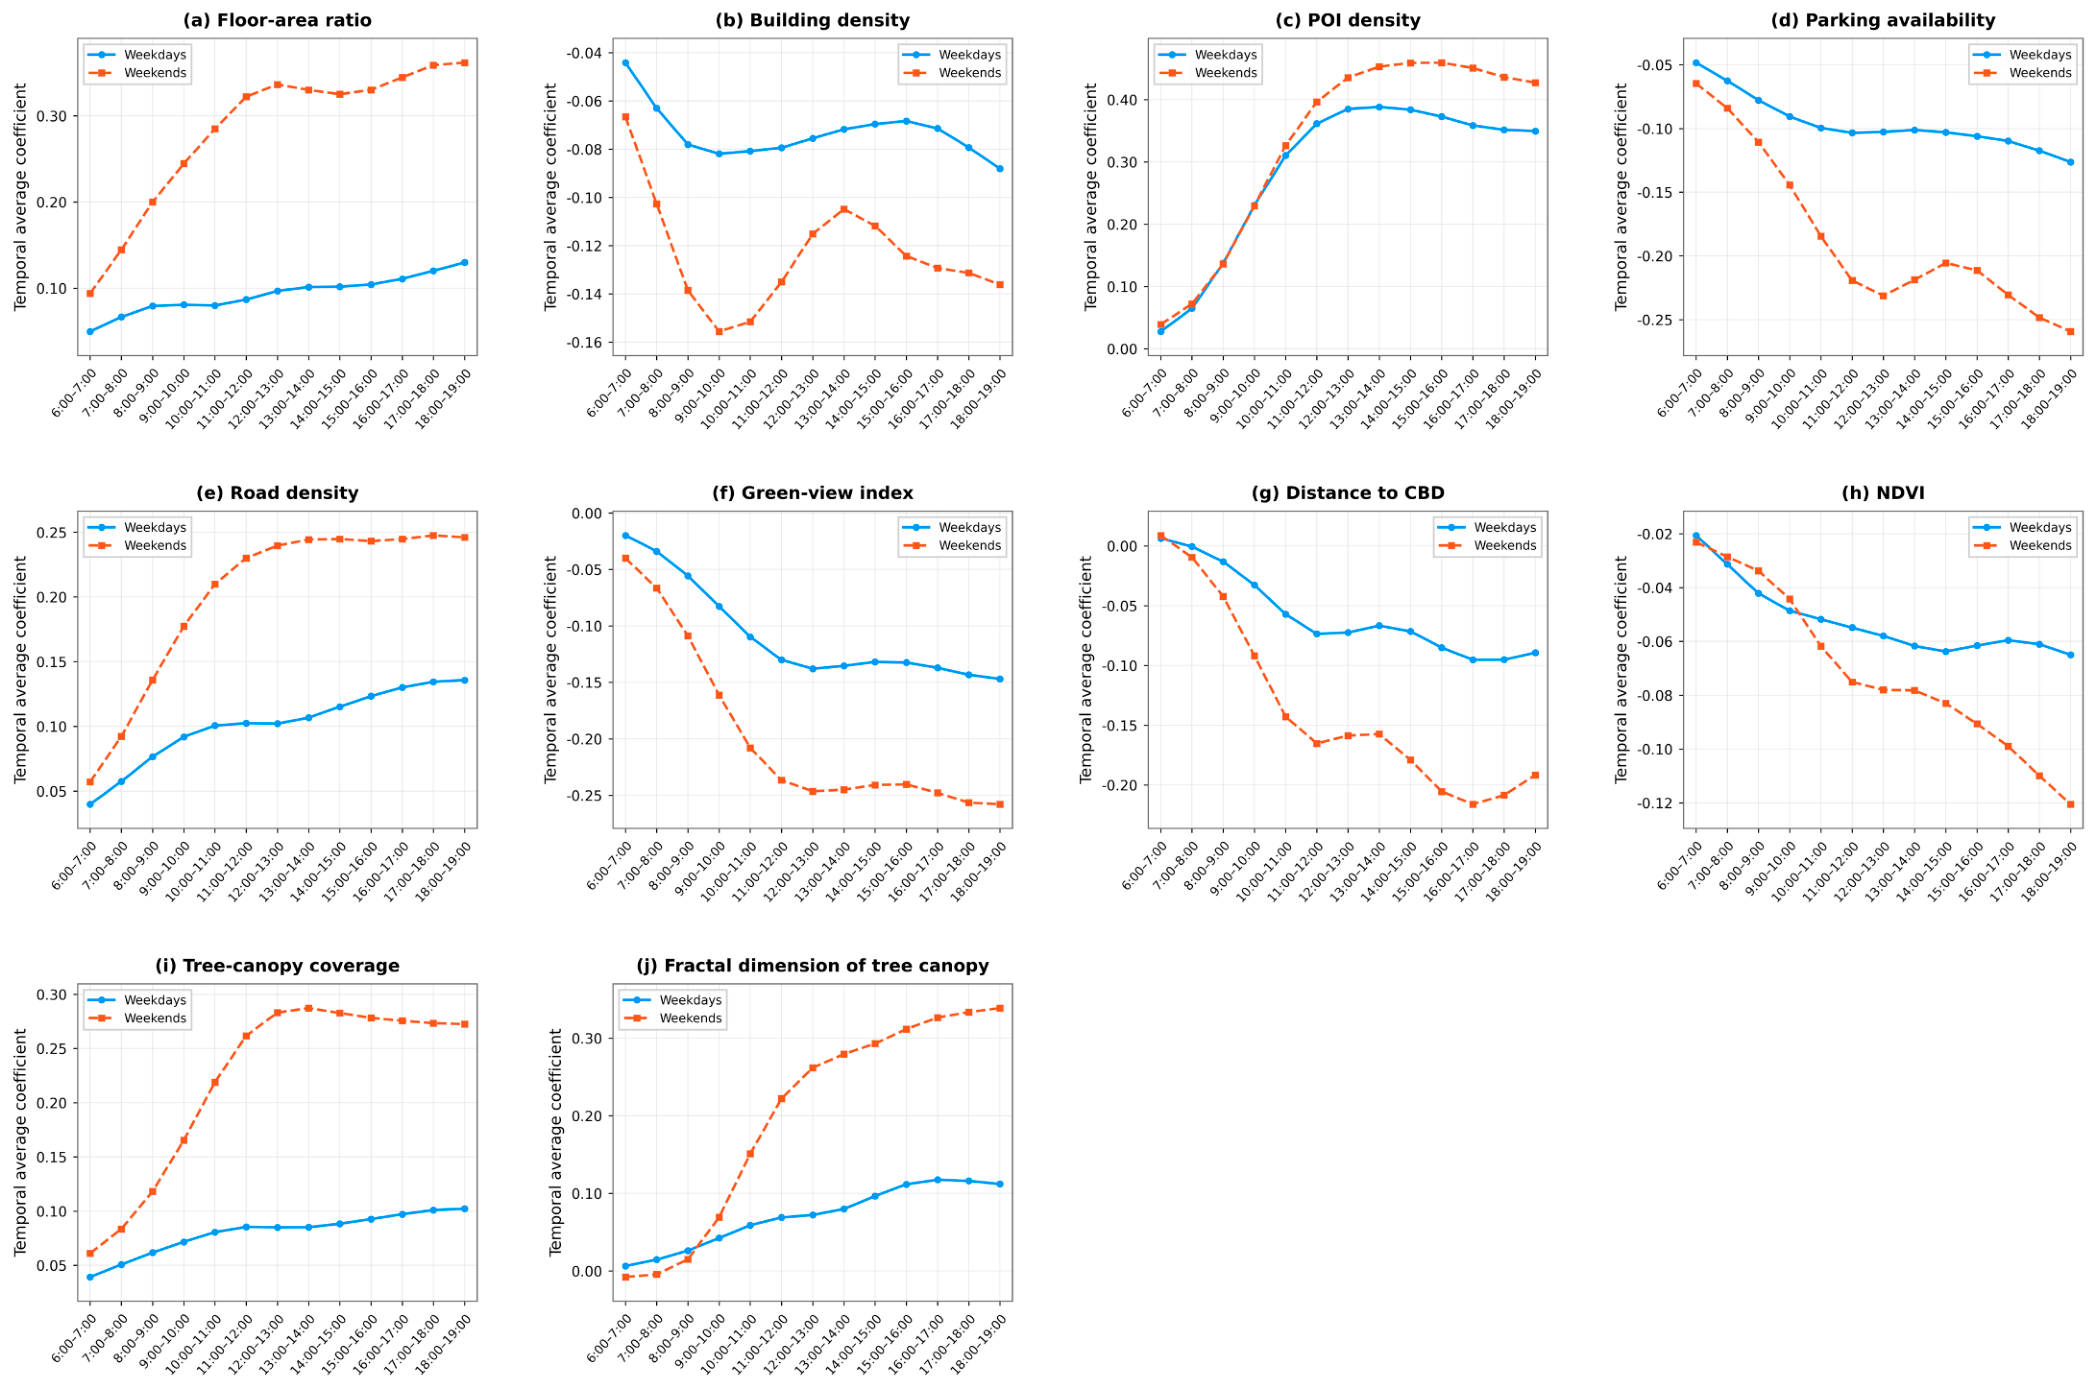
The relationship between built-environment variables and park vibrancy exhibited temporal heterogeneity. Figure 7 presents the temporal trajectories of the coefficients of some variables. Among them, the temporal trajectories for floor area ratio, POI density, road density, tree canopy coverage, and fractal dimension of tree canopy were largely positive, whereas those for building density, parking availability, green-view index, distance to the CBD, and NDVI were generally negative.
Figure 7.
Temporal average coefficients for the chosen built-environment variables.
Among the surrounding attributes, the coefficients of floor area ratio, POI density, and road density exhibited a temporal pattern of rising first and then stabilizing overall on both weekdays and weekends, indicating that parks surrounded by high-density development continuously attract an influx of visitors. By contrast, the coefficients of parking availability exhibited a temporal pattern of continuously strengthening negative effects (Figure 7).
Regarding park attributes, the average regression coefficient for distance to CBD was consistently negative during most hourly intervals on both days, with the negative effect being more pronounced on weekends than on weekdays across every time slot (Figure 7g). This phenomenon likely stems from variations in user demographics and their leisure mobility. Weekday park usage was dominated by non-working residents seeking proximity to their homes, thereby weakening the centralizing pull of the CBD. In contrast, the weekend influx of young working adults, who have more discretionary leisure time and are willing to travel further for parks with comprehensive recreational and social facilities, may account for the stronger negative association between distance to the CBD and vibrancy on weekends. For vegetation factors, NDVI and tree canopy coverage worked in converse directions on park vibrancy. NDVI tracked the green view index in both effects and diurnal variation, with the regression coefficients for both reaching relatively low values in the afternoon, whereas the coefficient for tree-canopy coverage remained relatively high (Figure 7f,h,i). Sang et al. found that the canopy possesses exceptional cooling capability [64]. Therefore, this phenomenon is probably due to higher levels of heat radiation in the afternoon than in the morning, meaning residents require more shade to reduce their exposure to the sun during park activities. Finally, the mean regression coefficients for the fractal dimension of tree canopy consistently exhibited positive values during nearly all hourly intervals across both days (Figure 7j).
4.3.2. Spatial Heterogeneity of Average Coefficients
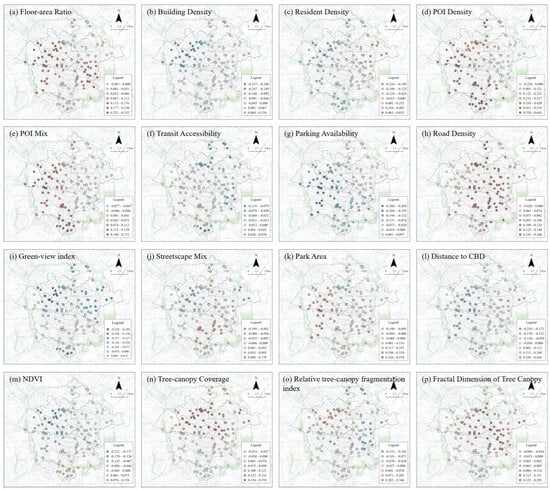
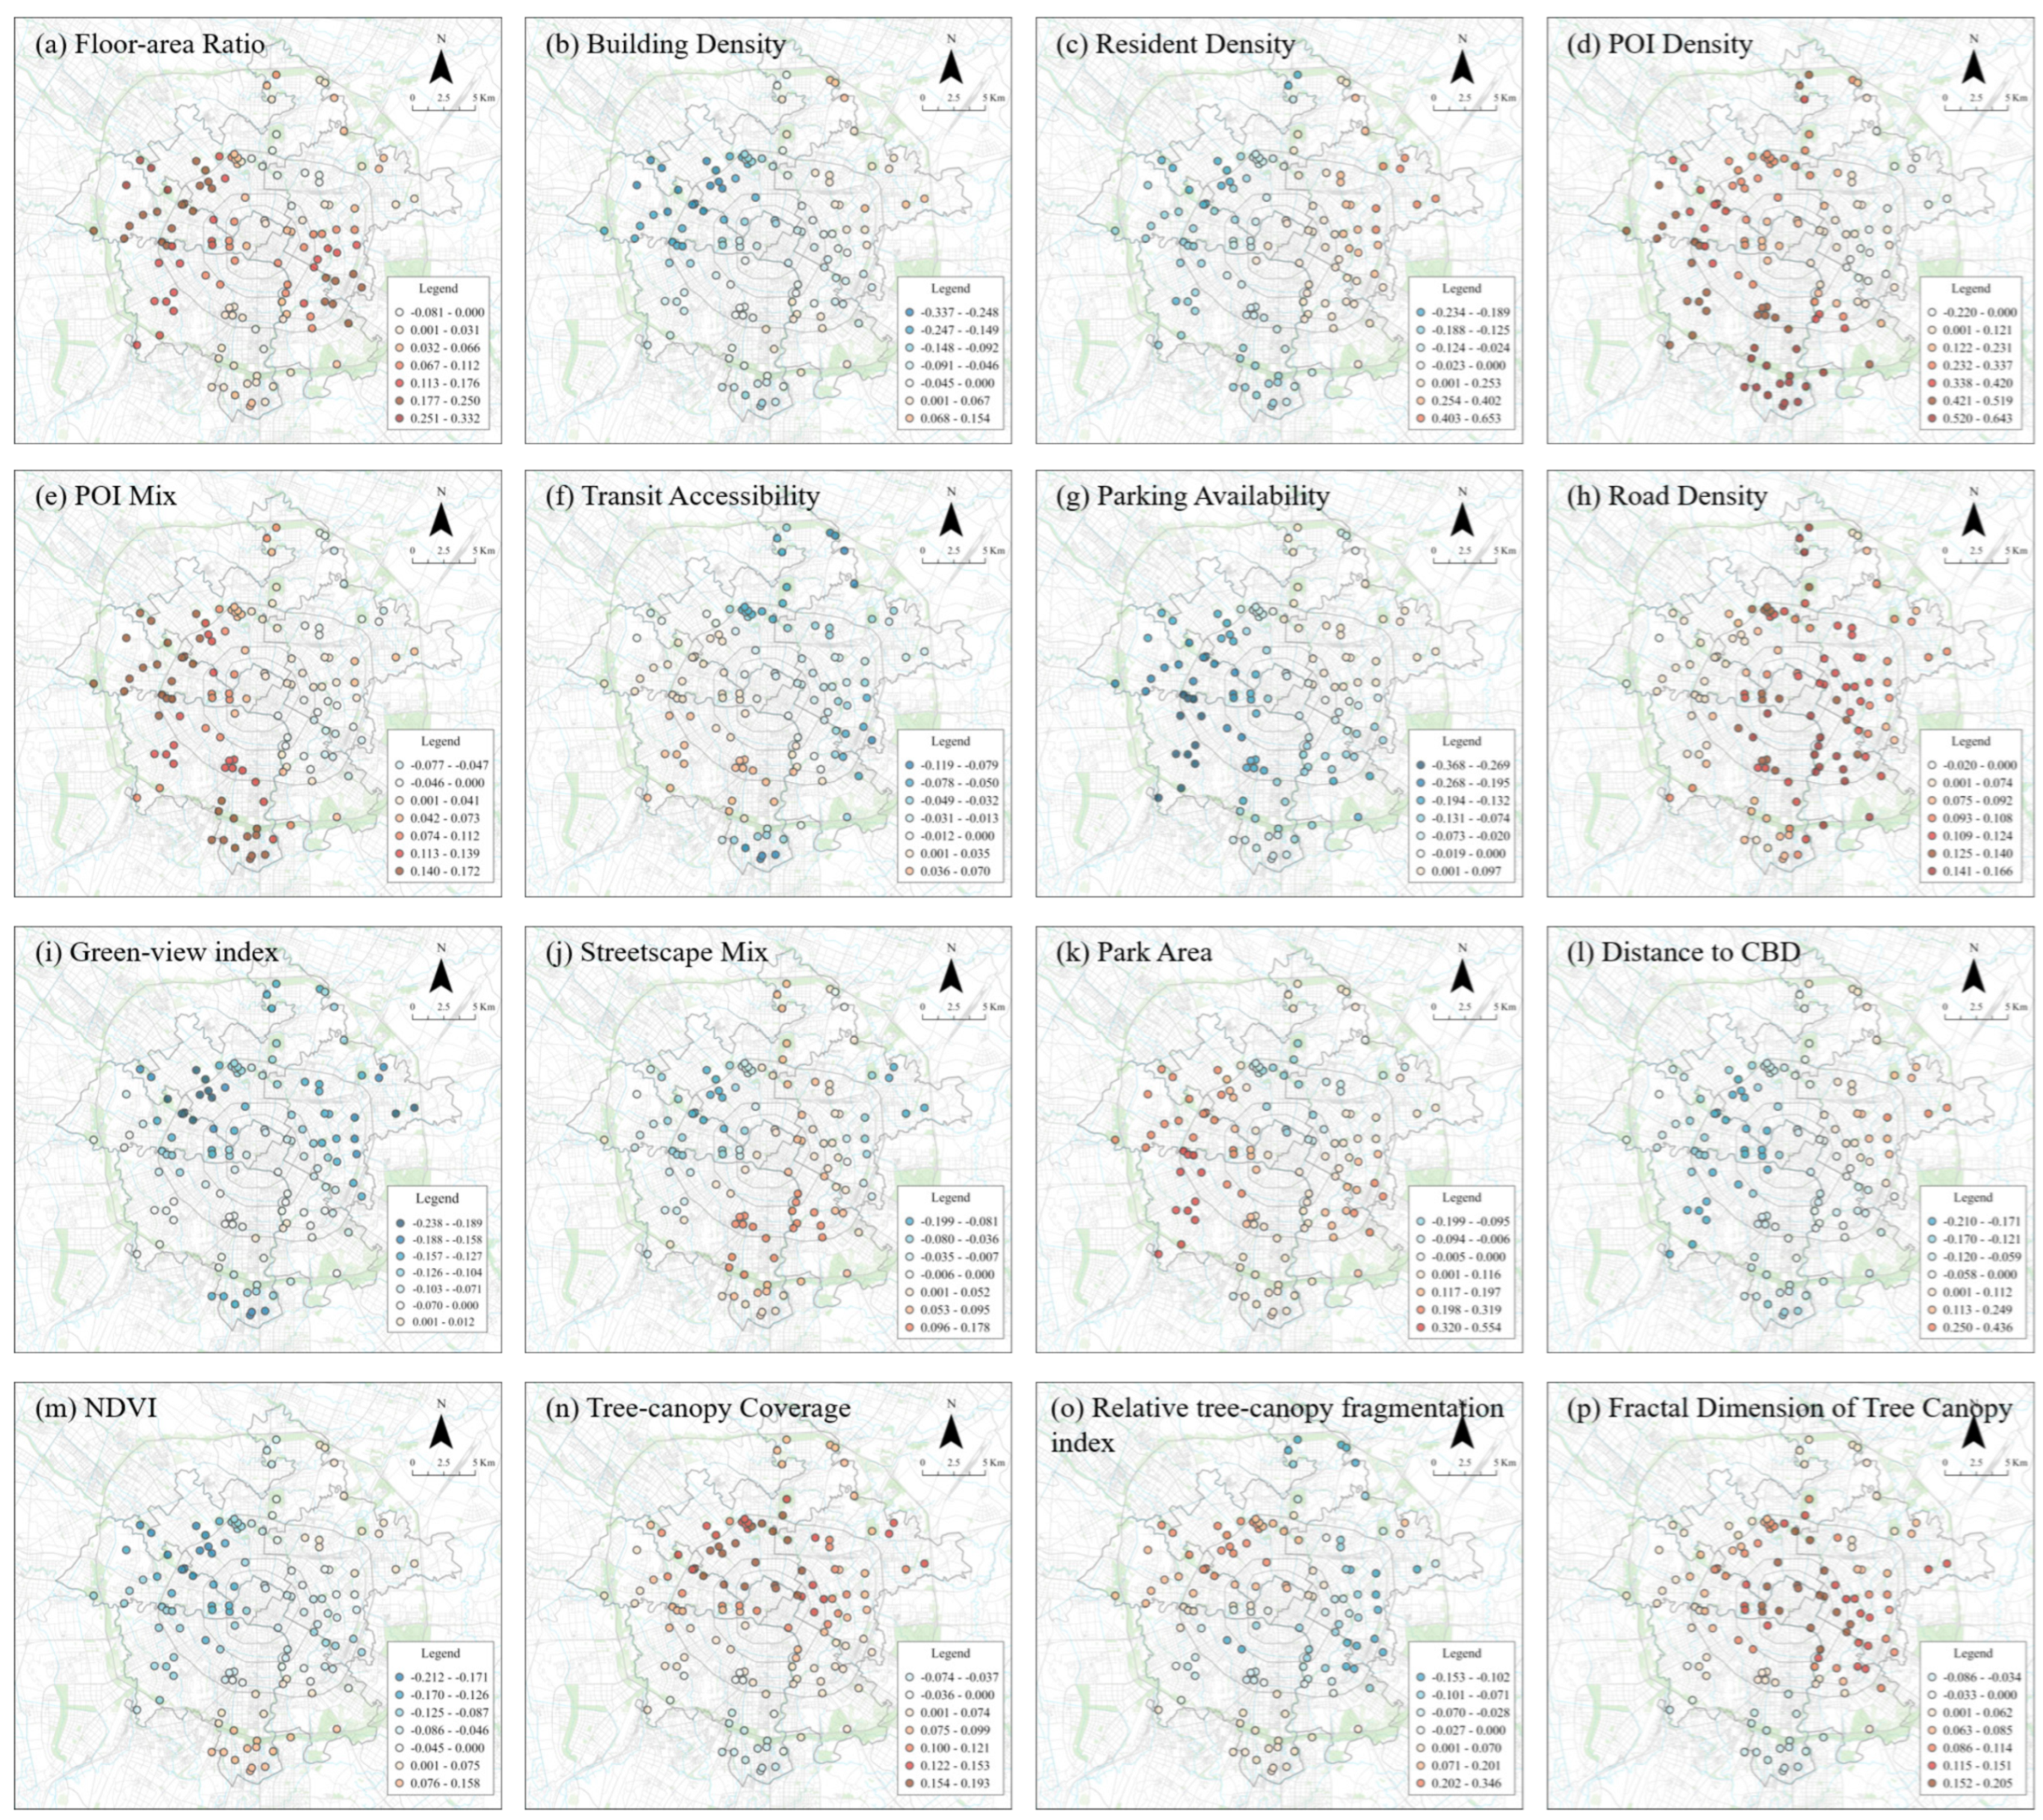
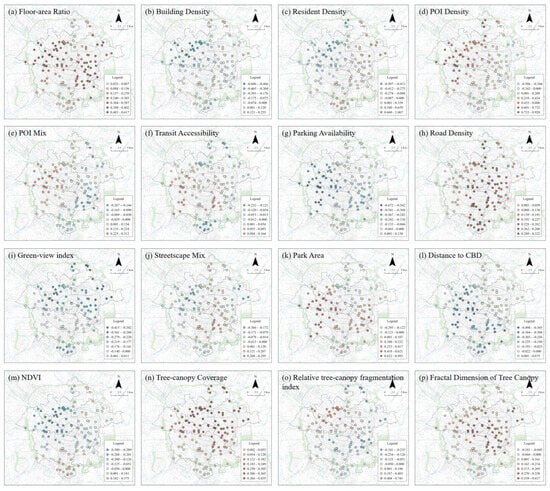
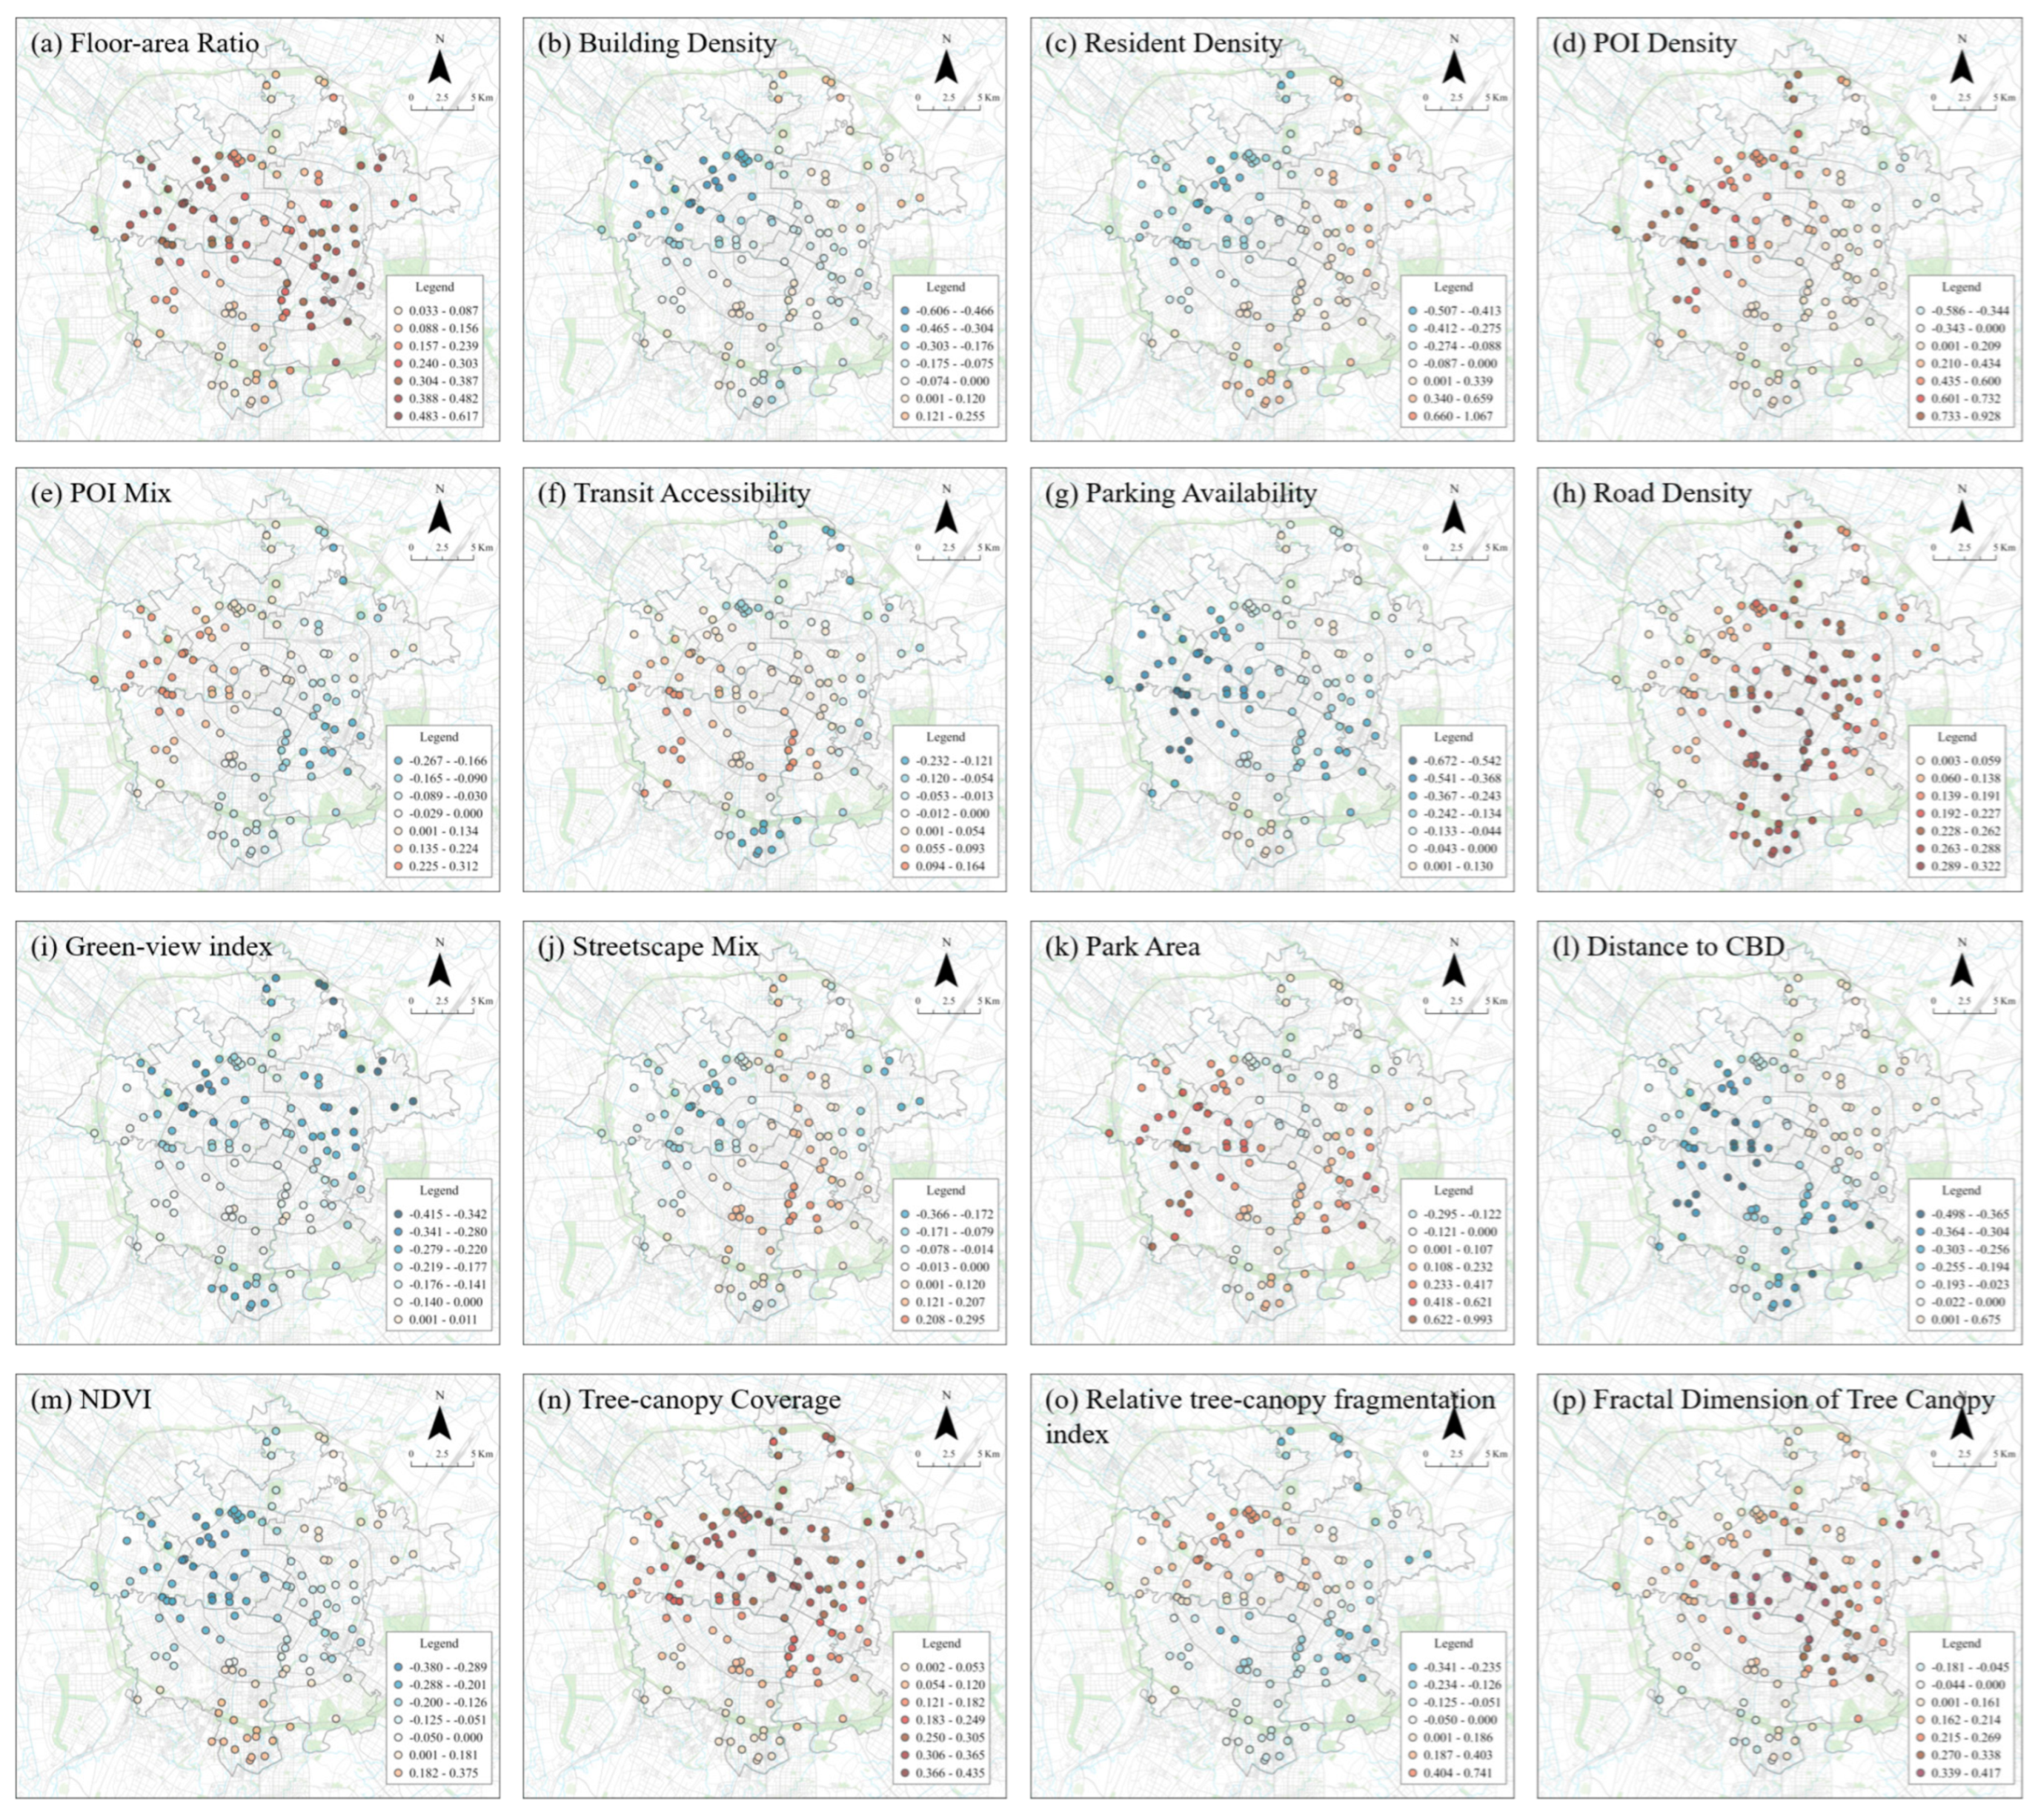
Similarly, the built-environment effects on park vibrancy are spatially heterogeneous. Figure 8 and Figure 9 map the spatial distribution of average regression coefficients for the 16 variables on weekdays and weekends. The coefficients in Figure 8 and Figure 9 were classified using the natural breaks (Jenks) method combined with manual annotation, so that the color distinguishes the sign (red for positive, blue for negative). The proportion of parks with positive and negative coefficients for each variable is reported in Table A1. Several patterns are observed from these two sets of graphs.
Figure 8.
Spatial distribution of average coefficients for the built-environment variables on weekdays.
Figure 9.
Spatial distribution of average coefficients for the built-environment variables on weekends.
The spatial patterns of average regression coefficients for demand-related variables were largely similar between weekdays and weekends, except for resident density. The coefficients for floor-area ratio were predominantly positive, with high values mainly concentrated in the urban periphery (Figure 8a and Figure 9a). This finding closely accords with the conclusions of Xiao et al., which revealed that beyond a 3-km distance from the city center, the floor area ratio exerted a more pronounced influence on park visits [36]. In contrast, building density consistently yielded predominantly negative regression coefficients. On weekdays and weekends, resident density exhibited marked changes between positive and negative effects across some parks, particularly in southern Wuhou District (e.g., Municipal Park, Guilong Park) (Figure 8c and Figure 9c). A possible explanation is that this area functions as Chengdu’s high-tech development zone, dominated by employment hubs, and nearby residents only have more leisure time on weekends to engage in activities in parks.
The spatial distribution of mean coefficients for land-use-related variables was different between weekdays and weekends. POI density was predominantly positively associated with park vibrancy in Jinniu, Qingyang, and Wuhou districts, whereas only a minority of parks in Chenghua District showed a negative association (Figure 8d and Figure 9d). On weekdays, the coefficients for POI mix showed a west-positive and east-negative spatial pattern, which shifted to a northwest-positive and southeast-negative distribution on weekends (Figure 8e and Figure 9e).
Among accessibility-related factors, road density showed a consistently positive association with park vibrancy on both weekdays and weekends (Figure 8h and Figure 9h). Parking availability showed the opposite trend (Figure 8g and Figure 9g), with the majority of parks showing negative associations and only 20.8% (weekdays) and 16.0% (weekends) showing positive associations. The coefficients of transit accessibility showed an overall southwest-positive and northeast-negative trend (Figure 8f and Figure 9f; Table A1).
For streetscape-related variables, green-view index was negatively associated with park vibrancy in the large majority of parks on both days (Figure 8i and Figure 9i). The proportion of negatively associated parks was 97.6% on both weekdays and weekends (Table A1). By contrast, the positively associated parks for streetscape mix were mainly distributed around the Jinjiang River in the south of the city.
For vegetation metrics, the distribution of mean coefficients for NDVI was mostly negative, being positive only in some parks in Wuhou District (Figure 8m and Figure 9m). One possible explanation is that denser vegetation may leave less space for facilities and activities, reducing park attractiveness. Tree canopy coverage, in contrast, differed sharply from NDVI, being positively associated with park vibrancy in virtually all parks on weekends, underscoring its association with higher park use (Figure 9n). Finally, the coefficients of fractal dimension of tree canopy were positive in the majority of parks on both weekdays and weekends (84.8% positive on weekdays and 91.2% positive on weekends) (Figure 8p and Figure 9p; Table A1).
5. Discussion
5.1. Built-Environment Variables Influencing Park Vibrancy and Implications of Urban Planning
This study extends previous research on the relationship between built environment and urban-park vibrancy from multiple perspectives. First, it employed Baidu heatmap data to characterize the spatiotemporal variations in park activity during daytime hours. Second, a linear regression model was used to estimate the average effects of 16 built-environment variables, followed by the application of a GTWR model to capture their spatiotemporally varying impacts. The findings indicate that the GTWR model provided a better fit to the research data and revealed clear spatiotemporal non-stationarity in the direction and magnitude of all predictors. This underscores that the influences of built environment on park vibrancy are intrinsically dynamic rather than fixed, aligning with prior research [44]. This study found that park vibrancy is closely associated with both external and internal factors. The comparison of mean GTWR coefficients across park types (Table A2) further indicated that the associations were broadly consistent across comprehensive, specialized, and community parks, with minor differences concentrated in community parks.
5.1.1. The Varying Effects of Demand, Land Use, and Accessibility
In this study, floor area ratio, POI density, and road density showed positive associations with park vibrancy. Building density, conversely, showed a negative association.
The opposite signs of floor-area ratio and building density suggest that the volumetric intensity of surrounding development, rather than its ground coverage, was associated with higher park vibrancy. This observation aligns with the principles of New Urbanism and Smart Growth theories, which advocate for a compact urban layout to enhance urban functionality and sustainability. Gao et al. came to the same conclusion when studying the park vibrancy in Guangzhou [37].
POI density was positively related to park vibrancy, especially on weekends, which is consistent with previous research on built environment and urban vibrancy [65]. Lyu and Zhang even found that POI density was the strongest factor influencing park usage in Wuhan [33], which corroborates that high-density and mixed-use development patterns can significantly enhance the intensity of residents’ diverse activities [66]. Furthermore, the spatial distribution of POI mix coefficients showed predominantly positive values in Qingyang and Jinniu districts (Figure 8e), and this clustered distribution was strengthened on weekends (Figure 9e). This study therefore suggests that intensifying land-use mixing in the immediate environs of these parks may help sustain their vibrancy.
The robust, positive association between road density and park vibrancy underscores that accessibility remains an important factor associated with park vibrancy, according with an extensive body of prior research [21,30,34].
5.1.2. The Vital Role of Street Greening and Park Vegetation
The GTWR model results showed that the two eye-level streetscape-related variables differed in their association with park vibrancy. Green-view index was negative in the large majority of parks (97.6% on both weekdays and weekends) (Table A1), consistent with Peng et al. [29]. Among vegetation factors, tree canopy coverage and fractal dimension were positively associated with vibrancy in the majority of parks, while NDVI was negatively associated.
Findings of this study on NDVI resonate with the results presented by Xiao et al., which found that park visits declined significantly when the park’s NDVI exceeded 0.3, suggesting that excessive vegetation coverage within parks may reduce available activity space and consequently diminish their appeal [36]. Previous research also found that similar greenness indicators, such as green-coverage rate, could similarly suppress park visitation [67]. Hence, whether viewed from the 3D human-eye level (GVI) or the 2D bird’s-eye plane, higher greenness was associated with lower park vibrancy. The contrasting signs of NDVI and the canopy metrics suggest that the negative NDVI association is driven largely by inaccessible or dense vegetation that limits usable space, rather than by the tree canopy itself, since the latter, when quantified by coverage and fractal dimension, showed a positive association. This opposing pattern indicates that the accessibility and quality of green space, rather than its overall amount, is what matters for park use. However, contradictory findings have also been reported: Gao et al. found that in Guangzhou, NDVI was positively associated with community park visitation once it exceeded 0.6 [37], which may reflect the smaller scale of community parks and their more limited range of resident activities, whereas the parks examined here span a wider range of sizes. This overall negative association suggests that urban-park greening should be approached rationally, and that the indiscriminate pursuit of high coverage could compromise the role of parks as public activity arenas. This is consonant with Landscape Preference Theory proposed by the Kaplans, which emphasizes that people’s preferences for landscapes depend not only on greenery itself, but on the balance between greenness and openness [68]. Accordingly, this study suggests that urban parks should balance vegetation coverage with open activity and social space, while upgrading on-site facilities.
Tree canopy coverage was positive in the large majority of parks (84.8% on weekdays and 100.0% on weekends), particularly on weekends, and this association was most pronounced during the hours of intense heat radiation. Some studies suggested that vegetation coverage merely reflects the quantity of vegetation rather than its quality, and thus might not attract visitors [69]. However, the overall concept of vegetation coverage obscures the appeal of trees, particularly those with larger crowns, to people. This is consistent with the findings of Grilli et al., which indicated that high-density tree coverage substantially increases residents’ willingness to visit parks [49]. Furthermore, existing research has found that tree canopies possess a significant cooling effect [64,70]. Liao et al. discovered that urban parks with high canopy coverage possess superior cooling capabilities, and residents are more likely to choose them to reduce heat exposure during hot periods [71]. Therefore, this study proposes disaggregating greenness into specific vegetation types to isolate the elements most strongly associated with vibrancy, and urges designers to prioritize the careful selection and sustained management of park trees.
The positive effects observed in the fractal dimension of tree canopy further expose the inadequacy of relying solely on NDVI or overall coverage to reflect the presence of green space in parks, because vegetation planting patterns, group structure, etc., also have vital impacts on park use. This finding aligns closely with the Landscape Pattern–Ecological Process Theory, which posits that the overall greenness indices such as NDVI fail to capture the spatial configuration of vegetation—a factor closely associated with human usage behavior. Findings above urge park designers to pay greater attention to vegetation identity and layout, and it is recommended to mix tree sizes and use continuous clustered patches to enhance the appeal of parks to visitors.
In summary, the effects of greenspace metrics on park vibrancy are dichotomous, varying fundamentally by analytical perspective and granularity. At the two-dimensional, macro-scale, overarching indicators such as NDVI were negatively associated with park vibrancy, whereas localized configuration metrics, including coverage and fractal dimension of tree canopy, showed predominantly positive associations. At the three-dimensional, human scale, the aggregate green-view index was likewise negatively associated with vibrancy. This quantity-configuration divergence necessitates a paradigm shift in greening strategy, from a narrow pursuit of high coverage to a more sophisticated orchestration of spatial patterns. For example, from a design perspective, large-crown trees provide shade and visual enclosure while their elevated canopies leave the ground plane open for activities, thereby enhancing thermal comfort without sacrificing usable space [72]. Achieving a synthesis of these global and local, 2D and 3D dimensions is pivotal for optimizing the socio-ecological functionality of urban parks.
5.2. Limitations
Although this study employed Baidu heatmap data and the GTWR model to investigate the spatiotemporally dynamic relationships between various built-environment factors and park vibrancy, several limitations should be mentioned. First, Baidu heatmap data only provide an estimate of park vibrancy based on heatmap imagery, and this estimate deviates from the actual population distribution and has limited accuracy. Other more accurate big data sources can be considered for future research to obtain precise information on population distribution, park visits, and vibrancy, such as Weibo check-in data [73] and mobile phone signaling data [15]. Second, although the selected week (10–16 April) was free of public holidays and had mild, comfortable weather, the data nevertheless cover only one week in April. The findings therefore reflect the short-term hourly and weekday–weekend patterns of this specific observation period and should not be interpreted as representing seasonal, climatic, holiday-related, or long-term patterns of park use. Future research could incorporate multi-seasonal and multi-year sampling. This would help examine how the spatiotemporal dynamics and determinants of urban-park vitality evolve with long-term changes in urban land use and spatial form. Third, the built environment affects different park types in distinct ways [15], yet this study did not estimate separate regression models for each category. Thus, future work could disaggregate park types and examine how built-environment attributes relate differently to the vibrancy of each type.
6. Conclusions
This study took Chengdu as a case to reveal the spatiotemporal dynamic impacts of multiple built-environment factors on park vibrancy through a GTWR model applied from both internal and external dimensions. It delivered adaptive, evidence-based guidance for the design and management of urban parks.
The findings of this study are summarized as follows. (1) Park vibrancy in Chengdu exhibited marked spatiotemporal heterogeneity, with distinct weekday–weekend patterns across different park types. (2) The GTWR model provided substantially greater explanatory power than the OLS model and fitted the study data better. (3) The GTWR model revealed a spatiotemporally non-stationary link between the built environment and park vibrancy, with factors from both the internal and external environments of parks playing a role. Overall, factors within the surrounding built environment, including floor area ratio, land-use-related metrics, and road density, alongside internal park variables such as the coverage and fractal dimension of tree canopy, showed positive associations with park vibrancy. Conversely, building density, green view index, parking availability, and NDVI showed negative associations with park vibrancy. (4) The impact of the built environment on park vibrancy was spatiotemporally heterogeneous, suggesting that urban planners in Chengdu should attend to these dynamic effects and tailor interventions to specific areas and hours of the city. (5) The effects of greenery on park vibrancy were highly context-dependent, varying across viewing perspectives and spatial granularity. Consequently, greening plans for Chengdu’s parks call for a holistic approach that integrates both two-dimensional and three-dimensional views, and balances overall planning at the macro granularity with local details at the micro granularity, in line with the city’s Beautiful, Livable Park City initiative.
Author Contributions
B.Y.: Writing—original draft, methodology, formal analysis, conceptualization. Y.Y.: writing—review and editing, methodology, formal analysis, conceptualization. L.H.: writing—review and editing, validation. H.F.: writing—review and editing, validation, formal analysis. P.L.: methodology, formal analysis. R.L.: writing—review and editing. H.Q.: writing—review and editing, validation. All authors have read and agreed to the published version of the manuscript.
Funding
This study was supported by the National Natural Science Foundation of China (No. 52508088), the Fundamental Research Funds for the Central Universities (No. 2682026CX099), and the Postdoctoral Science Foundation of China (No. 2026T190439, No. 2025M781555).
Data Availability Statement
The original contributions presented in the study are included in the article. Further inquiries can be directed to the corresponding author.
Conflicts of Interest
The authors declare no conflict of interest.
Appendix A
Table A1.
Park-level GTWR coefficients: standard deviation and sign distribution.
Table A2.
Mean GTWR coefficients by park type (weekday/weekend).
Table A3.
Pairwise Pearson correlations and variance inflation factors (VIFs) of the built-environment variables.
References
- Zhou, J.; Yang, M.; Chai, J.; Wu, L. Evaluation on the urban green space layout in the central city of Yuxi based on big data. Front. Environ. Sci. 2022, 10, 1068205. [Google Scholar] [CrossRef] [Scilit]
- Lee, G.; Hong, I. Measuring spatial accessibility in the context of spatial disparity between demand and supply of urban park service. Landsc. Urban Plan. 2013, 119, 85–90. [Google Scholar] [CrossRef] [Scilit]
- Ma, Y.; Koomen, E.; Rouwendal, J.; Wang, Z. The increasing value of urban parks in a growing metropole. Cities 2024, 147, 104794. [Google Scholar] [CrossRef] [Scilit]
- Chaiyarat, R.; Wutthithai, O.; Punwong, P.; Taksintam, W. Relationships between urban parks and bird diversity in the Bangkok metropolitan area, Thailand. Urban Ecosyst. 2019, 22, 201–212. [Google Scholar] [CrossRef] [Scilit]
- Yang, L.; Yang, H.; Yu, B.; Lu, Y.; Cui, J.; Lin, D. Exploring non-linear and synergistic effects of green spaces on active travel using crowdsourced data and interpretable machine learning. Travel Behav. Soc. 2024, 34, 100673. [Google Scholar] [CrossRef] [Scilit]
- Buchel, S.; Frantzeskaki, N. Citizens’ voice: A case study about perceived ecosystem services by urban park users in Rotterdam, the Netherlands. Ecosyst. Serv. 2015, 12, 169–177. [Google Scholar] [CrossRef] [Scilit]
- Larson, L.R.; Jennings, V.; Cloutier, S.A. Public Parks and Wellbeing in Urban Areas of the United States. PLoS ONE 2016, 11, e0153211. [Google Scholar] [CrossRef] [Scilit] [PubMed]
- Tan, P.Y.; Samsudin, R. Effects of spatial scale on assessment of spatial equity of urban park provision. Landsc. Urban Plan. 2017, 158, 139–154. [Google Scholar] [CrossRef] [Scilit]
- Volenec, Z.M.; Abraham, J.O.; Becker, A.D.; Dobson, A.P. Public parks and the pandemic: How park usage has been affected by COVID-19 policies. PLoS ONE 2021, 16, e0251799. [Google Scholar] [CrossRef] [Scilit] [PubMed]
- Zhang, R.; Peng, S.; Sun, F.; Deng, L.; Che, Y. Assessing the social equity of urban parks: An improved index integrating multiple quality dimensions and service accessibility. Cities 2022, 129, 103839. [Google Scholar] [CrossRef] [Scilit]
- Jacobs, J. The Death and Life of Great American Cities; Random House: New York, NY, USA, 1961. [Google Scholar]
- Chen, Z.; Dong, B.; Pei, Q.; Zhang, Z. The impacts of urban vitality and urban density on innovation: Evidence from China’s Greater Bay Area. Habitat Int. 2022, 119, 102490. [Google Scholar] [CrossRef] [Scilit]
- Chen, Y.; Yu, B.; Shu, B.; Yang, L.; Wang, R. Exploring the spatiotemporal patterns and correlates of urban vitality: Temporal and spatial heterogeneity. Sustain. Cities Soc. 2023, 91, 104440. [Google Scholar] [CrossRef] [Scilit]
- Cohen, D.A.; Marsh, T.; Williamson, S.; Derose, K.P.; Martinez, H.; Setodji, C.; McKenzie, T.L. Parks and physical activity: Why are some parks used more than others? Prev. Med. 2010, 50, S9–S12. [Google Scholar] [CrossRef] [Scilit] [PubMed]
- Gao, F.; Liao, S.; Wang, Z.; Cai, G.; Feng, L.; Yang, Z.; Chen, W.; Chen, X.; Li, G. Revealing disparities in different types of park visits based on cellphone signaling data in Guangzhou, China. J. Environ. Manag. 2024, 351, 119969. [Google Scholar] [CrossRef] [Scilit] [PubMed]
- Ouyang, J.; Fan, H.; Wang, L.; Zhu, D.; Yang, M. Revealing urban vibrancy stability based on human activity time-series. Sustain. Cities Soc. 2022, 85, 104053. [Google Scholar] [CrossRef] [Scilit]
- Kim, Y.L. Seoul’s Wi-Fi hotspots: Wi-Fi access points as an indicator of urban vitality. Comput. Environ. Urban Syst. 2018, 72, 13–24. [Google Scholar] [CrossRef] [Scilit]
- Yang, J.; Cao, J.; Zhou, Y. Elaborating non-linear associations and synergies of subway access and land uses with urban vitality in Shenzhen. Transp. Res. Part A Policy Pract. 2021, 144, 74–88. [Google Scholar] [CrossRef] [Scilit]
- Li, M.; Liu, J.; Lin, Y.; Xiao, L.; Zhou, J. Revitalizing historic districts: Identifying built environment predictors for street vibrancy based on urban sensor data. Cities 2021, 117, 103305. [Google Scholar] [CrossRef] [Scilit]
- Zhang, Z.; Yang, J.; Shi, Y.; Yang, H.; Chen, D.; Zhang, C.; Zhang, Z.; Zhang, X. Installation of pocket parks in mountainous cities: A case study on the nonlinear effect of the built environment on pocket park vitality in Chongqing, China. Ecol. Indic. 2025, 173, 113417. [Google Scholar] [CrossRef] [Scilit]
- Li, F.; Li, F.; Li, S.; Long, Y. Deciphering the recreational use of urban parks: Experiments using multi-source big data for all Chinese cities. Sci. Total Environ. 2020, 701, 134896. [Google Scholar] [CrossRef] [Scilit] [PubMed]
- Yang, L.; Ao, Y.; Ke, J.; Lu, Y.; Liang, Y. To walk or not to walk? Examining non-linear effects of streetscape greenery on walking propensity of older adults. J. Transp. Geogr. 2021, 94, 103099. [Google Scholar] [CrossRef] [Scilit]
- Kong, L.; Liu, Z.; Pan, X.; Wang, Y.; Guo, X.; Wu, J. How do different types and landscape attributes of urban parks affect visitors’ positive emotions? Landsc. Urban Plan. 2022, 226, 104482. [Google Scholar] [CrossRef] [Scilit]
- Kwan, M.P. The uncertain geographic context problem. Ann. Assoc. Am. Geogr. 2012, 102, 958–968. [Google Scholar] [CrossRef] [Scilit]
- Jiang, Y.; Sun, Z.; Wei, D.; Zhao, P.; Yang, L.; Lu, Y. Revealing the spatiotemporal pattern of urban vibrancy at the urban agglomeration scale: Evidence from the Pearl River Delta, China. Appl. Geogr. 2025, 181, 103694. [Google Scholar] [CrossRef] [Scilit]
- Yang, L. Integrating six feeder modes with the metro system: Insights from on-demand and pooled services. Transp. Res. Part E Logist. Transp. Rev. 2026, 208, 104659. [Google Scholar] [CrossRef] [Scilit]
- Eldeeb, G.; Mohamed, M.; Páez, A. Built for active travel? Investigating the contextual effects of the built environment on transportation mode choice. J. Transp. Geogr. 2021, 96, 103158. [Google Scholar] [CrossRef] [Scilit]
- Li, X.; Li, Y.; Jia, T.; Zhou, L.; Hijazi, I.H. The six dimensions of built environment on urban vitality: Fusion evidence from multi-source data. Cities 2022, 121, 103482. [Google Scholar] [CrossRef] [Scilit]
- Peng, Y.; Cui, X.; Yu, B.; Liu, R.; Li, H. How 2D and 3D built environment impact urban vitality: Evidence from overhead-level to eye-level urban form metrics. Land 2025, 14, 1026. [Google Scholar] [CrossRef] [Scilit]
- Chen, Y.; Liu, X.; Gao, W.; Wang, R.Y.; Li, Y.; Tu, W. Emerging social media data on measuring urban park use. Urban For. Urban Green. 2018, 31, 130–141. [Google Scholar] [CrossRef] [Scilit]
- Donahue, M.L.; Keeler, B.L.; Wood, S.A.; Fisher, D.M.; Hamstead, Z.A.; McPhearson, T. Using social media to understand drivers of urban park visitation in the Twin Cities, MN. Landsc. Urban Plan. 2018, 175, 1–10. [Google Scholar] [CrossRef] [Scilit]
- Zhu, J.; Lu, H.; Zheng, T.; Rong, Y.; Wang, C.; Zhang, W.; Yan, Y.; Tang, L. Vitality of urban parks and its influencing factors from the perspective of recreational service supply, demand, and spatial links. Int. J. Environ. Res. Public Health 2020, 17, 1615. [Google Scholar] [CrossRef] [Scilit] [PubMed]
- Lyu, F.; Zhang, L. Using multi-source big data to understand the factors affecting urban park use in Wuhan. Urban For. Urban Green. 2019, 43, 126367. [Google Scholar] [CrossRef] [Scilit]
- Zhang, S.; Zhou, W. Recreational visits to urban parks and factors affecting park visits: Evidence from geotagged social media data. Landsc. Urban Plan. 2018, 180, 27–35. [Google Scholar] [CrossRef] [Scilit]
- Baran, P.K.; Smith, W.R.; Moore, R.C.; Floyd, M.F.; Bocarro, J.N.; Cosco, N.G.; Danninger, T.M. Park use among youth and adults: Examination of individual, social, and urban form factors. Environ. Behav. 2014, 46, 768–800. [Google Scholar]
- Xiao, Z.; Zhang, C.; Li, Y.; Chen, Y. Community park visits determined by the interactions between built environment attributes: An explainable machine learning method. Appl. Geogr. 2024, 172, 103423. [Google Scholar] [CrossRef] [Scilit]
- Gao, F.; Deng, X.; Liao, S.; Liu, Y.; Chen, W.; Li, G. Comparing visitation patterns in distinct types of parks using geospatial data and interpretable machine learning. Urban For. Urban Green. 2025, 112, 128986. [Google Scholar] [CrossRef] [Scilit]
- Li, X.; Zhang, C.; Li, W.; Ricard, R.; Meng, Q.; Zhang, W. Assessing street-level urban greenery using Google Street View and a modified green view index. Urban For. Urban Green. 2015, 14, 675–685. [Google Scholar] [CrossRef] [Scilit]
- Jiang, Y.; Liu, D.; Ren, L.; Grekousis, G.; Lu, Y. Tree abundance, species richness, or species mix? Exploring the relationship between features of urban street trees and pedestrian volume in Jinan, China. Urban For. Urban Green. 2024, 95, 128294. [Google Scholar] [CrossRef] [Scilit]
- Liu, D.; Lu, Y.; Jiang, Y. Exploring the environmental justice of street tree provision: Adding biodiversity to automatic assessment of street-level greenery. Urban For. Urban Green. 2026, 115, 129184. [Google Scholar] [CrossRef] [Scilit]
- Roussel, R.; Jacoby, S.; Asadipour, A. Robust building identification from street views using deep convolutional neural networks. Buildings 2024, 14, 578. [Google Scholar] [CrossRef] [Scilit]
- Liu, L.; Silva, E.A.; Wu, C.; Wang, H. A machine learning-based method for the large-scale evaluation of the qualities of the urban environment. Comput. Environ. Urban Syst. 2017, 65, 113–125. [Google Scholar] [CrossRef] [Scilit]
- Luo, C.; Mo, Y.; Wang, Y.; Jiang, Y.; Zhang, W. How streetscape design shapes everyday street vitality: The mediating role of commercial satisfaction within a servicescape framework. Appl. Spat. Anal. Policy 2026, 19, 86. [Google Scholar] [CrossRef] [Scilit]
- Zhao, K.; Guo, J.; Ma, Z.; Wu, W. Exploring the spatiotemporal heterogeneity and stationarity in the relationship between street vitality and built environment. Sage Open 2023, 13, 21582440231152226. [Google Scholar] [CrossRef] [Scilit]
- Bahriny, F.; Bell, S. Patterns of urban park use and their relationship to factors of quality: A case study of Tehran, Iran. Sustainability 2020, 12, 1560. [Google Scholar] [CrossRef] [Scilit]
- Yasumoto, S.; Nakaya, T.; Jones, A.P. Quantitative environmental equity analysis of perceived accessibility to urban parks in Osaka Prefecture, Japan. Appl. Spat. Anal. Policy 2021, 14, 337–354. [Google Scholar] [CrossRef] [Scilit]
- Qin, L.; Zong, W.; Peng, K.; Zhang, R. Assessing spatial heterogeneity in urban park vitality for a sustainable built environment: A case study of Changsha. Land 2024, 13, 480. [Google Scholar] [CrossRef] [Scilit]
- Fan, Z.; Duan, J.; Lu, Y.; Zou, W.; Lan, W. A geographical detector study on factors influencing urban park use in Nanjing, China. Urban For. Urban Green. 2021, 59, 126996. [Google Scholar] [CrossRef] [Scilit]
- Grilli, G.; Mohan, G.; Curtis, J. Public park attributes, park visits, and associated health status. Landsc. Urban Plan. 2020, 199, 103814. [Google Scholar] [CrossRef] [Scilit]
- Cui, T.; Ye, Y.; Zhuang, Y.; Lin, Q.; Yan, M.; Zhang, L.; Zhu, L. A study of the changing characteristics and influencing factors of holiday visitor vitality in urban parks: The case of Fuzhou, China. PLoS ONE 2024, 19, e0311546, Correction in PLoS ONE 2026, 21, e0345091. [Google Scholar] [CrossRef] [Scilit] [PubMed]
- Chen, L.; Zhao, L.; Xiao, Y.; Lu, Y. Investigating the spatiotemporal pattern between the built environment and urban vibrancy using big data in Shenzhen, China. Comput. Environ. Urban Syst. 2022, 95, 101827. [Google Scholar] [CrossRef] [Scilit]
- Sholihin, M.; Soleh, A.M.; Djuraidah, A. Geographically and Temporally Weighted Regression (GTWR) for Modeling Economic Growth Using R. Int. J. Comput. Sci. Netw. 2017, 6, 800–805. [Google Scholar]
- Li, J.; Li, J.; Yuan, Y.; Li, G. Spatiotemporal distribution characteristics and mechanism analysis of urban population density: A case of Xi’an, Shaanxi, China. Cities 2019, 86, 62–70. [Google Scholar] [CrossRef] [Scilit]
- Fang, L.; Huang, J.; Zhang, Z.; Nitivattananon, V. Data-driven framework for delineating urban population dynamic patterns: Case study on Xiamen Island, China. Sustain. Cities Soc. 2020, 62, 102365. [Google Scholar] [CrossRef] [Scilit] [PubMed]
- Majid, I.A.; Latif, Z.A.; Adnan, N.A. Tree species classification using WorldView-3 data. In Proceedings of the 2016 7th IEEE Control and System Graduate Research Colloquium (ICSGRC), Shah Alam, Malaysia, 8 August 2016; pp. 73–76. [Google Scholar]
- Bondarenko, M.; Priyatikanto, R.; Tejedor-Garavito, N.; Zhang, W.; McKeen, T.; Cunningham, A.; Woods, T.; Hilton, J.; Cihan, D.; Nosatiuk, B.; et al. Constrained Estimates of 2015–2030 Total Number of People per Grid Square at a Resolution of 3 Arc (Approximately 100 m at the Equator) R2025A Version V1. Global Demographic Data Project-Funded by The Bill and Melinda Gates Foundation (INV-045237); WorldPop-School of Geography and Environmental Science, University of Southampton: Southampton, UK, 2025. [Google Scholar]
- Han, L.; Yu, B.; Fang, H.; Jiang, Y.; Yang, Y.; Qiu, H. Deciphering the impact of waterfront spatial environments on physical activity through SHAP: A tripartite study of riverfront, lakeshore, and seafront spaces in Shenzhen. Land 2025, 14, 2424. [Google Scholar] [CrossRef] [Scilit]
- Waldner, F.; Diakogiannis, F.I. Deep learning on edge: Extracting field boundaries from satellite images with a convolutional neural network. Remote Sens. Environ. 2020, 245, 111741. [Google Scholar] [CrossRef] [Scilit]
- Fu, B.J.; Chen, L.D. Agricultural landscape spatial pattern analysis in the semi-arid hill area of the Loess Plateau, China. J. Arid Environ. 2000, 44, 291–303. [Google Scholar] [CrossRef] [Scilit]
- Yeh, C.T.; Huang, S.L. Investigating spatiotemporal patterns of landscape diversity in response to urbanization. Landsc. Urban Plan. 2009, 93, 151–162. [Google Scholar] [CrossRef] [Scilit]
- Huang, B.; Wu, B.; Barry, M. Geographically and temporally weighted regression for modeling spatio-temporal variation in house prices. Int. J. Geogr. Inf. Sci. 2010, 24, 383–401. [Google Scholar] [CrossRef] [Scilit]
- Xu, J. From walking buffers to active places: An activity-based approach to measure human-scale urban form. Landsc. Urban Plan. 2019, 191, 103452. [Google Scholar] [CrossRef] [Scilit]
- Hägerstrand, T. What about people in regional science? Pap. Reg. Sci. Assoc. 1970, 24, 7–21. [Google Scholar] [CrossRef] [Scilit]
- Sang, Y.; Hu, Y.; Qin, X.; Yan, H.; Wu, R.; Qian, F.; Nan, X.; Shao, F.; Bao, Z. Impacts of street tree canopy coverage on pedestrians’ dynamic thermal perception and walking willingness. Sustain. Cities Soc. 2025, 121, 106196. [Google Scholar] [CrossRef] [Scilit]
- Wu, C.; Ye, X.; Ren, F.; Du, Q. Check-in behaviour and spatio-temporal vibrancy: An exploratory analysis in Shenzhen, China. Cities 2018, 77, 104–116. [Google Scholar] [CrossRef] [Scilit]
- Kang, C.; Fan, D.; Jiao, H. Validating activity, time, and space diversity as essential components of urban vitality. Environ. Plan. B Urban Anal. City Sci. 2021, 48, 1180–1197. [Google Scholar] [CrossRef] [Scilit]
- Zhou, C.; An, Y.; Zhao, J.; Xue, Y.; Fu, L. How do mini-parks serve in groups? A visit analysis of mini-park groups in the neighbourhoods of Nanjing. Cities 2022, 129, 103804. [Google Scholar] [CrossRef] [Scilit]
- Kaplan, R.; Kaplan, S. The Experience of Nature: A Psychological Perspective; Cambridge University Press: Cambridge, UK, 1989. [Google Scholar]
- Zhang, W.; Yang, J.; Ma, L.; Huang, C. Factors affecting the use of urban green spaces for physical activities: Views of young urban residents in Beijing. Urban For. Urban Green. 2015, 14, 851–857. [Google Scholar] [CrossRef] [Scilit]
- Smith, I.A.; Li, D.; Fork, D.K.; Wellenius, G.A.; Hutyra, L.R. Integrated tree canopy expansion and cool roofs can optimize air temperature and heat exposure reductions in Boston. Commun. Earth Environ. 2025, 6, 507. [Google Scholar] [CrossRef] [Scilit]
- Liao, W.; Guldmann, J.M.; Hu, L.; Cao, Q.; Gan, D.; Li, X. Linking urban park cool island effects to the landscape patterns inside and outside the park: A simultaneous equation modeling approach. Landsc. Urban Plan. 2023, 232, 104681. [Google Scholar] [CrossRef] [Scilit]
- Son, J.M.; Eum, J.H.; Sung, U.J. Thermal mitigation effects of building and tree shade in a high-rise and park-dense urban area. Sustain. Cities Soc. 2026, 136, 107073. [Google Scholar] [CrossRef] [Scilit]
- Zhen, F.; Cao, Y.; Qin, X.; Wang, B. Delineation of an urban agglomeration boundary based on Sina Weibo microblog “check-in” data: A case study of the Yangtze River Delta. Cities 2017, 60, 180–191. [Google Scholar] [CrossRef] [Scilit]

Disclaimer/Publisher’s Note: The statements, opinions and data contained in all publications are solely those of the individual author(s) and contributor(s) and not of MDPI and/or the editor(s). MDPI and/or the editor(s) disclaim responsibility for any injury to people or property resulting from any ideas, methods, instructions or products referred to in the content. |
© 2026 by the authors. Licensee MDPI, Basel, Switzerland. This article is an open access article distributed under the terms and conditions of the Creative Commons Attribution (CC BY) license.