


Abstract
Coastal salt marsh restoration can support blue carbon sequestration, but spatial pre-assessment is needed to identify where environmental conditions support vegetation establishment before restoration design and carbon accounting. This study developed a threshold-based framework for spatial pre-assessment of coastal salt marsh restoration suitability. The framework combines species-specific limits for tidal inundation duration, seawater salinity and sediment salinity with sediment type in a geographic information system workflow. Tidal inundation limits are translated into critical-elevation boundaries, and retained polygons are examined against planning, historical-distribution and use-right conditions. A general threshold library was compiled for five representative native salt marsh species, while regional records define the candidate set for each application. In Yingkou, China, Suaeda heteroptera and Phragmites australis formed the candidate set. For S. heteroptera, the 3 h d−1 inundation limit corresponded to a critical elevation of 1.90 m. July 2024 sediment salinity (0.96–1.08%) and September 2025 seawater salinity (29.715–29.825‰) met the corresponding screening limits for S. heteroptera and excluded P. australis. The integrated restoration-suitability area covered 76.5 ha, and 99.5% of the mapped current S. heteroptera distribution fell within it. The framework identifies candidate restoration space for field verification, restoration planning and subsequent carbon accounting.
1. Introduction
Wetlands are important ecosystems for long-term carbon storage because waterlogged soils can slow organic matter decomposition and support carbon accumulation over long periods [1]. Coastal salt marshes, mangroves and seagrass meadows are widely recognized as blue carbon ecosystems [2]. Salt marsh carbon storage is supported by high plant productivity, sediment trapping, anaerobic sediment conditions and the burial of organic carbon in soils [3,4]. Restoration can recover these functions while improving habitat quality and coastal protection [5,6]. Blue carbon conservation and restoration also contribute to climate mitigation, coastal resilience and broader goals for sustainable coastal development [7,8]. Evidence from salt marsh restoration shows that ecological outcomes depend strongly on site conditions and species selection, with successful planting supporting carbon storage and other ecosystem services [9]. For restoration planning, the mapped extent of a potential project area provides an initial spatial basis. Stable carbon accumulation also depends on the establishment and persistence of salt marsh vegetation under suitable local conditions [6,8,9].
Coastal wetland carbon stocks and restoration outcomes vary substantially across space. In China, soil organic carbon stocks and losses differ among ecosystem types, sedimentary settings and plant communities [10]. Restoration-based blue carbon benefits also respond to local environmental conditions. Inundation and rainfall influence the carbon potential of coastal wetland restoration [11], while sediment deposition, organic matter production and sea-level-driven inundation shape salt marsh carbon accumulation [12]. Salinity and inundation can further alter soil carbon decomposition during restoration [13]. These spatially variable processes also control vegetation establishment and persistence. A candidate restoration area may therefore contain zones with different levels of environmental suitability. Spatial screening provides a practical way to identify the areas where target vegetation can establish before those areas are used for restoration planning and subsequent carbon assessment.
Existing studies provide several forms of spatial support for blue carbon and wetland restoration planning. Landscape-scale blue carbon frameworks integrate vegetation, geomorphic setting, management context, carbon stocks and additionality [14]. GIS-based decision-support tools have also been used to locate potential blue carbon restoration sites by combining ecosystem distribution, geomorphology, hydrodynamic conditions and land tenure [15]. Geospatial assessments of salt marsh condition use elevation and other spatial indicators to guide restoration priorities and management actions [16]. Greenhouse gas inventory guidance establishes requirements for wetland boundaries, activity data and land-use transitions [17], while restoration guidance considers hydrology, geomorphology, existing uses and implementation constraints [18]. These approaches provide important components for restoration planning. A remaining methodological need is the direct translation of species-specific ecological tolerances into spatial screening boundaries. This is particularly relevant for tidal inundation, where plant tolerance is usually expressed as inundation duration while GIS analysis requires a spatial boundary. Linking the two would allow species establishment requirements to be incorporated into site screening before carbon accounting.
This study develops a threshold-based framework for spatial pre-assessment of coastal salt marsh restoration suitability. The framework converts species-specific tidal inundation tolerance into a mappable critical-elevation boundary and combines this layer with salinity and sediment conditions in GIS. In this study, suitability refers to compliance with the selected environmental screening criteria and implementation conditions. The mapped output identifies candidate restoration space for subsequent site verification and project design. Restoration effectiveness is evaluated after implementation through vegetation establishment and persistence monitoring. Realized carbon sequestration requires field-based carbon measurements and project-specific accounting. The study is organized around the development and application of the framework. Section 2 reviews existing spatial approaches and the environmental basis for restoration-site screening. Section 3 presents the rationale, scope and methodological construction of the framework, including the threshold system, critical-elevation procedure, spatial overlay and implementation grading. Section 4 describes the Yingkou case study and case-specific data. Section 5 presents the application results and internal spatial consistency assessment. Section 6 discusses the methodological contribution, connection with carbon accounting, transferability and current limitations.
2. Literature Review
2.1. Spatial Approaches for Blue Carbon and Coastal Wetland Restoration
Spatial information is central to blue carbon assessment because carbon stocks, ecological condition and restoration feasibility vary across coastal landscapes. Rogers et al. [14] developed a landscape-scale framework that links blue carbon stocks and additionality with vegetation cover, geomorphic setting and management context. This approach provides a spatial basis for carbon assessment and highlights the importance of defining ecosystem boundaries and land-use history. Greenhouse gas inventory guidance similarly requires spatially explicit wetland boundaries, activity data and land-use transitions before emissions and removals can be quantified [17].
Spatial decision-support methods have also been developed for restoration planning. Nuyts et al. [15] integrated blue carbon ecosystem distribution, coastal geomorphology, hydrodynamic conditions and land tenure in a GIS-based tool for identifying potential restoration sites. Ganju et al. [16] used spatial information on salt marsh elevation, vegetation condition and sediment-based persistence to guide restoration and management decisions. Restoration guidance provides a broader set of practical criteria, including geomorphology, hydrology, existing uses, infrastructure and implementation constraints [18]. Together, these studies show the value of spatial analysis for locating and prioritizing restoration opportunities. Across these approaches, species-specific environmental tolerances are generally treated as ecological considerations and are less frequently translated into explicit GIS boundaries for restoration screening [14,15,16,18].
2.2. Environmental Controls on Salt Marsh Restoration Suitability
Salt marsh restoration depends on successful establishment and persistence of target vegetation. A global synthesis of salt marsh planting found that restoration success varies with species characteristics, site conditions and management practices, and that appropriate site and species selection can improve vegetation establishment and subsequent ecosystem functions [9]. Hydrology is a major control because flooding frequency and duration influence germination, seedling survival and vegetation distribution [19,20]. Elevation is closely related to these processes in tidal wetlands because small vertical differences can produce substantial differences in inundation exposure.
Salinity and sediment conditions provide additional environmental filters. Water and sediment salinity influence plant establishment, growth and community persistence, while sediment characteristics affect rooting, substrate stability and sediment accumulation [18,19,20]. These factors also interact with carbon processes through vegetation production, sediment deposition and organic matter decomposition [11,12,13]. Their effects vary among species and locations. A spatial suitability assessment therefore requires locally relevant species information and environmental criteria that can be represented consistently across the assessment area.
These environmental variables describe a core set of mappable constraints for restoration screening. Other factors, including erosion, wave exposure, nutrient availability, propagule supply and biological interactions, can also influence restoration success [9,18]. Their importance depends on local conditions and data availability. Site-level restoration design can incorporate these additional factors after broad candidate areas have been identified.
3. Materials and Methods
3.1. Framework Rationale and Scope
The literature summarized in Section 2 provides a strong foundation for blue carbon accounting, landscape assessment and restoration-site prioritization [14,15,16,17,18]. A practical gap remains between species-level ecological evidence and spatial pre-assessment. Plant tolerance is commonly expressed through environmental ranges or limits, whereas restoration planning requires mapped areas with clear spatial boundaries. Tidal inundation illustrates this problem. A species-specific inundation-duration limit can inform ecological suitability, but it must be connected to local water levels and elevation before it can be used in GIS.
The framework developed here addresses this spatial translation step. It uses species-specific inundation and salinity thresholds together with sediment conditions to identify candidate areas for restoration. The upper limit of inundation duration is converted into a critical elevation, which provides a spatial boundary for the tidal-inundation suitability layer. The resulting biophysical suitability is subsequently examined with planning, historical distribution and use-right information.
The framework is intended for native salt marsh restoration in gently sloping intertidal flats or cleared coastal wetlands with tidal exchange and without severe local erosion. Application requires a regionally relevant candidate-species set, operational ecological thresholds, tide or water-level information, elevation data, sediment and salinity information, and spatial planning data where implementation grading is required. The thresholds provide screening criteria for spatial pre-assessment and can be calibrated with local observations when finer restoration design is needed. The mapped output defines candidate areas for field verification and restoration design. Post-restoration monitoring and carbon accounting form subsequent assessment stages.
3.2. Framework Construction and Overall Workflow
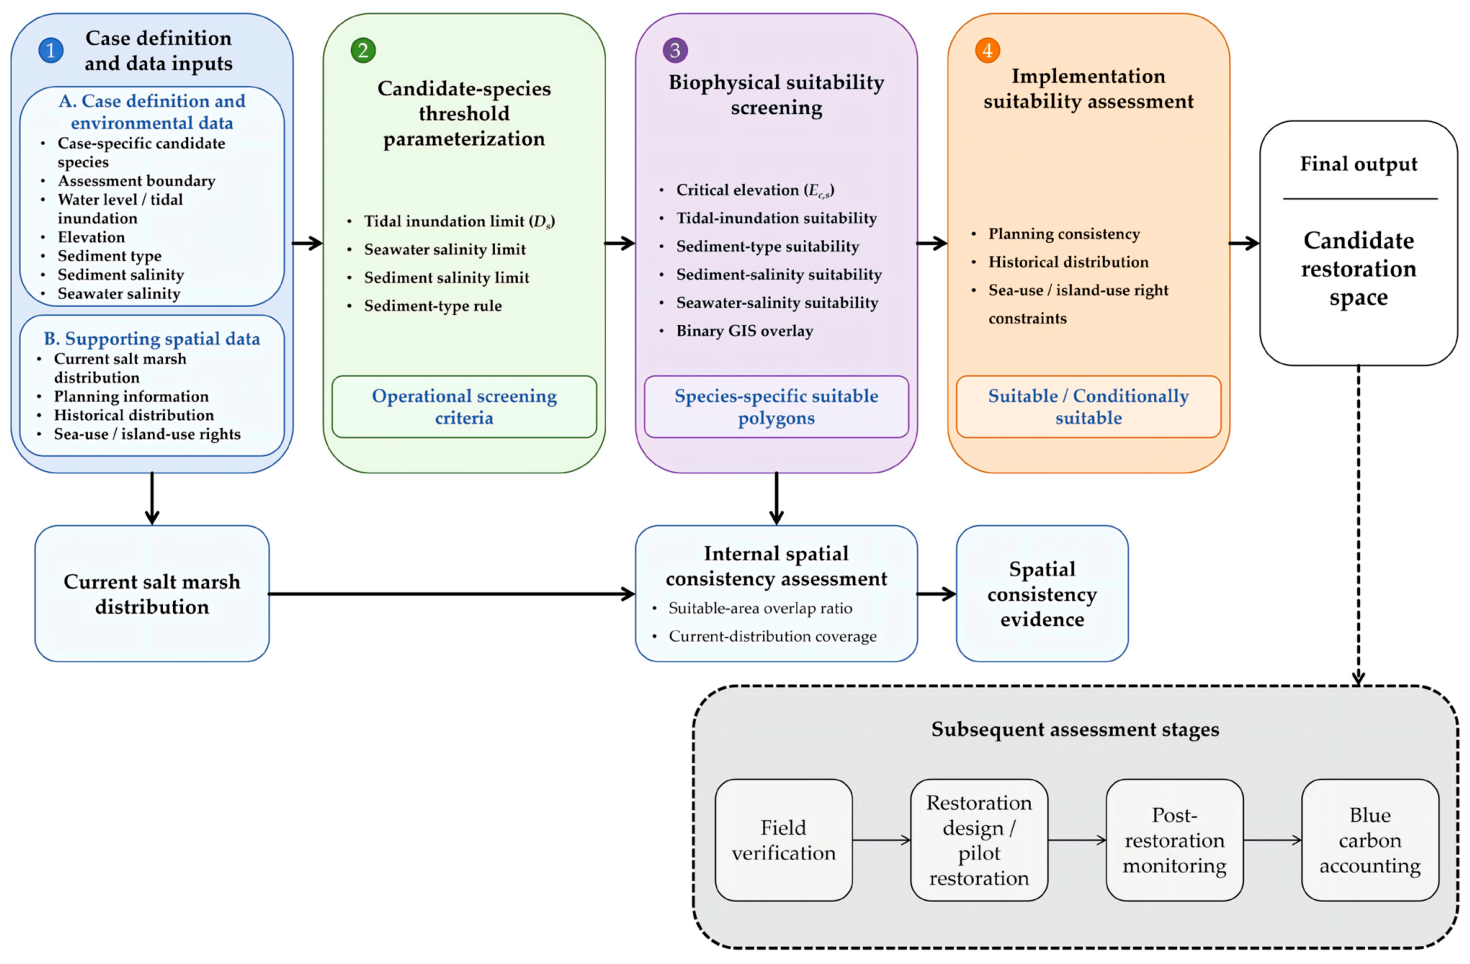
The framework operationalizes the ecological and spatial considerations summarized in Section 2 through a seven-step workflow. A case-specific candidate-species set was defined from native salt marsh species recorded in the surrounding coastal region, together with restoration objectives and available ecological evidence. Current species distribution within the assessment boundary was documented separately. Environmental and spatial data were then collected, including tidal inundation duration, elevation data for threshold spatialization, sediment type, sediment salinity, seawater salinity and current salt marsh distribution. Before indicator-based overlay, the assessment domain was limited to gently sloping intertidal flats or cleared coastal wetland areas suitable for restoration screening. Operational thresholds were assigned to each candidate species using the general threshold library or locally supported ecological evidence. The inundation-duration threshold was converted into a critical elevation. Four single-factor suitability components were generated for each candidate species and combined to identify species-specific suitable areas. The resulting polygons were then examined against spatial planning, historical distribution and sea-use or island-use right information to determine implementation suitability.
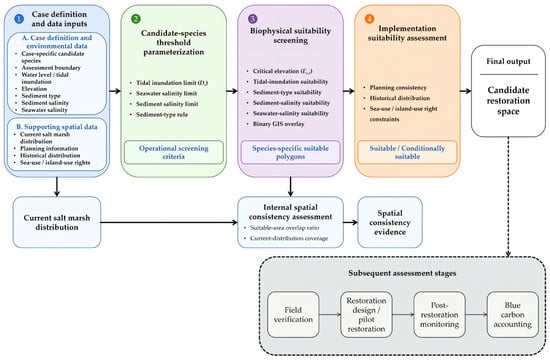
This procedure links restoration suitability screening with the planning stage of restoration-based carbon sink enhancement. The suitable-area polygons identify candidate restoration space under the selected species-specific constraints. These polygons can be carried forward to field verification, restoration design and subsequent carbon accounting [14,17]. The framework is organized into four modules covering case definition and data inputs, candidate-species threshold parameterization, biophysical suitability screening and implementation suitability assessment (Figure 1).
Figure 1.
Workflow of the threshold-based spatial pre-assessment framework for coastal salt marsh restoration suitability. The framework includes four modules: case definition and data inputs, candidate-species threshold parameterization, biophysical suitability screening and implementation suitability assessment. Current salt marsh distribution is used for the internal spatial consistency assessment. The final spatial output defines candidate restoration space and its implementation suitability grade. Field verification, restoration design, post-restoration monitoring and blue carbon accounting form subsequent assessment stages. Source: developed by the authors.
3.3. Core Environmental Screening Indicators for Restoration Suitability
The framework used two indicator groups: hydrological conditions and sediment conditions. Four core environmental screening indicators were included: tidal inundation duration, seawater salinity, sediment type and sediment salinity (Table 1). These variables have clear ecological relevance to salt marsh establishment and can be converted into reproducible spatial screening rules [18,19,20]. They form the core mappable pre-screening set used in this framework. A complete site-level habitat assessment extends beyond these four indicators. Erosion and accretion, wave exposure, microtopography, nutrient conditions, propagule availability, biological interactions and extreme events may also affect restoration outcomes [9,18]. These factors can be incorporated during site-level restoration design when reliable local data are available.
Table 1.
Core environmental screening indicators for coastal salt marsh restoration suitability.
Tidal inundation duration was used to screen the hydrological conditions controlling the seaward establishment boundary of each candidate species. It was spatialized through the local tide–elevation relationship and the species-specific critical elevation. Sediment type represented rooting and substrate stability. Sediment salinity and seawater salinity represented salt stress in the substrate and water column, respectively [18,19,20].
Before applying the four-indicator screen, the assessment domain was limited to gently sloping intertidal flats or cleared coastal wetland areas with tidal exchange and without evident severe local erosion.
Field surveys and measurements should follow the applicable national and marine-industry technical standards. Salt marsh vegetation and distribution surveys can follow HY/T 0460.4-2024 [21]. Hydrological observations, seawater chemical surveys, marine sediment surveys and topographic measurements can follow GB/T 12763.2-2007, GB/T 12763.4-2007, GB/T 12763.8-2007 and GB/T 17501-2017, respectively [22,23,24,25]. These standards specify data collection and measurement procedures. Species-specific operational thresholds are derived from ecological and technical evidence as described in Section 3.4.
3.4. Compilation of Species-Specific Operational Thresholds
Species-specific operational thresholds were compiled for seawater salinity, sediment salinity and tidal inundation duration. The evidence base also included field survey experience, expert consultation and relevant unpublished research findings incorporated into the Technical Guidelines for Identifying Suitable Areas for Carbon Sink Enhancement in Typical Blue Carbon Ecosystems (draft for approval) [26]. Published ecological and restoration studies were used to characterize species responses to hydrology, salinity and related environmental conditions [19,20,27,28,29,30,31,32,33,34].
The operational limits in Table 2 were defined through synthesis of these evidence sources. Published studies provided traceable ecological evidence for species responses and approximate tolerance ranges. Field observations, expert evidence and the unpublished findings incorporated into the draft guideline supported the selection of conservative screening values. The draft guideline provides an integrated technical synthesis of these sources. It is an approval-stage document developed under a formal marine standardization project; formal promulgation is pending.
Table 2.
Species-specific operational thresholds in the general framework library.
The general threshold library was developed at the framework level and included five representative native salt marsh plants from different Chinese coastal settings. The library covers contrasting salinity and inundation conditions and illustrates how the same spatial workflow can be parameterized for different species [19,20,27,28,29,30,31]. Each application defines its candidate-species set from native salt marsh species recorded in the surrounding coastal region, together with restoration objectives and available ecological evidence. Current distribution within the assessment boundary is documented separately. Each case therefore uses the subset of the library that is relevant to its regional species records. Additional native species can be incorporated when suitable threshold evidence is available. The resulting operational thresholds are summarized in Table 2 and can be calibrated with local observations for site-level restoration design. Species-level supporting evidence is summarized in Supplementary Materials Table S1.
3.5. Critical Elevation Mapping Based on Tidal Inundation Tolerance
3.5.1. Tidal Inundation Threshold
Tidal inundation duration links hydrological process with salt marsh vegetation establishment. Each candidate species has an upper limit of daily inundation duration. Areas with longer inundation duration may face seedling stress, reduced establishment success and weaker vegetation persistence. Inundation also affects sediment redox conditions, soil salinity, organic matter decomposition and sediment carbon storage [11,12,19,20].
The framework translated species-specific inundation tolerance into a critical elevation. This step is necessary because GIS suitability mapping requires a spatial boundary, while plant tolerance is often expressed as an inundation duration. Critical elevation was therefore used as the GIS boundary of the tidal-inundation suitability layer for each candidate species.
3.5.2. Critical Elevation Derivation
Tidal data can be obtained from tide-gauge records or tidal prediction products near the assessment area. The species-specific upper limit of daily tidal inundation duration is denoted as Ds, where s indicates the candidate species. The procedure used to derive critical elevation depends on the local tidal regime.
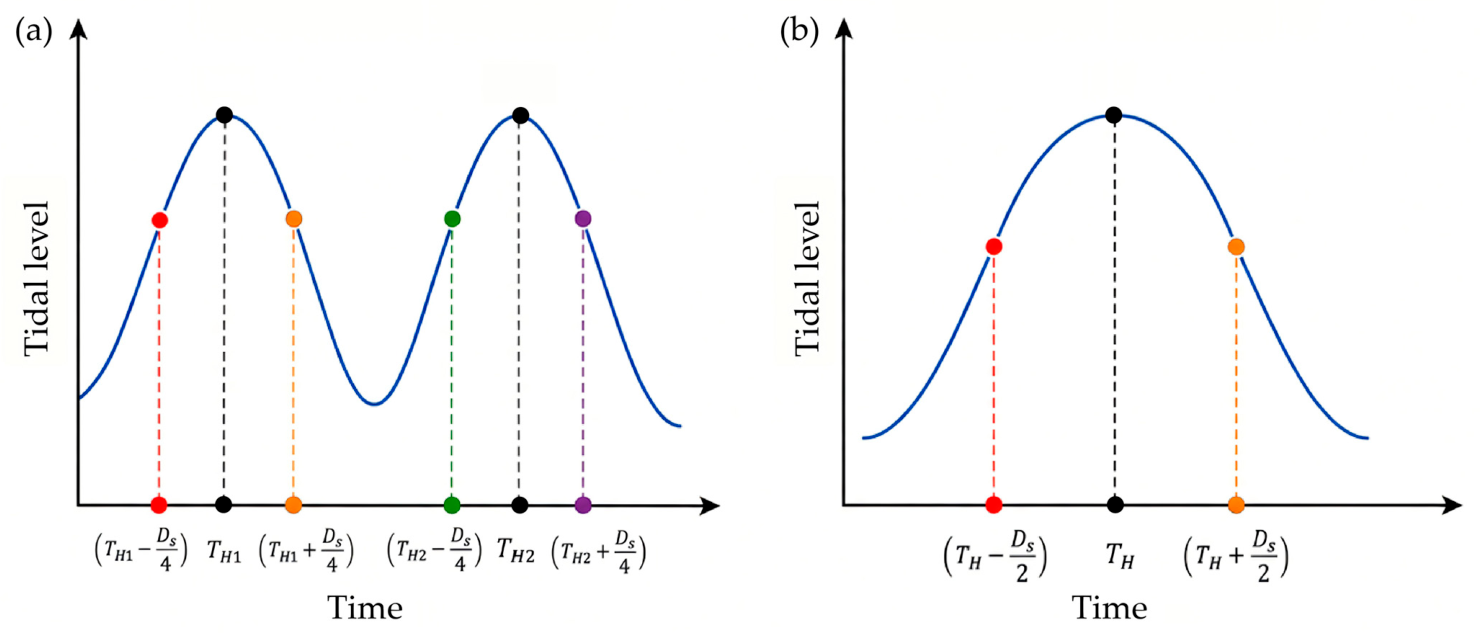
For regular semidiurnal tides, an annual or representative mean tidal curve can be used. Two high-water times occur within one day. Around each high-water time, two time points are identified at before and after high water. Four corresponding tidal levels are extracted and averaged to obtain the critical elevation for species s.
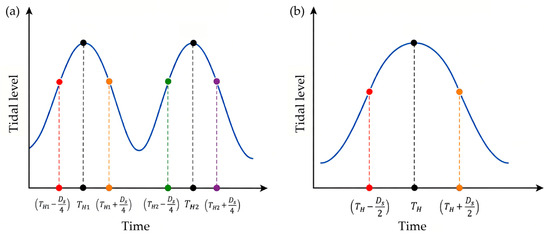
For regular diurnal tides, one high-water time occurs within one day. Two time points are identified at before and after high water. The mean of the two corresponding tidal levels is used as the critical elevation. The time-point procedures for regular semidiurnal and diurnal tides are illustrated in Figure 2.
Figure 2.
Derivation of critical elevation from species-specific tidal inundation tolerance. (a) In regular semidiurnal tide areas, two high-water times occur within one day. Four critical time points are selected by extending before and after each high-water time, and the corresponding tidal levels are averaged to define the critical elevation. (b) In regular diurnal tide areas, one high-water time occurs within one day. Two critical time points are selected by extending before and after the high-water time, and the corresponding tidal levels are averaged to define the critical elevation. Ds represents the species-specific upper limit of daily tidal inundation duration. TH1 and TH2 represent the two high-water times in regular semidiurnal tides, and TH represents the high-water time in regular diurnal tides. These schematic time-point rules apply to regular semidiurnal and diurnal regimes. Mixed or irregular tidal regimes use the continuous-series inundation-duration approach described in Section 3.5.2. Source: prepared by the authors based on the critical-elevation procedure described in Section 3.5.
For these regular tidal regimes, the critical elevation is calculated as
where Ec,s is the critical elevation for species s, ti is the i-th critical time point, is the tidal level at ti, and n is the number of critical time points. For regular semidiurnal tides, n = 4. For regular diurnal tides, n = 2.
Mixed or irregular tidal regimes require a direct inundation-duration approach because high-water timing and amplitude vary among tidal cycles. A continuous or high-frequency observed or simulated water-level series can be used over a representative analysis period. For each candidate elevation E, the time intervals during which the water level equals or exceeds E are summed to obtain inundation duration. Mean daily inundation duration is then calculated across the analysis period to construct an inundation-duration–elevation relationship. The critical elevation Ec,s is identified from the inundation-duration–elevation relationship as the elevation corresponding to the species-specific limit Ds. When the relationship is represented by discrete elevation–duration pairs, the lowest evaluated elevation satisfying the inundation-duration limit can be used as the operational critical elevation. Interpolation can be applied when finer-resolution estimation is required and supported by the available data. The analysis period should capture the main local tidal variability, including spring–neap changes where they are pronounced. Separate representative periods can be evaluated when seasonal hydrodynamic conditions differ.
After Ec,s is determined using the tidal-regime-specific procedure, the corresponding elevation contour is generated in GIS. Areas with elevations equal to or higher than Ec,s are classified as the tidal-inundation suitability component for species s. This component is then combined with sediment type, sediment salinity and seawater salinity in the spatial screening.
3.6. Spatial Overlay and Identification of Suitable Areas
For each candidate species, four binary suitability components were generated or assigned. The tidal-inundation suitability component was derived by converting the species-specific maximum inundation-duration threshold into a critical-elevation boundary. The sediment-type component selected muddy and sandy sediments. The sediment-salinity component identified whether sediment salinity was below the species-specific upper threshold. The seawater-salinity component identified whether seawater salinity was below the species-specific upper threshold. When spatially continuous salinity data are available, sediment-salinity and seawater-salinity components can be implemented as spatially explicit binary layers. Each salinity component should be associated with a defined observation or modeling period. Future applications with strong temporal variability or salinity values close to an operational threshold can use repeated seasonal observations or calibrated hydrodynamic salinity simulations.
Binary classification was used because the framework is designed as an early-stage exclusion screen based on operational environmental limits [35]. Each component records whether a defined screening condition is satisfied and produces an explicit spatial boundary that can be reproduced in GIS. The resulting classes indicate compliance with the operational thresholds. Continuous ecological response gradients and establishment probabilities remain outside this screening step.
For species s, the suitable area was calculated as
where SAs is the suitable area for species s, TIs is the tidal-inundation suitability layer spatialized using the critical elevation, STs is the sediment-type suitability layer, SSs is the sediment-salinity suitability layer, and WSs is the seawater-salinity suitability layer.
The integrated restoration-suitability area was obtained by merging species-specific suitable polygons:
where SA is the integrated restoration-suitability area, SAS is the suitable area for species s, and m is the number of candidate species included in the case-specific assessment. Species information was retained in the attribute table. If one polygon was suitable for more than one native species, all suitable species were recorded. This attribute structure allows later restoration planning to select a single target species or a mixed native community.
All spatial layers were harmonized to the GCS_China_Geodetic_Coordinate_System_2000 coordinate reference system before overlay analysis. Vector polygons were clipped to the assessment boundary. Raster layers were converted into vector polygons or reclassified into binary layers before intersection. Polygon topology was checked and cleaned before area calculation. Polygon areas were calculated in ArcGIS Pro 3.5.4 (Esri Inc., Redlands, CA, USA) using the geodesic area in hectares. Calculations used unrounded polygon areas, whereas area values in the text and tables are reported to one decimal place. The resulting attribute table included location, ecosystem type, suitable species, suitability grade and polygon area. Only polygons that satisfied all four environmental screening criteria were carried forward to the implementation assessment. Polygons failing any environmental screening criterion were removed during the biophysical screening stage.
3.7. Implementation Suitability Grading After Biophysical Screening
Implementation suitability was assessed only for polygons retained after the biophysical screening. This stage considered consistency with spatial planning or ecological restoration priorities, evidence of historical salt marsh distribution, and sea-use or island-use right constraints [14,17,18]. These factors determine whether a biophysically suitable polygon can proceed to detailed restoration planning under the available implementation conditions.
Two implementation grades were used (Table 3). “Suitable” indicates that all three implementation conditions are confirmed. “Conditionally suitable” indicates that the polygon has passed the biophysical screening and that one or more implementation conditions still require confirmation, coordination or adjustment.
Table 3.
Implementation suitability grading rules for biophysically suitable areas.
4. Case Study
4.1. Study Area and Restoration Context
The framework was applied to the Yingkou coastal salt marsh in Liaoning Province, China. The assessment area is located near the Daliaohe Estuary and the Red Beach wetland along the Bohai Sea coast. The GIS assessment boundary covered 1162.4 ha and included the mapped current distribution of S. heteroptera and adjacent gently sloping intertidal flats used for suitability screening. Regional pilot survey results identified S. heteroptera and Phragmites australis as the salt marsh vegetation species recorded in Yingkou. These two species therefore formed the case-specific candidate set. Within the GIS assessment boundary, the current salt marsh vegetation layer mapped S. heteroptera only. Both regional candidate species were screened using the corresponding entries in the general threshold library.
The assessment boundary extended beyond the mapped current S. heteroptera distribution so that adjacent areas could be evaluated under the same environmental criteria. Areas outside the current S. heteroptera layer were treated as candidate assessment space. Their present vegetation composition was not used as a quantitative exclusion criterion because the available data did not provide a complete and spatially consistent classification of all vegetation types across these areas. Field verification is therefore required before restoration design.
Historical information provided by the Yingkou Municipal Bureau of Ocean and Fisheries indicates that S. heteroptera previously occurred within the broader assessed area. However, the available records do not provide a sufficiently documented basis for attributing its reduction in parts of the area to a specific disturbance mechanism. Disturbance cause was therefore not used as an assessment input or screening criterion in the Yingkou application.
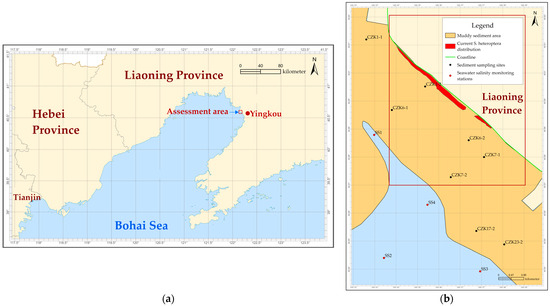
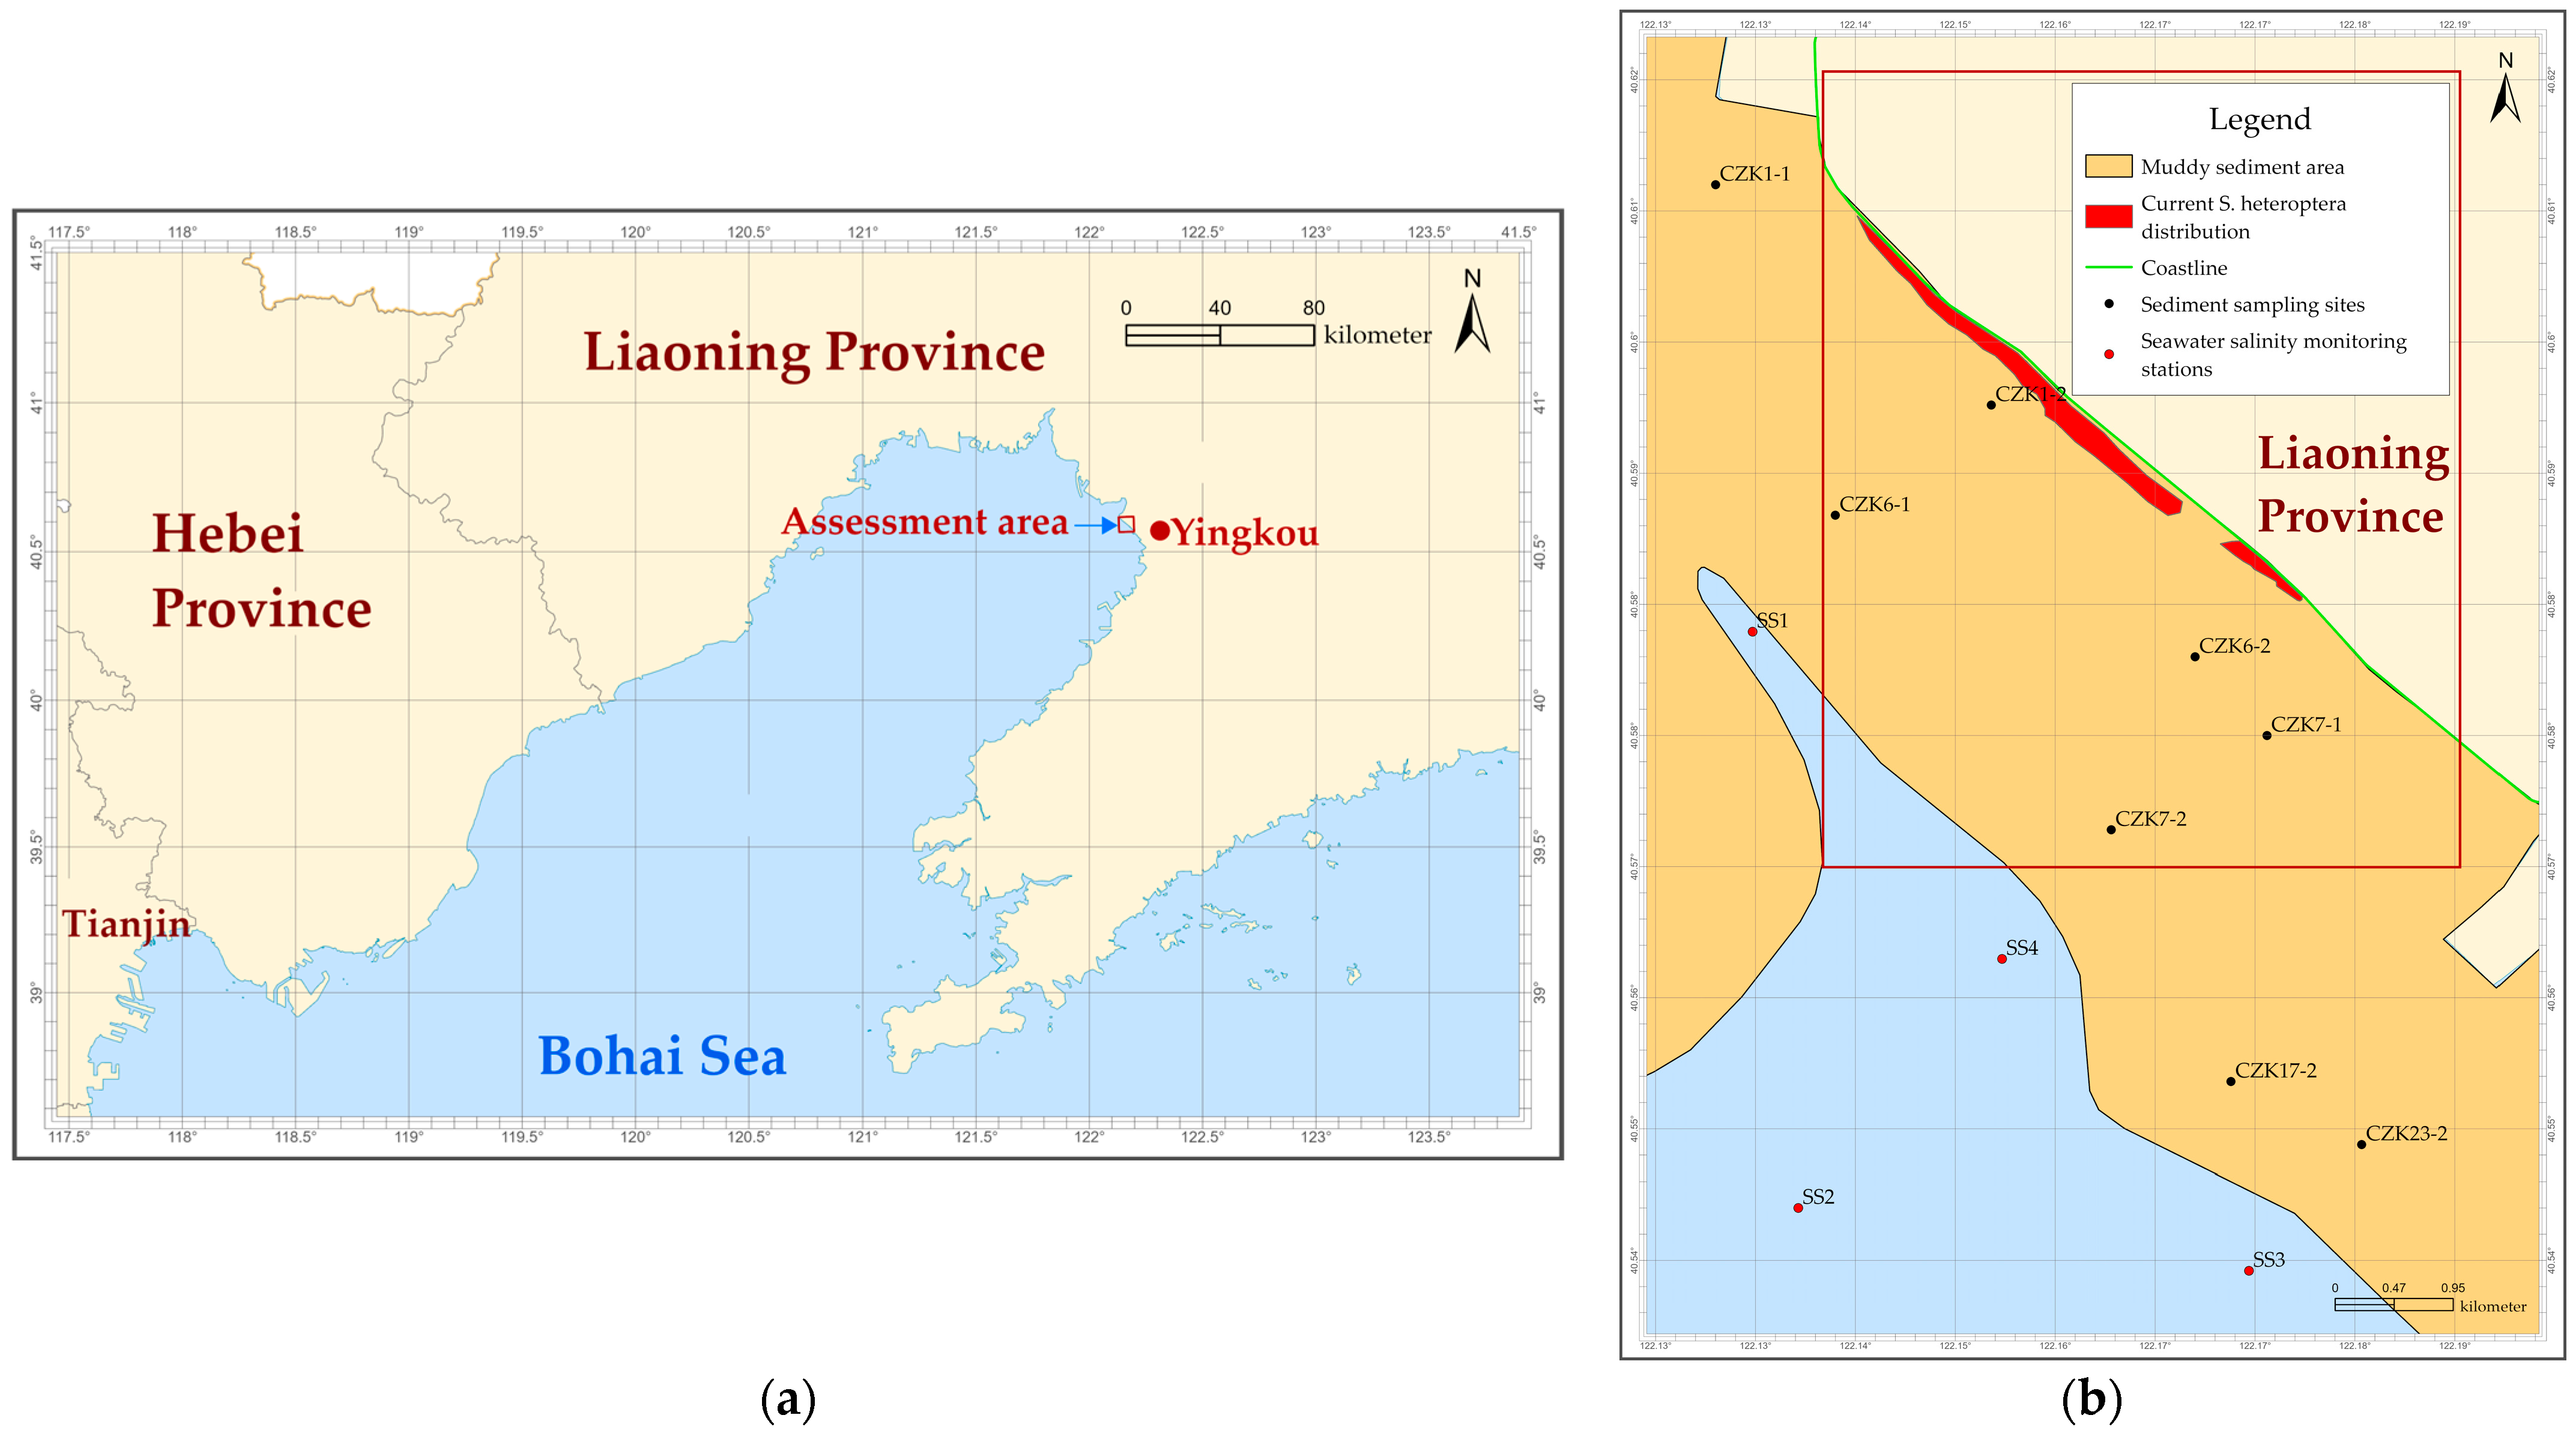
The Yingkou application was used to demonstrate the operation of the framework under local environmental and planning conditions. Its spatial output was compared with the mapped current S. heteroptera distribution through an internal spatial consistency assessment. The regional location and case-specific spatial datasets are shown in Figure 3.
Figure 3.
Location and spatial datasets used in the Yingkou application. (a) Regional location of the assessment area near the Daliaohe Estuary and Red Beach wetland in Yingkou, Liaoning Province, China. The red box indicates the location of the assessment area. (b) Detailed view of the assessment area. The red outline denotes the GIS assessment boundary. The panel also shows the mapped current Suaeda heteroptera distribution, eight sediment sampling sites and four seawater salinity monitoring stations. Source: prepared by the authors using the case-specific spatial and monitoring datasets listed in Table 4.
4.2. Case-Specific Data and Spatial Processing
The Yingkou application used tidal inundation duration, elevation, sediment type, sediment salinity, seawater salinity, current S. heteroptera distribution, spatial planning, historical distribution and sea-use or island-use right data. Table 4 summarizes the source, selection and quality-control criteria, processing method and use of each dataset. Data were selected according to their spatial relevance to the assessment area, traceable institutional source and completeness for the corresponding analytical step. Original sample and monitoring-station identifiers were retained throughout data processing. All case-specific spatial datasets were processed within the GIS assessment boundary defined in Section 4.1.
Table 4.
Data sources, selection and quality-control criteria, processing methods and uses in the Yingkou case study.
The tide–elevation relationship was derived from the numerical experiment report on tidal current and water exchange for the Yingkou marine ecological protection and restoration project [36]. This project-specific dataset provided the local inundation-duration information across the elevation range used in the Yingkou assessment. The spatial elevation dataset used for GIS analysis was accessed through the China Marine Ecological Early Warning and Monitoring Platform and was referenced to the local mean sea level. Sediment type and the mapped current S. heteroptera distribution originated from the 2021 national survey of typical marine ecosystem status conducted by the Ministry of Natural Resources and were accessed through the same platform. Sediment types were classified using the Folk sediment classification system. The S. heteroptera distribution was derived from remote-sensing interpretation and field verification.
Sediment salinity was obtained from field monitoring conducted in the Daliaohe Estuary Red Beach area in July 2024. All eight sediment-salinity samples available from the July 2024 survey for the Red Beach case were included: CZK1-1, CZK1-2, CZK6-1, CZK6-2, CZK7-1, CZK7-2, CZK17-2 and CZK23-2. Their locations are shown in Figure 3b. Sample identifiers and salinity values were checked against the source monitoring records before analysis. These eight records represent the complete set of available sediment-salinity samples for that survey period. The observed values were compared with the species-specific operational thresholds. The narrow sediment-salinity range supported assessment-domain-level binary screening for the July 2024 survey period in the Yingkou application.
Seawater salinity was obtained from all four monitoring stations with available records in and around the assessment area in September 2025. The stations were designated SS1–SS4, and their locations are shown in Figure 3b. Station identifiers and salinity values were checked against the source monitoring records before analysis. These four stations represent the complete set of available September 2025 monitoring stations in and around the assessment area. The observations characterized seawater salinity during the September 2025 survey period. Their values were compared with the species-specific operational thresholds and applied as an assessment-domain-level binary screening condition for that survey period. Interpretation over broader temporal scales requires additional seasonal or multi-year observations.
Planning and historical distribution information was provided by the Yingkou Municipal Bureau of Ocean and Fisheries. Sea-use and island-use right information was obtained from the Sea Area and Island Dynamic Monitoring and Regulatory System of the Ministry of Natural Resources. These datasets were applied to polygons retained by the biophysical screening and were used to assign their implementation suitability grades.
4.3. Internal Spatial Consistency Assessment
The spatial output of the Yingkou application was evaluated against the mapped current distribution of S. heteroptera. Two complementary overlap metrics were used for the internal spatial consistency assessment. The first metric was the suitable-area overlap ratio:
where ORSA is the suitable-area overlap ratio, SASH is the identified suitable area for S. heteroptera, and EDSH is the current distribution area of S. heteroptera. This metric measures the proportion of the mapped suitable area that is already occupied by the current S. heteroptera distribution.
The second metric was the current-distribution coverage:
where ORED is the current-distribution coverage. This metric measures the proportion of the current S. heteroptera distribution that falls within the mapped suitable area. Because the assessment boundary included the mapped current S. heteroptera distribution and adjacent areas included for suitability screening, these metrics were interpreted as an internal spatial consistency assessment.
5. Results
5.1. Critical Elevation Derived from the Tidal-Inundation Threshold for Suaeda heteroptera in Yingkou
The Yingkou candidate-species set comprised S. heteroptera and P. australis, the two salt marsh vegetation species recorded in Yingkou by the regional pilot survey. Within the 1162.4 ha GIS assessment boundary, the current salt marsh vegetation layer mapped S. heteroptera only. Both candidate species have a tidal inundation upper limit of 3 h d−1 in the general threshold library. The case-specific spatial screening was conducted for these two species.
The tide–elevation relationship showed a clear decrease in daily inundation duration with increasing elevation (Table 5). At 1.80 m, the mean inundation duration was 3.68 h d−1. At 1.85 m, the mean inundation duration was 3.42 h d−1 and exceeded the 3 h d−1 threshold. At 1.90 m, it decreased to 2.99 h d−1 and met the threshold. Therefore, 1.90 m was selected as the lowest evaluated elevation satisfying the inundation-duration criterion and was used to spatialize the S. heteroptera inundation threshold in the Yingkou case. Areas at or above this elevation were classified as tidal-inundation suitable because they met the maximum inundation-duration criterion. Areas below this elevation were exposed to longer inundation and were less suitable for stable S. heteroptera establishment.
Table 5.
Daily inundation duration at different elevations in the Yingkou case study.
5.2. Single-Factor Suitability Constraints
5.2.1. Tidal-Inundation Suitability
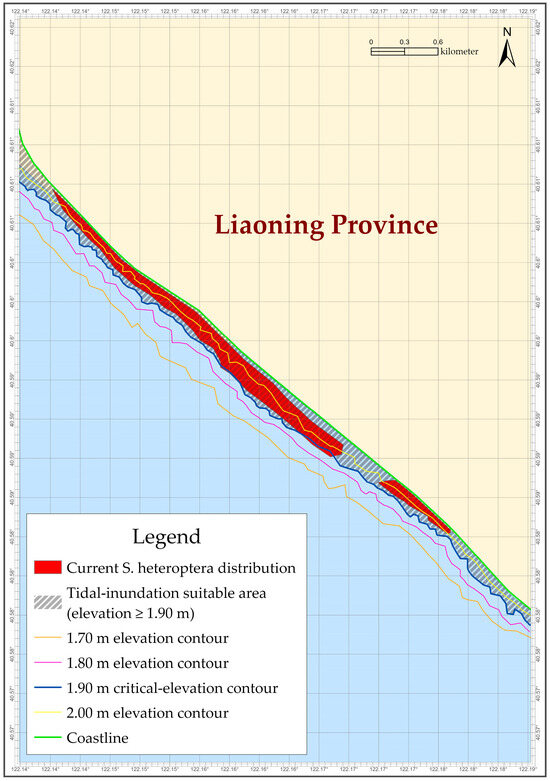
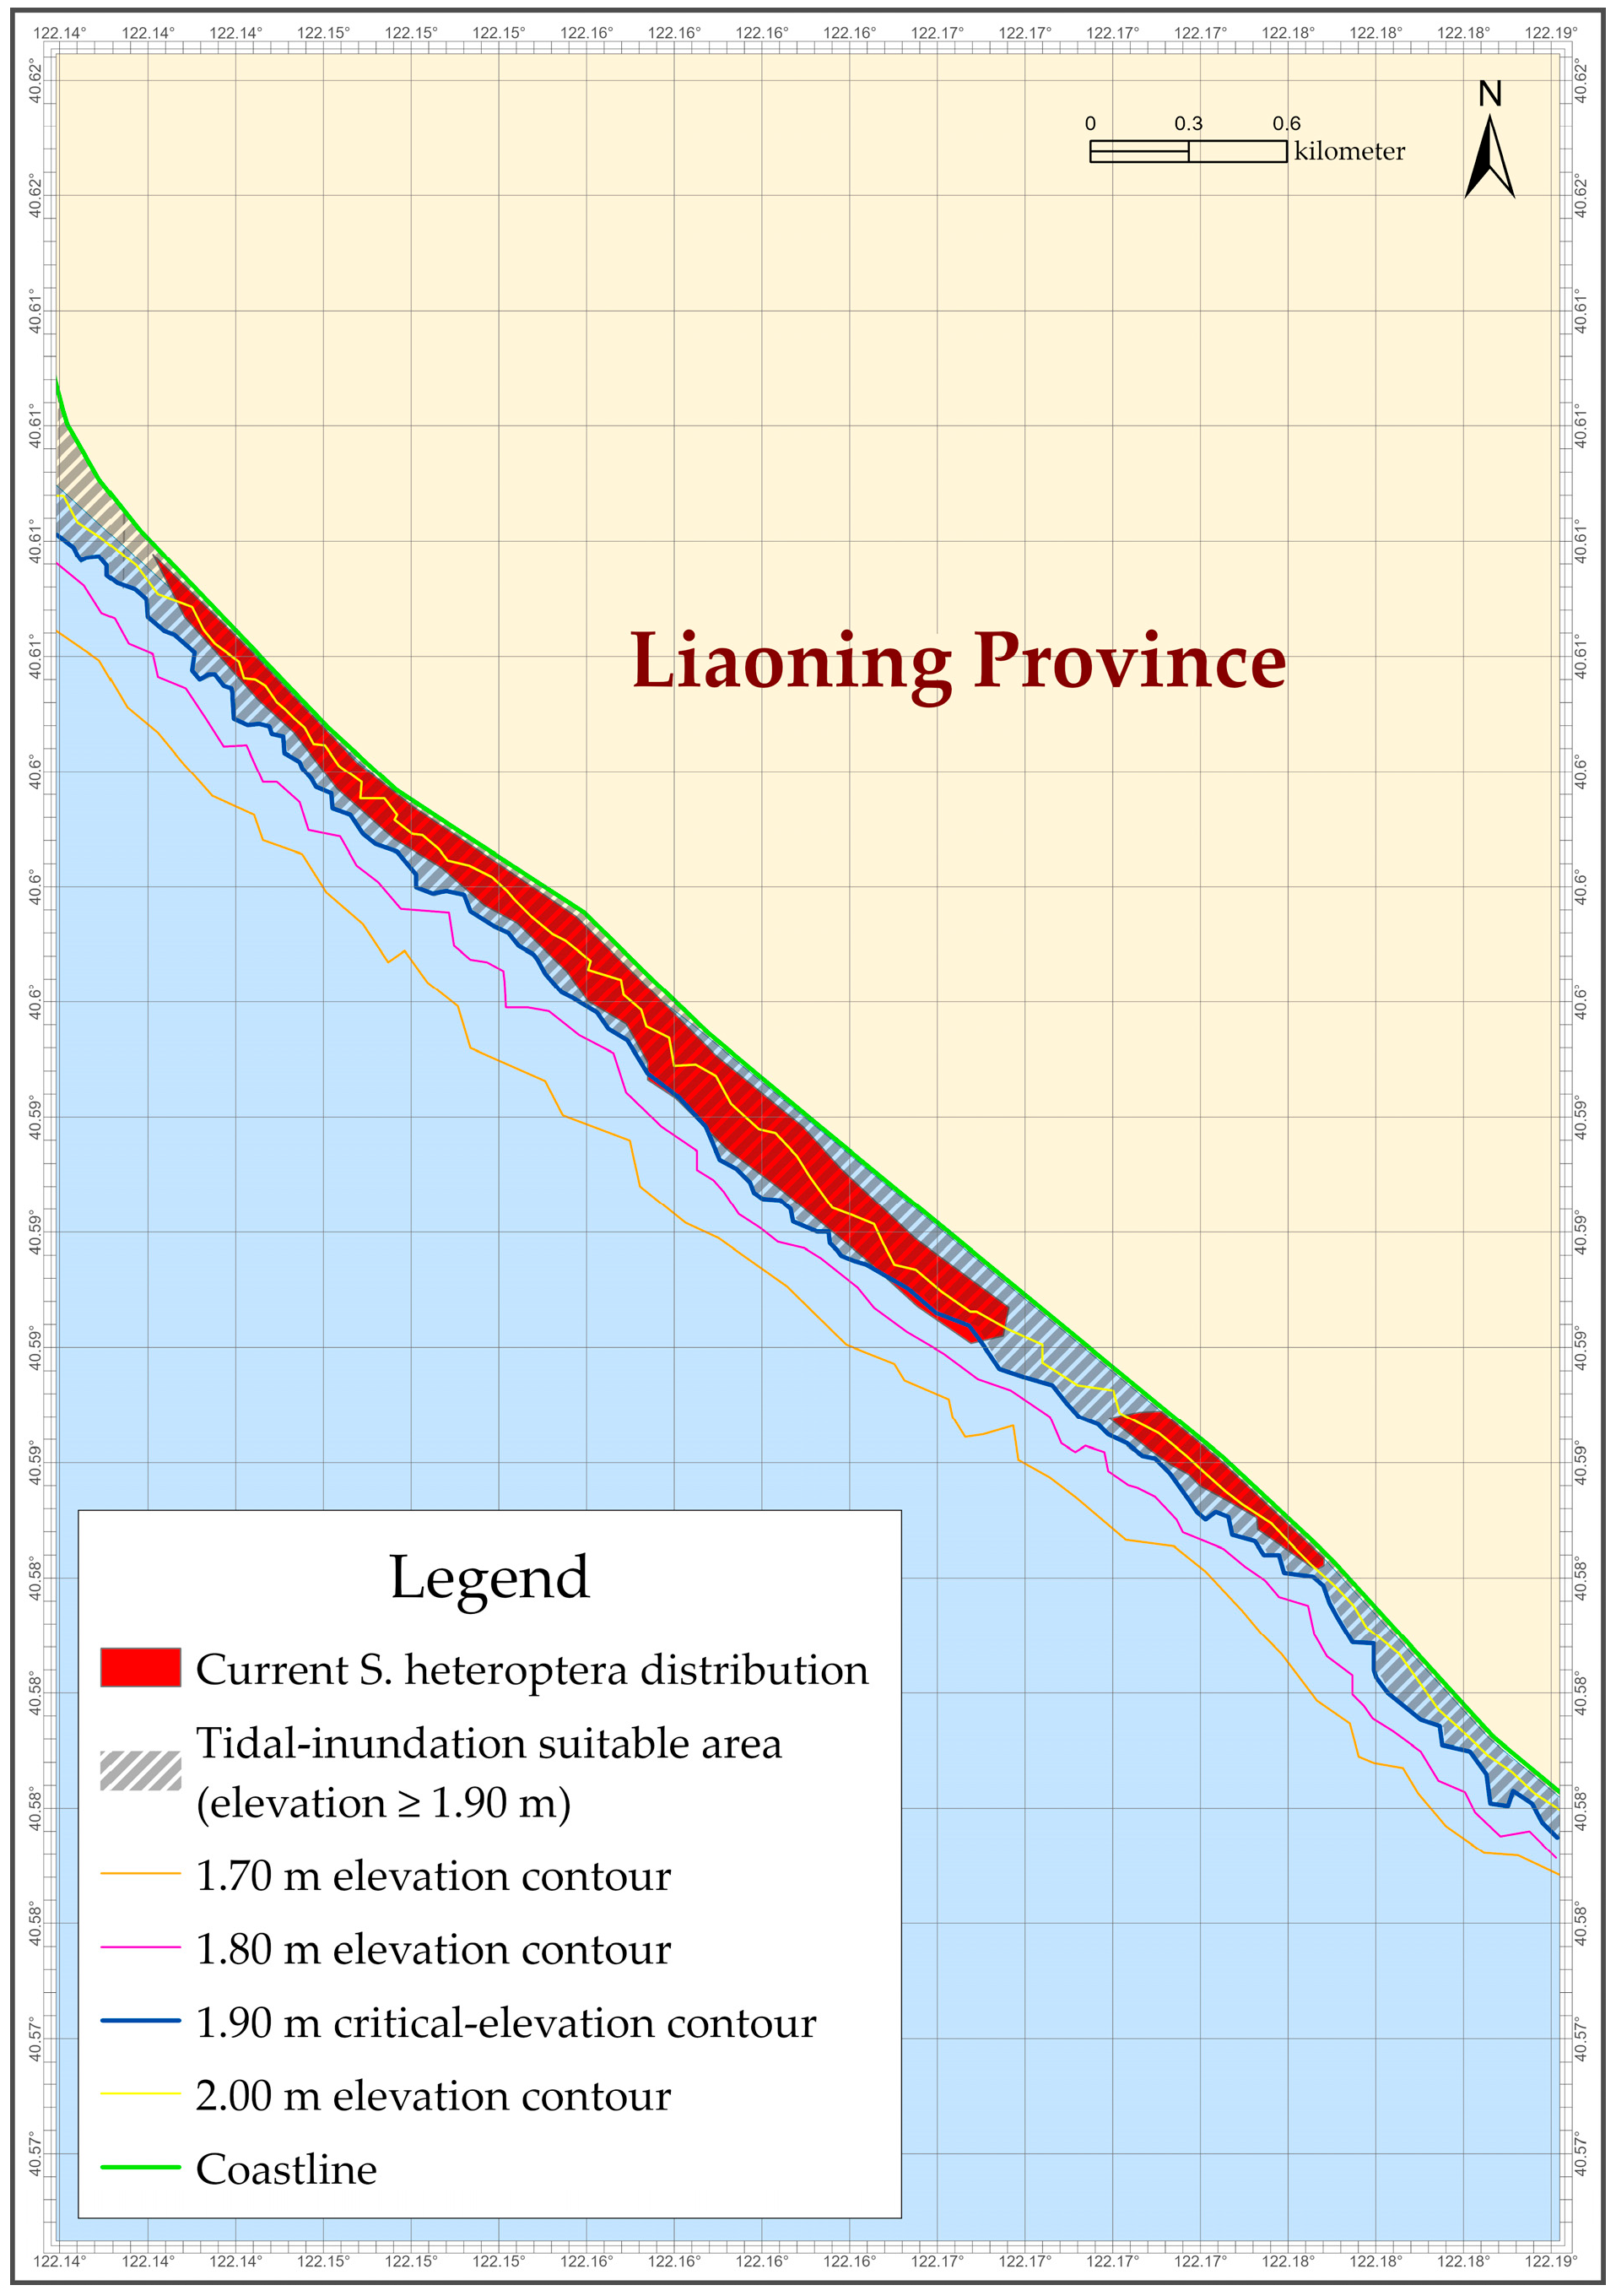
The critical-elevation analysis identified the 1.90 m contour as the seaward boundary of the tidal-inundation suitable area for S. heteroptera in the Yingkou case. Areas on the landward side of this contour, with elevations equal to or higher than 1.90 m, met the maximum inundation-duration criterion. Areas below 1.90 m were excluded from the tidal-inundation suitability layer. This result provided the hydrological constraint for the subsequent spatial overlay (Figure 4).
Figure 4.
Tidal-inundation suitability for Suaeda heteroptera in the Yingkou coastal salt marsh. The 1.90 m critical-elevation contour represents the species-specific upper inundation-duration limit of 3 h d−1. Areas on the landward side of this contour, with elevations equal to or higher than 1.90 m, were classified as tidal-inundation suitable. The 1.70, 1.80 and 2.00 m contours are shown to illustrate the local elevation gradient. Source: prepared by the authors using the tide–elevation data [36] and the elevation and current vegetation datasets listed in Table 4.
5.2.2. Sediment Type Suitability
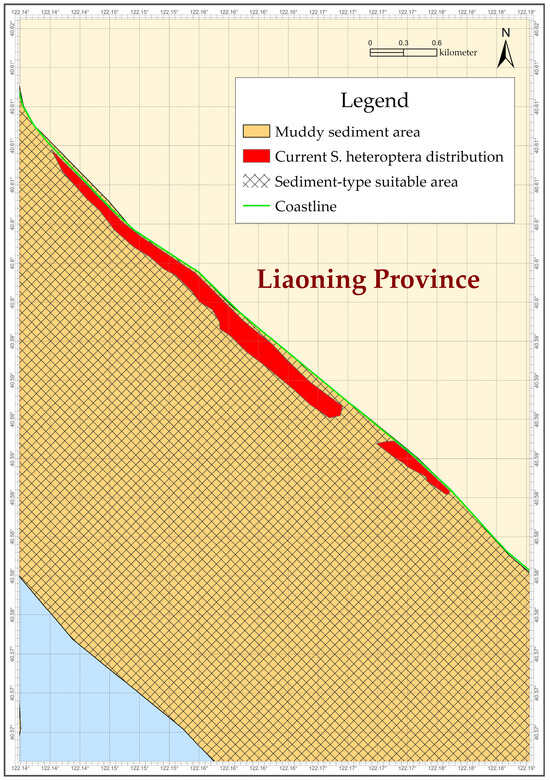
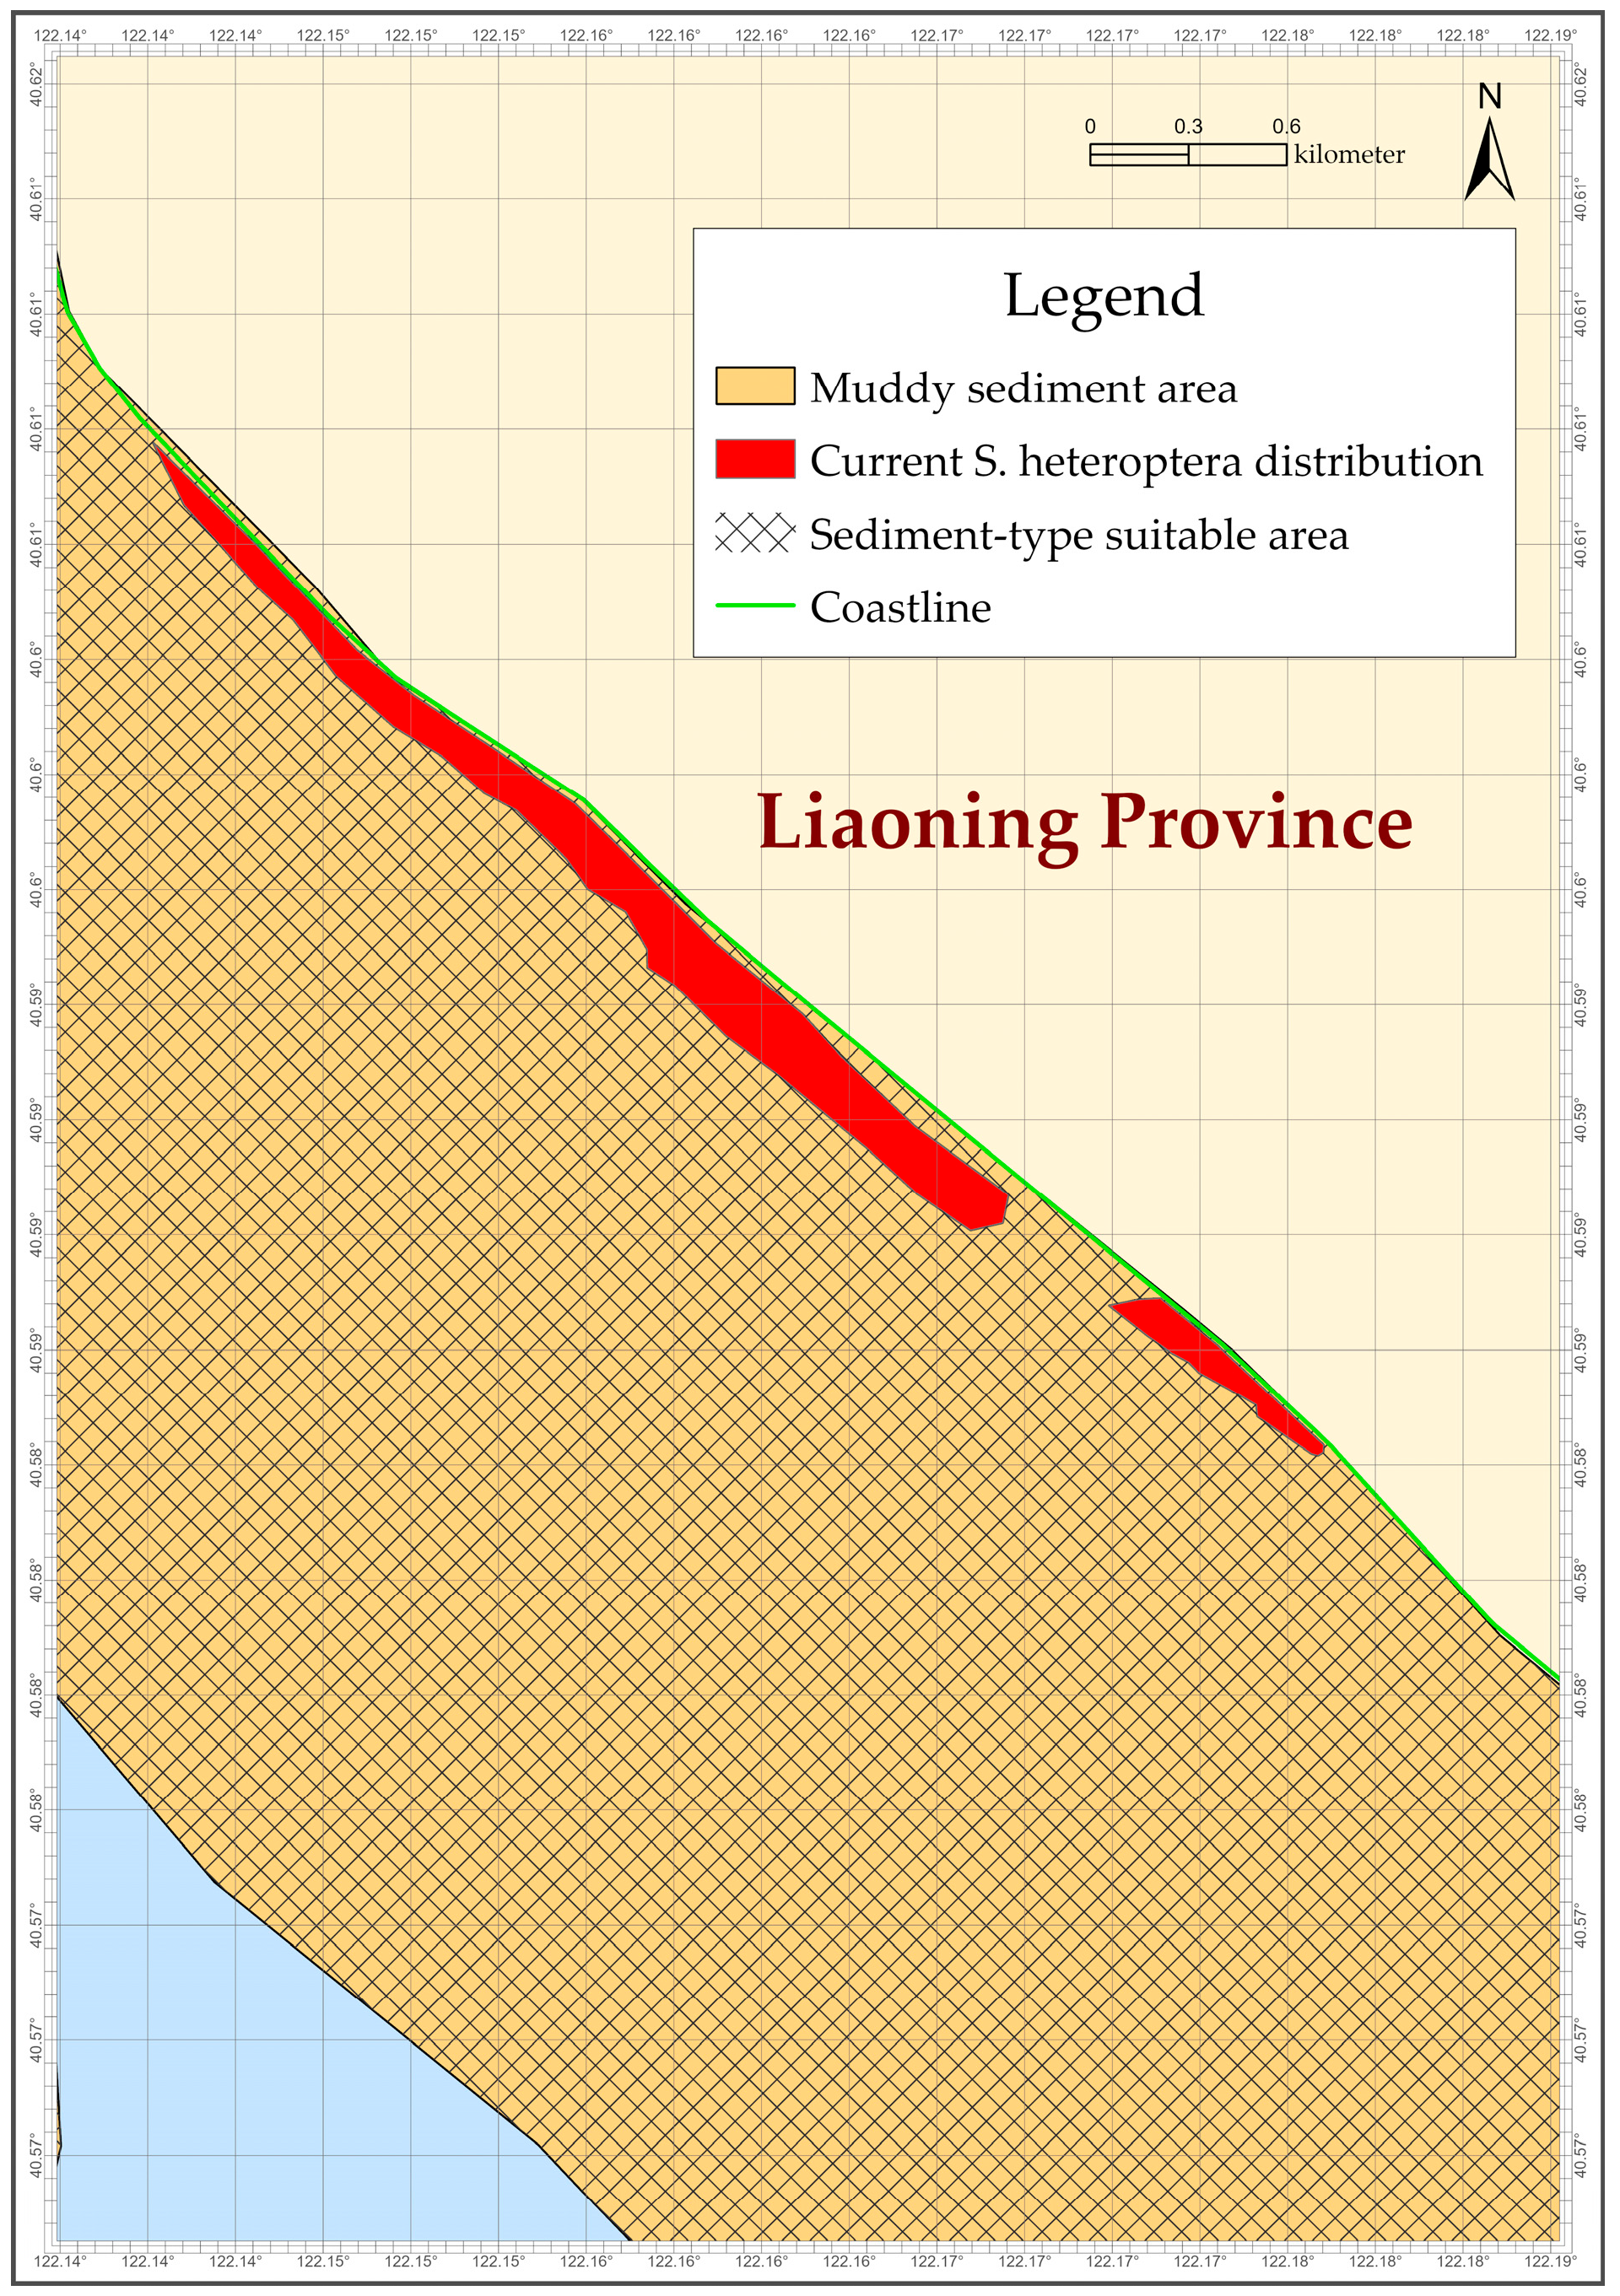
The sediment-type suitability layer covered the entire GIS assessment boundary. Within the 1162.4 ha assessment boundary, muddy sediment covered 1162.4 ha and accounted for 100.0% of the mapped sediment-type suitability layer. No sandy or unsuitable sediment types were identified within the assessment boundary. This sediment condition was consistent with the ecological requirement of S. heteroptera and P. australis, both of which can establish on muddy intertidal flats. Muddy sediment can support root anchorage and sediment stability. It also provides a substrate where organic matter can accumulate after vegetation establishment. Sediment type therefore imposed no spatial constraint on the Yingkou screening (Figure 5).
Figure 5.
Sediment-type suitability in the Yingkou coastal salt marsh. Muddy sediment covered the entire 1162.4 ha assessment boundary and met the sediment-type screening criterion throughout the assessed area. Sediment type therefore imposed no spatial constraint on the subsequent integrated screening. Source: prepared by the authors using the sediment-type and current vegetation datasets listed in Table 4.
5.2.3. Sediment Salinity Suitability
During the July 2024 survey, sediment salinity values in the eight monitored samples ranged from 0.96% to 1.08% (Table 6). All values were below the 2.00% sediment salinity upper limit for S. heteroptera. The monitored area therefore met the sediment salinity requirement for S. heteroptera. All values also exceeded the 0.90% sediment salinity screening threshold for P. australis, so this species was not retained under the sediment-salinity criterion.
Table 6.
Sediment salinity values in the Yingkou case study.
5.2.4. Seawater Salinity Suitability
During the September 2025 survey, seawater salinity at all four available monitoring stations in and around the assessment area ranged from 29.715‰ to 29.825‰. All four observations met the 30‰ seawater salinity screening threshold for S. heteroptera and exceeded the 12‰ threshold for P. australis. Under these survey-period conditions, the seawater-salinity criterion retained S. heteroptera and excluded P. australis. This classification represents the September 2025 observation period.
5.3. Integrated Restoration-Suitability Areas
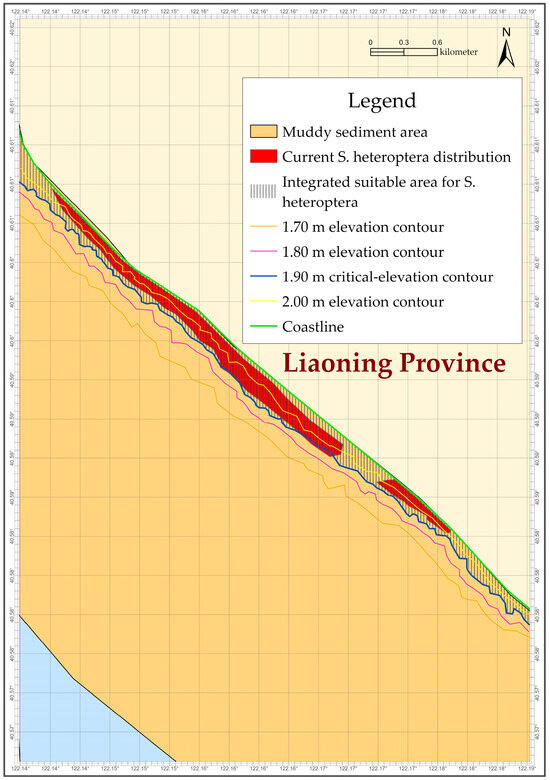
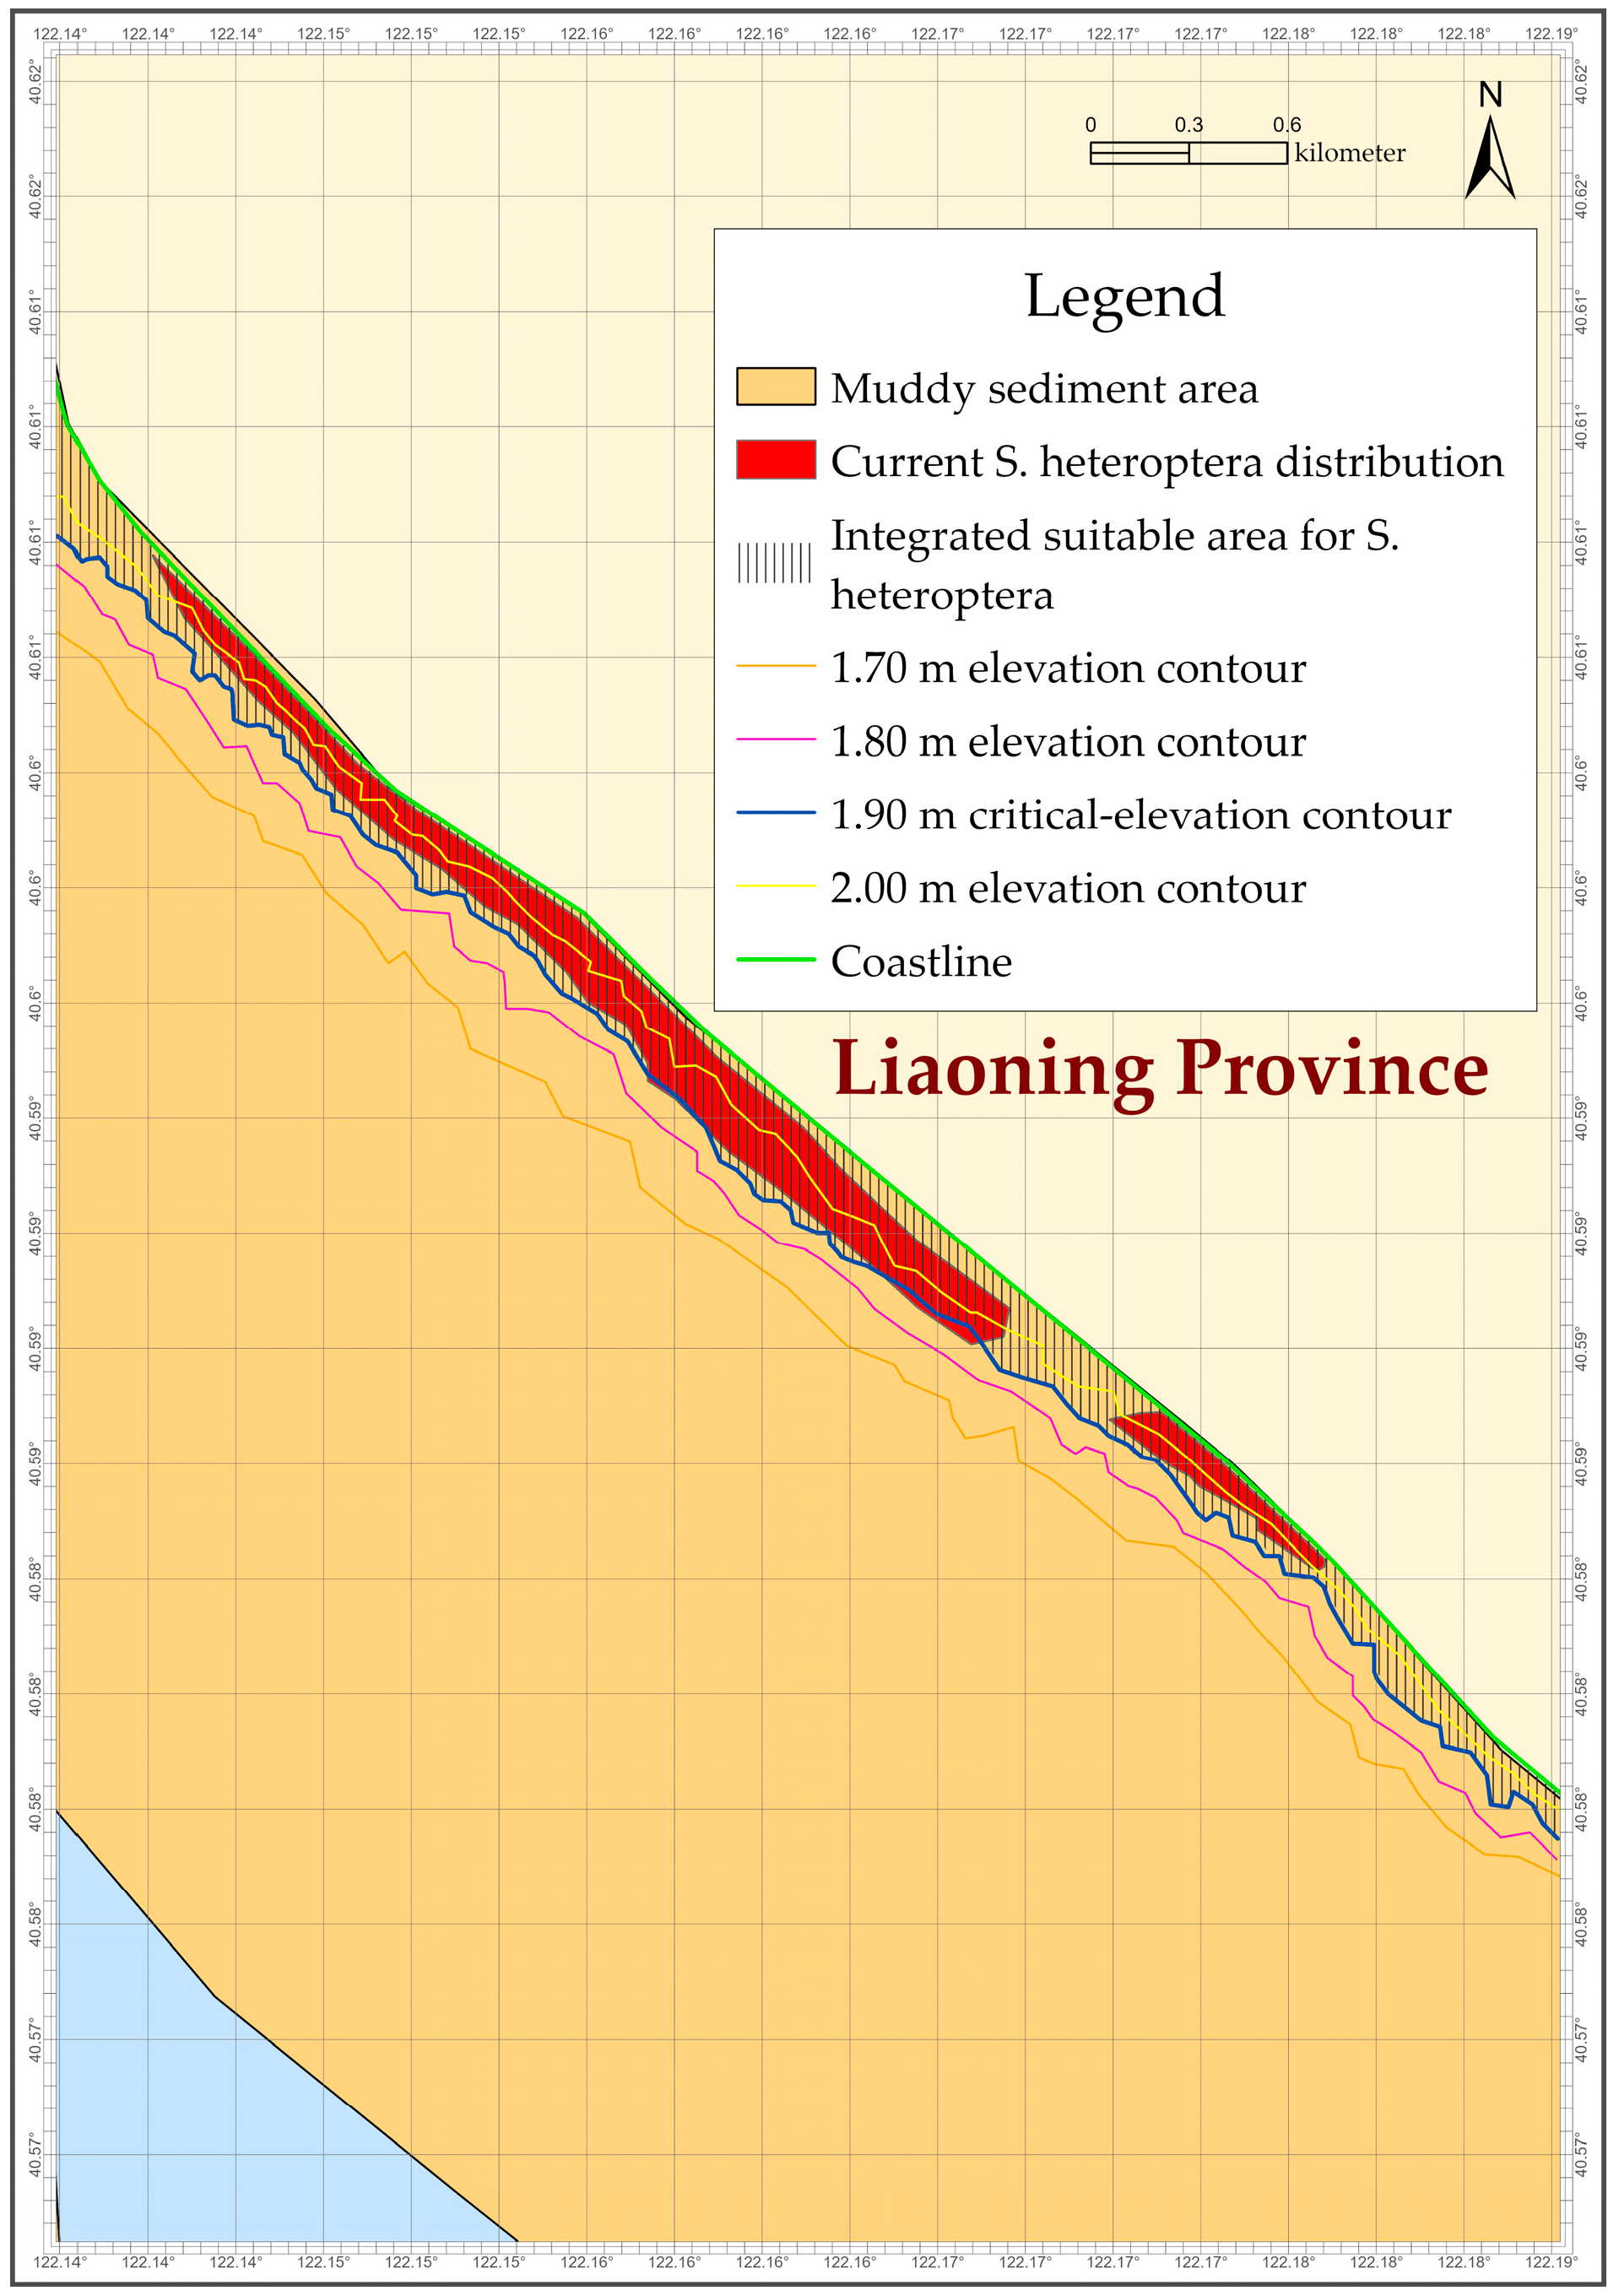
The single-factor screening results played different roles in the Yingkou assessment. The tidal-inundation component defined the main spatial boundary for S. heteroptera through the 1.90 m critical elevation (Figure 4). Sediment type imposed no spatial constraint because muddy sediment covered the entire 1162.4 ha assessment boundary (Figure 5). The July 2024 sediment-salinity and September 2025 seawater-salinity observations met the screening limits for S. heteroptera and exceeded those for P. australis. Salinity therefore affected species retention in the Yingkou candidate set. Combining the four environmental components retained 76.5 ha as the integrated restoration-suitability area for S. heteroptera (Figure 6).
Figure 6.
Integrated restoration-suitability area for Suaeda heteroptera in Yingkou. The integrated suitable area was generated by overlaying the tidal-inundation, sediment-type, sediment-salinity and seawater-salinity suitability layers. Phragmites australis was excluded from the two-species Yingkou candidate set by the sediment and seawater salinity criteria. The final suitable area was assigned to S. heteroptera. The sediment-salinity and seawater-salinity components reflect the July 2024 and September 2025 survey conditions, respectively. Source: prepared by the authors from the GIS overlay results generated in this study using the datasets listed in Table 4.
The 76.5 ha integrated suitable area was concentrated in muddy intertidal areas at or above the 1.90 m critical elevation. The sediment-salinity and seawater-salinity components reflect the July 2024 and September 2025 observations, respectively. The current S. heteroptera distribution covered 39.8 ha, of which 39.6 ha overlapped the integrated suitable area. A further 36.9 ha of suitable area occurred outside the mapped current distribution and was retained as candidate space for field verification and restoration planning. Only 0.2 ha of the mapped current distribution fell outside the suitable area (Figure 6; Table 7).
Table 7.
Integrated suitability results in the Yingkou case study.
5.4. Internal Spatial Consistency Assessment Against the Current Suaeda heteroptera Distribution
The integrated suitability map showed clear spatial consistency with the mapped current distribution of S. heteroptera within the assessment boundary. The suitable-area overlap ratio was 51.8%, indicating that 39.6 ha of the 76.5 ha mapped suitable area overlapped the current S. heteroptera distribution. The remaining 36.9 ha fell outside the mapped current distribution and represented candidate space for further field verification and restoration planning.
The current-distribution coverage was 99.5%, indicating that most of the mapped current S. heteroptera distribution fell within the identified suitable area. This result suggests that the threshold-based environmental filters were spatially consistent with the existing distribution pattern of the target species in the Yingkou case. Because the assessment boundary included the current S. heteroptera distribution and adjacent areas were included for suitability screening, this comparison represents an internal spatial consistency assessment. The two Yingkou candidate species met the same inundation threshold during the initial screening. Sediment and seawater salinity subsequently produced different screening outcomes, with S. heteroptera retained in the integrated suitability result.
5.5. Implementation Suitability Assessment
The 76.5 ha S. heteroptera suitable area had already passed the four environmental screening criteria and was subsequently assessed for implementation suitability. The suitable polygons overlapped with the ecological restoration arrangement in the Territorial Spatial Master Plan of Yingkou City for 2021–2035. Local historical information indicated that the assessed area was historically a natural distribution area of S. heteroptera. No sea-use, island-use or related use-right conflict was identified within the suitable polygons.
All three implementation conditions were therefore confirmed, and the identified S. heteroptera suitable area was assigned the “Suitable” implementation grade (Table 8). This grade indicates that no unresolved implementation constraint was identified from the planning, historical-distribution and use-right information used in the assessment.
Table 8.
Implementation suitability grading for the identified Suaeda heteroptera suitable area in Yingkou.
6. Discussion
6.1. Methodological Contribution to Spatial Pre-Assessment for Restoration-Based Carbon Sink Planning
The framework contributes to spatial pre-assessment by identifying where selected environmental requirements for salt marsh restoration are satisfied before carbon accounting begins. Blue carbon assessments require clearly defined wetland boundaries, activity data and management context [17]. Landscape-scale approaches also consider vegetation, geomorphic setting, sedimentary condition and management [14]. The present framework adds species-specific screening of inundation, salinity and sediment conditions. Its output is candidate restoration space that can be carried forward to field verification and project design.
Spatial screening narrows the area that requires more detailed investigation. In Yingkou, the integrated restoration-suitability area covered 76.5 ha, and 39.6 ha overlapped the mapped current S. heteroptera distribution. The current-distribution coverage reached 99.5%. This result provides evidence that the selected environmental filters are spatially consistent with most of the existing distribution within the assessment boundary. The 36.9 ha outside the mapped current distribution identifies candidate space for further field verification.
A distinctive step in the framework is the translation of plant inundation tolerance into a mappable critical-elevation boundary. Sediment type, sediment salinity and seawater salinity provide additional environmental filters. The resulting polygons support restoration-site planning. Restoration performance and carbon outcomes are evaluated through subsequent field monitoring and carbon assessment.
6.2. Environmental Controls on Restoration Suitability and Carbon-Relevant Processes
The Yingkou case illustrates how tidal inundation, sediment condition and salinity constrain restoration suitability and influence processes relevant to carbon accumulation. In this framework, the tide–elevation relationship was used to spatialize the species-specific inundation-duration threshold, while inundation itself represented the hydrological suitability constraint affecting vegetation survival, sediment redox condition, decomposition and carbon storage [11,12,13]. In this study, 1.90 m was identified as the critical elevation for S. heteroptera because it was the lowest evaluated elevation at which the mean daily inundation duration (2.99 h d−1) satisfied the species-specific threshold of 3 h d−1. Areas below this elevation were exposed to longer inundation and were less suitable for stable establishment.
Sediment type affects rooting, substrate stability and the potential for organic matter accumulation. Salt marsh carbon accumulation is shaped by mineral sediment deposition and organic matter production [12]. Muddy sediment can support root anchorage and sediment retention. It can also provide a suitable substrate for vegetation-driven carbon accumulation after restoration. This is important because salt marsh restoration success depends on both biological establishment and physical stability [5,18].
Salinity provided a clear species filter in the Yingkou case. Sediment salinity ranged from 0.96% to 1.08% during the July 2024 survey. Seawater salinity at the four monitoring stations ranged from 29.715‰ to 29.825‰ during the September 2025 survey. These observations met the operational screening limits for S. heteroptera and exceeded those for P. australis. The sediment- and seawater-salinity components therefore represent their respective survey periods rather than a contemporaneous salinity condition. Salinity and inundation can also influence soil organic matter decomposition during salt marsh restoration [13]. Species selection therefore affects vegetation establishment and the future pathway of carbon accumulation.
6.3. Linking Suitability Mapping with Blue Carbon Accounting
The framework produces a spatial screening output that can serve as an input to later blue carbon accounting. The 76.5 ha mapped suitable area describes candidate restoration space under the selected environmental and implementation criteria. Quantification of carbon benefits requires field measurements and project-specific accounting after restoration.
A subsequent carbon assessment can establish baseline vegetation carbon stocks, soil organic carbon density, sediment accretion and carbon burial, and CH4 and N2O fluxes within the mapped polygons [6,11,13,17]. The same variables can be monitored after restoration to quantify changes through time. Project duration, restoration success, baseline conditions and non-permanence risk can then be incorporated according to the carbon accounting method used.
Restoration effectiveness also requires direct ecological evaluation. Pilot or implemented restoration areas can be monitored for plant establishment, survival, vegetation cover, biomass and persistence. Sediment accretion can be measured together with carbon indicators. These observations can test whether mapped suitable areas support the target vegetation after restoration and can also provide evidence for local threshold calibration.
In Yingkou, the 76.5 ha result therefore serves as a spatial starting point for this next stage. The 36.9 ha outside the mapped current S. heteroptera distribution provides candidate space for field verification and restoration trials. Carbon sequestration can be quantified after restoration through the monitoring and accounting pathway described above.
6.4. Transferability to Other Tidal Wetland Systems
The workflow is consistent across applications. Candidate species, ecological thresholds and environmental layers are defined from regional evidence. The current five-species library provides starting entries for contrasting Chinese coastal settings [19,20,27,28,29,30,31]. Additional native species can be incorporated when suitable ecological evidence is available. Required case data include local water-level or inundation information, elevation, sediment and salinity conditions, and planning or use-right information where implementation grading is needed [17,18].
If disturbed or degraded intertidal wetlands are identified in the Yingkou coastal region, they could provide practical settings for further application where tidal exchange persists and locally native salt marsh species can be identified. The same workflow can also be evaluated in other Chinese estuarine and tidal-flat systems using regionally supported species and threshold data. Applications outside China follow the same principle and require locally native species and locally supported environmental thresholds [9,18].
The critical-elevation procedure requires adjustment to the local tidal regime. Regular semidiurnal and diurnal systems can use the time-point rules defined in Section 3.5.2. Mixed or irregular systems can derive critical elevation from continuous or high-frequency water-level series. For each candidate elevation, inundation duration is calculated directly from the water-level record, and the resulting inundation-duration–elevation relationship is used to identify the elevation corresponding to the species-specific inundation limit. Representative periods should capture important local tidal variability, including spring–neap changes where they occur. The Yingkou application demonstrates the use of the critical-elevation concept with a local tide–elevation relationship. Application of the continuous-series procedure can provide an independent test of transferability in mixed or irregular tidal systems.
Salinity layers also require a defined temporal basis. Future applications in areas with strong seasonal or interannual variability can use repeated monitoring or calibrated hydrodynamic salinity simulations, especially when observations lie close to an operational threshold. These data can be represented as spatially explicit salinity components when clear spatial gradients occur.
The implementation grading component can be retained across regions. Polygons that pass environmental screening can then be assessed against locally relevant planning, historical-distribution and use-right conditions. The specific administrative datasets vary among regions, but the separation between biophysical screening and implementation assessment remains applicable.
6.5. Scope, Limitations and Validation Pathway
The framework is designed for early-stage spatial screening. Its suitability classes indicate whether selected environmental thresholds are satisfied and whether key implementation conditions are confirmed. The resulting polygons represent candidate restoration space. Restoration success, vegetation persistence and realized carbon sequestration are evaluated in subsequent implementation, monitoring and carbon-accounting stages.
The species-specific thresholds are operational screening limits synthesized from published ecological evidence, experimental and field observations, expert consultation and relevant unpublished research findings incorporated into the draft technical guideline [26]. Regional variation in plant response, life stage and local hydrological–salinity conditions can shift the effective suitability boundary. Local germination, seedling establishment and transplant observations can improve threshold calibration. Binary thresholds also simplify ecological transitions around screening boundaries. Fuzzy membership functions can represent gradual transitions and partial suitability, and weighted suitability models can rank locations when environmental factors contribute with different strengths [35]. These extensions require defensible membership functions, indicator weights and sensitivity analysis.
Salinity is temporally dynamic in estuarine wetlands and can respond to freshwater discharge, tidal stage, precipitation and interannual hydrological conditions. In Yingkou, sediment salinity was measured at eight sites in July 2024, whereas seawater salinity was measured at four stations in September 2025. The two salinity components therefore represent separate survey periods rather than a contemporaneous salinity state. The July 2024 sediment-salinity range was 0.96–1.08%, and the September 2025 seawater-salinity range was 29.715–29.825‰. These observations support the screening classifications for their respective survey periods. Seasonal and interannual stability requires additional observations. Repeated seasonal and multi-year monitoring can improve temporal characterization in future applications. Hydrodynamic salinity modeling can also provide spatially and temporally resolved salinity fields where sufficient calibration data and boundary conditions are available.
Critical-elevation mapping depends on the quality of elevation data and the local tide–elevation relationship. Small errors near a screening boundary can affect the mapped suitable area. Mixed or irregular tidal regimes also require water-level records of sufficient temporal resolution and duration to characterize their inundation patterns. Sites with complex topography, strong erosion or accretion, or marked salinity gradients require finer spatial data and site-level verification. These requirements define the resolution at which the framework can support restoration design.
The comparison with the mapped current S. heteroptera distribution provides an internal spatial consistency assessment of the screening output. Evaluation of restoration effectiveness requires a separate post-implementation design. Field trials or restoration projects can track establishment, survival, vegetation cover, biomass, persistence and sediment accretion within mapped suitable polygons. Carbon assessment can include vegetation carbon stocks, soil organic carbon accumulation, carbon burial and greenhouse gas flux measurements [11,12,13,17]. These observations would provide direct evidence for realized restoration and carbon outcomes and support further threshold calibration.
Within this scope, the framework narrows broad candidate areas to locations requiring further field investigation, restoration design and carbon assessment.
7. Conclusions
This study developed a threshold-based spatial pre-assessment framework for identifying areas that meet selected environmental requirements for coastal salt marsh restoration. The framework combines a species-specific threshold library, critical-elevation mapping and GIS-based environmental screening. Its output defines candidate restoration space for restoration-based carbon sink planning.
Individual applications use candidate species selected from native salt marsh vegetation recorded in the surrounding coastal region. Regional pilot survey results in Yingkou identified S. heteroptera and P. australis as the regional candidate species, although only S. heteroptera was mapped within the GIS assessment boundary. The other three species in the general library provide threshold entries for applications in coastal regions where they are locally relevant.
In Yingkou, the 3 h d−1 inundation limit corresponded to a critical elevation of 1.90 m for S. heteroptera. July 2024 sediment-salinity and September 2025 seawater-salinity observations met the screening thresholds for S. heteroptera. P. australis was excluded under the case-specific salinity screen. The integrated restoration-suitability area covered 76.5 ha, and 99.5% of the mapped current S. heteroptera distribution fell within this area.
The 76.5 ha result provides candidate space for field verification and restoration planning. Restoration effectiveness can be evaluated through post-restoration monitoring of vegetation establishment and persistence. Realized carbon sequestration can then be quantified using carbon stocks, sediment carbon burial and greenhouse gas measurements. The separation between spatial pre-assessment and subsequent ecological and carbon evaluation provides a clear pathway from restoration-site screening to field validation and carbon accounting.
Future applications can evaluate the framework in additional coastal wetland settings in the Yingkou region and in other Chinese estuarine or tidal-flat systems using locally relevant native species and threshold data. Mixed or irregular tidal regimes can derive critical elevation from continuous water-level series by identifying the elevation associated with the species-specific daily inundation-duration limit. Applications across different disturbance settings, species assemblages and tidal regimes can provide further evidence of framework transferability.
Supplementary Materials
The following supporting information can be downloaded at: https://www.mdpi.com/article/10.3390/land15091652/s1, Table S1. Evidence supporting the species-specific operational thresholds in the general framework library.
Author Contributions
Conceptualization, Y.Z. and W.L.; methodology, Y.Z. and W.L.; software, Y.Z. and X.L.; validation, Y.Z., X.L. and X.H.; formal analysis, Y.Z.; investigation, Y.Z., L.D., C.L., X.L. and X.H.; resources, W.L.; data curation, Y.Z., L.D. and X.L.; writing—original draft preparation, Y.Z.; writing—review and editing, Y.Z., W.L., L.D., C.L., X.L. and X.H.; visualization, Y.Z. and X.L.; supervision, W.L.; project administration, W.L.; funding acquisition, W.L. All authors have read and agreed to the published version of the manuscript.
Funding
This research was funded by the National Key Research and Development Program of China, grant number 2023YFC3108004. The APC was funded by the same grant.
Data Availability Statement
The processed results supporting the findings of this study are presented in the article and Supplementary Materials. Precise sampling and monitoring coordinates, together with the planning and historical-distribution data used in the Yingkou application, are subject to access restrictions imposed by the relevant local government and natural-resource authorities in Yingkou and are therefore not publicly available. The spatial locations of the sampling sites and monitoring stations are shown in Figure 3b without releasing their precise coordinates. The elevation data, typical marine ecosystem distribution data, current vegetation distribution data and related underlying spatial datasets were accessed through the China Marine Ecological Early Warning and Monitoring Platform. Sea-use and island-use right data were obtained from the Sea Area and Island Dynamic Monitoring and Regulatory System of the Ministry of Natural Resources. Data from both systems are managed by the National Marine Data and Information Service, and the authors do not have permission to redistribute the underlying datasets. Researchers seeking access to these data may apply to the National Marine Data and Information Service in accordance with the applicable data-access procedures. Approved access requires a confidentiality agreement and documentation specifying the authorized scope of data use.
Conflicts of Interest
The authors declare no conflicts of interest. The funders had no role in the design of the study; in the collection, analyses, or interpretation of data; in the writing of the manuscript; or in the decision to publish the results.
Abbreviations
The following abbreviations are used in this manuscript:
| GIS | Geographic information system |
| GCS | Geographic coordinate system |
References
- Mitsch, W.J.; Bernal, B.; Nahlik, A.M.; Mander, Ü.; Zhang, L.; Anderson, C.J.; Jørgensen, S.E.; Brix, H. Wetlands, carbon, and climate change. Landsc. Ecol. 2013, 28, 583–597. [Google Scholar] [CrossRef] [Scilit]
- McLeod, E.; Chmura, G.L.; Bouillon, S.; Salm, R.; Björk, M.; Duarte, C.M.; Lovelock, C.E.; Schlesinger, W.H.; Silliman, B.R. A blueprint for blue carbon: Toward an improved understanding of the role of vegetated coastal habitats in sequestering CO2. Front. Ecol. Environ. 2011, 9, 552–560. [Google Scholar] [CrossRef] [Scilit]
- Chmura, G.L.; Anisfeld, S.C.; Cahoon, D.R.; Lynch, J.C. Global carbon sequestration in tidal, saline wetland soils. Glob. Biogeochem. Cycles 2003, 17, 1111. [Google Scholar] [CrossRef] [Scilit]
- Duarte, C.M.; Middelburg, J.J.; Caraco, N. Major role of marine vegetation on the oceanic carbon cycle. Biogeosciences 2005, 2, 1–8. [Google Scholar] [CrossRef] [Scilit]
- Temmerman, S.; Meire, P.; Bouma, T.J.; Herman, P.M.J.; Ysebaert, T.; De Vriend, H.J. Ecosystem-based coastal defence in the face of global change. Nature 2013, 504, 79–83. [Google Scholar] [CrossRef] [Scilit] [PubMed]
- Macreadie, P.I.; Costa, M.D.P.; Atwood, T.B.; Friess, D.A.; Kelleway, J.J.; Kennedy, H.; Lovelock, C.E.; Serrano, O.; Duarte, C.M. Blue carbon as a natural climate solution. Nat. Rev. Earth Environ. 2021, 2, 826–839. [Google Scholar] [CrossRef] [Scilit]
- Feng, C.; Ye, G.; Zeng, J.; Zeng, J.; Jiang, Q.; He, L.; Zhang, Y.; Xu, Z. Sustainably developing global blue carbon for climate change mitigation and economic benefits through international cooperation. Nat. Commun. 2023, 14, 6144. [Google Scholar] [CrossRef] [Scilit] [PubMed]
- Friess, D.A.; Shribman, Z.I.; Stankovic, M.; Iram, N.; Baustian, M.M.; Ewers Lewis, C.J. Restoring blue carbon ecosystems. Camb. Prisms Coast. Futures 2024, 2, e9. [Google Scholar] [CrossRef] [Scilit] [PubMed]
- Liu, Z.; Fagherazzi, S.; He, Q.; Gourgue, O.; Bai, J.; Liu, X.; Miao, C.; Hu, Z.; Cui, B. A global meta-analysis on the drivers of salt marsh planting success and implications for ecosystem services. Nat. Commun. 2024, 15, 3643. [Google Scholar] [CrossRef] [Scilit] [PubMed]
- Fu, C.; Li, Y.; Zeng, L.; Zhang, H.; Tu, C.; Zhou, Q.; Xiong, K.; Wu, J.; Duarte, C.M.; Christie, P.; et al. Stocks and losses of soil organic carbon from Chinese vegetated coastal habitats. Glob. Change Biol. 2021, 27, 202–214. [Google Scholar] [CrossRef] [Scilit] [PubMed]
- Negandhi, K.; Edwards, G.; Kelleway, J.J.; Howard, D.; Safari, D.; Saintilan, N. Blue carbon potential of coastal wetland restoration varies with inundation and rainfall. Sci. Rep. 2019, 9, 4368. [Google Scholar] [CrossRef] [Scilit] [PubMed]
- Kirwan, M.L.; Mudd, S.M. Response of salt-marsh carbon accumulation to climate change. Nature 2012, 489, 550–553. [Google Scholar] [CrossRef] [Scilit] [PubMed]
- Wang, F.; Kroeger, K.D.; Gonneea, M.E.; Pohlman, J.W.; Tang, J. Water salinity and inundation control soil carbon decomposition during salt marsh restoration: An incubation experiment. Ecol. Evol. 2019, 9, 1911–1921. [Google Scholar] [CrossRef] [Scilit] [PubMed]
- Rogers, K.; Macreadie, P.I.; Kelleway, J.J.; Saintilan, N. Blue carbon in coastal landscapes: A spatial framework for assessment of stocks and additionality. Sustain. Sci. 2019, 14, 453–467. [Google Scholar] [CrossRef] [Scilit]
- Nuyts, S.; Duarte de Paula Costa, M.; Macreadie, P.I.; Trevathan-Tackett, S.M. A decision support tool to help identify blue carbon sites for restoration. J. Environ. Manag. 2024, 367, 122006. [Google Scholar] [CrossRef] [Scilit] [PubMed]
- Ganju, N.K.; Ackerman, K.V.; Defne, Z. Using geospatial analysis to guide marsh restoration in Chesapeake Bay and beyond. Estuaries Coasts 2024, 47, 1–17. [Google Scholar] [CrossRef] [Scilit]
- Hiraishi, T.; Krug, T.; Tanabe, K.; Srivastava, N.; Baasansuren, J.; Fukuda, M.; Troxler, T.G. (Eds.) 2013 Supplement to the 2006 IPCC Guidelines for National Greenhouse Gas Inventories: Wetlands; IPCC: Geneva, Switzerland, 2014. [Google Scholar]
- Hudson, R.; Kenworthy, J.; Best, M. (Eds.) Saltmarsh Restoration Handbook: UK and Ireland; Environment Agency: Bristol, UK, 2021. [Google Scholar]
- Wang, Q.; Luo, M.; Qiu, D.D.; Xie, T.; Shi, W.; Cui, B.S. Effect of hydrological characteristics on the recruitment of Suaeda salsa in coastal salt marshes. J. Nat. Resour. 2019, 34, 2569–2579. [Google Scholar] [CrossRef] [Scilit]
- Zhang, M.L. Research advancement on degradation mechanism and ecological restoration technology of coastal salt-marsh: A review. J. Dalian Ocean Univ. 2022, 37, 539–549. [Google Scholar] [CrossRef]
- HY/T 0460.4-2024; Technical Directives for Investigation and Assessment of Coastal Ecosystem Status—Part 4: Salt Marshes. Ministry of Natural Resources of the People’s Republic of China: Beijing, China, 2024.
- GB/T 12763.2-2007; Specifications for Oceanographic Survey—Part 2: Marine Hydrographic Observation. Standards Press of China: Beijing, China, 2007.
- GB/T 12763.4-2007; Specifications for Oceanographic Survey—Part 4: Survey of Chemical Parameters in Sea Water. Standards Press of China: Beijing, China, 2007.
- GB/T 12763.8-2007; Specifications for Oceanographic Survey—Part 8: Marine Geology and Geophysics Survey. Standards Press of China: Beijing, China, 2007.
- GB/T 17501-2017; Specification for Marine Engineering Topographic Surveying. Standards Press of China: Beijing, China, 2017.
- Ministry of Natural Resources of the People’s Republic of China. Technical Guidelines for Identifying Suitable Areas for Carbon Sink Enhancement in Typical Blue Carbon Ecosystems; Draft for Approval; Ministry of Natural Resources of the People’s Republic of China: Beijing, China, 2025; unpublished technical guideline. [Google Scholar]
- Cui, M.Z. Biosynthesis of Betacyanins in Suaeda salsa under the Combined Stress of Low Nitrogen, Low Phosphorus and High Salt and Its Effect on Plant Salt Tolerance. Master’s Thesis, Lanzhou University, Lanzhou, China, 2020. (In Chinese) [Google Scholar]
- Dong, G.C.; Li, X.Q.; Ke, H.; Liu, F.; Gao, Y.F.; Liu, C. Evaluation of habitat suitability and ecological capacity of Phragmites australis in tidal wetland of Zhimai River Estuary. Chin. Agric. Sci. Bull. 2014, 30, 174–181. [Google Scholar] [CrossRef]
- Li, W.; Guo, L.L.; Chen, H.; Yuan, L.; Zhao, Z.Y. Responses of typical salt marsh plants in the Yangtze Estuary to continuous flooding stress. Ludong Univ. J. Nat. Sci. Ed. 2019, 35, 23–29. [Google Scholar]
- Chen, Y.S. Research on the Adaptability of Cyperus malaccensis and its Variety C. malaccensis var. brevifolius to Salt and Flooding Stress. Master’s Thesis, Guangxi University, Nanning, China, 2011. (In Chinese) [Google Scholar]
- He, Q.; An, Y.; Cui, B.S. Coastal salt marshes and distribution and diversity of salt marsh plant communities. Ecol. Environ. Sci. 2010, 19, 657–664. Available online: https://www.jeesci.com/CN/10.16258/j.cnki.1674-5906(2010)03-0657-08 (accessed on 3 September 2026). [CrossRef] [Scilit]
- Yang, C.Y.; Wang, L.; Su, F.L.; Li, H.F. Characteristics of soil salinity in the distribution area of Suaeda heteroptera in Liaohe estuary wetlands. Sci. Soil Water Conserv. 2019, 17, 117–123. [Google Scholar] [CrossRef]
- Hou, W.; Zhang, R.; Xi, Y.; Liang, S.; Sun, Z. The role of waterlogging stress on the distribution of salt marsh plants in the Liao River estuary wetland. Glob. Ecol. Conserv. 2020, 23, e01100. [Google Scholar] [CrossRef] [Scilit]
- Hu, Q.Y.; Zhao, Z.M.; Lan, Y.Y.; Zhang, X.; Xu, C.L.; Zhang, Y.J. Effects of salinity and duration of submergence on seed germination and seedling growth of Scirpus mariqueter. J. Shanghai Ocean Univ. 2020, 29, 55–63. [Google Scholar] [CrossRef]
- Malczewski, J. GIS-based land-use suitability analysis: A critical overview. Prog. Plan. 2004, 62, 3–65. [Google Scholar] [CrossRef] [Scilit]
- Liaoning Institute of Geology and Mineral Resources. Numerical Experiment Report on Tidal Current and Water Exchange for the Marine Ecological Protection and Restoration Project in Yingkou City, Liaoning Province; Liaoning Institute of Geology and Mineral Resources: Shenyang, China, 2022; unpublished project report. [Google Scholar]

Disclaimer/Publisher’s Note: The statements, opinions and data contained in all publications are solely those of the individual author(s) and contributor(s) and not of MDPI and/or the editor(s). MDPI and/or the editor(s) disclaim responsibility for any injury to people or property resulting from any ideas, methods, instructions or products referred to in the content. |
© 2026 by the authors. Licensee MDPI, Basel, Switzerland. This article is an open access article distributed under the terms and conditions of the Creative Commons Attribution (CC BY) license.