Article

Identifying the Spatiotemporal Characteristics and Driving Factors of Industrial Land Allocation Spatial Morphology: A Case Study of the Yangtze River Delta, China


1
School of Public Administration and Law, Anhui JianZhu University, Hefei 230601, China
2
School of Social and Population Studies, Nanjing University of Posts and Telecommunications, Nanjing 210023, China
*
Author to whom correspondence should be addressed.
Land 2026, 15(8), 1469; https://doi.org/10.3390/land15081469
Submission received: 9 July 2026 / Revised: 2 August 2026 / Accepted: 9 August 2026 / Published: 14 August 2026

Abstract

Industrial land allocation spatial morphology (ILASM) is crucial for economic development and the advancement of new-type industrialization. However, existing studies lack a comprehensive understanding of the evolutionary characteristics of the spatial morphology of industrial land allocation, let alone its driving factors and the spatial heterogeneity of their effects. Therefore, this paper classifies industrial land allocation spatial morphology into traditional industrial land allocation spatial morphology (TILASM) and high-tech industrial land allocation spatial morphology (HILASM), then evaluates and identifies their characteristics based on the precise geographic coordinates of each industrial land parcel between 2007 and 2024 in the Yangtze River Delta (YRD). Subsequently, the Random Forest Regression model and Multi-Scale Geographically Weighted Regression model are integrated to systematically investigate the driving factors and spatiotemporal patterns of ILASM, including both TILASM and HILASM. The results show that from 2007 to 2024, different types of ILASM exhibited distinct spatiotemporal evolutionary characteristics. Specifically, first, in terms of the evolution of spatial distribution direction, overall industrial land allocation exhibited a pronounced agglomeration pattern, extending from the western (slightly northern) part of the region to the eastern (slightly southern) part. Moreover, the evolutionary direction of traditional industrial land allocation was consistent with that of overall industrial land allocation. However, high-tech industrial land allocation exhibited an agglomeration trend extending from west (slightly south) to east (slightly north). Second, in terms of evolution of agglomeration pattern, the spatial distribution of TILASM evolved from three-core dispersed configuration to a multi-core linkage, before reverting to a multi-core dispersed state; by contrast, both ILASM and HILASM exhibited a spatial pattern that progressed from dispersion to contiguous agglomeration. Third, the spatial distribution characteristics of different types of ILASM were shaped by the combined influence of natural conditions, economic development, social environment, innovation environment and infrastructure. However, the dominant driving factors differed among them. Specifically, the number of foreign-invested enterprises exhibited a negative influence on ILASM, while having positive effects on both TILASM and HILASM. The effects of patent applications, population density and internet penetration rate on ILASM; foreign-invested level and slope proportion on TILASM; as well as road density, labor quality and foreign invested level on HILASM all exhibited U-shaped relationships. Moreover, the influences of opening-up level and per capital road area on ILASM and HILASM displayed relatively complex N-shaped relationships. Finally, the effects of these crucial drivers displayed significant spatial non-stationarity and certain gradient effects, manifesting in southern–northern, western–eastern and core–periphery spatial differentiation patterns. Overall, this study provides scientific evidence and practical references for optimizing the spatial allocation of industrial land.

1. Introduction

Land is not only a scarce resource but also the spatial carrier of socioeconomic activities. Land allocation is an important instrument used by local governments to facilitate urban management and promote economic development [1]. From 2007 to 2024, the gross area of construction land in China grew from 327,201 km2 to 827,976 km2, representing a growth rate of 153.05% (China Statistics Yearbook). Industrial land allocation plays an essential role in urban sprawl [2,3], accounting for more than 20% of the total urban sprawl. China, known as the “world factory”, has experienced a rapid growth in industrial land allocation. From 2007 to 2024, the area of industrial land allocation increased by 46.2%, substantially exceeding the growth of commercial and residential land.
Industrial land allocation spatial morphology (ILASM) refers to the spatial configuration of industrial land, encompassing its distribution patterns, geometric morphological characteristics, and the rules of parcel aggregation and differentiation within a regional context. It comprehensively reflects the spatial layout state of industrial land, shaped by the combined influence of regional natural conditions, economic development trajectories, social environment and spatial planning constraints, which serves as a critical determinant of the quality of urban economic development and the urban ecological environment [4,5,6]. Driven by both financial incentives and officials’ career advancement considerations, local governments play a leading role in shaping the spatial morphology of urban industrial land [7,8,9]. As monopolists in the primary land market, local governments typically supply industrial land at low prices or even free of charge, often on a large scale, to attract industrial enterprises, thereby securing a stable tax base and fostering economic development [9,10,11]. However, this industrial land allocation system, which prioritizes the maximization of local governmental interests, has resulted in inefficient land use, intensified low-level homogeneous competition among industrial parks, aggravated environmental pollution, and insufficient momentum for industrial transformation and innovation [12,13,14,15].
As China enters the stage of high-quality development, the optimization of its territorial spatial pattern has gradually shifted from controlling land-use scale to optimizing spatial configuration [9]. As a fundamental element of industrial production, the spatial configuration of industrial land not only forms the cornerstone of industrial economic development but also provides critical support for promoting new industrialization and achieving high-quality industrial development [16]. However, existing research has primarily focused on the scale, price and allocation modes of industrial land, while paying relatively little attention to its spatial morphology and even less attention on its driving mechanisms. Therefore, there is an urgent need to clarify the evolutionary characteristics of industrial land allocation morphology and identify the factors driving its changes. This is great significance for enhancing the capacity of land as a factor of production, improving the efficiency of land resource utilization, and promoting the high-quality development of the industrial economy.
Over the past 40 years, industrial land allocation has played a crucial role in stabilizing local fiscal revenue, enhancing the political performance of local officials, creating employment opportunities, and driving urbanization and industrialization [17,18,19,20]. Therefore, it has become an indispensable tool for promoting economic growth in China. Similar to the experiences of the USA, Singapore and Japan, where industrial land allocation has facilitated industrial restructuring and high-quality economic development, optimizing industrial land allocation has become a strategic priority under China’s new industrialization strategy [21,22,23]. Numerous studies have examined the characteristics and drivers of industrial land allocation from various perspectives, including fiscal incentives, investment attraction, market mechanisms, and government regulation [24,25,26,27]. Some scholars have argued that industrial land allocation is the key to understanding China’s development. Specifically, the price, scale, strategies, and marketization degree of industrial land allocation have significant impacts on industrial agglomeration, restructuring, carbon intensity, environmental pollution, urban green development, and urban innovation [12,18,28,29,30,31]. However, to the best of our knowledge, two major gaps remain. First, existing studies have largely focused on the evolutionary characteristics of urban spatial morphology and its driving mechanisms, while industrial land, despite being a key component of the urban landscape, has received relatively limited scholarly attention. Second, previous studies have primarily examined industrial land allocation from an economic perspective by focusing on its price, scale and structural characteristics, whereas few studies have systematically examined the spatial distribution, evolutionary patterns and driving mechanisms of industrial land allocation from a spatial morphology perspective.
This study aims at systematically analyzing the spatiotemporal evolutionary patterns and driving mechanisms of industrial land allocation spatial morphology (ILASM), including traditional industry land allocation (TILASM), and high-tech industry land allocation (HILASM) in the Yangtze River Delta (YRD), by using high-resolution remote sensing data, micro plots data on industrial land transfers and integrating the Random Forest (RF) model with the Multi-Scale Geographically Weighted Regression (MGWR) model. The findings aim to provide empirical insights for optimizing territorial spatial planning and fostering high-quality industrial development.
The remainder of this paper is organized as follows. Section 2 provides a literature review. Section 3 presents the conceptual research framework. Section 4 introduces the research methodology and data. Section 5 reports the research results. Finally, Section 6 and Section 7 present the discussion and conclusions, respectively.

2. Literature Review

Industrial land is not only a key production factor but also a vital resource base underpinning the development of global manufacturing [6]. The ILASM determines the scale, layout, structure and efficiency of various industries, making it a key determinant of resource utilization efficiency, collaborative innovation among enterprises, and the sustainable development of regional industries [32]. However, in both developing and developed countries, the spatial patterns of industrial land allocation and use have undergone continuous transformation. Consequently, optimizing the spatial allocation of industrial land has become a hot topic in global research. Due to differences in economic development, institutional frameworks and stages of industrial development, some developed countries have shifted from outward spatial expansion toward inward-oriented development. For example, the United States and many European countries have successively introduced Green New Deal-related policies to redevelop and reallocate idle and contaminated industrial sites, thereby creating green industrial complexes [33]. By contrast, most Southeast Asian countries remain in the extensive development phase. For example, in South Korea, the sprawling allocation of industrial land has resulted in declining land-use efficiency and land productivity [34]; similarly, in India, the uncontrolled expansion of industrial land has increased surface temperatures, thereby exacerbating the urban heat island effect [35]. Overall, developed countries primarily promote the redevelopment and reuse of existing industrial land through institutional optimization, with a focus on sustainable development. In contrast, many developing countries continue to experience declining land productivity and environmental degradation due to the disorderly expansion of industrial land allocation.
In China, since the 1994 tax-sharing reform, 75% of corporate income tax revenue has been allocated to the central government, resulting in a significant decline in local government revenue. To alleviate fiscal pressure, most revenues generated from land transfers have been retained by local governments [36,37,38,39]. At the same time, China’s centralized political system has intensified competition among local governments, where economic growth serves as one of the central indicators for evaluating local officials’ performance [40]. Consequently, the scale and structure of industrial land allocation are closely linked to local economic development, making industrial land allocation an important policy instrument with both economic and political functions [19]. The local governments have frequently adopted strategies of supplying large areas of industrial land at low prices to attract investment. This practice has often led to the influx of low-value-added enterprises, fragmented spatial distribution of industrial land, land idleness, inefficient land use and environmental degradation [40,41,42]. As China enters the phase of high-quality development, the shortage of newly available industrial land and the inefficient utilization of existing industrial land have become increasingly apparent. In response, some cities have implemented innovative policies for industrial land allocation, such as designating new types of industrial land allocation [43], mixed-use land [44], and standardized industrial land [45], to alleviate land supply–demand conflicts and improve industrial land-use efficiency.
From a morphological perspective, urban spatial morphology is typically characterized by two dimensions: concentration-dispersion and monocentric–polycentric structures [4]. Existing studies have employed landscape indices, kernel density estimation, entropy measures, the Helsinki Index, the Gini coefficient, land-use transition matrices, and ArcGIS 10.8-based visualization techniques to evaluate whether industrial land allocation has become more concentrated or dispersed over time [6,46,47,48,49]. For example, Yan et al. (2026) measured manufacturing agglomeration by the location entropy method based on the number of manufacturing enterprises [50]. In addition, scholars have examined spatial allocation of industrial land from multiple perspectives, including allocation scale, spatial patterns, land prices, land-use efficiency, and innovative policies [29,38,43,51,52]. However, most existing studies rely primarily on socioeconomic statistical data to indirectly estimate the degree of industrial land agglomeration and dispersion. Relatively few studies have utilized plot-level geographic coordinates and the actual spatial locations of industrial land parcels, making it difficult to accurately characterize the real spatial morphology of industrial land allocation.
Prior studies have argued that fiscal incentives, political promotion, public infrastructure, environmental regulation, and decentralization significantly influence industrial land allocation. In addition, China’s unique land management system and industrial policies directly shape the spatial layout and structural characteristics of industrial land allocation [25]. The industrial development level, government price control and intervention, and socioeconomic development level also exert significant influences on industrial land-use patterns [27,46]. However, existing studies have paid relatively little attention to the spatial morphological characteristics of industrial land allocation and their underlying driving mechanisms. For example, Yang et al. (2017) investigated the evolutionary trajectory of the spatial layout and scale expansion of industrial land in Xuzhou since China’s reform and opening up [53]. Xu et al. (2025) integrated multi-source data to identify the internal and external attributes of industrial land in the cities of southern Jiangsu, revealing the nonlinear evolution of industrial land [54]. Shi et al. (2025) explored the spatiotemporal patterns and driving forces of the scale, quantity and types of rural industrial land allocation in China [52].
Overall, the existing literature has made important contributions to the study of industrial land allocation; however, several research gaps remain. First, with regard to research focus, previous studies have mostly examined the spatiotemporal characteristics of industrial land allocation in terms of its scale, structure, price and allocation mode, while neglecting the evolutionary characteristics and spatial morphology of industrial land allocation. To address this gap, the present study employs the plot-level geographic coordinates of industrial land transactions together with the standard deviation ellipse (SDE) and kernel density estimation (KDE) methods to accurately characterize the spatial pattern and morphological evolution of industrial land allocation. Second, in terms of research content, although several studies have examined the spatial pattern of industrial land, most have focused on the utilization stage, with limited research on the allocation stage. In fact, the spatial allocation of industrial land fundamentally determines the subsequent direction, intensity and efficiency of industrial land use. Third, in terms of research methods, most existing studies have relied on traditional econometric models or geographically weighted regression models to analyze the effects of driving factors. However, when dealing with complex issues or high-dimensional datasets, the fitting accuracy of traditional regression models decreases significantly, and they fail to capture the embedded variable relationships. Therefore, this study integrates interpretable machine learning with the MGWR model to identify the key driving factors of industrial land allocation spatial morphology and further reveal their spatial heterogeneity with greater accuracy and interpretability.

3. Theoretical Framework

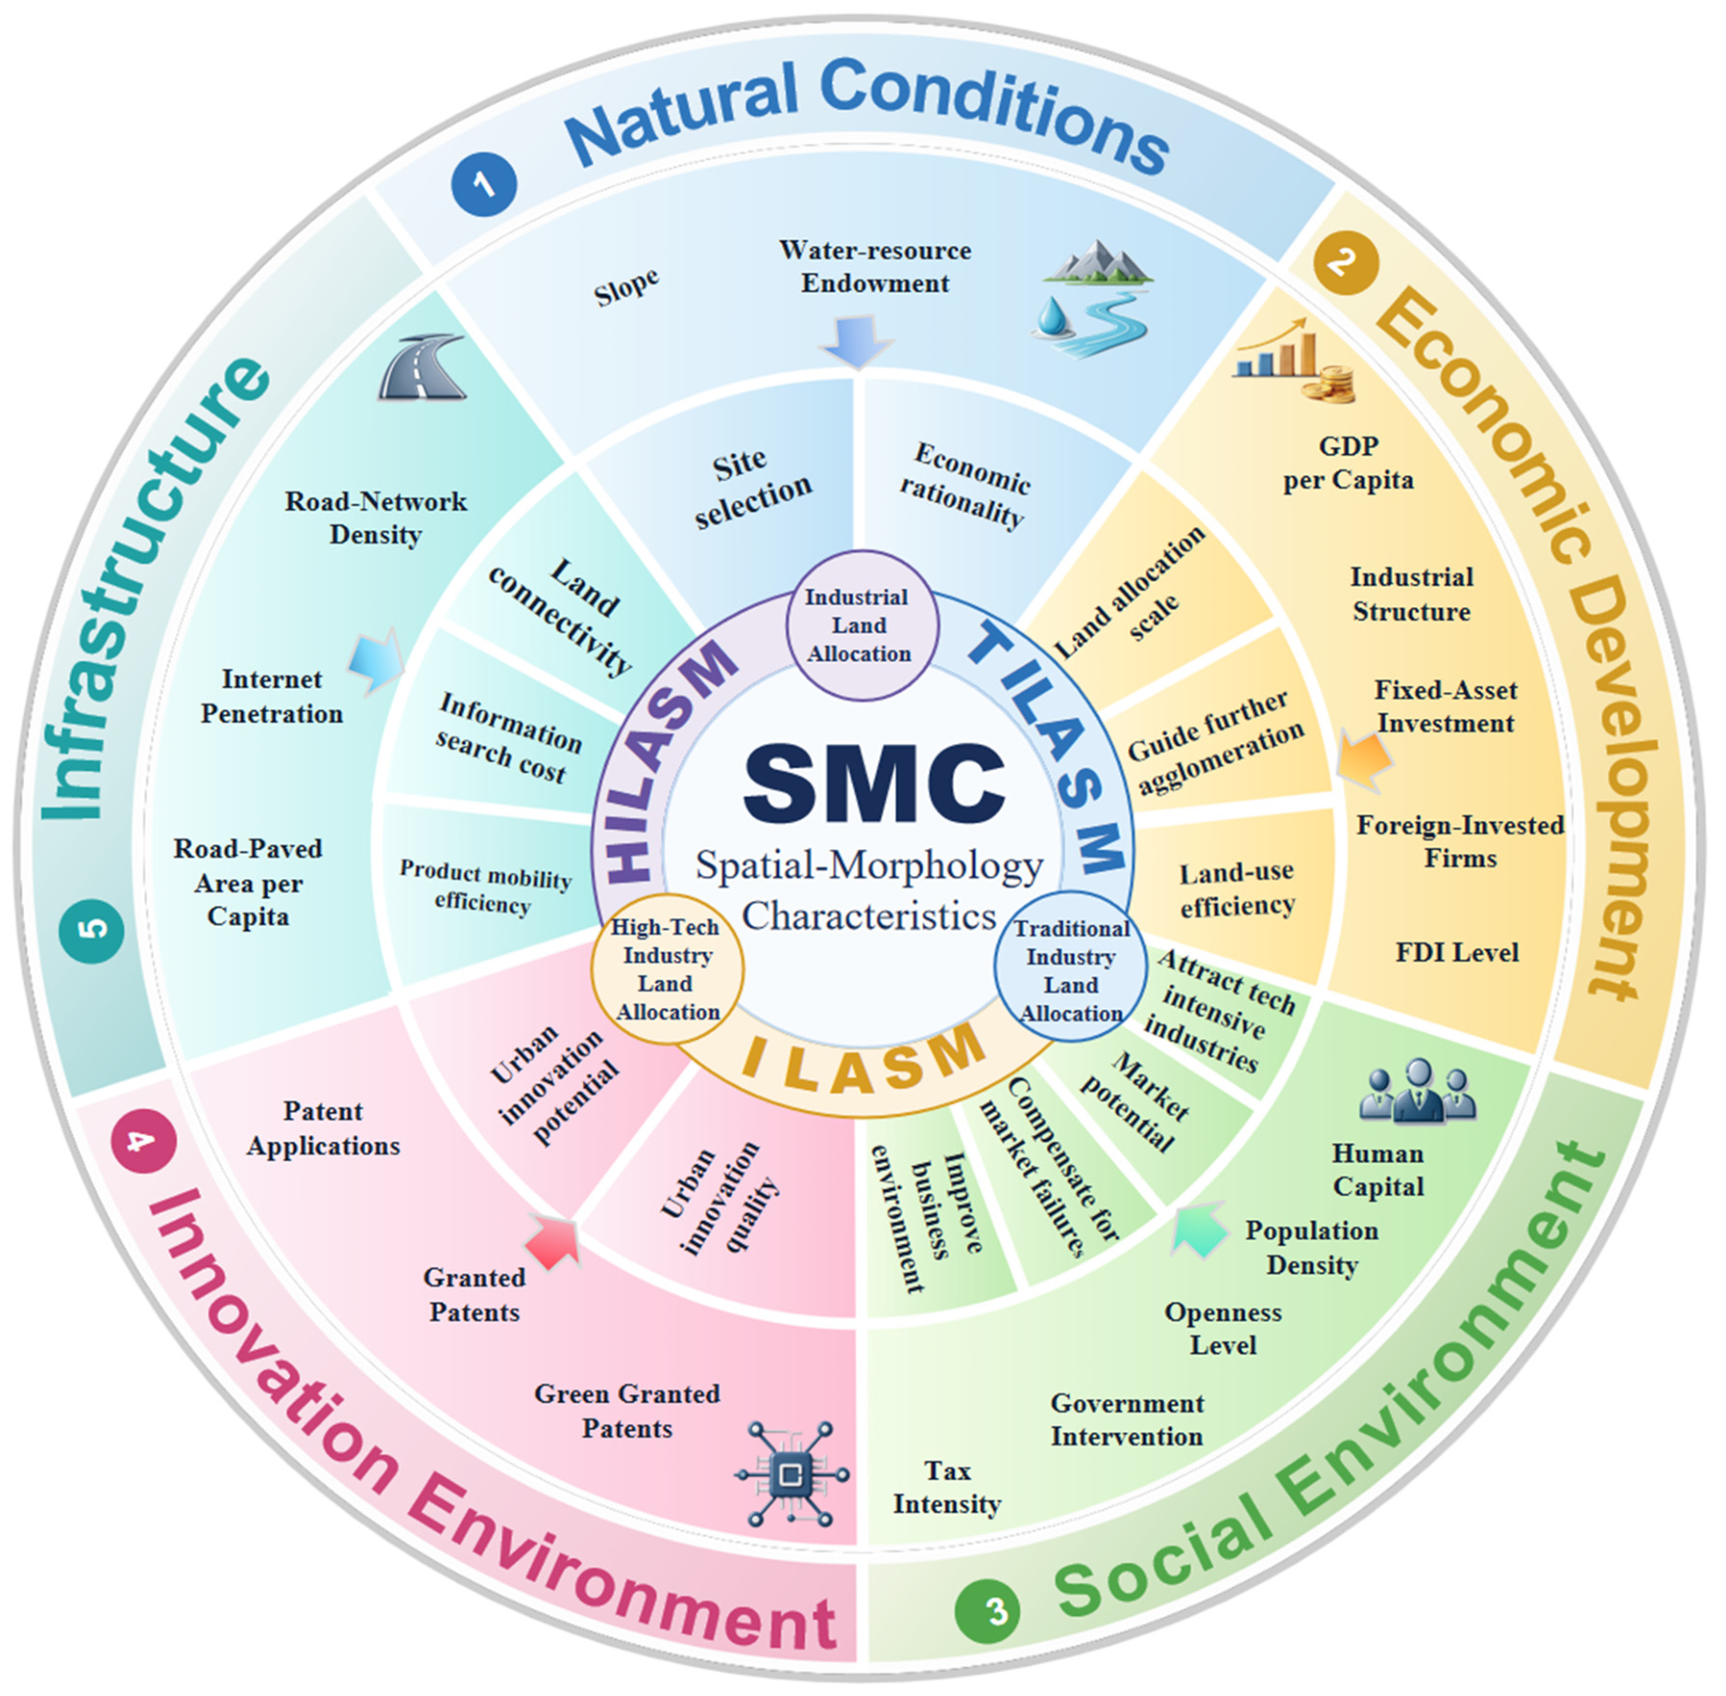
The ILASM, TILASM and HILASM are jointly shaped by a multitude of factors. Specifically, natural endowments and the level of economic development are the fundamental determinants. With the advancement of industrial restructuring and upgrading, the social environment, innovation environment, and infrastructure have also become increasingly important driving factors. Given the compound influences of natural conditions, economic foundation, social environment, innovation environment, and infrastructure on industrial land spatial morphology, this study further develops a targeted theoretical framework to explain the evolutionary mechanisms of industrial land allocation spatial morphology (Figure 1).

3.1. Natural Conditions

Natural conditions exert a strong constraining effect on the spatial morphology of industrial land allocation. Terrain, particularly slope, has a significant influence on the site selection and spatial layout of industrial enterprises. Appropriate terrain conditions facilitate the large-scale and concentrated arrangement of upstream and downstream industrial chain-related enterprises, thereby reducing transportation costs for raw materials and products. This process promotes the division of labor, resource sharing and coordinated development, which will play a positive role in optimizing the spatial allocation of industrial land [55]. Industrial production, cooling processes, raw material processing, and environmental protection facilities all rely heavily on stable water supply. Consequently, water resource endowment directly determines the technical feasibility and economic rationality of industrial projects, serving as a critical prerequisite for enterprise location decisions and ultimately shaping the spatial layout of industrial land allocation [56].

3.2. Economic Development

Economic development is the internal driving force underlying the formation, transformation and evolution of ILASM. Indicators of regional economic development, including per-capita GDP, industrial structure, fixed-asset investment, the number of foreign-invested enterprises, and the level of foreign direct investment, serve as important drivers of industrial land allocation. Regions with higher per-capita GDP generally possess a solid foundation for industrial development, including well-developed infrastructure, larger markets, and greater investment attractiveness, thereby influencing both the scale and spatial distribution of industrial land allocation [6]. Industrial structure exerts a significant influence on the spatial allocation of labor, capital, and resources, guiding industrial activities toward regions with comparative advantages and promoting industrial agglomeration. Consequently, industrial structure plays a key role in determining both the location choices of industrial enterprises and the spatial pattern of industrial land allocation [13]. A higher level of fixed-asset investment is associated with more complete urban infrastructure and stronger supporting conditions for industrial production, thereby increasing industrial land demand and improving allocation efficiency [17]. Foreign-invested enterprises are generally characterized by advanced technologies, high investment intensity, and efficient output performance. Their presence enhances industrial land-use efficiency and facilitates the transition of industrial land allocation from extensive expansion toward intensive and high-quality development, thereby optimizing both the spatial structure and allocation efficiency of industrial land. Foreign direct investment (FDI) has long been a major target of competition between local governments in China. High-quality FDI tends to promote industrial agglomeration, whereas low-quality FDI induces extensive expansion of industrial land. Thus, both the quality and level of FDI can reshape the spatial layout of industrial land allocation [26].

3.3. Social Environment

The social environment serves as an external driving force influencing the evolution of ILASM. Factors such as human capital, population density, opening-up level, government intervention, and tax intensity jointly shape the spatial layout and development of industrial land allocation. Human capital is a critical determinant of industrial location choice. A higher level of human capital enhances industrial specialization and innovation capacity, attracts technology-intensive and high-value-added industries, and promotes the optimization of industrial land allocation [57]. Population density reflects the intensity of regional socioeconomic activities and local market size. A higher population density generally indicates greater market potential, which attracts industrial enterprises and promotes the spatial expansion of industrial land allocation. However, excessive population agglomeration may increase land scarcity and development costs, encouraging industrial enterprises to relocate toward the urban periphery. A higher degree of openness helps to improve the regional business environment and facilitates external exchanges and trade, thereby increasing industrial land demand and optimizing its spatial allocation [58]. Moderate government interventions can effectively compensate for market failures and promote the efficient allocation of industrial land resources. Conversely, excessive administrative interventions may distort market mechanisms and hinder the formation of an efficient and rational spatial distribution of industrial land [3,25]. Tax intensity directly affects the location decisions of industrial enterprises by altering their cost and benefit expectations, thereby reshaping the spatial allocation pattern of industrial land.

3.4. Innovation Environment

The innovation environment serves as a sustained driving force for regional industrial land allocation. Against the backdrop of industrial transformation and upgrading, the number of patent applications and patent grants represents regional innovation potential and innovation capacity, respectively, whereas the number of green patents reflects innovation quality. Regional differences in innovation capability further intensify the spatial differentiation of industrial land allocation. For example, cities with stronger innovation environments are more likely to attract high-tech enterprises, thereby promoting industrial agglomeration and facilitating compact, contiguous industrial land layouts supported by well-developed infrastructure and innovation ecosystems.

3.5. Infrastructure

Infrastructure provides an essential foundation for the formation and optimization of ILASM. The road network density facilitates the diversification of industrial land allocation. An improved road network acts as the vascular system of regional development, effectively connecting scattered industrial parcels and facilitating the formation of an interconnected spatial network [59]. Internet penetration reduces information search and communication costs throughout the production process. Moreover, greater internet penetration weakens enterprises’ dependence on geographic proximity and reshapes the spatial layout of industrial land [52]. Per-capita paved road area is an important determinant of industrial location choice. It not only directly improves the mobility efficiency of production factors and the accessibility of product transportation but also enhances the attractiveness of a region to industrial enterprises. Therefore, continuous improvements in infrastructure play a crucial role in shaping and optimizing the spatial pattern of industrial land allocation.
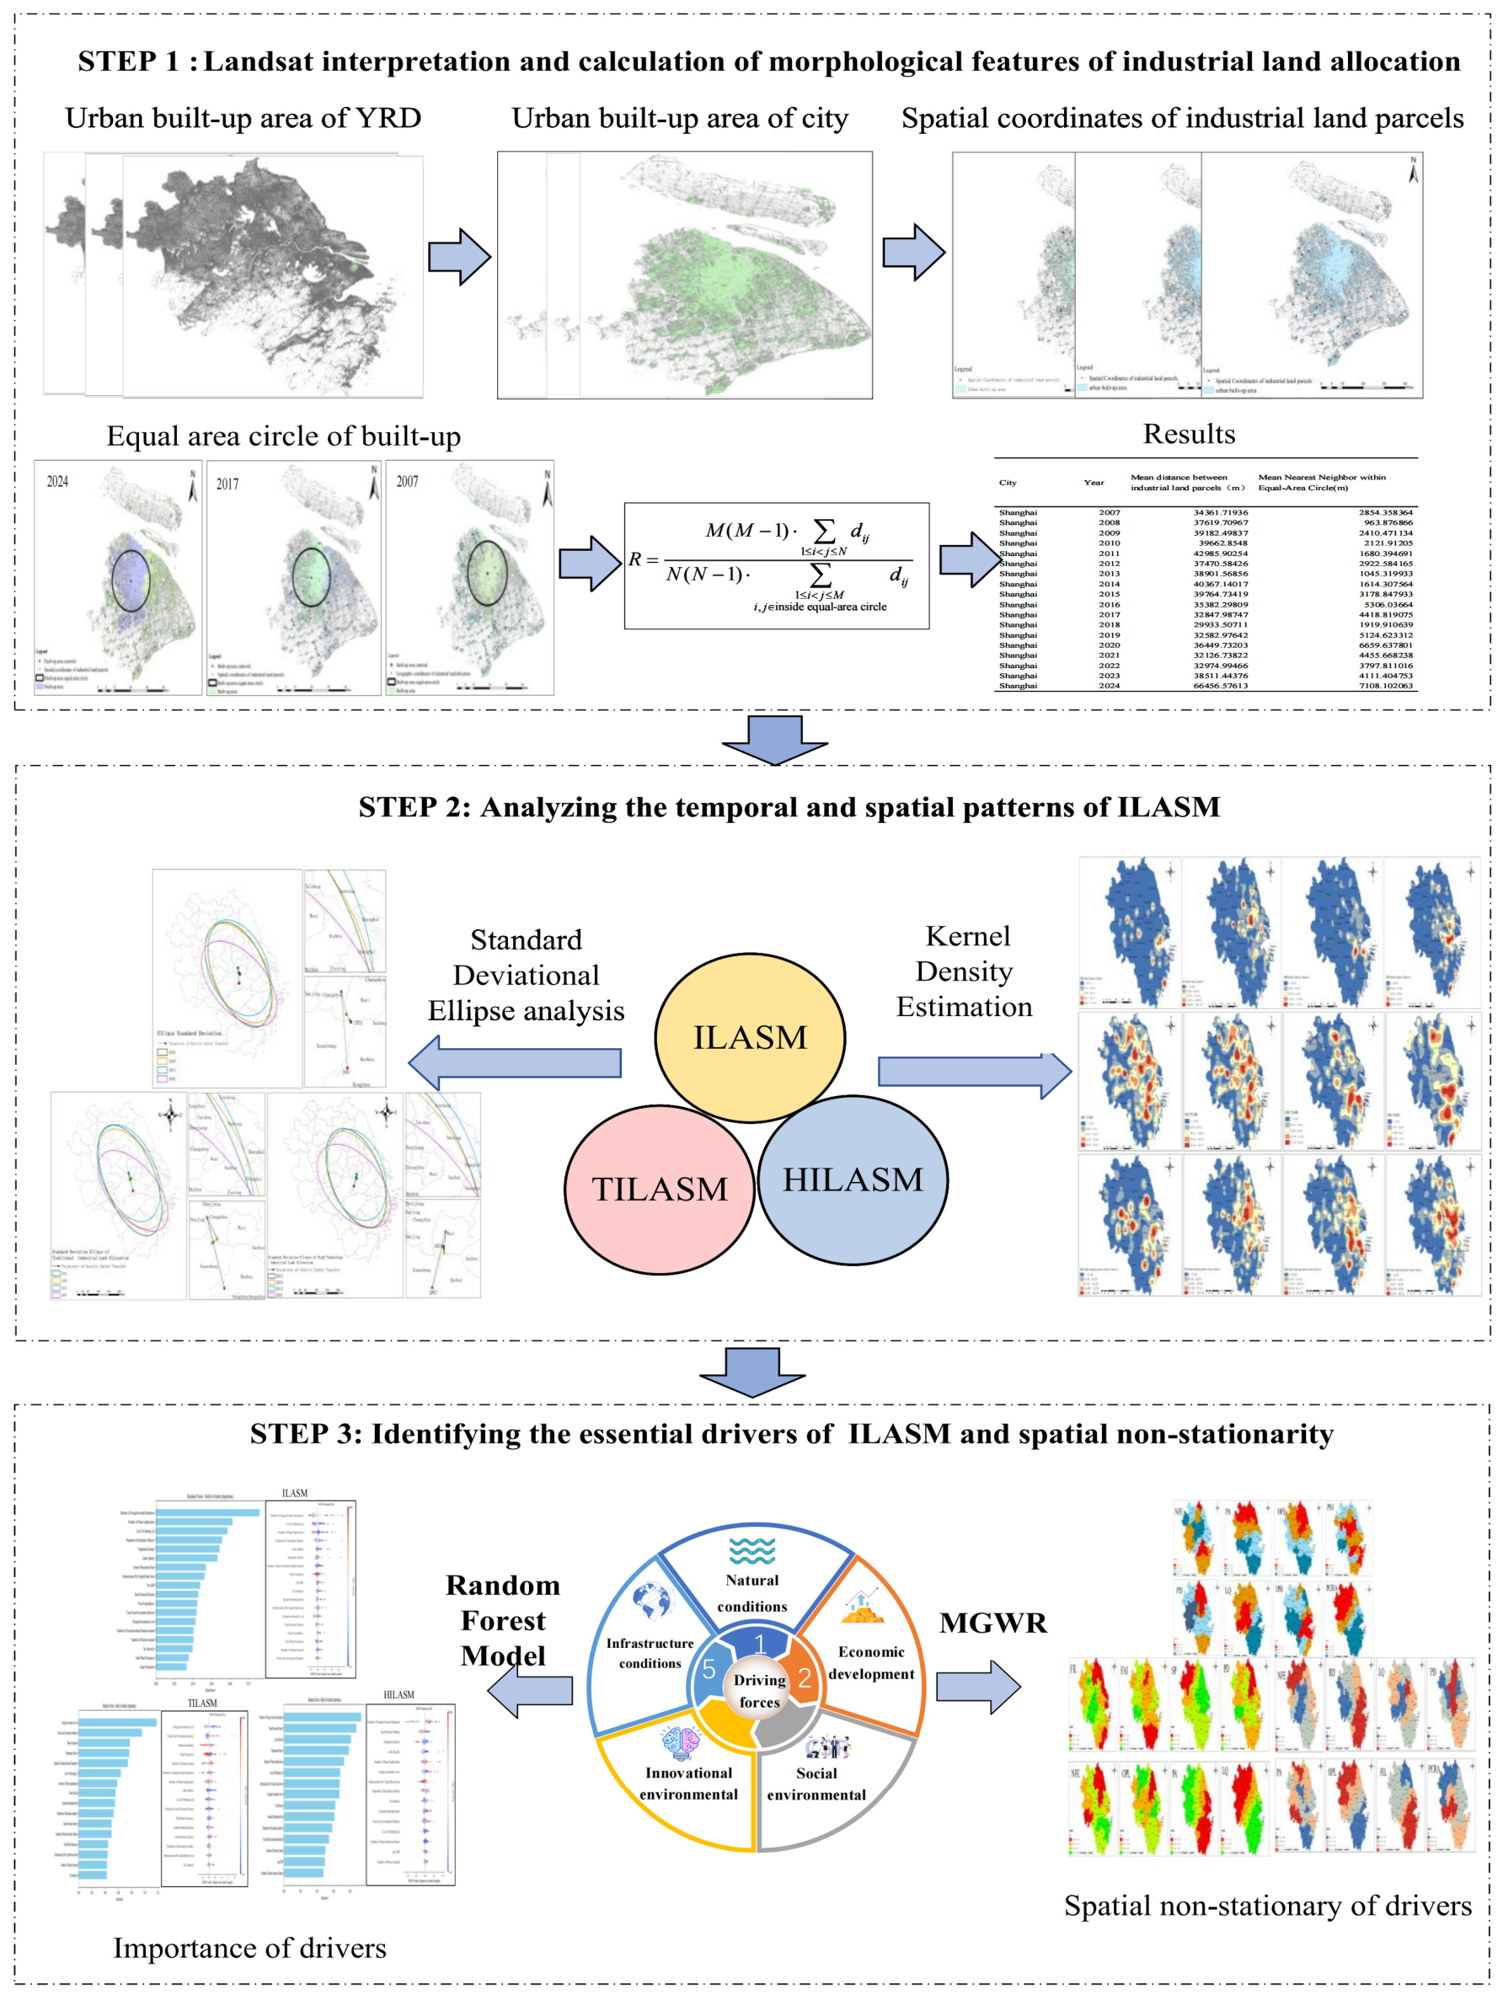
This study consists of three main stages. First, ArcGIS spatial analysis techniques are employed to identify the precise geographic coordinates of industrial land parcels within built-up areas. Second, the standard deviation ellipse (SDE) and kernel density estimation (KDE) are applied to systematically analyze the spatial and temporal evolution of ILASM, TILASM and HILASM. Finally, the RE model is applied to identify the key driving factors of ILASM, TILASM and HILASM, followed by the application of the MGWR model to investigate the spatial heterogeneity of these driving factors. The primary objective of this study is to improve our understanding of the spatiotemporal evolution of ILASM and its driving mechanisms. Furthermore, the findings are expected to provide scientific recommendations for optimizing the spatial patterns of industrial land allocation in other regions and countries. The overall analytical framework of the study is illustrated in Figure 2.

4. Methodology and Data

4.1. Study Area

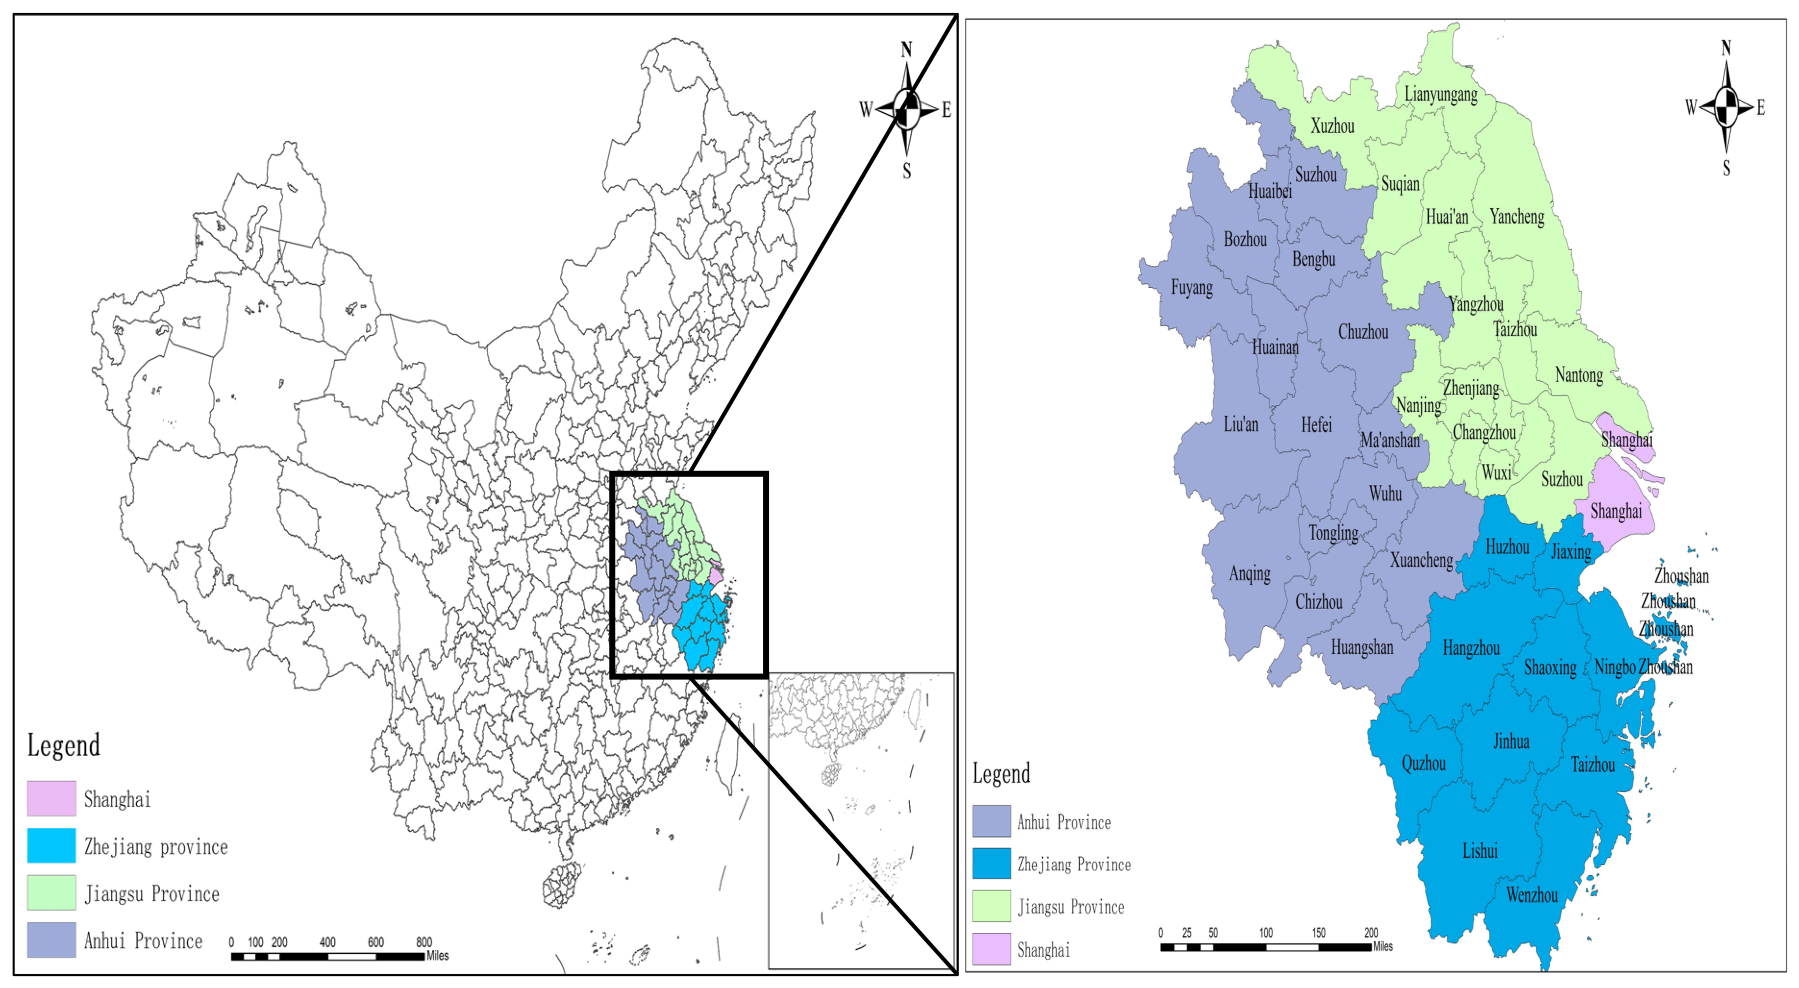
The Yangtze River Delta (YRD) region encompasses 41 cities across Anhui Province, Jiangsu Province, Zhejiang Province, and Shanghai (Figure 3). As one of China’s most economically dynamic regions, the YRD occupies a pivotal strategic position in building a Chinese-style modern industrial system and promoting new-type industrialization. From 2007 to 2024, the total industrial output value of this region increased from 3016.265 billion yuan to 10,448.67 billion yuan, representing a growth rate of 246% (China Statistical Yearbook). However, despite its remarkable industrial economic performance, the YRD continues to face prominent spatial disparities and unbalanced regional development, particularly in the allocation and utilization of industrial land. From 2007 to 2024, the total area of industrial land supplied increased substantially from 9013.662 ha to 16,498.568 ha, equivalent to an increase of 83.04%. During this period, the average annual increase in industrial land supply reached 440.29 ha (https://www.landchina.com, accessed on 1 May 2025). However, significant disparities exist in industrial economic growth. For example, in 2024, Shanghai contributed 10.4% of the region’s industrial output growth while accounting for only 0.75% of the newly supplied industrial land area. By contrast, Anhui Province accounted for 22.11% of newly supplied industrial land area but contributed only 13.51% of regional industrial output growth (China Statistical Yearbook). This mismatch reflects the coexistence of industrial land shortages in economically developed cities and excessive land supply in relatively less-developed areas, highlighting the spatial imbalance of industrial land allocation across the YRD.

4.2. Methods for Characterizing Industrial Land Allocation Spatial Morphology

In this study, ArcGIS served as the primary geospatial analytical platform, within which neighborhood analysis, directional distribution (Spatial Statistics toolbox), and kernel density estimation (Spatial Analyst toolbox) were applied to delineate and interpret the spatiotemporal evolution regularities of industrial land.

4.2.1. Measurement of Industrial Land Allocation Spatial Morphology

Based on land-use remote sensing data and urban administrative boundary data, this study quantifies urban spatial morphology. Specifically, building on prior studies, urban morphological configuration and internal spatial compactness are quantified using the average Euclidean distance between any two points within the city after standardization [60,61]. This study characterizes the spatial morphology and internal compactness of industrial land allocation using the average Euclidean distance between any two allocated industrial land points within the city. The specific calculation steps are as follows. First, 30-meter resolution remote sensing imagery and the Global Urban Boundary Dataset are employed to extract the largest contiguous built-up area for each city in the YRD. Second, industrial land allocation data are obtained from Land China (https://www.landchina.com). The geocoding APIs of Amap and Baidu Maps are adopted to parse the longitude and latitude of each land parcel, which are then converted into the WGS84 coordinate system. Based on these data, a plot-level industrial land database is constructed, encompassing complete spatial coordinates and land transaction and allocation attributes. Finally, based on this database, ILASM is calculated as the ratio of the average Euclidean distance between any two industrial land parcels to the expected mean Euclidean distance between any two parcels within a circle having an area equal to the city’s built-up area. This index quantifies the deviation of local governments’ industrial land allocation from the geographically most compact circular urban form, yielding the spatial morphology index of industrial land allocation used in this study. Lower index values indicate a more compact spatial pattern of industrial land allocation, whereas higher values represent a more dispersed spatial pattern.
In this study, ArcGIS was employed as the primary platform for assessing ILASM. The specific operational procedure involves the following four steps. Step 1: The merge tool was utilized to integrate the industrial land parcel coordinate layers of each prefecture-level city with the corresponding urban built-up area layers, thereby generating a spatial distribution layer of industrial land parcels confined within the boundaries of the built-up areas. Step 2: The neighborhood analysis tool was employed to compute the average distance among industrial land parcels situated within the built-up area. This calculation yielded the numerator component of the ILASM indicator. Step 3: The feature to point tool was first used to generate the centroid point of the geometric shape of the built-up area. Subsequently, the circle tool was employed to generate a circular polygon feature with an area equivalent to that of the built-up area, with the center of the circle located at the geometric centroid of the built-up area. Step 4: The neighborhood analysis tool was applied to calculate the average distance among the industrial land parcels located within the equal-area circle. This calculation yielded the denominator component of the ILASM indicator.

4.2.2. Standard Deviation Ellipse Analysis

The standard deviation ellipse method was employed herein not merely as a descriptive expedient but as an analytical framework for examining the spatial morphology of industrial land distribution, effectively diagnosing pronounced directional aggregation and spatial migration characteristics. The SDE method effectively captures the dominant orientation, spatial dispersion degree and centroid shift trajectory of land patches, thereby providing a robust basis for analyzing the overall spatial evolution trend of industrial land allocation morphology. Therefore, this study employs the SDE method to analyze the spatial distribution of industrial land allocation, including both traditional industrial land allocation and high-tech industrial land allocation. Specifically, the mean center coordinates represent the central tendency of the industrial allocation parcels, while the area and the minor axis reflect the spatial dispersion of parcels. Moreover, the rotation angle, major axis and minor axis indicate the evolutionary direction of industrial land allocation morphology. The equations are as follows:
S D E x = i = 1 n ( x i X ¯ ) 2 n
S D E y = i = 1 n ( y i Y ¯ ) 2 n
where S D E x and S D E y represent the center coordinates of the ellipse. x i , y i denotes the geographic coordinates of the industrial land, x i represents the longitude of industrial land, and y i denotes the latitude of industrial land; X ¯ , Y ¯ represents the mean center of industrial land allocation. n is the quantity of allocated industrial land parcels.
The axes’ direction represents the orientation of the spatial distribution of industrial land allocation. The major axis indicates the dominant extension direction of the spatial distribution, reflecting the main trend of the agglomeration and diffusion of allocation points within the region. The minor axis represents the secondary extension direction, reflecting the relatively compact and highly agglomerated dimension of the spatial distribution of industrial land parcels. The specific formulas are as follows:
tan θ = A + B C A = i = 1 n x ¯ i 2 i = 1 n y ¯ i 2 B = i = 1 n x ¯ i 2 i = 1 n y ¯ i 2 2 + 4 i = 1 n x ¯ i y ¯ i 2 C = 2 i = 1 n x ¯ i y ¯ i 2
where θ presents the directional angle of the ellipse; x i ¯ and y i ¯ are the coordinate deviations of each city from the mean center coordinates, respectively.
The standard deviation distance of the axis lengths of the SDE is given as follows:
σ x = i = 1 n x ¯ i cos θ y ¯ i sin θ 2 n σ y = 2 i = 1 n x ¯ i sin θ + y ¯ i cos θ 2 n
where σ x and σ y represent the lengths of the X-axis and Y-axis, respectively.

4.2.3. Kernel Density Estimation

Notably, KDE transforms discrete industrial parcel points into a continuous intensity surface, thereby facilitating the delineation of agglomeration cores and sparse zones without recourse to arbitrary areal units. KDE proves particularly effective in capturing the fine-grained spatial differentiation of industrial land allocation. The specific model is as follows:
f m ( x ) = 1 m h i = 1 m K x x i h
where f m ( x ) represents the kernel density value; K ( · ) is the kernel function; m is the number of points within the search radius; h is the search radius (bandwidth); and x x i denotes the distance from the estimation point to the sample point.
The integrated application of SDE and KDE enables a comprehensive depiction of industrial land dynamics, simultaneously capturing macroscopic directional evolution and microscopic density aggregation characteristics. This dual perspective is effective in uncovering the intricate spatial morphological rules underlying regional industrial land allocation.

4.3. Methods for Identifying the Driving Factors of Industrial Land Allocation Spatial Morphology

4.3.1. Random Forest Model

This study employs the Random Forest (RF) model to investigate the relationship between the ILASM and its driving factors, thereby identifying the key factors influencing ILASM. The RF model, proposed by Breiman in 2001, is a nonlinear machine learning algorithm that has been widely applied in research fields such as land-use science and ecological research. The RF model can accurately evaluate the relative importance of influencing factors and quantitatively analyze the contribution degree of each factor, thereby identifying the dominant driving factors [15]. In addition, the RF model effectively captures the complex relationship between each influencing factor and ILASM. By effectively handling high-dimensional data and complex nonlinear relationships, the RF model improves predictive performance, reduces regression error, and minimizes the risk of overfitting [16].
The RF model is based on decision trees. Each decision tree is constructed using random sample selection and random feature selection. Finally, the results of multiple decision trees are combined through voting. The number of decision trees and the number of variables used in each tree are the two most critical parameters. To enhance model performance, this study uses the overall out-of-bag root mean square error (RMSE) to optimize the model hyperparameters. The model performance is evaluated based on the RMSE, mean absolute error (MAE) and coefficient of determination (R2). Lower RMSE and MSE values, together with an R2 value closer to 1, indicate higher accuracy. The equations for these evaluation metrics are as follows:
R M S E = i = 1 n ( y ^ i y i ) 2 n
M A E = 1 n i = 1 n y ^ i y i
R = ± i = 1 n ( y ^ i y ¯ ) 2 i = 1 n ( y i y ¯ ) 2
where y i and y ^ i represent the observed and predicted values for the i sample, respectively; y - denotes the sample mean of the observed values; and n is the sample size.

4.3.2. Multi-Scale Geographically Weighted Regression

Compared with the traditional Ordinary Least Squares (OLS) model and the Geographically Weighted Regression (GWR) model, the MGWR model employs a modeling mechanism that is better suited to capturing real-world spatial processes, making it more sensitive to spatial heterogeneity. The model not only accounts for the spatial heterogeneity of economic activities by incorporating the geographic location of variables into the regression equation, but also considers differences in the spatial scales of the underlying processes [6,52]. It allows each independent variable to have its own optimal bandwidth rather than employing a global bandwidth, thus enabling more accurate regression results. Therefore, this study adopts the MGWR model to investigate the spatial heterogeneity of the driving factors influencing ILASM. The model is specified as follows:
y i = β 0 ( μ i , ν i ) + k β b w k ( u i , ν i ) x i k + ε i
In the above model, y i denotes the response variable at location i , with μ i , ν i as its coordinates. β 0   μ i , ν i represents the location-varying intercept. x ik and β bwk μ i , ν i , respectively, represent the K -th explanatory variable and its corresponding local regression coefficient at location i , where bwk denotes the variable-specific bandwidth. ε i is the random error term.
This study employs the Gaussian kernel function to calculate the spatial weights for the MGWR model. This kernel function addresses two major limitations of conventional spatial weighting methods: it eliminates the discontinuity associated with distance-threshold weighting and avoids the excessively large weight values generated by inverse distance weighting. The corresponding functional form is as follows:
w i j = exp d i j b 2
where w i j denotes the spatial weight between location i and j , d i j is the distance between points i and j , and b is the bandwidth parameter.

4.4. Variable Identification and Data Sources

4.4.1. Variable Identification

(1)
Explanatory variable
In this study, the dependent variable is the ILASM. The characteristics and evolutionary patterns of ILASM are examined from three dimensions: overall industrial land allocation, traditional industrial land allocation and high-tech industrial land allocation. Based on remote sensing land-use data and the geographic coordinate data of industrial land parcels covering the period from 2007 to 2024, this study constructs the ILASM indicator as the ratio of the average Euclidean distance between any two industrial land parcels to the expected average Euclidean distance between any two industrial land parcels within an equal-area circle corresponding to the built-up area.
(2)
Driving factors
Based on the theoretical analysis presented in Section 3, this study identifies the drivers of ILASM from five dimensions: natural conditions, economic development, social environment, innovation environment and infrastructure (Table 1). Since the location choice of industrial enterprises is closely related to regional natural conditions, slope and total regional water resources are selected to represent natural conditions. Economic development is an important driver of industrial land demand and spatial allocation. Accordingly, per-capita GDP, the proportion of secondary industry, fixed-asset investment intensity, the number of foreign-invested enterprises, and the level of foreign direct investment are selected as indicators of economic development. The social environment can shape the spatial allocation pattern of industrial land. Therefore, human capital, population density, the level of openness, and tax intensity are identified as driving factors. An improved innovation environment can reshape the ILASM. Accordingly, the number of patent applications, the number of granted patents, and the number of green invention patents are selected as influencing factors. Infrastructure also exerts a significant impact on industrial land allocation and industrial development. Therefore, road density, internet penetration rate, and per-capita paved road area are selected as indicators of infrastructure.

4.4.2. Data Sources

The data used in this study cover 41 prefecture-level cities and above (including municipalities) in the YRD from 2007 to 2024. The year 2007 was selected as the starting point because it marked a critical turning point in the market-oriented supply of industrial land, while 2024 represents the most recent year for which complete and publicly available data could be obtained. The primary datasets include industrial land leasing data, geographic information data, and socioeconomic data. The industrial land leasing data are sourced from the China Land Market Network (https://www.landchina.com). The original database contains 3,511,918 records, from which 129,120 valid records of industrial land leasing are extracted for subsequent analysis. The specific procedures are as follows: first, retaining land transaction data for the YRD region spanning 2007–2024; second, excluding land supply for residential, accommodation and catering, public infrastructure, and commercial and business purposes, among others, thereby preserving only transactions classified under industrial land use; finally, in conjunction with the industry classification variable, further excluding land parcels associated with real estate, accommodation, professional, scientific and technical services, as well as other non-industrial sectors, to maintain consistency with the industrial land definitions. Furthermore, according to the industrial classification standards established by the National Bureau of Statistics of China and the Asian Development Bank, the industrial land is categorized into traditional industrial land and high-tech industrial land (with specific details provided in the Appendix A). To construct the ILASM indicator, 30 m resolution land-use remote sensing imagery and the Global Urban Boundary Datasets are employed. The land-use remote sensing data are obtained from Landsat 9 imagery provided by the Earth Explorer platform of the United States Geological Survey (USGS) (https://earthexplorer.usgs.gov, accessed on 1 December 2025). Slope data are calculated from the 30 m resolution ASTER DEM V003 dataset. Administrative division codes are obtained from the National Bureau of Statistics (http://www.stats.gov.cn/tjsj/tjbz/tjyqhdmhcxhfdm, accessed on 1 may 2025). The socioeconomic data, including per-capita GDP, total water resources and foreign investment indicators are derived from the China City Statistical Yearbooks (2008–2025), the China National Intellectual Property Administration (CNIPA, http://www.cnipa.gov.cn, accessed on 1 December 2025) and the statistical yearbooks of each city.

5. Results

5.1. Spatial Patterns of ILASM

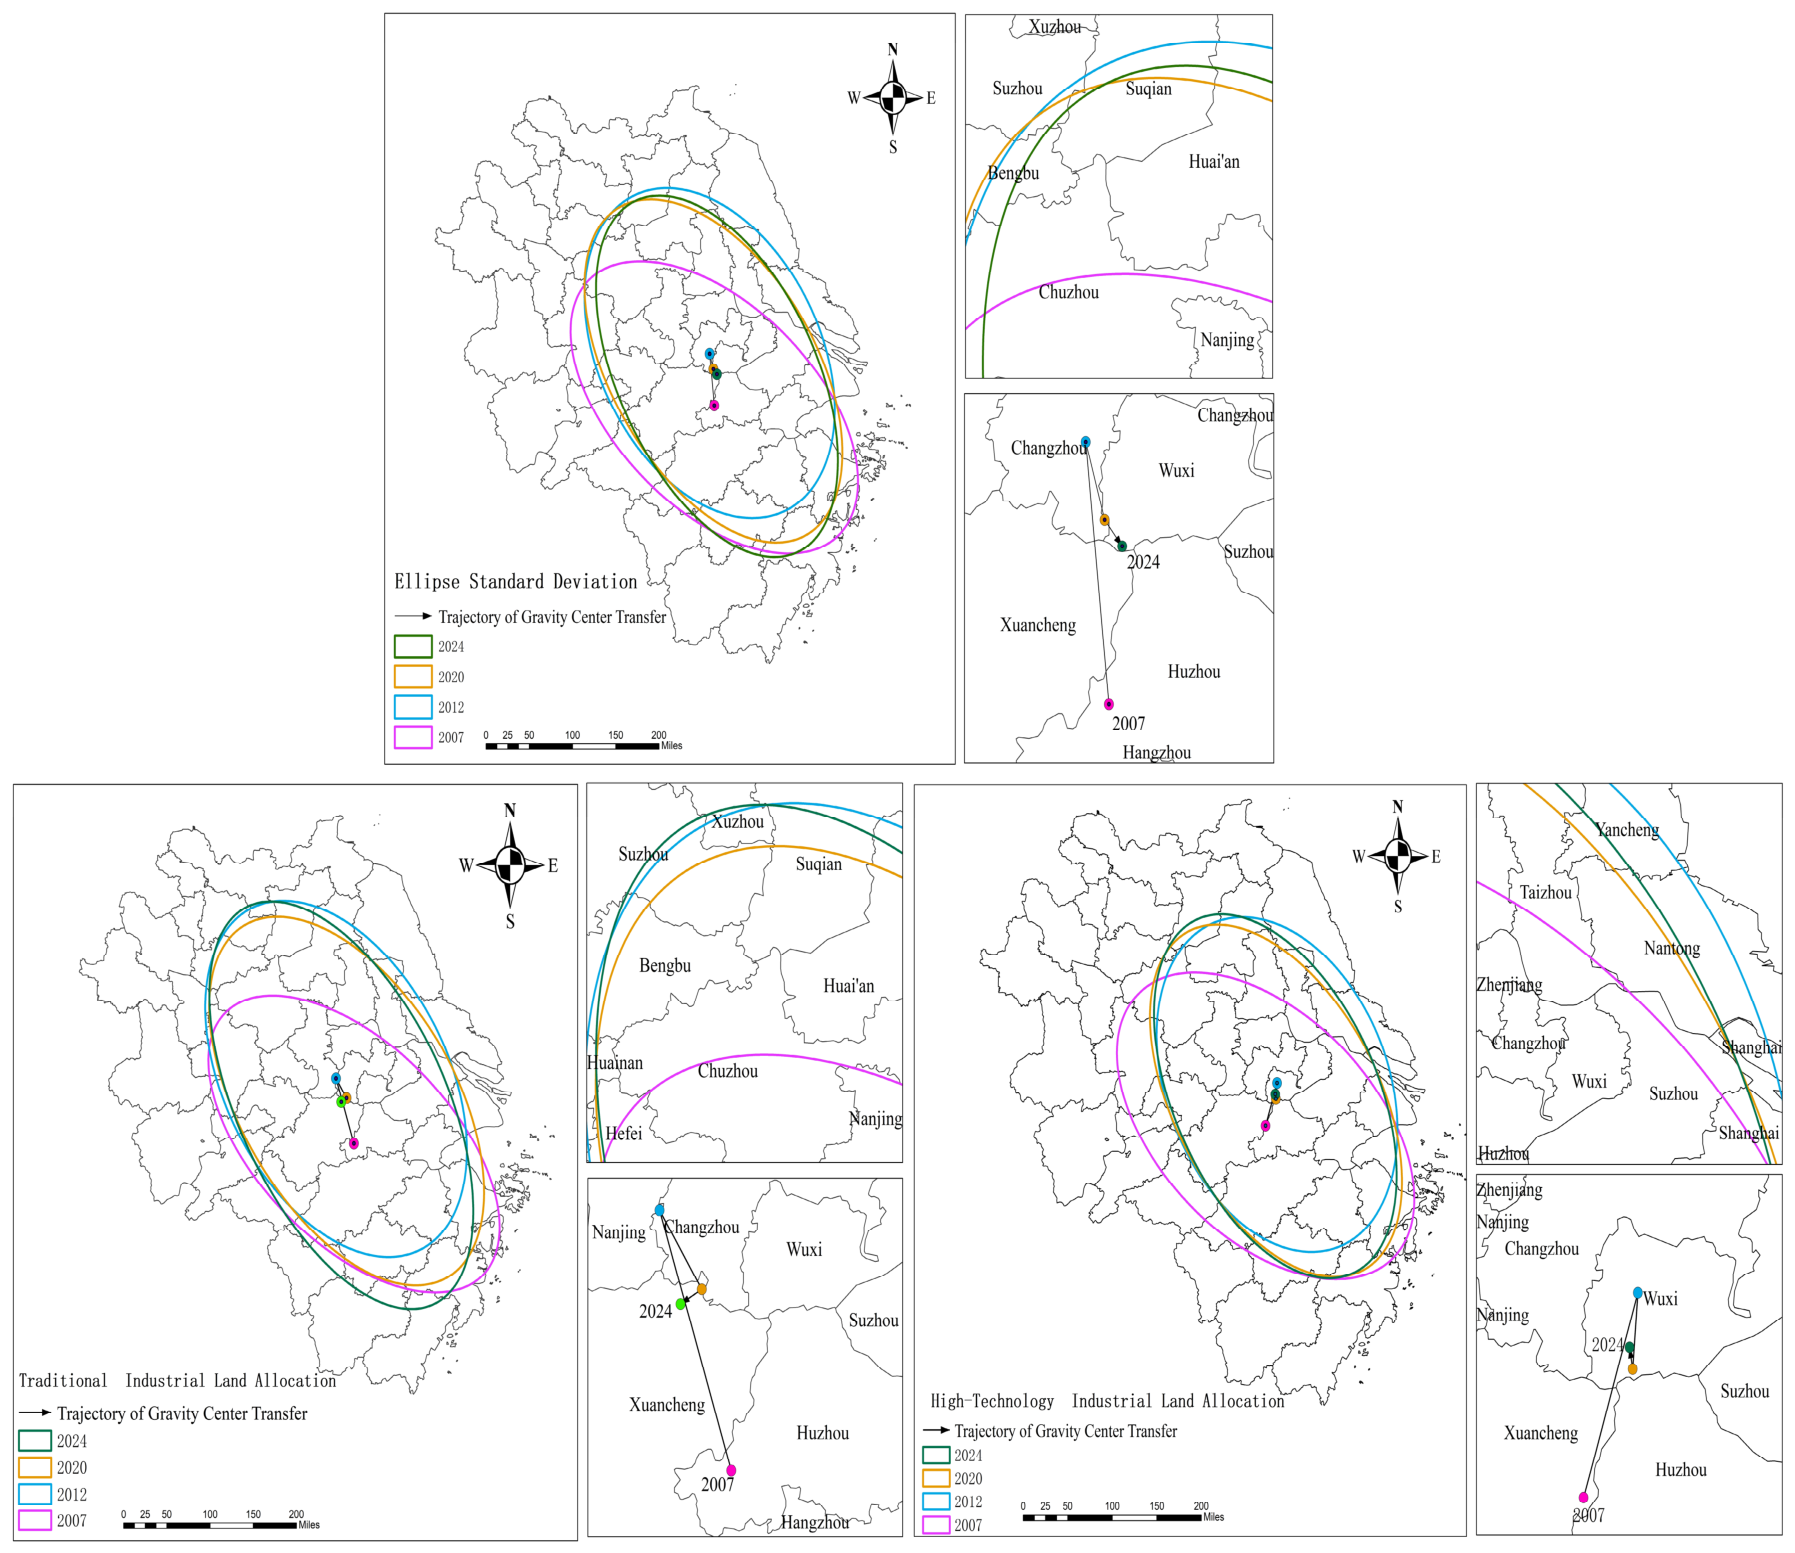
According to the results of the SDE analysis (Figure 4), the spatial distribution pattern and agglomeration center of industrial land allocation (ILA) in the YRD have experienced significant changes. In terms of spatial distribution, it showed an agglomeration pattern extending from the western (slightly northern) part of the region to the eastern (slightly southern) part. Regarding the spatial center, the center shifted from Huzhou to Changzhou and Wuxi, showing an inverted V-shaped trend. This trend reflects that the spatial pattern of ILA gradually evolved from dispersion to agglomeration.
In addition, drawing on the existing research, this study classified industrial land allocation into traditional industrial land and high-tech industrial land by matching industrial land transaction records with the industrial classification system of the National Bureau of Statistics. The SDE method was then applied to analyze their spatial distribution characteristics separately. Specifically, the allocation of traditional industrial land shows an agglomeration pattern extending from the western (slightly northern) part of the region to the eastern (slightly northern) part. The spatial distribution center shifted among Zhejiang, Jiangsu, and Anhui, showing an X-shaped trend. This spatial pattern indicates that the allocation of traditional industrial land gradually shifted from the northwestern to the northeastern part of the YRD, accompanied by an increasing degree of spatial agglomeration. The allocation of high-tech industrial land exhibits an agglomeration pattern extending from the western (slightly south) part of the region to the eastern (slightly north) part. Its spatial distribution center has shifted from Anhui Province to Jiangsu Province, reflecting that high-tech industrial land allocation has become increasingly concentrated in the eastern coastal areas of the YRD.

5.2. Spatial Density Characteristics of ILASM

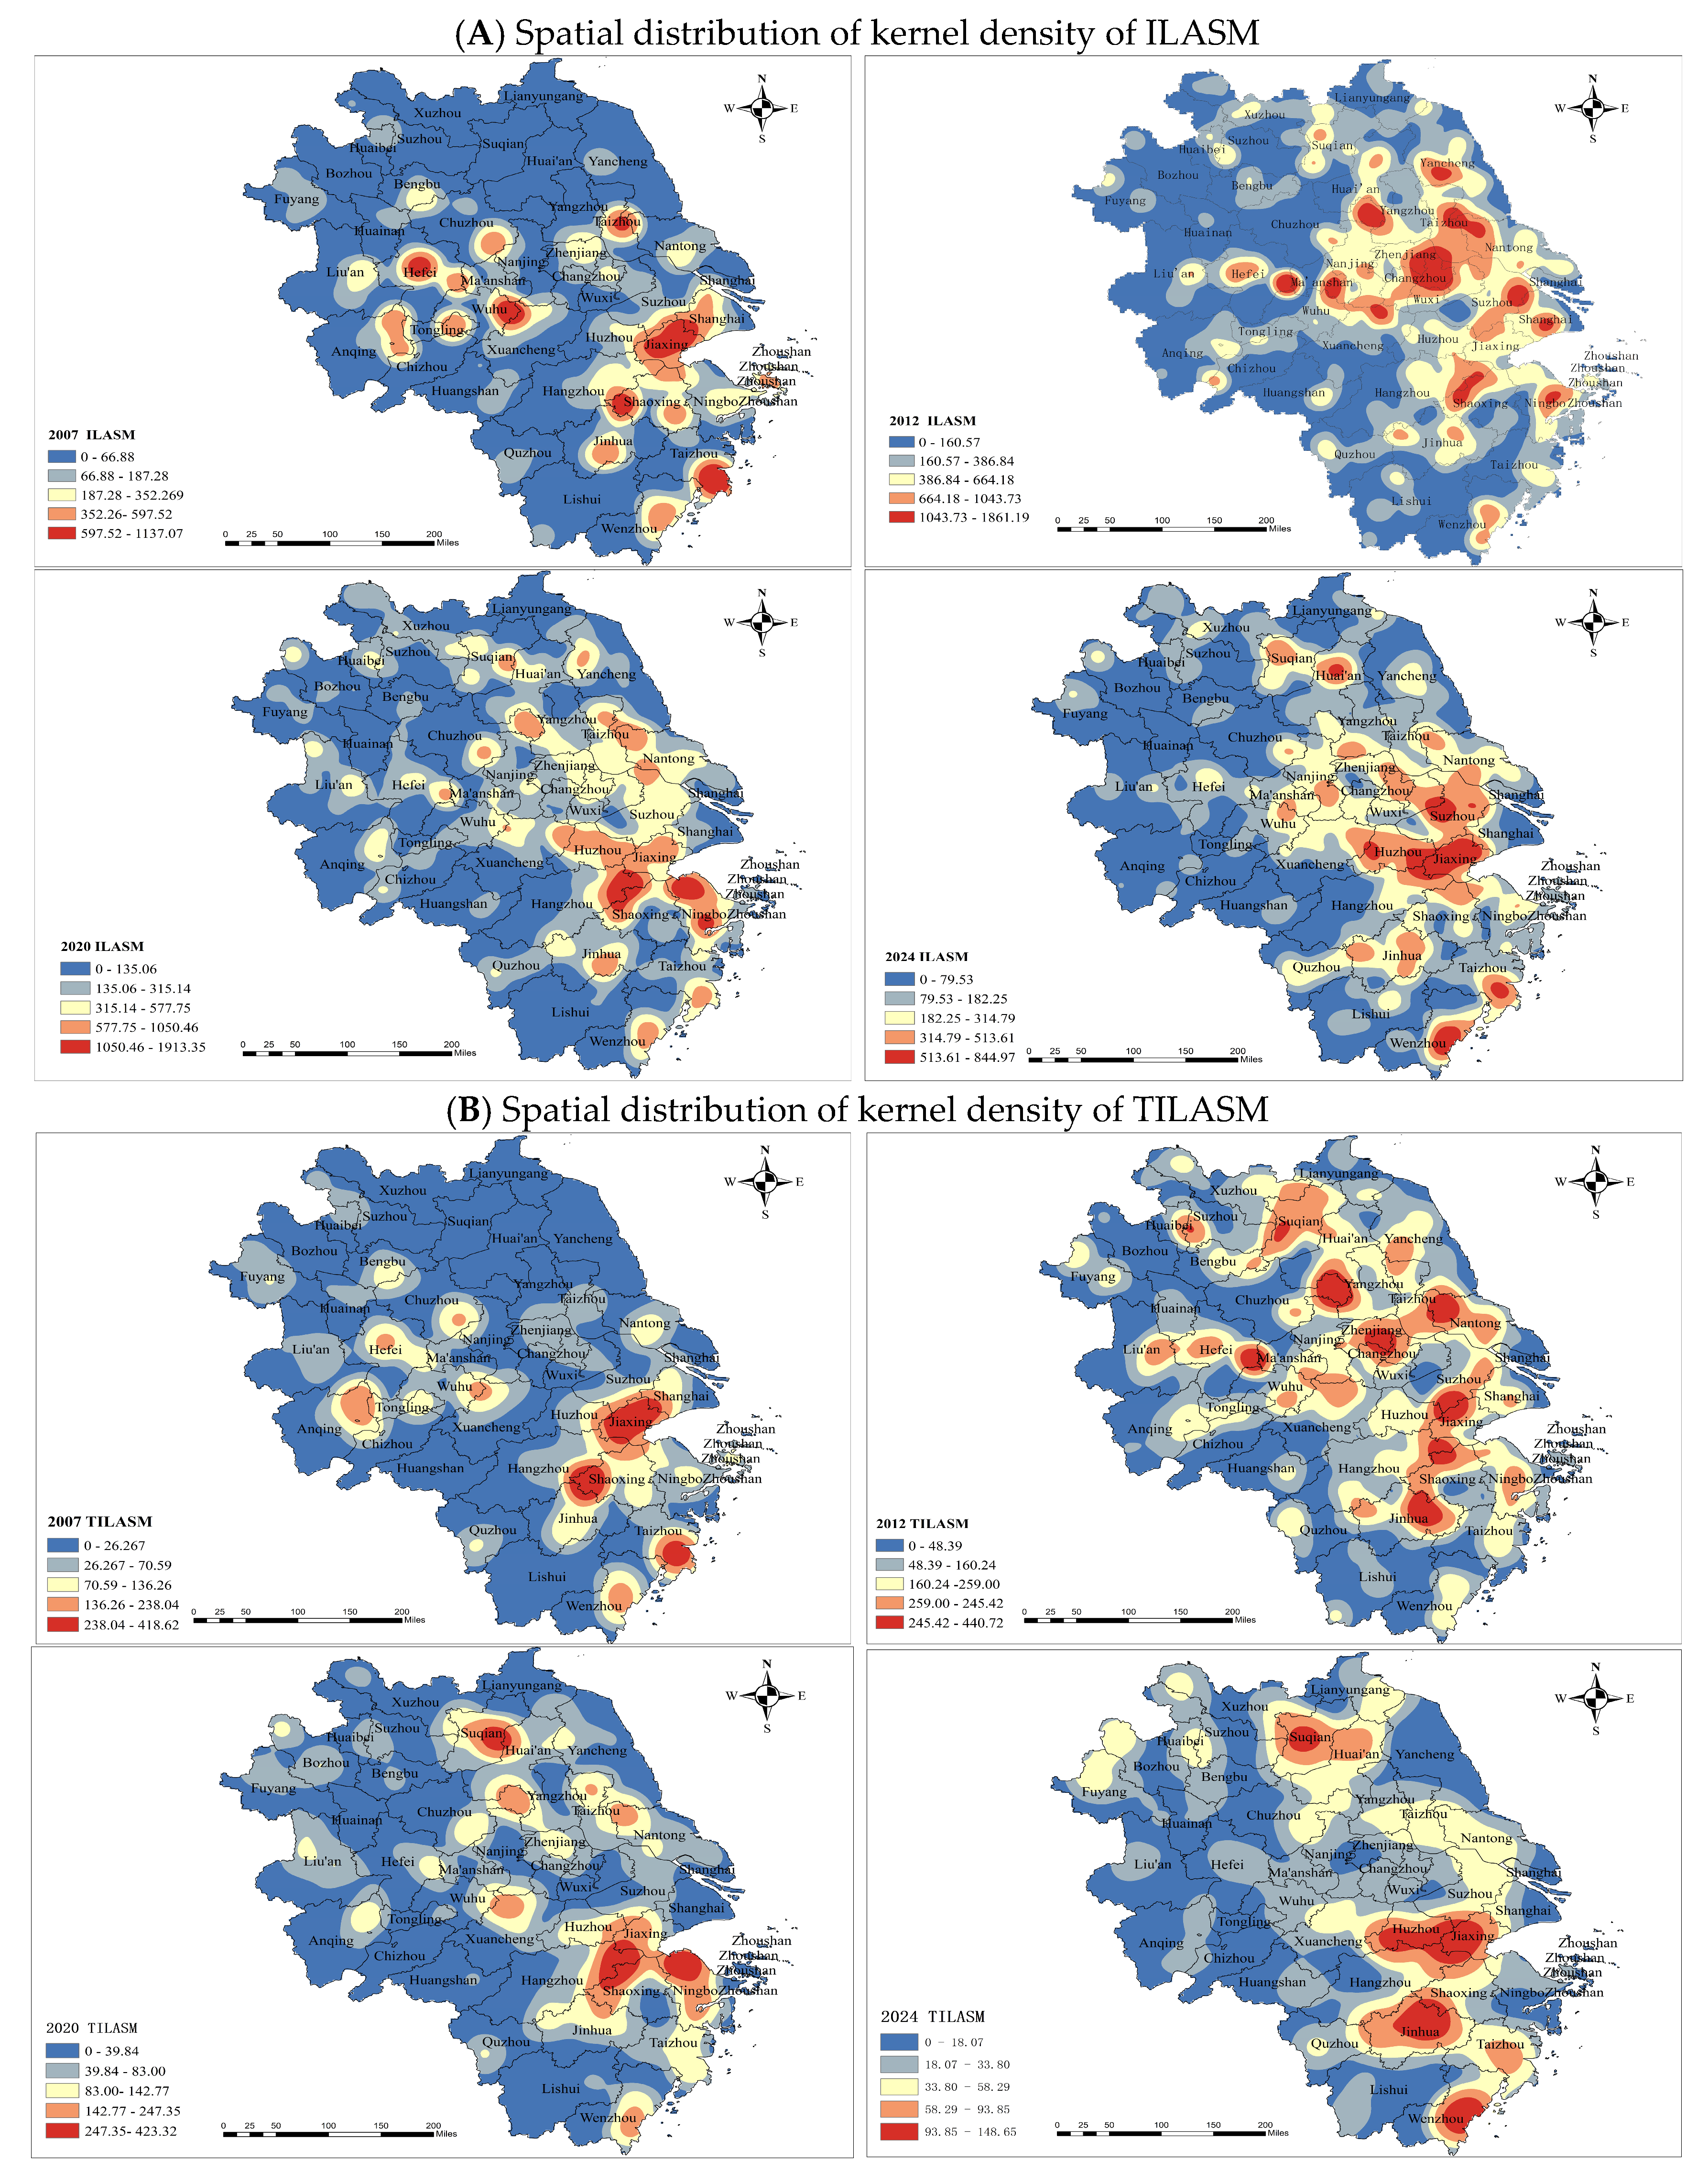
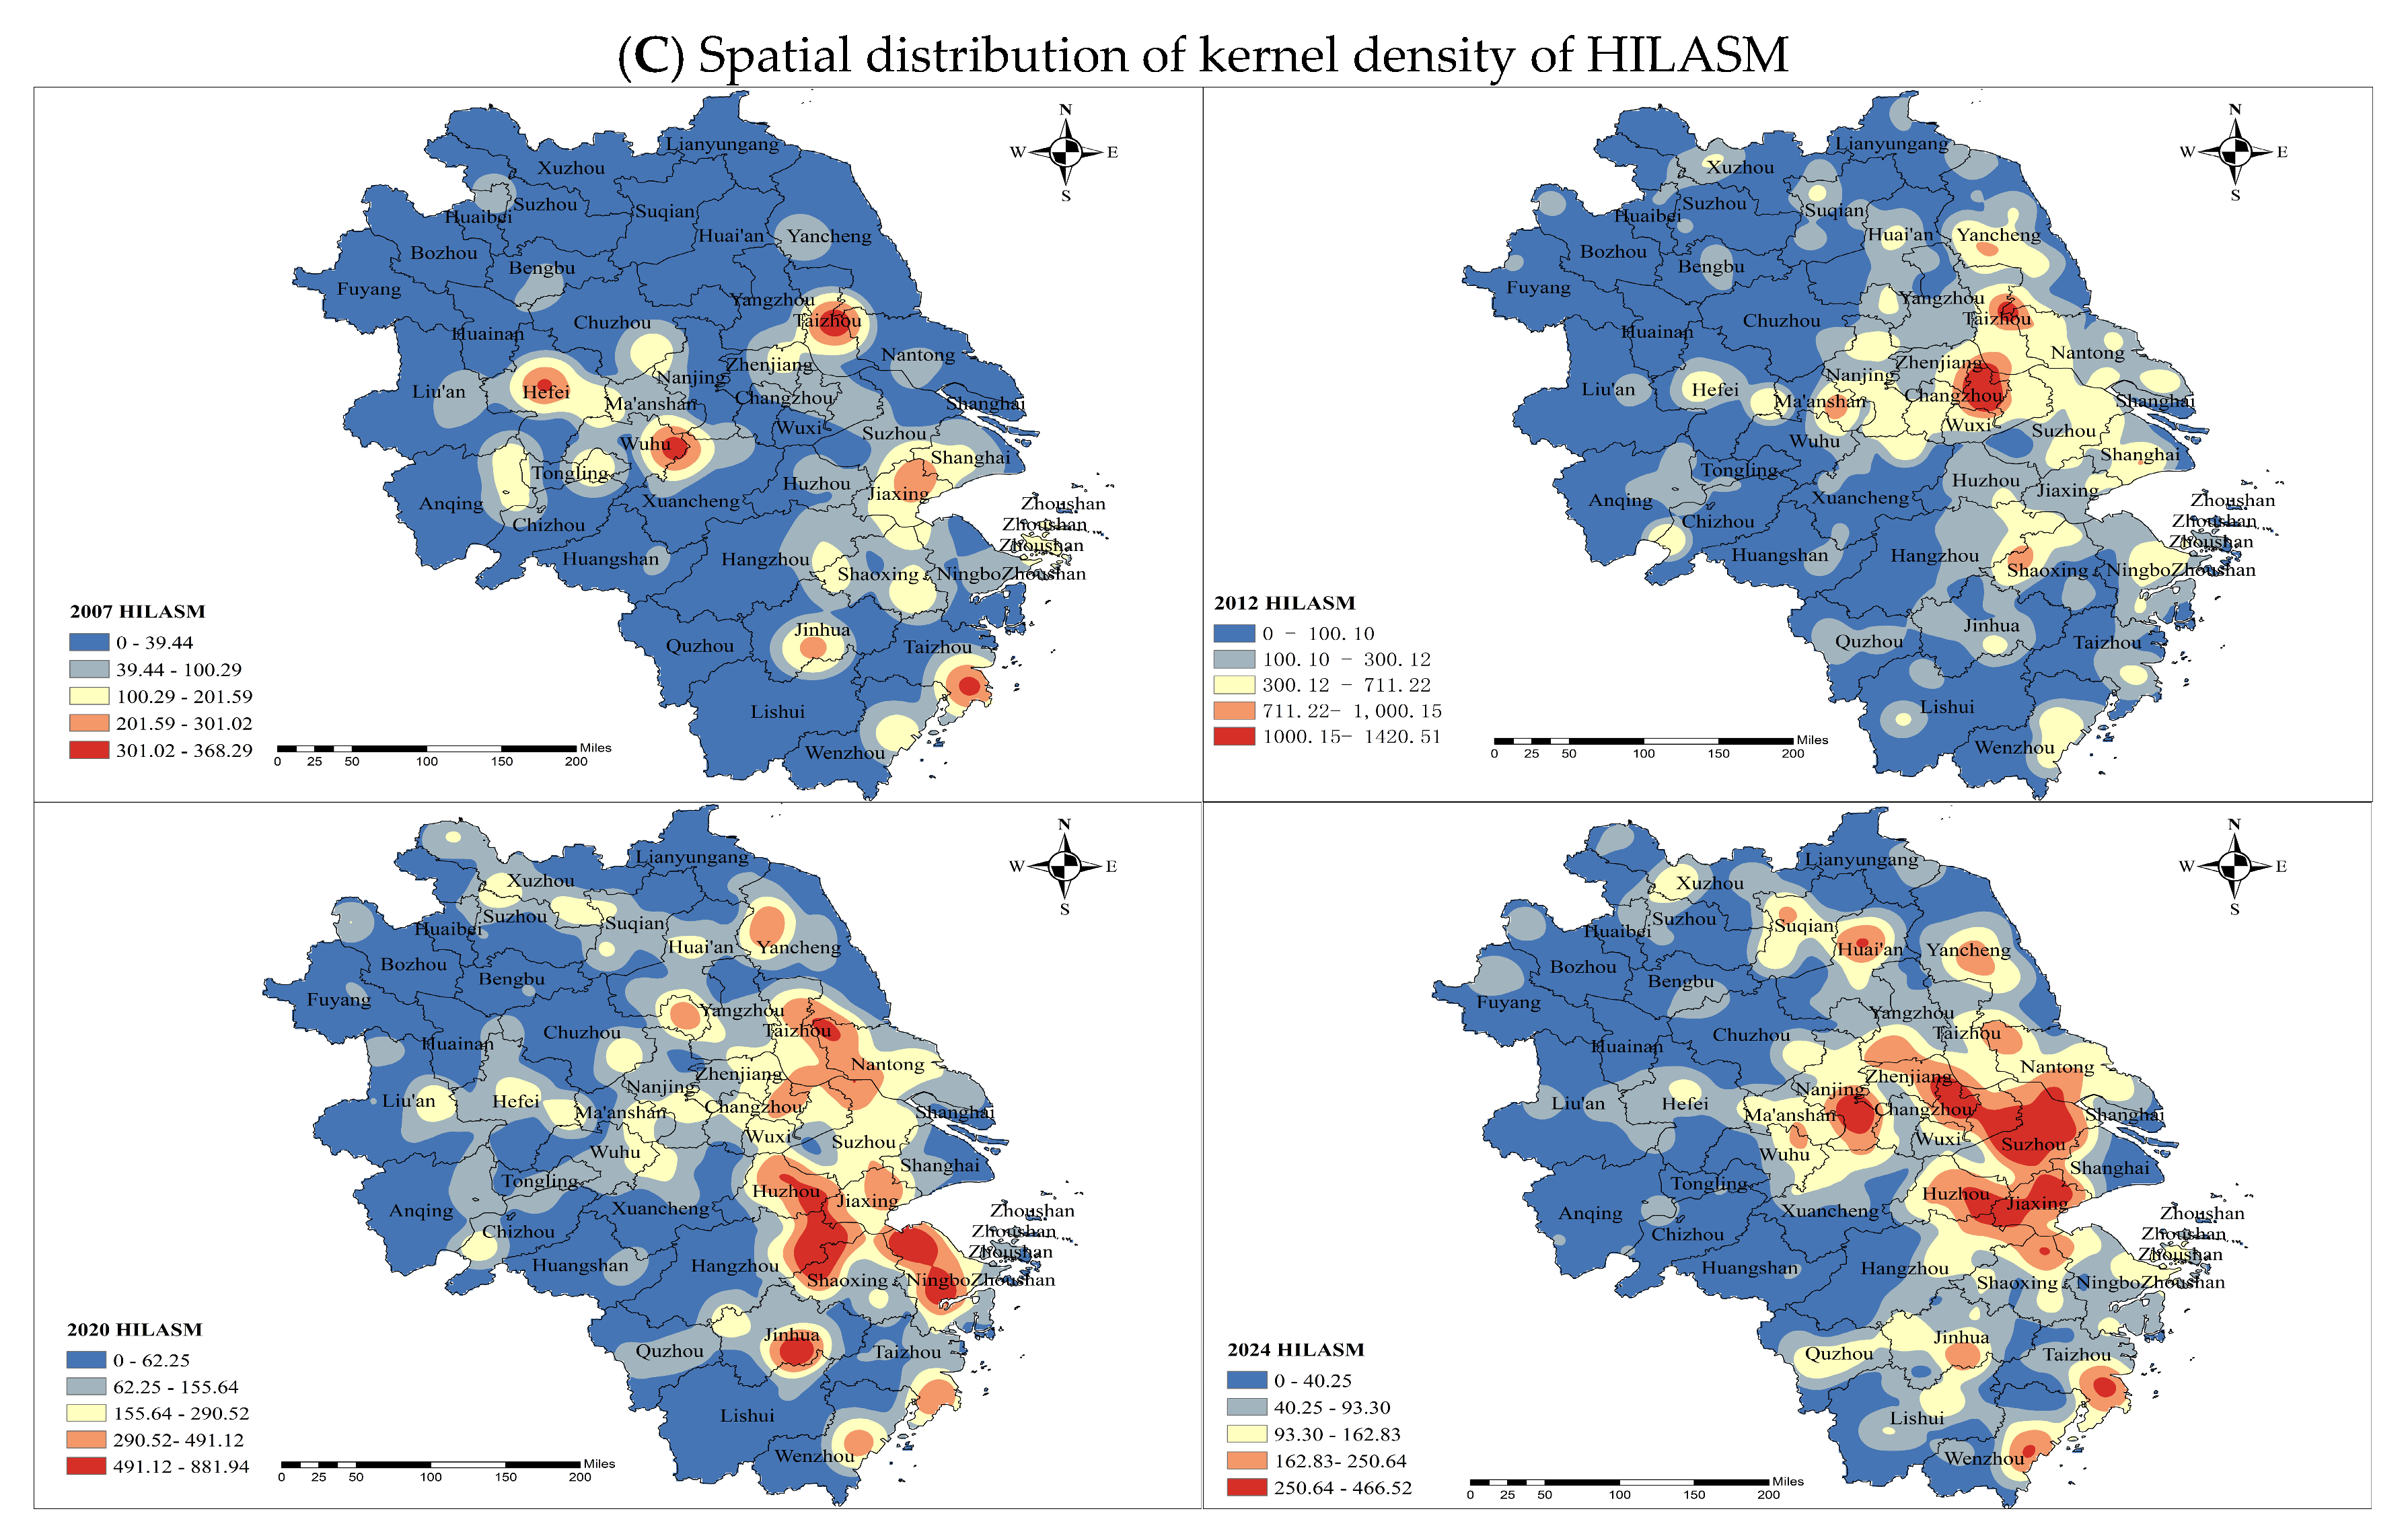
The KDE method was employed to further explore the spatial agglomeration centers and intensities of ILASM, including TILASM and HILASM (Figure 5). Overall, from 2007 to 2024, the spatial agglomeration intensity of ILASM gradually increased, with its spatial distribution pattern transitioning from a multi-core dispersed pattern to a multi-core contiguous development (Figure 5A). During the study period, the spatial distribution pattern of TILASM evolved from a three-core dispersed structure to a multi-core linkage, before reverting to a multi-core dispersion. This evolution reflects a gradual shift of the agglomeration center from the eastern coastal region toward the central inland region (Figure 5B). This evolution is mainly due to the national policies introduced in 2010 and 2021, which systematically promoted the industrial transfer from eastern China to the central region and implemented tilted land quota policies. From 2007 to 2024, the spatial pattern of HILASM evolved from a single-core dispersed pattern to a multi-core connected clustering (Figure 5C). Overall, it exhibited a pronounced spatial agglomeration trend toward the economically advanced southeastern coast of the YRD, while the spatial influence of high-density agglomeration areas progressively extended across provincial boundaries. This may be attributed to China’s elevation of the integrated development of the YRD to a national strategy in recent years, which has prioritized the development of coastal high-tech industries and strategic emerging industries with the aim of building a nationally advanced manufacturing hub and world-class industrial clusters. In summary, ILASM, TILASM, and HILASM generally exhibit a tendency of spatial evolution from dispersion toward agglomeration. The sole exception occurred in 2024, when TILASM displayed a modest tendency toward dispersion, whereas both ILASM and HILASM consistently transitioned from a spatial pattern of dispersion to contiguous agglomeration.

5.3. Assessment of the Drivers of ILASM

In this section, the RF model is employed to identify the relative importance of the driving factors influencing ILASM in the YRD, thereby revealing the complex relationships between the key influencing factors and ILASM. Although the RF model can inherently alleviate multicollinearity, it cannot completely eliminate its potential effects. Therefore, a multicollinearity assessment was first conducted for all driving factors. To ensure the rigor of the analysis, this study adopts the Variance Inflation Factor (VIF) to screen the driving factors. A VIF value below 10 indicates the absence of multicollinearity among variables. In addition, the predictive performance of the RF model was evaluated using three indicators: RMSE, MAE, and R2. Generally, lower RMSE and MAE values, together with a higher R2 value, indicate better model estimation accuracy. In summary, this study establishes a VIF-RMSE trade-off analysis framework for variable screening (Table 2). When ILASM is used as the dependent variable, the VIF values of all explanatory variables are below 10, indicating that no significant multicollinearity exists among variables. Meanwhile, the coefficient of determination R2 reaches 0.867, suggesting that the selected driving factors explain 86.7% of the variation in ILASM. When TILASM is used as the dependent variable, the VIF values of per-capita GDP (PGDP) and government intervention (GI) exceed 10, indicating substantial multicollinearity involving these variables. When they are removed (Column 2), the model performance declines, whereas the VIF values of the remaining variables remain within a reasonable range. The R2 value of 0.682 indicates that the retained variables explain approximately 68.2% of the variation in TILASM. When HILASM serves as the dependent variable, the VIF values of slope proportion (SP), total water resources (WR) and government intervention (GI) exceed 10, revealing multicollinearity among these variables and the remaining explanatory variables. After removing the above three variables, the VIF values of all remaining variables are within a reasonable threshold. Although the model performance decreases slightly, the retained variables still explain more than 70% of the variance in HILASM.
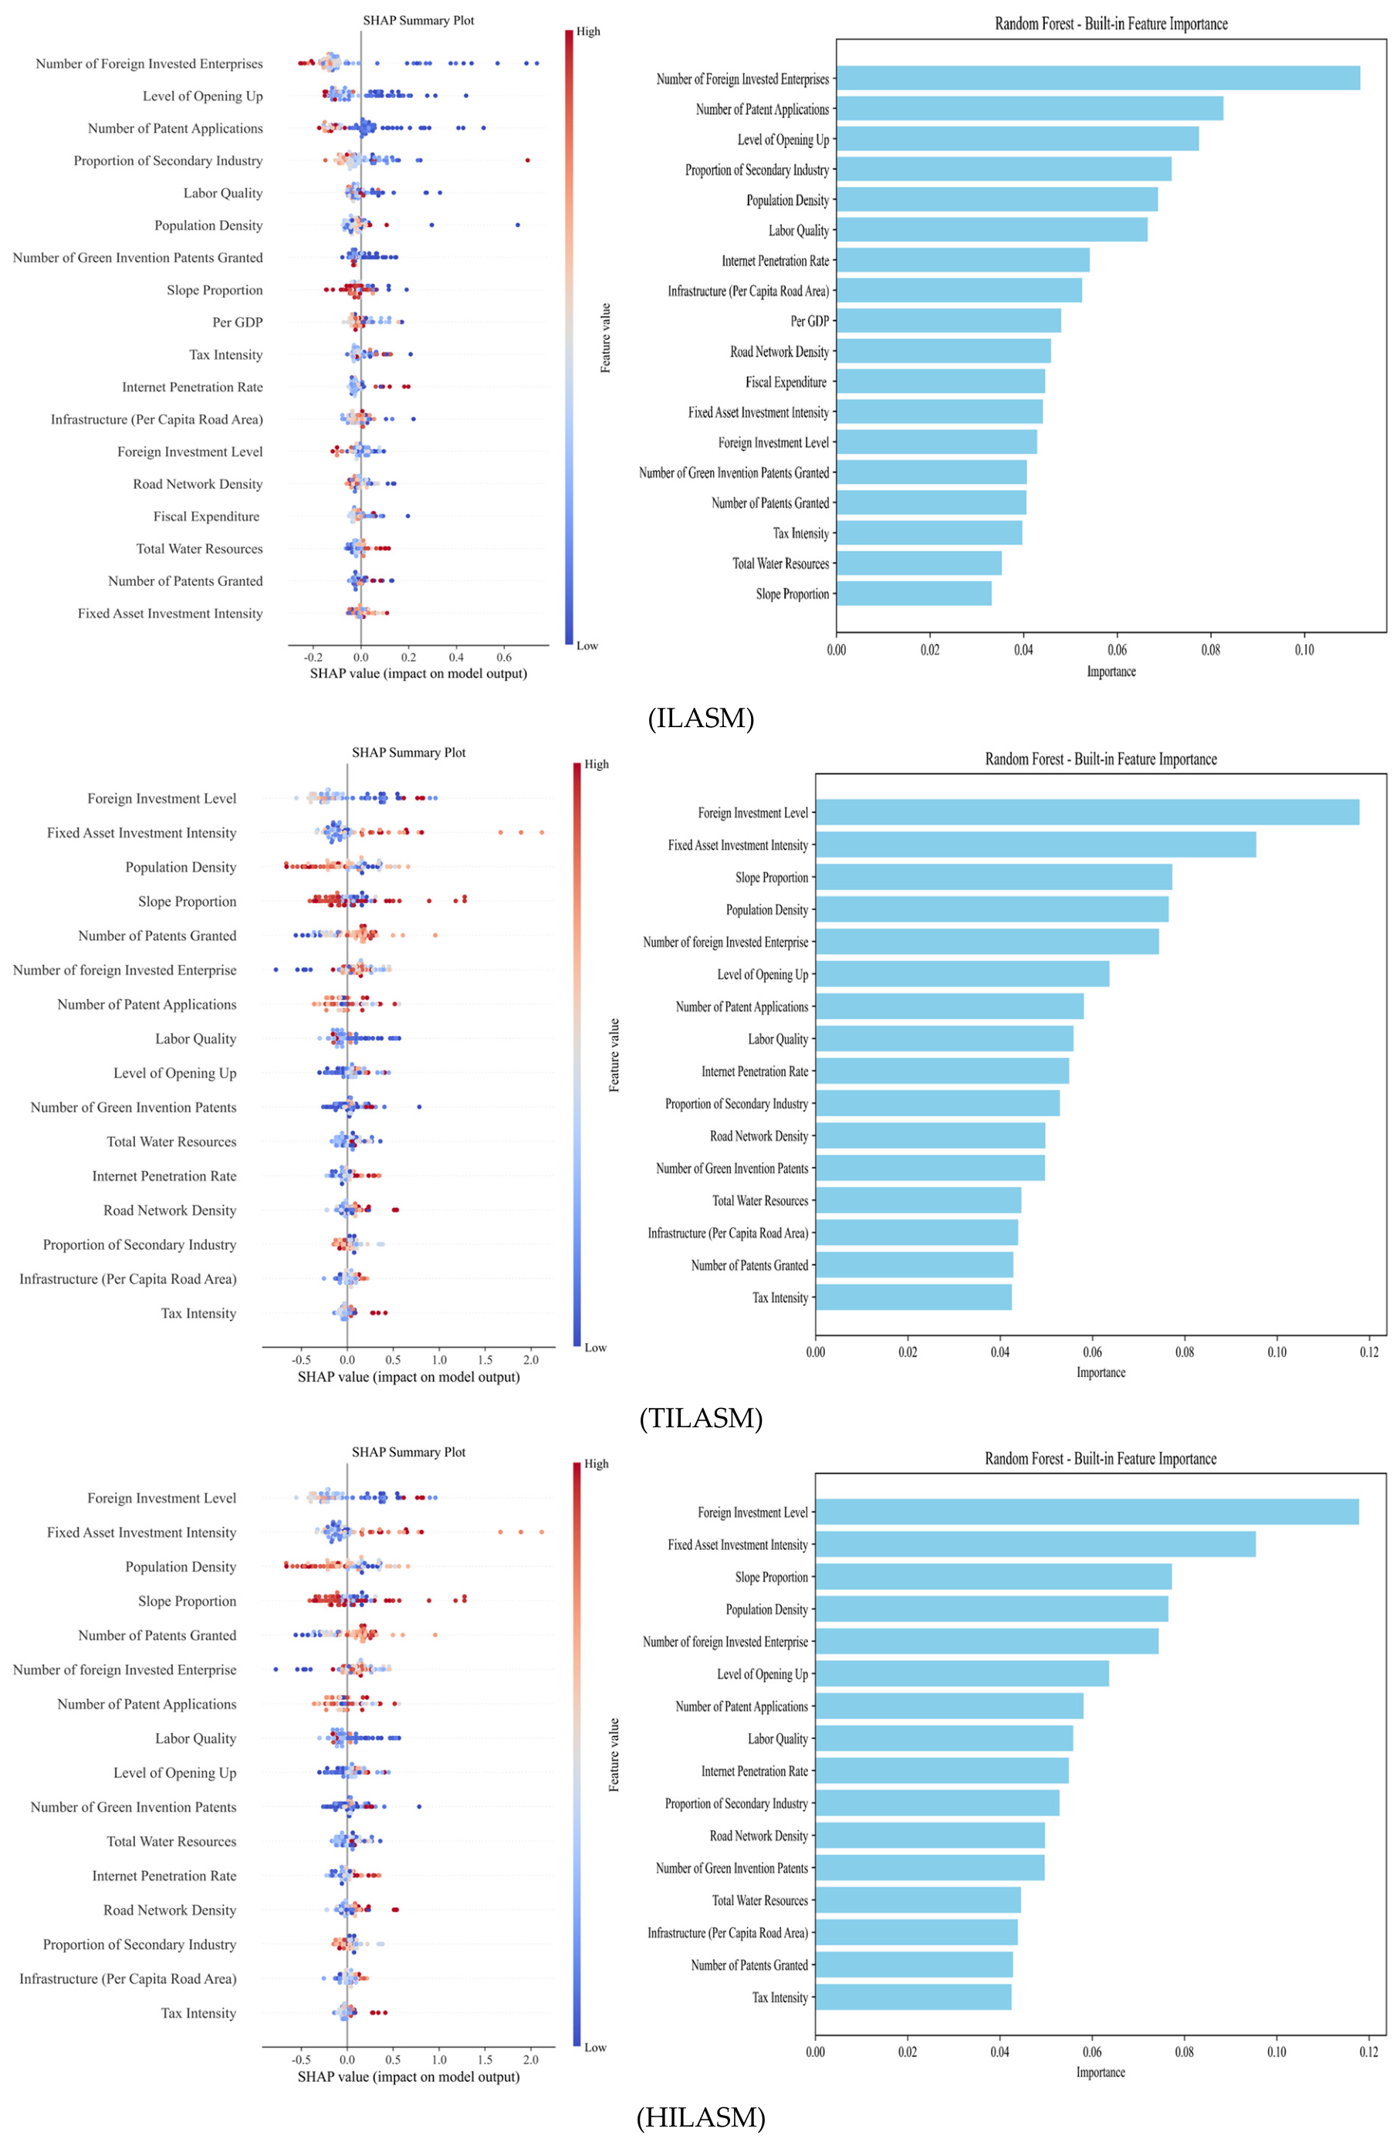
This study further applies the feature importance measure of the RF model to evaluate the influence degree of each driving factor (Figure 6). We trained regression models for ILASM, TILASM and HILASM. Meanwhile, the hyperparameters, including ntree and mtry, were optimized to improve the accuracy of the importance evaluation. The results show that the importance ranking of driving factors differs significantly among ILASM, TILASM, and HILASM. Specifically, economic development, the innovation environment and the social environment exert strong influences on ILASM. For TILASM, economic development, natural conditions and the social environment are the dominant driving dimensions. In contrast, HILASM is primarily influenced by economic development, infrastructure and the innovation environment. In summary, economic development level is the dominant factor driving ILASM.
Furthermore, we used five-fold cross-validation to determine the number of key driving factors. The results show that the prediction error is minimized when the eight most important variables are retained. Specifically, the key driving factors for ILASM are NFE, PA, OPL, PSI, PD, LQ, IPR and PCRA. For TILASM, the key driving factors include FIL, FAII, SP, PD, NFE, OPL, PA and LQ, whereas those for HILASM are NFE, RD, LQ, PD, PA, OPL, PCRA and FIL. Overall, although the key driving factors differ across the three types of industrial land allocation spatial morphology, their relative importance remains largely consistent. Among these factors, economic development variables, particularly NFE and FIL, exert relatively strong influences on ILASM, TILASM and HILASM. In contrast, social environment variables, including LQ and OPL, have a relatively mild influence on them.
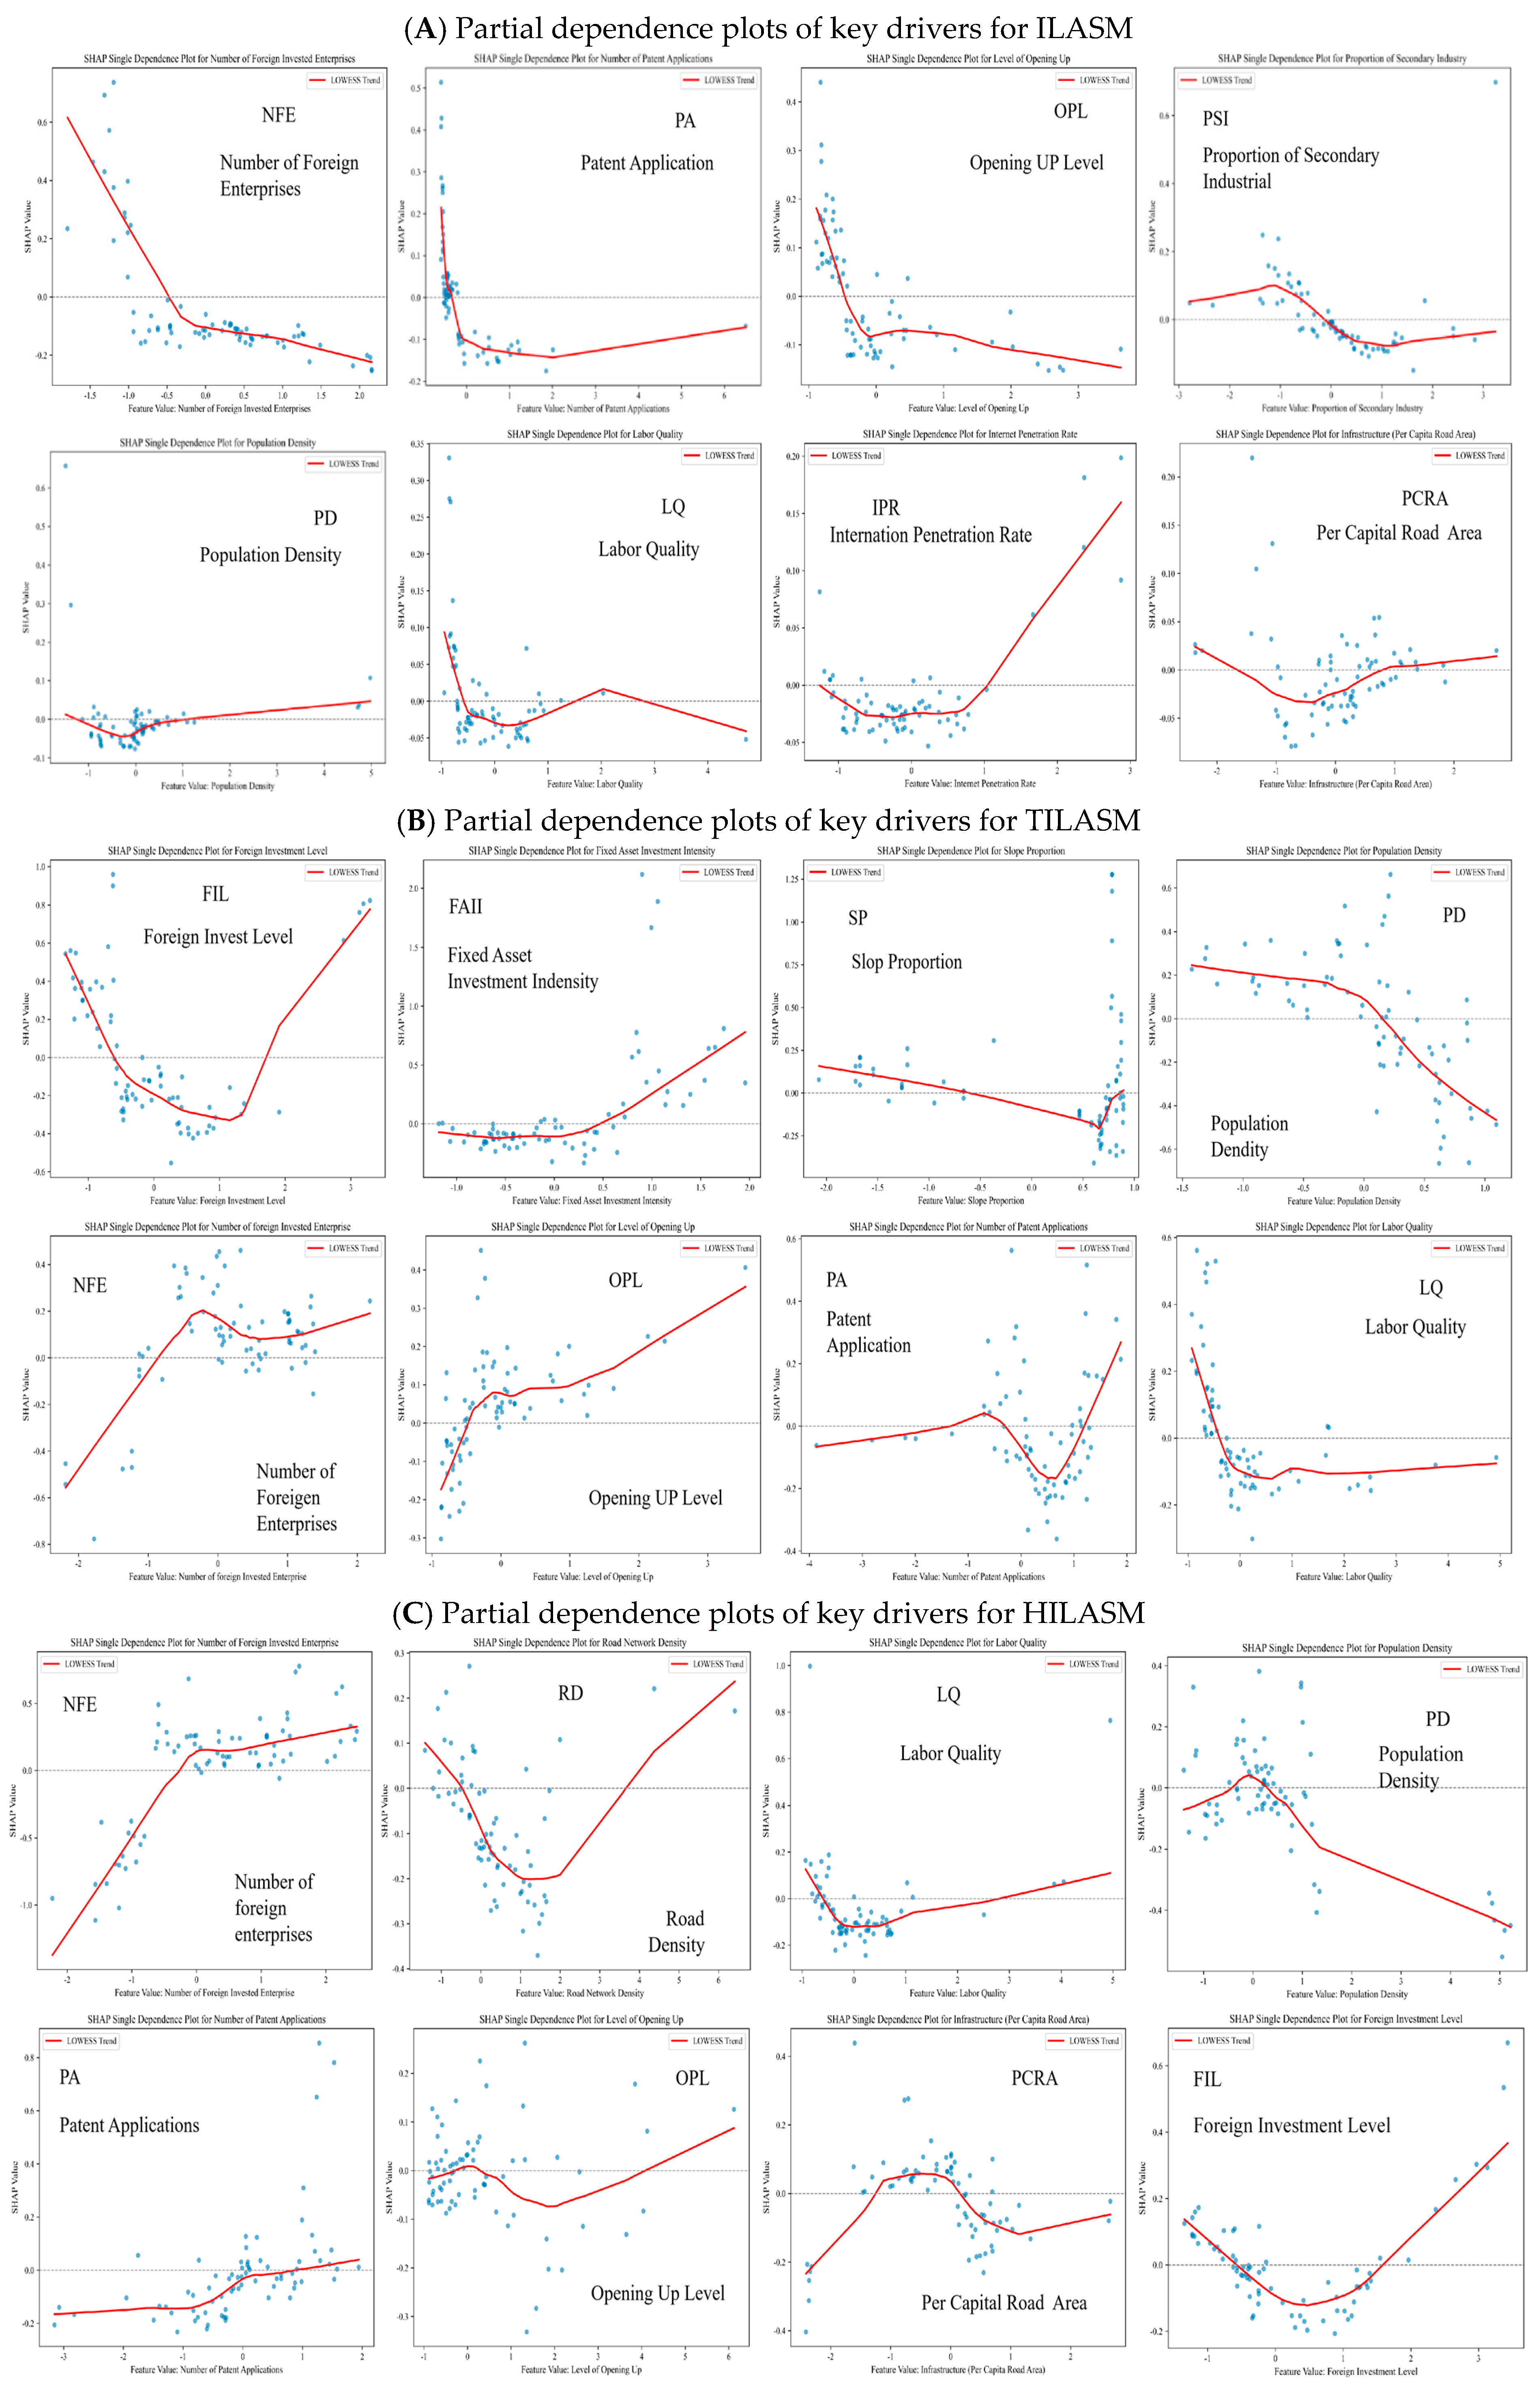
Although the RF model can rank the relative importance of the driving factors, it cannot explicitly characterize the relationships between the driving factors and the dependent variable. Therefore, we apply the dependence plots to investigate the impacts of the key driving factors on ILASM, TILASM and HILASM, thereby revealing their complex relationships. Compared with traditional regression models, which are generally limited to capturing linear relationships between explanatory and dependent variables, the partial dependence plots generated by the RF model can identify more complex linear relationships. As shown in Figure 7, the peaks on the X-axis represent the data distribution pattern of each key driving factor, with denser peaks indicating a higher concentration of data points. The Y-axis denotes the marginal effect of the key driving factors on ILASM, TILASM and HILASM, whereas the LOWESS trend refers to the locally weighted smoothing trend line.
As shown in Figure 7A, NFE exhibits an approximately linear negative relationship with ILASM, indicating that an increase in the number of foreign-invested enterprises is associated with a continuous increase in the dispersion degree of ILASM. In contrast, the remaining influencing factors exhibit nonlinear relationships with ILASM. Specifically, PA, PD and IPR exhibit U-shaped relationships, with the curve fluctuating—first in decline and then upward. Moreover, OPL, PSI and PCRA show N-shaped nonlinear relationships with ILASM. As their values increase, the positive effects gradually diminish and eventually become negative, with the strongest inhibitory effects occurring within the moderately low range. However, as these variables continue to increase, their effects gradually shift back to positive, resulting in a weak promoting effect at relatively high levels.
Figure 7B shows that NFE and FAII exhibit an approximately linear relationship with TILASM and exert a positive effect. The relationships between FIL, SP, and TILASM present a U-shaped pattern of “first inhibition, then promotion”. Specifically, when FIL is at relatively low levels, it exerts a significant negative effect on TILASM. However, once FIL was attained, its effect becomes positive. This result reveals that the influence of foreign investment exhibits a clear threshold effect. PA and LQ exhibit N-shaped nonlinear relationships with TILASM. Specifically, when the number of patent applications and the level of human capital are at low levels, they exert a significant negative inhibitory effect on TILASM. However, as these indicators increase, the inhibitory effect weakens rapidly and is replaced by a positive promotion. Then, at relatively high levels, the positive effect slightly declines and shows a sustained positive effect. OPL has an approximately linear positive relationship with TILASM. As the level of openness rises, it exerts a significant positive effect on TILASM. SP and PD exhibit an approximately linear negative relationship with TILASM.
As shown in Figure 7C, NFE and PA show an approximately linear positive relationship with HILASM. In other words, the number of foreign-funded enterprises and the number of patent applications can promote the development of HILASM. In contrast, PD exhibits an approximately linear negative relationship with HILASM. That is, as population density increases, the agglomeration degree of high-tech industrial land allocation declines. Furthermore, RD, LQ and FIL present a nonlinear U-shaped relationship with HILASM. That is, at low levels of road density, human capital, and foreign investment, these variables exert a negative inhibitory effect on the spatial agglomeration level of HILASM. Once they exceed a certain threshold, a positive effect becomes significant. OPL and PCRA exhibit a nonlinear N-shaped relationship with HILASM. That is, with increasing levels of openness and improvements in infrastructure, their impacts initially promote, then inhibit, and finally promote the spatial morphology of HILASM again.
In summary, although different types of industrial land allocation morphology share some common key driving factors, their effect magnitudes and directions differ significantly.

5.4. Spatial Non-Stationary Analysis of the Key Drivers of ILASM

To accurately characterize the spatial heterogeneity of key driving factors affecting ILASM, TILASM, and HILASM, this study employs a comparative regression analysis using the GWR and MGWR models (Table 3). The findings indicate that the AICc statistic of the MGWR model is significantly lower than that of the GWR model, while its R2 value is higher. These results suggest that the MGWR model provides a superior fit and is therefore the preferred model for subsequent analyses.
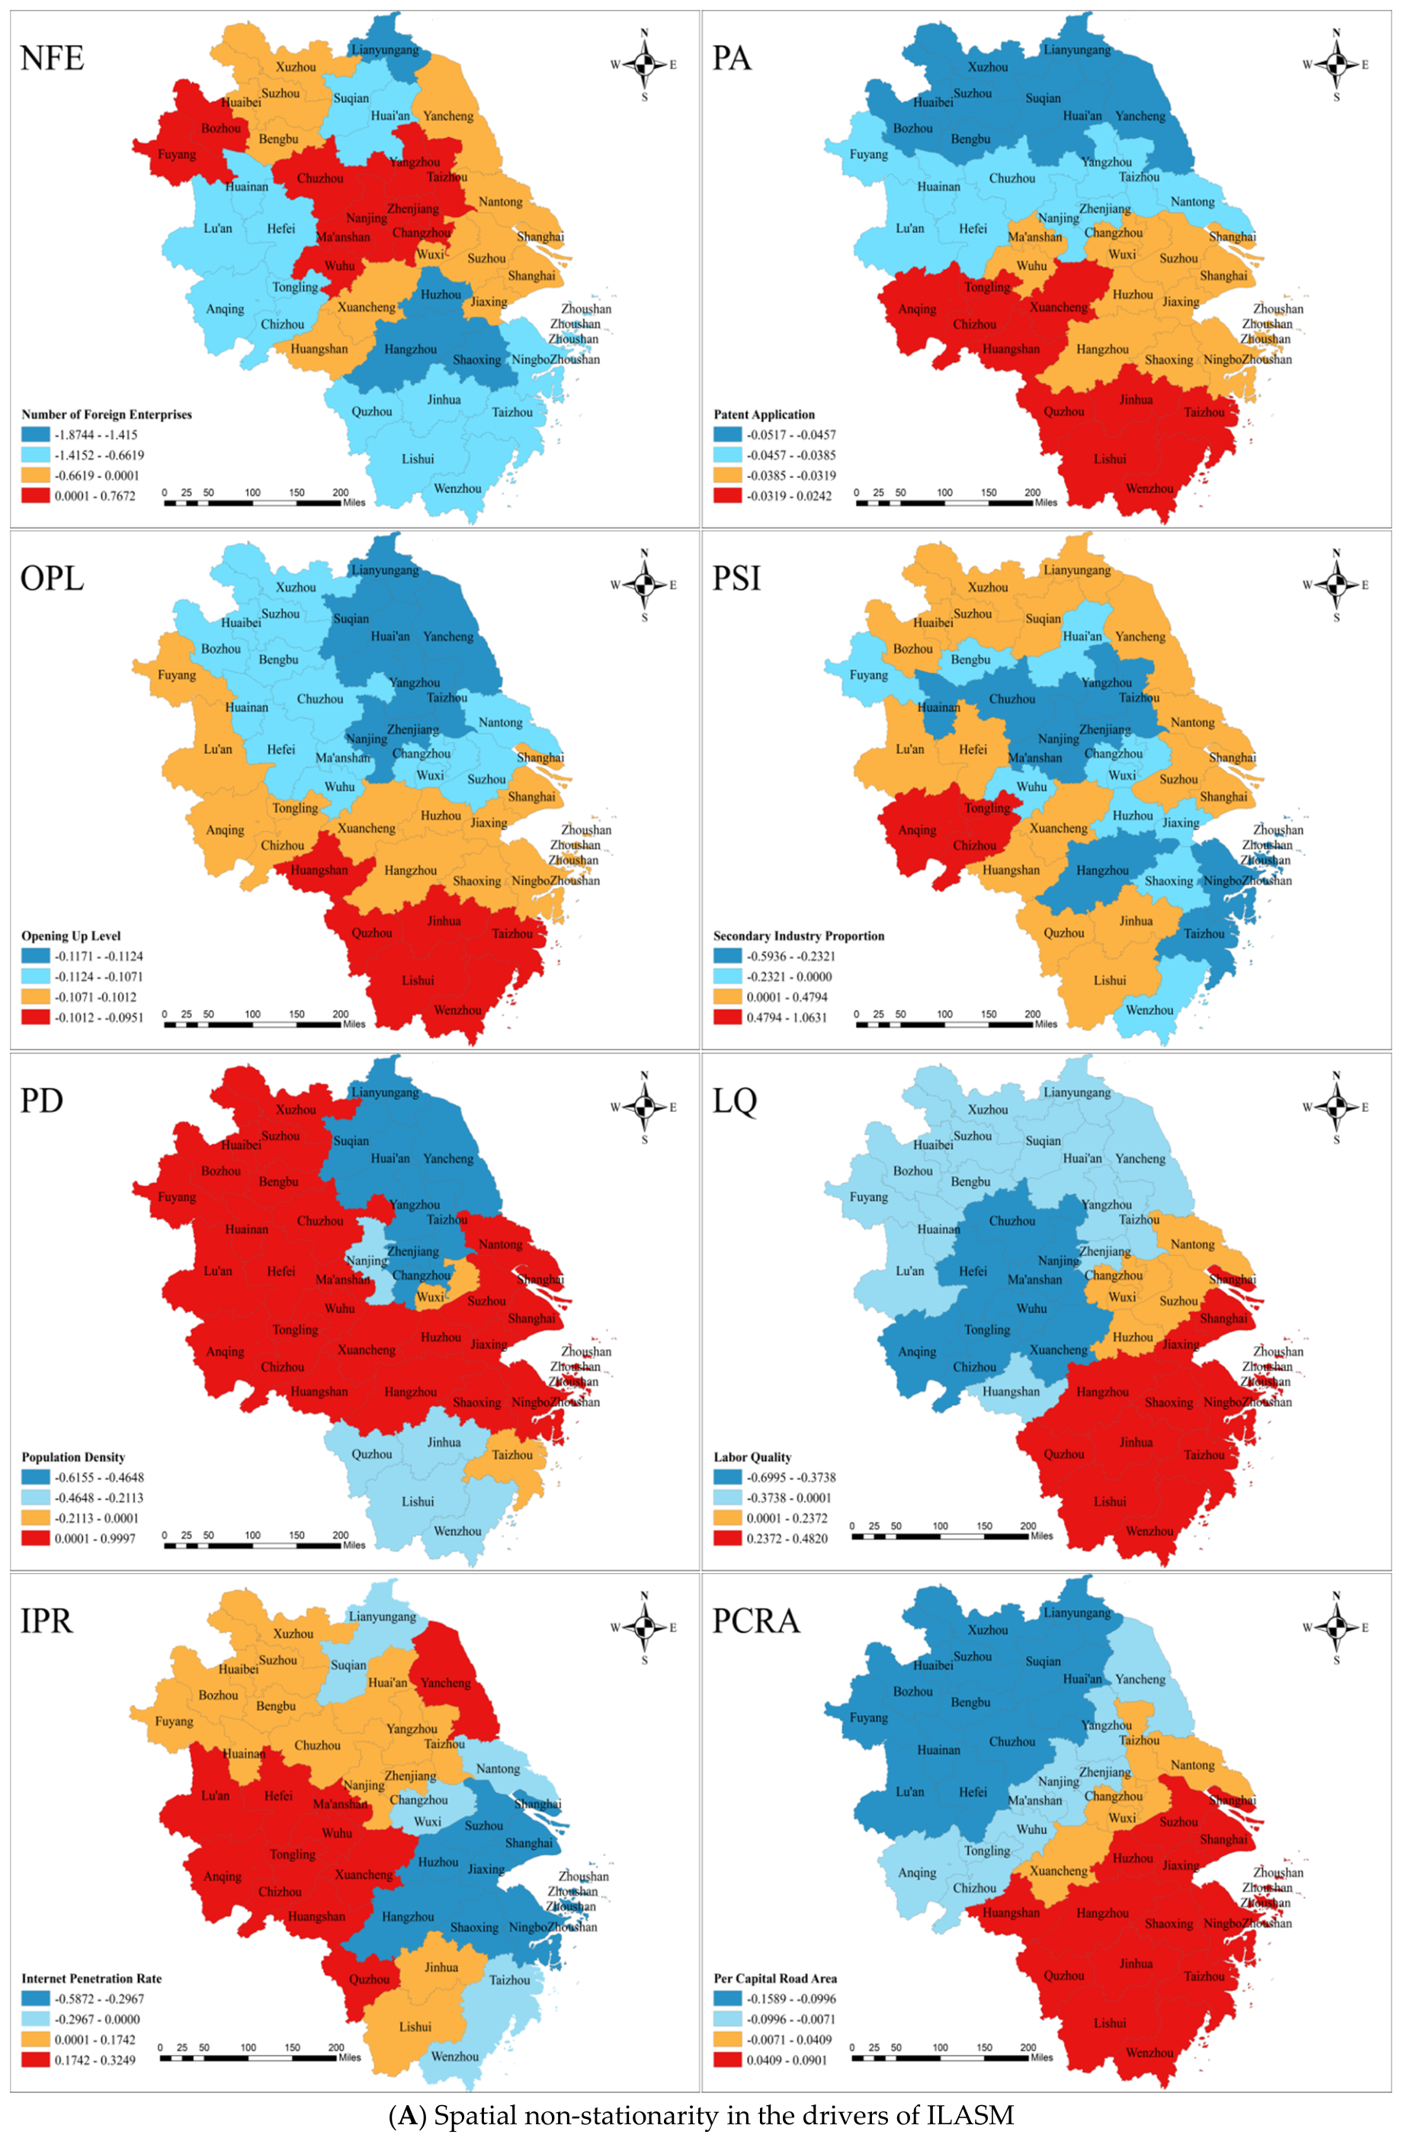
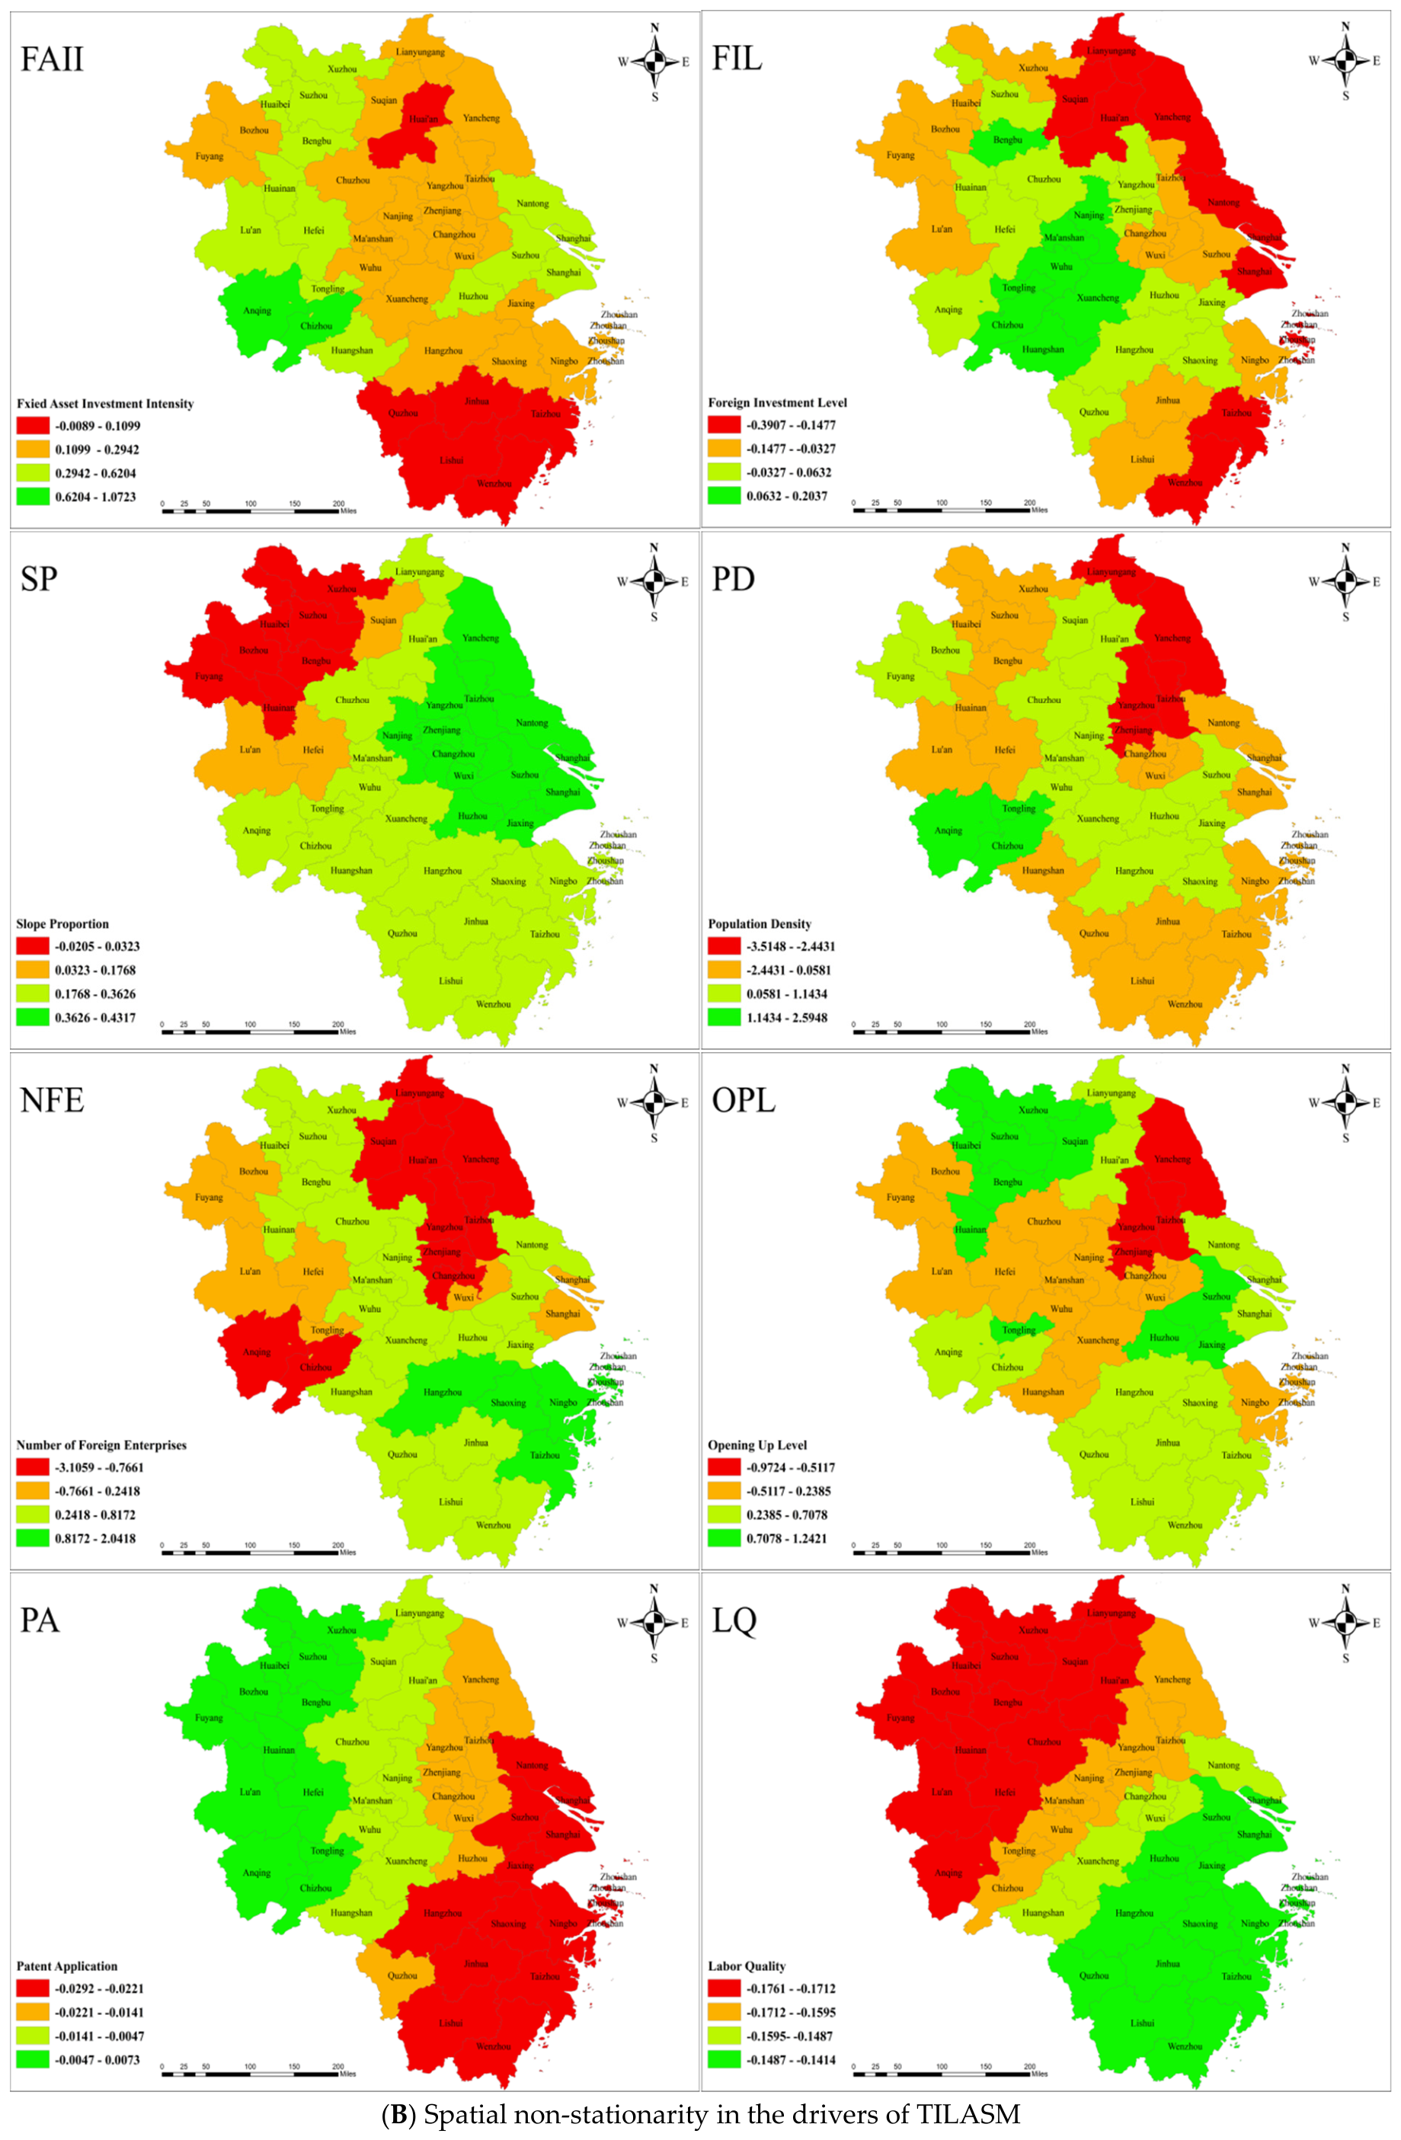
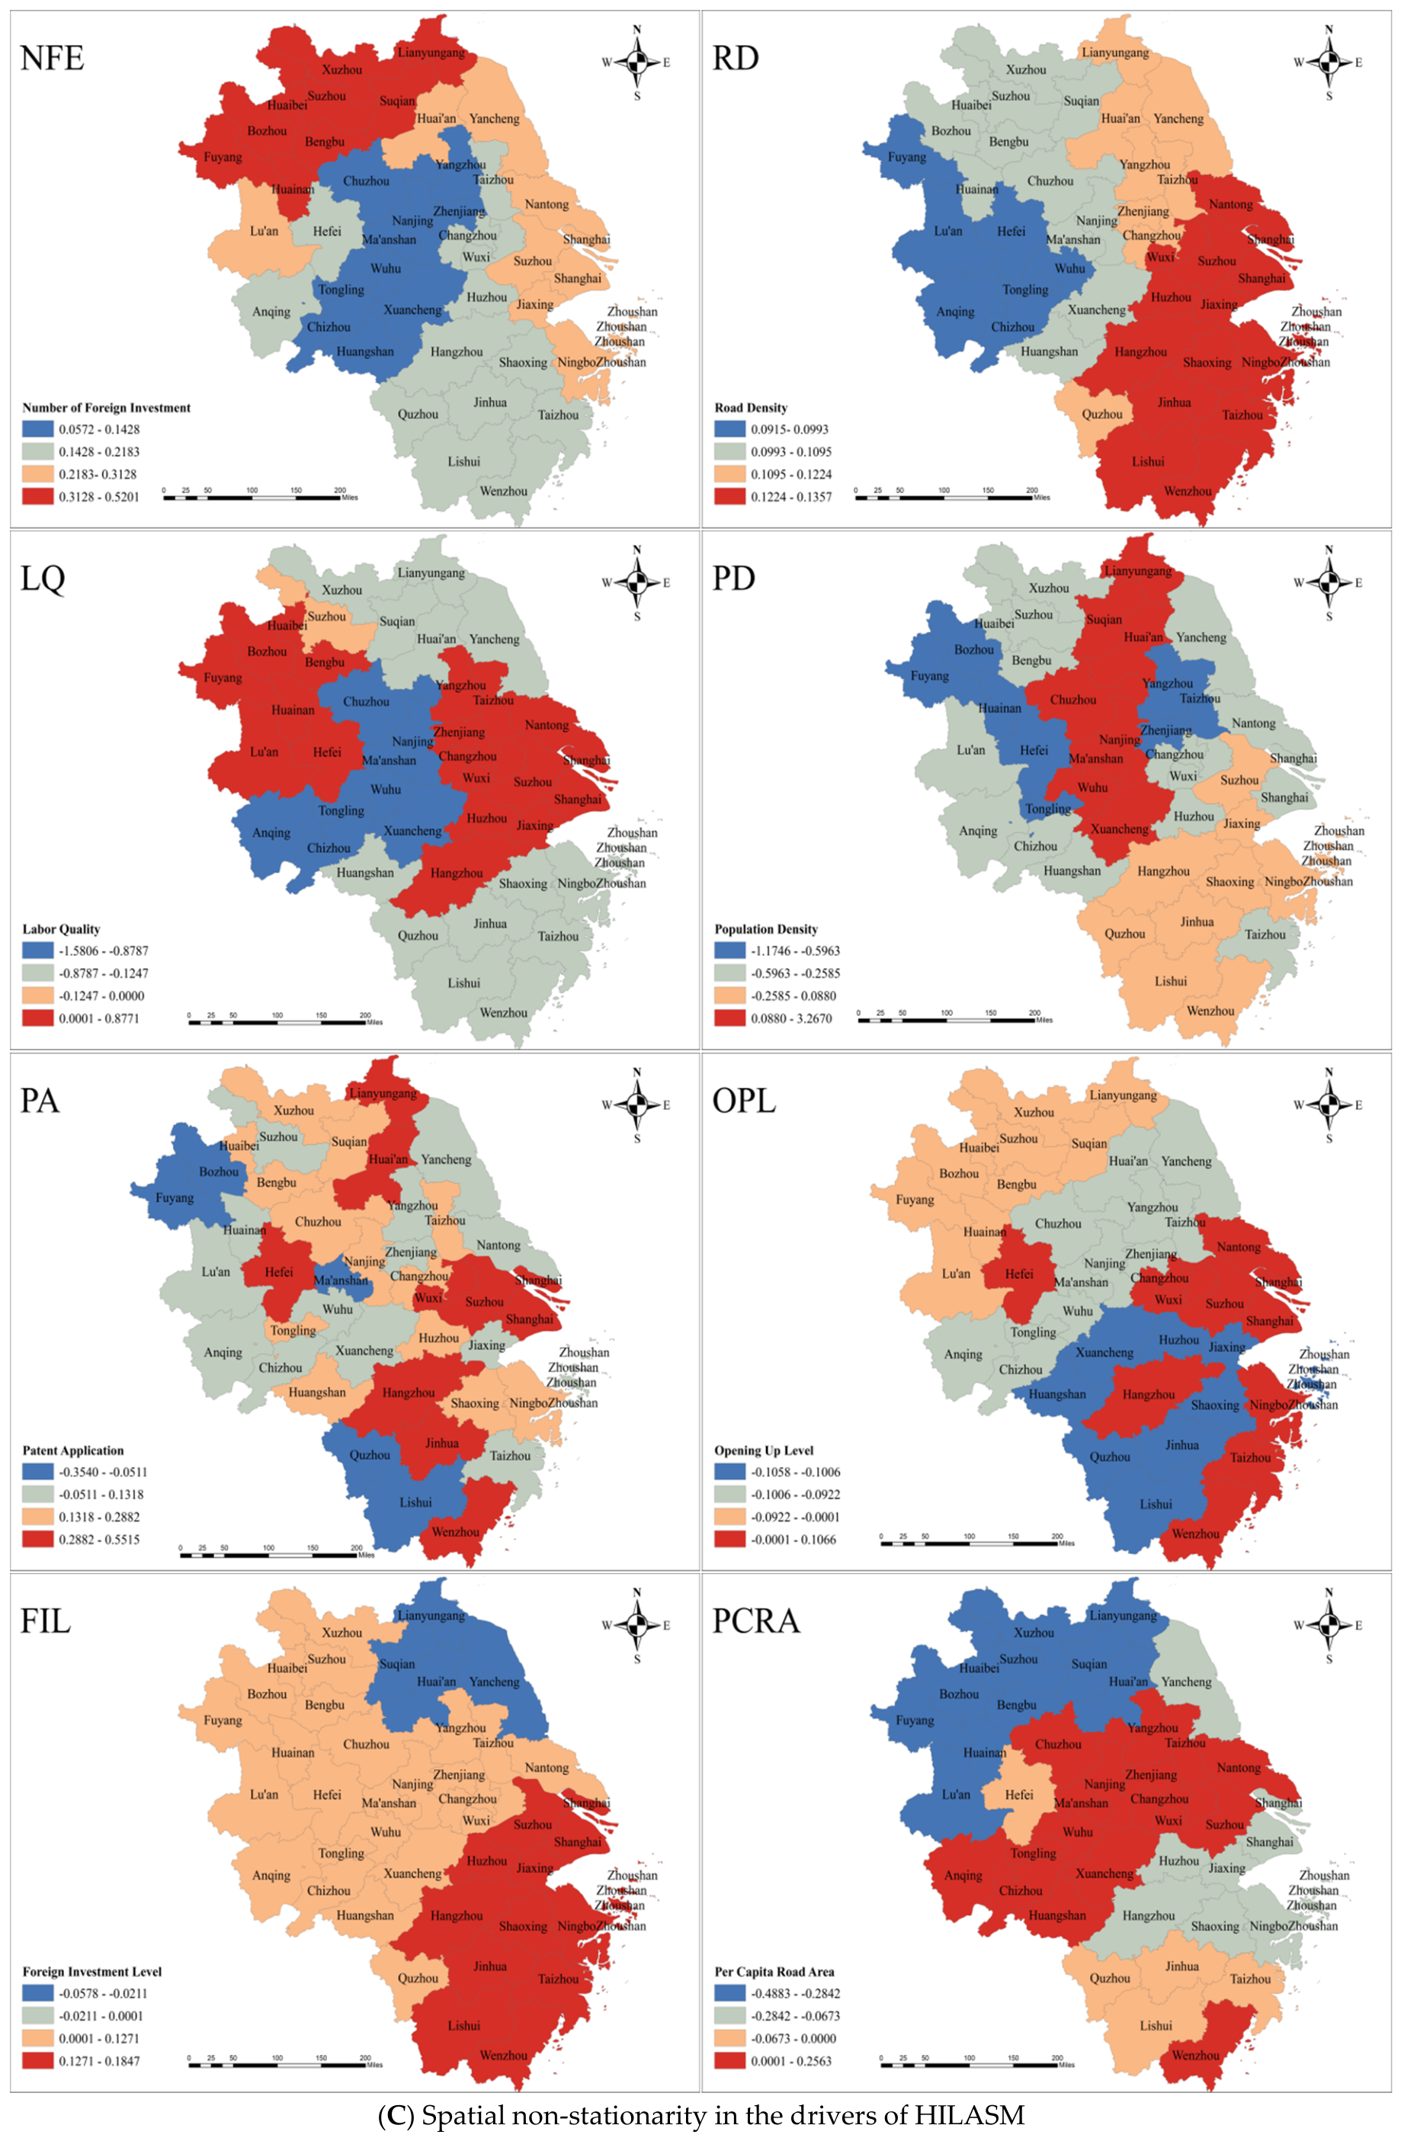
Based on the key driving factors of ILASM, TILASM and HILASM, this study finds that their effects exhibit significant spatial gradient effects and regional heterogeneity patterns (Figure 8). Overall, the spatially non-stationary effects exhibit systematic variations along both the latitudinal and longitudinal directions. Furthermore, we find that the impacts of the driving factors derived from the MGWR regression are generally consistent with those identified by the RF model, which further supports the robustness and reliability of the results.
As shown in Figure 8A, when the explained variable is ILASM, NFE exerts an inhibitory effect on ILASM, showing a distinct core–periphery spatial gradient pattern characterized by higher values in the central region and lower values in peripheral areas. Moreover, the influence in the central region shifts from negative to positive. This is because the high-value regions include Nanjing, Chuzhou, Ma’anshan, Wuhu, and Changzhou, which together constitute the first inter-provincial metropolitan area in China. They exert a siphon effect on surrounding areas by virtue of their policy advantages, thereby facilitating the spatial agglomeration of industrial land allocation within the region. The influence of PA, OPL, and PCRA exhibits a distinct spatial pattern of “high—north, low—south.” In particular, PCRA exerts a positive effect in the southern region, indicating that in the more economically developed areas of the YRD, improved infrastructure can better promote the spatial agglomeration of industrial land allocation. Conversely, the persistently lagging infrastructure in relatively underdeveloped regions makes it difficult to form spatially agglomerated patterns of industrial land allocation. LQ shows a spatial gradient extending from northwest to southeast, gradually shifting from a negative effect to a positive effect. The southeastern part of the YRD, including Shanghai, Wenzhou and Hangzhou, boasts strong economic, industrial, and educational foundations. These distinct advantages help them to maintain a competitive advantage in attracting skilled labor. Consequently, the continuous improvement of human capital yields a more positive marginal effect than in other regions, thereby promoting the continuous optimization of the spatial pattern of industrial land allocation. The impact of PSI on ILASM exhibits spatial heterogeneity, characterized by negative effects in inland areas and positive effects along the Yangtze River. This is mainly because Shanghai, Suzhou, Wuxi and Changzhou have entered the post-industrialization stage, with manufacturing transforming toward high-end and intelligent development. Industrial land has consequently shifted from “incremental expansion” to “stock quality improvement,” while the rising proportion of the secondary industry has continuously increased the demand for spatially agglomerated industrial land layouts, thereby generating a positive driving effect. In recent years, inland areas have undertaken a large number of heavy industrial transfers from regions along the Yangtze River, which have exerted a negative impact on the spatial agglomeration of industrial land allocation in the short term. In addition, ecological function zones such as Anqing and Chizhou are strictly constrained by ecological red lines, cultivated land protection, and negative lists for industrial access. Most small and medium-sized enterprises engaged in light industries, such as tea and polygonatum production, are concentrated near raw material production areas, thus exerting a positive effect on ILASM. The high positive effect zones of PD and IPR on ILASM largely overlap, with both concentrated in Anhui, whereas the high negative effect zones exhibit clear spatial divergence, characterized by “PD in northern and central Jiangsu, IPR in southern Jiangsu and northeastern Zhejiang”. Anhui is in a stage of accelerated industrialization, where rising population density and improved infrastructure can both promote the spatial agglomeration of industrial land allocation. In contrast, southern Jiangsu and northeastern Zhejiang are in the late stage of industrialization, where increases in population density and infrastructure primarily serve the development of the tertiary sector, resulting in weakened or even negative agglomeration effects on industrial land allocation.
When the explained variable is TILASM (Figure 8B), its key driving factors include FIL, FAII, SP, PD, NFE, OPL, PA, and LQ. Specifically, the influence of FIL on TILASM displays a distinct spatial gradient: its positive effect progressively diminishes from the southwest toward the northwest, eventually shifting into a negative impact. Notably, the areas of positive influence are predominantly concentrated within the Nanjing Metropolitan Area and its vicinity. Owing primarily to variations in industrial structure, Nanjing has assumed a leading role in coordinating cross-provincial allocation of industrial land quotas and co-constructing industrial parks, exemplified by the Suzhou–Chuzhou Industrial Park, Nanjing–Ma’anshan Industrial Park, and Nanjing–Wuhu Industrial Corridor. The implementation of foreign-invested projects directly drives both the incremental supply of traditional industrial land and the revitalization of existing parcels, thereby fostering the spatial agglomeration of traditional industrial land allocation. By contrast, Shanghai, the central of Jiangsu and Zhejiang Province are characterized by the predominance of new energy sectors and other emerging industries. The trajectory of incremental foreign investment has decoupled from the demand for traditional industrial land. Only a limited number of foreign-invested industrial parks occupy marginal portions of such land, resulting in significant negative effects. The influence patterns of FAII and NFE exhibit opposite spatial characteristics between the north and the south. The negative effect of FAII gradually weakens from south to north, while the negative effect of NFE gradually weakens from north to south. PD exhibits a core–periphery spatial gradient, shifting from a positive effect to a negative effect. This is attributed to disparities in industrial development stages; Anhui is undergoing an accelerated phase, characterized by labor-intensive industries as it undertakes traditional industrial transfers from the eastern regions. By contrast, Jiangsu, Zhejiang and other developed provinces have entered the late stage of industrialization, dominated by capital-intensive and technology-intensive sectors. OPL presents a spatial pattern of positive effects in the north and south, but negative effects in the central region. This may be because the economic development level of northern and central Jiangsu is relatively low, and the level of openness is still dominated by low-value, labor-intensive processing industries, which are scattered across township industrial parks and are therefore unlikely to achieve contiguous development. However, cities in southern Jiangsu, including Suzhou, Wuxi, and Jiaxing, constitute the core manufacturing clusters of the YRD. The continuous improvement in the level of openness has directly attracted capital-intensive, foreign-funded projects, such as electronic information and equipment manufacturing, and has facilitated the early formation of industrial agglomeration areas, including national-level development zones and bonded zones. LQ shows a distinct spatial gradient, with positive effects gradually strengthening from north to south. This negative impact substantiates the rationale of “replacing the old with the new” that underpins the economic restructuring. Elevated labor quality fosters a spatial displacement of low-end manufacturing through increasing wage costs and land-rent premiums, consequently attenuating the spatial agglomeration of traditional industrial land in more advanced regions. In addition, PA presents a spatial gradient in which its negative effect gradually weakens from south to north. Long-standing competition among local governments in China over industrial land transfer prices has resulted in different land allocation strategies across regions. This strategic difference has directly distorted industrial land price signals and reduced the spatial efficiency of land allocation. In other words, the regions with higher innovation capacity may fail to gain corresponding advantages in industrial land agglomeration; instead, persistently low-price land transfers have resulted in fragmented land use.
As shown in Figure 8C, the key influencing factors include NFE, RD, LQ, PD, PA, OPL, FIL, and PCRA. NFE exerts a positive influence on HILASM, with its impact being pronounced, in the northern and southern regions, while remaining comparatively weak. This phenomenon can be attributed to the deepening of global specialization and the intra-regional industrial gradient transfer within the YRD. As foreign-invested enterprises increasingly relocate large-scale manufacturing operations to peripheral areas with cost advantages, they simultaneously foster the agglomeration of high-tech industries’ land allocation. RD exhibits a progressively stronger positive effect on HILASM from north to south. Road density is a key factor influencing firms’ location choices. An increase in road density reduces transportation costs and facilitates factor mobility. Therefore, it promotes the spatial agglomeration of industrial land allocation. LQ exhibits positive effects in the core area of the YRD. The knowledge-intensive nature of high-tech industries entails a high demand for skilled labor. Regions with higher levels of human capital tend to attract the clustered location of firms, allowing them to benefit from human capital externalities and thereby promoting the spatial agglomeration of industrial land allocation.
However, negative effects are observed in northern Jiangsu Province and southern Zhejiang Province due to their relatively low human capital endowments. Meanwhile, the introduction of highly skilled labor may encounter a “maladaptation” dilemma due to the lack of complementary institutional and industrial support systems in these regions, which in turn inhibits the agglomeration of industrial enterprises. PD shows a core–periphery spatial differentiation, exerting a positive effect in the central region, but a negative effect in peripheral areas such as Shanghai and Ningbo. The interplay of moderate population density and industrial gradient transfer not only provides an ample pool of supporting labor but also enhances the cost-efficient absorption of manufacturing spillovers, thereby fostering the belt-shaped agglomeration of high-tech industrial land in Anhui. However, in the central regions of the YRD, exemplified by Shanghai and Nanjing, corporate headquarters and R&D functions dominate, whereas peripheral cities primarily undertake industrialization and production implementation tasks. This differentiated functional division impedes the positive impacts of quantitative population advantages on the agglomeration momentum of high-tech industrial land. PA is predominantly facilitative, exhibiting an east–west divergent pattern. High-value zones form an S-shaped belt centered around Hefei, Nanjing, Shanghai, and Hangzhou. The overall effect gradually weakens from this high-value belt toward both the eastern and western regions. The impact of OPL on HILASM shows a distinct core–periphery spatial differentiation pattern. Positive effects are observed in regions such as Hefei, Hangzhou, and Shanghai, while negative effects appear in the surrounding areas of these high-value zones. This is because higher levels of openness in economically developed regions exert a siphon effect on neighboring areas, leading to the dispersed locations of enterprises, thereby making it difficult to achieve the spatial agglomeration of high-tech industrial land allocation. FIL shows a spatial gradient in which the positive effect gradually diminishes from southeast to northwest. The impact of PCRA on HILASM shows that positive effects occur in the central “core belt” of the YRD, whereas negative effects gradually strengthen toward the north and south.

6. Discussion

6.1. Spatial and Temporal Evolution Characteristics of Industrial Land Allocation

This study finds that industrial land allocation in the YRD exhibits an overall agglomeration trend, extending from the west (slightly north) to the east (slightly south), with its spatial distribution center shifting along an inverted V-shaped trajectory. Specifically, traditional industrial land allocation gradually shifts from the eastern region to the central region, while high-tech industrial land allocation tends to concentrate from the central region toward the eastern region. This finding is consistent with the ongoing process of industrial restructuring and regional industrial relocation under the integrated development of the YRD [31]. Between 2007 and 2024, the spatial agglomeration of industrial patterns evolved from a multi-core dispersed configuration to a multi-core contiguous development pattern. This result diverges from the conclusions reported by Zeng et al. 2023 [62]. This divergence mainly stems from the variations in measurement indicators and methods. Furthermore, the spatial agglomeration patterns of high-tech land allocation reveal a transition from a single-core dispersion to a multi-core connected clustering. Although this result contrasts with the findings reported by [38], it is consistent with the research studies [45,63,64,65]. This can be attributed to two main factors. First, following the market-oriented reform of industrial land allocation in 2007, local governments encouraged enterprises to locate in regions with high industrial agglomeration, thereby reshaping the geographical distribution of newly established enterprises and optimizing the overall industrial spatial layout [6]. Second, the regional integration policy of the YRD has reduced inter-regional market barriers and facilitated the free flow of regional factors. The expanded product market and freer factor market have restructured the spatial pattern of industrial land allocation, driving its evolution from multi-core decentralization to contiguous agglomeration [66]. In comparison, tradition land allocation evolves from core dispersed to multi-core linkage, before reverting to a stage of multi-core dispersion. This dynamic is primarily driven by the industrial transformation and industrial spatial restructuring occurring within the core area of the YRD. The comparative advantages of traditional industries in core regions have generally diminished, driving their diffusion to peripheral cities with lower labor and land costs [45].

6.2. Driving Mechanism of ILASM

This study establishes a five-dimensional driving mechanism, including natural conditions, economic development, social environment, innovation environment and infrastructure. The integration of RF model with the MGWR model overcomes the limitations of traditional “black-box” models and static spatial regression models. Moreover, it enables a more accurate and comprehensive identification of the driving mechanisms underlying ILASM.
In this study, economic development plays a crucial role in shaping the driving mechanisms of ILASM, TILASM, and HILASM alike. This finding is largely consistent with those reported by Tan et al., 2024 [6] and Cheng et al., 2025 [10]. Nevertheless, this study reveals that NFE and FIL exert the most substantial influences on ILASM, TILASM and HILASM, surpassing the effects of PGDP and PSI. Specifically, the growth in the number of NFEs exerts a linear negative effect on ILASM while exhibiting a linear positive effect on HILASM. This is mainly because local governments have long allocated industrial land at low prices and on a large scale to attract numerous low-quality enterprises. These enterprises are typically highly cost-sensitive but less location-sensitive, resulting in a scattered and fragmented spatial pattern of industrial land allocation. In contrast, high-tech industries have stronger requirements regarding regional industrial foundations, infrastructure and resource endowments. In the process of site selection, they place greater emphasis on knowledge spillovers, resource sharing and economies of scale generated through industrial agglomeration. Therefore, an increase in foreign-invested enterprises can further enhance the spatial agglomeration of high-tech industrial land allocation [1,67]. Moreover, the impact of FIL intensity on ILASM exhibits a U-shaped curve, diverging from prior findings [25,41]. This is because traditional industries are highly sensitive to fluctuations in land prices. When the scale of FIL remains relatively limited, local governments tend to allocate land for low-tech industries to urban peripheries with cheaper land, thereby leading to a more dispersed spatial distribution of traditional industrial land. As FIL continues to expand, inter-regional competition among local governments intensifies. In order to attract additional investment and improve the completeness of local industrial chains, local authorities develop specialized industrial parks to accommodate supporting low-tech enterprises, such as component-processing and product-packaging firms located along industrial supply chains. This process, in turn, fosters the spatial agglomeration of traditional industrial land allocation [26].
In terms of the social environment, PD exerts a significant negative effect on both TILASM and HILASM. This finding is largely consistent with He et al., 2019 [7], who argued that rising population density crowds out space for industrial land allocation, thereby promoting scattered expansion of industrial land allocation. OPL shows a linear positive effect on TILASM, while its impact on HILASM follows a relatively complex N-shaped relationship. This discrepancy arises from substantial differences between traditional and high-tech industries in their dependence on land, cost sensitivity, and location preferences. However, these results are different from the existing research, which argues the opening up is not significant [41]. This is mainly because the existing research focuses on the influence of the opening-up level on industrial land prices rather than industrial land allocation morphology.
Finally, in terms of the innovation environment, the impact of PA on TILASM follows an N-shaped pattern, whereas its effect on HILASM shows an approximately increasing trend. This is mainly because innovation has become a key indicator of local government performance. In order to rapidly enhance regional innovation capacity, local governments tend to allocate large amounts of land to attract high-tech industries and projects, thereby crowding out land resources available for low-tech industries. This may force low-tech firms to exit the market in the short run, resulting in a decline in their number and a more fragmented spatial distribution. In the long run, however, as urban innovation capacity continues to rise, low-tech enterprises located upstream and downstream of industrial chain remain essential components of the regional industrial system. In order to strengthen industrial chain resilience, local governments subsequently reallocate land for low-tech industries around high-tech development zones, forming a peripheral agglomeration pattern centered on high-tech industries [17].
In addition, among infrastructure factors, PCRA influences both ILASM and TILASM. However, its importance is relatively low compared with other driving mechanisms, suggesting that its role in shaping the spatial pattern of industrial land allocation is comparatively limited. RD, by contrast, exerts a considerable influence on HILASM, ranking second in importance among all driving factors, although its effect follows a U-shaped pattern. Notably, most observations fall within the inhibitory phase, indicating that RD generally suppresses HILASM. This finding is not consistent with those of Zheng & Shi, 2018 [1] and Zhang et al., 2019 [17]. The discrepancy arises because their studies primarily focused on firms’ location preferences or industrial land productivity, whereas the present study emphasizes the spatial morphology of newly allocated industrial land. However, several studies have reported findings consistent with the present research [68,69]. The adverse effects of RD on HILASM can be attributed to the following reasons: On the one hand, the extensive, high-density road network across the YRD has largely eliminated inter-city transportation barriers. Consequently, high-tech manufacturing and supporting processing enterprises are free to relocate to lower-cost peripheral regions such as northern Jiangsu, northern Anhui, and southwestern Zhejiang. The once-contiguous innovation agglomeration centered in core urban areas has progressively fragmented, giving rise to a scattered, multi-node spatial pattern across the region and a dilution of overall agglomeration intensity. On the other hand, the construction of high-density road networks may substantially raise land-leasing prices, office rents, and industrial park rentals along transport corridors. R&D headquarters, laboratories, and pilot-testing bases within high-tech enterprises exhibit heightened sensitivity to escalating land costs. In densely road-networked core urban areas, premium land rents erode firms’ innovative profits, prompting voluntary relocation toward peri-urban areas and suburban high-tech zones characterized by moderate road accessibility and lower land costs. This process gradually disintegrates the original spatial agglomeration in established clusters.

7. Conclusions and Implications

(1)
From 2007 to 2024, the spatial distribution pattern and agglomeration center of industrial land allocation in the YRD underwent significant changes. The evolutionary trajectory of the spatial pattern of traditional industrial land allocation was consistent with that of overall industrial land allocation, both exhibiting an agglomeration trend from the “west (slightly north) to the east (slightly south)”. In contrast, high-tech industrial land allocation exhibited an agglomeration trend from the “west (slightly south) to the east (slightly north),” forming an evolutionary pattern from multi-core dispersion to multi-core contiguous agglomeration.
(2)
The ILASM, TILASM, and HILASM are jointly shaped by multiple factors, including natural conditions, economic development, social environment, innovation environment and infrastructure. Economic development is the principal factor affecting ILASM, whereas natural conditions exert a negative impact on ILASM and positive impacts on both TILASM and HILASM. Specifically, the impacts of patent application, population density and internet penetration rate on ILASM; foreign-invested levels and slope proportion on TILASM; and road density, labor quality, and foreign-invested levels on HILASM all exhibit U-shaped relationships. Moreover, the effects of opening-up level and per capital road area on ILASM and HILASM exhibit a complex N-shaped characteristic, reflecting threshold effects and stage-specific characteristics.
(3)
The impacts of the key driving factors on ILASM, TILASM and HILASM display significant spatial heterogeneity, primarily characterized by core–periphery structures and east–west and north–south spatial gradient variations.
Based on the identified driving mechanisms on ILASM and their spatial heterogeneity, this study proposes the following policy recommendations:
(1)
Foreign investment remains the most influencing driving factor of ILASM. Therefore, in order to mitigate its potential negative effects, it is crucial to optimize the spatial matching between foreign-invested enterprises and local industrial firms. Local governments should refrain from blind competition. Instead, based on clearly identified regional industrial advantages, they should promote the localized agglomeration of industrial chains and attract traditional technology enterprises that complement and strengthen existing industrial chains. Such measures would foster a spatially coordinated pattern of industrial agglomeration, characterized by hierarchical industrial development, integrated upstream–downstream linkages and industrial clusters centered on competitive industries while being reinforced by the supporting role of traditional manufacturing sectors.
(2)
Given the pronounced spatial heterogeneity of the key driving factors, differentiated industrial land allocation strategies should be implemented across the YRD. First, in priority development zones, such as Shanghai, southern Jiangsu Province, and the Hangzhou Bay area, local governments should raise the threshold for industrial land supply and encourage industrial upgrading and transformation. In addition, these regions should further improve the innovation environment, infrastructure and human capital in order to foster high-tech industrial agglomeration. Second, in major development zones, including central Jiangsu and Zhejiang Provinces, the Wanjiang Economic Belt, and parts of the coastal areas, local governments should seize the opportunities created by YRD regional integration by optimizing the structure of industrial land allocation to facilitate industrial transfer and industrial chain supporting projects. Third, building upon their industrial foundations, these regions should further develop supporting clusters for advanced manufacturing industries. Finally, in restricted development zones, including northern Jiangsu Province, western Anhui Province, and western Zhejiang Province, local governments should capitalize on the opportunities provided by the green development strategy. Environmental access thresholds for industrial enterprises should be further strengthened, and whole-life-cycle environmental supervision should be implemented. Based on regional natural resource endowments, the spatial layout of industrial land should be scientifically optimized to develop eco-friendly industrial agglomeration zones.
(3)
Across the YRD region, a coordinated land management reform system and a cross-regional platform for land quota trading and benefit sharing should be established. Such a mechanism would effectively prevent redundant construction and homogeneous competition among industrial clusters. Furthermore, establishing a “chain-based synergy corridor” would enhance talent mobility and foster innovation technology spillovers, thereby, reinforcing spatial functional complementarity and driving differentiated development across south–north, east–west and core–peripheral regions.
Although this study integrated the RF model and the MGWR model to investigate the key driving factors of ILASM, TILASM and HILASM, several limitations should be acknowledged. First, due to data availability constraints, this study examined only the spatial morphological evolution of overall industrial land, traditional industrial land and high-tech industrial land, without further classifying industrial land into more detailed industrial sectors. Future research should conduct in-depth investigations into the spatial layout and optimization of land allocation across different industrial sectors. Second, although this study established a multi-dimensional driving mechanism to analyze the driving mechanisms of the spatial morphology of industrial land allocation, it did not explicitly examine potential causal relationships. While the RF model effectively identifies the key drivers of ILASM, it mainly captures statistical associations rather than explicit causal relationships. Future studies should employ more rigorous modeling methods to better identify the causal mechanisms underlying the spatial morphology of industrial land allocation.

Author Contributions

P.W.: Writing—review and editing, writing—original draft, conceptualization. Y.W.: Resources, methodology. W.Z.: Visualization, data curation. All authors have read and agreed to the published version of the manuscript.

Funding

This study was funded by the National Natural Science Foundation of China (42501351, 72404147, 42301297).

Data Availability Statement

The data that supports the findings of this study are available upon reasonable request from the corresponding author.

Conflicts of Interest

The authors declare no conflicts of interest.

Appendix A

Low-technology industrial mainly includes: mining; processing of agricultural and sideline food; food manufacturing; manufacturing of wine, beverages and refined tea; tobacco products; textiles; textile clothing and apparel; leather, fur, feather and related products and footwear; wood processing and wood, bamboo, rattan, palm and straw products; furniture manufacturing; paper making and paper products; printing and reproduction of recording media; manufacturing of cultural, educational, arts and crafts, sports and entertainment products; rubber and plastic products; production and supply of electric power, heat power, gas and water.
High-technology industrial mainly includes: processing of petroleum, coal and other fuels; manufacturing of raw chemical materials and chemical products; manufacturing of medicines; manufacturing of chemical fibers; manufacturing of non-metallic mineral products; smelting and pressing of ferrous and non-ferrous metals; metal products; motor vehicles; equipment manufacturing (general equipment, special equipment, railway, shipbuilding, aerospace and other transportation equipment, computers, communication and other electronic equipment); electrical machinery and apparatus; and instrumentation manufacturing.

References

  1. Zheng, D.; Shi, M. Industrial Land Policy, Firm Heterogeneity and Firm Location Choice: Evidence from China. Land Use Policy 2018, 76, 58–67. [Google Scholar] [CrossRef] [Scilit]
  2. Liu, Y.; Fang, F.; Li, Y. Key Issues of Land Use in China and Implications for Policy Making. Land Use Policy 2014, 40, 6–12. [Google Scholar] [CrossRef] [Scilit]
  3. Zhou, L.; Tian, L.; Cao, Y.; Yang, L. Industrial Land Supply at Different Technological Intensities and Its Contribution to Economic Growth in China: A Case Study of the Beijing-Tianjin-Hebei Region. Land Use Policy 2021, 101, 105087. [Google Scholar] [CrossRef] [Scilit]
  4. Yan, S.; Hu, M.; Ma, X.; Li, X. Exploring the Nexus between Spatial Configuration of Urban Agglomerations and Land Use Efficiency: A Bidimensional Analysis Considering Transport Network Connectivity. Cities 2025, 167, 106353. [Google Scholar] [CrossRef] [Scilit]
  5. Wijesinghe, D.C.; Sun, P.; Liu, Z. Spatial Evolution Characteristics and Driving Factors of Urban Forms in the Colombo Metropolitan Area (CMA), Sri Lanka: A Geo-Informatics Approach. Land Use Policy 2026, 162, 107900. [Google Scholar] [CrossRef] [Scilit]
  6. Tan, X.; Chen, W.; Cao, H.; Li, Q.; Zhang, S. Identifying Spatiotemporal Characteristics and Driving Factors of Industrial Land Use Morphology in China. Expert Syst. Appl. 2024, 235, 121231. [Google Scholar] [CrossRef] [Scilit]
  7. He, Q.; Xu, M.; Xu, Z.; Ye, Y.; Shu, X.; Xie, P.; Wu, J. Promotion Incentives, Infrastructure Construction, and Industrial Landscapes in China. Land Use Policy 2019, 87, 104101. [Google Scholar] [CrossRef] [Scilit]
  8. Zhang, Y.; Liu, Y.; Li, Y.; Chu, J.; Yang, Q. Nonlinear and Spatial Non-Stationary Effects of Land Finance on Urban Expansion at the County Level in China: Insights from Explainable Spatial Machine Learning. Cities 2025, 160, 105850. [Google Scholar] [CrossRef] [Scilit]
  9. Tian, T.; Sho, K.; Seta, F.; Tang, J. Land Policy Instrument Selection in China’s Urban Redevelopment: A Governance Structure Perspective. Habitat Int. 2026, 172, 103812. [Google Scholar] [CrossRef] [Scilit]
  10. Cheng, G.; Shu, T.; Chau, K.W. Incentives behind Local Governments’ Industrial Land Transfers: Evidence from China. Habitat Int. 2025, 162, 103460. [Google Scholar] [CrossRef] [Scilit]
  11. Wu, J.; Guo, Q.; Hewings, G.J.D. Land Regulating Economy as a Policy Instrument in Urban China. Cities 2019, 94, 225–234. [Google Scholar] [CrossRef] [Scilit]
  12. Qi, Y.; Lin, R.; Zhu, D. Impact of Rising Industrial Land Prices on Land-Use Efficiency in China: A Study of Underpriced Land Price. Land Use Policy 2025, 151, 107490. [Google Scholar] [CrossRef] [Scilit]
  13. Wang, Z.; Fu, H.; Liu, H.; Liao, C. Urban Development Sustainability, Industrial Structure Adjustment, and Land Use Efficiency in China. Sustain. Cities Soc. 2023, 89, 104338. [Google Scholar] [CrossRef] [Scilit]
  14. Yang, H.; Chen, C.; Li, J.; Li, M.; Sieber, S.; Long, K. How Does the Concentration of Spatial Allocation of Urban Construction Land across Cities Affect Carbon Emission Intensity in China? Ecol. Indic. 2025, 170, 113136. [Google Scholar] [CrossRef] [Scilit]
  15. Sun, Y.; Ma, A.; Su, H.; Su, S.; Chen, F.; Wang, W.; Weng, M. Does the Establishment of Development Zones Really Improve Industrial Land Use Efficiency? Implications for China’s High-Quality Development Policy. Land Use Policy 2020, 90, 104265. [Google Scholar] [CrossRef] [Scilit]
  16. Luo, J.; Wu, Y.; Choguill, C.L.; Zhang, X. A Study on Promoting the Intensive Use of Industrial Land in China through Governance: A Game Theoretical Approach. J. Urban Manag. 2022, 11, 298–309. [Google Scholar] [CrossRef] [Scilit]
  17. Zhang, J.; Zhang, D.; Huang, L.; Wen, H.; Zhao, G.; Zhan, D. Spatial Distribution and Influential Factors of Industrial Land Productivity in China’s Rapid Urbanization. J. Clean. Prod. 2019, 234, 1287–1295. [Google Scholar] [CrossRef] [Scilit]
  18. Liu, J.; Zhou, D.; Jiang, G. Structural Adjustment of Industrial Land Use and Economic Resilience: Evidence from China’s Poverty-Stricken Counties. Land Use Policy 2026, 169, 108121. [Google Scholar] [CrossRef] [Scilit]
  19. Liu, Z.; Luo, G.; Zhang, Q. The Driving Effect of Market-Oriented Allocation of Industrial Land on Green Economic Efficiency: Empirical Evidence from the Standard Land Reform in China. Sustain. Futures 2026, 11, 101953. [Google Scholar] [CrossRef] [Scilit]
  20. Cai, M. Revenue, Time Horizon, and Land Allocation in China. Land Use Policy 2017, 62, 101–112. [Google Scholar] [CrossRef] [Scilit]
  21. Fukui, S.; Anh Luong, D. Impact of Diseconomy of Mixed Land-Use on Factory Land Redevelopment in Large Urban Area: Evidence from Japan. Jpn. World Econ. 2024, 71, 101256. [Google Scholar] [CrossRef] [Scilit]
  22. Murakami, J. The Government Land Sales Programme and Developers’ Willingness to Pay for Accessibility in Singapore, 1990–2015. Land Use Policy 2018, 75, 292–302. [Google Scholar] [CrossRef] [Scilit]
  23. Han, Z.; Xie, W.; Yu, H.; Xie, H.; Li, Y.; Wang, Y. Rethinking Industrial Land-Use in American Rust Cities towards Sustainability Based on a Block-Level Model. J. Environ. Manag. 2024, 352, 120067. [Google Scholar] [CrossRef] [Scilit] [PubMed]
  24. Chen, Y.; Zhang, Y.; Wang, B.; Feng, S. The Impact of Market-Oriented Reform of Collective Operating Construction Land on the Price of State-Owned Industrial Land in China: A Case Study of Wujin District, Changzhou. Cities 2026, 168, 106447. [Google Scholar] [CrossRef] [Scilit]
  25. Huang, Z.; Du, X. Government Intervention and Land Misallocation: Evidence from China. Cities 2017, 60, 323–332. [Google Scholar] [CrossRef] [Scilit]
  26. Zhang, J. Interjurisdictional Competition for FDI: The Case of China’s “Development Zone Fever”. Reg. Sci. Urban Econ. 2011, 41, 145–159. [Google Scholar] [CrossRef] [Scilit]
  27. Lin, S.-W.; Ben, T.-M. Impact of Government and Industrial Agglomeration on Industrial Land Prices: A Taiwanese Case Study. Habitat Int. 2009, 33, 412–418. [Google Scholar] [CrossRef] [Scilit]
  28. Kong, W.; Pan, Y.; Zhou, H.; Shen, G.Q.; Zhang, D.; Tang, L.; Zhang, Z.; Zhang, Z.; Hu, Q. The Carbon Reduction Effects of Industrial Land Transition: Intelligently Constructed Dataset of 16,067 Parcels Reveals Multi-Dimensional Interactions and Nonlinear Mechanisms. Land Use Policy 2026, 168, 108084. [Google Scholar] [CrossRef] [Scilit]
  29. Xie, D.; Han, Y.; Fahad, S. Land Supply Constraints and Firm Innovation: Evidence from China’s Minimum Industrial Land Price Policy. Econ. Anal. Policy 2026, 91, 711–729. [Google Scholar] [CrossRef] [Scilit]
  30. Yang, J.; Liu, C.; Liu, K. Land Marketization and Industrial Restructuring in China. Land Use Policy 2023, 131, 106737. [Google Scholar] [CrossRef] [Scilit]
  31. Yue, L.; Miao, J.; Ahmad, F.; Draz, M.U.; Guan, H.; Chandio, A.A.; Abid, N. Investigating the Role of International Industrial Transfer and Technology Spillovers on Industrial Land Production Efficiency: Fresh Evidence Based on Directional Distance Functions for Chinese Provinces. J. Clean. Prod. 2022, 340, 130814. [Google Scholar] [CrossRef] [Scilit]
  32. Zhang, M.; Qin, F. Spatial Proximity, Enterprise Agglomeration, and Innovation Output: Mechanisms and Insights from China. Sustain. Futures 2025, 9, 100793. [Google Scholar] [CrossRef] [Scilit]
  33. Sessa, M.R.; Russo, A.; Sica, F. Opinion Paper on Green Deal for the Urban Regeneration of Industrial Brownfield Land in Europe. Land Use Policy 2022, 119, 106198. [Google Scholar] [CrossRef] [Scilit]
  34. Park, J.-I.; Kim, J.-O. Does Industrial Land Sprawl Matter in Land Productivity? A Case Study of Industrial Parks of South Korea. J. Clean. Prod. 2022, 334, 130209. [Google Scholar] [CrossRef] [Scilit]
  35. Chatterjee, S.; Gupta, K. Exploring the Spatial Pattern of Urban Heat Island Formation in Relation to Land Transformation: A Study on a Mining Industrial Region of West Bengal, India. Remote Sens. Appl. Soc. Environ. 2021, 23, 100581. [Google Scholar] [CrossRef] [Scilit]
  36. Chen, D.; Li, Y.; Hu, W.; Lang, Y.; Zhang, Y.; Cheng, C. Uncovering the Influence of Land Finance Dependency on Inter-City Regional Integration: An Explanatory Framework Integrating Time-Nonlinear and Spatial Factors. Land Use Policy 2024, 144, 107207. [Google Scholar] [CrossRef] [Scilit]
  37. Yu, B.; Zhou, X. Land Finance and Urban Sprawl: Evidence from Prefecture-Level Cities in China. Habitat Int. 2024, 148, 103074. [Google Scholar] [CrossRef] [Scilit]
  38. Wang, D.; Ren, C.; Zhou, T. Understanding the Impact of Land Finance on Industrial Structure Change in China: Insights from a Spatial Econometric Analysis. Land Use Policy 2021, 103, 105323. [Google Scholar] [CrossRef] [Scilit]
  39. Cai, L.; Liao, Y.; Tang, H. How Does Land Finance Affect Carbon Emissions? Evidence from 270 Chinese Cities. Int. Rev. Econ. Financ. 2025, 104, 104771. [Google Scholar] [CrossRef] [Scilit]
  40. Zhou, D.; Wang, H.; Wang, M. Does Local Government Competition Affect the Dependence on Polluting Industries? Evidence from China’s Land Market. J. Environ. Manag. 2023, 325, 116518. [Google Scholar] [CrossRef] [Scilit] [PubMed]
  41. Song, M.; Xie, Q.; Chen, J. Effects of Government Competition on Land Prices under Opening up Conditions: A Case Study of the Huaihe River Ecological Economic Belt. Land Use Policy 2022, 113, 105875. [Google Scholar] [CrossRef] [Scilit]
  42. Ahmad, M.; Khan, Z.; Anser, M.K.; Jabeen, G. Do Rural-Urban Migration and Industrial Agglomeration Mitigate the Environmental Degradation across China’s Regional Development Levels? Sustain. Prod. Consum. 2021, 27, 679–697. [Google Scholar] [CrossRef] [Scilit]
  43. Sun, F.; Xu, H. Towards Sustainable Development: How Industrial Land Leasing Affects Urban Green Innovation? J. Urban Manag. 2026, 15, 641–656. [Google Scholar] [CrossRef] [Scilit]
  44. Hu, Q.; Shen, W.; Yan, J.; Kong, W.; Li, W.; Zhang, Z. Does Existing Mixed Land Development Promote the Urban Spatial Composite Function? Evidence from Beijing, China. Land Use Policy 2024, 143, 107212. [Google Scholar] [CrossRef] [Scilit]
  45. Liu, C.; Sun, W.; Wu, J. Synergistic Effects of Manufacturing Spatial Agglomeration and Carbon Emission Efficiency in Urban Hierarchies: Evidence from the Yangtze River Delta, China. Energy 2026, 359, 141130. [Google Scholar] [CrossRef] [Scilit]
  46. Bao, F.; Zhao, Z.; Dong, L. Government Land Control Approach, Industrial Agglomeration, and Urban Air Quality: Analysis Based on Spatial Spillovers and Threshold Effects. J. Clean. Prod. 2023, 427, 139176. [Google Scholar] [CrossRef] [Scilit]
  47. Wang, Y.; Wei, H.; Kontoleon, A. How Does Urban Agglomeration Contribute to Achieving Carbon Reduction Targets? Evidence from an HSR-Weighting Spatial DID Approach. Energy Econ. 2026, 154, 109136. [Google Scholar] [CrossRef] [Scilit]
  48. Yang, S.; Chen, Y.; Chen, H.; Ye, B.; Shao, S. Digital Enterprise Distribution and Green Total Factor Productivity: A Spatial Agglomeration Perspective. Environ. Impact Assess. Rev. 2025, 112, 107832. [Google Scholar] [CrossRef] [Scilit]
  49. Kong, W.; Huang, J.; Niu, L.; Chen, S.; Zhou, J.; Zhang, Z.; Guo, S. Innovative Framework for Identification and Spatiotemporal Dynamics Analysis of Industrial Land at Parcel Scale with Multidimensional Attributes. Cities 2025, 162, 105958. [Google Scholar] [CrossRef] [Scilit]
  50. Yan, M.; Yan, M.; Zhao, J. Manufacturing Agglomeration and High-Quality Economic Development: Unveiling Nonlinear Dynamics and Spatial Spillovers in China. Appl. Geogr. 2026, 186, 103833. [Google Scholar] [CrossRef] [Scilit]
  51. Chen, W.; Shen, Y.; Wang, Y. Does Industrial Land Price Lead to Industrial Diffusion in China? An Empirical Study from a Spatial Perspective. Sustain. Cities Soc. 2018, 40, 307–316. [Google Scholar] [CrossRef] [Scilit]
  52. Shi, H.; Zhang, S.; Li, M.; Chen, W.; Luo, Y.; Li, Q.; Yang, Y.; Liu, X. Understanding Industrial Land Allocation in Rural Regions of China: Spatiotemporal Patterns and Driving Mechanisms. Habitat Int. 2025, 165, 103574. [Google Scholar] [CrossRef] [Scilit]
  53. Yang, B.D.; Lv, J.; Yang, Y.J.; Chen, F.; Liu, G.J. Evolution of Industrial Land Location in Xuzhou City since Chinese Reform and Opening-Up. Procedia Eng. 2017, 198, 1137–1148. [Google Scholar] [CrossRef] [Scilit]
  54. Xu, C.; Ren, Y.; Kong, F. Spatial Correlation Network, Driving Factors and Planning Application of Land Green Use Efficiency in Zhejiang Province, China. Environ. Sustain. Indic. 2025, 28, 100963. [Google Scholar] [CrossRef] [Scilit]
  55. Zong, S.; Xu, S.; Huang, J.; Ren, Y.; Song, C. Distribution Patterns and Driving Mechanisms of Land Use Spatial Conflicts: Empirical Analysis from Counties in China. Habitat Int. 2025, 156, 103268. [Google Scholar] [CrossRef] [Scilit]
  56. Zhang, Z.; Gong, J.; Li, J.; Yang, J.; Chen, G.; Ren, Y.; Plaza, A. Comparative Study of Construction Land Development Suitability Assessment: Insights from Multiple Models and Driving Forces. Environ. Impact Assess. Rev. 2024, 107, 107574. [Google Scholar] [CrossRef] [Scilit]
  57. Wu, Y.; Shan, J.; Choguill, C.L. Combining Behavioral Interventions with Market Forces in the Implementation of Land Use Planning in China: A Theoretical Framework Embedded with Nudge. Land Use Policy 2021, 108, 105569. [Google Scholar] [CrossRef] [Scilit]
  58. Ji, X.; Han, M.; Ulgiati, S. Optimal Allocation of Direct and Embodied Arable Land Associated to Urban Economy: Understanding the Options Deriving from Economic Globalization. Land Use Policy 2020, 91, 104392. [Google Scholar] [CrossRef] [Scilit]
  59. Wang, Z.; Zhou, H.; Zheng, X.; Yang, X. Unveiling the Spatial Patterns and Drivers of Urban Land Use in a Mountainous Urban Agglomeration: Evidence from the Chengdu-Chongqing Economic Zone (CCEZ), China. City Environ. Interact. 2026, 29, 100317. [Google Scholar] [CrossRef] [Scilit]
  60. Angel, S.; Parent, J.; Civco, D.L. Ten Compactness Properties of Circles: Measuring Shape in Geography. Can. Geogr./Géogr. Can. 2010, 54, 441–461. [Google Scholar] [CrossRef] [Scilit]
  61. Mariaflavia, H. Cities in Bad Shape Urban Geometry in India. Am. Econ. Rev. 2020, 110, 2377–2421. [Google Scholar] [CrossRef] [Scilit]
  62. Zeng, G.; Hu, Y.; Zhong, Y. Industrial Agglomeration, Spatial Structure and Economic Growth: Evidence from Urban Cluster in China. Heliyon 2023, 9, e19963. [Google Scholar] [CrossRef] [Scilit] [PubMed]
  63. Ellison, G.; Edward, G.; Kerr, W. What Causes Industry Agglomeration? Evidence From Coagglomeration Patterns. Am. Econ. Rev. 2010, 100, 1195–1213. [Google Scholar] [CrossRef] [Scilit]
  64. Feng, Y.; Ye, Z.; Ma, L.; Jin, F. Mapping the Journey: Tracing the Complete Relocation Trajectories of High-Tech Firms in the Pearl River Delta, China. Appl. Geogr. 2025, 183, 103740. [Google Scholar] [CrossRef] [Scilit]
  65. Yang, S.; Jiang, W.; Wang, J. How Does ICT Agglomeration Promote Green Technology Innovation? Evidence from Yangtze River Delta in China. Energy Econ. 2025, 147, 108584. [Google Scholar] [CrossRef] [Scilit]
  66. Zhao, J.; Zhu, D.; Cheng, J.; Jiang, X.; Lun, F.; Zhang, Q. Does Regional Economic Integration Promote Urban Land Use Efficiency? Evidence from the Yangtze River Delta, China. Habitat Int. 2021, 116, 102404. [Google Scholar] [CrossRef] [Scilit]
  67. Tang, Y.; Zhang, K.H. Absorptive Capacity and Benefits from FDI: Evidence from Chinese Manufactured Exports. Int. Rev. Econ. Financ. 2016, 42, 423–429. [Google Scholar] [CrossRef] [Scilit]
  68. Liu, H.C.; Fan, J.; Zhang, H.P.; Wang, P. Agglomeration and Dispersion of Manufacturing Industries and Spatial Pattern Changes in the Pearl River Delta Urban Agglomeration. Prog. Geogr. 2020, 39, 195–206. [Google Scholar] [CrossRef] [Scilit]
  69. Zandiatashbar, A.; Hamidi, S.; Foster, N. High-Tech Business Location, Transportation Accessibility, and Implications for Sustainability: Evaluating the Differences between High-Tech Specializations Using Empirical Evidence from U.S. Booming Regions. Sustain. Cities Soc. 2019, 50, 101648. [Google Scholar] [CrossRef] [Scilit]
Figure 1. The theoretical framework of driving factors of industrial land allocation spatial morphology.
Land 15 01469 g001
Figure 2. Research framework.
Land 15 01469 g002
Figure 3. Location of YRD. The left map approval number is GS2023(2767) under the supervision of the Ministry of Natural Resources of China.
Land 15 01469 g003
Figure 4. Spatial distribution pattern of overall industrial land, traditional industrial land and high-tech industrial land allocation in the YRD.
Land 15 01469 g004
Figure 5. Spatial distribution of kernel density of (A) overall industrial land, (B) traditional industrial land and (C) high-tech industrial land allocation in the YRD.
Land 15 01469 g005aLand 15 01469 g005b
Figure 6. Ranking of importance of drivers for ILASM, TILASM and HILASM.
Land 15 01469 g006
Figure 7. Partial dependence plots of key drivers for (A) ILASM, (B) TILASM, and (C) HILASM.
Land 15 01469 g007
Figure 8. Spatial non-stationarity in the drivers of (A) ILASM, (B) TILASM and (C) HILASM.
Land 15 01469 g008aLand 15 01469 g008bLand 15 01469 g008c
Table 1. Definition of variables.
Variable CategoryVariable NameMeasurement MethodVariable Unit
ILASMTotal industrial land allocation spatial morphology (ILASM)Average distance of two industrial parcels/average distance in equal-area circle of built-up area
High-tech industrial land allocation spatial morphology (HILASM)Average distance of two high-tech industrial parcels/average distance in equal-area circle of built-up area
Traditional industrial land allocation spatial morphology (TILASM)Average distance of two low-tech industrial parcels/average distance in equal-area circle of built-up area
Nature conditionsSlop proportion (SP)Land area with slope below 15°/total administrative area
Water resources (WR)Regional total water resourcesBillion cubic meters
Economic developmentPer capital GDP (PGDP)Total GDP/resident populationYuan
Proportion of secondary industrial (PSI)Value of secondary industry/GDP
Fixed asset investment intensity (FAII)Total fixed asset investment/GDP
Number of foreign-invested enterprises (NFE)Total foreign invested enterpriseTen thousand
Foreign invested level (FIL)Total foreign investedTake the logarithm
Social environmentLabor quality (LQ)Higher education students/total population at the year-end
Population density (PD)Number of resident population/administrative areaPersons per square meter
opening up level (OPL)Trade volume/GDP
Government Intervention (GI)Local government fiscal expenditure/GDP
Taxed intensity (TI)Tax revenue/GDP
Invention environmentNumber of patent applications (PA)Total patent applications
Number of patents granted (PG)Total patents granted
Number of green patents granted (GPG)Total green patents granted
InfrastructureRoad density (RD)Road miles/land area of administrative areaKilometers/square
Internet Penetration Rate (IPR)Internet broadband access subscribers/resident populationHouseholds/100 persons
Per capital road area (PCRA)Total area of paved urban roads/urban resident populationM2/capital
Table 2. VIF-RMSE trade-off analysis process for ILASM, LILASM and HILASM regressions.
VariablesILASMLILASMHILASM
(1)(2)(1)(2)(1)(2)
SP2.96 4.042.6810.96
WR1.12 1.121.1110.12
PGDP4.92 10.92 4.923.53
PSI2.43 2.431.822.431.87
FAII2.32 2.322.012.322.12
NFE4.28 4.282.774.281.78
FIL1.9 1.911.731.93.42
LQ1.84 1.841.61.841.83
PD4.04 4.043.624.042.59
OPL1.99 1.991.871.991.97
GI6.98 10.08 10.05
TI1.97 1.971.91.971.73
PA4.78 4.784.764.784.74
PG5.14 5.144.75.145.01
GPG2.77 2.772.752.772.76
RD2.38 2.382.192.381.98
IPR1.92 1.921.651.921.73
PCRA1.95 1.951.651.951.67
Mean VIF3.09 3.662.434.212.58
RMSE0.418 1.2411.9590.6741.004
MAE0.325 0.9711.5480.4960.804
R20.867 0.8010.6820.9030.706
Table 3. Correlation indices for model fit.
ModelsIndicatorILASMTILASMHILASM
GWRAICc2078.1952062.1921975.249
R20.0480.0690.172
Adj.R20.0380.0580.163
MGWRAICc1728.4671799.8591800.838
R20.5090.4310.45
Adj.R20.4570.3840.396
Disclaimer/Publisher’s Note: The statements, opinions and data contained in all publications are solely those of the individual author(s) and contributor(s) and not of MDPI and/or the editor(s). MDPI and/or the editor(s) disclaim responsibility for any injury to people or property resulting from any ideas, methods, instructions or products referred to in the content.