


Abstract
Urban parks contribute to emotional well-being, yet the relationship among park environments, users’ perceptions, recreational activities, and emotions across seasons remains insufficiently understood. Using Jiefang Park in Wuhan, China, as a case study, this study analyzed 2233 valid questionnaires from four-season field surveys across six surveyed spaces, together with measured spatial environmental data. Partial least squares structural equation modeling (PLS-SEM) was used to examine the associations and interaction effects of landscape perception, thermal perception, recreational activities, and positive and negative emotions. Hierarchical linear modeling (HLM) was used to account for respondents nested within 24 space-season units and examine cross-level statistical indirect associations. Emotional responses varied across seasons and among the six surveyed locations. The surveyed lawn space showed the highest positive-emotion and lowest negative-emotion scores, whereas the surveyed fitness activity space had the highest negative-emotion score. The surveyed fitness activity and waterfront spaces displayed smaller seasonal fluctuations. Thermal and visual perceptions were consistently associated with emotional responses in the season-specific models. Measurement invariance was not established, so path coefficients were not formally compared. Spatial environmental characteristics showed significant indirect associations with emotions mainly through perceptual variables, whereas indirect associations through recreational activities were not significant. Vegetation color richness showed favorable indirect associations, while green view, pavement visibility, and fitness facility quantity showed adverse indirect associations at the surveyed locations. These findings suggest that seasonally responsive park design should emphasize perceptual quality, thermal adaptability, and context-sensitive spatial configuration.
1. Introduction
1.1. Urban Parks and Emotional Well-Being
As urbanization continues to advance, changes in urban environments and lifestyles have posed increasing challenges to public health, particularly mental health. As essential components of sustainable urban environments, urban parks and green spaces play an important role in promoting residents’ physical and psychological well-being [1,2]. Previous studies have shown that exposure to urban natural environments can alleviate psychological stress, improve mood, and promote positive emotional responses. Compared with many other built-environment settings, parks may offer stronger restorative benefits [3,4,5].
Urban parks can support emotional well-being through multiple pathways. They provide opportunities for walking, jogging, social interaction, and other forms of recreation, which are associated with reducing negative emotions (NEs) and enhancing positive emotions (PEs) [6]. Parks may also improve users’ emotional experiences by reducing exposure to noise, air pollution, and heat stress, restoring attention, relieving psychological stress, and promoting health-related behaviors such as physical activity and social interaction [7]. In addition, vegetation, water bodies and spatial configurations can modify local microclimatic conditions. Favorable outdoor thermal conditions can encourage park users to engage in recreational activities, thereby increasing the vitality of urban public spaces and strengthening their emotional benefits [8,9,10,11]. Understanding how park environments shape positive and negative emotions is therefore an important issue in healthy urban planning and landscape design.
1.2. Seasonal Variations in Park Environments and Emotional Responses
The environmental and emotional benefits of urban parks may vary across seasons. Seasonal changes in vegetation, thermal conditions, and the suitability of outdoor spaces can alter users’ environmental exposure and experiences. Consequently, the same park space may provide different emotional benefits under different seasonal conditions.
Previous studies have demonstrated that emotional responses vary according to the spatial and environmental characteristics of urban parks. Natural open spaces, such as lawns, have been associated with stronger PE and restorative experiences, whereas plaza spaces tend to show weaker restorative effects [12]. Water areas are positively associated with PE, while impervious surfaces show the opposite relationship [13]. The green view index and the degree of spatial enclosure may also significantly influence psychological restoration, particularly among older adults [14]. Moreover, the green view index within a 200 m buffer zone has been found to be negatively associated with NE [15]. Pavement materials and the quality of fitness facilities can further affect users’ emotional states [16].
Outdoor thermal conditions represent another important source of seasonal variation. Thermal perception plays an important role in shaping emotional and restorative experiences, with thermal comfort exerting a stronger positive effect on PE than on NE [17,18]. In hot and humid regions, thermal perception may also substantially influence the restorative benefits derived from exposure to green space [19]. Seasonal differences in temperature, solar radiation, vegetation cover, and shade may therefore alter users’ emotional responses to different park spaces. However, most previous studies have focused on individual environmental factors or observations conducted during a single season, and four-season comparisons among multiple settings within the same comprehensive park remain limited.
1.3. Perception and Recreational Activities in Park–Emotion Relationships
The emotional associations of park environments depend not only on objective spatial characteristics but also on how users perceive and use these environments. Landscape perception, thermal perception, and recreational activities may be directly associated with emotional responses and may also form statistical indirect associative pathways between spatial environmental characteristics and emotions.
Users’ perceptions and recreational activities are closely related to their emotional responses in urban parks. Landscape features such as spatial openness, water visibility, and plant community richness can enhance perceived restoration, while visual and auditory perceptions may jointly contribute to positive emotional experiences [20,21]. Multi-sensory comfort also contributes to emotional restoration, and visual comfort may become particularly important when conflicts occur among sensory experiences [22,23]. Visual, auditory, and olfactory perceptions may further be associated with emotions through thermal comfort [24], while perceived biodiversity has been identified as an important predictor of psychological restoration [25].
Recreational activities may be directly associated with users’ emotional states and may also contribute to statistical indirect associations between park environments and emotions. Longer park stays are generally associated with stronger PE [26], while social interaction within parks can provide positive experiences [27]. Adequate shade and well-developed activity facilities may increase activity frequency and duration [28], and walking has been shown to provide public health benefits [29]. Park accessibility, aesthetic quality, and facility configuration may also be associated with mental health through physical activity [30]. Different activity patterns may play different roles: sedentary activities may link natural features to psychological restoration, whereas active activities may link recreational facilities to attention restoration [31].
Landscape perception, thermal perception, and recreational activities may also be interrelated. Users’ perceptions of landscape and thermal conditions may affect the frequency, intensity, type, and duration of their activities, while participation in recreational activities may be associated with their perceptions and emotional experiences [32]. Nevertheless, whether these associations and interactions are consistent across seasons and whether perception and recreational activities form indirect associative pathways between spatial environmental characteristics and emotions remain insufficiently understood.
1.4. Research Gaps, Objectives, and Conceptual Framework
Despite increasing attention to the emotional benefits of urban parks, several research gaps remain. First, relatively few studies have conducted field surveys across all four seasons, limiting understanding of seasonal patterns in park environment–emotion relationships. Second, systematic comparisons among multiple spatial settings within the same comprehensive urban park remain scarce. Third, objective spatial environmental characteristics, landscape perception, thermal perception, recreational activities, and positive and negative emotions have rarely been incorporated into a unified analytical framework. Fourth, the nesting of individual responses within different space–season contexts has not always been adequately considered, potentially obscuring the distinction between individual-level experiences and upper-level environmental characteristics.
To address these gaps, this study investigates users’ emotional responses across six surveyed spaces in Jiefang Park, Wuhan, using field data collected in spring, summer, autumn, and winter. Specifically, the study aims to: (1) identify the spatial and seasonal patterns in users’ positive and negative emotions; (2) examine the associations of spatial environmental characteristics, landscape perception, thermal perception, and recreational activities with emotional responses; (3) examine interactions among landscape perception, thermal perception, and recreational activities within each seasonal sample; and (4) assess statistical indirect associations between spatial environmental characteristics and emotions via perception and recreational activities. The findings are expected to provide evidence for seasonally adaptive park planning, design and management strategies that enhance users’ emotional well-being.
2. Materials and Methods
2.1. Study Area
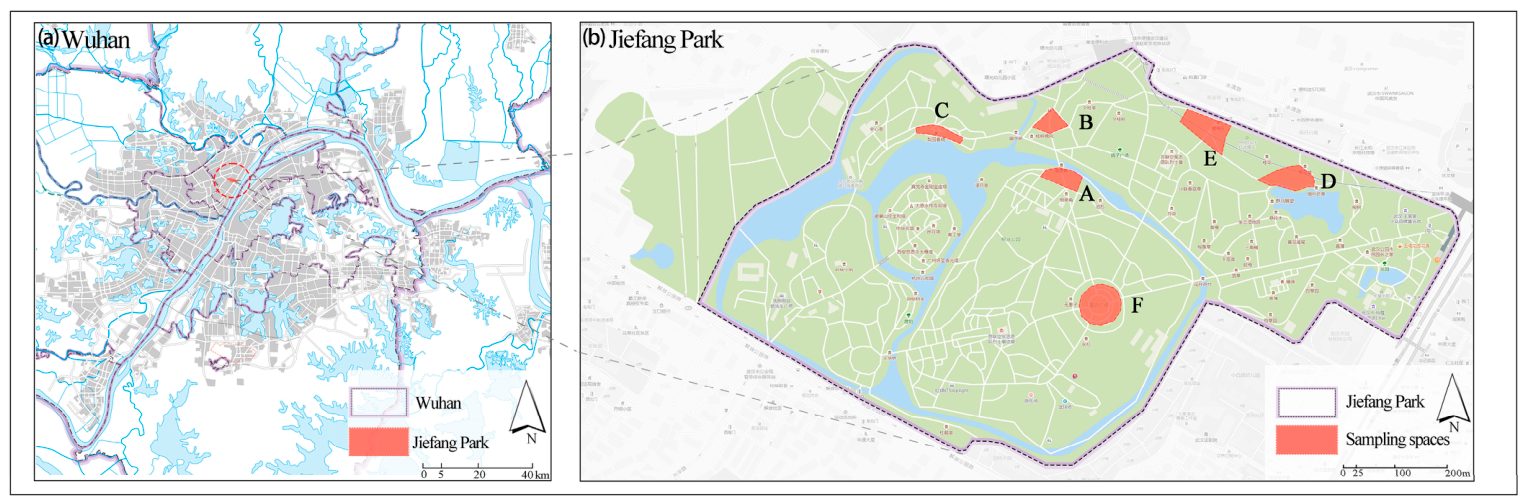
This study was conducted in Jiefang Park, Wuhan, China. Located in the central part of Wuhan, Jiefang Park was established in 1952 and covers an area of approximately 46 ha (Figure 1). It is a large comprehensive urban park in Wuhan’s main urban area and serves as an important ecological “green lung” for the city. Wuhan has a humid subtropical monsoon climate, with four distinct seasons and concurrent rainy and hot periods.
Figure 1.
Location of the Jiefang Pak in Wuhan (a) and six sampling spaces in Jiefang Park (b).
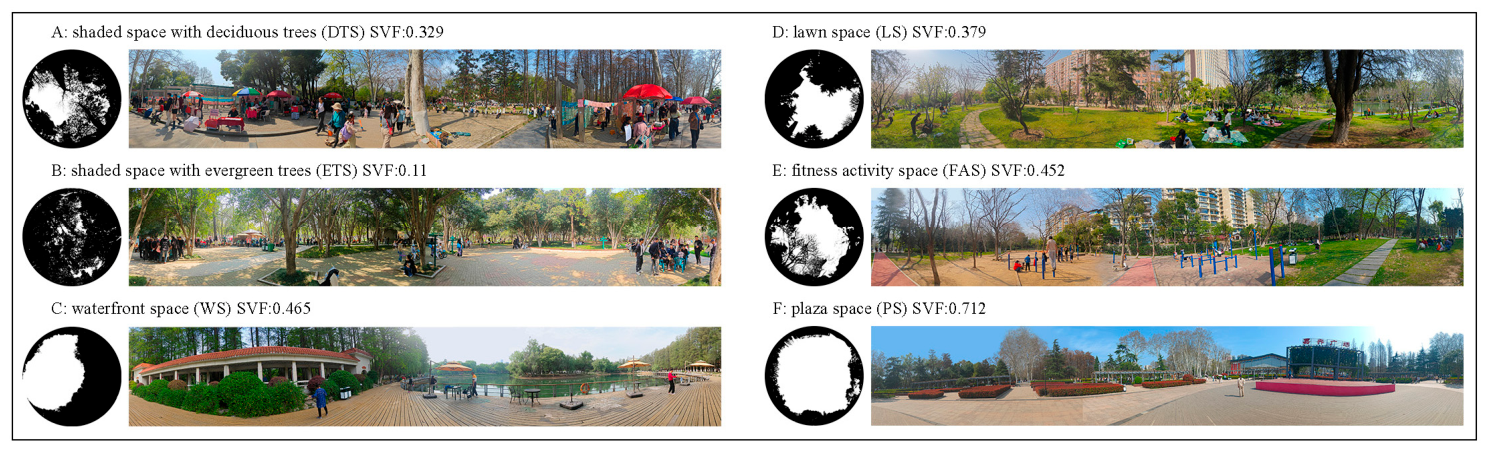
Six spaces within the park were selected as survey sites: a shaded space with deciduous trees (DTS), a shaded space with evergreen trees (ETS), a waterfront space (WS), a lawn space (LS), a fitness activity space (FAS), and a plaza space (PS) (Figure 2). Each surveyed space was represented by one specific physical location. The selected spaces provided contrasting environmental and recreational conditions for comparing users’ emotional responses.
Figure 2.
Panoramic views of the six surveyed spaces in summer.
2.2. Data Collection
Field surveys were conducted in spring, summer, autumn, and winter. In each season, surveys were carried out on two weekdays and two weekend days. Data were collected during two fixed periods, from 08:00 to 11:00 and from 14:00 to 17:00, under clear and calm weather conditions to ensure comparability across survey days.
An on-site intercept questionnaire survey was conducted simultaneously with the field investigation. The questionnaire covered users’ emotional states, landscape perception, thermal perception, and recreational activities. A pilot survey was conducted before the formal investigation to test and refine the questionnaire. A total of 2312 questionnaires were collected, of which 2233 were valid, yielding a valid response rate of 96.6%.
Microclimatic conditions were measured across the six surveyed spaces at a height of 1.5 m above the ground. HOBO temperature and humidity data loggers and a TESTO portable weather station equipped with an anemometer and a globe thermometer were used to continuously record air temperature (Ta), relative humidity (RH), wind velocity (Va), and globe temperature (Tg) at 1 min intervals.
Spatial environmental data were also collected in the six surveyed spaces. Equirectangular panoramic images were captured at a height of 1.5 m and used to derive visual and spatial indicators. Field observations were conducted in each surveyed space to record plant species and facility characteristics. For the multilevel analyses, the spatial environmental and microclimatic data were summarized for each of the 24 space–season survey units. Each respondent was assigned the environmental values corresponding to the space and season in which the questionnaire was completed.
2.3. Variables
Users’ emotions were measured using the Positive and Negative Affect Schedule (PANAS). Following exploratory factor analysis, items with cross-loadings were removed. The final scale retained nine positive-emotion items, including “determined”, “attentive”, and “active”, and five negative-emotion items, including “guilty”, “scared”, and “hostile”. All items were rated on a 5-point Likert scale from 1 = very slightly or not at all to 5 = extremely. Mean scores were used for descriptive analyses, while standardized latent scores from the full-sample measurement model were used in HLM.
Perception was divided into landscape and thermal perception. Landscape perception comprised visual, usability, safety, and spatial dimensions. Visual perception (VP) included landscape view, tree shade, vegetation richness, satisfaction with vegetation color, water features, and topography. Usability perception (UP) included facility density, comfort, and facility completeness. Safety perception (SA) included barrier-free design, pavement material, and facility maintenance. Spatial perception (SP) included perceived openness, olfactory comfort, and acoustic comfort. Thermal perception (TP) included thermal comfort, satisfaction, and acceptability. All items used a 5-point Likert scale from very poor or uncomfortable to very good or comfortable.
Recreational activities (RAs) were conceptualized as the overall level of recreational participation, reflected in three complementary dimensions: habitual park use, represented by activity frequency; time investment, represented by activity duration; and activity intensity. Although these indicators capture different aspects of recreational behavior, they were specified as a single latent construct and subsequently evaluated using exploratory factor analysis and the PLS-SEM measurement model. Activity intensity was classified according to Ainsworth’s Compendium of Physical Activities, including sedentary behavior (1–1.5 METs), light activity (1.6–2.9 METs), moderate activity (3.0–5.9 METs), vigorous activity (6.0–8.9 METs), and very vigorous activity (≥9.0 METs). Activity duration was divided into five categories at 0.5 h intervals: <0.5 h, 0.5–1 h, 1–1.5 h, 1.5–2 h, and >2 h. Activity frequency was divided into five categories: 1–2 times per year, 1–2 times per month, once per week, several times per week, and daily.
Spatial environmental characteristics were measured using indicators related to spatial openness, vegetation composition, facility function, and microclimatic characteristics. Spatial openness was represented by the sky view factor. Vegetation composition was measured using the green view index, plant species richness, and vegetation color richness. Facility function was measured using the pavement view index, number of leisure facilities, number of fitness facilities, and number of facility types. Microclimatic characteristics included air temperature (Ta), relative humidity (RH), wind velocity (Va), globe temperature (Tg), and physiological equivalent temperature (PET). The measurement methods and descriptions of these indicators are summarized in Table 1.
Table 1.
Measurement of spatial environmental characteristics.
2.4. Research Hypotheses
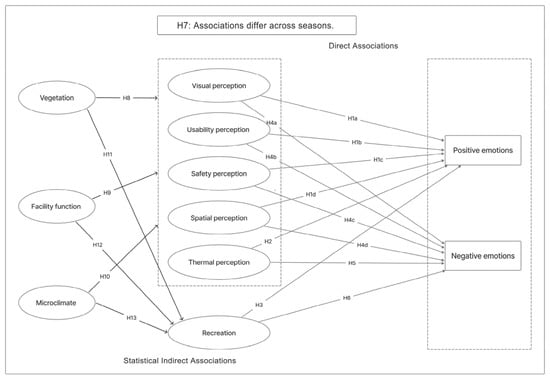
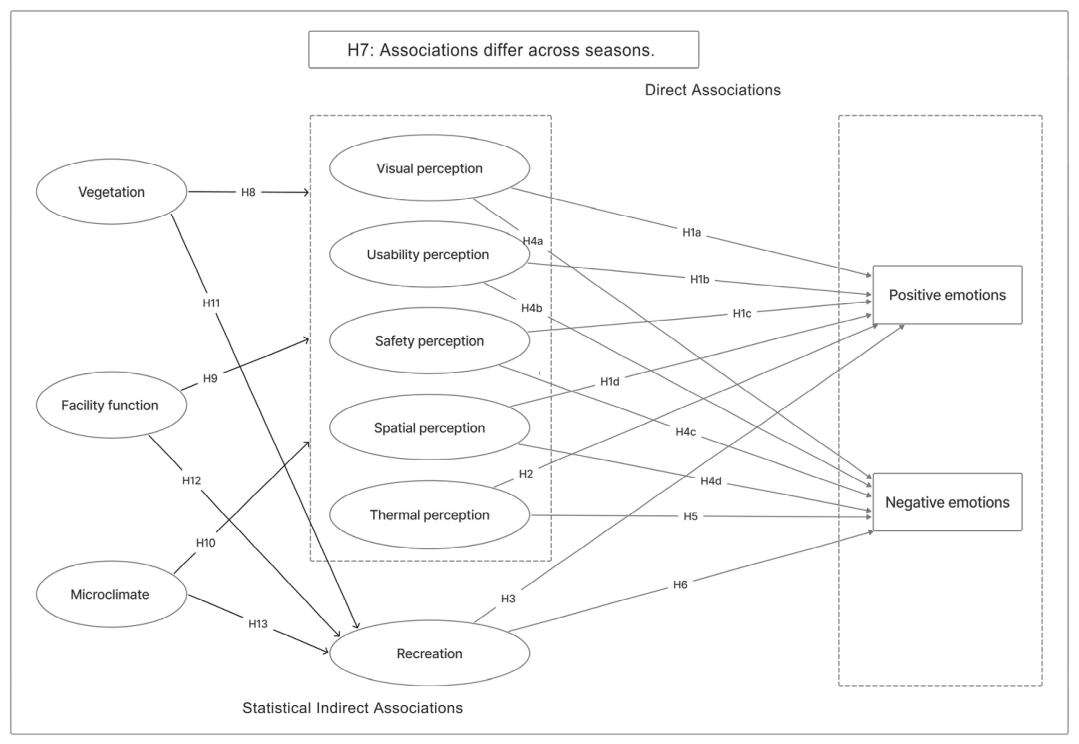
The hypotheses addressed three sets of relationships. H1–H3 proposed positive associations of landscape perception, thermal perception, and recreational activities with positive emotions. H4–H6 proposed negative associations of these variables with negative emotions. H7 proposed that the relationships would differ by season. H8–H13 proposed indirect associations of vegetation composition, facility function, and microclimatic characteristics with emotions through perception or recreational activities (Figure 3, Table 2).
Figure 3.
Hypothesized relationships among environmental characteristics, perception, recreational activities, and emotions.
Table 2.
Summary of research hypotheses.
2.5. Statistical Analysis
Descriptive statistics summarized respondent characteristics and study variables. Scale reliability was assessed using Cronbach’s α. Construct validity was evaluated using exploratory factor analysis and the PLS-SEM measurement model, including the Kaiser–Meyer–Olkin (KMO) test, Bartlett’s test of sphericity, outer loadings, composite reliability (CR), and average variance extracted (AVE). Discriminant validity was assessed using the Fornell–Larcker criterion. Multicollinearity among the spatial environmental variables was examined using variance inflation factors (VIFs). PET and PET squared were included simultaneously to represent potential nonlinear associations, and continuous environmental variables were standardized before model estimation.
PLS-SEM and HLM served complementary analytical purposes. PLS-SEM examined relationships among individual-level latent constructs, whereas HLM accounted for the nested data structure and examined cross-level associations involving space–season environmental characteristics.
PLS-SEM was conducted using SmartPLS 4.0. A full-sample model was first estimated to evaluate the overall associations among the latent constructs and the explanatory power of the structural model. Separate models were then estimated for spring, summer, autumn, and winter. Pairwise interaction models were used to examine landscape–thermal, landscape–recreational, and thermal–recreational interactions. Path significance was assessed using two-tailed bootstrapping with 5000 resamples. Effect sizes were evaluated using f2, with values of 0.02, 0.15, and 0.35 indicating small, medium, and large effects, respectively. Out-of-sample predictive relevance was assessed using the PLSpredict procedure. Positive values indicate predictive relevance relative to the naïve benchmark, and RMSE and MAE were also reported. Measurement invariance across the four seasonal groups was assessed using the measurement invariance of composite models (MICOM) procedure before any cross-season comparison.
HLM was conducted in R Studio-2026.01.1-403. Individual respondents constituted Level 1 and were nested within 24 space–season survey units at Level 2. Standardized latent-variable scores extracted from the full-sample PLS-SEM measurement model were entered into the HLM as observed Level 1 variables. These scores were treated as fixed observed values; consequently, uncertainty associated with their estimation was not propagated into the HLM standard errors. A unified multilevel SEM was not estimated because the dataset contained only 24 Level 2 space–season units, which was insufficient for reliable estimation of the full latent-variable and cross-level structure. Level 1 variables included individual socio-demographic and landscape perception, thermal perception, recreational activities, and emotional responses. Level 2 variables comprised the spatial environmental and microclimatic characteristics of the corresponding space–season units. Random-intercept null models were first estimated, and intraclass correlation coefficients were calculated to assess the proportion of variance attributable to differences between Level 2 units. Three nested HLMs were then constructed: Model 1 included individual-level controls; Model 2 added environmental variables; and Model 3 added perception and recreational activities. Statistical significance was assessed using Monte Carlo simulation with 20,000 repetitions and 95% confidence intervals.
3. Results
3.1. Sample Characteristics
The sample covered six surveyed spaces and four seasons, with relatively more responses collected in spring and autumn. Weekend responses slightly outnumbered weekday responses, and the gender distribution was generally balanced. Respondents aged 18–69 years accounted for 78.0% of the sample, while 80.7% had educational attainment ranging from high school to undergraduate levels.
Walking and public transport were the main modes of park access, together accounting for 74.8% of all trips. Park use was characterized by frequent visits and relatively short stays: 63.3% of respondents visited the park several times per week or daily, and 91.0% stayed for no more than 2 h per visit. Detailed socio-demographic and behavioral characteristics are provided in Appendix B Table A1.
3.2. Temporal and Spatial Differences in Emotional Responses
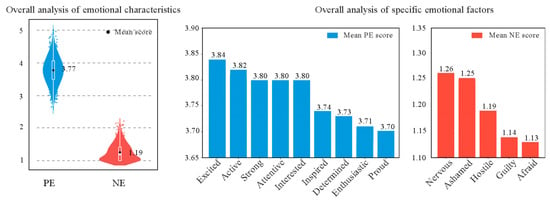
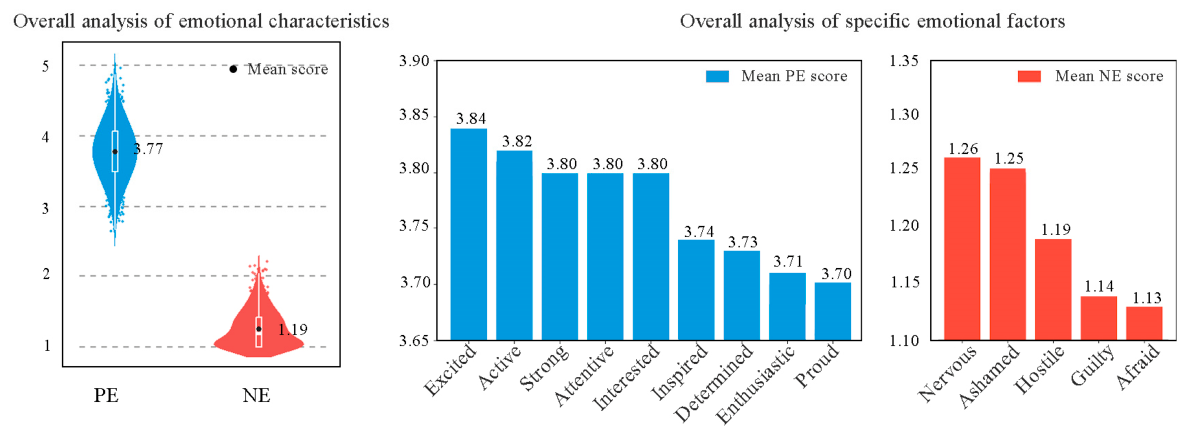
Park users reported relatively high PE and low NE. The mean PE score was 3.77, with a median of 3.89, indicating that positive-emotion scores were concentrated in the upper range. By contrast, the mean NE score was 1.19, indicating generally low levels of NE (Figure 4). Among the positive-emotion items, “Excited” (3.84), “active” (3.82), and “strong” (3.80) received the highest scores, whereas the mean scores of the negative-emotion items ranged from 1.13 to 1.26.
Figure 4.
Distribution of positive and negative emotions.
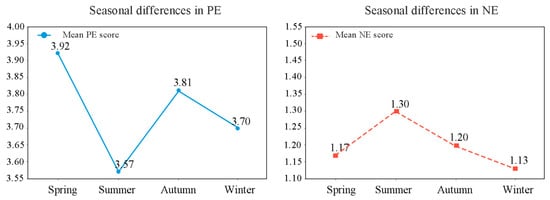
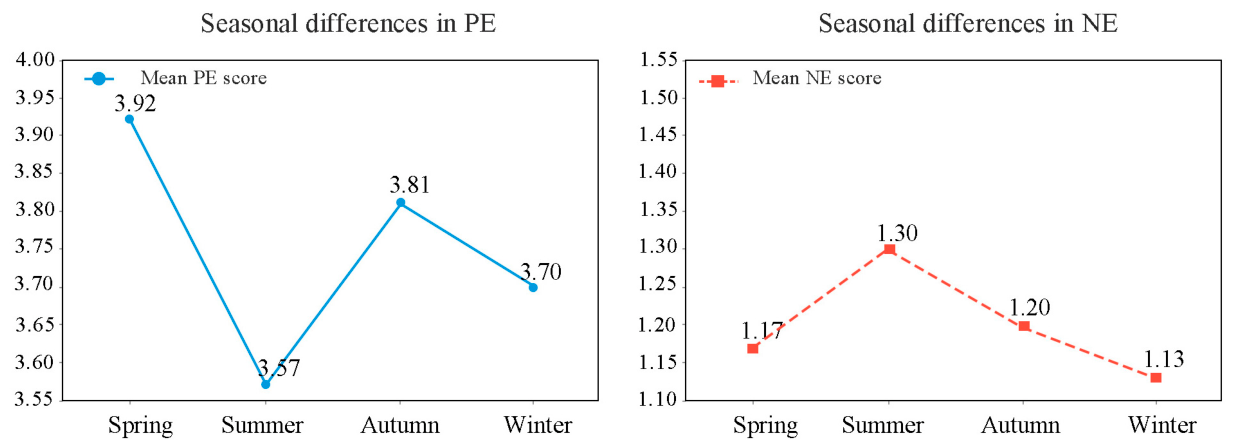
Emotional responses also varied across seasons (Figure 5). PE was highest in spring (3.92), lowest in summer (3.57), and intermediate in autumn (3.81) and winter (3.70). NE showed the opposite pattern, reaching the highest in summer (1.30) and its lowest in winter (1.13). The largest seasonal contrast therefore occurred in summer. Vitality-related positive-emotion items showed the strongest seasonal variation, while “hostile”, “nervous”, and “ashamed” reached their highest values in summer (1.34), suggesting greater emotional discomfort under hot and humid conditions.
Figure 5.
Seasonal patterns in positive and negative emotions.
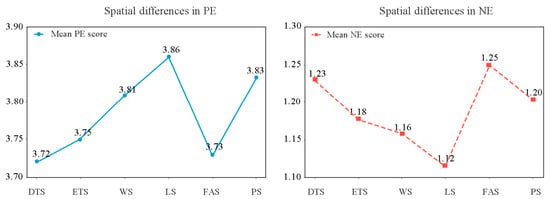
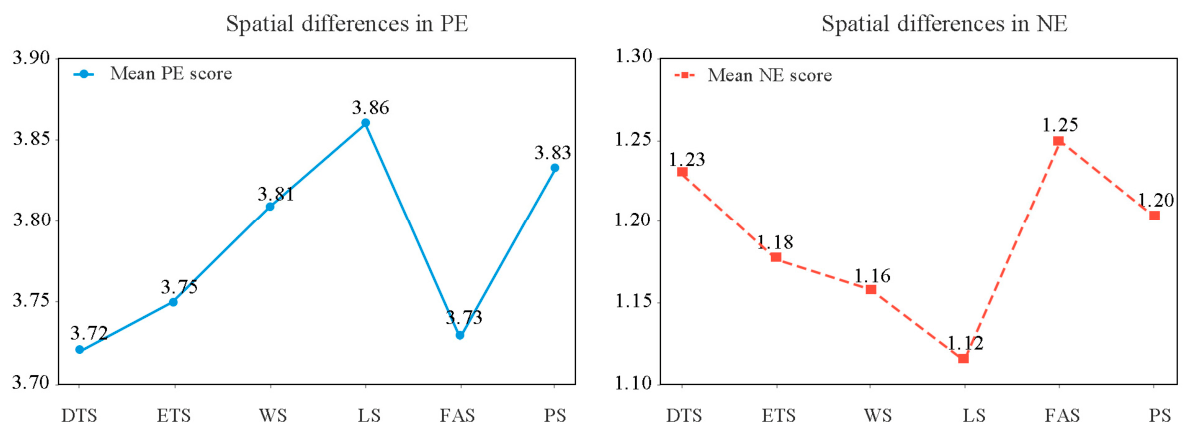
Differences were also observed among the six surveyed spaces (Figure 6). The surveyed lawn space had the highest PE score (3.86) and the lowest NE score (1.12). The surveyed plaza space and waterfront space also showed relatively high PE scores, whereas the surveyed fitness activity space had the highest NE score (1.25) and a relatively low PE score (3.73). The surveyed evergreen-shaded space showed a slightly higher PE score (3.75) and lower NE score (1.18) than the surveyed deciduous-shaded space.
Figure 6.
Emotional responses across the six surveyed spaces.
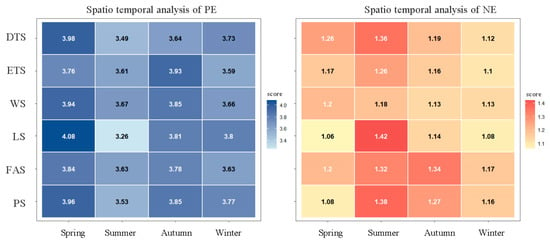
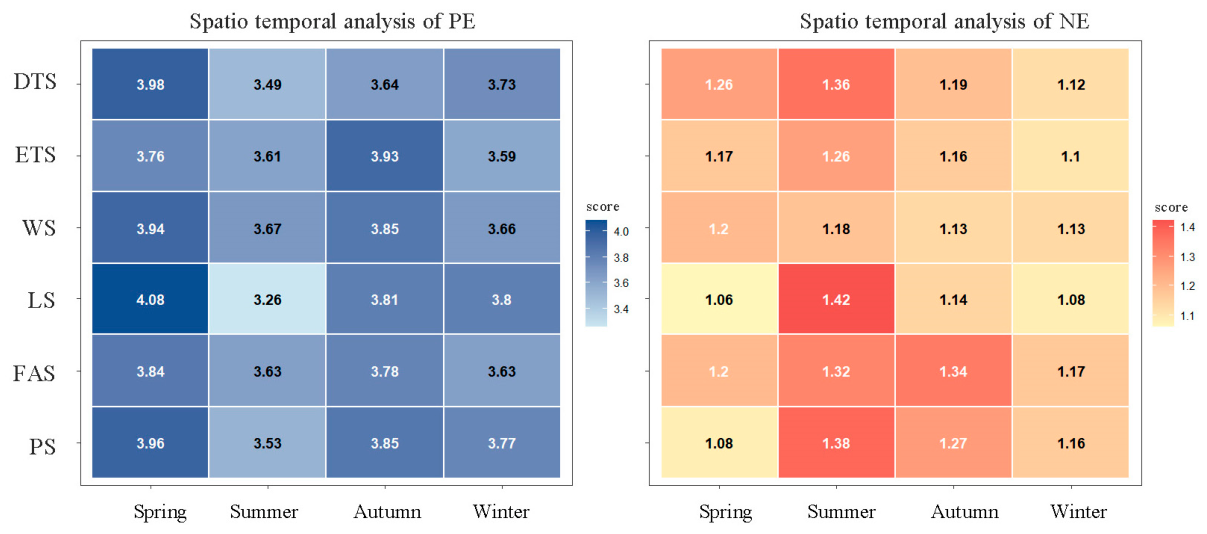
Emotions further varied across combinations of surveyed space and season (Figure 7). The surveyed lawn space showed the largest seasonal fluctuation in PE, decreasing from 4.08 in spring to 3.26 in summer. This pattern suggests that the surveyed lawn space may promote stronger PE under mild climatic conditions but become more sensitive to solar exposure and heat stress in summer. By contrast, the surveyed fitness activity space and waterfront space showed smaller seasonal ranges of 0.23 and 0.29, respectively. NE increased at all six surveyed spaces in summer, with the highest values observed at the surveyed lawn and deciduous-shaded space. In winter, NE generally declined, with the lowest scores observed in the surveyed lawn space (1.07) and evergreen-shaded space (1.10).
Figure 7.
Emotional patterns across surveyed spaces and seasons.
3.3. Measurement Model and Model Diagnostics
The measurement model showed acceptable reliability, convergent validity, and discriminant validity (Appendix B Table A2 and Table A3). Cronbach’s α values ranged from 0.631 to 0.903, CR values ranged from 0.789 to 0.921, and AVE values ranged from 0.557 to 0.688. Outer loadings generally exceeded 0.60, and the Fornell–Larcker criterion was satisfied for all constructs.
Because activity frequency, duration, and intensity capture different behavioral aspects, the recreational-activities construct was examined separately. Exploratory factor analysis supported a single-factor structure, with loadings of 0.876, 0.798, and 0.655, respectively, and no substantial cross-loadings. The corresponding PLS-SEM outer loadings were 0.883, 0.824, and 0.639. The construct showed acceptable reliability and convergent validity (Cronbach’s α = 0.690, CR = 0.829, and AVE = 0.623), and the square root of its AVE (0.789) exceeded its correlations with the other constructs.
The full-sample model explained 44.0% of the variance in PE and 14.1% of the variance in NE. As shown in Table 3, thermal perception had a medium effect on PE, while visual, safety, and usability perceptions and recreational activities had small effects. For NE, thermal and visual perceptions showed small effects, whereas the remaining predictors showed negligible effects. The PLSpredict analysis produced positive values for PE (0.436) and NE (0.140), indicating predictive relevance for both outcomes.
Table 3.
Full-sample structural model and predictive diagnostics.
All retained environmental variables had VIF values below 10, with the highest value for pavement view index (VIF = 6.10). The null models produced ICCs of 15.54% for positive emotions and 5.86% for negative emotions, supporting multilevel analysis.
3.4. Season-Specific Associations of Perception and Recreational Activities with Emotions
The associations of perception and recreational activities with emotions were examined separately for each season (Table 4). The MICOM procedure did not establish measurement invariance across the four seasonal groups. Consequently, seasonal path coefficients were not formally compared, and H7 was not supported. The following results describe the associations identified within each seasonal model.
Table 4.
Season-specific path coefficients from the PLS-SEM models.
Thermal perception was positively associated with PE and negatively associated with NE in all four seasonal models. Visual perception showed the same consistent pattern. Recreational activities were positively associated with PE in summer, autumn, and winter and negatively associated with NE in spring and summer. Usability and safety perceptions were positively associated with PE in all seasons and negatively associated with NE only in summer. Spatial perception was positively associated with PE in spring and autumn but was not associated with NE in any season.
The R2 values ranged from 0.278 to 0.586 for PE and from 0.081 to 0.39 for NE. Because measurement invariance was not established, differences in coefficients and explanatory power are interpreted descriptively.
3.5. Season-Specific Interaction Patterns
Two-way interaction models were estimated separately for each season to examine whether the associations among landscape perception, thermal perception, recreational activities, and emotions were non-additive (Table 5). The results showed that significant interaction effects were identified in different season models.
Table 5.
Season-specific interaction effects on emotions.
In summer, thermal perception interacted with visual perception in relation to NE (β = 0.158, p < 0.001), and with safety perception in relation to PE (β = −0.075, p < 0.05). In autumn, thermal perception interacted with visual perception (β = 0.109, p < 0.001) and spatial perception (β = 0.062, p < 0.05) in relation to PE. The thermal–spatial interaction was also associated with PE in winter (β = 0.102, p < 0.05).
In spring, recreational activities interacted positively with usability perception in relation to PE (β = 0.062, p < 0.05), and negatively with safety perception (β = −0.082, p < 0.01); the latter interaction was also significant in summer (β = −0.072, p < 0.05). Recreational activities interacted with visual perception in relation to NE in summer (β = 0.121, p < 0.05) and with spatial perception in autumn (β = −0.096, p < 0.05) and in winter (β = −0.098, p < 0.05). The thermal–recreational interaction was associated with NE in summer (β = 0.180, p < 0.001) and with PE in autumn (β = 0.075, p < 0.05). These results do not constitute formal evidence of differences between seasons.
3.6. Indirect Associations of Perception and Recreational Activities
3.6.1. Nested Model Comparison
Three nested HLMs were constructed to examine the relationships among individual characteristics, spatial environmental variables, perception, recreational activities, and emotions (Table 6).
Table 6.
Nested model comparison for positive and negative emotions.
In the positive-emotion model, adding spatial environmental characteristics reduced the between-group variance from 0.176 to 0.098. PET2 was negatively associated with PE, while vegetation color richness was positively associated with PE. After perceptual and recreational activities were added in Model 3, these environmental coefficients became non-significant, the between-group variance decreased to 0.031, and marginal R2 increased from 0.107 to 0.447.
In the negative-emotion model, pavement view index, the number of fitness facilities, green view index, PET, and PET2 were significant in Model 2. After perception and recreational activities were introduced, most environmental coefficients were no longer significant, while PET remained significant. Marginal R2 increased from 0.027 to 0.187. These changes are consistent with statistical indirect associations through perceptual variables.
3.6.2. Specific Indirect Associations
Monte Carlo simulations identified indirect effects primarily through perceptual variables, whereas all indirect effects through recreational activities were non-significant. Table 7 therefore reports only the significant perceptual pathways.
Table 7.
Significant statistical indirect associations linking environmental characteristics to emotions.
PET2 showed indirect associations with both PE and NE through visual, spatial, usability, safety, and thermal perception, with thermal perception showing the largest indirect effects. Vegetation color richness was indirectly associated with higher PE and lower NE through thermal, usability, and spatial perception.
The green view index and pavement view index showed adverse indirect associations through thermal and usability perception in the present sample. The number of fitness facilities was also indirectly associated with lower PE and higher NE through visual, thermal, and spatial perception. The number of facility types and plant species richness showed smaller indirect associations through thermal, usability, or spatial perception.
Overall, the HLM results identified significant statistical indirect effects primarily through perceptual variables. Recreational activities were directly associated with emotions in the PLS-SEM models but did not show significant indirect effects between spatial environmental characteristics and emotions.
4. Discussion
4.1. Spatiotemporal Patterns of Emotional Responses Across the Six Surveyed Spaces
Previous studies have reported seasonal variation in emotional benefits of urban parks, with PE generally being higher in spring and autumn than in summer and winter [33,34], and have identified parks as emotional hotspots [35]. Consistent with this evidence, PE in Jiefang Park was highest in spring, and lowest in summer, while NE was highest in summer and lowest in winter. The hot and humid summer conditions recorded during summer were therefore associated with less favorable emotional response.
The surveyed lawn space showed relatively high PE and low NE but also the largest seasonal fluctuations. The fitness activity and waterfront spaces showed smaller fluctuations. These findings are partly consistent with previous evidence on waterfront and shaded environments [12,13]. The relatively high negative-emotion score at the surveyed fitness activity space may be related to its activity intensity, social environment, or other site-specific characteristics.
4.2. Season-Specific Associations, Interactions, and Indirect Pathways
Thermal and visual perceptions were consistently associated with PE and NE in all four seasonal models. These findings align with studies linking thermal comfort and visual landscape quality to emotional and restorative experiences [9,17,19,36]. Recreational activities were associated with PE in the summer, autumn, and winter models and with lower NE in the spring and summer models, supporting evidence that activity in natural environments is related to psychological well-being [37]. Usability and safety perception were associated with lower NE only in the summer model, suggesting that facility and perceived safety may be particularly relevant to emotional experiences under the environmental conditions observed during summer. Because measurement invariance was not established, these patterns cannot be interpreted as formal seasonal moderation.
The interaction models further identified non-additive relationships among perception and recreational activities within particular seasonal samples. In the summer and winter models, the interaction between visual and thermal perception was associated with NE. Given the negative main associations of both variables, these results suggest a possible compensatory relationship between visual quality and thermal perception under thermally stressful conditions. This interpretation is broadly consistent with studies showing that visual, thermal, and multi-sensory comfort jointly contribute to psychological restoration and emotional experience [22,24]. In the autumn model, interactions involving visual, spatial, and thermal perception were associated with positive emotions, suggesting that multiple favorable perceptions may operate jointly under relatively comfortable conditions [38]. Recreational activities also interacted with landscape or thermal perception in several seasonal models, indicating that activity engagement may alter the relationship between perceived environmental conditions and emotions [32].
The cross-level analysis provided further evidence of statistical indirect associations between spatial environmental characteristics and emotions. Significant indirect effects were mainly identified through perceptual variables, while indirect effects through recreational activities were not significant. Vegetation color richness was indirectly associated with higher PE and lower NE through thermal, usability, and spatial perception. This result is consistent with Hao, who showed that plant richness and color diversity can influence environmental perception, preference, and restoration in urban green spaces [21].
By contrast, the green view index showed adverse indirect associations through thermal and usability perception in this sample. This finding suggests that a higher proportion of visible greenery does not necessarily correspond to more favorable emotional responses when it is accompanied by lower perceived thermal comfort or usability. Dense vegetation may, in some settings, reduce visual permeability, ventilation, or perceived accessibility [14]. The pavement view index and the number of fitness facilities also showed adverse indirect associations through perceptual pathways, indicating that landscape and facility configuration may be more relevant than their quantity alone.
Recreational activities may therefore be more directly related to emotional responses than to the transmission of environmental effects. Users may also adjust their activities in response to environmental conditions, for example by moving to shaded areas, shortening their stays, or reducing activity intensity. Such behavior adaptation may weaken stable indirect relationships between objective environmental characteristics, recreational activities, and immediate emotions.
4.3. Implications for Seasonally Adaptive Park Design
The findings suggest that emotionally supportive park design should prioritize perceptual quality, thermal adaptability, and flexible use. Environmental improvements should consider not only physical attributes but also how users experience visual, thermal, spatial, and facility conditions.
Planting design should consider seasonal variation in vegetation structure and visual composition, rather than overall greenness alone. Flowering or visually distinctive plants may strengthen seasonal landscape experiences during warmer periods, whereas evergreen and structurally distinctive vegetation may help maintain visual interest during colder periods. In enclosed or densely planted locations, selective pruning may improve visual permeability and air circulation, thereby supporting spatial openness and thermal perceptions. Planting design may therefore function as a seasonally dynamic perceptual resource rather than a static measure of vegetation quantity.
The findings related to the pavement visibility and the number of fitness facilities suggest that the spatial organization of hardscape and facilities may be more important than provision quantity alone. Dispersed fitness facilities along shaded edges or semi-natural areas may reduce visual concentration and improve environmental exposure. In highly exposed locations, paving materials and shading should be coordinated to limit heat accumulation. Integrating seating, shade, and resting functions into activity areas may also improve perceived usability and allow users to adjust their activities under different environmental conditions.
Thermal perception was consistently associated with emotional responses, highlighting the importance of coordinating shade, solar access, and ventilation. Open areas may support gathering and active use under moderate thermal conditions, while shaded edge spaces can provide alternatives during hot periods. Vegetation structure and canopy configuration can regulate seasonal solar exposure, whereas waterfront spaces may require both summer cooling and winter wind protection. Thermal design should therefore be integrated with spatial organization and activity planning.
The absence of significant indirect associations through recreational activities does not imply that recreational opportunities are unimportant. Instead, activity-related design may be most effective when it enables users to adapt their behavior. Park environments should accommodate both active and passive use, with shaded and sheltered spaces supporting lower-intensity activities during thermal stress and open spaces supporting more active use under moderate conditions. Flexible elements, including movable seating, multifunctional edges, and adaptable activity areas, may further improve seasonal usability.
4.4. Limitations
This study has several limitations. First, the analysis was based on a single comprehensive urban park in Wuhan, and each of the six surveyed spaces was represented by only one physical location. The designated spatial characteristics were therefore confounded with other site-specific conditions. Moreover, the Level 2 analysis included only 24 space–season units relative to the number of environmental predictors, which may have limited the precision and stability of the cross-level estimates. Standardized latent scores were treated as observed variables in the HLM, so uncertainty associated with their estimation was not propagated into the HLM standard errors. The limited number of Level 2 units also made reliable estimation of a unified multilevel SEM difficult. Future studies should include multiple locations representing each spatial setting and a larger number of upper-level units across different parks and climatic regions.
Second, the study used a cross-sectional design, and different users were surveyed in each seasonal investigation. The relationships represent associations rather than causal effects or within-person seasonal changes. Similarly, the identified indirect pathways should be interpreted as statistical indirect effects rather than confirmed causal mechanisms. Future research could adopt longitudinal or repeated-measures designs to provide stronger evidence regarding seasonal changes and environment–emotion relationships.
Third, measurement invariance was not established across seasonal samples. Consequently, seasonal path coefficients could not be formally compared, and H7 was not supported. Future research should refine the measurement instrument, include multiple comparable locations, and use longitudinal or repeated-measures designs.
5. Conclusions
Using four-season field survey data from six locations in Jiefang Park, Wuhan, this study examined the associations of spatial environmental characteristics, perception, and recreational activities with users’ positive and negative emotions. Emotional responses varied across the four survey seasons and among the six surveyed locations. The surveyed lawn space had the highest positive-emotion score and the lowest negative-emotion score, whereas the surveyed fitness activity space had the highest negative-emotion score. The surveyed fitness activity and waterfront spaces showed smaller seasonal fluctuations than the other surveyed locations.
Thermal and visual perception were consistently associated with emotional responses across the season-specific models. Usability, safety, spatial perception and recreational activities showed different patterns of significance within four seasonal samples. However, measurement invariance across seasons was not established; therefore, the seasonal path coefficients could not be formally compared, and H7 was not supported.
The interaction models identified non-additive relationships among landscape perception, thermal perception, and recreational activities within particular seasonal samples. The multilevel analysis showed significant indirect associations mainly through perceptual variables, whereas indirect effects through recreational activities were not significant. Vegetation color richness showed favorable indirect associations, while green view index, pavement view index, and the number of fitness facilities showed adverse indirect associations at the surveyed locations. Park design and management should therefore coordinate visual quality, thermal adaptability, spatial usability, and flexible recreational opportunities. Multi-site and longitudinal studies are needed to determine whether these associations apply to other parks and climatic contexts.
Author Contributions
L.C. and X.Y. contributed equally to this work and share first authorship. Conceptualization, L.C., X.Y. and L.Z.; methodology, L.C. and X.Y.; investigation, L.C., X.Y. and W.Z.; resources, L.C., X.Y. and W.Z.; data curation, L.C., X.Y. and W.Z.; writing—original draft preparation, L.C. and X.Y.; writing—review and editing, L.Z.; supervision, L.Z.; project administration, L.Z.; funding acquisition, L.Z. All authors have read and agreed to the published version of the manuscript.
Funding
This research is supported by the Science and Technology Program of Hubei Province (CN) (No. 2025EHA054), the Fundamental Research Funds for the Central Universities (No. 2662023YLPY006) and the Shijing Education Funds (No. SJJQ202603).
Data Availability Statement
The data presented in this study are available from the corresponding author upon reasonable request.
Conflicts of Interest
The authors declare no conflicts of interest. Xiaotian Yang is employed by Wuhan Jianghua Urban Development Consulting Co., Ltd. Li Zhang is employed by International Science and Technology Cooperation Base for Urban and Rural Human Settlements and Environmental Sciences.
Abbreviations
The following abbreviations are used in this manuscript:
| Abbreviation | Full form |
| AVE | average variance extracted |
| CR | composite reliability |
| DTS | shaded space with deciduous trees |
| EFA | exploratory factor analysis |
| ETS | shaded space with evergreen trees |
| FAS | fitness activity space |
| NFF | number of fitness facilities |
| GVI | green view index |
| HLM | hierarchical linear modeling |
| ICC | intraclass correlation coefficient |
| KMO | Kaiser–Meyer–Olkin |
| NLF | Number of leisure facilities |
| LS | lawn space |
| MET | metabolic equivalent |
| NE | negative emotions |
| NFT | number of facility types |
| PANAS | Positive and Negative Affect Schedule |
| PE | positive emotions |
| PET | physiological equivalent temperature |
| PLS-SEM | partial least squares structural equation modeling |
| PS | plaza space |
| PVI | pavement view index |
| RA | recreational activities |
| RH | relative humidity |
| SA | safety perception |
| SP | spatial perception |
| SR | plant species richness |
| SVF | sky view factor |
| Ta | air temperature |
| Tg | globe temperature |
| Tmrt | mean radiant temperature |
| TP | thermal perception |
| UP | usability perception |
| Va | wind velocity |
| VCR | vegetation color richness |
| VIF | variance inflation factor |
| VP | visual perception |
| WS | waterfront space |
Appendix A. Questionnaire
Questionnaire on Emotions, Perception, and Recreational Characteristics in Jiefang Park Green Spaces.
| Part I. Basic Information | |||||||||
| Your gender: | |||||||||
| □ Male | □ Female | ||||||||
| Your age: | |||||||||
| □ 13–17 | □ 18–45 | □ 46–69 | □ 70 or above | ||||||
| Your education level: | |||||||||
| □ Junior high school or below | □ Senior high school or technical secondary school | ||||||||
| □ Bachelor’s degree/college | □ Master’s degree or higher | ||||||||
| Part II. Travel and Visit Characteristics | |||||||||
| How do you get to the park? | |||||||||
| □ Walk | □ Bike | □ Bus/subway | □ Car | □ Taxi/ride-hailing | |||||
| How long does it take you to reach the park? | |||||||||
| □ Within 15 min | □ 15–30 min | □ 30–60 min | □ 60–90 min | □ More than 90 min | |||||
| How long have you stayed in the park? | |||||||||
| □ <1 h | □ 1–2 h | □ 2–3 h | □ 3–4 h | □ >4 h | |||||
| How often do you visit this park? | |||||||||
| □ Every day | □ Several times a week | □ Once a week | □ 1–2 times a month | ||||||
| □ 1–2 times a year | |||||||||
| Part III. Recreational Characteristics | |||||||||
| Which activities do you do in this space? (Multiple choices allowed) | |||||||||
| □ Chess/cards | □ Sitting quietly | □ Reading | □ Picnic | □ Taking photos | |||||
| □ Walking | □ Chatting | □ Dating/matchmaking | □ Kite flying | ||||||
| □ Playing musical instruments | □ Stretching | □ Jogging/running | |||||||
| □ Observing nature | □ Traditional opera | □ Sword dancing | □ Tai chi | ||||||
| □ Fitness training | □ Basketball | □ Dancing | □ Frisbee | □ Square dancing | |||||
| □ Badminton | □ Table tennis | □ Football | □ Roller skating | □ Skateboarding | |||||
| □ Jumping rope | □ Parent-child activities | □ Walking dog | □ Other: ______ | ||||||
| How long do you usually spend on these activities in this space? | |||||||||
| □ 0–0.5 h | □ 0.5–1 h | □ 1–1.5 h | □ 1.5–2 h | □ >2 h | |||||
| How often do you perform these activities in this space? | |||||||||
| □ Every day | □ Several times a week | □ Once a week | □ 1–2 times a month | ||||||
| □ 1–2 times a year | |||||||||
| Part IV. Thermal Perception | |||||||||
| How comfortable do you feel with the current climate (temperature, humidity, wind) in this space? | |||||||||
| □ Very uncomfortable | □ Uncomfortable | □ Neutral | □ Comfortable | ||||||
| □ Very comfortable | |||||||||
| How satisfied are you with the current climate (temperature, humidity, wind) in this space? | |||||||||
| □ Very dissatisfied | □ Dissatisfied | □ Neutral | □ Satisfied | □ Very satisfied | |||||
| How acceptable is the current climate (temperature, humidity, wind) in this space to you? | |||||||||
| □ Completely unacceptable | □ Somewhat unacceptable | □ Neutral | □ Somewhat acceptable | □ Completely acceptable | |||||
Part V. Landscape Perception
Please rate the following landscape features of this area.
| Perceptual Dimension | 1 = Very Poor | 2 = Poor | 3 = Neutral | 4 = Good | 5 = Very Good |
| Visual openness | |||||
| Canopy shade | |||||
| Vegetation color satisfaction | |||||
| Vegetation richness | |||||
| Water features | |||||
| Topography | |||||
| Facility density | |||||
| Facility comfort | |||||
| Facility maintenance | |||||
| Sense of spatial openness | |||||
| Acoustic comfort | |||||
| Olfactory comfort | |||||
| Barrier-free design | |||||
| Pavement material |
Part VI. Emotional Characteristics (PANAS)
Please describe your overall feelings in this space. Choose the extent to which you feel each emotion.
| Emotion | 1 = Very Slightly or Not at All | 2 = a Little | 3 = Moderately | 4 = Quite a Bit | 5 = Extremely |
| Interested | |||||
| Distressed | |||||
| Excited | |||||
| Upset | |||||
| Strong | |||||
| Guilty | |||||
| Scared | |||||
| Hostile | |||||
| Enthusiastic | |||||
| Proud | |||||
| Irritable | |||||
| Alert | |||||
| Ashamed | |||||
| Inspired | |||||
| Nervous | |||||
| Determined | |||||
| Attentive | |||||
| Jittery | |||||
| Active | |||||
| Afraid | |||||
| Note: The English terms correspond to the PANAS (Positive and Negative Affect Schedule) items used in the study. The order follows the original Chinese questionnaire. | |||||
Appendix B
Table A1.
Descriptive statistics of respondents’ demographic characteristics.
Table A2.
Reliability and Convergent Validity of the Measurement Model.
Table A3.
Discriminant validity based on the Fornell–Larcker criterion.
References
- Liu, H.; Pang, Y.; Jiao, M.; Sun, X.; Ren, H.; Luo, L.; Han, T.; Li, Y.; Zheng, S.; Sui, C. Greenspace Exposure and Its Dual Role as Mediator and Moderator in the Relationship between Urban Density and Mental Health. Landsc. Urban Plan. 2025, 264, 105497. [Google Scholar] [CrossRef] [Scilit]
- Veckalne, R.; Saidkhodjaev, A.; Tambovceva, T. Public Perceptions of Urban Green Spaces: Effects on Physical and Mental Health. Urban Sci. 2025, 9, 128. [Google Scholar] [CrossRef] [Scilit]
- Dietz, L.W.; Šćepanović, S.; Zhou, K.; Zanella, A.F.; Quercia, D. Understanding the Potential of Urban Parks to Promote Well-Being. Nat. Cities 2025, 2, 1205–1216. [Google Scholar] [CrossRef] [Scilit]
- Olsen, J.R.; Nicholls, N.; Caryl, F.M.; Astell-Burt, T.; Pell, J.P.; Lyall, D.M.; Ho, F.K.; Feng, X.; Mitchell, R. Characteristics of Parks Associated with Depression in Women Only: A Cross-Sectional Study of 329,363 Adults. BMC Med. 2026, 24, 98. [Google Scholar] [CrossRef] [Scilit]
- Plunz, R.A.; Zhou, Y.; Carrasco Vintimilla, M.I.; Mckeown, K.; Yu, T.; Uguccioni, L.; Sutto, M.P. Twitter Sentiment in New York City Parks as Measure of Well-Being. Landsc. Urban Plan. 2019, 189, 235–246. [Google Scholar] [CrossRef] [Scilit]
- Zheng, Y.; Cheng, B.; Dong, L.; Zheng, T.; Wu, R. The Moderating Effect of Social Participation on the Relationship between Urban Green Space and the Mental Health of Older Adults: A Case Study in China. Land 2024, 13, 317. [Google Scholar] [CrossRef] [Scilit]
- Fischer, L.K.; Honold, J.; Botzat, A.; Brinkmeyer, D.; Cvejić, R.; Delshammar, T.; Elands, B.; Haase, D.; Kabisch, N.; Karle, S.J.; et al. Recreational Ecosystem Services in European Cities: Sociocultural and Geographical Contexts Matter for Park Use. Ecosyst. Serv. 2018, 31, 455–467. [Google Scholar] [CrossRef] [Scilit]
- Huang, D.; Tian, M.; Yuan, L. Sustainable Design of Running Friendly Streets: Environmental Exposures Predict Runnability by Volunteered Geographic Information and Multilevel Model Approaches. Sustain. Cities Soc. 2023, 89, 104336. [Google Scholar] [CrossRef] [Scilit]
- Xin, B.; Zhu, C.; Geng, J.; Liu, Y. Emotional Perceptions of Thermal Comfort for People Exposed to Green Spaces Characterized Using Streetscapes in Urban Parks. Land 2024, 13, 1515. [Google Scholar] [CrossRef] [Scilit]
- Liu, Y.; Fan, J.; Xie, S.; Chen, X. Study on the Spatial and Temporal Distribution of Thermal Comfort and Its Influencing Factors in Urban Parks. Atmosphere 2024, 15, 183. [Google Scholar] [CrossRef] [Scilit]
- Rosso-Alvarez, J.; Jiménez-Caldera, J.; Campo-Daza, G.; Hernández-Sabié, R.; Caballero-Calvo, A. Integrating Objective and Subjective Thermal Comfort Assessments in Urban Park Design: A Case Study of Monteria, Colombia. Urban Sci. 2025, 9, 139. [Google Scholar] [CrossRef] [Scilit]
- Li, Y.; Zhang, J.; Jiang, B.; Li, H.; Zhao, B. Do All Types of Restorative Environments in the Urban Park Provide the Same Level of Benefits for Young Adults? A Field Experiment in Nanjing, China. Forests 2023, 14, 1400. [Google Scholar] [CrossRef] [Scilit]
- Kong, L.; Liu, Z.; Pan, X.; Wang, Y.; Guo, X.; Wu, J. How Do Different Types and Landscape Attributes of Urban Parks Affect Visitors’ Positive Emotions? Landsc. Urban Plan. 2022, 226, 104482. [Google Scholar] [CrossRef] [Scilit]
- Lu, S.; Oh, W.; Ooka, R.; Wang, L. Effects of Environmental Features in Small Public Urban Green Spaces on Older Adults’ Mental Restoration: Evidence from Tokyo. Int. J. Environ. Res. Public Health 2022, 19, 5477. [Google Scholar] [CrossRef] [Scilit] [PubMed]
- Ge, Y.; Guo, Y.; Ma, Y.; Ma, S.; Liu, Y.; Qin, X. A Study on the Relationship between Internet Popularity and Emotional Perception of Urban Parks Using Weibo Data in Luoyang, China. Sci. Rep. 2025, 15, 9940. [Google Scholar] [CrossRef] [Scilit] [PubMed]
- McCormack, G.R.; Rock, M.; Toohey, A.M.; Hignell, D. Characteristics of Urban Parks Associated with Park Use and Physical Activity: A Review of Qualitative Research. Health Place 2010, 16, 712–726. [Google Scholar] [CrossRef] [Scilit] [PubMed]
- Niu, J.; Xiong, J.; Qin, H.; Wu, H.; Zhang, K.; Yan, J.; Ye, L.; Han, G. Thermal Comfort Influences Positive Emotions but Not Negative Emotions When Visiting Green Spaces during Summer. Forests 2023, 14, 1512. [Google Scholar] [CrossRef] [Scilit]
- Suneja, M. Heat, Shade and Mood: Linking Thermal Comfort to Emotional Response in Urban Green Spaces. In Proceedings of the 12th International Conference on Urban Climate (ICUC12), Rotterdam, The Netherlands, 7–11 July 2025. [Google Scholar] [CrossRef] [Scilit]
- Song, S.; Xiao, Y.; Tu, R.; Yin, S. Effects of Thermal Perception on Restorative Benefits by Green Space Exposure: A Pilot Study in Hot-Humid China. Urban Clim. 2024, 53, 101767. [Google Scholar] [CrossRef] [Scilit]
- Li, W.; Liu, Y. The Influence of Visual and Auditory Environments in Parks on Visitors’ Landscape Preference, Emotional State, and Perceived Restorativeness. Humanit. Soc. Sci. Commun. 2024, 11, 1491. [Google Scholar] [CrossRef] [Scilit]
- Hao, J.; Gao, T.; Qiu, L. How Do Species Richness and Colour Diversity of Plants Affect Public Perception, Preference and Sense of Restoration in Urban Green Spaces? Urban For. Urban Green. 2024, 100, 128487. [Google Scholar] [CrossRef] [Scilit]
- Gao, M.; Zhu, X. Reclaiming Winter: How Visual, Thermal, and Acoustic Comfort Shape Psychological Restoration in Severe Cold Urban Parks. Build. Environ. 2025, 271, 112597. [Google Scholar] [CrossRef] [Scilit]
- Wang, H.; Qu, Y.; Chen, Y. How Natural and Artificial Park Features Influence Older Adults’ Visiting Behaviors and Mental Health: Evidence from a Psychological Survey in China. City Environ. Interact. 2025, 27, 100238. [Google Scholar] [CrossRef] [Scilit]
- Liu, C.; Tang, L.; Yan, J.; Ouyang, J. Direct and Indirect Effects of Multisensory Modalities on Visitor’s Thermal Comfort in an Urban Park in a Humid-Hot Climate. Int. J. Sustain. Dev. World Ecol. 2023, 30, 319–328. [Google Scholar] [CrossRef] [Scilit]
- Gonçalves, P.; Grilo, F.; Mendes, R.C.; Vierikko, K.; Elands, B.; Marques, T.A.; Santos-Reis, M. What’s Biodiversity Got to Do with It? Perceptions of Biodiversity and Restorativeness in Urban Parks. Ecol. Soc. 2021, 26, 25. [Google Scholar] [CrossRef] [Scilit]
- Yang, A.; Cheng, W.; Yang, J.; Cai, C.; Li, H.; Yang, D. Unveiling Disparities: A Social Media Analysis of Urban Park Usage and Sentiments in Oklahoma City. GeoJournal 2024, 89, 173. [Google Scholar] [CrossRef] [Scilit]
- Zhang, B.; Song, Y.; Liu, D.; Zeng, Z.; Guo, S.; Yang, Q.; Wen, Y.; Wang, W.; Shen, X. Descriptive and Network Post-Occupancy Evaluation of the Urban Public Space through Social Media: A Case Study of Bryant Park, NY. Land 2023, 12, 1403. [Google Scholar] [CrossRef] [Scilit]
- Petrunoff, N.A.; Edney, S.; Yi, N.X.; Dickens, B.L.; Joel, K.R.; Xin, W.N.; Sia, A.; Leong, D.; Van Dam, R.M.; Cook, A.R.; et al. Associations of Park Features with Park Use and Park-Based Physical Activity in an Urban Environment in Asia: A Cross-Sectional Study. Health Place 2022, 75, 102790. [Google Scholar] [CrossRef] [Scilit] [PubMed]
- Wang, H.; Rodiek, S. Older Adults’ Preference for Landscape Features Along Urban Park Walkways in Nanjing, China. Int. J. Environ. Res. Public Health 2019, 16, 3808. [Google Scholar] [CrossRef] [Scilit] [PubMed]
- Chen, L.; Liu, L.; Wu, H.; Peng, Z.; Sun, Z. Change of Residents’ Attitudes and Behaviors toward Urban Green Space Pre- and Post- COVID-19 Pandemic. Land 2022, 11, 1051. [Google Scholar] [CrossRef] [Scilit]
- Yang, D.; Xie, S.; Su, R.; Wu, W. Urban Park Restorative Effects in an Integrated Model of Positive Emotion and Leisure Involvement Moderation. Sci. Rep. 2025, 15, 34100. [Google Scholar] [CrossRef] [Scilit] [PubMed]
- Niu, J.; Zhang, K.; Chen, J.; Qin, H.; Wei, X.; Huo, J.; Wu, H.; Han, G.; Yan, J. Interrelationships among Physical Activity, Positive Emotion, and Thermal Sensation in Urban Park Green Spaces: An Empirical Study in Chongqing, China. Build. Environ. 2025, 270, 112567. [Google Scholar] [CrossRef] [Scilit]
- Liang, H.; Yan, Q.; Yan, Y.; Zhang, L.; Zhang, Q. Spatiotemporal Study of Park Sentiments at Metropolitan Scale Using Multiple Social Media Data. Land 2022, 11, 1497. [Google Scholar] [CrossRef] [Scilit]
- Ma, Y.; Yang, Y.; Jiao, H. Exploring the Impact of Urban Built Environment on Public Emotions Based on Social Media Data: A Case Study of Wuhan. Land 2021, 10, 986. [Google Scholar] [CrossRef] [Scilit]
- Li, Z.; Wu, X.; Wu, J.; Liu, H. The Influence of Urban Landscape Ecology on Emotional Well-Being: A Case Study of Downtown Beijing. Land 2025, 14, 519. [Google Scholar] [CrossRef] [Scilit]
- Jin, T.; Lu, J.; Shao, Y. Exploring the Impact of Visual and Aural Elements in Urban Parks on Human Behavior and Emotional Responses. Land 2024, 13, 1468. [Google Scholar] [CrossRef] [Scilit]
- Barton, J.; Pretty, J. What Is the Best Dose of Nature and Green Exercise for Improving Mental Health? A Multi-Study Analysis. Environ. Sci. Technol. 2010, 44, 3947–3955. [Google Scholar] [CrossRef] [Scilit] [PubMed]
- Lyu, B.; Gao, Z.; Wang, Y.; Liu, J.; Zhang, L.; Song, J.; Pan, Y.; Cheng, M.; Liu, S.; Chen, Q.; et al. Seasonal Dynamics and Trade-Offs/Synergies of Cultural Ecosystem Services in Urban Parks: A Case Study of Chengdu, China. Land 2025, 14, 2126. [Google Scholar] [CrossRef] [Scilit]

Disclaimer/Publisher’s Note: The statements, opinions and data contained in all publications are solely those of the individual author(s) and contributor(s) and not of MDPI and/or the editor(s). MDPI and/or the editor(s) disclaim responsibility for any injury to people or property resulting from any ideas, methods, instructions or products referred to in the content. |
© 2026 by the authors. Licensee MDPI, Basel, Switzerland. This article is an open access article distributed under the terms and conditions of the Creative Commons Attribution (CC BY) license.