


Abstract
Coastal cities are highly sensitive and vulnerable to climate change risks. A scientifically grounded assessment of urban climate change risk and its driving mechanisms is essential for strengthening urban climate adaptation capacity and supporting sustainable development. Taking Ningbo as the study area, this paper constructs a risk assessment system comprising five categories of extreme climate indicators, namely heat, rainstorm, drought, humidity, and strong wind, based on the China Surface Climate Normals Dataset for 1981–2010 and meteorological observations from the National Centers for Environmental Information (NCEI) for 2015–2024. Using 30 m resolution land-use data for 2023, three land-use sensitivity indicators are extracted: the proportion of built-up land, the proportion of green space and forest land, and the proportion of water area. The CRITIC objective weighting method is then applied to construct an integrated climate change risk index and identify the spatial pattern of climate change risk in Ningbo. On this basis, the high-risk area identification performance of Logistic Regression, Random Forest, and XGBoost is compared. The optimal XGBoost model is selected and combined with the SHAP method to systematically reveal the direction, relative importance, and nonlinear threshold relationships through which land-use characteristics affect the formation of high-risk areas. The results show that urban climate change risk in Ningbo exhibits a pronounced spatial differentiation pattern, with higher risk in the northeastern coastal and central–eastern areas and lower risk in the western and southwestern areas. Insufficient green space and forest land buffering is the most important factor affecting the formation of high-risk areas. All three land-use variables have clear nonlinear thresholds. The critical turning points for identifying high-risk areas are 20.0% built-up land, 2.0% green space and forest land, and whether there is a water body or not. Significant interaction effects are observed among land-use variables, among which the interaction between built-up land and green space/forest land is the most prominent. These findings provide methodological support and empirical evidence for climate change risk assessment and climate-adaptive spatial planning regulation in coastal cities.
1. Introduction
1.1. Research Background
Climate warming has become a global ecological and environmental crisis of shared concern. The increasing frequency of extreme climate events and the continuing escalation of climate-related risks have become central challenges for global development in the twenty-first century [1]. The World Economic Forum Global Risks Report 2022 identifies climate-related risks among the most critical global risks over the coming decade [2]. The IPCC Sixth Assessment Report confirms that the most recent 50 years have been the warmest period in the past two millennia; the global mean temperature in 2015–2019 was 1.1 degrees C higher than the pre-industrial level, and the intensity, duration, and spatial extent of extreme events such as heat waves, heavy rainfall, flooding, typhoons, and storm surges have continued to expand [3]. The IPCC Climate Change 2022 report further indicated that climate change directly affects the functioning of urban systems, while urban spatial form, land development patterns, and infrastructure conditions can also reshape the manifestation and magnitude of climate risks [4]. Therefore, urban climate risk assessment should not only identify the spatial distribution of extreme climate hazards, such as heat, rainstorms, drought, and strong wind, but also further examine how different land-use and built-environment characteristics within cities amplify or mitigate climate risks.
According to the IPCC risk assessment framework, climate risk is generally understood as the outcome of the interaction among climate hazards, exposure, and vulnerability, namely the H–E–V framework [3,5]. Based on this framework, this study develops a spatially simplified framework for identifying intra-urban climate risks in Ningbo. In this study, climate hazards are represented by extreme climate indicators, while land-use sensitivity is used to characterise the urban physical–spatial conditions that may amplify or mitigate climate risks. Specifically, construction land reflects the concentration of artificial underlying surfaces and urban physical exposure, whereas green space, forest land, and water bodies indicate ecological buffering capacity and local climate-regulating functions.
China is highly sensitive to climate change and has been substantially affected by its impacts. Its warming rate is higher than the global average for the same period, and extreme weather and climate events have become more frequent and intense [6]. The Global Climate Risk Index 2021 reports a climate risk index of 42.83 for China, ranking it 32nd globally, which indicates substantial pressure for climate risk prevention and control [7]. The Blue Book on Climate Change in China (2025) further shows that extreme weather and climate events in China have increased and intensified, with a rising climate risk index. Since the mid-1990s, China’s climate risk index has remained relatively high; in 2024, it reached its highest level since 1961 [8].
Land-use change is a critical linkage between human activities and local climate change [9]. Different land-use types produce differentiated climatic effects by altering surface albedo, evapotranspiration capacity, and hydrological regulation processes. Continuous built-up land aggravates the thermal environment, increases surface runoff, and raises climate risk, whereas ecological spaces such as green land, forest land, and water bodies buffer risk through cooling and interception functions [10,11]. From the perspective of social–ecological–technological systems (SETS), urban climate risk is not determined by a single natural process, but emerges from the coupled interactions among social activities, ecological processes, and technological infrastructure [12]. Within this framework, land-use structure reflects both urban construction activities and infrastructure layout, while also representing the regulating capacity of ecological spaces such as green land, forest land, and water bodies. It therefore serves as an important spatial carrier linking climate hazard, urban exposure, and ecological buffering capacity [13]. A coupled analysis of land use and integrated urban climate risk, including their interaction mechanisms, can provide quantitative evidence for optimising spatial layout and advancing climate-adaptive urban development in coastal cities [14], and therefore has both theoretical and practical significance.
1.2. Research on the Relationship Between Land Use and Urban Climate Change Risk
Land use is a core anthropogenic driver that regulates the local urban climate and shapes the spatial differentiation of climate risk [15]. It is also an interdisciplinary research focus in urban climatology, urban and rural planning, and risk management. A large body of empirical evidence shows that the expansion of built-up land and impermeable surfaces reduces surface albedo, changes surface thermal properties, and intensifies the urban heat-island effect. It also blocks rainfall infiltration, increases surface runoff coefficients, and amplifies rainstorm waterlogging risk [15,16]. In contrast, green spaces and forest land cool and humidify the local environment through vegetation transpiration and canopy shading, while also intercepting rainfall and conserving soil and water. Water bodies regulate climate and manage pluvial flooding through high heat capacity and flood-storage functions [17,18]. These ecological and blue spaces are therefore key spatial carriers for mitigating urban climate risk.
Traditional studies have often used correlation analysis and conventional regression models to test linear relationships between land-use proportions and climatic indicators such as land surface temperature and precipitation. However, urban systems are highly complex, and the impact of land use on climate risk commonly involves nonlinear responses, threshold effects, and multi-factor interactions. Conventional statistical models are therefore limited in capturing these processes [19]. Explainable machine learning can provide explicit model interpretation [20], but its application to urban climate change risk research remains limited, restricting the transfer of machine learning results into territorial spatial planning practice.
The main contributions of this study are threefold. First, it constructs an urban climate change risk assessment framework based on extreme climate hazards and land-use sensitivity and identifies the spatial differentiation of climate change risk in Ningbo. Second, it uses XGBoost and SHAP to explain the relationship between land-use sensitivity variables and high-risk area identification, revealing the relative contributions, threshold responses, and interaction characteristics of built-up land ratio, green/forest buffering insufficiency, and water regulation insufficiency. Third, it integrates climate hazard, land-use sensitivity, and model interpretation results to provide a spatial identification basis for climate-adaptive planning in Ningbo.
2. Materials and Methods
2.1. Study Area
The study area is Ningbo. Ningbo is located in the Southern Yangtze River Delta and faces the East China Sea. As one of China’s major coastal port cities, it is affected by the combined influence of the marine monsoon, typhoon circulation, and local urban underlying surfaces. Extreme heat, rainstorm-induced waterlogging, storm surges, and other hazards occur frequently, making its climate vulnerability particularly pronounced [21]. Ningbo is currently undergoing urban expansion, industrial upgrading, and territorial spatial optimisation. Rapid restructuring of land-use patterns, disorderly expansion of urban construction land, continuous growth of impervious surfaces, and the encroachment of primary ecological space have further intensified the urban heat-island and rain-island effects and exacerbated the spatial differentiation of climate risk [22,23].
Figure 1 shows the geographical location of Ningbo. Its landform is jointly shaped by coastal plains, hilly and mountainous terrain, and island coastlines, resulting in a diverse geomorphological structure and an interwoven pattern of urban construction space and ecological space. Ningbo administers six districts, including Jiangbei, Zhenhai, Beilun, Yinzhou, and Fenghua; two counties, Xiangshan and Ninghai; and two county-level cities, Yuyao and Cixi. This study uses the administrative boundary of Ningbo as the research boundary. The basic administrative boundary data are obtained from the 2024 edition of the National Platform for Common Geospatial Information Services (Tianditu) [24].
Figure 1.
Geographical location of Ningbo: (a) location of Zhejiang Province; (b) location of Ningbo within Zhejiang Province; (c) internal geographical setting of Ningbo. Map approval number: GS (2024) 0650.
2.2. Data Sources
2.2.1. Climate Data
The climate data used in this study include long-term climate normals and recent meteorological observations. The long-term climate normals are derived from the Dataset of China Surface Climate Normals for 1981–2010 [25]. Produced by the National Meteorological Information Centre from observations at China’s surface meteorological stations, this dataset can accurately reflect the multi-year mean climatic background and is therefore used as the main data source for the spatial baseline of extreme climate indicators. Recent meteorological observations are obtained from the Integrated Surface Database Lite (ISD-Lite) released by the National Centres for Environmental Information (NCEI). The ISD integrates global surface meteorological observations, and ISD-Lite is a simplified fixed-width version that includes basic variables such as temperature, dew-point temperature, air pressure, wind direction, wind speed, and precipitation [26].
According to the requirements of urban climate change risk identification in Ningbo, this study selects five meteorological elements—temperature, precipitation, relative humidity, wind direction and speed, and air pressure–as the basic data for calculating climate hazard indicators (Figure 2). The study period is divided into 1981–2010 and 2015–2024. The 1981–2010 data are used to characterise the long-term climate baseline, while the 2015–2024 data are used to represent the recent climatic background and to support correction of the long-term climate risk baseline. Because the raw ISD-Lite data are recorded at hourly or three-hour intervals, the data are first aggregated to a daily scale and then used to calculate annual extreme climate indicators. Finally, the annual indicators for 2015–2024 are averaged over multiple years to represent the recent climate change risk conditions of Ningbo.
Figure 2.
Locations of meteorological stations: (a) 1980–2010 stations; (b) 2015–2024 stations.
Figure 2 shows the distribution of meteorological stations corresponding to the long-term climate normals and the recent observation data. This study uses inverse distance weighting (IDW) interpolation to generate spatial surfaces for climate indicators. IDW assigns weights according to the distance from sample points; observations closer to an estimated location have greater influence. It is suitable for estimating continuous spatial surfaces from station-based data [27].
Because IDW interpolation is sensitive to station number and spatial distribution, differentiated station selection strategies are applied in different stages. For the 1981–2010 long-term baseline, stations within and around Ningbo are prioritised, including Cixi, Yuyao, Zhenhai, Yinzhou, Beilun, Fenghua, Xiangshan, Ninghai, and Shipu. These stations cover the mainland and coastal areas of Ningbo and provide internal control points for spatializing climate indicators. To reduce extrapolation errors near the study boundary, Shangyu Station to the northwest of Ningbo and Linhai Station to the south are added as peripheral control stations. This helps improve the continuity of interpolation results near the boundary. For the 2015–2024 recent observation stage, five stations–Shengsi, Dinghai, Shengzhou, Shipu, and Dachen–are selected as recent correction and reference stations. They cover the northeastern sea area, eastern sea area, southeastern sea area, and western inland transition zone around Ningbo, and can reflect recent changes in the climatic background around the study area. Among them, Shipu Station is close to Ningbo and is used as an important control point for recent climate correction.
Given the limited number of available NCEI stations and the relatively high proportion of island stations, results may be affected by sparse and uneven station distribution and are insufficient for fine-scale climate change risk assessment within the Ningbo municipal area. In response, this study uses NCEI stations as recent corrections to the long-term baseline surface. This approach improves the representation of recent climate conditions while maintaining the stability of Ningbo’s spatial climatic pattern as far as possible and reduces interpolation uncertainty associated with insufficient and unevenly distributed stations.
2.2.2. Land-Use Data
The land-use data are obtained from the China Land Cover Dataset (CLCD), a 30 m annual land-cover product based on Landsat imagery. The CLCD was developed by Yang and Huang. The research team processed large-scale Landsat imagery on the Google Earth Engine platform and combined stable samples from the China Land Use/Cover Dataset (CLUD) with visually interpreted samples from Google Earth, Google Maps, and satellite time-series imagery to build a training sample library. In the classification process, multi-temporal remote-sensing features and a Random Forest classifier were used to generate annual land-cover products, and temporal–spatial filtering and logical reasoning were applied to correct abnormal fluctuations in annual classifications [28]. This procedure enhances temporal continuity and reduces the influence of classification noise in individual years on change detection.
This study uses CLCD data to extract built-up land, green/forest land, and water areas in Ningbo and calculates their area proportions within spatial units. To unify the analysis scale of climate indicators and land-use indicators, 1 km × 1 km fishnet units are used as the basic spatial units for integrated assessment and machine learning analysis. After climate indicators are spatialized, they are aggregated to the fishnet scale to obtain the corresponding climate characteristics for each unit. Land-use data are used to calculate the area proportions of each land-use class within the same fishnet units. Through this processing, each fishnet unit corresponds to a set of climate variables and land-use structure variables, forming an analytical sample set with consistent spatial scale and unified variable definitions.
2.2.3. Data Preprocessing and Indicator Extraction
This study is based on the following methodological assumption: extreme climate indicators and major land-use characteristics can capture the main spatial differences in intra-urban climate risk in Ningbo. Specifically, extreme climate indicators are used to represent climate hazards, while construction land, green space, forest land, and water bodies are used to characterise key spatial conditions, including the concentration of artificial underlying surfaces, urban physical exposure, ecological buffering capacity, and local regulatory functions. Given that this study aims to reveal the physical–spatial mechanisms underlying the formation of climate risk, non-physical–spatial factors such as socioeconomic conditions, infrastructure capacity, and governance capacity are not included in the core model, but are discussed as part of the research scope and limitations.
- (1)
- Extraction of Extreme Climate Indicators
To characterise climate hazard in the urban climate change risk of Ningbo, this study selects extreme climate indicators from five dimensions: high temperature, heavy rainfall, drought-persistence, humid-heat background, and strong wind. High-temperature hazard is represented by the multi-year average number of hot days (HotDays35), defined as the number of days with daily maximum temperature greater than or equal to 35 degrees C. Rainstorm hazard is represented by the multi-year average number of heavy rainfall days (R50mm), defined as the number of days with daily precipitation greater than or equal to 50 mm. Drought persistence is represented by DrySpell. Because different data sources do not use fully consistent recording standards for consecutive dry days, this study does not use the daily CDD indicator; instead, it constructs a drought-persistence proxy based on the longest monthly continuous no-precipitation period, processed through annual and multi-year averaging. Relative humidity (RH) is used to represent the humid-heat background and the moisture conditions that interact with high-temperature processes. Strong-wind hazard is represented by the multi-year average number of strong-wind days (Wind10), defined as the number of days with daily maximum wind speed greater than or equal to 10 m/s. These indicators correspond to the heat, rainfall, drought, humidity, and wind dimensions of climate hazard in Ningbo. After spatialization, they are incorporated into the climate hazard assessment to identify spatial differences in climate hazards.
- (2)
- Climate Data Indicator Spatialization
Because the 1981–2010 station network is relatively complete and its spatial distribution can represent the long-term climate pattern of Ningbo and surrounding areas, this study uses station data from this period to generate long-term baseline surfaces for each extreme climate indicator. Specifically, HotDays35, R50mm, DrySpell, RH, and Wind10 are used as interpolation variables, and IDW interpolation is applied to generate continuous raster surfaces. The interpolation results are unified under the Albers Conic Equal Area projection, with a spatial resolution of 500 m and a power parameter of 2. To reduce extrapolation errors near the study area boundary, the long-term baseline surfaces are first generated over a larger area covering Ningbo and the surrounding land–sea transition zone, and then clipped to the Ningbo administrative boundary.
To use both the spatial stability of long-term baseline data and the timeliness of recent observations, the final climate indicator surfaces are produced by combining the long-term baseline surfaces with recent correction values. First, the Extract Values to Points tool is used to extract the 1981–2010 long-term baseline raster values at the locations of recent stations for 2015–2024; these values are taken as long-term baseline references at the same locations. The difference between the recent multi-year mean observations and the corresponding long-term baseline reference values is then calculated as the recent correction value for each station:
where the term denotes the deviation of station i in the recent period relative to the long-term baseline, the recent multi-year mean value for 2015–2024, and the value extracted from the long-term baseline surface at the same location.
After obtaining the station correction values, IDW interpolation is again applied to generate a recent correction raster. The final climate indicator surface is obtained by adding the long-term baseline surface and the recent correction raster:
where the terms denote the long-term baseline value of raster cell x, the interpolated recent correction surface, and the final climate surface, respectively.
Because different climate indicators have clear physical value ranges, boundary constraints are applied after additive correction. For day-count or duration indicators such as HotDays35, R50mm, DrySpell, and Wind10, a non-negative constraint is applied:
where the term denotes the boundary-constrained indicator value. For relative humidity, values are constrained to the range of 0–100%.
For relative humidity, upper and lower bounds are applied as follows:
where the terms denote the constrained relative humidity value and the additively corrected relative humidity value. After these procedures, final spatial surfaces are obtained for HotDays35, R50mm, DrySpell, RH, and Wind10, which serve as the basic data for climate hazard assessment.
- (3)
- Land-Use Reclassification
According to the land-use structure of Ningbo and the requirements of climate risk identification, the original land-use classes are merged into four categories: built-up land, green/forest land, water area, and other land. These categories support subsequent statistics of land-use structure at the fishnet scale (Figure 3).
Figure 3.
Land use in Ningbo.
Built-up land mainly corresponds to artificial underlying surfaces and areas of impervious-surface concentration, reflecting urban development intensity and its influence on local thermal conditions, runoff processes, and ventilation. Green/forest land corresponds to vegetated space and reflects ecological buffering and surface regulation conditions. Water area corresponds to rivers, lakes, reservoirs, bays, and other blue spaces, representing water-body distribution and potential climate-regulation functions. Other land is retained as a supplementary category to maintain the completeness of land-use classification, but it is not included in the subsequent core indicator calculation.
- (4)
- Calculation of Land-Use Type Proportions
This study uses 1 km × 1 km fishnet units as the basic spatial units for land-use indicator extraction. For each fishnet unit, the areas of built-up land, green/forest land, and water-area are calculated, and their proportions in the total unit area are obtained. These three indicators—built-up land ratio (BuiltPct), green/forest land ratio (GreenPct), and water area ratio (WaterPct)—are used to characterise artificial development intensity, green ecological coverage, and blue-space distribution, respectively.
Let the total area of the fishnet unit i be , with built-up land area , green/forest land area , and water area . The three indicators are defined as follows:
Regarding indicator direction, BuiltPct, HotDays35, R50mm, Wind10, and DrySpell are set as positive indicators. A larger standardised value indicates a stronger contribution to climate change risk. GreenPct, WaterPct, and RH are set as negative indicators (Table 1). Negative indicators are first directionally transformed and then standardised. Therefore, after transformation, a larger standardised value indicates a greater shortage of green/forest buffering, water-area regulation, or humidity regulation and hence a stronger risk contribution.
Table 1.
Explanation of model factors.
2.2.4. Index Construction
- (1)
- Determining Weights by the CRITIC Method
This study uses the CRITIC method (Criteria Importance Through Intercriteria Correlation) to determine indicator weights. CRITIC is an objective weighting method that allocates weights based on indicator dispersion and inter-indicator correlation. Greater dispersion indicates stronger discriminatory power among fishnet units; lower correlation with other indicators indicates less information redundancy. The method accounts for both indicator variability and information independence and reduces repeated weighting among highly correlated indicators [29]. The specific equations are as follows:
Assume that there are m evaluation indicators and n evaluation units. After directional processing and standardisation, the standardised matrix is obtained:
where the term denotes the standardised value of evaluation unit i under indicator j.
First, the standard deviation of indicator j across all evaluation units is calculated to represent indicator dispersion:
where the term denotes the mean standardised value of indicator j. A larger standard deviation indicates greater variation among evaluation units and a higher information content.
Second, the correlation coefficient between indicator j and indicator k is calculated. Pearson’s correlation coefficient is used to represent inter-indicator correlation [30]:
A higher correlation coefficient indicates that two indicators contain more similar and redundant information; a lower correlation coefficient indicates that the indicator has a stronger independent information contribution. On this basis, the conflict intensity, or independent information content, of indicator j is calculated:
where the term reflects the degree of information difference between indicator j and the other indicators. If an indicator has generally low correlations with the remaining indicators, its conflict intensity is high, indicating that its information is less substitutable.
The indicator dispersion and conflict intensity are then combined to calculate the comprehensive information content:
A larger value indicates that indicator j has both stronger discriminatory capacity and higher independent information contribution; accordingly, it should receive a higher weight.
Finally, the comprehensive information content of all indicators is normalised to obtain the indicator weight:
and the weights satisfy:
- (2)
- Index Construction
After directional processing, standardisation, and CRITIC weight calculation, three composite indices are constructed: the climate hazard index, the land-use sensitivity index, and the climate change risk index. These indices are used to characterise spatial differences in urban climate change risk in Ningbo. The climate hazard index represents the potential pressure exerted by extreme climate conditions on urban space. It consists of five climate indicators: HotDays35, R50mm, RH, Wind10, and DrySpell. Let the standardised values and corresponding weights be denoted accordingly; the climate hazard index of fishnet unit i can be expressed as:
This index comprehensively represents the intensity of exposure to extreme climate conditions across spatial units. A larger value indicates a higher climate hazard.
The land-use sensitivity index is constructed from three land-use indicators: BuiltPct, GreenPct, and WaterPct. Let their standardised values and weights be denoted accordingly; the land-use sensitivity index of fishnet unit i can be expressed as:
This index characterises the sensitivity of different land-use structures to urban climate risk. A larger value indicates that the land-use composition of the spatial unit is more likely to correspond to a higher-risk state.
On this basis, the climate hazard index and land-use sensitivity index are integrated to construct the climate change risk index. Because both indices have been standardised and are comparable, the integrated risk index is expressed as a weighted sum:
where the terms denote the climate change risk index of fishnet unit i and the composite weights of climate hazard and land-use sensitivity, respectively. A higher climate change risk index indicates a higher level of urban climate change risk for the unit. The specific factor weights are determined using the CRITIC method.
2.2.5. High-Risk Area Identification Model and SHAP Threshold Interpretation
- (1)
- Model Setting
To identify the relationship between land-use variables and high-risk areas, this study constructs a binary classification model for high-risk area identification. The model is used to analyse the differences in the contribution of land-use characteristics to high-risk unit identification.
The target variable is first constructed based on the classification result of the climate change risk index. High-risk and relatively high-risk units are assigned a value of 1, while all other units are assigned a value of 0. The resulting binary label indicates whether a fishnet unit belongs to a high-risk area. This processing converts the continuous risk index into a dependent variable suitable for classification modelling and provides the data basis for high-risk area identification and land-use driving analysis.
The model explanatory variables include three land-use indicators: , , and . represents the expansion of artificial underlying surfaces and the concentration of impervious surfaces. represents vegetation coverage and ecological buffering conditions. represents the blue-space configuration and its potential regulating function. Together, these variables reflect differences in land-use structures within fishnet units and explain the relationship between land-use characteristics and high-risk area identification.
- (2)
- Model Training and SHAP Interpretation
To select a model that can better simulate and identify high-risk areas, this study compares three binary classification models: Logistic Regression, Random Forest, and XGBoost. The three models use the same sample partitioning strategy and are trained and evaluated under the same training and testing conditions to ensure comparability of model performance.
Logistic Regression is suitable for characterising the linear relationship between explanatory variables and the probability of occurrence of high-risk areas [31]. Its equation can be expressed as:
where the term denotes the probability that sample i is identified as a high-risk area, the explanatory variable of sample i, the intercept, and the regression coefficient of variable j. When the probability exceeds the predefined threshold, the sample is classified as a high-risk area.
Random Forest is an ensemble learning model based on multiple decision trees. It constructs multiple training subsets through bootstrap sampling and randomly selects a subset of features during node splitting, thereby reducing the overfitting risk of a single decision tree [32]. Its expression is:
where the terms denote the predicted class of sample i, the classification result of the kth decision tree, the number of decision trees, and the candidate classes. The model selects the class receiving the largest number of votes as the final prediction. When probability output is used, the probability that sample i is identified as high risk can be expressed as:
where the term is an indicator function. If tree k classifies the sample as a high-risk area, the indicator equals 1; otherwise, it equals 0. A higher value indicates a greater likelihood that the sample is identified as high risk by most decision trees.
XGBoost progressively adds multiple regression trees to correct previous prediction errors and introduces regularisation terms to control model complexity. It is suitable for identifying nonlinear relationships between land-use variables and high-risk areas [33]. Its additive tree model can be expressed as:
where the terms denote the model prediction output, the kth tree, the number of trees, and the function space of CART trees. The objective function of XGBoost consists of a loss term and a regularisation term:
where the terms denote the loss function between true class and predicted result, the complexity penalty of the kth tree, the number of leaf nodes, the leaf weights, and the regularisation coefficients for leaf-node number and L2 penalty. This structure helps control tree-model complexity and reduce overfitting.
This study evaluates model performance using Accuracy, F1 score, and AUC. Accuracy reflects the overall classification correctness. F1 score jointly considers Precision and Recall and is suitable for evaluating the accuracy and completeness of high-risk area identification. AUC measures the model’s ability to distinguish high-risk from non-high-risk areas across different thresholds [34,35,36]. The equations are as follows:
where TP denotes the number of samples correctly identified as high risk, TN the number correctly identified as non-high risk, FP the number of non-high-risk samples incorrectly identified as high risk, and FN the number of high-risk samples incorrectly identified as non-high risk. The closer the AUC is to 1, the stronger the model’s discriminative ability.
After determining the model with better overall performance, this study uses SHAP to interpret the model outputs [37,38,39]. SHAP quantifies the relative contribution of different land-use variables to high-risk area identification and reveals their direction of influence and nonlinear response patterns. Under the additive explanation framework, the prediction for a single sample can be expressed as:
where the terms denote the model prediction output, the baseline prediction, the contribution of feature j to the prediction, and the number of features. To compare global variable importance, this study uses the mean absolute SHAP value across samples as the global importance measure:
where the term denotes the global importance of feature j and the SHAP value of feature j for sample i. A larger value indicates a stronger average influence of the variable on high-risk area identification. This metric is used to identify the key land-use drivers of high-risk area formation.
Two types of SHAP outputs are mainly used: summary plots and dependence plots. The summary figure evaluates the overall contributions of BuiltPct, GreenPct, and WaterPct to model predictions and determines the relative significance of various land-use variables on a global scale. The dependence plot shows the relationship between the value of a single variable and its SHAP value, characterising the marginal effect of variable change on model output and helping identify nonlinear effects and threshold characteristics.
SHAP interaction analysis can effectively quantify complex nonlinear interaction relationships and provides a useful tool for revealing the mechanisms by which land-use combinations affect climate risk [40,41]. Based on the SHAP results of the XGBoost model, this study further analyses the relative contributions of built-up land ratio, green/forest land ratio, and water-area ratio to the identification of high climate change risk areas.
To further identify the combined effects among different land-use sensitivity variables, SHAP interaction values are calculated in the XGBoost model for pairwise interactions among the standardised built-up land ratio, green/forest buffering insufficiency index, and water regulation insufficiency index. This is used to determine under what value conditions different variable combinations show joint enhancement, joint weakening, or mutual offsetting [39]. Unlike single-variable SHAP values, SHAP interaction values emphasise the additional contribution generated by the joint action of two variables beyond their individual main effects. A positive interaction value indicates that the two variables jointly push model output toward the high-risk class for that sample; a negative value indicates that the joint effect is weaker than the simple addition of their main effects. Because positive and negative interaction values may coexist across samples, a direct mean may lead to mutual cancellation. Therefore, this study takes the absolute SHAP interaction values for each pair of variables across all samples and then averages them to represent overall interaction intensity.
2.3. Research Content and Technical Route
Urban climate change risk assessment is a fundamental task for climate-adaptive governance and spatial planning. Its theories and methods have evolved from single-hazard assessment to multi-hazard integrated assessment, from qualitative description to quantitative measurement, and from static pattern analysis to dynamic mechanism interpretation [42]. Early studies mainly focused on single extreme climate hazards, such as high temperature, heavy rainfall, and typhoons, and relied on historical disaster statistics and empirical models for risk diagnosis. As understanding of climate-system complexity has deepened, the IPCC risk framework has been widely adopted, and multi-hazard integrated risk assessment has become a mainstream paradigm [43,44].
The development of remote sensing, GIS, and machine learning has substantially improved the spatial precision and computational efficiency of risk assessment. Remote-sensing big data provides long-term series and high-resolution land-use, vegetation-cover, and meteorological observation data [45]. GIS supports multi-source spatial data integration, spatial analysis, and visualisation. Machine learning models represented by Random Forest and XGBoost are effective in capturing nonlinear relationships within complex systems and have improved the accuracy of risk identification and prediction [46].
Existing studies still have three limitations. First, many multi-hazard assessments continue to rely on simple weighting approaches, which have difficulty capturing the compounding and synergistic effects among different extreme climate hazards and may therefore bias the assessment results. Second, most studies focus on macro-regional scales, while research on fine-grained intra-urban grid units remains insufficient, limiting support for block- and district-level planning control. Third, many studies stop at identifying risk patterns and provide limited interpretation of the internal mechanisms of risk formation, which weakens their direct applicability to urban planning and design.
In response to these limitations, this paper takes Ningbo as a representative coastal port city and examines the relationship between climate change risk and land-use characteristics. First, it establishes a climate change risk assessment framework that couples extreme climate hazards and land-use sensitivity. Second, it integrates explainable machine learning to identify the spatial differentiation of climate change risk in Ningbo. Third, it reveals the driving mechanisms through which land-use characteristics influence high-risk areas. The main research tasks are as follows:
- (1)
- Extraction and spatial visualisation of extreme climate indicators: Based on the China Surface Climate Normals Dataset for 1981–2010 and NCEI meteorological observations for 2015–2024, five typical extreme climate indicators are selected, covering high temperature, heavy rainfall, drought, relative humidity, and strong wind, and then spatialized.
- (2)
- Extraction of land-use sensitivity indicators: Based on the 2023 CLCD land-use data with a spatial resolution of 30 m, three core indicators, namely built-up land ratio, green/forest land ratio, and water-area ratio, are extracted at the 1 km × 1 km grid scale to characterise the climate sensitivity of different underlying surfaces.
- (3)
- Integrated assessment of urban climate change risk: The CRITIC objective weighting method is used to determine indicator weights. A climate hazard index, a land-use sensitivity index, and an integrated climate change risk index are constructed to identify the overall spatial pattern of climate change risk in Ningbo.
- (4)
- Interpretation of land-use driving mechanisms in high-risk areas: A binary classification model for high-risk areas is constructed. The identification accuracy of Logistic Regression, Random Forest, and XGBoost is compared, and the optimal XGBoost model is selected. Combined with the SHAP explainability framework, the direction, relative importance, nonlinear thresholds, and interaction effects of the three land-use factors are quantified to clarify the formation mechanism of climate change high-risk areas.
The technical route is shown in Figure 4. The study focuses on the spatial pattern of climate change risk and the land-use driving mechanisms in coastal port cities. The findings provide methodological support and empirical reference for climate risk prevention, territorial spatial optimisation, and related governance practices in Ningbo and other similar cities worldwide.
Figure 4.
Research framework.
2.4. Methodological Assumptions and Limitations
This study constructs an urban climate change risk assessment framework based on extreme climate hazards and land-use sensitivity and uses explainable machine learning to reveal the influence of land-use characteristics on the formation of high-risk areas. Although data correction, model comparison, and SHAP-based interpretation were used to improve the reliability of the results, three limitations remain.
First, this study mainly reflects current urban climate change risk and does not further project risk under future climate and land-use scenarios. To mitigate this limitation, the 1981–2010 climate normals were used to represent the stable long-term spatial climatic pattern, and recent meteorological observations from 2015 to 2024 were used to correct this baseline, thereby improving the temporal relevance and robustness of the current risk assessment. Future research may combine global climate models, regional climate models, and land-use scenario simulations to further examine the evolution of risk under different climate change and urban development scenarios.
Second, the risk assessment focuses on extreme climate hazards and land-use sensitivity and does not incorporate socioeconomic exposure or adaptive-capacity indicators, such as population density, economic activity, infrastructure resilience, and social adaptive capacity [47,48]. Future studies may incorporate socioeconomic exposure and adaptive-capacity indicators to develop a more comprehensive urban climate risk assessment framework.
Third, this study mainly uses statistical modelling and explainable machine learning to reveal the association between land-use variables and high-risk areas, without further validating the physical mechanisms through urban climate or hydrological models. To reduce uncertainty associated with a single model, Logistic Regression, Random Forest, and XGBoost were compared, and model performance was evaluated using Accuracy, F1-score, and AUC. SHAP was further used to interpret variable contributions, nonlinear thresholds, and interaction effects. However, SHAP results mainly represent statistical contributions within the model and should not be interpreted as strict causal effects. Future research may combine urban climate simulations, surface energy balance models, or urban hydrological models to further verify the physical processes through which land-use change affects climate risk.
3. Results
3.1. Spatial Differentiation of Extreme Climate Hazard
Figure 5 shows the spatial differentiation of extreme climate hazards in Ningbo. Wind10, R50mm, and DrySpell are relatively high in the eastern and southeastern coastal areas; HotDays35 is more prominent in the southern and southwestern areas; and high RH values are mainly distributed in the south and southeast. Ningbo’s extreme climate hazard generally presents a pattern characterised by stronger coastal wind–rain disturbance and dry-spell pressure, together with more pronounced thermal pressure in the south.
Figure 5.
Spatial differentiation of extreme climate hazard: (a) Wind10; (b) R50mm; (c) DrySpell; (d) HotDays35; (e) RH.
For Wind10 (Figure 5a), the strong-wind hazard in Ningbo shows clear coastal clustering. High values are mainly distributed in Fenghua District, Yinzhou District, Xiangshan County, and surrounding coastal areas, with relatively high strong-wind days in the eastern nearshore zone. Cixi, Yuyao, and inland areas west of the central city show relatively low values. This pattern may be related to Ningbo’s location facing the East China Sea, its long coastline, and active land–sea wind exchange. Eastern and southeastern coastal areas are more directly affected by marine airflow and peripheral typhoon circulation, making strong-wind processes more likely to occur in these areas.
For R50mm (Figure 5b), the rainstorm hazard also shows a coastal-high pattern, while some hilly and mountainous areas form local high-value zones. High values mainly occur in Beilun District, Xiangshan County, Southwestern Ninghai County, and parts of the southeastern coast. The central city and central–western areas are generally at medium to low levels, while parts of Yuyao, Fenghua, and Haishu have relatively low rainstorm days. This pattern may be associated with stronger moisture transport in eastern coastal areas and orographic lifting in southern hilly and mountainous areas, which may further enhance heavy precipitation and produce relatively high rainstorm-day values.
For DrySpell (Figure 5c), the spatial distribution of continuous dry processes is relatively complex. High values are mainly located in the eastern coastal and southern areas, especially Beilun, Xiangshan, Ninghai, and Southern Fenghua. Cixi, Yuyao, and some central areas show relatively low drought persistence. The results indicate that, although coastal areas have favourable moisture conditions, long dry periods may still occur under specific seasonal or circulation backgrounds. The southern area also shows a certain drought-persistence risk due to terrain and local climatic differences.
For HotDays35 (Figure 5d), the high-temperature hazard is mainly concentrated in the southern and southwestern areas. Fenghua, Ninghai, and the surrounding areas have more hot days, and local high-value patches also appear in Yuyao. Beilun, Xiangshan, and eastern coastal areas generally have fewer hot days. Compared with inland and southern areas, coastal areas are moderated by the ocean and experience weaker high-temperature processes. Some southern and southwestern areas are farther from marine regulation and may experience stronger heat accumulation due to hilly terrain and local thermal conditions.
For RH (Figure 5e), high values are mainly distributed in Ninghai, Xiangshan, Southern Fenghua, and the southeastern coastal area, while Northern Cixi, Yuyao, and parts of the central city are relatively low. This study treats RH as a negative indicator; higher humidity usually represents stronger moisture-regulation conditions. Although the southern and southeastern areas face certain hazards related to rainstorms, strong winds, or drought persistence, their humidity conditions are relatively favourable and can buffer compound heat–dry stress. In contrast, parts of the northern and central areas have lower RH and relatively insufficient moisture regulation.
Considering all climate risk indicators, Ningbo’s extreme climate hazard presents a clear zoning pattern. Eastern and southeastern coastal areas such as Beilun, Xiangshan, and Ninghai mainly face compound hazards related to strong winds, heavy rainfall, and drought. Southern areas such as Fenghua and Ninghai have more hot days and relatively high humidity, reflecting the coexistence of thermal pressure and a humid background. Cixi, Yuyao, and parts of the central city are relatively low in most extreme climate indicators, though local high-temperature or insufficient humidity-regulation issues remain. Overall, Ningbo’s extreme climate hazard is characterised by coastal wind–rain disturbance, southern heat accumulation, and local humidity differences.
3.2. Spatial Distribution of Land-Use Type Indicators
Figure 6 shows the spatial distribution of the built-up land ratio in Ningbo. Overall, the built-up land ratio exhibits clear spatial differentiation. High values are generally distributed in the central city, the northeastern coastline area and the port-oriented development belt, while low values are mainly distributed in the southern and southeastern mountain–sea counties. This pattern is directly tied to the intensity of urban development, the port–industry arrangement, the concentration of population, and the restrictions of topography and ecology in Ningbo.
Figure 6.
Spatial distribution of built-up land ratio.
From the perspective of spatial distribution, Beilun District has the highest built-up land ratio in Ningbo. As an important carrier of Ningbo Port, Beilun concentrates port logistics, port-based industry, warehousing facilities, and transport infrastructure, and therefore has a high intensity of artificial construction. The continuous distribution of port facilities, industrial land, and transport corridors forms a significant impervious-surface cluster. Zhenhai and Yinzhou also have relatively high built-up land ratios. Zhenhai is influenced by the outward expansion of the main urban area and the layout of coastal industrial land, while Yinzhou combines functional extension of the central city with peripheral spatial expansion and therefore shows a wider and more internally differentiated built-up land distribution. Jiangbei, as an important part of the central city, also shows a high built-up land proportion due to the continuity of its built environment.
Xiangshan and Ninghai are areas with relatively low built-up land ratios. In Xiangshan, peninsular landform, bay segmentation, and ecological-space constraints mean that built-up land mainly develops locally along town nodes and coastal belts, with a low overall coverage ratio. In Ninghai, the large area of hills and mountains and the strong ecological base restrict built-up land expansion through both natural landform and ecological-space constraints.
Overall, the built-up land ratio in Ningbo is high in the central city and port areas and low in peripheral counties and southern mountain–sea areas. The main urban area and port-oriented development belt form high-value clusters of built-up land, reflecting the concentrated layout of population, industry, transport infrastructure, and port functions. The lower built-up land ratio in peripheral counties and southern mountain–sea areas indicates that terrain conditions, ecological space, and natural coastlines continue to constrain land development intensity. Ningbo’s built-up land distribution, therefore, reflects the coexistence of urban core concentration, port-axis reinforcement, and the preservation of peripheral ecological space.
Figure 7 shows the spatial distribution of the green/forest land ratio in Ningbo. Overall, high values are mainly distributed in the southern, southwestern, and southeastern mountain–sea areas, while low values are concentrated in the central city, northeastern coastal development belt, and port–industry agglomeration area. This pattern corresponds closely to Ningbo’s natural terrain, ecological base, and urban development intensity.
Figure 7.
Spatial distribution of green/forest land ratio.
In the high-value zones, Ninghai, Xiangshan, and Fenghua have relatively high green/forest land ratios. Southern and Southwestern Ninghai contain extensive hilly and mountainous areas with strong continuity of forest and ecological space, giving green/forest land a large share of the land-use structure. Xiangshan retains substantial natural vegetation and ecological land because of its peninsular landform, bay segmentation, and mountainous ecological space, resulting in a generally high green/forest land ratio. Fenghua lies in the transition from hills and mountains to plains, has pronounced terrain undulation and a relatively strong ecological base, and maintains a stable green/forest distribution due to relatively limited urban development intensity. In contrast, the central city, the northeastern coastal area, and the port–industry agglomeration area have lower green/forest land ratios. In parts of Beilun, Zhenhai, Jiangbei, and Yinzhou, green/forest spaces are fragmented by built-up space under the influence of construction land expansion, port–industry layout, and population concentration, leading to reduced continuity and a compressed share in the land-use structure.
In general, the proportion of green/forest land in Ningbo is high in the southern mountain counties and low in the core city and port development area. The southern, southeastern and southwestern areas have comparatively high green ecological coverage based on hills, ecological space and natural coasts. In the central city, northeastern coastal area, and port industrial zones, the green/forest land ratio is significantly reduced by construction development, population concentration, and industrial layout. This pattern indicates that Ningbo’s green/forest resources are mainly maintained by the peripheral ecological base, while ecological space in the urban core and port development belt remains under strong development pressure.
Figure 8 shows the spatial distribution of the water-area ratio in Ningbo. Compared with built-up land and green/forest land, the overall proportion of water area is low and spatial continuity is weak. High values mainly appear as point, linear, and patch-like distributions, relying on coastal zones, harbour shorelines, nearshore waters, major river corridors, and local lakes and reservoirs.
Figure 8.
Spatial distribution of water-area ratio.
In terms of spatial distribution, coastal areas such as Xiangshan, Ninghai, and Zhenhai form clear high-value water patches under the influence of coastlines, bays, and nearshore waters. Some river corridors and lake-reservoir surroundings also show local high values. The central city and some northern plain areas have relatively low water ratios, indicating that construction development, agricultural use, and intensive land use have affected the proportion of water space. Overall, Ningbo’s water space is characterised by coastal orientation, local concentration, and fragmented distribution. Although water occupies a limited share of the city’s land-use structure, coastal waters, river networks, and lake-reservoir patches remain important spatial foundations for urban thermal regulation, humidity maintenance, and climate risk buffering.
3.3. Results of Integrated Urban Climate Change Risk Assessment
3.3.1. Spatial Distribution of the Climate Hazard Index
Figure 9 shows the spatial distribution of the climate hazard index in Ningbo. Overall, the index exhibits clear regional differentiation. High values are mainly concentrated in the eastern, northeastern, and eastern coastal areas, while low values are mainly distributed in the northwest and parts of the inland area. The climate hazard level generally increases from the northwest to the east and from inland areas toward the coast.
Figure 9.
Climate hazard index.
At the district and county scale, Beilun District shows a relatively high climate hazard index in Ningbo. Wind10, R50mm, and DrySpell are all at relatively high levels in Beilun. The superimposition of multiple climate hazard factors makes Beilun the most prominent high-value core of integrated climate hazard. Most areas of Yinzhou District also show high hazard levels and, together with Beilun, form the core high-value belt of climate hazard in Ningbo. Zhenhai District is generally at a medium-high level, indicating that the northeastern coastal area of Ningbo is strongly exposed to multiple types of extreme climate hazards.
Haishu, Jiangbei, and Fenghua are generally at medium levels and form transitional areas between the eastern coastal high-value zone and the western low-value zone. Haishu and Jiangbei have slightly higher climate hazards than the northwestern county-level cities due to high temperature, rainstorms, and a local humid-heat background. Fenghua shows clear internal differences, with some medium-high patches. Yuyao and Cixi are generally at medium-low to medium levels and are relatively low-hazard areas in Ningbo. Ninghai and Xiangshan are mainly at medium levels, with local coastal areas reaching medium-high levels. Eastern coastal Ninghai has relatively high hazard, while inland areas have lower. Due to its peninsular landform and land–sea transition conditions, some coastal belts in Xiangshan still face substantial extreme climate pressure.
Overall, high climate hazard index values in Ningbo are mainly concentrated in eastern coastal areas such as Beilun, eastern Yinzhou, and Zhenhai. Medium values are mainly distributed in Haishu, Jiangbei, Fenghua, Ninghai, and parts of Xiangshan, while lower values are mainly located in Cixi, Yuyao, and some inland areas. This pattern indicates that the spatial differentiation of climate hazards first arises from the spatial unevenness of extreme climate processes. Eastern coastal areas are affected by the superposition of strong winds, heavy rainfall, and drought persistence, whereas the northwest and inland plains are relatively less affected by these extreme climate factors.
Based on the classification results shown in Figure 9, areas with climate risk index values in the highest risk classes, namely values above 0.470, as displayed as 0.471–0.730 in the legend, were classified as high-risk areas, while the remaining areas were classified as low-risk areas. Subsequently, fishnet units located in high-risk areas were assigned a value of one, whereas non-high-risk units were assigned a value of zero, thereby constructing a binary label for high-risk area identification (Figure 10). This binary label was used as the dependent variable in the Logistic Regression, Random Forest, and XGBoost models to examine the relationship between land-use structure variables and high-risk area identification.
Figure 10.
Classification of high-risk climate areas.
3.3.2. Spatial Distribution of the Land-Use Sensitivity Index
Figure 11 shows the spatial distribution of the land-use sensitivity index in Ningbo. The index is constructed from BuiltPct, GreenPct, and WaterPct and characterises the sensitivity of different land-use structures to climate change risk. Overall, the index exhibits clear spatial heterogeneity. High values are mainly concentrated in the northeast, central-east, and areas around the main urban area, while low values are mainly distributed in the west, south, and southwest, where ecological space is relatively continuous. The overall pattern decreases from the main urban area and coastal development belt toward peripheral ecological areas.
Figure 11.
Land-use sensitivity index.
At the district and county scale, Jiangbei, Haishu, and Zhenhai are the areas with the highest land-use sensitivity in Ningbo. Built-up land is relatively concentrated in these districts, the urban built environment is spatially continuous, and the proportion of green space and forest land is relatively insufficient; therefore, overall land-use sensitivity is high. Beilun District also has a relatively high land-use sensitivity index. As an area with concentrated port-related development and industrial land, Beilun has a high proportion of built-up land and shows strong land-use sensitivity overall.
Cixi and Yuyao are generally dominated by medium-high to medium levels, but their internal differences are evident. Areas close to built-up urban zones and transport corridors show relatively high sensitivity, whereas the southern areas, where agricultural and ecological spaces are more extensive, are mainly characterised by medium-low values. Several local medium-high patches remain, indicating clear internal differences in the balance between land development and ecological-space allocation in the northern county-level cities.
Fenghua District is generally dominated by medium-low values, with only scattered medium-high patches in areas closely connected to the main urban area or where local construction activities are concentrated. Its green space and forest land foundation is relatively strong, and the intensity of built-up land expansion is generally lower than that in the central urban area and the northeastern coastal zone; as a result, overall land-use sensitivity is not high. Ninghai and Xiangshan are also mainly characterised by low to medium-low values and represent areas of relatively low land-use sensitivity in Ningbo. Both areas have a high proportion of ecological space and relatively continuous green space and forest land. Although some medium-high patches occur near coastal towns or transport nodes, they do not alter the overall pattern of low sensitivity.
Overall, the land-use sensitivity index constructed from BuiltPct, GreenPct, and WaterPct shows that high-value areas in Ningbo are mainly concentrated in Beilun, Zhenhai, Yinzhou, and other main urban districts. This indicates that a higher proportion of built-up land corresponds to stronger land-use sensitivity. Low-value areas are mainly distributed in Ninghai, Xiangshan, Fenghua, and other areas where ecological space is dominant, suggesting that higher green space and forest land coverage and relatively lower built-up intensity help reduce land-use sensitivity.
3.3.3. Climate Change Risk Index and Zoning Results
Figure 12 shows that climate change risk in Ningbo is spatially uneven. High values are mainly distributed in the northeast and central-east, while low values are mainly located in the west, southwest, and parts of the south. This pattern combines clustered high-risk patches with continuous low-risk areas (Figure 12).
Figure 12.
Climate change risk index.
From the perspective of high-risk and relatively high-risk areas, Jiangbei, Zhenhai, eastern Haishu, Yinzhou, and the continuously built-environment areas in Northwestern and Eastern Beilun constitute the core high-value belt of climate change risk in Ningbo. Among them, Jiangbei and Zhenhai show the most prominent risk levels, with large areas classified as high-risk. This result is related to the relatively high strong-wind and rainstorm hazards in the two districts, as well as their high proportion of built-up land and strong land-use sensitivity. Eastern Haishu also contains continuously distributed high-risk patches, indicating that the coastal development belt and the eastward expansion area of the main urban area are spatial units where integrated climate change risk is concentrated. Yinzhou and the continuously built-environment areas in Northwestern and Eastern Beilun together form a clear cluster of relatively high risk.
Medium-risk areas are mainly distributed around the periphery of high-risk areas and in several transitional zones, including northern Yuyao, Central and Northern Cixi, Northeastern Fenghua, and some coastal areas of Xiangshan. These areas are affected by both climate hazard and land-use sensitivity to some extent, but their development intensity and integrated exposure are lower than those of the core high-risk areas. They therefore function as transitional belts connecting high-risk and low-risk areas.
Low-risk and relatively low-risk areas are mainly concentrated in Ninghai, the southwestern hilly and mountainous area of Fenghua, and Southern Yuyao. These areas have a high proportion of green space and forest land, low built-up intensity, and relatively good ecological continuity, and therefore show relatively low integrated risk levels. Ninghai forms a relatively continuous low-risk cluster. Although some local coastal climate hazard patches exist, the strong ecological base and low built-up intensity play a buffering role in the integrated assessment. Similar characteristics are also observed in Southwestern Fenghua and Southern Yuyao.
Overall, high-value climate change risk areas in Ningbo are mainly concentrated in the northeastern coastal development belt and the central urban area, whereas low-value areas are mainly distributed in southern and western areas with relatively continuous ecological space. This spatial pattern indicates that climate change risk in Ningbo is jointly shaped by climate hazard and land-use sensitivity. Coastal areas with high development intensity are subject to both higher climate hazards and stronger land-use sensitivity, making them more likely to form integrated high-risk clusters. In contrast, areas with a higher proportion of ecological space and lower construction intensity have lower integrated risk levels.
Based on the risk classification in Figure 12, high-risk and relatively high-risk areas are combined as the identification target for subsequent modelling. Specifically, fishnet units with high-risk and relatively high-risk are allocated value one, whereas medium risk, relatively low risk and low risk units are given value zero, thereby creating a binary designation for high-risk locations. This label is the target variable of Logistic Regression, Random Forest and XGBoost models, and is used to analyse the link between land-use structural factors and high-risk area identification.
3.4. Spatial Differentiation and Dominant Characteristics of High-Risk Areas
To compare the applicability of different classification models in identifying high-risk areas, the importance ranking of land-use variables is further examined to identify the relative contributions of built-up land, green/forest land, and water areas to high-risk area classification.
3.4.1. Model Accuracy and Variable Contribution Differences in High-Risk Area Identification
As shown in Figure 13 and Table 2, when only land-use proportion variables were included, the three models showed limited but non-negligible ability to identify high climate change risk areas. The training-set accuracy of Logistic Regression, Random Forest, and XGBoost is 0.55, 0.56, and 0.60, respectively. XGBoost performs relatively better in the training stage, but the testing-set accuracy differences among the three models are small. This indicates that land-use type variables have a certain correspondence with high-risk areas, but the explanatory strength of this relationship is limited. Therefore, the subsequent SHAP-based analysis is interpreted as an exploratory explanation of land-use-related associations and nonlinear response patterns.
Figure 13.
Model screening.
Table 2.
Performance of land-use-based models for high-risk area identification.
Further comparison of training and testing results shows that none of the three models exhibits severe overfitting, but overall testing accuracy remains low. This suggests that BuiltPct, GreenPct, and WaterPct are associated with high climate change risk areas, yet their explanatory capacity is limited. The formation of high-risk areas is not determined only by land-use proportions; it may also be affected by factors such as urban development intensity and local spatial structure. Land-use proportion indicators can reveal part of the spatial variation, but they cannot independently explain the full distribution of high-risk areas.
Considering model performance and the subsequent need for interpretive analysis, XGBoost is selected as the main model for identifying high climate change risk areas [33]. It performs relatively better among the three models and is more suitable for capturing nonlinear relationships between land-use variables and high-risk area identification.
3.4.2. Key Land-Use Correspondence Based on SHAP
In terms of mean absolute SHAP values, all three land-use variables affect model output, but their contributions differ (Figure 14). The green/forest land ratio has the highest mean absolute SHAP value, 0.38, and is the dominant variable influencing classification results. The built-up land ratio ranks second, with a mean absolute SHAP value of 0.18. The water-area ratio is lowest, with a value of 0.15. These results indicate that green/forest land has the strongest explanatory role in distinguishing high-risk from non-high-risk units; built-up land also has a clear influence, while water area plays a weaker role.
Figure 14.
SHAP feature contribution distribution for high climate risk areas.
The SHAP summary plot shows that the green/forest buffering insufficiency index has the clearest influence on model output (Figure 15). Most samples with high values are in the positive SHAP range, i.e., when the green/forest buffering of a fishnet unit is not sufficient, the model is more likely to designate it as a high climate change risk area. The samples with low values are more frequently distributed in the negative or near-zero range, showing that a certain amount of green/forest coverage can minimise the possibility of high-risk detection.
Figure 15.
SHAP feature contribution beeswarm plot for high climate risk areas.
The standardised built-up land ratio shows a clear positive contribution. Samples with higher built-up land ratios tend to correspond to positive SHAP values, indicating that a higher proportion of artificial underlying surface increases the probability that a unit will be identified as a high climate change risk area. When the built-up land ratio is low, SHAP values are mostly negative or close to zero, suggesting that lower construction intensity helps reduce high-risk identification probability.
The water regulation insufficiency index also shows a positive contribution, though its influence is weaker. High-value samples are more likely to have positive SHAP values, indicating that insufficient water-area regulation can increase high-risk identification probability to some extent. Low-value samples are more often negative or near zero, suggesting that water-area configuration can buffer high-risk identification.
Overall, SHAP analysis indicates that, in identifying high climate change risk areas in Ningbo, all three land-use sensitivity variables make positive risk contributions, although their magnitudes differ. The green/forest buffering insufficiency index is the primary discriminating variable, indicating the close relationship between insufficient ecological buffering and high-risk identification. The standardised built-up land ratio ranks second, reflecting the clear influence of artificial development intensity. The water regulation insufficiency index has a weaker contribution and mainly functions as a local regulating factor. These findings show that high-risk area identification is not affected only by built-up land expansion; insufficient ecological buffering and blue-space regulation also alter the model’s classification of high-risk units.
Figure 16 shows the SHAP single-factor dependence relationships between built-up land, green/forest land, water-area proportions, and high climate change risk area identification [49]. SHAP decomposes model predictions into the marginal contribution of each explanatory variable and uses sample-level SHAP values to describe the direction and magnitude of variable effects on model output [38,39]. In Figure 16, points represent sample units, blue curves represent SHAP response trends, light bars indicate the sample density of variable values, and vertical dashed lines indicate the main turning points identified by the model.
Figure 16.
SHAP single-factor dependence relationships of land-use variables.
For the standardised built-up land ratio, the main turning point is approximately 20%. When the value is below 20%, SHAP values fluctuate around zero and have limited influence on high-risk identification. Once the value exceeds 20%, SHAP values increase with the variable and gradually enter the positive range. This result suggests that, after the built-up land proportion exceeds this empirical turning point, the continuity of impervious surfaces may become more pronounced, further enhancing heat storage, reducing rainwater infiltration, increasing surface runoff, and compressing ecological buffering space. As a result, the positive contribution of built-up land to high-risk area identification becomes more evident.
For the green/forest buffering insufficiency index, the main turning point is approximately 2%. In this study, when ecological buffering conditions shift from relatively sufficient to insufficient, the model shows a markedly stronger tendency to identify the corresponding units as high-risk areas. However, this does not imply that 2% represents a universal ecological threshold. Rather, it indicates that, under the specific urban spatial context of Ningbo, even a slight insufficiency in green space and forest buffering capacity may have a substantial influence on risk identification. This is particularly relevant in highly urbanised or coastal development areas, where the fragmentation or insufficiency of green and forest spaces can weaken shading, evapotranspiration cooling, rainwater interception, and local microclimate regulation functions, thereby increasing the probability that such units are identified as high climate change risk areas.
For the water regulation insufficiency index, the main turning point is close to zero. Considering that water bodies are often distributed as localised and scattered patches within 1 km × 1 km fishnet units, this result is better interpreted as the presence or absence of water bodies within a given unit rather than as a continuous proportional threshold. In other words, at the intra-urban grid scale of Ningbo, when a spatial unit completely lacks water bodies, its capacity for local stormwater retention, evaporative cooling, and microclimate regulation is relatively limited, making it more likely to be classified by the model as a high climate change risk area. Conversely, once a certain proportion of water bodies is present within the unit, even if the proportion is relatively small, it may influence risk identification by providing local cooling, stormwater detention, and blue–green spatial connectivity.
3.4.3. Nonlinear Threshold Characteristics of Land-Use Variables
The pairwise SHAP interaction results show that the interaction between the standardised built-up land ratio and the green/forest buffering insufficiency index is the most prominent (Figure 17). Using the mean absolute SHAP interaction value as the interaction-intensity measure, BuiltPct × GreenPct has the highest mean absolute interaction intensity, 0.0672; BuiltPct × WaterPct ranks second, 0.0492; and GreenPct × WaterPct is the lowest, 0.0259. After normalisation, the three interactions account for approximately 47.2%, 34.6%, and 18.2%, respectively. This indicates that interaction effects in high-risk area identification mainly revolve around built-up land. The combination of built-up land and insufficient green/forest buffering is most critical, followed by the interaction between built-up land and insufficient water-area regulation, while the interaction between insufficient green/forest buffering and insufficient water regulation is relatively weak.
Figure 17.
SHAP interaction effects of land-use sensitivity variables.
Specifically, the response of BuiltPct × GreenPct is strongly context dependent. Under high levels of green/forest buffering insufficiency, the interaction value turns quickly from negative to positive as the standardised built-up land ratio increases from low values and remains positive over a relatively long range. This indicates a joint enhancement relationship between increasing construction intensity and insufficient green/forest buffering. When ecological buffering is insufficient, an increase in built-up land more readily amplifies the model’s probability of identifying a unit as high risk. Conversely, better green/forest buffering may weaken the additional amplification effect of built-up land on high-risk identification.
The interaction characteristics of BuiltPct × WaterPct are also relatively clear. Taking water regulation insufficiency as the background condition, urban construction expansion and insufficient water regulation exhibit a certain joint enhancement effect. When the water regulation insufficiency index is high, an increase in the standardised built-up land ratio clearly raises the interaction value and moves it into the positive range under medium-high construction intensity. When a unit retains some water regulation capacity, the additional interaction contribution of built-up land is relatively weak and may even be negative in some ranges. This indicates that insufficient water conditions strengthen the amplification effect of built-up land on high-risk identification, whereas in units with relatively good water-area configuration, the influence of built-up land is expressed more as its own main effect and less as additional interaction amplification. In comparison, the GreenPct × WaterPct interaction is weak and does not show strong synergy. Insufficient green/forest buffering and insufficient water regulation may contain overlapping information, and their joint effect is weaker than the interaction between built-up land and ecological buffering insufficiency.
Overall, Figure 17 indicates that high-risk identification is affected by different variable-combination relationships. The interaction between the standardised built-up land ratio and the green/forest buffering insufficiency index is the strongest, followed by the interaction between the standardised built-up land ratio and the water regulation insufficiency index. The interaction between the green/forest buffering insufficiency index and the water regulation insufficiency index is the weakest.
Figure 18 shows the predicted probability distribution of high climate hazard areas under different land-use combinations when the third variable is fixed.
Figure 18.
Predicted probability distribution of high-risk areas under combinations of land-use sensitivity variables. (a) Built-up Land Ratio × WaterPct Green/Land Cover Ratio; (b) Built-up Land Ratio × Water Area Ratio; (c) Green/Land Cover Ratio × Water Area Ratio.
For the combination of built-up and green land (Figure 18a), with a water-area ratio fixed at zero, the predicted probability generally increases markedly with the increase in green/forest land ratio and forms a continuous high-value belt in the medium-high green-land range. Built-up land ratio causes some local fluctuation along the horizontal dimension, but its overall influence is weaker than that of the green/forest land ratio.
For the combination of built-up and water area (Figure 18b), with green/forest land ratio fixed at 29.3%, the built-up land ratio has a strong lifting effect on predicted hazard probability. When the built-up land ratio increases from low values to approximately 40–50%, the predicted probability rises clearly and remains high in the medium-high built-up range. The effect of the water-area ratio is unstable. Under low built-up conditions, medium water-area ratios correspond to lower predicted hazard probabilities; when the built-up land ratio is high, higher water-area ratios are more likely to fall into high-hazard probability zones, indicating that the effect of water area is constrained by construction intensity.
For the combination of green land and water area (Figure 18c), with a built-up land ratio fixed at 4.4%, the overall predicted hazard probability is relatively low but still shows a clear nonlinear response. Lower probabilities are mainly concentrated in the medium water-area range, while probabilities rebound when the water-area ratio is low, or the green-land ratio is high. This suggests that, under low built-up conditions, green land and water area do not form a continuously superimposed inhibitory effect but instead exhibit a compound response with thresholds and interval differences.
Overall, Figure 18 shows that high climate hazard area identification is not determined by a single land-use variable, but by the combined effects of different land-use configurations. Built-up land ratio acts as a key factor raising the probability in most contexts. The green/forest buffering insufficiency index is more dominant in some combinations, while the water-area ratio functions more as a regulating factor dependent on the levels of other variables. The effects of different land-use factors are therefore nonlinear, segmented, and context dependent.
4. Discussion
4.1. Formation Logic of Spatial Differentiation in Ningbo’s Urban Climate Change Risk
First, natural geography is the foundation of the spatial differentiation of urban climate change risk in Ningbo. Natural geography provides the basic conditions for climate change risk, while urban development patterns, shaped by multiple natural, built-environment, and socioeconomic factors, form land-use sensitivity characteristics. Together, they constitute the overall spatial pattern of urban climate change risk. Many researchers have emphasised that the effect of land-use change on flood-hazard magnitude can be as important as climate change [50,51,52,53,54,55]. Changes in either factor may be more significant, and each may amplify or mitigate the impact of the other [56]. Ningbo is located on China’s eastern coast, has a long coastline, exhibits strong land–sea thermal contrasts, and is substantially influenced by the marine climate and typhoons [21]. Its eastern and southeastern coastal areas face the East China Sea and are the main areas affected by typhoons, rainstorms, and strong winds; Wind10, R50mm, and DrySpell are all at relatively high levels there. The southern and southwestern areas are dominated by hilly and mountainous terrain, where complex topography can favour heat accumulation and therefore stronger high-temperature hazards. The northwestern and inland plain areas are less directly affected by marine regulation and have relatively flat terrain, so the frequency and intensity of extreme climate events are comparatively lower [57].
Second, the urban development pattern is the core factor shaping the land-use sensitivity characteristics of urban climate change risk in Ningbo. Urban development has expanded outward from the municipal centre and from urban and subdistrict centres adjacent to roads and coastlines, especially along major roads [58]. As the core carrier of Ningbo Port, Beilun District has a high concentration of port logistics, port-related industries, and warehousing facilities. Large-scale expansion of built-up land has produced a continuous impervious surface, while natural ecological spaces such as green space, forest land, and water areas have been substantially compressed, resulting in a significant increase in land-use sensitivity.
This spatial differentiation indicates that urban climate change risk depends not only on natural climatic conditions but is also closely related to land-use changes driven by human activities [58]. Changes in land use and land management affect the urban hydrological processes that determine flood hazards, water resources for human and environmental needs, and pollutant transport and dilution [59]. Optimising the land-use structure, reasonably controlling built-up land expansion, and increasing green space and water areas can effectively reduce urban land-use sensitivity and mitigate integrated climate change risk [60].
4.2. Correspondence Between Land-Use Types and the Formation of High-Risk Areas
Based on model identification and SHAP interpretation, land-use sensitivity variables show a certain correspondence with high-risk areas. This indicates that land-use variables can explain part of the spatial variation in high-risk area formation, but cannot independently account for the full distribution pattern. High-risk area formation is still jointly influenced by climate hazard, land–sea location, terrain conditions, urban development intensity, local spatial structure, and other factors [61,62]. Among the three land-use sensitivity variables, the green/forest buffering insufficiency index has the highest mean absolute SHAP value and is the most important variable for high-risk area discrimination; the standardised built-up land ratio ranks second, and the water regulation insufficiency index is the lowest. Existing studies show that the climate risk amplification effect of urban built-up land mainly operates through the heat-island effect, rain-island effect, waterlogging risk, and ecological-space compression [63,64].
4.2.1. Risk Amplification Effect of Built-Up Land
The standardised built-up land ratio shows a clear positive risk contribution. The SHAP single-factor dependence relationship indicates that, when the standardised built-up land ratio exceeds 20%, SHAP values increase with the variable, suggesting that after construction intensity reaches a certain level, the positive contribution of built-up land ratio to high-risk identification begins to strengthen.
This result is consistent with the formation process of urban climate risk. The risk amplification effect of built-up land operates mainly through the following mechanisms: (1) the heat-island effect, whereby built-up land, especially impervious surfaces, has low heat capacity and high thermal conductivity, absorbs substantial solar radiation during the day, and releases heat slowly at night, raising surface temperature and aggravating heat-wave risk [65,66]; (2) the rain-island effect, whereby increased surface roughness strengthens atmospheric convection, and the urban heat-island effect promotes cloud formation and development, increasing urban precipitation [67,68]; (3) waterlogging risk, whereby increased impervious surfaces reduce infiltration and increase runoff, while urban drainage systems often lag behind urban development, thereby increasing rainstorm waterlogging risk [69]; and (4) ecological-space compression, whereby built-up land expansion occupies green land and water areas, weakens the climate-regulation function of natural ecosystems, and further intensifies climate change risk [70,71,72].
4.2.2. Risk Contributions of Insufficient Ecological Buffering and Blue Space
The importance of green and forest land indicates that ecological buffering capacity plays a key role in distinguishing high-risk from non-high-risk units. Green and forest spaces can mitigate climate risk through shading [73], evapotranspiration [74], rainfall interception [75], soil-water conservation, and improvement of local microclimates [76]. The results also suggest that ecological space should not be treated merely as a land-use category, but as a functional component of urban climate adaptation. Maintaining the continuity and integrity of green and forest land is therefore essential for reducing climate sensitivity.
The water regulation insufficiency index also shows a positive risk contribution, but its intensity is weaker than that of green/forest buffering insufficiency and the standardised built-up land ratio. The main turning point of water regulation insufficiency is close to zero. Given that water areas often appear as local patches within 1 km × 1 km fishnet units, this turning point is better interpreted as whether a unit contains a water-area configuration. When a unit contains some water area, SHAP values are mostly negative or close to zero, and the high-risk identification probability is relatively low. When water configuration becomes insufficient or absent, SHAP values rise rapidly and become positive. This indicates that water bodies can buffer high-risk identification, but their effect is mainly concentrated at the presence/absence threshold. Water-body risk mitigation mainly operates through evaporative cooling and stormwater regulation [77], but it also has limitations. In highly urbanised areas, waterfront zones are often key development areas with high construction intensity. At the same time, a high proportion of urban water area may aggravate storm-surge-related risk. During storm surges, high water levels can significantly reduce inland flood drainage efficiency during rainfall, resulting in more severe flooding [78].
Green/forest buffering insufficiency has a global discriminative role and can strongly distinguish high-risk from non-high-risk units. Water regulation insufficiency more often reflects local regulatory conditions; its contribution is weaker, but in units lacking water-body configuration, it still increases the probability of high-risk identification.
4.2.3. Nonlinear Thresholds and Interaction Effects of Land-Use Variables
Urban climate high-risk areas are formed through the joint action of land-use structural composition and natural geographical patterns [79,80]. The influence of land-use variables on identifying high climate change risk areas shows clear nonlinear thresholds and hierarchical interaction effects.
Pairwise interaction results further show that the combination of built-up land and ecological buffering insufficiency is an important source of high-risk area identification. Measured by mean absolute SHAP interaction value, the interaction between the standardised built-up land ratio and the green/forest buffering insufficiency index is the strongest, accounting for 47.2% of the total interaction intensity among the three pairs. The interaction between the standardised built-up land ratio and the water regulation insufficiency index ranks second, accounting for 34.6%, while the interaction between green/forest buffering insufficiency and water regulation insufficiency is the weakest, accounting for 18.2%. Interactions in high-risk area formation mainly revolve around built-up land, especially the relationship between built-up land and insufficient green/forest buffering. This finding is consistent with existing studies on land-use threshold effects and indicates that urbanisation and land-use change have a clear influence on climate change risk, especially on local urban climate [81].
The standardized proportion of built-up land, the green space and forest buffering insufficiency index, and the water regulation insufficiency index correspond to different response patterns. The standardized built-up land proportion shows a positive cumulative effect, with approximately 20% representing an important turning point at which its risk contribution begins to increase. The green space and forest buffering insufficiency index shows a rapid shift toward positive SHAP values at low values and maintains a relatively strong contribution at medium-to-high values. The water regulation insufficiency index exhibits a rapid increase at the low-value stage and then gradually enters a plateau, suggesting that its effect is mainly concentrated around the presence–absence transition of water bodies. Overall, the built-up land proportion of approximately 20%, the green space and forest buffering insufficiency level of approximately 2%, and the presence or absence of water bodies should be understood as grid-scale warning references for climate risk identification rather than rigid planning control standards. For areas approaching or exceeding the built-up land turning point, priority should be given to controlling additional construction intensity and increasing permeable surfaces and blue–green infrastructure. For areas with evident insufficiency in green space and forest buffering capacity, ecological restoration, green corridor construction, and the protection of continuous ecological spaces should be strengthened.
5. Conclusions
Taking Ningbo as the study area, this paper constructs an extreme climate hazard index and a land-use sensitivity index based on multi-source data, assesses the spatial pattern of urban climate change risk, and uses XGBoost combined with SHAP to further explain the relationship between land-use sensitivity variables and high-risk area identification. The main conclusions are as follows:
- (1)
- Extreme climate hazard in Ningbo shows clear spatial differentiation. Eastern and southeastern coastal areas mainly face strong winds, rainstorms, and drought-persistence pressure, while the southern and southwestern areas have stronger high-temperature hazards. Overall, the pattern is characterised by stronger coastal wind–rain and dry-spell pressure and more prominent thermal pressure in the south. High climate hazard index values are mainly concentrated in eastern coastal areas such as Beilun, Eastern Yinzhou, and Zhenhai, whereas low values are mainly distributed in Cixi, Yuyao, and some inland areas.
- (2)
- The land-use sensitivity index in Ningbo decreases from the main urban area and coastal development belt toward peripheral ecological areas. High-value areas are mainly concentrated in Beilun, Zhenhai, Yinzhou, and other main urban districts, while low-value areas are mainly distributed in Ninghai, Xiangshan, Southern Fenghua, Western Yuyao, and other areas with relatively continuous ecological space.
- (3)
- Integrated climate change risk in Ningbo shows marked spatial unevenness, with higher levels in the northeastern coastal and central–eastern areas and lower levels in the western and southwestern areas. High-risk and relatively high-risk areas are mainly concentrated in Jiangbei, Zhenhai, Eastern Haishu, Northwestern and Eastern Yinzhou, and Northwestern and Eastern Beilun, whereas low-risk and relatively low-risk areas are mainly concentrated in Ninghai, Southwestern Fenghua, and parts of Southern Yuyao.
- (4)
- Land-use characteristics are important factors influencing high-risk area formation in Ningbo, and different land-use types differ markedly in direction and intensity of influence. The green/forest buffering insufficiency index has the highest mean absolute SHAP value, 0.38; the standardised built-up land ratio ranks second, 0.18; and the water regulation insufficiency index is lowest, 0.15.
- (5)
- The effects of land-use variables on high-risk area identification show clear nonlinear threshold characteristics. The threshold of the built-up land ratio is approximately 20.0%; above this threshold, its risk amplification effect becomes stable. The threshold of green/forest buffering insufficiency is approximately 2.0%; above this threshold, the model is more likely to identify the corresponding units as high climate change risk areas. The threshold of water-area ratio is close to 0.0%, which is more appropriately interpreted as whether the unit contains a water-area configuration.
- (6)
- Significant interaction effects exist among land-use variables. The interaction between built-up land and green/forest land is the most prominent, followed by the interaction between built-up land and water area, while the interaction between green/forest land and water area is relatively weak. Under a high green-land background, the risk amplification effect of built-up land is partially weakened, indicating that retaining a certain proportion of green/forest land can effectively mitigate the climate change risk associated with built-up land expansion.
The findings have important practical implications for urban planning and climate change response in Ningbo. In future urban development, the city should optimise its spatial layout, strictly control the expansion of built-up land in high-risk areas such as Beilun and Zhenhai, and improve land-use efficiency. Urban ecological construction should be strengthened by increasing green space and water areas. In particular, in areas where the proportion of built-up land exceeds 20.0%, the proportion of green space and forest land should be maintained at no less than 2.0%, and water spaces should be reasonably allocated. A blue–green ecological network should be developed to improve the continuity and integrity of ecological space and enhance the climate-regulation capacity of the city. Differentiated climate adaptation strategies should be formulated for areas with different risk levels, thereby improving the overall climate adaptation capacity of the city and supporting sustainable urban development.
Author Contributions
Conceptualization, writing and funding acquisition, Q.Y.; methodology and visualisation N.A.; data curation, Y.Y.; audit, H.A.; supervision, H.L. All authors have read and agreed to the published version of the manuscript.
Funding
This research was funded by the General Project of Humanities and Social Sciences Research, Ministry of Education, China, grant number 23YJCZH275; Annual Project of Zhejiang Provincial Philosophy and Social Sciences Planning, grant number 22NDJC069YB; National Social Science Fund of China, Western Project, grant number 23XSH002; as well as National Natural Science Foundation of China, grant number 52278071.
Data Availability Statement
Publicly available datasets were analysed in this study. This data can be found on Web of Science.
Conflicts of Interest
The authors declare that they have no known competing financial interests or personal relationships that could have appeared to influence the work reported in this paper.
Abbreviations
The following abbreviations are used in this manuscript:
| AUC | Area Under the Curve |
| BuiltPct | Proportion of Construction Land |
| CLCD | China Land Cover Dataset |
| CRITIC | Criteria Importance Through Intercriteria Correlation |
| DrySpell | Annual Average Maximum Consecutive Dry Days |
| GreenPct | Proportion of Green Space and Forest Land |
| HotDays35 | Annual Average Number of Days with Maximum Temperature ≥ 35 °C |
| IDW | Inverse Distance Weighting |
| NCEI | National Centers for Environmental Information |
| R50mm | Annual Average Number of Days with Daily Precipitation ≥ 50 mm |
| RH | Relative Humidity |
| SHAP | SHapley Additive exPlanations |
| WaterPct | Proportion of Water Area |
| Wind10 | Annual Average Number of Days with Maximum Wind Speed ≥ 10 m/s |
| XGBoost | Extreme Gradient Boosting |
References
- Intergovernmental Panel on Climate Change (IPCC). Climate Change 2021—The Physical Science Basis: Working Group I Contribution to the Sixth Assessment Report of the Intergovernmental Panel on Climate Change; Cambridge University Press: Cambridge, UK, 2023. [Google Scholar]
- World Economic Forum. The Global Risks Report 2022, 17th ed.; Insight Report; World Economic Forum: Geneva, Switzerland, 2022; ISBN 978-2-940631-09-4. [Google Scholar]
- Intergovernmental Panel on Climate Change (IPCC). Climate Change 2022—Impacts, Adaptation and Vulnerability: Working Group II Contribution to the Sixth Assessment Report of the Intergovernmental Panel on Climate Change; Cambridge University Press: Cambridge, UK, 2023. [Google Scholar]
- Dodman, D.; Hayward, B.; Pelling, M.; Broto, V.C.; Chow, W.; Chu, E.; Dawson, R.; Khirfan, L.; McPhearson, T.; Prakash, A. Cities, Settlements and Key Infrastructure. In Climate Change 2022: Impacts, Adaptation, and Vulnerability, Contribution of Working Group II to the Sixth Assessment Report of the Intergovernmental Panel on Climate Change; IPCC: Geneva, Switzerland, 2022. [Google Scholar]
- IPCC. Managing the Risks of Extreme Events and Disasters to Advance Climate Change Adaptation—IPCC; IPCC: Geneva, Switzerland, 2012. [Google Scholar]
- China Meteorological Administration. Release of the China Climate Change Blue Book: The Climate System Continues to Warm. 2025. Available online: https://www.cndataseed.com/data-detail/3403?database_id=855 (accessed on 27 April 2026).
- Germanwatch, H.S. Global Climate Risk Index 2021. 2021. Available online: https://www.developmentaid.org/api/frontend/cms/file/2021/03/Global-Climate-Risk-Index-2021_1.pdf (accessed on 15 April 2026).
- China Meteorological Administration. An In-Depth Reading of the China Climate Change Blue Book: An Analysis of the Characteristics and Trends of Climate Change in China and Worldwide. 2025. Available online: https://www.cma.gov.cn/2011xwzx/2011xqxxw/2011xqxyw/202506/t20250630_7175137.html (accessed on 29 May 2026).
- Turner, B.L.; Lambin, E.F.; Reenberg, A. The Emergence of Land Change Science for Global Environmental Change and Sustainability. Proc. Natl. Acad. Sci. USA 2007, 104, 20666–20671. [Google Scholar] [CrossRef] [Scilit] [PubMed]
- Carlson, T.N.; Arthur, S.T. The Impact of Land Use—Land Cover Changes Due to Urbanization on Surface Microclimate and Hydrology: A Satellite Perspective. Glob. Planet. Change 2000, 25, 49–65. [Google Scholar] [CrossRef] [Scilit]
- Jesudhas, C.J.; Muniraj, K.; Devaraj, S. Factors That Influence the Hydrological Process: A Climate and Land Use/Land Cover Perspective. In Climate Change Impact on Groundwater Resources; Panneerselvam, B., Pande, C.B., Muniraj, K., Balasubramanian, A., Ravichandran, N., Eds.; Springer International Publishing: Cham, Switzerland, 2022; pp. 25–46. ISBN 978-3-031-04706-0. [Google Scholar]
- Chester, M.V.; Miller, T.R.; Muñoz-Erickson, T.A.; Helmrich, A.M.; Iwaniec, D.M.; McPhearson, T.; Cook, E.M.; Grimm, N.B.; Markolf, S.A. Sensemaking for Entangled Urban Social, Ecological, and Technological Systems in the Anthropocene. npj Urban Sustain. 2023, 3, 39. [Google Scholar] [CrossRef] [Scilit]
- McPhearson, T.; Haase, D.; Kabisch, N.; Gren, Å. Advancing Understanding of the Complex Nature of Urban Systems. Ecol. Indic. 2016, 70, 566–573. [Google Scholar] [CrossRef] [Scilit]
- Wu, H.; Qin, Y.; Dunchev, D.; Che, S.; Ivanova, B. Urban Climate Risk Assessment under Climate and Land Use Changes Impact: A Multi-Dimensional Approach. Urban Clim. 2025, 61, 102379. [Google Scholar] [CrossRef] [Scilit]
- Trabucco, I.; Cristiano, S. Urban Climate Change Mitigation, Adaptation, and Disaster Risk Reduction—A Review on Their Joint Use for Spatial Resilience. Contesti Città Territ. Progett. 2026, 56–95. [Google Scholar] [CrossRef] [Scilit]
- Yu, H.; Zhao, Y.; Fu, Y.; Li, L. Spatiotemporal Variance Assessment of Urban Rainstorm Waterlogging Affected by Impervious Surface Expansion: A Case Study of Guangzhou, China. Sustainability 2018, 10, 3761. [Google Scholar] [CrossRef] [Scilit]
- Zhang, Y.; Dai, M. Analysis of the Cooling and Humidification Effect of Multi-Layered Vegetation Communities in Urban Parks and Its Impact. Atmosphere 2022, 13, 2045. [Google Scholar] [CrossRef] [Scilit]
- Zhu, L.; Gao, C.; Wu, M.; Zhu, R. Integrating Blue–Green Infrastructure with Gray Infrastructure for Climate-Resilient Surface Water Flood Management in the Plain River Networks. Land 2025, 14, 634. [Google Scholar] [CrossRef] [Scilit]
- Noszczyk, T. A Review of Approaches to Land Use Changes Modeling. Hum. Ecol. Risk Assess. Int. J. 2019, 25, 1377–1405. [Google Scholar] [CrossRef] [Scilit]
- Thaile, M.; Abhinaya, Y.; Rajkumar, G.; Kumar, P.S.; Sunitha, Y.; Shivani, V.; Pittala, R.B.; Kiran, M.A. Climate Change and Agriculture Land Suitability Insights from Interpretable Machine Learning. In Proceedings of the 2025 IEEE 4th World Conference on Applied Intelligence and Computing (AIC), New Delhi, India, 26–27 July 2025; pp. 273–278. [Google Scholar]
- Tang, Y.-T.; Chan, F.K.S.; Griffiths, J. City Profile: Ningbo. Cities 2015, 42, 97–108. [Google Scholar] [CrossRef] [Scilit]
- Liu, Y.; Feng, Y. Simulating the Impact of Economic and Environmental Strategies on Future Urban Growth Scenarios in Ningbo, China. Sustainability 2016, 8, 1045. [Google Scholar] [CrossRef] [Scilit]
- Zheng, Q.; Wang, K.; Huang, L.; Zheng, Q.; Abubakar, G.A. Monitoring the Different Types of Urban Construction Land Expansion (UCLE) in China’s Port City: A Case Study of Ningbo’s Central City. Sustainability 2017, 9, 2374. [Google Scholar] [CrossRef] [Scilit]
- Tianditu National Platform for Common Geospatial Information Services: Tianditu. Available online: https://www.tianditu.gov.cn/ (accessed on 27 April 2026).
- Hu, K.; Li, Q.; Cao, L.; Zhou, X.; Xu, W.; Chen, Z.; Yang, S.; Qin, Y.; Zhou, H. *Dataset of China Surface Climate Normals for 1981–2010* [Dataset]; National Meteorological Information Centre, China Meteorological Administration: Beijing, China, 2020; Available online: http://cmakjgl.cmatc.cn/cgview.aspx?id=MTE5OTU3MjExOTk1NzI* (accessed on 8 July 2026).
- National Centers for Environmental Information Maps and Geospatial Products. Available online: https://www.ncei.noaa.gov/maps-and-geospatial-products (accessed on 17 March 2026).
- Shepard, D. A Two-Dimensional Interpolation Function for Irregularly-Spaced Data. In Proceedings of the 1968 23rd ACM National Conference; ACM Press: New York, NY, USA, 1968; pp. 517–524. [Google Scholar]
- Yang, J.; Huang, X. The 30 m Annual Land Cover Dataset and Its Dynamics in China from 1990 to 2019. Earth Syst. Sci. Data 2021, 13, 3907–3925. [Google Scholar] [CrossRef] [Scilit]
- Diakoulaki, D.; Mavrotas, G.; Papayannakis, L. Determining Objective Weights in Multiple Criteria Problems: The Critic Method. Comput. Oper. Res. 1995, 22, 763–770. [Google Scholar] [CrossRef] [Scilit]
- Pearson, K., VII. Note on Regression and Inheritance in the Case of Two Parents. Proc. R. Soc. Lond. 1895, 58, 240–242. [Google Scholar] [CrossRef] [Scilit]
- Hosmer, D.W.; Lemeshow, S.; Sturdivant, R.X. Applied Logistic Regression, 3rd ed.; Wiley: Hoboken, NJ, USA, 2013; ISBN 978-0-470-58247. [Google Scholar]
- Breiman, L. Random Forests. Mach. Learn. 2001, 45, 5–32. [Google Scholar] [CrossRef] [Scilit]
- Chen, T.; Guestrin, C. XGBoost: A Scalable Tree Boosting System. In Proceedings of the 22nd ACM SIGKDD International Conference on Knowledge Discovery and Data Mining, San Francisco, CA, USA, 13 August 2016; pp. 785–794. [Google Scholar]
- Sokolova, M.; Lapalme, G. A Systematic Analysis of Performance Measures for Classification Tasks. Inf. Process. Manag. 2009, 45, 427–437. [Google Scholar] [CrossRef] [Scilit]
- Fawcett, T. An Introduction to ROC Analysis. Pattern Recognit. Lett. 2006, 27, 861–874. [Google Scholar] [CrossRef] [Scilit]
- Powers, D. Evaluation: From Precision, Recall and F-Measure to ROC, Informedness, Markedness & Correlation. J. Mach. Learn. Technol. 2011, 2, 37–63. [Google Scholar]
- Li, Y.; He, Y.; Yang, F.; An, H.; Li, J.; Xie, Y. An XGBoost-SHAP Analysis of the Driving Factors of Carbon Emissions in China’s First-Tier Cities. Sci. Rep. 2025, 16, 1659. [Google Scholar] [CrossRef] [Scilit] [PubMed]
- Lundberg, S.M.; Lee, S.-I. A Unified Approach to Interpreting Model Predictions. Adv. Neural Inf. Process. Syst. 2017, 30, 4768–4777. [Google Scholar]
- Lundberg, S.M.; Erion, G.; Chen, H.; DeGrave, A.; Prutkin, J.M.; Nair, B.; Katz, R.; Himmelfarb, J.; Bansal, N.; Lee, S.-I. From Local Explanations to Global Understanding with Explainable AI for Trees. Nat. Mach. Intell. 2020, 2, 56–67. [Google Scholar] [CrossRef] [Scilit] [PubMed]
- Feng, H.; Zhang, X.; Shi, P.; Shi, J.; Wang, Z. Environmental Interpretation of Spatial Heterogeneity in the Trade-Offs and Synergies of Land Use Functions: A Study Based on the XGBoost-SHAP Model. J. Arid Land 2025, 17, 1378–1401. [Google Scholar] [CrossRef] [Scilit]
- Zhang, L.; Zhang, X.; Gao, S.; Gu, X. Revealing Nonlinear Relationships and Thresholds of Human Activities and Climate Change on Ecosystem Services in Anhui Province Based on the XGBoost–SHAP Model. Sustainability 2025, 17, 8728. [Google Scholar] [CrossRef] [Scilit]
- Eminoğlu, Y.; Tarhan, Ç. Decadal Evolution of GIS in Disaster Management and Risk Assessment. Int. J. Eng. Geosci. 2025, 10, 173–196. [Google Scholar] [CrossRef] [Scilit]
- Zhou, S.; Zhai, G. A Multi-Hazard Risk Assessment Framework for Urban Disaster Prevention Planning: A Case Study of Xiamen, China. Land 2023, 12, 1884. [Google Scholar] [CrossRef] [Scilit]
- Chang, J.; Yin, Z.; Zhang, Z.; Xu, X.; Zhao, M. Multi-Disaster Integrated Risk Assessment in City Range—A Case Study of Jinan, China. Int. J. Environ. Res. Public Health 2023, 20, 3483. [Google Scholar] [CrossRef] [Scilit] [PubMed]
- Fu, Y.; Zhu, Z.; Liu, L.; Zhan, W.; He, T.; Shen, H.; Zhao, J.; Liu, Y.; Zhang, H.; Liu, Z.; et al. Remote Sensing Time Series Analysis: A Review of Data and Applications. J. Remote Sens. 2024, 4, 0285. [Google Scholar] [CrossRef] [Scilit]
- Singh, D.K.; Rawat, N. Machine Learning for Weather Forecasting: XGBoost vs SVM vs Random Forest in Predicting Temperature for Visakhapatnam. Int. J. Intell. Syst. Appl. 2023, 15, 57–69. [Google Scholar] [CrossRef] [Scilit]
- Gasper, R.; Blohm, A.; Ruth, M. Social and Economic Impacts of Climate Change on the Urban Environment. Curr. Opin. Environ. Sustain. 2011, 3, 150–157. [Google Scholar] [CrossRef] [Scilit]
- Satterthwaite, D.; Huq, S.; Reid, H.; Pelling, M.; Lankao, P.R. Adapting to Climate Change in Urban Areas: The Possibilities and Constraints in Low- and Middle-Income Nations. In Adapting Cities to Climate Change; Routledge: London, UK, 2009. [Google Scholar]
- Friedman, J.H. Greedy Function Approximation: A Gradient Boosting Machine. Ann. Stat. 2001, 29, 1189–1232. [Google Scholar] [CrossRef] [Scilit]
- Rogger, M.; Agnoletti, M.; Alaoui, A.; Bathurst, J.C.; Bodner, G.; Borga, M.; Chaplot, V.; Gallart, F.; Glatzel, G.; Hall, J.; et al. Land Use Change Impacts on Floods at the Catchment Scale: Challenges and Opportunities for Future Research. Water Resour. Res. 2017, 53, 5209–5219. [Google Scholar] [CrossRef] [Scilit] [PubMed]
- Dubi, A. Land-Use and Land-Cover (LULC) Change Detection and the Implications for Coastal Water Resource Management in the Wami–Ruvu Basin, Tanzania. Sustainability 2021, 13, 4092. [Google Scholar] [CrossRef] [Scilit]
- Sugianto, S.; Deli, A.; Miswar, E.; Rusdi, M.; Irham, M. The Effect of Land Use and Land Cover Changes on Flood Occurrence in Teunom Watershed, Aceh Jaya. Land 2022, 11, 1271. [Google Scholar] [CrossRef] [Scilit]
- Sun, L.; Yu, H.; Sun, M.; Wang, Y. Coupled Impacts of Climate and Land Use Changes on Regional Ecosystem Services. J. Environ. Manag. 2023, 326, 116753. [Google Scholar] [CrossRef] [Scilit]
- Xiao, J.; Song, F.; Su, F.; Shi, Z.; Song, S. Quantifying the Independent Contributions of Climate and Land Use Change to Ecosystem Services. Ecol. Indic. 2023, 153, 110411. [Google Scholar] [CrossRef] [Scilit]
- Majidi, A.; Hosseini, S.A.; Nazif, S.; Ghermezcheshmeh, B. Comprehensive Analysis of the Impacts of Climate and Land Use Changes on Flood Damage (Case Study: AqQala, Iran). J. Water Clim. Change 2024, 15, 3260–3275. [Google Scholar] [CrossRef] [Scilit]
- Praskievicz, S.; Chang, H. A Review of Hydrological Modelling of Basin-Scale Climate Change and Urban Development Impacts. Prog. Phys. Geogr. Earth Environ. 2009, 33, 650–671. [Google Scholar] [CrossRef] [Scilit]
- Wei, B.; Li, Y.; Suo, A.; Zhang, Z.; Xu, Y.; Chen, Y. Spatial Suitability Evaluation of Coastal Zone, and Zoning Optimisation in Ningbo, China. Ocean Coast. Manag. 2021, 204, 105507. [Google Scholar] [CrossRef] [Scilit]
- Zhang, C.; Zhong, S.; Wang, X.; Shen, L.; Liu, L.; Liu, Y. Land Use Change in Coastal Cities during the Rapid Urbanization Period from 1990 to 2016: A Case Study in Ningbo City, China. Sustainability 2019, 11, 2122. [Google Scholar] [CrossRef] [Scilit]
- Wheater, H.; Evans, E. Land Use, Water Management and Future Flood Risk. Land Use Policy 2009, 26, S251–S264. [Google Scholar] [CrossRef] [Scilit]
- Roy, P.S.; Ramachandran, R.M.; Paul, O.; Thakur, P.K.; Ravan, S.; Behera, M.D.; Sarangi, C.; Kanawade, V.P. Anthropogenic Land Use and Land Cover Changes—A Review on Its Environmental Consequences and Climate Change. J. Indian Soc. Remote Sens. 2022, 50, 1615–1640. [Google Scholar] [CrossRef] [Scilit]
- Zhang, Y.; Hu, R.; Li, T.; Zhang, Z.; Fu, Z.; Dong, K.; Ma, J.; Lu, Z.; Sun, J. What Are the Driving Factors and Spatial-Temporal Characteristics of the Landscape Ecological Risk of the Yellow River Delta? Environ. Dev. Sustain. 2026. [Google Scholar] [CrossRef] [Scilit]
- Zhang, L.; Zhu, M.; Zhang, X.; Li, J.; Zhai, J. Identifying Potential Territorial Spatial Conflicts in Land–Sea Interaction Zones in Yancheng City, China: A Multidimensional Suitability Evaluation. Environ. Dev. Sustain. 2025. [Google Scholar] [CrossRef] [Scilit]
- Musco, F. (Ed.) Counteracting Urban Heat Island Effects in a Global Climate Change Scenario; Springer International Publishing: Cham, Switzerland, 2016; ISBN 978-3-319-10424-9. [Google Scholar]
- Irfeey, A.M.M.; Chau, H.-W.; Sumaiya, M.M.F.; Wai, C.Y.; Muttil, N.; Jamei, E. Sustainable Mitigation Strategies for Urban Heat Island Effects in Urban Areas. Sustainability 2023, 15, 10767. [Google Scholar] [CrossRef] [Scilit]
- Zou, Z.; Yan, C.; Yu, L.; Jiang, X.; Ding, J.; Qin, L.; Wang, B.; Qiu, G. Impacts of Land Use/ Land Cover Types on Interactions between Urban Heat Island Effects and Heat Waves. Build. Environ. 2021, 204, 108138. [Google Scholar] [CrossRef] [Scilit]
- Hua, L.; Zhang, X.; Nie, Q.; Sun, F.; Tang, L. The Impacts of the Expansion of Urban Impervious Surfaces on Urban Heat Islands in a Coastal City in China. Sustainability 2020, 12, 475. [Google Scholar] [CrossRef] [Scilit]
- Zhao, Y.; Xia, J.; Xu, Z.; Zou, L.; Qiao, Y.; Li, P. Impact of Urban Expansion on Rain Island Effect in Jinan City, North China. Remote Sens. 2021, 13, 2989. [Google Scholar] [CrossRef] [Scilit]
- Pathirana, A.; Denekew, H.B.; Veerbeek, W.; Zevenbergen, C.; Banda, A.T. Impact of Urban Growth-Driven Landuse Change on Microclimate and Extreme Precipitation—A Sensitivity Study. Atmos. Res. 2014, 138, 59–72. [Google Scholar] [CrossRef] [Scilit]
- Sohn, W.; Kim, J.-H.; Li, M.-H.; Brown, R.D.; Jaber, F.H. How Does Increasing Impervious Surfaces Affect Urban Flooding in Response to Climate Variability? Ecol. Indic. 2020, 118, 106774. [Google Scholar] [CrossRef] [Scilit]
- Munang, R.; Thiaw, I.; Alverson, K.; Liu, J.; Han, Z. The Role of Ecosystem Services in Climate Change Adaptation and Disaster Risk Reduction. Curr. Opin. Environ. Sustain. 2013, 5, 47–52. [Google Scholar] [CrossRef] [Scilit]
- Oliver, T.H.; Morecroft, M.D. Interactions between Climate Change and Land Use Change on Biodiversity: Attribution Problems, Risks, and Opportunities. WIREs Clim. Change 2014, 5, 317–335. [Google Scholar] [CrossRef] [Scilit]
- Malhi, Y.; Franklin, J.; Seddon, N.; Solan, M.; Turner, M.G.; Field, C.B.; Knowlton, N. Climate Change and Ecosystems: Threats, Opportunities and Solutions. Philos. Trans. R. Soc. B Biol. Sci. 2020, 375, 20190104. [Google Scholar] [CrossRef] [Scilit] [PubMed]
- Fryd, O.; Pauleit, S.; Bühler, O. The Role of Urban Green Space and Trees in Relation to Climate Change. CABI Rev. 2012, 6, 1–18. [Google Scholar] [CrossRef] [Scilit]
- Edeigba, B.A.; Ashinze, U.K.; Umoh, A.A.; Biu, P.W.; Daraojimba, A.I.; Edeigba, B.A.; Ashinze, U.K.; Umoh, A.A.; Biu, P.W.; Daraojimba, A.I. Urban Green Spaces and Their Impact on Environmental Health: A Global Review. World J. Adv. Res. Rev. 2024, 21, 917–927. [Google Scholar] [CrossRef] [Scilit]
- Qiu, G.; Li, H.; Zhang, Q.; Chen, W.; Liang, X.; Li, X. Effects of Evapotranspiration on Mitigation of Urban Temperature by Vegetation and Urban Agriculture. J. Integr. Agric. 2013, 12, 1307–1315. [Google Scholar] [CrossRef] [Scilit]
- Tong, P.; Yin, H.; Wang, Z.; Trivers, I. Combining Stormwater Management and Park Services to Mitigate Climate Change and Improve Human Well-Being: A Case Study of Sponge City Parks in Shanghai. Land 2022, 11, 1589. [Google Scholar] [CrossRef] [Scilit]
- Jandaghian, Z.; Colombo, A. The Role of Water Bodies in Climate Regulation: Insights from Recent Studies on Urban Heat Island Mitigation. Buildings 2024, 14, 2945. [Google Scholar] [CrossRef] [Scilit]
- Shi, S.; Yang, B.; Jiang, W. Numerical Simulations of Compound Flooding Caused by Storm Surge and Heavy Rain with the Presence of Urban Drainage System, Coastal Dam and Tide Gates: A Case Study of Xiangshan, China. Coast. Eng. 2022, 172, 104064. [Google Scholar] [CrossRef] [Scilit]
- Xin, J.; Yang, J.; Ren, J.; Yu, W.; Shi, Z.; Cong, N.; Xiao, X.; Xia, J.; Qiao, Z. Enhancing Urban Resilience: Mitigating Compound Risk through Multi-Scenario Land Use Optimization. Transp. B Transp. Dyn. 2025, 13, 2552888. [Google Scholar] [CrossRef] [Scilit]
- Boyacioglu, H.; Gunacti, M.C. Synergistic Effects of Climate and Land Use Change on Heat Index Extremes: Toward Risk Mapping and Assessment. Int. J. Environ. Sci. Technol. 2026, 23, 350. [Google Scholar] [CrossRef] [Scilit]
- Deng, X.; Zhao, C.; Yan, H. Systematic Modeling of Impacts of Land Use and Land Cover Changes on Regional Climate: A Review. Adv. Meteorol. 2013, 2013, 317678. [Google Scholar] [CrossRef] [Scilit]
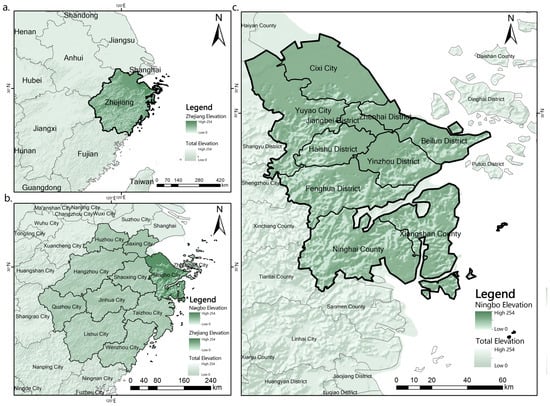
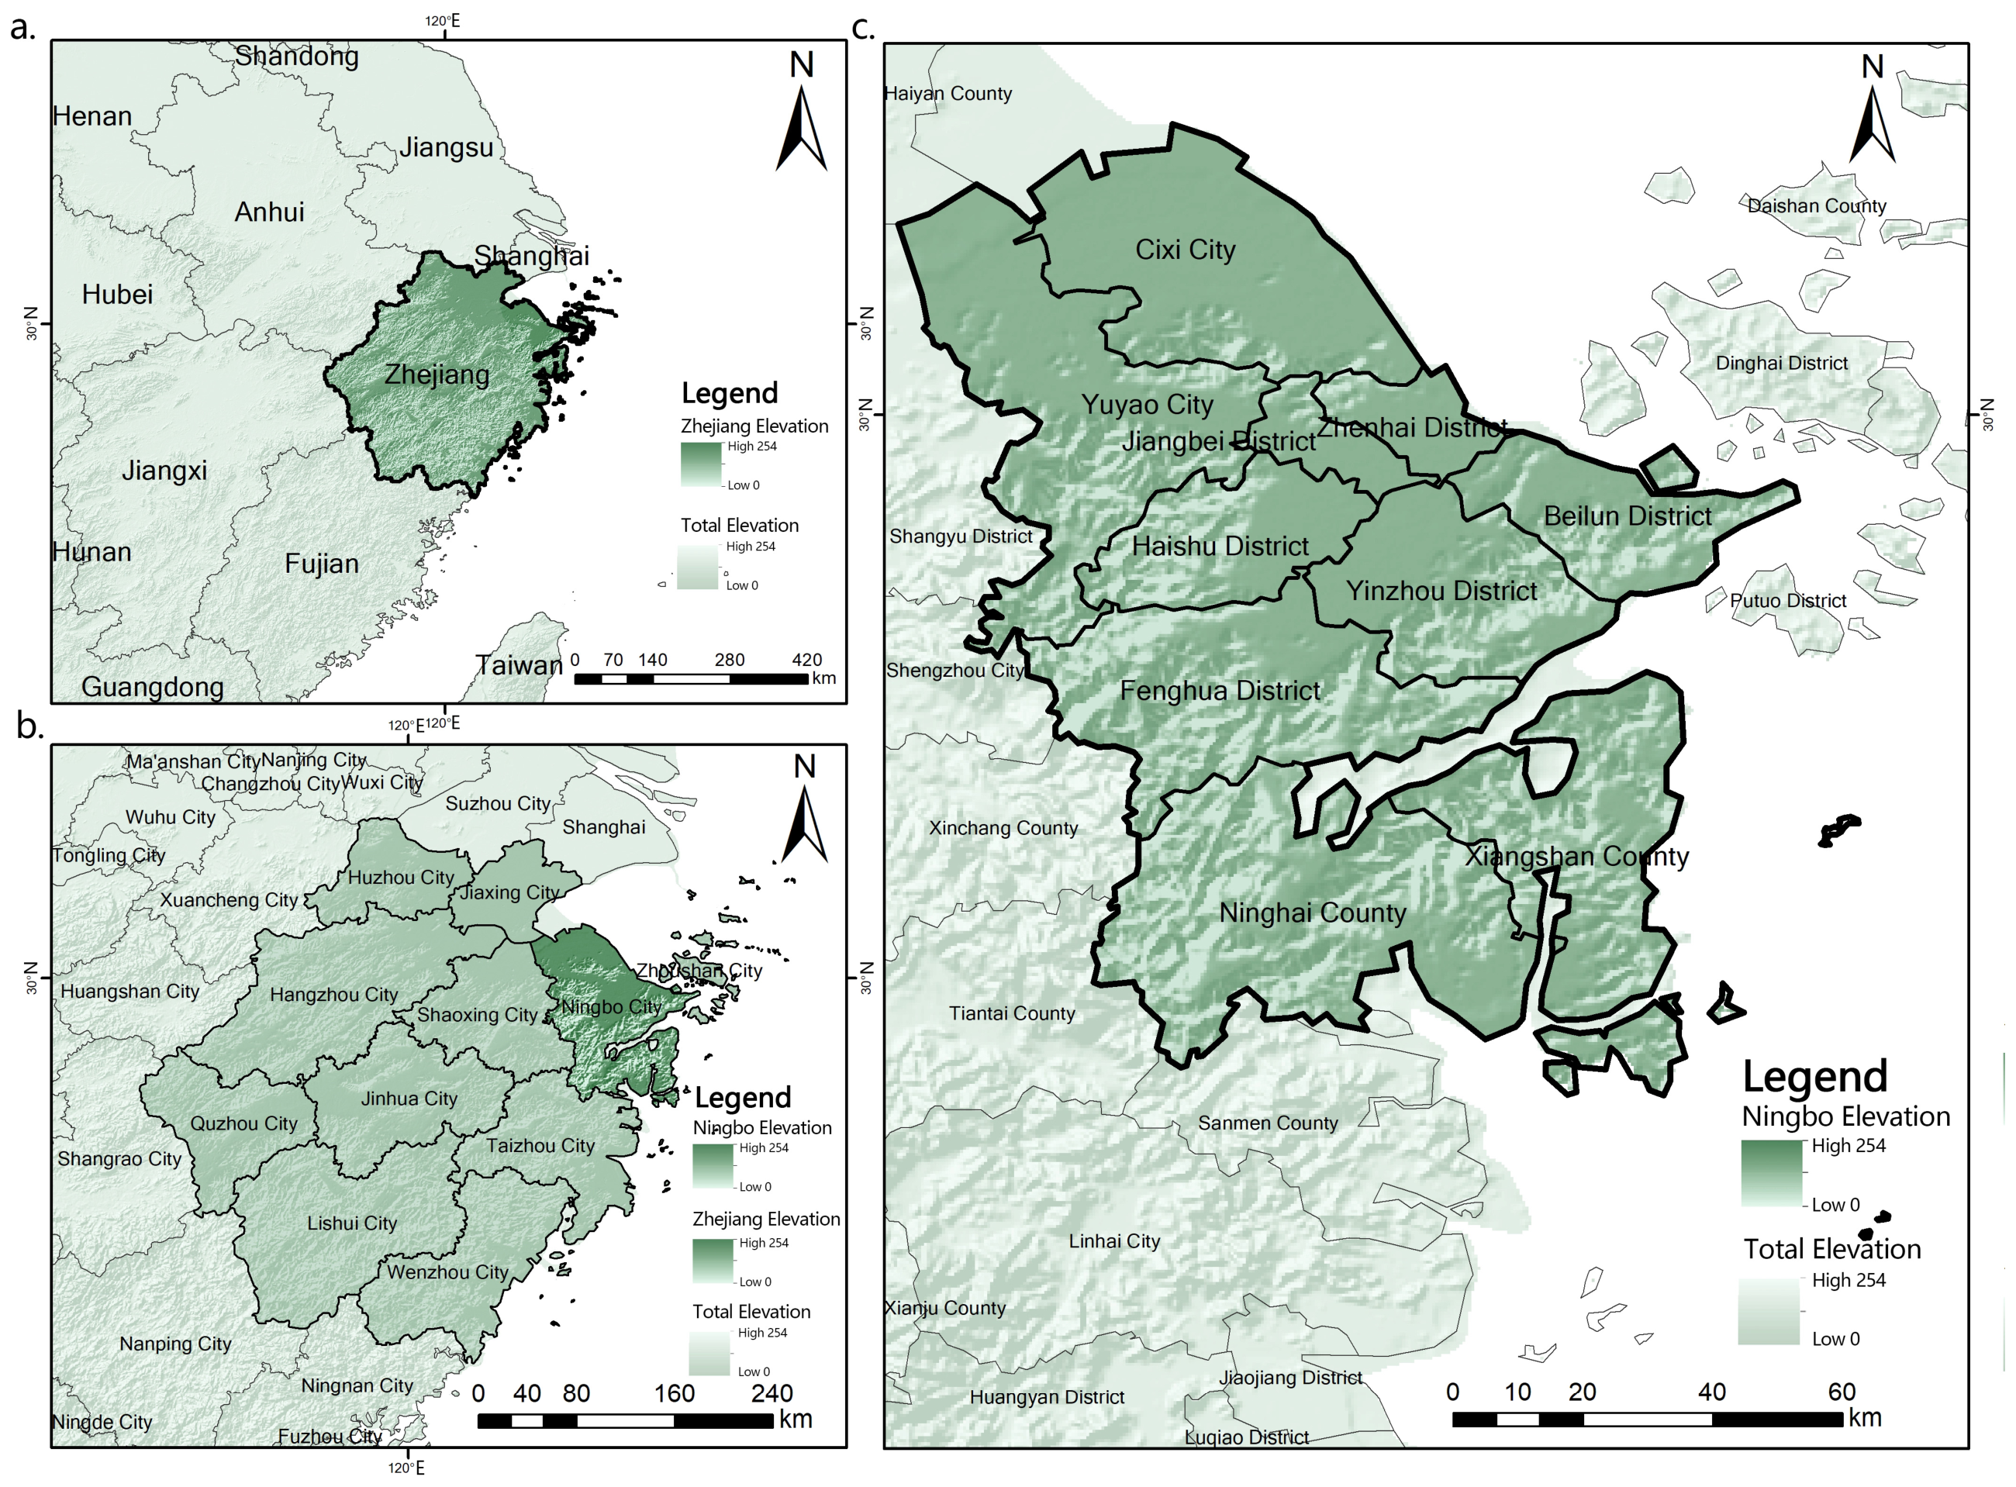
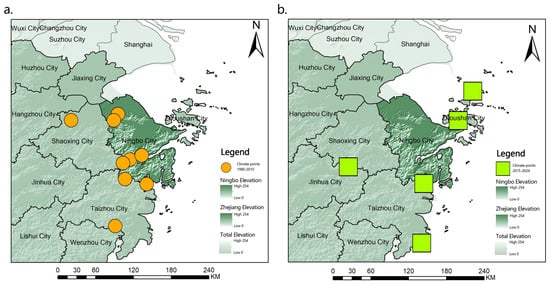
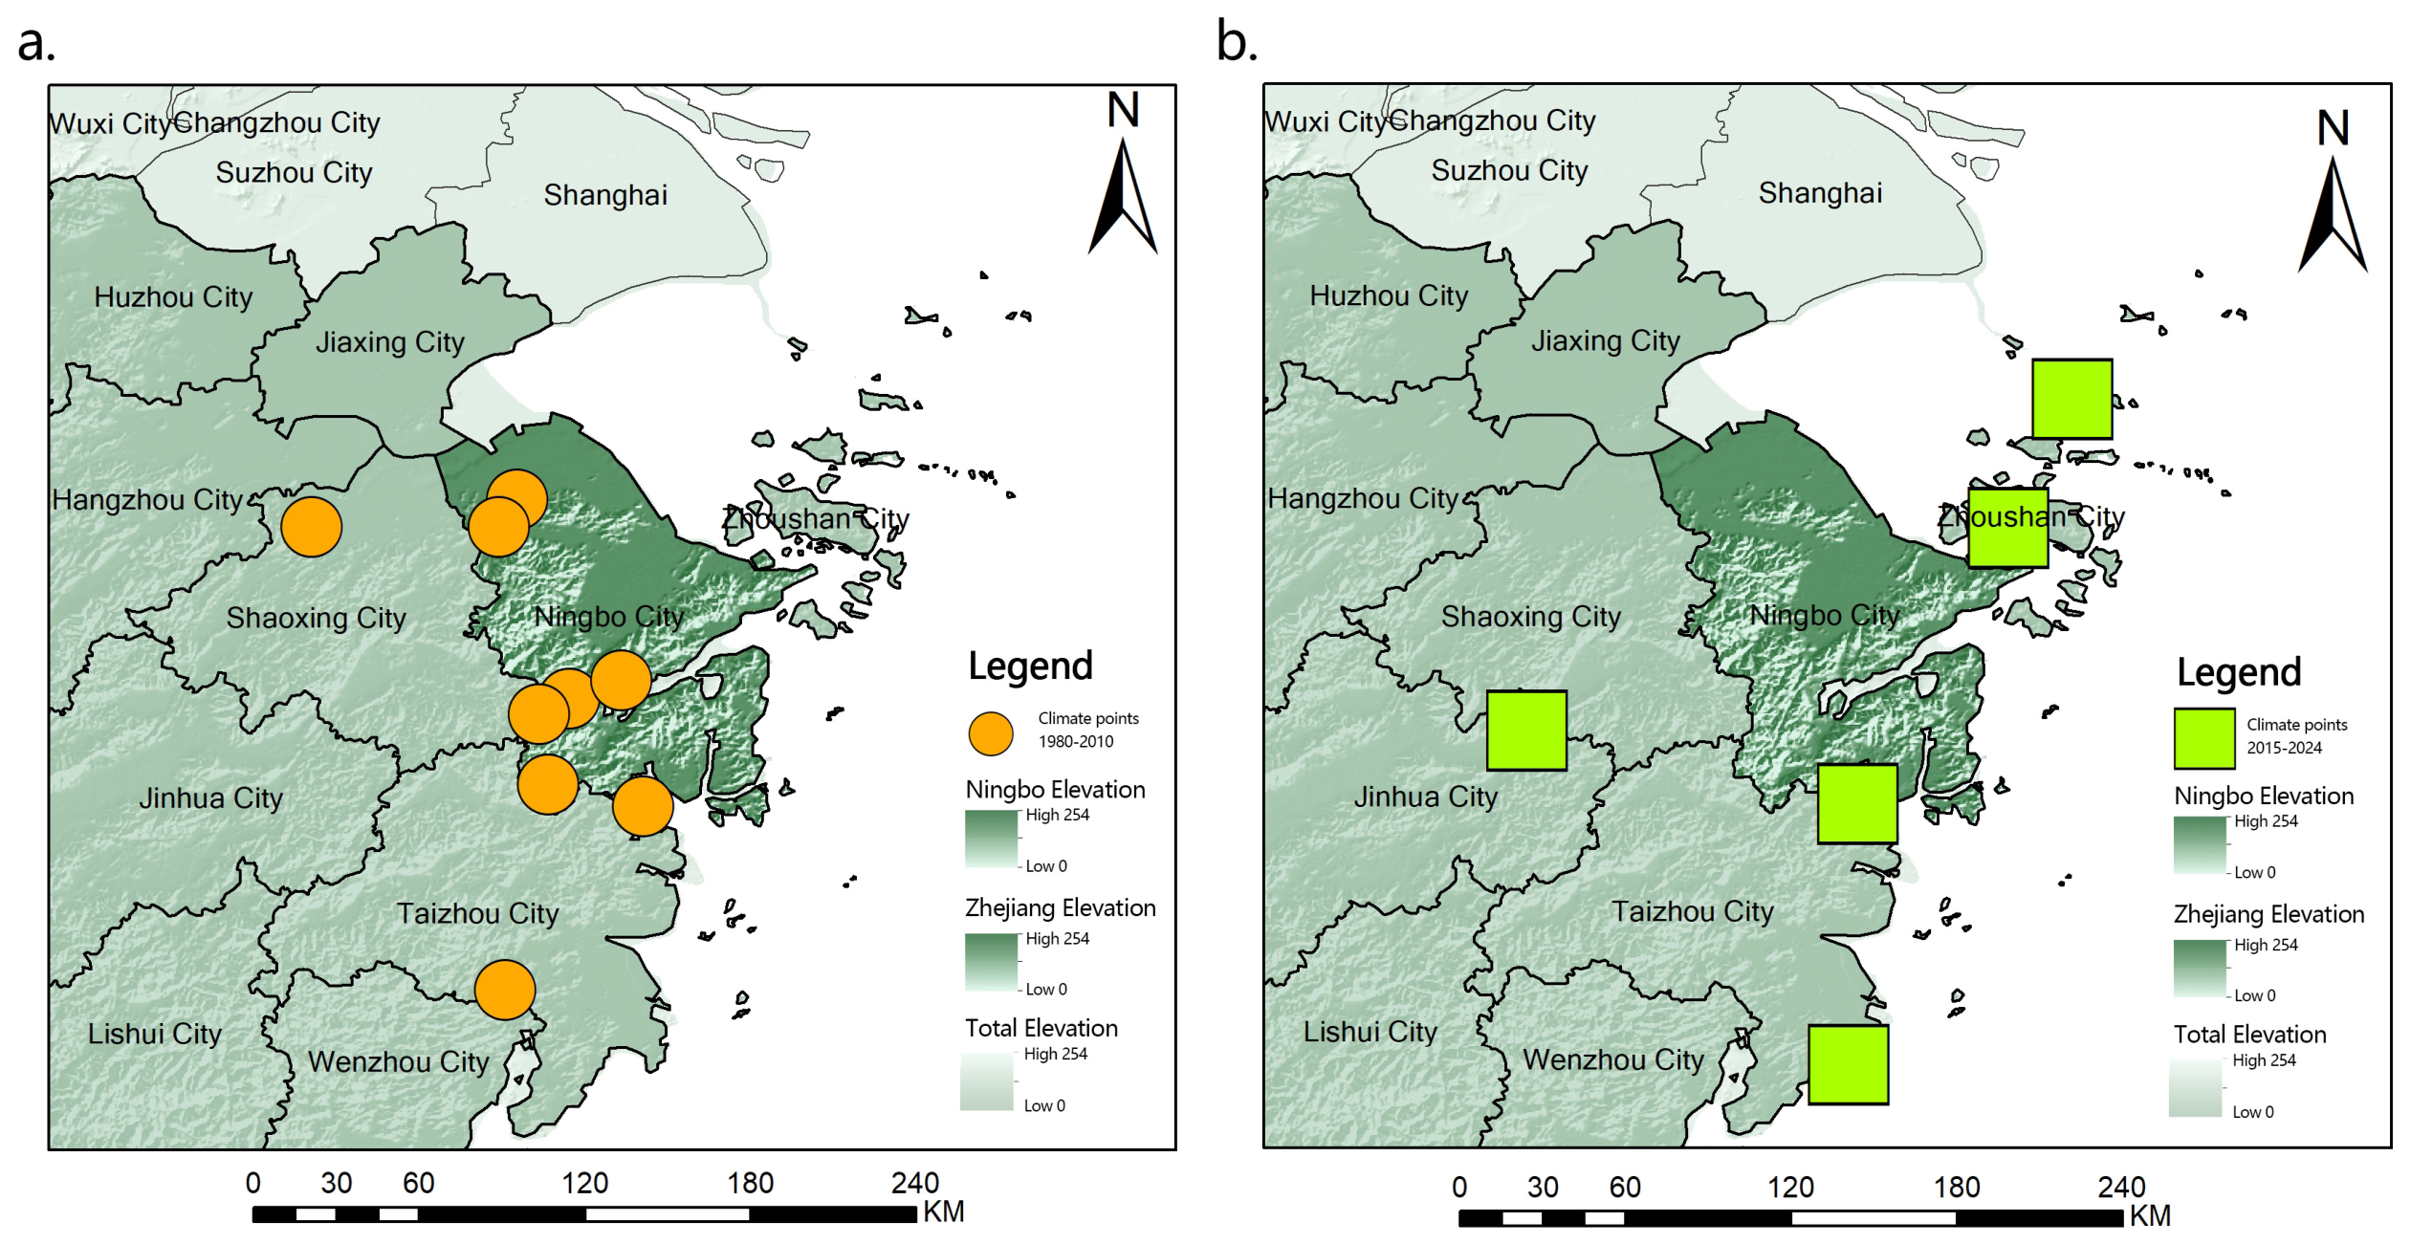
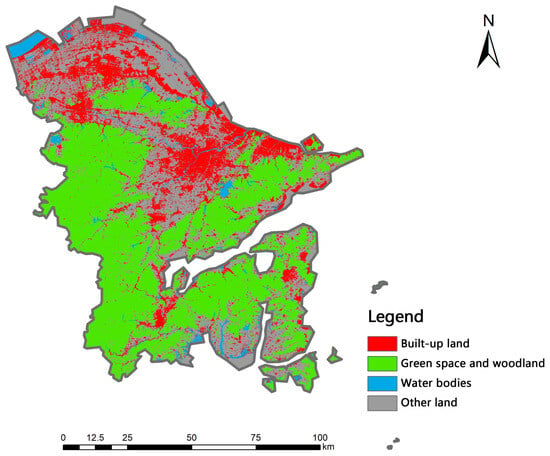
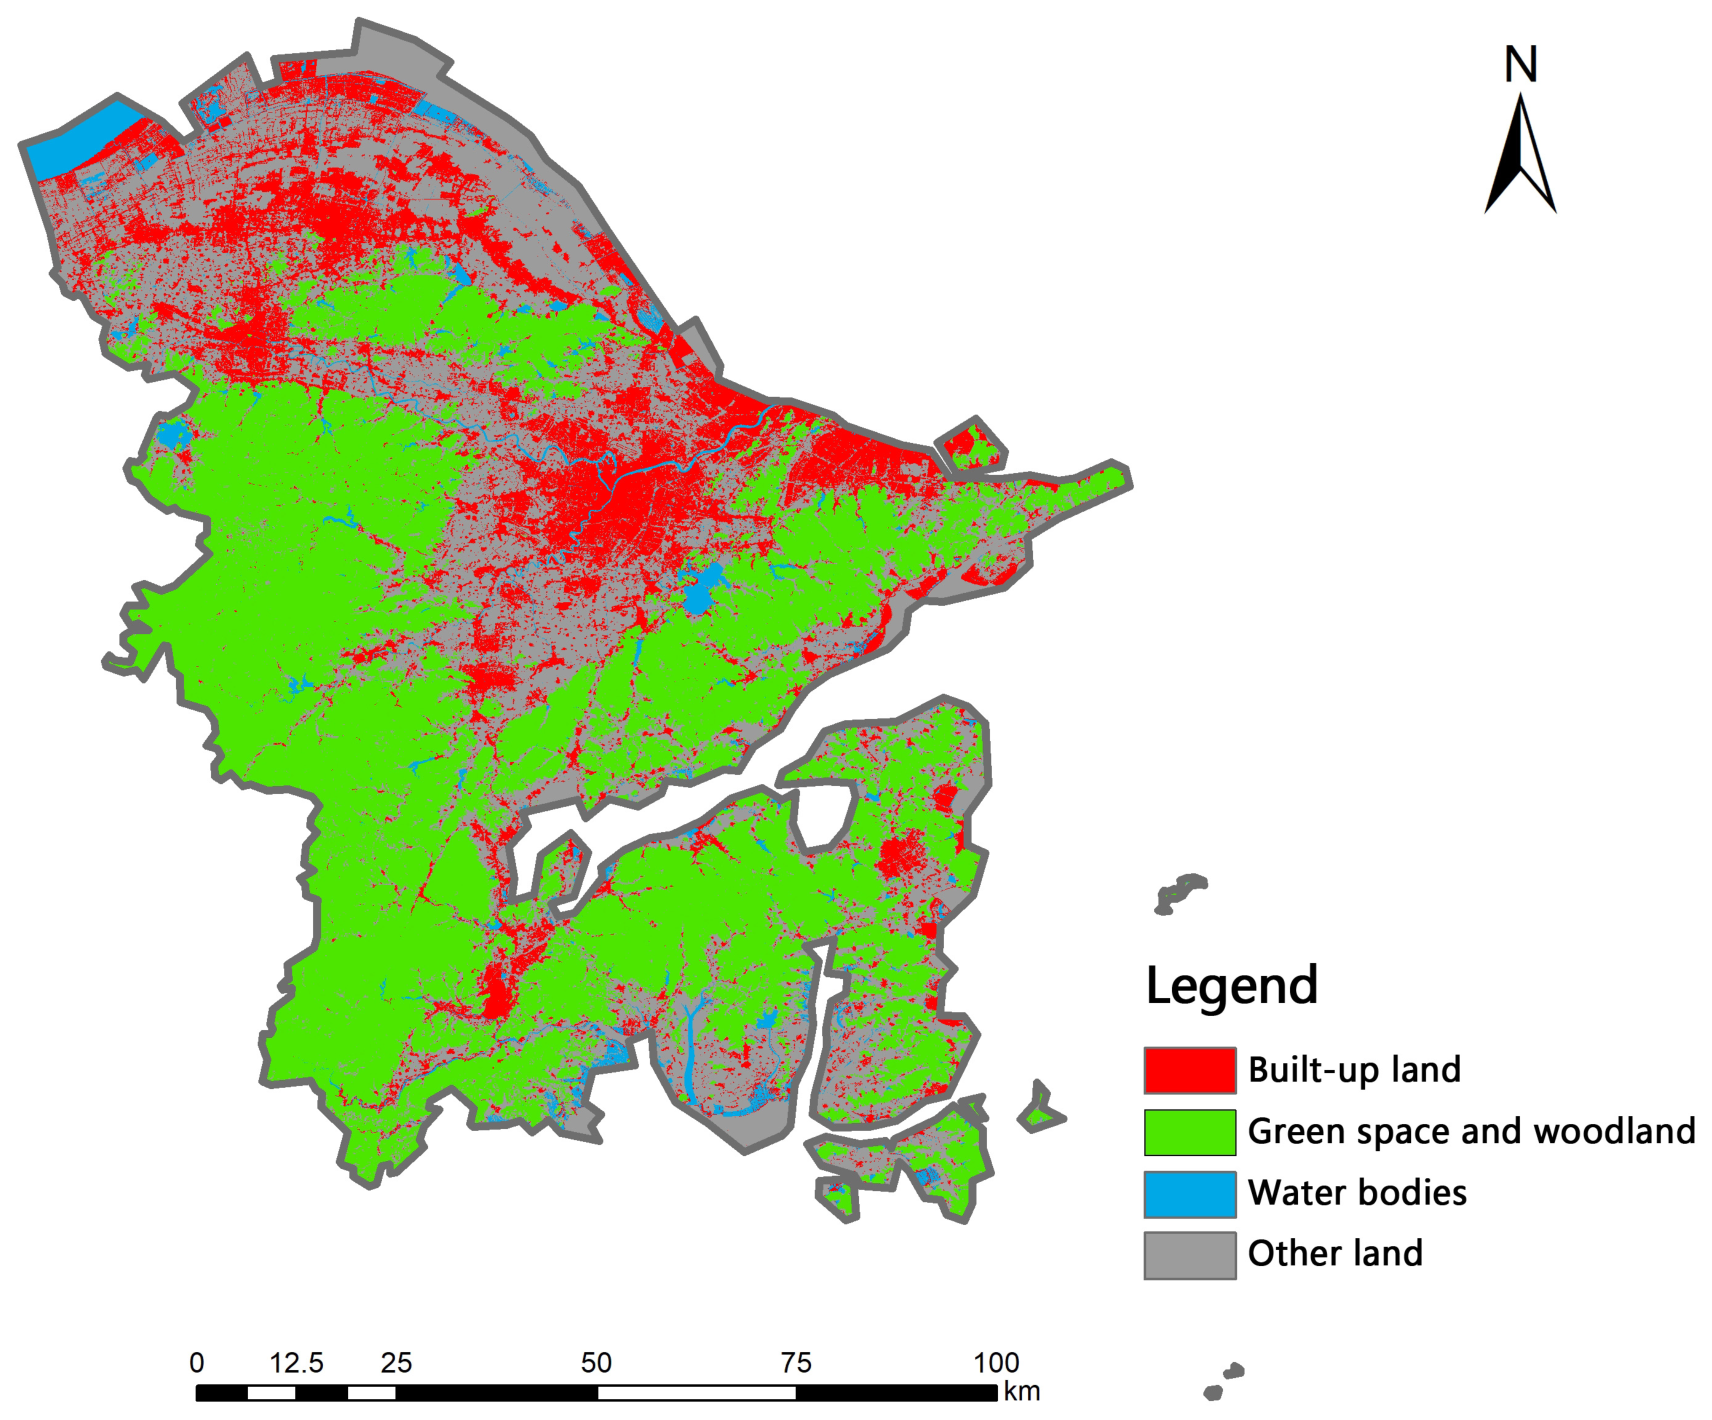
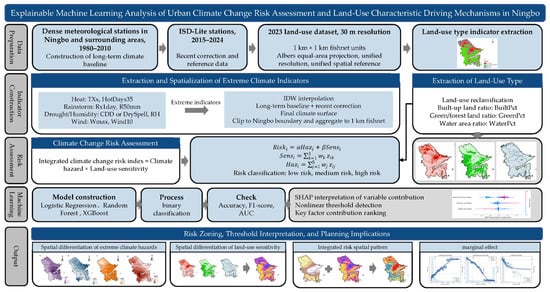
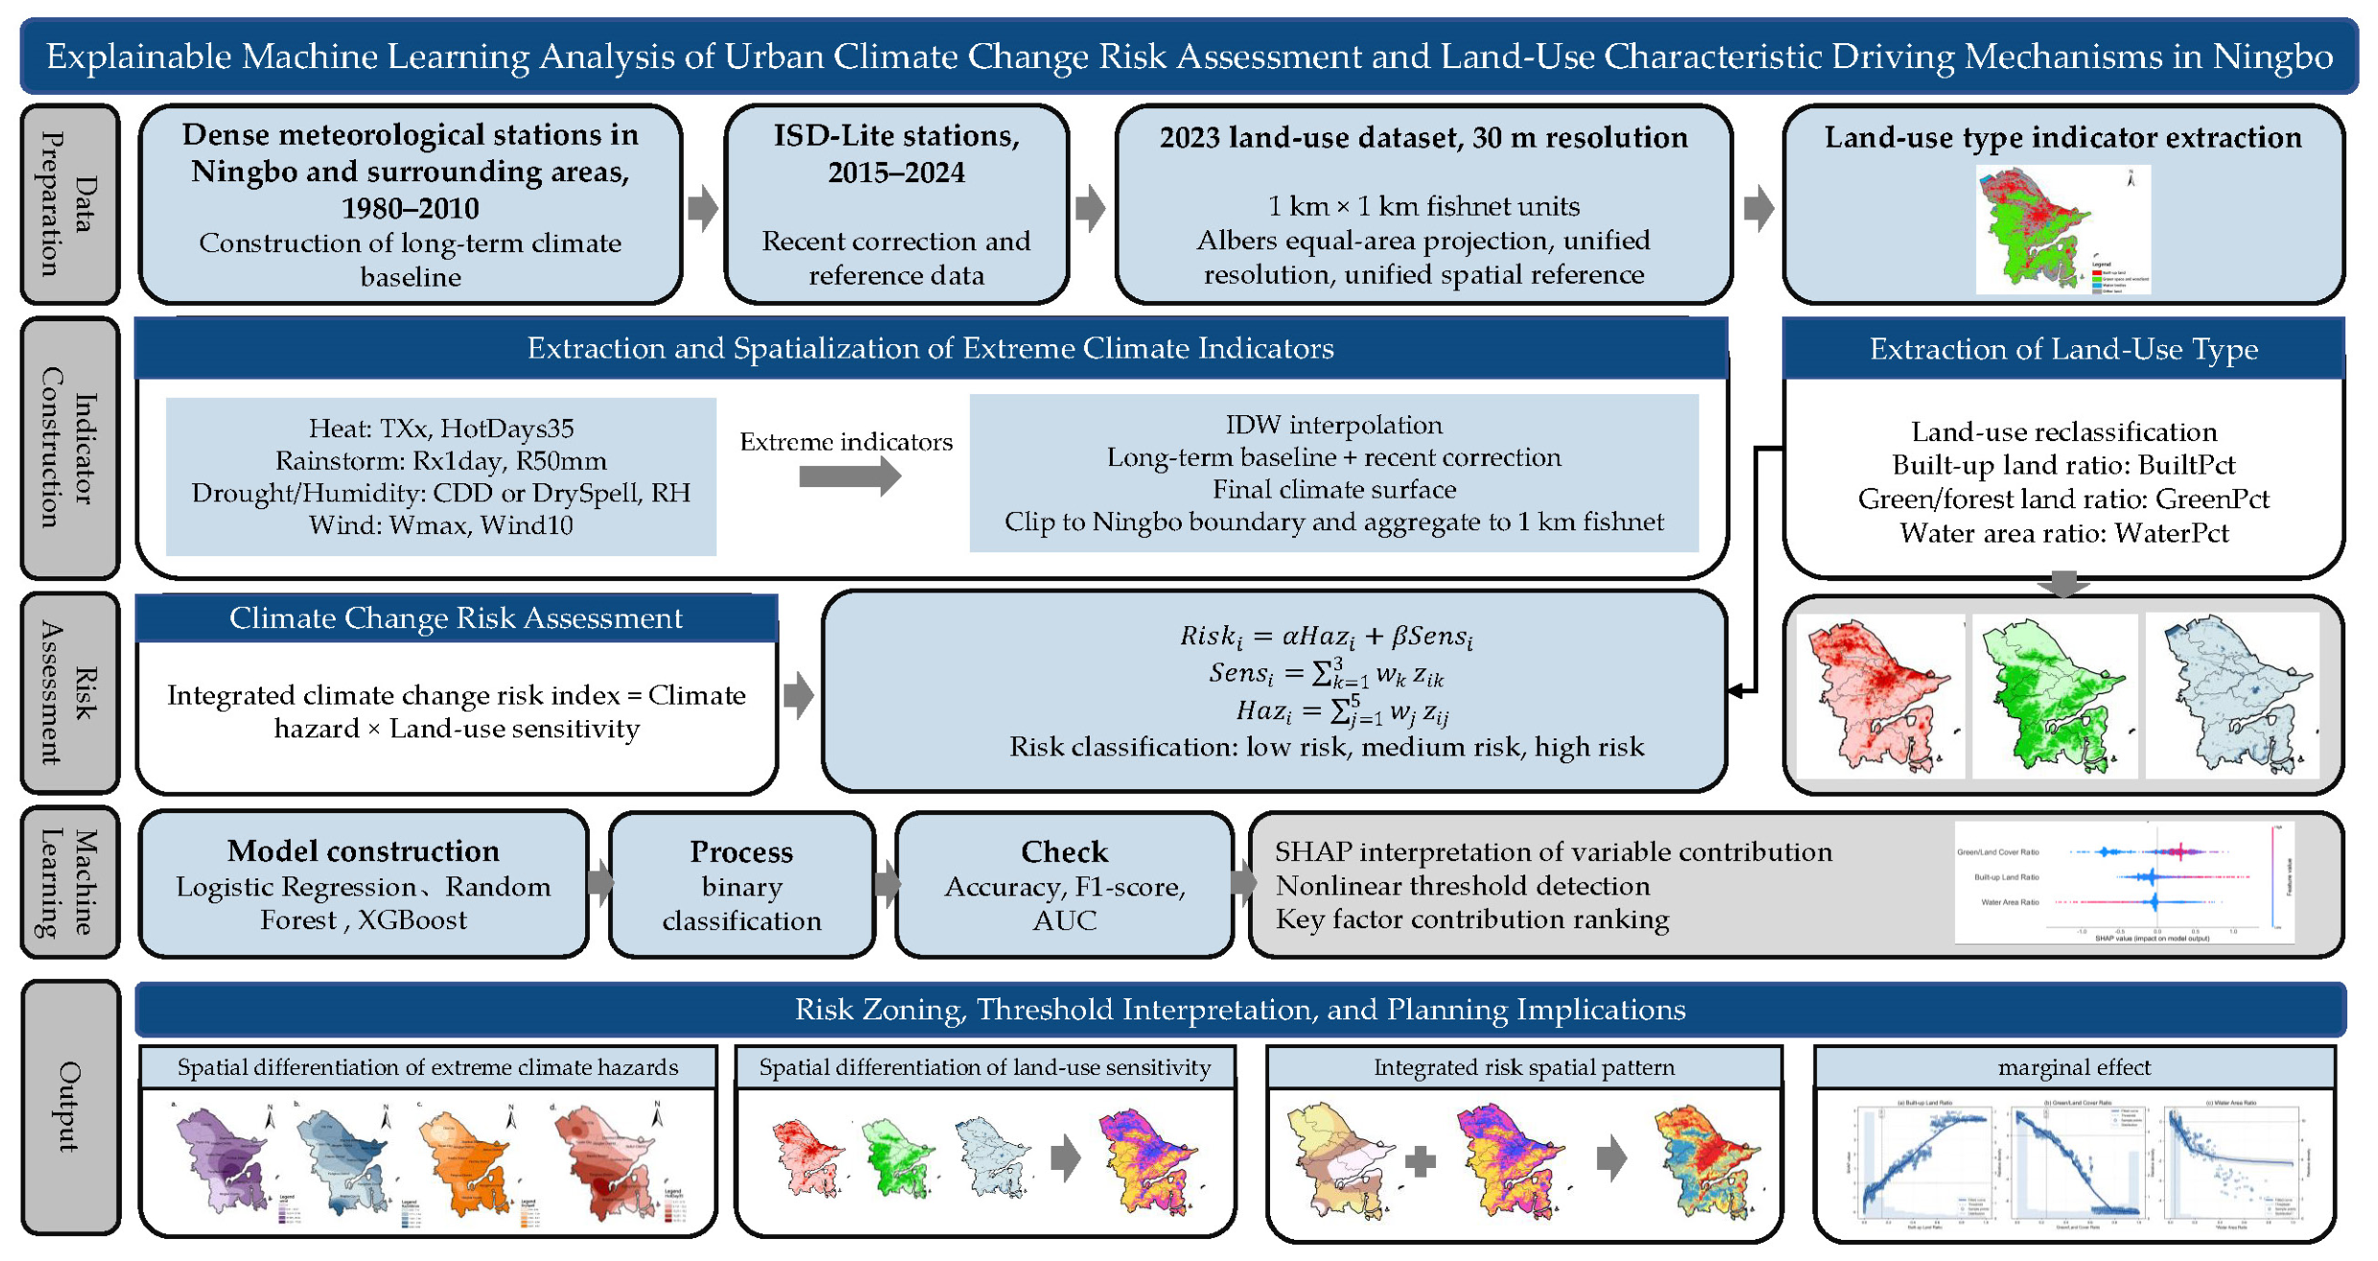
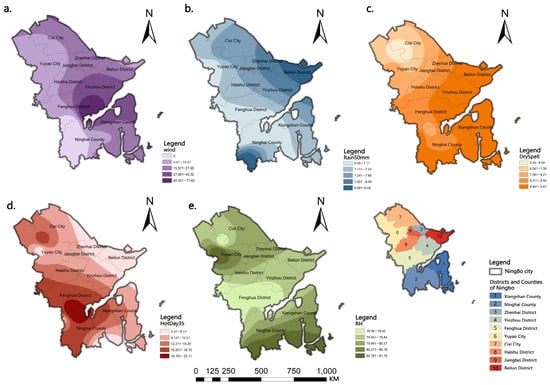
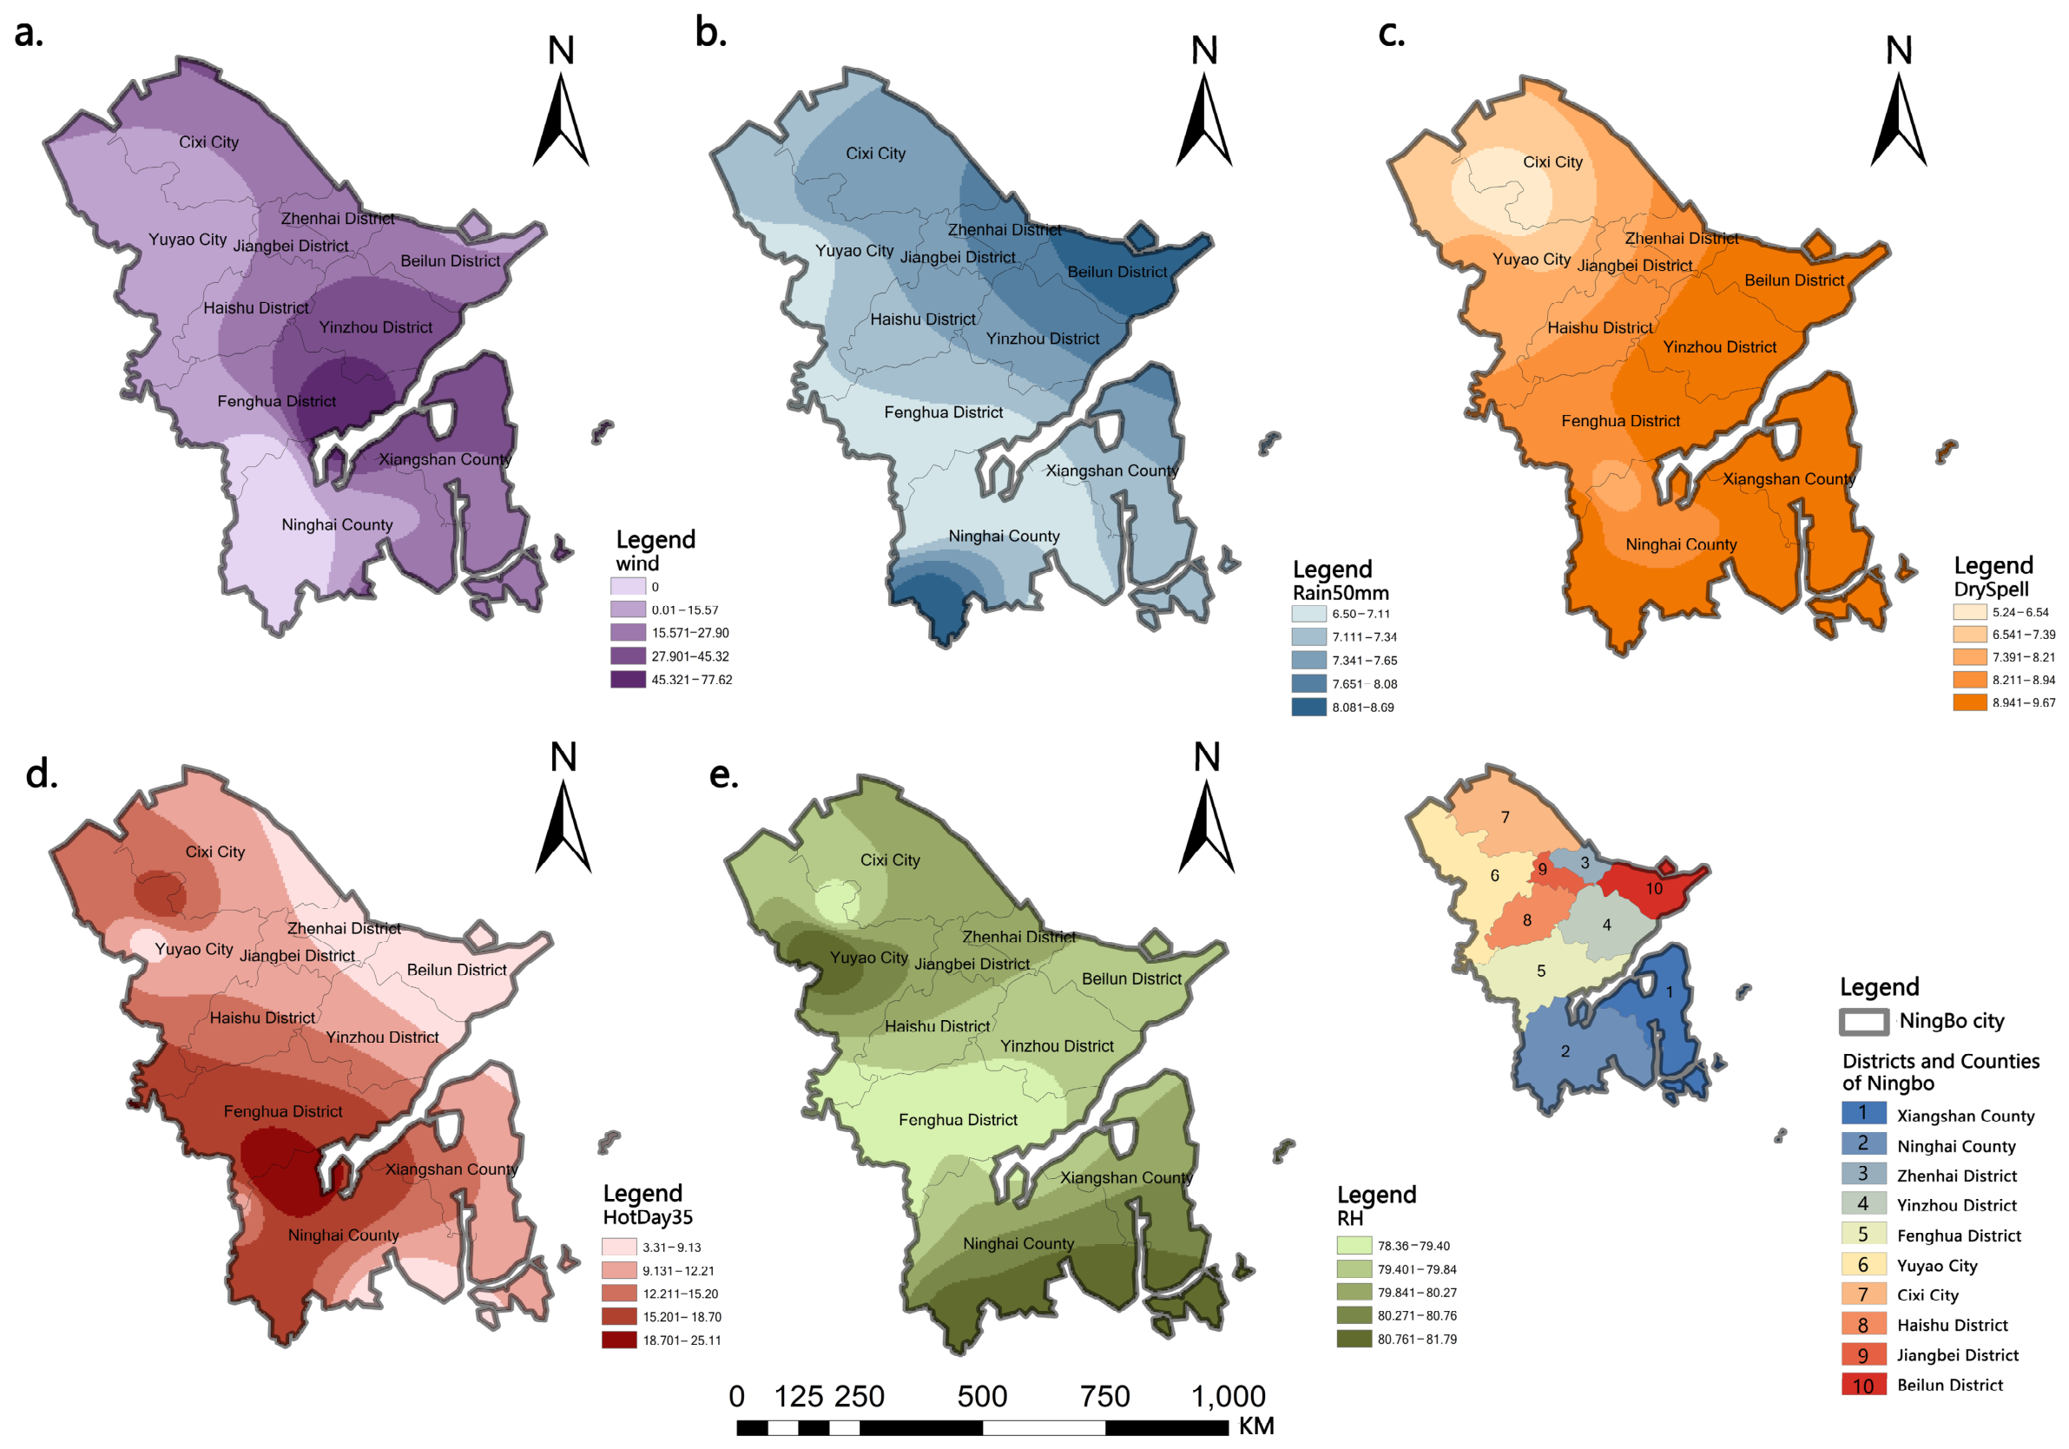
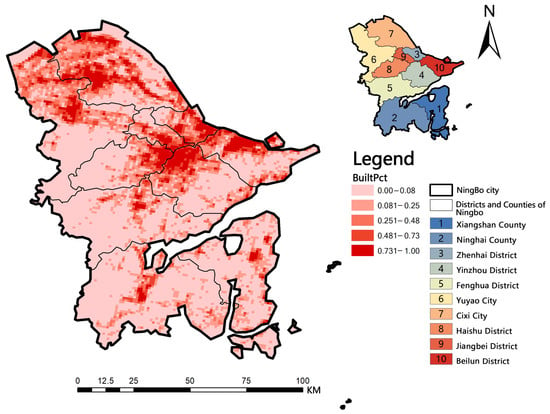
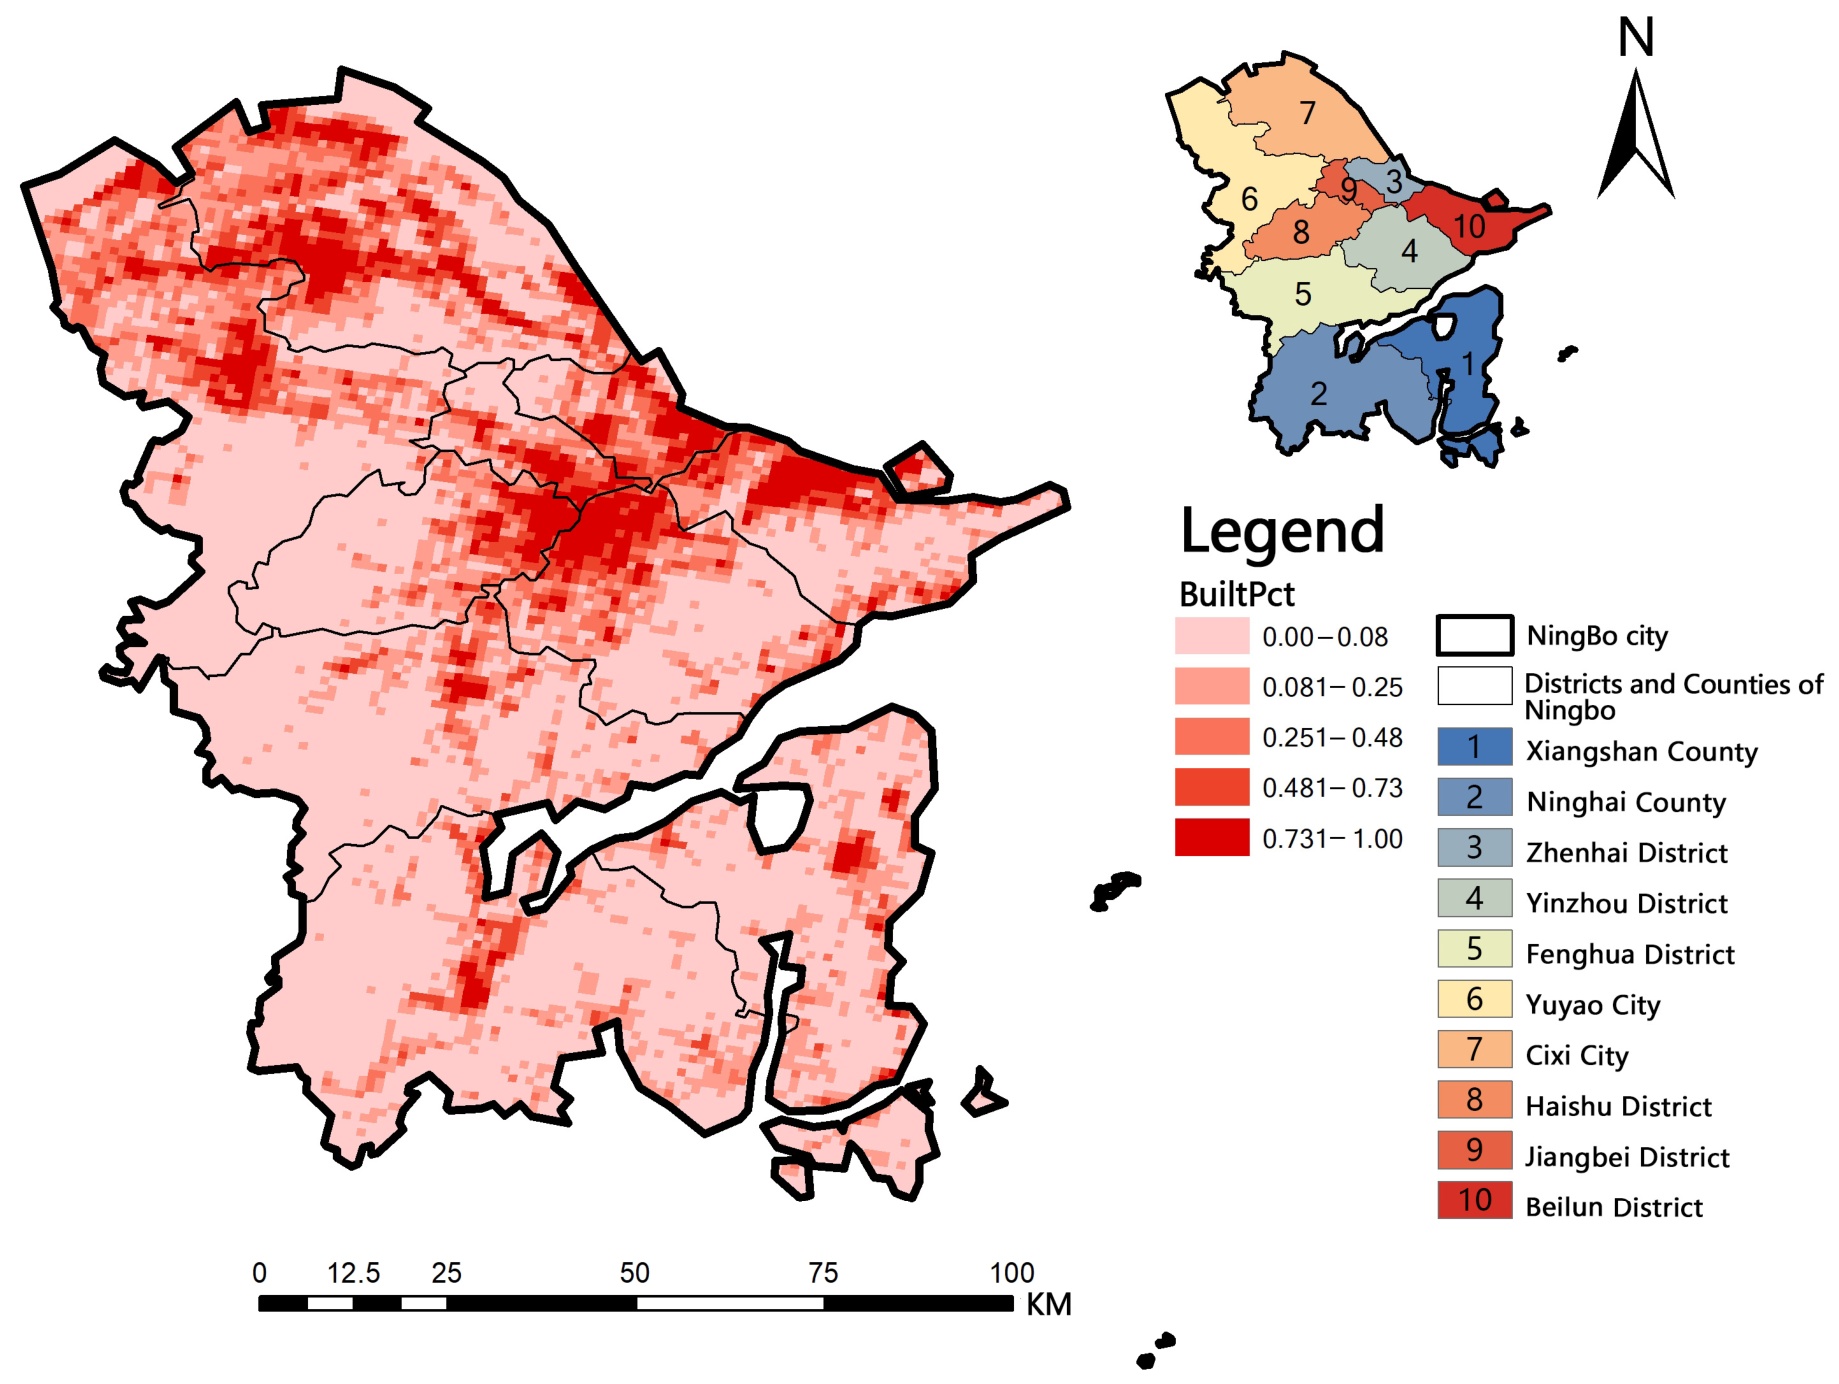
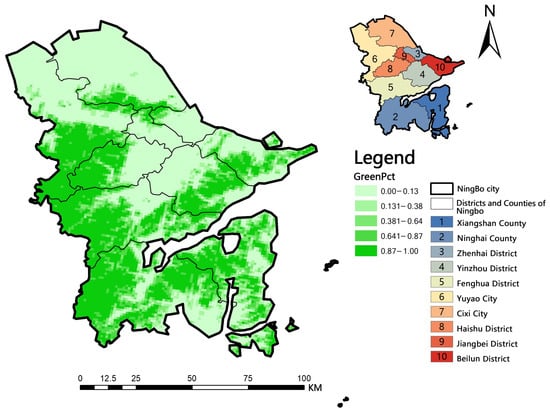
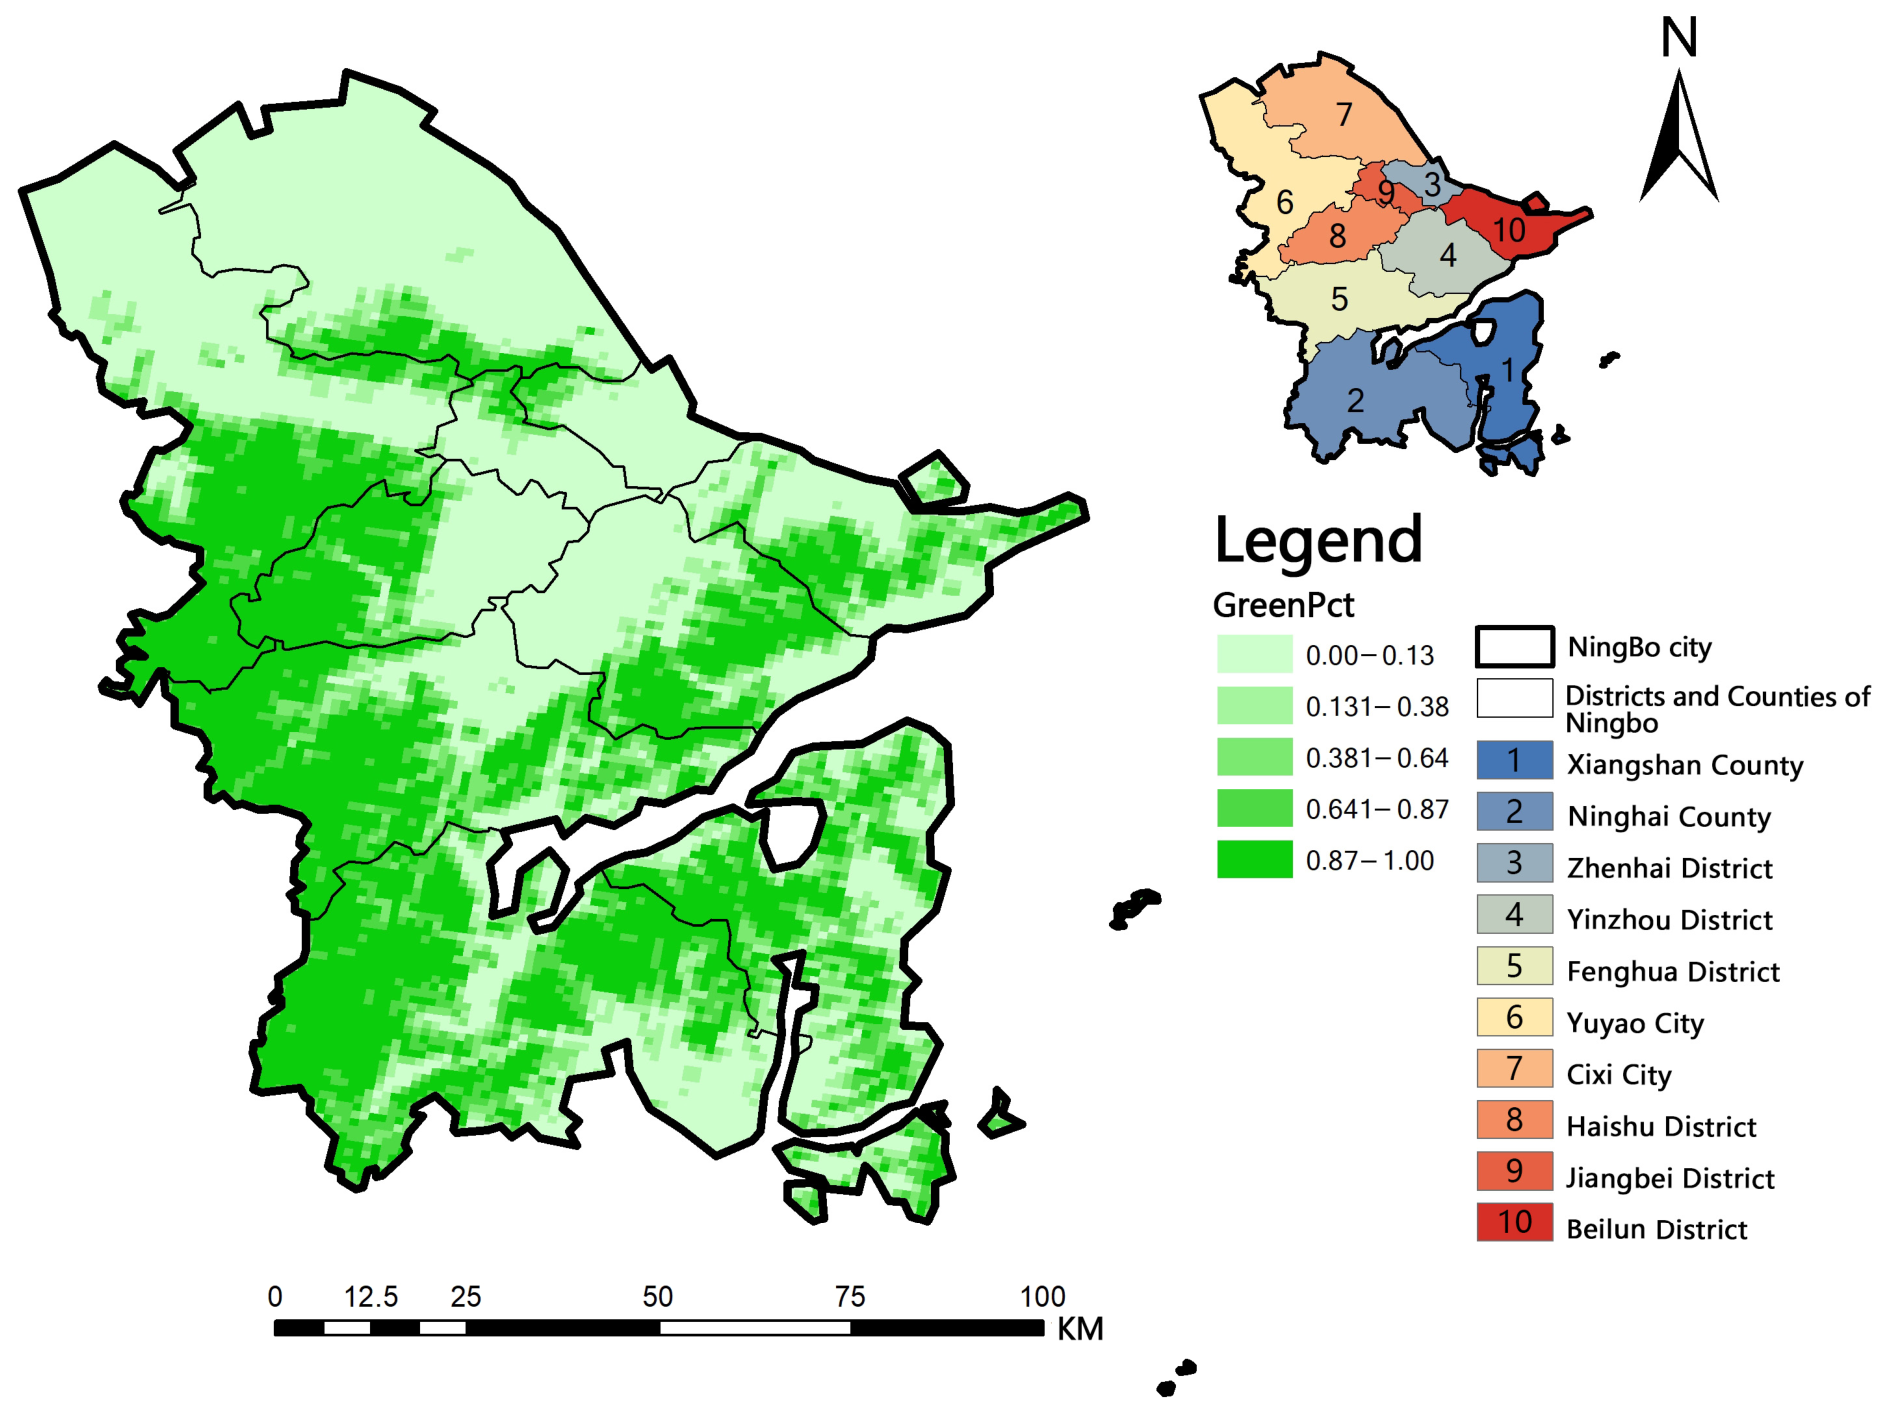
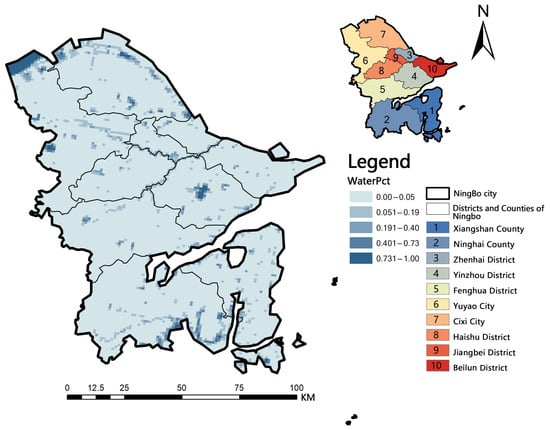
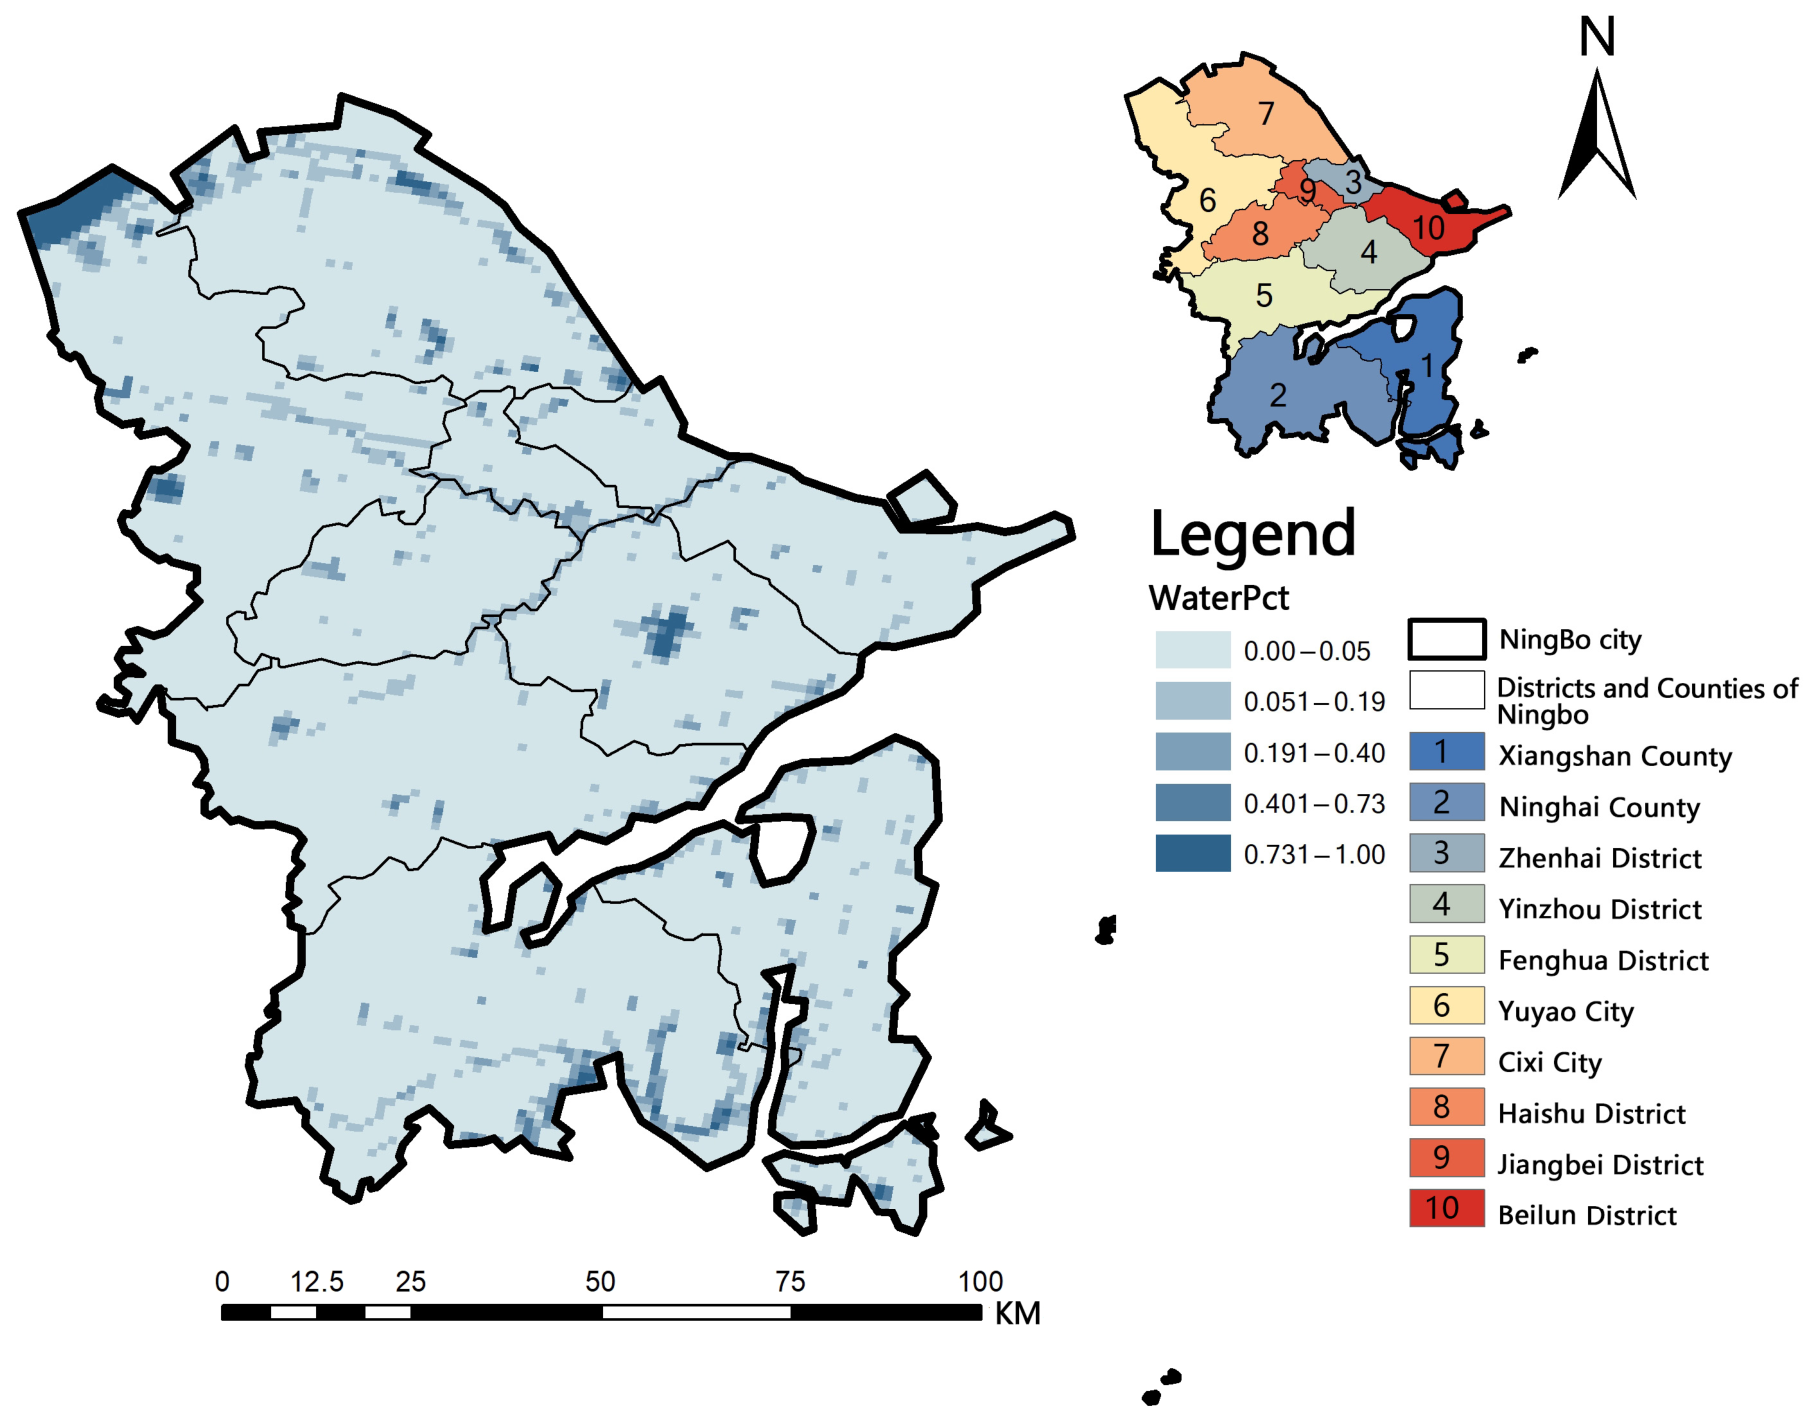
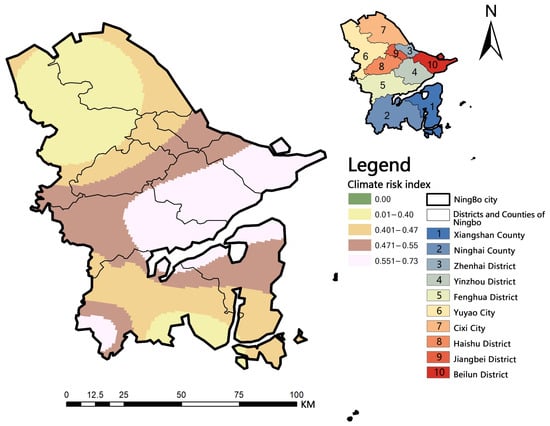
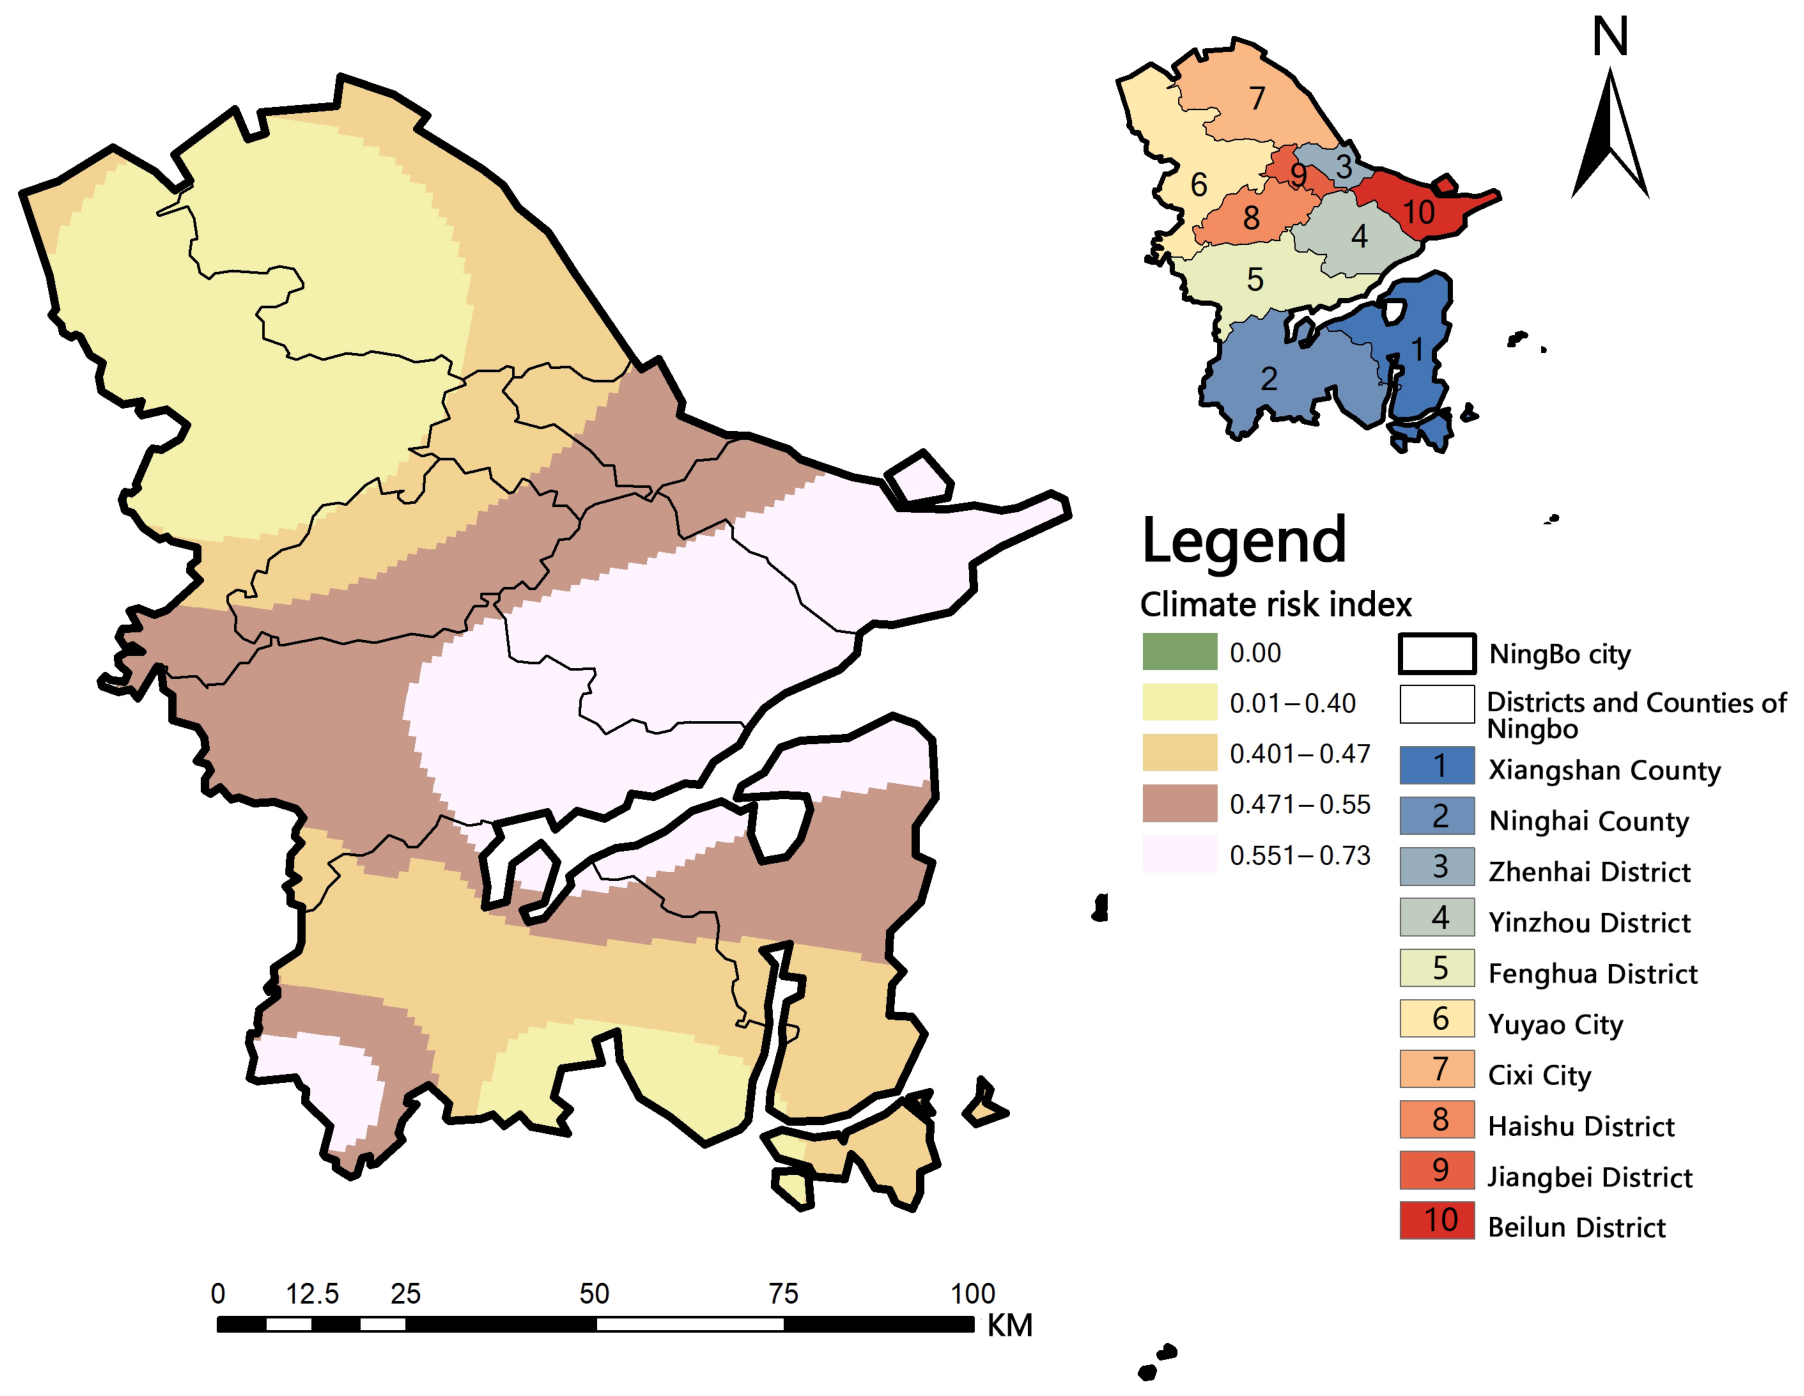
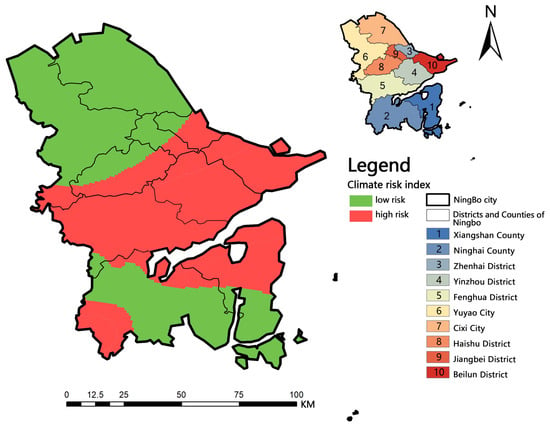
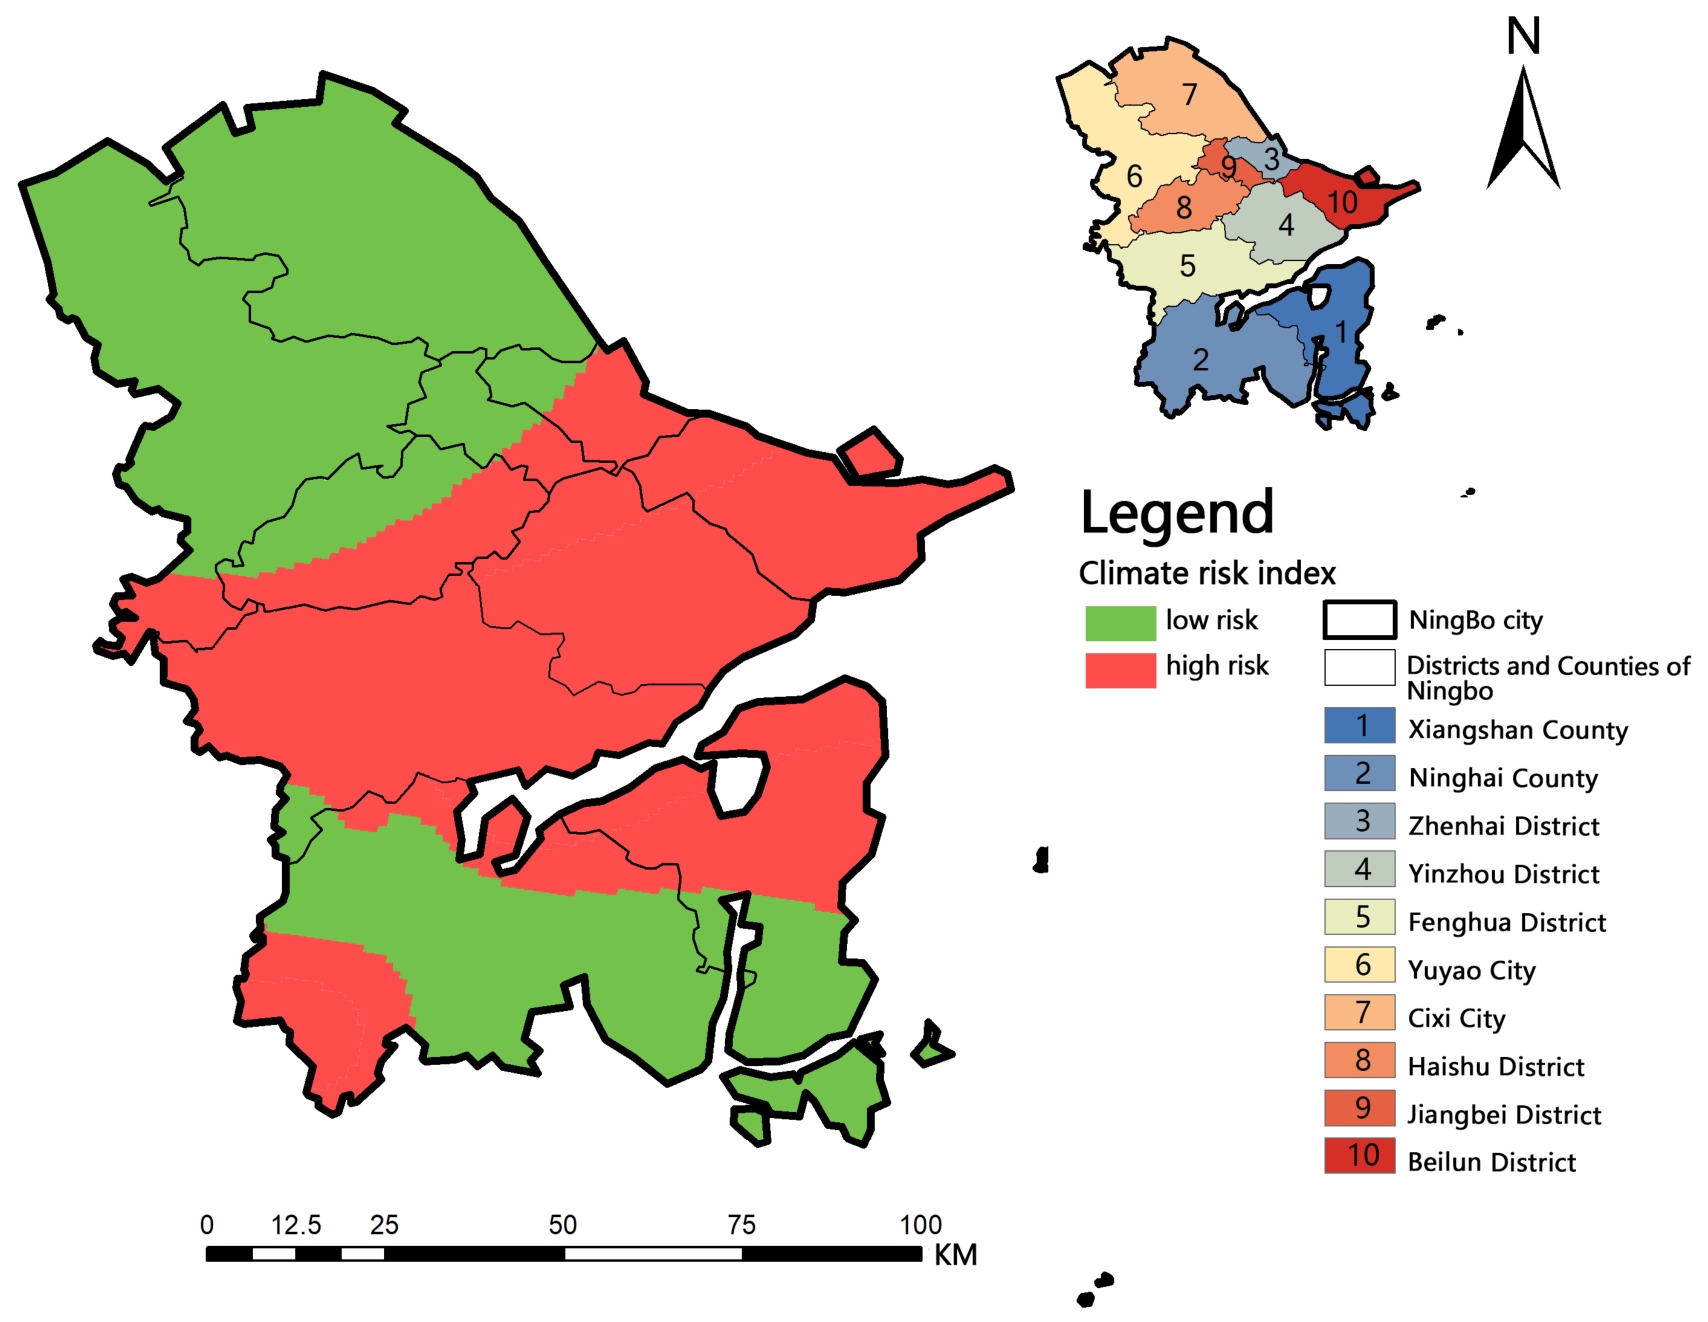
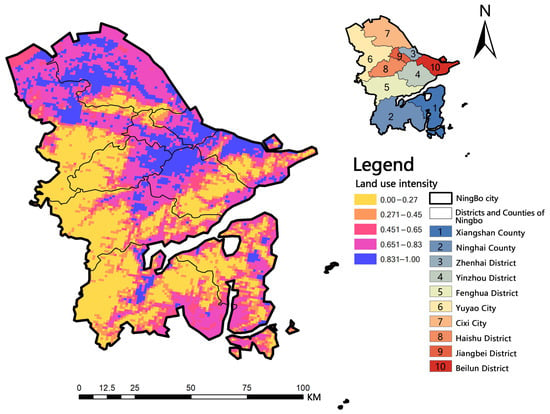
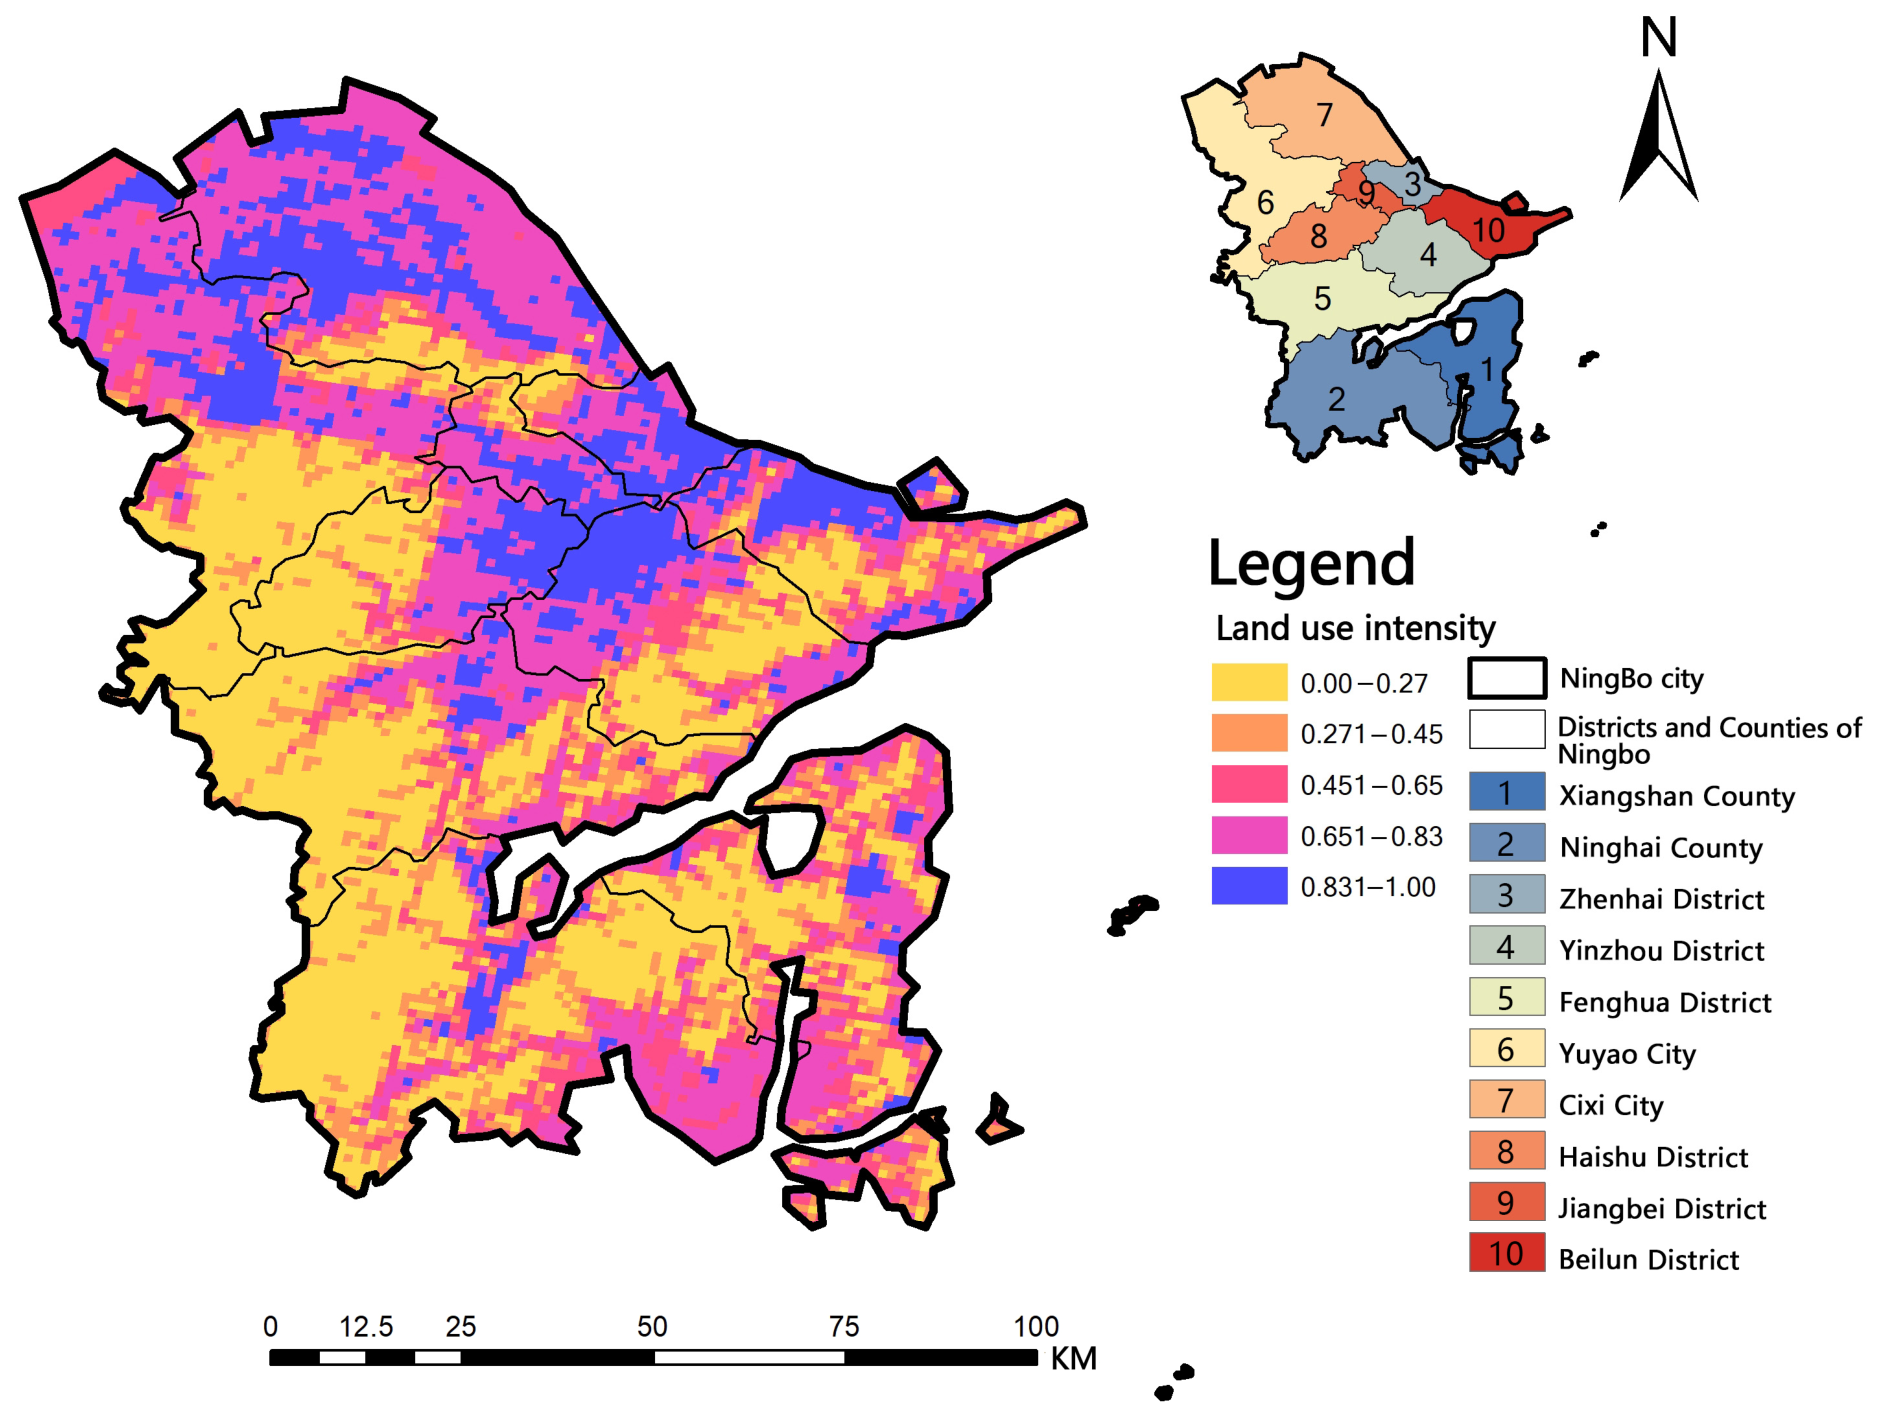
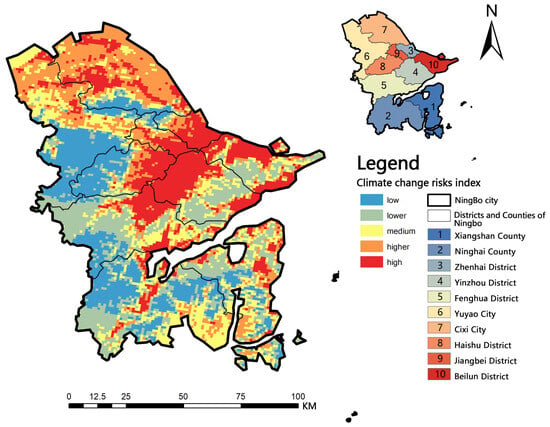
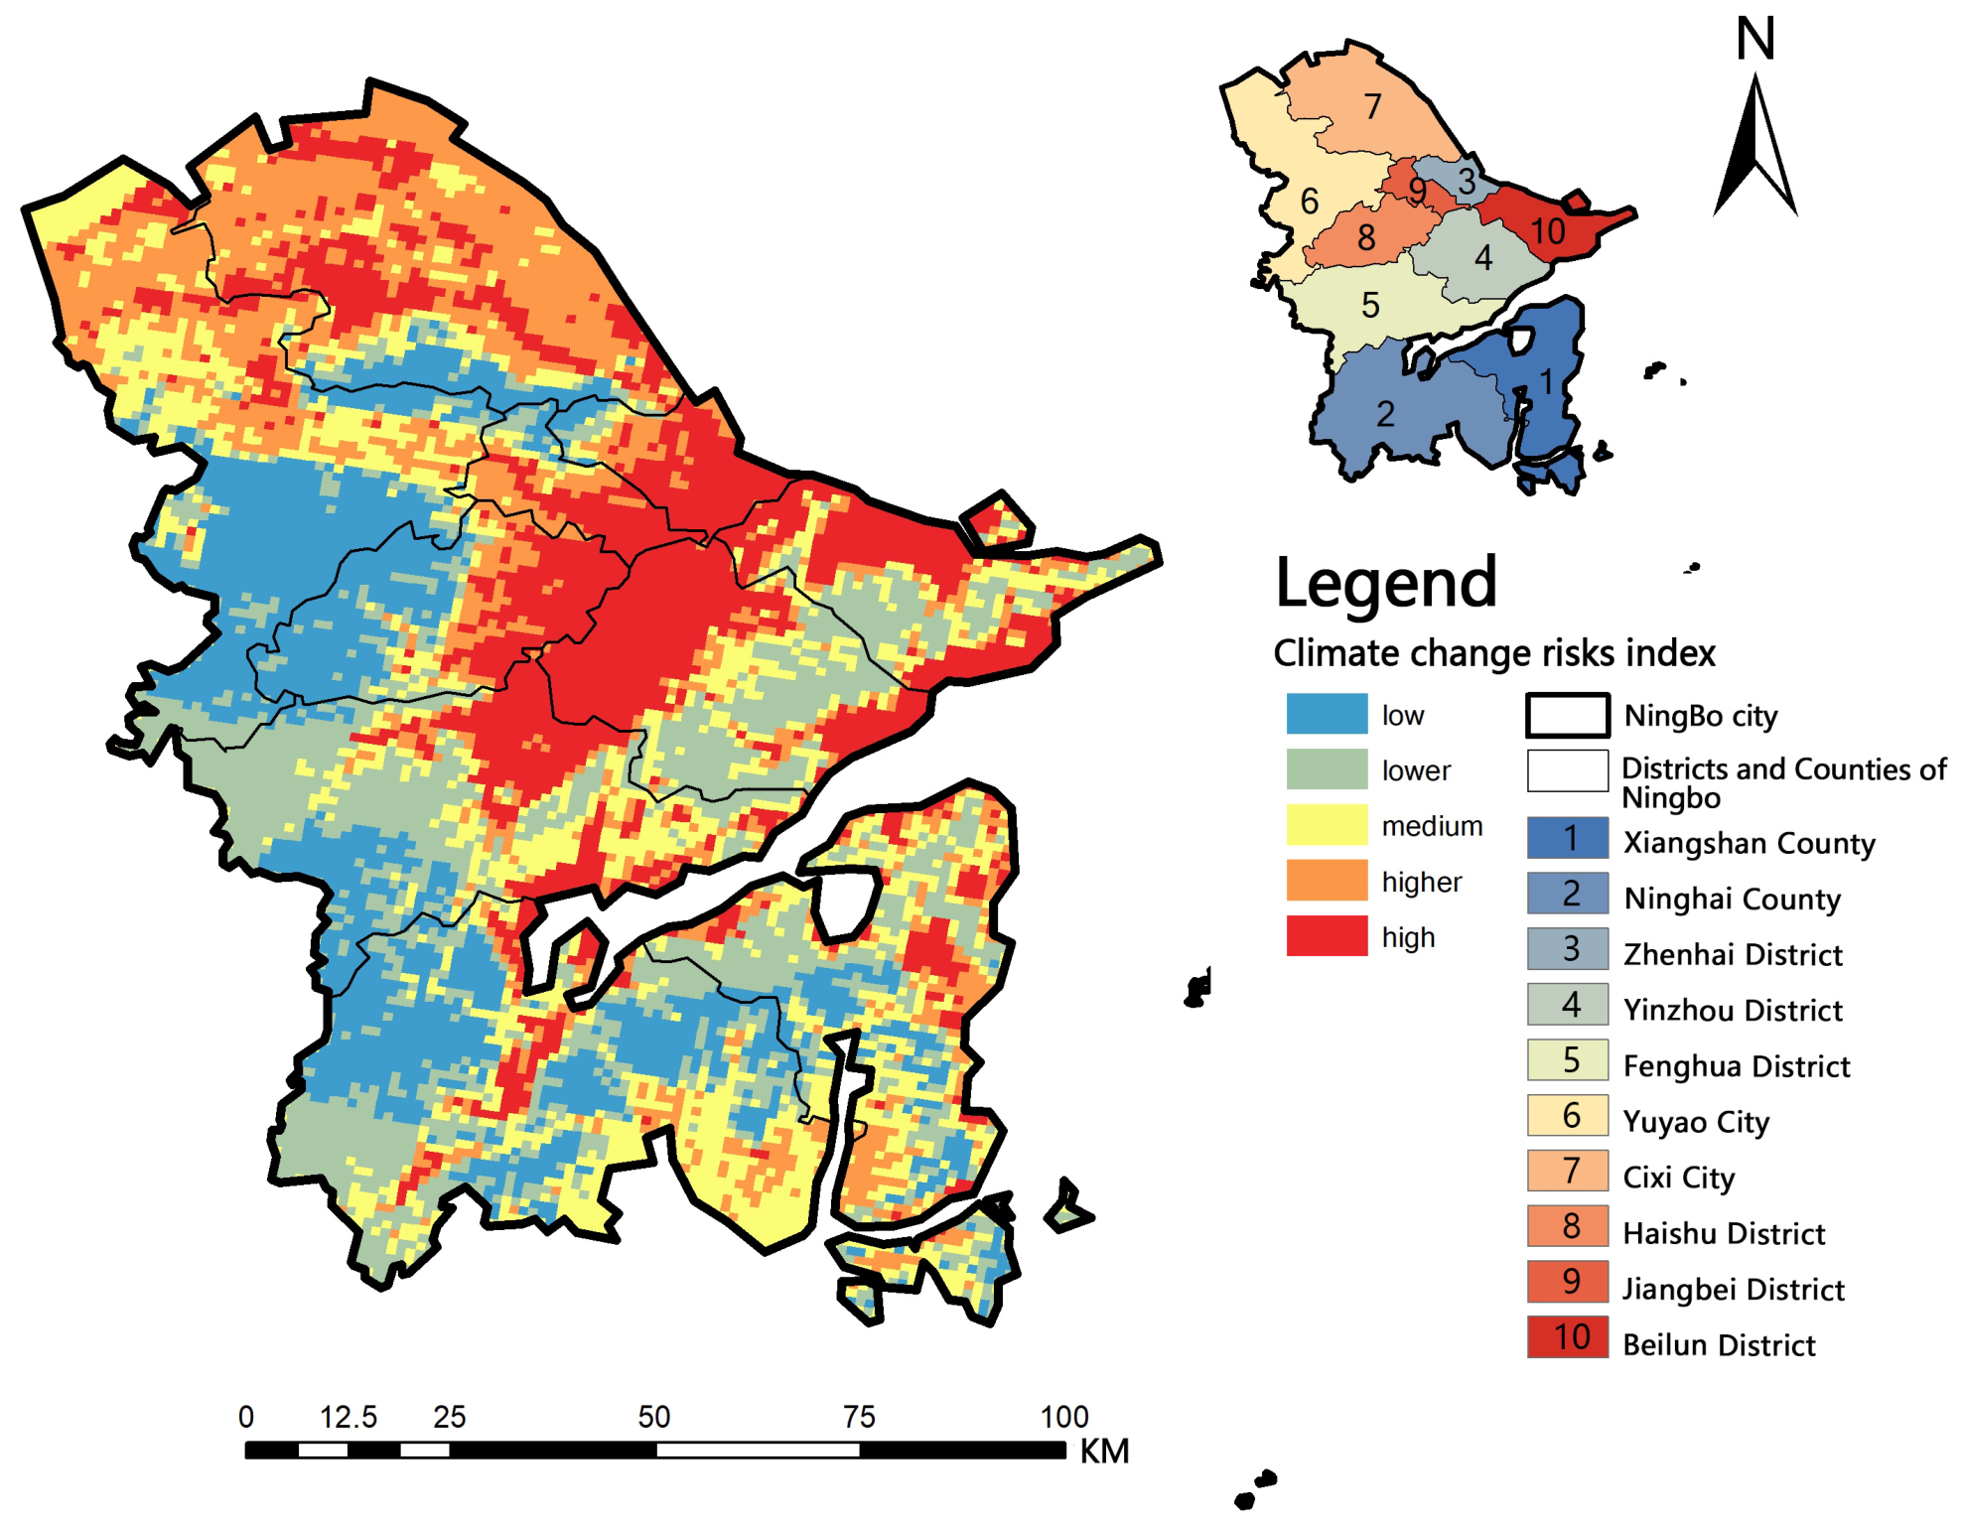
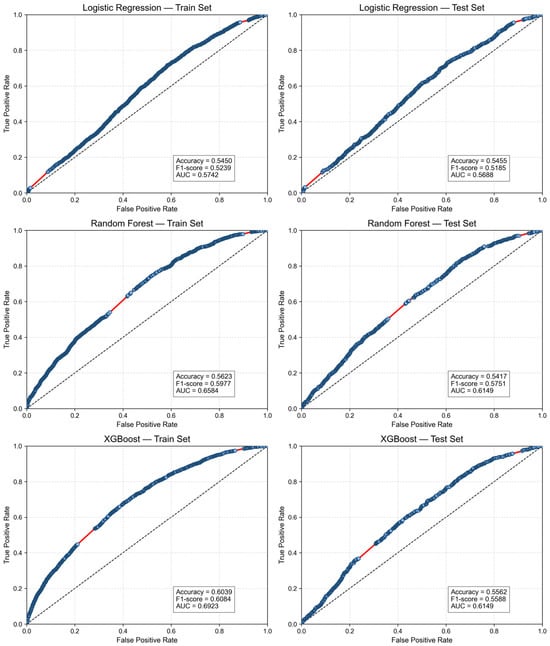
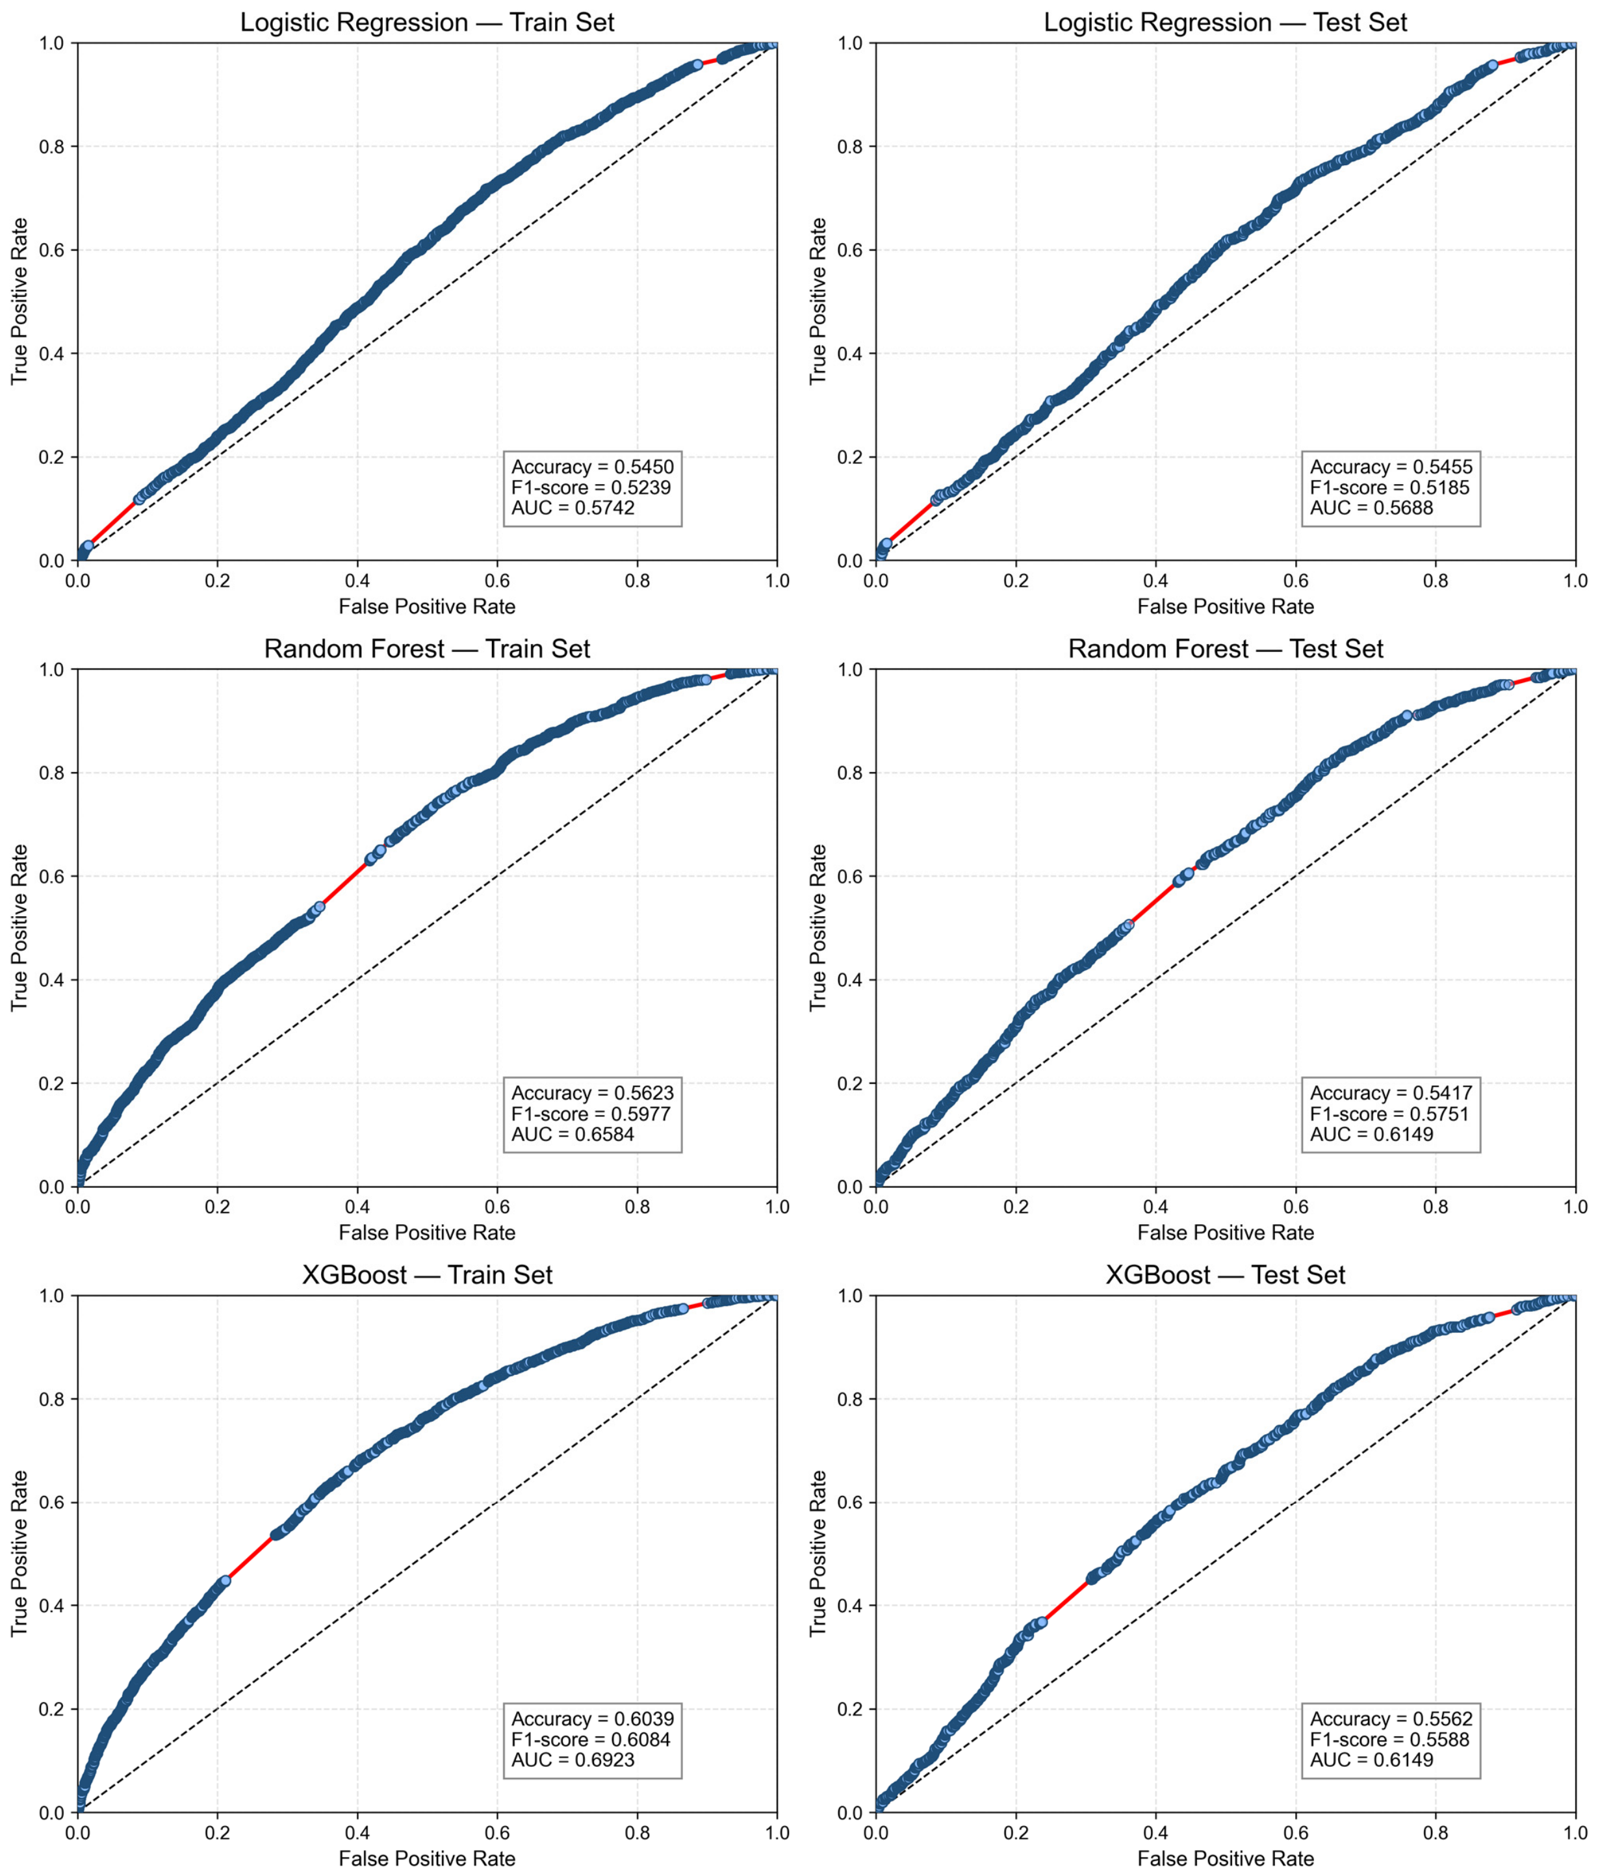
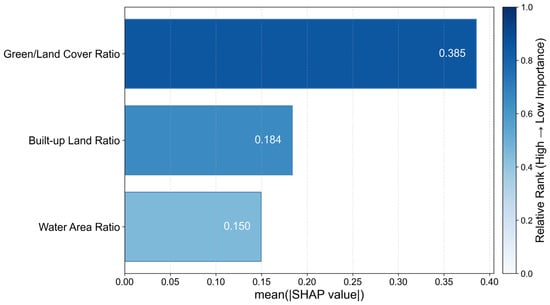
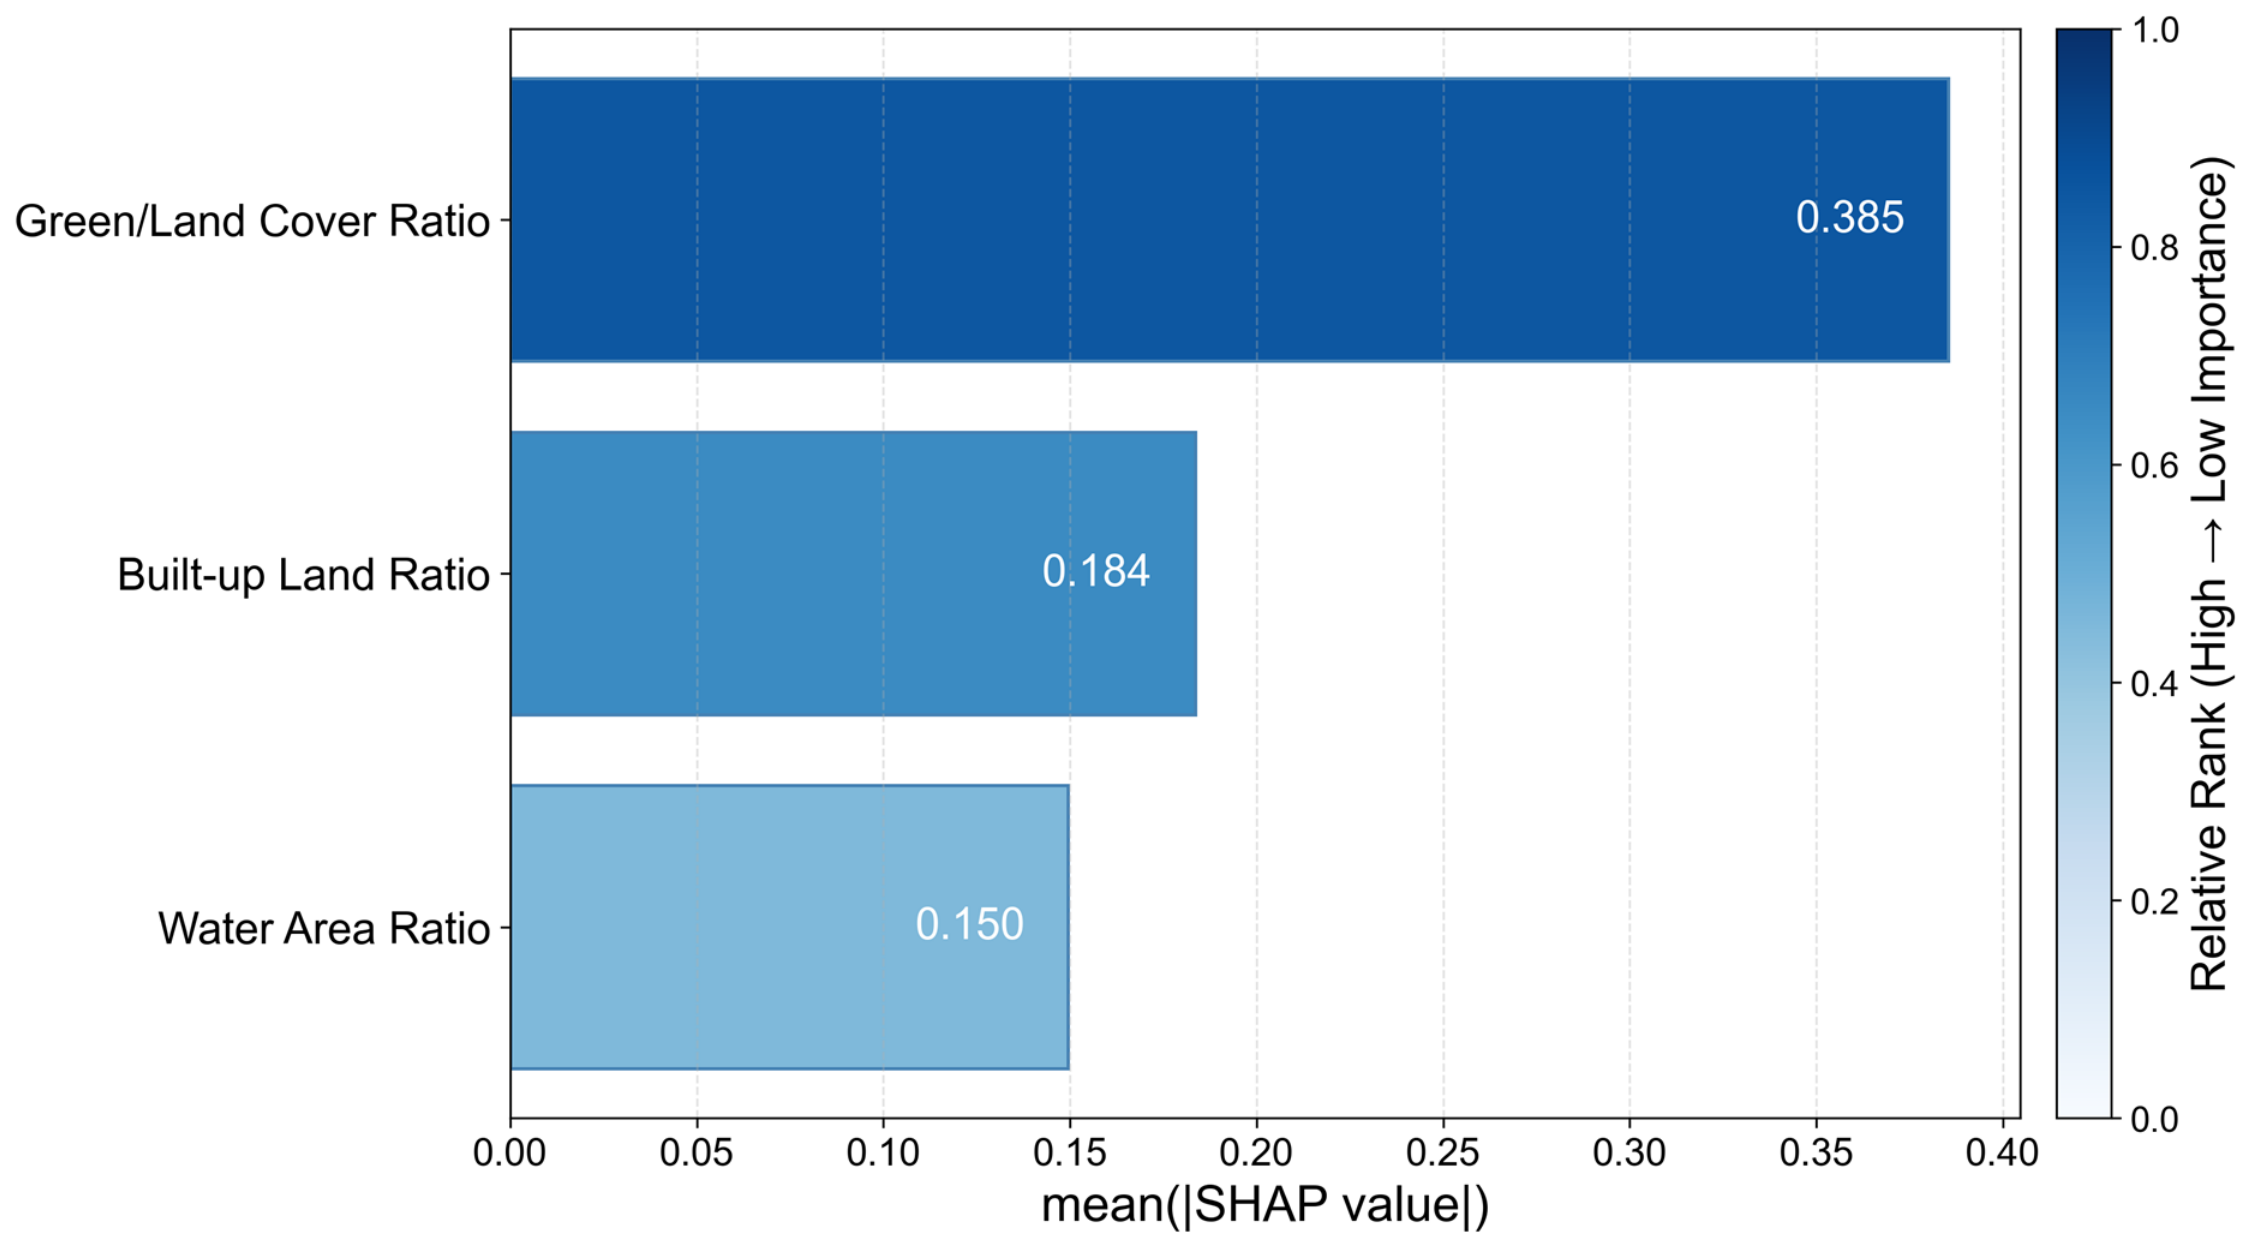
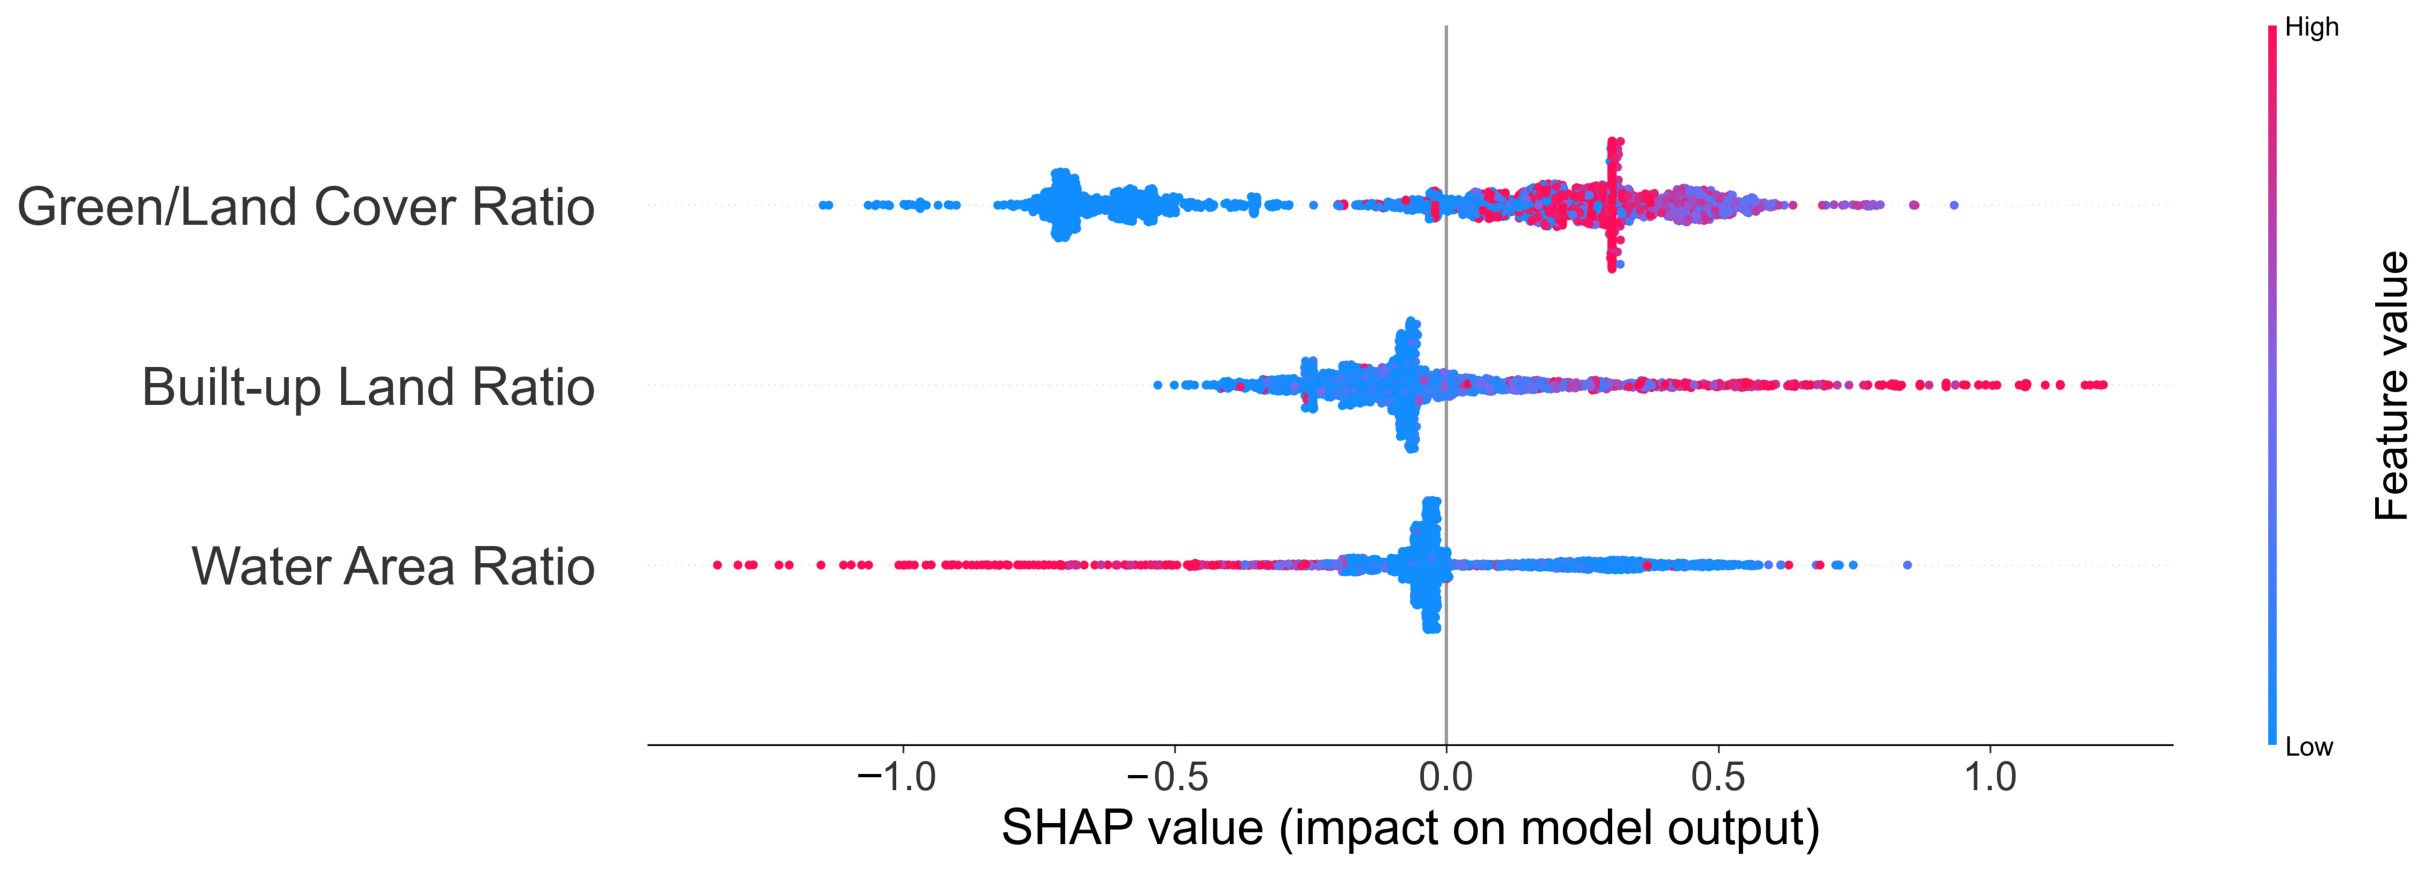
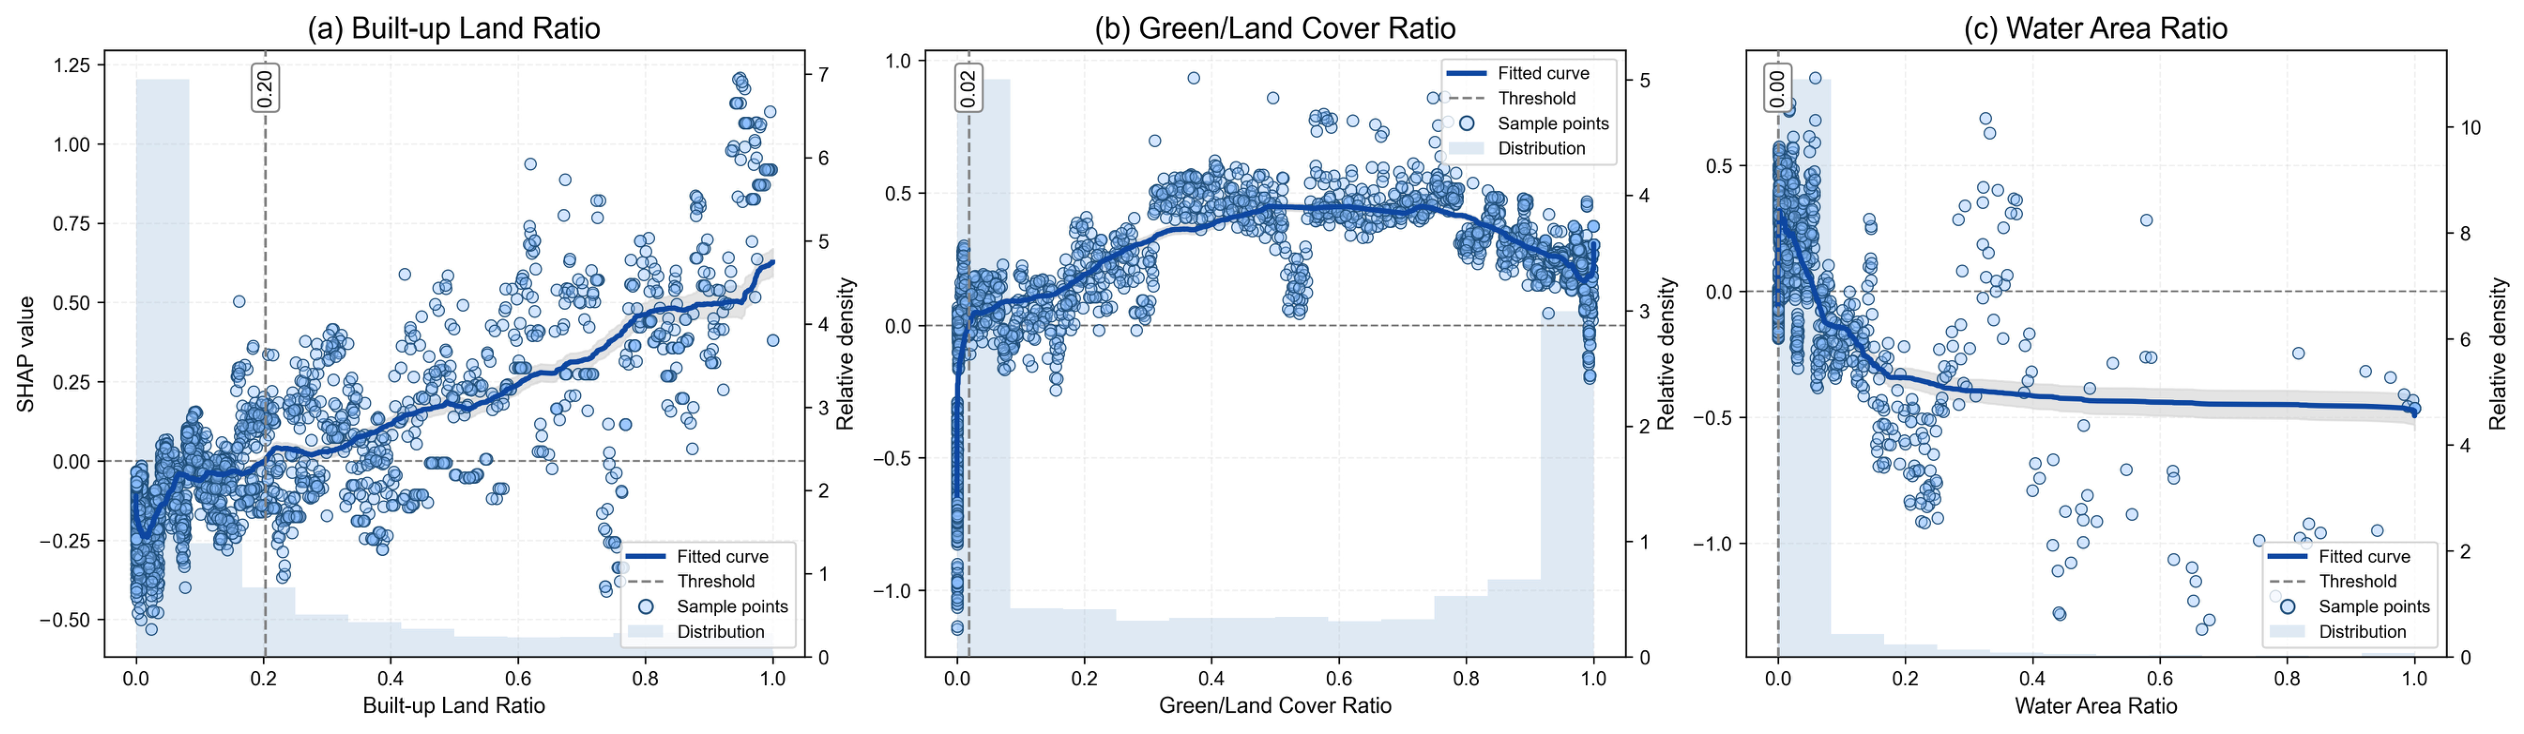
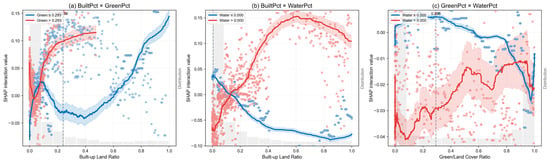
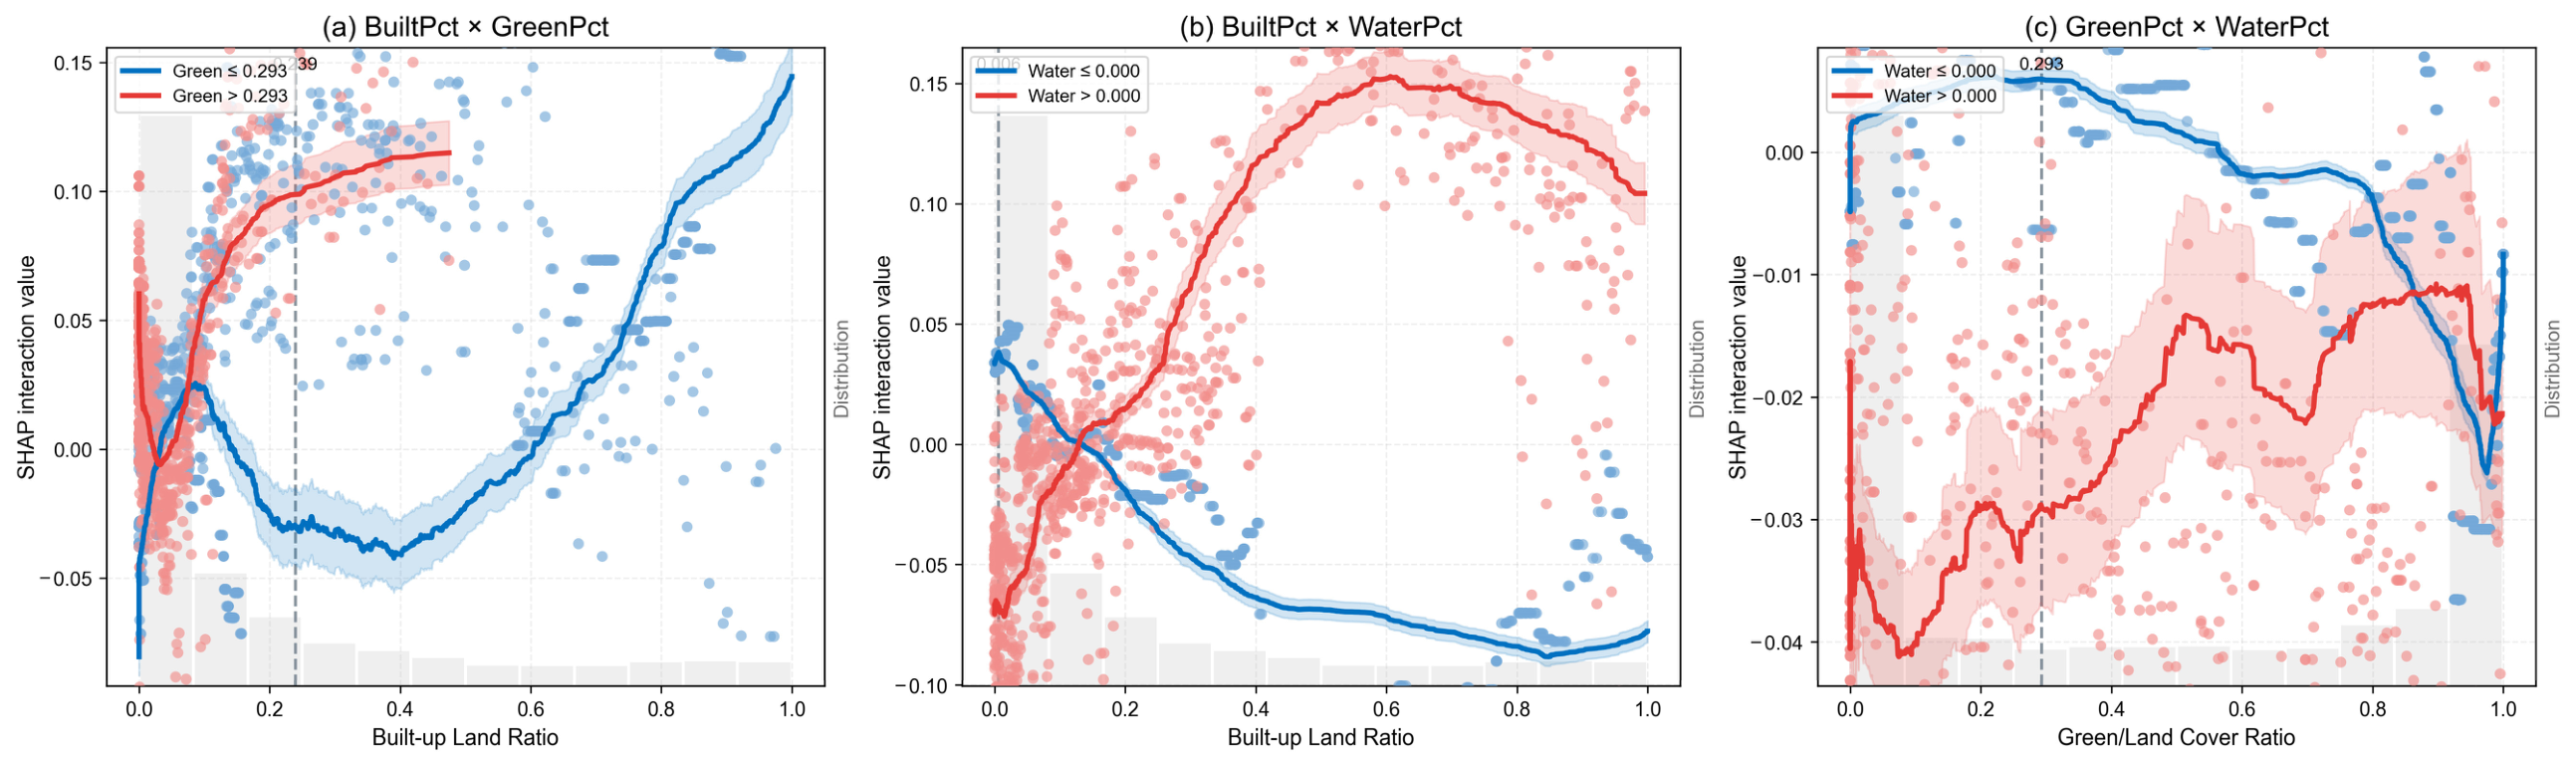
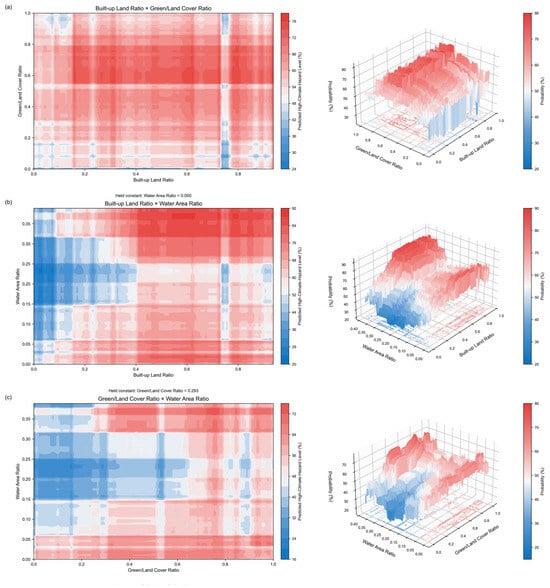
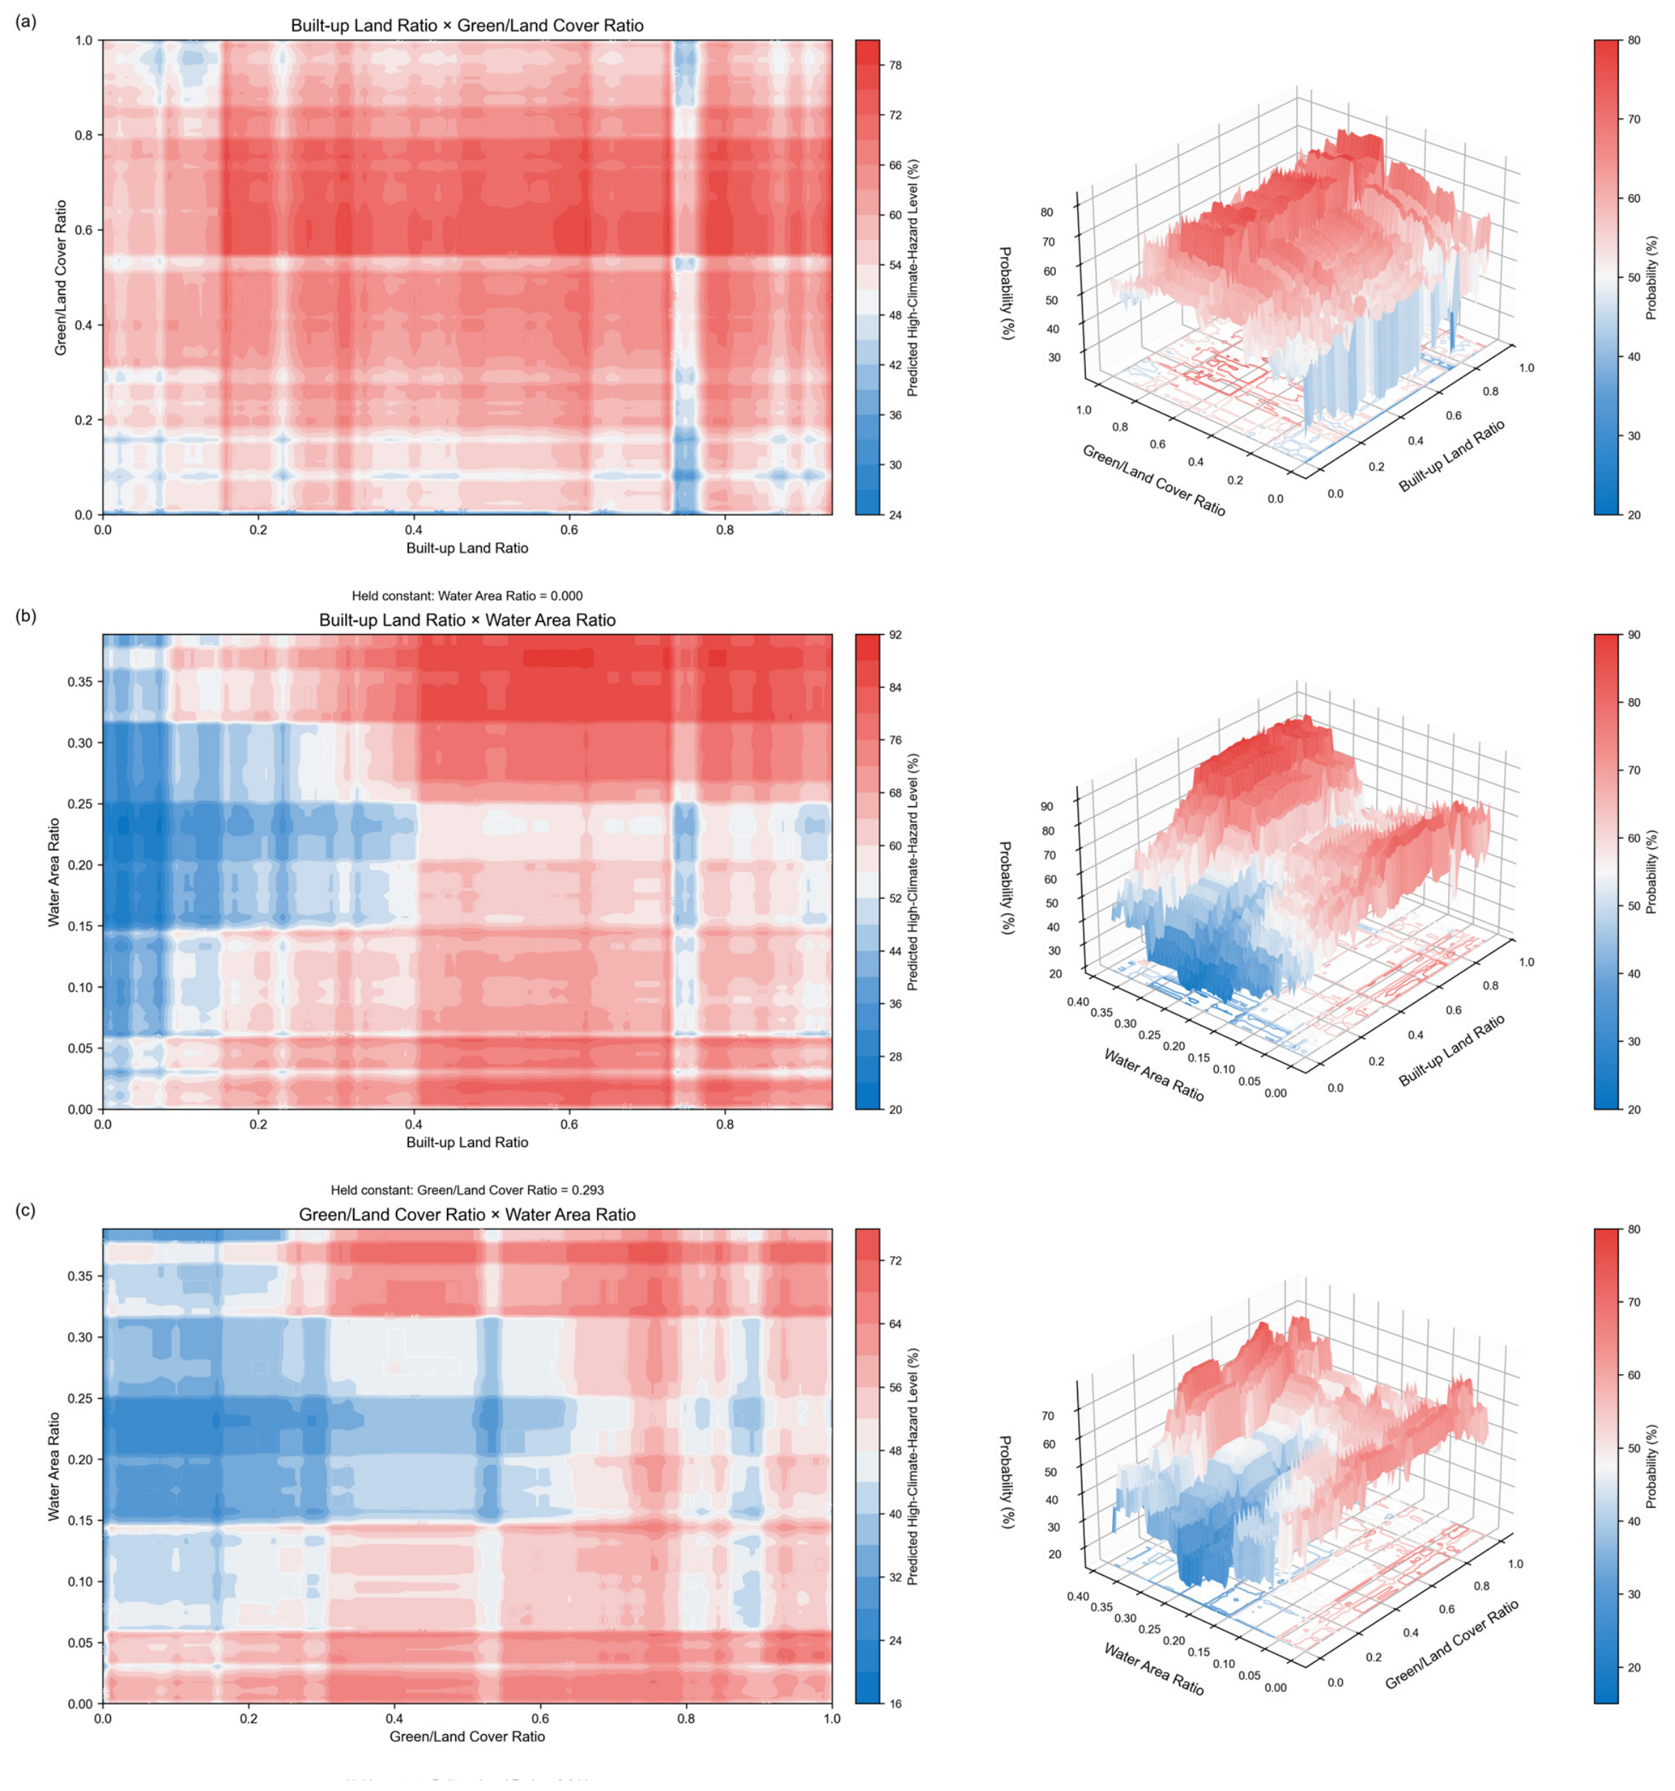

Disclaimer/Publisher’s Note: The statements, opinions and data contained in all publications are solely those of the individual author(s) and contributor(s) and not of MDPI and/or the editor(s). MDPI and/or the editor(s) disclaim responsibility for any injury to people or property resulting from any ideas, methods, instructions or products referred to in the content. |
© 2026 by the authors. Licensee MDPI, Basel, Switzerland. This article is an open access article distributed under the terms and conditions of the Creative Commons Attribution (CC BY) license.