


Abstract
Urban sprawl in emerging Indian cities has accelerated over the last three decades as a consequence of rapid population growth, industrial expansion, infrastructure development, and market-driven land conversion. Moradabad, a fast-growing urban center in Uttar Pradesh, has undergone substantial morphological transformation between 1994 and 2024. This study undertakes a comprehensive and quantitative examination of urban sprawl dynamics in Moradabad through the integration of ward-wise and zone-wise built-up expansion, gradient directional analysis, Shannon’s entropy, the Urban Expansion Intensity Index (UEII), and spatial pattern typologies such as edge, ribbon, infill, and leapfrog development. Multi-temporal urban land data for 1994, 2004, 2014, and 2024 were utilized to assess patterns and magnitudes of expansion. The results indicate a nearly 2.5-fold growth in the urban area, increasing from 9.02 km2 in 1994 to 23.86 km2 in 2024, with sustained outward expansion accompanied by increasing fragmentation and dispersion from the urban core to the periphery. Shannon’s entropy values increased from 0.60 in 1994 to 0.73 in 2024, reflecting a marked shift from compact to dispersed development. The UEII increased from 0.45 (1994–2004) to a peak of 1.13 (2004–2014), followed by a decline to 0.85 (2014–2024), indicating an initial acceleration in urban expansion and intensity, and a subsequent moderation, while urban growth remains relatively high and dispersed. Edge development increases constantly by 24.45% to 30.93% throughout the decades. Ribbon development was the most dominant typology, constituting 37.89% of total urban expansion from 1994 to 2004. Ribbon development decreased from 37.89% to 32.56% by 2024, while leapfrog development showed a similar fall from 35.24% to 31.61% during the same period; in contrast, infill growth remained comparatively limited. The findings indicate a strong spatial association between urban expansion patterns and the distribution of transportation corridors and industrial areas. However, the present analysis does not directly quantify the causal influence of these factors on urban growth, particularly in the SSW, SSE, ESE, and NE zones, in contrast to prior studies.
1. Introduction
Urban growth represents an intricate and ever-changing process that transforms rural landscapes into dense urban forms, particularly accelerating in developing nations like India due to rising population, economic progress, and rural-to-urban migration [1,2,3,4]. Globally, the urban population increased from 54% in 2014 and is projected to reach 66% by 2050 [5], with Asia accounting for the majority of this growth, thereby placing increasing pressure on resources and ecosystems while posing challenges to Sustainable Development Goal 11 for sustainable cities [6,7]. While urban sprawl has important implications for sustainable urban development, the present study focuses primarily on quantifying spatial patterns of urban expansion and does not directly evaluate SDG indicators or broader sustainability outcomes. In India, urbanization reached 31.1% in 2011, up from 27.7% in 2001 [8,9], thereby fueling urban sprawl in metropolitan cities such as Mumbai, with around 18.4 million residents [10], as well as in medium-sized urban centers. This has led to land degradation, infrastructure deficits, pollution, and the loss of agricultural and forest lands [11,12,13]. Rapid urbanization manifests in multiple forms, including physical expansion [14,15], suburbanization in developed regions [16,17,18], and haphazard growth in developing regions, which converts natural landscapes into built-up areas and exacerbates environmental issues such as biodiversity loss and flooding [19,20,21]. Key driving factors include industrialization [22,23], migration in search of better opportunities, and policy and planning gaps. Although urban areas occupy only about 3% of the Earth’s surface, they contribute disproportionately to ecological disturbances through urban sprawl, which is defined as unplanned, low-density, and outward expansion [23,24]. Previous studies have highlighted several negative impacts of urban sprawl, including habitat fragmentation [25], air and water pollution [26], traffic congestion [27], and inefficient resource utilization, as observed in the suburban expansion of the United States post-1950s and the rapid growth of class-I cities in India [28,29].
India contributes significantly to global urban expansion through natural population growth and migration [30], with states like Uttar Pradesh witnessing polarized urban growth in centers such as Moradabad, which are transitioning from agrarian dominance to commercial and residential expansion. Medium and small cities like Purulia [31,32], and others experience relatively under-researched urban sprawl, characterized by peripheral expansion, increasing entropy (dispersion), and the emergence of slums, poor sanitation, and socio-economic disparities in deprived regions [33]. Moradabad presents a compelling case for urban spatial analysis, given its dual role as a rapidly expanding tier-II city and a globally connected industrial hub. With approximately 9000 industries, including hundreds of export-oriented brassware and metal handicraft units and a spatially distributed population exceeding 900,000 across four urban zones, the city exemplifies the complex interplay between industrial growth, demographic pressure, and unplanned urban expansion that characterizes many medium-sized Indian cities. These challenges include overcrowding, infrastructure and service deficits, an increase in impervious surfaces, and the formation of urban heat islands [34], thereby underscoring the need for balanced regional development beyond megacities such as Delhi and Bengaluru [35]. Remote sensing data, particularly from the Landsat program at 30 m resolution [36], along with Geographic Information Systems (GISs), enable cost-effective and multi-temporal monitoring of land use and land cover (LULC) changes. These technologies facilitate the analysis of urban sprawl patterns such as leapfrog, ribbon, edge, and infill development [37,38], as well as the application of metrics like Shannon’s entropy to quantify spatial dispersion [39,40]. Analytical techniques include supervised classification, machine learning algorithms such as Random Forest and Support Vector Machine (SVM) [41], and landscape metrics derived from FRAGSTATS, such as Class Area (CA), Total Edge (TE), Number of Patches (NP), and Landscape Shape Index (LSI) [42]. Additionally, urban sprawl matrices [43] and predictive models such as CA-Markov and Multi-Layer Perceptron Neural Networks (MLP-NNs) [44] are widely used, offering improved spatiotemporal accuracy compared to traditional survey-based methods [23].
Prior studies have quantified urban sprawl using remote sensing and GIS techniques. For instance, ref. [43] employed urban sprawl matrices and Landsat satellite data to examine spatial patterns and urban growth in the Kolkata Urban Agglomeration from 1990 to 2015. Their findings indicated rapid urbanization along the eastern bank of the Hooghly River and emphasized the need for integrated approaches combining urban sprawl matrices, GISs, and remote sensing for effective urban planning and management. Similarly, ref. [41] analyzed land use and land cover changes in Karachi from 1990 to 2020 using Landsat data and the Random Forest algorithm. The study identified six urban classes, examined sprawl patterns, and applied a CA-Markov model to predict future scenarios for 2030. Ref. [40] investigated urban sprawl in Ajmer over a 25-year period (1977–2002) using Landsat TM, MSS, ETM+, and IRS LISS-III data, and further applied logistic regression to simulate urban growth patterns. In another study, ref. [45] assessed urban sprawl in Tripoli using remote sensing techniques, while ref. [42] analyzed urban expansion in the City of Tshwane from 1984 to 2015 using landscape metrics. Global studies, such as those conducted in Isfahan, have integrated Shannon’s entropy (SE), Multi-Layer Perceptron (MLP), and Multi-Criteria Analysis (MCA) to model urban growth [46]. Similarly, ref. [47] applied 28 static and dynamic indicators in the Kerman region using the Friedman test to assess urban expansion dynamics. These studies collectively reveal diverse urban sprawl patterns, including radial expansion, highway-oriented growth, fragmentation, and shifting driving forces [39,48]. However, significant research gaps remain in the context of medium-sized Indian cities. There is a scarcity of long-term (30+ years) analyses, limited integration of urban heat island effects and land surface temperature (LST), and insufficient attention to sustainability concerns in non-metropolitan areas such as Moradabad [49]. While extensive research exists for megacities like Delhi [50], Mumbai [51], and Kolkata [52], medium-sized cities remain relatively underexplored despite projections of rapid future growth [53]. In particular, there is a lack of integrated studies linking long-term (1994–2024) land use and land cover dynamics with land surface temperature, machine learning-based classification, and policy-oriented modeling approaches. Moreover, only a few studies have incorporated urban heat island analysis, entropy-based dispersion with buffer and zonal approaches [29], or multi-decadal Landsat datasets for analyzing long-term urban expansion patterns and their potential planning implications. As a result, the specific needs of smaller and deprived urban regions, particularly in terms of decentralized planning and sustainable development, continue to be overlooked [30].
While the analytical techniques adopted in this study have been used separately in the past to study urban growth, the novelty of the present research is their integration in a common multi-scale framework to understand the long-term urban sprawl dynamics of a fast-growing medium-sized Indian city. Unlike most of the previous research that mainly focuses on land use change detection or one urban sprawl indicator, this study integrates machine learning-based built-up extraction, ward-level spatial assessment, directional gradient analysis, Shannon’s entropy, Urban Expansion Intensity Index (UEII), and urban growth typology classification in a single analytical framework over three decades (1994–2024). The research also examines the spatial correspondence between urban growth patterns, industrial concentration, transportation infrastructure, and demographic distribution, providing contextual insights into factors that may be associated with urban expansion. This integrated approach offers methodological and planning contributions that can be transferred to other emerging industrial cities experiencing rapid urban transformation.
The contribution of this study should therefore be understood as an integrative methodological framework rather than the introduction of a new urban sprawl metric. While each analytical technique has been reported individually in previous studies, their systematic combination within a unified multi-scale workflow enables a more comprehensive evaluation of long-term urban expansion than is typically achieved using a single indicator or isolated analytical approach. The framework is designed to be transferable to other rapidly urbanizing medium-sized cities where long-term geospatial datasets are available, thereby providing practical value for urban planning and sustainable land management.
This research addresses gaps by analyzing Moradabad’s built-up changes from 1994 to 2024 using Landsat 5, 7 and 8, supervised classification using ML (SVM), for built-up extraction indices (NDBI, MNDWI & SAVI), Shannon entropy (SE) and UEII. Objectives:
- To quantify and compare built-up changes ward-wise across the four years (1994, 2004, 2014, and 2024).
- To assess the rates and directions of urban growth using gradient analysis and visualize dominant directions of expansion.
- To classify and measure different urban sprawl typologies (edge, infill, leapfrog, ribbon) and their contribution to total growth.
- To compute and interpret annual spatial metrics (Shannon Entropy Index and UEII) to understand the degree and nature of urban sprawl each year.
2. Study Area
Moradabad is a notable city situated in Uttar Pradesh, located at approximately 28.8387° N latitude and 78.7733° E longitude, as shown in (Figure 1). The city covers an area of over 65 square kilometers and is strategically positioned along the Ramganga River. It is characterized by a diverse landscape comprising urban areas, agricultural land, and forested regions. Moradabad lies at an average elevation of 198 m above sea level and experiences a subtropical climate, with hot summers, moderate winters, and a pronounced monsoon season. The mean annual rainfall is approximately 1000 mm, most of which occurs between June and September. Temperatures typically range from about 5 °C in winter to 45 °C in summer, significantly influencing LULC patterns in the region. Moradabad has a population exceeding 900,000 and has experienced rapid urbanization in recent years. The expansion of residential and industrial areas has led to significant land use and land cover changes, particularly a decline in agricultural land and natural vegetation. These changes have had notable impacts on the local environment, hydrology, and air quality [8]. Moradabad is one of India’s most important industrial cities, famous for its brassware and other metal handicrafts. The industrial landscape spatially is concentrated in few identifiable clusters, such as Lakhi Bagh Industrial Estate, Parsakhera Industrial Area, Prem Nagar Industrial Area and the traditional Line Par–Bartan Bazaar cluster. Moradabad is one of the largest metal handicraft export centers in India with around 9000 industries, out of which 600 to 850 are export-oriented units. The industrial concentration in this area has always attracted large-scale labor migration and commercial activity, contributing significantly to demographic growth and spatial urban expansion. The demographic footprint of the city is also expanding as per the zone-wise population distribution. Zone 1 has the highest population of 269,825 followed by Zone 2 (222,378), Zone 3 (203,270) and Zone 4 (192,398), which shows there is sustained population pressure across all spatial zones and not just in the urban core.
Figure 1.
Geographical map showing the location of the study area in Moradabad City, Uttar Pradesh, India.
3. Data and Methodology
This study employed a meticulous methodology to analyze the geographical trends and patterns of urban growth in Moradabad City during a 30-year period from 1994 to 2024. The methodology employs remote sensing techniques, thematic index integration, and spatial analytical tools to derive critical insights into urban sprawl dynamics (Figure 2).
Figure 2.
Conceptual framework of the study methodology.
3.1. Data Acquisition and Processing
The primary data source for this study comprised satellite imagery from the Landsat 5 (Thematic Mapper), Landsat 7 (Enhanced Thematic Mapper Plus), and Landsat 8 (Operational Land Imager and Thermal Infrared Sensor) (U.S. Geological Survey, Reston, VA, USA), all with a spatial resolution of 30 m. These datasets were utilized to analyze trends and forecast patterns of various types of urban sprawl and their temporal dynamics. To ensure a comprehensive representation of urban growth patterns, four distinct temporal datasets were selected, each corresponding to imagery acquired from different Landsat sensors. The selected dates are: (i) 2 May 1994 (Landsat 5 TM); (ii) 1 April 2004 (Landsat 7 ETM+); (iii) 9 May 2014 (Landsat 8 OLI/TIRS); and (iv) 20 May 2024 (Landsat 8 OLI/TIRS). The use of approximately 10-year intervals between these periods facilitates a systematic assessment of urban expansion over time. The satellite datasets were obtained from the United States Geological Survey (USGS) in GeoTIFF format [54]. Vector data of the city administrative boundary was digitized from the master plan map of Moradabad city, which is uploaded on Nagar Nigam Moradabad’s official website [55]. Prior to analysis, the imagery underwent detailed pre-processing using ArcGIS 10.8 (Esri, Redlands, CA, USA), a geospatial platform widely recognized for its accuracy and reliability. The pre-processing flow included radiometric calibration, atmospheric correction, image sub-setting, geometric verification, and image normalization. Atmospheric effects were minimized and consistency among multi-temporal datasets was ensured by using USGS surface reflectance products. Radiometric consistency across acquisition dates was checked through additional visual inspection and histogram comparison. For spatial comparability all the images were projected to the WGS 1984 UTM Zone 44N coordinate system (International Association of Oil & Gas Producers (IOGP) Geomatics Committee through the EPSG Geodetic Parameter Dataset) and clipped to the Moradabad Municipal Corporation boundary. Images were selected from similar dry season periods (April–May) to minimize seasonal vegetation and atmosphere differences. Secondary ancillary information including road network maps, Census of India population data (1991, 2001, 2011, 2021), industrial area locations, and municipal zoning records were reviewed to contextualize the observed patterns of urban expansion. To maintain consistency and comparability, all datasets were selected from the dry summer season. This approach ensured minimal cloud cover and improved spectral clarity, thereby enhancing classification accuracy, as supported by previous studies [56,57].
3.1.1. Raster Alignment and Temporal Harmonization
The Landsat datasets were spatially harmonized to maintain positional consistency across observation years before multi-temporal analysis. The images were obtained as USGS Level-2 Surface Reflectance products (U.S. Geological Survey, Reston, VA, USA) orthorectified and projected to a common coordinate system (WGS 1984 UTM Zone 44N). All datasets were normalized to a common spatial resolution of 30 m and clipped using the same Moradabad Municipal Corporation boundary. The geometric alignment was verified using stable reference features such as major road intersections, railway lines, river channels, and permanent urban landmarks, which are visible in all study periods. Temporal harmonization was also achieved by selecting imagery from similar seasonal periods (April–May) thus minimizing seasonal variability in vegetation and atmospheric conditions. The consistent use of the standardized surface reflectance products and the same pre-processing and classification workflows among the Landsat 5 TM, Landsat 7 ETM+ and Landsat 8 OLI/TIRS data reduced the potential effect of spatial misalignment on the detection of urban change, entropy calculation and directional growth analysis.
3.1.2. Retrieval of Urban Built-Up Area
This study employed the thematic-oriented index combination method described by [58] to extract urban built-up land from Landsat imagery. The primary spectral indices employed to characterize the major urban land cover categories like built-up areas, open water, and vegetation are the Normalized Difference Built-up Index (NDBI), Modified Normalized Difference Water Index (MNDWI), and Soil-Adjusted Vegetation Index (SAVI), respectively. The initial seven-band Landsat dataset was converted into three themed bands based on these indicators and then amalgamated into a new composite picture. This method decreased inter-band correlation and spectral redundancy, therefore alleviating confusion among the primary land use categories. The composite significantly improved the spectral separability of built-up, water, and vegetation surfaces compared to the original multispectral picture, resulting in distinctly separated spectral clusters for each class. For the supervised classification, training samples were selected in a stratified sampling manner by visual interpretation of Landsat composites, historical Google Earth imagery, topographic maps and field knowledge of the study area. Two main classes were identified, urban (built-up) and non-urban. For each year of study, about 250 training samples for the urban class and 250 training samples for the non-urban class were used; thus, each classification had a total of 500 training samples. Training samples were distributed over the study area to capture the spectral variability caused by different land cover conditions and to reduce classification bias (Table 1).
Table 1.
Parameters used in SVM classification and validation.
Normalized Difference Built-up Index (NDBI):
NDBI highlights developed surfaces by utilizing their increased reflectance in the Shortwave Infrared (SWIR) spectrum and diminished reflection in the Near-Infrared (NIR) spectrum.
Originally introduced by [59], NDBI has been widely applied in urban studies to discriminate impervious built-up areas from non-built-up features such as vegetation and water.
Modified Normalized Difference Water Index (MNDWI):
MNDWI is designed to enhance open water bodies while suppressing signals from built-up and vegetated surfaces.
It is expressed as proposed by [60]; MNDWI improves upon the traditional NDWI, providing enhanced dependability in urban settings where water features are frequently spatially linked to impermeable surfaces.
Soil-Adjusted Vegetation Index (SAVI):
SAVI was adopted to mitigate soil background effects and improve vegetation discrimination.
where L is a soil adjustment factor, typically fixed at 0.5. Developed by [61], SAVI is particularly suitable for areas with sparse or heterogeneous vegetation cover.
The three indices (NDBI, MNDWI, SAVI) were combined to generate a composite image that enhances urban built-up land while suppressing water, vegetation, and bare soil. A supervised classification using the SVM algorithm was then applied, given its strong performance with high-dimensional and multi-class datasets. The SVM classifier was performed with Radial Basis Function (RBF) kernel, which is generally recommended for remote sensing classification as it can handle non-linear feature boundaries. The kernel parameters were chosen as: penalty parameter C = 100, and gamma (γ) = 0.125 (equivalent to 1/number of bands), which is standard in comparable urban land cover classification studies. The best SVM parameters were selected by the classification performance and visual evaluation of the classification outputs through an iterative trial-and-error procedure. We tested several combinations of the penalty parameter (C) and gamma (γ) values and the final set of parameters (C = 100, γ = 0.125) provided the highest classification accuracy and the best separation between the urban and non-urban classes. The RBF kernel was chosen due to its ability to model complex non-linear relationships that are often present in heterogeneous urban landscapes. To ensure temporal comparability between the Landsat 5 TM, Landsat 7 ETM+ and Landsat 8 OLI/TIRS sensors, all datasets were converted to surface reflectance products and processed using identical classification procedures. Also, the use of normalized spectral indices (NDBI, SAVI and MNDWI) reduced the sensor-specific radiometric differences and improved the consistency of the observation years. To reduce temporal and sensor related biases similar seasonal acquisition dates and a common spatial resolution of 30 m were adopted (Table 1). Classification accuracy was evaluated using overall accuracy, Kappa coefficient, and user’s and producer’s accuracy for urban and non-urban classes. For each period, 300 validation samples were used, comprising 150 urban and 150 non-urban points. Land cover verification for 1994, 2004, and 2014 relied on historical Google Earth Pro imagery, whereas the 2024 assessment integrated 120 GPS-based ground truth points and 180 visually interpreted points from high-resolution Google Earth Pro imagery, ensuring a rigorous and credible accuracy evaluation.
For the historical time periods (1994 and 2004), reference samples were generated using a combination of archived imagery available through Google Earth Pro, Survey of India topographic maps, municipal planning records, historical land use maps, and visual interpretation of stable landscape features such as major roads, railway corridors, river channels, institutional campuses, and long-established urban settlements. Validation points were selected only when land cover identity could be determined with a high degree of confidence. To ensure temporal consistency, reference information was verified from the nearest available historical imagery and ancillary datasets for each study period. The multi-source validation approach reduced the dependence on a single reference dataset and improved the reliability of historical classification assessment.
Historical Validation Uncertainty
The assessment of historical accuracy is subject to certain limitations, as no contemporaneous field observations are available for the earlier study years. Uncertainty arises from differences in image quality among Landsat sensors, misregistration of historical reference datasets, visual interpretation errors, and the limited availability of high-resolution historical imagery, meaning temporal and spatial resolution of reference sources varied across years. Consequently, the accuracy values reported for 1994 and 2004 should be treated as best-available approximations rather than exact measures of classification performance or direct substitutes for contemporaneous field validation. The use of multiple independent historical reference sources, stratified validation sampling, and consistency checks helped minimize these uncertainties, providing a sufficiently reliable and conservative basis for analyzing long-term urban growth trends in Moradabad.
3.1.3. Quantification of Built-Up Changes: Ward-Wise
Moradabad is analyzed in this study to systematically quantify built-up area changes across its four administrative zones and 70 wards, providing granular insights into urban sprawl patterns from 1994 to 2024. Using classified satellite imagery and GIS-based spatial analysis, the study measures absolute change, percentage change, decadal growth rates, and compound annual growth rates for the benchmark years 1994, 2004, 2014, and 2024. This dual-scale approach, ward-level analysis for identifying micro-scale hotspots such as rapid densification, leapfrog development, and edge expansion, and zone-level analysis for examining meso-scale trends such as core versus peripheral growth that reveals heterogeneous urbanization patterns that are often obscured in city-wide aggregates. Such detailed spatial assessment enables planners and policymakers to identify differential growth trajectories, stagnant areas, and emerging hotspots, thereby supporting targeted interventions aligned with the city’s diverse development dynamics.
Selection of the City Center
The reference city center for the concentric buffer and directional analyses was defined as the geometric centroid of the Moradabad Municipal Corporation (MMC) administrative boundary. The centroid was created in ArcGIS 10.8 using “Feature to Point” (Inside) geoprocessing tool, which determines a representative point that is located within the municipal polygon. To ensure consistency of methodology and comparability of spatial metrics, this centroid was adopted as the common origin for all concentric buffer rings and directional sectors throughout the study period.
The geometric centroid was used rather than alternative definitions (Central Business District (CBD), population-weighted center, administrative headquarters) as the study is primarily interested in quantifying city-scale spatial expansion rather than economic or demographic centrality. Furthermore, the administrative extent of Moradabad did not change during the analysis period, which allowed using the same reference point for all the temporal datasets (1994–2024).
Urban development patterns in Moradabad were further examined using built-up data from 1994 to 2024. The methodology involved quantifying decadal variations in urban extent to assess changes in spatial growth. To facilitate this analysis, buffer rings were generated around the urban core at 2 km intervals, extending up to 8 km from the city center (Figure 3). The same buffer configuration was maintained for all study years to ensure methodological consistency and minimize zoning-related variability in entropy estimation. To capture the spatial gradient of urban expansion from the city center to the urban fringe, a 2 km interval buffer approach was adopted with an adequate spatial resolution for directional analysis. Similar buffer-based frameworks have been widely used in urban sprawl and entropy-based studies to evaluate the core–periphery pattern of urban growth. The selected period was considered suitable for the municipal extent of Moradabad for meaningful comparison of urban expansion across the concentric zones. To ensure all the spatial units analyzed are formal designated urban and urban fringe areas, the buffer rings up to 8 km from the city center were restricted to the administrative boundary of MMC. Thus, the gradient and directional analysis only considers land use changes occurring within the administrative boundaries, avoiding the misinterpretation of peripheral rural or non-urban lands as urban sprawl. These buffer zones were further divided into 16 directional sectors, including north, northeast, northwest, south, southeast, and southwest. This zonal framework enabled the identification of directional trends and spatial patterns of urban expansion within each sector. Urban extents were delineated within each buffer ring to provide a comprehensive understanding of spatial growth dynamics. This approach enabled comparative analysis of growth patterns across different time periods for each buffer zone. The method effectively captured and analyzed the evolving spatial structure of urban expansion, offering detailed insights into the geographical trends of urban growth in Moradabad between 1994 and 2024.
Figure 3.
Concentric buffer rings and 16 directional sectors generated from the geometric centroid of the Moradabad Municipal Corporation boundary, used as the reference city center for gradient and entropy analyses.
The formal sensitivity tests using alternative buffer widths (1 km, 3 km, and 5 km) and different configurations of directional sectors (8 and 32) were out of the scope of the present study. However, the selected framework was developed considering the spatial extent of Moradabad, built-up land distribution, and methodological consistency with previous urban entropy studies. Future work could evaluate the impact of different zoning schemes on entropy values and directional growth measures.
The 2 km concentric buffer intervals are a compromise between spatial resolution and statistical robustness for the municipal extent of Moradabad (approximately 65 km2). Smaller intervals (e.g., 1 km) would imply more spatial units with limited built-up area, thus increasing local variability and reducing the robustness of the entropy estimation. Larger intervals (e.g., 3–5 km), in contrast, would aggregate heterogeneous urban forms, masking significant transitions between the compact urban core and the peri-urban fringe. Thus, a 2 km interval is appropriate to represent the radial gradient of urban expansion in terms of spatial resolution and to keep similar proportions of built-up areas among the buffer zones.
The 16-sector directional framework (22.5° intervals) was also chosen to allow sufficient directional resolution for detecting anisotropic urban growth patterns while ensuring statistically significant built-up areas within each sector. A lower directional resolution (8 sectors; 45° intervals) would generalize directional variations and potentially hide localized expansion corridors, whereas a higher resolution (32 sectors; 11.25° intervals) would generate many sectors with limited urban coverage, increasing sensitivity to local irregularities while reducing interpretability. Therefore, the 16-sector structure chosen is a compromise between spatial detail and analytical robustness.
Gradient analysis was employed to evaluate variations in the rate, intensity, and direction of urban growth from the city core to peri-urban and rural fringes by segmenting the landscape into radial sectors or transects. This method quantifies built-up expansion, vegetation loss, land conversion, and fragmentation, thereby identifying patterns such as concentric growth, ribbon development along transportation corridors, leapfrog sprawl, and infill development. It transforms complex spatial changes into direction-specific metrics, highlighting dominant growth corridors (e.g., northward and eastward expansion) and critical hotspots, thereby aiding planners in targeting interventions, assessing ecological impacts and managing urban sprawl effectively.
It should be noted that the concentric buffer framework is used as an analysis reference system and not an assumption for uniform urban growth in all directions. In Moradabad, urban expansion is determined by transport corridors, industrial estates, existing settlement patterns, planning policies and natural features such as the Ramganga River. Thus, a 16-direction sector analysis is combined with the radial framework to identify anisotropic growth patterns, while maintaining a consistent spatial reference for comparing urban expansion in different periods. This mixed approach distinguishes between the geometric measurement of urban growth and the interpretation of the spatial processes that rule it.
3.1.4. Analysis of Urban Growth Patterns
The spatiotemporal patterns of urban expansion in Moradabad were classified into four categories: leapfrog, edge, ribbon, and infill development, using spatial overlay analysis, quantitative metrics, and contextual evaluation [62]. New development patches were identified by overlaying supervised classified built-up maps derived from satellite imagery for the periods 1994–2004, 2004–2014, and 2014–2024, and were subsequently validated for accuracy. These overlays enabled the identification of non-urban to urban land transitions. The identified urban growth typologies (edge, ribbon, leapfrog and infill) were validated through visual interpretation and comparison with high-resolution Google Earth imagery and historical built-up maps for each study period. A random sample of newly developed patches was examined to assess the fit of spatial configuration of development to the assigned growth category. The selected Sp-based classification framework has been widely used in previous studies on urban sprawl and it was found to accurately describe the observed urban growth patterns in Moradabad.
The classification framework adopted a hybrid approach by integrating methodologies from [62,63,64], with refinements to suit the Indian urban context. The cut-off values used to classify the Sprawl Expansion Index (Sp) were based on the conceptual framework proposed by Liu et al. and subsequent studies on urban sprawl, which classify newly developed urban patches based on their degree of spatial connectivity with existing urban areas. The thresholds are higher levels of patch integration into the urban fabric. A Sp value of 0 implies complete spatial separation from existing urban development and thus represents leapfrog growth. Values of 0.50 and below indicate some degree of adjacency to the urban boundary and are associated with edge expansion. Intermediate values between 0.50 and 0.75 indicate elongated development forms that tend to occur along transportation corridors and are classified as ribbon development. Values above 0.75 suggest a strong enclosure and integration with the existing urban structure, which is typical for infill development. These thresholds have been widely used for the studies of urban growth and provide a common basis for the comparison of spatial expansion patterns. This approach incorporated geometric, spatial, and contextual criteria for accurate classification. Furthermore, the Sprawl Expansion Model was employed to strengthen validation and quantify the classification results. This model uses the following formula to evaluate the relationship between the geometry of newly developed patches and their spatial characteristics:
where Sp denotes the sprawl growth index, Lp represents the area of the newly created patch, and P signifies the perimeter of the newly built patch. Ref. [64] provide the notion of “ribbon” development, which is predicated on the strong link between the Sp value and nearness to significant transportation networks. Patches were categorized into four classifications based on the Sp values, as seen in (Figure 4) are as follows:
Figure 4.
Urban growth pattern classification edge, infill, leapfrog, and ribbon.
(a) Edge sprawl represents continuous outward expansion from existing urban boundaries, akin to ripples from a stone in water. New subdivisions, commercial centers, and infrastructure adjoin the current city edge, gradually extending it while consuming peripheral agricultural and natural lands in a relatively compact manner.
- Edge development: 0 < Sp ≤ 0.50
(b) Infill development counters sprawl by utilizing vacant or underused parcels within existing urban areas, such as empty lots, parking spaces, or brownfields. It promotes sustainability by leveraging infrastructure, easing peripheral pressure, and revitalizing neighborhoods.
- Infill development: 0.75 < Sp ≤ 1.0
(c) Leapfrog sprawl involves discontinuous “jumps” over nearby vacant land to distant sites, driven by cheaper land, fewer regulations, or attractive features. This scattered pattern creates isolated pockets separated by underutilized gaps, demanding costly extended infrastructure like roads and utilities.
- Leapfrog development: Sp = 0
(d) Ribbon sprawl, or linear development, aligns with major transport corridors (highways, roads), forming spoke-like extensions from the core. It leverages accessibility for commercial and residential clusters but fosters traffic congestion, poor walkability, and fragmented landscapes between corridors.
- Ribbon development: 0.50 < Sp ≤ 0.75
Values for Sp threshold were taken from existing urban sprawl studies and are related to the geometric relationship between patch area and perimeter. Lower Sp values are characteristic of fragmented and discontinuous growth, typical of leapfrog development, while higher values are associated with compact and contiguous development, typical of infill growth. Values in between represent ribbon and edge expansion, which are usually influenced by transportation corridors and outward urban expansion.
Spatial and Contextual Dimension Blending
The interaction between fresh patches and their spatial surroundings was carefully analyzed in order to guarantee that the categorization takes into consideration surrounding urban context:
- (1)
- Proximity to Transportation Networks: The distance of new patches to existing metropolitan areas and transport networks was calculated by creating GIS-based spatial buffers.
- (2)
- Adjacency and Overlap: Edge and infill development classifications were validated using the amount of overlap and contact with new patches and prior urban areas.
- (3)
- Spatial Arrangement: The geometric form and distribution of patches were studied to check their compliance with projected growth patterns.
The contextual studies allowed for fuller interpretations of the growth patterns, eliminating the restrictions of a strictly geometric approach.
Classification Validation
To verify the categorization of urban development types, a mix of procedures was used to assure accuracy and scientific rigor:
- Cross-Validation Using Satellite Imagery: Satellite pictures of historical data were used for geographical reference and confirmation of the established spatial linkages and patch classifications.
- Field verification was conducted for representative contemporary patches (2024), while historical growth categories were verified using archived imagery, historical maps, and spatial overlay analysis.
- Addition of ancillary data land use and transportation network areas were utilized to augment and improve classifications and discrepancies.
The robustness of the typology classification was assessed by performing a sensitivity analysis varying the threshold boundaries ±0.05 around the original Sp values. The results showed only minor changes in the proportional distribution of growth categories, while the dominant spatial patterns were consistent across all study periods. Edge development remained the most dominant form of growth, and infill development remained the least dominant category. The results indicate that the general understanding of urban sprawl dynamics is not very sensitive to small changes in the threshold.
Limitations of Typology Classification
The adopted classification framework is a useful representation of urban growth processes, but some limitations should be acknowledged. Urban expansion is often the result of complex and coalescent spatial processes and individual patches of development may exhibit edge, ribbon and leapfrog characteristics simultaneously. The use of discrete threshold values collapses these transitional patterns into mutually exclusive categories, potentially ignoring finer-scale spatial variation. In addition, the spatial resolution of Landsat imagery and the geometry of the extracted urban patches also influence the classification. Therefore, the typology proportions reported should be interpreted as generalized indicators of dominant growth behavior, rather than exact reflections of all urban development processes. Despite these limitations, however, the framework is useful for discerning general spatial trends and for comparing patterns of urban expansion over long temporal periods.
In addition, the choice of buffer width and sector design (i.e., the Modifiable Areal Unit Problem, MAUP) might affect the results of buffer-based entropy and directional analysis. The adopted 2 km buffer and 16-sector framework was chosen to provide a proper trade-off between spatial detail and analytical robustness. However, future studies should assess the sensitivity of the results by using alternative buffer widths (e.g., 1 km, 3 km and 5 km) and different sector configurations (e.g., 8 and 32 sectors).
3.1.5. Shannon’s Entropy and Urban Expansion Intensity Index Model: Assessing Urban Spatial Extent
Land use and land cover evaluation alone fails to fully assess physical urban expansion trends, necessitating quantification of changes within the urban framework. Shannon’s entropy measures spatial concentration or scattering of built-up areas from the metropolitan core [65,66]. This prevalent GIS-based technique evaluates sprawl extent [29,30,65,66,67,68]. Relative entropy, normalized between 0 (compact core distribution) and 1 (uneven dispersion), (Equation (1)):
where and is built-up density in the ith of n zones [66]. Values exceeding 0.50 threshold signify sprawl [23,66]. An entropy threshold of 0.50 has been commonly applied in urban sprawl research to distinguish relatively compact urban forms from dispersed development patterns. Similarly, the thresholds for the UEII classification used in this study are based on established urban expansion frameworks, which allow the comparison of growth intensity of Moradabad with other cities reported in the literature. Entropy differences between periods t and t + 1, (Equation (2)):
ΔEn denotes the difference in relative entropy values between two time periods, where En(t + 1) represents the relative entropy value at time period t + 1, and En(t) signifies the relative entropy value at time period t, indicating progression toward sprawl or compactness [66,69,70]. Applications include buffer zone [30,39,66,69,70,71], ward-based [29,40], and directional methods [66,72]. This study applies directional analysis across 16 cardinal directions (E, ENE, ESE, N, NE, NNE, NNW, NW, S, SE, SSE, SSW, SW, W, WNW, WSW) from the CBD to track anisotropic expansion. Shannon’s entropy is extensively used for measuring urban dispersion while its interpretation is exposed to some methodological limitations. First, entropy values are scale-dependent and might vary depending on the spatial extent of the study area and resolution of analysis. Second, entropy calculations are dependent on the configuration and size of the spatial units used to aggregate, e.g., buffer zones, wards, or administrative boundaries. This sensitivity is related to the Modifiable Areal Unit Problem (MAUP), meaning that changes in zoning schemes can alter the resultant entropy values and their interpretation. Thus, entropy should be considered a measure of the relative level of spatial dispersion, not a direct or complete measure of urban sprawl. In order to overcome these limitations, the current study analyzes the results of entropy along with the direction of growth, the typology of urban growth, and the UEII to provide a more elaborate evaluation of the dynamics of urban expansion.
UEII is defined as the average yearly growth area normalized by the total area of a geographical unit, indicating future trends and possibilities for urban expansion [73,74]. The UEII has been classified into many categories: very-high-speed expansion (>1.92), high-speed expansion (1.05–1.92), medium-speed expansion (0.50–1.05), slow growth (0.28–0.59), and very slow expansion (<0.28) [75]. It is expressed below in (Equation (3))
where UEIIi denotes the Urban Expansion Intensity Index for unit i; and represent the built-up land area at times t2 and t1, respectively; TLAi signifies the total land area within study area i; and ∆t indicates the temporal difference in the research period.
4. Results
This part presents the results and analysis of our study, concentrating on Four primary aspects: quantification of built-up changes—ward-wise and zone-wise, Urban Growth Trend Analysis, Urban Growth Pattern Analysis and Shannon’s entropy and Urban Expansion Intensity Index. Through the analysis of these aspects, we want to offer an exhaustive comprehension of the urbanization process in Moradabad City during the last 30 years. The research utilizes geographical data to reveal the magnitude, trajectory, and categories of urban expansion, emphasizing the city’s dynamic evolution.
4.1. Spatiotemporal Urban Change
Spatial trends of urban growth in Moradabad City were analyzed using built-up area maps spanning three decades, revealing significant and dynamic expansion patterns. In 1994, the built-up area spanned 9.02 km2, around 12.00 km2 by 2004 with 33.04% growth rate, coinciding with a period of increasing urban development and population growth in the city. The 2004–2014 decade showed moderated yet substantial growth to 19.39 km2 (61.58% increase), likely due to urban consolidation and structured planning policies. From 2014 to 2024, expansion accelerated to 23.86 km2 (23.05% growth), reflecting continued urban growth and outward spatial expansion during the study period, resulting in nearly 2.5-fold increase overall (Figure 5).
Figure 5.
Urban area extent and rate of change in Moradabad city from 1994 to 2024.
Classification accuracy was validated through confusion matrices for each period. Overall accuracy improved from 85.0% (Kappa 0.70) in 1994, to 88.0% (Kappa 0.76) in 2004, 91.0% (Kappa 0.82) in 2014, and peaked at 94.0% (Kappa 0.88) in 2024. User’s and producer’s accuracies for urban and non-urban classes progressed consistently, achieving 92.9% producer’s accuracy for urban classification in 2024, confirming model robustness (Table 2).
Table 2.
Accuracy assessment metrics for urban and non-urban classification from 1994 to 2024.
The relatively lower accuracies for 1994 and 2004 are also partly due to the challenges in interpreting and validating historical imagery. The 2024 dataset was improved by field-based GPS observations, while the historical assessments relied mainly on archival imagery and ancillary datasets. Thus, the earlier classifications are subject to a greater degree of uncertainty. Nevertheless, the steadily increasing overall accuracy and Kappa statistics throughout the study period indicates that the classification framework was still sufficiently robust for analyzing long-term trends in urban growth.
The map illustrates the spatial expansion of urban sprawl in Moradabad City from 1994 to 2024. Built-up areas for four time periods (1994, 2004, 2014, and 2024) are shown using different colors, highlighting progressive outward growth from the city core. The densest growth is concentrated in the eastern and southeastern sectors, while moderate growth is visible in other directions. This temporal comparison clearly demonstrates rapid urbanization, infilling of vacant land, and the spread of built-up areas into the surrounding peri-urban regions over three decades (Figure 6).
Figure 6.
Spatiotemporal urban area changes in Moradabad city from 1994 to 2024.
Ward-Wise Built-Up Expansion (1994–2024)
The ward-wise analysis reveals a clear transformation in the urban structure of Moradabad from a compact monocentric city in 1994 to a more dispersed and increasingly polycentric urban form by 2024. During the early phase (1994–2004) (Figure 7 and Table 3), urban growth was still focused on the existing urban core and adjacent residential areas, reflecting edge expansion and gradual outward diffusion of development. The 2004–2014 period was the most active period of urban transformation with rapid outward expansion, large-scale conversion of peripheral land and emergence of a number of growth hotspots beyond the traditional city center. This phase represented a transition from compact growth to a more dispersed and fragmented urban pattern (Figure 8 and Table 3).
Figure 7.
Ward-wise built-up expansion of Moradabad city from 1994 to 2004.
Table 3.
Ward-wise built-up expansion of Moradabad city (1994–2024).
Figure 8.
Ward-wise built-up expansion of Moradabad city from 2004 to 2014.
During 2014–2024, urban expansion continued mostly along peripheral growth corridors, particularly in areas spatially associated with transportation networks, industrial zones, and available developable land. The continued growth of peripheral wards and relatively limited redevelopment in the urban core suggests that urban expansion was largely the result of edge and leapfrog development, rather than compact infill growth. The spatial pattern of growth hotspots shows the increasing significance of industrial clusters, residential townships and transport infrastructure in determining urban growth patterns (Figure 9 and Table 3).
Figure 9.
Ward-wise built-up expansion of Moradabad city from 2014 to 2024.
Taken together, the ward-level results reveal three major spatial processes: (i) growth from the existing urban core, (ii) corridor-focused growth along major transportation corridors and industrial zones, and (iii) creation of a polycentric urban form through the emergence of secondary growth centers. Together these processes resulted in an increase in spatial dispersion, fragmentation and urban sprawl in Moradabad during the period of study.
4.2. Spatial Trends of Urban Growth
The distance and direction analysis of built-up expansion in Moradabad City from 1994 to 2024 reveals a highly asymmetric urban growth pattern driven by both proximity to the urban core and directional developmental pressures. Growth intensity varies significantly across the 16 radial directions and four buffer distances (2, 4, 6, and 8 km), demonstrating the spatial heterogeneity of urban sprawl (Figure 10).
Figure 10.
Urban growth in different zones and buffer rings: (a) 1994; (b) 2004; (c) 2014; (d) 2024.
The strongest and most consistent expansion occurs in the eastern and southeastern sectors, particularly along the E, ENE, ESE, SE, and SSE directions, where built-up area values increase steadily across all distances and decades. For instance, the E direction at 4 km maintains the highest magnitude (2.01 km2 in 1994 to 2.13 km2 in 2024), indicating a long-term corridor of urban intensification, likely influenced by major transportation routes and industrial activity. Similarly, the ENE and ESE directions show substantial growth at mid-range buffers (4–6 km), reflecting outward residential expansion and peri-urban conversions. In contrast, northern and northeastern directions (N, NE, NNE, NNW) show moderate but steady increases, suggesting controlled expansion compared to the high-pressure eastern belt (Table 4). The southern and southwestern sectors show mixed behavior: while SSE and SSW directions exhibit noticeable growth at 2–6 km, the SW and WSW directions experience smaller increments, indicating low-density or environmentally constrained expansion.
Table 4.
Urban sprawl in distance and direction of Moradabad city (1994–2024).
The spatial distribution of urban expansion in Moradabad reflects the combined influence of demographic growth, industrial development, transportation accessibility, and peripheral land availability. With a population exceeding 900,000 distributed across four urban zones, the city has experienced sustained demand for residential, commercial, and infrastructural development. Simultaneously, the concentration of approximately 9000 industries, including major industrial clusters such as Parsakhera Industrial Area, Prem Nagar Industrial Area, Lakhi Bagh Industrial Estate, and the Line Par–Bartan Bazaar industrial belt, has attracted labor migration and economic activity, creating additional pressure for urban expansion. Improved transportation connectivity has further facilitated the conversion of agricultural and open land into built-up areas, particularly in the eastern and southeastern sectors, which coincide with major transport corridors and industrial growth zones. Consequently, urban growth has predominantly occurred through edge, ribbon, and leapfrog development, contributing to increasing spatial dispersion and fragmentation. In contrast, the western sector experienced relatively slower growth due to weaker economic attraction and lower development pressure. The persistently low proportion of infill development indicates that expansion has largely occurred through peripheral land conversion rather than redevelopment within the urban core, reflecting the availability of comparatively inexpensive fringe land and the absence of strong compact city or densification policies.
The western and northwestern directions (W, WNW, NW) generally record lower magnitudes, except for isolated increases at distances of 4–6 km, reflecting slower urbanization possibly due to land suitability or limited developmental pull. Across all directions, the magnitude of expansion decreases with distance from the city center, with 2 km and 4 km buffers showing the dominant built-up accretion, confirming a strong core–periphery gradient. Overall, the table highlights a directionally biased, distance-dependent expansion pattern dominated by eastern and southeastern corridors, evidencing both planned and spontaneous sprawl dynamics shaping the city over three decades (Figure 11).
Figure 11.
Urban growth trends from 1994 to 2024 in built-up area (km2) with respect to E, ENE, ESE, N, NE, NNE, NNW, NW, S, SE, SSE, SSW, SW, W, WNW, and WSW.
The direction in which a city grows is not just a matter of geometry; it is influenced by the ease of transportation, the concentration of industry and the pressure of population. The pronounced expansion observed in the eastern and southeastern sectors spatially coincides with major industrial estates and transportation corridors indicating that economic activity and accessibility have played an important role in shaping the observed urban growth pattern. The present study, however, assesses these relationships qualitatively, not through explicit statistical modeling, which is a future research path.
4.3. Spatial Patterns of Urban Growth
Urban growth patterns of the study area over three decades from 1994 to 2004, 2004–2014, and 2014–2024, by quantifying the spatial extent of four major forms of urban expansion, are: edge, infill, ribbon, and leapfrog development. The values are expressed both in sq. km and percentage contribution to total urban growth for each time period, allowing a clear assessment of how dominant each growth type was over time. During 1994–2004, the urban growth was almost equally dominated by Ribbon (1.72 km2; 37.89%) and leapfrog growth (1.6 km2; 35.24%), suggesting that development largely followed major transportation corridors and also occurred in scattered patches beyond the urban edge. Edge growth contributed 1.11 km2 (24.45%), indicating moderate outward expansion along the existing built-up boundary. Infill growth was minimal (0.11 km2; 2.42%), showing very limited utilization of vacant inner-city parcels (Table 5).
Table 5.
Urban spatial patterns area and percentage of Moradabad city (1994–2024).
In the period of 2004–2014, all growth types intensified significantly, with ribbon growth (2.42 km2; 36.28%) becoming the most dominant pattern, reflecting strong linear expansion along highways and major road networks. Leapfrog development also increased (2.35 km2; 35.23%), highlighting continued outward growth via isolated settlement patches. Edge expansion rose to 1.51 km2 (22.64%), confirming active boundary-level sprawl, while infill growth increased modestly to 0.39 km2 (5.85%), indicating some improvement in built-up consolidation. The pronounced leapfrog and ribbon development observed during 2004–2014 spatially coincides with the peripheral locations of major industrial estates, including Parsakhera and Prem Nagar Industrial Areas, where employment-driven in-migration and associated residential demand likely accelerated fragmented outward expansion. Similarly, the sustained population across outer zones, Zone 3 (203,270) and Zone 4 (192,398) were indications that demographic pressure was not confined to the urban core, consistent with the dispersed built-up expansion documented across all buffer zones.
Between 2014 and 2024, the overall magnitude of growth for all patterns slightly decreased compared to the peak decade (2004–2014), but the spatial distribution remained dispersed. Ribbon (2.39 km2; 32.56%) and leapfrog (2.32 km2; 31.61%) continued to dominate, showing persistent corridor-based and fragmented outward development. Edge growth accounted for 2.27 km2 (30.93%), indicating steady expansion along existing built-up boundaries. Infill growth (0.36 km2; 4.90%) remained the least significant, reflecting limited densification in the urban core (Figure 12).
Figure 12.
Urban sprawl patterns changes of Moradabad city from 1994 to 2024.
The edge development dominance was stable for all study periods within small threshold variations during the sensitivity tests, indicating that the observed growth patterns are robust and not dependent on the chosen classification boundaries. This confirms the validity of the typology-based interpretation of urban expansion in Moradabad.
4.4. Quantification of Urban Sprawl Using Shannon’s Entropy
The zone-wise distribution of built-up area across four distance bands (0–2 km, 2–4 km, 4–6 km, and 6–8 km) from the city center for the years 1994, 2004, 2014, and 2024, along with the corresponding Shannon Entropy Index, which is a widely used metric to quantify the degree of urban sprawl. For each year, the values in the “Zone” rows represent the measured built-up area (in km2) within each radial zone, while the corresponding “Pi” values denote the proportion of built-up area in each zone relative to the total built-up area of that year. In 1994, the built-up concentration is heavily skewed toward the 2–4 km zone (Pi = 0.704), indicating a compact and highly localized urban structure, which results in a lower entropy value of 0.826, reflecting limited sprawl. By 2004, built-up expansion increases substantially in the same zone (7.74 km2), yet the distribution becomes slightly more spread out across the other zones, increasing the entropy to 0.879 (Table 6).
Table 6.
Shannon Entropy Index of Moradabad city (1994–2024).
The pattern becomes more dispersed by 2014, where the built-up area grows across all zones, with notable increases in both the 2–4 km and 4–6 km bands (Pi = 0.568 and 0.167, respectively). This outward shift results in a higher entropy of 1.024, indicating moderate sprawl. By 2024, the trend intensifies further: although the 2–4 km zone still dominates (12.99 km2), the outer zones (4–6 km and 6–8 km) also show gradual increases in built-up area, reflecting a more polycentric and diffused urban expansion pattern. Consequently, the entropy value reaches 1.012, the highest among the four years, signifying increased spatial dispersion of built-up growth and a more sprawled urban form. The table demonstrates a clear temporal transition from a compact city structure in 1994 toward progressively dispersed and decentralized urban growth over three decades.
The Shannon Entropy Index for four time periods using the formula Hn = −Σ(Pi × ln Pi) and normalized against the theoretical maximum ln(4) = 1.386 to produce values ranging between 0 (perfectly compact) and 1 (maximum dispersal). In 1994, the normalized entropy of 0.596 indicates a moderately compact urban structure, where built-up area was heavily concentrated in the 2–4 km zone. By 2004, the value marginally increased to 0.634, reflecting the beginning of spatial dispersal as development gradually extended into outer zones. The most notable shift occurred by 2014, when entropy reached 0.739, signaling a clear transition toward dispersed and fragmented urban growth across all buffer zones. In 2024, the value stands at 0.730, remaining high and confirming a persistently sprawled urban form, though the marginal decline from 2014 suggests a slight stabilization in the rate of dispersal rather than a reversal of the sprawl trend (Table 7).
Table 7.
Normalized Shannon Entropy Index of Moradabad City (1994–2024).
The increase in Shannon’s entropy from 0.60 in 1994 to 0.73 in 2024 indicates a progressive increase in the spatial dispersion of built-up areas across Moradabad. Higher entropy values suggest that urban development became increasingly distributed beyond the traditional urban core and expanded into peripheral areas. However, entropy values alone do not fully capture the complexity of urban morphology, fragmentation patterns, or the spatial configuration of development. Therefore, the observed increase should be interpreted as evidence of increasing dispersion rather than definitive proof of urban sprawl. The entropy results are supported by complementary indicators, including directional growth analysis, UEII, and urban growth typology classification, which collectively indicate a transition towards a more dispersed and fragmented urban structure.
It should also be noted that the entropy values can vary with the spatial units used for analysis. Slightly different entropy estimates may result from different alternative zoning systems, buffer distances, or administrative boundaries. While the buffer-based framework used in this study provides a consistent basis for temporal comparison, the entropy values reported here should be interpreted as relative indicators of urban dispersion rather than as absolute measures of urban sprawl intensity. “Hn” is the raw Shannon entropy and the normalized version (Hn/ln4) is used for cross-study comparison.
4.5. Monitoring Urban Expansion Intensity Index (UEII)
The UEII was monitored for three consecutive decades 1994–2004, 2004–2014, and 2014–2024, which measures how rapidly the built-up area expanded during each period relative to the total urban extent. The UEII is a normalized indicator where higher values represent faster and more intensive urban expansion, while lower values indicate slower, more moderate growth. Between 1994 and 2004, the UEII value of 0.45 reflects a relatively moderate rate of urban expansion, consistent with early-stage growth concentrated mainly in the inner and middle zones of the city.
During 2004–2014, the index rises sharply to 1.13, indicating the most intense phase of urban development across the entire study period. This decade corresponds to rapid outward growth, increased land conversion, and more dispersed spatial patterns, as seen in the expansion of built-up areas into outer zones. In the final decade, 2014–2024, the UEII value decreases to 0.85, suggesting that although urban growth remains strong, the pace has slightly slowed compared to the previous decade. This period likely reflects a shift toward more structured development or saturation within certain zones (Table 8).
Table 8.
Urban Expansion Intensity Index of Moradabad city (1994–2024).
4.6. Correlation Analysis and Indicator Robustness Assessment
The Pearson correlation matrix was calculated among the four study periods to test for possible collinearity among the quantitative indicators used in this study (built-up area, Shannon’s entropy, UEII, and sprawl type proportions) (Table 9). The results reveal a strong positive correlation between built-up area and entropy (r = 0.98). This is not surprising since both indicators measure the magnitude and spatial dispersion of urban expansion respectively, and therefore point to complementary rather than redundant aspects of the same phenomenon. The UEII is moderately correlated with built-up area (r = 0.61), confirming that expansion intensity and absolute area are related but not interchangeable measures. Among sprawl typologies, ribbon development is strongly negatively correlated with built-up area and entropy (r = −0.97 and −0.99 respectively), suggesting that as overall urban expansion became more intense, the proportional predominance of ribbon growth decreased in relative terms, consistent with increasing spatial diversification of growth patterns. It is recognized that with only four observational points over time, formal multicollinearity diagnostics such as Variance Inflation Factor (VIF) cannot be performed in a statistically valid manner; however, the correlation matrix validates that each indicator captures a different analytical dimension of urban sprawl dynamics, collectively providing a more comprehensive characterization of expansion than any single metric alone (Table 10).
Table 9.
Correlation test among indicators from 1994 to 2024.
Table 10.
Pearson correlation matrix (r values) among indicators from 1994 to 2024.
5. Discussion
Moradabad has transitioned from a compact, core-dominated city in 1994 to a dispersed, corridor-oriented, and increasingly sprawled urban system by 2024, with particularly rapid growth during the 2004–2014 period and a strong directional bias toward the eastern and southeastern sectors. The dominance of ribbon and leapfrog development, rising Shannon’s entropy, and high UEII values align with national and global evidence that medium-sized cities represent key frontiers of unsustainable urban sprawl, with significant implications for land, infrastructure, and environmental management.
This study reveals a substantial transformation in Moradabad’s urban landscape. A nearly 2.5-fold increase in built-up area from 9.02 km2 in 1994 to 23.86 km2 in 2024. The urban expansion observed in Moradabad is not solely a result of population growth and infrastructure development but is also linked to India’s broader economic and urban development policies. Since the economic reforms of the 1990s, Moradabad’s brassware and export-oriented industries have attracted labor migration and commercial investment, accelerating urban growth. In addition, improvements in transportation networks and urban infrastructure have encouraged expansion, particularly in the eastern and southeastern sectors, where industrial and commercial activities are concentrated. The peak UEII value (1.13) during 2004–2014, along with the outward shift in built-up areas into the 4–6 km and 6–8 km buffer zones, indicates a decisive transition from a compact urban form toward dispersed peri-urbanization [76]. Ward-wise results show classic core saturation and peripheral boom: inner wards (e.g., Lajpat Nagar, Gandhi Nagar, Katghar) exhibit marginal or even declining built-up area in the last decade, while outer wards such as Paipatpura Lakri, Bheemather, Lal Nagri, and Khushalpur record the most intense expansion. This spatial hierarchy is consistent with theoretical models of monocentric cores evolving into increasingly polycentric metropolitan structures [37,77].
Distance and direction analysis confirms a strong anisotropy of urban growth, with continued intensification in the east and southeast corridors (E, ENE, ESE, SE, SSE), driven largely by transportation networks and industrial service nodes. By contrast, the northern and northeastern sectors (N, NE, NNE, NNW) experienced a moderate but steady expansion suggesting a controlled outward growth and gradual urban consolidation. The intensities of expansion were generally lower in the western and southwestern sectors (W, WNW, WSW, SW) apart from some localized increases in a few buffer zones, denoting relatively weaker development pressure and limited urban attraction. The results indicate that urban growth has happened in all the 16 directional sectors, but with large differences in magnitude and intensity, resulting in a highly directional and spatially uneven pattern of urban expansion. In contrast, relatively subdued expansion in the western and northwestern directions suggests the influence of land suitability constraints, weaker infrastructure, or institutional and policy-related factors. These findings are consistent with studies from other Indian cities, where infrastructure and economic corridors strongly shape urban sprawl patterns [78]. The quantified growth typologies demonstrate a clear dominance of ribbon and leapfrog development across all study periods, peaking during 2004–2014 and remaining significant thereafter, while infill development contributes only marginally to overall growth. This pattern reflects low-density, corridor-based expansion that fragments agricultural and open land, thereby undermining compact city objectives [37].
The spatial pattern shows that the urban growth of Moradabad is not purely concentric. The concentric buffer framework provides a standardized basis for measuring urban expansion with increasing distance from the city center, but the results show strong directional heterogeneity. The expansion is concentrated along major transportation corridors and industrial clusters, particularly in the directions of SSW, SSE, ESE, and NE, whereas development in other directions has been limited due to the Ramganga River and existing land use constraints. Therefore, the radial scheme must be understood as a measure strategy and not as a proof that the urban growth of the city is a merely radial process.
While the spatial distribution of urban expansion is consistent with major transportation corridors, industrial clusters and rapidly developing peripheral areas, the present study does not statistically quantify the influence of these factors on urban growth. Therefore, these relationships should be considered as contextual spatial associations, not as evidence of causality. Future studies should include explanatory variables such as distance to major roads, industrial estates, railway corridors, population density, and socio-economic variables into regression-based or spatial statistical frameworks (e.g., ordinary least squares (OLS), geographically weighted regression (GWR), spatial lag/error models, geographically weighted correlation, or machine learning approaches) to quantify the relative contribution of individual growth drivers to urban expansion.
Shannon’s entropy increased from 0.60 to 0.73 over the study period, clearly indicating a shift from a concentrated 2–4 km urban ring to a more dispersed, polycentric urban structure, with substantial development in the 4–6 km and 6–8 km zones. The patterns of urban sprawl that have been observed have important environmental and socio-economic implications that extend beyond the physical expansion. The conversion of agricultural land and open spaces into built-up surfaces can contribute to the formation of urban heat islands, increased surface runoff, reduced ecological connectivity and greater pressure on urban infrastructure and public services. Dispersed development patterns also generally increase transportation demand, energy consumption, and related carbon emissions. These challenges are directly relevant to Sustainable Development Goal 11 (Sustainable Cities and Communities), which focuses on inclusive, resilient and sustainable urban development. The findings therefore underscore the need for compact growth strategies, infill development, and integrated land use planning to support sustainable urbanization in Moradabad. Similar increases in entropy have been interpreted as strong indicators of urban sprawl in other Indian and global contexts, reinforcing the conclusion that Moradabad’s growth has become increasingly decentralized [34]. Furthermore, high classification accuracy (overall accuracy exceeding 93% and Kappa coefficient up to 0.93), along with robust user’s and producer’s accuracies for the urban class, indicate that the derived land use patterns are reliable for temporal analysis. These results are consistent with established practices in Landsat-based urban studies [79].
Observed patterns of urban expansion have potential implications for urban sustainability, as dispersed growth, increasing fragmentation and peripheral expansion may impact on infrastructure efficiency, land consumption and environmental quality. However, the present study does not directly assess sustainability indicators such as green space availability, urban heat island intensity, ecosystem services, carbon emissions or SDG-related metrics. The sustainability implications should be therefore seen as potential planning considerations rather than the direct results shown by the analysis. Future research including environmental and socio-economic indicators may lead to a more holistic evaluation of urban sustainability in Moradabad.
5.1. Comparison with Existing Research and Global Context
Multi-temporal remote sensing studies across Indian cities (e.g., Lucknow, Raipur, Bhubaneswar, and Dehradun) show rapid increases in built-up areas since the 1990s, with sprawl typologies typically dominated by edge expansion, followed by leapfrog and ribbon growth. In Moradabad, by contrast, ribbon and leapfrog growth exceed edge expansion for much of the study period, indicating a more corridor-oriented and fragmented development pattern than that reported in several other medium-sized Indian cities [49,77]. Analyses from cities such as Gandhinagar and Hyderabad, as well as hill towns in India, similarly document the loss of open and green spaces, conversion of agricultural land, and uneven infrastructure provision as key consequences of unplanned outward expansion. Moradabad’s ward-level evidence showing rapid growth in peripheral wards and stagnation in constrained core areas, aligns with these broader national trends, with fringe zones likely experiencing infrastructure deficits and service lags relative to built-up expansion [80,81]. Globally, ribbon and leapfrog development are widely recognized as archetypal forms of urban sprawl that produce discontinuous, low-density urban fabrics, thereby increasing dependence on private vehicles and raising infrastructure costs. The persistence of these patterns in Moradabad over three decades parallels international experiences in North America, Europe, and rapidly growing Asian regions, where such forms are associated with higher energy consumption, longer commuting distances, and fragmented ecosystems [82]. The application of Shannon’s entropy, distance and direction-based matrices, and expansion intensity indices in Moradabad is consistent with contemporary methodological frameworks for quantifying urban form and sprawl dynamics in developing-country contexts. Similar combinations of entropy and expansion indices have been widely used to examine how remotely sensed urban growth trajectories interact with demographic and policy drivers [34,83]. In order to place the findings in a wider comparative perspective, the major sprawl indicators of Moradabad were compared with published studies of small and medium-sized cities across the world. The entropy range observed in Moradabad (0.60–0.78) is similar to the values reported for similar tier-II Indian cities such as Ajmer (0.52–0.71) and Purulia (0.55–0.79) [34,84], and medium-sized cities in North Africa (Tripoli: 0.58–0.81) and Turkey (Samsun: 0.61–0.82) [66,85]. This confirms that the transition from moderate to dispersed urban form in Moradabad is consistent with the trajectory of rapidly industrializing medium-sized cities in developing economies. The UEII peak value of 1.13 in 2004–2014 is in the high-speed expansion category and is similar to the values reported for satellite cities of Shanghai (0.85–1.45) and mountain cities in China (0.45–1.92) [74,75], showing that the expansion intensity of Moradabad is consistent with medium-to-high growth trajectories demonstrated in Asian urban contexts. The dominant form of growth is edge expansion, followed by leapfrog and ribbon growth, which is in agreement with findings from Ajmer, Asmara and Samsun, where edge growth is always the largest component of total expansion in cities with pronounced core–periphery gradients. The relatively low and fluctuating contribution of infill across all periods (0.22–5.85%) also aligns with comparable studies, where infill development remains limited in cities lacking strong densification policies or compact city planning frameworks.
5.2. Implications for Sustainable Development
The dominance of ribbon and leapfrog development, coupled with rising entropy, implies increased infrastructure and service delivery costs, longer travel distances, and higher per capita energy consumption and transport-related emissions. These trends conflict with sustainable urban development goals in India. Evidence from other Indian metropolitan regions indicates that such sprawl contributes to air pollution, loss of agricultural land, and ecosystem degradation, thereby undermining both food security and climate resilience [86]. Peripheral wards experiencing rapid but fragmented growth are likely to face deficiencies in water supply, sanitation, solid waste management, and public transportation, as observed in uneven urban expansion around Delhi and other cities. This spatial inequality can exacerbate socio-economic vulnerability, with low-income populations often pushed into poorly serviced and hazard-prone peri-urban areas [87,88]. Continued expansion into outer radial zones (4–8 km) risks the irreversible conversion of productive agricultural land and natural flood buffers. This pattern aligns with national-level assessments linking urban sprawl to increased flood risk, reduced groundwater recharge, and intensified urban heat island effects. Since the eastern and southeastern sectors of Moradabad have a high concentration of urban growth, spatial planning initiatives should be targeted at these high-growth corridors through controlled zoning and urban growth boundaries. The peri-urban belt of 4–6 km where rapid conversion of open land is taking place, should be earmarked for planned residential and mixed-use development with adequate infrastructure. The western and southwestern areas are low-growth areas and can be maintained as green buffers and open spaces to maintain ecological balance and prevent dispersed sprawl. Also, development along major transport corridors should be guided by transit-oriented planning so as to reduce ribbon and leapfrog expansion and promote compact growth in urban areas [86,89]. The limited contribution of infill development indicates underutilization of inner-city and brownfield land parcels, which could otherwise support compact, transit-oriented development. Promoting mixed-use redevelopment and higher-density infill in already serviced areas would reduce pressure on peri-urban land and improve alignment with Sustainable Development Goal 11 (Sustainable Cities and Communities) [77,90].
5.3. Limitations of the Study
The analysis relies on medium-resolution satellite imagery from the Landsat program, with a spatial resolution of 30 m. While widely used, such data may lead to the misclassification of narrow linear features, small buildings, and heterogeneous mixed pixels, particularly in dense informal settlements or traditional urban cores. Some degree of confusion between built-up areas, bare soil, and high-albedo non-urban surfaces may persist despite high overall and Kappa accuracy values [91]. One limitation of this study is the potential influence of residual cloud cover, haze and atmospheric variability within multi-temporal Landsat imagery. Although images were selected during the dry season with a low cloud cover, some slight effects of the atmosphere may have affected the spectral reflectance and caused some local classification uncertainties, especially in urban–rural transition zones. These effects were, however, minimized by image pre-processing, use of NDBI, MNDWI and SAVI indices, SVM classification and rigorous accuracy assessment. The overall classification accuracies were high (85–94%), suggesting that cloud-related uncertainties did not affect the overall results much. The classification scheme is limited to two broad categories (urban and non-urban) in the quantitative analysis, which restricts insights into internal land use heterogeneity, such as distinctions among residential, industrial, commercial, and institutional built-up areas. This limitation reduces the ability to associate specific growth forms (e.g., industrial corridors) with particular environmental or socio-economic impacts [83]. The study primarily adopts a physical spatial perspective, with limited integration of demographic, economic, and regulatory data (e.g., ward-level population, income, zoning regulations, building bylaws, and land market information). Consequently, it becomes challenging to disentangle the relative influence of market forces, planning interventions, and infrastructure investments on the observed spatial patterns [76]. Furthermore, metrics such as Shannon’s entropy and the Urban Expansion Intensity Index (UEII) provide aggregate measures of sprawl intensity but do not capture qualitative dimensions such as urban design quality, street connectivity, or micro-scale livability. These aspects are increasingly emphasized in global discussions on “good density” versus “undesirable sprawl” [77,92]. Through the four decadal time points used in this study, formal inferential significance tests (e.g., t-tests or ANOVA) are not statistically appropriate. Instead, robustness of the findings was based on convergent evidence across multiple measures. The same urban expansion trend is confirmed by the uniformly increasing built-up area (9.02–23.86 km2), increasing entropy values (0.60–0.78) and the UEII peak during 2004–2014. The UEII peak (1.13) is also supported by the largest increase in built-up area (+7.37 km2), the highest ribbon and leapfrog development, and the greatest entropy increase (ΔEn = +0.10), which clearly indicates an intensified growth phase. Entropy trends were also stable for raw and normalized values, confirming robustness of temporal patterns. These results, taken together, provide strong evidence for the reliability of the conclusions of the study about the magnitude, direction and phases of urban sprawl in Moradabad. Future studies with annual time series data may permit formal statistical trend testing.
A further limitation of this study is that the drivers to urban expansion were interpreted qualitatively using ancillary information on transportation infrastructure, industrial development and demographic trends rather than tested using quantitative statistical models. The study therefore identifies spatial correspondence between patterns of urban growth and these contextual factors, but does not establish causal relationships. Future research needs to integrate remotely sensed datasets of urban expansion with explanatory spatial variables and employ regression analysis, spatial association statistics, geographically weighted regression, and proximity-based modeling to quantify the magnitude and significance of individual drivers of urban growth.
5.4. Future Research Directions
Future research should integrate higher-resolution optical imagery (e.g., Landsat program, Sentinel-2, and commercial datasets) and, where feasible, Synthetic Aperture Radar (SAR) data to refine built-up extraction, distinguish building typologies, and better capture vertical growth and informal urban morphologies. Object-based and deep learning classification approaches can further improve the detection of small and linear features, particularly in dense urban cores and mixed-use peri-urban areas [79,89]. Spatial growth metrics should be coupled with socio-economic and demographic data at the ward level (e.g., census variables, household surveys, and land price data) to model how income, tenure, land markets, and planning instruments influence specific growth typologies (edge, ribbon, leapfrog, and infill). Such integration would enable a more comprehensive assessment of equity, affordability, and exposure to environmental risks [76,83]. The analytical framework can be extended to incorporate environmental indicators such as land surface temperature, green space accessibility, flood susceptibility, and air quality proxies. This would help quantify how different urban growth typologies affect climate resilience and ecosystem services, thereby generating actionable insights for mainstreaming nature-based solutions and climate-sensitive zoning strategies [86,93]. Predictive and scenario-based urban growth models (e.g., CA-Markov, SLEUTH, and machine learning approaches) should be developed using observed trends from 1994 to 2024 to simulate alternative futures under compact growth, transit-oriented development, and business-as-usual scenarios. Such models can support urban planning and infrastructure decision-making in Moradabad [76]. Finally, comparative studies with other secondary cities in the Indo-Gangetic Plain and across South Asia would help position Moradabad within broader regional urbanization trajectories and identify transferable best practices for managing ribbon and leapfrog sprawl [34,83].
5.5. Scientific Contribution and Policy Implications
The scientific contribution of the present study is not only on local estimation of urban growth of Moradabad. First, the study emphasizes the importance of integrating different urban sprawl indicators at different spatial scales that allow a simultaneous evaluation of the magnitude, direction, intensity, dispersion and morphological form of urban expansion. Second, the results provide empirical evidence that medium-sized industrial cities can exhibit highly asymmetric urban growth patterns similar to those found in larger metropolitan regions. Third, the research underscores the advantages of integrating ward-level and directional analyses with entropy-based metrics to detect localized growth hot spots that might be missed in city-wide evaluations. Therefore, the proposed framework provides a transferable methodology for monitoring and management of urban sprawl in fast urbanizing cities of India and other developing countries.
5.6. Uncertainty and Limitations of the Analysis
The results of the research are contingent on the accuracy of the urban classification products of Landsat on which all subsequent analyses are based. The classification accuracies ranged from 85.0% in 1994 to 94.0% in 2024. Classification uncertainty can still influence the estimation of built-up area, Shannon’s entropy, Urban Expansion Intensity Index (UEII), directional growth patterns and urban growth typologies. We must account for a number of sources of uncertainty. First, the 30 m spatial resolution of Landsat imagery may not be sufficient to capture small urban features, narrow transportation corridors, scattered settlements or mixed land cover pixels, especially in fast urbanizing fringe areas. The second is that differences in image quality, sensor characteristics and availability of historical reference data may introduce additional uncertainty in the earlier study years. Third, boundary delineation errors in built-up extraction may influence the geometric properties of urban patches and, consequently, the typology classification results. All derived indicators are calculated based on the classified urban extent and thus error propagation is crucial. The misclassification of built-up areas could change the spatial distribution of urban land in buffer zones and therefore the values of Shannon’s entropy and directional growth metrics. Similarly, UEII calculations and proportions of growth typology could be affected by over- or underestimation of urban extent. However, the relatively high classification accuracies, consistent temporal trends across multiple indicators and sensitivity testing of typology thresholds suggest that the major conclusions regarding urban expansion, increasing spatial dispersion and dominant growth processes are robust. Further reduction in the uncertainties could be achieved by combining higher spatial resolution satellite data, object-based image analysis, deep learning classification techniques and formal uncertainty propagation schemes that quantify the effect of classification errors on derived urban sprawl indicators.
Although the spatial analyses show distinct patterns of urban growth and their association with transportation corridors, industrial areas, and population distribution, the study does not quantitatively assess the causal contribution of these factors. Future studies should combine demographic, economic, industrial, infrastructure and migration datasets with spatial modeling techniques to improve our understanding of the drivers of urban growth and urban sprawl.
The pattern of urban growth in Moradabad is similar with the pattern observed in other medium-sized cities of the world. Studies conducted in Karachi, Tripoli, Tshwane and Isfahan have also documented outward expansion, increasing spatial dispersion and a dominance of edge and corridor-oriented development. Similarly to these cities, Moradabad shows a transition from a relatively compact urban growth to a more fragmented and dispersed urban form, as reflected in increasing Shannon’s entropy values and rapid expansion along transportation corridors. However, unlike in many large metropolitan regions where growth is heavily influenced by metropolitan decentralization, urban growth in Moradabad is more closely tied to industrial concentration, labor migration and the development of peri-urban residential areas.
The results emphasize the importance of medium-sized cities as major centers of urban transformation and their contribution to regional land use change. The combination of built-up expansion analysis, directionality of growth, Shannon’s entropy, UEII and urban growth typologies provides a flexible framework for understanding urban sprawl dynamics in fast-growing cities. Thus, the study is not only of local relevance for urban planning, but also for the wider scientific understanding of long-term urban expansion processes in the emerging urban centers of the Global South.
6. Conclusions
The spatio-temporal analysis of Moradabad City from 1994 to 2024 reveals a profound transformation marked by nearly 2.5-fold expansion in built-up area and a transition from compact to dispersed urban morphology. The classification accuracies were satisfactory (overall accuracy from 85% to 94%) but some misclassification errors were observed especially in transitional urban fringe areas. In the early years (1994 and 2004), bare soil, fallow agricultural land and construction sites were sometimes misclassified as built-up areas due to the similarity of their spectral characteristics. In the same way non-urban land was sometimes mapped as sparse residential settlements with interspersed vegetation. Also, in the industrial areas of Parsakhera and Line Par, classification problems were noted where metal-roofed structures showed spectral response similar to exposed surfaces. The scale of these errors was more evident in the earlier Landsat data, because of the lower image quality and sparse reference data. However, the combination of NDBI, SAVI and MNDWI indices, SVM classification and GPS-based validation for 2024 significantly minimized such uncertainties in later years. Urban growth has been distinctly asymmetric, with intense expansion along eastern and southeastern corridors driven by population pressure, infrastructure development, and economic activity. Ward-wise assessments indicate core saturation, peripheral intensification, and emerging polycentricity, while Shannon’s entropy (0.60) in 1994 to (0.73) by 2024 and the UEII trajectory rising sharply to a peak of 1.13 in 2004–2014 before easing to 0.85 in 2014–2024, confirms an intensified expansion phase followed by moderated growth, yet continuing expansion. Ribbon and leapfrog patterns dominate, underscoring a corridor-oriented, fragmented growth process with limited infill development. The results suggest that the urban expansion in Moradabad has been affected by the interaction of population growth, industrial concentration, transportation accessibility and peripheral land availability. These factors have supported economic development but have also accelerated agricultural land conversion and dispersed urban growth. The observed trends stress the need to align future urban development with SDG 11 through compact growth policies, improved land use management, and promotion of infill development from a sustainability perspective.
The spatial pattern of urban expansion shows a strong influence of industrial concentration, transportation corridors and peripheral land availability. Together, these factors promoted ribbon and leapfrog development, especially in the eastern and southeastern sectors, while infill growth was constrained by limited redevelopment within the urban core. The results imply that future urban planning should promote compact and infill development to reduce fragmented sprawl and improve land use efficiency.
Author Contributions
Conceptualization, M.F. and R.A.F.; methodology, M.F. and R.A.F.; software, M.F.; validation, M.F. and R.A.F.; formal analysis, M.F.; investigation, M.Z. and M.B.; resources, R.A.F., F.F.B.H., M.B. and M.Z.; data curation, M.F.; writing—original draft preparation, M.F. and R.A.F.; writing—review and editing, M.F., F.F.B.H., M.B. and M.Z.; visualization, R.A.F.; supervision, R.A.F.; project administration, M.Z. All authors have read and agreed to the published version of the manuscript.
Funding
This research was funded by Princess Nourah bint Abdulrahman University Researchers Supporting Project number (PNURSP2026R675), Princess Nourah Bint Abdulrahman University, Riyadh, Saudi Arabia.
Data Availability Statement
Data will be made available on request.
Acknowledgments
The authors extend their appreciation to Princess Nourah bint Abdulrahman University Researchers Supporting Project number (PNURSP2026R675), Princess Nourah bint Abdulrahman University, Riyadh, Saudi Arabia. The authors extend their gratitude to the United States Geological Survey (USGS) for granting access to satellite data at no cost. The authors also extend their gratitude to Esri, HERE, Garmin, Intermap, increment P Corp., GEBCO, USGS, FAO, NPS, NRCAN, GeoBase, IGN, Kadaster NL, Ordnance Survey, Esri Japan, METI, Esri China (Hong Kong), © OpenStreetMap contributors, and the GIS User Community for providing Service Layer Credits as base layer for all the Maps. We acknowledge the support of Moradabad Municipal Corporation for providing necessary data and material. We also express the gratitude to the Geospatial Lab at the Department of Geography, Faculty of Science, Aligarh Muslim University, Aligarh. The authors would like to acknowledge the support received from the Interdisciplinary Department of Remote Sensing and GIS Applications at Aligarh Muslim University.
Conflicts of Interest
The authors declare no conflicts of interest.
References
- Stow, D.A.; Hope, A.; McGuire, D.; Verbyla, D.; Gamon, J.; Huemmrich, F.; Houston, S.; Racine, C.; Sturm, M.; Tape, K.; et al. Remote sensing of vegetation and land-cover change in Arctic Tundra Ecosystems. Remote Sens. Environ. 2004, 89, 281–308. [Google Scholar] [CrossRef] [Scilit]
- Fang, C.; Yu, D. Urban agglomeration: An evolving concept of an emerging phenomenon. Landsc. Urban Plan. 2017, 162, 126–136. [Google Scholar] [CrossRef] [Scilit]
- Ramachandra, T.V.; Aithal, B.H.; Sanna, D.D. Insights to urban dynamics through landscape spatial pattern analysis. Int. J. Appl. Earth Obs. Geoinf. 2012, 18, 329–343. [Google Scholar] [CrossRef] [Scilit]
- Kundu, A. Trends and Processes of Urbanisation in India; Human Settlements Group, International Institute for Environment and Development: London, UK; Population and Development Branch, United Nations Population Fund: New York, NY, USA, 2011. [Google Scholar]
- United Nations, Department of Economic and Social Affairs, Population Division. World Urbanization Prospects, U.N. 2014 Revision; United Nations Department of Economic and Social Affairs/Population Division: New York, NY, USA, 2015. [Google Scholar]
- Zhang, Q.; Wang, J.; Peng, X.; Gong, P.; Shi, P. Urban built-up land change detection with road density and spectral information from multi-temporal Landsat TM data. Int. J. Remote Sens. 2002, 23, 3057–3078. [Google Scholar] [CrossRef] [Scilit]
- Arfanuzzaman, M.; Dahiya, B. Sustainable urbanization in Southeast Asia and beyond: Challenges of population growth, land use change, and environmental health. Growth Change 2019, 50, 725–744. [Google Scholar] [CrossRef] [Scilit]
- Office of the Registrar General & Census Commissioner. Primary Census Abstract, Census of India 2011: Uttar Pradesh, Moradabad District; Office of the Registrar General & Census Commissioner: New Delhi, India, 2011.
- Bhagat, R.B. Urbanisation in India: A Demographic Reappraisal; International Institute for Population Sciences: Mumbai, India, 2018. [Google Scholar]
- Mendiratta, P.; Kumar, K.V.R.K.R. Assessment of Mumbai to Serve as a Smart Global Mega City. In Smart Global Megacities: Collaborative Research: Tokyo, Mumbai, New York, Hong Kong-Shenzhen, Kolkata; Springer: Singapore, 2022; pp. 251–284. [Google Scholar] [CrossRef] [Scilit]
- Sarvestani, M.S.; Ibrahim, A.L.; Kanaroglou, P. Three decades of urban growth in the city of Shiraz, Iran: A remote sensing and geographic information systems application. Cities 2011, 28, 320–329. [Google Scholar] [CrossRef] [Scilit]
- Mcmichael, A.J. The urban environment and health in a world of increasing globalization: Issues for developing countries. Bull. World Health Organ. 2000, 78, 1117–1126. [Google Scholar] [PubMed]
- Ji, W.; Ma, J.; Twibell, R.W.; Underhill, K. Characterizing urban sprawl using multi-stage remote sensing images and landscape metrics. Comput. Environ. Urban Syst. 2006, 30, 861–879. [Google Scholar] [CrossRef] [Scilit]
- Visalatchi, A.; Padmanaban, R. Land Use and Land Cover Mapping and Shore Line Changes Studies in Tuticorin Coastal Area Using Remote Sensing. Int. J. Adv. Earth Sci. Eng. 2012, 1, 1–12. [Google Scholar]
- Yang, J.; Li, J.; Xu, F.; Li, S.; Zheng, M.; Gong, J. Urban development wave: Understanding physical spatial processes of urban expansion from density gradient of new urban land. Comput. Environ. Urban Syst. 2022, 97, 101867. [Google Scholar] [CrossRef] [Scilit]
- Grigorescu, I.; Mitrică, B.; Mocanu, I.; Ticană, N. Urban sprawl and residential development in the Romanian Metropolitan Areas. Rom. J. Geogr. 2012, 56, 43–59. [Google Scholar]
- Padmanaban, R. Modelling the Transformation of Land use and Monitoring and Mapping of Environmental Impact with the help of Remote Sensing and GIS. Int. J. Adv. Altern. Energy Environ. Ecol. 2012, 1, 36–38. [Google Scholar]
- Herold, M.; Goldstein, N.C.; Clarke, K.C. The spatiotemporal form of urban growth: Measurement, analysis and modeling. Remote Sens. Environ. 2003, 86, 286–302. [Google Scholar] [CrossRef] [Scilit]
- World Economic Forum. Global Risks 2015 10th Edition Insight Report. 2015. Available online: https://www.weforum.org (accessed on 16 June 2026).
- World Economic Forum. The Global Risks Report 2016 11th Edition Insight Report. 2016. Available online: http://wef.ch/risks2016 (accessed on 16 June 2026).
- The World Economic Forum. The Global Risks Report 2017; World Economic Forum: Geneva, Switzerland, 2017. [Google Scholar]
- Datt, S.K. Urban Development in the Metropolitan Shadow: A Case Study from Haryana; Inter India Publication: New Delhi, India, 1985. [Google Scholar]
- Bhatta, B.; Saraswati, S.; Bandyopadhyay, D. Urban sprawl measurement from remote sensing data. Appl. Geogr. 2010, 30, 731–740. [Google Scholar] [CrossRef] [Scilit]
- Zhang, B. Study on Urban Growth Management in China; Xinhua: Beijing, China, 2004. [Google Scholar]
- Macie, E.; Moll, G. Trees and exurban sprawl. Am. For. 1989, 95, 61–64. [Google Scholar]
- Stoel, T.B. Reining in Urban Sprawl. Environment 1999, 41, 6–11. [Google Scholar] [CrossRef] [Scilit]
- Silambarasan, K.; Vinaya, M.S.; Sureshbabu, S. Urban sprawl mapping and landuse change detection in and around Udupi town: A remote sensing based approach. Int. J. Sci. Res. Eng. Technol. 2014, 2, 815–820. [Google Scholar]
- Amitabh, K. Trends and patterns of urbanization and their economic implications. India Infrastruct. Rep. 2006, 29, 27–41. [Google Scholar]
- Punia, M.; Singh, L. Entropy Approach for Assessment of Urban Growth: A Case Study of Jaipur, INDIA. J. Indian Soc. Remote Sens. 2012, 40, 231–244. [Google Scholar] [CrossRef] [Scilit]
- Dhali, M.K.; Chakraborty, M.; Sahana, M. Assessing spatio-temporal growth of urban sub-centre using Shannon’s entropy model and principle component analysis: A case from North 24 Parganas, lower Ganga River Basin, India. Egypt. J. Remote Sens. Space Sci. 2019, 22, 25–35. [Google Scholar] [CrossRef] [Scilit]
- Directorate of Census Operation. Census of India 2011 West Bengal Series-20 Part XII-A District Census Handbook Puruliya Village and Town Directory Directorate of Census Operations West Bengal. In District Census Handbook; West Bengal Govt Press Quarters: Kolkata, India, 1965. [Google Scholar]
- Directorate of Census Operation. Census of India 2011 West Bengal Series-20 Part XII-A District Census Handbook Kolkata Village and Town Directory Directorate of Census Operations West Bengal; Directorate of Census Operation: Calcutta, India, 1982.
- Weber, C.; Puissant, A. Urbanization pressure and modeling of urban growth: Example of the Tunis Metropolitan Area. Remote Sens. Environ. 2003, 86, 341–352. [Google Scholar] [CrossRef] [Scilit]
- Chettry, V. Geospatial measurement of urban sprawl using multi-temporal datasets from 1991 to 2021: Case studies of four Indian medium-sized cities. Environ. Monit. Assess. 2022, 194, 860. [Google Scholar] [CrossRef] [Scilit] [PubMed]
- Nandi, S.; Gamkhar, S. Urban challenges in India: A review of recent policy measures. Habitat Int. 2013, 39, 55–61. [Google Scholar] [CrossRef] [Scilit]
- Qiu, C.; Schmitt, M.; Geiß, C.; Chen, T.-H.K.; Zhu, X.X. A framework for large-scale mapping of human settlement extent from Sentinel-2 images via fully convolutional neural networks. ISPRS J. Photogramm. Remote Sens. 2020, 163, 152–170. [Google Scholar] [CrossRef] [Scilit] [PubMed]
- Harvey, R.O.; Clark, W.A.V. The Nature and Economics of Urban Sprawl. 1965. Available online: https://www.jstor.org/stable/3144884 (accessed on 16 June 2026).
- Wilson, E.H.; Hurd, J.D.; Civco, D.L.; Prisloe, M.P.; Arnold, C. Development of a geospatial model to quantify, describe and map urban growth. Remote Sens. Environ. 2003, 86, 275–285. [Google Scholar] [CrossRef] [Scilit]
- Sudhira, H.S.; Ramachandra, T.V. Urban sprawl: Metrics, dynamics and modelling using GIS. Int. J. Appl. Earth Obs. Geoinf. 2004, 5, 29–39. [Google Scholar] [CrossRef] [Scilit]
- Jat, M.K.; Garg, P.K.; Khare, D. Monitoring and modelling of urban sprawl using remote sensing and GIS techniques. Int. J. Appl. Earth Obs. Geoinf. 2008, 10, 26–43. [Google Scholar] [CrossRef] [Scilit]
- Baqa, M.F.; Chen, F.; Lu, L.; Qureshi, S.; Tariq, A.; Wang, S.; Jing, L.; Hamza, S.; Li, Q. Monitoring and modeling the patterns and trends of urban growth using urban sprawl matrix and CA-Markov model: A case study of Karachi, Pakistan. Land 2021, 10, 700. [Google Scholar] [CrossRef] [Scilit]
- Magidi, J.; Ahmed, F. Assessing urban sprawl using remote sensing and landscape metrics: A case study of City of Tshwane, South Africa (1984–2015). Egypt. J. Remote Sens. Space Sci. 2019, 22, 335–346. [Google Scholar] [CrossRef] [Scilit]
- Sahana, M.; Hong, H.; Sajjad, H. Analyzing urban spatial patterns and trend of urban growth using urban sprawl matrix: A study on Kolkata urban agglomeration, India. Sci. Total Environ. 2018, 628–629, 1557–1566. [Google Scholar] [CrossRef] [Scilit] [PubMed]
- Xu, X.; Min, X. Quantifying spatiotemporal patterns of urban expansion in China using remote sensing data. Cities 2013, 35, 104–113. [Google Scholar] [CrossRef] [Scilit]
- Alsharif, A.A.A.; Pradhan, B. Urban Sprawl Analysis of Tripoli Metropolitan City (Libya) Using Remote Sensing Data and Multivariate Logistic Regression Model. J. Indian Soc. Remote Sens. 2014, 42, 149–163. [Google Scholar] [CrossRef] [Scilit]
- Rabiei-Dastjerdi, H.; Amini, S.; McArdle, G.; Homayouni, S. City-region or city? That is the question: Modelling sprawl in Isfahan using geospatial data and technology. GeoJournal 2023, 88, 135–155. [Google Scholar] [CrossRef] [Scilit]
- Mohimi, A.; Esmaeily, A. Spatiotemporal analysis of urban sprawl using a multi-technique approach and remote sensing satellite imagery from 1990 to 2020: Kerman/Iran. Environ. Dev. Sustain. 2024, 26, 18033–18068. [Google Scholar] [CrossRef] [Scilit]
- Yan, Y.; Ju, H.; Zhang, S.; Jiang, W. Spatiotemporal Patterns and Driving Forces of Urban Expansion in Coastal Areas: A Study on Urban Agglomeration in the Pearl River Delta, China. Sustainability 2019, 12, 191. [Google Scholar] [CrossRef] [Scilit]
- Chettry, V. Monitoring and Characterizing Urban Sprawl in Raipur Urban Agglomeration, India from 2005 to 2015 using Geospatial Techniques. In IOP Conference Series: Earth and Environmental Science; Institute of Physics: London, UK, 2022. [Google Scholar] [CrossRef] [Scilit]
- Kumar, S.; Devi, K.; Kumar, M.; Bhadwal, S.; Chauhan, N.; Verma, N.K. Spatio-Temporal Changes in Metropolitan Cities of India: A Comparative Study of Delhi and Mumbai. In Remote Sensing and Geographic Information Systems for Policy Decision Support; Springer Nature: Singapore, 2022; pp. 265–282. [Google Scholar] [CrossRef] [Scilit]
- Shahfahad; Rihan, M.; Naikoo, M.W.; Ali, M.A.; Usmani, T.M.; Rahman, A. Urban Heat Island Dynamics in Response to Land-Use/Land-Cover Change in the Coastal City of Mumbai. J. Indian Soc. Remote Sens. 2021, 49, 2227–2247. [Google Scholar] [CrossRef] [Scilit]
- Rukhsana; Hasnine, M. Population Pressure and Urban Sprawl in Kolkata Metropolitan Area. In Habitat, Ecology and Ekistics: Case Studies of Human-Environment Interactions in India; Springer International Publishing: Cham, Switzerland, 2021; pp. 163–178. [Google Scholar] [CrossRef] [Scilit]
- United Nations. World Economic and Social Survey 2013: Sustainable Development Challenges; United Nations: New York, NY, USA, 2013. [Google Scholar]
- US Geological Survey. USGS Earth Explorer; US Government: Washington, DC, USA. Available online: https://earthexplorer.usgs.gov/ (accessed on 16 June 2026).
- Nagar Nigam Moradabad. Moradabad Nagar Nigam. Nagar Nigam. Available online: https://www.nagarnigammoradabad.in/HOME/index.php (accessed on 16 June 2026).
- Fonji, S.F.; Taff, G.N. Using satellite data to monitor land-use land-cover change in North-eastern Latvia. SpringerPlus 2014, 3, 61. [Google Scholar] [PubMed]
- Rousta, I.; Sarif, O.; Gupta, R.D.; Olafsson, H.; Ranagalage, M.; Murayama, Y.; Zhang, H.; Mushore, T.D. Spatiotemporal analysis of land use/land cover and its effects on surface urban heat Island using landsat data: A case study of Metropolitan City Tehran (1988–2018). Sustainability 2018, 10, 4433. [Google Scholar] [CrossRef] [Scilit]
- Xu, H. Extraction of Urban Built-up Land Features from Landsat Imagery Using a Thematicoriented Index Combination Technique. Photogramm. Eng. Remote Sens. 2007, 73, 1381–1391. [Google Scholar] [CrossRef] [Scilit]
- Zha, Y.; Gao, J.; Ni, S. Use of normalized difference built-up index in automatically mapping urban areas from TM imagery. Int. J. Remote Sens. 2003, 24, 583–594. [Google Scholar] [CrossRef] [Scilit]
- Xu, H. Modification of normalised difference water index (NDWI) to enhance open water features in remotely sensed imagery. Int. J. Remote Sens. 2006, 27, 3025–3033. [Google Scholar] [CrossRef] [Scilit]
- Huete, A.R. A soil-adjusted vegetation index (SAVI). Remote Sens. Environ. 1988, 25, 295–309. [Google Scholar] [CrossRef] [Scilit]
- Liu, X.; Li, X.; Chen, Y.; Tan, Z.; Li, S.; Ai, B. A new landscape index for quantifying urban expansion using multi-temporal remotely sensed data. Landsc. Ecol. 2010, 25, 671–682. [Google Scholar] [CrossRef] [Scilit]
- Li, C.; Li, J.; Wu, J. Quantifying the speed, growth modes, and landscape pattern changes of urbanization: A hierarchical patch dynamics approach. Landsc. Ecol. 2013, 28, 1875–1888. [Google Scholar] [CrossRef] [Scilit]
- Shukla, A.; Jain, K. Modeling Urban Growth Trajectories and Spatiotemporal Pattern: A Case Study of Lucknow City, India. J. Indian Soc. Remote Sens. 2019, 47, 139–152. [Google Scholar] [CrossRef] [Scilit]
- Tewolde, M.G.; Cabral, P. Urban Sprawl Analysis and Modeling in Asmara, Eritrea. Remote Sens. 2011, 3, 2148–2165. [Google Scholar] [CrossRef] [Scilit]
- Ozturk, D. Assessment of urban sprawl using Shannon’s entropy and fractal analysis: A case study of Atakum, Ilkadim and Canik (Samsun, Turkey). J. Environ. Eng. Landsc. Manag. 2017, 25, 264–276. [Google Scholar] [CrossRef] [Scilit]
- Verzosa, L.C.O.; Gonzalez, R.M. Remote Sensing, Geographic Information Systems and Shannon’s Entropy: Measuring Urban Sprawl in a Mountainous Environment. In Proceedings of the SPRS TC VII Symposium–100 Years ISPRS, Vienna, Austria, 5–7 July 2010. [Google Scholar]
- Kumar, J.; Biswas, B.; Walker, S. Multi-temporal LULC Classification using Hybrid Approach and Monitoring Built-up Growth with Shannon’s Entropy for a Semi-arid Region of Rajasthan, India. J. Geol. Soc. India 2020, 95, 626–635. [Google Scholar] [CrossRef] [Scilit]
- Li, X.; Yeh, A.G. Calibration of cellular automata by using neural networks for the simulation of complex urban systems. Environ. Plan. A 2001, 33, 1445–1462. [Google Scholar] [CrossRef] [Scilit]
- Sun, D.; Kafatos, M. Note on the NDVI-LST relationship and the use of temperature-related drought indices over North America. Geophys. Res. Lett. 2007, 34, L24406. [Google Scholar] [CrossRef] [Scilit]
- Mosammam, H.M.; Nia, J.T.; Khani, H.; Teymouri, A.; Kazemi, M. Monitoring land use change and measuring urban sprawl based on its spatial forms. Egypt. J. Remote Sens. Space Sci. 2017, 20, 103–116. [Google Scholar] [CrossRef] [Scilit]
- Alsharif, A.A.A.; Pradhan, B.; Mansor, S.; Zulhaidi, H.; Shafri, M. Urban Expansion Assessment by Using Remotely Sensed Data and the Relative Shannon Entropy Model in Gis: A Case Study OF Tripoli, Libya. Theor. Empir. Res. Urban Manag. 2015, 10, 55–71. [Google Scholar]
- Hu, Z.-L.; Du, P.-J.; Da-Zhi, G. Analysis of Urban Expansion and Driving Forces in Xuzhou City Based on Remote Sensing. J. China Univ. Min. Technol. 2007, 17, 267–271. [Google Scholar] [CrossRef] [Scilit]
- Li, X.; Zhang, L.; Liang, C. A GIS-based buffer gradient analysis on spatiotemporal dynamics of urban expansion in Shanghai and its major satellite cities. Procedia Environ. Sci. 2010, 2, 1139–1156. [Google Scholar] [CrossRef] [Scilit]
- Ren, P.; Gan, S.; Yuan, X.; Zong, H.; Xie, X. Spatial Expansion and Sprawl Quantitative Analysis of Mountain City Built-Up Area. In Geo-Informatics in Resource Management and Sustainable Ecosystem: International Symposium, GRMSE 2013, Wuhan, China, 8–10 November 2013; Proceedings, Part I; Springer: Berlin/Heidelberg, Germany, 2013; pp. 166–176. [Google Scholar] [CrossRef] [Scilit]
- Dhanaraj, K.; Angadi, D.P. Urban expansion quantification from remote sensing data for sustainable land-use planning in Mangaluru, India. Remote Sens. Appl. 2021, 23, 100602. [Google Scholar] [CrossRef] [Scilit]
- Pradhan, K.; Rajabifard, A.; Aryal, J.; Crompvoets, J. Dissecting multidimensional morphology of urban sprawl: Framework for policy intervention. Cities 2025, 157, 105627. [Google Scholar] [CrossRef] [Scilit]
- Saini, V.; Tiwari, R.K. Remote sensing based time-series analysis for monitoring urban sprawl: A case study of Chandigarh capital region. J. Geom. 2019, 13, 94–97. [Google Scholar]
- Badlani, B.; Patel, A.N.; Patel, K.; Kalubarme, M.H. Urban Growth Monitoring using Remote Sensing and Geo-Informatics: Case Study of Gandhinagar, Gujarat State (India). Int. J. Geosci. 2017, 8, 563–576. [Google Scholar] [CrossRef]
- Thakur, A. Sustainable urban policy development in hill cities: A case study of Shimla’s LULC changes and urban regeneration efforts. Urban Gov. 2025, 5, 342–362. [Google Scholar] [CrossRef] [Scilit]
- Jain, M.; Dimri, A.P.; Niyogi, D. Urban Sprawl Patterns and Processes in Delhi from 1977 to 2014 Based on Remote Sensing and Spatial Metrics Approaches. Earth Interact. 2016, 20, 1–29. [Google Scholar] [CrossRef] [Scilit]
- Heim, C.E. Leapfrogging, urban sprawl, and growth management: Phoenix, 1950–2000. Am. J. Econ. Sociol. 2001, 60, 245–283. [Google Scholar] [CrossRef] [Scilit]
- El Garouani, A.; Mulla, D.J.; El Garouani, S.; Knight, J. Analysis of urban growth and sprawl from remote sensing data: Case of Fez, Morocco. Int. J. Sustain. Built Environ. 2017, 6, 160–169. [Google Scholar] [CrossRef] [Scilit]
- Jat, M.K.; Garg, P.K.; Khare, D. Modelling of urban growth using spatial analysis techniques: A case study of Ajmer city (India). Int. J. Remote Sens. 2008, 29, 543–567. [Google Scholar] [CrossRef] [Scilit]
- Al-sharif, A.A.A.; Pradhan, B. Monitoring and predicting land use change in Tripoli Metropolitan City using an integrated Markov chain and cellular automata models in GIS. Arab. J. Geosci. 2014, 7, 4291–4301. [Google Scholar] [CrossRef] [Scilit]
- Sarkar, S.; Bhattacharyya, T. Environmentally Sustainable Development of Urban Settlements in India: A Framework for Development of Indicators. Curr. World Environ. 2015, 10, 121–142. [Google Scholar] [CrossRef] [Scilit]
- Parmar, S.P.; Chauhan, S.H. The Making of an Unliveable Capital: A Comprehensive Study on Delhi’s Urban Issues; HBRP Publication: Uttar Pradesh, India, 2025. [Google Scholar]
- Singh, V. Level of Urban sprawl and its impact on daily life in India. IJRAR-Int. J. Res. Anal. Rev. 2019, 6, 730–735. [Google Scholar] [CrossRef] [Scilit]
- Sangeetha, S.K.B.; Kushwah, V.S.; Sumangali, K.; Sangeetha, R.; Raja, K.T.; Mathivanan, S.K. Effect of Urbanization Through Land Coverage Classification. Radio Sci. 2023, 58, e2023RS007816. [Google Scholar] [CrossRef] [Scilit]
- Debolina, K.; Arvind, P. Sustainable Urbanisation in India and Delhi: Challenges and Way Forward. In 23rd ASEF Summer University ASEF Education Department; Asia-Europe Foundation’s Education Department: Singapore, 2021. [Google Scholar]
- Moeller, M.S. Remote Sensing for the Monitoring of Urban Growth Patterns. Eng. Environ. Sci. Geogr. 1950, 57, 93–105. [Google Scholar]
- Samuel, B. The Characteristics, Causes, and Consequences of Sprawling Development Patterns in the United States. Nat. Educ. Knowl. 2013, 4, 2. [Google Scholar]
- Bera, B.; Chinta, S.; Mahajan, D.A.; Sailaja, A.; Mahajan, R.; Professor, A. Urbanization and Its Impact on Environmental Sustainability: A Comprehensive Review. J. Harbin Eng. Univ. 2023, 44, 1310–1318. [Google Scholar]
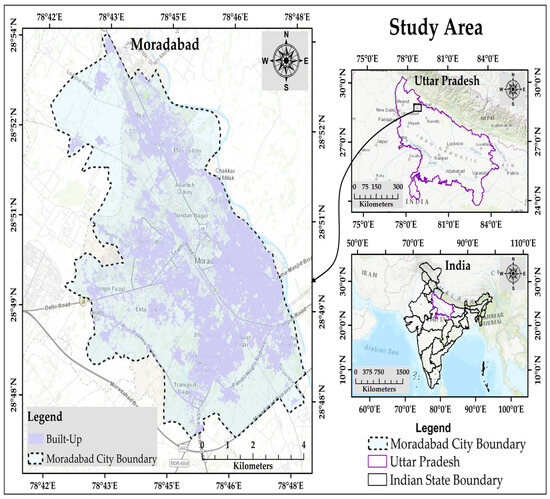
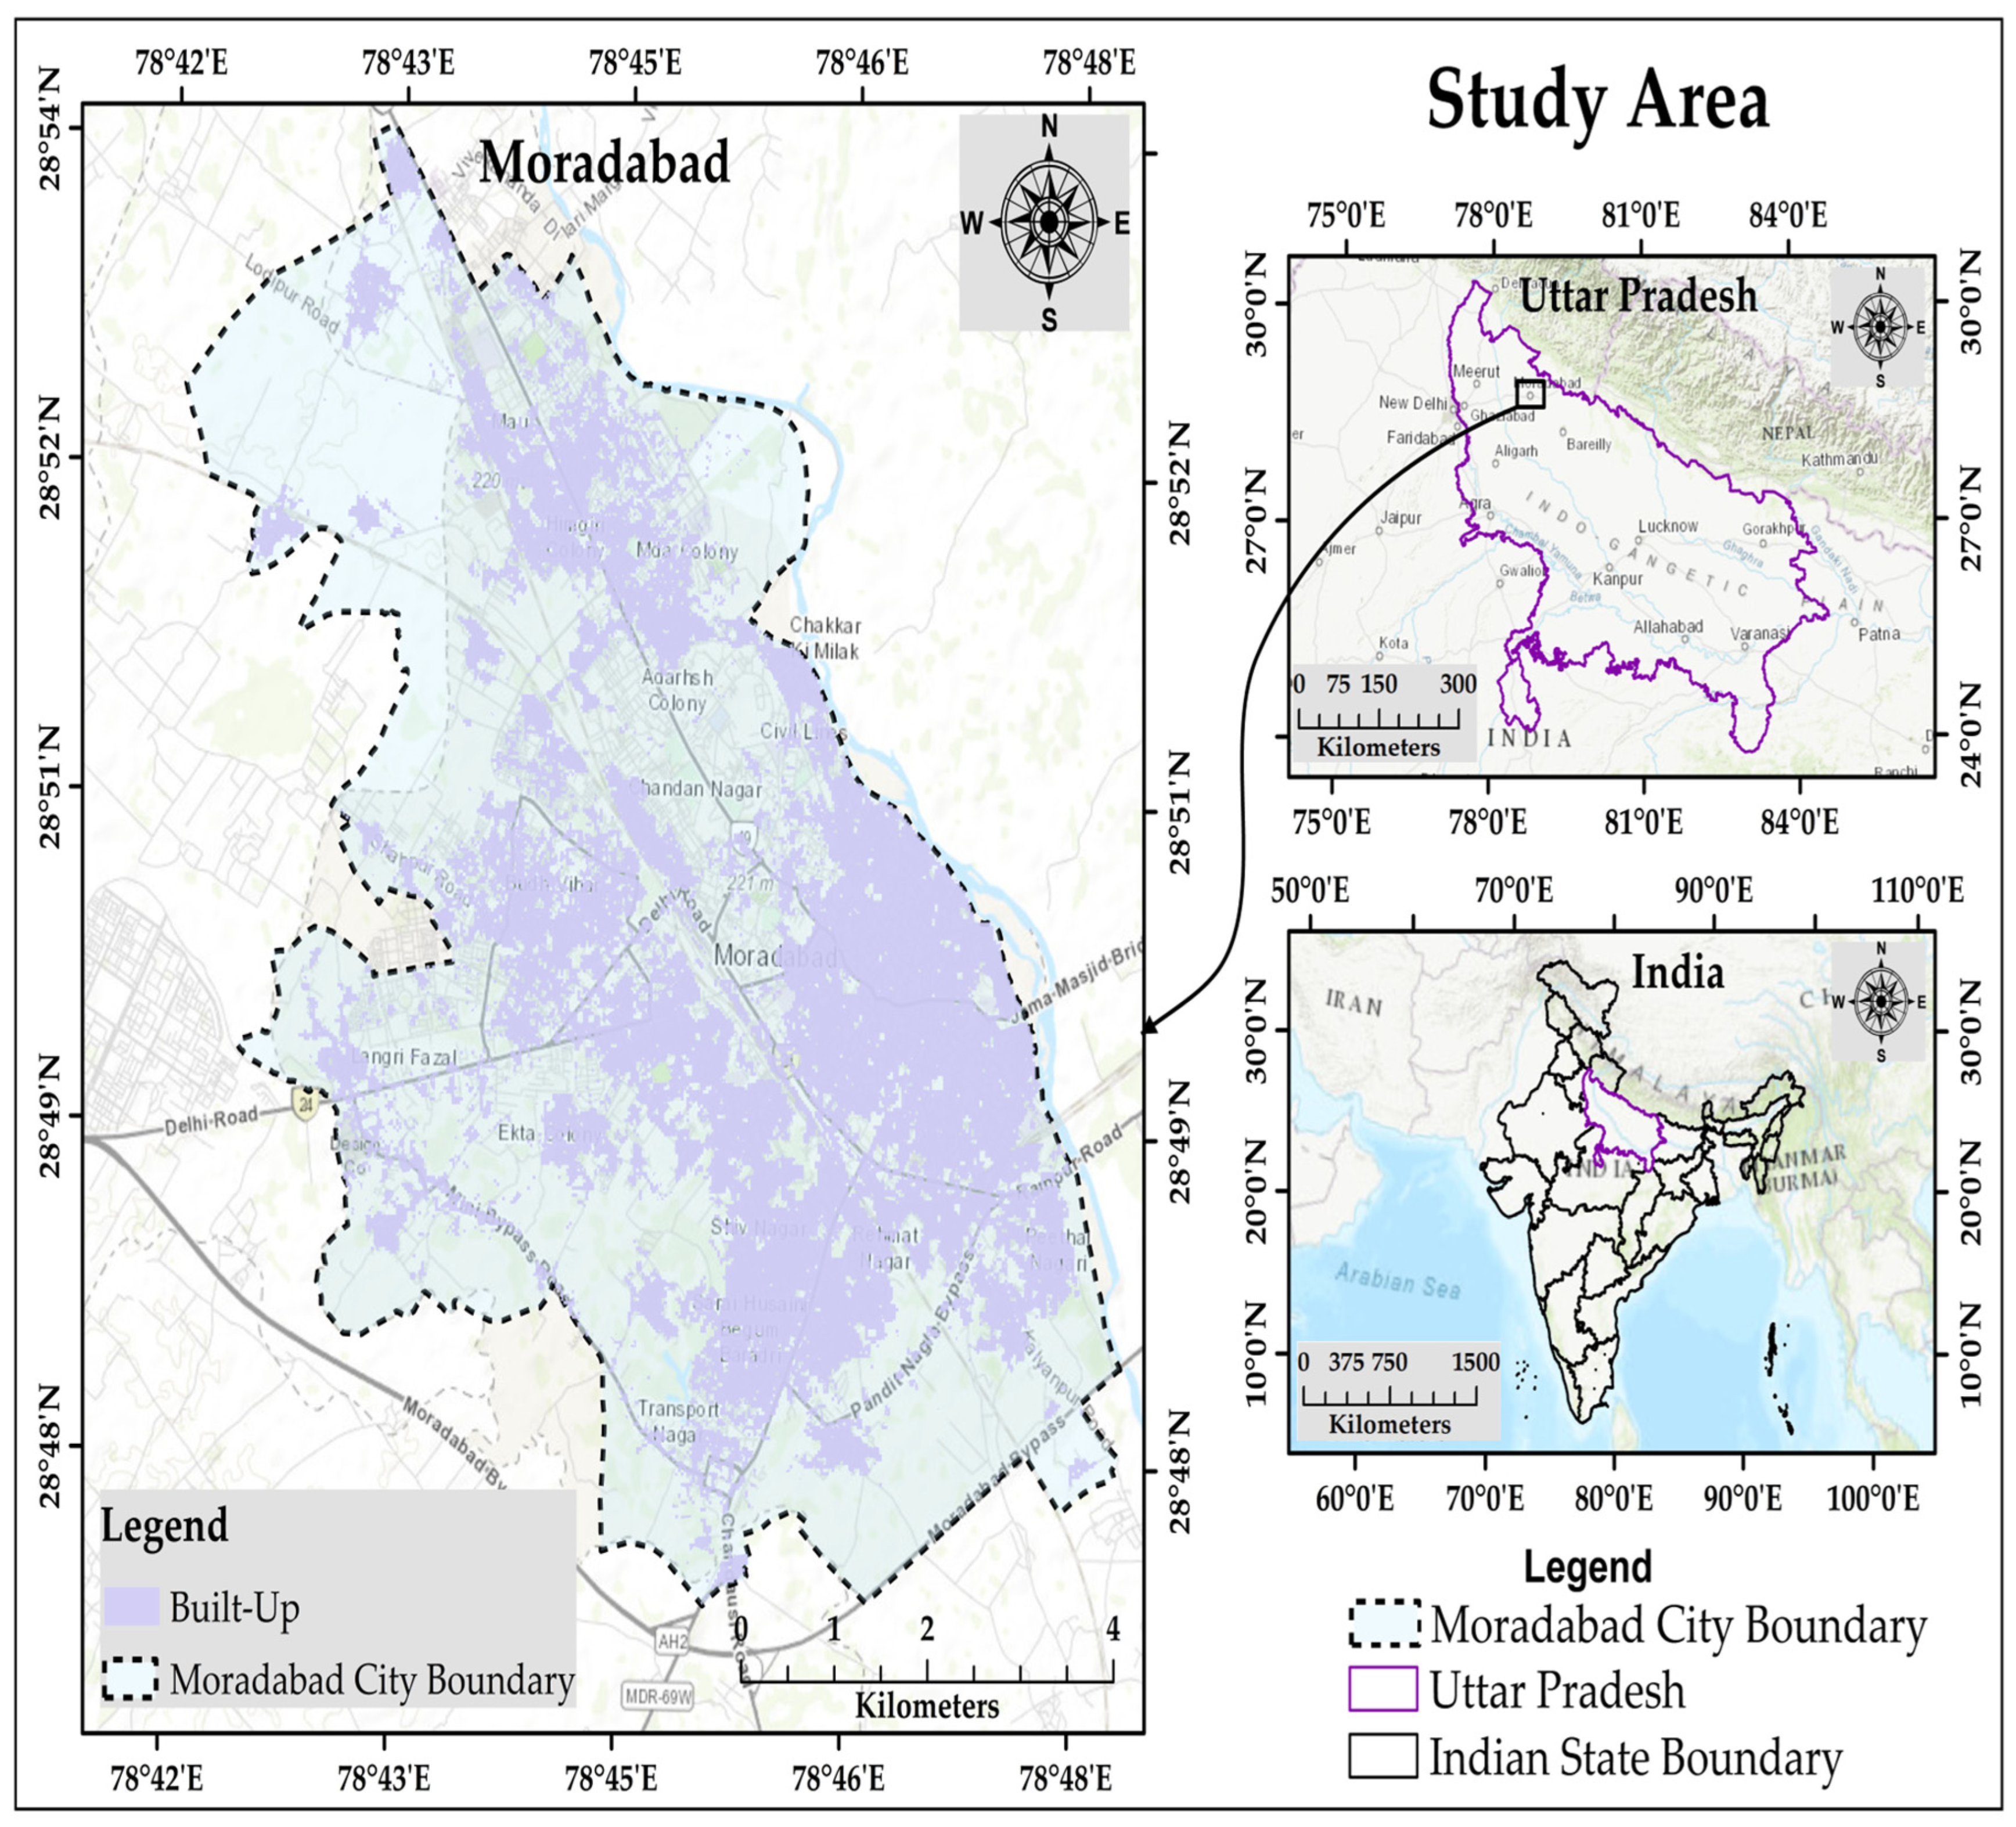
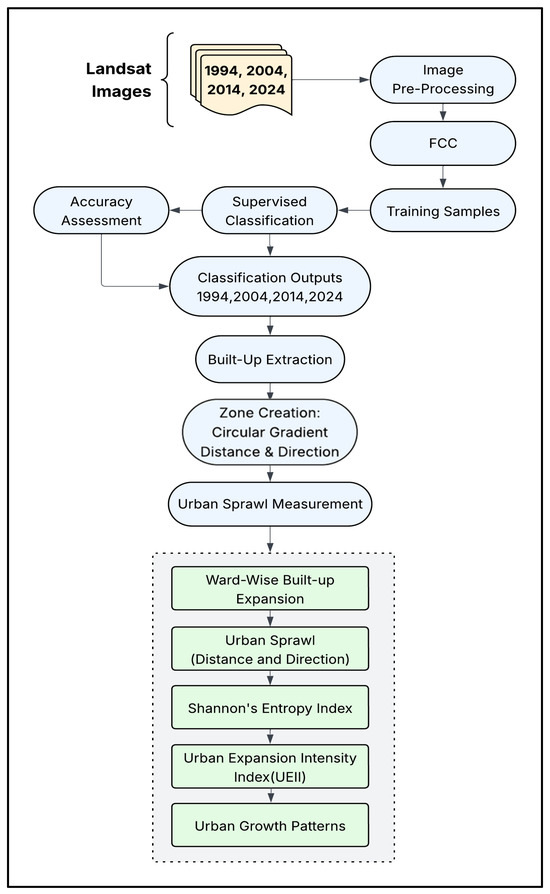
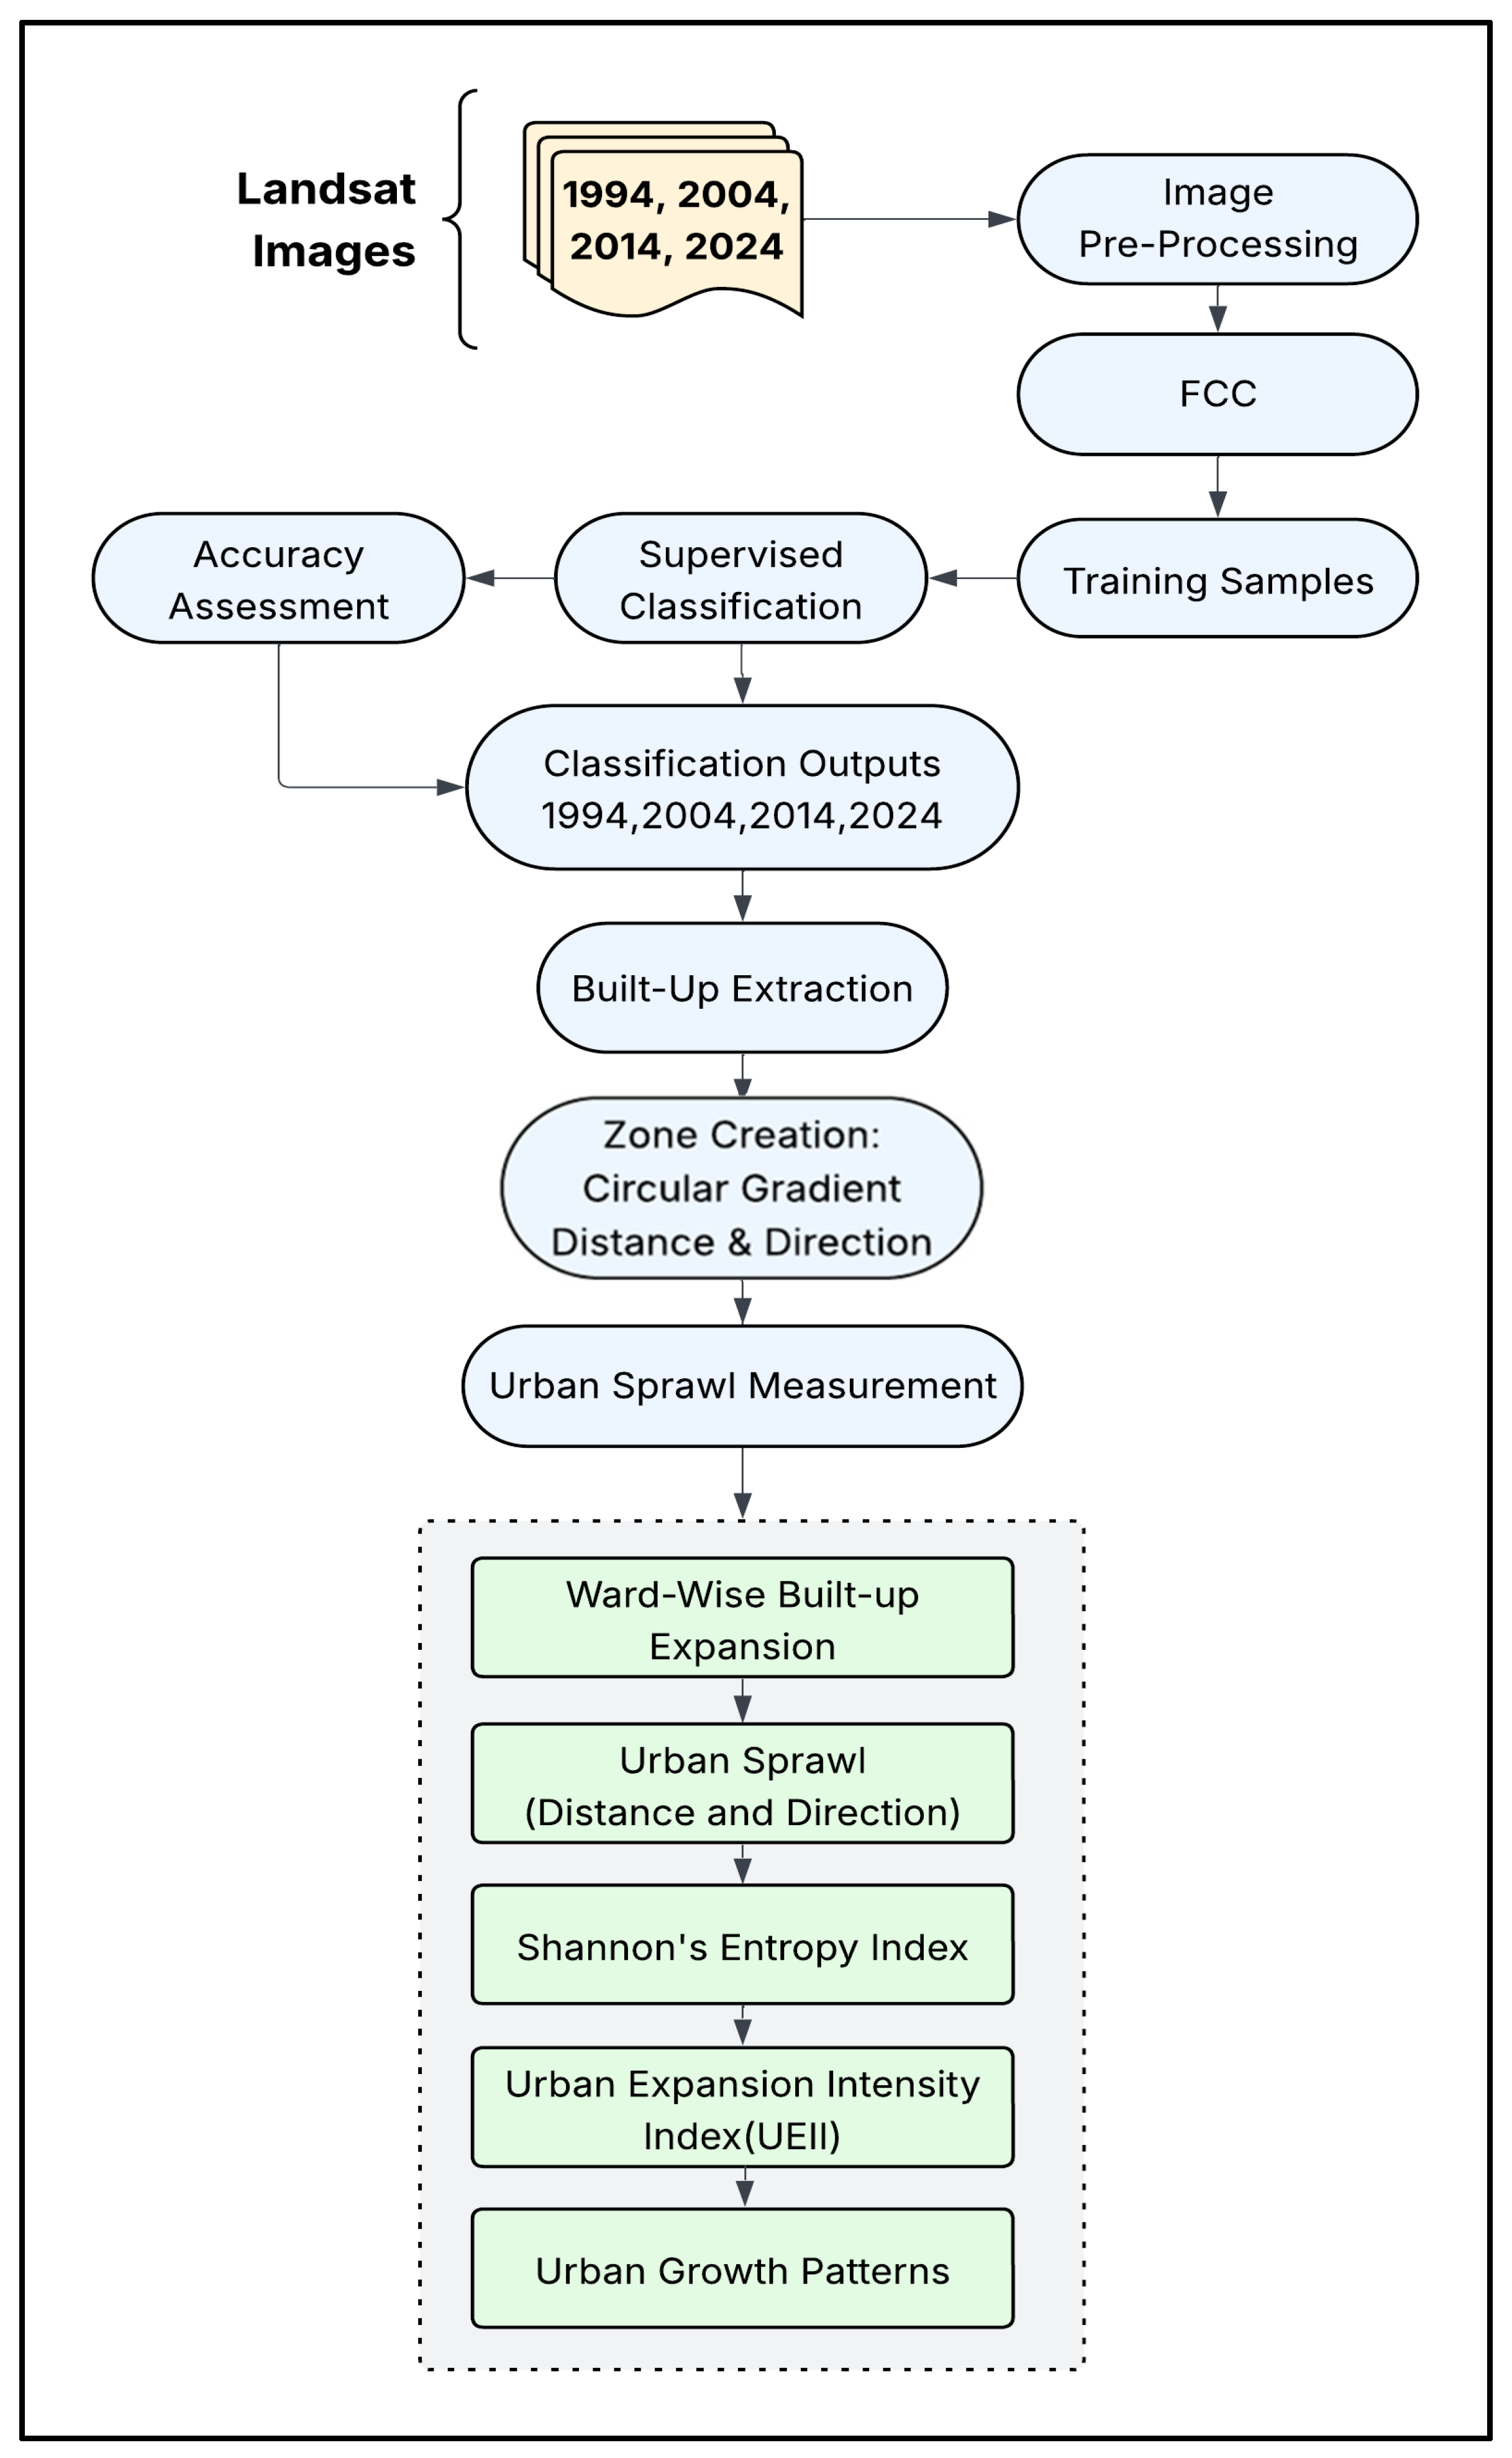
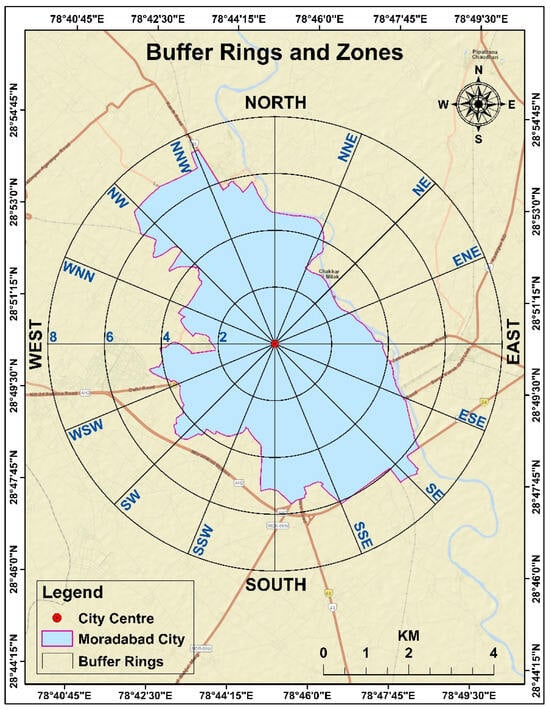
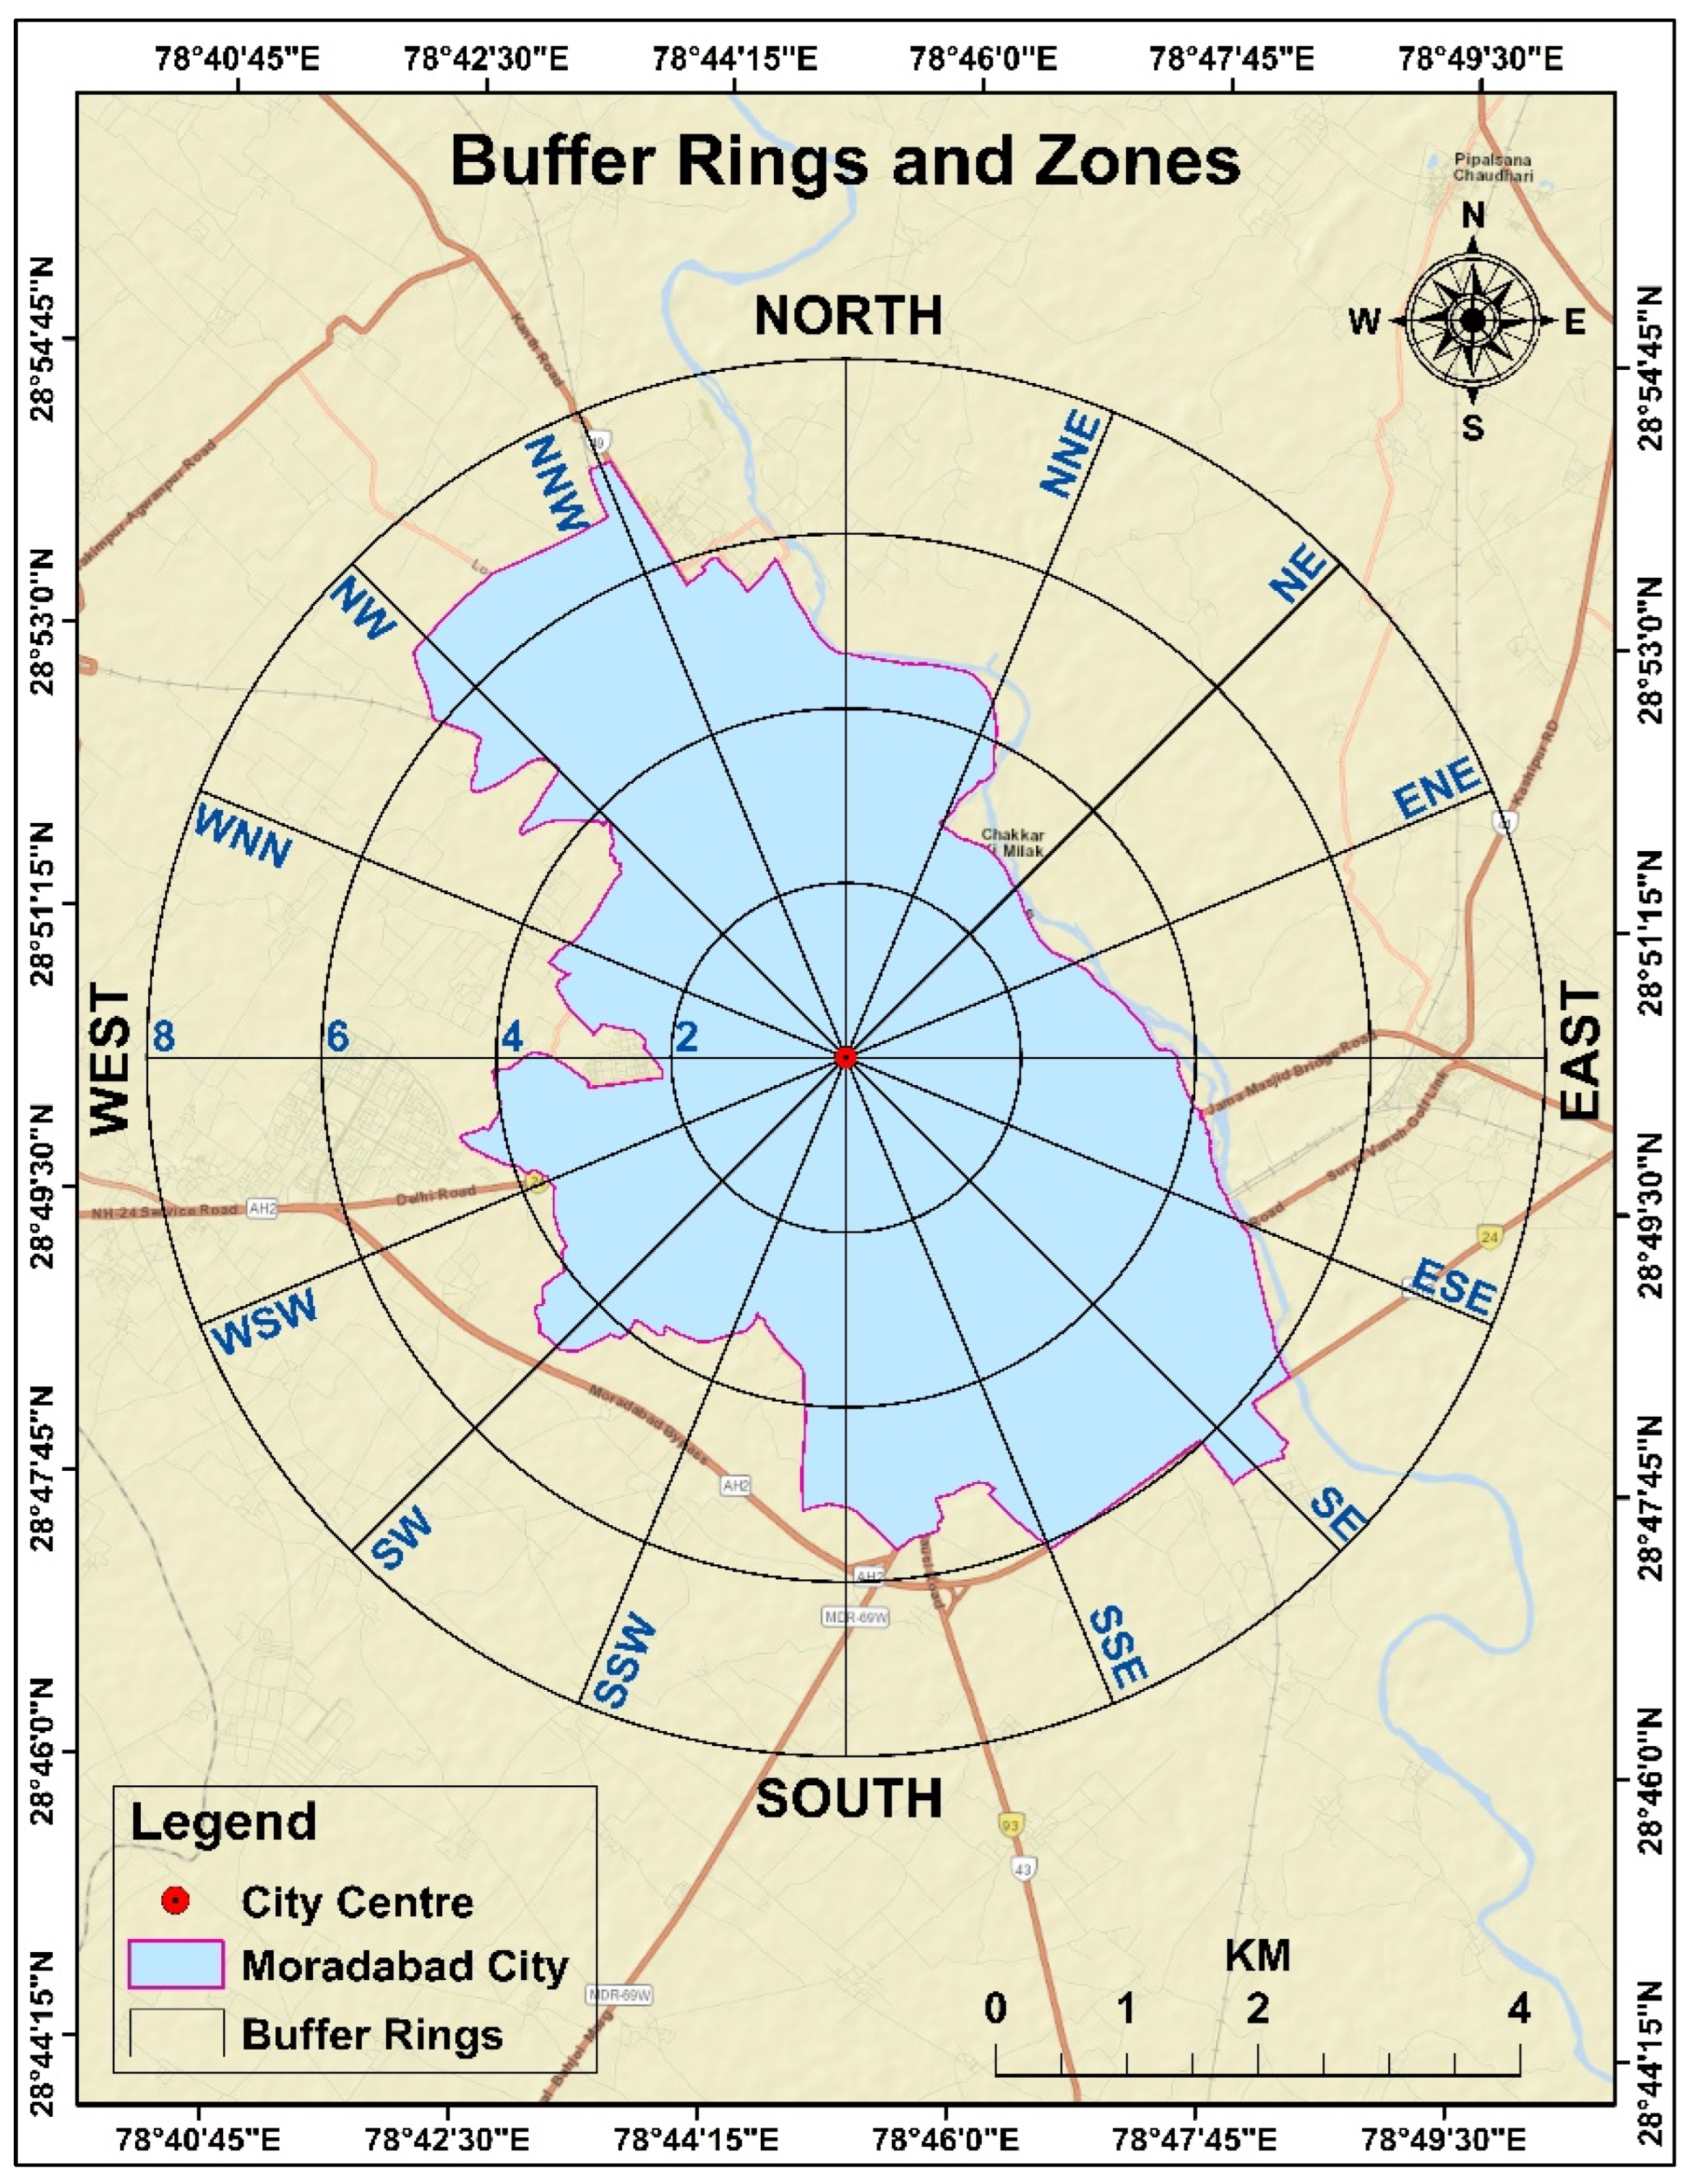
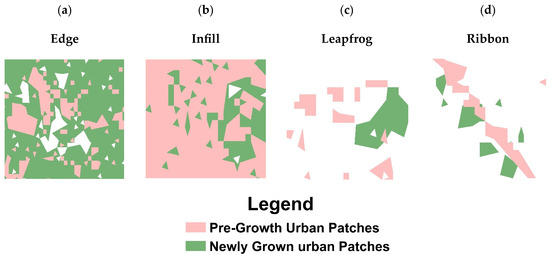
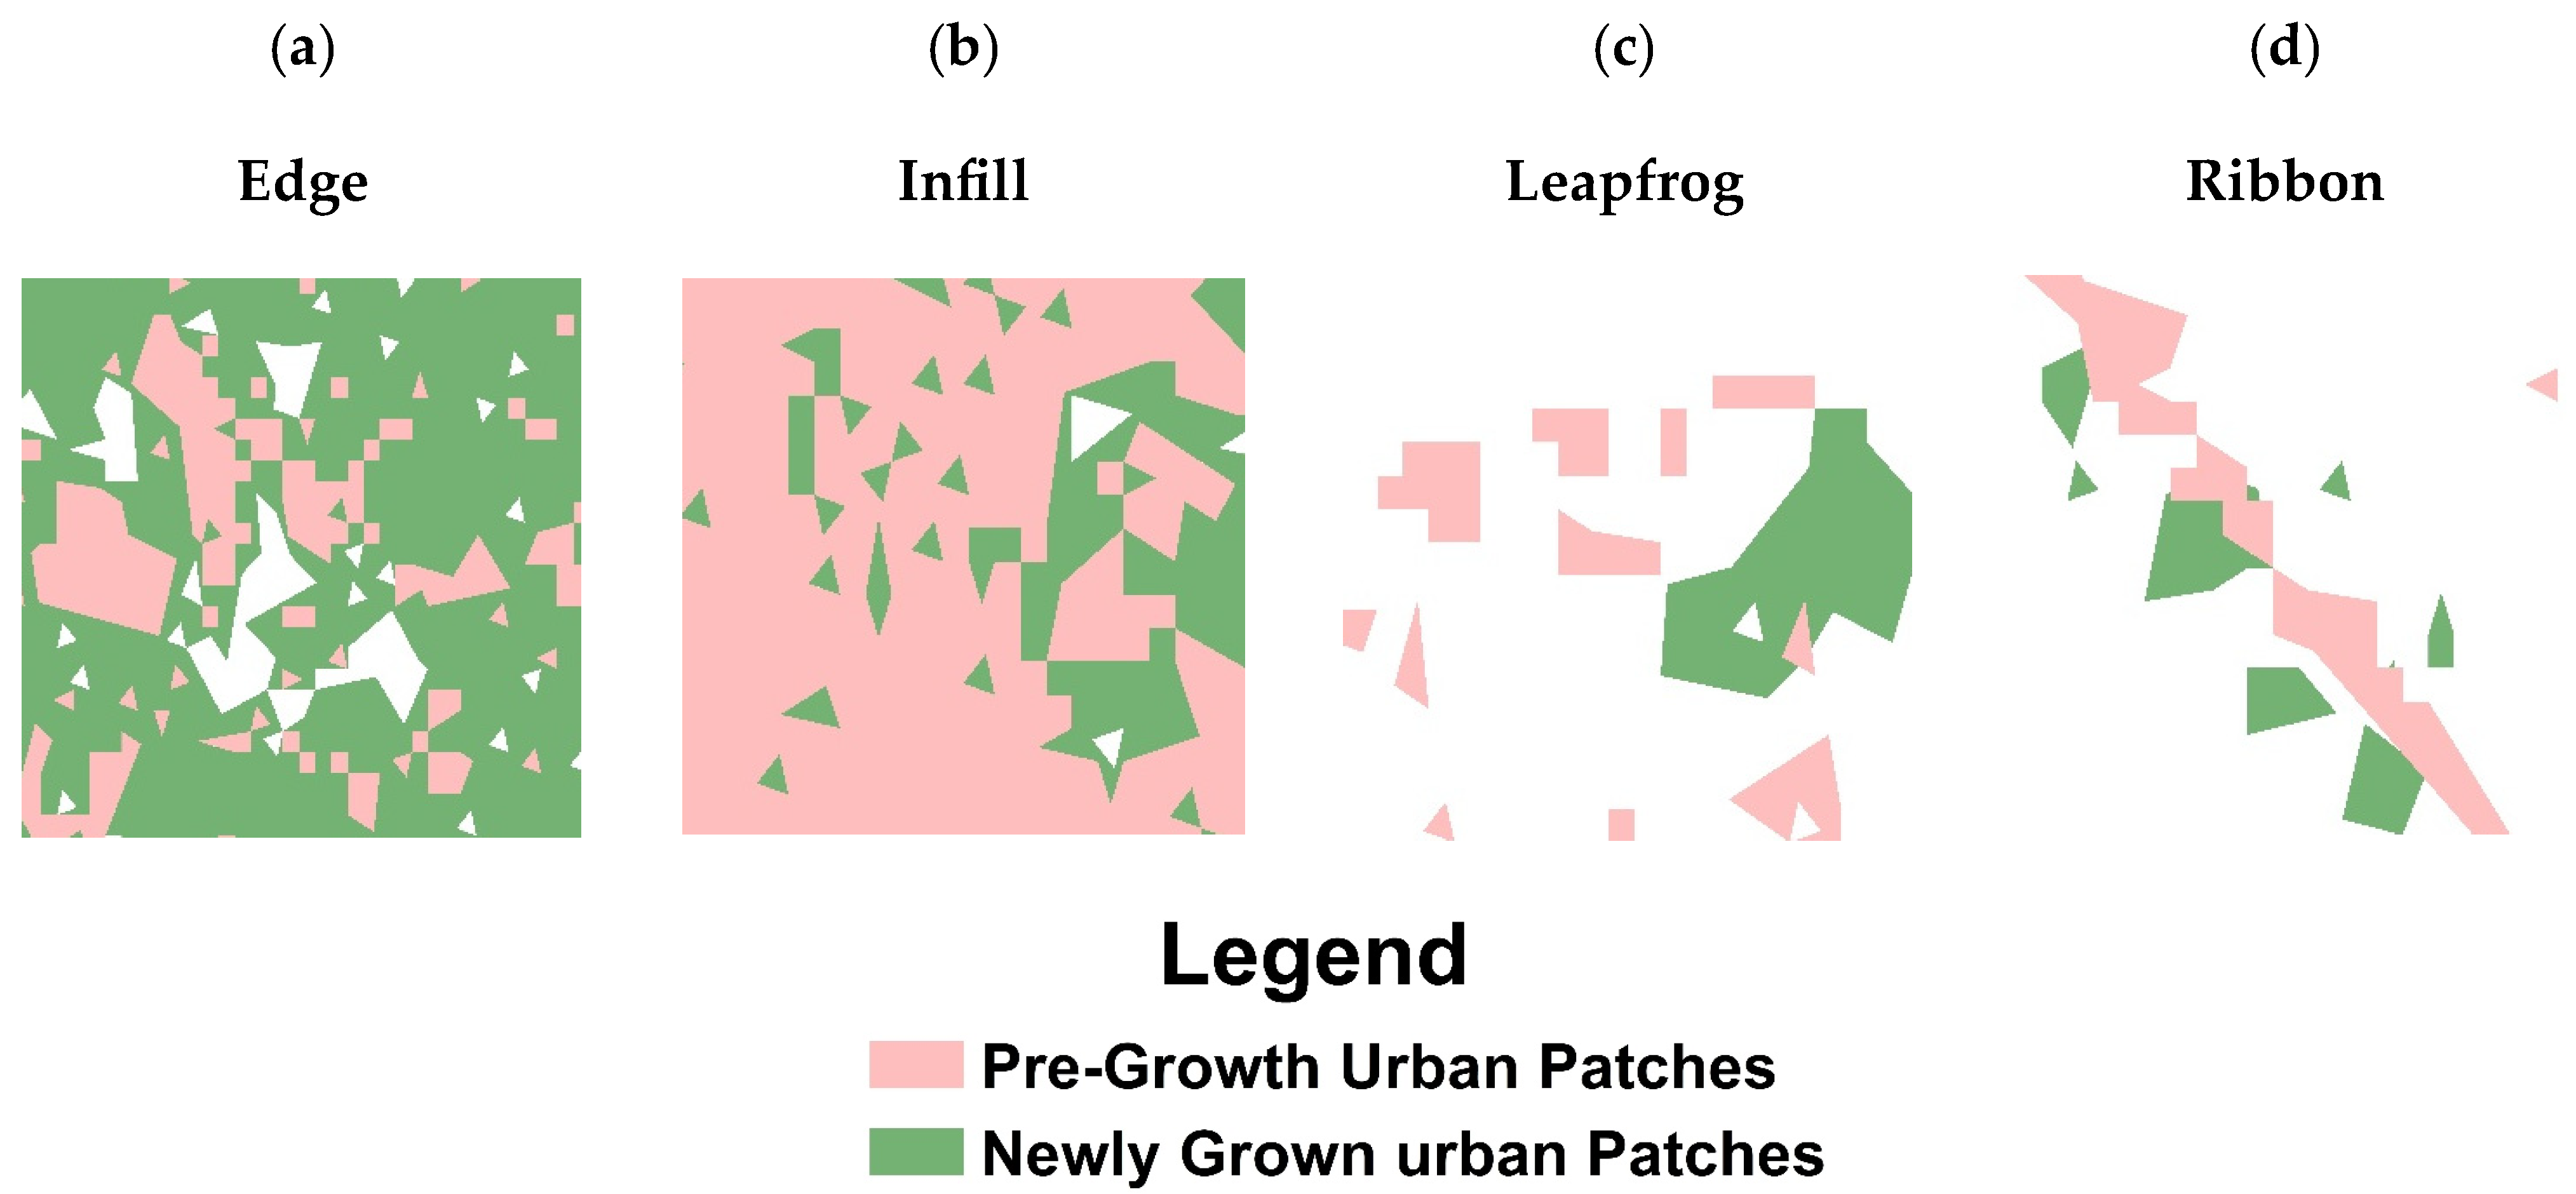
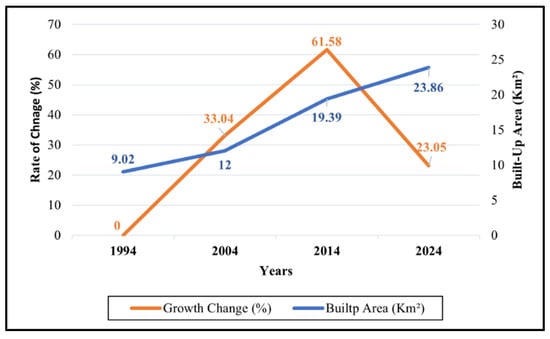
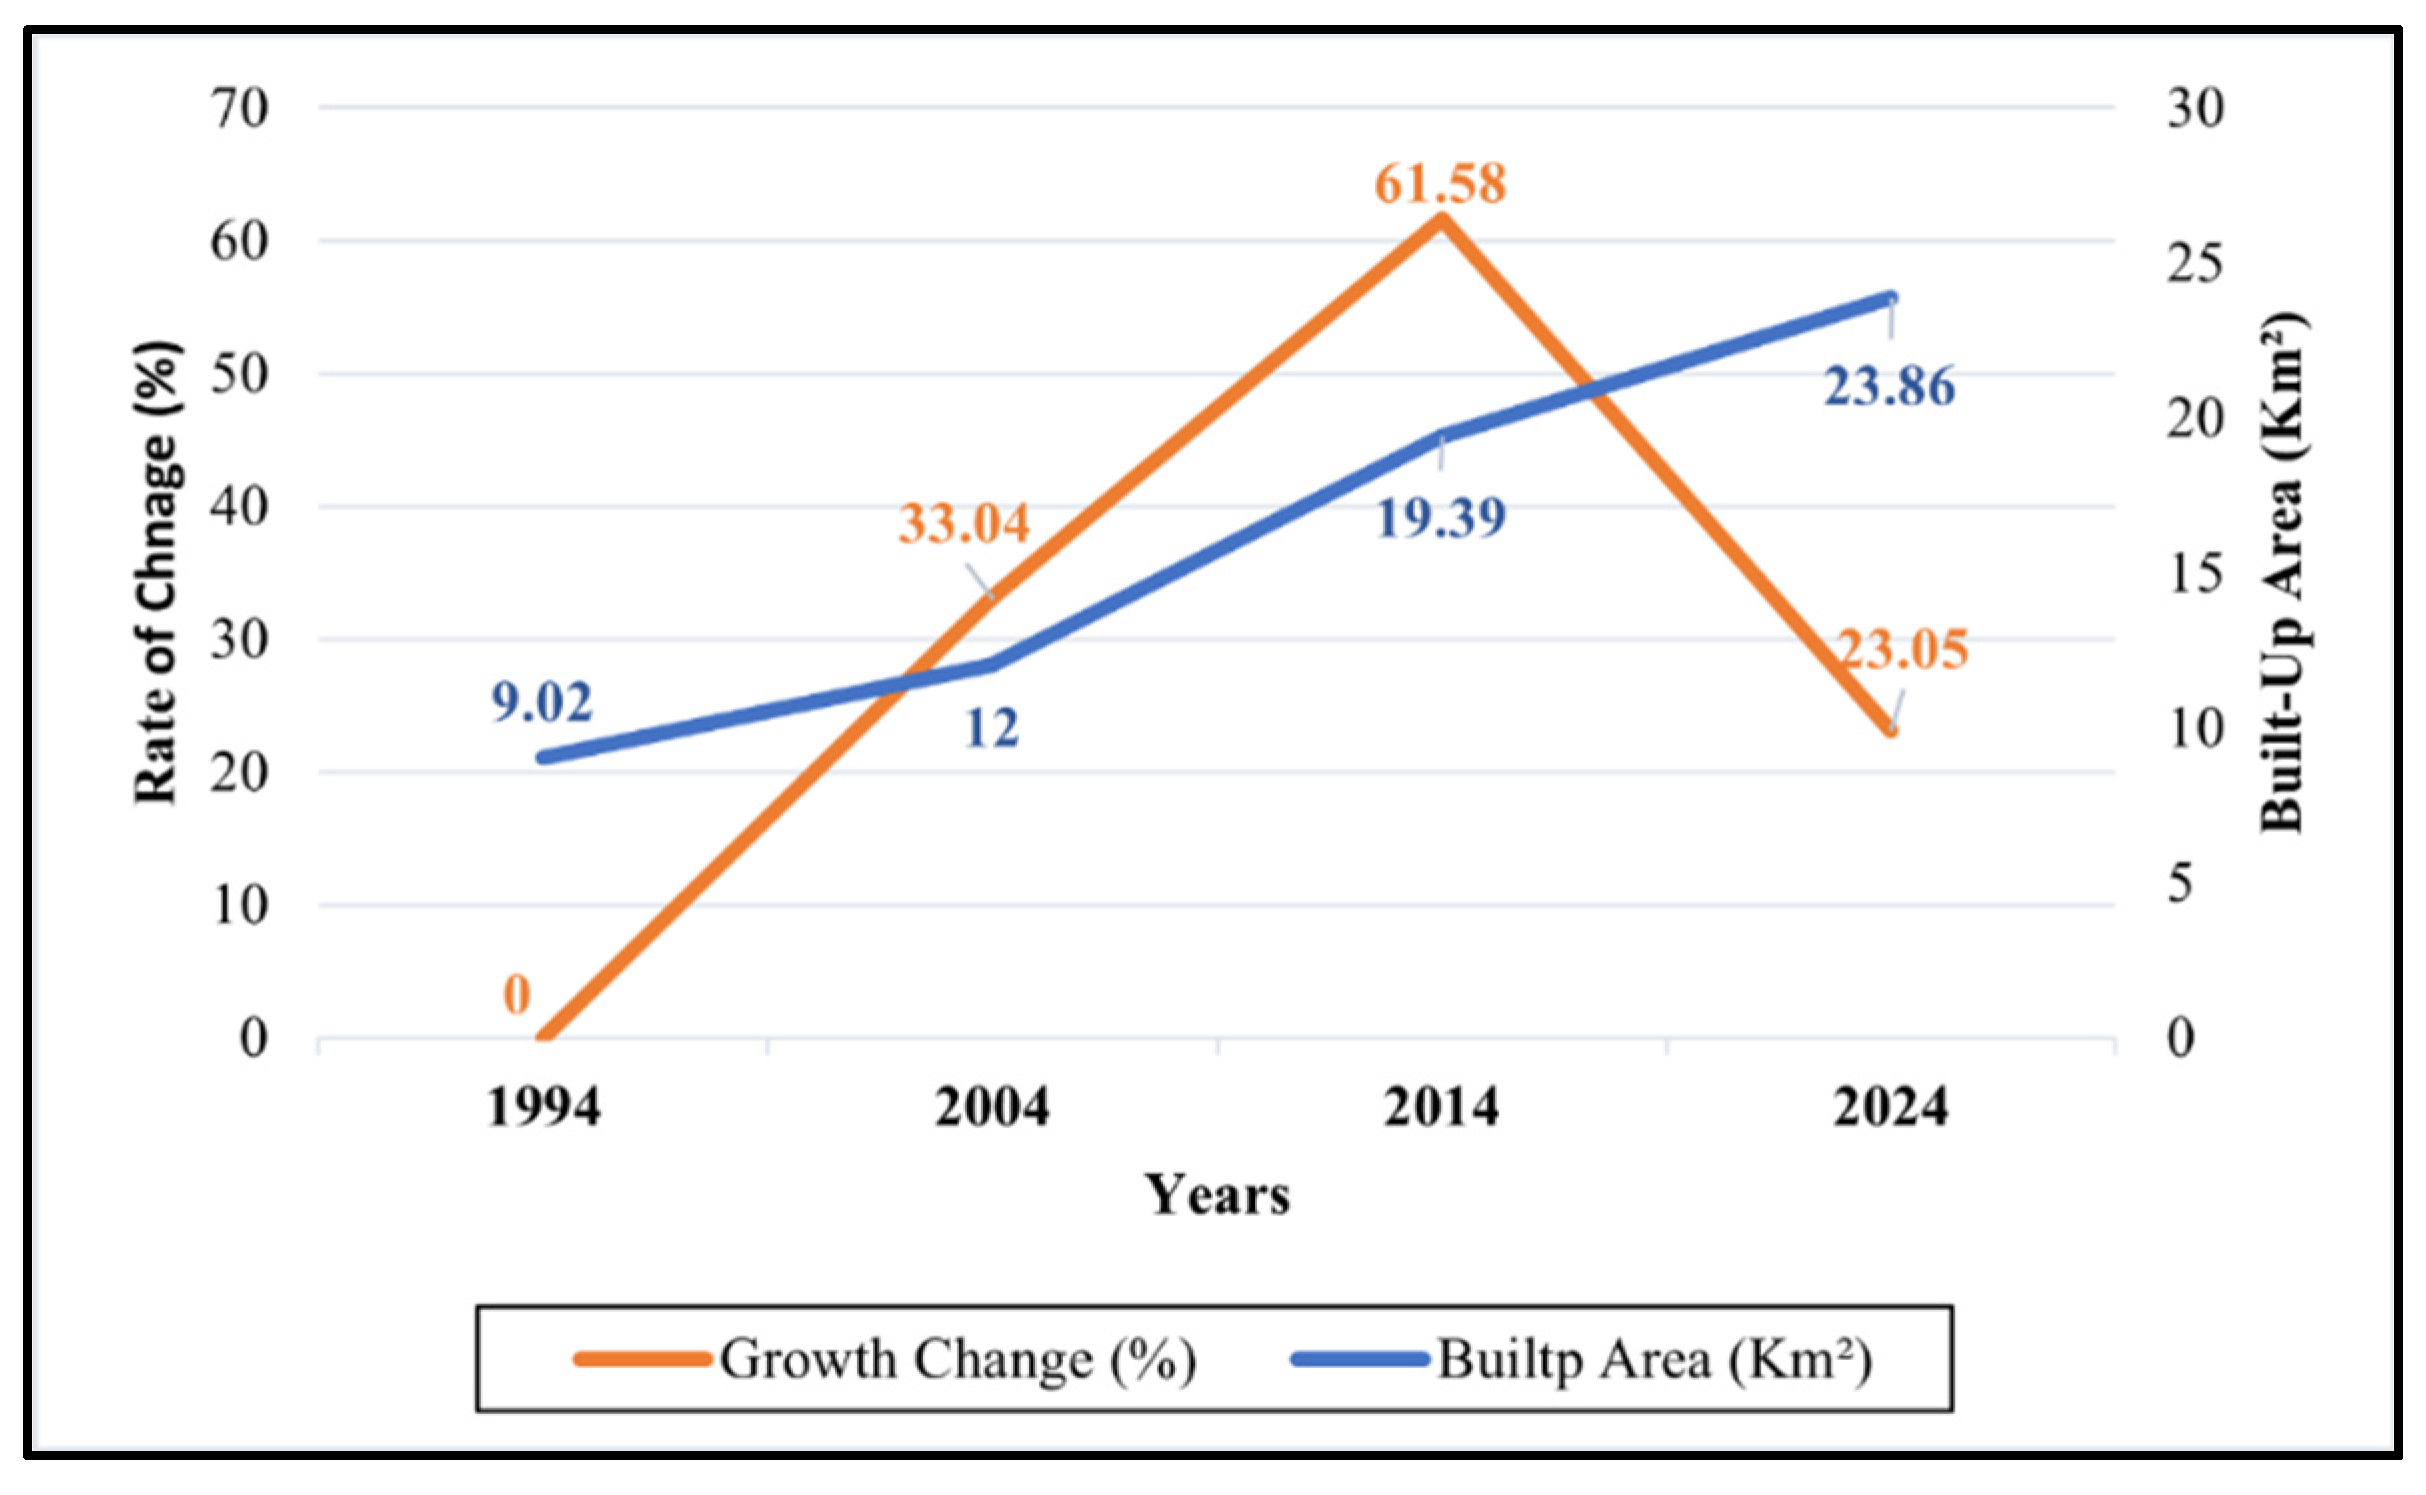
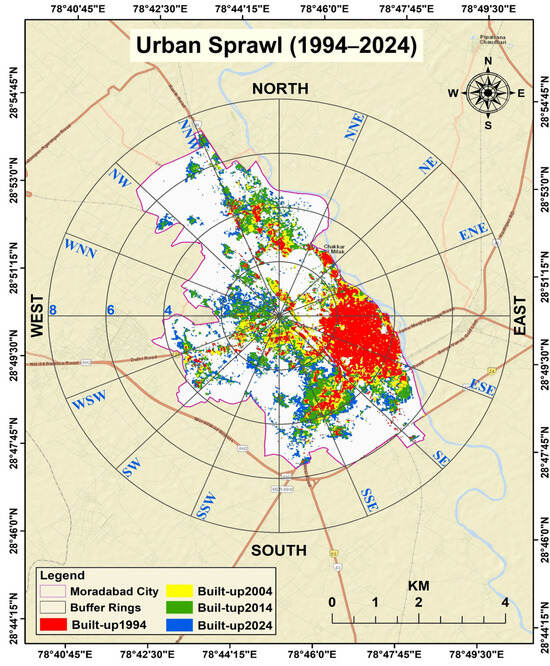
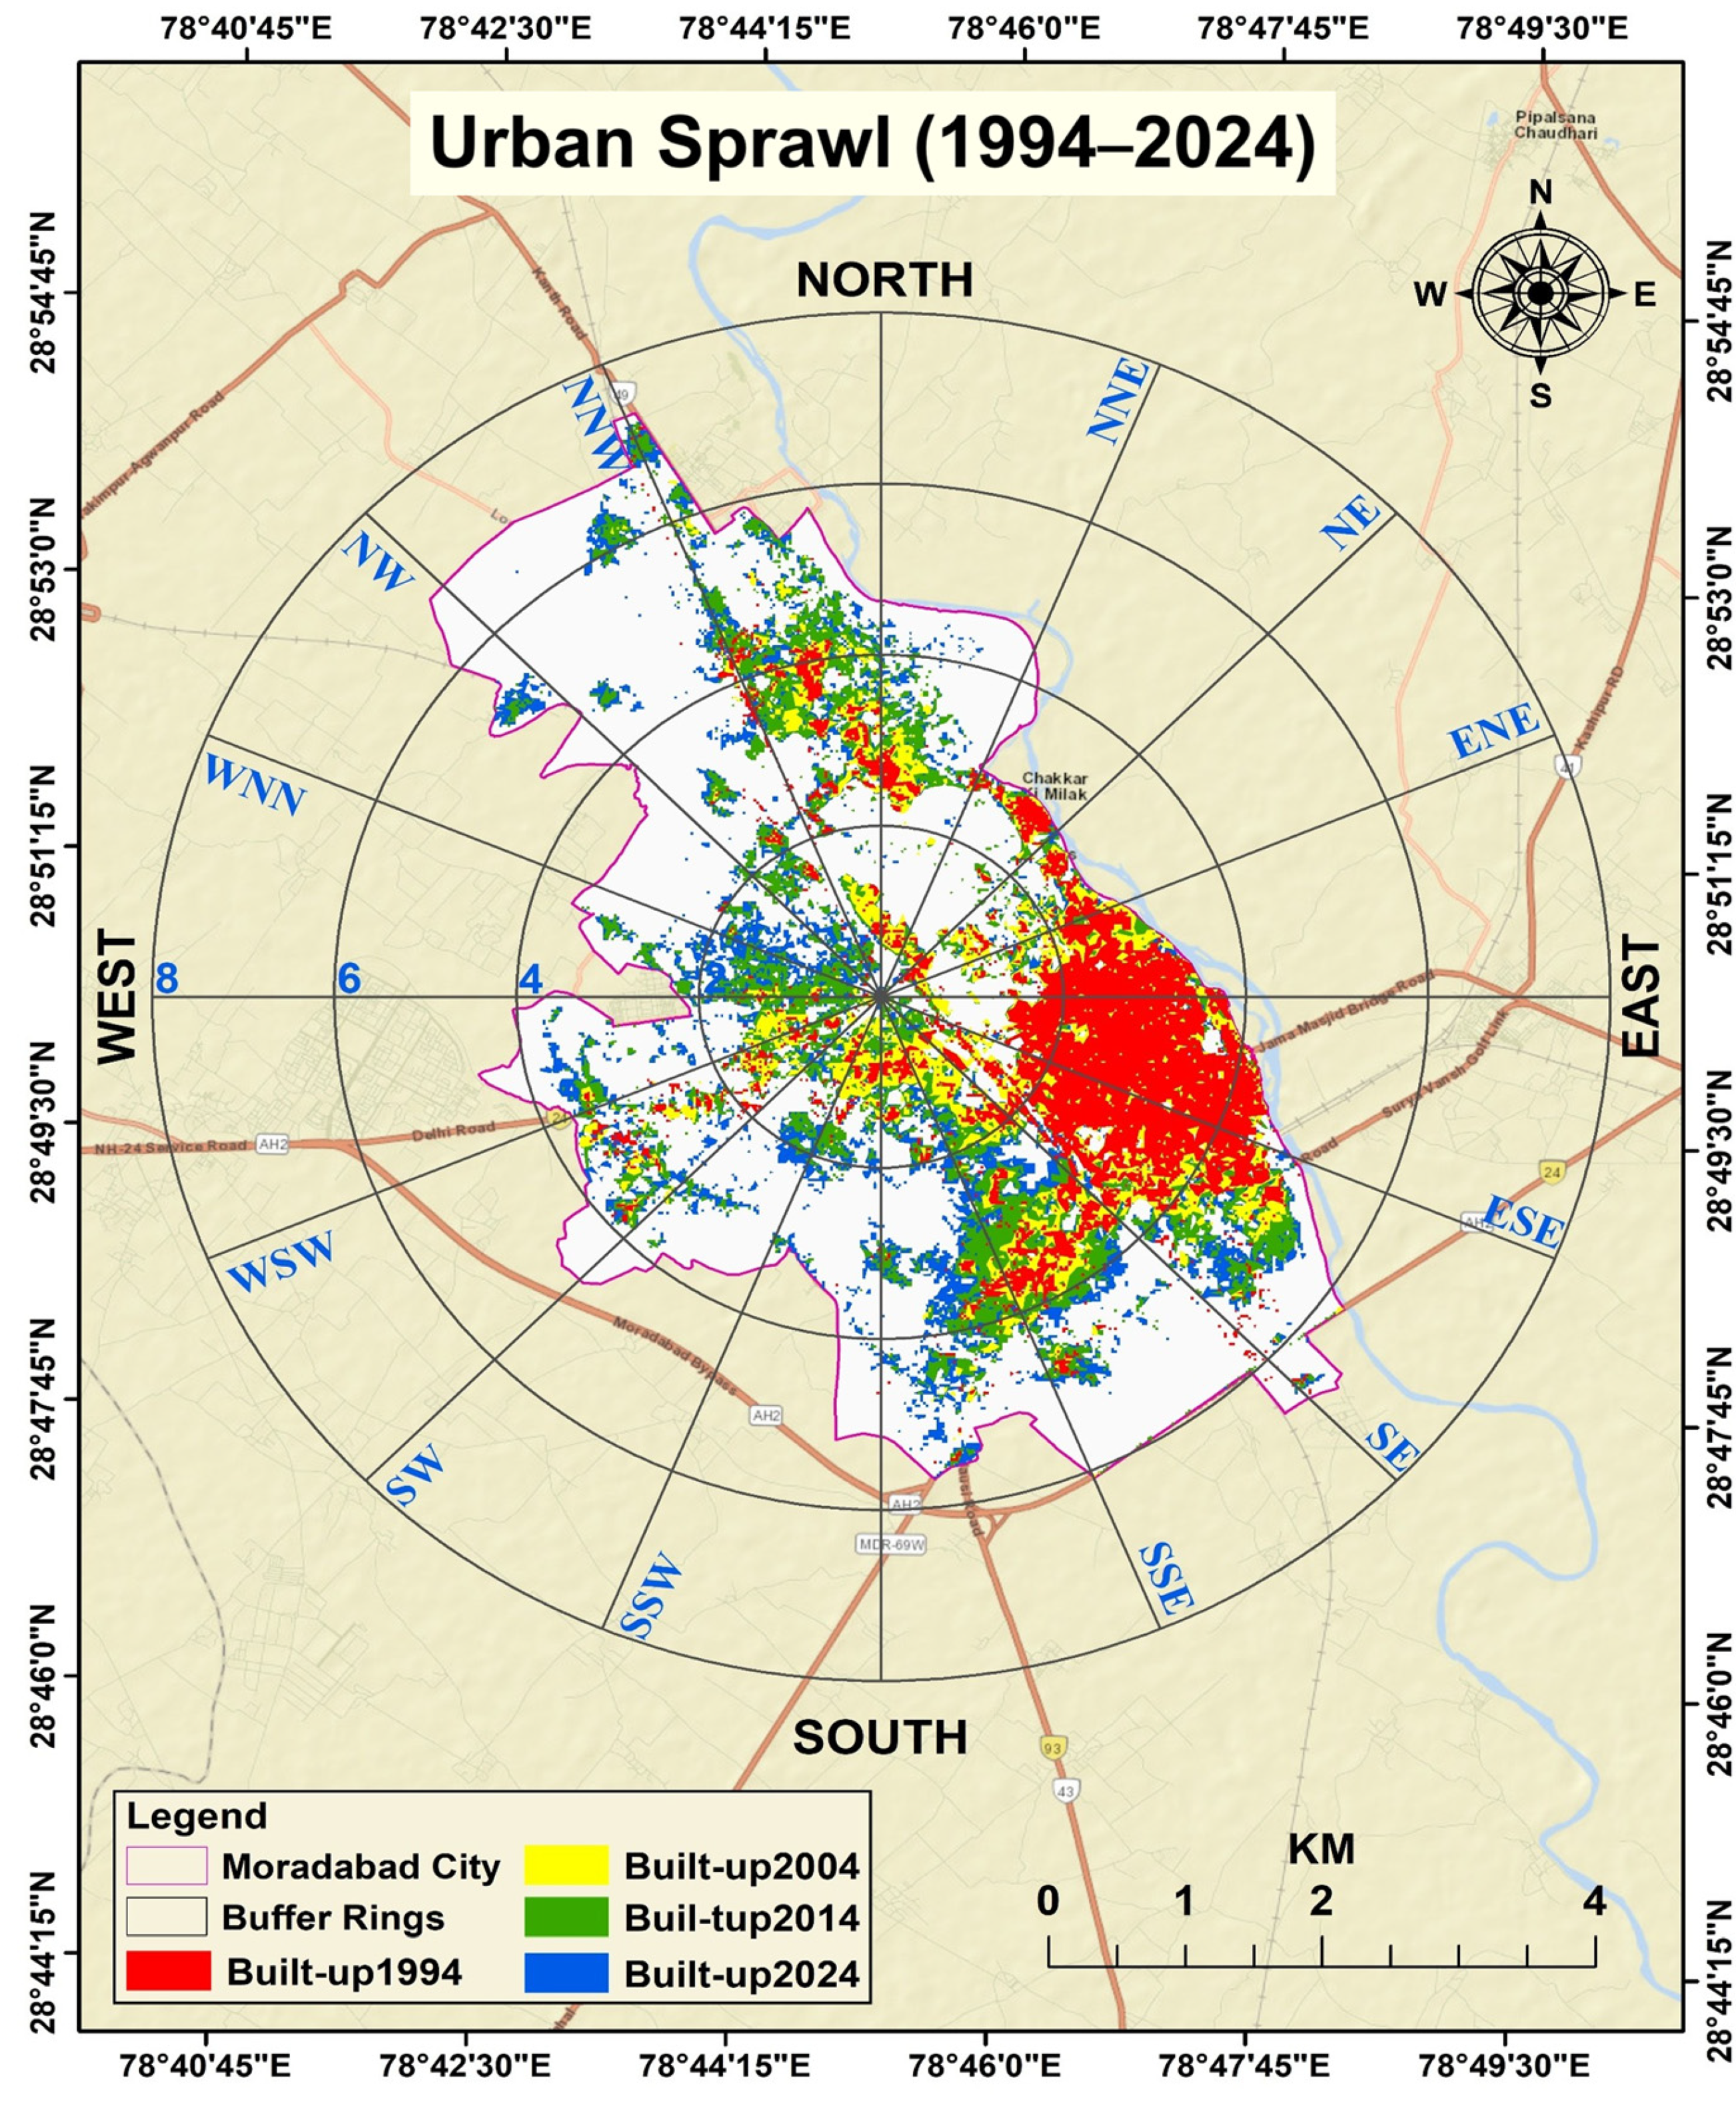
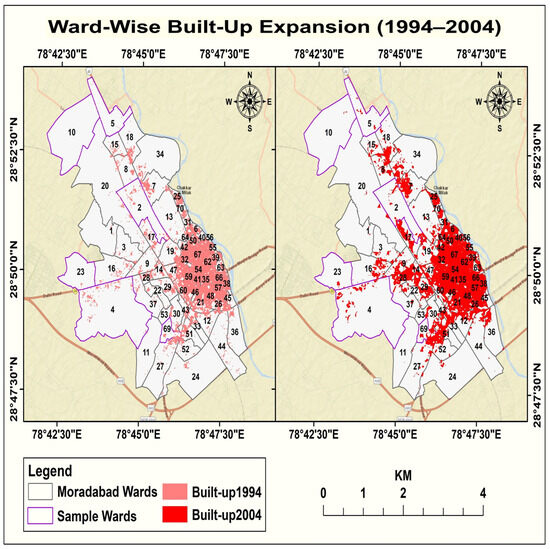
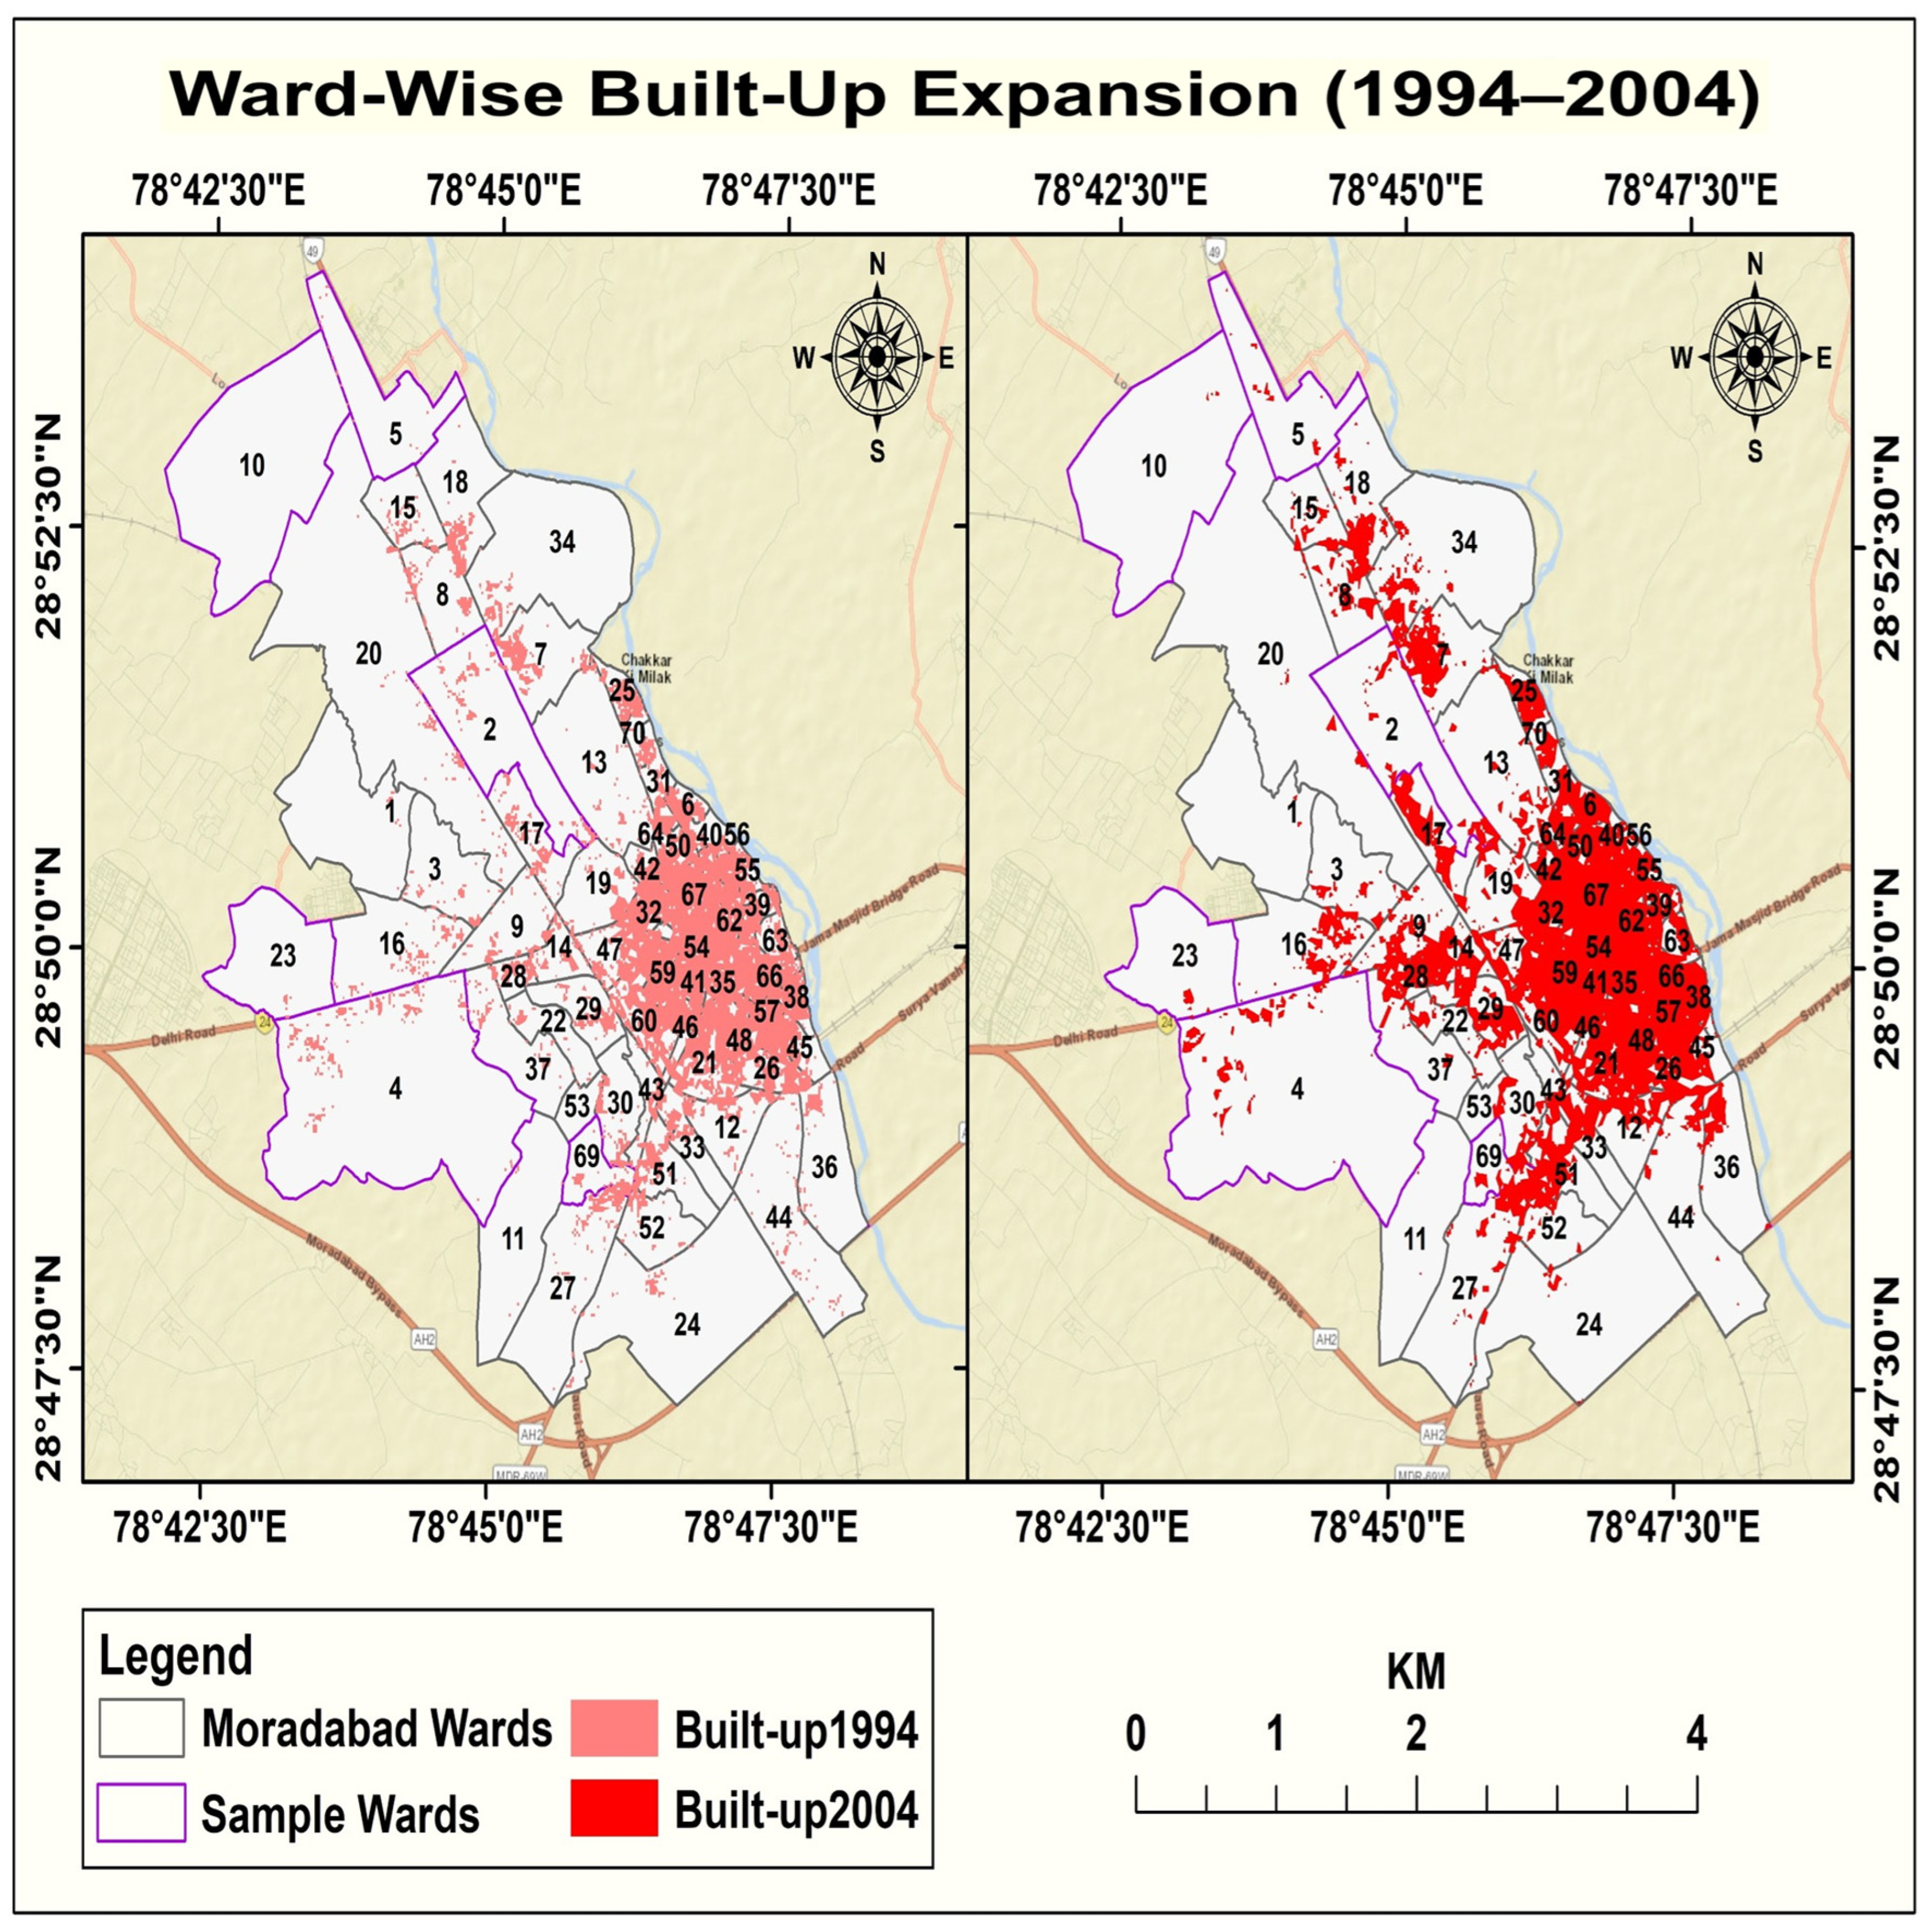
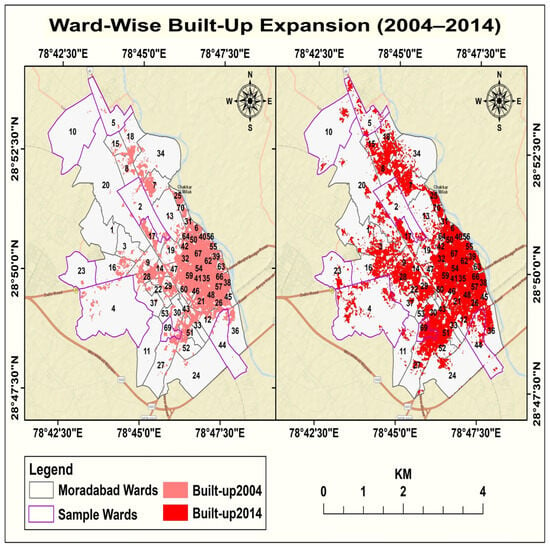
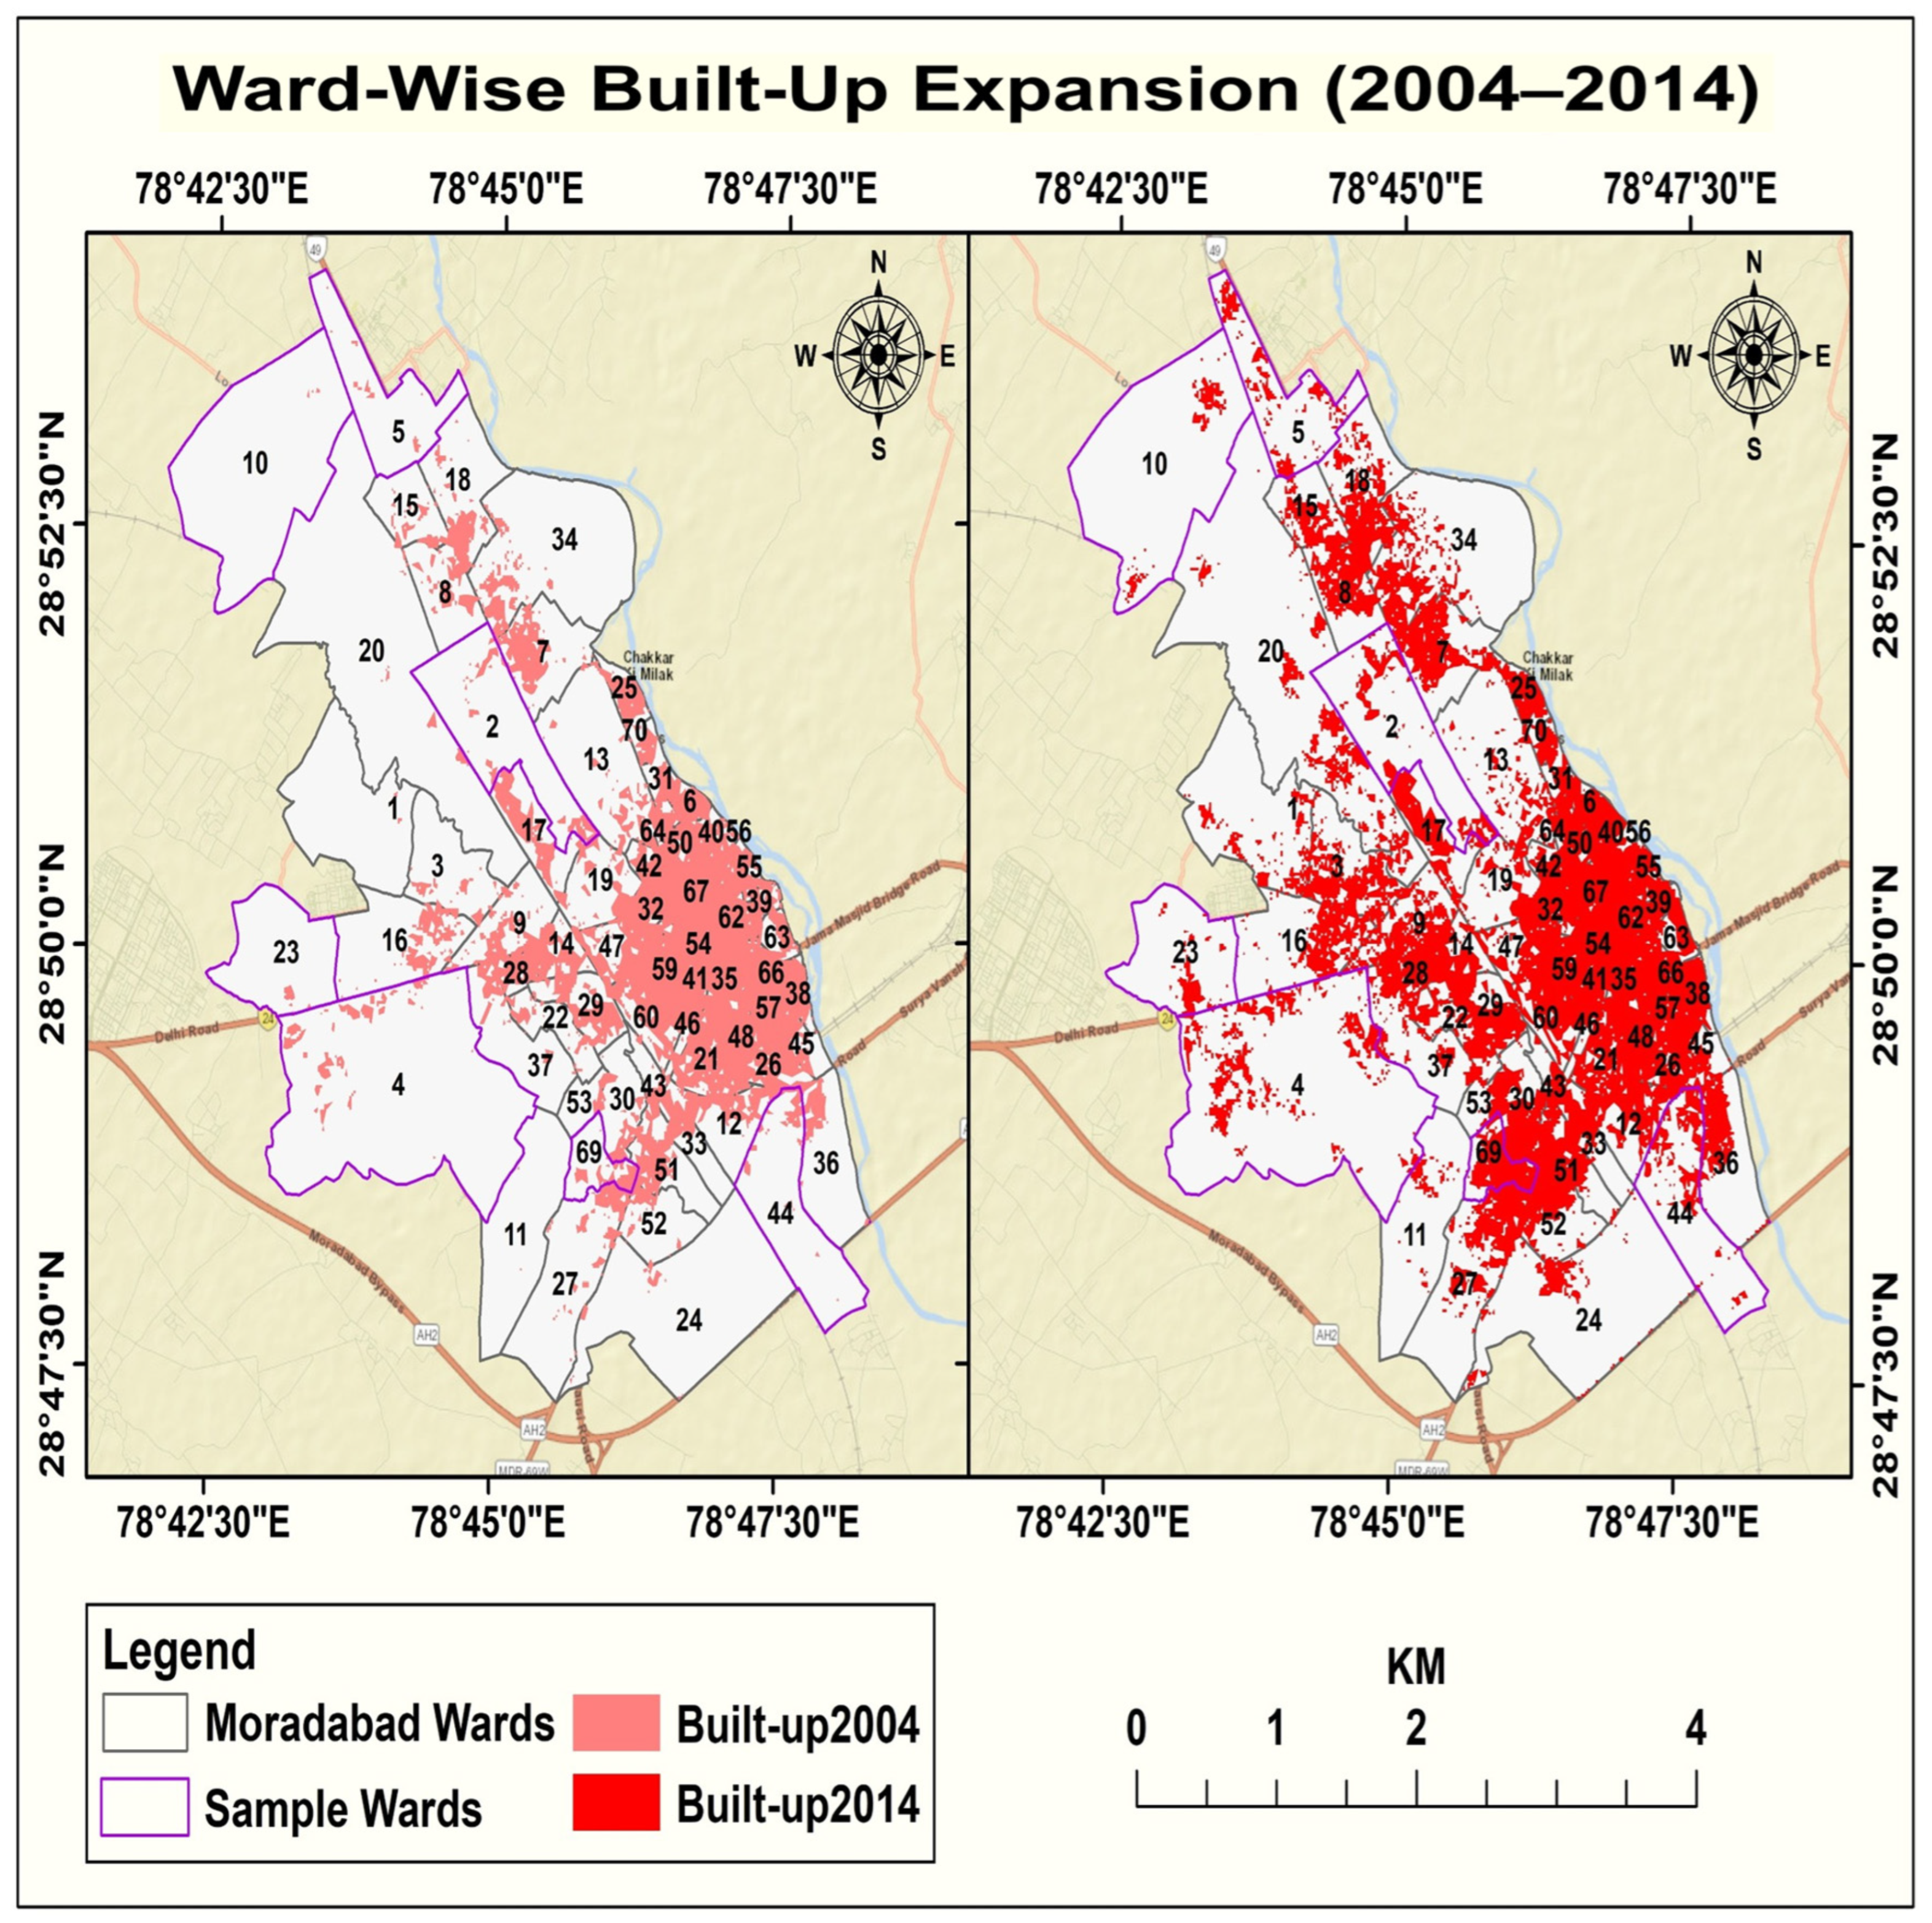
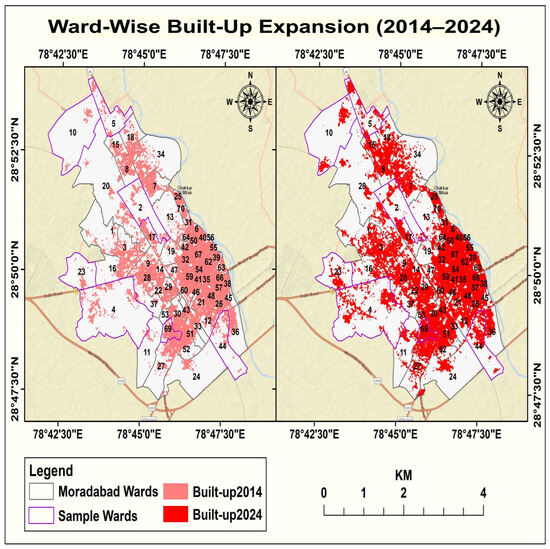
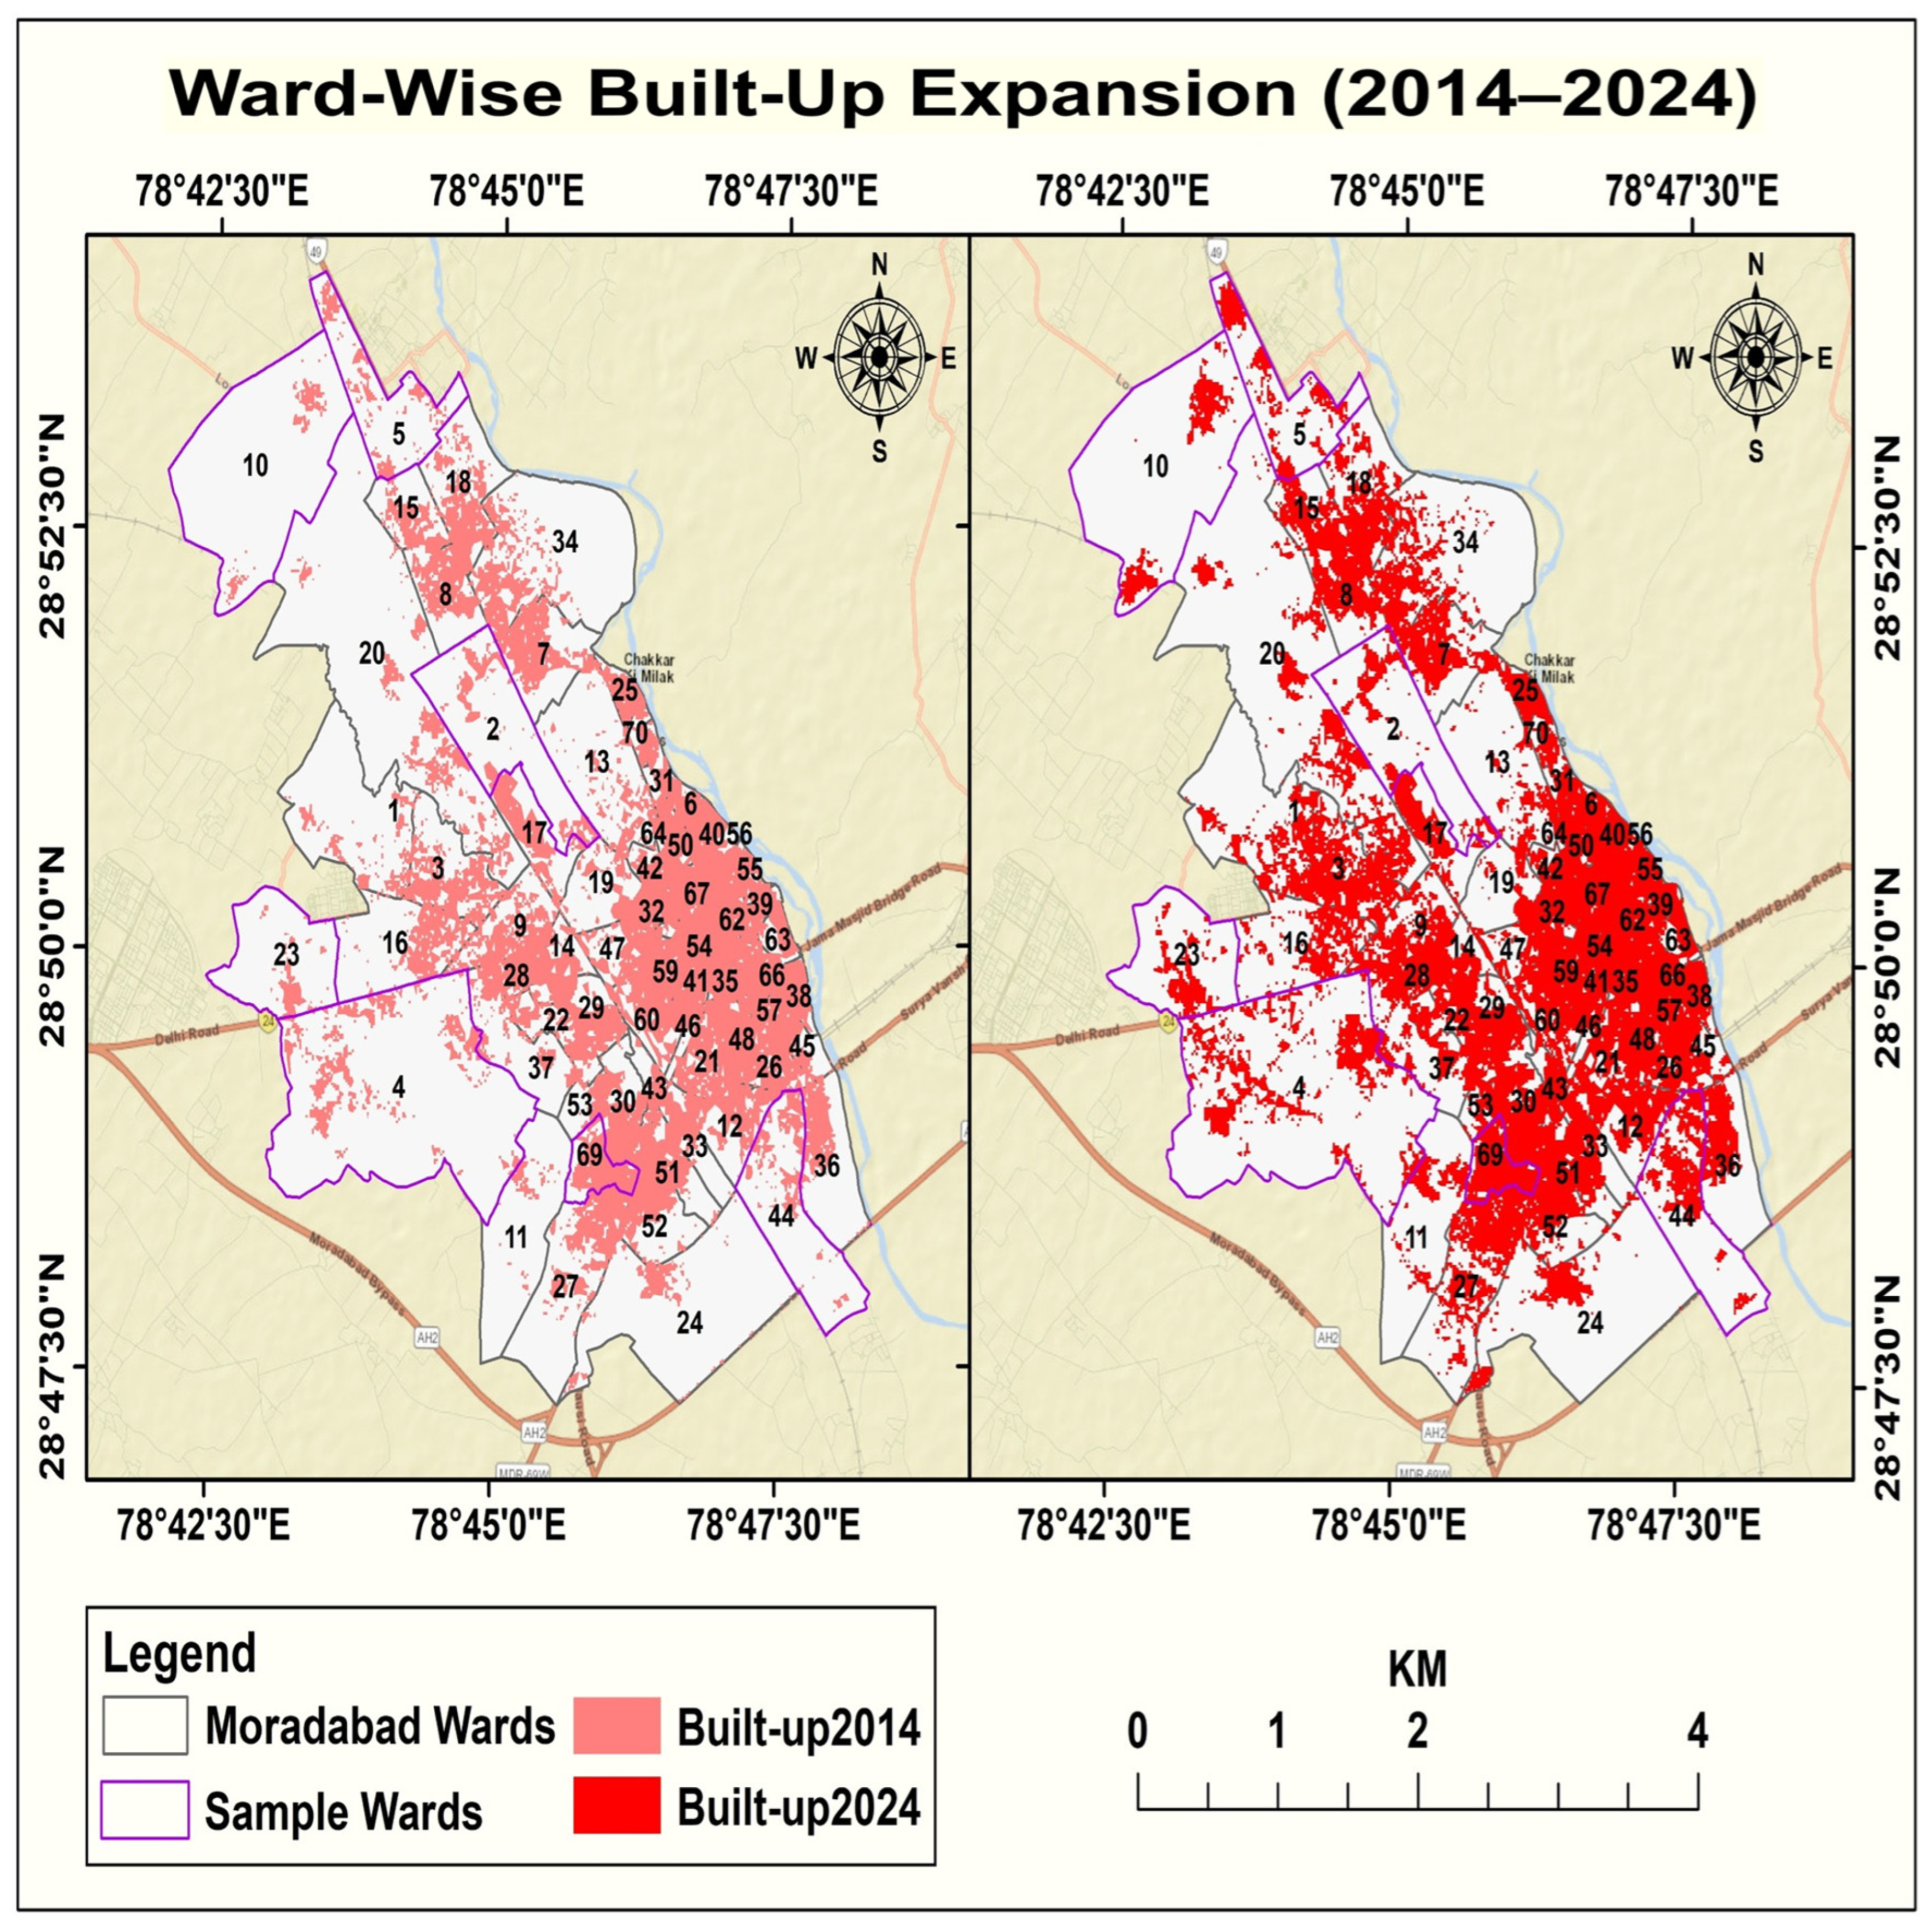
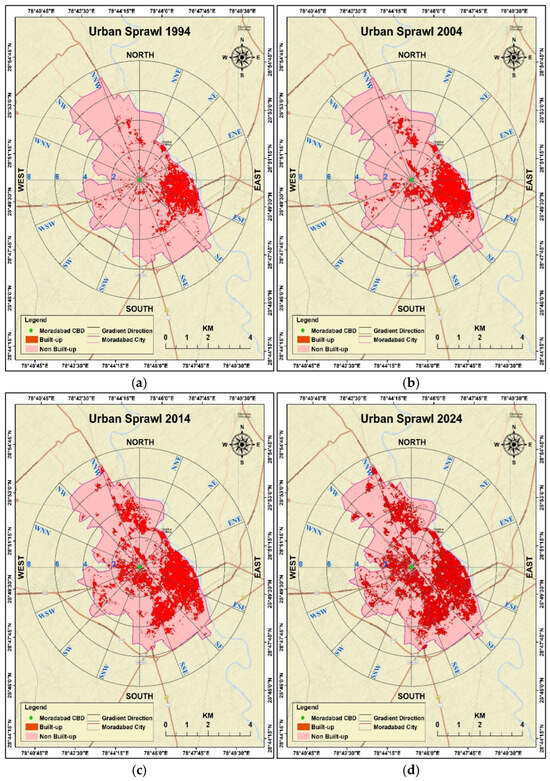
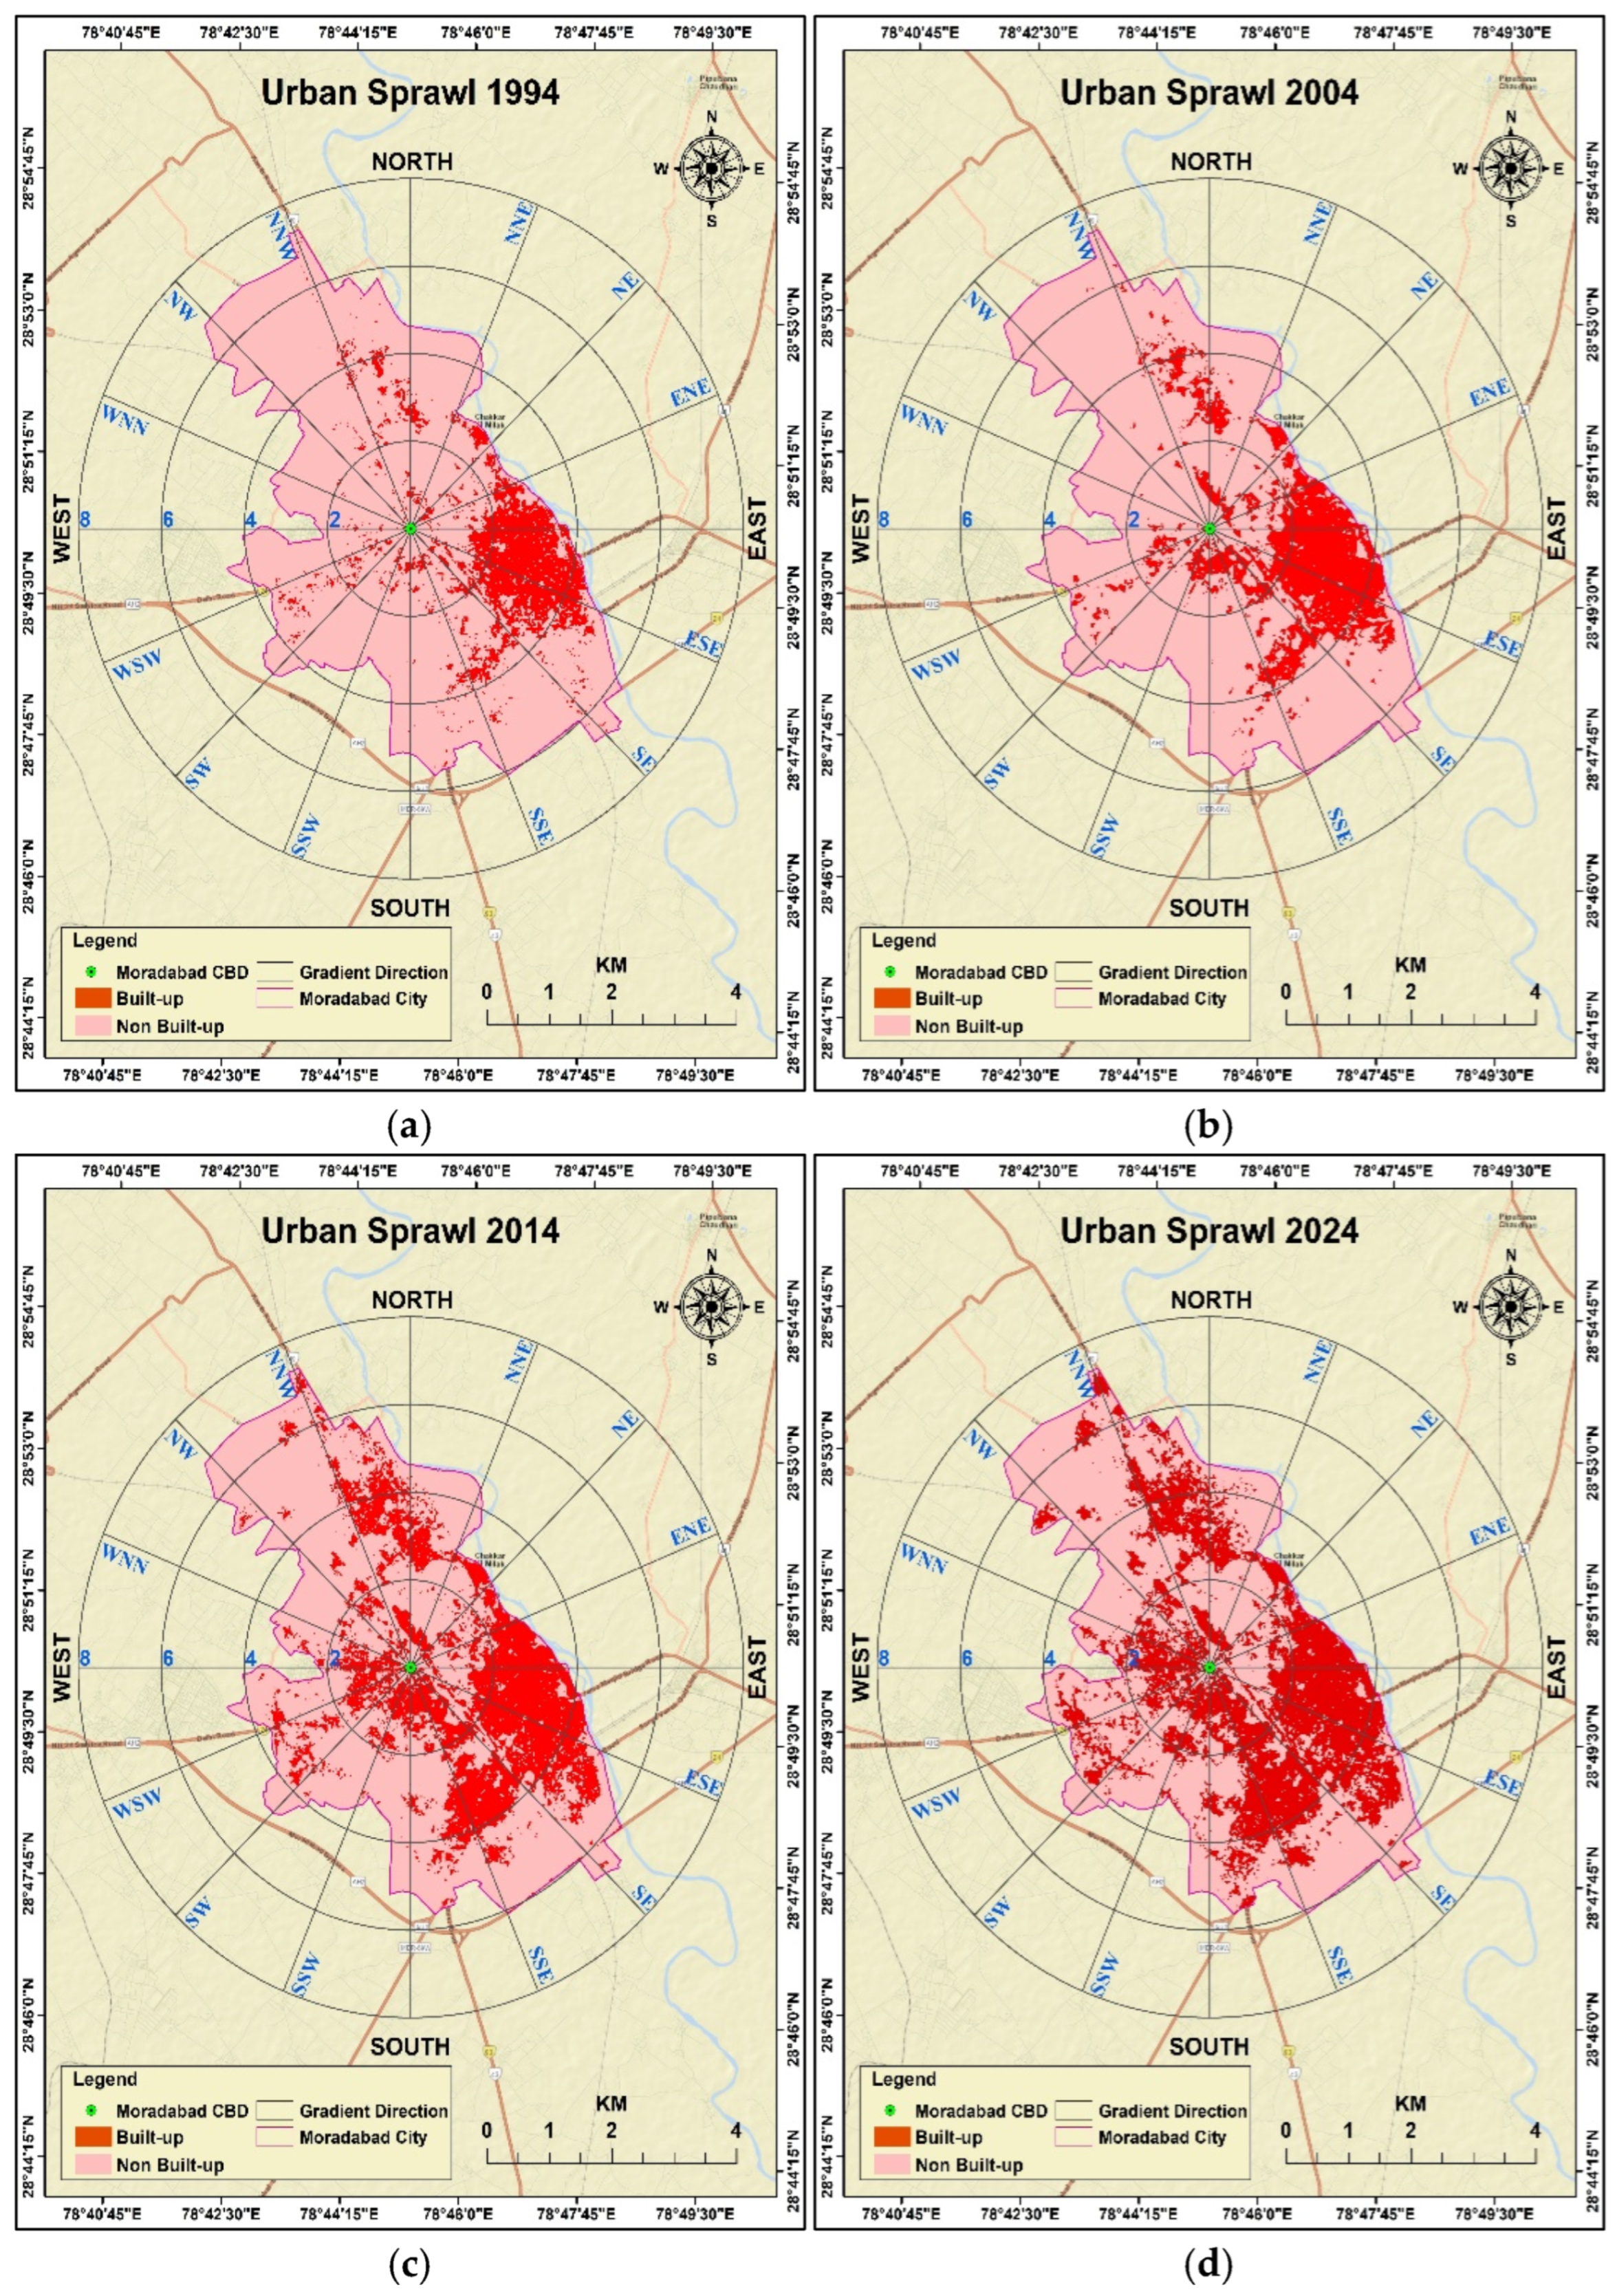
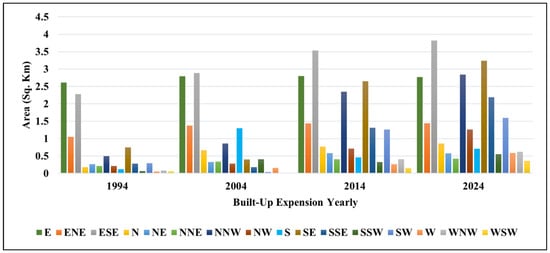
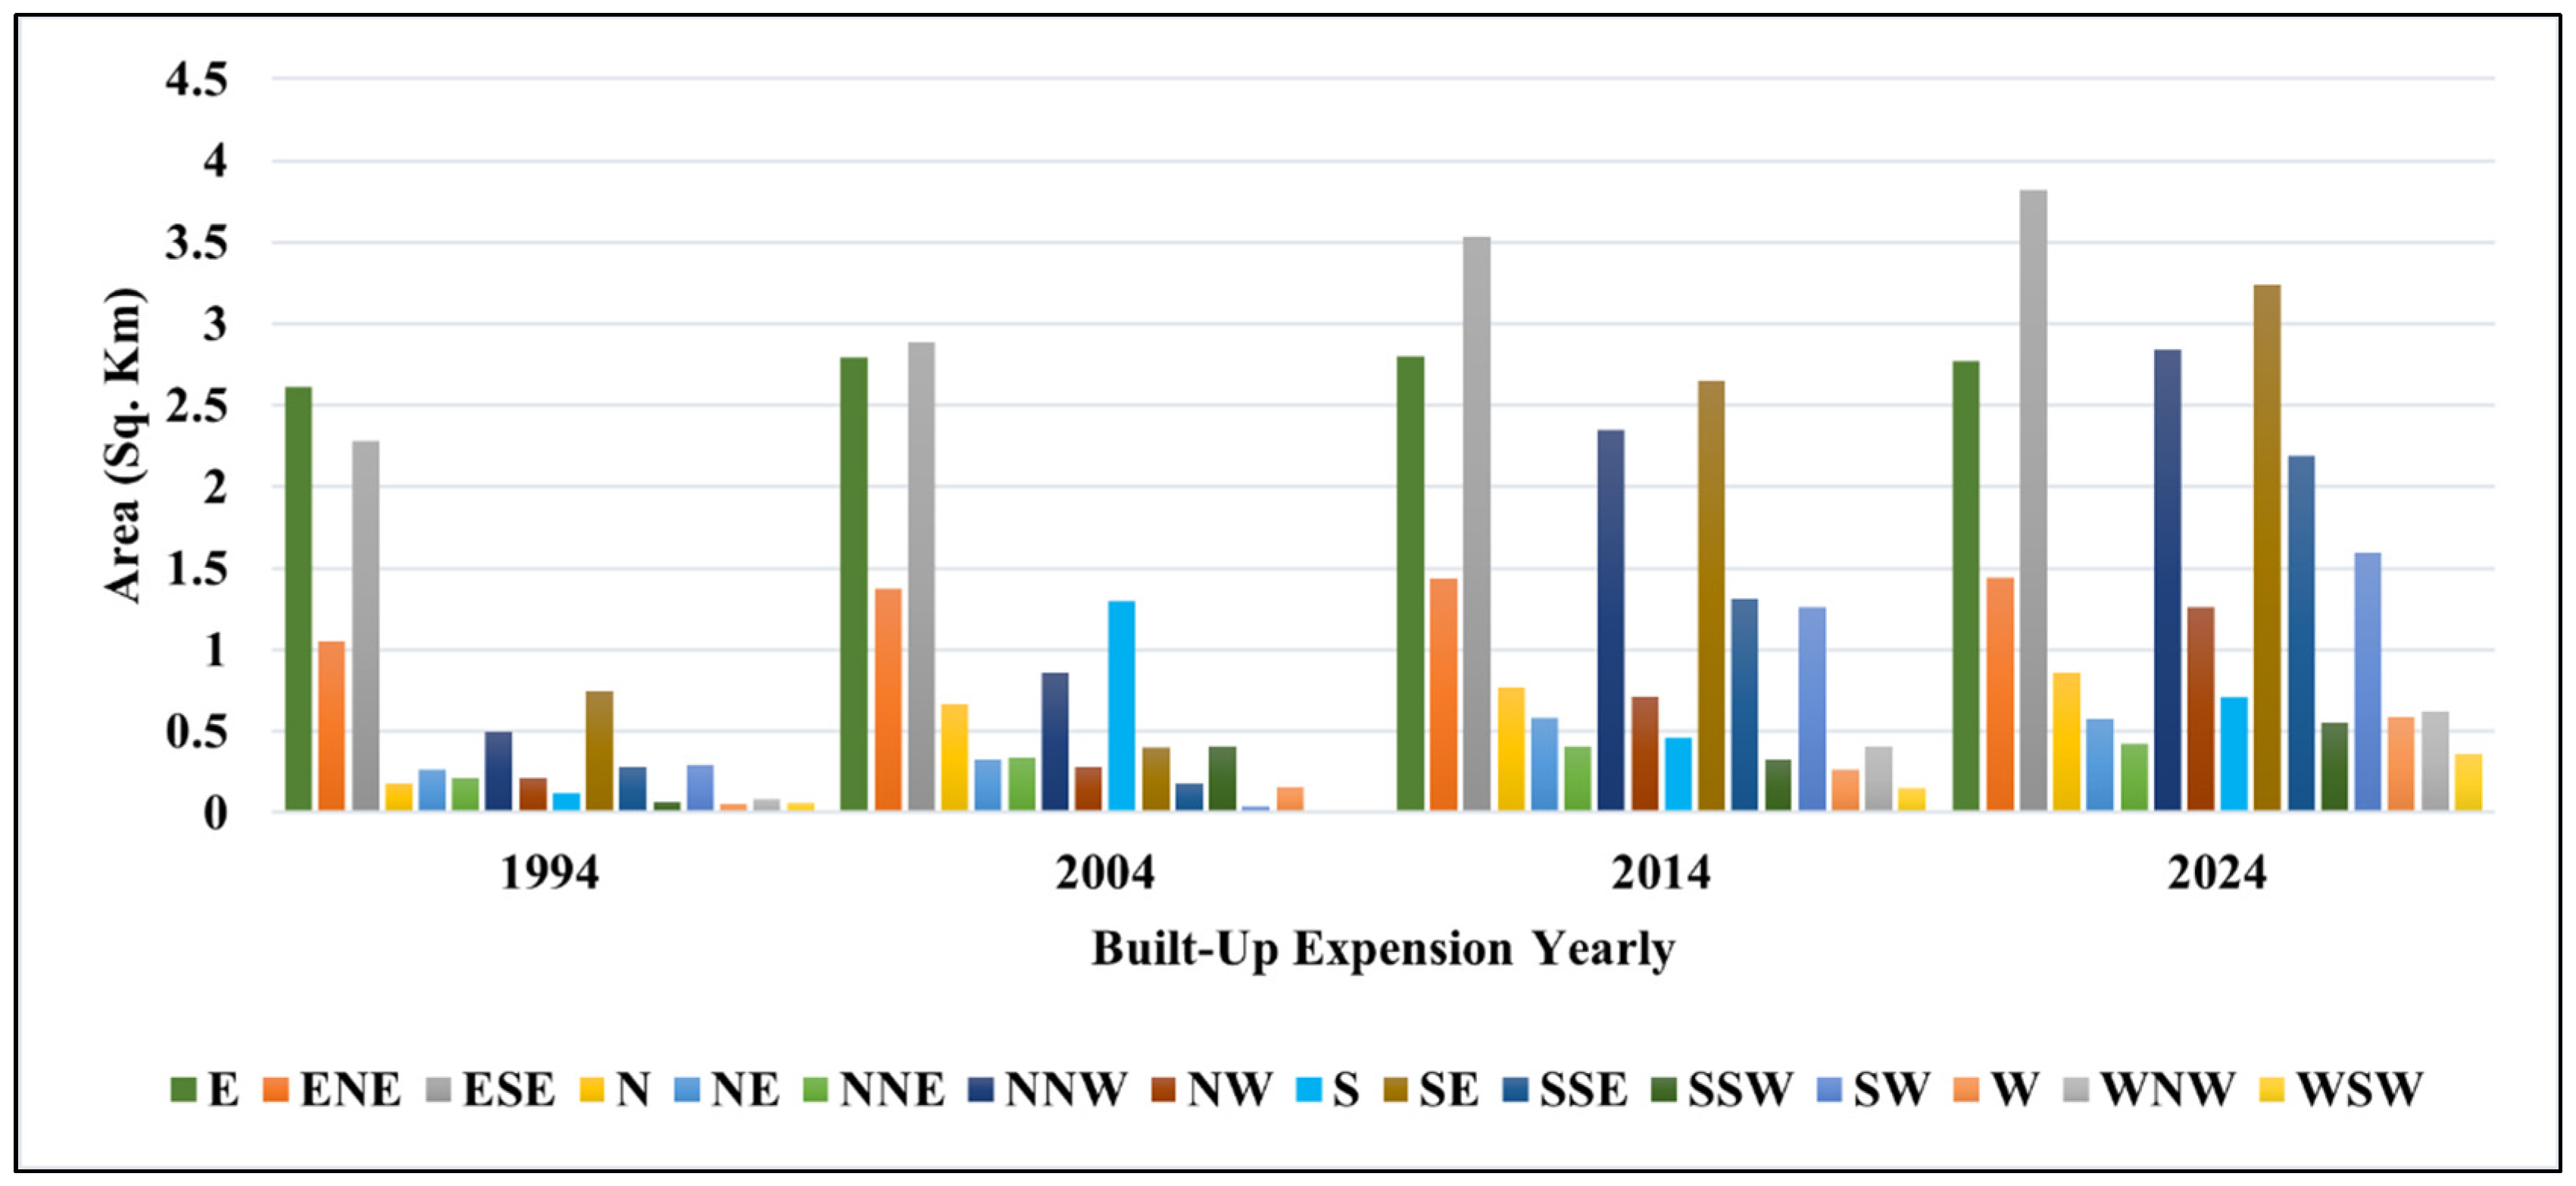
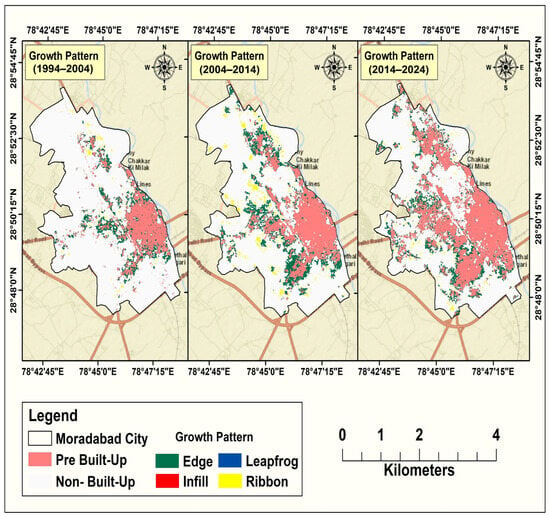
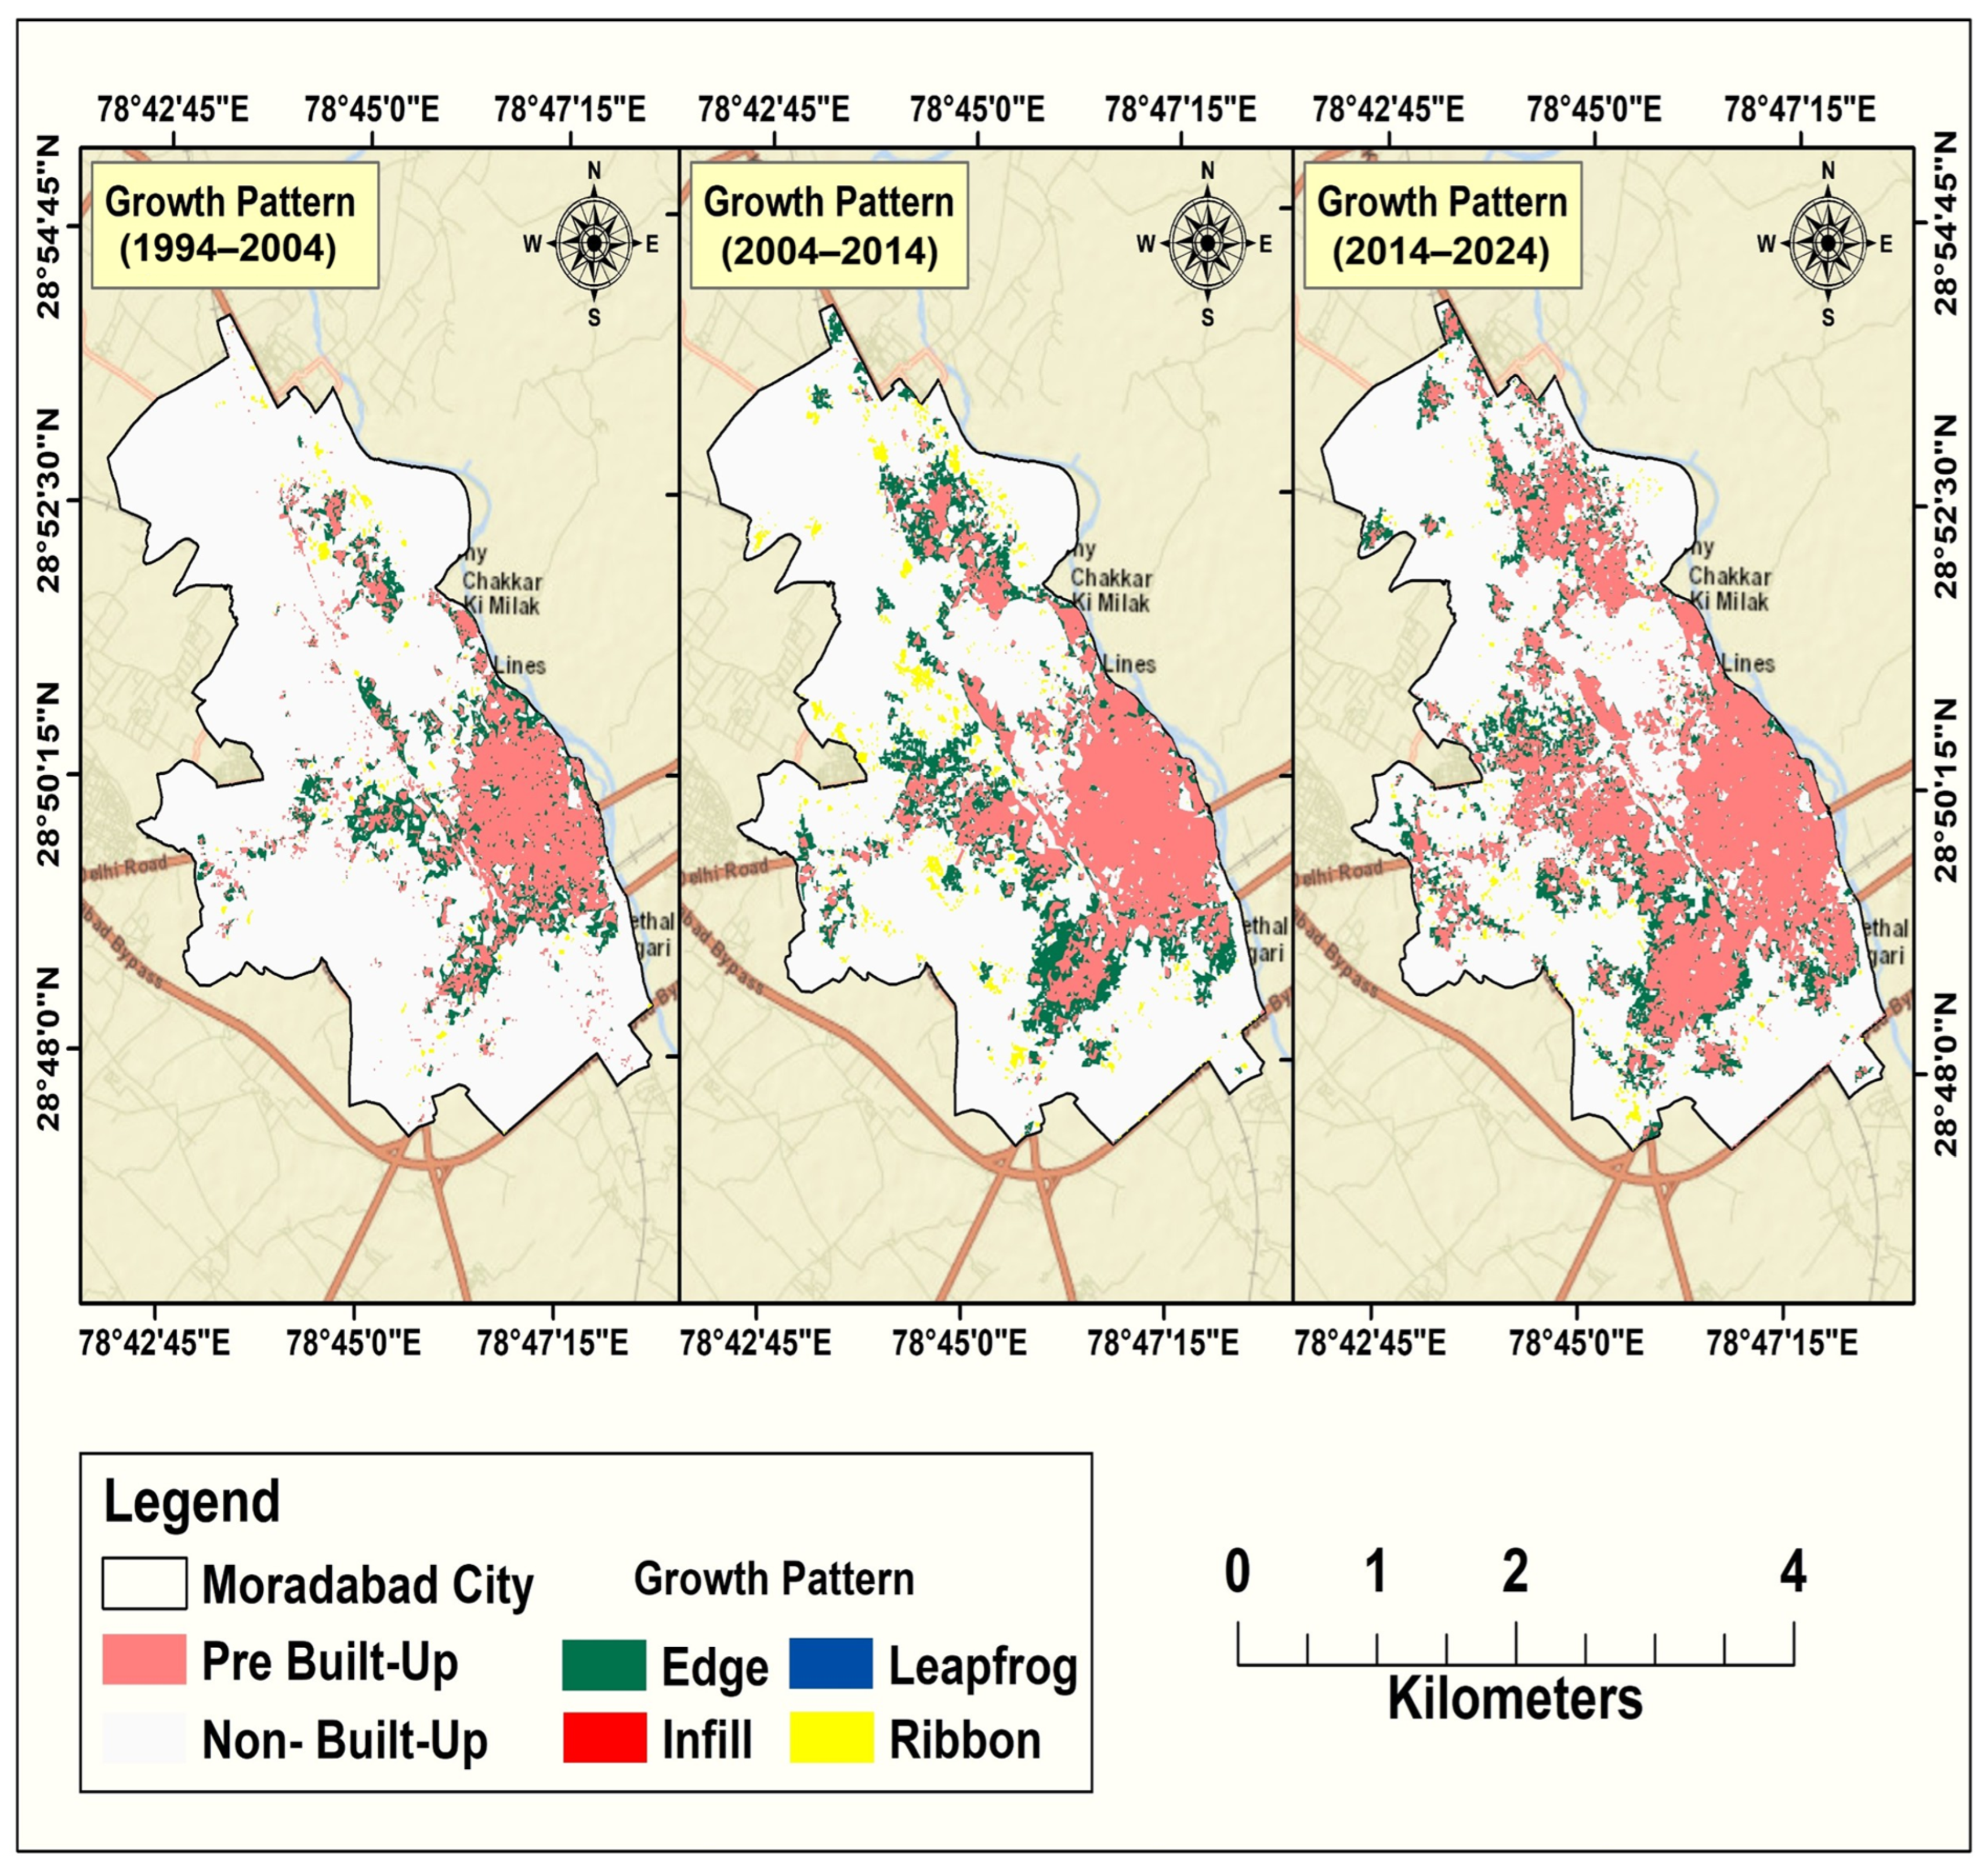

Disclaimer/Publisher’s Note: The statements, opinions and data contained in all publications are solely those of the individual author(s) and contributor(s) and not of MDPI and/or the editor(s). MDPI and/or the editor(s) disclaim responsibility for any injury to people or property resulting from any ideas, methods, instructions or products referred to in the content. |
© 2026 by the authors. Licensee MDPI, Basel, Switzerland. This article is an open access article distributed under the terms and conditions of the Creative Commons Attribution (CC BY) license.