


Abstract
Quantitative land cover records for geopolitically restricted regions remain extremely scarce, particularly for the pre-Landsat era. This study reconstructs long-term urban land cover dynamics in Pyongyang, Democratic People’s Republic of Korea (DPRK), over a 55-year span (1967–2022) by combining deep learning colorization of declassified CORONA KH-4 panchromatic imagery with the GLC_FCS30D global 30 m land cover dynamics dataset. The GLC_FCS30D nine-epoch time series (1985–2022) revealed that built-up area expanded from 65.0 km2 (36.0%) to a peak of 103.2 km2 (57.1%) in 2015, driven almost entirely by the conversion of agricultural land, before declining to 92.7 km2 (51.3%) by 2022. The 1967 colorization-based classification yielded a built-up proportion of 35.9%, closely approximating the 1985 baseline. Integration of these results identified three urbanization phases: post-reconstruction consolidation (1967–1985), sustained expansion at the expense of agricultural land (1985–2015), and stabilization coinciding with intensified international sanctions and pandemic-related isolation (2015–2022). The near-halving of agricultural land within the capital’s vicinity during chronic national food insecurity is consistent with a fundamental tension between showcase urban modernization and food production imperatives in state-planned economies. As perhaps the last continuously state-planned socialist city, Pyongyang’s trajectory offers a rare empirical counterpoint to market-driven urbanization processes.
1. Introduction
Land cover change analysis is fundamental to understanding the interactions between human activities and the natural environment. Urban expansion, in particular, represents one of the most significant and irreversible forms of land cover transformation, with profound implications for ecosystem services, food security, and regional climate [1]. Satellite remote sensing has been the primary tool for monitoring such changes at regional to global scales, with the Landsat program providing a continuous observational record since 1972 [2]. However, for many regions of the world—particularly those with restricted access such as the Democratic People’s Republic of Korea (DPRK)—the temporal depth of available satellite data remains insufficient to capture the full trajectory of post-war urbanization.
Pyongyang, the capital and largest city of the DPRK, presents a unique case in the study of urban transformation. Following the near-complete destruction of the city during the Korean War (1950–1953), Pyongyang was systematically rebuilt according to Soviet-influenced socialist urban planning principles during the late 1950s and 1960s, a period driven by the Chollima Movement, the DPRK’s campaign for rapid industrialization and reconstruction [3]. The subsequent decades witnessed continued expansion under centralized state planning, followed by a period of severe economic crisis during the 1990s famine known as the “Arduous March” [4], and more recent development initiatives including large-scale construction projects such as the Ryomyong Street complex [5]. Despite the geopolitical significance of these transformations, quantitative spatial analyses of Pyongyang’s land cover change have been limited to the Landsat era, with the earliest systematic studies beginning from approximately 2000 [6,7].
Recent advances in global land cover mapping have produced datasets with unprecedented temporal depth. The GLC_FCS30D product, developed by Zhang et al. [8], provides the first global 30 m land cover dynamics monitoring dataset with 35 subcategories spanning 1985 to 2022, derived from dense-time-series Landsat imagery. This product enables consistent multi-temporal analysis without the need for independent classification at each epoch, thereby reducing the methodological uncertainties inherent in multi-sensor comparisons. However, even this dataset cannot extend the observational record into the pre-Landsat era prior to 1985.
Declassified intelligence satellite imagery offers a unique opportunity to bridge this temporal gap. The CORONA program (1960–1972), operated by the United States Central Intelligence Agency, acquired over 860,000 images of the Earth’s surface using the KH-1 through KH-4B camera systems [9]. Following declassification by Executive Order 12951 in 1995, these images became publicly available through the United States Geological Survey (USGS) Earth Resources Observation and Science (EROS) Center. The CORONA KH-4 system achieved a ground resolution of approximately 1.8–7.6 m, providing spatial detail comparable to modern high-resolution commercial satellites [10]. However, all CORONA imagery is panchromatic (single-band), which severely limits its utility for spectral-based land cover classification methods. In recent years, CORONA imagery has been increasingly applied to urban land cover change studies: Li et al. [11] developed an automatic method for identifying urban built-up areas in Shanghai during the 1960s, Mihai et al. [12] demonstrated photogrammetric processing of CORONA KH-4B imagery for high-resolution landscape change mapping in the Danube region, and Rizayeva et al. [13] produced large-area land cover classifications from Corona imagery for the Caucasus Mountains using object-oriented methods. These studies collectively demonstrate the growing utility of declassified imagery for historical urban and land cover analysis.
Recent advances in deep learning-based image colorization have opened new possibilities for enhancing the interpretability of historical panchromatic imagery. Agapiou [14] demonstrated the feasibility of this approach by applying the DeOldify model to colorize a CORONA KH-4 image of Larnaca, Cyprus (1963), achieving an overall classification accuracy of 94% and a kappa coefficient of 0.91 using object-based image analysis with a support vector machine classifier. The emerging literature on satellite image colorization has further explored various deep learning architectures for converting grayscale satellite imagery to color representations suitable for land cover analysis [15]. While these studies established the validity of the colorization-to-classification pipeline for historical satellite imagery, they were limited to single-epoch analyses without integrating the colorized historical data into multi-temporal change detection frameworks that leverage modern global land cover products.
DDColor, a state-of-the-art image colorization architecture employing a dual-decoder design [16], represents the current benchmark in photo-realistic colorization. The architecture consists of a pixel decoder based on a UNet-like structure and a query-based color decoder utilizing transformer cross-attention mechanisms. With a ConvNeXt-Large backbone architecture [17] pretrained on ImageNet-22k, DDColor achieves superior performance in terms of color richness and semantic consistency compared to prior methods. However, models trained on natural photographs exhibit a significant domain gap when applied to satellite imagery, which features distinctive spectral characteristics, nadir viewing geometry, and unique land cover patterns absent from conventional photographic datasets.
This study addresses three primary objectives, which are outlined as follows. First, we apply a domain-adapted DDColor model to colorize declassified CORONA KH-4 imagery of Pyongyang acquired in 1967, producing pseudo-color composites that enhance visual interpretability of land cover features. Second, we conduct an exploratory unsupervised classification (K-Means) of the colorized imagery to generate a pre-Landsat land cover estimate. Third, we integrate this exploratory 1967 land cover map with a quantitative time-series analysis derived from the GLC_FCS30D global land cover dataset (1985–2022) to construct a comprehensive narrative of urban transformation spanning approximately five decades. In doing so, this study seeks to balance the methodological innovation of colorization-based historical classification with the substantive urban planning and land use policy implications of Pyongyang’s unique development trajectory, thereby contributing to both the remote sensing and urban studies literature. To our knowledge, this represents the first study to combine deep learning colorization of declassified imagery with a global land cover time-series product for multi-decadal change analysis in the DPRK, extending the quantitative observational record of Pyongyang’s urban transformation into the pre-Landsat era.
2. Materials and Methods
2.1. Study Area
The study area encompasses the central urban core and surrounding peri-urban zones of Pyongyang, DPRK. The region of interest (ROI) is defined by the coordinates 125.676° E–125.844° E and 38.954° N–39.066° N, covering an area of approximately 180.8 km2 (Figure 1). The ROI boundary was defined by geographic coordinates rather than administrative boundaries, as precise administrative boundary data for Pyongyang are not publicly available. The selected extent was designed to encompass the principal urban core, the Taedong River corridor, and the immediately adjacent peri-urban agricultural zones, thereby capturing the primary zone of urban-agricultural land conversion that constitutes the central phenomenon of interest. Pyongyang is situated on the Taedong River in the west-central part of the Korean Peninsula, characterized by a continental climate with distinct seasonal variations. The terrain consists of a relatively flat alluvial plain along the Taedong River, surrounded by low hills to the north and east with elevations ranging from approximately 10 m to 200 m above sea level. Key geographic features within the ROI include the Taedong River, which bisects the study area from northeast to southwest, the Pothong River to the west, and surrounding hill areas to the north and east (all shown in Figure 1).
Figure 1.
Location of the study area in Pyongyang, Democratic People’s Republic of Korea (DPRK). The red rectangle delineates the study area boundary (125.55° E–125.95° E, 38.88° N–39.12° N; approximately 35 km × 27 km). The background is a Sentinel-2 L2A true-color composite (bands B4, B3, B2) acquired during April–July 2024 at 10 m spatial resolution. The red star indicates the central location of Pyongyang. Inset map: location of Pyongyang on the Korean Peninsula (source: Esri Land Cover).
As the political, economic, and cultural center of the DPRK, Pyongyang has experienced distinct phases of urban development: post-war reconstruction (1953–1960s), socialist planned expansion during the Chollima era (1960s–1970s), continued growth under centralized planning (1980s), contraction and stagnation during the economic crisis of the 1990s, and renewed development in the 21st century [3,5]. These phases reflect a uniquely centralized approach to urban planning in which the state directly controlled all aspects of land allocation, construction, and population distribution. Unlike market-driven urbanization, where land use is shaped by economic forces and private decision-making, Pyongyang’s development has been entirely directed by state policy—from the Soviet-influenced reconstruction master plan of the 1950s through the monumental construction campaigns of recent decades [5,18]. This makes Pyongyang a particularly significant case for testing satellite-based urban change detection methods, as the observed land cover changes directly reflect deliberate policy decisions rather than emergent market processes. The city’s population has been estimated at approximately 2.8–3.3 million, though precise demographic data remain difficult to verify due to the limited availability of official statistics [19]. Figure 2 presents a timeline integrating the city’s urban development history with satellite data availability and the analysis epochs employed in this study.
Figure 2.
Timeline of Pyongyang’s urban development history, satellite data availability, and analysis epochs. Upper section: temporal coverage of satellite data sources used in this study—CORONA KH-1→4B (1960–1972), Landsat 1–9 (1972–present), GLC_FCS30D (1985–2022), and Sentinel-2 (2015–present)—shown as horizontal color-coded bands. Red triangles indicate the ten analysis epochs of this study (1967, 1985, 1990, 1995, 2000, 2005, 2010, 2015, 2020, 2022). Middle section: key historical events in Pyongyang’s urban development, color-coded by category (blue = political event, green = development project, red = crisis/sanctions, brown = this study). The Built-up percentage trend line (dark red) shows the trajectory from 35.9% (1967) through the peak of 57.1% (2015) to 51.3% (2022), with percentage scale on the left axis. Lower section: the three urbanization phases identified in this study—Phase 1: Consolidation (~36%, 1967–1985), Phase 2: Expansion (36→57%, 1985–2015), and Phase 3: Stabilization (→51%, 2015–2022).
2.2. Data Sources
2.2.1. Declassified CORONA KH-4 Imagery (1967)
The primary historical dataset consists of declassified CORONA KH-4 panchromatic satellite imagery acquired on 16 December 1967 (Scene ID: DS1105-2134DA168), obtained from the USGS EROS Center via the EarthExplorer platform (https://earthexplorer.usgs.gov/). The CORONA KH-4 system employed two J-3 panoramic cameras (forward and aft-looking) with a focal length of 609.6 mm, producing stereo image pairs on 70 mm film. The digitized imagery provides a ground resolution of approximately 1.8–7.6 m depending on the camera variant and scanning resolution [9,10]. The imagery is single-band (panchromatic) with pixel values representing reflected visible-spectrum radiance recorded on film (Table 1). Geometric correction was performed using six ground control points (GCPs) were selected from identifiable features common to both the CORONA image and the Sentinel-2 reference. An affine transformation (6-parameter: translation, rotation, and scale) was applied, yielding a fitting RMSE of approximately 48 m across the six GCPs. The transformation includes a rotation correction of approximately 12.5°, consistent with the known along-track orientation of the KH-4 camera system. To independently verify geometric accuracy—rather than relying solely on the fitting residuals of the GCPs used in the transformation—13 additional check points (CPs) were measured on terrain features identifiable in both the georeferenced CORONA image and the 2024 Sentinel-2 reference, none of which were used in deriving the affine parameters (Appendix G, Figure A5). After 2σ outlier rejection (1 point excluded), the independent RMSE was 16.7 m (12 CPs), corresponding to approximately 0.56 pixels at the 30 m GLC_FCS30D resolution and confirming sub-pixel geometric accuracy for the land-cover comparison.
Table 1.
Summary of remote sensing datasets used in this study.
It is important to note that the declassified CORONA imagery is provided in a non-orthorectified format. The KH-4 panoramic camera system introduces geometric distortions that include film deformation during the scanning process, panoramic distortion inherent to the camera design, and Earth curvature effects across the wide swath [9,12]. Full photogrammetric processing of CORONA imagery—including interior orientation recovery, lens distortion modeling, and rigorous bundle adjustment—requires camera calibration parameters that are not available for all missions, and typically demands a substantially larger number of ground control points (GCPs) than were accessible for the present study area due to the geopolitical restrictions on ground access in the DPRK.
Given these constraints, geometric correction was performed using a simplified approach. Six GCPs were identified from corresponding features in modern high-resolution Sentinel-2 imagery, selected at temporally stable landmarks such as road intersections, river confluence points, and the corners of large structures that were identifiable in both the 1967 and modern imagery. An affine transformation was applied, yielding a root mean square error (RMSE) of less than 50 m (Table 1). The affine model was selected over higher-order polynomial transformations because the limited number of GCPs (six) would risk overfitting with more complex models. The study area is characterized by predominantly flat to gently undulating terrain (elevation range 10–200 m a.s.l.), which minimizes the relief displacement effects that would necessitate full orthorectification. Nevertheless, the geometric accuracy is expected to vary across different land cover and terrain types due to differences in relief displacement and the temporal stability of reference features. The independent check point assessment (Appendix G, Table A5) confirms that all terrain categories achieve sub-pixel accuracy relative to the 30 m GLC_FCS30D grid (RMSE range: 8.0–22.6 m), with the highest residuals observed along riverside features where shoreline migration over the 57-year interval complicates feature matching.
The RMSE of less than 50 m corresponds to approximately 1.7 pixels at the 30 m resolution of the GLC_FCS30D comparison product. Because the primary analytical approach in this study relies on class-proportion comparison rather than pixel-level spatial correspondence, this level of geometric accuracy is considered sufficient for the intended analysis. A detailed assessment of geometric accuracy across different terrain and land cover conditions is presented in Appendix G.
2.2.2. GLC_FCS30D Global Land Cover Dataset (1985–2022)
The GLC_FCS30D dataset [8], accessed through the Google Earth Engine (GEE) platform (asset path: projects/sat-io/open-datasets/GLC-FCS30D), provides global land cover classification at 30 m spatial resolution with 35 subcategories derived from dense-time-series Landsat imagery. The dataset covers the period 1985–2022, with five-year intervals for 1985–1995 and annual resolution from 2000 onward. Nine temporal epochs were extracted for the study area: 1985, 1990, 1995, 2000, 2005, 2010, 2015, 2020, and 2022 (Table 1). The original 35 subcategories were remapped into a five-class scheme: Water (class 1), Forest (class 2), Agriculture (class 3), Built-up (class 4), and Others (class 5). The detailed remapping scheme is provided in Appendix B.
2.2.3. Sentinel-2 L2A (2024)
Modern reference imagery was acquired from the Copernicus Sentinel-2 Level-2A surface reflectance product (COPERNICUS/S2_SR_HARMONIZED) via GEE. Images from April to July 2024 with less than 30% cloud cover were selected and composited using a median reducer. Sentinel-2 provides 13 spectral bands at spatial resolutions of 10 m (Bands 2, 3, 4, 8), 20 m (Bands 5, 6, 7, 8A, 11, 12), and 60 m (Bands 1, 9, 10). This imagery was used for visual reference and for generating the study area Figure 1 (Table 1).
2.2.4. Training Data for Colorization Model
The domain adaptation of the DDColor model required a large corpus of paired grayscale–color satellite imagery. The training dataset was assembled from four publicly available high-resolution multispectral satellite image collections: (1) WorldView-3 super-resolution training imagery covering the Korean Peninsula [20], consisting of 3-band RGB images at 512 × 512 pixels; (2) SpaceNet 2 building detection challenge imagery (pan-sharpened multispectral, 8-band, 650 × 650 pixels; available at https://registry.opendata.aws/spacenet/, accessed on 3 April 2026); (3) SpaceNet 3 road detection challenge imagery (pan-sharpened multispectral, 8-band, 1300 × 1300 pixels); and (4) SpaceNet 4 building detection challenge imagery (pan-sharpened, 4-band, 900 × 900 pixels). For the SpaceNet multispectral datasets, bands 5, 3, and 2 (corresponding to red, green, and blue) were extracted to construct RGB composites.
All images were resampled to 256 × 256 pixels using Lanczos interpolation. For each RGB patch, a synthetic grayscale version was generated by converting from the RGB color space to the CIE L*a*b* color space and extracting the L (luminance) channel, simulating the panchromatic appearance of the CORONA imagery. Sixteen-bit imagery was normalized to 8-bit using the 2nd and 98th percentile stretch to preserve radiometric contrast while avoiding outlier saturation. The combined dataset yielded approximately 51,000 image pairs prior to quality filtering. After excluding tiles with more than 50% black pixels (pixel value < 10 across all channels) to remove no-data regions, 33,711 pairs were retained and split into training (32,026 pairs, 95%) and validation (1685 pairs, 5%) subsets.
2.3. Methods
The methodological framework consists of three sequential components: (1) domain-adapted colorization of the CORONA imagery and exploratory K-Means classification, (2) GLC_FCS30D-based multi-temporal land cover extraction, and (3) integrated analysis combining the 1967 exploratory classification with the 1985–2022 quantitative time series (Figure 3).
Figure 3.
Methodological framework of this study. Phase 1: data acquisition (CORONA KH-4 1967, DDColor training pairs, GLC_FCS30D 1985–2022, Sentinel-2 2024, GCPs and independent check points). Phase 2: DDColor domain adaptation and patch-based colorization of the CORONA scene. Phase 3: dual-branch classification—unsupervised K-Means (k = 5) on the colorized 1967 imagery and five-class remapping of nine-epoch GLC_FCS30D maps—with cross-reference of pixel-level accuracy and class proportions. Phase 4: integrated 55-year analysis combining the 1967 exploratory classification with the 1985–2022 time series to derive a three-phase urbanization narrative (consolidation, expansion, stabilization).
2.3.1. DDColor Architecture and Domain Adaptation
DDColor is an end-to-end image colorization framework employing a dual-decoder architecture, representing one of the most advanced approaches in the deep learning colorization literature [16]. The encoder is based on a ConvNeXt-Large backbone architecture [17], pretrained on ImageNet-22K, which extracts multi-scale feature representations from the input grayscale image. These features are processed by two parallel decoders: a pixel decoder with a UNet-like architecture that progressively upsamples feature maps to reconstruct spatial details, and a query-based color decoder that utilizes learnable color queries (N = 100) processed through nine transformer decoder layers with cross-attention mechanisms to establish semantic correspondences between image content and color distributions.
For domain adaptation to satellite imagery, the pretrained DDColor model (originally trained on natural photographs) was fine-tuned on the satellite image dataset described in Section 2.2.4. After preprocessing and quality filtering (excluding tiles with >50% black pixels), a total of 33,711 image pairs were retained and split into training (32,026 pairs, 95%) and validation (1685 pairs, 5%) subsets. The fine-tuning procedure employed a standard optimization configuration with an initial learning rate of 1 × 10⁻⁴ and a weight decay of 1 × 10⁻². A warmup-then-cosine learning rate schedule was applied, with a linear warmup over the first 5 epochs followed by cosine annealing. Mixed-precision training (BF16) with gradient checkpointing was used to optimize GPU memory utilization. The composite loss function [21] consisted of three components:
where L1 is the pixel-wise L1 loss between predicted and ground-truth a*b* channels in the CIE L*a*b* color space (λ1 = 1.0), L_perceptual is the perceptual loss computed using deep feature representations [22] (λ2 = 5.0), and L_colorfulness is a regularization term encouraging chromatic diversity in the output (λ3 = 0.5). In plain terms, the three loss components serve complementary objectives: L1 penalizes pixel-level color deviations, L_perceptual ensures that the colorized output appears visually realistic by comparing deep feature representations, and L_colorfulness prevents the model from producing desaturated results. The weighting coefficients reflect the priority of perceptual quality (λ2 = 5.0) over strict pixel-level accuracy (λ1 = 1.0), consistent with the goal of producing visually interpretable pseudo-color imagery rather than spectrally calibrated output. Training was conducted for 200 epochs on a high-performance computing (HPC) cluster equipped with NVIDIA A100 80 GB GPUs (DELL PowerEdge XE8545, AMD EPYC 7763 processors, 240 GiB RAM) with a batch size of 64. The quality of the colorization output was evaluated on the validation set (n = 1685) using three complementary metrics: peak signal-to-noise ratio (PSNR), structural similarity index measure (SSIM) [23], and learned perceptual image patch similarity (LPIPS). The results are summarized in Table 2.
Table 2.
Quantitative evaluation of the fine-tuned DDColor model on the validation set (n = 1685).
2.3.2. Large-Image Inference and Colorization
The CORONA imagery, with its panoramic format covering a swath of approximately 16 km × 217 km, significantly exceeds the 256 × 256 pixel input size of the DDColor model. To process these large-format images, a patch-based inference strategy was employed. The input image was divided into overlapping patches of 256 × 256 pixels with a stride of 192 pixels (64-pixel overlap). Each patch was independently colorized by the model, and the resulting patches were reassembled using Gaussian-weighted blending in the overlap regions to minimize boundary artifacts. Sigma correction (σ = 1) was applied to optimize contrast in the colorized output.
2.3.3. Exploratory Land Cover Classification of Colorized CORONA Imagery
Rather than applying supervised classifiers requiring manual training sample collection—which would introduce subjective uncertainty for an era without ground truth—the colorized 1967 imagery was classified using unsupervised K-Means clustering on the RGB color space. The rationale for this approach is that the DDColor model, having learned color-semantic associations from millions of natural and satellite images, assigns spectrally plausible colors to different land cover types (e.g., blue for water, green for vegetation, gray-brown for built-up areas). These color differences, while not representing true spectral reflectance, provide sufficient inter-class separability for unsupervised clustering.
The heuristic class assignment rules were preferred over manual visual interpretation of cluster maps—which would introduce subjective bias and reduce reproducibility—and over supervised or semi-supervised labeling approaches, which would require training samples derived from the pseudo-color imagery itself, creating a circular dependency in which classification accuracy reflects the operator’s interpretation of synthetic colors rather than genuine land cover characteristics. The automated heuristic rules exploit the DDColor model’s learned color-semantic associations that are broadly consistent across natural image domains, providing an objective and reproducible basis for class labeling without human intervention.
The classification procedure was as follows. First, the colorized image was cropped to the study ROI matching the GLC_FCS30D extraction area. To manage computational requirements (the full-resolution image contains approximately 33.7 million pixels), K-Means centroids were trained on a 25% downsampled version of the image with five replicates, and the resulting centroids were then applied to the full-resolution image through nearest-centroid assignment computed row-by-row to conserve memory. Five clusters (k = 5) were generated and automatically assigned to land cover classes based on the color characteristics of each cluster centroid: the cluster with the highest blue dominance (B − (R + G)/2) was assigned to Water; the cluster with the highest green dominance (G − R) was assigned to Forest; the cluster with the lowest saturation (minimum range of R, G, B values) was assigned to Built-up; the brightest remaining cluster was assigned to Agriculture; and the remaining cluster was assigned to Others. The detailed classification parameters are presented in Appendix D.
The five land cover classes employed in this study are defined as follows. Water encompasses all open water surfaces including the Taedong River, its tributaries, and any standing water bodies. Forest includes all tree-covered areas on hillsides and along riverbanks, regardless of species composition. Agriculture encompasses all cultivated land including paddy fields and dry cropland in the peri-urban zones surrounding the city center. Built-up includes all impervious surfaces associated with urban development—residential blocks, industrial facilities, roads, and other constructed infrastructure. Others is a residual category capturing transitional zones, bare soil, sparse vegetation, and areas where the pseudo-color output did not produce sufficient chromatic differentiation for unambiguous class assignment. The relatively broad definition of these classes reflects the limitations of unsupervised clustering on pseudo-color imagery and is designed to maximize comparability with the GLC_FCS30D five-class remapping scheme (Appendix B). It is noted that the K-Means algorithm, operating solely on RGB color values without spatial context or texture information, may not reliably distinguish between spectrally similar classes—particularly between built-up surfaces and bare agricultural fields in the winter imagery, which contributes to the substantial Others category (29.3%) in the 1967 classification.
The choice of K-Means with k = 5 was determined by the need for direct comparability with the five-class GLC_FCS30D remapping scheme. While the default squared Euclidean distance metric and random initialization are standard K-Means parameters, the specific configuration (500 maximum iterations, 5 replicates on 25% downsampled imagery, random seed 42) was selected to balance computational efficiency with classification stability. The use of 5 replicates ensures that the final solution is not overly sensitive to the random initial centroid placement (Appendix D).
2.3.4. GLC_FCS30D Land Cover Extraction
Land cover data for the Pyongyang ROI were extracted from the GLC_FCS30D dataset using GEE. The annual collection and five-year collection were mosaicked and the appropriate bands selected for each of the nine analysis years. The original classification codes were remapped to the five-class scheme as follows: codes 10–20 (cropland types) → Agriculture; codes 51–92 (forest and shrub types) → Forest; code 190 (impervious surface) → Built-up; codes 210, 220 (water bodies and permanent ice/snow) → Water; and all remaining codes → Others. The complete remapping table is provided in Appendix B. For each epoch, per-class areas (km2) were computed using pixel area summation within the ROI, and class proportions were calculated relative to the total ROI area of 180.8 km2.
2.3.5. Integrated Analysis
The 1967 colorization-based classification was compared with the GLC_FCS30D products through two approaches. First, the class proportions from the 1967 K-Means classification were compared with the 1985 and 2022 GLC_FCS30D proportions to assess whether the colorization-based approach captures meaningful land cover signals. Second, a pixel-level overall accuracy (OA) was computed by resampling the 1967 classification to match the 30 m resolution of the GLC_FCS30D 1985 product using nearest-neighbor interpolation. It is noted that this OA metric reflects the combined effects of actual land cover change over 17 years, colorization model uncertainty, and resolution discrepancy, and is therefore reported as a reference indicator rather than a strict accuracy assessment.
3. Results
3.1. Colorization Results
The domain-adapted DDColor model successfully assigned spectrally plausible colors to the major land cover types visible in the 1967 CORONA panchromatic imagery (Figure 4). Urban areas appear in characteristic gray-brown tones, agricultural fields in yellow-green hues, forested hillsides in darker green, and the Taedong River and its tributaries in blue-dark tones. Compared to the baseline ImageNet-pretrained model, the domain-adapted version produced more realistic vegetation coloring and more consistent water body representation. The colorized imagery exhibited sufficient visual contrast between the major land cover classes to support both visual interpretation and unsupervised classification. To illustrate the colorization performance across different land cover types, enlarged comparison panels for four representative areas—(i) urban core, (ii) agricultural zone, (iii) Taedong River corridor, and (iv) hillside/forest—are presented in Appendix G.2 (Figure A5 and Figure A6). These panels demonstrate that the DDColor model, while not reproducing true spectral reflectance, generates sufficient chromatic differentiation to support the subsequent unsupervised classification, with water surfaces showing the strongest colorization fidelity and agricultural/built-up boundaries representing the greatest challenge due to the spectral ambiguity of fallow winter fields.
Figure 4.
Comparison of original and colorized CORONA imagery with modern satellite data for the Pyongyang study area: (a) original CORONA KH-4 panchromatic image (16 December 1967), (b) DDColor colorized output assigning spectrally plausible pseudo-colors (gray-brown = urban, yellow-green = agriculture, dark green = forest, blue-dark = water), and (c) Sentinel-2 L2A true-color composite (April–July 2024) as a modern reference. Color-coded rectangles indicate the locations of four representative sample areas corresponding to key land cover types (see Appendix G.2, Figure A5 and Figure A6): red = Urban core, green = Agricultural, blue = Taedong River, yellow = Hill/Forest. Scale bar: 2 km. North arrow indicated. The pseudo-colors do not represent true spectral reflectance values.
3.2. Exploratory Land Cover Classification of the 1967 Imagery
The K-Means classification of the colorized 1967 CORONA imagery produced a five-class land cover map. The five cluster centroids and their automatic class assignments are presented in Table 3. The classification yielded the following land cover proportions: Built-up 35.9%, Water 15.0%, Agriculture 12.4%, Forest 7.3%, and Others 29.3%. The relatively large Others category (29.3%) suggests that the five-cluster scheme may not fully capture the spectral complexity of the pseudo-color imagery, particularly in transitional zones between urban and agricultural surfaces. All image processing and K-Means clustering were performed using MATLAB R2025b (The MathWorks, Inc., Natick, MA, USA).The spatial distribution of the 1967 classification is presented within the integrated analysis (Section 3.4).
Table 3.
K-Means cluster centroids (RGB, 0–1 scale) and automatic class assignment for the 1967 colorized CORONA imagery. Classification parameters: k = 5, squared Euclidean distance, 500 maximum iterations, 5 replicates, random seed 42 (see Appendix D).
When compared against the GLC_FCS30D 1985 classification at the pixel level, the overall accuracy was 17.2%. The class-level agreement varied substantially, with Water showing relatively high spatial correspondence due to the stable geometry of the Taedong River, while Agriculture showed the lowest agreement, reflecting both the 17-year temporal gap and the tendency of the colorization model to assign muted gray-brown tones to agricultural fields that overlap spectrally with urban surfaces in the pseudo-color output.
3.3. GLC_FCS30D Land Cover Time Series (1985–2022)
The GLC_FCS30D extraction yielded a consistent nine-epoch land cover time series for the Pyongyang ROI (180.8 km2). Figure 5 presents the land cover maps for four representative epochs (1985, 2000, 2015, 2022), and the complete nine-epoch maps are provided in Appendix A. All maps include graphical scale bars and north arrows for spatial reference.
Figure 5.
GLC_FCS30D land cover maps for four representative epochs in the Pyongyang study area (180.8 km2): (a) 1985, (b) 2000, (c) 2015, and (d) 2022. Built-up area increased from 65.0 km2 (36.0%) in 1985 to a peak of 103.2 km2 (57.1%) in 2015, then declined to 92.7 km2 (51.3%) by 2022, with expansion concentrated along the Taedong River corridor at the expense of agricultural land. The five-class remapping scheme is detailed in Appendix B.
The per-class areas and proportions for all nine epochs are summarized in Table 4. The dominant land cover class shifted from agriculture (54.3%, 98.2 km2) in 1985 to built-up (57.1%, 103.2 km2) by 2015, indicating that urbanization occurred primarily through the conversion of agricultural land. The temporal trends of these two classes are illustrated in Figure 6, which reveals a clear inverse relationship: as built-up area expanded steadily over three decades, agricultural area contracted at a nearly equivalent rate, with the crossover point occurring between 1995 and 2000 when built-up proportion first exceeded that of agriculture.
Table 4.
Land cover area (km2) and proportion (%) for the Pyongyang ROI, 1985–2022 (GLC_FCS30D).
Figure 6.
Temporal trends of built-up area (dark red, left y-axis) and agricultural area (gold, right y-axis) in the Pyongyang ROI (180.8 km2), 1985–2022, derived from GLC_FCS30D. Vertical dashed lines mark key historical events: “Arduous March” (1994), Inter-Korean Summit (2000), UN Sanctions Intensified (2016), and COVID-19 Border Closure (2020). Three colored background bands indicate the urbanization phases: Phase 1: Consolidation (blue-tinted, pre-1985), Phase 2: Expansion (red-tinted, 1985–2015), and Phase 3: Stabilization (green-tinted, 2015–2022). The two classes exhibit a clear inverse relationship, with built-up area expanding from 65.0 km2 to a peak of 103.2 km2 in 2015 before declining to 92.7 km2 by 2022, while agricultural area decreased correspondingly from 98.2 km2 to 70.8 km2.
The ROI boundary (125.676° E–125.844° E, 38.954° N–39.066° N) used for area computation is identical across all nine epochs, ensuring temporal consistency. As noted in Section 2.1, this boundary is defined by geographic coordinates and does not correspond to any administrative division.
The analysis reveals several notable trends. Built-up area expanded substantially from 65.0 km2 (36.0%) in 1985 to a peak of 103.2 km2 (57.1%) in 2015, representing a net increase of 38.2 km2 over three decades. This was followed by a slight decline to 92.7 km2 (51.3%) by 2022. Agricultural land exhibited a corresponding decline from 98.2 km2 (54.3%) in 1985 to a minimum of 59.9 km2 (33.1%) in 2015, with a partial recovery to 70.8 km2 (39.2%) by 2022 (Appendix C Figure A2). Water and forest areas remained relatively stable throughout the study period, fluctuating narrowly around 13.0 km2 (7.1%) and 3.3 km2 (1.8%), respectively (Appendix C Figure A3).
3.4. Integrated 1967–2022 Analysis
To extend the temporal baseline beyond the GLC_FCS30D series (1985–2022), the colorized 1967 CORONA KH-4 panchromatic imagery was classified using the unsupervised K-Means method (k = 5) described in Section 2.3.3 and compared with the nine-epoch GLC_FCS30D products. This integration enables a continuous 55-year land cover trajectory from 1967 to 2022, bridging the pre-Landsat era with the modern satellite record. Figure 7 presents the full processing pipeline from the original grayscale CORONA acquisition (16 December 1967) through DDColor colorization and K-Means classification, alongside the GLC_FCS30D 1985 and 2022 reference maps, allowing direct visual comparison of the land cover distribution across the three key time points.
Figure 7.
CORONA-based classification pipeline and GLC_FCS30D reference maps for the Pyongyang study area (180.8 km2). (a) Original CORONA KH-4 panchromatic image (16 December 1967). (b) DDColor colorized output. (c) K-Means classification (k = 5) of the colorized imagery. (d) GLC_FCS30D 1985 (Built-up: 36.0%). (e) GLC_FCS30D 2022 (Built-up: 51.3%). Color legend: blue = Water, green = Forest, yellow/gold = Agriculture, dark red = Built-up, gray = Others.
The most notable finding is the close agreement in built-up proportion between the 1967 K-Means estimate (35.9%) and the 1985 GLC_FCS30D value (36.0%). While the precise numerical correspondence may be partly coincidental given the fundamentally different methodologies and the 17-year temporal gap, it suggests that the built-up footprint of Pyongyang was already substantial by the late 1960s and remained relatively stable through the mid-1980s. This interpretation is consistent with historical accounts indicating that post-war reconstruction of Pyongyang’s core was largely completed by the mid-1960s, with major peripheral expansion occurring from the 1970s onward in preparation for events such as the 13th World Festival of Youth and Students (1989) [3,5]. The comparison between the 1967 estimate and the 2022 endpoint reveals a substantial increase in built-up proportion from 35.9% to 51.3%, accompanied by a corresponding decline in agricultural land. Figure 8 compares the land cover proportions across three key epochs, illustrating these phase transitions.
Figure 8.
Land cover proportions (%) for 1967 (DDColor + K-Means), 1985 (GLC_FCS30D), and 2022 (GLC_FCS30D). The 1967 built-up estimate (35.9%) closely approximates the 1985 value (36.0%), while Agriculture and Others show substantial divergence, reflecting pseudo-color limitations and the 17-year temporal gap.
The temporal trajectory of land cover change can be meaningfully connected to key historical moments in Pyongyang’s urban planning history, as illustrated in the annotated trend plot (Figure 6). The period of built-up consolidation (1967–1985, ~36%) corresponds to the completion of post-war reconstruction and the Chollima era. The rapid expansion phase (1985–2015, rising to 57.1%) encompasses the preparations for the 13th World Festival of Youth and Students (1989), the “Arduous March” famine (1994–1998) during which urban expansion briefly stalled, and the subsequent recovery including major showcase construction projects such as Ryomyong Street (initiated circa 2012). The post-2015 stabilization coincides with intensified UN sanctions (2016) and the COVID-19 border closure (2020).
To examine the spatial dimension of these temporal trends, three representative sub-areas were selected from the 1967 CORONA K-Means classification (Figure 9): (a) the Central Core, encompassing the main government and commercial district north of the Taedong River; (b) the Taedong River corridor, where riverfront development has been most intensive; and (c) the southwestern peri-urban zone, where agricultural-to-urban conversion is most prominent. Multi-epoch land-cover panels for these sub-areas (1967–2022) are presented in Appendix H (Figure A7), revealing that the Central Core maintained consistently high built-up density (70–82%) from 1985 onward, the Taedong River corridor exhibited the most rapid expansion (52.8% → 70.0%, 1985–2015), and the southwestern peri-urban zone demonstrated the clearest agricultural-to-urban conversion (20.6% → 66.2%, 1985–2015) followed by a partial decline to 59.8% in 2022. These sub-area patterns confirm that the aggregate trends observed in Figure 6 are spatially heterogeneous, with expansion driven primarily by riverfront and peri-urban development rather than uniform densification.
Figure 9.
The 1967 CORONA KH-4 K-Means land cover classification (k = 5) for the Pyongyang study area (180.8 km2), with three representative sub-areas indicated by color-coded rectangles: (a) Central Core (red), (b) Taedong River corridor (blue), and (c) SW Peri-urban zone (yellow). Multi-epoch land-cover panels (1967, 1985, 2000, 2015, 2022) for these sub-areas are presented in Appendix H (Figure A7). Color legend: blue = Water, green = Forest, yellow/gold = Agriculture, dark red = Built-up, gray = Others. Scale bar: 2 km. North arrow indicated.
4. Discussion
4.1. Effectiveness and Limitations of Colorization-Based Historical Land Cover Reconstruction
The pixel-level overall accuracy (OA) of 17.2% between the 1967 K-Means classification and the 1985 GLC_FCS30D product is low by conventional remote sensing standards. However, interpreting this metric at face value would be misleading, as it is fundamentally confounded by three independent sources of disagreement that cannot be separated with available data: (a) genuine land cover change over the 17-year temporal gap (1967–1985), (b) the inherent limitations of pseudo-color generation that optimizes perceptual naturalness rather than spectral fidelity, and (c) the resolution discrepancy between the CORONA imagery (~2 m, ~33.7 million pixels within the ROI) and the GLC_FCS30D product (30 m, ~200,000 pixels). These factors collectively render strict pixel-level comparison inappropriate as an isolated measure of classification quality.
A more informative perspective emerges from examining the colorization-to-classification error propagation pathway. The domain-adapted DDColor model achieves a validation PSNR of 32.61 dB and SSIM of 0.974 (Table 2), confirming high structural fidelity between input and output. However, the K-Means cluster centroids (Table 3) reveal that all five clusters exhibit remarkably low saturation values (range: 0.004–0.040), indicating that the pseudo-color output retains predominantly luminance-based contrast rather than strong chromatic differentiation. In practical terms, the colorization model produces images that appear visually plausible—water is dark, vegetation is slightly greener, built-up surfaces are gray-brown—but the color differences between classes are subtle relative to the within-class luminance variation. The K-Means algorithm therefore partitions the image primarily along a brightness gradient rather than along true spectral boundaries, which explains why pixel-level class assignments frequently disagree with the spectrally derived GLC_FCS30D classification while the aggregate luminance distribution still correlates with broad land cover proportions.
Despite this limitation, the class-proportion comparison reveals a more meaningful picture. A class-by-class proportion comparison between the 1967 K-Means classification and the 1985 GLC_FCS30D product reveals highly variable inter-class reliability. Built-up proportions show close agreement (35.9% vs. 36.0%), while substantial divergences are observed in the remaining classes: Water is overestimated in 1967 (15.0% vs. 7.2%), likely because the DDColor model’s blue rendering extends into shadow zones and dark riparian areas; Forest is similarly overestimated (7.3% vs. 1.8%), potentially reflecting shadowed hillside pixels; Agriculture is severely underestimated (12.4% vs. 54.3%); and the Others category absorbs the difference (29.3% vs. 0.7%). These class-specific patterns indicate that a large portion of genuinely agricultural pixels are captured by the Others category in the 1967 output, due to the spectral ambiguity of fallow winter fields in the pseudo-color imagery. The pipeline’s reliability is therefore class-dependent: Built-up yields the most trustworthy proportion estimate, while Agriculture is substantially underestimated with the deficit redistributed primarily into Others.
While the precise numerical correspondence may be partly coincidental, the agreement is consistent with the broader statistical principle that aggregate estimates can remain robust despite noisy individual predictions [2]. This finding extends the work of Agapiou [14], who demonstrated colorization-based classification of CORONA imagery in Cyprus with 94% OA using supervised object-based analysis. The substantially lower accuracy observed in the present study can be attributed to three methodological differences: the use of unsupervised rather than supervised classification, the complex urban morphology of Pyongyang compared to the Mediterranean coastal landscape of Larnaca, and the particularly challenging winter acquisition conditions of the December 1967 CORONA scene, when deciduous vegetation was bare and agricultural fields were fallow, reducing the spectral contrast available for colorization.
The relatively large Others category in the 1967 classification (29.3%) warrants specific attention. In the 1985 GLC_FCS30D product, the corresponding Others category is only 0.7%, indicating that the 1967 Others class does not represent a genuine land cover type but rather a methodological artifact. Examination of the spatial distribution of Others pixels reveals that they concentrate in transitional zones between urban and agricultural surfaces where the pseudo-color output produces ambiguous gray-brown tones—tones that are insufficiently dark to be assigned to Built-up (which captures the lowest-saturation cluster) and insufficiently bright to be assigned to Agriculture (which captures the brightest remaining cluster). The Others proportion therefore functions as an inverse indicator of the colorization model’s discriminative power: a lower Others proportion would imply better chromatic differentiation. Future improvements in satellite-specific colorization—particularly in enhancing the saturation and spectral realism of pseudo-color output—would likely reduce the Others category and improve both pixel-level and proportion-level accuracy. Experimentation with larger values of k, or with more sophisticated clustering algorithms that incorporate texture and spatial context features, may also improve class discrimination in future applications.
The present results confirm that deep learning colorization can extend the historical observational record into the pre-Landsat era, but they equally demonstrate that the approach currently functions as an exploratory tool for approximate land cover estimation—suitable for deriving proportion-level baselines and constraining change trajectories—rather than as a substitute for multispectral classification.
4.2. Five Decades of Urban Transformation in Pyongyang
The integrated analysis spanning approximately 55 years (1967–2022) reveals a complex trajectory of urban change that can be meaningfully contextualized within the broader political, economic, and social history of the DPRK. The annual rates of land cover change for all inter-epoch periods are summarized in Appendix E, and the relationship between land cover trends and key historical events is visualized in Figure 6 (annotated trend plot) and Figure 2 (timeline).
Phase 1: Post-Reconstruction Consolidation (1967–1985, ~36%). The 1967 colorized CORONA imagery provides the earliest satellite-derived spatial record of Pyongyang’s post-reconstruction urban extent. The estimated built-up proportion of 35.9% closely approximates the GLC_FCS30D 1985 value of 36.0%, suggesting that the urban footprint of central Pyongyang remained relatively stable over this approximately two-decade period. This stability is consistent with historical accounts describing the concentration of reconstruction efforts on the city center and key industrial zones during the Chollima Movement of the late 1950s and 1960s [3]. The implication is that subsequent development during the 1970s and early 1980s was primarily characterized by densification and vertical growth (e.g., replacement of low-rise structures with apartment blocks) rather than outward spatial expansion—a finding that could not have been derived from Landsat-era data alone and represents a novel contribution of the CORONA-based analysis.
Phase 2: Sustained Expansion (1985–2015, 36.0%→57.1%). The period from 1985 to 1995 was characterized by modest built-up growth, with the proportion increasing from 36.0% to 38.4% over a decade (annual rate: +0.41 to +0.49 km2/yr; Appendix E). This slow growth rate is inseparable from the deepening economic crisis following the collapse of the Soviet Union and the cessation of preferential trade arrangements after 1988. The catastrophic famine of 1994–1998, known as the “Arduous March,” estimated to have caused between 600,000 and one million deaths [4], devastated not only the agricultural sector but also the state’s capacity for capital construction. Haggard and Noland [24] documented how the famine fundamentally disrupted the centralized distribution system that had sustained Pyongyang’s privileged status as a showcase capital. The near-stagnation of urban expansion during this period thus reflects a broader systemic crisis rather than merely a slowdown in construction activity.
A dramatic acceleration occurred between 1995 and 2000, during which built-up area surged from 69.5 km2 (38.4%) to 89.6 km2 (49.5%) at an annual rate of approximately +4.0 km2/yr—an order of magnitude faster than the preceding decade. This sharp increase should be interpreted with some caution, as it coincides with the transition from five-year to annual classification intervals in the GLC_FCS30D methodology, which may introduce discontinuities in the detected change rate. Nevertheless, the expansion continued at a more moderate but sustained pace from 2000 to 2015, with built-up area reaching 103.2 km2 (57.1%). The spatial pattern of this growth, visible in the sequential GLC_FCS30D maps (Appendix A) and synthesized in the change map (Figure 9), shows expansion extending outward from the historic urban core along the Taedong River corridor and into previously agricultural areas. This pattern is consistent with known state-led development projects, including preparations for the 13th World Festival of Youth and Students (1989) and later the Ryomyong Street residential complex [5,25]. Over the entire 30-year expansion phase, built-up area increased by 38.2 km2 (net gain of ~59%), driven almost entirely by the conversion of agricultural land from 98.2 km2 (54.3%) to 59.9 km2 (33.1%).
The near-halving of agricultural land within the study area carries implications that extend beyond land cover statistics. The DPRK has experienced chronic food insecurity since the 1990s, with the United Nations World Food Programme repeatedly identifying the country as one of the most food-insecure nations in Asia. The conversion of 38.3 km2 of agricultural land to urban use within the capital’s vicinity—the most politically privileged region of the country—is consistent with an interpretation that urban modernization priorities may have taken precedence over local food production capacity during the expansion phase. However, the absence of policy documents and ground-level agricultural productivity data precludes definitive causal attribution, and it remains possible that agricultural intensification or redistribution elsewhere partially offset the area loss within the ROI.
Phase 3: Stabilization Under Economic Isolation (2015–2022, 57.1%→51.3%). The apparent decline in built-up area from 103.2 km2 in 2015 to 92.7 km2 by 2022, accompanied by a partial recovery of agricultural land to 70.8 km2 (39.2%), requires particularly cautious interpretation. Two categories of explanation must be considered.
The geopolitical explanation is supported by the timeline of external constraints. International sanctions imposed by the United Nations Security Council intensified significantly after 2016, restricting the import of construction materials and heavy equipment. The COVID-19 pandemic prompted the DPRK to close its borders almost entirely from January 2020, further curtailing economic activity [25]. Lee [26] demonstrated that economic sanctions caused economic activity to concentrate disproportionately in Pyongyang, suggesting that the capital’s development trajectory is inextricably linked to the country’s external economic relations. Under this interpretation, the concurrent recovery of agricultural land may reflect a deliberate policy recalibration toward food self-sufficiency—a forced shift from the urban modernization imperative that dominated the preceding decades.
However, methodological factors cannot be entirely excluded. The GLC_FCS30D classification inherits uncertainties from the underlying Landsat time series, and the 2020–2022 period may be affected by reduced Landsat scene availability over the Korean Peninsula, changes in atmospheric conditions, or algorithmic sensitivity in the continuous change detection method. The particularly sharp reversal between 2020 and 2022 (annual rate of −4.78 km2/yr for Built-up; Appendix E) is substantially faster than any preceding change and warrants skepticism. Independent verification using high-resolution commercial satellite imagery (e.g., Planet, Maxar) would be necessary to definitively confirm whether the observed decline represents genuine re-conversion of built-up land to agricultural use or a classification artifact. The overall trajectory from 36% to over 50% built-up area remains robust regardless of the interpretation of the post-2015 period.
Throughout the entire study period, water bodies and forest areas remained remarkably stable, with water fluctuating between 12.4 and 13.1 km2 (6.9–7.2%) and forest between 2.9 and 3.4 km2 (1.6–1.9%) (Appendix C). The persistence of forest patches on hillsides indicates that urban expansion occurred almost exclusively at the expense of agricultural land—a pattern that contrasts with many rapidly urbanizing cities elsewhere in East Asia where deforestation commonly accompanies urban growth, and reflects the relatively flat topography of Pyongyang’s expansion zones.
4.3. Geometric Considerations
The integration of data from complementary sensors with fundamentally different geometric properties requires explicit discussion. The CORONA KH-4 panoramic camera system introduces geometric distortions including film deformation, panoramic sweep distortion, and Earth curvature effects across the wide imaging swath [9,12]. The GLC_FCS30D product, by contrast, inherits the well-characterized geolocation accuracy of the Landsat series (~12 m). The affine geometric correction applied to the CORONA imagery in this study (RMSE < 50 m using 6 GCPs) represents a simplified approach that does not account for the full complexity of CORONA camera geometry.
Several factors mitigate the impact of this geometric limitation on the study’s conclusions. First, the primary analytical metric is class proportion computed over the entire ROI (180.8 km2), which is inherently robust to moderate positional errors because random displacements cancel out at the aggregate level. Second, the study area is predominantly flat (Taedong River alluvial plain, elevation 10–200 m a.s.l.), limiting relief displacement to the peripheral hill areas that constitute a small fraction of the total ROI and experienced minimal land cover change. Third, the 50 m RMSE corresponds to approximately 1.7 pixels at the 30 m GLC_FCS30D resolution, which is comparable to the geolocation uncertainty of early Landsat scenes and represents a well-understood source of error in multi-temporal analyses.
The terrain-stratified accuracy assessment (Appendix G, Table A5) reveals that all four terrain categories achieve sub-pixel accuracy relative to the 30 m GLC_FCS30D grid: flat built-up areas (RMSE = 13.9 m, n = 3), flat agricultural areas (16.1 m, n = 3), hillside features (8.0 m, n = 3), and riverside features (22.6 m, n = 3). The slightly elevated riverside RMSE is attributable to shoreline and channel migration over the 57-year interval rather than to geometric model deficiency. Critically, the flat built-up and agricultural zones—where the majority of urban-agricultural land cover conversion occurred—exhibit RMSE values well below one GLC_FCS30D pixel (30 m), confirming that geometric uncertainty does not materially affect the proportion-based change estimates in the primary zone of interest.
For future studies applying CORONA imagery in areas with more complex topography, full photogrammetric processing—incorporating stereo pair analysis, DEM-based orthorectification, interior orientation recovery, and a substantially larger GCP network—would be essential [12,13]. The simplified approach employed here is justified by the specific combination of predominantly flat terrain, proportion-based analysis, and the constraints imposed by the inaccessibility of the DPRK for ground truth collection.
The independent check point analysis (Appendix G, Table A5 and Table A6) confirms that the residual geometric error (RMSE = 16.7 m after 2σ outlier rejection, 12 CPs) is well below one GLC_FCS30D pixel (30 m), indicating that positional uncertainty does not materially affect the land-cover proportion estimates reported in this study. The single excluded outlier (CP02, 145.3 m) is located near the Taedong River bank where 57 years of channel migration may have shifted the apparent shoreline position. Terrain-stratified results (Table A6) show consistent sub-pixel accuracy across all four categories, with flat built-up (13.9 m), flat agricultural (16.1 m), and hillside (8.0 m) areas all exhibiting RMSE values substantially below the 30 m analysis resolution, and riverside features (22.6 m) remaining within acceptable limits despite the inherent temporal instability of fluvial landmarks.
4.4. The Synergy Between CORONA KH-4 and Multispectral Data
The integration of CORONA KH-4 panchromatic imagery with the GLC_FCS30D multispectral-derived product raises questions of data compatibility across three dimensions: spatial resolution, geometric accuracy, and class definition consistency.
Regarding spatial resolution, the CORONA imagery (~2 m) provides approximately 15 times finer spatial detail than the GLC_FCS30D product (30 m). When the 1967 classification is resampled to 30 m for pixel-level comparison, substantial information loss occurs, and the mixed-pixel effect at the 30 m scale may explain a significant portion of the pixel-level disagreement. Conversely, the higher resolution of the CORONA classification means that proportion-level estimates are derived from approximately 33.7 million independent pixels, compared to approximately 200,000 at 30 m resolution, which statistically favors more stable aggregate estimates.
Regarding geometric accuracy, the independent check point assessment yielded an overall RMSE of 16.7 m (Appendix G, Table A6), corresponding to approximately 0.56 GLC_FCS30D pixels—well within one pixel of the 30 m reference grid. For pixel-level comparison, this introduces a systematic error floor that limits achievable agreement even assuming perfect classification. For proportion-level comparison, however, random positional errors cancel out across the ROI, and the impact on aggregate class proportions is negligible provided the errors are not systematically biased toward particular land cover types—a condition that is satisfied by the affine transformation model, which distributes residual errors relatively uniformly across the image.
Regarding class definition consistency, the five-class scheme was deliberately designed to accommodate the limited discriminative power of pseudo-color K-Means classification while maintaining meaningful correspondence with the GLC_FCS30D remapping (Appendix B). Water and Built-up show the strongest inter-dataset consistency because they occupy distinctive positions in both luminance space (pseudo-color) and spectral space (Landsat-derived). Agriculture and Others show the weakest consistency due to the colorization model’s tendency to assign spectrally ambiguous gray-brown tones to bare agricultural fields in the winter imagery, producing overlap with urban surface tones in the pseudo-color output.
The unique significance of CORONA KH data for urban land use planning analysis lies in its irreplaceable temporal position. No other satellite dataset provides spatial information at sub-10 m resolution for the 1960s—a period of critical importance for understanding post-war reconstruction and the establishment of socialist urban morphology in cities such as Pyongyang. While the classification accuracy achievable from panchromatic imagery is inherently lower than from multispectral data, the proportion-level estimates provide baseline information that constrains the starting point of subsequent change trajectories. This temporal extension—from 1985 back to 1967—reveals the consolidation phase that would otherwise remain invisible in Landsat-era analyses, demonstrating that the built-up footprint was already established by the late 1960s and that the dramatic expansion observed after 1985 represented a qualitatively different phase of development.
4.5. Comparison with Previous Studies
The findings of this study can be compared with previous studies of Pyongyang’s land cover dynamics, though differences in study area extent, data sources, and classification methodologies must be carefully considered. A summary comparison is provided in Appendix F.
Piao et al. [6] reported that built-up areas in Pyongyang increased from 8.26% in 2000 to 9.49% in 2020 using random forest classification of Landsat data, with an overall classification accuracy of 97.66%. In a related study, the same research group [7] documented similar patterns for the period 2000–2018. The substantially lower built-up proportions reported in these studies—approximately one-sixth of the values observed here—reflect their use of the entire Pyongyang municipal district (approximately 600 km2), which encompasses extensive peripheral agricultural and forested zones that considerably dilute the urban proportion. Despite this difference in spatial extent, both studies consistently identify an increasing trend in built-up area during 2000–2015, lending mutual support to the observed urbanization trajectory. Kang et al. [19] examined urban land cover change across the DPRK at the national scale between 1987 and 2010 using nighttime light data (DMSP/OLS), documenting urban expansion broadly consistent with the present findings.
Beyond the remote sensing literature, the urbanization trajectory identified in this study can be situated within broader discussions of socialist and post-socialist urban transformation. Hirt [18] characterized the distinctive spatial logic of socialist cities—centralized planning, monumental public spaces, and functional zoning—as features that fundamentally differentiate their morphological evolution from market-driven urbanization. The three-phase trajectory observed in Pyongyang partially mirrors patterns described for post-socialist cities in Eastern Europe, yet diverges in a critical respect: whereas most post-socialist cities experienced rapid market-driven transformation following political liberalization, Pyongyang’s urban change has remained entirely state-directed throughout the study period [5]. Pyongyang thus represents perhaps the last major example of a continuously state-planned socialist city, making its transformation trajectory of particular interest to urban studies scholarship.
The post-2015 decline can also be contextualized within the political economy of international sanctions. Lee [26] demonstrated that economic sanctions caused economic activity to concentrate disproportionately in Pyongyang relative to other DPRK regions. Ahn et al. [27] employed a human-machine collaborative model with satellite imagery to predict grid-level economic development across the DPRK, revealing significant spatial heterogeneity. The convergence of evidence from independent methodological traditions—remote sensing classification, nighttime light analysis, and machine learning-based economic prediction—strengthens the interpretation that the post-2015 stabilization reflects genuine constraints on development, while acknowledging the methodological caveats discussed in Section 4.2.
4.6. Spatial Patterns of Change: Sub-Area Analysis
To complement the ROI-wide quantitative analysis and connect the statistical findings to the physical evidence from the imagery, three sub-areas representing distinct urbanization processes are examined. The sub-area locations are identified on the 1967 CORONA K-Means classification map (Figure 9), and multi-epoch classification panels are presented in Appendix H (Figure A7).
The Taedong River corridor experienced the most intensive built-up expansion between 1985 and 2015. The synthesis map reveals that new construction extended outward from the historic urban core along both banks of the river, progressively converting adjacent agricultural parcels in a pattern consistent with the state-led strategy of constructing showcase residential complexes along the riverfront. The sequential GLC_FCS30D maps (Appendix A) confirm that this corridor accounts for the largest contiguous blocks of agricultural-to-urban conversion, particularly during the 2000–2015 period when annual expansion rates exceeded +1.0 km2/yr.
The southwestern peri-urban zone shows a more complex pattern. Built-up area expanded into previously agricultural land during 2000–2015, but the 2022 classification suggests partial re-conversion to agricultural use in this zone. If confirmed by independent data, this pattern would be consistent with a policy recalibration toward food self-sufficiency under sanctions-imposed constraints—prioritizing agricultural production in areas that are accessible from the capital but less central to the showcase urban landscape.
The northern hillside fringe shows minimal change throughout the study period. The persistent forest cover on these slopes confirms that urban expansion in Pyongyang occurred almost exclusively on flat agricultural land rather than through hillside development. This pattern reflects both topographic constraints and the planned character of socialist urban expansion, which favored the development of flat, easily constructible parcels over the irregular terrain of hillsides. The contrast with market-driven urbanization—where speculative development commonly extends into hillside areas—further underscores the distinctiveness of Pyongyang’s state-directed development model.
These spatial patterns provide the evidentiary link between the quantitative classification results and the qualitative narrative of policy-driven transformation. The concentration of expansion along the river corridor and flat agricultural zones, the absence of hillside encroachment, and the spatially dispersed nature of the post-2015 contraction are all consistent with centralized planning decisions rather than emergent market processes.
4.7. Methodological Implications and Policy Relevance
The approach presented in this study—combining deep learning colorization of declassified panchromatic imagery with global land cover products—offers a replicable methodology for extending urban change analysis into the pre-Landsat era. The use of unsupervised classification (K-Means) rather than supervised methods represents a pragmatic choice that avoids the circular reasoning inherent in manually labeling training samples on imagery whose spectral properties are synthetic. The integration through proportion-level comparison rather than pixel-level accuracy assessment represents an appropriate analytical strategy that acknowledges the exploratory nature of the colorization-based classification while still extracting meaningful historical information.
Beyond its methodological contribution, this study demonstrates the critical role of satellite-based monitoring for regions where conventional ground-based data collection is impossible due to geopolitical restrictions. The DPRK remains one of the most data-scarce countries in the world, with virtually no publicly available census, cadastral, or land use survey data. In such contexts, the combination of declassified historical imagery, global land cover products, and emerging deep learning techniques represents one of the few viable pathways for reconstructing long-term urban and environmental change trajectories. This capacity has significant implications for humanitarian assessment, as satellite-derived land cover change data can serve as proxy indicators for urbanization pressures, agricultural productivity trends, and population displacement patterns in regions where direct observation is precluded.
The findings also carry implications for the broader discourse on urban sustainability in closed economies. The inverse relationship between built-up expansion and agricultural land loss illustrates a fundamental tension in state-planned urbanization: the drive to construct a modern showcase capital conflicts with the imperative of maintaining agricultural productivity in a chronically food-insecure nation. The apparent post-2015 reversal of this trend, if confirmed by independent high-resolution data, may represent a forced recalibration of this balance under external constraints, potentially offering an empirical case study of how international sanctions and pandemic-related isolation could reshape urban land use trajectories in ways that differ from market-driven urbanization processes.
4.8. Limitations and Future Directions
Several limitations should be acknowledged. First, the colorization model generates pseudo-color representations that do not correspond to true spectral reflectance values, and the December 1967 winter acquisition conditions represent particularly challenging conditions for both colorization and classification. The K-Means classification of the 1967 imagery should therefore be considered exploratory rather than definitive.
Second, the GLC_FCS30D product, while providing unprecedented temporal consistency, inherits classification uncertainties from the underlying Landsat time series. The apparent fluctuations observed in the 2020–2022 period may reflect methodological artifacts, and independent validation over the DPRK is effectively precluded by the near-total absence of ground truth data.
Third, the geometric correction of the CORONA imagery relies on a simplified affine model with six GCPs, which does not fully account for the panoramic camera’s distortion characteristics. The terrain-stratified accuracy assessment (Appendix G) demonstrates acceptable performance for the predominantly flat study area, but the approach would not be adequate for regions with significant topographic relief without additional processing steps.
Fourth, the pixel-level comparison between the 1967 classification and the 1985 GLC_FCS30D product is irrecoverably confounded by the 17-year temporal gap. Future studies could partially address this by incorporating additional archival sources such as historical maps, declassified KH-7 GAMBIT imagery (available for 1963–1967 at higher resolution), or contemporary textual descriptions of the city’s spatial extent.
Future research should pursue both technical refinements and broader analytical integration. On the technical side, fine-tuning colorization models with satellite-specific spectral targets rather than perceptual naturalness, incorporating texture and spatial context features alongside RGB values in the classification step, and applying deep learning semantic segmentation models could substantially improve classification reliability. On the analytical side, integrating land cover change data with socioeconomic indicators derived from nighttime light imagery [26,27], population estimates, and economic activity proxies would enable a more holistic understanding of the relationship between physical urban transformation and human development outcomes in the DPRK.
5. Conclusions
This study reconstructed Pyongyang’s urban land cover trajectory over 55 years (1967–2022) by combining deep learning colorization of declassified CORONA KH-4 imagery with the GLC_FCS30D global land cover time-series dataset. The domain-adapted DDColor model produced a 1967 built-up proportion estimate of 35.9%, closely approximating the 1985 GLC_FCS30D baseline of 36.0%, demonstrating that deep learning colorization can capture meaningful aggregate land cover signals from historical panchromatic imagery despite low pixel-level accuracy (17.2%).
The integrated analysis identified three urbanization phases: post-reconstruction consolidation (1967–1985, ~36%), sustained expansion at the expense of agricultural land (1985–2015, up to 57.1%), and stabilization under economic isolation (2015–2022, 51.3%). The first phase represents a novel finding unattainable from Landsat-era data alone. The near-halving of agricultural land within the capital’s vicinity during chronic food insecurity highlights a fundamental tension between showcase urbanization and food production in state-planned economies.
The practical significance of this study extends across three domains. For remote sensing methodology, the colorization-classification pipeline demonstrates that meaningful land cover information can be extracted from historical panchromatic imagery, extending the analytical record by nearly two decades beyond the Landsat era. For urban planning research, the three-phase urbanization trajectory provides the first quantitative satellite-derived evidence for the periodization of Pyongyang’s post-war development, confirming historical accounts while adding spatial precision to previously qualitative narratives. For humanitarian assessment, the documented conversion of agricultural land within the capital’s vicinity during a period of chronic national food insecurity provides empirical evidence relevant to understanding the relationship between state-directed urbanization and food security outcomes in closed economies.
The methodology is transferable to other data-scarce regions where declassified panchromatic imagery exists but multispectral data are unavailable. Future work should improve colorization fidelity, develop more robust classification methods, and integrate socioeconomic indicators for a more holistic understanding of urban transformation in geopolitically restricted regions.
Author Contributions
Conceptualization, S.-J.L., W.-C.J., J.-H.C., J.K. and H.-S.Y.; methodology, S.-J.L., J.K. and H.-S.Y.; software, S.-J.L., W.-C.J. and H.-S.Y.; validation, S.-J.L., J.-H.C., J.K. and H.-S.Y.; formal analysis, S.-J.L., J.K. and H.-S.Y.; investigation, S.-J.L., W.-C.J. and H.-S.Y.; resources, S.-J.L., J.-H.C. and H.-S.Y.; data curation, S.-J.L., W.-C.J. and H.-S.Y.; writing—original draft preparation, S.-J.L., J.K. and H.-S.Y.; writing—review and editing, S.-J.L., J.-H.C., J.K. and H.-S.Y.; visualization, S.-J.L., W.-C.J. and H.-S.Y.; supervision, S.-J.L., J.K. and H.-S.Y.; project administration, S.-J.L., J.K. and H.-S.Y.; funding acquisition, S.-J.L., J.K. and H.-S.Y. All authors have read and agreed to the published version of the manuscript.
Funding
This work was supported by a National Research Foundation of Korea (NRF) grant funded by the Korea government (MSIT) (RS-2026-25488422).
Institutional Review Board Statement
Not applicable.
Informed Consent Statement
Not applicable.
Data Availability Statement
The original contributions presented in the study are included in the article, further inquiries can be directed to the corresponding authors.
Acknowledgments
The English text was reviewed and refined with the assistance of Claude (Anthropic), an AI language model, for grammar and clarity improvements. The scientific content, data analysis, and interpretation remain entirely the work of the authors.
Conflicts of Interest
Author Jung-Ho Cho was employed by GEOSTORY Co., Ltd. The remaining authors declare that the research was conducted in the absence of any commercial or financial relationships that could be construed as a potential conflict of interest.
Abbreviations
The following abbreviations are used in this manuscript:
| CORONA | Satellite reconnaissance program (KH-1 through KH-4B) |
| KH-4 | Keyhole-4 reconnaissance satellite system |
| DDColor | Dual-Decoder Color (deep-learning colorization model) |
| GLC_FCS30D | Global Land Cover with Fine Classification System at 30 m—Dynamic |
| GEE | Google Earth Engine |
| ROI | Region of Interest |
| RGB | Red, Green, Blue (color space) |
| K-Means | K-Means clustering algorithm |
| OA | Overall Accuracy |
| DPRK | Democratic People’s Republic of Korea |
| USGS | United States Geological Survey |
| EROS | Earth Resources Observation and Science (Center) |
| GCP | Ground Control Point |
| RMSE | Root Mean Square Error |
| PSNR | Peak Signal-to-Noise Ratio |
| SSIM | Structural Similarity Index Measure |
| LPIPS | Learned Perceptual Image Patch Similarity |
| ConvNeXt | Convolutional Network “Next” |
Appendix A. GLC_FCS30D Nine-Epoch Land Cover Maps
Appendix A presents the nine-epoch land cover maps derived from the GLC_FCS30D dataset for the Pyongyang ROI (125.676° E–125.844° E, 38.954° N–39.066° N; 180.8 km2). These maps illustrate the spatiotemporal progression of land cover change from 1985 to 2022 at 30 m spatial resolution, providing a comprehensive visual record of the urban expansion and agricultural land conversion discussed in Section 3.3 and Section 4.2. The dominant trend visible across the nine panels is the progressive replacement of agricultural land (gold) by built-up area (dark red), particularly along the Taedong River corridor and in the southwestern peri-urban zones. The 2020 and 2022 panels show a partial reversal of this trend, with agricultural land recovering in some peripheral areas—a pattern discussed in detail in Section 4.2 (Phase 3). All panels share a common five-class color legend and include graphical scale bars (2 km) and north arrows.
Figure A1.
GLC_FCS30D land cover classification maps for all nine analysis epochs (3 × 3 panel layout): 1985, 1990, 1995, 2000, 2005, 2010, 2015, 2020, 2022. Each panel title includes the year and built-up proportion (%). Color legend: blue = Water, dark green = Forest, yellow/gold = Agriculture, dark red = Built-up, gray = Others. Scale bar: 2 km. North arrow indicated in each panel. The ROI boundary (coordinate-defined, not administrative; see Section 2.1) is identical across all epochs.
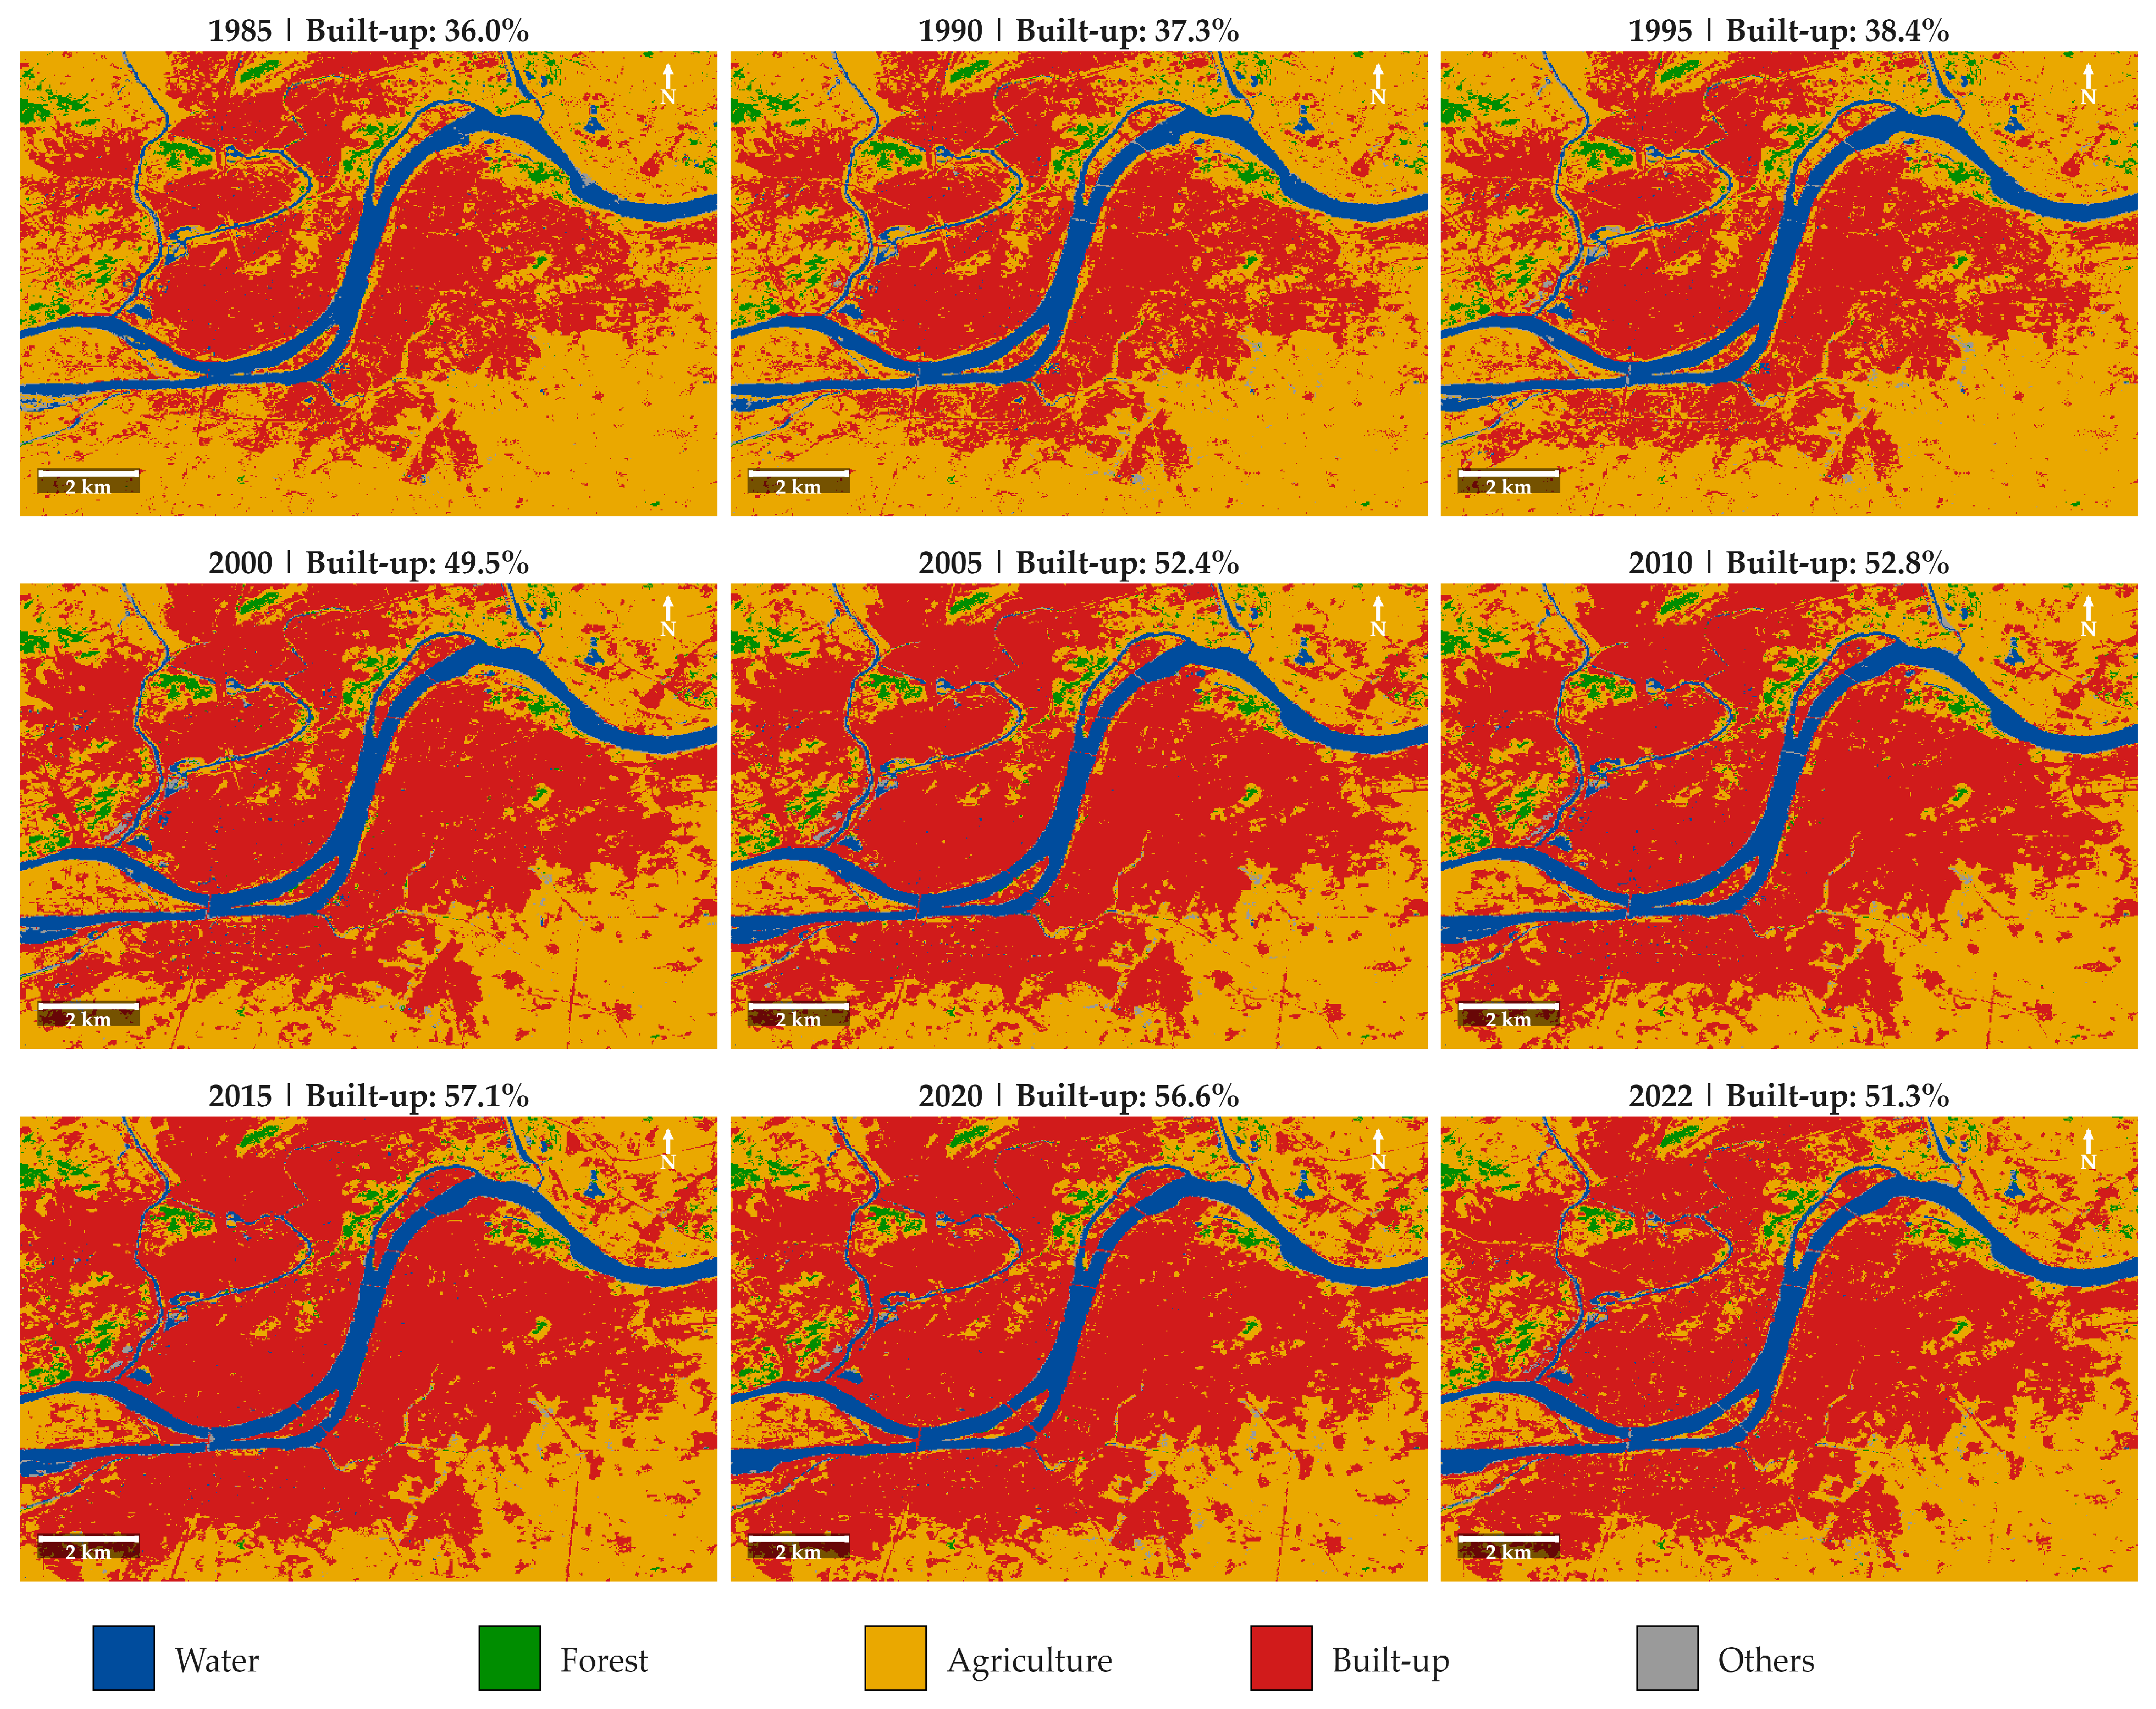
Appendix B. GLC_FCS30D Class Remapping Scheme
Appendix B presents the class remapping scheme used to reclassify the original GLC_FCS30D 35-subcategory land cover classification into the simplified five-class system employed in this study. The remapping was designed to achieve two objectives: (1) to reduce the classification complexity to a level compatible with the limited discriminative power of the pseudo-color K-Means classification of the 1967 CORONA imagery, and (2) to group thematically related subcategories into broad classes that capture the primary land cover dynamics relevant to urban transformation analysis (i.e., the conversion of agricultural land to built-up surfaces). The “Others” class serves as a residual category that aggregates minor land cover types (shrubland, grassland, bare areas, wetlands) that collectively account for less than 2% of the ROI across all epochs.
Table A1.
GLC_FCS30D class remapping scheme.
Appendix C. Land Cover Area Dynamics (1985–2022)
Appendix C presents supplementary visualizations of the temporal dynamics of land cover areas from 1985 to 2022. Figure A2 shows the proportional composition of all five land cover classes across the nine epochs as a 100% stacked bar chart, providing an integrated overview of how the dominant land cover shifted from agriculture to built-up over three decades. Figure A3 focuses specifically on the absolute area trends of water and forest—the two classes that remained stable throughout the study period—using a dual-axis plot to capture the subtle fluctuations within their narrow ranges. The stability of these two classes (water: 12.4–13.1 km2; forest: 2.9–3.4 km2) confirms that urbanization in Pyongyang occurred almost exclusively at the expense of agricultural land (discussed in Section 4.2).
Figure A2.
Land cover composition of the Pyongyang ROI (180.8 km2) from 1985 to 2022, shown as a 100% stacked bar chart derived from GLC_FCS30D. Color legend: blue = Water, green = Forest, gold = Agriculture, dark red = Built-up, gray = Others. The crossover point between Agriculture and Built-up occurred between 1995 and 2000, when Built-up proportion first exceeded that of Agriculture.
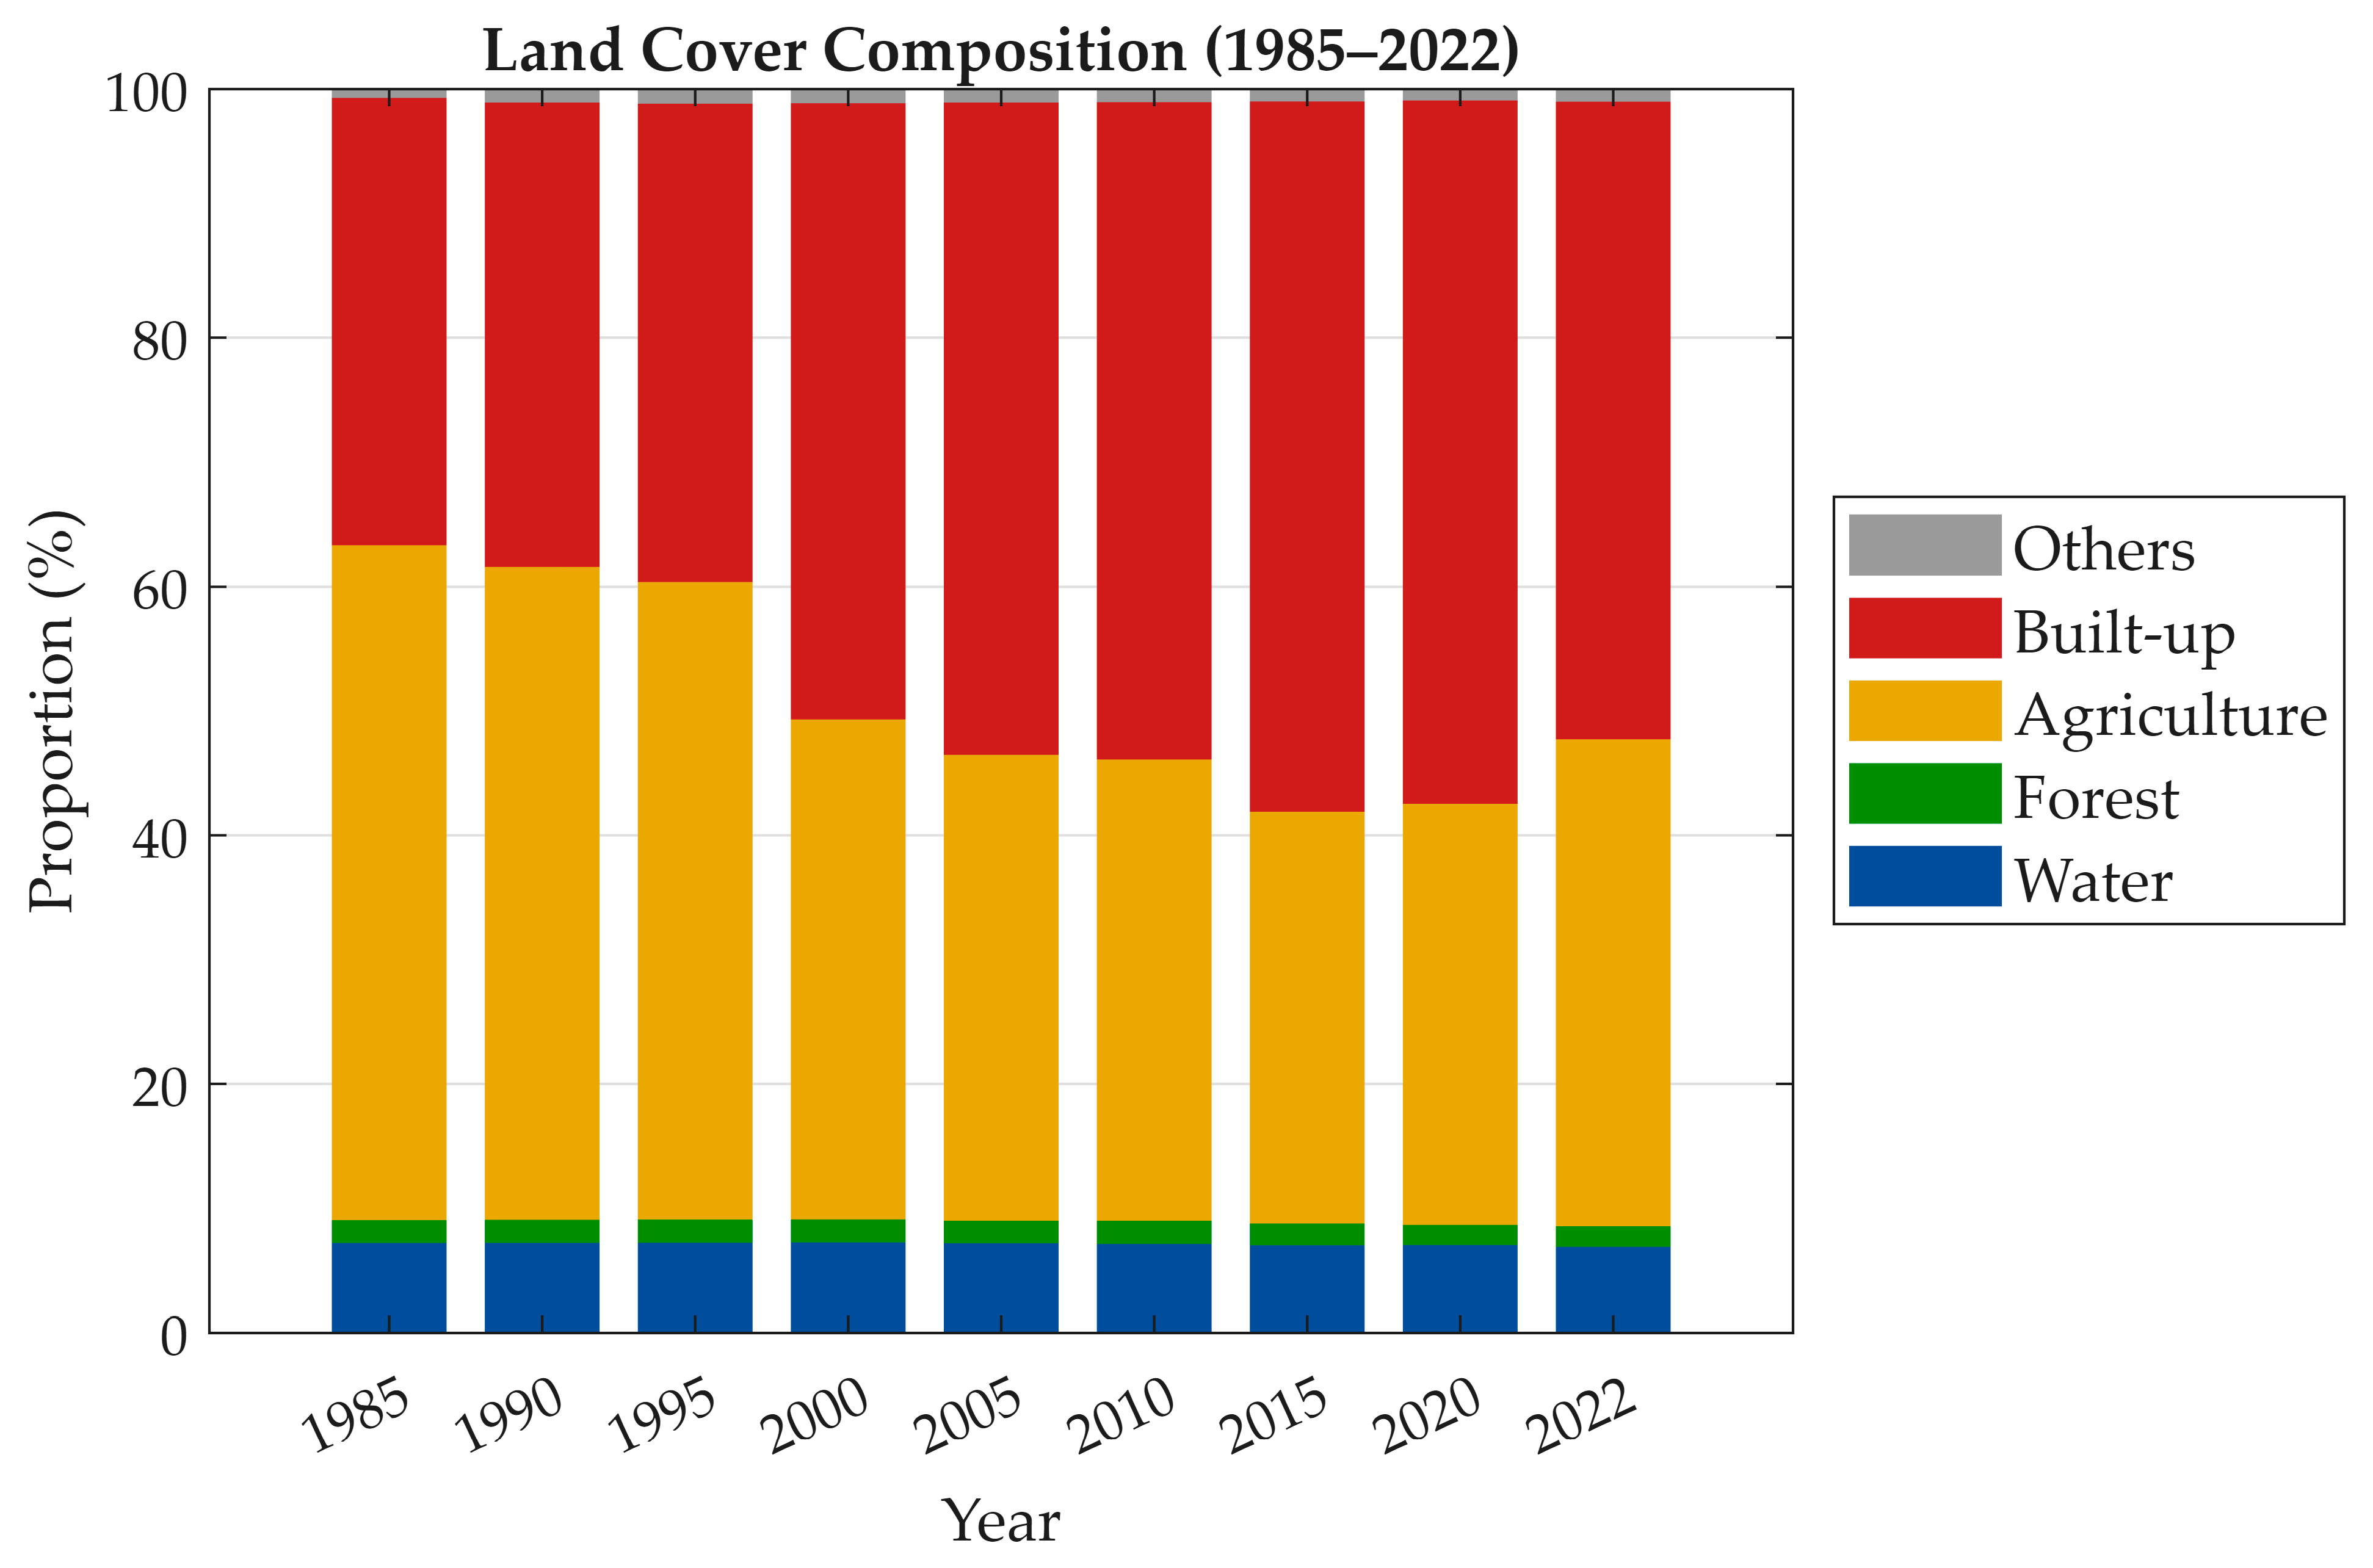
Figure A3.
Temporal trends of water area (blue, left y-axis) and forest area (green, right y-axis) in the Pyongyang ROI, 1985–2022, derived from GLC_FCS30D. Both classes remained stable throughout the study period, with water fluctuating between 12.4 and 13.1 km2 and forest between 2.9 and 3.4 km2, indicating that urbanization occurred primarily at the expense of agricultural land rather than water bodies or forested areas. The slight decline in water area after 2015 (from 12.7 to 12.4 km2) may reflect seasonal water level variation or classification sensitivity rather than genuine hydrological change.
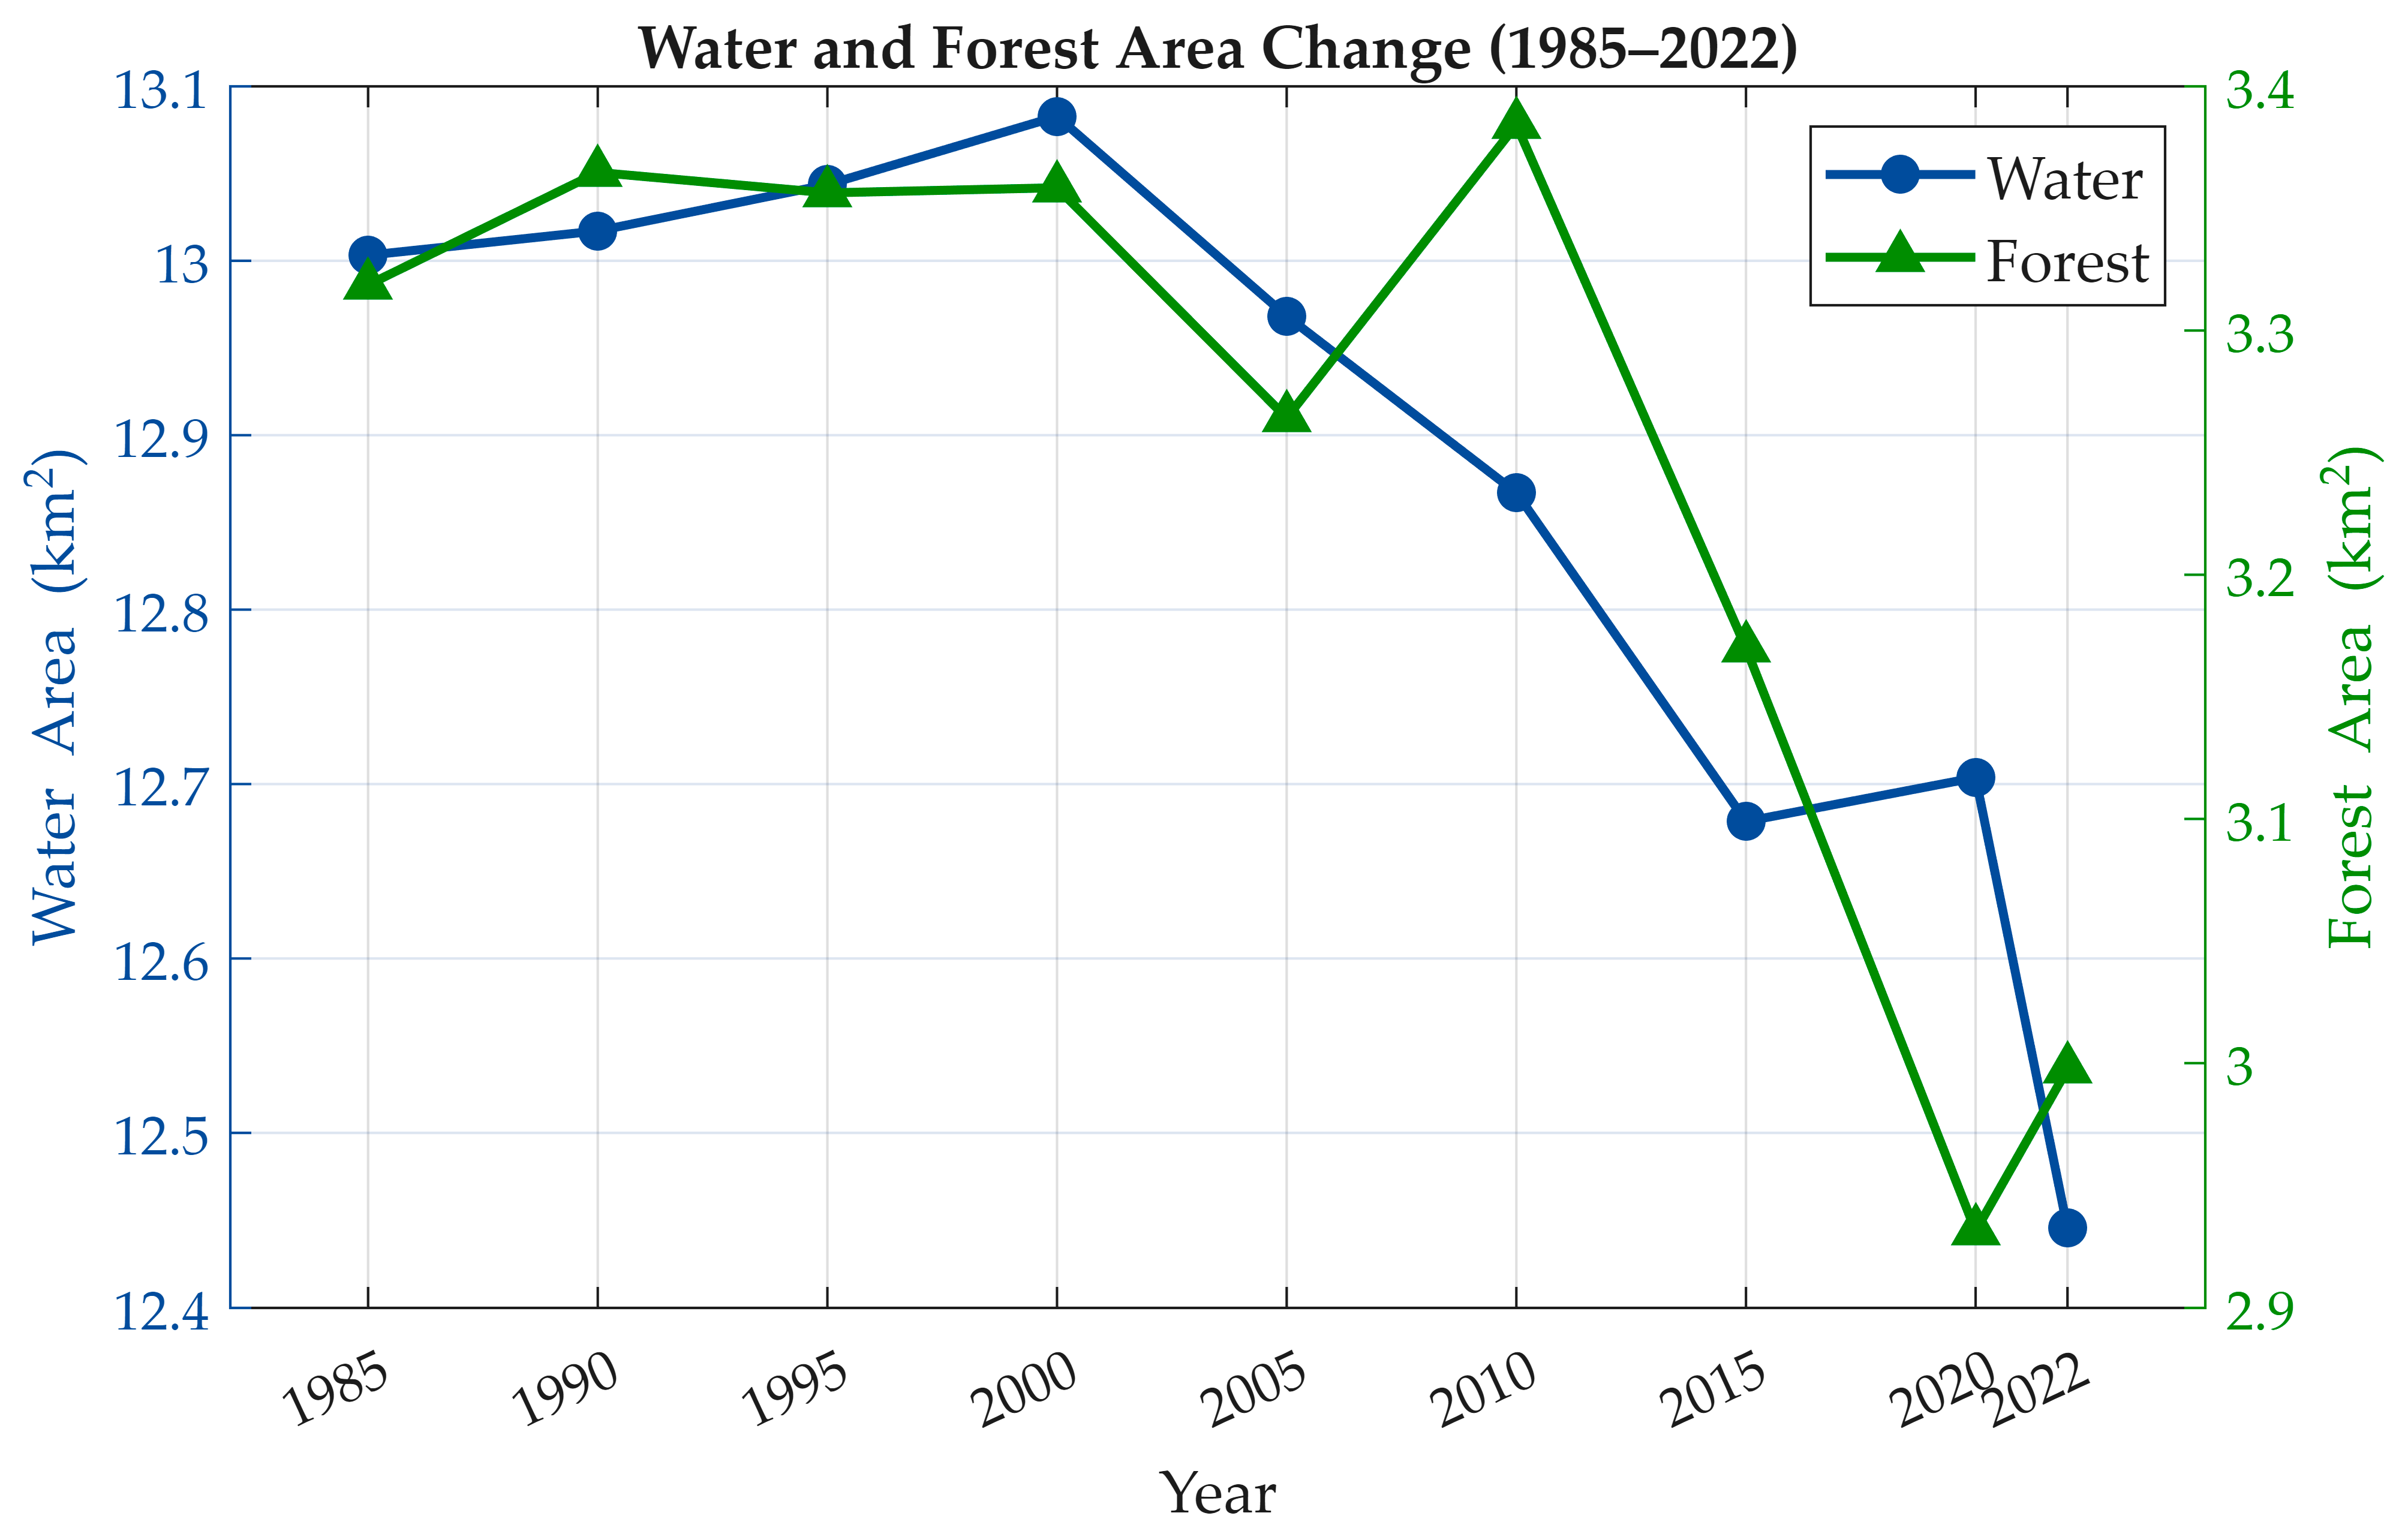
Appendix D. K-Means Classification Parameters
Appendix D summarizes the key parameters used in the K-Means unsupervised classification of the 1967 colorized CORONA imagery. The parameter selection was guided by two principles: (1) direct comparability with the five-class GLC_FCS30D remapping scheme (k = 5), and (2) computational stability and reproducibility (5 replicates, fixed random seed). The class assignment rules are based on color-space heuristics that exploit the systematic color associations learned by the DDColor model (e.g., blue for water, green for vegetation, gray-brown for built-up). These heuristics operate on the cluster centroids rather than individual pixels, ensuring objective and reproducible class labeling without manual intervention.
Table A2.
K-Means classification parameters for the 1967 colorized CORONA imagery.
Appendix E. Annual Rate of Land Cover Change
Appendix E presents the annual rate of land cover change (km2/yr) for each inter-epoch period from 1985 to 2022. The values represent the average yearly gain (+) or loss (−) in area for each reclassified land cover class, computed by dividing the total area change by the number of years in each interval. This normalization enables standardized comparison of change intensity across periods with different time intervals (5 years for 1985–2015, 2 years for 2020–2022). The most notable features are the sharp acceleration of built-up expansion during 1995–2000 (+4.01 km2/yr), which may partly reflect the transition from five-year to annual classification intervals in the GLC_FCS30D methodology (see Section 4.2), and the equally sharp reversal during 2020–2022 (−4.78 km2/yr), which warrants cautious interpretation as discussed in Section 4.2 (Phase 3).
Table A3.
Annual rate of land cover change (km2/yr) for each inter-epoch period.
Appendix F. Comparison with Previous Studies
Appendix F provides a comparative summary of the findings from this study with those of previous studies conducted in the same or overlapping study areas. The most important caveat for interpreting this comparison is the difference in study area extent: the present study focuses on a 180.8 km2 ROI centered on the urban core, while Piao et al. [6,7] analyzed the entire Pyongyang municipal district (~600 km2), which includes extensive peripheral agricultural and forested zones that substantially dilute the urban proportion. When this difference is accounted for, all studies consistently identify an increasing built-up trend during the 2000–2015 period, lending mutual support to the observed urbanization trajectory (see Section 4.5).
Table A4.
Study area and key findings comparison.
Appendix G. CORONA Imagery Processing Validation
Appendix G.1. Geometric Accuracy Assessment
The CORONA KH-4 image (DS1105-2134DA168) was georeferenced using a six-parameter affine transformation based on six GCPs identified on both the CORONA film scan and the 2024 Sentinel-2 L2A reference image. The original film scan (33,882 × 10,343 pixels) was reduced to 1/4 scale for GCP selection, and the pixel coordinates were transformed to account for the film’s along-track mirror reversal (horizontal and vertical flip). The affine model incorporates translation, rotation (−12.5°), and anisotropic scaling (X: 0.876, Y: 0.844), consistent with the oblique scan geometry of the KH-4 panoramic camera. The fitting RMSE across six GCPs was approximately 48 m.
To independently verify geometric accuracy, 13 check points (CPs) were selected on terrain features identifiable in both the georeferenced CORONA colorized image and the Sentinel-2 2024 RGB composite. CPs were distributed across the ROI and included river confluences, island tips, hill ridges, and other natural features stable over the 57-year interval. Figure A5 shows the spatial distribution of the CPs.
Table A5.
Independent check point residuals.
Table A6.
Terrain-stratified RMSE summary.
After 2σ outlier rejection (CP02 excluded), the overall RMSE is 16.7 m, approximately 0.56 pixels relative to the 30 m GLC_FCS30D grid. Terrain-stratified results (Table A6) show that all four categories—flat built-up (13.9 m), flat agricultural (16.1 m), riverside (22.6 m), and hillside (8.0 m)—achieve sub-pixel accuracy relative to the 30 m analysis grid. The relatively higher riverside RMSE reflects the temporal instability of fluvial reference features over the 57-year interval rather than a deficiency of the geometric model. These results confirm that positional errors do not exceed the spatial resolution of the land-cover classification data and do not materially affect the proportion-based urban change analysis.
Figure A4.
Spatial distribution of 13 independent check points on (a) the georeferenced CORONA KH-4 colorized image (1967) and (b) the Sentinel-2 L2A RGB composite (2024). Red: inliers; orange: outlier (CP02).
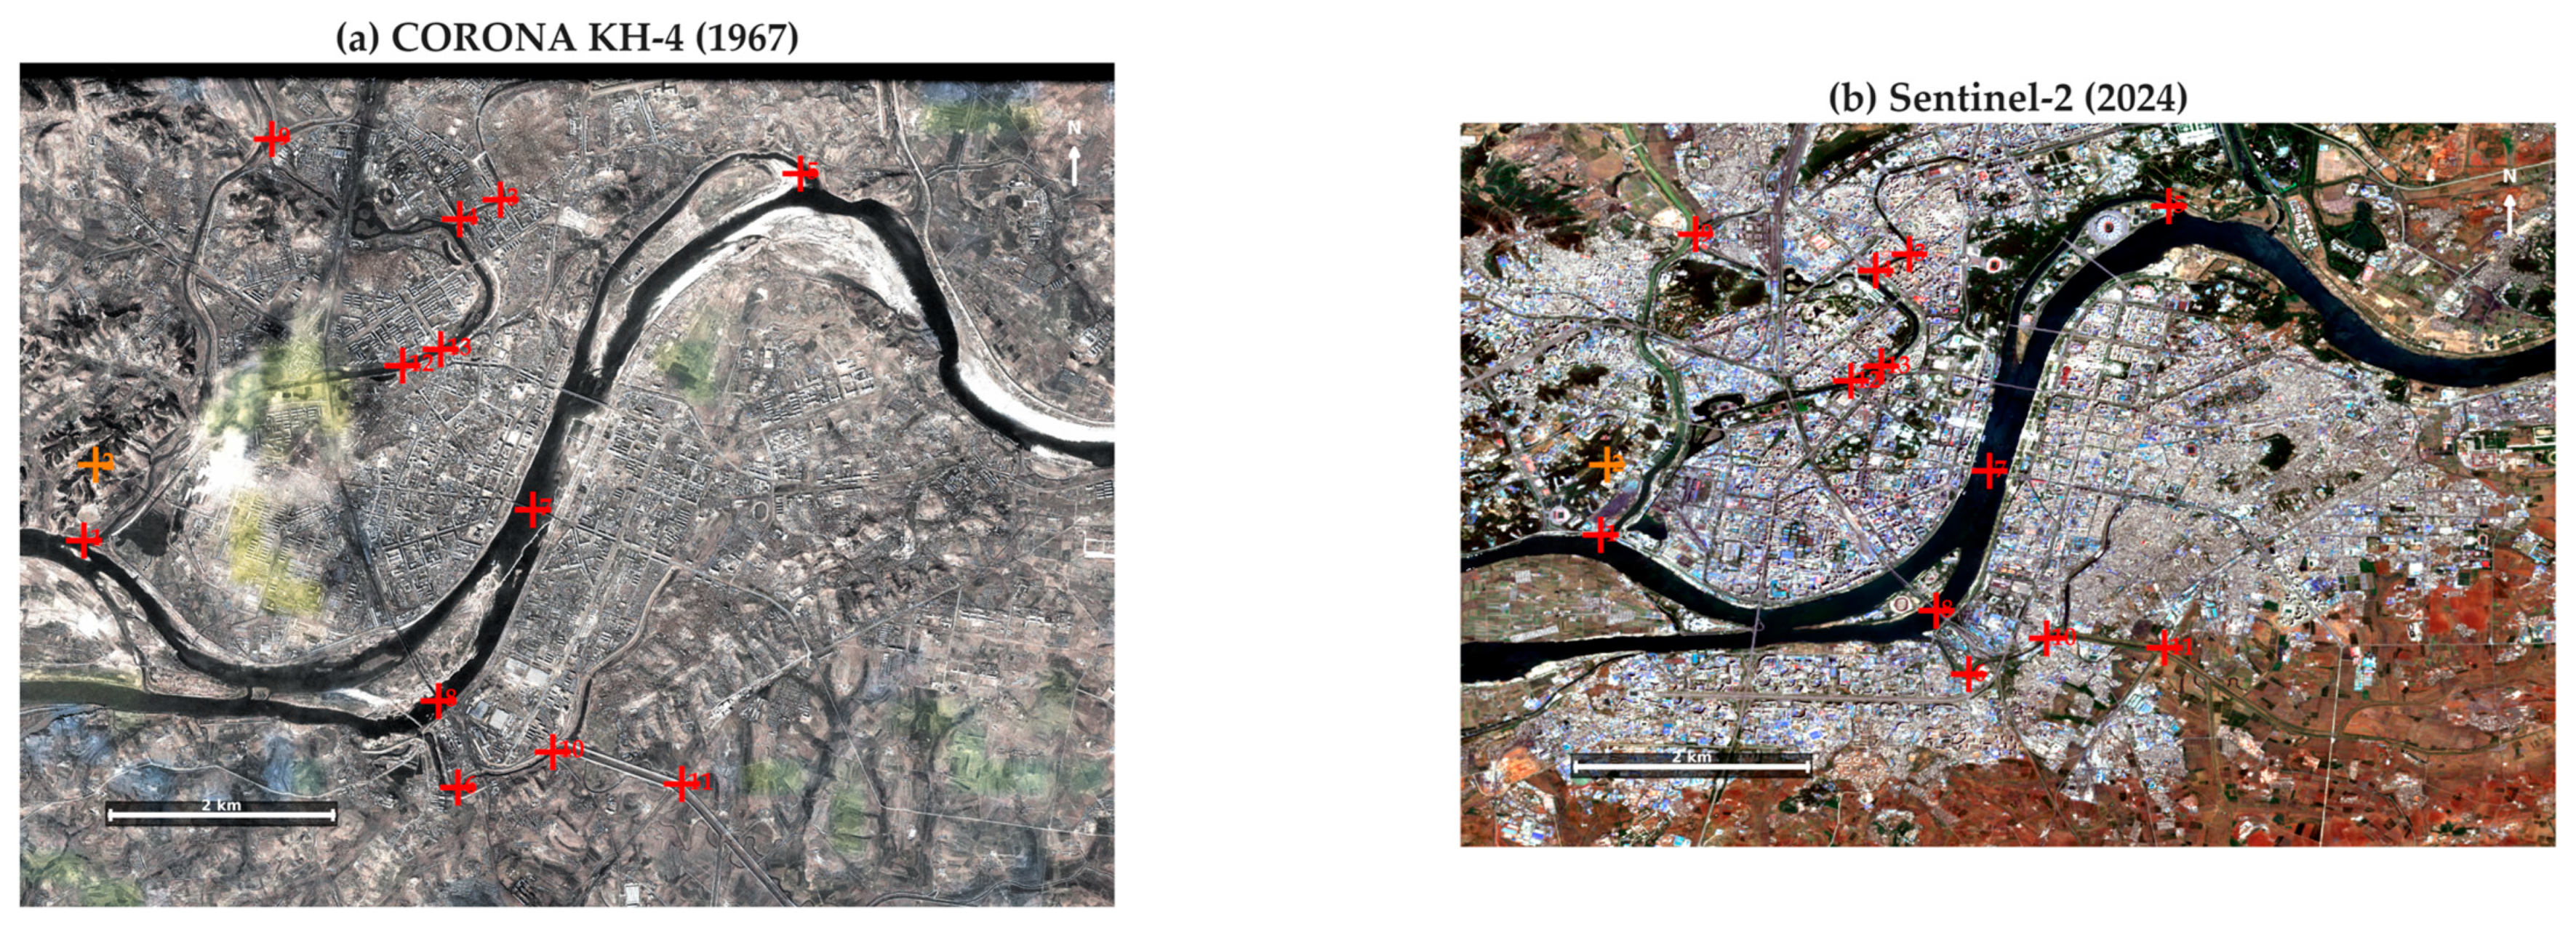
Appendix G.2. Colorization Quality Assessment: Detail Comparison by Land Cover Type
Appendix G.2 presents visual evidence of the DDColor colorization performance across different land cover types within the Pyongyang study area. While the quantitative evaluation of the colorization model is reported in Table 2 (PSNR, SSIM, LPIPS on the validation set), visual inspection of the colorized output provides complementary qualitative evidence of the model’s ability to assign spectrally plausible pseudo-colors to the major surface types present in the 1967 CORONA imagery.
Figure A5 presents the full study area comparison with the locations of four representative sample areas indicated by color-coded rectangles. Each panel shows: (a) the original CORONA KH-4 panchromatic image (16 December 1967), (b) the DDColor colorized output, and (c) the Sentinel-2 L2A true-color composite (April–July 2024) as a modern visual reference. The four sample areas are: (i) Urban core (red rectangle), (ii) Agricultural zone (green rectangle), (iii) Taedong River corridor (blue rectangle), and (iv) Hill/Forest (yellow rectangle). All panels include 2 km scale bars and north arrows. It is noted that direct spectral comparison between the 1967 colorized output and the 2024 Sentinel-2 imagery is not meaningful due to the 57-year temporal gap and the pseudo-color nature of the DDColor output; the Sentinel-2 panel serves only to illustrate the current land cover condition and to provide a color reference for the reader.
Figure A5.
Comparison of original and colorized CORONA imagery with modern satellite data for the Pyongyang study area: (a) original CORONA KH-4 panchromatic image (16 December 1967), (b) DDColor colorized output assigning spectrally plausible pseudo-colors (gray-brown = urban, yellow-green = agriculture, dark green = forest, blue-dark = water), and (c) Sentinel-2 L2A true-color composite (April–July 2024) as a modern reference. Color-coded rectangles indicate the locations of the four enlarged sample areas presented in Figure A6: red = (i) Urban core, green = (ii) Agricultural, blue = (iii) Taedong River, yellow = (iv) Hill/Forest. Scale bar: 2 km. The pseudo-colors do not represent true spectral reflectance values.
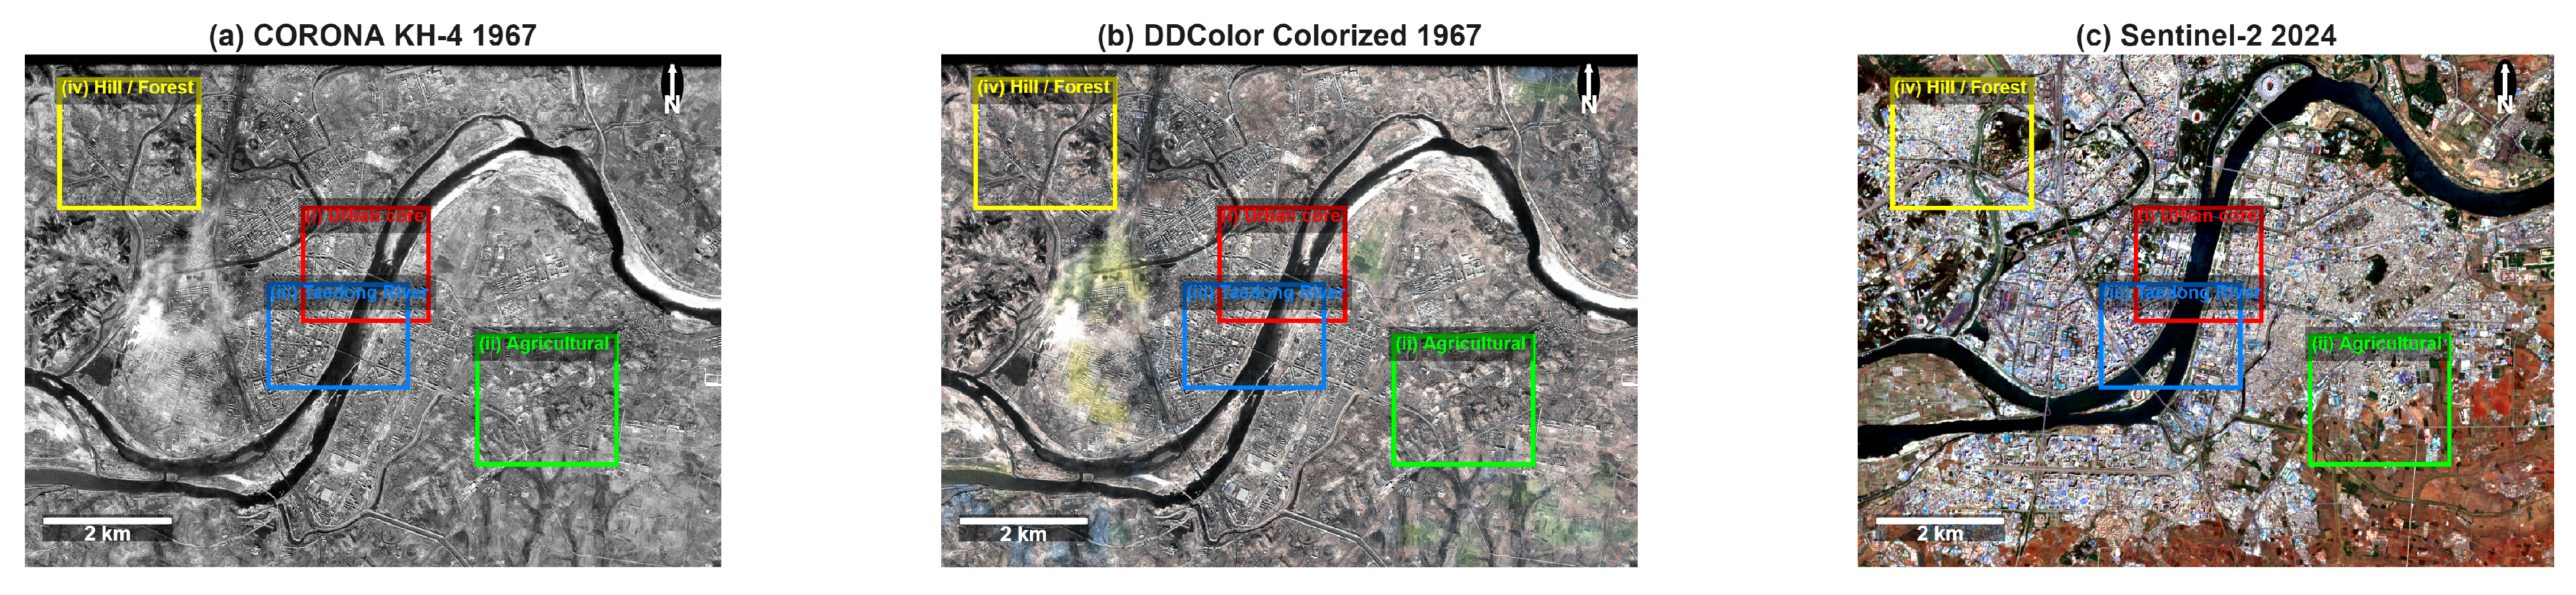
Figure A6 presents the enlarged comparison panels for the four sample areas, arranged as a 4 × 3 grid. Each row corresponds to one land cover type, and the three columns show the original panchromatic image (left), the DDColor colorized output (center), and the Sentinel-2 2024 reference (right).
Figure A6.
Enlarged colorization comparison for four key land cover types (4 × 3 panel layout). Row (i) Urban core: the original uniform gray tones are differentiated into gray-brown built-up surfaces with visible block-level structure in the colorized output. Row (ii) Agricultural area: the model assigns yellow-green hues to field patterns in the eastern peri-urban zone; the relatively bright tones of fallow winter fields in the December 1967 acquisition are rendered as light yellow-brown, contributing to the spectral overlap with built-up surfaces that explains the large Others category (29.3%) in the K-Means classification (Section 4.1). Row (iii) Taedong River corridor: water surfaces are consistently rendered in blue-dark tones, representing the strongest and most reliable colorization among all land cover types. Row (iv) Hillside/Forest: darker green coloring distinguishes forested slopes from adjacent agricultural and built-up surfaces, though the chromatic contrast is weaker than for water bodies, reflecting the challenge of colorizing bare deciduous forest in winter imagery.
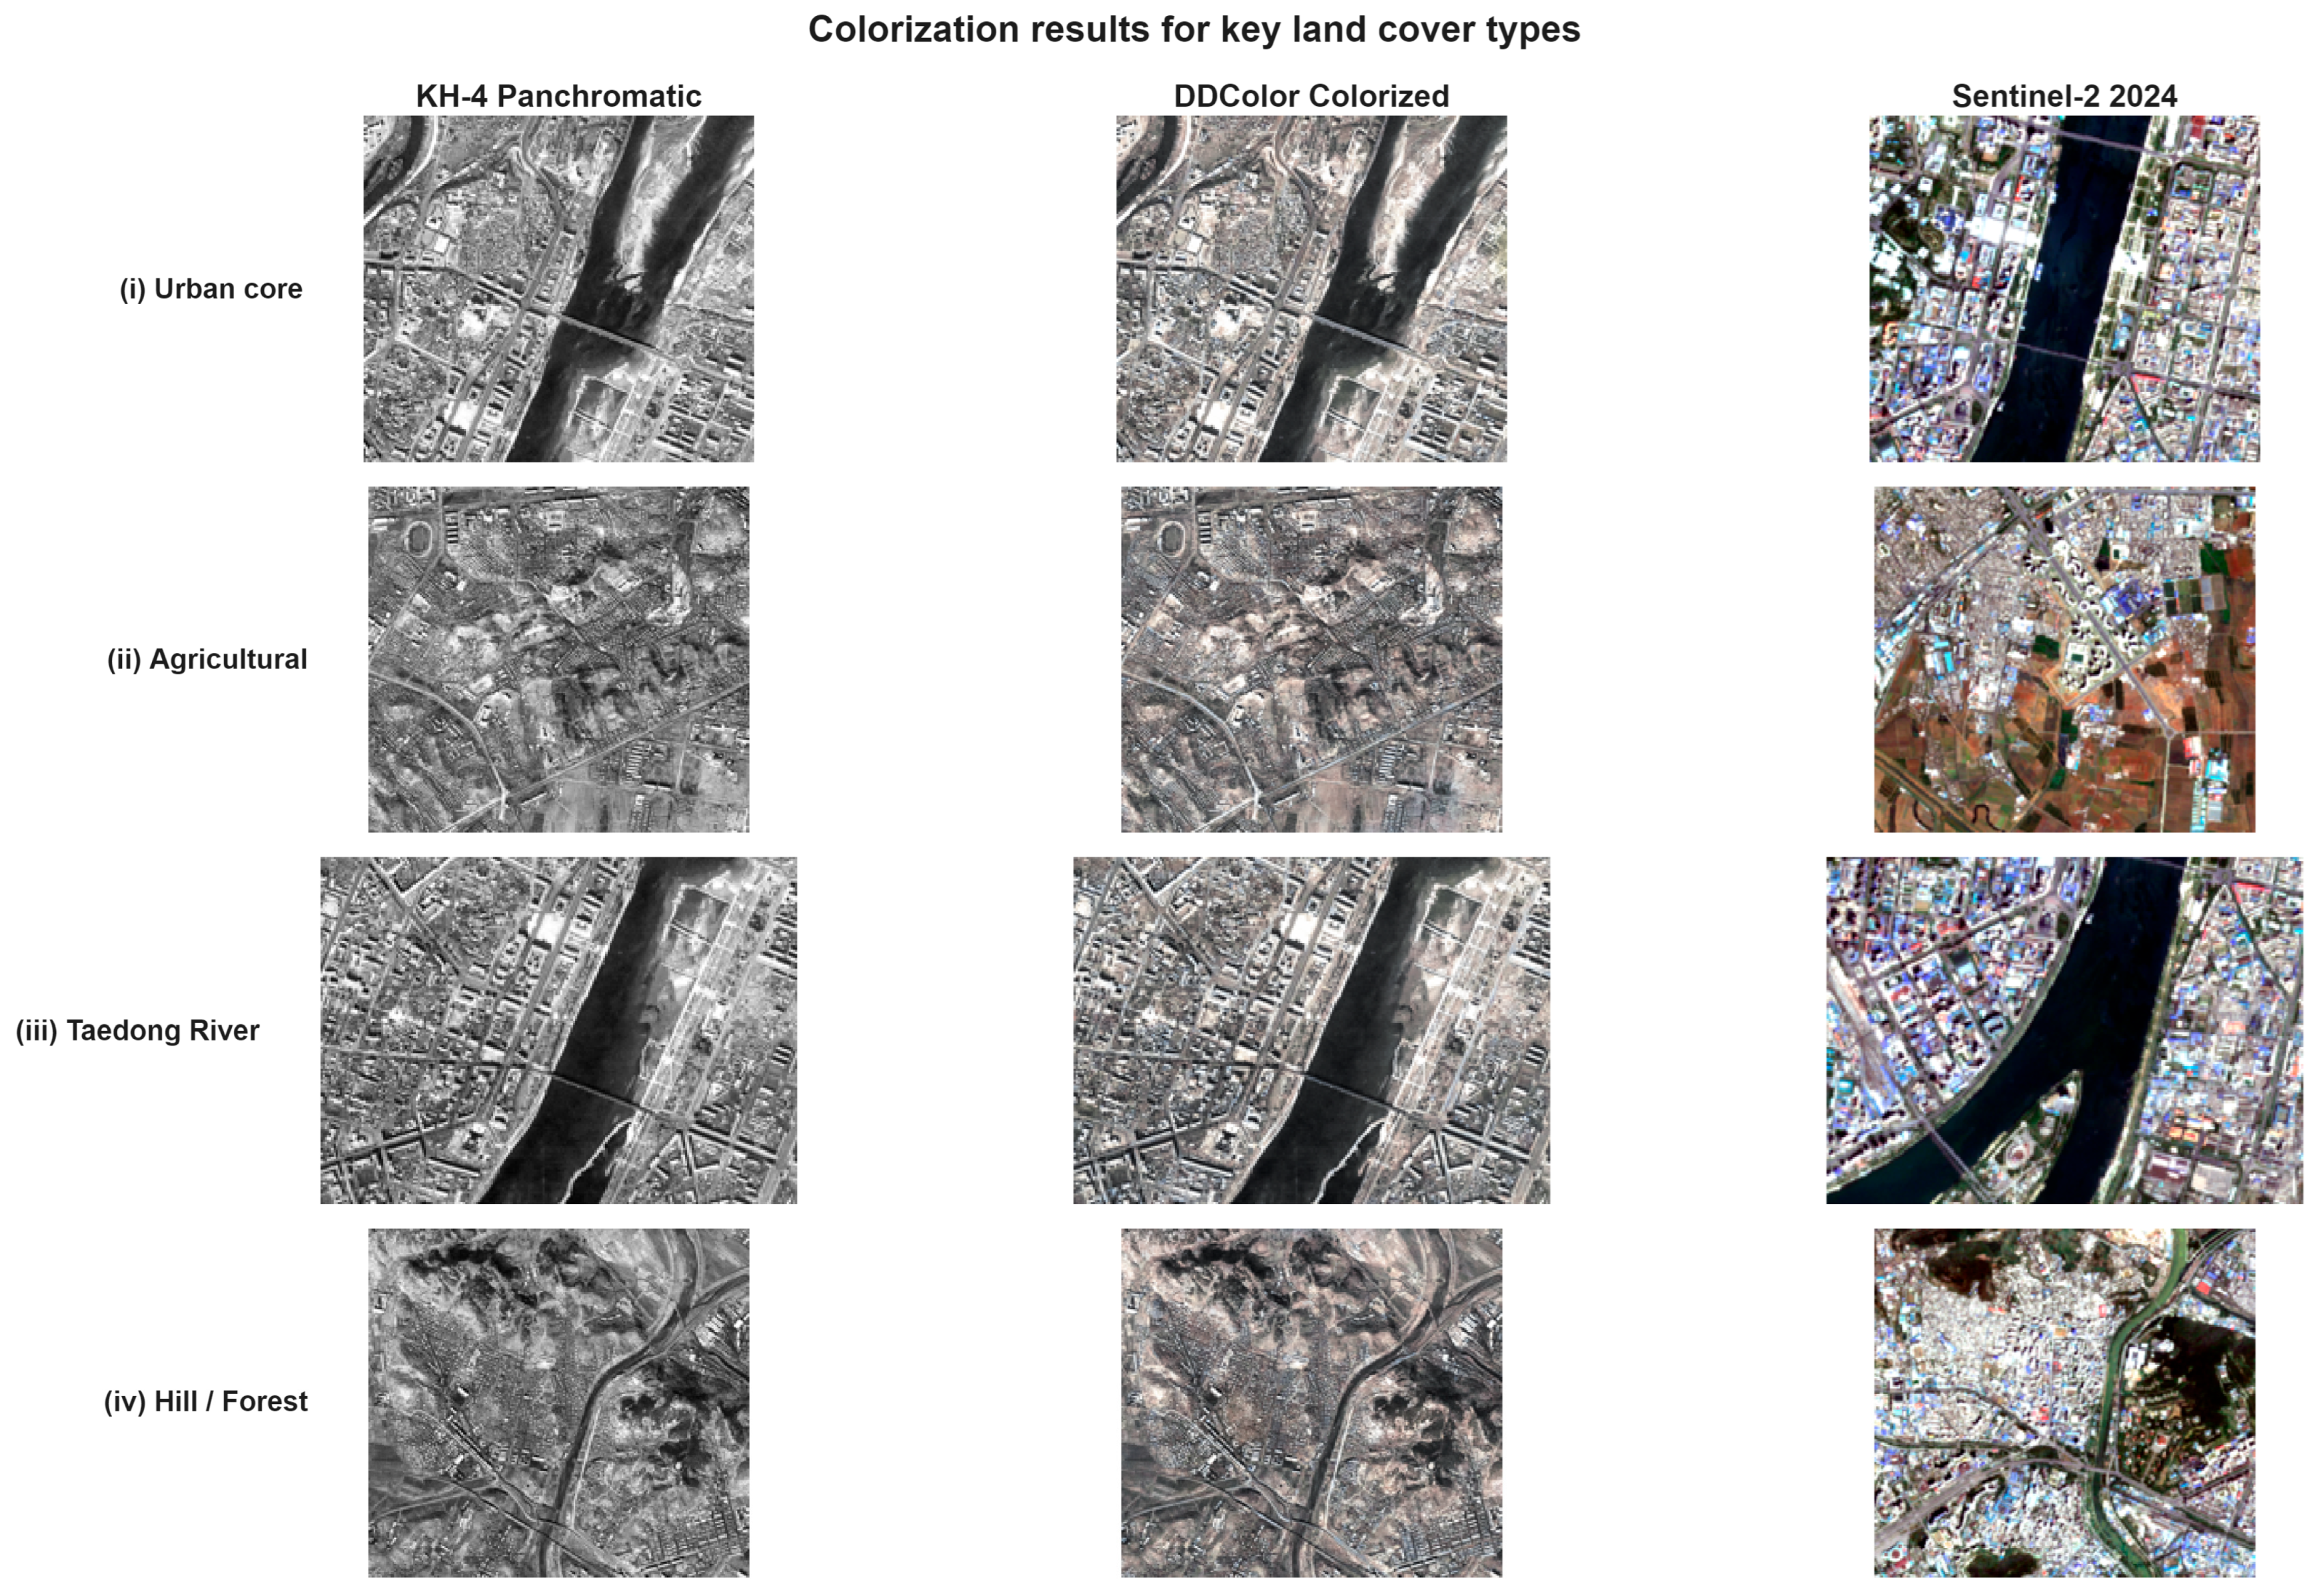
Appendix H. Sub-Area Multi-Epoch Land-Cover Comparison
This appendix presents the multi-epoch land-cover classification for three representative sub-areas identified in Figure 9: (a) Central Core, (b) Taedong River corridor, and (c) SW Peri-urban zone. Figure A7 displays a 3 × 5 panel grid covering five epochs (1967, 1985, 2000, 2015, 2022). The 1967 column is derived from CORONA KH-4 imagery processed through DDColor colorization and unsupervised K-Means clustering, resampled to 30 m resolution for visual consistency with the GLC_FCS30D product used for 1985–2022. All panels share the same five-class color scheme (Water, Forest, Agriculture, Built-up, Others), and built-up proportions (BU%) are annotated in the upper-right corner of each panel.
The Central Core (row a) shows a transition from mixed land cover in 1967 (BU: 23.4%) to predominantly built-up coverage by 1985 (BU: 70.8%), remaining stable through 2022 (BU: 77.9%). The modest increase between 1985 and 2015 reflects infill development within an already urbanized district, while the slight decline from 82.1% (2015) to 77.9% (2022) may reflect reclassification of aging structures or GLC_FCS30D sensitivity changes rather than actual demolition.
The Taedong River corridor (row b) exhibits the most dynamic change trajectory. Built-up proportion increases from 26.9% (1967) to 52.8% (1985) and further to 70.0% (2015), driven by state-directed riverfront construction projects. The post-2015 decline to 65.8% (2022) parallels the aggregate trend and warrants further investigation with higher-resolution imagery.
The SW Peri-urban zone (row c) demonstrates the clearest agricultural-to-urban conversion. In 1967, this area was predominantly agricultural and forest (BU: 17.4%). By 1985, built-up proportion had only marginally increased to 20.6%, but rapid conversion occurred between 2000 and 2015 (46.9% → 66.2%), coinciding with peripheral housing and infrastructure development. The subsequent decline to 59.8% (2022) suggests partial re-conversion or classification uncertainty at the urban-rural fringe.
These sub-area trajectories provide spatial specificity to the aggregate trends discussed in Section 3.4 and Section 4.2, confirming that Pyongyang’s urban expansion was not spatially uniform but concentrated along the river corridor and southwestern periphery.
Figure A7.
Multi-epoch land-cover classification for three representative sub-areas in Pyongyang, 1967–2022. Rows correspond to sub-areas identified in Figure 9: (a) Central Core, (b) Taedong River corridor, (c) SW Peri-urban zone. The 1967 column is derived from CORONA KH-4 via DDColor colorization and K-Means clustering (resampled to 30 m for visual consistency); 1985–2022 columns are from GLC_FCS30D. BU = Built-up proportion (%). Scale bars: 2 km (rows a,b), 1 km (row c). All panels share the same five-class color scheme.
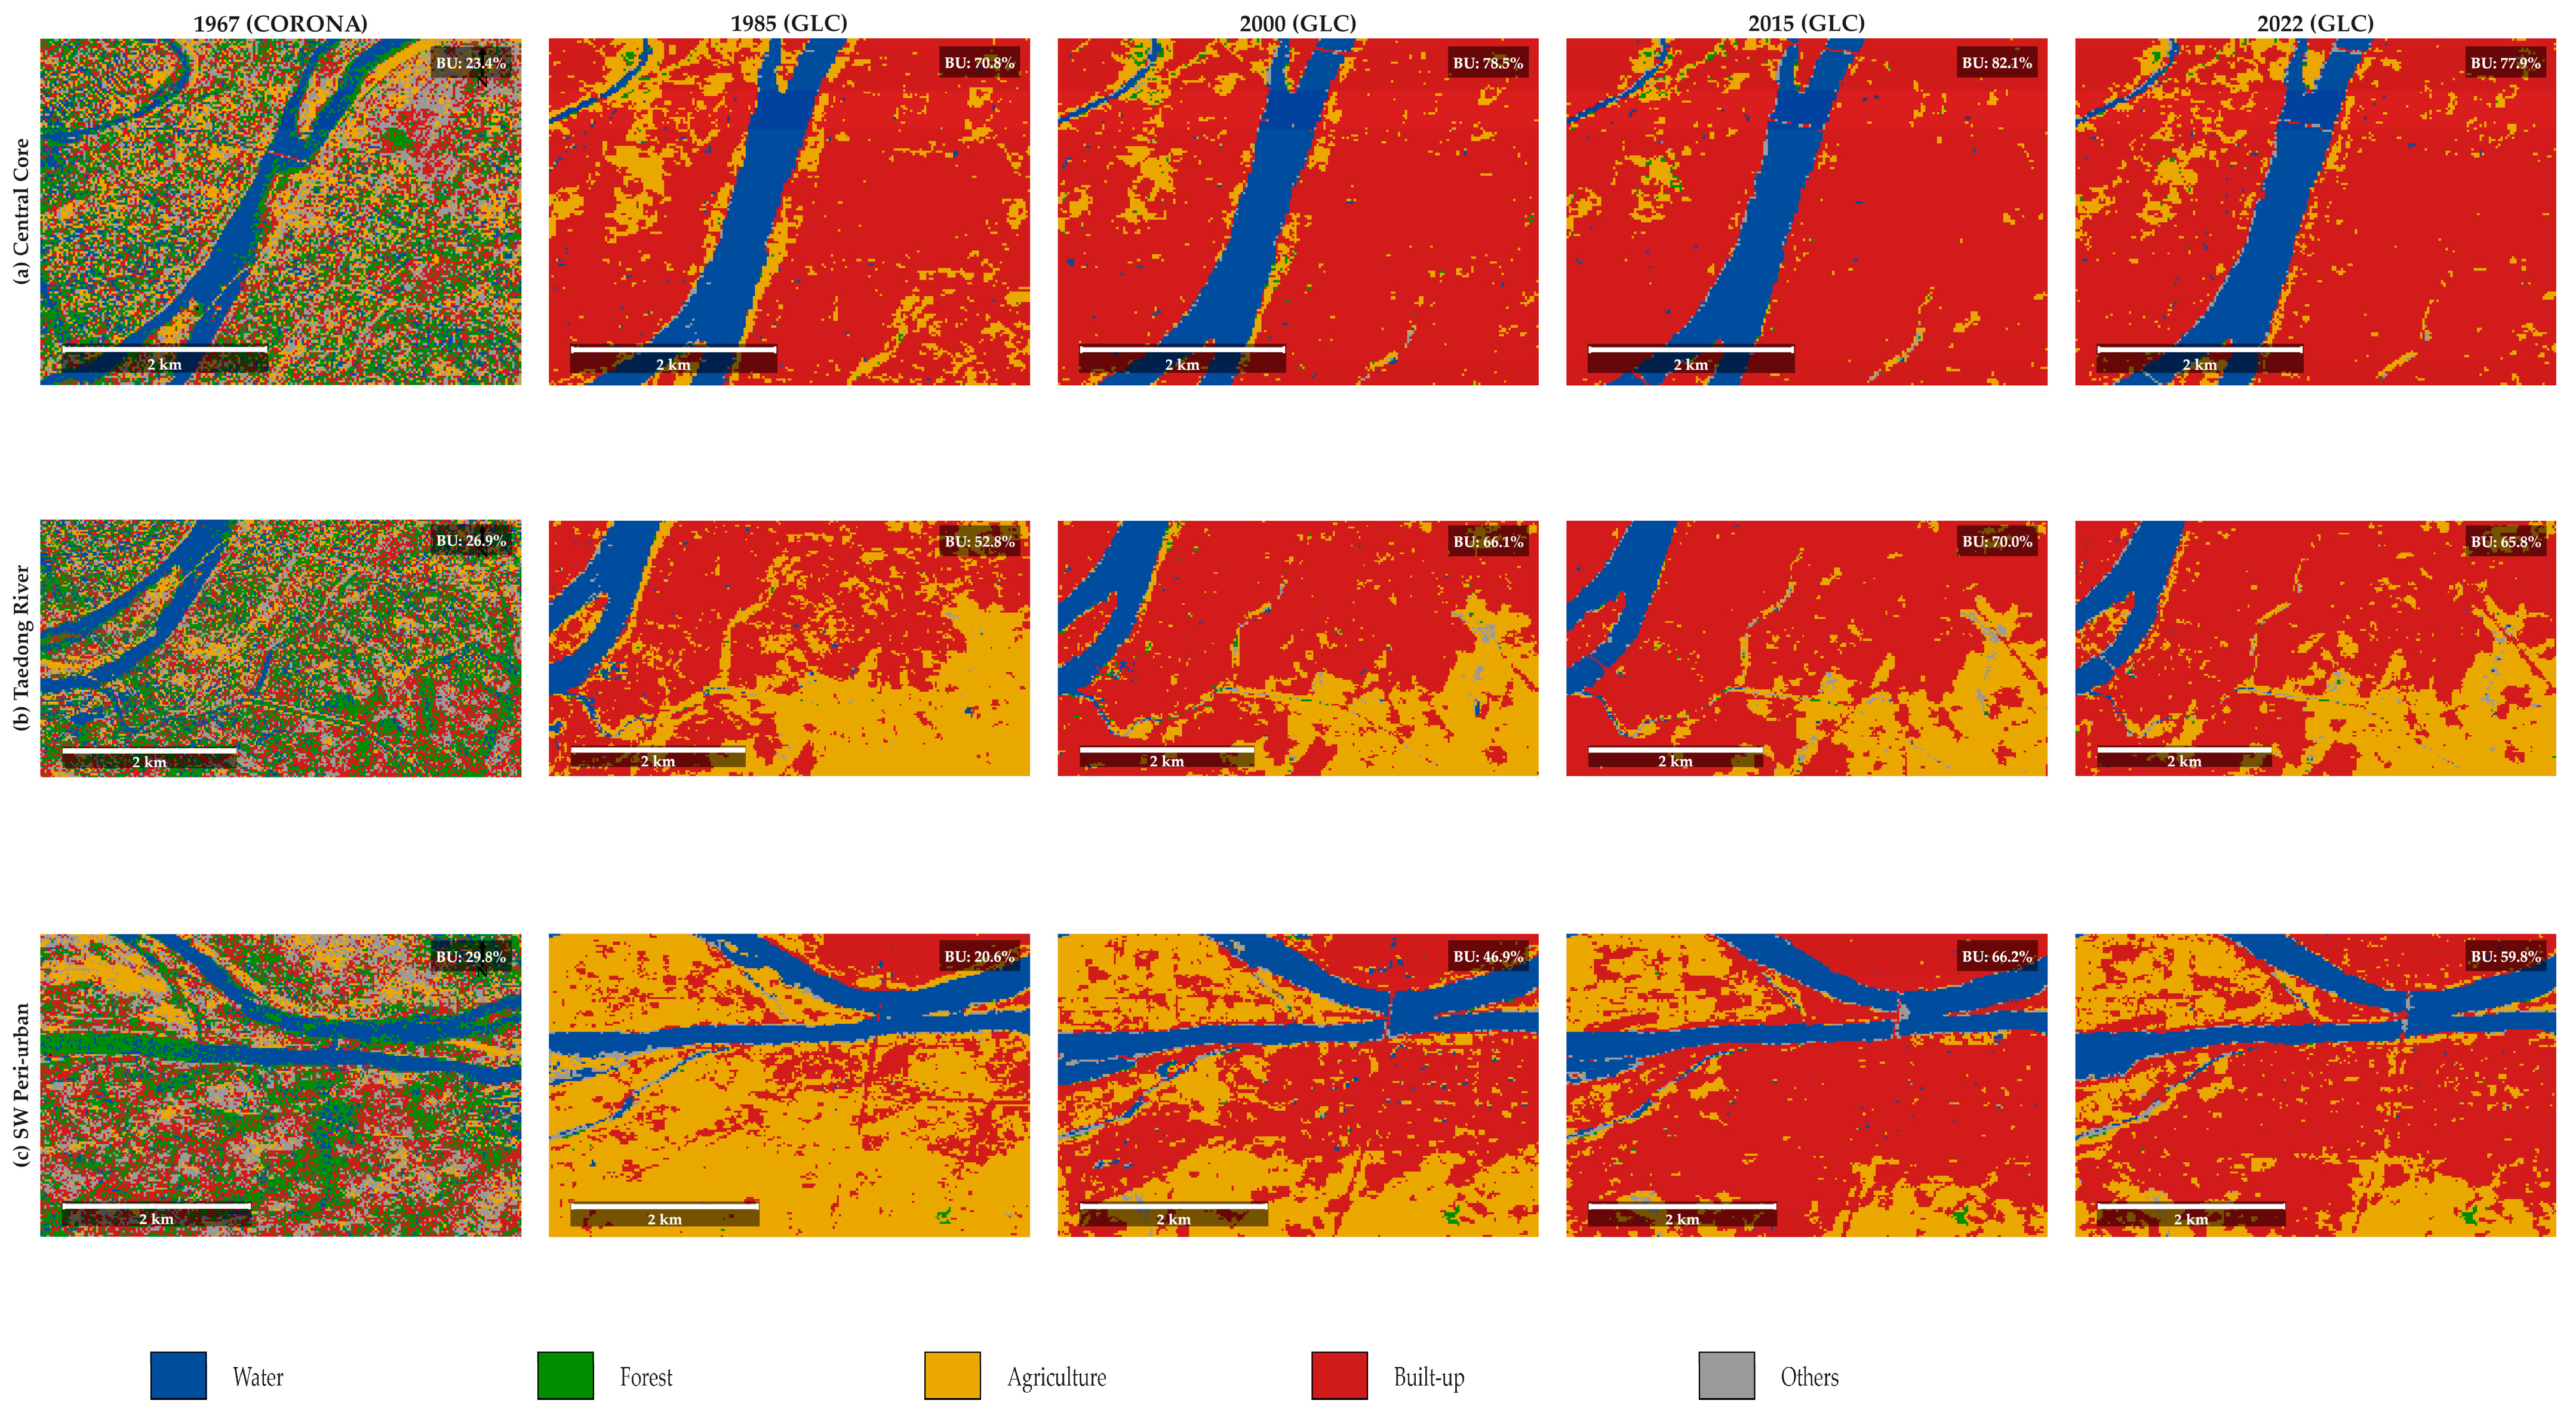
References
- Foley, J.A.; DeFries, R.; Asner, G.P.; Barford, C.; Bonan, G.; Carpenter, S.R.; Chapin, F.S.; Coe, M.T.; Daily, G.C.; Gibbs, H.K.; et al. Global Consequences of Land Use. Science 2005, 309, 570–574. [Google Scholar] [CrossRef] [Scilit]
- Wulder, M.A.; Loveland, T.R.; Roy, D.P.; Crawford, C.J.; Masek, J.G.; Woodcock, C.E.; Allen, R.G.; Anderson, M.C.; Belward, A.S.; Cohen, W.B.; et al. Current Status of Landsat Program, Science, and Applications. Remote Sens. Environ. 2019, 225, 127–147. [Google Scholar] [CrossRef] [Scilit]
- Armstrong, C.K. The Destruction and Reconstruction of North Korea, 1950–1960. Asia-Pac. J. 2009, 7, e8. [Google Scholar] [CrossRef] [Scilit]
- Goodkind, D.; West, L. The North Korean Famine and Its Demographic Impact. Popul. Dev. Rev. 2001, 27, 219–238. [Google Scholar] [CrossRef] [Scilit]
- Em, P.P.; Ward, P. City Profile: Is Pyongyang a Post-Socialist City? Cities 2021, 108, 102950. [Google Scholar] [CrossRef] [Scilit]
- Piao, Y.; Xiao, Y.; Ma, F.; Park, S.; Lee, D.; Mo, Y.; Jeong, S.; Hwang, I.; Kim, Y. Monitoring Land Use/Land Cover and Landscape Pattern Changes at a Local Scale: A Case Study of Pyongyang, North Korea. Remote Sens. 2023, 15, 1592. [Google Scholar] [CrossRef] [Scilit]
- Piao, Y.; Jeong, S.; Park, S.; Lee, D. Analysis of Land Use and Land Cover Change Using Time-Series Data and Random Forest in North Korea. Remote Sens. 2021, 13, 3501. [Google Scholar] [CrossRef] [Scilit]
- Zhang, X.; Zhao, T.; Xu, H.; Liu, W.; Wang, J.; Chen, X.; Liu, L. GLC_FCS30D: The First Global 30 m Land-Cover Dynamics Monitoring Product with a Fine Classification System for the Period from 1985 to 2022 Generated Using Dense-Time-Series Landsat Imagery and the Continuous Change-Detection Method. Earth Syst. Sci. Data 2024, 16, 1353–1381. [Google Scholar] [CrossRef] [Scilit]
- Philip, G.; Donoghue, D.; Beck, A.; Galiatsatos, N. CORONA Satellite Photography: An Archaeological Application from the Middle East. Antiquity 2002, 76, 109–118. [Google Scholar] [CrossRef] [Scilit]
- Dashora, A.; Lohani, B.; Malik, J.N. A Repository of Earth Resource Information—CORONA Satellite Programme. Curr. Sci. 2007, 92, 926–932. [Google Scholar]
- Li, S. Identifying urban built-up areas using CORONA imagery in the pre-Landsat era: A case study of Shanghai in the 1960s. Int. J. Remote Sens. 2024, 45, 2028–2048. [Google Scholar] [CrossRef] [Scilit]
- Mihai, B.; Nistor, C.; Simion, G. High Resolution Landscape Change Analysis with CORONA KH-4B Imagery. A Case Study from Iron Gates Reservoir Area. Procedia Environ. Sci. 2016, 32, 200–210. [Google Scholar] [CrossRef] [Scilit]
- Rizayeva, A.; Nita, M.D.; Radeloff, V.C. Large-area, 1964 land cover classifications of Corona spy satellite imagery for the Caucasus Mountains. Remote Sens. Environ. 2023, 284, 113343. [Google Scholar] [CrossRef] [Scilit]
- Agapiou, A. Land Cover Mapping from Colorized CORONA Archived Greyscale Satellite Data and Feature Extraction Classification. Land 2021, 10, 771. [Google Scholar] [CrossRef] [Scilit]
- Fu, Q.; Xia, S.; Kang, Y.; Sun, M.; Tan, K. Satellite Remote Sensing Grayscale Image Colorization Based on Denoising Generative Adversarial Network. Remote Sens. 2024, 16, 3644. [Google Scholar] [CrossRef] [Scilit]
- Kang, X.; Yang, T.; Ouyang, W.; Ren, P.; Li, L.; Xie, X. DDColor: Towards Photo-Realistic Image Colorization via Dual Decoders. In Proceedings of the 2023 IEEE/CVF International Conference on Computer Vision (ICCV); IEEE: New York, NY, USA, 2023; pp. 328–338. [Google Scholar]
- Liu, Z.; Mao, H.; Wu, C.-Y.; Feichtenhofer, C.; Darrell, T.; Xie, S. A ConvNet for the 2020s. In Proceedings of the 2022 IEEE/CVF Conference on Computer Vision and Pattern Recognition (CVPR); IEEE: New York, NY, USA; pp. 11966–11976.
- Hirt, S. Whatever Happened to the (Post)Socialist City? Cities 2013, 32, S29–S38. [Google Scholar] [CrossRef] [Scilit]
- Kang, S.; Choi, J.; Yoon, H.; Choi, W. Changes in the Extent and Distribution of Urban Land Cover in the Democratic People’s Republic of Korea (North Korea) between 1987 and 2010. Land Degrad. Dev. 2019, 30, 2009–2017. [Google Scholar] [CrossRef] [Scilit]
- Kim, N. Worldview-3 Super-Resolution (×4) Training Dataset Using Satellite Imagery. DataON (Korea Institute of Science and Technology Information, KISTI). 2025. Available online: https://dataon.kisti.re.kr/search/view.do?drId=c6e83759-3def-4185-b5c9-adec42aa9048 (accessed on 3 April 2026).
- Zhao, H.; Gallo, O.; Frosio, I.; Kautz, J. Loss Functions for Image Restoration with Neural Networks. IEEE Trans. Comput. Imaging 2017, 3, 47–57. [Google Scholar] [CrossRef] [Scilit]
- Johnson, J.; Alahi, A.; Fei-Fei, L. Perceptual Losses for Real-Time Style Transfer and Super-Resolution. In Computer Vision–ECCV 2016; Leibe, B., Matas, J., Sebe, N., Welling, M., Eds.; Lecture Notes in Computer Science; Springer International Publishing: Cham, Switzerland, 2016; Volume 9906, pp. 694–711. ISBN 978-3-319-46474-9. [Google Scholar]
- Zhou, W.; Bovik, A.C.; Sheikh, H.R.; Simoncelli, E.P. Image Quality Assessment: From Error Visibility to Structural Similarity. IEEE Trans. Image Process. 2004, 13, 600–612. [Google Scholar] [CrossRef] [Scilit]
- Haggard, S.; Noland, M. Famine in North Korea: Markets, Aid, and Reform; Columbia University Press: New York, NY, USA, 2007. [Google Scholar]
- Lee, S.-H.; Suh, M.-G.; Kim, S.-B.; Baek, M. Urban Poverty Patterns in Pyongyang (North Korea): A Deep-Learning-Based Spatial Analysis. Cities 2024, 151, 105109. [Google Scholar] [CrossRef] [Scilit]
- Lee, Y.S. International Isolation and Regional Inequality: Evidence from Sanctions on North Korea. J. Urban Econ. 2018, 103, 34–51. [Google Scholar] [CrossRef] [Scilit]
- Ahn, D.; Yang, J.; Cha, M.; Yang, H.; Kim, J.; Park, S.; Han, S.; Lee, E.; Lee, S.; Park, S. A Human-Machine Collaborative Approach Measures Economic Development Using Satellite Imagery. Nat. Commun. 2023, 14, 6811. [Google Scholar] [CrossRef] [Scilit] [PubMed]
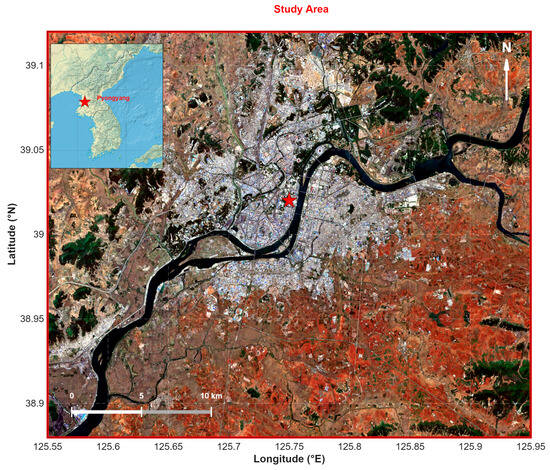
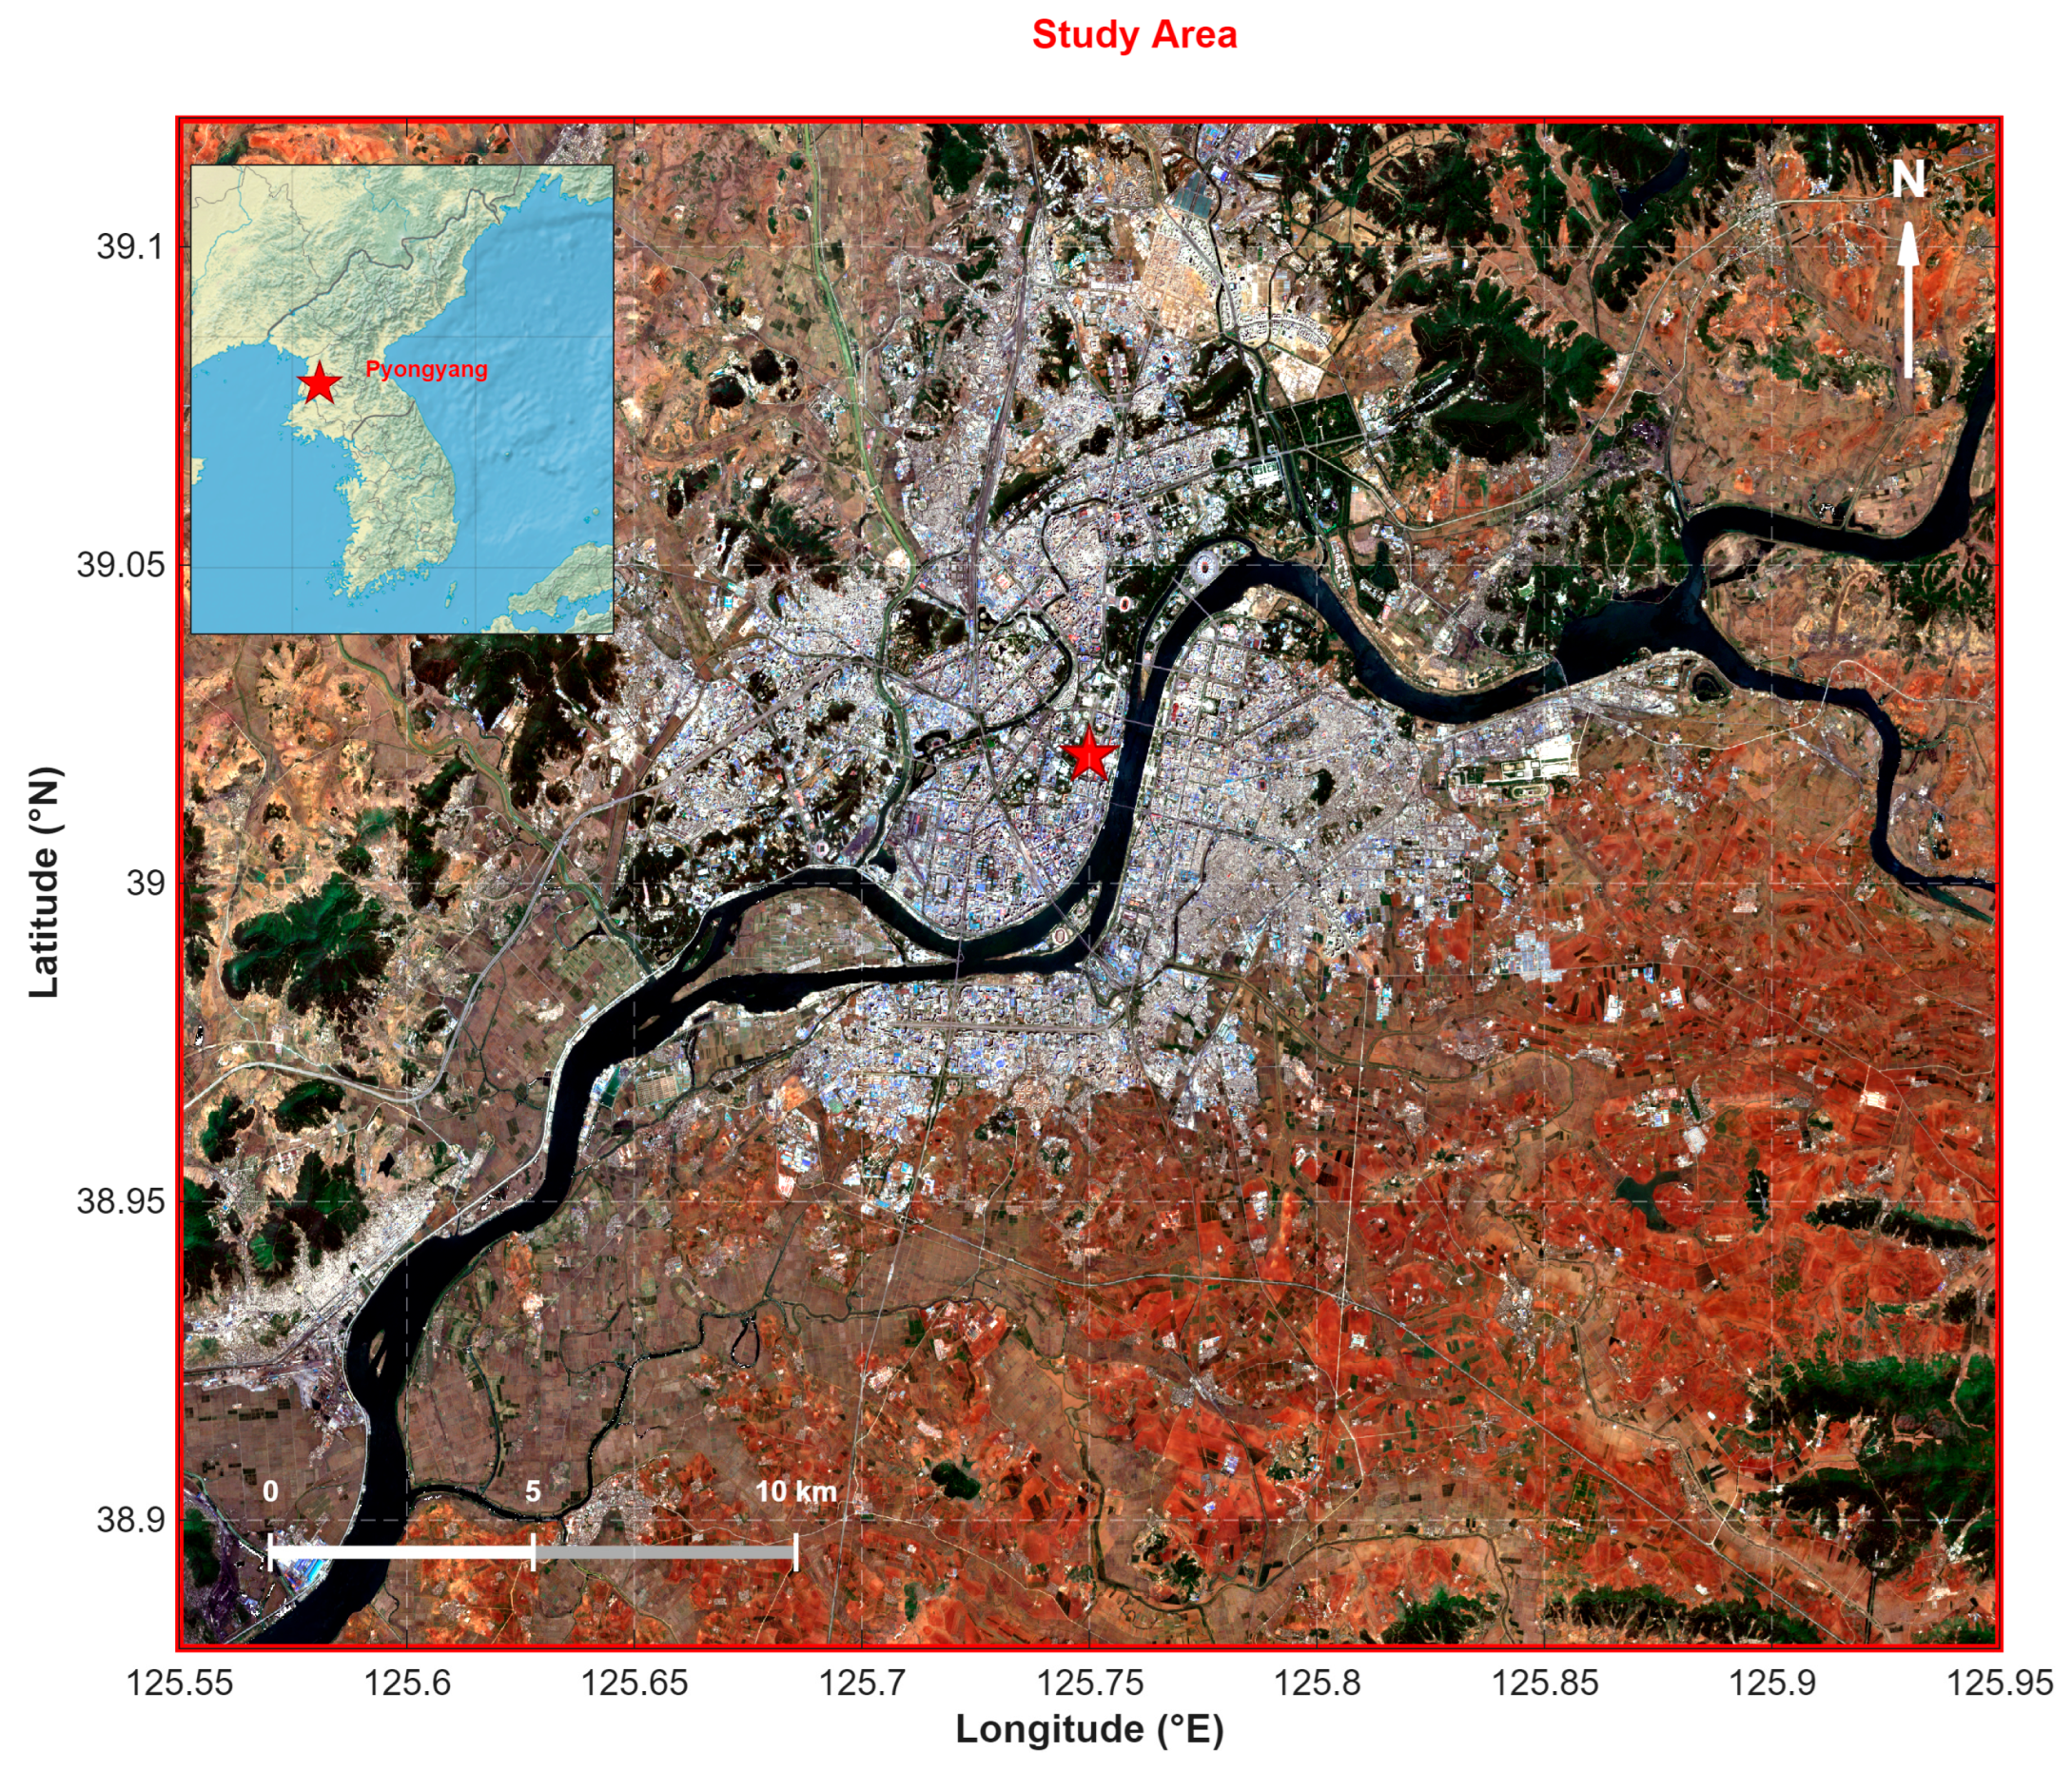
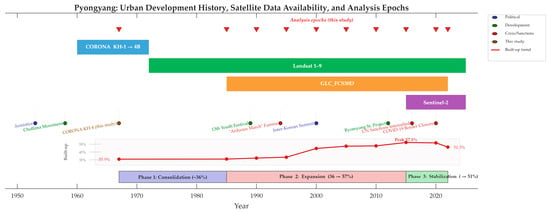
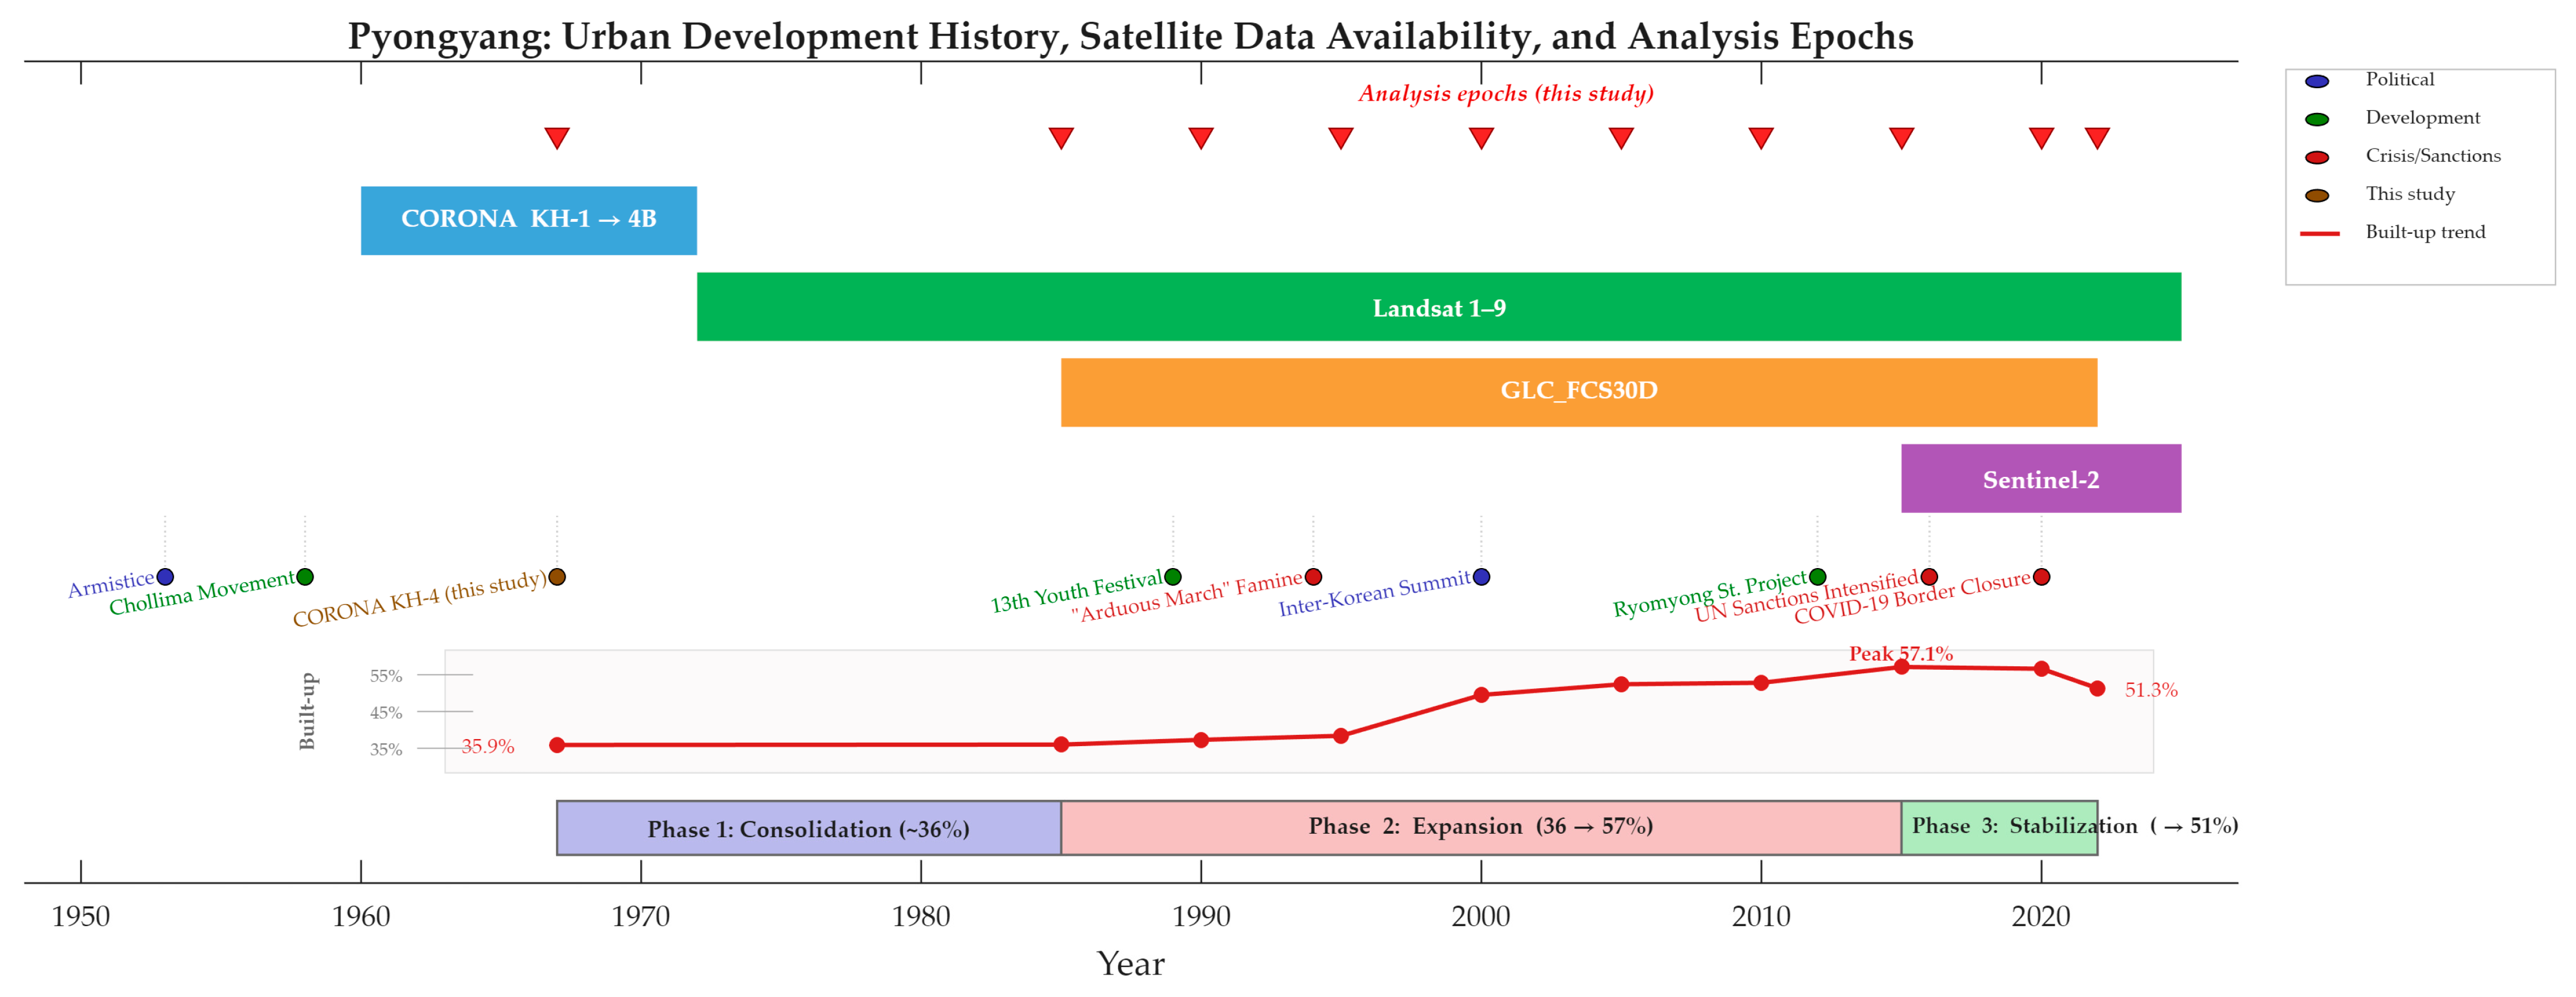
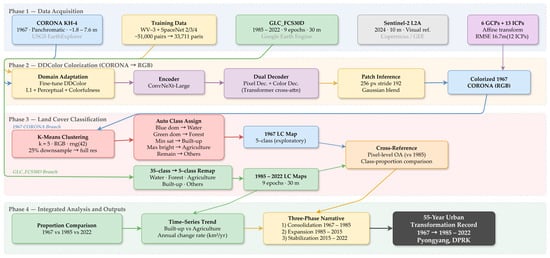
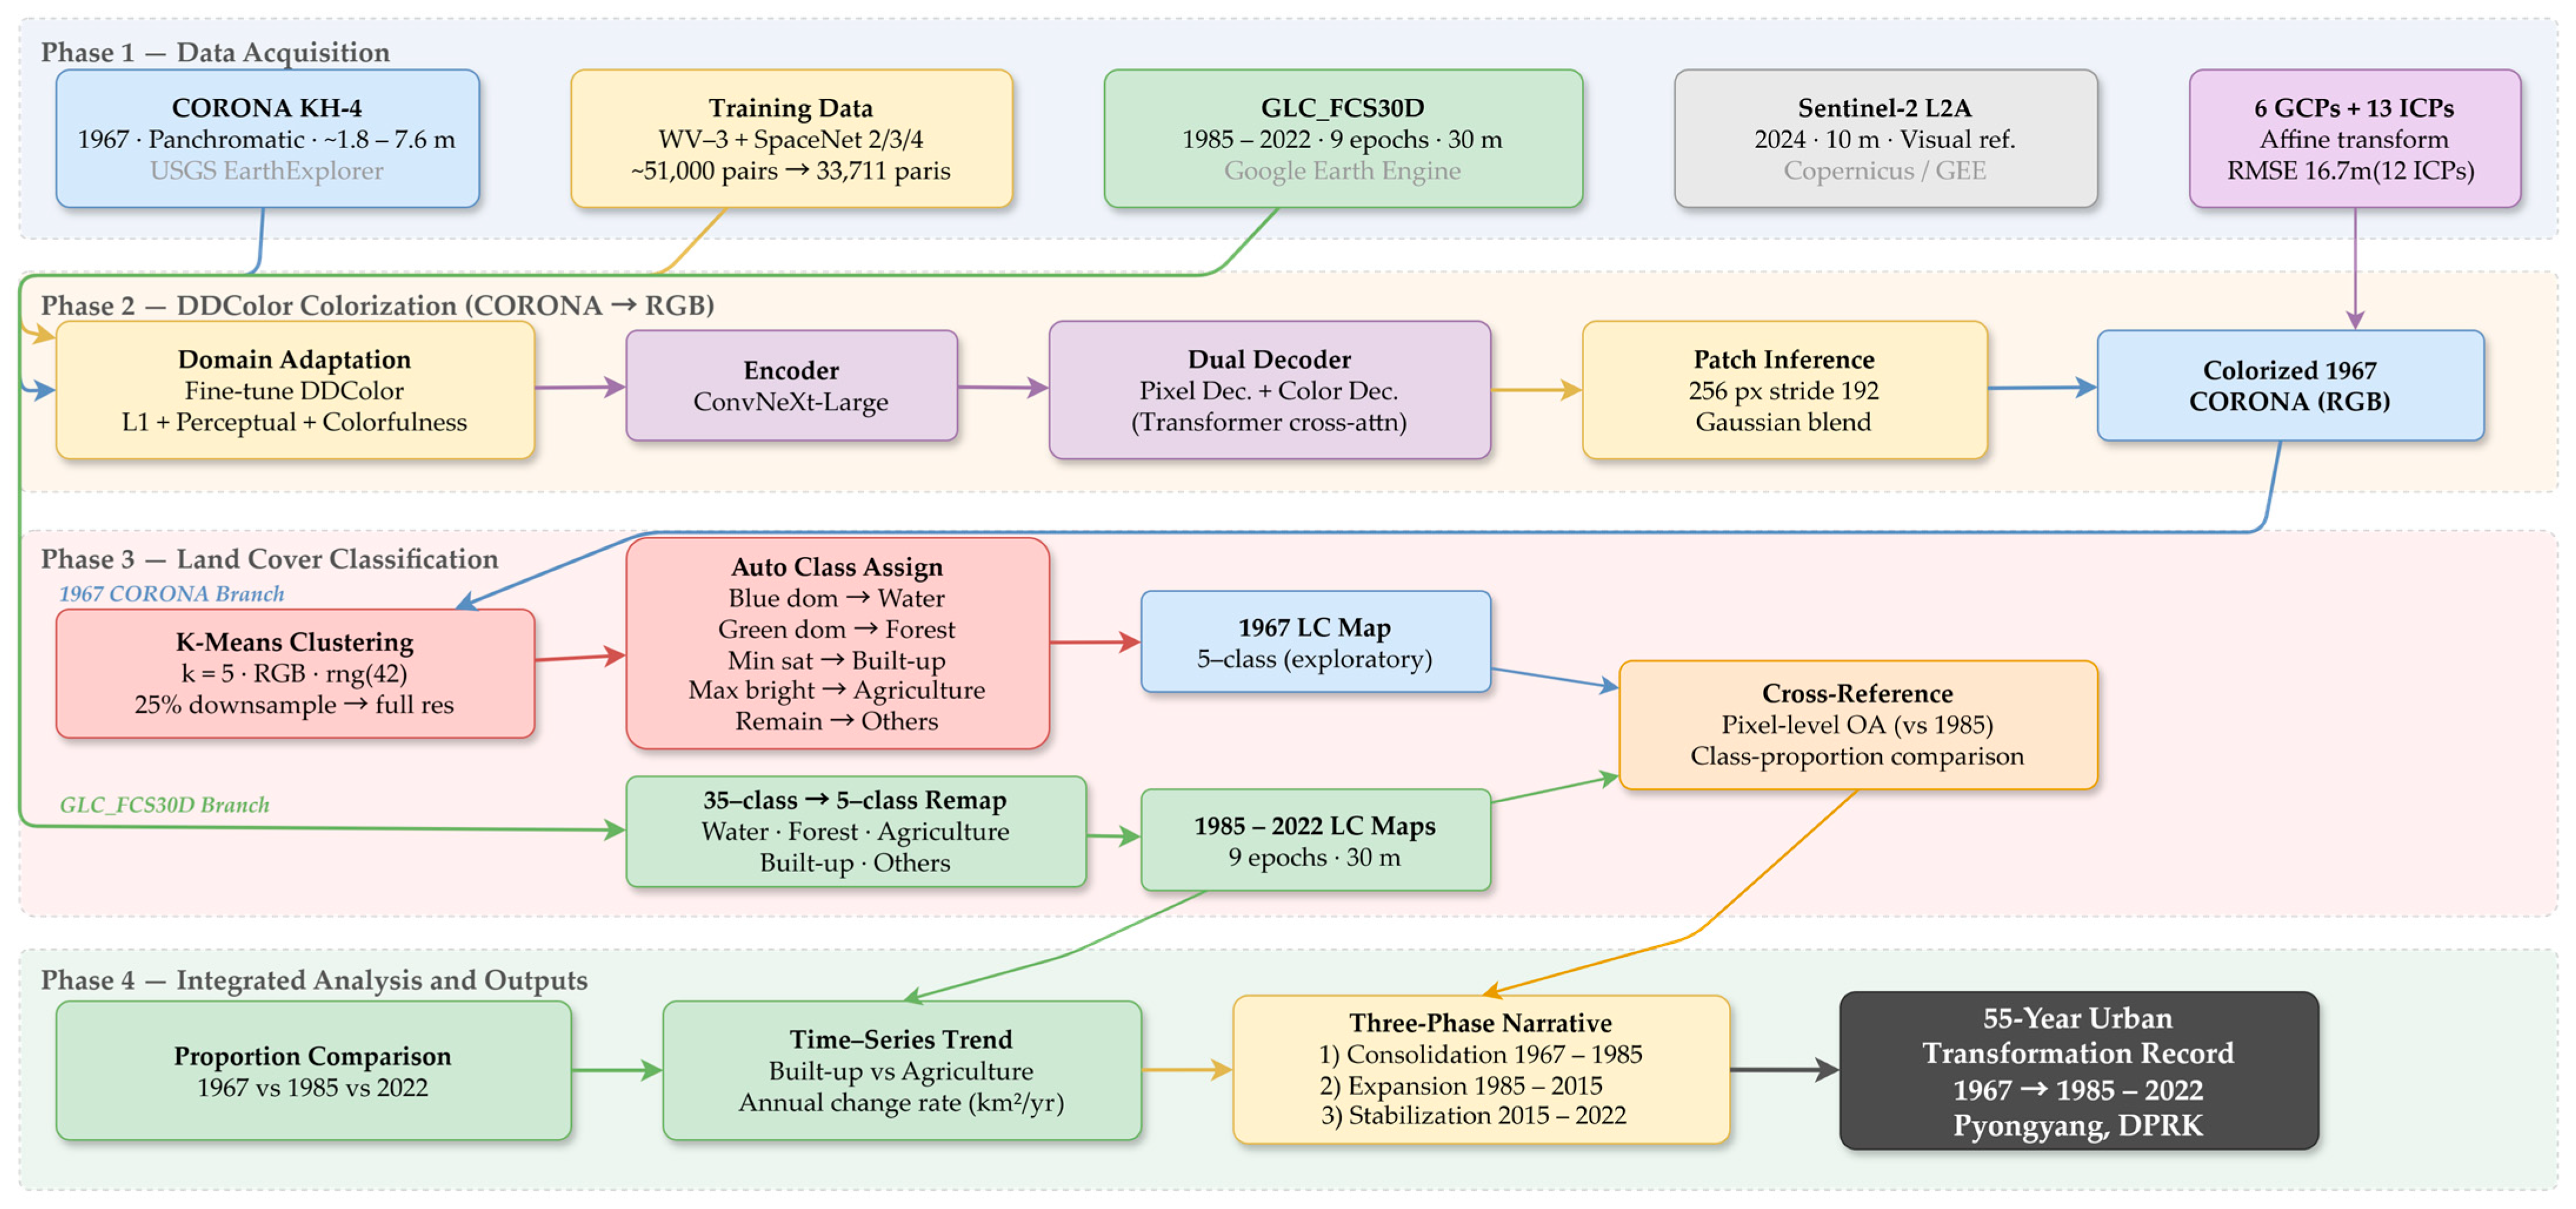
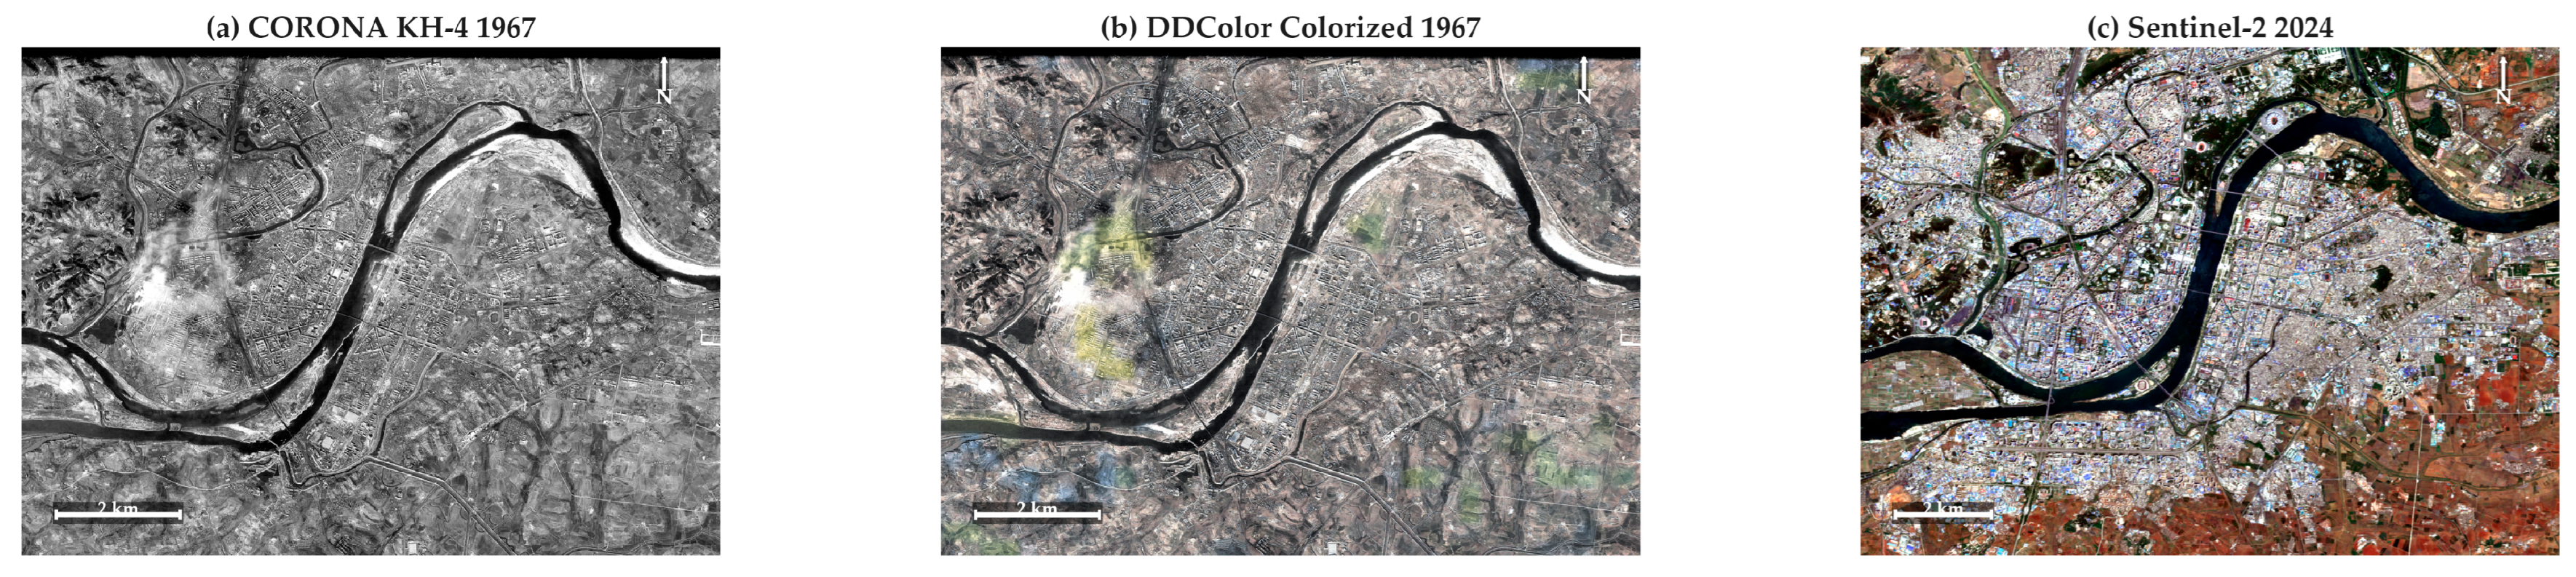
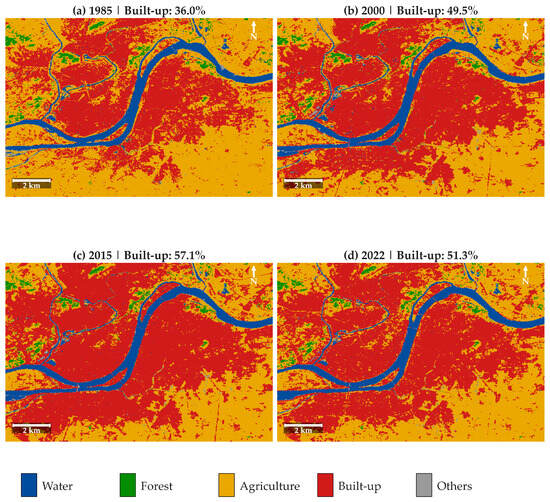
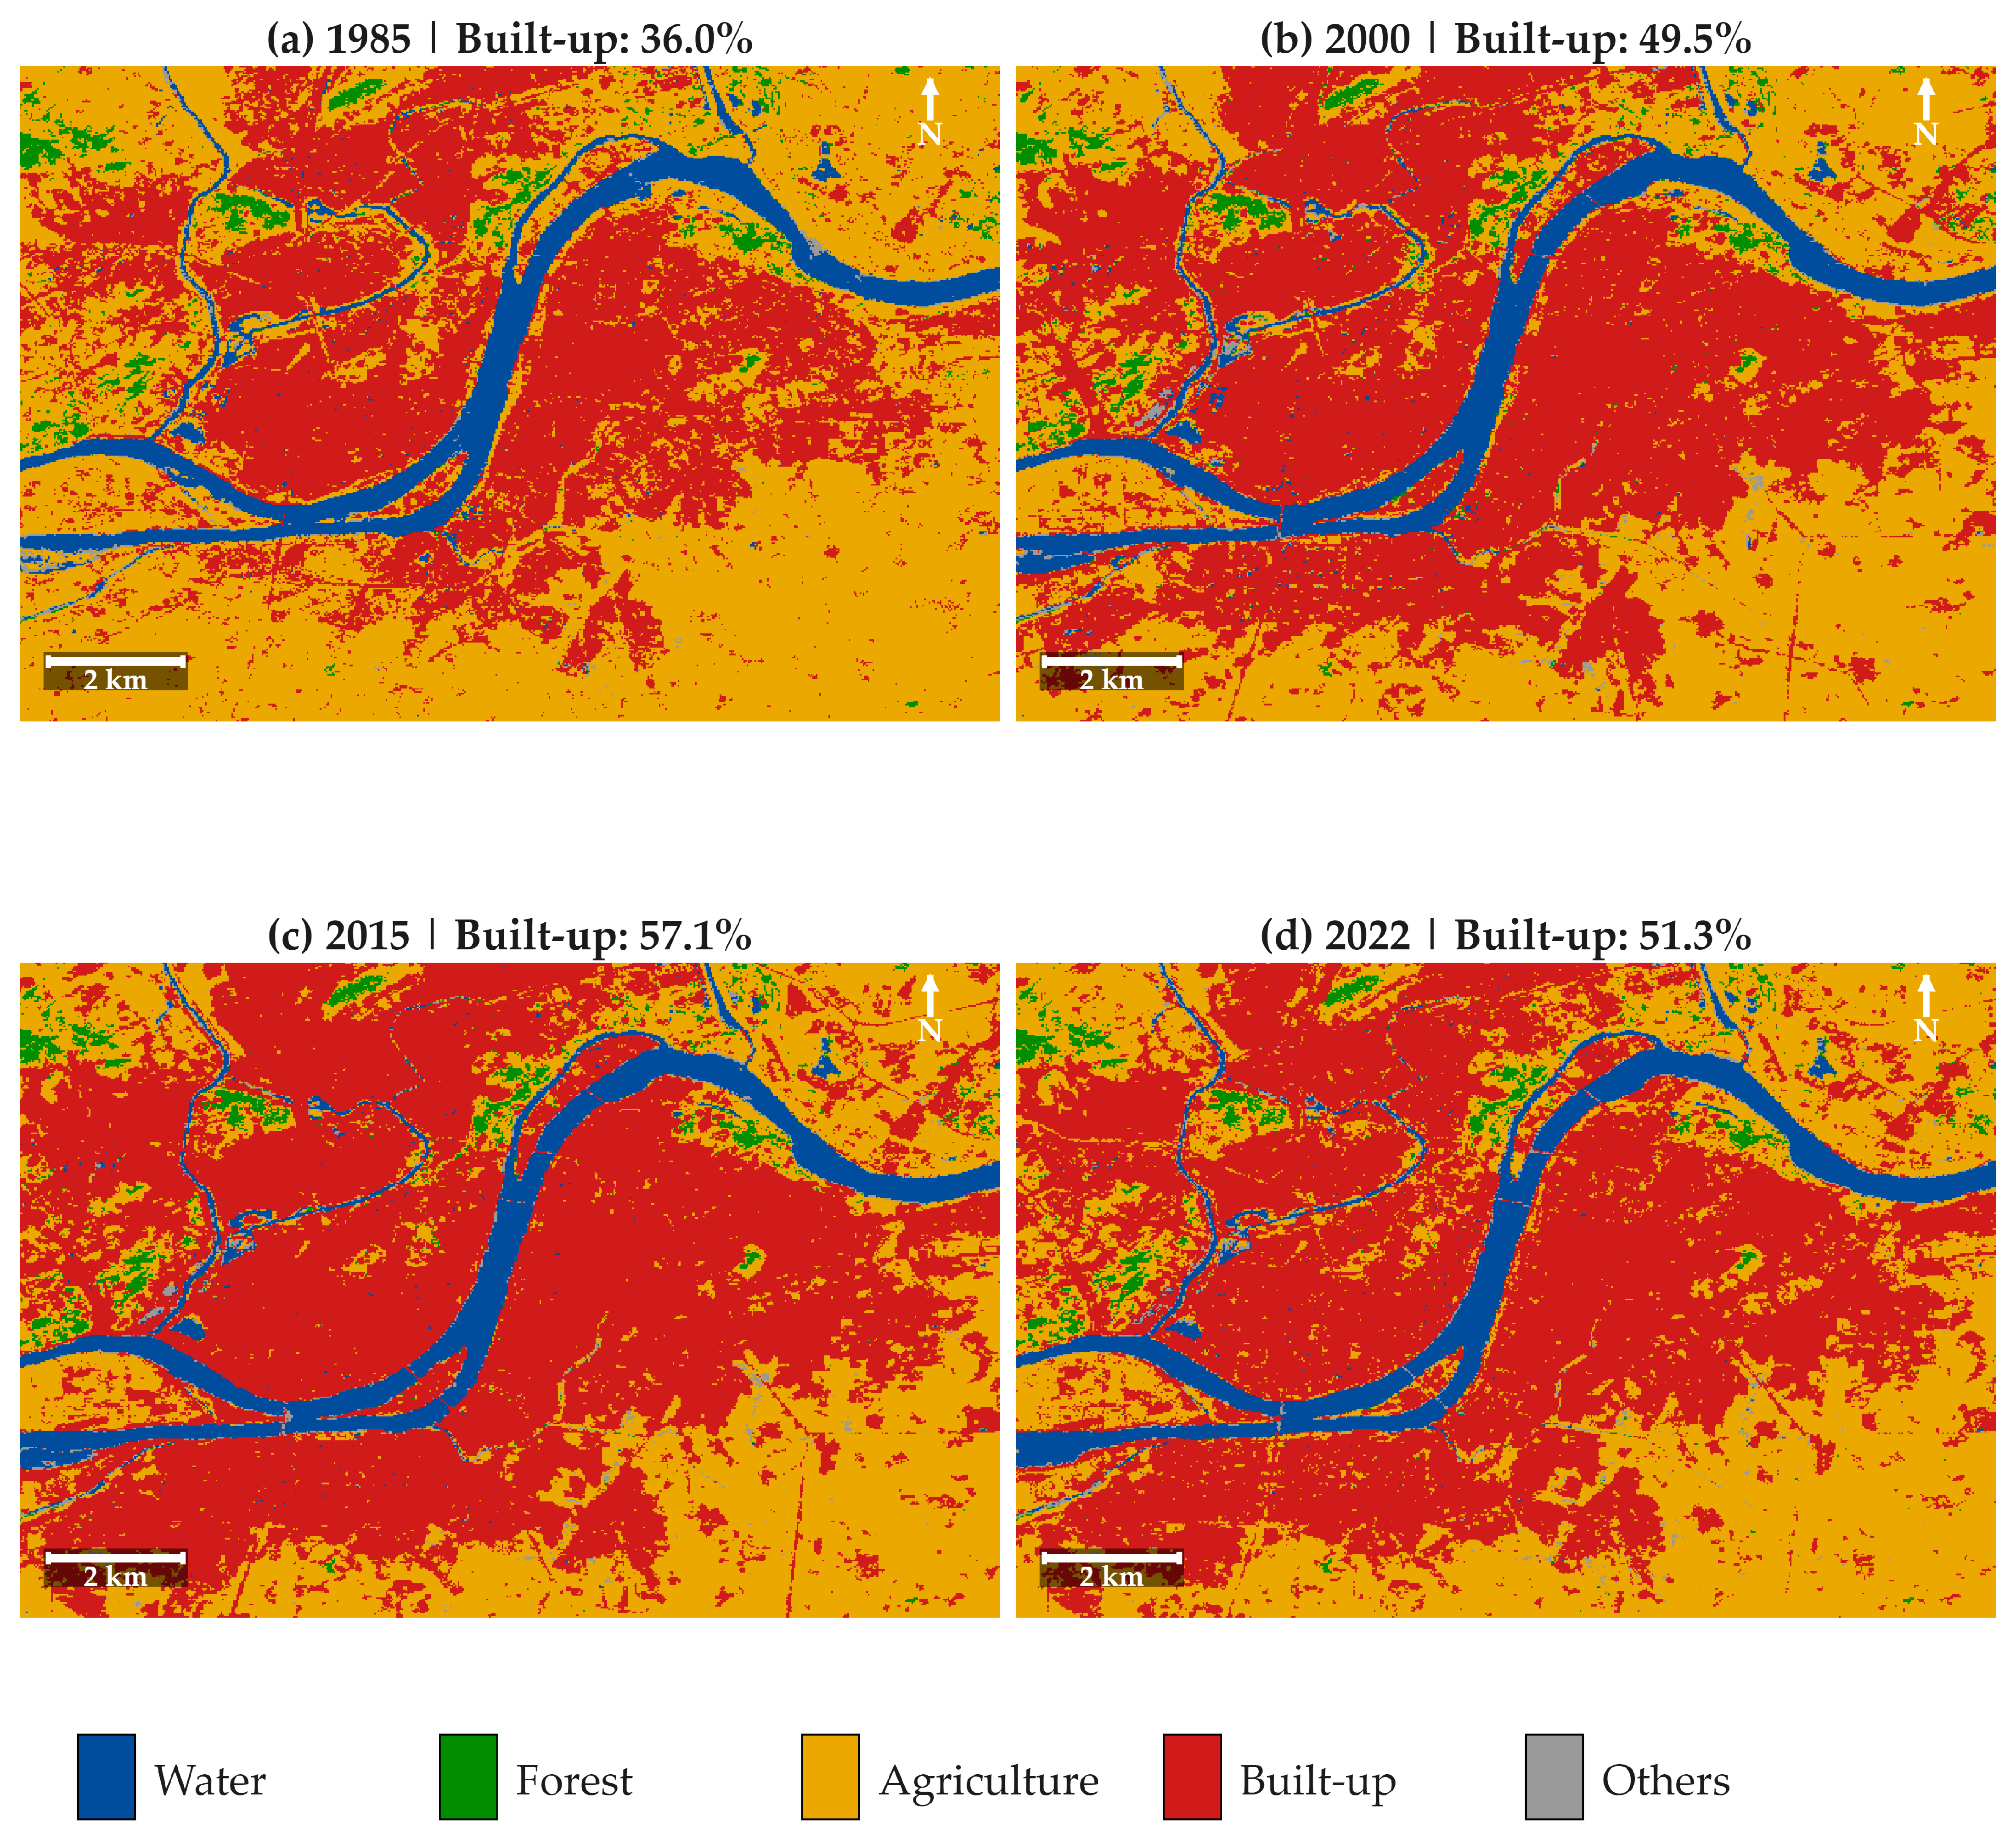
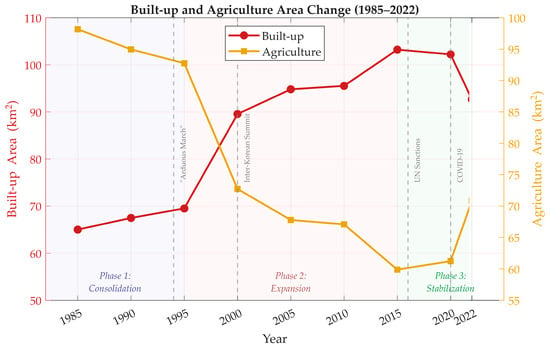
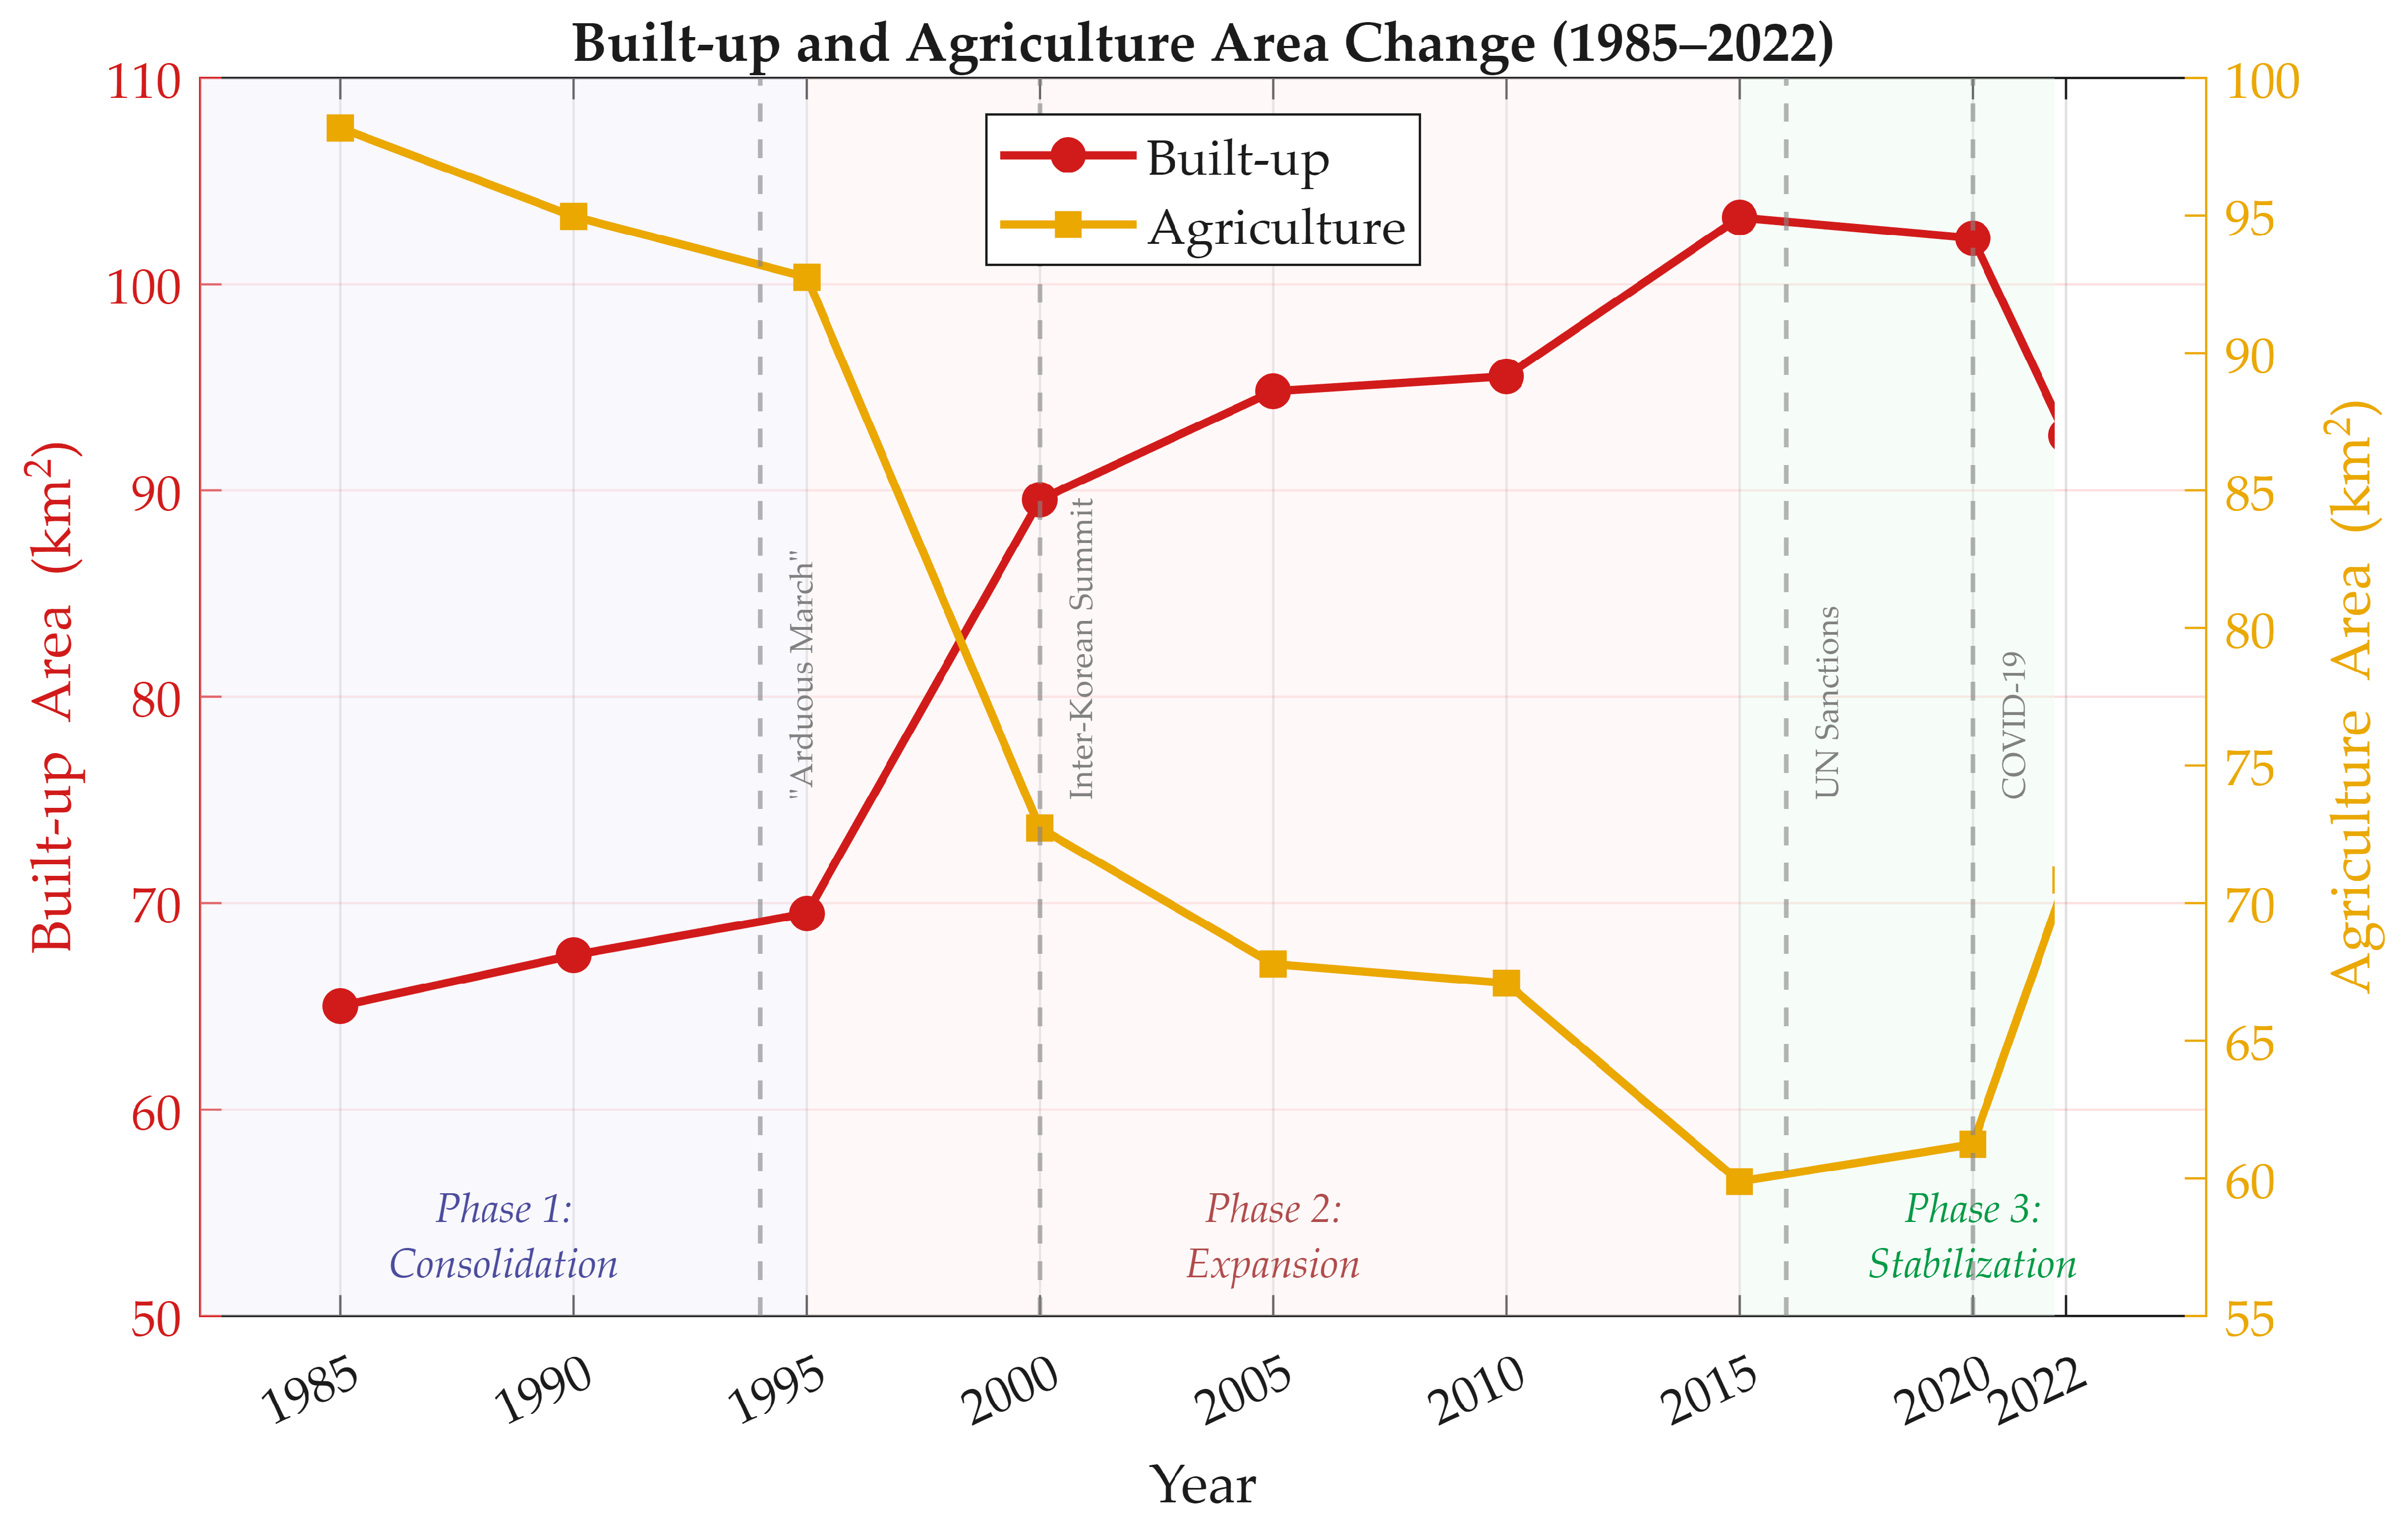
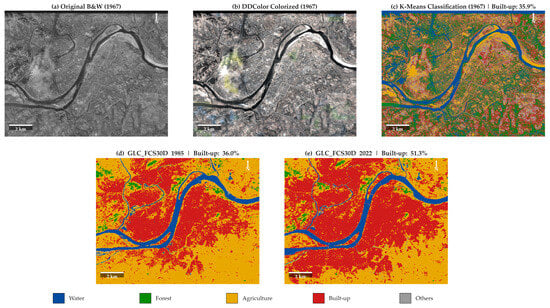
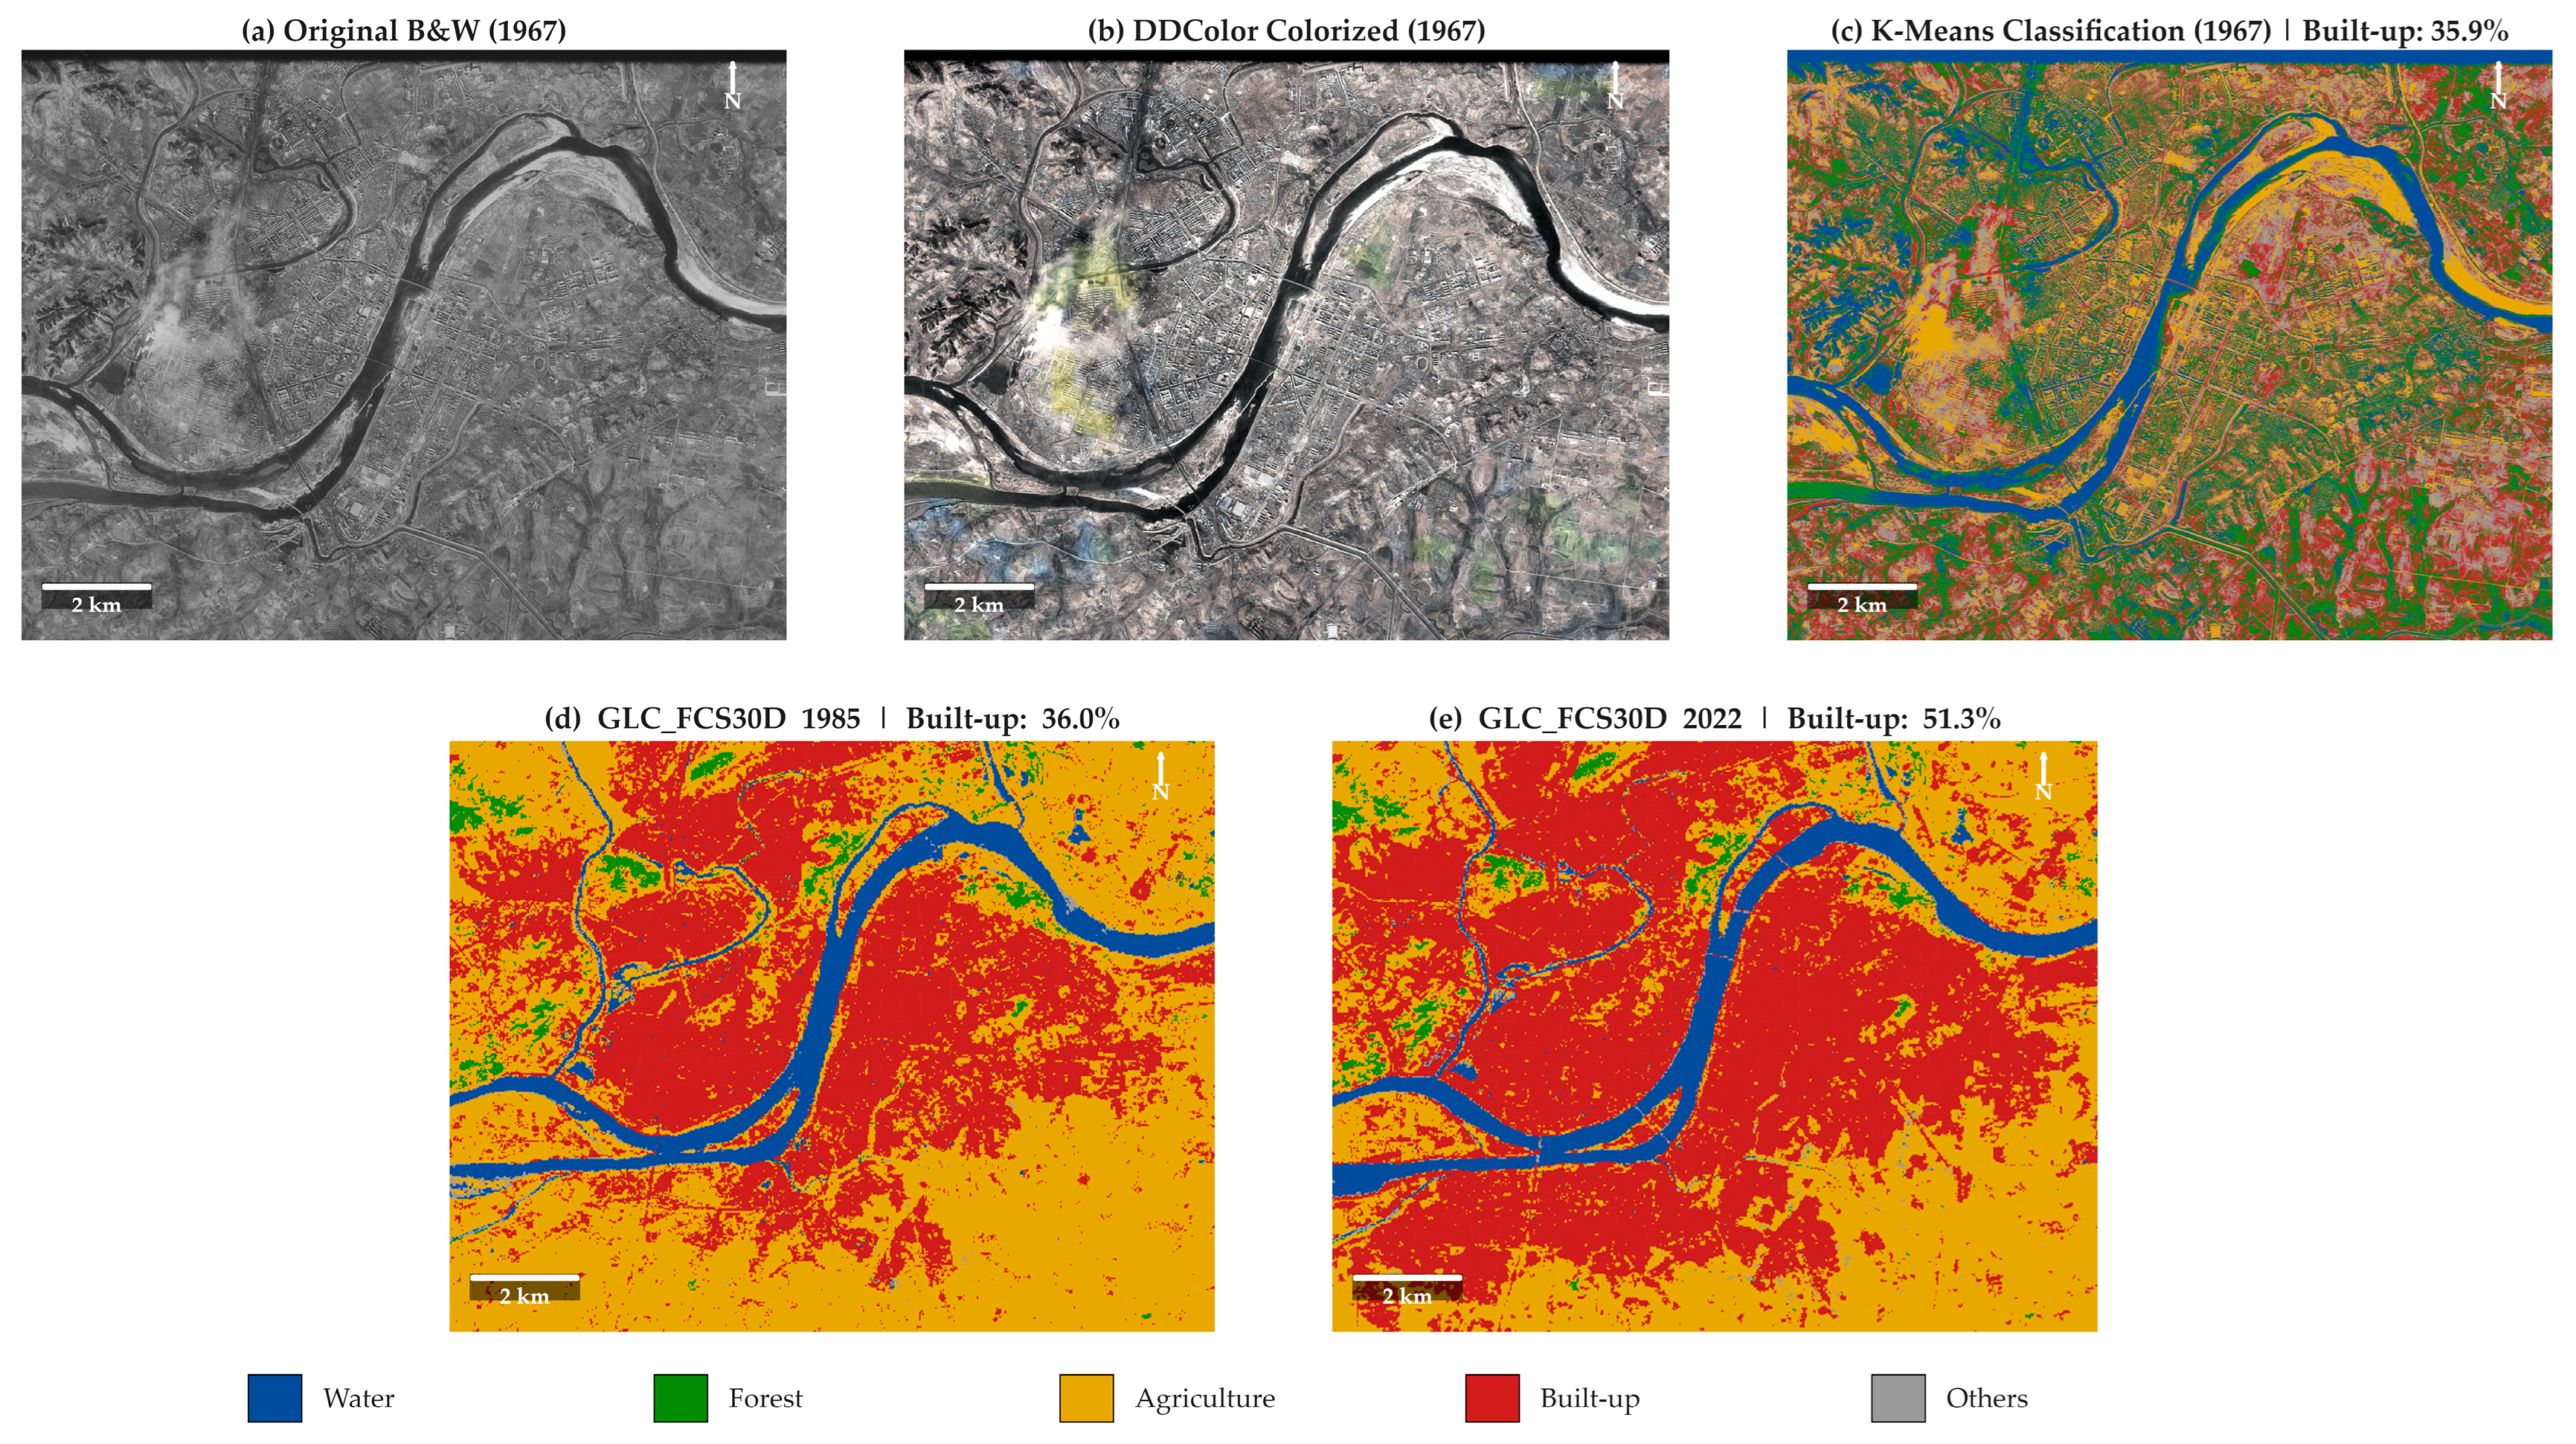
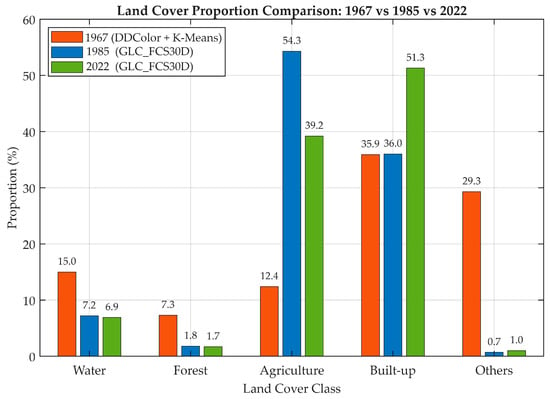
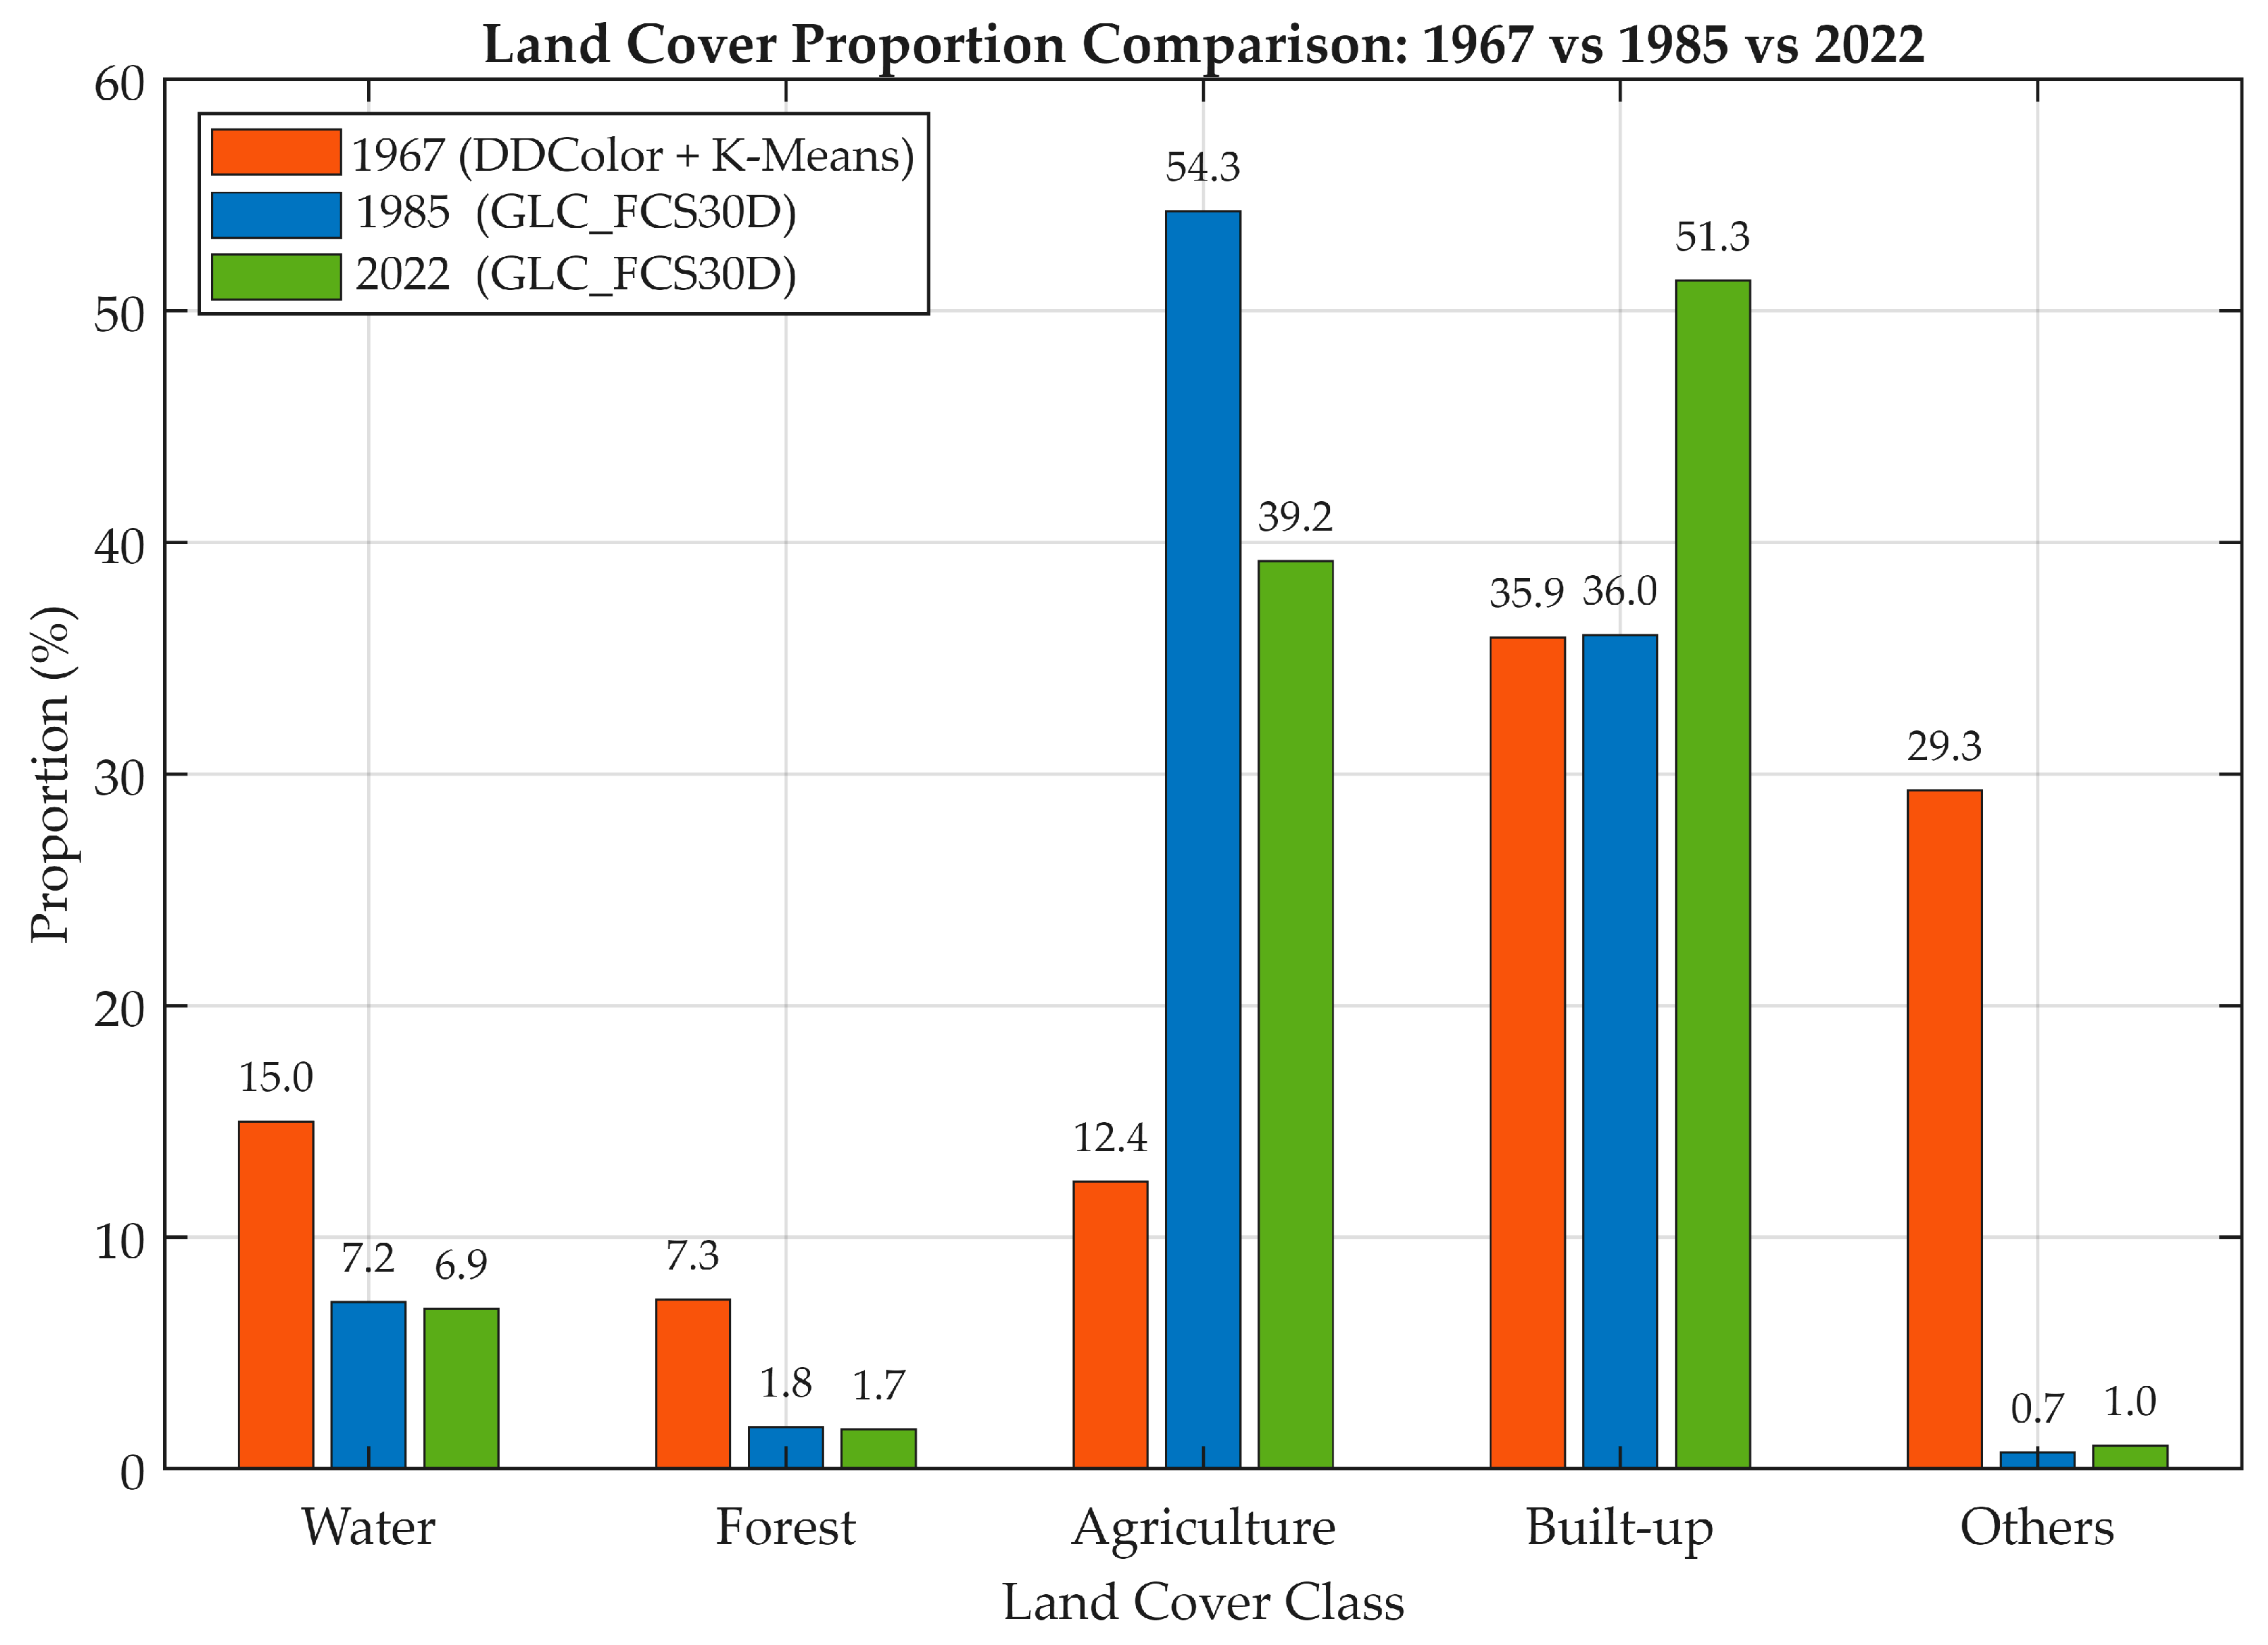
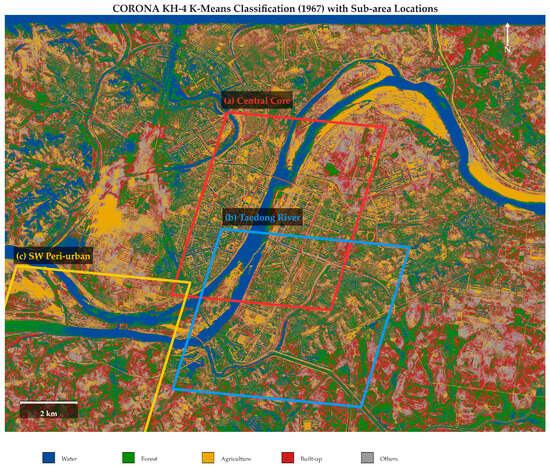
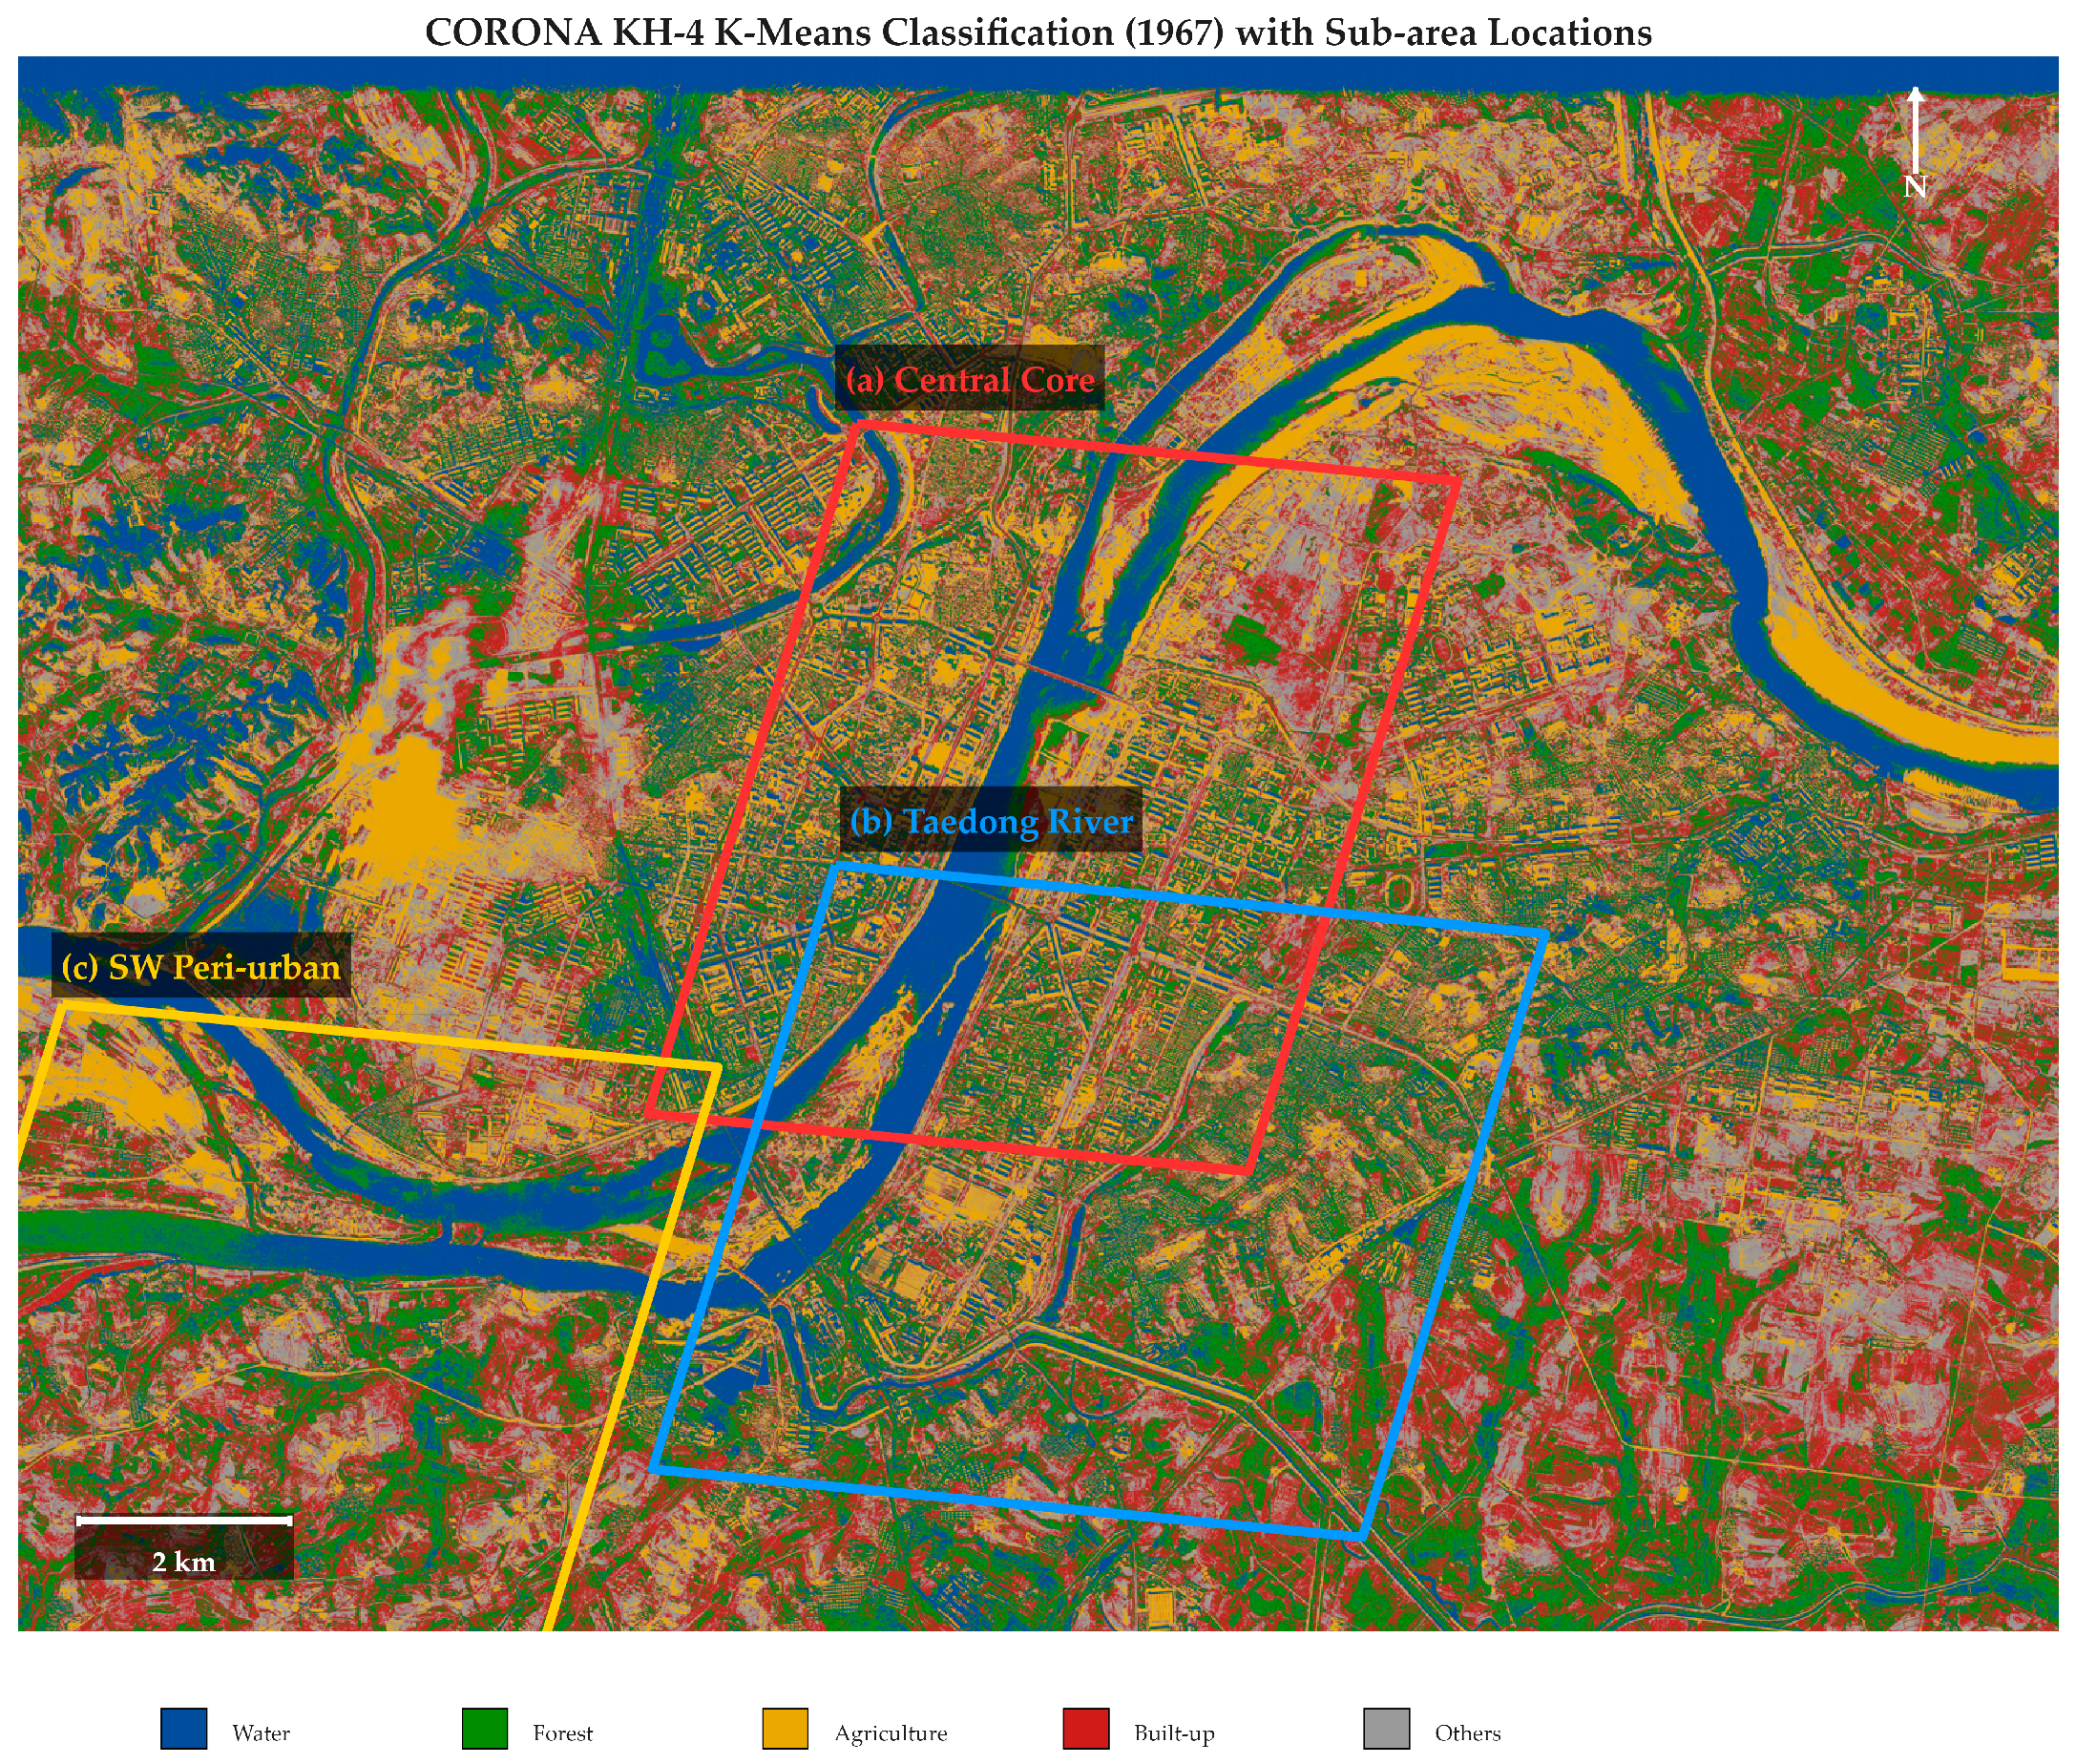

Disclaimer/Publisher’s Note: The statements, opinions and data contained in all publications are solely those of the individual author(s) and contributor(s) and not of MDPI and/or the editor(s). MDPI and/or the editor(s) disclaim responsibility for any injury to people or property resulting from any ideas, methods, instructions or products referred to in the content. |
© 2026 by the authors. Licensee MDPI, Basel, Switzerland. This article is an open access article distributed under the terms and conditions of the Creative Commons Attribution (CC BY) license.