


Abstract
The fallow deer (Dama dama) population on the island of Rhodes, Greece, constitutes one of the oldest extant free-ranging populations of this species. Robust population estimates are crucial for effective conservation and management. This study aimed to estimate deer population density, using a combination of direct and indirect approaches and to evaluate their relative performance. Surveys were conducted during the rutting season (October 2022) across mixed habitats, shrublands, and forests using Daytime Distance Sampling (DDS) and Spotlight Distance Sampling (SDS). Indirect estimates were derived using the Faecal Standing Crop (FSC) method during the same period, and, in January 2023, a revisit allowed estimation through the Faecal Accumulation Rate (FAR) method. All approaches indicated that mixed habitats supported the highest densities (7.85–10 individuals/km2), whereas shrublands (2.24–2.64 individuals/km2) and forests (0.65–2.96 individuals/km2) showed lower densities. Distance sampling methods performed best in mixed habitats, while FSC yielded more accurate and precise estimates than FAR across all habitats according to the Relative Net Precision index. These findings highlight the value of integrating complementary density methods and support the combined application of SDS and FSC for long-term population monitoring and evidence-based management.
1. Introduction
Wild ungulates are key components of European ecosystems, functioning as ecosystem engineers that influence vegetation structure, soil nutrient cycling, trophic interactions, and overall biodiversity. They frequently interact with human land use across much of the continent [1,2,3,4]. In recent decades, ungulate populations have increased due to reforestation, changes in agricultural practices, legal protection, and local predator declines. This expansion has led to widespread distribution beyond protected areas and increasingly complex socio-ecological dynamics with humans, including crop and forest damage, vehicle collisions, and disease transmission, generating both ecological benefits and conflicts [5,6,7,8,9]. In this context, coordinated policies at national and European levels are essential to reconcile ungulate conservation and management with ecosystem health and human interests across diverse landscapes [10]. Effective conservation and management require science-based monitoring of population dynamics and ecological impacts [11], the integration of legal and administrative frameworks across jurisdictions, and adaptive strategies that balance biodiversity objectives with socioeconomic considerations [6,12,13]. However, in some European countries, including Greece, systematic and scientifically rigorous monitoring remains limited [13].
A wide range of census methods has been applied across Europe to obtain reliable estimates of population size and demographic status, including both direct and indirect approaches. Direct methods rely on the observation of individuals, whereas indirect methods are based on signs such as calls, tracks, or faecal pellet group counts. The selection of an appropriate method depends on local conditions, habitat characteristics, cost, logistical constraints, and methodological considerations, including bias, accuracy, and consistency [13,14,15,16,17]. Among these techniques, distance sampling is a widely used direct method for ungulate population surveys [16,18,19,20] due to its ability to account for imperfect detectability [21,22,23]. Daytime distance sampling (DDS) is commonly applied to diurnal ungulates [18], particularly in open or semi-open habitats, where observers can accurately identify species, determine sex and age classes, estimate group size, record behaviour, and measure distances, leading to reliable density estimates. In contrast, spotlight distance sampling (SDS) is frequently employed for nocturnal or crepuscular ungulates, as eyeshine and movement under artificial light enhance detectability at night. SDS has been shown to be effective for species such as deer [14,16,24,25,26], particularly along roads or transects in open landscapes. However, it may introduce biases related to animal responses to light, reduced accuracy in distance estimation, observer fatigue, variability in observer experience, and limitations imposed by vegetation structure and light penetration [23,27]. Faecal standing crop (FSC) and faecal accumulation rate (FAR) are two widely used cost-effective indirect methods for estimating ungulate abundance based on counts of faecal pellet groups and require knowledge of defecation rate [14,16,28,29,30]. FSC generally requires less field effort per sample than FAR and often provides higher precision under certain conditions, although both methods remain subject to observational bias associated with pellet detectability, vegetation cover, and observer effects [29].
The fallow deer (Dama dama) is the most widely distributed deer species worldwide and one of only three deer species (Cervidae) with natural populations in Greece [31,32]. It occurs throughout the Mediterranean and has been introduced to other regions of Europe, North and South America, South Africa, New Zealand, Australia and several islands [32,33]. Its current distribution largely reflects human-mediated translocations [32,34,35], making it difficult to determine its original natural range [33]. In addition, captive populations are maintained globally for aesthetic, commercial (meat, antler, velvet), and hunting purposes. On the island of Rhodes, in Greece, one of the few free-ranging fallow deer populations occurs [36]. The species likely became established through repeated introductions from Anatolia during the Neolithic period. This population represents the oldest surviving insular population in the Mediterranean and is of high conservation importance [32,37]. Genetic analyses indicate that the Rhodian population has ancient origins, exhibits a distinct genetic identity due to long-term isolation, and maintains the genetic diversity of the original Anatolian population [32,37,38]. In the 1960s, individuals from Rhodes were successfully introduced to Lemnos Island [35], while, elsewhere in Greece, the species exist only in small groups maintained in zoos or private farms.
The fallow deer is classified as “Least Concern” by the IUCN [36], whereas, in Greece it is listed as “Endangered” in the national Red Book [39]. Historical estimates for the Rhodes population indicate approximately 1000 individuals at the beginning of the last century [40], declining to 300–400 individuals in the 1970s [31], 20–50 individuals in the 1980s [41], and 70–300 individuals by the late 1990s [42]. More recent surveys conducted in 2010–12 reported an index of 1.4 individuals/km [43]. Although these estimates provide valuable historical context, they should be interpreted cautiously due to differences in methodology and associated uncertainty. Reliable population data for fallow deer in Greece remain scarce, and no comprehensive and systematic monitoring has been implemented for the Rhodes population. In this context, the aims of this study were: (a) to estimate the density of fallow deer on Rhodes Island, and (b) to evaluate the most efficient method for monitoring the species. The results are expected to support the development of evidence-based management strategies to mitigate potential impacts on human activities, including agriculture, livestock farming, forestry, and traffic, while ensuring the long-term persistence of the population.
2. Materials and Methods
2.1. Study Area
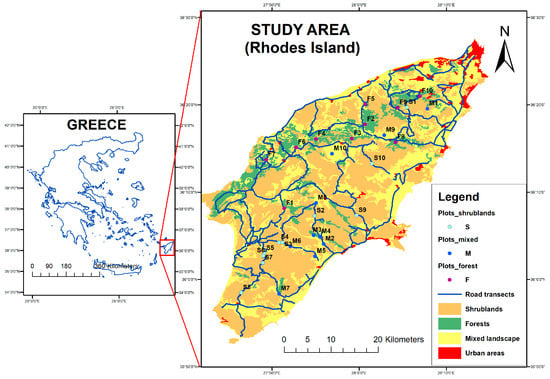
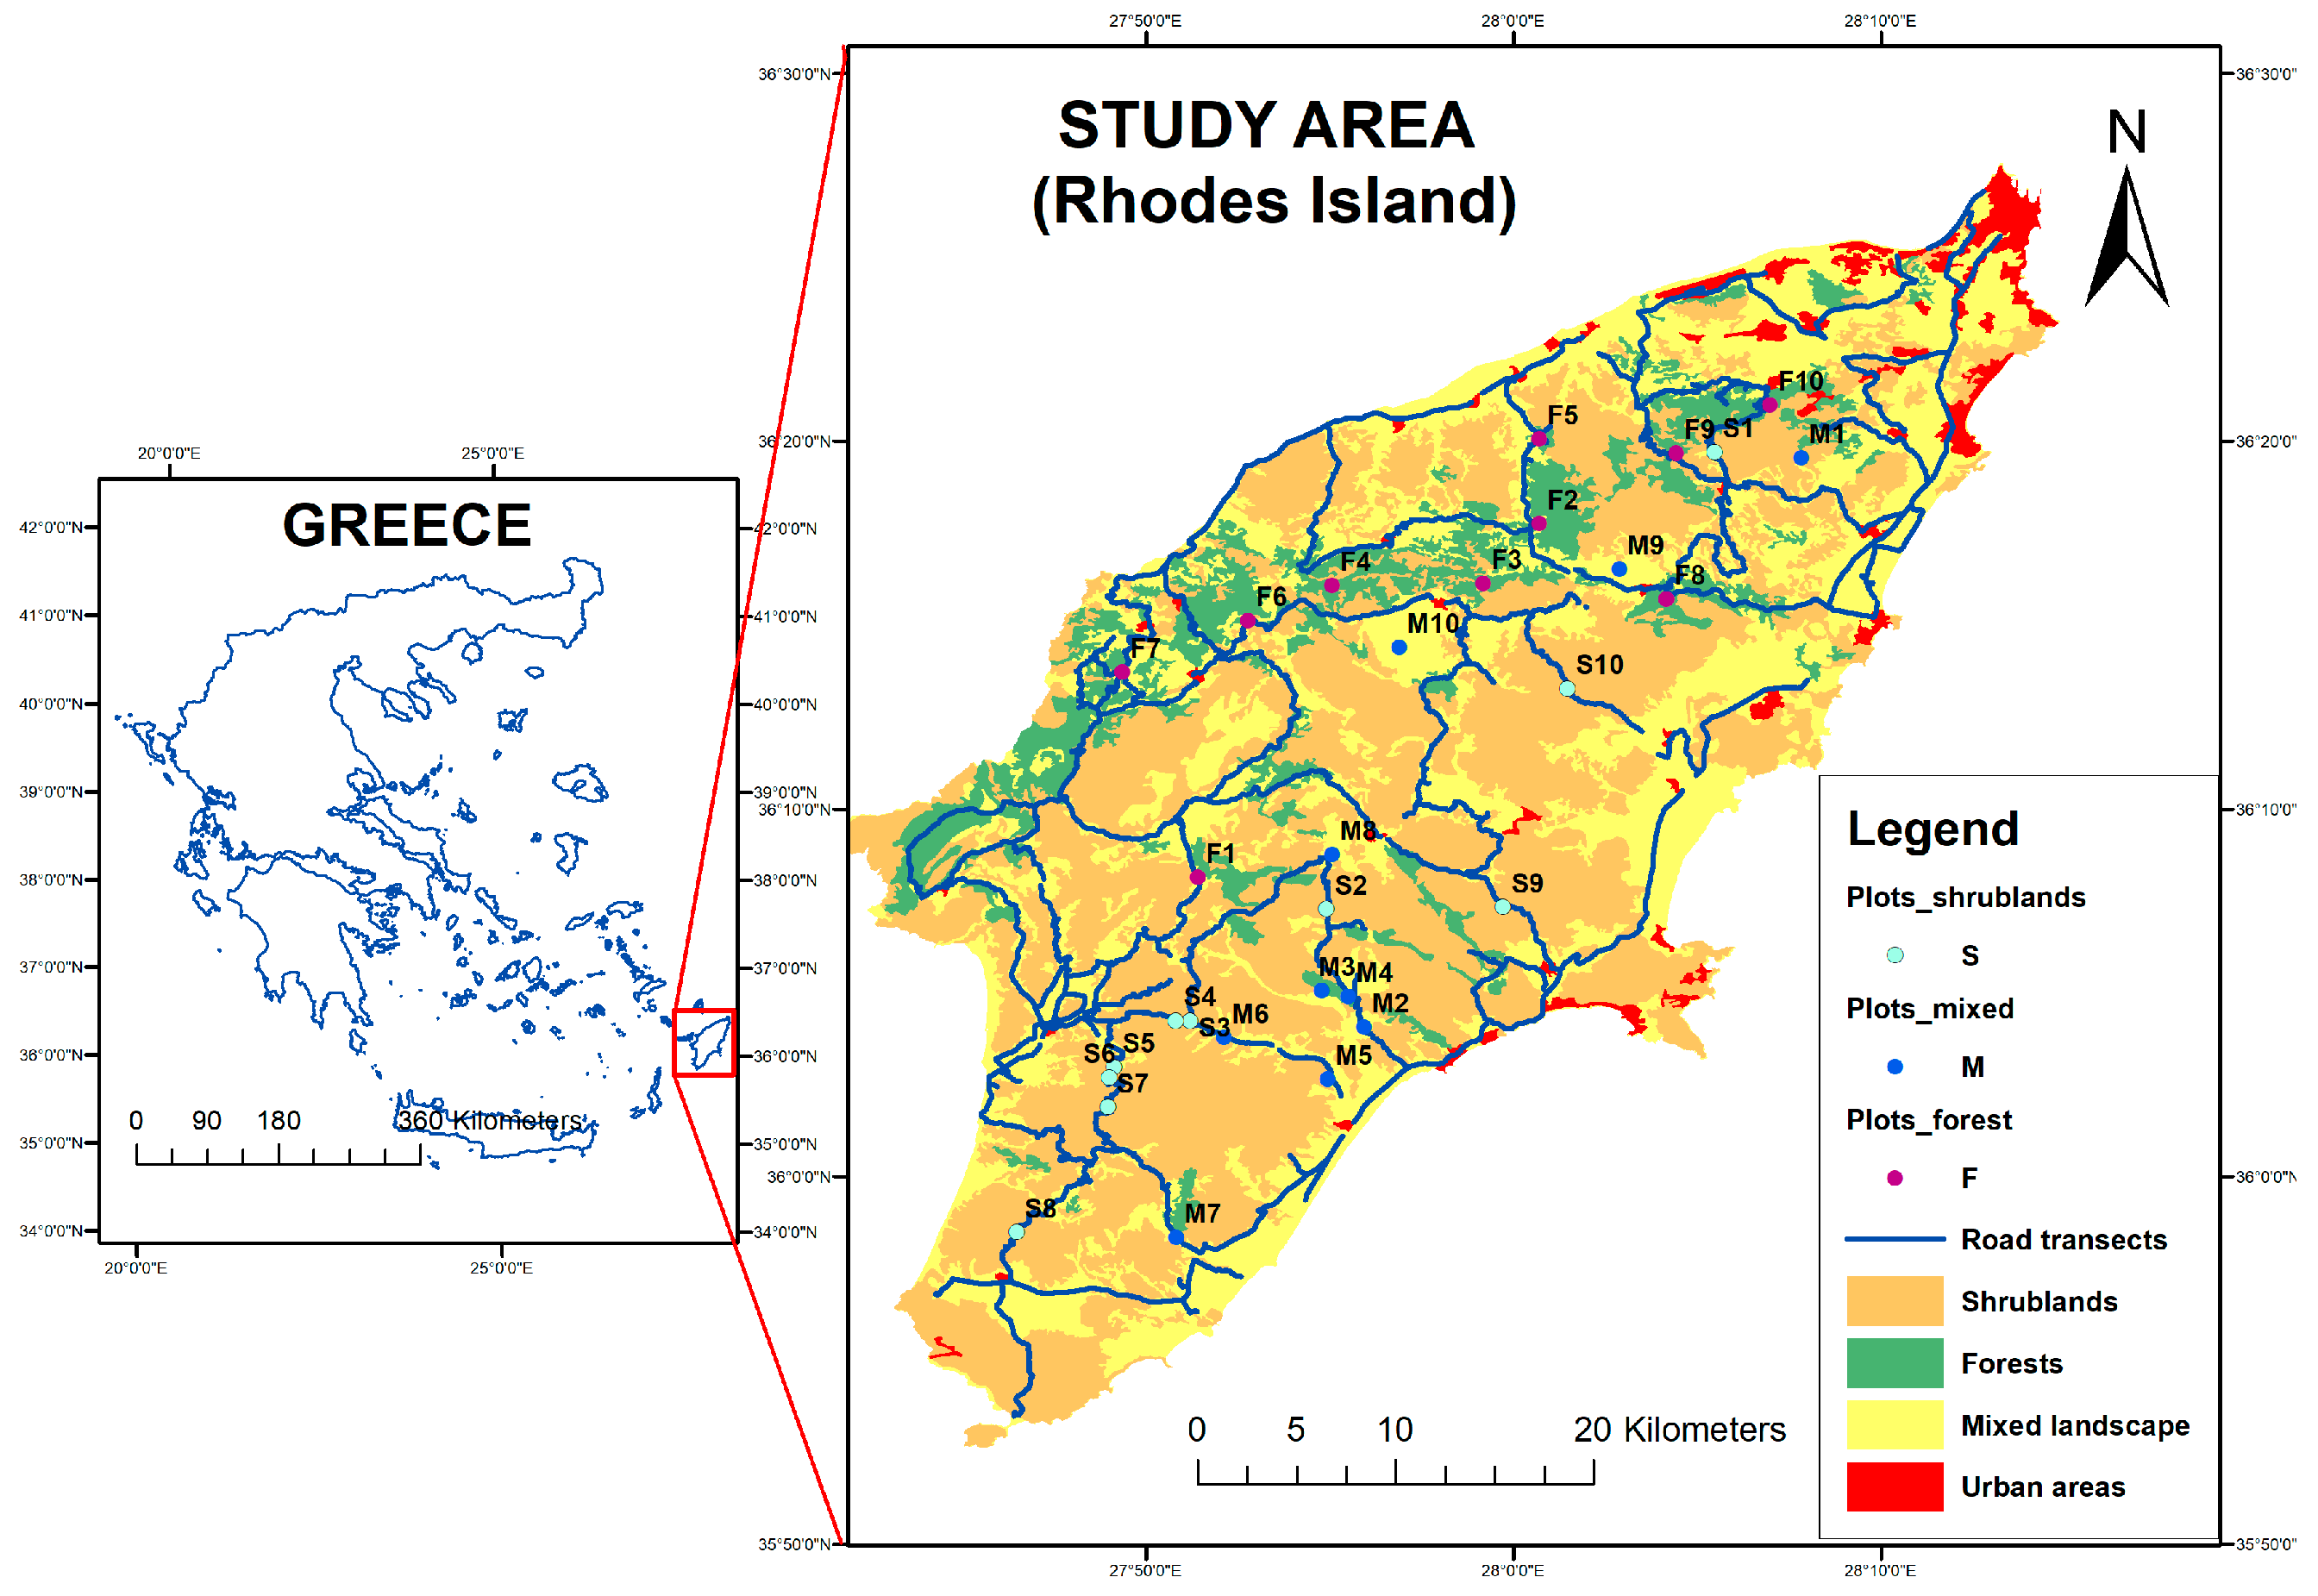
The study was conducted on the island of Rhodes (36°27′ N, 28°22′ E), located in the SE Aegean Sea, Greece, in the eastern Mediterranean (Figure 1). The climate is characterized as temperate Mediterranean, with mild, relatively humid winters and hot, dry summers. The mean annual temperature is 21.3 °C (range 12–31.2 °C), and the average annual precipitation is 634.2 mm [44]. The island covers an area of 1404 km2, with elevations ranging from sea level to 1215 m, and it supports a diverse range of Mediterranean habitats. It is mainly wooded and dominated by phrygana and evergreen sclerophyllous shrublands (50.8%). Typical shrub species are the Mastic tree (Pistacia lentiscus), the Strawberry tree (Arbutus unedo) and the Kermes oak (Quercus coccifera), while Phoenician juniper (Juniperus phoenicea) dominates coastal zones. Mixed habitats account for 35.28% of the island and consist of mosaic landscapes combining agricultural land with natural vegetation (shrublands, forests and grasslands). Olive is the main cultivation, while cereals, animal fodder, melons, watermelons, vineyards and citrus are produced on large areas. Pure Calabrian pine (Pinus brutia) and mixed Calabrian pine and Mediterranean cypress (Cupressus sempervirens) forests cover about 10.76%, while urban areas cover a small part (3.14%) of the island [45,46]. Rhodes is a popular tourist destination, attracting over 3 million visitors annually, with a prolonged tourist season extending from early April to early November. The island also has a dense and well-developed road network (1219 km), with consistently high traffic volumes, particularly during the tourist period.
Figure 1.
Map of Rhodes Island depicting the main habitat types and 30 sampling sites used to estimate the density of fallow deer in the study area. In each sampling site (S, M, F), four plots were established for FSC_1, FSC_2, FSC_3 and FAR methods. Blue lines indicate the routes surveyed during both daytime and nighttime counts. Coordinates devised according to the Geographic Coordinate System (GCS).
2.2. Field Data Collection
The fallow deer population density was estimated by applying direct (DDS and SDS) and indirect (FSC and FAR) methods, using stratified sampling [47], in the three main habitat types on the island of Rhodes: (a) mixed habitats, (b) shrublands and (c) coniferous forests. Fieldwork was carried out during the rutting season in October 2022, when males create harems and defend specific areas thus, individuals are more active and more easily detected using direct methods [48]. In addition, during this period vegetation is lower, allowing easier identification of dung on the ground [19,30], thereby facilitating the application of indirect methods. Additional fieldwork was carried out in January 2023. Within the study area, 10 representative sites were selected for each habitat type, yielding a total of 30 sites. At each site, four sampling plots were established corresponding to the FSC_1, FAR, FSC_2 and FSC_3 methods.
2.2.1. Daytime and Spotlight Distance Sampling
Visual (daytime and nocturnal) observations of individuals and herds were conducted along transects with a total length of 514 km distributed across the island’s road network (Figure 1). Of this total, 356 km was located in mixed habitats, 109 km in shrublands, and 49 km in forests. The same transects were surveyed during both daytime and spotlight sampling. Daytime surveys were carried out from early morning (07:00) until sunset (approximately 18:30), while spotlight surveys started after sunset (18:45) and lasted 3–4 h. Along each transect, a field team travelled by vehicle at a low speed of ≈15–20 km/h. Two observers simultaneously scanned both sides of the transect, recording individuals or herds and measuring the perpendicular distance from the transect line to each individual or to the centre of each group using a laser rangefinder (GeoDist 600 LR, GEO FENNEL, Baunatal, Germany) [49,50]. During spotlight surveys, each observer was also equipped with a 1300-lumen spotlight (Trigger Pro, NightSearcher, Portsmouth, UK) [14,16,20,50]. For each detection, group size was recorded and individuals were classified into adult males, yearling males, adult females, and juveniles (<1 year old). Geographic coordinates of all detections were recorded using handheld GPS device and tablets.
2.2.2. Faecal Standing Crop
FSC counts were conducted in 30 rectangular sample plots measuring 2 m × 50 m (100 m2) each, randomly distributed across the three main habitat types (10 plots per habitat: shrublands, mixed habitats, and forests). A total of 30 plots were surveyed in October 2022 (FSC_1) and an additional 30 in January 2023 (FSC_2) (Figure 1). Two observers carefully scanned each plot, recording the number of faecal pellet groups. A cluster of six or more pellets was defined as a single pellet group [14]. In addition, during January 2023, 30 square-shaped plots measuring 7 m × 7 m (49 m2; FSC_3) were established and surveyed in each habitat type. Population density (individuals/km2) for each habitat type was then calculated using the following equation:
Average faecal decay time was estimated separately for each habitat type. In July 2018, a total of 94 faecal pellet groups were collected on the same day and placed in mixed habitats (n = 19), shrublands (n = 38) and coniferous forests (n = 37). The persistence of each pellet group was monitored monthly until complete decomposition or until fewer than six pellets remained per group. For density estimation, a daily defecation rate of 26.5 pellet groups per individual was assumed [51].
2.2.3. Faecal Accumulation Rate
The FAR method was implemented in 30 fixed rectangular plots measuring 2 m × 50 m (100 m2) each, randomly distributed across the three main habitat types (10 plots per habitat: shrubland, mixed habitats, and forests). During the initial visit in October 2022, plot boundaries were established and all existing faecal pellet groups were removed. A second visit was conducted approximately three months later, in January 2023, during which all plots were surveyed, and all newly deposited faecal pellet groups were recorded [14,29]. Population density (individuals/km2) for each habitat type was then calculated using the following equation:
For both the FSC and FAR methods, the mean, standard deviation (SD), standard error (SE), coefficient of variation (% CV), and 95% confidence intervals (95% CI) were calculated for all estimators. Given the aggregated spatial distribution of the faecal pellet groups, SE was estimated assuming a negative binomial distribution. The 95% CI was calculated at a significance level of α = 0.05 using a t-value of 2.262 for small samples (<30 samples) [52]. Differences in mean faecal decay time among the three main habitat types were tested using one-way analysis of variance (ANOVA). Statistical analyses of t-test and one-way ANOVA were performed using the statistical package IBM-SPSS Statistics version 25.
2.3. Statistical Analyses
Conventional Distance Sampling was applied to estimate the fallow deer population density [21,22,53]. For each habitat type, a set of 14 candidate Detection Function Models (DFMs), incorporating different key functions and adjustment terms, was evaluated. Specifically, the following models were fitted: (i) a uniform key function with one and two cosine adjustment terms, and one and two simple polynomial adjustment terms; (ii) a half-normal key function with zero, one and two Hermite polynomial adjustments and one and two cosine adjustments; and (iii) a hazard-rate key function with zero, one and two cosine adjustment terms and one and two simple polynomial adjustment terms. Model selection was conducted in two stages. First, models were ranked using the Akaike Information Criterion (AIC). Based on ΔAIC values, the best-supported model (ΔAIC = 0) and competing models with substantial support (ΔAIC < 2) were retained. Second, goodness-of-fit was assessed using the χ2 test, and models showing adequate fit to the data (lower χ2 values and p > 0.05) were selected. When evidence of overdispersion was detected (c-hat > 1), model evaluation was based on the quasi-Akaike Information Criterion (QAIC) [54]. All statistical parameters, including mean density estimates, standard error (SE), standard deviation (SD), coefficient of variation (% CV), and 95% confidence intervals (95% CI), were derived using the Distance 7.5 release 1 software [55].
Evaluation of Indirect Methods
All indirect methods (FSC and FAR) were evaluated with the Relative Net Precision (RNP) index to assess the precision and accuracy of their estimates [56]. The methods were subsequently compared to identify the most efficient approach in terms of time, cost, personnel requirements, ease of implementation, and accuracy in estimating actual population size. A higher RNP value indicates greater efficiency relative to the other methods [30,56].
3. Results
3.1. Daytime and Spotlight Distance Sampling
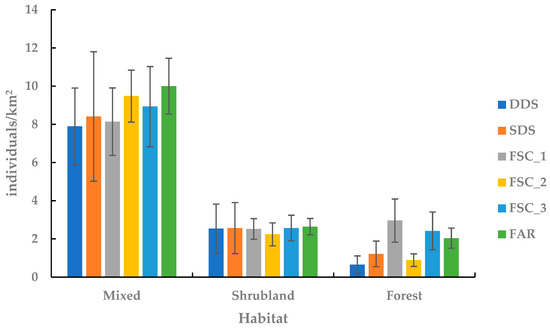
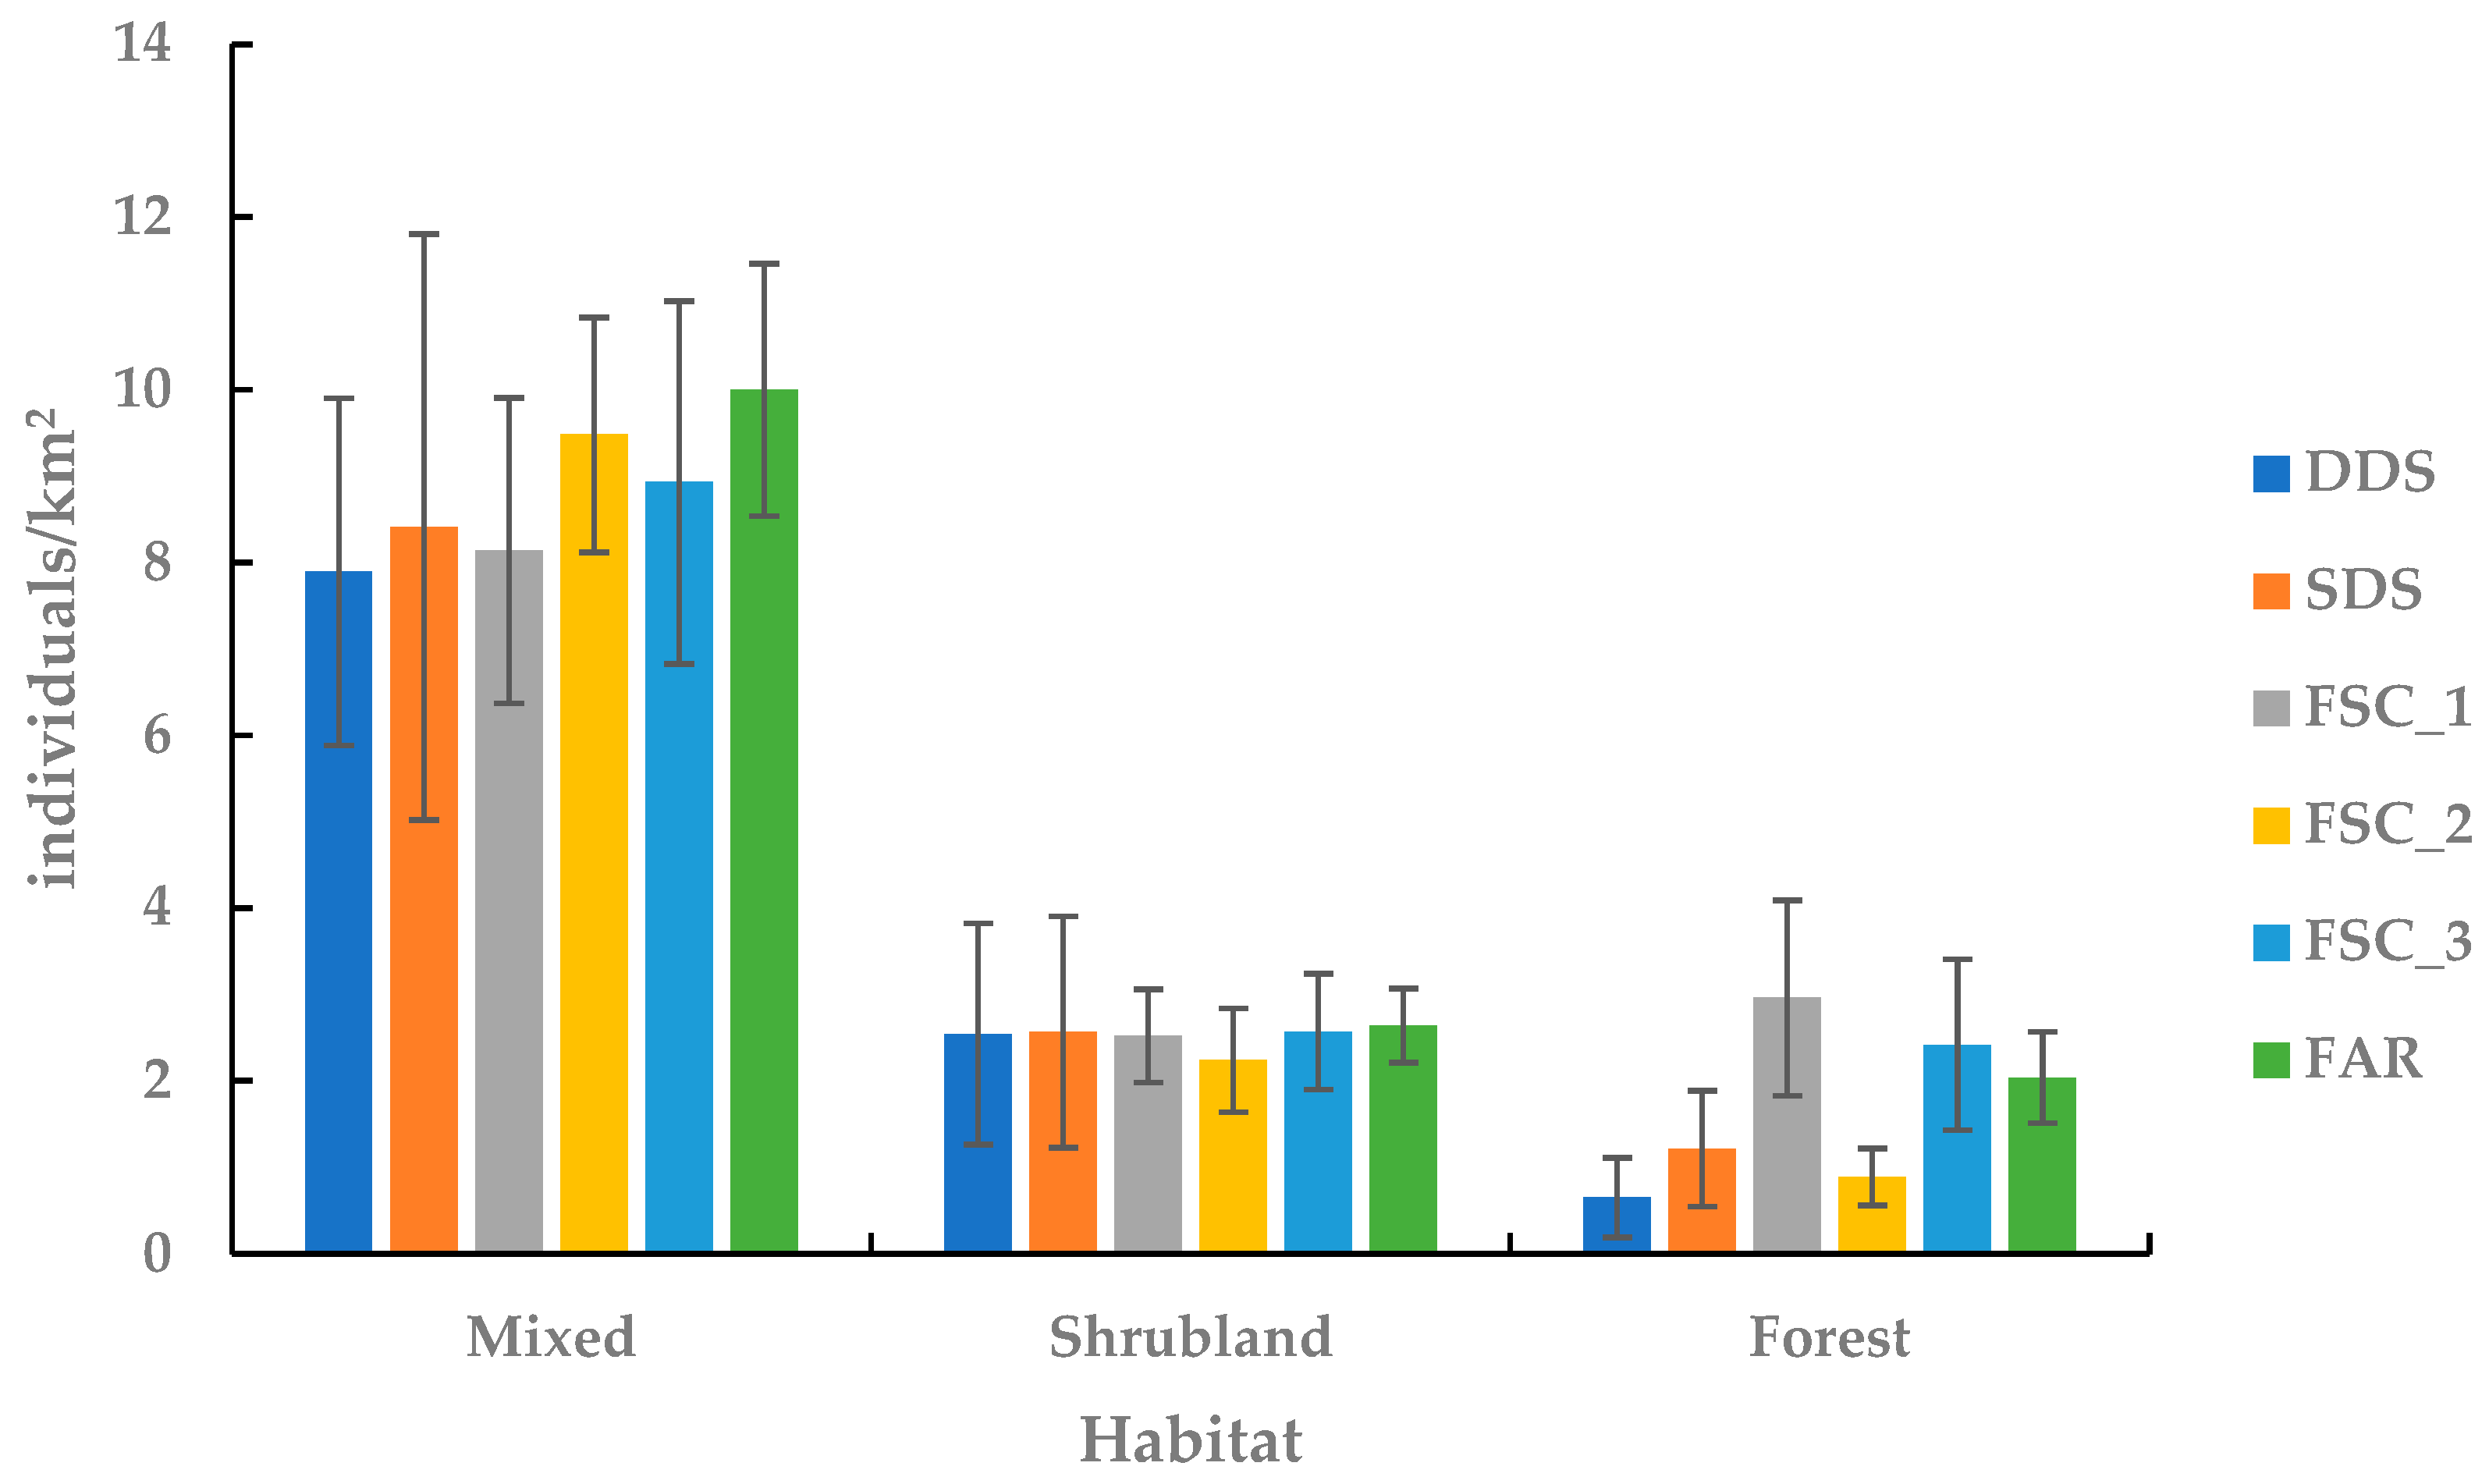
A total of 102 observations of individuals and herds were made during the DDS and 95 during the SDS. Both methods showed that the largest number of observations occurred in mixed habitats, followed by shrublands and forests (Table 1, Figure 2). During both DDS and SDS, the encounter rate (n/km where “n” is individuals or groups of animals seen) of fallow deer was relatively satisfactory and was found to be highest in mixed habitats (DDS: 0.24 n/km, SDS: 0.20 n/km), followed by shrublands (DDS: 0.14 n/km, SDS: 0.16 n/km) and forests (DDS: 0.06 n/km, SDS: 0.10 n/km).
Table 1.
Estimation of fallow deer (Dama dama) density using daytime and spotlight distance sampling in the three representative habitat types using Distance 7.5 software, on the island of Rhodes, in October 2022. D ± SE: density ± standard error, % CV: coefficient of variation of density, encounter rate: n/km where “n” is individuals or groups of animals seen. In parentheses, we give the 95% confidence intervals.
Figure 2.
Fallow deer density (±standard error) (individuals/km2) in the three representative habitat types on the island of Rhodes. Direct methods used were daytime (DDS) and spotlight distance sampling (SDS) in October 2022. Indirect methods were Faecal Standing Crop (FSC) with rectangular sample plots (2 m × 50 m) in October 2022 (FSC 1) and January 2023 (FSC 2), and square sample plots (7 m × 7 m) in January 2023 (FSC 3); and Faecal Accumulation Rate (FAR).
According to the best-performing DFM in each habitat, the density of fallow deer was higher in mixed habitats (DDS: 7.85 ± 2.01 ind./km2 (Table S1), SDS: 8.41 ± 3.39 ind./km2 (Table S4)), followed by shrublands (DDS: 2.54 ± 1.28 ind./km2 (Table S2), SDS: 2.57 ± 1.34 ind./km2 (Table S5)) and forests (DDS: 0.65 ± 0.46 ind./km2 (Table S3), SDS: 1.21 ± 0.67 ind./km2 (Table S6)) in both sampling methods (Table 1).
3.2. Faecal Standing Crop
The total average decay time of the faeces was calculated at 272.1 ± 11.7 days and showed no differences between the three habitat types (mixed habitat: 310.6 ± 24.4 days, shrubland: 269.8 ± 17 days and forest: 254.6 ± 20.1 days; F2,91 = 1.577, p = 0.212). For the density estimation, the faecal decay time specific to each habitat type was used.
The highest fallow deer densities were consistently observed in mixed habitats across all survey periods and plot sizes (Table 2, Figure 2). Forests showed higher densities than shrublands in October 2022 (FSC_1), whereas the opposite pattern was observed in January 2023 (FSC_2 and FSC_3).
Table 2.
Estimation of fallow deer (Dama dama) density using the Faecal Standing Crop (FSC) and Faecal Accumulation Rate (FAR) methods in the three representative habitat types using rectangular (2 m × 50 m) and square sample plots (7 m × 7 m) on the island of Rhodes, in October 2022 and January 2023. D ± SE: density ± standard error (individuals/km2). In parentheses, we give the 95% confidence intervals. RNP: the Relative Net Precision index of each method.
3.3. Faecal Accumulation Rate
The mean time between visits to the survey plots was 94.6 days in mixed habitats, 92.6 days in shrublands and 91.4 days in forests. FAR showed the highest fallow deer density in mixed habitats, followed by shrublands and forests (Table 2).
3.4. Evaluation of Indirect Methods
The total average time to approach, establish and survey the plots in FSC_1 was 11.10 (±3.77 SD) min per h, while, for the FSC_2, it was 10.23 (±3.89 SD) min per h and, for the FSC_3, it was 11.00 (±2.1 SD) min per h. For the FAR method the total mean time for approach, installation, cleaning and control of the plots in the two sampling periods was 25.73 (±1.9 SD) min. The RNP index was higher for FSC_1 and FSC_2. On the other hand, FAR showed the lowest index (Table 2).
4. Discussion
4.1. Overview of Fallow Deer Population Density on Rhodes Island and Other Countries
The application of both direct and indirect approaches provided consistent estimates of fallow deer population density across the three habitat types on Rhodes Island. All methods yielded broadly similar estimates among the different habitat types. The two direct distance sampling methods appear to generate analogous results. Both DDS and SDS methods indicated that the highest densities occurred in mixed habitats (7.85 and 8.41 ind./km2, respectively), which are characterized by a mosaic of cultivated fields, olive groves, and natural vegetation. Lower densities were recorded in shrublands (2.54 ind./km2 in DDS and 2.57 ind./km2 in SDS), while the lowest densities were observed in forest habitats, (0.65 ind./km2 and 1.21 ind./km2 for DDS and SDS, respectively). It should be noted, however, that several of these estimates were associated with relatively wide 95% confidence intervals (relative half-width > 30%), indicating low precision and requiring cautious interpretation, likely reflecting variability in encounter rates and habitat heterogeneity across sampling areas [21]. In contrast, indirect methods showed greater variability in density estimates across habitats. The FSC method applied in January (FSC 2) yielded lower estimates in forests (0.89 ind./km2) and shrublands (2.24 ind./km2) compared to the other approaches, while producing higher estimates in mixed habitats (9.48 ind./km2). Across the different variants of the FSC method, mean density in mixed habitats ranged between 8.14 and 9.48 ind./km2, slightly lower than the estimate derived from the FAR method (10 ind./km2). A similar pattern was observed in shrublands, where FSC estimates (2.24–2.57 ind./km2) were marginally lower than those derived from FAR (2.64 ind./km2). In forest habitats, however, both indirect approaches produced broadly comparable estimates, ranging from 0.89 to 2.96 ind./km2.
Several studies have estimated fallow deer density across different habitat types in Europe and Australia. The mean density estimated in the mixed habitats on the island of Rhodes in October 2022 (8.41 individuals/km2 using SDS and 8.14 individuals/km2 using FSC_1) is considerably lower than densities reported from areas characterized by a mosaic of “open” habitats and natural ecosystems in Italy (22 ind./km2) [57]. Similarly, lower values were recorded compared to Scandinavian countries, including mixed agricultural land, pastures, and forest in Sweden (17.7 ind./km2 in 2008 and 19.9 ind./km2 in 2009) [58], mixed agricultural land and coniferous forest in Norway in 2013–2014 (15 ind./km2) [59], and a mixed grassland–forest landscape on a Baltic Sea island (27 ind./km2) [60]. Likewise, the mean density estimated in shrublands on Rhodes in October 2022 (2.57 ind./km2 using SDS and 2.52 ind./km2 using FSC_1) is lower than densities reported in Mediterranean maqui habitats in Italy from 2000 to 2001 (2.9–53.8 ind./km2) [61] and from 1995 to 1997 (7 ind./km2) [57]. In contrast, the mean density estimated in forest habitats on Rhodes (1.21 ind./km2 using SDS and 2.96 ind./km2 using FSC_1) is comparable to densities reported in Australian forests (0.29 and 2.09 ind./km2) [17], but it is substantially lower than densities estimated in forests of southwestern Asia Minor (20.1 ind./km2) [62].
4.2. Evaluation of Direct and Indirect Methods
The time required to survey, the personnel and equipment involved, the operation of specialized software, and the overall precision and accuracy of each method represent key parameters in selecting the most appropriate and efficient approach for long-term monitoring of population trends [13]. Distance sampling methods are considered among the most reliable techniques for estimating density and abundance of wildlife species [63]. However, their implementation is time consuming and requires specialized scientific expertise for analysis. Distance sampling, often conducted with thermal or spotlight detection at night, has been shown to produce precise estimates in Mediterranean fallow deer populations when assumptions are met [25]. Distance sampling requires five assumptions to be met in order to acquire reliable, precise and robust density estimations: (1) clusters on the line are detected with certainty, (2) clusters are detected at their initial location, (3) measurements are exact, (4) each cluster detection is independent, and (5) transects are randomly allocated [21,55]. Our survey design was carefully implemented in order to meet these assumptions. Roads were monitored by the survey crew, including the driver, to ensure the detection of every individual deer (assumption 1). Fallow deer behaviour was not affected by the presence of vehicles on roads (assumption 2). Although these assumptions were carefully considered, the use of roads as transects may not fully represent random placement and could potentially influence detectability through subtle behavioural responses of the animals [20,64,65]. On the other hand, road networks enable rapid surveying of long transects, increasing the likelihood of collecting an adequate number of detections while maintaining data reliability and minimizing bias [20,66,67,68]. Limiting surveys to roads that are routinely exposed to human presence may also help satisfy the distance sampling assumption that deer are observed at their initial locations, as animals in these areas are less likely to respond to observers [20,66]. During the rut period, fallow deer aggregate in mixed habitats near roadsides on the island of Rhodes. These edge habitats provide the deer with sufficient food supplies, water and cover. Moreover, the lack of predators and hunting on the island has made the species familiar with human environments and presence, so it shows no particular avoidance of traffic. The equipment used ensures the accuracy of the measurements (assumption 3). Moreover, the risk of double counting was minimized by accounting for previously observed deer locations and their potential movement trajectories while surveying along transects (assumption 4). Finally, transects were placed on 42% of the road network in order to adequately cover all landscapes across the island (assumption 5).
Despite these advantages, an important limitation of distance sampling is the requirement for a sufficient number of detections—typically, more than 60–80 observations—to reliably estimate density [16,69]. According to both methods, sufficient detections were made only in mixed habitats, possibly due to the high aggregation of deer in these habitats during the rut season and higher detectability due to vegetation. Our results showed that, during the DDS, the CVs indicated a relatively high accuracy of estimating the species density in mixed habitats (25.6%), and low accuracy in shrublands (50.62%) and forests (71.46%). On the contrary, in SDS the CV was calculated at 40.37% in mixed habitats, 52.47% in shrublands and 55.02% in forests, indicating low accuracy in the three habitats. In habitats where few individuals are detected (e.g., closed habitats such as coniferous forests or dense shrublands), this approach may underestimate density. Therefore, density estimates derived under such conditions should be interpreted with caution. Although differences in density estimation between the two direct methods were small, SDS may be considered more precise due to the number of observations and encounter rate with fallow deer across all three habitat types. Additionally, deer are more active during the night and the presence of a reflecting tapetum lucidum increases the probability of detecting individuals during nocturnal spotlight counts, especially in closed habitats [16].
From a different perspective, Mayle et al. [14] suggested that indirect methods based on dung counts are particularly effective in relatively closed habitats where the detection probability is low, and that they can be successfully applied proportionally to the existing density of the species in the study area. Specifically, Mayle et al. [14] recommend the application of FSC using rectangular transects in areas with low fallow deer densities, FSC using square plots (7 m × 7 m) in areas with medium densities, and FAR methods using square plots (7 m × 7 m or 10 m × 10 m) in areas with high densities. Our results showed that, among the four variants of the indirect density estimation methods, the FSC method using rectangular sampling plots (FSC_1 and FSC_2), applied in both October and January, proved to be the most efficient (RNP = 8.37), whereas the FAR method was the least efficient (RNP = 4.60). Similar conclusions were reported by Campbell et al. [29] and Smart et al. [15]. It is interesting to note that fallow deer densities observed in forests during October were higher than those observed in January using the FSC method. October coincides with the rut, while, during January, female fallow deer are pregnant. In contrast to our results, in other parts of the species distribution, fallow deer tend to spend their winter period in forested habitats in order to seek cover and forage [32,33]. During winter in Rhodes, individuals may shift from forested areas to mixed habitats to take advantage of more abundant food resources. Conversely, during the rutting period, younger males may establish territories within forests to avoid competition with dominant adult bucks in the more favourable breeding areas of mixed habitats. This behaviour can lead to higher population densities in forests. Choosing between FSC and FAR therefore entails a trade-off between logistical feasibility, precision, and susceptibility to parameter uncertainty, and it should be guided by the specific research goals, environmental context, and available resources [29]. Furthermore, Smart et al. [15] recommend combining the FSC method with nighttime surveys using thermal cameras and distance sampling analysis as the most reliable approach for estimating fallow deer population density.
4.3. Methodological Considerations When Monitoring Rhodian Fallow Deer
The collection of sufficiently robust and accurate population data across relatively large areas, with comparatively low effort, constitutes the cornerstone of an effective long-term monitoring system for assessing population trends of wildlife species [70]. The application of both direct and indirect methods to estimate the density of fallow deer on the island of Rhodes during autumn 2022 indicated that the highest densities were recorded in the mixed habitats (7.8–8.4 ind./km2), followed by lower densities in shrublands (approximately 2.5 ind./km2) and forest habitats (0.6–2.9 ind./km2). The autumn data collection period is considered the most appropriate, as males establish breeding territories during this season and the population is more spatially aggregated compared to other times of the year. Direct methods, particularly spotlight counts, provide more reliable estimates of density and population structure [63]. However, they are more demanding in terms of field effort, personnel, equipment, and the use of specialized software. Special caution is required when interpreting results derived from small sample sizes or when methods are applied to species occurring at low densities or in “closed” habitat types, such as coniferous forests and dense shrublands. Among the indirect methods, the FSC approach applied using rectangular strip transects produced density estimates per habitat type that were closest to those obtained from direct methods, particularly when surveys were conducted in mid-autumn (October). Although the FSC method requires knowledge of dung decay rates in the specific study environment, it is easier to implement, less time-consuming, and more efficient than the FAR method. Both indirect methods require accurate knowledge of the species’ daily defecation rate under local environmental conditions, as well as reliable field identification of dung pellets, especially in areas where wild and domestic species coexist, such as fallow deer, sheep and goats on the island of Rhodes. A major limitation of indirect methods is the lack of information on population structure, including harem size, sex ratio, and age classes.
The total implementation cost including personnel, vehicle rental, accommodation, and equipment, was estimated at EUR 2900 for DDS and EUR 3500 for SDS. In contrast, the indirect methods were considerably less costly, with estimated expenses of approximately EUR 1320 for FSC_1 and FSC_2, EUR 1760 for FSC_3, and EUR 2640 for FAR. These differences highlight the potential cost-efficiency advantages of indirect approaches, particularly under budget constraints; however, such savings should be evaluated in relation to their relative precision and detection performance when selecting appropriate methods for long-term monitoring.
4.4. Management Implications
Our results provide valuable insights for the conservation and management of the fallow deer population on Rhodes Island. Management strategies should prioritize the protection and conservation of habitat mosaics, particularly areas that combine open and wooded habitats. These areas support the highest densities, as they provide optimal breeding grounds and foraging and shelter resources for sustaining a viable population. Population monitoring should employ a combination of FSC surveys for cost-effective assessment, complemented by SDS to capture population structure and improve precision. Surveys are best conducted in autumn when deer aggregate during the breeding season, maximizing detection rates. FSC methods are particularly suitable for low-density or closed habitats, such as dense shrublands and coniferous forests, but they require accurate dung identification, especially in areas with sympatric domestic species, and knowledge of species-specific defecation rates. Monitoring programs should establish baseline data across multiple sampling units per habitat type and repeat surveys to detect temporal changes, enabling adaptive management. This adaptive approach can inform targeted interventions, including habitat restoration, population control and protection from illegal hunting, to prevent under- or overpopulation and mitigate impacts on vegetation and ecosystem integrity. Following the IUCN–CMP Classification of Direct Threats to Ecosystems and Species [71] the main threats the species faces are transportation, service, and security corridors (4.1–“Roads, trails and railroads” and 4.5–“Fencing and walls”), biological resource use (5.1–“Hunting, collecting and controlling terrestrial animals”), natural system management and modifications (7.1–“Fire and fire management”), invasive/other problematic species, genes and pathogens (8.3–“Introduced genetic material”), and climate change (11.3–“Changes in precipitation and hydrological regimes”). In contrast to other deer populations around the Mediterranean, such as the Italian roe deer (Capreolus capreolus italicus), which historically suffered dramatic population declines [72], the Rhodian fallow deer showed no evidence of extinction [35,37,42]. Illegal hunting has historically been regarded as one of the main threats to the species on the island of Rhodes [35,37,43]. Currently, the occurrence of poaching in relation to agricultural damage remains unverified. However, no direct evaluation has been made, especially considering that, in 2023, a total of 51,997 caprine, mainly goats, [73] were grazing unattended on the island [43]. Furthermore, no compensation from national authorities is currently available for potential damage caused by the species to agriculture. Some fallow deer are caught in fences used to protect crops, and others may be involved in vehicle collisions. In recent decades, and particularly under the influence of climate change, additional threats such as wildfires, land-use changes, and limited water resources have emerged. Genetic isolation, together with the potential risk of breeding with non-native fallow deer introduced from other countries, may also represent a conservation concern [39]. Finally, integrating both direct and indirect methods allows managers to balance efficiency, accuracy, and resource requirements, ensuring the long-term conservation and sustainable management of the species.
5. Conclusions
In conclusion, this study demonstrated that the fallow deer population on Rhodes Island is unevenly distributed across habitats, with the highest densities observed in mixed habitats and lower densities in shrublands and forests, reflecting pronounced spatial heterogeneity. Among the methods applied, SDS provided the most reliable density estimates, although it required substantial field effort. In contrast, the FSC method yielded comparable density estimates with significantly lower logistical demands, particularly when applied in autumn (October), which appears to be the optimal sampling period due to increased deer aggregation. Increasing the number of sampling units per habitat (approximately 20–30) would further reduce the sampling error and improve the precision of estimates, as well as the detection of temporal trends. Based on these findings, FSC is recommended as the core method for long-term monitoring of fallow deer on Rhodes Island, complemented by SDS when detailed information on population structure is required.
Supplementary Materials
The following supporting information can be downloaded at: https://www.mdpi.com/article/10.3390/land15050762/s1, Table S1: Population density models for fallow deer (Dama dama) estimated from visual records of perpendicular distances of individuals or groups along daytime transects in mixed habitats, analysed using Distance 7.5 software, Rhodes Island, Greece, October 2022. %CV: coefficient of variation; KS p-value: significance level of the Kolmogorov–Smirnov test; c-hat: overdispersion parameter. Values in parentheses indicate the 95% confidence interval (CI) of the estimator. Models highlighted in green denote the best-supported model (ΔAIC = 0) and strongly supported models (ΔAIC < 2); Table S2: Population density models for fallow deer (Dama dama) estimated from visual records of perpendicular distances of individuals or groups along daytime transects in shrublands, analysed using Distance 7.5 software, Rhodes Island, Greece, October 2022. %CV: coefficient of variation; KS p-value: significance level of the Kolmogorov–Smirnov test; c-hat: overdispersion parameter. Values in parentheses indicate the 95% confidence interval (CI) of the estimator. Models highlighted in green denote the best-supported model (ΔAIC = 0) and strongly supported models (ΔAIC < 2); Table S3: Population density models for fallow deer (Dama dama) estimated from visual records of perpendicular distances of individuals or groups along daytime transects in forests, analysed using Distance 7.5 software, Rhodes Island, Greece, October 2022. %CV: coefficient of variation; KS p-value: significance level of the Kolmogorov–Smirnov test; c-hat: overdispersion parameter. Values in parentheses indicate the 95% confidence interval (CI) of the estimator. Models highlighted in green denote the best-supported model (ΔAIC = 0) and strongly supported models (ΔAIC < 2); Table S4: Population density models for fallow deer (Dama dama) estimated from nighttime spotlight surveys of perpendicular distances of individuals or groups along transects in mixed habitats, analysed using Distance 7.5 software, Rhodes Island, Greece, October 2022. %CV: coefficient of variation; KS p-value: significance level of the Kolmogorov–Smirnov test; c-hat: overdispersion parameter. Values in parentheses indicate the 95% confidence interval (CI) of the estimator. Models highlighted in green denote the best-supported model (ΔAIC = 0) and strongly supported models (ΔAIC < 2); Table S5: Population density models for fallow deer (Dama dama) estimated from nighttime spotlight surveys of perpendicular distances of individuals or groups along transects in shrublands, analysed using Distance 7.5 software, Rhodes Island, Greece, October 2022. %CV: coefficient of variation; KS p-value: significance level of the Kolmogorov–Smirnov test; c-hat: overdispersion parameter. Values in parentheses indicate the 95% confidence interval (CI) of the estimator. Models highlighted in green denote the best-supported model (ΔAIC = 0) and strongly supported models (ΔAIC < 2); Table S6: Population density models for fallow deer (Dama dama) estimated from nighttime spotlight surveys of perpendicular distances of individuals or groups along transects in forests, analysed using Distance 7.5 software, Rhodes Island, Greece, October 2022. %CV: coefficient of variation; KS p-value: significance level of the Kolmogorov–Smirnov test; c-hat: overdispersion parameter. Values in parentheses indicate the 95% confidence interval (CI) of the estimator. Models highlighted in green denote the best-supported model (ΔAIC = 0) and strongly supported models (ΔAIC < 2).
Author Contributions
Conceptualization, D.E.B., E.G.K. and K.S.P.; methodology, D.E.B., E.G.K., K.S.P. and G.P.; software, D.E.B., E.G.K., K.S.P. and G.P.; validation, D.E.B., E.G.K. and K.S.P.; formal analysis, D.E.B., E.G.K., K.S.P. and G.P.; investigation, D.E.B., E.G.K., K.S.P. and G.P.; data curation, D.E.B., E.G.K. and K.S.P.; writing—original draft preparation, D.E.B., E.G.K. and K.S.P.; writing—review and editing, D.E.B., E.G.K., K.S.P. and G.P.; visualization, D.E.B., E.G.K. and K.S.P.; supervision, D.E.B.; project administration, D.E.B.; funding acquisition, D.E.B. All authors have read and agreed to the published version of the manuscript.
Funding
This research was funded by the Natural Environment & Climate Change Agency, Hellenic Ministry of Environment and Energy, contract number 22AWRD010833567 29 June 2022.
Data Availability Statement
The data presented in this study are available on request from the corresponding author (D.E.B.); the data are not publicly available due to privacy restrictions.
Acknowledgments
We would like to thank Nikolaos Theodoridis for the valuable information provided throughout the implementation of the project, as well as the forest rangers Stamatis Hourdakis, Stamatis Mastrosavakis and Georgios Vrontou of the Directorate for Forests of the Prefecture of Dodecanese for their contribution. Moreover, we would like to thank Manolis Sarris for his assistance during field data collection. We also thank Elisavet Dimou for her linguistic assistance with the final draft of this manuscript. We greatly appreciate the four anonymous reviewers and the editor for their helpful and constructive suggestions.
Conflicts of Interest
The authors declare no conflicts of interest. The funders had no role in the design of the study; in the collection, analyses, or interpretation of data; in the writing of the manuscript; or in the decision to publish the results.
Abbreviations
The following abbreviations are used in this manuscript:
| DDS | Daytime Distance Sampling |
| SDS | Spotlight Distance Sampling |
| FSC | Faecal Standing Crop |
| FAR | Faecal Accumulation Rate |
| RNP | Relative Net Precision |
| ind. | individuals |
| DFM | Detection Function Models |
| CV | coefficient of variation |
| AIC | Akaike Information Criterion |
| CI | confidence interval |
| KS | Kolmogorov–Smirnov |
| SE | standard error |
References
- Lacher, T.E.; Davidson, A.D.; Fleming, T.H.; Gómez-Ruiz, E.P.; McCracken, G.F.; Owen-Smith, N.; Peres, C.A.; Vander Wall, S.B. The Functional Roles of Mammals in Ecosystems. J. Mammal. 2019, 100, 942–964. [Google Scholar] [CrossRef] [Scilit]
- Ramirez, J.I.; Jansen, P.A.; den Ouden, J.; Moktan, L.; Herdoiza, N.; Poorter, L. Above- and Below-Ground Cascading Effects of Wild Ungulates in Temperate Forests. Ecosystems 2021, 24, 153–167. [Google Scholar] [CrossRef] [Scilit]
- Segar, J.; Pereira, H.M.; Baeten, L.; Bernhardt-Römermann, M.; De Frenne, P.; Fernández, N.; Gilliam, F.S.; Lenoir, J.; Ortmann-Ajkai, A.; Verheyen, K.; et al. Divergent Roles of Herbivory in Eutrophying Forests. Nat. Commun. 2022, 13, 7837. [Google Scholar] [CrossRef] [Scilit] [PubMed]
- Garcia, F.; Alves da Silva, A.; Freitas, H.; Sousa, J.P.; Alves, J. The Essential, but Complex, Role of Red Deer as an Ecosystem Service Provider: A Comprehensive Review across Europe. Eur. J. Wildl. Res. 2025, 71, 46. [Google Scholar] [CrossRef] [Scilit]
- Côté, S.D.; Rooney, T.P.; Tremblay, J.-P.; Dussault, C.; Waller, D.M. Ecological Impacts of Deer Overabundance. Annu. Rev. Ecol. Evol. Syst. 2004, 35, 113–147. [Google Scholar] [CrossRef] [Scilit]
- Apollonio, M.; Andersen, R.; Putnam, R. European Ungulates and Their Management in the 21st Century; Cambridge University Press: London, UK, 2010. [Google Scholar]
- Putman, R.; Langbein, J.; Green, P.; Watson, P. Identifying Threshold Densities for Wild Deer in the UK above Which Negative Impacts May Occur. Mamm. Rev. 2011, 41, 175–196. [Google Scholar] [CrossRef] [Scilit]
- Linnell, J.D.C.; Cretois, B.; Nilsen, E.B.; Rolandsen, C.M.; Solberg, E.J.; Veiberg, V.; Kaczensky, P.; Van Moorter, B.; Panzacchi, M.; Rauset, G.R.; et al. The Challenges and Opportunities of Coexisting with Wild Ungulates in the Human-Dominated Landscapes of Europe’s Anthropocene. Biol. Conserv. 2020, 244, 108500. [Google Scholar] [CrossRef] [Scilit]
- Bakaloudis, D.E.; Bontzorlos, V.A.; Kotsonas, E. Wildlife Mortality on Roads Crossing a Protected Area: The Case of Dadia-Lefkimi-Soufli National Park in North-Eastern Greece. J. Nat. Conserv. 2023, 74, 126443. [Google Scholar] [CrossRef] [Scilit]
- van Beeck Calkoen, S.T.S.; Mühlbauer, L.; Andrén, H.; Apollonio, M.; Balčiauskas, L.; Belotti, E.; Carranza, J.; Cottam, J.; Filli, F.; Gatiso, T.T.; et al. Ungulate Management in European National Parks: Why a More Integrated European Policy Is Needed. J. Environ. Manag. 2020, 260, 110068. [Google Scholar] [CrossRef] [Scilit]
- Bakaloudis, D.E.; Thoma, C.T.; Makridou, K.N.; Kotsonas, E.G.; Arsenos, G.; Theodoridis, A.; Kontsiotis, V. Home Range and Habitat Selection of Feral Horses (Equus ferus f. caballus) in a Mountainous Environment: A Case Study from Northern Greece. Land 2024, 13, 1165. [Google Scholar] [CrossRef] [Scilit]
- Williams, B.K.; Nichols, J.D.; Conroy, M.J. Analysis and Management of Animal Populations; Academic Press: San Diego, CA, USA, 2002. [Google Scholar]
- Morellet, N.; Klein, F.; Solberg, E.; Andersen, R. The Census and Management of Populations of Ungulates in Europe. In Ungulate Management in Europe: Problems and Practices; Putman, R., Apollonio, M., Andersen, R., Eds.; Cambridge University Press: Cambridge, UK, 2011; pp. 106–143. [Google Scholar]
- Mayle, B.A.; Peace, A.J.; Gill, R.M.A. How Many Deer? A Field Guide to Estimating Deer Population Size; Forestry Commission: Edinburgh, UK, 1999. [Google Scholar]
- Smart, J.C.R.; Ward, A.I.; White, P.C.L. Monitoring Woodland Deer Populations in the UK: An Imprecise Science. Mamm. Rev. 2004, 34, 99–114. [Google Scholar] [CrossRef] [Scilit]
- Enetwild Consortium; Acevedo, P.; Apollonio, M.; Bevilacqua, C.; Blanco-Aguiar, J.A.; Brivio, F.; Casaer, J.; Ferroglio, E.; Grignolio, S.; Jansen, P.; et al. A Practical Guidance on Estimation of European Wild Ungulate Population Density; Enetwild Consortium: Ciudad Real, Spain; IREC: Ciudad Real, Spain, 2022. [Google Scholar]
- Bengsen, A.J.; Forsyth, D.M.; Ramsey, D.S.L.; Amos, M.; Brennan, M.; Pople, A.R.; Comte, S.; Crittle, T. Estimating Deer Density and Abundance Using Spatial Mark–Resight Models with Camera Trap Data. J. Mammal. 2022, 103, 711–722. [Google Scholar] [CrossRef] [Scilit]
- Focardi, S.; Isotti, R.; Tinelli, A. Line Transect Estimates of Ungulate Populations in a Mediterranean Forest. J. Wildl. Manag. 2002, 66, 48. [Google Scholar] [CrossRef] [Scilit]
- Acevedo, P.; Ruiz-Fons, F.; Vicente, J.; Reyes-García, A.R.; Alzaga, V.; Gortázar, C. Estimating Red Deer Abundance in a Wide Range of Management Situations in Mediterranean Habitats. J. Zool. 2008, 276, 37–47. [Google Scholar] [CrossRef] [Scilit]
- Anderson, C.W.; Nielsen, C.K.; Hester, C.M.; Hubbard, R.D.; Stroud, J.K.; Schauber, E.M. Comparison of Indirect and Direct Methods of Distance Sampling for Estimating Density of White-tailed Deer. Wildl. Soc. Bull. 2013, 37, 146–154. [Google Scholar] [CrossRef] [Scilit]
- Buckland, S.T.; Anderson, D.R.; Burnham, K.P.; Laake, J.L.; Borchers, D.L.; Thomas, L. Introduction to Distance Sampling: Estimating Abundance of Biological Populations; Oxford University Press: Oxford, UK, 2001. [Google Scholar]
- Buckland, S.T.; Rexstad, E.A.; Marques, T.A.; Oedekoven, C.S. Distance Sampling: Methods and Applications; Springer International Publishing: Cham, Switzerland, 2015. [Google Scholar]
- Clark, R.G. Statistical Efficiency in Distance Sampling. PLoS ONE 2016, 11, e0149298. [Google Scholar] [CrossRef] [Scilit] [PubMed]
- Garel, M.; Bonenfant, C.; Hamann, J.; Klein, F.; Gaillard, J. Are Abundance Indices Derived from Spotlight Counts Reliable to Monitor Red Deer Cervus elaphus Populations? Wildl. Biol. 2010, 16, 77–84. [Google Scholar] [CrossRef] [Scilit] [PubMed]
- Focardi, S.; Franzetti, B.; Ronchi, F. Nocturnal Distance Sampling of a Mediterranean Population of Fallow Deer Is Consistent with Population Projections. Wildl. Res. 2013, 40, 437–446. [Google Scholar] [CrossRef] [Scilit]
- Corlatti, L.; Gugiatti, A.; Pedrotti, L. Spring Spotlight Counts Provide Reliable Indices to Track Changes in Population Size of Mountain-dwelling Red Deer Cervus elaphus. Wildl. Biol. 2016, 22, 268–276. [Google Scholar] [CrossRef] [Scilit]
- Focardi, S.; De Marinis, A.M.; Rizzotto, M.; Pucci, A. Comparative Evaluation of Thermal Infrared Imaging and Spotlighting to Survey Wildlife. Wildl. Soc. Bull. 2001, 29, 133–139. [Google Scholar]
- Putman, R.J. Facts from Faeces. Mamm. Rev. 1984, 14, 79–97. [Google Scholar] [CrossRef] [Scilit]
- Campbell, D.; Swanson, G.M.; Sales, J. Comparing the Precision and Cost-effectiveness of Faecal Pellet Group Count Methods. J. Appl. Ecol. 2004, 41, 1185–1196. [Google Scholar] [CrossRef] [Scilit]
- Alves, J.; Alves da Silva, A.; Soares, A.M.V.M.; Fonseca, C. Pellet Group Count Methods to Estimate Red Deer Densities: Precision, Potential Accuracy and Efficiency. Mamm. Biol. 2013, 78, 134–141. [Google Scholar] [CrossRef] [Scilit]
- Chapman, D.I.; Chapman, N.G. Fallow Deer: Their History, Distribution and Biology, 2nd ed.; Coch-y-bonddu Books: Machynlleth, UK, 1997. [Google Scholar]
- De Marinis, A.M.; Chirichella, R.; Apollonio, M. Common Fallow Deer Dama dama (Linnaeus, 1758). In Handbook of the Mammals of Europe: Terrestrial Certiodactyla; Corlatti, L., Zachos, F.E., Eds.; Springer Nature: Cham, Switzerland, 2022; pp. 115–154. [Google Scholar]
- Focardi, S.; Ciuti, S.; Melletti, M. European Fallow Deer Dama dama (Linnaeus, 1758). In Deer of the World: Ecology, Conservation and Management; Melletti, M., Focardi, S., Eds.; Springer Nature: Cham, Switzerland, 2025; pp. 89–108. [Google Scholar]
- Feldhamer, G.A.; Farris-Renner, K.C.; Barker, C.M. Dama dama. Mamm. Species 1988, 317, 1–8. [Google Scholar] [CrossRef] [Scilit]
- Masseti, M. Atlas of Terrestrial Mammals of the Ionian and Aegean Islands; Walter de Gruyter GmbH: Berlin, Germany; Boston, MA, USA, 2012. [Google Scholar]
- Masseti, M.; Mertzanidou, D. Dama Dama. IUCN Red List of Threatened Species. 2008. Available online: https://www.iucnredlist.org/species/42188/10656554#assessment-information (accessed on 29 January 2026).
- Masseti, M.; Cavallaro, A.; Pecchioli, E.; Vernesi, C. Artificial Occurrence of the Fallow Deer, Dama dama dama (L., 1758), on the Island of Rhodes (Greece): Insight from MtDNA Analysis. Hum. Evol. 2006, 21, 167–175. [Google Scholar] [CrossRef] [Scilit]
- Masseti, M.; Pecchioli, E.; Vernesi, C. Phylogeography of the Last Surviving Populations of Rhodian and Anatolian Fallow Deer (Dama dama dama L., 1758). Biol. J. Linn. Soc. 2008, 93, 835–844. [Google Scholar] [CrossRef] [Scilit]
- Mertzanidou, D. Fallow deer (Dama dama). In The Red Data Book of the Endangered Animals of Greece; Legakis, A., Maragou, P., Eds.; Hellenic Zoological Society: Athens, Greece, 2009; pp. 378–379. [Google Scholar]
- Ghigi, A. Ricerche Faunistiche Nelle Isole Italiane Dell’Egeo; Archivio Zoologico Italiano: Torino, Italy, 1929; Volume 13. [Google Scholar]
- Ioannidis, G.; Bousbouras, D. The Deer on Rhodes: A Fauna Census Program; Athens, Greece, 1988. [Google Scholar]
- Masseti, M.; Theodoridis, N. Recording the Data on the Former and Present Distribution of the Free-Ranging Deer Population on Rhodes. In Island of Deer, Natural History of the Fallow Deer of Rhodes and of the Vertebrates of the Dodecanese (Greece); Environmental Organization of Rhode Municipality: Rhodes, Greece, 2002; pp. 169–180. [Google Scholar]
- De Marinis, A.M.; Masseti, M. The Spatio-Temporal Co-Occurrence of Free-Ranging Common Fallow Deer and Domestic Caprines on the Island of Rhodes, Greece. Mammalia 2021, 85, 227–230. [Google Scholar] [CrossRef] [Scilit]
- Hellenic National Meteorological Service. Available online: https://emy.gr/climatic-data?tab=statistics-tab (accessed on 5 February 2026).
- European Environment Agency (EEA). CORINE Land Cover 2018 (Vector/Raster 100 m), Europe, 6-Yearly. [Dataset]. Available online: https://land.copernicus.eu/en/products/corine-land-cover/clc2018 (accessed on 5 February 2026).
- Carlstrom, A. A Survey of the Flora and Phytogeography of Rhodos, Simi, Tilos and the Marmaris Peninsula (SE Greece and SW Turkey). Ph.D. Thesis, University of Lund, Lund, Sweden, 1987. [Google Scholar]
- Levy, P.S.; Lemeshow, S. Sampling of Populations; Wiley: New York, NY, USA, 2008. [Google Scholar]
- Focardi, S.; Toso, S.; Pecchioli, E. The Population Modelling of Fallow Deer and Wild Boar in a Mediterranean Ecosystem. For. Ecol. Manag. 1996, 88, 7–14. [Google Scholar] [CrossRef] [Scilit]
- Skalski, J.R.; Ryding, K.E.; Millspaugh, J.J. Wildlife Demography: Analysis of Sex, Age, and Count Data; Elsevier—Academic Press: Amsterdam, The Netherlands, 2005. [Google Scholar]
- Grignolio, S.; Apollonio, M.; Brivio, F.; Vicente, J.; Acevedo, P.; P., P.; Petrovic, K.; Keuling, O. Guidance on Estimation of Abundance and Density Data of Wild Ruminant Population: Methods, Challenges, Possibilities. EFSA Support. Publ. 2020, 17, 1876E. [Google Scholar] [CrossRef] [Scilit]
- Massei, G.; Bacon, P.; Genov, P.V. Fallow Deer and Wild Boar Pellet Group Disappearance in a Mediterranean Area. J. Wildl. Manag. 1998, 62, 1086–1094. [Google Scholar] [CrossRef] [Scilit]
- Zar, J.H. Biostatistical Analysis, 3rd ed.; Prentice Hall: Upper Saddle River, NJ, USA, 1996. [Google Scholar]
- Buckland, S.T.; Anderson, D.R.; Burnham, K.P.; Laake, J.L.; Borchers, D.L.; Thomas, L. Advanced Distance Sampling; Oxford University Press: Oxford, UK, 2004. [Google Scholar]
- Howe, E.J.; Buckland, S.T.; Després-Einspenner, M.; Kühl, H.S. Model Selection with Overdispersed Distance Sampling Data. Methods Ecol. Evol. 2019, 10, 38–47. [Google Scholar] [CrossRef] [Scilit]
- Thomas, L.; Buckland, S.T.; Rexstad, E.A.; Laake, J.L.; Strindberg, S.; Hedley, S.L.; Bishop, J.R.B.; Marques, T.A.; Burnham, K.P. Distance Software: Design and Analysis of Distance Sampling Surveys for Estimating Population Size. J. Appl. Ecol. 2010, 47, 5–14. [Google Scholar] [CrossRef] [Scilit] [PubMed]
- Cho, K.; Eckel, C.S.; Walgenbach, J.F.; Kennedy, G.G. Spatial Distribution and Sampling Procedures for Frankliniella spp. (Thysanoptera: Thripidae) in Staked Tomato. J. Econ. Entomol. 1995, 88, 1658–1665. [Google Scholar] [CrossRef] [Scilit]
- Focardi, S.; Isotti, R.; Pelliccioni, E.R.; Iannuzzo, D. The Use of Distance Sampling and Mark-resight to Estimate the Local Density of Wildlife Populations. Environmetrics 2002, 13, 177–186. [Google Scholar] [CrossRef] [Scilit]
- Kjellander, P.; Svartholm, I.; Bergvall, U.A.; Jarnemo, A. Habitat Use, Bed-site Selection and Mortality Rate in Neonate Fallow Deer Dama dama. Wildl. Biol. 2012, 18, 280–291. [Google Scholar] [CrossRef] [Scilit]
- Menichetti, L.; Touzot, L.; Elofsson, K.; Hyvönen, R.; Kätterer, T.; Kjellander, P. Interactions between a Population of Fallow Deer (Dama dama), Humans and Crops in a Managed Composite Temperate Landscape in Southern Sweden: Conflict or Opportunity? PLoS ONE 2019, 14, e0215594. [Google Scholar] [CrossRef] [Scilit]
- Stenström, D.; Dahlblom, S.; Jones Fur, C.; Höglund, J. Rutting Pit Distribution and the Significance of Fallow Deer Dama dama Scrapes during the Rut. Wildl. Biol. 2000, 6, 23–29. [Google Scholar] [CrossRef] [Scilit]
- Focardi, S.; Aragno, P.; Montanaro, P.; Riga, F. Inter-specific Competition from Fallow Deer Dama Dama Reduces Habitat Quality for the Italian Roe Deer Capreolus capreolus italicus. Ecography 2006, 29, 407–417. [Google Scholar] [CrossRef] [Scilit]
- Ünal, Y.; Çulhacı, H. Investigation of Fallow Deer (Cervus dama L.) Population Densities by Camera Trap Method in Antalya Düzlerçamı Eşenadası Breeding Station. Turk. J. For. 2018, 19, 57–62. [Google Scholar] [CrossRef] [Scilit]
- Forsyth, D.M.; Comte, S.; Davis, N.E.; Bengsen, A.J.; Côté, S.D.; Hewitt, D.G.; Morellet, N.; Mysterud, A. Methodology Matters When Estimating Deer Abundance: A Global Systematic Review and Recommendations for Improvements. J. Wildl. Manag. 2022, 86, e22207. [Google Scholar] [CrossRef] [Scilit]
- Tomás, W.M.; McShea, W.; de Miranda, G.H.B.; Moreira, J.R.; Mourao, G.; Borges, P.A.L. A Survey of a Pampas Deer, Ozotoceros bezoarticus leucogaster (Arctiodactyla, Cervidae), Population in the Pantanal Wetland, Brazil, Using the Distance Sampling Technique. Anim. Biodivers. Conserv. 2001, 24, 101–106. [Google Scholar] [CrossRef] [Scilit]
- Chiarello, A.G.; Arruda, L.N. Unpaved Roads Are Not Adequate Surrogates of True Transects for Sampling Agoutis. Mammalia 2017, 81, 489–501. [Google Scholar] [CrossRef] [Scilit]
- Heydon, M.J.; Reynolds, J.C.; Short, M.J. Variation in Abundance of Foxes (Vulpes vulpes) between Three Regions of Rural Britain, in Relation to Landscape and Other Variables. J. Zool. 2000, 251, 253–264. [Google Scholar] [CrossRef]
- LaRue, M.A.; Nielsen, C.K.; Grund, M.D. Using Distance Sampling to Estimate Densities of White-Tailed Deer in South-Central Minnesota. Prairie Nat. 2007, 39, 57–68. [Google Scholar]
- McShea, W.J.; Stewart, C.M.; Kearns, L.; Bates, S. Road Bias for Deer Density Estimates at 2 National Parks in Maryland. Wildl. Soc. Bull. 2011, 35, 177–184. [Google Scholar] [CrossRef] [Scilit]
- Barraclough, R.K. Distance Sampling: A Discussion Document Produced for the Department of Conservation (Science and Research Internal Report No. 175); Department of Conservation: Wellington, New Zealand, 2000. [Google Scholar]
- Bakaloudis, D.E.; Thoma, C.T.; Makridou, K.N.; Kotsonas, E.G. Occupancy Dynamics of Free Ranging American Mink (Neogale vison) in Greece. Sci. Rep. 2024, 14, 9973. [Google Scholar] [CrossRef] [Scilit]
- Salafsky, N.; Relton, C.; Young, B.E.; Lamarre, P.; Böhm, M.; Chénier, M.; Cochrane, E.; Dionne, M.; He, K.K.; Hilton-Taylor, C.; et al. Classification of Direct Threats to the Conservation of Ecosystems and Species 4.0. Conserv. Biol. 2025, 39, e14434. [Google Scholar] [CrossRef] [Scilit] [PubMed]
- Battisti, C.; Di Gennaro, A.; Gippoliti, S. Schematizing a Historical Demographic Collapse on a Large Time Span Using Local, Secondary and Grey Data: The Case of Italian Roe Deer Capreolus capreolus italicus in Central Italy. J. Nat. Conserv. 2015, 24, 63–67. [Google Scholar] [CrossRef] [Scilit]
- Hellenic Statistical Authority Table 3. Sheep, Goats and Pigs (All Ages) on 31st December 2023, by Region and Regional Unities. Available online: https://www.statistics.gr/el/statistics?p_p_id=documents_WAR_publicationsportlet_INSTANCE_VBZOni0vs5VJ&p_p_lifecycle=2&p_p_state=normal&p_p_mode=view&p_p_cacheability=cacheLevelPage&p_p_col_id=column-2&p_p_col_count=4&p_p_col_pos=2&_documents_WAR_publicationsportlet_INSTANCE_VBZOni0vs5VJ_javax.faces.resource=document&_documents_WAR_publicationsportlet_INSTANCE_VBZOni0vs5VJ_ln=downloadResources&_documents_WAR_publicationsportlet_INSTANCE_VBZOni0vs5VJ_documentID=503950&_documents_WAR_publicationsportlet_INSTANCE_VBZOni0vs5VJ_locale=el (accessed on 29 March 2026).

Disclaimer/Publisher’s Note: The statements, opinions and data contained in all publications are solely those of the individual author(s) and contributor(s) and not of MDPI and/or the editor(s). MDPI and/or the editor(s) disclaim responsibility for any injury to people or property resulting from any ideas, methods, instructions or products referred to in the content. |
© 2026 by the authors. Licensee MDPI, Basel, Switzerland. This article is an open access article distributed under the terms and conditions of the Creative Commons Attribution (CC BY) license.