


Abstract
Ecosystem carbon use efficiency (CUE = NEP/GPP) is an indicator of an ecosystem’s capacity to convert photosynthetically fixed carbon into net carbon storage. Under global warming and CO2 fertilization, vegetation greening may be accompanied by asynchronous changes in carbon use efficiency. As the world’s largest non-zonal arid region, the arid region of Central Asia still lacks systematic understanding of the spatiotemporal evolution of CUE and its primary associated factors. This study analyzed the spatiotemporal dynamics and influencing factors of CUE in the arid region of Central Asia from 1999 to 2019. The results showed that the region as a whole acted as a carbon sink, with multi-year mean GPP and NEP of 414.8 g C m−2 and 83.3 g C m−2, respectively, and interannual growth rates of 6.5 g C m−2 yr−1 and 1.3 g C m−2 yr−1, respectively. The mean CUE was 0.17, and its trend was essentially stable. Shrubland (SL) had the highest CUE (0.25) but showed a slight declining trend, suggesting that its carbon use efficiency may face a risk of decline. Partial correlation analysis identified the primary factors associated with CUE in Central Asia from 1999 to 2019. Across the entire region, LAI had the highest proportion as the primary associated factor. Forest (FR) had a relatively high proportion of pixels with TEM as the primary associated factor. SL showed relatively balanced associations with multiple moisture factors, including PRE, SM, and VPD. Grassland (GL) and sparse vegetation (SV) had VPD and LAI as their primary associated factors, while in cropland (CL), LAI was prominent as the primary associated factor. Geographical detector results indicated that the statistical explanatory power of multi-factor interaction combinations for the spatial differentiation of CUE was higher than that of single factors, and two-factor interactions significantly enhanced explanatory power. Across the entire region, TEM∩LAI had the highest explanatory power (q = 0.252); some combinations exhibited bi-factor enhancement, while the rest mainly showed nonlinear enhancement. Among different ecosystems, TEM∩LAI and VPD∩LAI in SL had the highest explanatory power (q = 0.501 and 0.510, respectively), TEM∩PRE in GL had prominent explanatory power (q = 0.324), and SV and CL exhibited strong multi-factor interaction characteristics. These results reveal the spatial heterogeneity of carbon use efficiency in the arid region of Central Asia and the explanatory power of its associated factors, and further highlight that high productivity does not necessarily correspond to high carbon use efficiency, providing new insights into understanding ecosystem carbon use strategies in arid regions.
1. Introduction
Human activities, represented by fossil fuel combustion and land-use change, have caused atmospheric carbon dioxide (CO2) concentrations to rise continuously, accelerating global warming and consequently affecting ecosystem carbon cycling [1,2]. The terrestrial ecosystem carbon cycle is an important component of the global carbon cycle, in which the net terrestrial carbon sink removes approximately one-quarter of anthropogenic CO2 emissions annually and makes an important contribution to the global carbon balance [3]. Enhancing terrestrial carbon sinks is also regarded as one of the feasible pathways for addressing climate change, and accurately quantifying the magnitude and growth potential of regional carbon sinks can provide a scientific basis for carbon management decisions in climate change mitigation [4]. Understanding the carbon budget of terrestrial ecosystems generally relies on several core metrics: gross primary productivity (GPP), which represents the total carbon fixed by vegetation through photosynthesis [5]; ecosystem respiration (RECO), including autotrophic and heterotrophic respiration [6]; and net ecosystem productivity (NEP = GPP − RECO), which represents the net carbon uptake or net carbon emission of an ecosystem [7].
In the context of climate change, global warming and CO2 fertilization effects are generally considered important drivers promoting vegetation growth, leading to global vegetation greening and enhancing the carbon sequestration capacity of terrestrial ecosystems, thereby significantly increasing terrestrial carbon uptake [8,9]. According to studies, global terrestrial GPP increased by 31% ± 5% during the 20th century [10]. Two atmospheric inversions, MACC-II and Jena CarboScope, indicate that global terrestrial NEP showed a positive growth trend (approximately 0.12–0.18 Pg C yr−1) from 1995 to 2014; statistically, rising CO2 can explain more than 90% of this trend. However, this attribution is limited by data sources, time periods, and model frameworks; the TRENDY ensemble shows a markedly lower trend, and other processes may also contribute [11]. Although many studies depict an increasingly enhanced terrestrial carbon sink, over time substantial increases in GPP may be offset by synchronous or even faster increases in RECO, weakening the carbon sequestration benefit of increased GPP. This can lead to relatively low NEP growth rates and low ecosystem carbon fixation efficiency [12]. Therefore, to better reveal ecosystem efficiency in carbon fixation, ecosystem carbon use efficiency (CUE = NEP/GPP) is used as a key parameter. It quantifies the proportion of total carbon fixed by photosynthesis that is converted into net carbon storage in the carbon cycle and reflects the balance between carbon assimilation and respiratory losses [13]. High CUE corresponds to a higher proportion of photosynthetically fixed carbon retained as net carbon accumulation, whereas low CUE corresponds to a higher proportion lost through respiration. Compared with GPP or NEP alone, CUE links total carbon assimilation with net carbon storage, helping identify ecosystems with high productivity but low carbon fixation efficiency and providing a basis for understanding the spatial matching between regional carbon sink magnitude and carbon use efficiency.
Arid regions account for approximately 41% of the Earth’s land area and are considered among the most vulnerable and sensitive ecosystems globally [14]. Arid ecosystems are strongly constrained by water availability. Water deficit suppresses photosynthesis, whereas respiration may respond differently due to temperature or substrate limitations, thereby altering the direction and magnitude of CUE. In global semi-arid regions, spatially averaged annual GPP, NEP, evapotranspiration, and water use efficiency (WUE) all show significant upward trends; these upward trends also hold at regional scales in Asia, Africa, and Australia [15]. The arid region of Central Asia, the largest arid region in the temperate Northern Hemisphere, has become a focus of geoscience research regarding the impacts of climate change on ecosystem carbon cycling [16]. If the challenges posed by climate change cannot be effectively addressed, ecosystems may undergo irreversible degradation, exacerbating water resource management problems, causing resource shortages, and affecting industrial and agricultural production and economic development [17]. However, previous global carbon cycle studies have mostly focused on tropical rainforests, temperate forests, or high-latitude regions, with relatively insufficient attention to ecosystems in the arid region of Central Asia. Moreover, because this region lacks adequate field observations and related studies, existing assessments often rely on data from other non-temperate arid regions [18], leading to uncertainty in estimates of carbon sequestration potential in Central Asia.
In response to the above issues, this study focuses on the arid region of Central Asia. Using annual GPP, NEP, temperature (TEM), precipitation (PRE), soil moisture (SM), vapor pressure deficit (VPD), and leaf area index (LAI) data from 1999 to 2019, we propose the following hypotheses: CUE depends to a large extent on how GPP and respiration are estimated, and a high CUE does not necessarily indicate that an ecosystem has greater carbon sequestration capacity. We further explore the following questions: (1) Are increases in GPP accompanied by proportional increases in NEP and CUE? (2) Do environmental factors associated with CUE vary by vegetation type? (3) Do environmental and vegetation variables and their interactions have higher explanatory power for the spatial differentiation of CUE?
This study calculates CUE based on GPP and RECO derived from remote sensing models rather than direct flux tower observations. Although the results are affected by uncertainties in model algorithms and input data, this approach has the advantage of providing large-scale, continuous spatiotemporal carbon flux estimates, thereby compensating for sparse ground observations. This paper aims to comprehensively examine the associations between CUE and environmental and vegetation factors in this region, contributing to a more comprehensive and accurate assessment of the carbon sequestration efficiency of ecosystems in the arid region of Central Asia under climate change and to an analysis of its influencing factors.
2. Materials and Methods
2.1. Study Area
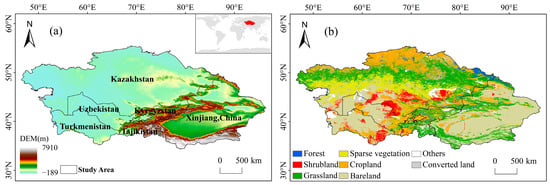
The study area in Central Asia (35.11–55.43° N, 46.48–96.04° E) spans approximately 5.7 × 10⁶ km2 (Figure 1), encompassing Kazakhstan, Uzbekistan, Kyrgyzstan, Tajikistan, Turkmenistan, and the Xinjiang Uygur Autonomous Region of China. The topography is highly diverse, comprising the Caspian coastal lowlands, northern steppes, central semi-deserts and deserts, and high mountains in the southeast (Altai Mountains, Tianshan Mountains, and the Pamir Plateau). Owing to its deep inland location far from oceanic moisture sources, the region experiences a typical temperate continental climate. Precipitation is generally scarce and concentrated in spring and summer; except for mountainous areas where orographic uplift enhances rainfall, most of the region receives less than 200 mm of annual precipitation, and some desert areas receive less than 100 mm [19]. Grasslands and croplands dominate the vegetation cover (accounting for ~70% of the pixels), while forests are rare (~2%) and are mainly restricted to mountainous zones. Shrublands (~8%) and sparse vegetation (~20%, mostly in the central and western parts) are widely distributed. The region faces pronounced ecological problems, notably steppe degradation and desertification.
Figure 1.
(a) Overview of the study area in Central Asia; (b) Distribution of different vegetation types.
2.2. Data Sources
2.2.1. Vegetation Productivity Dataset
The data used in this study were obtained from the Global Carbon Flux Dataset (GCFD) (https://data.tpdc.ac.cn/ (accessed on 14 May 2025)), which contains three carbon flux variables—GPP, RECO, and NEE—from January 1999 to June 2020, with a 10-day temporal resolution and a 0.1° spatial resolution. This dataset was developed using measured carbon fluxes from 280 sites worldwide as benchmarks, with multiple indicators as covariates, and was generated using a convolutional neural network model. The R2 values of the GCFD were 0.82 for GPP, 0.72 for RECO, and 0.62 for NEE [20]. Zhang et al. compared this dataset with carbon flux observations from a grassland ecosystem in the Tianshan region of China, confirming its applicability [21]. In this study, annual-scale data were generated by aggregating the original data while ignoring missing values. NEP was obtained by taking the negative of NEE (NEP = −NEE). CUE was calculated from annual-scale data, and then the multi-year average of CUE was computed. The NEP/GPP ratio reflects the proportion of net carbon accumulation relative to the initial photosynthetically fixed carbon after deducting ecosystem respiration (autotrophic and heterotrophic respiration). This definition emphasizes net ecosystem carbon storage efficiency and is more sensitive to respiratory losses than NPP/GPP.
2.2.2. Land Use Data
The land cover dataset was obtained from the European Space Agency Climate Change Initiative (ESA CCI) (https://cds.climate.copernicus.eu/ (accessed on 19 February 2025)). It has a spatial resolution of 300 m and has been validated against independent validation datasets. In this study, the original ESA CCI land cover classes were reclassified into seven categories for the period 1999–2019: forest (FR), shrubland (SL), grassland (GL), sparse vegetation (SV), cropland (CL), bare soil, and other areas (including water bodies and urban areas). To minimize the impact of land cover change on our results, pixels that underwent land cover conversion were assigned to a separate class, while unchanged pixels were defined as those whose land cover type remained consistent throughout 1999–2019 [22]. This study focuses primarily on the five vegetation ecosystem types represented by FR, SL, GL, SV, and CL.
2.2.3. Environmental and Vegetation Data
Temperature (TEM) data were obtained from the skin temperature product of the ERA5-Land reanalysis dataset (https://cds.climate.copernicus.eu/), with a spatial resolution of 0.1°. Precipitation (PRE) and vapor pressure deficit (VPD) data were acquired from the TerraClimate dataset (https://www.climatologylab.org/terraclimate.html (accessed on 20 March 2025)), which has a spatial resolution of 1/24° and a monthly temporal resolution [23]. Soil moisture (SM) data were derived from the Global Land Evaporation Amsterdam Model (GLEAM) v4.2a dataset (https://www.gleam.eu/ (accessed on 10 April 2025)), provided at an annual scale with a global spatial resolution of 0.1° [24]. Leaf area index (LAI) data were sourced from the GIMMS LAI4g dataset [25], which spans 1982–2020 with a biweekly temporal resolution and a spatial resolution of 1/12° (~9 km at the equator) (https://zenodo.org/record/7649107 (accessed on 1 February 2026)).
All datasets used in this study cover the period 1999–2019. To ensure consistent spatial resolution for subsequent analyses, all data layers were resampled to 0.1°.
2.3. Analysis Methods
At the interannual scale, the trends in GPP, NEP, and CUE were quantified using the slope of a linear regression equation [26,27]. At the pixel scale, spatial trends were calculated using the Theil–Sen median method [28], and the statistical significance of the trends was tested using the Mann–Kendall test, with a significance level of α = 0.05; calculations were performed only for pixels with data series longer than 10 years [29]. Partial correlation analysis was used to examine the relationships between CUE and each environmental and vegetation factor, and significance was tested using a t-test at α = 0.05 [30]. When calculating the partial correlation coefficient between CUE and a given factor, the other four factors were controlled simultaneously. Factor detection analysis was conducted using the optimal parameters-based geographical detector (OPGD). The discretization process employed five discretization methods (equal interval, natural breaks, quantile, geometric interval, and standard deviation), with the number of breakpoints set to 6–9. For continuous factors, OPGD iterated through combinations of different discretization methods and numbers of breakpoints and selected the combination that maximized the q statistic as the optimal discretization parameters for that factor. The optimal parameters were defined as follows: among combinations satisfying the significance level of p < 0.01, the combination with the largest q value was selected; if multiple combinations had the same q value, the one with fewer breakpoints was chosen to avoid over-discretization. The factor detector was used to identify factors with high statistical explanatory power for the spatial differentiation of CUE (q value; p < 0.01 considered significant), whereas the interaction detector was used to determine the types of interactions among factors (nonlinear weaken, single-factor nonlinear weaken, bi-factor enhance, and independent or nonlinear enhance) [31].
3. Results
3.1. Spatial Distribution Patterns
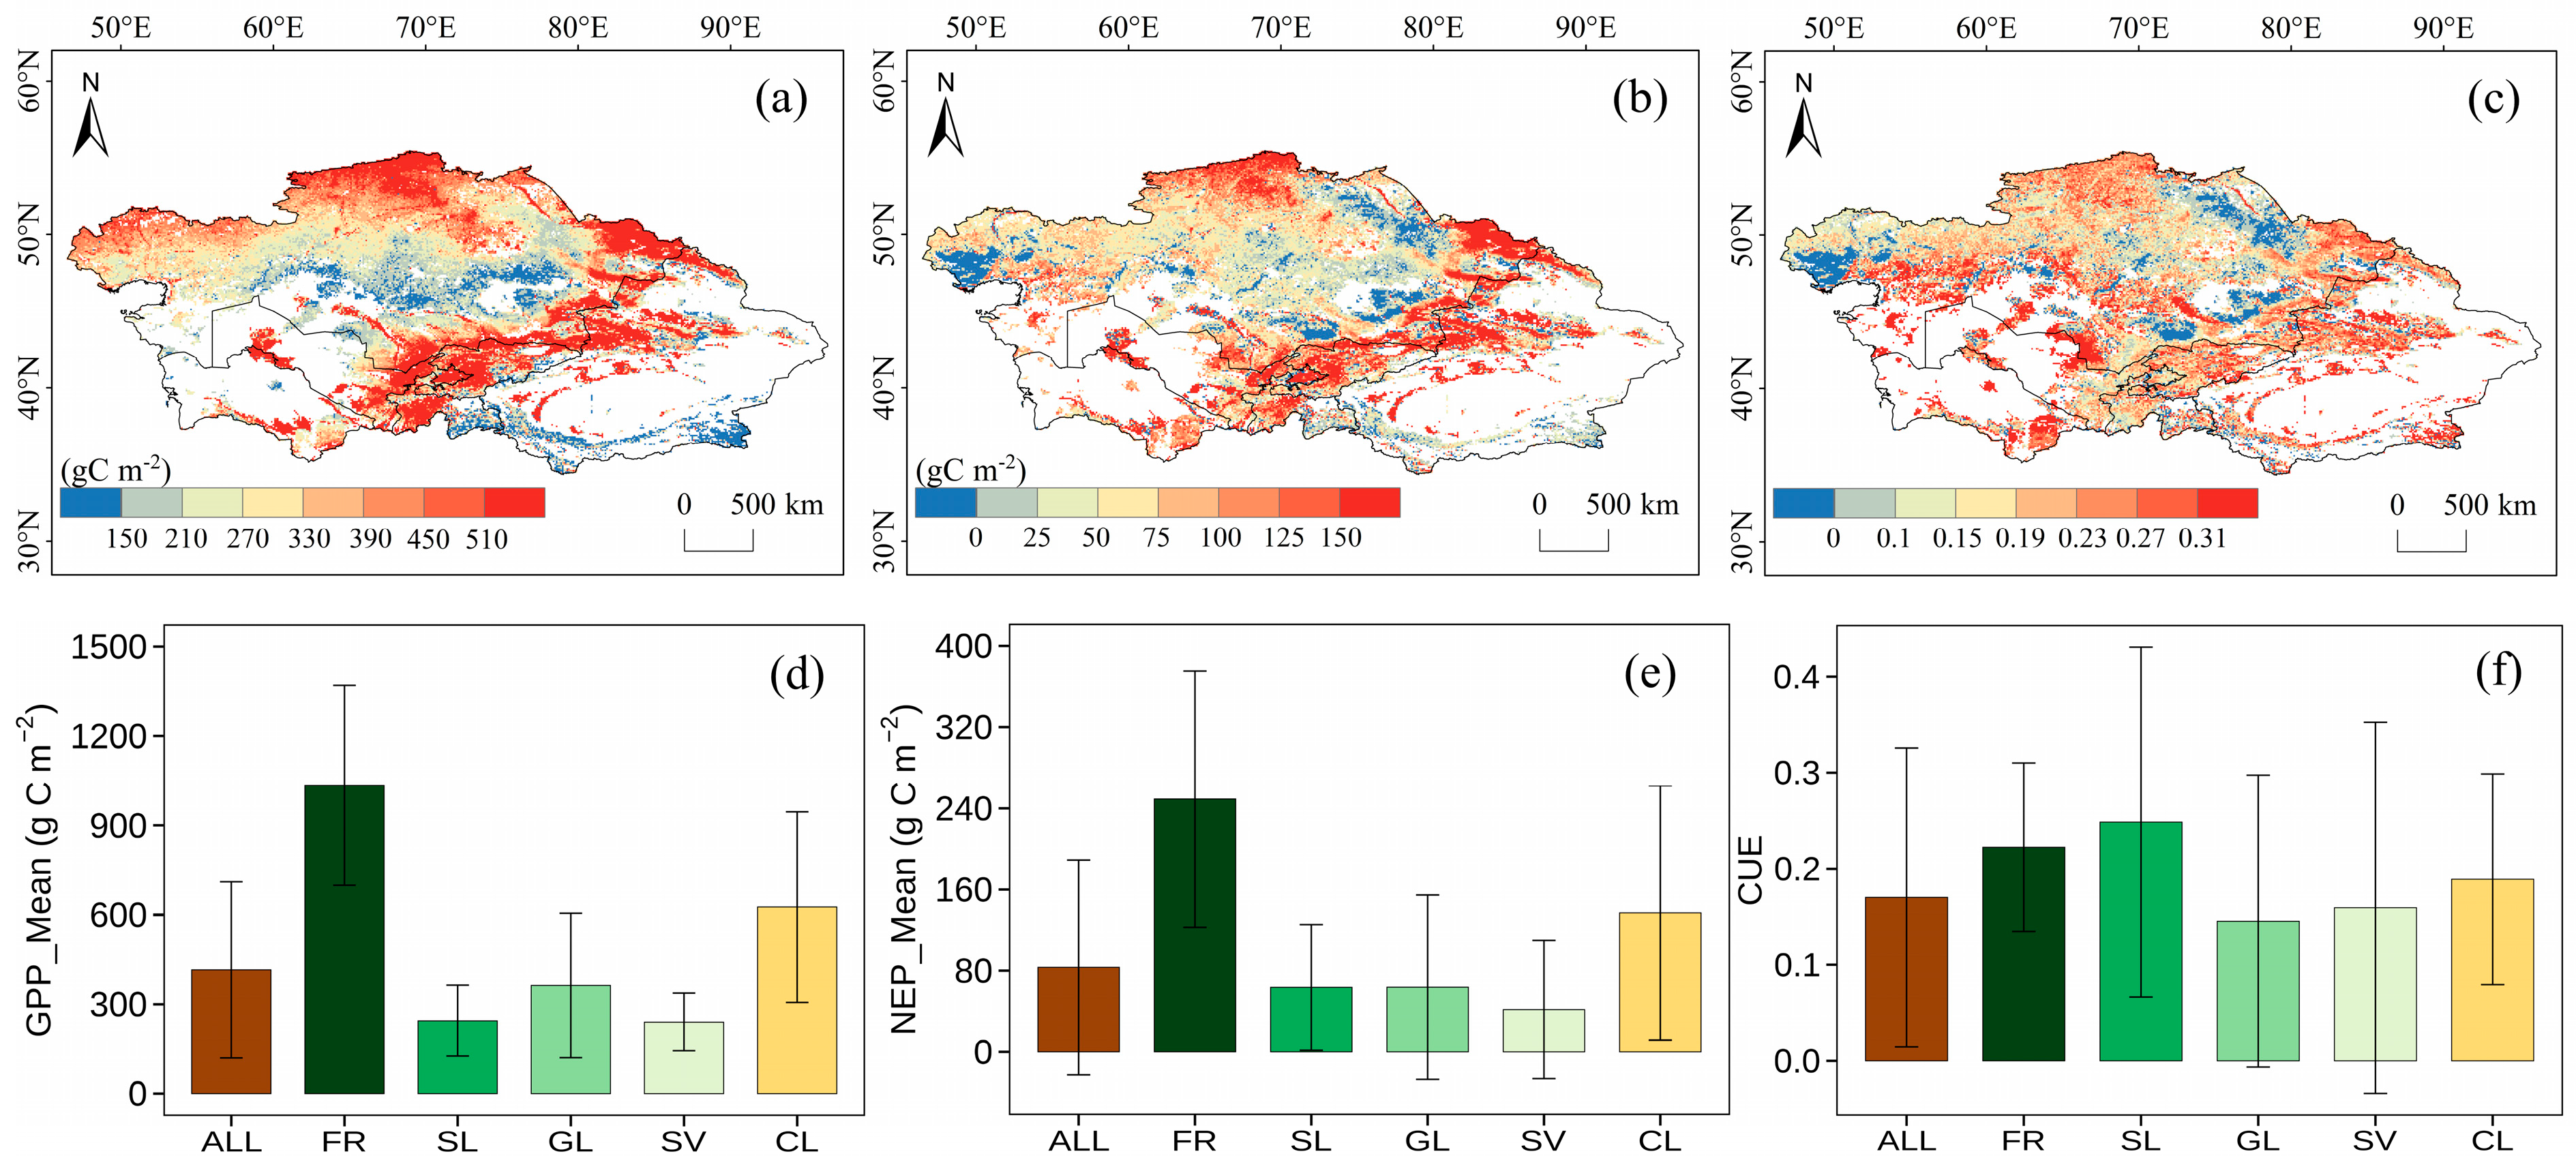
The annual mean GPP and NEP over the entire Central Asian region were 414.8 and 83.3 g C m−2, respectively (Figure 2d), indicating that the region as a whole acted as a carbon sink. However, the mean CUE was only 0.17, indicating that high productivity did not correspond to high carbon use efficiency. The spatial patterns of GPP and NEP were similar, whereas the spatial pattern of CUE did not coincide with either. Higher GPP and NEP values occurred in CL and FR in the northern region and in FR and GL in the central region, whereas values in SL and SV areas in the central region were relatively low (Figure 2a,b). Among the different ecosystems, FR had the highest mean GPP and NEP, reaching 1035.0 and 249.3 g C m−2, respectively, followed by CL, GL, SL, and SV. SV had the lowest mean GPP and NEP, at only 240.0 and 41.9 g C m−2, respectively.
Figure 2.
(a–c) Spatial distribution of multi-year average GPP, NEP, and CUE across Central Asia and different ecosystems from 1999 to 2019. (d–f) Multi-year mean values of GPP, NEP, and CUE for different ecosystems. Error bars represent the standard deviation of the data. ALL denotes the entire Central Asian region; FR, forest; SL, shrubland; GL, grassland; SV, sparse vegetation; CL, cropland.
The overall CUE in Central Asia was 0.17; high CUE values occurred in low-elevation CL in the north, high-elevation FR and GL in the central region, and low-elevation SL in the southwest, whereas CUE was relatively low in low-elevation GL in the north and west. CUE differed significantly among ecosystem types. SL had the highest CUE (0.25), followed by FR, CL, SV, and GL, with GL having the lowest CUE (only 0.15). This ranking reveals a spatial mismatch between carbon sink function and carbon use efficiency in Central Asia: FR had the highest GPP and NEP but not the highest CUE, whereas SL had relatively low GPP and NEP but the highest CUE. This indicates that carbon use efficiency in arid regions depends more on respiratory consumption and carbon allocation strategies than on total photosynthetic carbon fixation. The above results indicate that high productivity does not necessarily correspond to high carbon use efficiency.
3.2. Spatiotemporal Trends
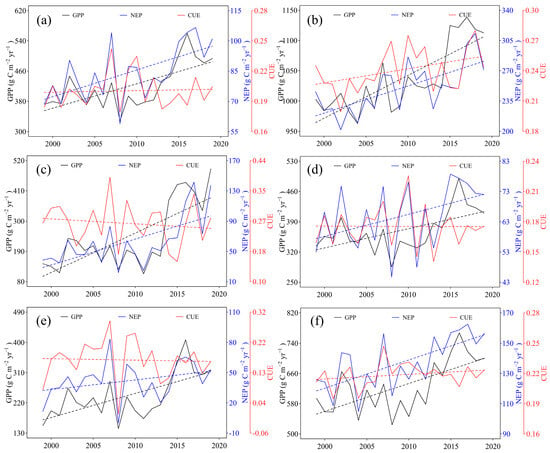
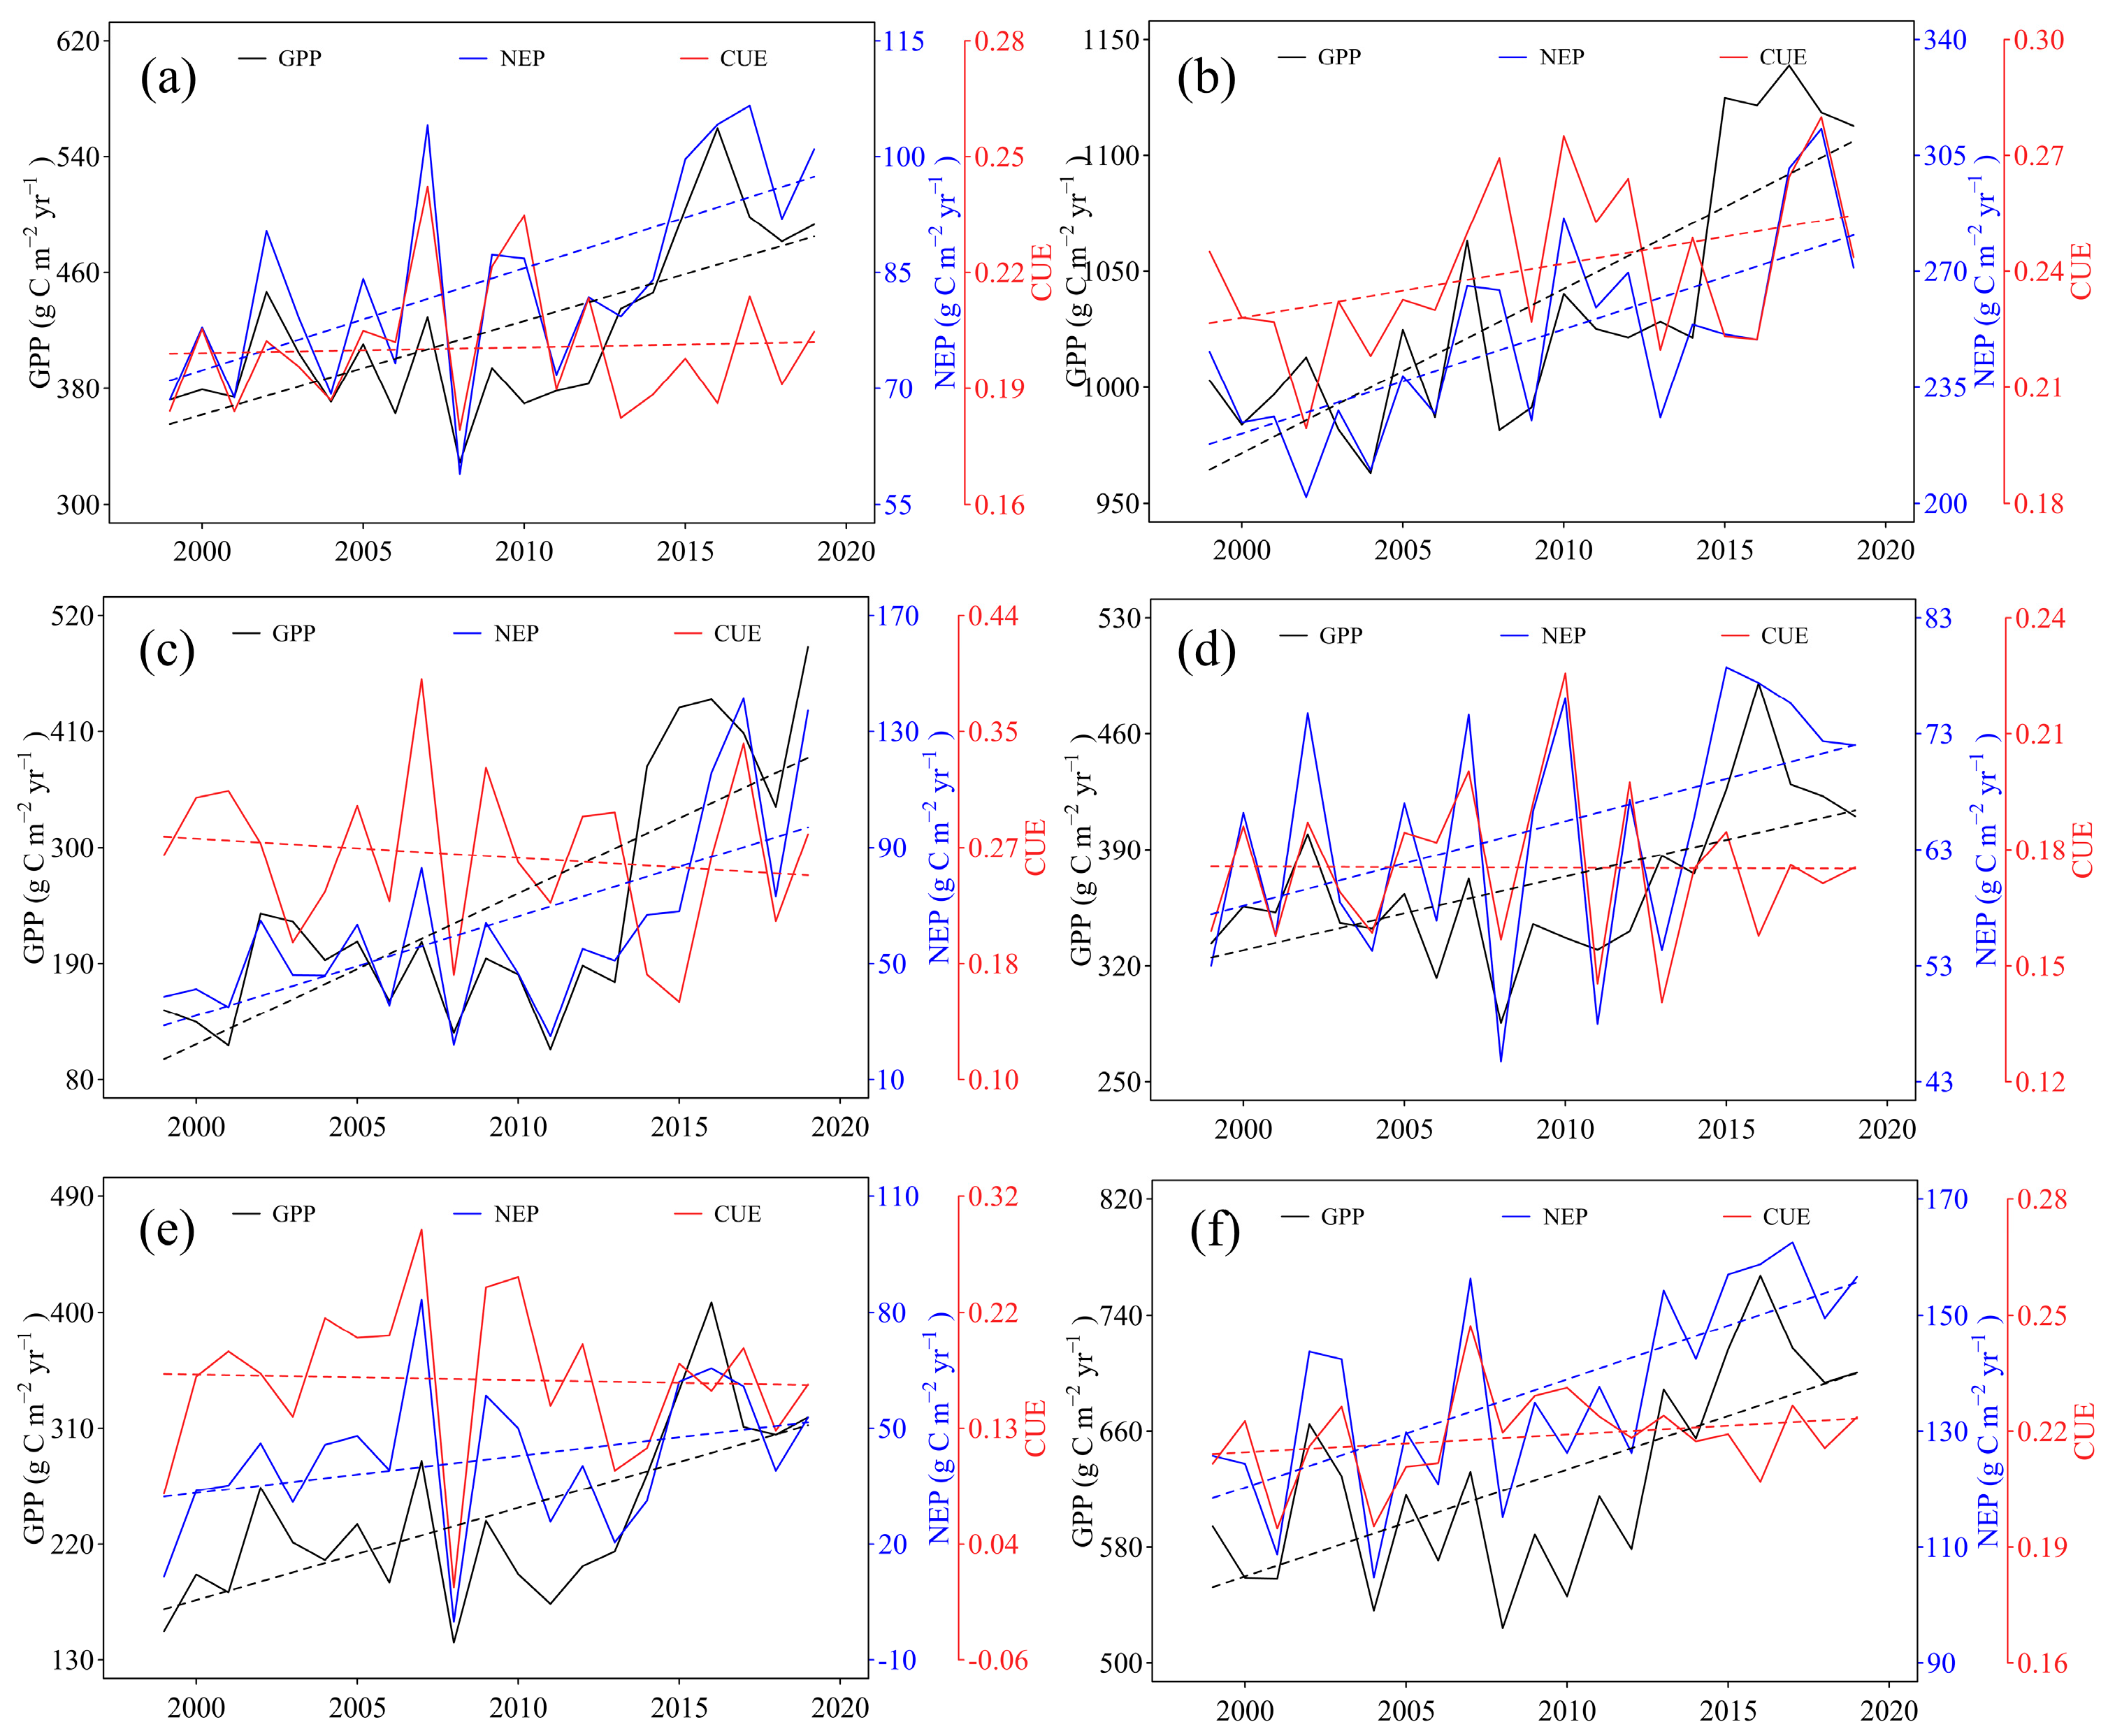
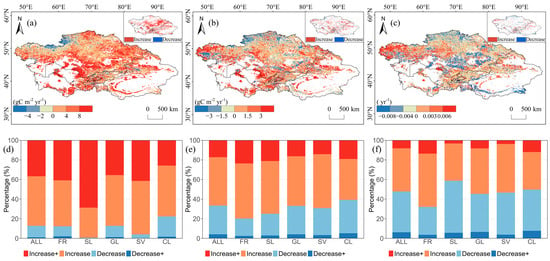
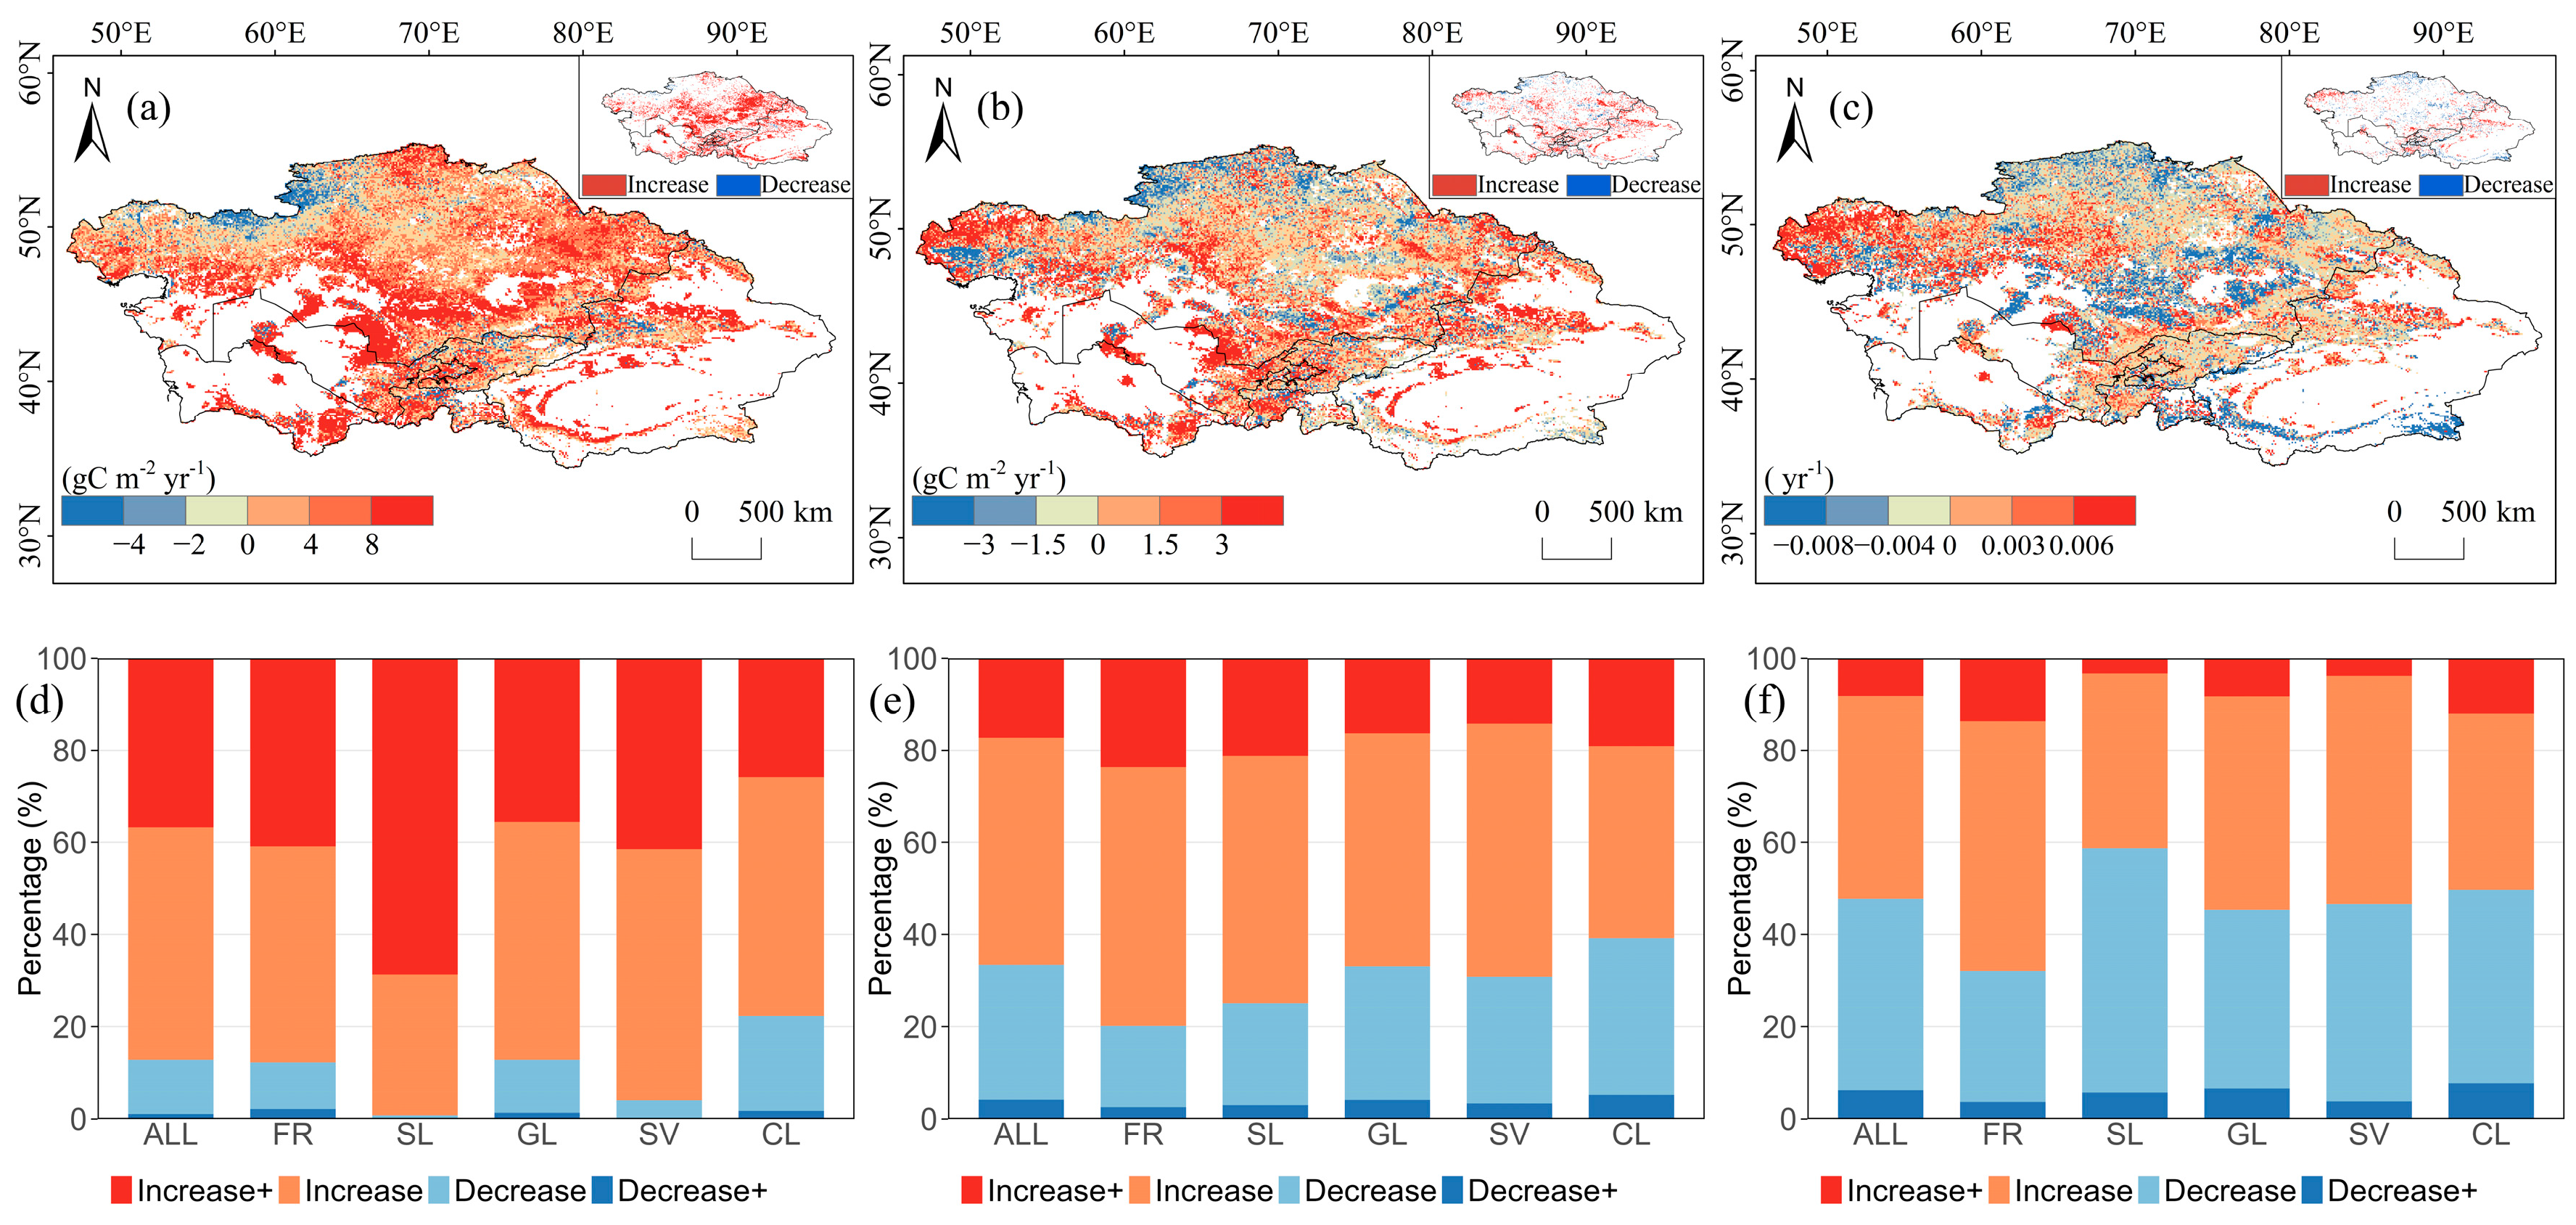
During 1999–2019, both GPP and NEP in the ecosystems of the entire Central Asian region exhibited significant interannual increasing trends (Figure 3 and Figure 4), with annual growth rates of 6.5 g C m−2 yr−1 and 1.3 g C m−2 yr−1, respectively (Figure 3a). This increasing trend was prevalent across all ecosystems. Among them, SL exhibited the fastest productivity growth, with GPP and NEP increasing at rates of 14.3 g C m−2 yr−1 and 3.4 g C m−2 yr−1, respectively (Figure 3c). In contrast, GL showed relatively low growth rates for GPP (4.4 g C m−2 yr−1) and NEP (0.7 g C m−2 yr−1) (Figure 3d). Spatially, the trends in GPP and NEP across Central Asia displayed pronounced spatial heterogeneity. Specifically, 87.2% of the region showed an increasing trend in GPP (36.7% significant), with the SL area having the broadest coverage of GPP increase (accounting for 99.2% of its area, 68.7% significant) (Figure 4d). The spatial distribution of NEP trends was slightly different from that of GPP, mainly concentrated in the central and southern regions (Figure 4b). An increasing trend in NEP was observed in 66.5% of the area (17.3% significant), with FR having the highest proportion of area showing an NEP increase (79.8%, 23.7% significant) (Figure 4e).
Figure 3.
(a–f) Temporal trends in annual mean GPP, NEP, and CUE for the entire Central Asian region and different ecosystem types (FR, SL, GL, SV, and CL) from 1999 to 2019.
Figure 4.
Spatial distribution and proportions of trends in GPP, NEP, and CUE across Central Asia and different ecosystem types from 1999 to 2019. (a–c) Trends and significance for GPP, NEP, and CUE, respectively; insets in the upper right corner indicate areas with significant trends (p < 0.05). (d–f) Proportions of trend categories for GPP, NEP, and CUE in different ecosystems; “+” denotes that the trend reached statistical significance (p < 0.05).
Unlike the significant increases in GPP and NEP, the overall CUE in Central Asia remained essentially stable, indicating that productivity gains were not synchronously translated into improved carbon use efficiency and that regional greening may mask the risk of weakening carbon use efficiency. The spatial differences in CUE across Central Asia were pronounced, with higher CUE in the western and southern regions. CUE increased in 52.3% of the area (8.2% significantly) and decreased in 47.7% of the area (6.3% significantly). Among ecosystem types, CUE showed a slight increasing trend in FR and a slight decreasing trend in SL, whereas the other three ecosystem types remained relatively stable. This difference indicates that increases in GPP and NEP do not necessarily lead to synchronous increases in CUE. SL had the fastest productivity growth but a declining CUE, reflecting that its net carbon accumulation increased more slowly than GPP and that its carbon use efficiency is at risk of weakening. In terms of spatial trend distribution, FR had the highest proportion of areas with increasing CUE (67.9%, 13.7% significant), while 32.1% showed decreasing CUE (3.6% significant). In SL, 58.7% of the area showed decreasing CUE (5.8% significant) and 41.3% showed increasing CUE (3.4% significant) (Figure 4f).
In summary, the most prominent spatiotemporal pattern during 1999–2019 was that SL had the fastest productivity growth but showed a slight declining trend in CUE, indicating that its productivity enhancement and changes in carbon use efficiency were not synchronous.
3.3. Analysis of Factors Influencing CUE in Central Asian Ecosystems
3.3.1. Partial Correlation Analysis
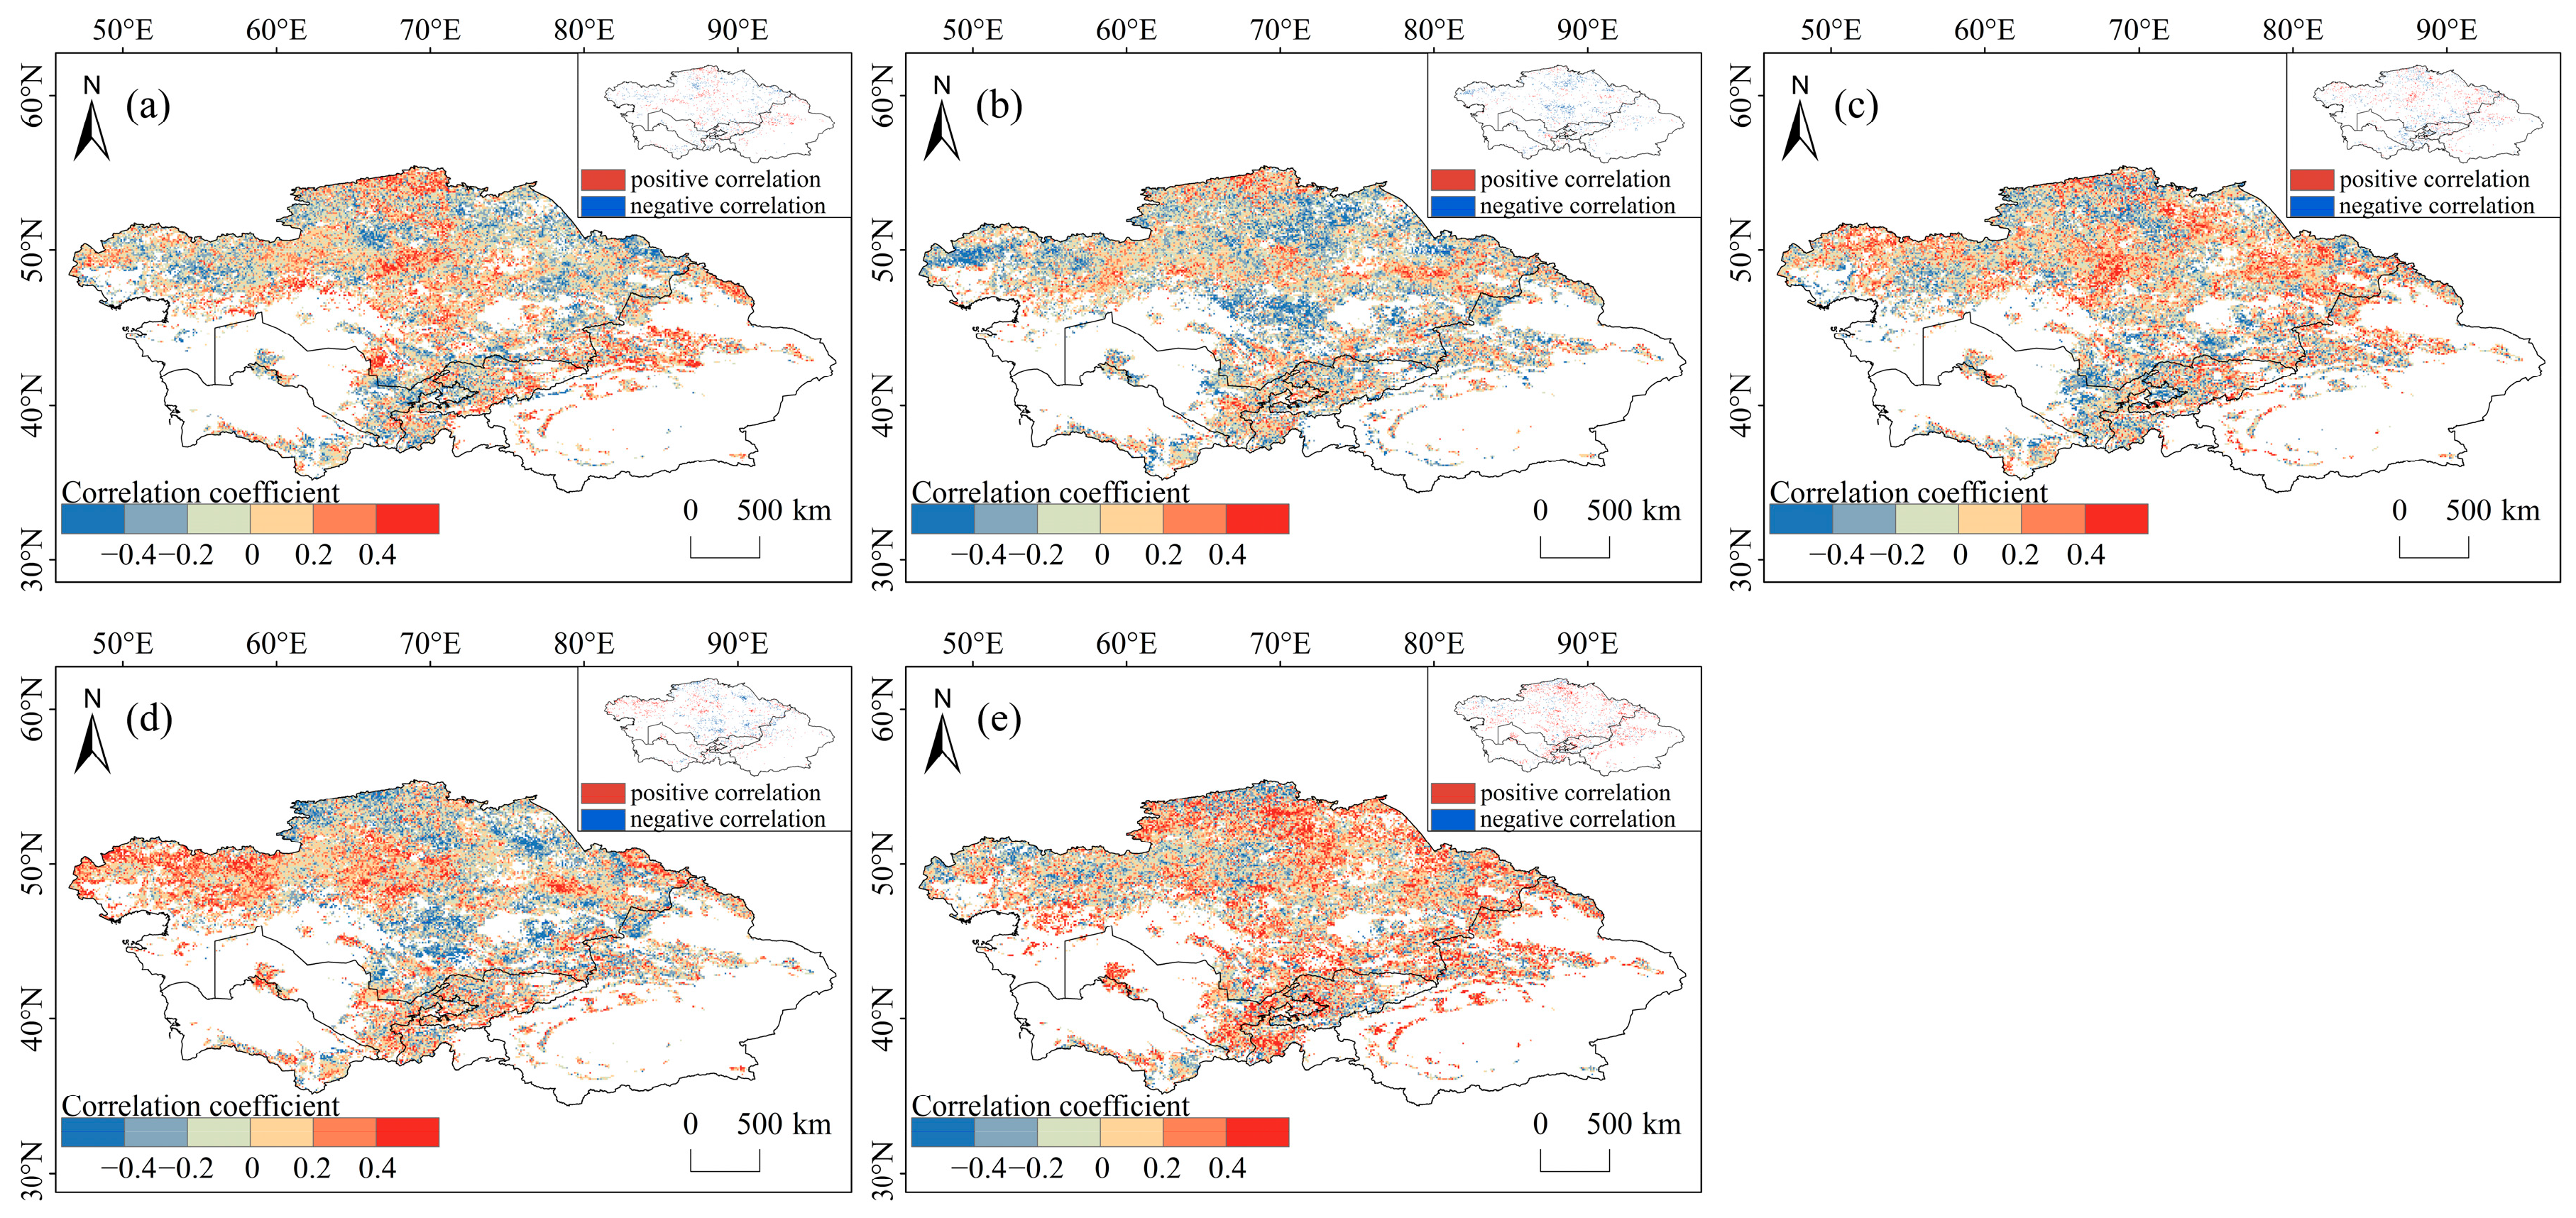
Partial correlation analysis showed that the direction of associations between CUE and various environmental and vegetation factors in Central Asia exhibited clear ecosystem differentiation (Figure 5). Across the entire Central Asian region, the proportions of pixels showing positive and negative partial correlations between CUE and temperature (TEM), soil moisture (SM), and vapor pressure deficit (VPD) were both close to 50%, but clear differences existed among ecosystems. In forest (FR), the proportion of negative correlations between TEM and CUE was the highest (70.2%), and the proportion of significant negative correlations was also the highest (10.7%). In contrast, in shrubland (SL), the proportion of positive correlations between TEM and CUE was relatively high (56.3%). In FR, the proportion of positive correlations between VPD and CUE was the highest (69.9%), with significant positive correlations accounting for 7.3% and significant negative correlations accounting for only 1.8%. Conversely, the proportion of negative correlations between VPD and CUE in SL reached 62.7%, with significant negative correlations accounting for 9.2%, the highest among all ecosystems. The proportion of negative correlations between SM and CUE was highest in SL (66.5%), with significant negative correlations reaching 7.3%; in contrast, the proportion of pixels with significant SM correlations in FR was the highest among all ecosystem types. Across the entire Central Asian region, the proportion of pixels showing a negative correlation between precipitation (PRE) and CUE was 62.2%, the highest negative association proportion among all influencing factors. Among different ecosystems, SL had the highest proportion of negative correlations (70.9%), with significant negative correlations accounting for 7.8%; the proportions of negative correlations in FR, cropland (CL), grassland (GL), and sparse vegetation (SV) were similar, ranging from 61.1% to 62.3%. In all ecosystems, the proportion of significant positive correlations with PRE did not exceed 1.5%. The proportion of pixels showing a positive correlation between leaf area index (LAI) and CUE across the entire Central Asian region was 59.4%, the highest positive association proportion among all environmental and vegetation factors. Among the ecosystems, FR and CL had the highest proportions of positive correlations (66.4% and 65.5%, respectively), and CL had the highest proportion of pixels with significant positive correlations (12.4%), ranking first among all ecosystems.
Figure 5.
(a–e) Partial correlation coefficients and their significance between carbon use efficiency (CUE) and temperature (TEM), precipitation (PRE), soil moisture (SM), vapor pressure deficit (VPD), and leaf area index (LAI) for Central Asia and each ecosystem type during 1999–2019. Insets in the upper right corner indicate areas with significant correlations (p < 0.05).
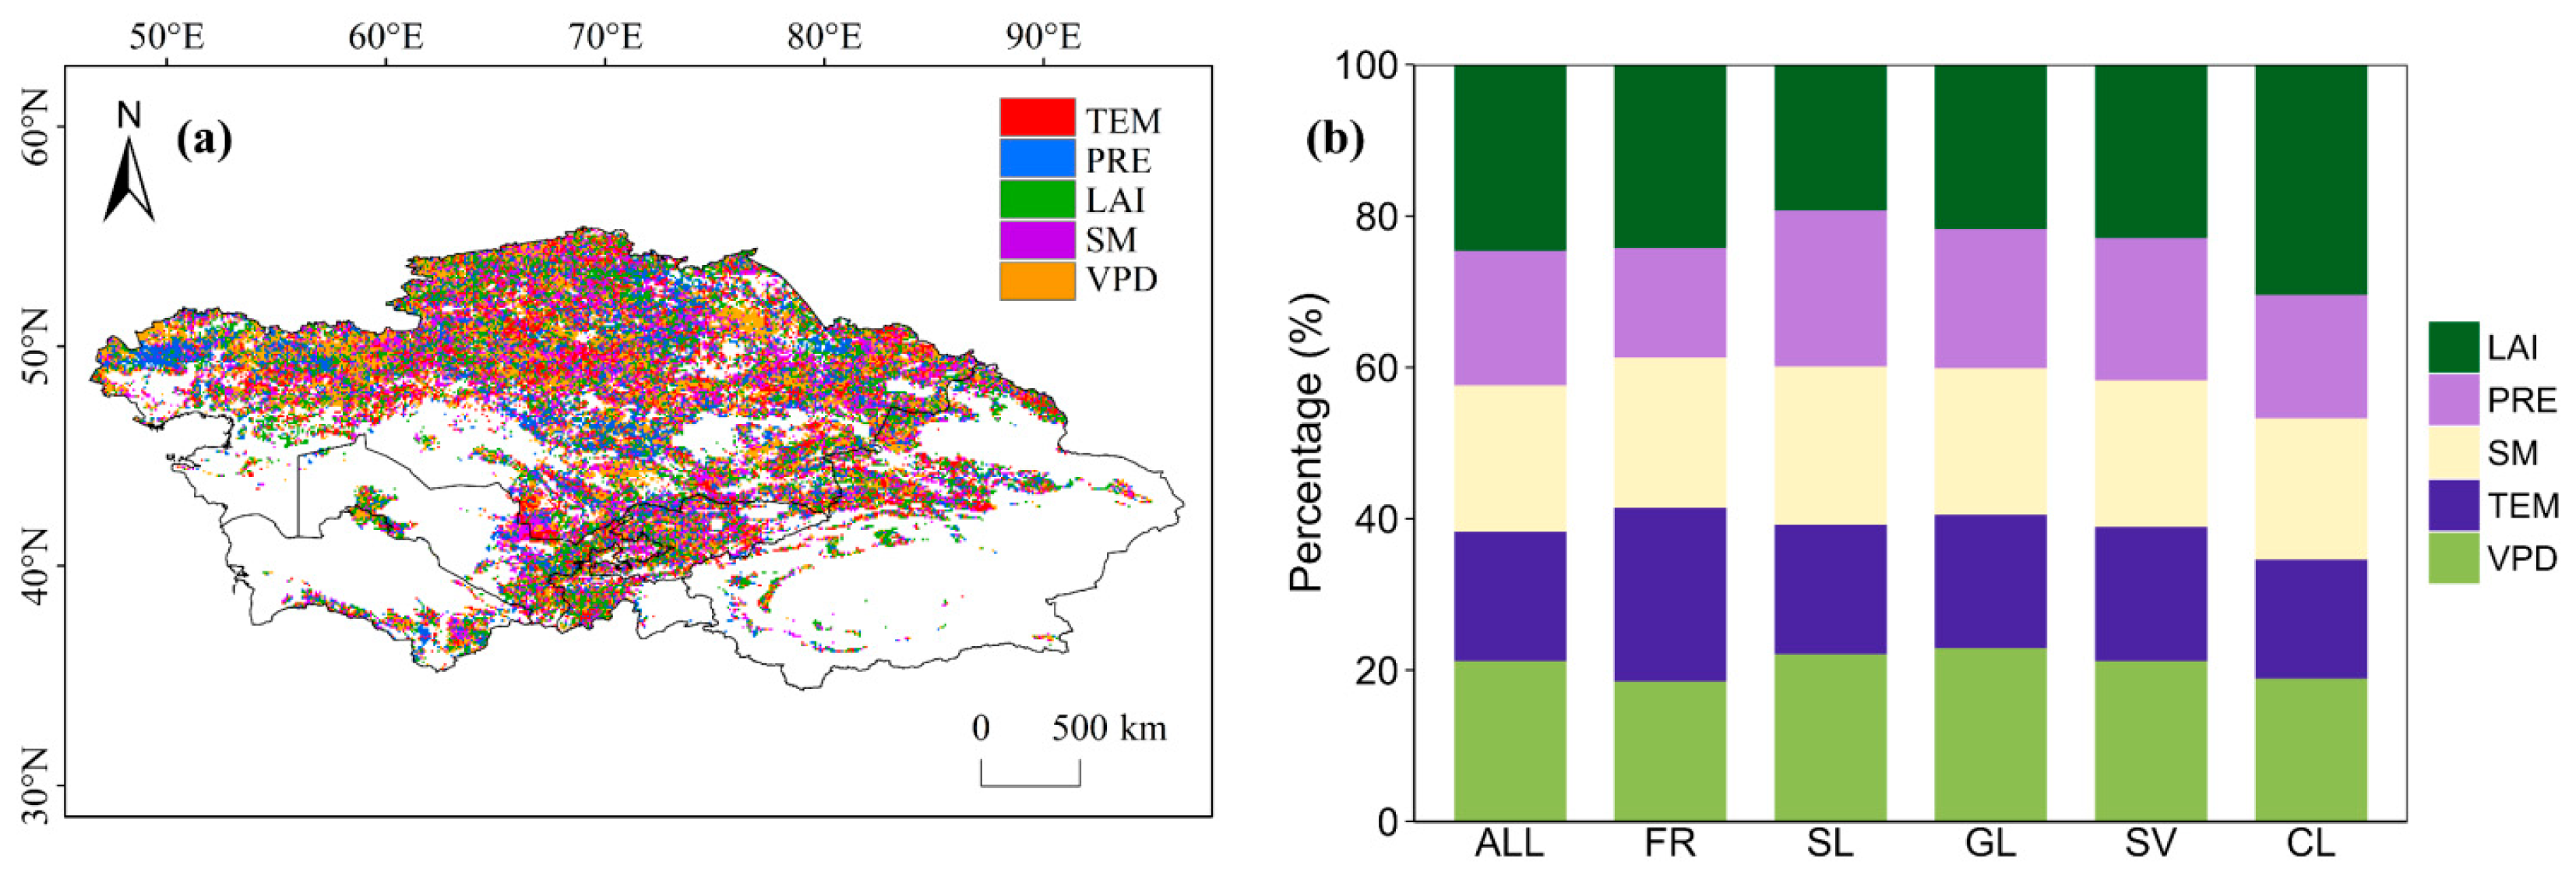
By comparing the absolute values of the partial correlation coefficients between each factor and CUE, the primary factor associated with CUE was identified pixel by pixel across Central Asia from 1999 to 2019 (Figure 6). Across the entire study area, LAI had the highest proportion of pixels as the primary associated factor (24.6%), followed by VPD and SM, whereas the proportions for TEM and PRE were relatively low, indicating that vegetation growth status and atmospheric moisture demand were more closely associated with CUE at the regional scale. The composition of primary associated factors differed significantly among ecosystems. In FR, LAI had the highest proportion of pixels as the primary associated factor (24.2%), while the proportion for TEM also reached 22.9%, reflecting the prominent association between temperature conditions and forest carbon use efficiency. The primary associated factors in SL were more evenly distributed, with similar proportions for VPD (22.1%), SM (20.9%), and PRE (20.6%), indicating that water supply and atmospheric evaporative demand were relatively balanced in their associations with CUE in arid environments. In both GL and SV, VPD and LAI were the main associated factors. Specifically, VPD was the primary associated factor in 22.9% of GL pixels, while LAI was the primary associated factor in 22.9% of SV pixels. SM accounted for approximately 19% in both ecosystem types, indicating that although SM is an important background condition, atmospheric aridity and leaf area dynamics are more strongly associated with CUE. In CL, LAI was the primary associated factor in up to 30.4% of pixels, far exceeding other factors and significantly higher than in other ecosystems. This is consistent with the fact that croplands are strongly regulated by anthropogenic management and that fluctuations in LAI directly reflect the photosynthetic carbon assimilation capacity of crops.
Figure 6.
(a) Spatial distribution of the primary factors associated with the interannual variation in CUE in Central Asia; (b) proportions of the primary associated factors among different ecosystem types.
3.3.2. Geographical Detector Analysis
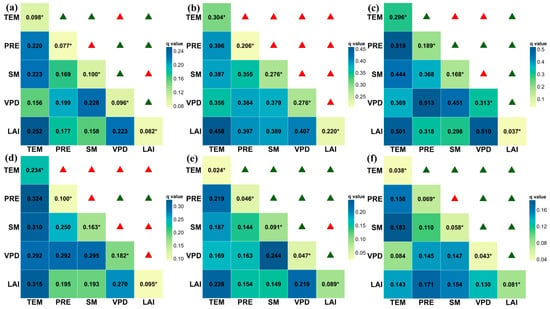
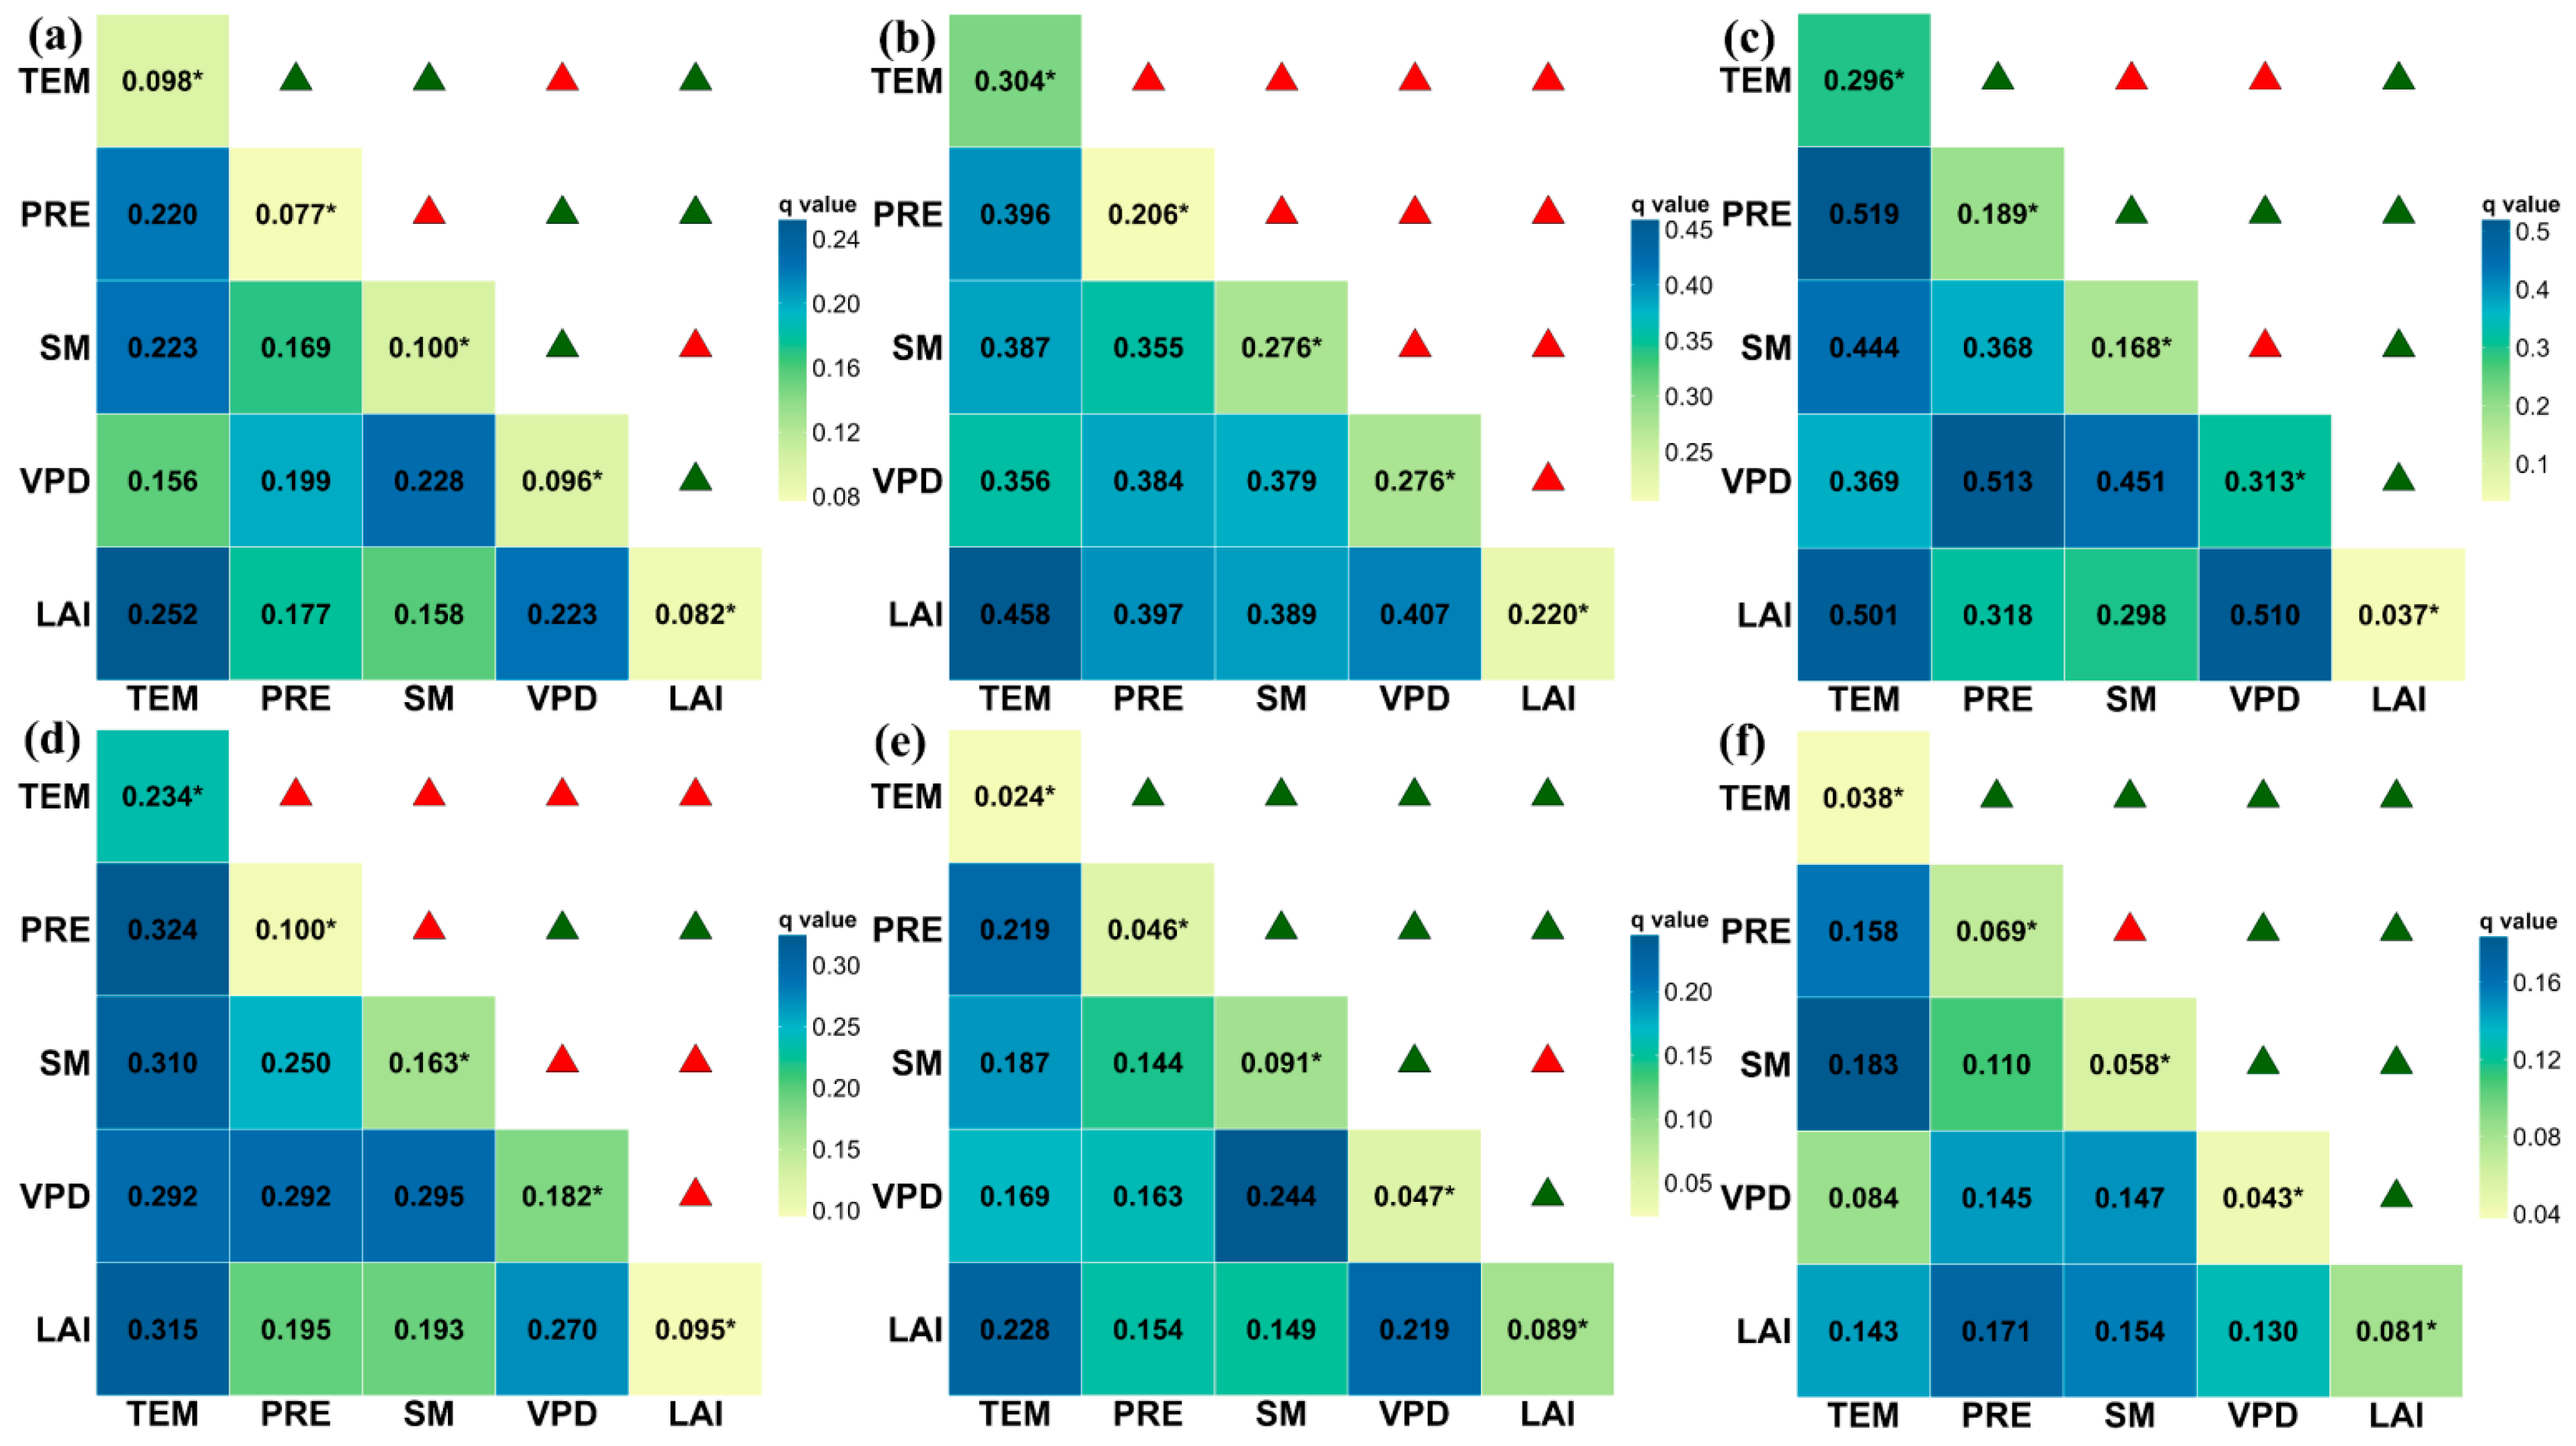
The geographical detector analysis (Figure 7) showed that the single-factor explanatory power for the spatial differentiation of CUE in Central Asia was generally low. SM, TEM, and VPD had similar explanatory power, slightly higher than that of LAI and PRE. Two-factor interactions markedly improved the explanatory power, with TEM ∩ LAI having the highest q value (0.252). Except for TEM ∩ VPD, PRE ∩ SM, and SM ∩ LAI, which exhibited bi-factor enhancement, all other combinations showed nonlinear enhancement. Among the different ecosystems, FR had relatively high single-factor explanatory power, with q values of 0.304 for TEM and 0.276 for both VPD and SM; all two-factor interactions exhibited bi-factor enhancement, with TEM ∩ LAI showing the highest explanatory power. In SL, VPD and TEM had relatively high explanatory power, with q values of 0.313 and 0.296, respectively. LAI alone had weak explanatory power, but TEM ∩ LAI and VPD ∩ LAI reached q values of 0.501 and 0.510, respectively, indicating that these variable combinations had high explanatory power for the spatial differentiation of CUE in SL. In GL, TEM was the single factor with the highest explanatory power, and interactions were dominated by bi-factor enhancement, among which TEM∩PRE had the highest q value (0.324), suggesting that combinations of TEM with moisture and vegetation factors had relatively high explanatory power. In SV, SM∩VPD had the highest interaction explanatory power (0.244), indicating that the spatial differentiation of CUE in SV was strongly associated with nonlinear interactions among multiple factors. In CL, TEM ∩ SM had the relatively highest q value (0.183), and most interaction combinations showed nonlinear enhancement. Across ecosystems, the rankings of single- and two-factor q values for the spatial differentiation of CUE differed. In FR, SL, and GL, single-factor q values were relatively high, with TEM and VPD having higher q values; in SV and CL, two-factor combinations generally had higher q values. In all ecosystems, two-factor q values were generally higher than single-factor q values, and nonlinear enhancement dominated in SV and CL. These differences represent differences in statistical explanatory power for the spatial differentiation of CUE, and the underlying ecological mechanisms require further analysis combined with process-based observations.
Figure 7.
(a–f) Factor detection results of the influencing factors on CUE for the entire Central Asian region and for FR, SL, GL, SV, and CL from 1999 to 2019. The diagonal shows single-factor detection; * indicates significance. The off-diagonals show interaction detection results; green triangles denote nonlinear enhancement, and red triangles denote bi-factor enhancement.
Overall, the primary factors associated with CUE differed markedly among ecosystems: across the entire region, LAI had the highest proportion of pixels as the primary associated factor; FR was strongly associated with TEM; SL showed relatively balanced associations with multiple moisture factors, including VPD, SM, and PRE; GL and SV were mainly associated with VPD and LAI; and CL was most prominently associated with LAI. The statistical explanatory power of two-factor interactions was generally higher than that of single factors, with TEM ∩ LAI and VPD ∩ LAI in SL having the highest explanatory power. This indicates that the spatial differentiation of CUE in Central Asia was not mainly explained by a single factor, but was better explained by ecosystem-specific climate–vegetation factor combinations.
4. Discussion
During the period from 1999 to 2019, the Central Asian region as a whole acted as a significant carbon sink. This positive carbon balance highlights the important role of Central Asia in the global carbon cycle and indicates that the region can contribute to the global carbon budget as a carbon sink. Spatially, the carbon cycle processes in Central Asia exhibited pronounced spatial heterogeneity. High values of GPP and NEP were mainly concentrated in low-elevation CL in the north, high-elevation FR, and high-elevation FR and GL in the central region. This pattern is related to the physiological characteristics of different ecosystems and their adaptive strategies to environmental conditions, and may also be closely associated with regional differences in hydrothermal conditions and the productivity potential of vegetation types [32]. Owing to its high biomass and growth potential, FR exhibited the highest GPP and NEP, consistent with the widely recognized view that forest ecosystems are important carbon sinks [33], but its CUE was not the highest. Although SL had lower GPP and NEP than other ecosystems, it exhibited the highest CUE (0.25), indicating that SL maintains its ecological functions through a conservative adaptive strategy. This may be related to the “conservative” water use strategy that SL has developed in arid and semi-arid environments, whereby water safety is prioritized and water loss is reduced under water-limited conditions, thereby favoring long-term carbon retention [34]. The well-developed deep root systems of plants enable them to access deep soil moisture and thereby maintain water supply during drought periods [35]. Overall, both GPP and NEP in Central Asia showed significant increasing trends. This regional-scale “greening” phenomenon is consistent with the globally widespread trend of increasing vegetation productivity [36]. In particular, SL exhibited the fastest growth rates of GPP and NEP, whereas its CUE showed a declining trend. This indicates that the relative growth rate of NEP in SL was lower than that of GPP, implying a declining proportion of productivity gains being converted into effective carbon storage. This decline in conversion efficiency may be attributable to the greater sensitivity of GPP than respiration to water stress [37].
LAI was the factor with the highest proportion of positive correlations. By regulating canopy radiation interception, LAI directly controls photosynthetic rate and is one of the key variables linking environmental drivers to carbon fluxes [38]. Water supply plays an important role in the carbon cycle of the arid and semi-arid regions of Central Asia [39]. In addition, shrubs in arid regions have evolved strategies that are highly adapted to long-term drought and sporadic precipitation. With increasing TEM, enhanced biological activity and a prolonged growing season promote GPP while possibly also increasing respiration rates [11], ultimately making the effect of TEM on CUE context-dependent and differing among systems. When VPD increases, stomatal conductance decreases, reducing CO2 exchange between leaves and the atmosphere and potentially lowering photosynthetic rate [40]; this mechanism is most prominent in SL. The associations between CUE and environmental and vegetation factors may differ among ecosystem types, and interactions among factors often exhibit nonlinear enhancement, with their combined effects potentially exceeding the simple sum of independent single-factor effects. Elevated VPD can limit photosynthetic rate by inducing stomatal closure, and areas with higher LAI have larger canopy transpiration areas and stronger evapotranspiration, which may exacerbate plant water deficit; the coupling of these two factors through the plant water conduction system may manifest as a nonlinear enhancement effect [41]. TEM and LAI may also jointly exert synergistic or antagonistic effects on CUE. In SL, the coupling between atmospheric aridity and vegetation leaf area appeared to play a relatively important role in the spatial differentiation of CUE. In FR and GL, TEM may be an important factor in interactions, and through synergism with LAI, VPD, and other factors, it may jointly influence the spatial pattern of CUE. In contrast, interactions in SV and CL mostly exhibited nonlinear enhancement, indicating that the spatial differentiation of CUE showed a relatively strong nonlinear association with combined fluctuations in moisture and atmospheric dryness, and that ecosystem vulnerability may therefore be more pronounced. Taken together, the above analysis indicates that high productivity does not necessarily represent high carbon fixation efficiency. In ecological restoration and land management in arid and semi-arid regions, attention should be paid to the protection and restoration of drought-tolerant shrub species [42].
Although this study explored the associations between GPP, NEP, and CUE and climate change in Central Asia, several limitations remain. The results are based on gridded data products, and their inherent uncertainties may have affected the accuracy of the quantified results. The lack of ground-based flux observations in Central Asia prevented validation and calibration. With respect to temporal limitations, although the 21-year period of this study covers the drought cycle fluctuations from 1999 to 2019, soil carbon pools generally require about 100 years to reach equilibrium; therefore, the study period may be insufficient to fully capture the long-term adjustment processes of carbon pools, and the lagged effects of extreme climate events on the carbon cycle are also difficult to fully assess. In addition, the factors mainly considered in this study did not fully account for human activities and other factors that may affect the carbon cycle. Future studies should incorporate irrigation ratios, grazing intensity, and land-use management data, or use residual methods to separate the contributions of climate and management to CUE.
5. Conclusions
- (1)
- During 1999–2019, Central Asia as a whole acted as a carbon sink. Annual mean GPP and NEP were 414.8 and 83.3 g C m−2, respectively, and both showed significant increasing trends, whereas the interannual variation in CUE remained essentially stable (mean = 0.17). This indicates that increased productivity was not synchronously translated into improved carbon use efficiency. Forest (FR) had the highest GPP and NEP, while shrubland (SL) had the highest CUE (0.25) but showed a declining trend, indicating that high productivity does not necessarily equate to high carbon use efficiency. In arid regions, carbon sink function depends more on respiratory consumption and carbon allocation strategies. SL may maintain relatively high CUE through conservative adaptive strategies, while also facing a potential risk of gradual weakening.
- (2)
- The statistical associations between CUE and environmental factors showed clear ecosystem differentiation. LAI was predominantly positively correlated with CUE, whereas PRE was predominantly negatively correlated. In FR, CUE was strongly associated with TEM; in SL, CUE was relatively evenly associated with multiple moisture-related factors, including PRE, SM, and VPD; GL and SV were more strongly associated with VPD and LAI; and CL showed a prominent association with LAI. Geographical detector analysis indicated that multi-factor combinations had greater explanatory power for the spatial differentiation of CUE than single factors, with nonlinear enhancement dominating in SV and CL. These results suggest that the spatial pattern of CUE is associated with different combinations of climatic and vegetation factors.
Author Contributions
F.Z.: formal analysis, visualization, writing—original draft; F.Y.: writing—review and editing, funding acquisition; X.Z. (Xinqian Zheng): writing—review and editing; Y.L. (Yongqiang Liu): writing—review and editing; T.W.: writing—review and editing; J.G.: writing—review and editing; P.H.: writing—review and editing; X.Z. (Xiannian Zheng): writing—review and editing; Y.L. (Yihan Liu): writing—review and editing; Y.Y.: writing—review and editing; Q.G.: writing—review and editing. All authors have read and agreed to the published version of the manuscript.
Funding
This work was supported by the Youth Innovation Team of China Meteorological Administration (CMA2024QN13), the Natural Science Foundation of Xinjiang Uygur Autonomous Region (2022D01E104), the China Postdoctoral Science Foundation (2025MD774146), and the S&T Development Fund of CAMS (2021KJ034).
Data Availability Statement
The original contributions presented in this study are included in the article Further inquiries can be directed to the corresponding author.
Conflicts of Interest
The authors declare no conflicts of interest.
References
- Friedlingstein, P.; O’Sullivan, M.; Jones, M.W.; Andrew, R.M.; Hauck, J.; Landschützer, P.; Le Quéré, C.; Li, H.; Luijkx, I.T.; Olsen, A.; et al. Global Carbon Budget 2024. Earth Syst. Sci. Data 2025, 17, 965–1039. [Google Scholar] [CrossRef] [Scilit]
- Ciais, P.; Tan, J.; Wang, X.; Roedenbeck, C.; Chevallier, F.; Piao, S.-L.; Moriarty, R.; Broquet, G.; Le Quéré, C.; Canadell, J.G.; et al. Five Decades of Northern Land Carbon Uptake Revealed by the Interhemispheric CO2 Gradient. Nature 2019, 568, 221–225. [Google Scholar] [CrossRef] [Scilit] [PubMed]
- Jian, J.; Bailey, V.; Dorheim, K.; Konings, A.G.; Hao, D.; Shiklomanov, A.N.; Snyder, A.; Steele, M.; Teramoto, M.; Vargas, R.; et al. Historically Inconsistent Productivity and Respiration Fluxes in the Global Terrestrial Carbon Cycle. Nat. Commun. 2022, 13, 1733. [Google Scholar] [CrossRef] [Scilit] [PubMed]
- Zhu, X.; Yu, G.; He, H.; Wang, Q.; Chen, Z.; Gao, Y.; Zhang, Y.; Zhang, J.; Yan, J.; Wang, H.; et al. Geographical Statistical Assessments of Carbon Fluxes in Terrestrial Ecosystems of China: Results from Upscaling Network Observations. Glob. Planet. Change 2014, 118, 52–61. [Google Scholar] [CrossRef] [Scilit]
- Lu, X.; Zhou, Y.; Liu, Y.; Le Page, Y. The Role of Protected Areas in Land Use/Land Cover Change and the Carbon Cycle in the Conterminous United States. Glob. Change Biol. 2018, 24, 617–630. [Google Scholar] [CrossRef] [Scilit] [PubMed]
- Yu, P.; Zhou, T.; Luo, H.; Liu, X.; Shi, P.; Zhang, Y.; Zhang, J.; Zhou, P.; Xu, Y. Global Pattern of Ecosystem Respiration Tendencies and Its Implications on Terrestrial Carbon Sink Potential. Earth’s Future 2022, 10, e2022EF002703. [Google Scholar] [CrossRef] [Scilit]
- Woodwell, G.M.; Whittaker, R.H.; Reiners, W.A.; Likens, G.E.; Delwiche, C.C.; Botkin, D.B. The Biota and the World Carbon Budget: The Terrestrial Biomass Appears to Be a Net Source of Carbon Dioxide for the Atmosphere. Science 1978, 199, 141–146. [Google Scholar] [CrossRef] [Scilit] [PubMed]
- Keenan, T.F.; Gray, J.; Friedl, M.A.; Toomey, M.; Bohrer, G.; Hollinger, D.Y.; Munger, J.W.; O’Keefe, J.; Schmid, H.P.; Wing, I.S.; et al. Net Carbon Uptake Has Increased through Warming-Induced Changes in Temperate Forest Phenology. Nat. Clim. Change 2014, 4, 598–604. [Google Scholar] [CrossRef] [Scilit]
- Piao, S.; Wang, X.; Park, T.; Chen, C.; Lian, X.; He, Y.; Bjerke, J.W.; Chen, A.; Ciais, P.; Tømmervik, H.; et al. Characteristics, Drivers and Feedbacks of Global Greening. Nat. Rev. Earth Environ. 2020, 1, 14–27. [Google Scholar] [CrossRef] [Scilit]
- Campbell, J.E.; Berry, J.A.; Seibt, U.; Smith, S.J.; Montzka, S.A.; Launois, T.; Belviso, S.; Bopp, L.; Laine, M. Large Historical Growth in Global Terrestrial Gross Primary Production. Nature 2017, 544, 84–87. [Google Scholar] [CrossRef] [Scilit] [PubMed]
- Fernández-Martínez, M.; Sardans, J.; Chevallier, F.; Ciais, P.; Obersteiner, M.; Vicca, S.; Canadell, J.G.; Bastos, A.; Friedlingstein, P.; Sitch, S.; et al. Global Trends in Carbon Sinks and Their Relationships with CO2 and Temperature. Nat. Clim. Change 2019, 9, 73–79. [Google Scholar] [CrossRef] [Scilit]
- Tan, Z.-H.; Zhang, Y.-P.; Liang, N.; Hsia, Y.-J.; Zhang, Y.-J.; Zhou, G.-Y.; Li, Y.-L.; Juang, J.-Y.; Chu, H.-S.; Yan, J.-H.; et al. An Observational Study of the Carbon-Sink Strength of East Asian Subtropical Evergreen Forests. Environ. Res. Lett. 2012, 7, 044017. [Google Scholar] [CrossRef] [Scilit]
- Liu, Z.; Chen, Z.; Yu, G.; Yang, M.; Zhang, W.; Zhang, T.; Han, L. Ecosystem Carbon Use Efficiency in Ecologically Vulnerable Areas in China: Variation and Influencing Factors. Front. Plant Sci. 2022, 13, 1062055. [Google Scholar] [CrossRef] [Scilit] [PubMed]
- Burrell, A.L.; Evans, J.P.; De Kauwe, M.G. Anthropogenic Climate Change Has Driven over 5 Million Km2 of Drylands towards Desertification. Nat. Commun. 2020, 11, 3853. [Google Scholar] [CrossRef] [Scilit] [PubMed]
- Zhang, L.; Xiao, J.; Zheng, Y.; Li, S.; Zhou, Y. Increased Carbon Uptake and Water Use Efficiency in Global Semi-Arid Ecosystems. Environ. Res. Lett. 2020, 15, 034022. [Google Scholar] [CrossRef] [Scilit]
- Gao, X.; Zhao, D. Impacts of Climate Change on Vegetation Phenology over the Great Lakes Region of Central Asia from 1982 to 2014. Sci. Total Environ. 2022, 845, 157227. [Google Scholar] [CrossRef] [Scilit] [PubMed]
- Huang, W.; Duan, W.; Chen, Y. Rapidly Declining Surface and Terrestrial Water Resources in Central Asia Driven by Socio-Economic and Climatic Changes. Sci. Total Environ. 2021, 784, 147193. [Google Scholar] [CrossRef] [Scilit] [PubMed]
- Sommer, R.; De Pauw, E. Organic Carbon in Soils of Central Asia—Status Quo and Potentials for Sequestration. Plant Soil 2011, 338, 273–288. [Google Scholar] [CrossRef] [Scilit]
- Yang, P.; Xia, J.; Chen, Y.; Zhang, Y.; Li, Z.; Zhang, S.; Wang, W. Dynamic Evolution of Recent Droughts in Central Asia Based on Microwave Remote Sensing Satellite Products. J. Hydrol. 2023, 620, 129497. [Google Scholar] [CrossRef] [Scilit]
- Shangguan, W.; Xiong, Z.; Nourani, V.; Li, Q.; Lu, X.; Li, L.; Huang, F.; Zhang, Y.; Sun, W.; Dai, Y. A 1 km Global Carbon Flux Dataset Using In Situ Measurements and Deep Learning. Forests 2023, 14, 913. [Google Scholar] [CrossRef] [Scilit]
- Zhang, K.; Wang, Y.; Mamtimin, A.; Liu, Y.; Gao, J.; Aihaiti, A.; Wen, C.; Song, M.; Yang, F.; Zhou, C.; et al. Temporal and Spatial Variations in Carbon Flux and Their Influencing Mechanisms on the Middle Tien Shan Region Grassland Ecosystem, China. Remote Sens. 2023, 15, 4091. [Google Scholar] [CrossRef] [Scilit]
- Guo, H.; Bao, A.; Liu, T.; Ndayisaba, F.; Jiang, L.; Zheng, G.; Chen, T.; De Maeyer, P. Determining Variable Weights for an Optimal Scaled Drought Condition Index (OSDCI): Evaluation in Central Asia. Remote Sens. Environ. 2019, 231, 111220. [Google Scholar] [CrossRef] [Scilit]
- Abatzoglou, J.T.; Dobrowski, S.Z.; Parks, S.A.; Hegewisch, K.C. TerraClimate, a High-Resolution Global Dataset of Monthly Climate and Climatic Water Balance from 1958–2015. Sci. Data 2018, 5, 170191. [Google Scholar] [CrossRef] [Scilit] [PubMed]
- Miralles, D.G.; Bonte, O.; Koppa, A.; Baez-Villanueva, O.M.; Tronquo, E.; Zhong, F.; Beck, H.E.; Hulsman, P.; Dorigo, W.; Verhoest, N.E.C.; et al. GLEAM4: Global Land Evaporation and Soil Moisture Dataset at 0.1° Resolution from 1980 to near Present. Sci. Data 2025, 12, 416. [Google Scholar] [CrossRef] [Scilit] [PubMed]
- Cao, S.; Li, M.; Zhu, Z.; Wang, Z.; Zha, J.; Zhao, W.; Duanmu, Z.; Chen, J.; Zheng, Y.; Chen, Y.; et al. Spatiotemporally Consistent Global Dataset of the GIMMS Leaf Area Index (GIMMS LAI4g) from 1982 to 2020. Earth Syst. Sci. Data 2023, 15, 4877–4899. [Google Scholar] [CrossRef] [Scilit]
- Li, X.; Du, H.; Zhou, G.; Mao, F.; Zhu, D.; Zhang, M.; Xu, Y.; Zhou, L.; Huang, Z. Spatiotemporal Patterns of Remotely Sensed Phenology and Their Response to Climate Change and Topography in Subtropical Bamboo Forests during 2001—2017: A Case Study in Zhejiang Province, China. GIScience Remote Sens. 2023, 60, 2163575. [Google Scholar] [CrossRef] [Scilit]
- Liu, Y.; Huang, T.; Qiu, Z.; Guan, Z.; Ma, X. Effects of Precipitation Changes on Fractional Vegetation Cover in the Jinghe River Basin from 1998 to 2019. Ecol. Inform. 2024, 80, 102505. [Google Scholar] [CrossRef] [Scilit]
- Sen, P.K. Estimates of the Regression Coefficient Based on Kendall’s Tau. J. Am. Stat. Assoc. 1968, 63, 1379–1389. [Google Scholar] [CrossRef]
- Cai, Y.; Zhang, F.; Duan, P.; Jim, C.Y.; Chan, N.W.; Shi, J.; Liu, C.; Wang, J.; Bahtebay, J.; Ma, X. Vegetation Cover Changes in China Induced by Ecological Restoration-Protection Projects and Land-Use Changes from 2000 to 2020. CATENA 2022, 217, 106530. [Google Scholar] [CrossRef] [Scilit]
- Wang, S.; Zhu, C.; Huang, Z.; Li, Y.; Cui, C.; Zhang, C. Primary Roles of Soil Evaporation and Vegetation in Driving Terrestrial Evapotranspiration across Global Drylands. Sci. Total Environ. 2025, 958, 178073. [Google Scholar] [CrossRef] [Scilit] [PubMed]
- Song, Y.; Wang, J.; Ge, Y.; Xu, C. An Optimal Parameters-Based Geographical Detector Model Enhances Geographic Characteristics of Explanatory Variables for Spatial Heterogeneity Analysis: Cases with Different Types of Spatial Data. GIScience Remote Sens. 2020, 57, 593–610. [Google Scholar] [CrossRef] [Scilit]
- Yang, R.; Yuan, H.; Du, R.; Zhou, L.; Wu, J.; Gao, L.; Mao, T. Temperature-VPD-Evapotranspiration Interactions Modulated Asynchronous Dynamics of Vegetation Photosynthesis and Net Ecosystem Production in Eurasia. Ecol. Indic. 2025, 174, 113445. [Google Scholar] [CrossRef] [Scilit]
- Gray, A.N.; Whittier, T.R. Carbon Stocks and Changes on Pacific Northwest National Forests and the Role of Disturbance, Management, and Growth. For. Ecol. Manag. 2014, 328, 167–178. [Google Scholar] [CrossRef] [Scilit]
- Driscoll, A.W.; Bitter, N.Q.; Ehleringer, J.R. Interactions among Intrinsic Water-Use Efficiency and Climate Influence Growth and Flowering in a Common Desert Shrub. Oecologia 2021, 197, 1027–1038. [Google Scholar] [CrossRef] [Scilit] [PubMed]
- Fan, Y.; Miguez-Macho, G.; Jobbágy, E.G.; Jackson, R.B.; Otero-Casal, C. Hydrologic Regulation of Plant Rooting Depth. Proc. Natl. Acad. Sci. USA 2017, 114, 10572–10577. [Google Scholar] [CrossRef] [Scilit] [PubMed]
- Zhu, Z.; Piao, S.; Myneni, R.B.; Huang, M.; Zeng, Z.; Canadell, J.G.; Ciais, P.; Sitch, S.; Friedlingstein, P.; Arneth, A.; et al. Greening of the Earth and Its Drivers. Nat. Clim. Change 2016, 6, 791–795. [Google Scholar] [CrossRef] [Scilit]
- Ma, L.; Qiao, C.; Du, L.; Tang, E.; Wu, H.; Shi, G.; Xue, B.; Wang, Y.; Lucas-Borja, M.E. Drought in the Middle Growing Season Inhibited Carbon Uptake More Critical in an Anthropogenic Shrub Ecosystem of Northwest China. Agric. For. Meteorol. 2024, 353, 110060. [Google Scholar] [CrossRef] [Scilit]
- Norton, A.J.; Bloom, A.A.; Parazoo, N.C.; Levine, P.A.; Ma, S.; Braghiere, R.K.; Smallman, T.L. Improved Process Representation of Leaf Phenology Significantly Shifts Climate Sensitivity of Ecosystem Carbon Balance. Biogeosciences 2023, 20, 2455–2484. [Google Scholar] [CrossRef] [Scilit]
- Yu, T.; Jiapaer, G.; Bao, A.; Zheng, G.; Zhang, J.; Li, X.; Yuan, Y.; Huang, X.; Umuhoza, J. Disentangling the Relative Effects of Soil Moisture and Vapor Pressure Deficit on Photosynthesis in Dryland Central Asia. Ecol. Indic. 2022, 137, 108698. [Google Scholar] [CrossRef] [Scilit]
- Johnston, M.R.; Barnes, M.L.; Preisler, Y.; Smith, W.K.; Biederman, J.A.; Scott, R.L.; Williams, A.P.; Dannenberg, M.P. Effects of Hot Versus Dry Vapor Pressure Deficit on Ecosystem Carbon and Water Fluxes. J. Geophys. Res. Biogeosci. 2025, 130, e2024JG008146. [Google Scholar] [CrossRef] [Scilit]
- Yuan, W.; Tian, J.; Wang, M.; Wang, S.; Xu, W.; Wang, Y.; Fu, Z.; Girardin, M.P.; Green, J.K.; Zhou, S.; et al. Impacts of Rising Atmospheric Dryness on Terrestrial Ecosystem Carbon Cycle. Nat. Rev. Earth Environ. 2025, 6, 712–727. [Google Scholar] [CrossRef] [Scilit]
- Maestre, F.T.; Eldridge, D.J.; Soliveres, S.; Kéfi, S.; Delgado-Baquerizo, M.; Bowker, M.A.; García-Palacios, P.; Gaitán, J.; Gallardo, A.; Lázaro, R.; et al. Structure and Functioning of Dryland Ecosystems in a Changing World. Annu. Rev. Ecol. Evol. Syst. 2016, 47, 215–237. [Google Scholar] [CrossRef] [Scilit] [PubMed]
Disclaimer/Publisher’s Note: The statements, opinions and data contained in all publications are solely those of the individual author(s) and contributor(s) and not of MDPI and/or the editor(s). MDPI and/or the editor(s) disclaim responsibility for any injury to people or property resulting from any ideas, methods, instructions or products referred to in the content. |
© 2026 by the authors. Licensee MDPI, Basel, Switzerland. This article is an open access article distributed under the terms and conditions of the Creative Commons Attribution (CC BY) license.