


Abstract
Rainfall-induced landslides along Malaysian highway cut slopes are commonly evaluated using empirical thresholds, with limited consideration of cumulative antecedent rainfall. This study evaluates a machine-learning rainfall threshold for five documented shallow-slope failures along Federal Route FT185 (Jalan Simpang Pulai–Blue Valley), Perak, Malaysia, using 520 site-days of daily rainfall records. Cumulative rainfall was calculated over seven windows (1, 3, 5, 7, 14, 21 and 30 days), together with a short-burst intensity feature and a wet-day count and six classifiers (logistic regression, Random Forest, Gradient Boosting, k-nearest neighbours, a support vector machine and XGBoost) were trained under class-weighted, leave-one-site-out cross-validation. Random Forest achieved the best discrimination (ROC-AUC = 0.817), with 80% sensitivity and 90% specificity. Antecedent rainfall consistently ranked above same-day rainfall, indicating the importance of longer-duration rainfall accumulation in the present dataset. An interpretable two-feature logistic regression boundary (14-day antecedent rainfall vs. same-day rainfall) and Random Forest partial-dependence saturation points (approximately 203, 330 and 447 mm for the 14-, 21- and 30-day windows) were derived and combined into a two-tier watch/warning rainfall-probability threshold. The results provide preliminary, site-specific rainfall thresholds for the investigated corridor within a pilot methodological framework requiring prospective validation with additional independent failure events before operational application.
1. Introduction
Rainfall-induced landslides are among the most frequent and economically damaging natural hazards along mountainous and hilly transportation corridors in the humid tropics. Rainfall thresholds have supported landslide early-warning systems (LEWSs) worldwide for over four decades, as rainfall infiltration increases pore-water pressure and contributes to shallow-slope failures [1]. The original global intensity–duration (I–D) threshold of Caine [1] and its subsequent update by Guzzetti et al. [2] established the now-standard power-law form relating triggering rainfall intensity to storm duration, and this approach has since been adapted at national and regional scale in dozens of settings [3]. In humid tropical settings, rainfall intensity and duration alone may not adequately predict landslides, as soils can accumulate pore-water pressure over longer periods, making cumulative antecedent rainfall an important predictor [3,4].
Peninsular Malaysia and the Cameron Highlands plateau form a well-documented landslide hotspot where steep terrain, intensive hillside agriculture and tourism development, and a year-round monsoon-influenced rainfall regime combine to produce frequent shallow failures along both public roads and highways [5,6]. Federal Route FT185 (Jalan Simpang Pulai–Blue Valley), the main road connecting the Simpang Pulai interchange on the North–South Expressway to the Cameron Highlands townships, has a long history of rainfall-triggered slope failures that periodically close the route and endanger road users [6]. Reviews of the Malaysian landslide-susceptibility literature show that GIS-based susceptibility mapping is comparatively mature in Malaysia, whereas quantitative, data-driven rainfall-threshold studies specific to Malaysian slopes remain limited [7]. Complementary geotechnical studies of Malaysian residual soils show that rainfall infiltration behaviour in these profiles is strongly influenced by antecedent wetness and cover conditions, reinforcing the physical case for considering antecedent rainfall, rather than single-storm, threshold formulations in this setting [8,9].
Over the past five years, machine learning (ML) has been increasingly applied to rainfall-threshold and landslide-prediction problems, motivated by its ability to combine multiple rainfall-related predictors, capture nonlinear failure responses and output continuous failure probabilities rather than a single binary curve [10,11]. Menon and Kolathayar [12] compared five classifiers (k-nearest neighbours, Random Forest, logistic regression, Gradient Boosting and a support vector machine) on a 64-event inventory from Kerala, India, and found k-NN achieved the best discrimination (ROC-AUC = 0.90), while support vector machines could achieve high precision for landslide prediction but often showed reduced recall, which is important when evaluating limited landslide inventories. At the regional scale, Nocentini et al. [13] combined cumulative-rainfall variables spanning 1–30 days with Random Forest to build a dynamic, pixel-level landslide-probability model for Kvam, Norway, and found that systematically varying the non-landslide: landslide sampling ratio (from 1× to 100×) was important for controlling false positives. Shao et al. [14] trained XGBoost, Random Forest, LightGBM and logistic regression on a national-scale Italian inventory and used SHAP explainability to show that total event rainfall dominated feature importance by roughly an order of magnitude over other variables. Dal Seno et al. [15] directly compared four conventional statistical methods (Bayesian, frequentist, percentile and linear discriminant analysis) against seven ML methods on an 18:1 imbalanced Emilia-Romagna dataset, finding that XGBoost improved F2-score and false-alarm count over the operational Bayesian baseline. However, adding antecedent-rainfall parameters beyond simple intensity–duration gave only modest incremental gains. Most directly comparable to the present study, Franceschini et al. [16] applied Random Forest with partial-dependence-based explainability to a single, well-instrumented deep-seated landslide in Cazzaso, Italy and found that a roughly week-scale (7–9 day) cumulative-rainfall window, rather than daily rainfall, carried the most predictive importance, a finding echoed in the results reported in Section 3 of this study.
Beyond threshold derivation, several recent studies have moved toward full operational LEWS architecture. Segoni et al. [17] described a prototype national-scale landslide nowcasting system for Italy that fused rainfall thresholds with risk indicators, and Liu et al. [18] developed a slope-unit-based regional early-warning model for Chongqing, China, that coupled rainfall thresholds with susceptibility zoning. Alternative threshold-derivation strategies continue to be explored alongside ML approaches: Dixit et al. [19] derived intensity–duration thresholds from physically based numerical debris-flow models for a Himalayan debris-flow catchment, and Barthélemy et al. [20] recently re-derived a regional rainfall threshold for the Alpes-Maritimes, France, providing an additional cross-climate benchmark for the threshold values obtained here. Low-cost IoT hydrological sensor networks are increasingly proposed to densify rainfall and soil-moisture monitoring in landslide-prone terrain [21], offering one practical route toward the additional, better-instrumented events needed to validate ML rainfall thresholds of the kind developed in this study.
Landslide inventories typically contain relatively few failure events, making class imbalance a recurring methodological challenge in landslide studies. Reported strategies include perfectly balanced random undersampling of non-triggering days [12,16], systematic multi-ratio imbalance testing [13], synthetic oversampling applied to training data (SMOTE, SMOTE-Tomek, SMOTE-ENN) [22,23,24] and cost-sensitive class-weighting combined with recall-prioritizing metrics such as the F2-score [15]. Explainable-AI techniques, including SHAP values and partial dependence plots, are increasingly used to translate a trained classifier’s internal logic into a physically interpretable, reportable threshold curve or saturation point [14,16,25,26], and were adopted for that purpose in Section 2.5 and Section 3.5 of this study. Deep-learning and computer-vision approaches, including convolutional neural networks, vision transformers, time-series and multi-task architectures, are expanding landslide prediction capabilities [27,28,29], with their application generally benefiting from larger datasets. Finally, because rainfall thresholds are sensitive to changing climatic conditions, recent regional hydro-climatic projections for Peninsular Malaysia indicating changing wet- and dry-spell characteristics under CMIP6 scenarios [30] are an important caveat for the long-term validity of any threshold calibrated on a short historical record and are revisited in the Discussion.
This study addresses two specific gaps identified above: (i) the scarcity of quantitative, data-driven rainfall-threshold studies for Malaysian slopes relative to susceptibility-mapping studies [7]; and (ii) the general literature finding that multi-window antecedent rainfall, rather than single-storm intensity–duration, is often the stronger predictor in tropical, deeply weathered residual-soil settings [3,4,9], which has not previously been quantified with machine learning for a Malaysian case. Using five documented shallow-slope failures along FT185, this study aims to (1) engineer cumulative antecedent-rainfall features over seven time windows; (2) train and cross-validate six machine-learning classifiers under a leave-one-site-out design appropriate to a very small event inventory; (3) derive an explicit, interpretable probabilistic threshold using logistic regression boundary curves and Random Forest partial dependence; and (4) propose a two-tier rainfall-probability warning threshold, discussed against the wider literature reviewed above. Given the currently limited number of documented failure events, the analysis is framed throughout as a pilot methodological framework for deriving and testing rainfall-probability thresholds, intended to be strengthened by additional events as they are documented rather than treated as an immediately deployable operational design standard.
Previous studies have incorporated antecedent rainfall into machine-learning frameworks [12,13], while more recent work has demonstrated the use of Random Forest and partial-dependence analysis to identify influential cumulative-rainfall periods and derive rainfall thresholds for a monitored deep-seated landslide in Italy [16]. Comparable applications, however, remain limited in tropical settings. The present study provides a quantitative, machine-learning-derived rainfall-probability threshold calibrated specifically for a documented Malaysian slope-failure inventory, as distinct from the GIS-based susceptibility-mapping studies that dominate the Malaysian and Cameron Highlands literature [5,6,7]. This setting also motivates a threshold framework different from those developed for temperate climates: the equatorial, monsoon-influenced rainfall regime is distributed throughout the year rather than concentrated in discrete storm events, and the deeply weathered granitic and metasedimentary residual soils along FT185 can sustain pore-water-pressure build-up over multi-week, rather than multi-day, timescales [8,9]. This physical contrast provides the rationale for evaluating multiple antecedent-rainfall windows rather than directly adopting an intensity–duration or single-window threshold for this corridor, and it also provides a basis for interpreting the comparatively high cumulative-rainfall values obtained here relative to thresholds reported for temperate study areas.
2. Materials and Methods
2.1. Study Area
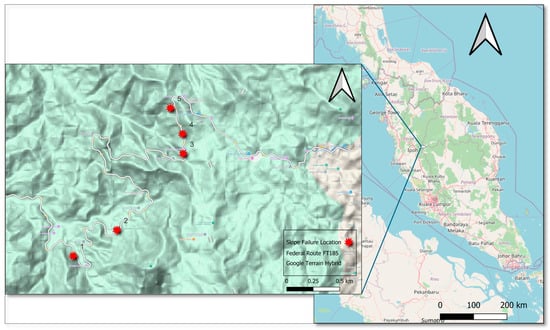
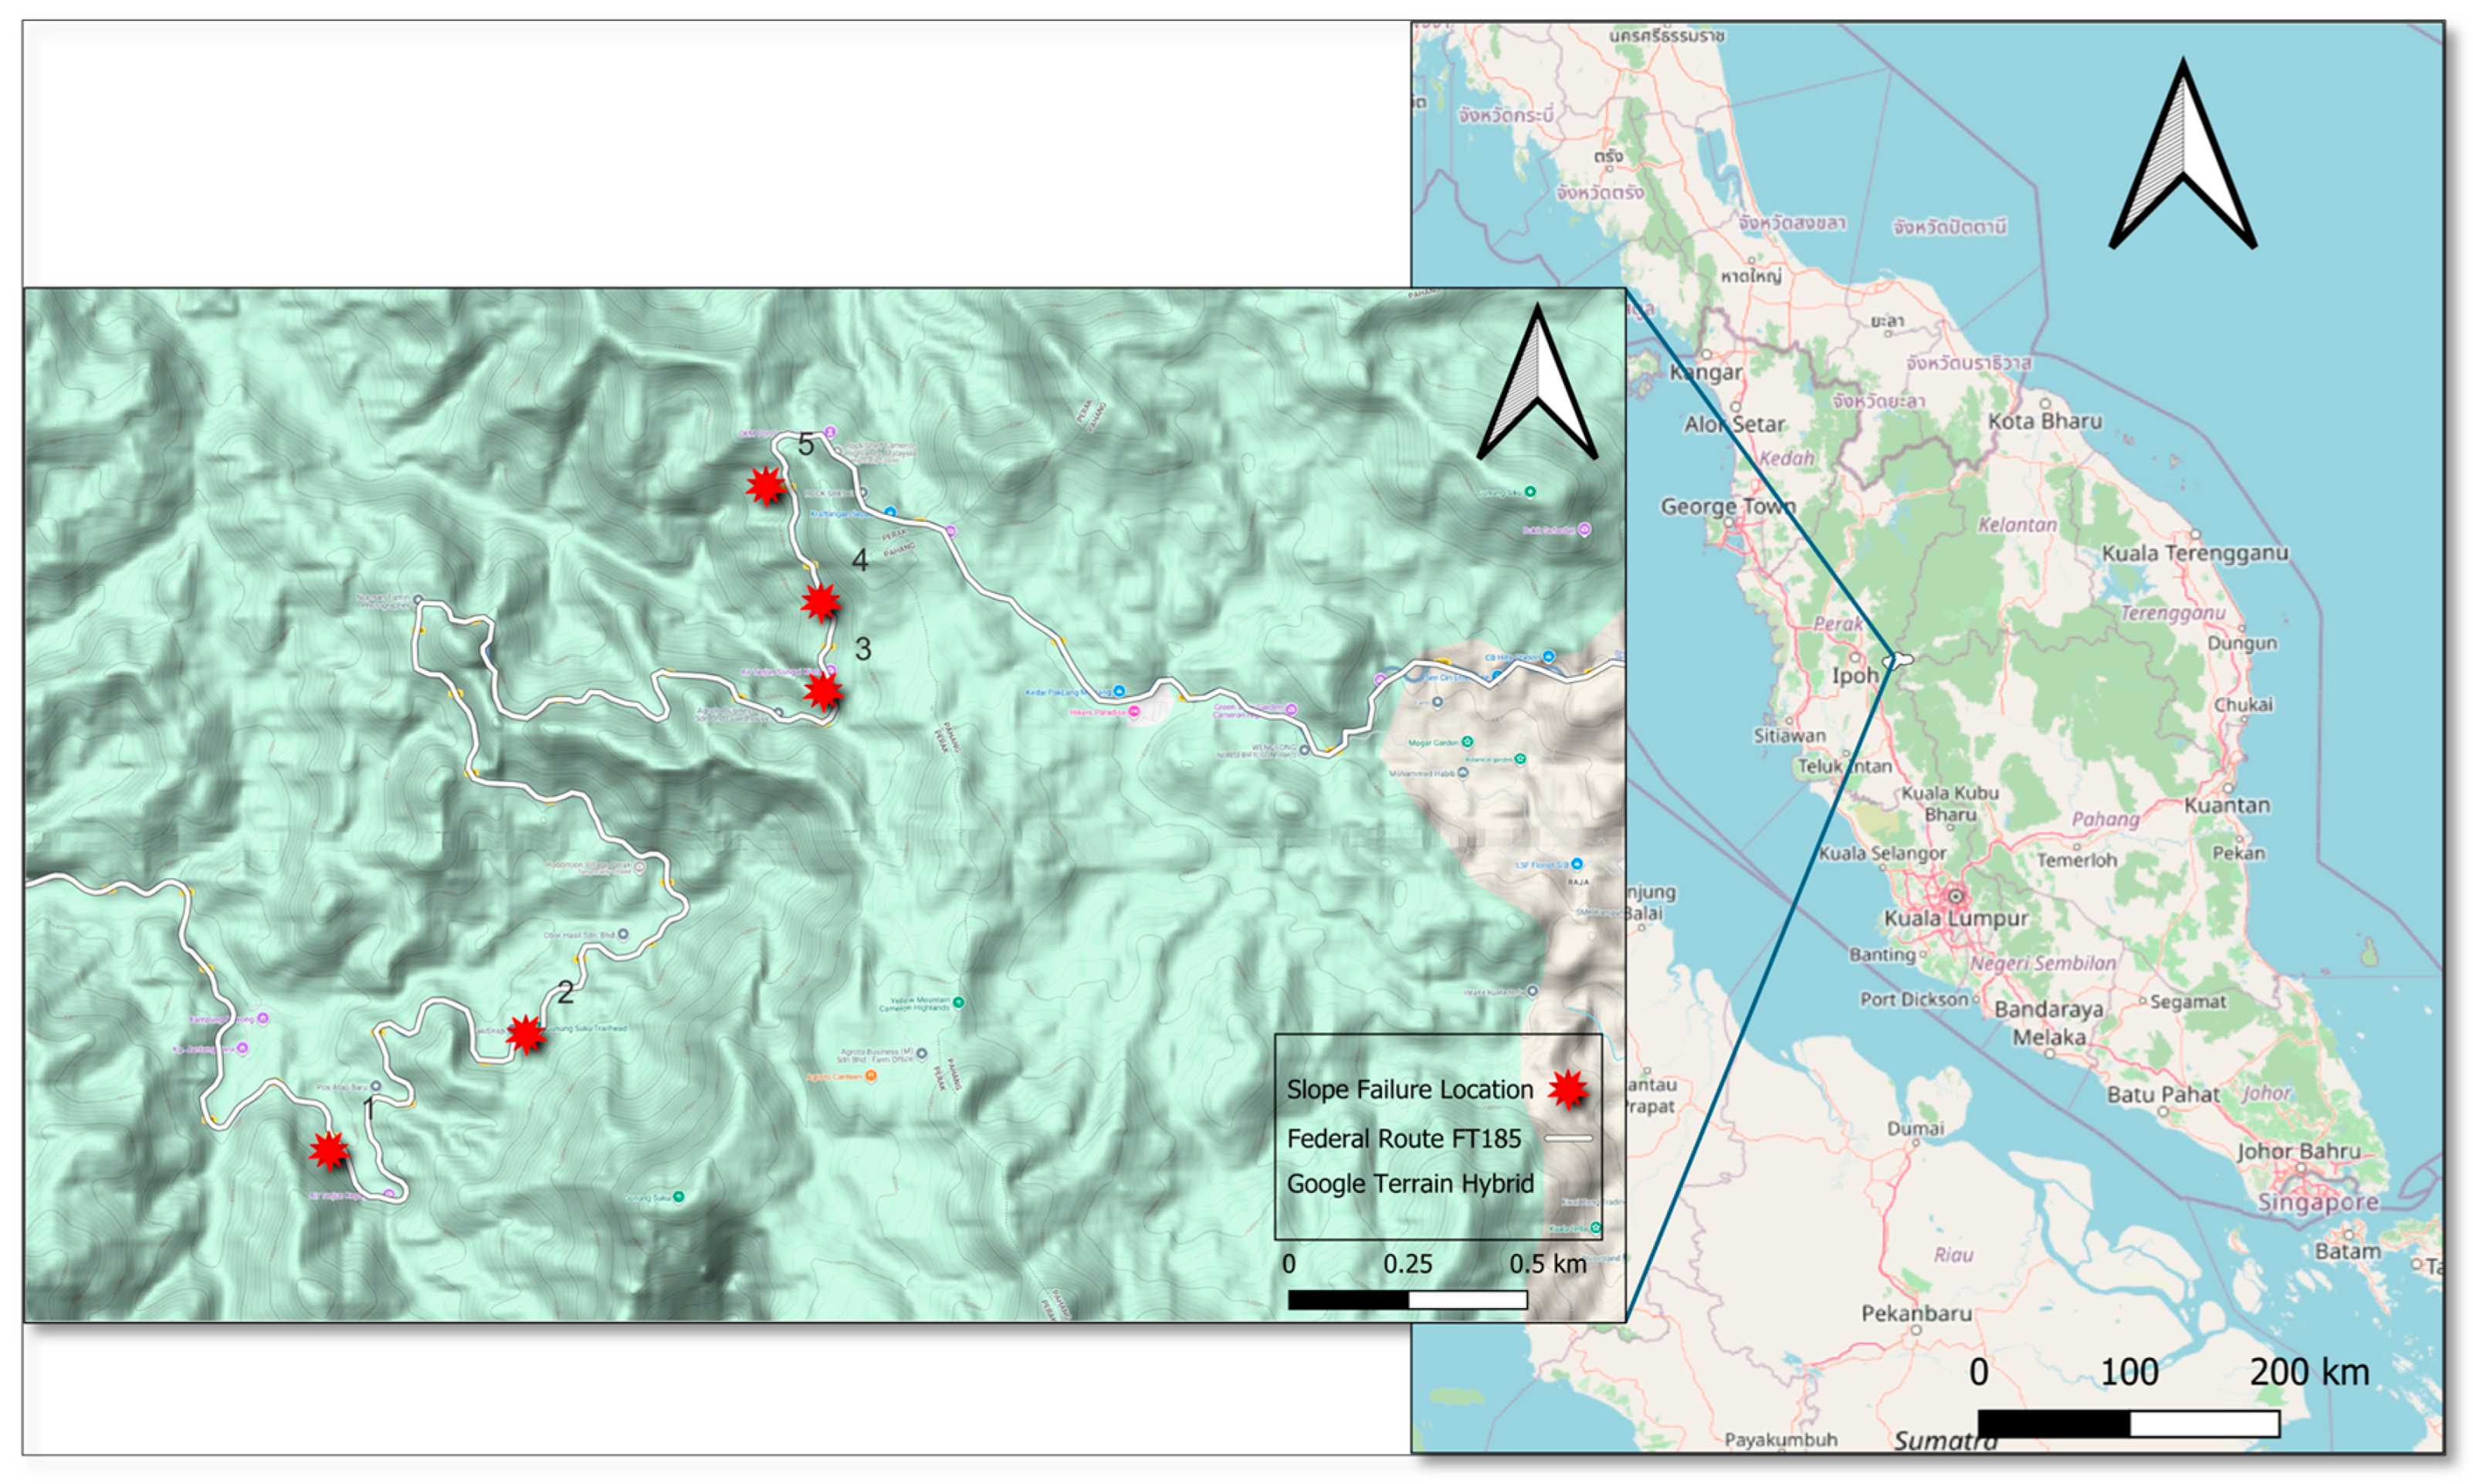
The study area is located along Federal Route FT185 (Jalan Simpang Pulai–Blue Valley) in Kinta District, Perak, Peninsular Malaysia (Figure 1). The study corridor extends from the vicinity of Simpang Pulai at approximately 4.5301° N, 101.1314° E eastward toward Blue Valley at approximately 4.5829° N, 101.4079° E. FT185 traverses mountainous terrain toward the Perak–Pahang boundary and provides one of the principal road connections between the Kinta lowlands and the Cameron Highlands region. The investigated slope sites are distributed along this corridor within the approximate geographical extent of 4.53–4.59° N and 101.13–101.41° E. The route is characterized by steep terrain and engineered cut slopes, with several sections having experienced slope instability and landslide occurrences.
Figure 1.
Location of the five investigated slope sites along Federal Route FT185 (Jalan Simpang Pulai–Blue Valley), Kinta District, Perak, Peninsular Malaysia. The FT185 study corridor extends approximately from 4.5301° N, 101.1314° E near Simpang Pulai to 4.5829° N, 101.4079° E near Blue Valley.
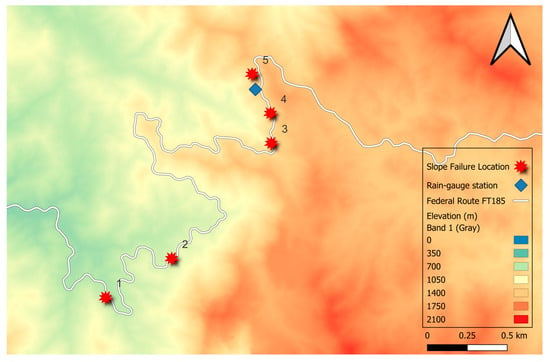
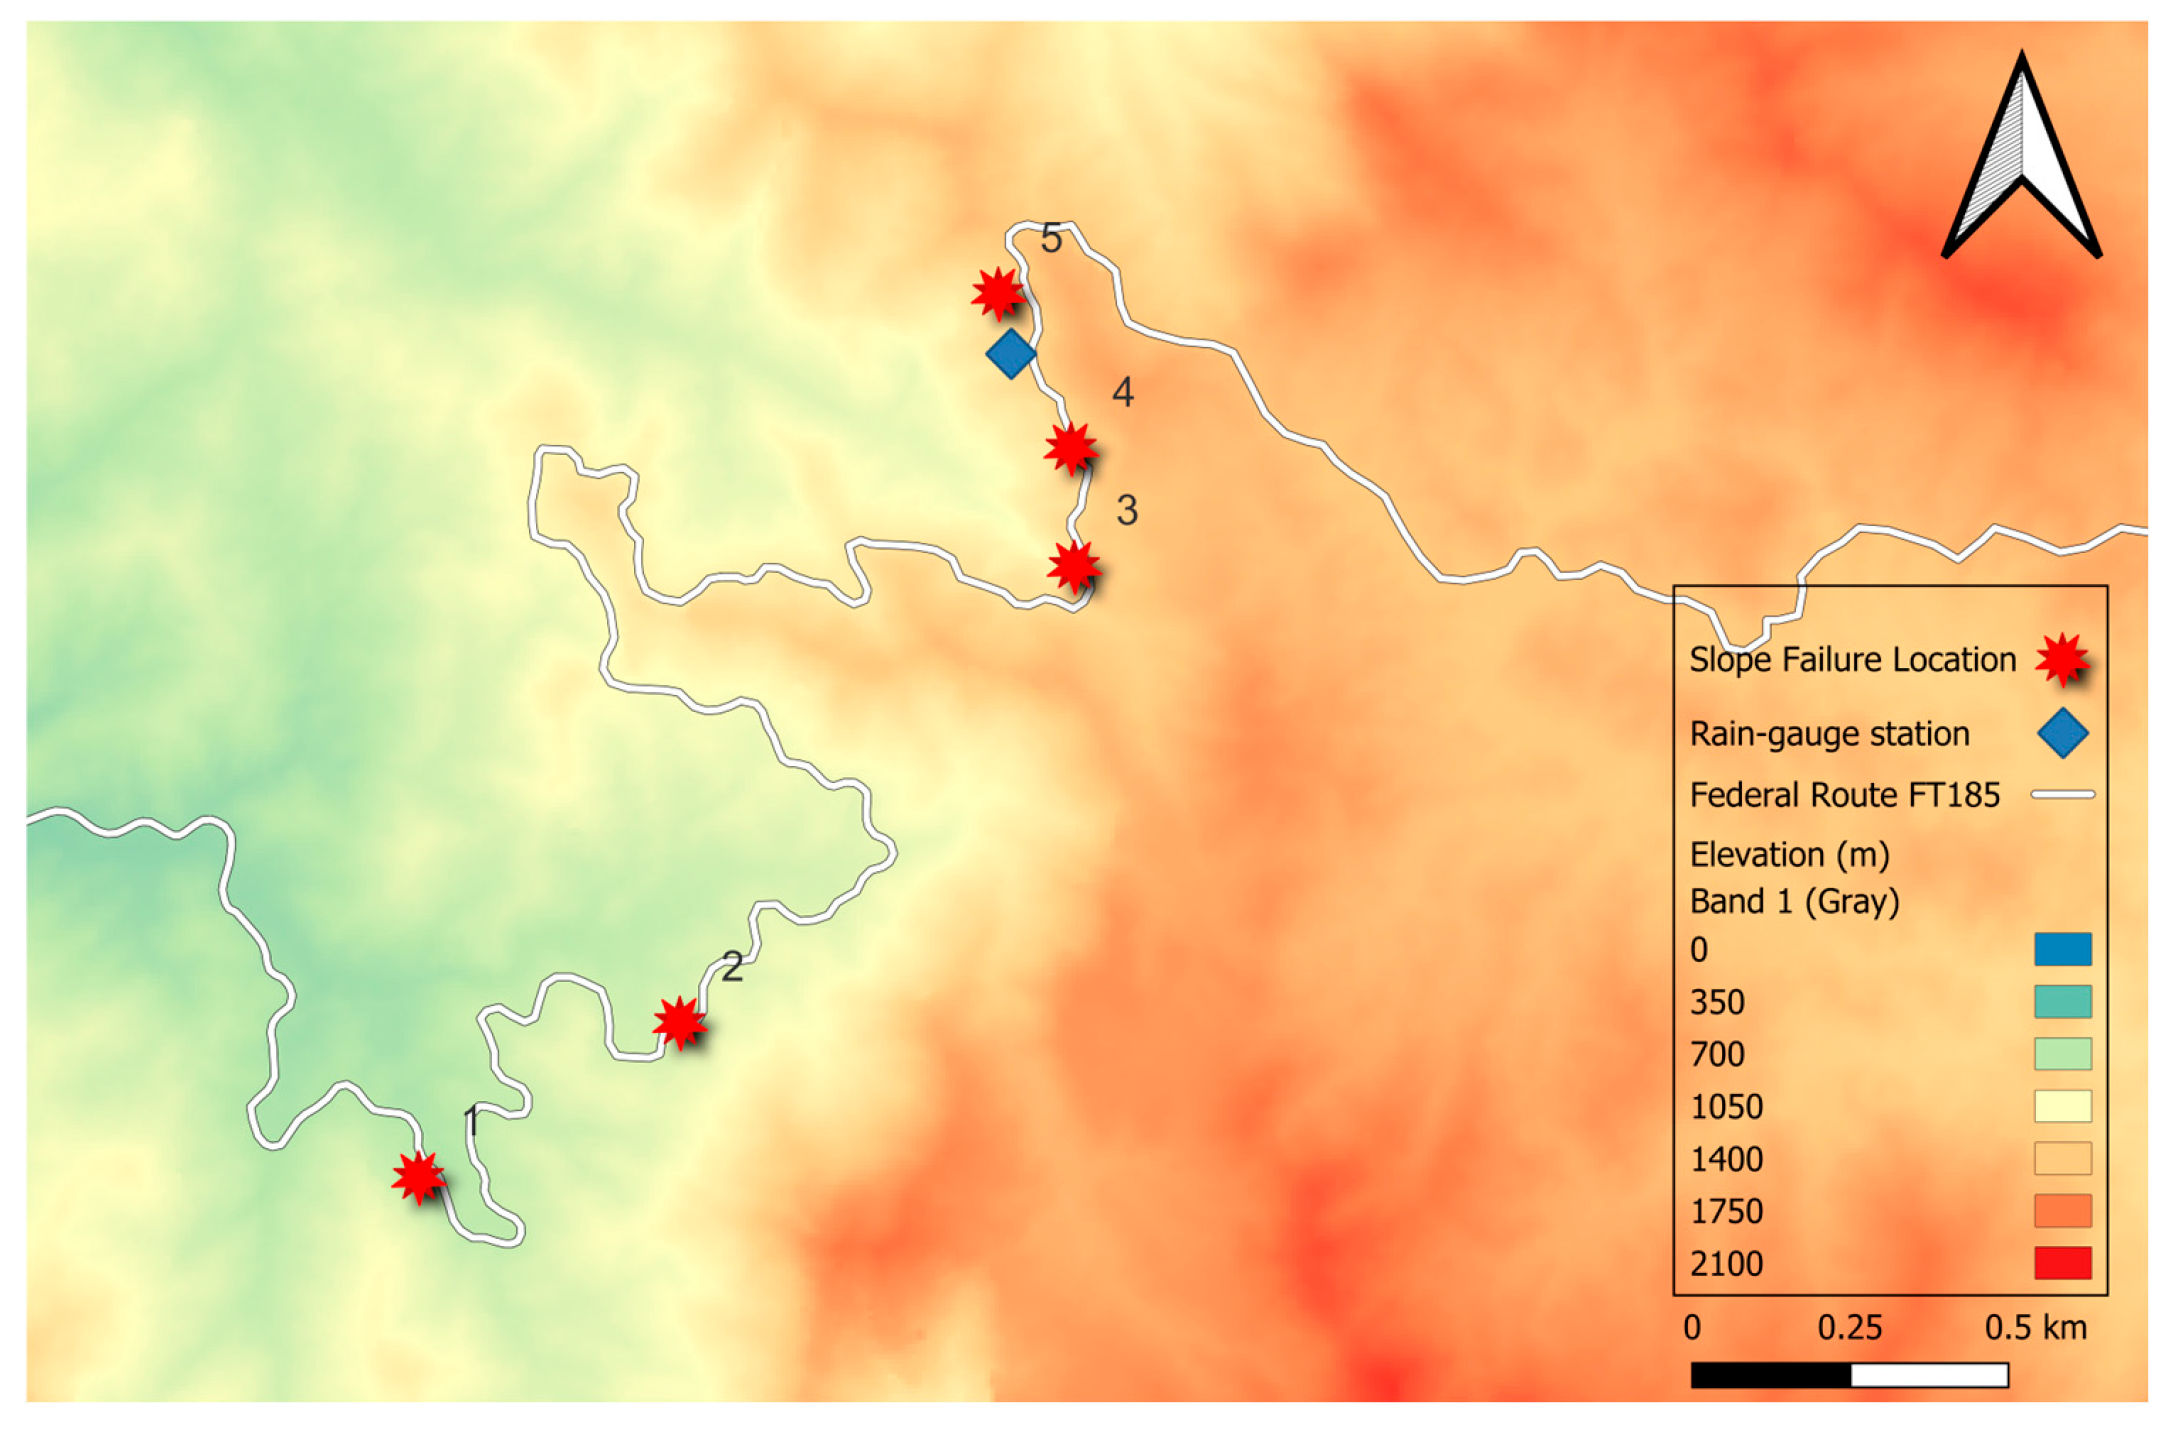
The study area comprises five slope-failure locations along Federal Route FT185 (Jalan Simpang Pulai–Blue Valley), which climbs from the Simpang Pulai interchange near Ipoh, Perak, into the Cameron Highlands plateau (Figure 1). The route traverses steep, forested and partly agricultural terrain underlain by granitic and metasedimentary bedrock (Figure 2) weathered to considerable depth, producing thick, low-cohesion residual soil covers that are widely documented as susceptible to shallow, rainfall-triggered failure in this region [5,6,8]. The climate is equatorial, with rainfall distributed across the year but modulated by the Northeast and Southwest monsoon transitions, producing prolonged wet spells capable of driving deep antecedent soil saturation as well as short, high-intensity convective bursts. The five study sites, identified by their route chainage, Site 1 (KM 27.1), Site 2 (KM 31.6), Site 3 (KM 43.4), Site 4 (KM 43.9) and Site 5 (KM 45) each experienced a documented shallow-slope failure between 2019 and 2024 (Table 1).
Figure 2.
Location map of the five slope-failure sites along Federal Route FT185 (Jalan Simpang Pulai–Blue Valley) in Kinta, Perak, Peninsular Malaysia, superimposed on the elevation map of the study area. Red star symbols indicate the identified slope-failure locations, while the background colour gradient represents terrain elevation above mean sea level.
Table 1.
The five slope-failure study sites along the study route, including route chainage, recorded failure date, distance from the nearest rain-gauge station and geological information. Geological data were obtained from the Department of Mineral and Geoscience Malaysia, MyGEMS database.
The five study sites are characterized by two distinct geological settings as shown in Table 1. Four sites (1, 2, 4 and 5) are underlain predominantly by intrusive rocks, mainly granite with minor granodiorite. Such lithology is typical of granitic terrains and, under tropical weathering conditions, may develop thick residual-soil profiles derived from the weathering of the parent rock. The remaining site (3) is geologically more heterogeneous, comprising schist, phyllite, slate and limestone, with minor intercalations of sandstone and volcanic rocks. Compared with the relatively homogeneous granitic sites, this site may exhibit greater lithological and structural variability because of differences in rock composition, foliation, discontinuity characteristics, and weathering behaviour. These geological variations may influence the local slope-material properties, infiltration characteristics, and susceptibility to rainfall-induced slope instability.
2.2. Data Source and Description
Daily rainfall records (mm/day) for each of the five study sites were provided as individual worksheets, each corresponding to a documented slope failure and carrying an explicit binary failure flag on the final record. The failure date printed in each worksheet’s header was cross-checked against the flagged failure row and matched in all five cases. Table 2 shows five landslide events and cumulative antecedent rainfall recorded on the day of landslide failure occurrence. Record lengths ranged from 83 to 119 days per site, yielding 520 site-days in total, of which exactly five (0.96%) are the documented failure day, a severe class imbalance that is characteristic of this literature [12,13,15] and that shaped the validation design described in Section 2.4.
Table 2.
Five documented FT185 landslide events and cumulative rainfall on the failure day. CRx denotes cumulative rainfall (mm) over the x-day period ending on and including the failure day.
Daily rainfall data for the five study sites were obtained from Jabatan Kerja Raya Malaysia for the period 2019 to 2024. The rainfall records were provided by the agency as quality-controlled datasets and were therefore used without further modification of the original measurements. For each study site, the nearest available rainfall gauge was selected, and the distance between the gauge and the corresponding slope location was determined. Data completeness was checked before the calculation of antecedent rainfall variables. No interpolation or imputation was applied to missing observations, and only periods with sufficient rainfall records were retained for analysis. Landslide occurrence dates were matched with the corresponding daily rainfall series, from which cumulative rainfall was calculated for the selected 1-, 3-, 5-, 7-, 14-, 21- and 30-day periods ending on and including each event day (Table 2).
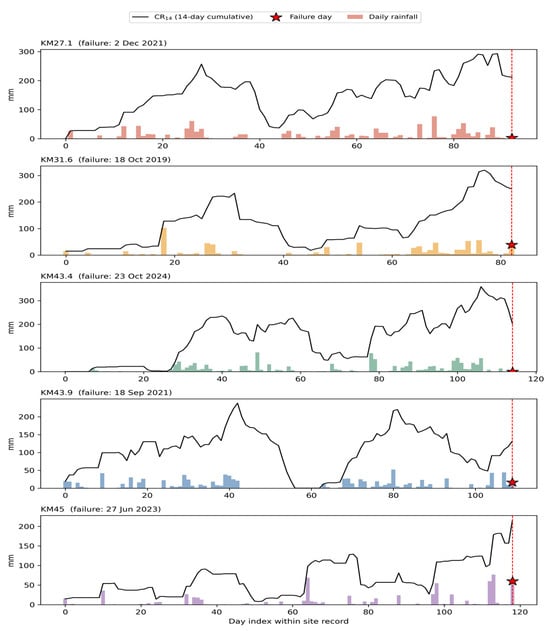
Figure 3 shows the complete daily rainfall time series for all five study sites, together with the 14-day cumulative-rainfall trace, illustrating the heterogeneity of triggering conditions discussed further in Section 3.1: KM 43.4 failed on a day with 0 mm of same-day rainfall but a very high 30-day antecedent total (490 mm); whereas, KM 45 failed on a day with a 60 mm burst but a comparatively modest 30-day antecedent total (330 mm).
Figure 3.
Daily rainfall (bars) and 14-day cumulative rainfall (CR14; black line) for each of the five study sites. The red dashed line and star mark the documented failure day.
2.3. Feature Engineering
Following the fixed-window cumulative-rainfall approach adopted in recent antecedent-rainfall studies [13,15,16], seven cumulative-rainfall features were computed for each site-day: CR1, CR3, CR5, CR7, CR14, CR21, and CR30, representing rainfall accumulated over the corresponding 1-, 3-, 5-, 7-, 14-, 21-, and 30-day periods. These windows were selected to represent rainfall accumulation over immediate, short-, medium-, and longer-term antecedent periods. Two supplementary features were included. Imax3, defined as the maximum daily rainfall recorded during the preceding three days, was used to represent short-duration rainfall concentration independently of cumulative rainfall, consistent with the broader intensity–duration framework [1,2,19]. Wet-days7, defined as the number of days with rainfall ≥1 mm during the preceding seven days, was introduced as a simple indicator of rainfall persistence. It was used as an indirect proxy for antecedent wetness because direct soil-moisture observations, which can improve landslide prediction [14], were unavailable.
In the present study, each cumulative-rainfall feature was formally defined as a fixed-window rolling sum:
where R(t) is the rainfall recorded on day t, k is the integer lag in days, and w ∈ {1, 3, 5, 7, 14, 21, 30} is the window length in days. Thus, CRw(t) represents the total rainfall accumulated during the w-day period ending on and including day t. Fixed-window summation was selected because comparable recent studies represented antecedent rainfall using cumulative totals calculated over specified preceding periods [13,15,16].
2.4. Machine-Learning Models and Validation Strategy
Six supervised classifiers were trained: logistic regression, Random Forest, Gradient Boosting, k-nearest neighbours (k = 5), following the optimal value reported by Menon and Kolathayar [12] on a comparably small inventory and not independently re-tuned on the present dataset given the very small number of positive events available for validation, and a support vector machine with a radial basis function kernel. Given the extreme 0.96% positive-class imbalance, a sixth classifier, XGBoost (gradient-boosted trees with an explicit scale_pos_weight term set to the negative:positive class ratio), was additionally evaluated under the same leave-one-site-out protocol to test whether a more flexible, regularized boosting implementation could resolve the nonlinear failure boundary more effectively than the standard Gradient Boosting. Logistic regression, k-NN and the support vector machine used standardized (zero-mean, unit-variance) features; the three tree-based models (Random Forest, Gradient Boosting and XGBoost) used raw features. Class imbalance (5 positive site-days of 520, 0.96%) was addressed through cost-sensitive class weighting (class_weight = “balanced”) rather than synthetic oversampling: with only five true positive events, techniques such as SMOTE [22,23,24] were judged too likely to generate an unrepresentative synthetic minority-class manifold to validate reliably, a concern also raised explicitly by Franceschini et al. [16] and Dal Seno et al. [15] for comparably small or imbalanced inventories. The Random Forest hyperparameters (300 trees, maximum depth 5) were set manually rather than through an exhaustive grid search, since cross-validated hyperparameter tuning on only five positive events risks overfitting the tuning procedure itself; a shallow depth was preferred a priori to limit the model’s capacity to memorize individual failure site-days.
The Random Forest’s split criterion was based on the standard Gini impurity of a node , following the Random Forest formulation described by Gu et al. [31]:
where is the proportion of class- samples (failure vs. no-failure) at node , summed over both classes k. Feature importance is the total decrease in Gini(t) attributable to splits on that feature, weighted by node sample size and averaged across all 300 trees in the ensemble.
Because only five independent sites are available, a conventional random train/test split risks leaking site-specific rainfall-regime information between training and test partitions. Models were instead validated using leave-one-site-out cross-validation (five folds: each site held out in turn while the model trains on the remaining four), the small-sample analogue of the leave-one-region-out cross-validation used by Shao et al. [14] on a much larger national inventory. Performance is reported on the pooled out-of-fold predictions across all five folds using ROC-AUC and precision–recall AUC (PR-AUC); because PR-AUC is mechanically compressed by the 0.96% positive base rate, it is interpreted relative to that base rate rather than on an absolute 0–1 scale.
The operating probability cutoff on the best-performing model’s pooled out-of-fold ROC curve was selected using sensitivity (recall) and specificity [32],
and the Youden index [32],
Precision = TP/(TP + FP), was also used below in the recall-weighted F-score. Following the general Fβ formulation of Assel and Vickers [33],
where TP, FN, TN and FP are the counts of true-positive, false-negative, true-negative and false-positive site-days at a given probability cutoff. J (Equation (4)) was maximized over the ROC curve to select the reported operating cutoff; setting β = 2 in Equation (5) gives the recall-weighted F2-score, which weights recall twice as heavily as precision and is reported, alongside J, where a recall-weighted summary is more appropriate for an early-warning context in which missed failures (false negatives) are far more costly than false alarms.
No additional post hoc probability calibration (e.g., Platt scaling or isotonic regression) was performed. The reported probabilities are the direct probability outputs of the fitted classifiers: logistic regression probabilities were obtained from the logistic link function, whereas Random Forest probabilities were obtained from the aggregated class-probability estimates of the constituent decision trees. Given the very small number of documented failure events (n = 5), a separate calibration model could not be estimated or independently validated reliably. Accordingly, the predicted probabilities are interpreted primarily as model-derived relative risk scores for threshold derivation rather than as empirically calibrated estimates of absolute landslide probability.
2.5. Threshold Derivation
Three complementary methods were used to translate the observed rainfall conditions and trained models into explicit, reportable thresholds, consistent with recent studies comparing empirical rainfall-threshold formulations with machine-learning approaches for landslide prediction [12,14,15,19]:
- Naive minimum-observed threshold: As a deliberately conservative empirical benchmark, for each antecedent window, the lowest cumulative-rainfall recorded among the five documented failures was taken as the trigger level. The associated false-alarm rate was then audited as the proportion of non-failure site-days that would be incorrectly flagged if a warning were issued whenever this level was met or exceeded. Evaluating false-positive predictions is particularly important for the operational application of rainfall thresholds and machine-learning landslide-warning models [12,14].
- Interpretable two-feature logistic regression boundary: A class-balanced logistic regression using 14-day antecedent rainfall (AR14) and same-day rainfall (R) was fitted to obtain a continuous probability of failure. AR14 was defined as the cumulative rainfall over the full 14 days preceding and excluding the current day, while R represents rainfall on the current day. This formulation differs from CR14, used in the Random Forest analysis, which is a 14-day cumulative-rainfall window ending on and including the current day. Accordingly, thresholds derived from AR14 and CR14 are reported under their respective definitions and are not interpreted as directly equivalent numerical thresholds. Logistic regression provides an interpretable probabilistic formulation for binary rainfall-based landslide classification [12,15]. The fitted model was expressed in closed form, allowing probability boundaries at P(failure) = 0.3, 0.5, and 0.7 to be plotted directly against the observations. This probability-based representation is consistent with recent studies that translate model probabilities into explicit rainfall thresholds at different probability levels [14], while retaining an analogous interpretation to conventional rainfall-threshold curves [1,2,19].
- Random Forest partial dependence: For the three antecedent windows ranked most important by the Random Forest (Section 3.3), partial-dependence plots (PDPs) were used to characterize how the mean predicted failure probability varied with cumulative rainfall. PDP-based examination of nonlinear rainfall-response behaviour and subsequent stabilization is consistent with explainable-machine-learning approaches used to identify critical rainfall conditions [14,16]. For each curve, the rainfall level at which the response reached 90% of its maximum was defined in the present study as an operational saturation threshold, representing the point beyond which additional cumulative rainfall produced comparatively little further increase in the model response.
For the logistic regression threshold (method 2; Section 3.5), failure probability is obtained from the fitted linear predictor through the standard logistic (sigmoid) link function [15]:
where x1, x2, … are the model input features (AR14 and R for the two-feature boundary), and b0, b1, b2, … are the fitted coefficients. Random Forest probabilities are calculated separately from the aggregated class-probability estimates of the constituent decision trees and are therefore not obtained using Equation (6). This distinction is consistent with the separate formulations of Logistic Regression and Random Forest used in rainfall-based landslide classification studies [12,14,15].
For comparison with method 2, the classical rainfall intensity–duration (I-D) threshold takes the general power-law form established in the empirical rainfall-threshold literature [1,2,12,19]:
where I is rainfall intensity (mm/h), D is storm duration (h), and α and β are empirically fitted positive constants. Such I-D relationships require rainfall-event intensity and duration information, whereas the present dataset contains daily rainfall totals without sub-daily storm intensity–duration pairs. Equation (7) was therefore not fitted directly in this study but is presented to situate the continuous probability boundaries derived from Equation (6) within the conventional rainfall-threshold framework [1,2,12,19].
2.6. Software and Reproducibility
All analyses were implemented in Python 3 using pandas and NumPy for data handling, scikit-learn for all machine-learning models and cross-validation, and Matplotlib 3.10.0 for figures. To support reproducibility within the data-sharing restrictions, Section 2.3, Section 2.4 and Section 2.5 provide the complete feature definitions, model configurations, class-imbalance treatment, five-fold leave-one-site-out validation structure, threshold-derivation procedures and evaluation metrics. The principal model outputs including classifier performance, Random Forest feature importance and derived threshold values are reported in Table 3, Table 4 and Table 5 and Section 3.2, Section 3.3, Section 3.4, Section 3.5 and Section 3.6.
Table 3.
Leave-one-site-out cross-validated model performance, pooled out-of-fold predictions across all five site folds. PR-AUC is compressed by the 0.96% positive base rate and should be interpreted relative to that base rate rather than on an absolute scale.
Table 4.
Random Forest feature importance (Gini importance), model fit on all 5 sites (520 site-days).
Table 5.
Naive minimum-observed threshold for each cumulative-rainfall window (the lowest cumulative rainfall recorded at any of the five documented failures) and the resulting false-alarm audit across the full 520-day dataset.
3. Results
3.1. Rainfall Characteristics and Triggering Heterogeneity
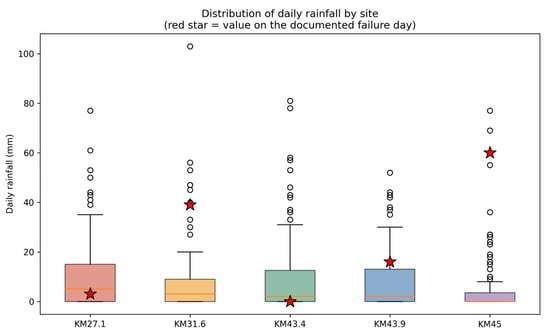
Across the 520 site-days, daily rainfall was strongly right-skewed and dominated by dry or near-dry days, typical of tropical daily rainfall series (Figure 4). Median daily rainfall at the five study sites ranged from approximately 0–2 mm, with occasional bursts exceeding 60–100 mm. Table 2 and Figure 3 show that the five documented failures exhibited different triggering signatures: same-day rainfall on the failure day ranged from 0 mm (KM 43.4) to 60 mm (KM 45); while 30-day antecedent rainfall ranged more narrowly from 286 mm (KM 43.9) to 490 mm (KM 43.4). This variability in failure mechanisms, ranging from prolonged ground saturation to intense rainfall following antecedent wet conditions, supports the integration of multiple antecedent rainfall windows within a multivariate model.
Figure 4.
Distribution of daily rainfall by site (520 site-days), shown as boxplots with individual outliers. The red star marks the same-day rainfall recorded on each site’s documented failure day.
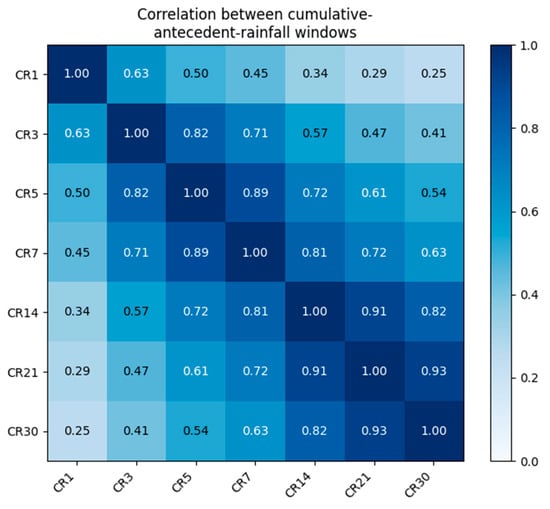
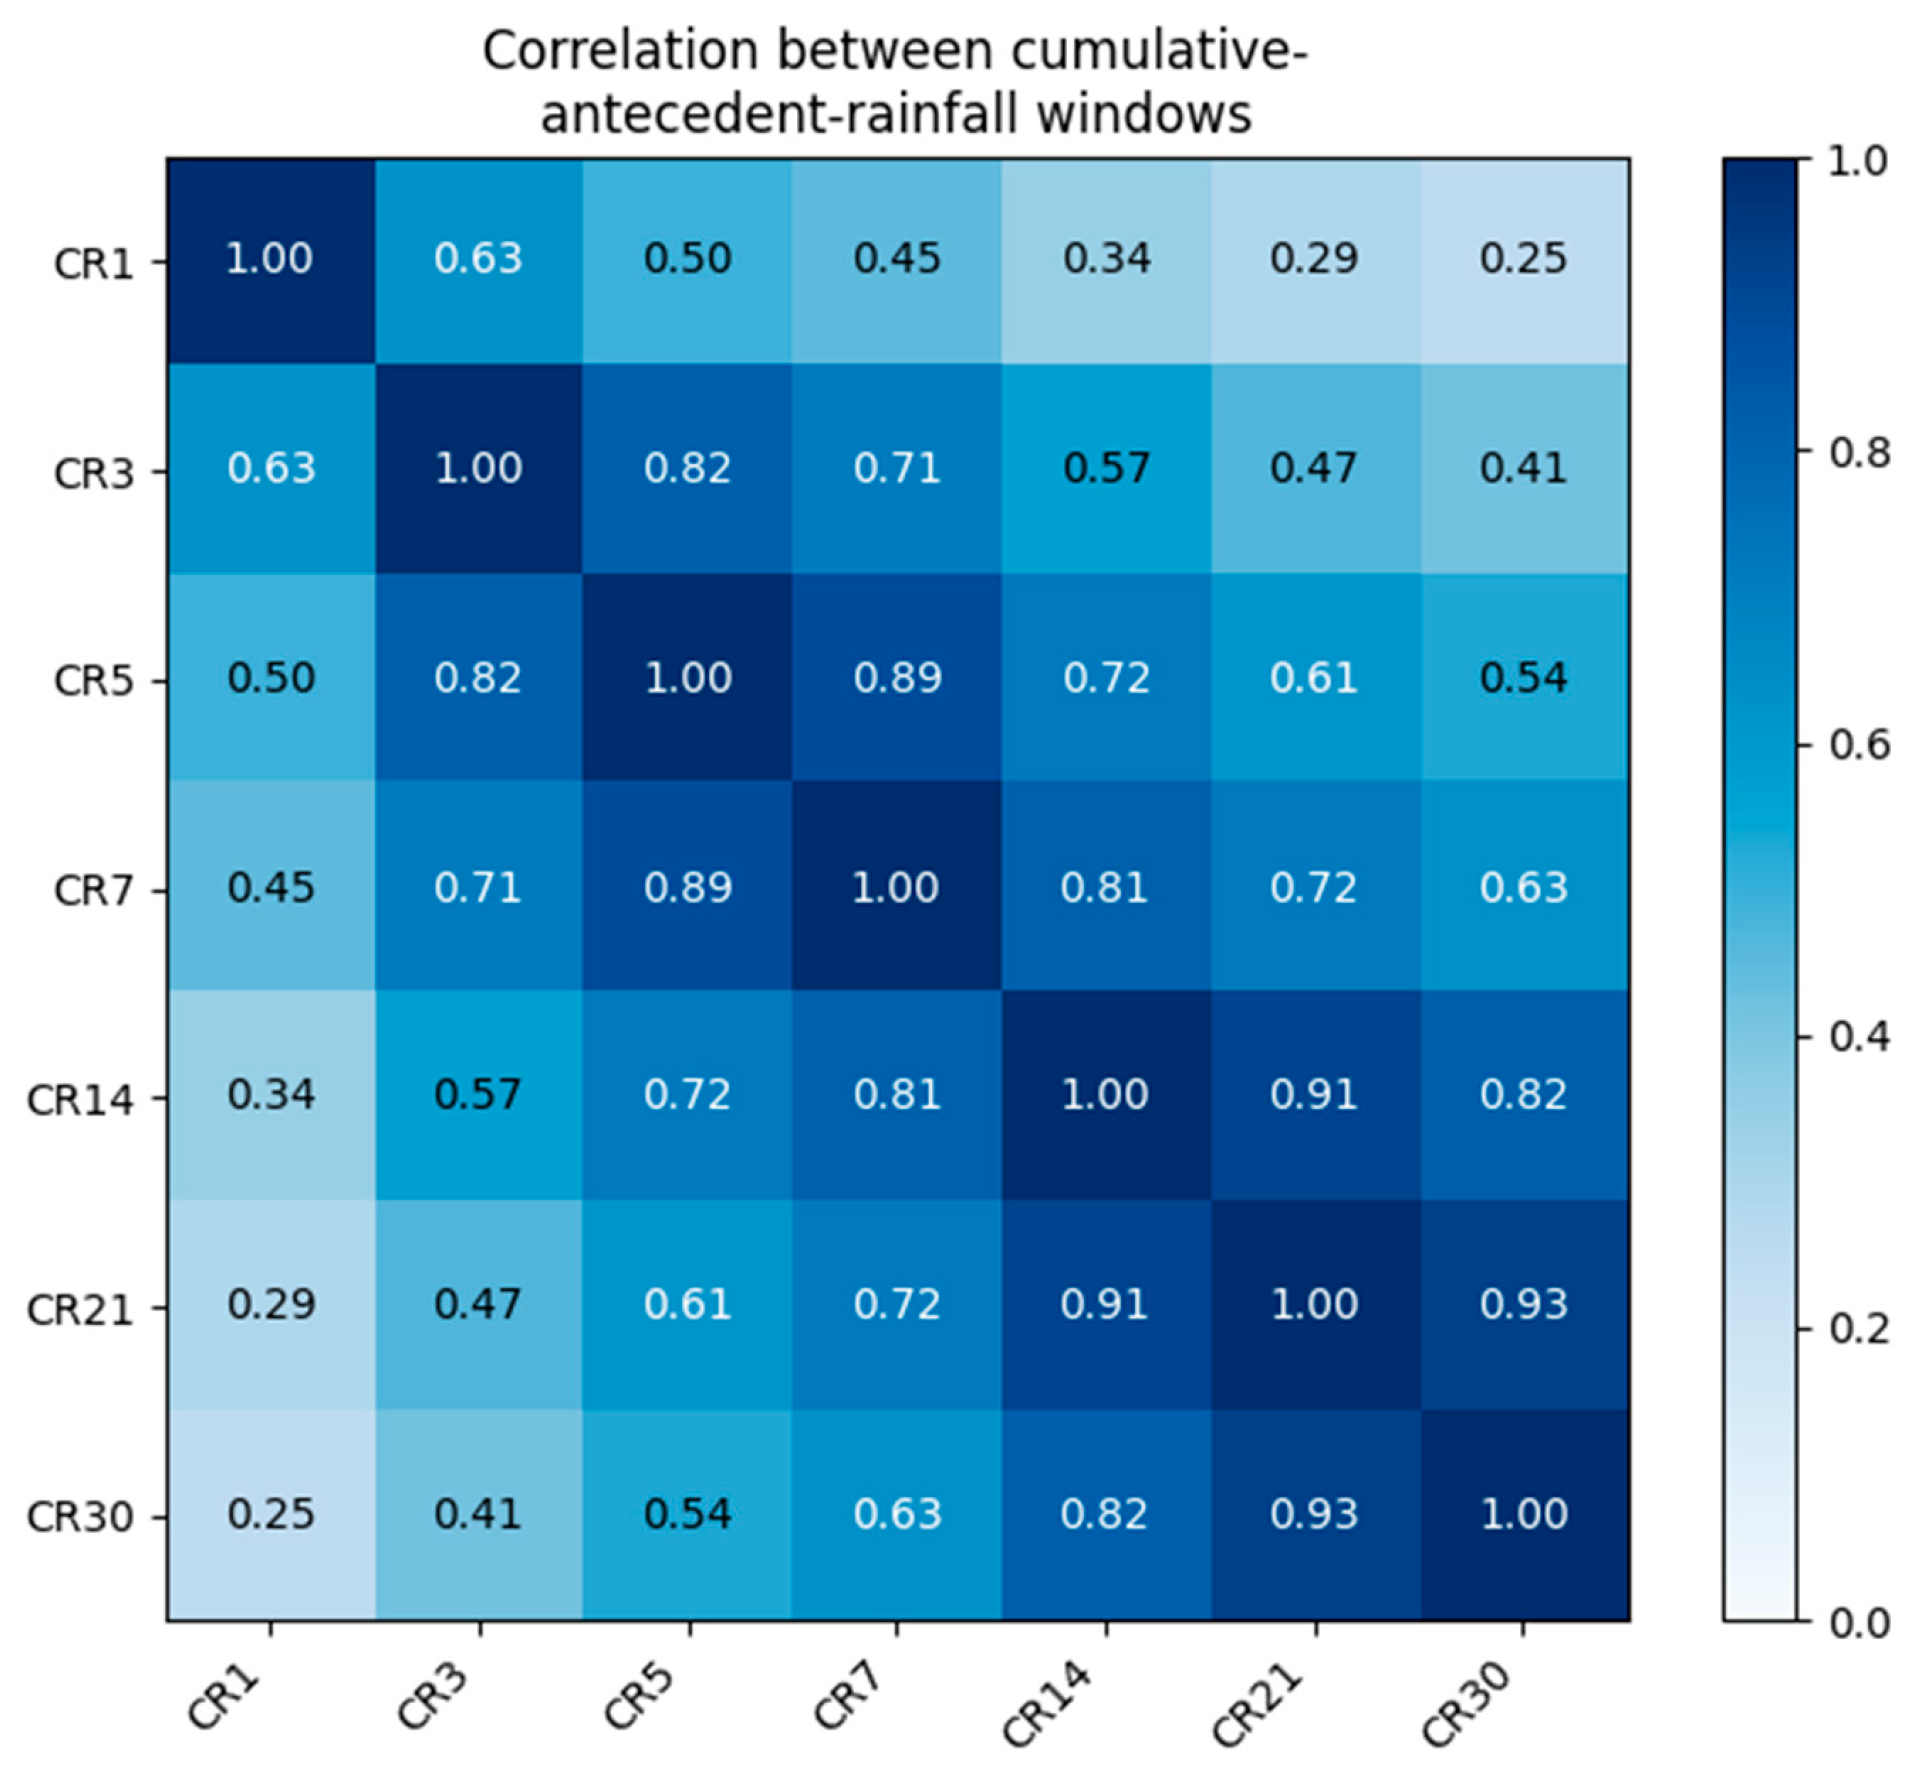
Figure 5 shows the Pearson correlation structure among the seven antecedent-rainfall windows. As expected for nested rolling sums, adjacent windows are highly collinear (e.g., CR21 and CR30, r = 0.93), while the shortest and longest windows are only weakly correlated (CR1 and CR30, r = 0.25). This structure explains why, in the Random Forest results below, predictive importance is distributed across several correlated long-window features rather than concentrated in a single variable.
Figure 5.
Pearson correlation between the seven cumulative-rainfall windows used as model features (520 site-days).
3.2. Model Comparison
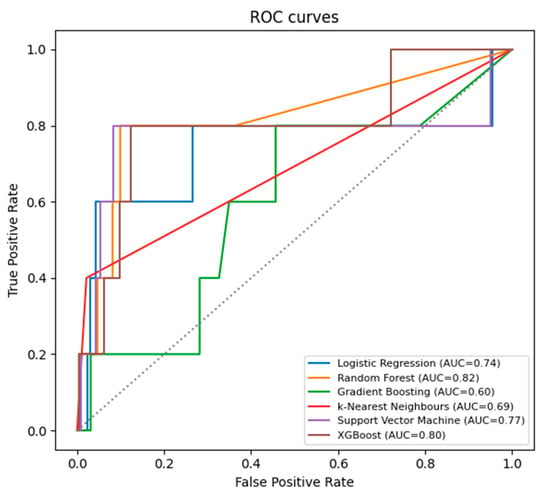
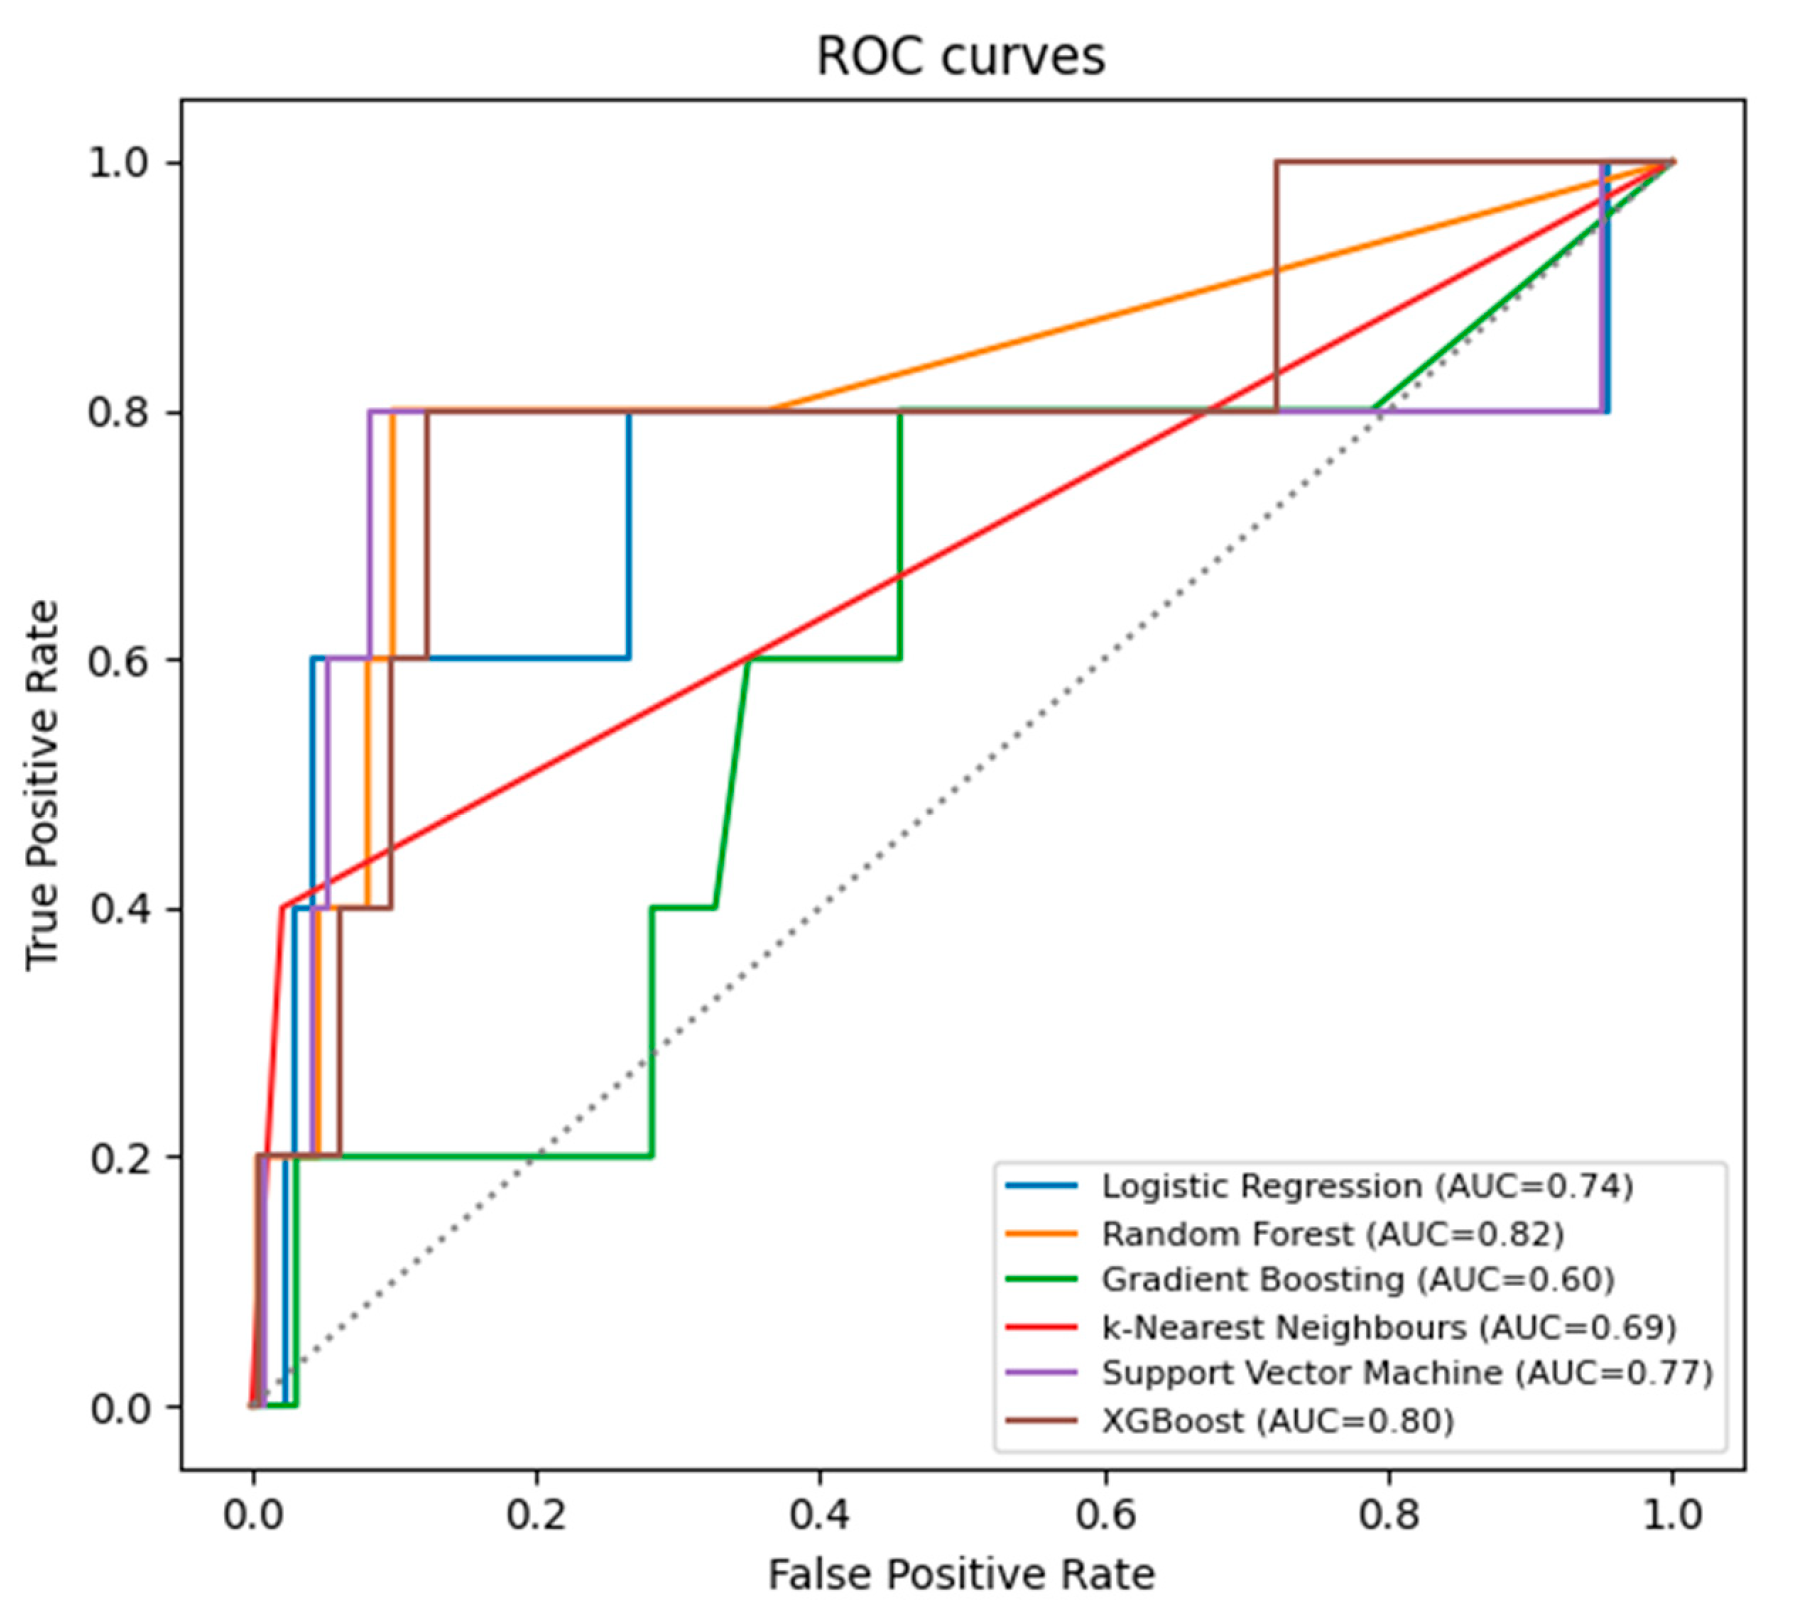
Table 3 reports leave-one-site-out cross-validated performance for all six classifiers, pooled across the five out-of-fold predictions. Random Forest achieved the best discrimination (ROC-AUC = 0.817, PR-AUC = 0.112), ahead of XGBoost (0.799/0.104), the RBF support vector machine (0.772/0.095), logistic regression (0.737/0.071), k-nearest neighbours (0.689/0.067) and Gradient Boosting (0.600/0.023). XGBoost was additionally evaluated in response to the extreme 0.96% positive-class imbalance and to examine whether a more flexible boosting implementation could capture the nonlinear failure boundary more effectively than the standard Gradient Boosting model. Its performance approached that of Random Forest in terms of ROC-AUC but did not exceed it and yielded a slightly lower PR-AUC. Accordingly, XGBoost was not preferred over Random Forest for the present dataset, although its performance provides further evidence of the suitability of tree-based ensemble methods for this problem. This pattern is broadly consistent with previous rainfall-induced landslide studies, in which tree-based ensemble methods, particularly Random Forest and Gradient Boosting approaches, have demonstrated strong predictive performance [13,14,15]. Nevertheless, the present dataset is substantially smaller than the regional or national inventories considered in those studies; therefore, differences in model performance should be interpreted cautiously, particularly given the sensitivity of advanced machine-learning methods to the quality and volume of the available training data.
Given the extremely small number of positive events, these AUC values should be read as point estimates with wide, un-computed confidence intervals rather than precisely resolved figures and the differences between models have not been tested for statistical significance. The reported ordering is consequently indicative of relative discrimination rather than a confirmed ranking. To make this uncertainty explicit rather than only asserted, the Random Forest ROC-AUC was re-examined using three complementary approaches: a class-stratified bootstrap (5000 resamples of the pooled out-of-fold predictions, resampling the five positive and 515 negative site-days separately to preserve the class ratio) gives a 95% interval of approximately 0.56–0.97; a leave-one-failure-out jackknife (five exact re-evaluations, each omitting one documented failure) gives a narrower range of approximately 0.77–0.94; and the analytic Hanley–McNeil standard-error formula (n1 = 5 positive, n0 = 515 negative) gives an analogous wide interval. The corresponding PR-AUC bootstrap 95% interval (0.024–0.475) is wider still in relative terms, reflecting the mechanical sensitivity of precision–recall metrics to the 0.96% positive base rate at this sample size. All three approaches agree that the headline ROC-AUC = 0.817 is a plausible but imprecisely bounded point estimate, reinforcing the pilot framing adopted throughout this study (Section 4.4). Figure 6 shows the corresponding ROC curves.
Figure 6.
Receiver operating characteristic (ROC) curves for all six classifiers. The grey dotted diagonal line represents no-discrimination performance (ROC-AUC = 0.5).
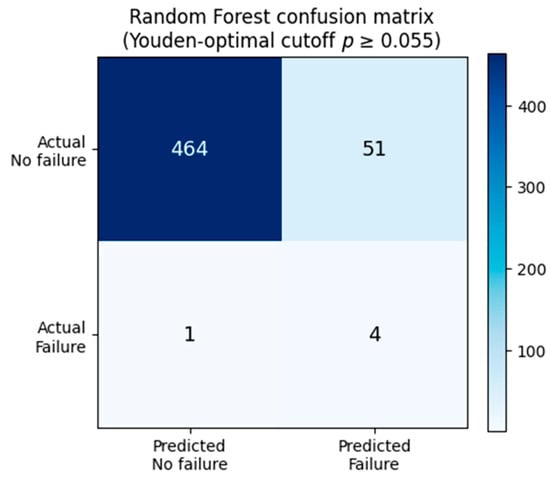
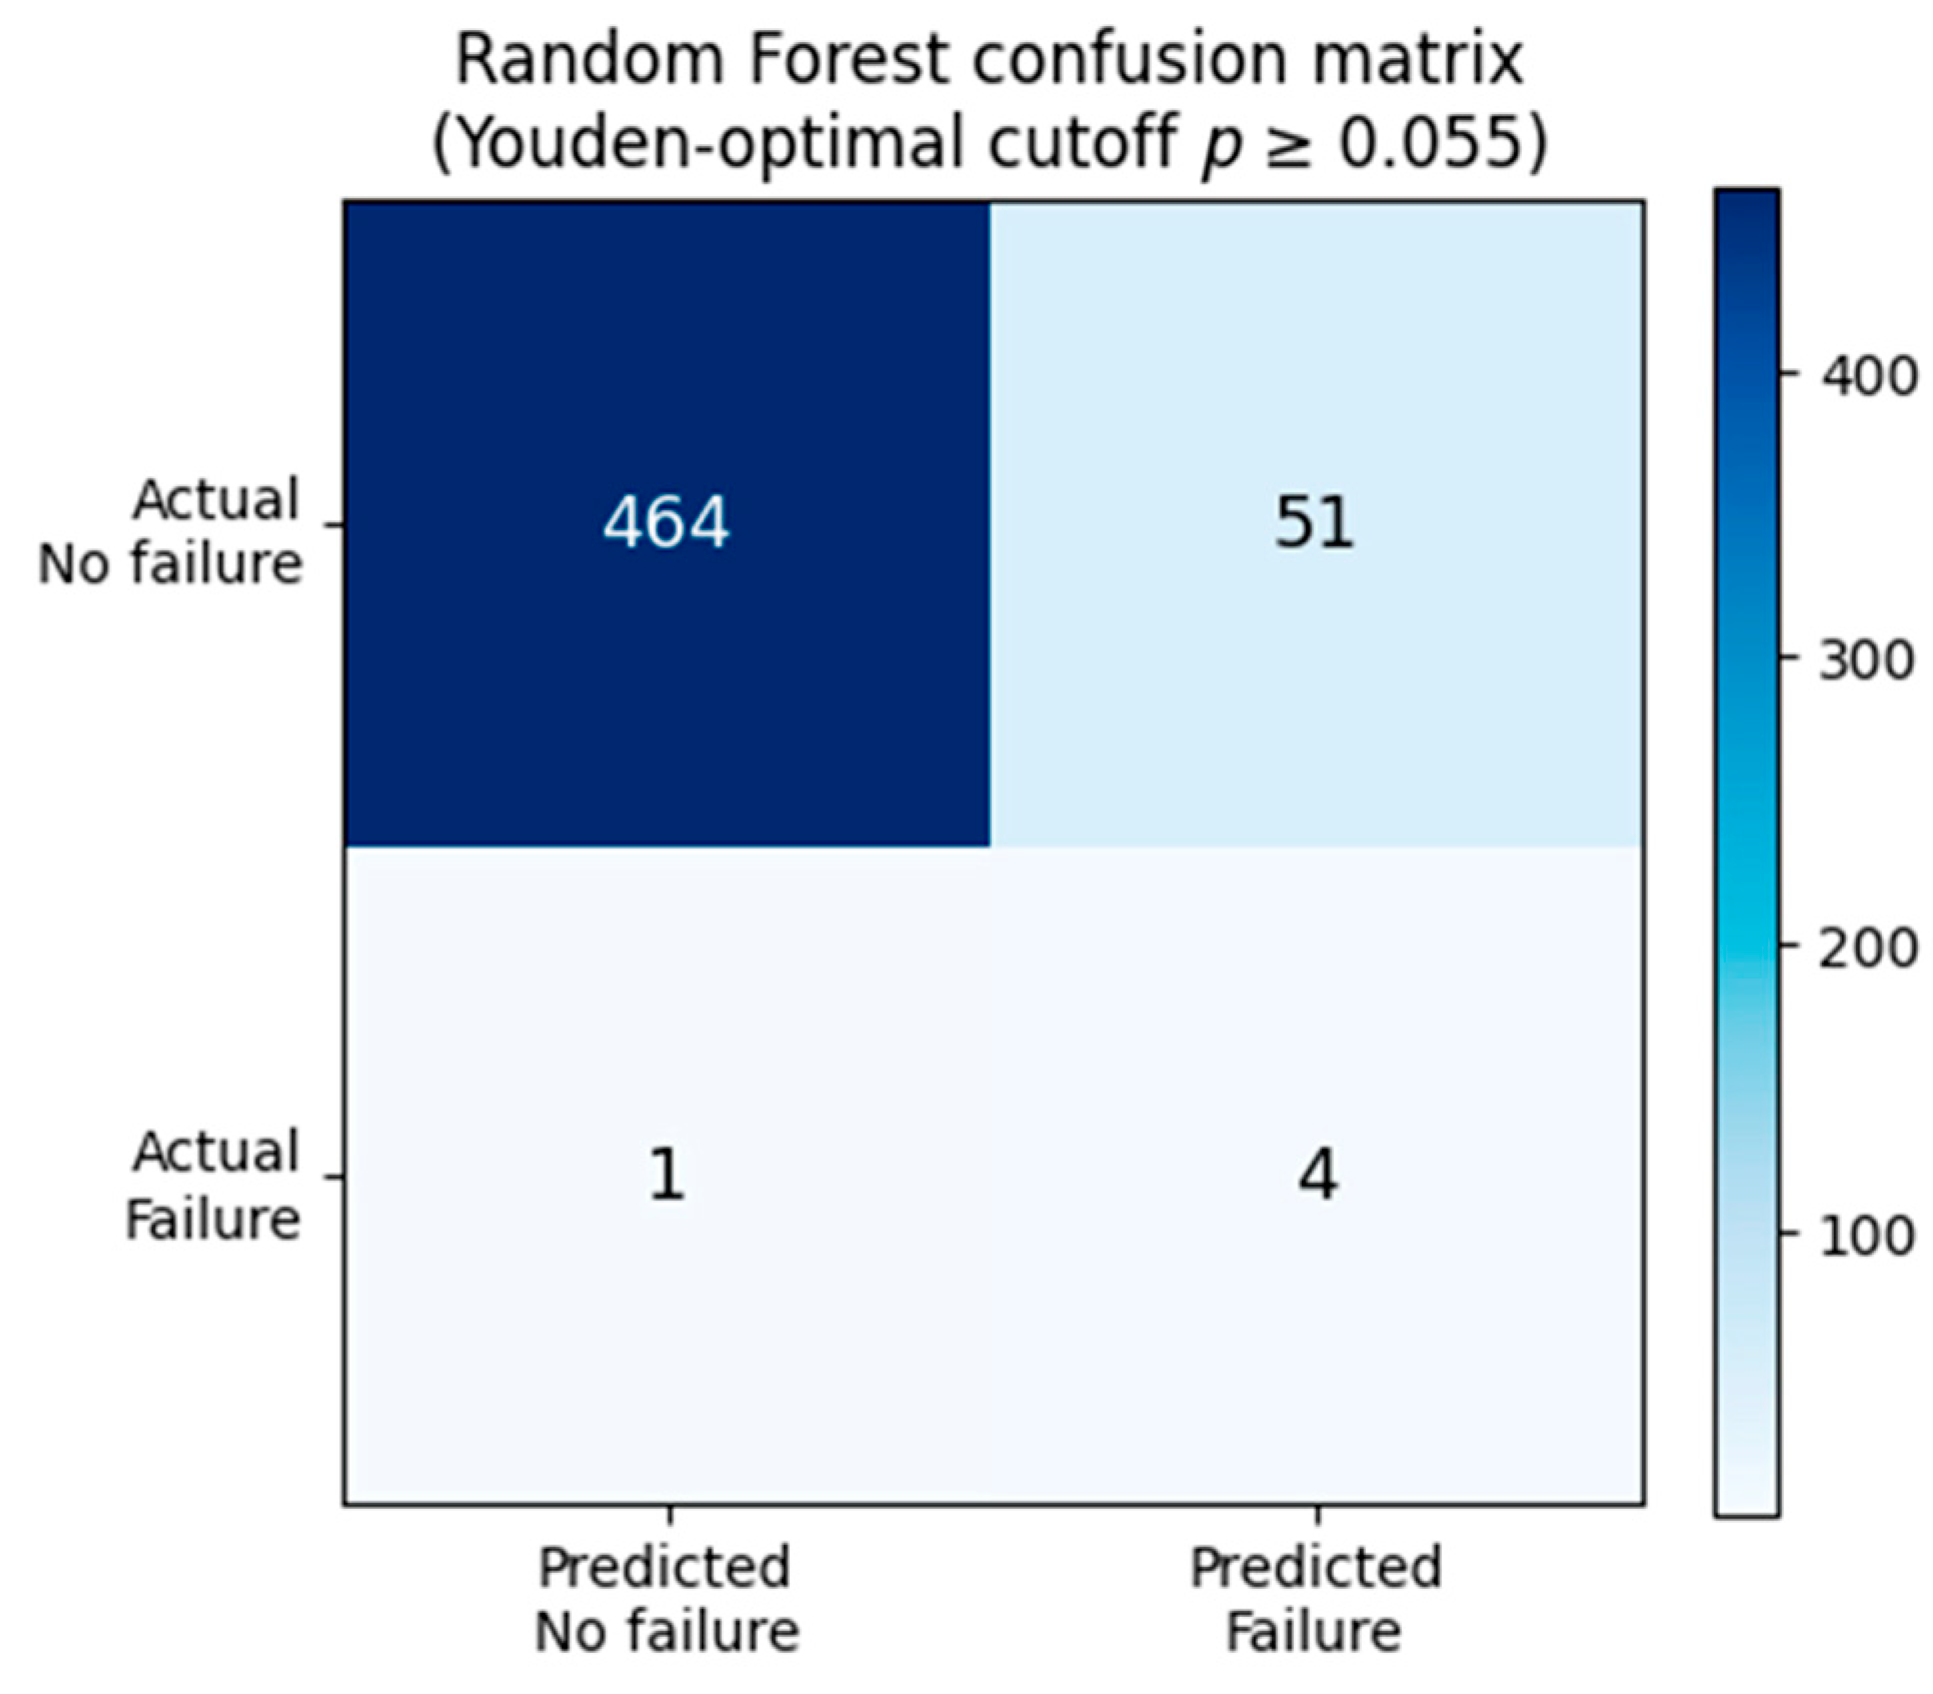
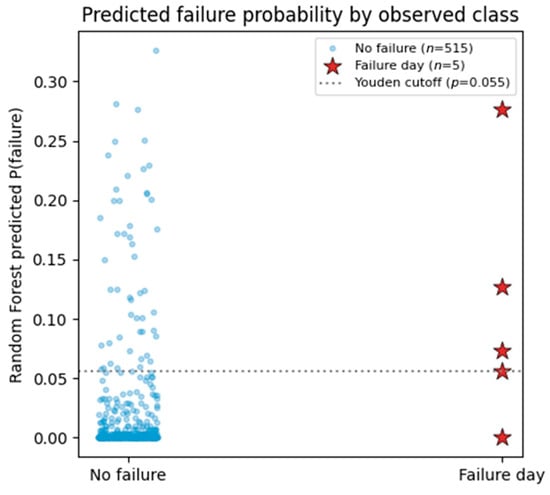
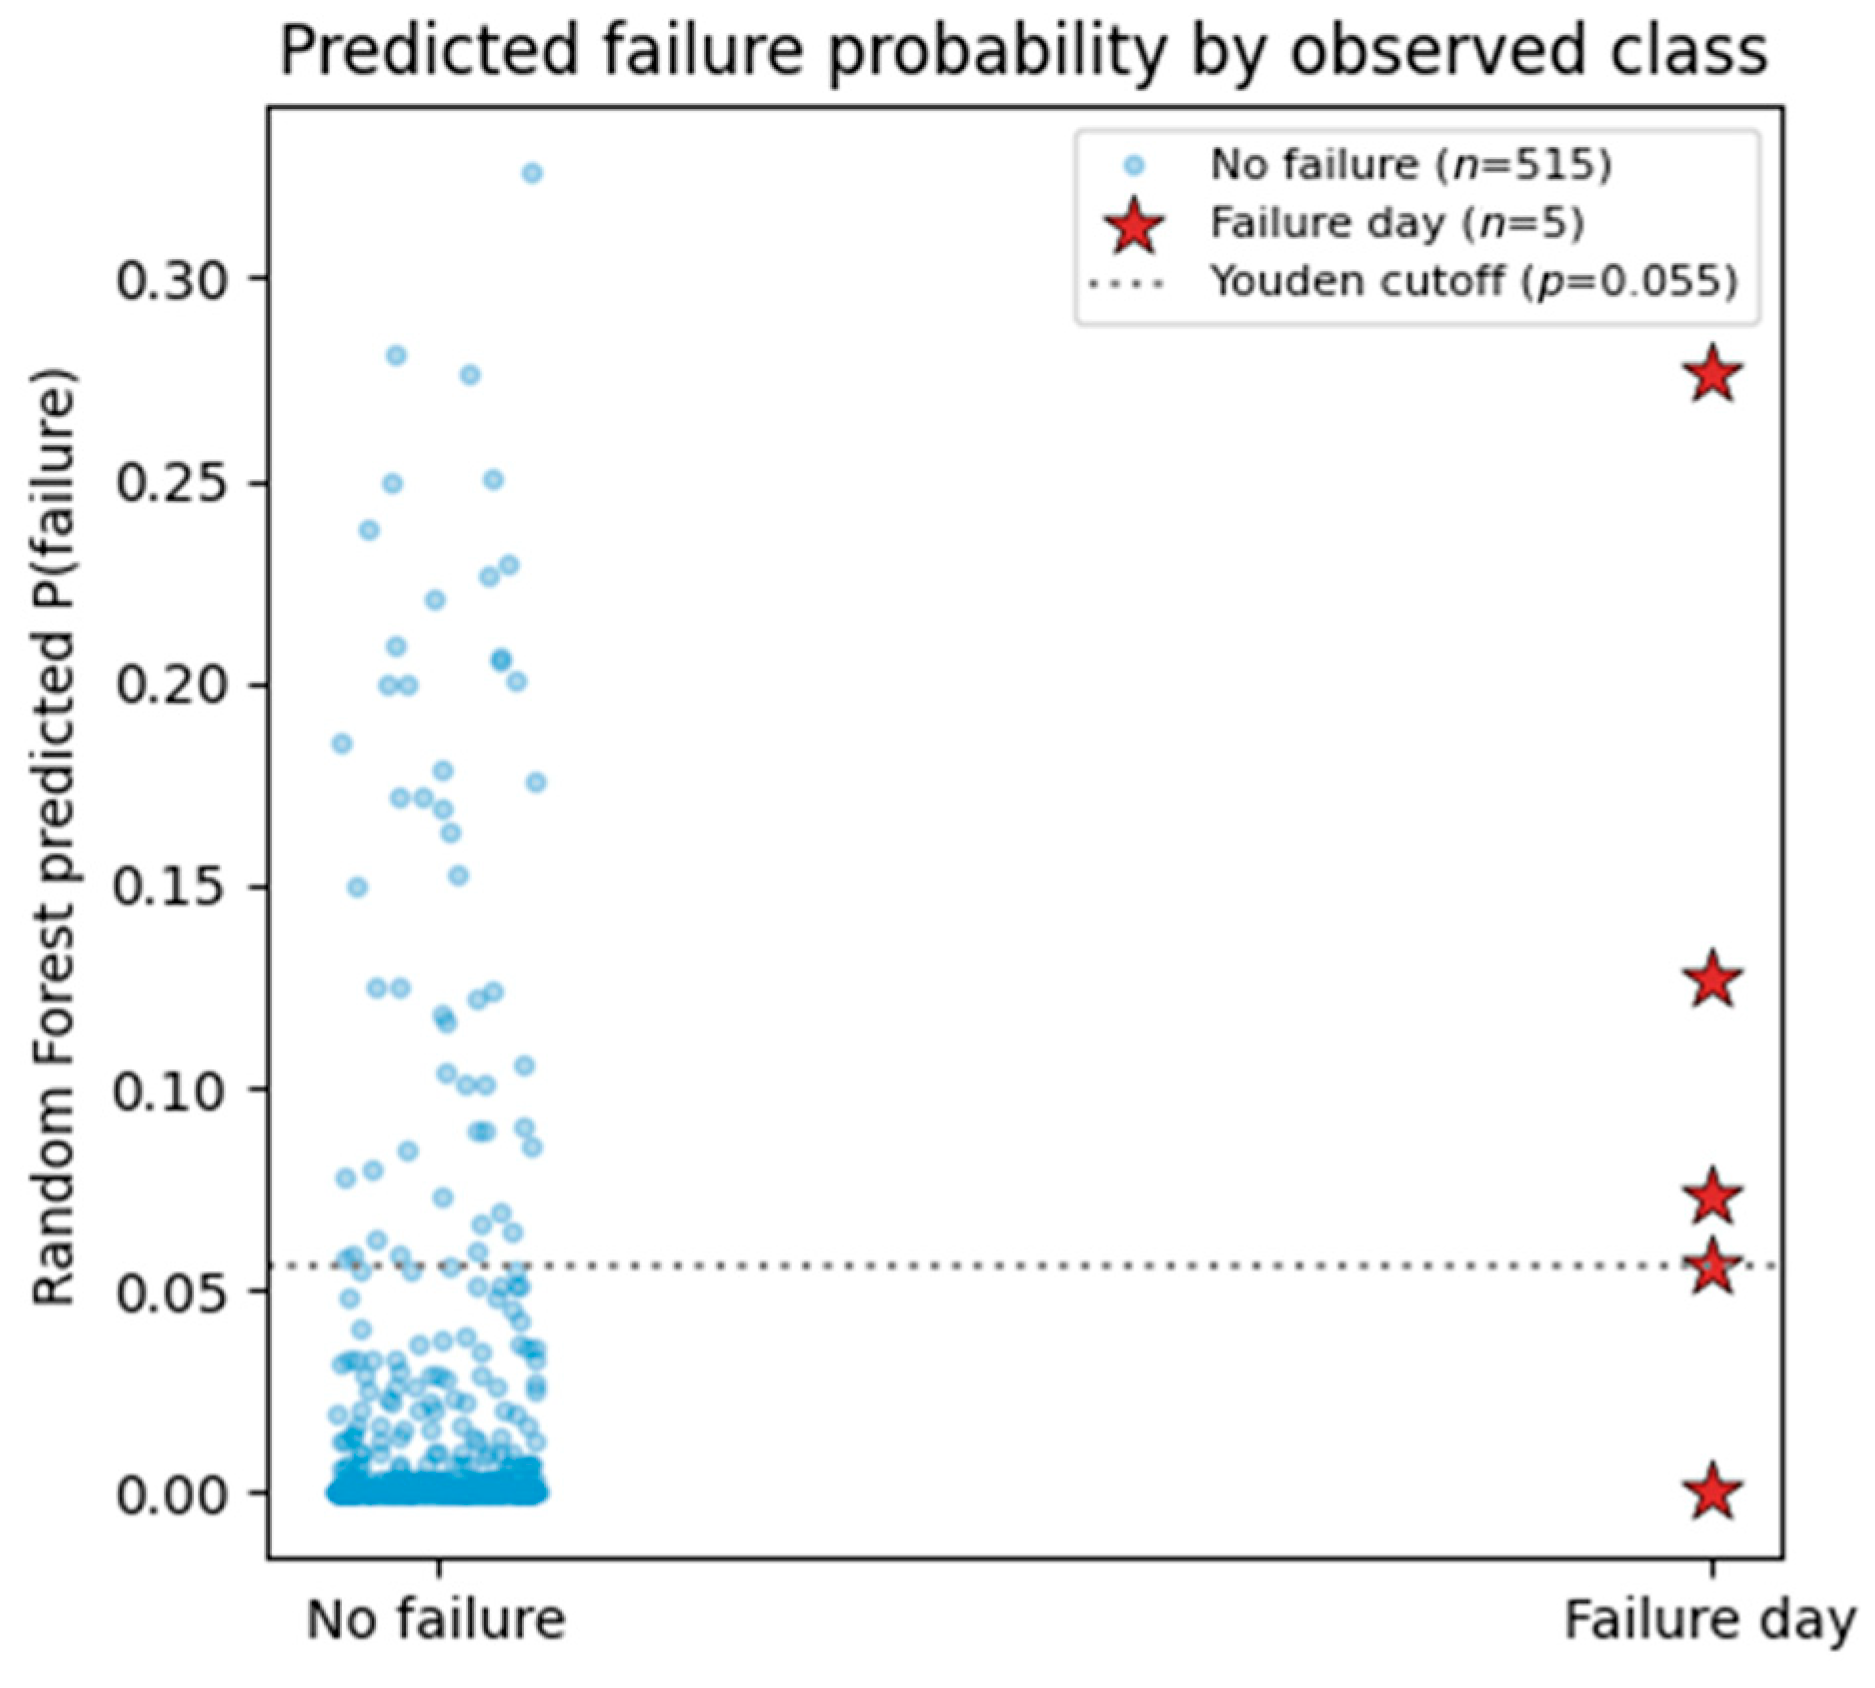
At the Youden-optimal probability cutoff on the pooled Random Forest predictions (p ≥ 0.055; J = 0.701, Equation (4)), the model correctly flags four of the five documented failures (80% sensitivity) while correctly classifying 464 of 515 non-failure site-days as low-risk (90.1% specificity); the remaining 51 non-failure days are false positives (Figure 7), giving a precision of 7.3% and a recall-weighted F2-score (Equation (5)) of 0.267. The low F2-score reflects the very low positive-event base rate (0.96%) and is reported alongside J to make the effect of class imbalance explicit. The single missed event is KM 43.4, the zero-same-day-rainfall, long-antecedent case, illustrating the residual difficulty of predicting failures with no short-term rainfall signal from a purely rainfall-based feature set. This is a limitation returned to in Section 4.3. Figure 8 shows the distribution of predicted failure probability separately for failure and non-failure days: four of the five failure days are clearly separated above the bulk of the non-failure distribution, while the fifth (KM 43.4) falls just below the cutoff, within the upper tail of the non-failure distribution.
Figure 7.
Random Forest confusion matrix at the Youden-optimal probability cutoff (p ≥ 0.055).
Figure 8.
Random Forest predicted failure probability by observed class (leave-one-site-out out-of-fold predictions). The dotted line marks the Youden-optimal cutoff.
3.3. Feature Importance
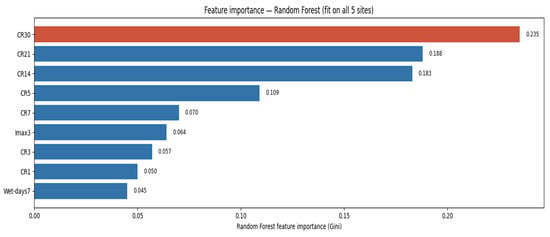
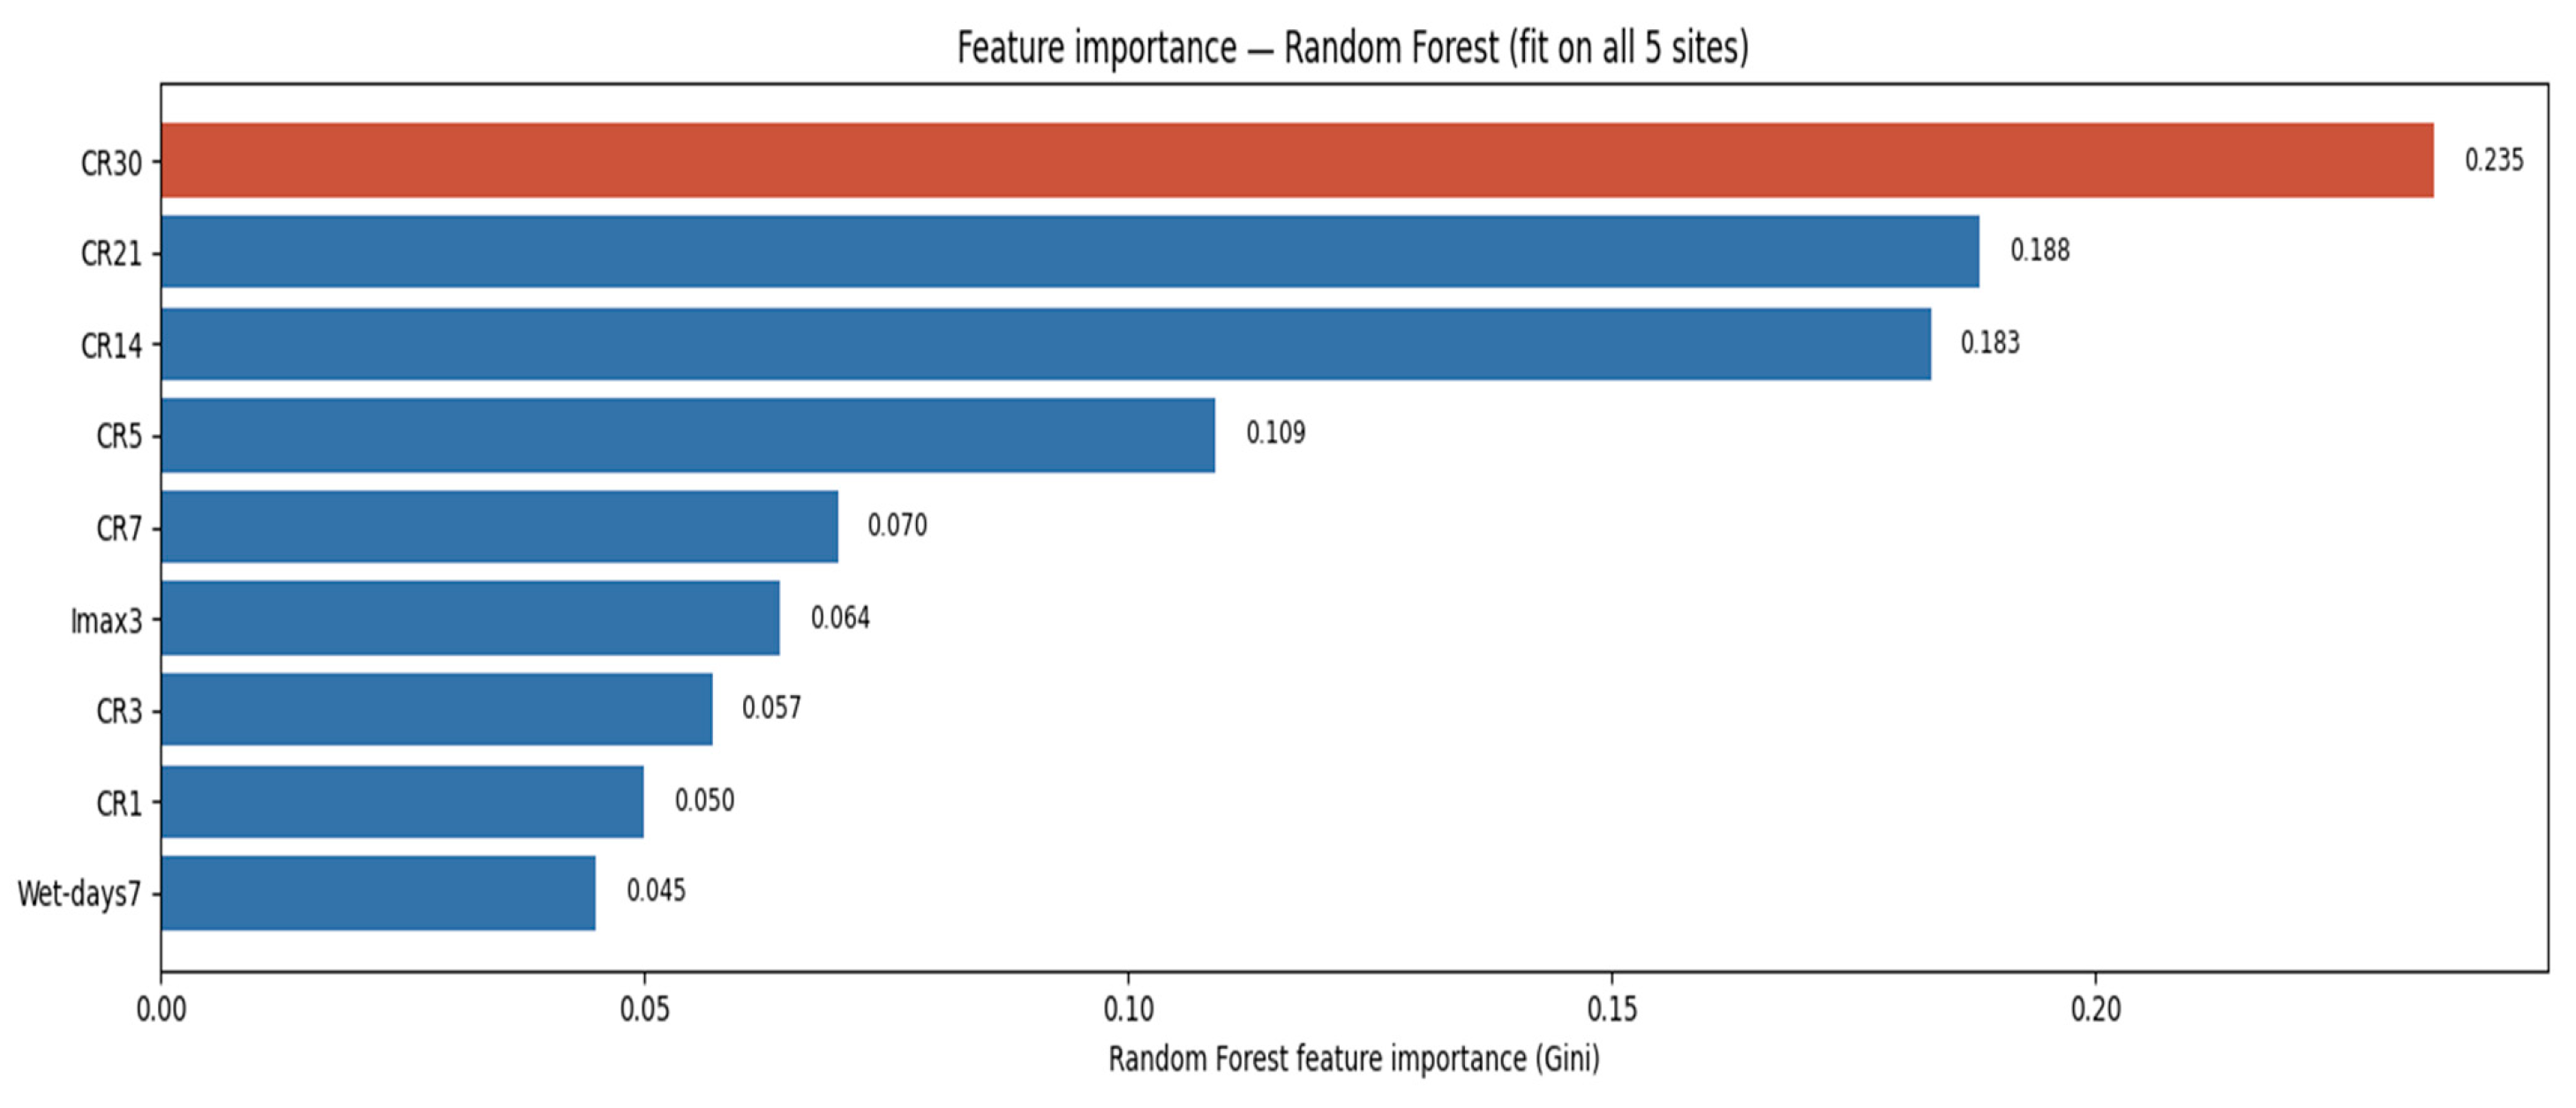
Table 4 and Figure 9 report Random Forest Gini feature importance for the model fit on all five sites. The three longest cumulative-rainfall windows, CR30 (0.235), CR21 (0.188) and CR14 (0.183), together account for 60.6% of total feature importance, while same-day rainfall CR1 (0.050) and the preceding wet-day count Wet-days7 (0.045, the single least important feature) rank lowest. This pattern differs from conventional rainfall intensity–duration threshold approaches [1,2], which characterize landslide triggering primarily in terms of event rainfall intensity and duration, and instead highlights the contribution of longer antecedent rainfall accumulation in the present dataset. This pattern is consistent with Guzzetti et al. [2], who reported that antecedent precipitation and soil-moisture conditions may become important for rainfall events exceedingly approximately 48 h. Franceschini et al. [16] similarly found that medium-term cumulative rainfall over 7–9 days was more influential than daily rainfall for predicting landslide reactivation. This interpretation is also consistent with the triggering heterogeneity observed in the present study, particularly the KM 43.4 failure, which occurred on a day with 0 mm rainfall but was preceded by an unusually high 30-day cumulative rainfall total.
Figure 9.
Ranked Random Forest feature importance (Gini importance) for the model fitted to all five study sites.
3.4. Naive Minimum-Observed Threshold
Table 5 reports, for each antecedent window, the lowest value recorded at any of the five documented failures, together with the false alarm audit obtained by flagging every site-day at which that window’s value is met or exceeded. The 1- and 3-day windows are uninformative as stand-alone triggers (minimum observed = 0 mm at KM 43.4), while the 14-, 21- and 30-day windows provide a more discriminating, though still very conservative, floor (132, 171 and 286 mm, respectively). Even the best-performing single window (CR30) still classifies 96.4% of its exceedances as false alarms across the full 520-day dataset. This interpretation is consistent with Dal Seno et al. [15], who found that machine-learning approaches incorporating multiple rainfall-related predictors generally reduced false positives relative to conventional rainfall-threshold methods, although the magnitude of improvement depended on the information content of the additional predictors.
3.5. ML-Derived Probabilistic Threshold
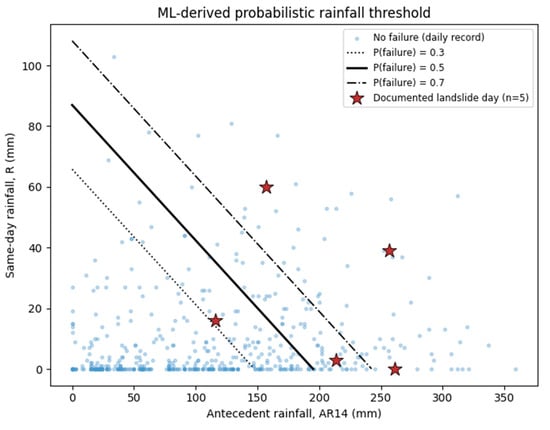
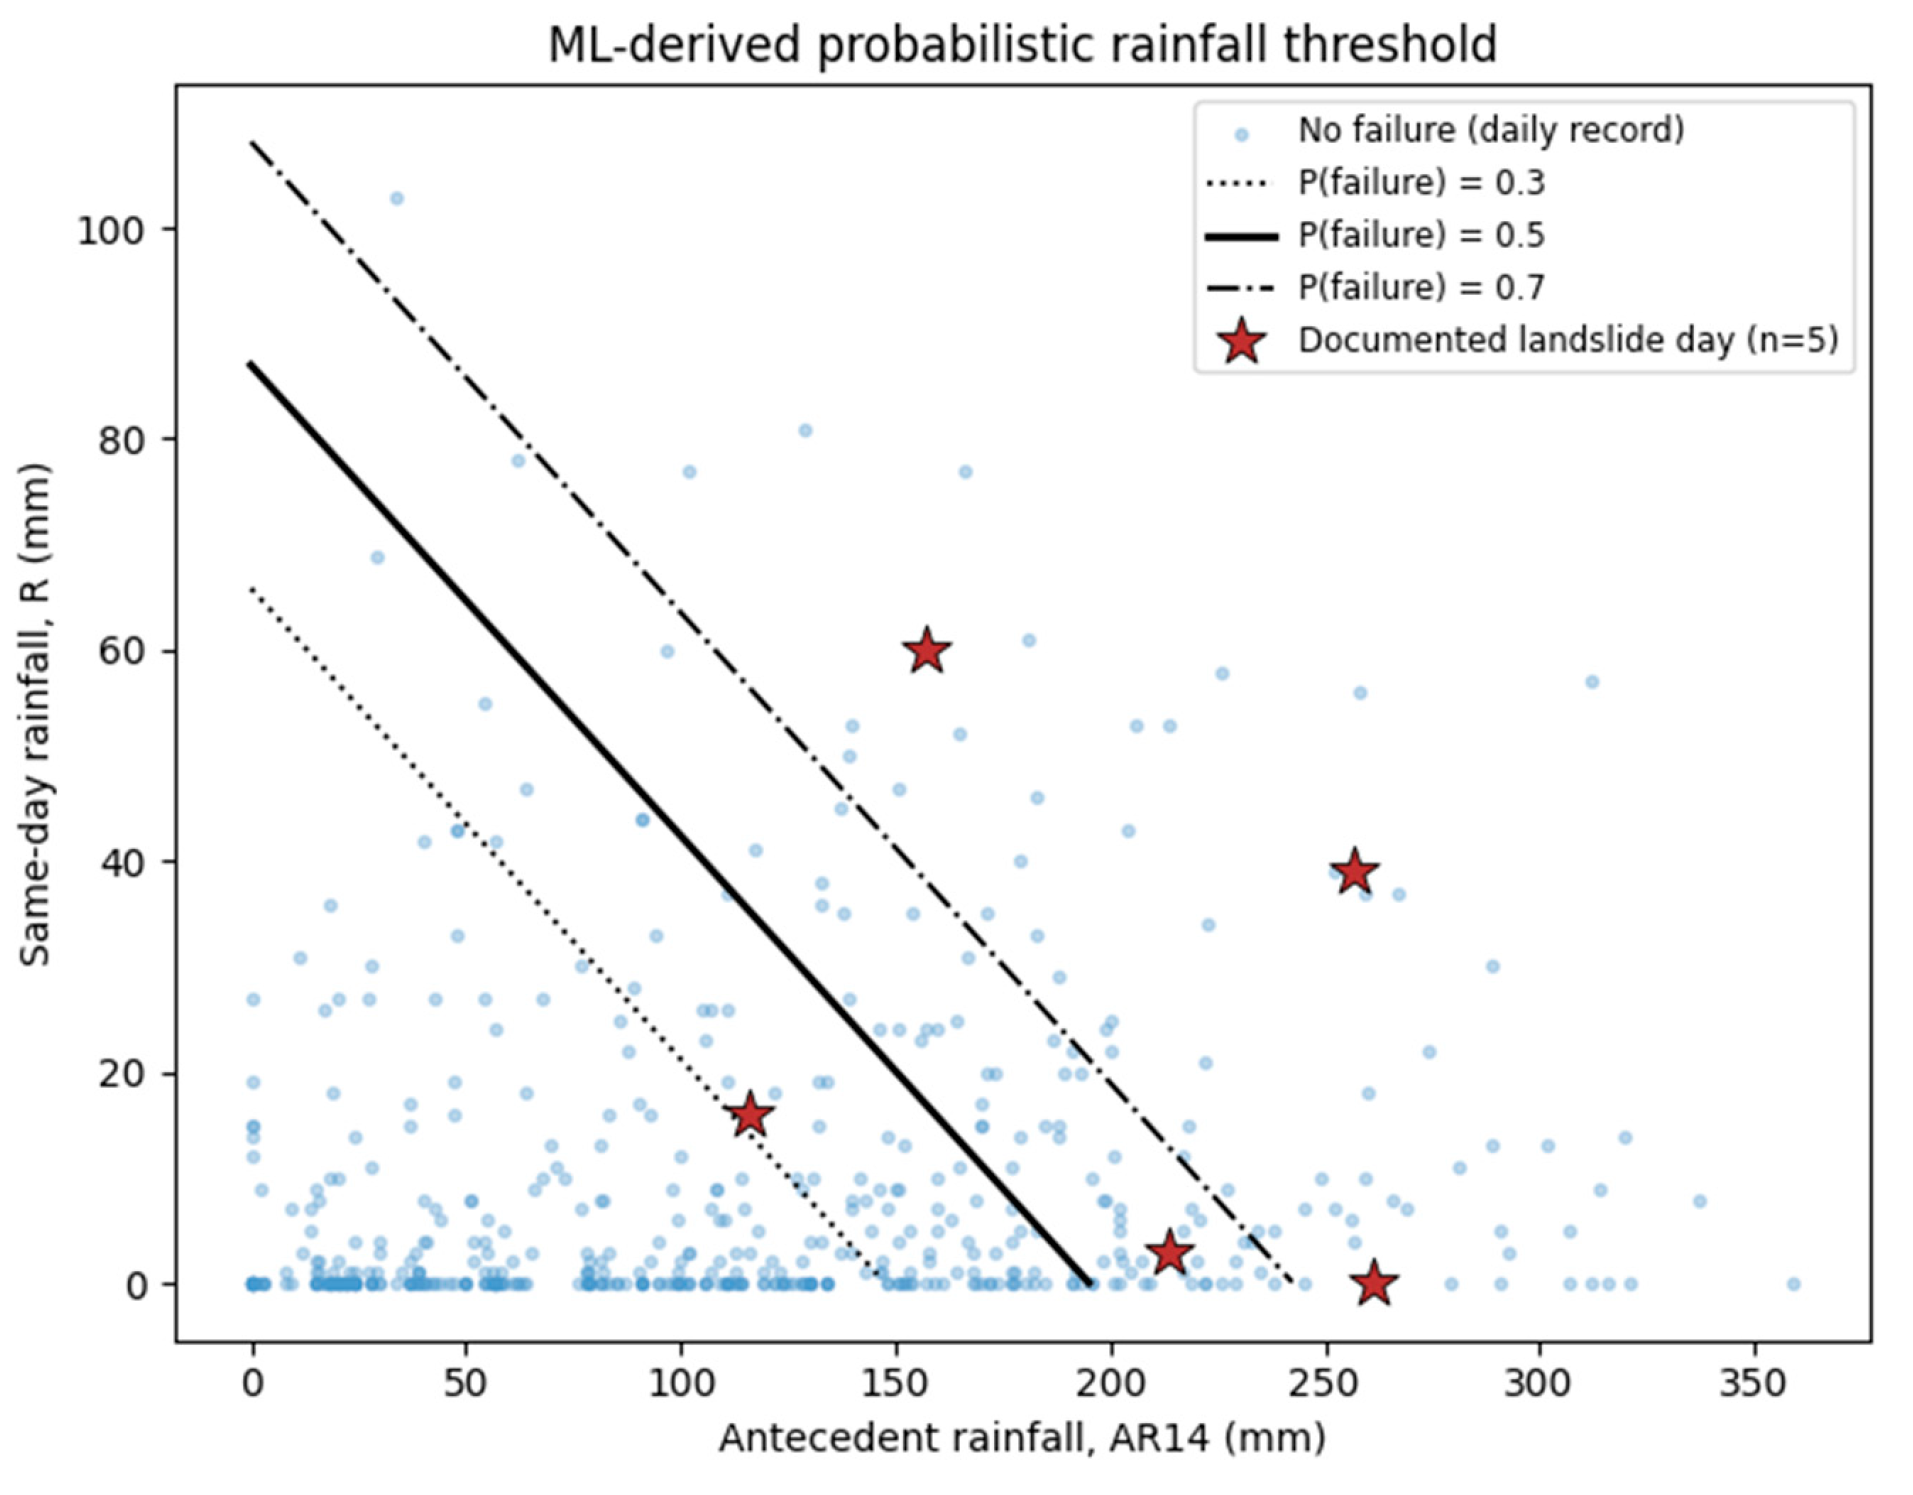
A class-balanced logistic regression on 14-day antecedent rainfall (AR14, the cumulative rainfall over the full 14 days preceding and excluding the current day) and same-day rainfall (R), fitted using the standard logistic link of Equation (6), gives the explicit threshold equation:
with , where AR14 and R are both in millimetres. Solving Equation (8) for R at fixed probability levels produces the boundary curves shown in Figure 10; the p = 0.5 curve, for example, runs from R ≈ 87 mm at AR14 = 0 mm down to R = 0 mm at AR14 ≈ 195 mm. Once 14-day antecedent rainfall exceeds approximately 195 mm, a nominally dry day lies at or above the model-derived p = 0.5 logistic regression contour (the corresponding p = 0.3 boundary, at R = 0 mm, is AR14 ≈ 148 mm). Because no post hoc probability calibration was performed, these probability levels are interpreted as model-derived decision contours rather than independently calibrated estimates of absolute landslide probability. Given the very small event inventory, uncertainty on this boundary was quantified in two complementary ways: a leave-one-failure-out jackknife gives a comparatively stable AR14 range of approximately 174–215 mm across the five folds, while a class-stratified bootstrap (5000 resamples) yields a much wider and right-skewed 95% interval of approximately 153–552 mm, reflecting the instability of the fitted slope coefficient when resampled at n = 5 positive events. The two estimates are reported together, rather than the bootstrap interval alone, because the wide bootstrap range is itself partly an artefact of occasional near-zero resampled slopes rather than of the boundary location being genuinely this uncertain in every resample. Both intervals are wide enough to confirm that the point estimate (195 mm) should be treated as indicative rather than as a precise design value, consistent with the pilot framing adopted throughout. Three of the five documented failures lie at or above the p = 0.5 curve, and all five lie at or above the p = 0.3 curve, indicating that the two-feature model captures the great majority of the observed triggering conditions while still leaving most of the space (and therefore of ordinary rainy days) below the p = 0.3 contour.
Figure 10.
Logistic regression rainfall threshold: same-day rainfall (R) vs. 14-day antecedent rainfall (AR14), with model-derived p = 0.3, 0.5, and 0.7 probability contours. Stars mark the five documented failures. The probability contours are uncalibrated and are interpreted as model-derived decision boundaries rather than estimates of absolute landslide probability.
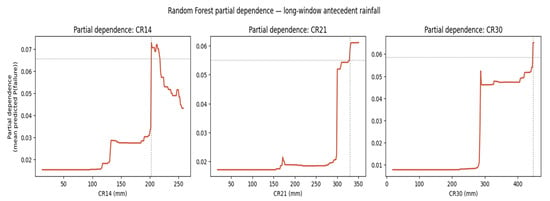
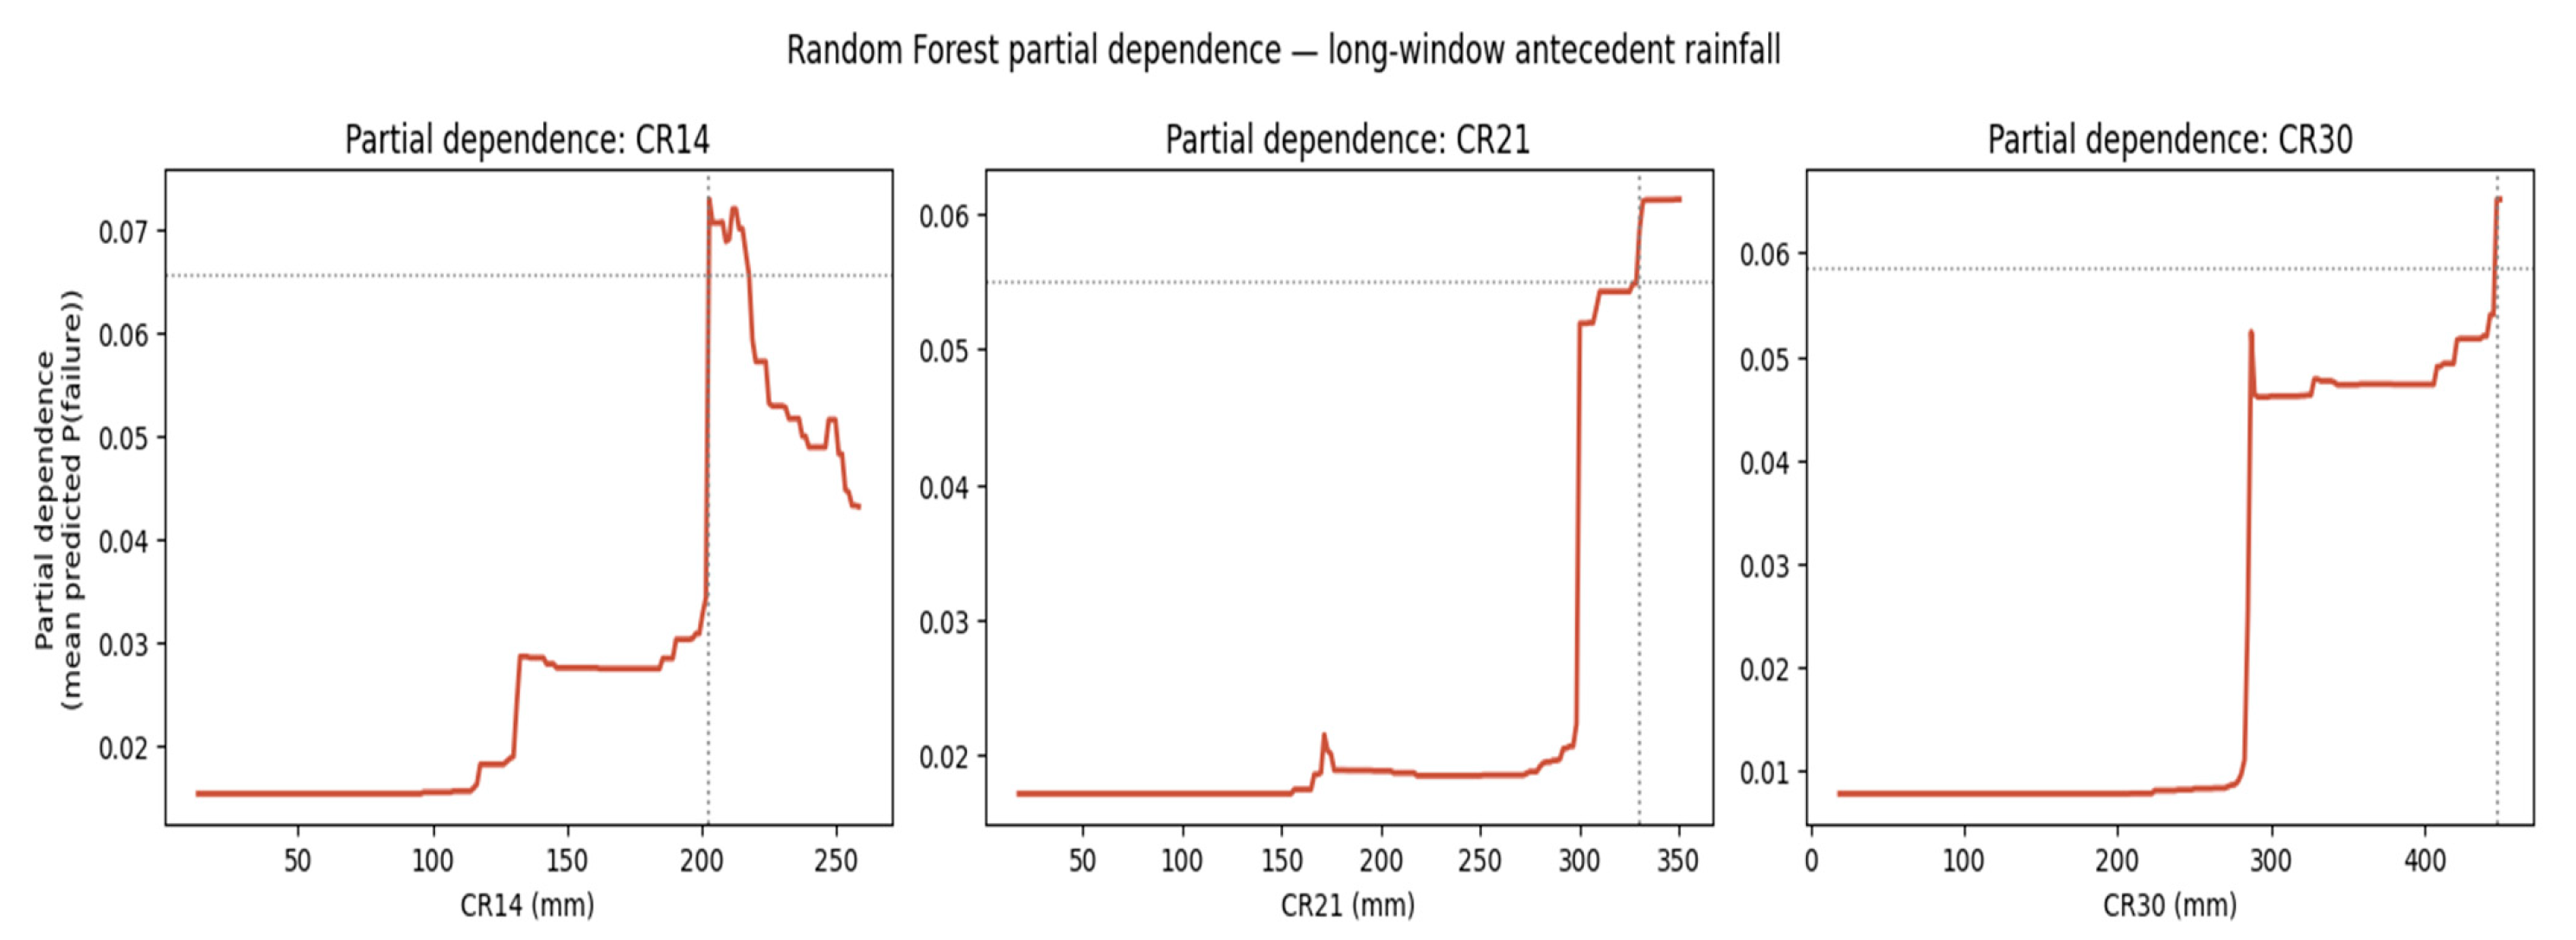
Random Forest partial-dependence curves for the three most important cumulative-rainfall windows (Figure 11) show a broadly consistent pattern: predicted failure probability remains low and roughly flat at low cumulative rainfall, then rises and begins to saturate (reaching 90% of its maximum response) at approximately 203 mm for CR14, 330 mm for CR21, and 447 mm for CR30. The CR14 saturation point of approximately 203 mm should not be directly compared numerically with the logistic regression p = 0.5 boundary of AR14 ≈ 195 mm because the two variables use different temporal definitions: CR14 includes rainfall on the current day, whereas AR14 represents the preceding 14 days and excludes the current day. The two analyses therefore provide complementary evidence of the importance of multi-day rainfall accumulation, but their numerical threshold values are not equivalent or directly interchangeable.
Figure 11.
Random Forest partial dependence for CR14, CR21 and CR30 (model fit on all five sites). Dashed lines mark the 90%-of-maximum-response (“saturation”) point for each window.
3.6. Candidate Two-Tier Threshold for Prospective Evaluation
Considering the naive minimum-envelope, logistic-boundary, and partial-dependence evidence above, the threshold results are interpreted according to their respective rainfall-window definitions. For CR14, which includes the current day, the observed-failure minimum of 132 mm provides a conservative empirical reference, while the Random Forest partial-dependence response reaches its 90%-of-maximum saturation point at approximately 203 mm. Separately, the logistic regression model uses AR14, which excludes the current day, together with same-day rainfall (R); its p = 0.5 boundary reaches R = 0 at AR14 ≈ 195 mm. Because CR14 and AR14 represent different temporal windows, the 203 mm and 195 mm values are not treated as convergent or interchangeable thresholds. For the proposed preliminary, site-specific two-tier rainfall-probability framework, a watch level is therefore associated with CR14 reaching approximately 130 mm or the Random Forest probability exceeding its Youden-optimal cutoff (≥0.055), whereas a warning-level reference is associated with CR14 approaching the Random Forest saturation point of approximately 203 mm or same-day rainfall reaching approximately 60 mm, as observed for the KM 45 event. The AR14 logistic regression boundary is retained as a separate probability-based diagnostic and is not used to define the CR14 warning level. This two-tier structure mirrors the escalating watch or warning terminology conventionally used in rainfall-based early-warning systems [17,18] and is presented as a candidate rule for prospective testing rather than as a validated stand-alone early-warning decision rule.
Operationally, the watch level is intended to trigger increased data review and, where practicable, field observation of the five monitored cut-slopes, while the warning level is intended to trigger the more restrictive response measures that the responsible authority would ordinarily reserve for its highest-confidence rainfall alerts. These watch and warning levels are preliminary, site-specific criteria proposed for prospective evaluation and are not presented as validated operational thresholds. They have not been independently validated against failure events beyond the five study sites used to derive them, and their prospective performance, particularly the false-alarm rate implied by Section 3.4, should be evaluated using additional independent events before any formal deployment decision is made. Because the threshold is derived entirely from the rainfall record analyzed in this study, its probability tiers, unlike an instrumented-displacement alarm, can in principle be evaluated continuously from rain-gauge or radar-rainfall data alone, before any physical sign of instability is observed at the slope. This lead-time property and the threshold’s current status as a literature-grounded pilot value rather than a validated operational design threshold are discussed further in Section 4.
4. Discussion
4.1. Antecedent Rainfall Dominance and Its Physical Interpretation
The dominance of 14–30-day cumulative-rainfall features over same-day rainfall in both the Random Forest feature-importance ranking and the naive minimum-envelope threshold supports the broader literature showing that rainfall-triggered slope responses depend on cumulative antecedent conditions as well as short-duration rainfall [3,4,9]. This contrasts with the classical Caine [1] intensity–duration formulation developed for shallow landslides and debris flows. Malaysian residual-soil laboratory and numerical studies likewise show that rainfall infiltration progressively alters soil suction and pore-water-pressure conditions, with the response influenced by initial moisture conditions and rainfall duration [9]. Franceschini et al. [16] similarly found that approximately one-week antecedent rainfall (7–9 days) was more influential than short-duration rainfall for a deep-seated, reactivated Italian landslide. Conversely, Nocentini et al. [13] identified daily rainfall (CR1) as the most important cumulative-rainfall predictor for a regional Norwegian inventory composed mainly of shallow landslides, which the authors associated primarily with short-duration, intense rainfall. These apparently contrasting findings suggest that the relative importance of short- versus long-duration rainfall may reflect differences in landslide type and local hydrogeological conditions rather than a universally optimal antecedent window. The present inventory illustrates this heterogeneity: the KM 43.4 failure occurred on a 0 mm rainfall day preceded by an unusually high 30-day antecedent total, whereas KM 45 followed a 60 mm daily rainfall burst under more moderate antecedent conditions. These physical interpretations are plausible and not directly verified at the five study sites because hydrogeological variables were not measured; the present analysis therefore establishes statistical associations rather than direct evidence of pore-pressure or infiltration processes.
4.2. Comparison with the Wider Rainfall-Threshold Literature
Previous studies have established rainfall thresholds for Malaysia and the wider Southeast Asian region; however, these have predominantly been formulated using conventional intensity–duration (I–D) relationships at relatively broad spatial scales. Lu et al. [4], for example, developed country-level I–D rainfall thresholds for six ASEAN countries, including Malaysia, using regional landslide records and satellite precipitation data. Their results also demonstrated the importance of antecedent rainfall, with landslide frequency increasing with cumulative precipitation prior to failure. Nevertheless, such country-scale thresholds do not provide the site-specific resolution, nor do they explicitly evaluate multiple nested antecedent-rainfall windows adopted in the present study. Accordingly, the present framework complements existing regional threshold approaches by deriving a locally calibrated, machine-learning-based rainfall threshold for the investigated Malaysian road slopes, while explicitly examining rainfall accumulation over multiple antecedent periods. In relative terms, however, the Random Forest ROC-AUC obtained here (0.817) sits within the range reported across the reviewed ML rainfall-threshold literature, below the larger, national-scale study of Shao et al. [14] (AUC = 0.92), and Franceschini et al. [16] (AUC = 0.92 using the more complete rainfall record), but comparable to other reported results, including Franceschini et al. [16] (AUC = 0.68 using the less complete rainfall record) and Dal Seno et al. [15] (AUC = 0.85 for their best model on an 18:1 imbalanced dataset). This pattern is consistent with Franceschini et al.’s [16] explicit finding that rainfall data completeness strongly affects achievable discrimination. The 90%-saturation partial-dependence values obtained here (approximately 203, 330 and 447 mm for CR14, CR21 and CR30) are broadly comparable in order of magnitude, though not directly equivalent in window definition, to the 50–90 mm 8-day cumulative-rainfall thresholds identified by Franceschini et al. [16] and to the regional Alpes-Maritimes threshold recently re-derived by Barthélemy et al. [20], underscoring that Malaysian tropical rainfall totals required to approach saturation are substantially higher in absolute terms than in the temperate European catchments most represented in this literature. This is an expected consequence of the much higher background rainfall totals typical of an equatorial monsoon climate.
4.3. Model Choice and Class Imbalance
The relatively modest advantage of Random Forest over logistic regression (ROC-AUC 0.817 vs. 0.737; Table 3), and the comparatively poor performance of Gradient Boosting (0.600), together suggest that model ranking on very small landslide inventories is itself unstable and dataset-dependent. K-nearest neighbours (0.689), despite its strong showing on the similarly small Kerala inventory of Menon and Kolathayar [12] (where it achieved the best AUC of the methods they tested), ranks in the middle of the six classifiers evaluated here rather than at either extreme, underscoring that its k = 5 hyperparameter, carried over from the Kerala study rather than independently tuned on the present dataset, is not straightforwardly transferable across inventories in either direction. This reinforces Dal Seno et al.’s [15] observation that increased model complexity and the incorporation of additional rainfall parameters yield only modest gains in predictive performance. The severe class imbalance in this study (5 positive site-days of 520, or 0.96%) is more extreme than the balanced Kerala inventory of Menon and Kolathayar [12] or the systematically tuned 1×–100× ratios explored by Nocentini et al. [13], and closer in spirit to the 18:1 imbalance handled by class-weighting and F2-scoring in Dal Seno et al. [15]. The decision taken here to use cost-sensitive class weighting rather than synthetic oversampling (SMOTE and its variants, as applied to landslide classification by Lv et al. [23] and Lu et al. [24], or the general class-imbalance strategies for geohazard prediction reviewed by Kumar et al. [22]) reflects a judgement that, with only five true positive examples, any synthetic minority-class interpolation risks fabricating an unrepresentative feature-space representation; this trade-off should be revisited as a priority for future work once more failure events are available to validate oversampling-based approaches directly.
4.4. Limitations
- Sample size: Five failure events is a very small inventory for statistical threshold-fitting. All performance metrics (Random Forest ROC-AUC = 0.817) should be treated as indicative rather than as robust, regionally generalizable design values. As reported in Section 3.2, the 95% confidence interval on this AUC spans approximately 0.56–0.97 (bootstrap) to 0.59–1.00 (Hanley–McNeil), and the leave-one-failure-out jackknife range is 0.77–0.94. The results should be read as a methodological pilot consistent with the data limitations and need for further validation discussed by Menon and Kolathayar [12] and Franceschini et al. [16]. Bootstrap and jackknife confidence intervals for ROC-AUC and PR-AUC, and a bootstrap/jackknife uncertainty range for the logistic regression AR14 boundary (Section 3.5), have been computed and reported; formal significance testing between classifiers was not performed and remains a priority addition once a larger validation dataset is available.
- Probability calibration: No separate post hoc calibration of the classifier probability outputs was performed because only five positive events were available. Consequently, the reported probability values and associated contours should be interpreted as model-derived scores and decision boundaries rather than as independently calibrated estimates of absolute landslide probability. Probability calibration should be reassessed when a larger independent event inventory becomes available.
- Class imbalance: With five positive site-days of 520 (0.96%), ROC-AUC is inflated relative to PR-AUC, and most of the false positives reported in Section 3.2 are a structural feature of operating any useably sensitive threshold at this base rate, not evidence of a modelling defect per se.
- Limited ground-truthing of non-failure days: Days not flagged as documented failures were treated as non-failure days in the analysis. However, the available source records cannot exclude the possibility of unreported minor instability during high-rainfall non-flagged days, which, if present, could increase the estimated false-alarm rate. This limitation arises from the event records available for the five sites and could be addressed in future studies through continuous slope inspection or instrumentation records covering the full monitoring period.
- Limited availability of directly comparable Malaysian benchmarks: The literature reviewed in this study did not identify a directly comparable calibrated rainfall threshold for Malaysian slopes with equivalent site-specific conditions and rainfall-window definitions. Consequently, the thresholds derived here were calibrated using the five-event dataset available for the study corridor and should be regarded as preliminary site-specific estimates requiring validation against additional Malaysian landslide events.
- Potential hydroclimatic non-stationarity: Regional hydroclimatic projections for Peninsular Malaysia under CMIP6 scenarios indicate potential changes in wet- and dry-spell characteristics [30]. Consequently, thresholds calibrated using the 2019–2024 rainfall record may require reassessment or recalibration if rainfall regimes change over time.
4.5. Pathway to Operational Use and Future Work
The rainfall-probability thresholds proposed in Section 3.6 are preliminary and site-specific to the investigated FT185 corridor and should not be interpreted as validated operational or design thresholds. Prospective validation against additional independent failure events is required before their operational applicability can be established. Densifying rainfall and, where feasible, soil-moisture or pore-pressure monitoring along FT185 using low-cost IoT sensor networks, consistent with the approach proposed by Marino et al. [21], would both improve the antecedent-rainfall feature quality used here and generate the additional independent events needed to properly validate rather than merely illustrate the two-tier threshold proposed in Section 3.6. As more failure events are recorded, synthetic oversampling methods (SMOTE-Tomek, SMOTE-ENN [23,24]) and deep-learning forecasting approaches [27,28,29] become increasingly viable and should be revisited. At the present five-event scale, however, the simpler, more interpretable Random Forest and logistic regression approaches adopted here, combined with explicit partial-dependence and SHAP-style reasoning [14,16,25,26], provide a suitable basis for prospective evaluation of the proposed pilot rainfall-probability framework.
Beyond its function as an early-warning decision rule, the two-tier rainfall-probability threshold proposed in Section 3.6 has direct relevance to land management along the FT185 corridor. For the technical agencies and local municipal councils, the watch and warning tiers could be integrated directly into linear-infrastructure asset-management schedules, prioritizing roadside slope inspection, drainage maintenance and vegetation management at the five monitored cut-slopes ahead of forecast antecedent-rainfall accumulation, rather than only reacting after a failure is reported.
5. Conclusions
This study developed a machine-learning-derived rainfall threshold for five documented shallow-slope failures along Federal Route FT185, Cameron Highlands, Malaysia, using cumulative-rainfall features engineered over seven time windows (1–30 days) and six classifiers compared under leave-one-site-out cross-validation. Random Forest gave the best discrimination (ROC-AUC = 0.817; 95% CI approximately 0.56–0.97), achieving 80% sensitivity and 90% specificity at its Youden-optimal cutoff. It also consistently ranked the 14–30-day cumulative-rainfall features above CR1 in predictive importance, highlighting the role of longer-duration rainfall accumulation in the present dataset. Notably, one failure (KM 43.4) occurred on a day with zero same-day rainfall but the highest 30-day antecedent total (490 mm) in the dataset. An explicit, interpretable logistic regression probability equation was derived within the proposed rainfall-probability framework for the FT185 corridor. Random Forest partial-dependence saturation points were also identified at approximately 203, 330 and 447 mm for the 14-, 21- and 30-day cumulative-rainfall windows, respectively, and each output was interpreted separately according to its own rainfall-window definition. The derived values should therefore be regarded as preliminary, site-specific thresholds for the investigated FT185 corridor rather than validated operational or design thresholds. Prospective validation against additional independent and instrumented failure events, supported by densified rainfall and pore-pressure monitoring, is required to evaluate their reliability and generalizability beyond the five events analyzed here.
Author Contributions
Conceptualization, R.A.H., F.C.R. and S.S.A.; data curation, M.S.A.R., M.N.A. and F.H.; formal analysis, R.A.H., F.C.R., A.I. and F.H.; methodology, R.A.H., F.C.R. and S.S.A.; project administration, F.C.R.; resources, M.S.A.R., M.N.A. and N.H.; supervision, F.C.R., S.S.A. and A.I.; validation, F.C.R., S.S.A. and N.H.; visualization, R.A.H. and F.C.R.; writing—original draft preparation, R.A.H. and F.C.R.; writing—review and editing, R.A.H. and F.C.R. All authors have read and agreed to the published version of the manuscript.
Funding
This research received no external funding.
Data Availability Statement
The data used in this study are not publicly available because of data-sharing restrictions associated with the source records. These restrictions also preclude the public release of derivative or processed versions of the rainfall records. To support reproducibility within these constraints, the manuscript provides complete feature definitions, model configurations, validation procedures and fold structure, event-level cumulative-rainfall values, and the principal model and threshold outputs. The inability to release the underlying data limits full independent reproducibility. Additional information may be made available by the corresponding author upon reasonable request, subject to the applicable data-sharing restrictions.
Conflicts of Interest
The authors declare no conflicts of interest.
Abbreviations
The following abbreviations are used in this manuscript:
| AI | Artificial Intelligence |
| ANN | Artificial Neural Network |
| AR | Antecedent Rainfall |
| AUC | Area Under the Curve |
| CNN | Convolutional Neural Network |
| CR | Cumulative Rainfall |
| EWS | Early-Warning System |
| F2 | F-beta score with beta = 2 (recall-weighted F-score) |
| GBM | Gradient Boosting Machine |
| GIS | Geographic Information System |
| I-D | Intensity–Duration |
| IoT | Internet of Things |
| k-NN | k-Nearest Neighbours |
| LEWS | Landslide Early-Warning System |
| LOSO-CV | Leave-One-Site-Out Cross-Validation |
| ML | Machine Learning |
| PDP | Partial Dependence Plot |
| PR-AUC | Precision–Recall Area Under the Curve |
| RF | Random Forest |
| ROC | Receiver Operating Characteristic |
| SHAP | SHapley Additive exPlanations |
| SMOTE | Synthetic Minority Over-sampling Technique |
| SVM | Support Vector Machine |
| XAI | Explainable Artificial Intelligence |
| XGBoost | Extreme Gradient Boosting |
Appendix A
Extended Descriptive Statistics
Table A1 reports extended per-site descriptive statistics of the daily rainfall record underlying Table 2 and Figure 3 and Figure 4, computed directly from the 520 site-days of data described in Section 2.2.
Table A1.
Extended descriptive statistics of daily rainfall by site (520 site-days total).
References
- Caine, N. The Rainfall Intensity-Duration Control of Shallow Landslides and Debris Flows. Geogr. Ann. Ser. A Phys. Geogr. 1980, 62, 23–27. [Google Scholar] [CrossRef] [Scilit]
- Guzzetti, F.; Peruccacci, S.; Rossi, M.; Stark, C.P. The Rainfall Intensity–Duration Control of Shallow Landslides and Debris Flows: An Update. Landslides 2008, 5, 3–17. [Google Scholar] [CrossRef] [Scilit]
- Gonzalez, F.C.G.; Cavalcanti, M.C.R.; Ribeiro, W.N.; de Mendonça, M.B.; Haddad, A.N. A Systematic Review on Rainfall Thresholds for Landslides Occurrence. Heliyon 2023, 10, e23247. [Google Scholar] [CrossRef] [Scilit]
- Lu, W.; Xiao, Z.; Chen, Y.; Sun, J.; Chen, F. Spatiotemporal Characteristics and Rainfall Thresholds of Geological Landslide Disasters in ASEAN Countries. Atmosphere 2024, 15, 599. [Google Scholar] [CrossRef]
- Bui, D.T.; Shahabi, H.; Shirzadi, A.; Chapi, K.; Alizadeh, M.; Chen, W.; Mohammadi, A.; Ahmad, B.B.; Panahi, M.; Hong, H.; et al. Landslide Detection and Susceptibility Mapping by AIRSAR Data Using Support Vector Machine and Index of Entropy Models in Cameron Highlands, Malaysia. Remote Sens. 2018, 10, 1527. [Google Scholar] [CrossRef] [Scilit]
- Zainal Abidin, R.; Mahamud, M.A.; Abdullah, J.; Mohd Kasim, M.Z.; Yusof, M.F.; Mohd Arif Zainol, M.R. Mapping Landslide Events at Cameron Highlands, Malaysia in Relation to Land Use, Rainfall and Elevation Using Geographical Information System. IOP Conf. Ser. Earth Environ. Sci. 2023, 1249, 012005. [Google Scholar] [CrossRef] [Scilit]
- Murthy, T.; Mohamad Yusoff, I.; Samsudin, S.H.; Majid, T.A.; Ahmad Abir, I.; Yong, C.H.; Mohamad Ismail, M.A. Geographical Information System (GIS)-Based Landslide Susceptibility Mapping in Malaysia: A Review of Past, Current and Future Trends. Acad. J. Interdiscip. Stud. 2023, 12, 235. [Google Scholar] [CrossRef] [Scilit]
- Dorairaj, D.; Osman, N. Present Practices and Emerging Opportunities in Bioengineering for Slope Stabilization in Malaysia: An Overview. PeerJ 2021, 9, e10477. [Google Scholar] [CrossRef] [Scilit]
- Lee, M.L.; Koo, C.H.; Chong, S.Y.; Chin, D.J. Laboratory and Numerical Studies of Rainfall Infiltration into Residual Soil Slope Improved by Biomediated Soil Cover. Water 2022, 14, 744. [Google Scholar] [CrossRef] [Scilit]
- Mondini, A.C.; Guzzetti, F.; Melillo, M. Deep Learning Forecast of Rainfall-Induced Shallow Landslides. Nat. Commun. 2023, 14, 2466. [Google Scholar] [CrossRef] [Scilit]
- Kudaibergenov, M.; Nurakynov, S.; Iskakov, B.; Iskaliyeva, G.; Maksum, Y.; Orynbassarova, E.; Akhmetov, B.; Sydyk, N. Application of Artificial Intelligence in Landslide Susceptibility Assessment: Review of Recent Progress. Remote Sens. 2025, 17, 34. [Google Scholar] [CrossRef] [Scilit]
- Menon, V.; Kolathayar, S. Empirical and Machine Learning-Based Approaches to Identify Rainfall Thresholds for Landslide Prediction: A Case Study of Kerala, India. Discov. Appl. Sci. 2025, 7, 203. [Google Scholar] [CrossRef] [Scilit]
- Nocentini, N.; Rosi, A.; Piciullo, L.; Liu, Z.; Segoni, S.; Fanti, R. Regional-Scale Spatiotemporal Landslide Probability Assessment through Machine Learning and Potential Applications for Operational Warning Systems: A Case Study in Kvam (Norway). Landslides 2024, 21, 2369–2387. [Google Scholar] [CrossRef] [Scilit]
- Shao, X.; Yan, W.; Yan, C.; Zhao, W.; Wang, Y.; Shi, X.; Dong, H.; Li, T.; Yu, J.; Zuo, P.; et al. Explainable Machine Learning for Mapping Rainfall-Induced Landslide Thresholds in Italy. Appl. Sci. 2025, 15, 7937. [Google Scholar] [CrossRef] [Scilit]
- Dal Seno, N.; Evangelista, D.; Piccolomini, E.; Berti, M. Comparative Analysis of Conventional and Machine Learning Techniques for Rainfall Threshold Evaluation under Complex Geological Conditions. Landslides 2024, 21, 2893–2911. [Google Scholar] [CrossRef] [Scilit]
- Franceschini, R.; Nocentini, N.; Rosi, A.; Tunini, L.; Zuliani, D.; Peressi, G.; Rossi, G. Deriving Rainfall Thresholds with XAI and GNSS Measurements for a Large Landslide. Landslides 2025, 23, 741–754. [Google Scholar] [CrossRef] [Scilit]
- Segoni, S.; Nocentini, N.; Barbadori, F.; Medici, C.; Gatto, A.; Rosi, A.; Casagli, N. A Novel Prototype National-Scale Landslide Nowcasting System for Italy Combining Rainfall Thresholds and Risk Indicators. Landslides 2025, 22, 1341–1366. [Google Scholar] [CrossRef] [Scilit]
- Liu, S.; Du, J.; Yin, K.; Zhou, C.; Huang, C.; Jiang, J.; Yu, J. Regional Early Warning Model for Rainfall Induced Landslide Based on Slope Unit in Chongqing, China. Eng. Geol. 2024, 336, 107464. [Google Scholar] [CrossRef] [Scilit]
- Dixit, S.; Siva Subramanian, S.; Srivastava, P.; Yunus, A.P.; Martha, T.R.; Sen, S. Numerical-Model-Derived Intensity–Duration Thresholds for Early Warning of Rainfall-Induced Debris Flows in a Himalayan Catchment. Nat. Hazards Earth Syst. Sci. 2024, 24, 465–480. [Google Scholar] [CrossRef] [Scilit]
- Barthélemy, S.; Bernardie, S.; Grandjean, G. Assessing Rainfall Threshold for Shallow Landslides Triggering: A Case Study in the Alpes Maritimes Region, France. Nat. Hazards 2025, 121, 4023–4049. [Google Scholar] [CrossRef] [Scilit]
- Marino, P.; Roman Quintero, D.C.; Santonastaso, G.F.; Greco, R. Prototype of an IoT-Based Low-Cost Sensor Network for the Hydrological Monitoring of Landslide-Prone Areas. Sensors 2023, 23, 2299. [Google Scholar] [CrossRef] [Scilit]
- Kumar, P.; Priyanka; Uday, K.V.; Dutt, V. Addressing Class Imbalance in Soil Movement Predictions. Nat. Hazards Earth Syst. Sci. 2024, 24, 1913–1928. [Google Scholar] [CrossRef] [Scilit]
- Lv, M.; Li, K.; Cai, J.; Mao, J.; Gao, J.; Xu, H. Evaluation of Landslide Susceptibility Based on SMOTE-Tomek Sampling and Machine Learning Algorithm. PLoS ONE 2025, 20, e0323487. [Google Scholar] [CrossRef] [Scilit]
- Lu, M.; Tay, L.T.; Mohamad-Saleh, J. Landslide Susceptibility Analysis Using Random Forest Model with SMOTE-ENN Resampling Algorithm. Geomat. Nat. Hazards Risk 2024, 15, 2314565. [Google Scholar] [CrossRef] [Scilit]
- Le, X.-H.; Choi, C.; Eu, S.; Yeon, M.; Lee, G. Quantitative Evaluation of Uncertainty and Interpretability in Machine Learning-Based Landslide Susceptibility Mapping through Feature Selection and Explainable AI. Front. Environ. Sci. 2024, 12, 1424988. [Google Scholar] [CrossRef] [Scilit]
- Khan, D.; Akram, W.; Ullah, S. Enhancing Landslide Susceptibility Predictions with XGBoost and SHAP: A Data-Driven Explainable AI Method. Geocarto Int. 2025, 40, 2514725. [Google Scholar] [CrossRef] [Scilit]
- Bao, S.; Liu, J.; Wang, L.; Konečný, M.; Che, X.; Xu, S.; Li, P. Landslide Susceptibility Mapping by Fusing Convolutional Neural Networks and Vision Transformer. Sensors 2023, 23, 88. [Google Scholar] [CrossRef] [Scilit]
- Ebrahim, K.M.P.; Fares, A.; Faris, N.; Zayed, T. Exploring Time Series Models for Landslide Prediction: A Literature Review. Geoenviron. Disasters 2024, 11, 25. [Google Scholar] [CrossRef] [Scilit]
- Strnad, D.; Mongus, D.; Horvat, Š.; Šegina, E. A Multi-Task Deep Learning Approach for Landslide Displacement Prediction with Applications in Early Warning Systems. Sci. Rep. 2026, 16, 196. [Google Scholar] [CrossRef] [Scilit]
- Arbai, N.A.M.; Irie, M. Effects of Climate Change on Wet and Dry Spells in Kelantan River Basin Using Physically-Based Hydrological Model and CMIP6 Scenarios. J. Hydrol. Reg. Stud. 2025, 58, 102219. [Google Scholar] [CrossRef] [Scilit]
- Gu, T.; Li, J.; Wang, M.; Duan, P.; Zhang, Y.; Cheng, L. Study on landslide susceptibility mapping with different factor screening methods and random forest models. PLoS ONE 2023, 18, e0292897. [Google Scholar] [CrossRef] [Scilit]
- Wu, S.; Zou, G.; Zhang, L.; Zhou, B.; Xu, D.; He, C. Multi-spatial scale analysis of cutting-slope houses to landslide hazard in granite regions: A case study in central China. Sci. Rep. 2026, 16, 17274. [Google Scholar] [CrossRef] [Scilit]
- Assel, M.; Vickers, A. The F score ranks diagnostic tests and prediction models inconsistently with their clinical utility. Diagn. Progn. Res. 2025, 9, 30. [Google Scholar] [CrossRef] [Scilit]

Disclaimer/Publisher’s Note: The statements, opinions and data contained in all publications are solely those of the individual author(s) and contributor(s) and not of MDPI and/or the editor(s). MDPI and/or the editor(s) disclaim responsibility for any injury to people or property resulting from any ideas, methods, instructions or products referred to in the content. |
© 2026 by the authors. Licensee MDPI, Basel, Switzerland. This article is an open access article distributed under the terms and conditions of the Creative Commons Attribution (CC BY) license.