


Abstract
This study examines the spatial associations between climatic conditions and construction land in China during 2000–2020. Using construction land data from CNLUCC and spatially interpolated meteorological data, five climatic indicators were selected: annual mean temperature, annual precipitation, annual sunshine duration, annual mean wind speed, and annual mean atmospheric pressure. Spatial statistical methods were employed to examine the distribution and changes in construction land across different climatic conditions and to assess their associations at the central-city level. The results show that different climatic factors exhibit distinct spatial associations with construction land. Urban land, rural residential land, and other construction land also show distinct spatial patterns across climatic conditions. Analysis of central cities and their surrounding areas further reveals a differentiation between construction land stock and recent growth, indicating that long-term spatial distribution and recent expansion represent different dimensions of construction land dynamics. These associations may reflect the combined roles of climatic and non-climatic factors and should not be interpreted as direct causal relationships. The findings provide a macro-level basis for understanding the spatial differentiation of construction land under diverse climatic conditions and for further integrating demographic, economic, technological, and land-use factors into future research.
1. Introduction
Against the backdrop of global climate change and rapid urbanization, changes in land use and construction land have become important topics in human–land relationship research. Early studies primarily explained land-use change from the perspectives of socioeconomic growth and population change. In recent years, however, climate conditions have increasingly been incorporated into analytical frameworks, with growing attention to the relationships between land-use change and the climate system [1,2]. This has contributed to a research framework characterized by cross-scale and interdisciplinary integration of multiple methods.
Climatic conditions constitute an important natural background factor shaping long-term land-use patterns. A substantial body of research has shown that climate is an important natural background factor underlying the spatial differentiation of land use and construction land. Climatic conditions such as temperature and precipitation influence the spatial distribution of different land-use types by affecting ecosystem structure, agricultural production potential, and the human living environment [3,4,5,6]. This constraining effect is particularly pronounced in ecologically fragile areas. For example, in some parts of the Qinghai–Tibet Plateau, natural factors exert a stronger influence than socioeconomic factors and have become major determinants of changes in construction land [7]. In arid, semi-arid, and high-altitude regions, precipitation and temperature impose fundamental constraints on land-use intensity and the direction of construction land expansion by affecting ecosystem services and environmental carrying capacity [8]. At the scale of cities and settlements, climatic characteristics also exert important influences. Studies have found that regional differences in temperature, precipitation, and elevation shape spatial variations in settlement size and construction land structures [9,10,11]. In addition, hydrothermal conditions and ventilation are important natural foundations for the spatial patterns of urban green spaces, gardens, and other ecological spaces [12,13]. Overall, existing research suggests that climatic conditions are closely associated with long-term spatial patterns of land use and construction land, potentially through their effects on ecological suitability and resource and environmental carrying capacity.
Climatic conditions may also be related to land use and construction land change through several indirect pathways. In contrast to the long-term background effects of climatic conditions, climate may influence land use and construction land change indirectly, particularly through extreme weather disasters and ecosystem functions. In climate-vulnerable areas, extreme weather events such as floods and droughts can significantly affect livelihoods and human safety, and may contribute to population migration. A large body of empirical research has demonstrated that severe and irreversible disaster shocks significantly increase the probability of migration and consequently lead to spatial restructuring of population distributions [14,15,16]. The effects of temperature anomalies on migration behavior vary considerably across countries and stages of development. In middle-income countries, migration often represents an adaptive response, whereas in low-income countries, mobility constraints tend to weaken such adjustment mechanisms [17]. Other studies have found that people with relatively favorable economic conditions place greater emphasis on factors such as air pollution when making migration decisions [18]. At the ecosystem level, numerous studies have shown that climate change and land-use change jointly affect soil conservation, carbon storage, and ecosystem services [3,6,19]. At broader spatial scales, climate change often plays a dominant role [4]. Climate change may be related to construction land expansion through changes in ecosystem functions and land productivity, particularly in ecologically sensitive areas and regions subject to strong food-security constraints [3,8].
Land-use and construction land changes also generate feedback effects on regional climate. Importantly, the influence of climatic conditions on land use is not unidirectional; changes in land use can also exert reverse effects on regional climatic conditions, and this phenomenon has received considerable scholarly attention. Research on the bidirectional feedback relationship between the two indicates that land-use change and construction land expansion may affect local and regional climates by altering land-cover types and underlying surface characteristics [1,20,21,22]. Simulations based on regional climate models show that the conversion of agricultural or forest land into construction land generally leads to higher temperatures and, to some extent, alters precipitation and wind-field characteristics. These effects are particularly pronounced during summer and in highly urbanized areas [21,22]. Further data analysis indicates that urbanization significantly increases the frequency of extreme high-temperature events, while its effects on extreme precipitation exhibit substantial spatial heterogeneity [23]. In addition, construction land expansion is closely associated with energy consumption and carbon emissions. Studies have shown that urban building energy consumption and air-conditioning use may be related to climate change, and their growth may contribute to greenhouse gas emissions at the urban scale [24]. The expansion of construction land can generate a positive feedback mechanism through increased carbon emissions and intensified urban heat-island effects, thereby exacerbating regional climate change and associated risks [2,25,26,27].
Overall, existing studies have examined the complex relationships among climatic conditions, climate change, land use, and construction land change from multiple perspectives, resulting in a relatively systematic research framework. Nevertheless, existing studies still tend to place greater emphasis on socioeconomic factors when explaining changes in construction land [28,29,30,31], while climatic factors are often treated merely as background or control variables. Quantitative assessments of the relationship between climatic conditions and construction land change remain relatively limited. Many studies have focused on the scale of urban agglomerations or regions [3,32,33], whereas macro-level empirical studies at the national scale remain relatively scarce. Some studies have adopted different scenarios and corresponding models to project future trends in land-use change [8,27,34,35]. In contrast, greater research attention should also be given to periods for which current conditions have already become historically established outcomes. In addition, further research is needed to better connect observed relationships between climatic conditions and land-use change with spatial planning practices [36,37].
Building on existing research, this study examines the spatial associations between climatic conditions and construction land in China during 2000–2020. Using five climatic indicators, it investigates the spatial distribution and changes in construction land under different climatic conditions, with different types of construction land examined separately. It further analyzes the associations between climatic conditions and construction land growth at the central-city level and compares construction land stock and growth patterns. Finally, the study discusses potential non-climatic factors underlying the observed associations and briefly considers their implications for future construction land changes.
2. Materials and Methods
2.1. Materials
The temporal scope of this study is 2000–2020, and the spatial scope covers China.
Data on changes in construction land constitute one of the core datasets required for this study. The China Land Use/Cover Dataset (CNLUCC) [38] is used in this study. The dataset is a national-scale, multi-period land-use database constructed primarily from Landsat satellite remote sensing imagery provided by the United States. The data are provided in raster format, with a central meridian of 105° E and standard parallels of 25° N and 47° N. The Krasovsky_1940_Albers projection is used, with a grid-cell size of 1 km × 1 km. It was developed through manual visual interpretation and adopts a two-level classification system. The first-level categories include: (1) cropland; (2) forestland; (3) grassland; (4) water bodies; (5) urban and rural settlements, industrial and mining land, and residential land; (6) unused land; and (9) oceans.
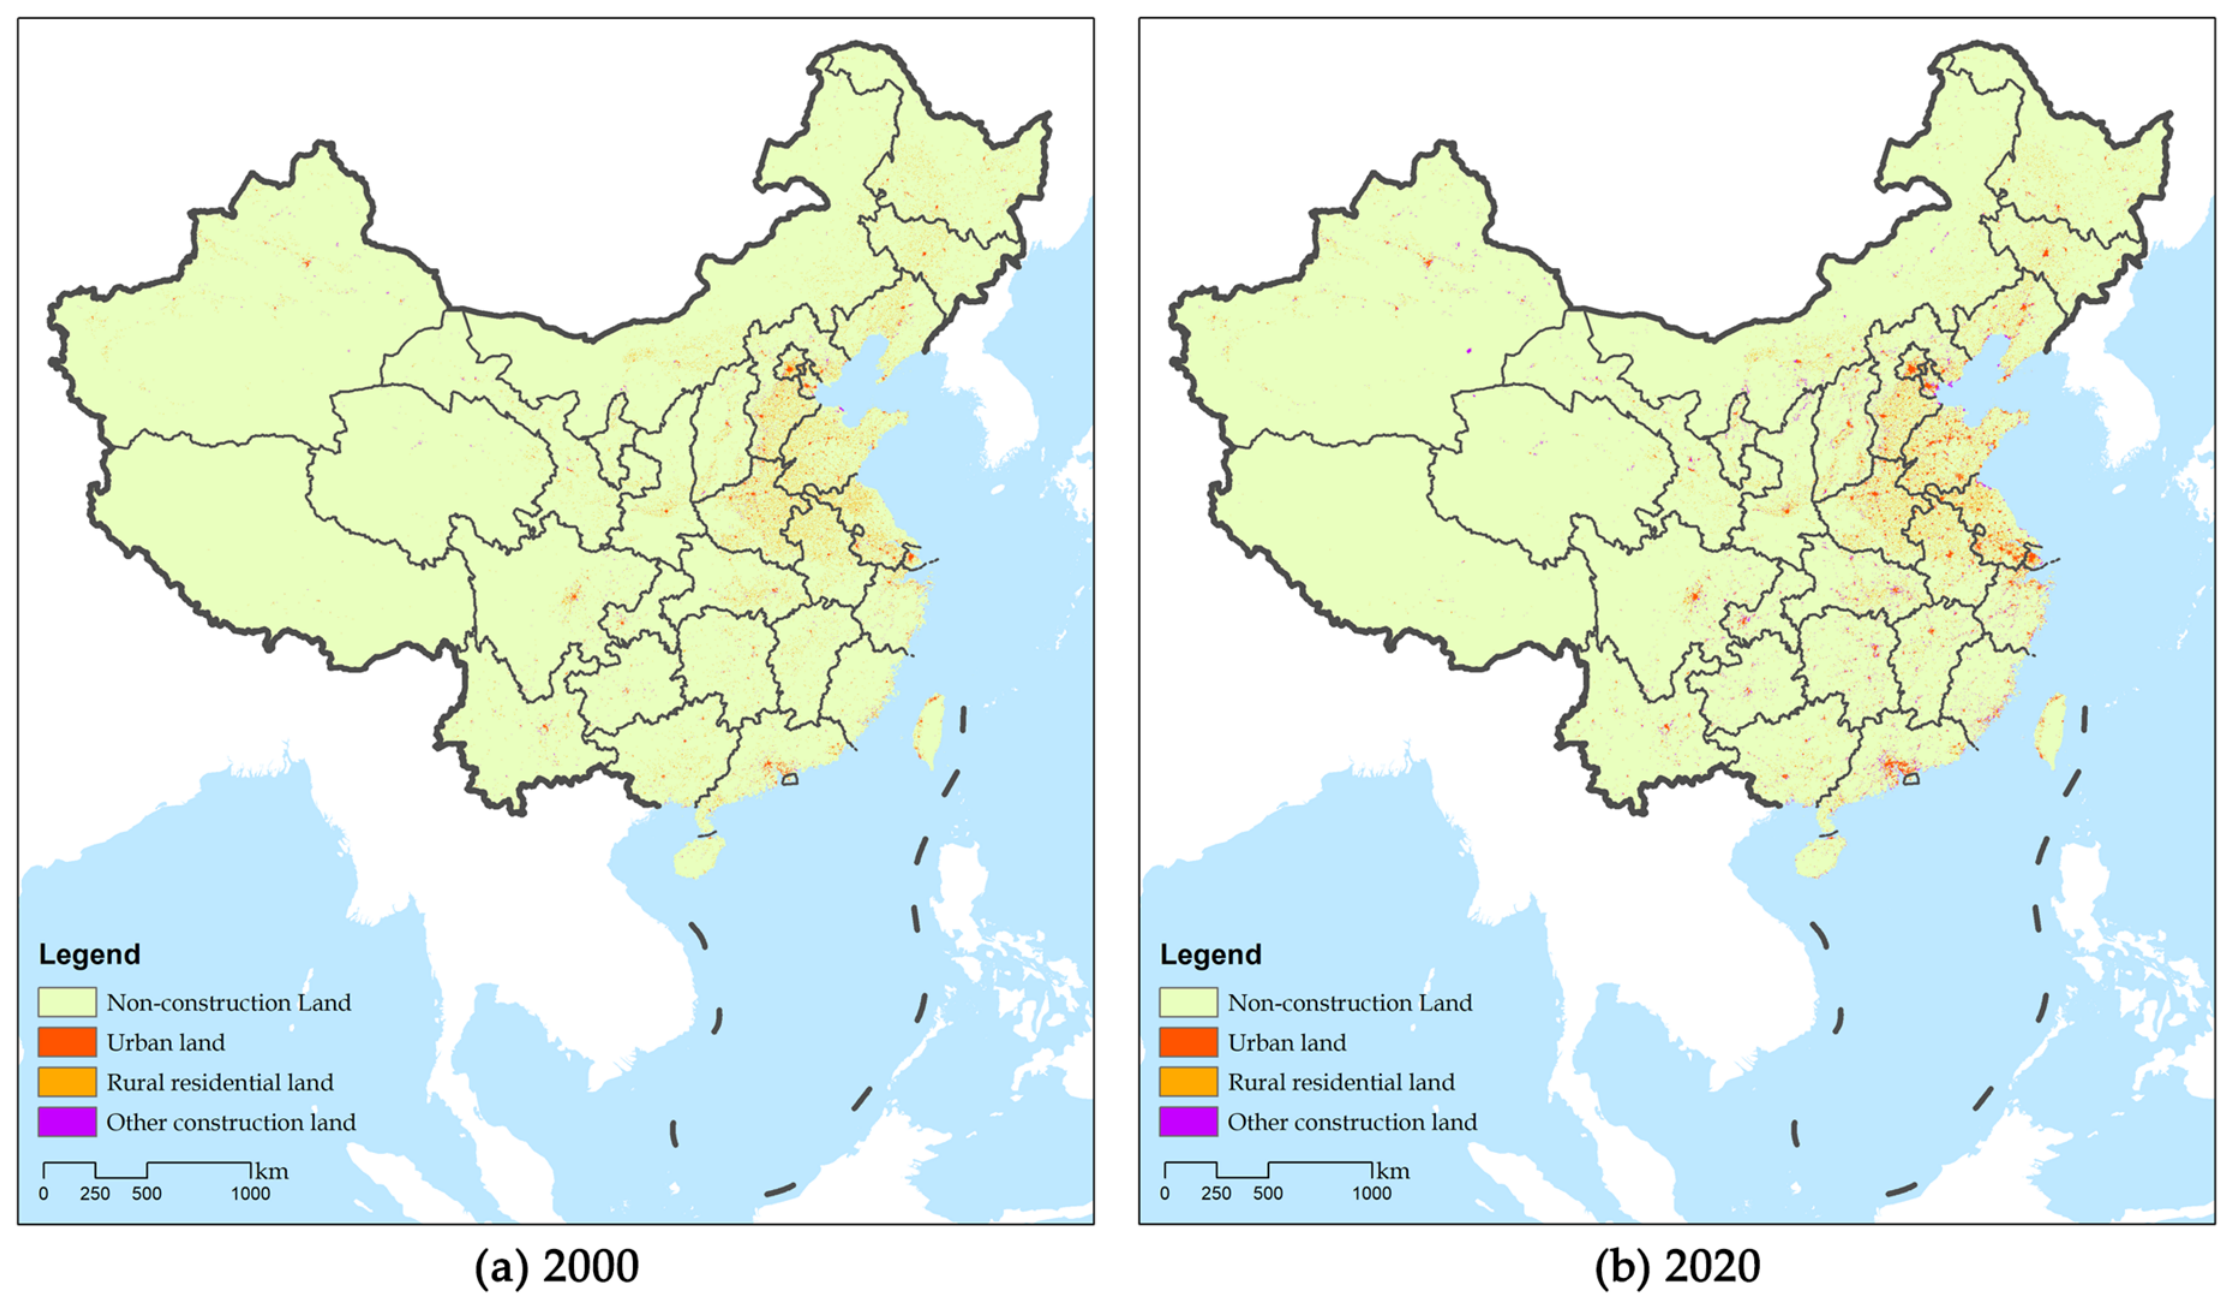
The construction land examined in this study corresponds to the fifth first-level category, which includes three second-level categories: (51) urban land, referring to built-up areas within large, medium-sized, and small cities and county-level towns; (52) rural residential land, referring to rural settlements located outside urban areas; and (53) other construction land, referring to land used for factories and mines, large industrial areas, oil fields, salt fields, quarries, transportation facilities, airports, and other special-purpose uses. The spatial distribution of construction land in 2000 and 2020 is shown in Figure 1.
Figure 1.
Distribution of construction land in China in 2000 and 2020.
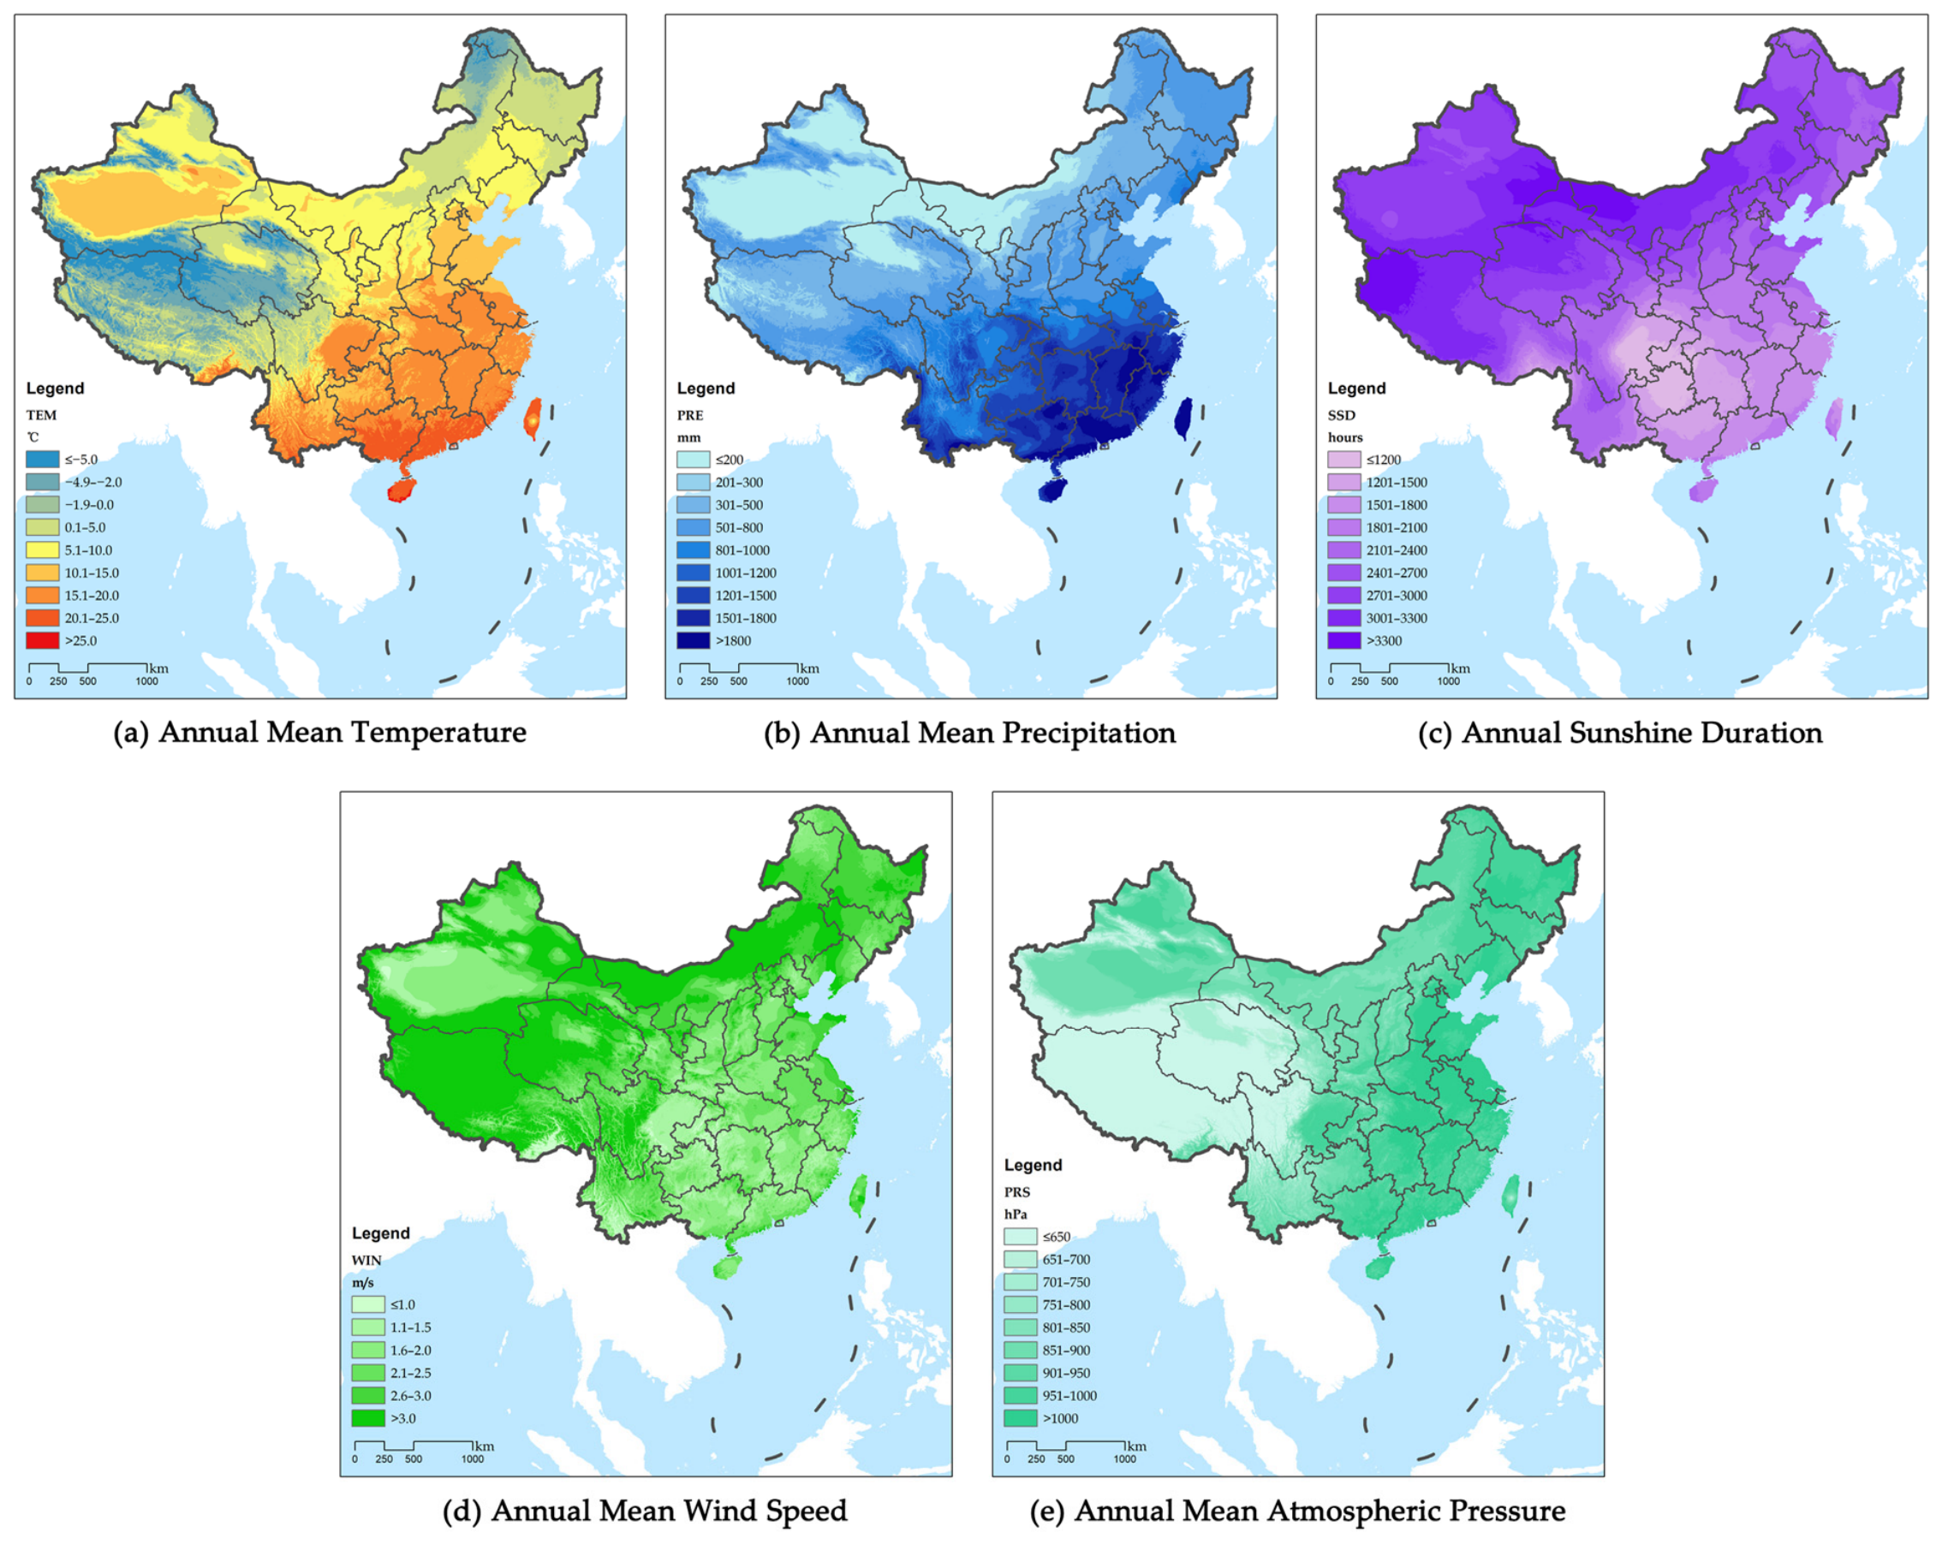
The climate data were obtained from spatially interpolated meteorological indicators, including annual mean temperature, annual precipitation, annual sunshine duration, annual mean wind speed, and annual mean atmospheric pressure. For mainland China, the data were obtained from the Resources and Environmental Science and Data Center and represent 30-year climatological averages for the 1990s, 2000s, and 2010s. Data for Taiwan, China, were obtained from the website of Taiwan’s meteorological agency (CWA) and represent 30-year climatological averages for the period from 1991 to 2020. It should be noted that the climate dataset for mainland China is provided in raster format at a spatial resolution of 1 km, whereas the data for Taiwan, China, are point-based meteorological station data consisting of multi-year statistical averages for climatic variables such as temperature. Therefore, Inverse Distance Weighting (IDW) interpolation was applied to the station-based data for Taiwan, China, to generate raster surfaces of the climatic variables, which were then integrated with the mainland China raster dataset. The spatial distribution of the major climatic indicators after data integration is shown in Figure 2.
Figure 2.
Spatial distribution characteristics of major climatic indicators in China (30-year averages).
The climatic variables used in this study are represented by 30-year climatological averages, which are used to characterize the long-term background climatic conditions of the study area. A 30-year period is adopted because it is the conventional reference period for calculating climatic normals in China and provides a standardized basis for characterizing long-term climatic conditions. In contrast, construction land characteristics are examined from both static and dynamic perspectives, including their spatial characteristics at specific time points and their changes during 2000–2020. The climatic variables are treated as static background conditions throughout the study period.
2.2. Methods
On the ArcGIS10.8 platform, land-use and climate data are integrated into a database using the Albers projected coordinate system as a common spatial reference. All datasets are transformed into this common coordinate system prior to spatial integration and analysis. Based on predefined spatial unit delineation rules, data from different layers are extracted and integrated for comprehensive analysis. Therefore, determining an appropriate spatial unit delineation scheme is one of the first issues that needs to be addressed in this study.
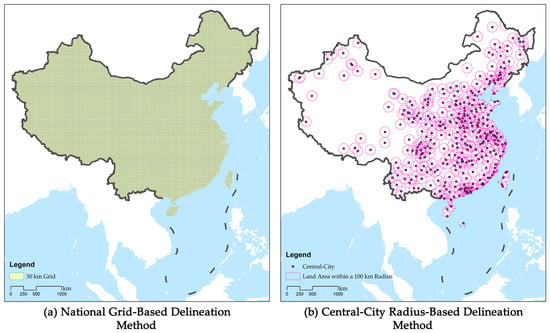
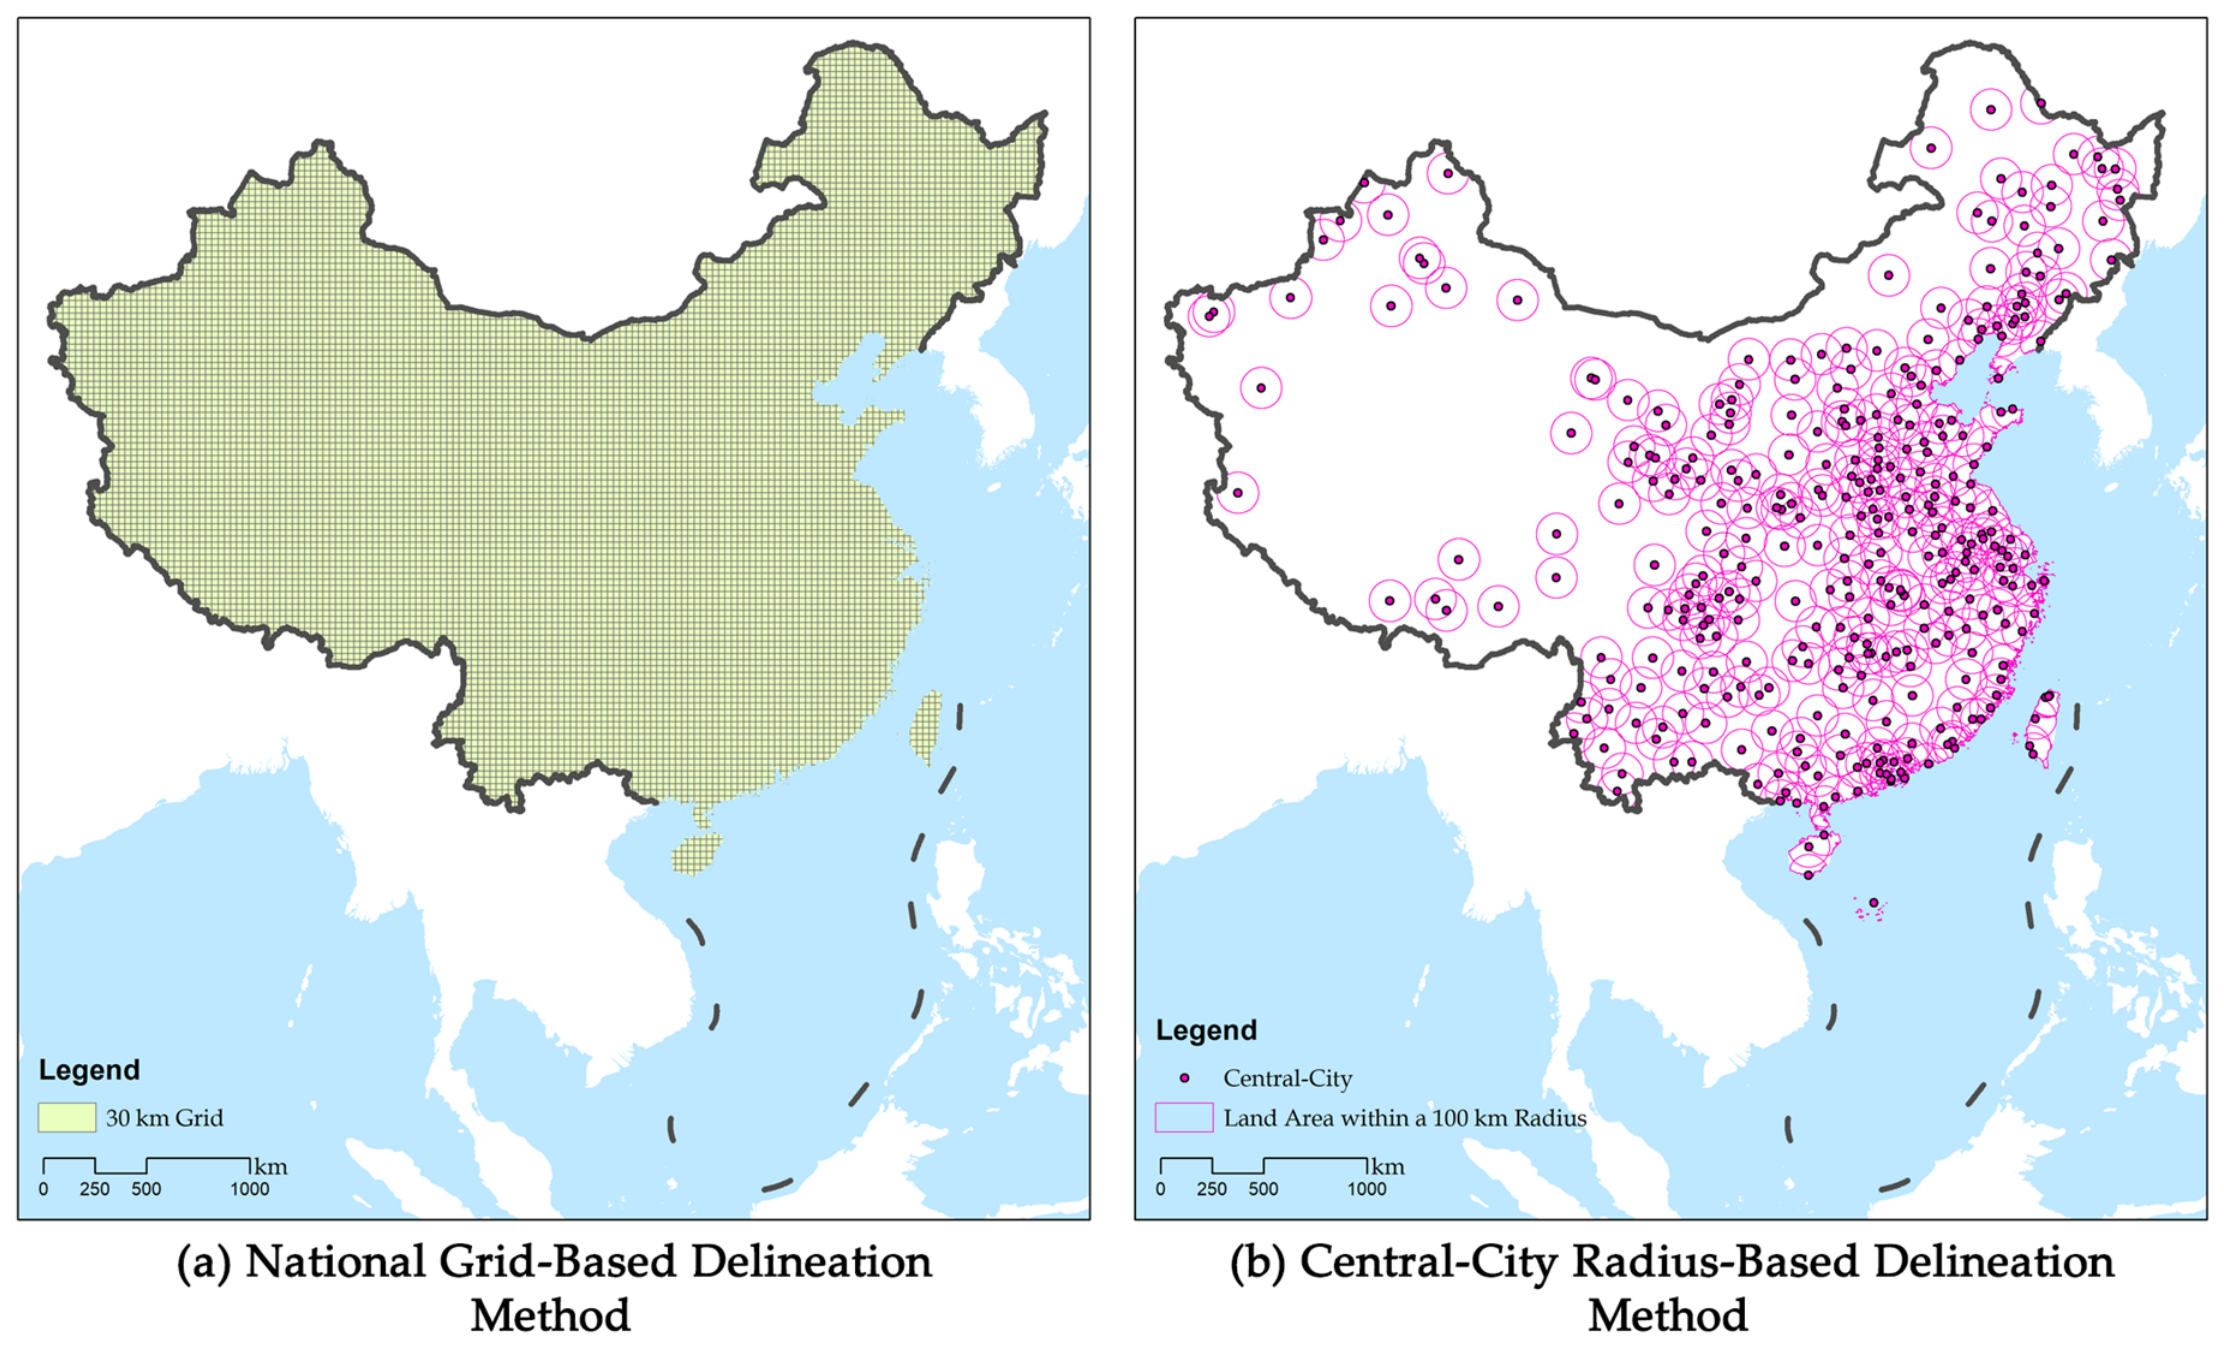
First, this study delineates homogeneous grids across the entire terrestrial area of China, with each grid measuring 30 km × 30 km. A total of 11,150 grid cells are generated, although some cells only partially overlap with the terrestrial area of China (Figure 3a). Homogeneous grids have the advantage of standardizing spatial units and facilitating comparisons across space. They also provide a convenient framework for integrating data from multiple sources.
Figure 3.
Two methods for delineating and identifying spatial units.
Because construction land is spatially concentrated in urban and town areas, its distribution is uneven across the study area. Therefore, a central-city-based spatial unit was also adopted for city-level analysis. The central cities comprise municipalities directly under the central government, sub-provincial cities, prefecture-level cities, seats of autonomous prefectures and administrative prefectures, as well as Hong Kong, Macao, Taipei, New Taipei, Taoyuan, Taichung, Tainan, and Kaohsiung. Common approaches to defining the spatial extent of city-level analysis include municipal administrative boundaries, physical urbanized areas, and standardized units such as regular grids or fixed-radius areas. Administrative boundaries vary substantially in spatial extent, with some municipalities dominated by urban districts and others encompassing extensive county-level territories, which may reduce cross-city comparability. Physical urbanized areas are dynamic and change over time, making consistent spatial and temporal delineation difficult. Standardized spatial units provide a more consistent basis for cross-city comparison, although fixed-radius areas are relatively coarse.
Accordingly, a circular analysis area with a radius of 100 km was constructed around each central city (Figure 3b). This radius was selected because it broadly encompasses the commuting and functional areas of most central cities and was also determined with reference to the average administrative scale of the 345 prefecture-level and above central cities included in the study. Following the city selection criteria, all 345 cities were initially included. Because some surrounding areas contained unrecognized construction land or missing data for certain years, a data-quality screening was subsequently conducted, resulting in 326 cities being retained for the final analysis.
After the basic spatial units are determined, climatic characteristics and the areas of different types of construction land are systematically extracted and aggregated within each spatial unit. For climatic variables, the mean value of the corresponding climate raster within each spatial unit is calculated. For construction land data, the corresponding values are generally aggregated by calculating the total area within each spatial unit.
Subsequently, subgroup statistics, standardized statistics, linear regression analysis, and two-dimensional quadrant analysis are conducted according to the research objectives. The 30 km × 30 km grid analysis is primarily used to characterize the spatial distribution of construction land across different climatic classes. In contrast, the 100 km central-city analysis provides a city-based spatial context for examining the correspondence between climatic characteristics, construction land stock, and construction land growth.
Subgroup statistics are first conducted to summarize construction land area and its changes across different climatic classes, providing a basis for comparing the distribution and growth characteristics of construction land under different climatic conditions. The coefficient of variation (CV) is then used as a descriptive measure of the relative spatial variability of construction land area across different climatic classes. It indicates the degree of dispersion of construction land area within the classified climatic conditions, but does not measure the strength of association, explanatory power, or causal effect of climatic variables. At the central-city scale, bubble charts are used to visualize, while linear regression analyses are used to quantify, the direction and strength of linear associations between climatic indicators and construction land growth. Two-dimensional quadrant analysis is used to jointly consider construction land stock and construction land growth, distinguish different combinations of these two dimensions, and examine their distribution across climatic conditions.
3. Results
3.1. Relationship Between Climatic Characteristics and the Spatial Distribution of Construction Land
Among the 11,150 grid cells, 6561 contain construction land, accounting for 58.84% of all grid cells. The grid cells are ranked according to the mean value of each climatic indicator and divided into 10 classes based on an approximately equal number of observations in each class. The spatial distribution and change characteristics of construction land across different climatic classes are then further examined and compared.
3.1.1. Construction Land Distribution Under Different Climatic Conditions
Construction land is most extensive in areas with annual mean temperatures of 13.78–15.52 °C (Table 1), roughly corresponding to the Jianghuai region, the Huang-Huai region, the Central Plains urban agglomeration, and the Guanzhong Plain. The 10.98–13.78 °C range follows, covering mainly the Beijing–Tianjin–Hebei region and the Shandong Peninsula. Another major concentration occurs in areas with annual mean temperatures of 15.52–16.95 °C, particularly in northern Jiangnan and the Jianghan Plain. Overall, construction land tends to be concentrated in areas with moderate annual mean temperatures, while relatively small amounts are found in regions with either lower or higher temperatures.
Table 1.
Construction land distribution by annual mean temperature (2020).
A similar pattern can be observed for annual precipitation. The largest concentration of construction land occurs in areas receiving 662–877 mm of annual precipitation (Table 2), roughly covering southern Shandong, central Henan, the northern Qinling Mountains, and the central Sichuan Basin. Areas with 494–662 mm (including 494–570 mm and 570–662 mm) and 877–1108 mm of annual precipitation also contain substantial amounts of construction land. The former mainly covers the North China Plain, the Northeast China Plain, and central Shaanxi, whereas the latter includes the Huai River Basin, northern Hubei, the Sichuan Basin, and southeastern Tibet. Overall, construction land is concentrated primarily in areas with moderate annual precipitation, with relatively limited amounts occurring in areas with either very low or very high precipitation.
Table 2.
Construction land distribution by annual mean precipitation (2020).
In terms of annual sunshine duration, the greatest concentration of construction land is found in areas receiving 1838–2087 h of sunshine annually (Table 3). These areas roughly include most of Henan, north-central Anhui, south-central Jiangsu, the Guanzhong Plain, Hainan Island, Chaoshan, and southern Fujian. The next largest concentration occurs in areas with 2087–2322 h, mainly covering the southern North China Plain, southern Shanxi, central Shaanxi, southeastern Gansu, western Sichuan, central and southern Yunnan, and eastern Jilin. Overall, construction land tends to be concentrated in areas with moderate annual sunshine durations, although the relationship is less pronounced than that observed for temperature and precipitation.
Table 3.
Construction land distribution by annual sunshine duration (2020).
With respect to annual mean wind speed, the largest amount of construction land is found in areas with wind speeds of 1.89–2.04 m/s (Table 4), roughly corresponding to the Huang-Huai region, the central Hebei Plain, Beijing, the Jianghan Plain, and the Pearl River Delta. This is followed by areas with wind speeds of 2.04–2.23 mm and 2.23–2.40 m/s, which mainly include the central and western Jianghuai region, central and western Shandong, northern Henan, and north-central Hubei. By comparison, areas with either relatively low or high annual mean wind speeds contain considerably less construction land. Overall, construction land tends to be concentrated in areas with moderate annual mean wind speeds.
Table 4.
Construction land distribution by annual mean wind speed (2020).
For annual mean atmospheric pressure, construction land is particularly concentrated in areas with values of 1012–1021 hPa (Table 5), roughly including Shanghai, most of Jiangsu, southeastern Hebei, the Jianghan Plain, northern Jiangxi, and the Pearl River Delta. These areas are generally characterized by relatively low elevations. Overall, construction land shows a strong spatial concentration in areas with relatively high annual mean atmospheric pressure, whereas areas with relatively low atmospheric pressure contain substantially less construction land. This pattern is closely associated with elevation, as atmospheric pressure generally decreases with increasing altitude.
Table 5.
Construction land distribution by annual mean atmospheric pressure (2020).
3.1.2. Coefficient of Variation in Construction Land Area Across Different Climatic Conditions
To further assess the degree of spatial differentiation in construction land across different climatic conditions, the coefficient of variation (CV), defined as the ratio of the standard deviation to the mean, was calculated for the construction land area across the climatic classes. The CV is used as a descriptive measure of the relative spatial variability of construction land area among climatic classes. A lower coefficient of variation indicates smaller differences in construction land area across climatic classes, reflecting relatively limited spatial differentiation across the corresponding climatic conditions. Conversely, a higher coefficient of variation indicates greater differences in construction land area across climatic classes, reflecting stronger spatial differentiation across climatic conditions. The calculated coefficients of variation for the climatic indicators are presented in Table 6.
Table 6.
Coefficient of variation in construction land distribution across different climate condition classes (2020).
In terms of the overall distribution of construction land, annual mean atmospheric pressure has the highest coefficient of variation, reaching 1.019, indicating substantial differences in construction land area across different atmospheric pressure conditions. Annual mean temperature has the second-highest coefficient of variation, at 0.579, followed by annual sunshine duration, with a coefficient of variation of 0.562. Annual mean wind speed has a coefficient of variation of 0.390, while annual precipitation has the lowest coefficient of variation, at 0.355. Overall, the climatic indicators exhibit substantial differences in the degree of spatial differentiation in construction land across climatic classes.
Across different types of construction land, the coefficients of variation for urban land and rural residential land are relatively similar, indicating broadly comparable degrees of spatial differentiation across climatic conditions. This similarity suggests that the spatial distributions of urban land and rural residential land exhibit broadly consistent patterns across the climatic classes examined in this study. From the perspective of climatic suitability, this finding may also provide a basis for considering the coordination of urban and rural living environments in spatial planning.
In contrast, other construction land has a substantially lower coefficient of variation than urban land and rural residential land, indicating relatively smaller differences in its spatial distribution across climatic conditions. This pattern may be related to the functional characteristics of these land uses, which include factories and mines, large industrial areas, oil fields, salt fields, and quarries. Their spatial distributions may be more closely associated with factors such as mineral and energy resources, industrial functions, and transportation accessibility, potentially reducing the extent to which differences in climatic conditions are reflected in their spatial distribution. These factors provide possible explanations for the relatively lower variation observed for other construction land.
3.2. Relationship Between Climate Characteristics and Changes in Construction Land
An analysis of changes in construction land area from 2000 to 2020 across different climatic zones reveals considerable spatial differences in the expansion of construction land and its various types. These differences indicate that the rates and patterns of construction land change vary across climatic conditions.
3.2.1. Annual Mean Temperature and Construction Land Growth
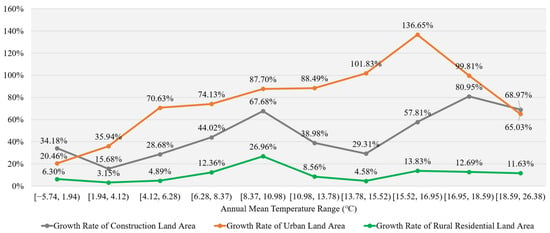
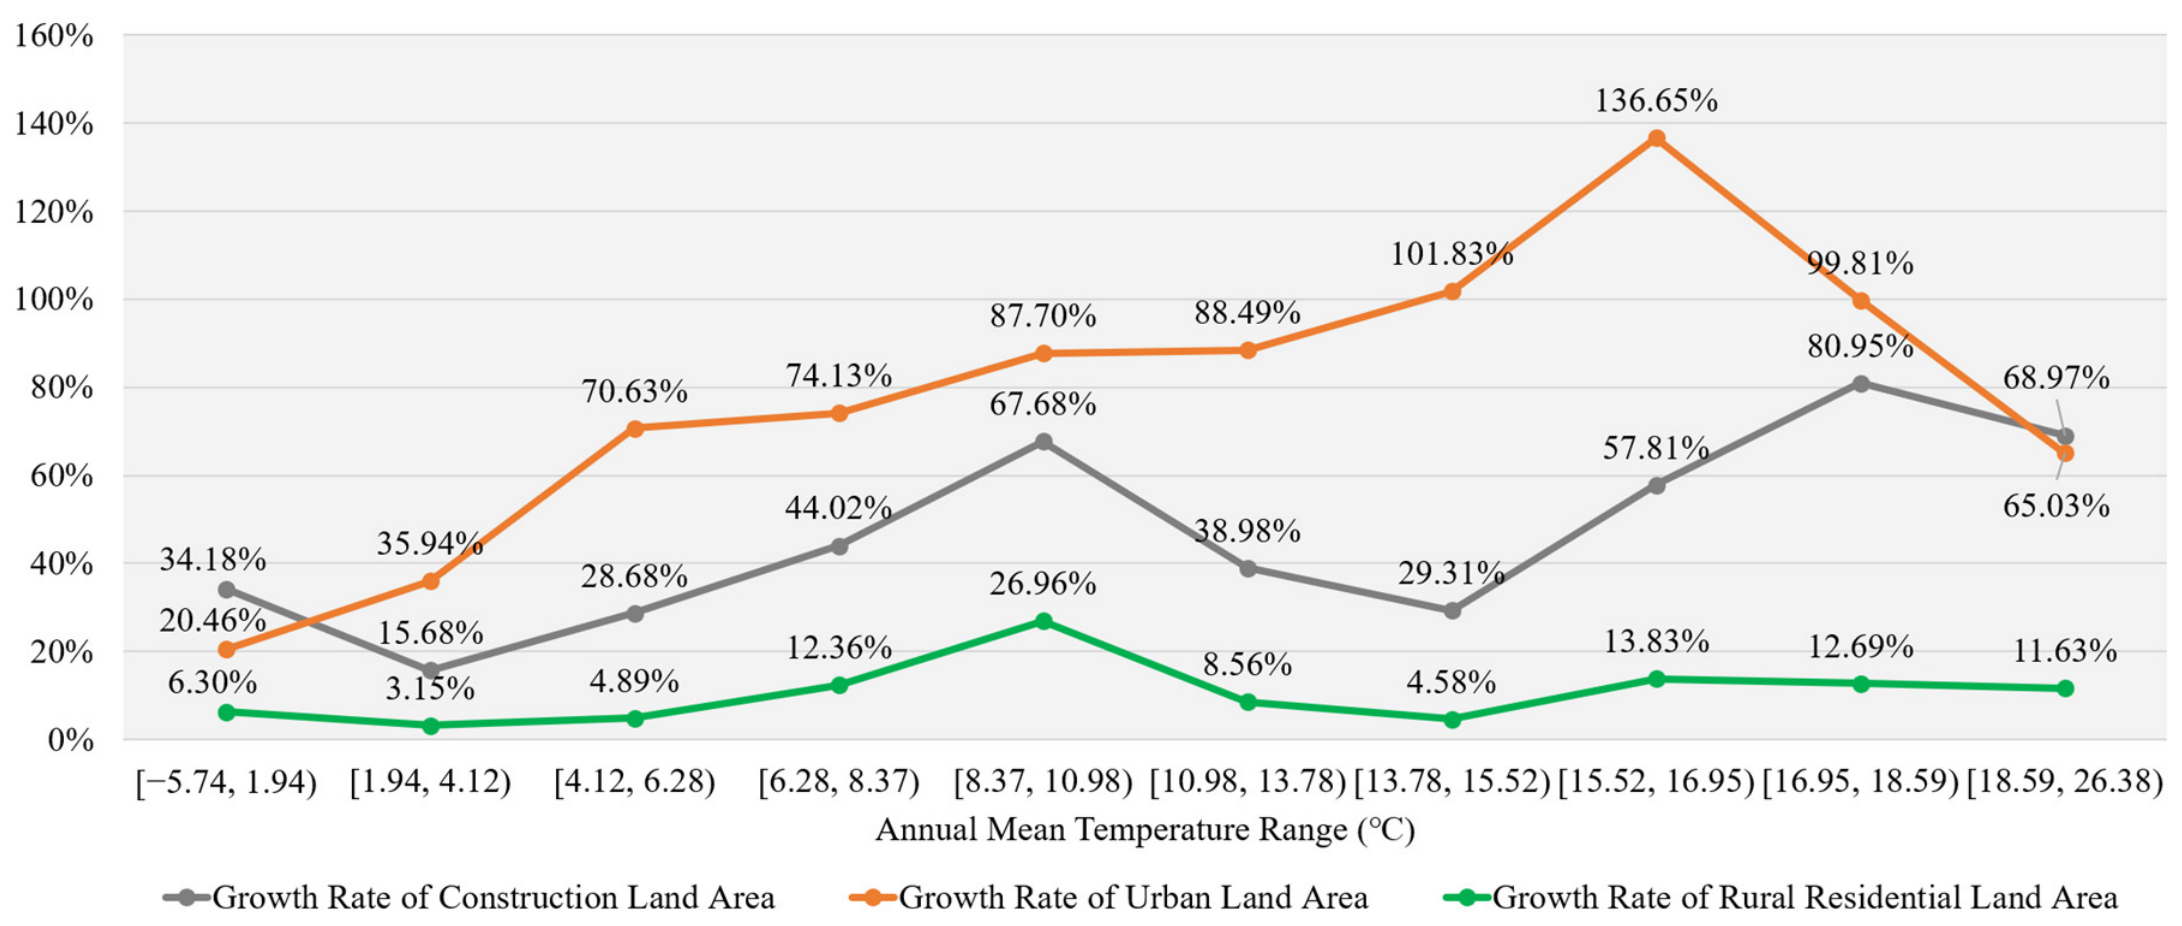
Across the different annual mean temperature zones, the fastest growth in construction land area occurred in areas with an annual mean temperature of 16.95–18.59 °C (Figure 4), which broadly correspond to the central and northern parts of the Jiangnan region and the Sichuan Basin. From 2000 to 2020, construction land area in this temperature range increased by 80.95%. Among the different types of construction land, urban land experienced the most significant growth, increasing by 136.65% in areas with annual mean temperatures of 15.52–16.95 °C, substantially higher than the overall growth rate of construction land. In contrast, the growth of rural residential land was generally much lower across the different temperature ranges, with increases not exceeding 27%.
Figure 4.
Construction land growth by annual mean temperature (2000–2020).
Overall, construction land, particularly urban land, exhibited relatively pronounced expansion in areas with moderately high annual mean temperatures, whereas rural residential land showed comparatively smaller differences in growth across temperature ranges.
3.2.2. Annual Mean Precipitation and Construction Land Growth
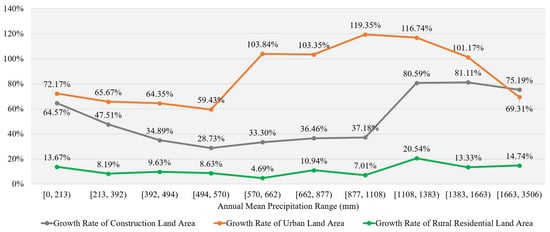
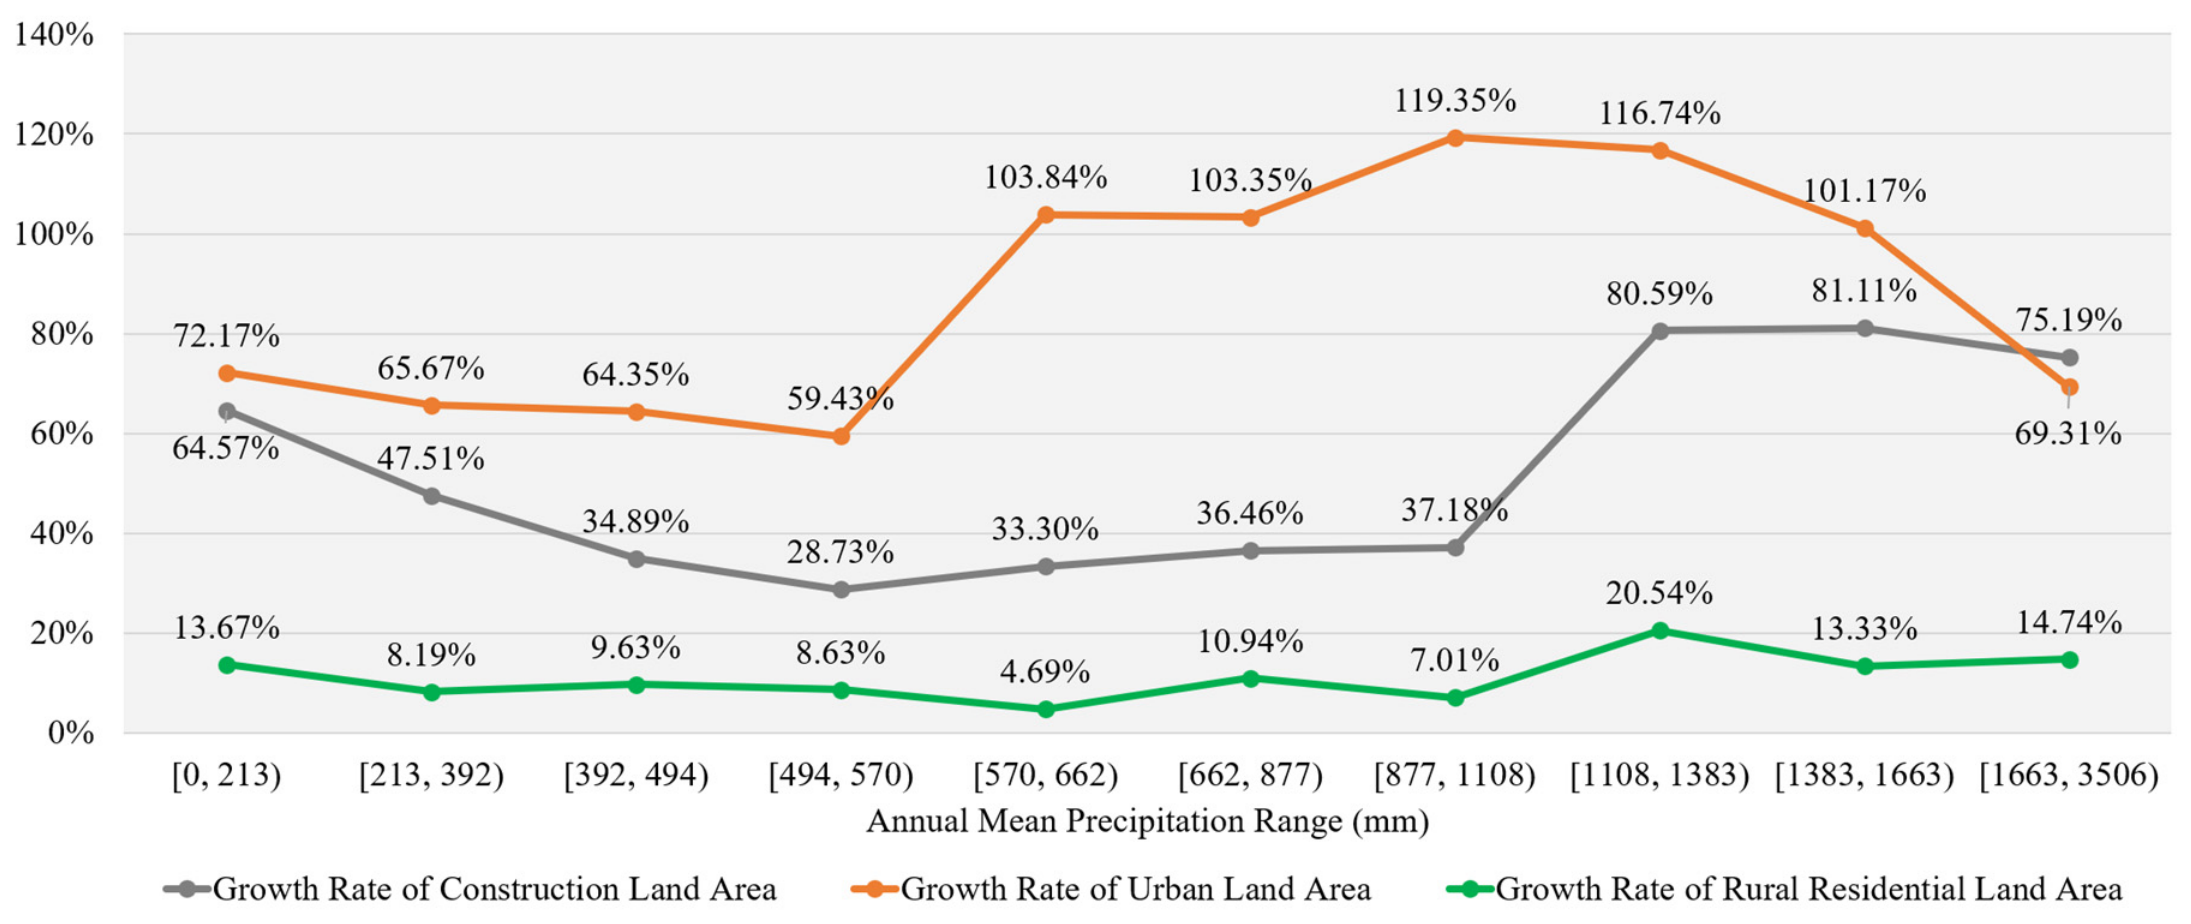
Considerable differences in construction land expansion were observed across areas with different annual mean precipitation levels. The fastest growth in construction land area occurred primarily in regions with annual mean precipitation exceeding 1108 mm (Figure 5), which are broadly located south of the Yangtze River. From 2000 to 2020, construction land area increased by 80.6%, 81.1%, and 75.2% in areas with annual mean precipitation of 1108–1383 mm, 1383–1663 mm, and 1663–3506 mm, respectively.
Figure 5.
Construction land growth by annual mean precipitation (2000–2020).
Notably, another region with a relatively high growth rate was the lowest precipitation zone, with annual mean precipitation of 0–213 mm, where the area of construction land increased by 64.57% between 2000 and 2020. This finding indicates that the expansion of construction land does not exhibit a simple linear pattern across precipitation ranges. Substantial expansion also occurred in areas with low precipitation, where the observed growth may be related to resource exploitation, energy development, urban construction, and other regional development activities.
In terms of urban land, relatively rapid growth was concentrated in areas with annual mean precipitation of 570–1663 mm, with growth rates exceeding 100% across all relevant precipitation intervals. A comparison of changes in total construction land and urban land reveals a pronounced “jump” in both, although the precipitation thresholds at which these changes occurred differed. Construction land as a whole showed a clear increase around an annual mean precipitation level of 1108 mm, whereas urban land exhibited a marked increase around 570 mm. This pattern indicates that the spatial variation in urban land growth across precipitation ranges differs from that of total construction land. Rural residential land, in contrast, showed relatively low growth across all precipitation ranges, with increases below 21%.
3.2.3. Annual Sunshine Duration and Construction Land Growth
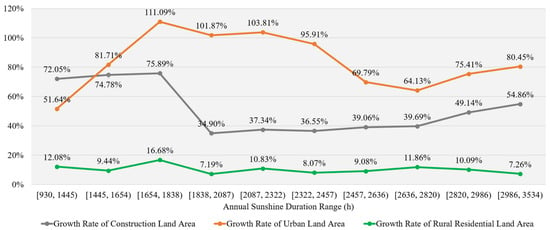
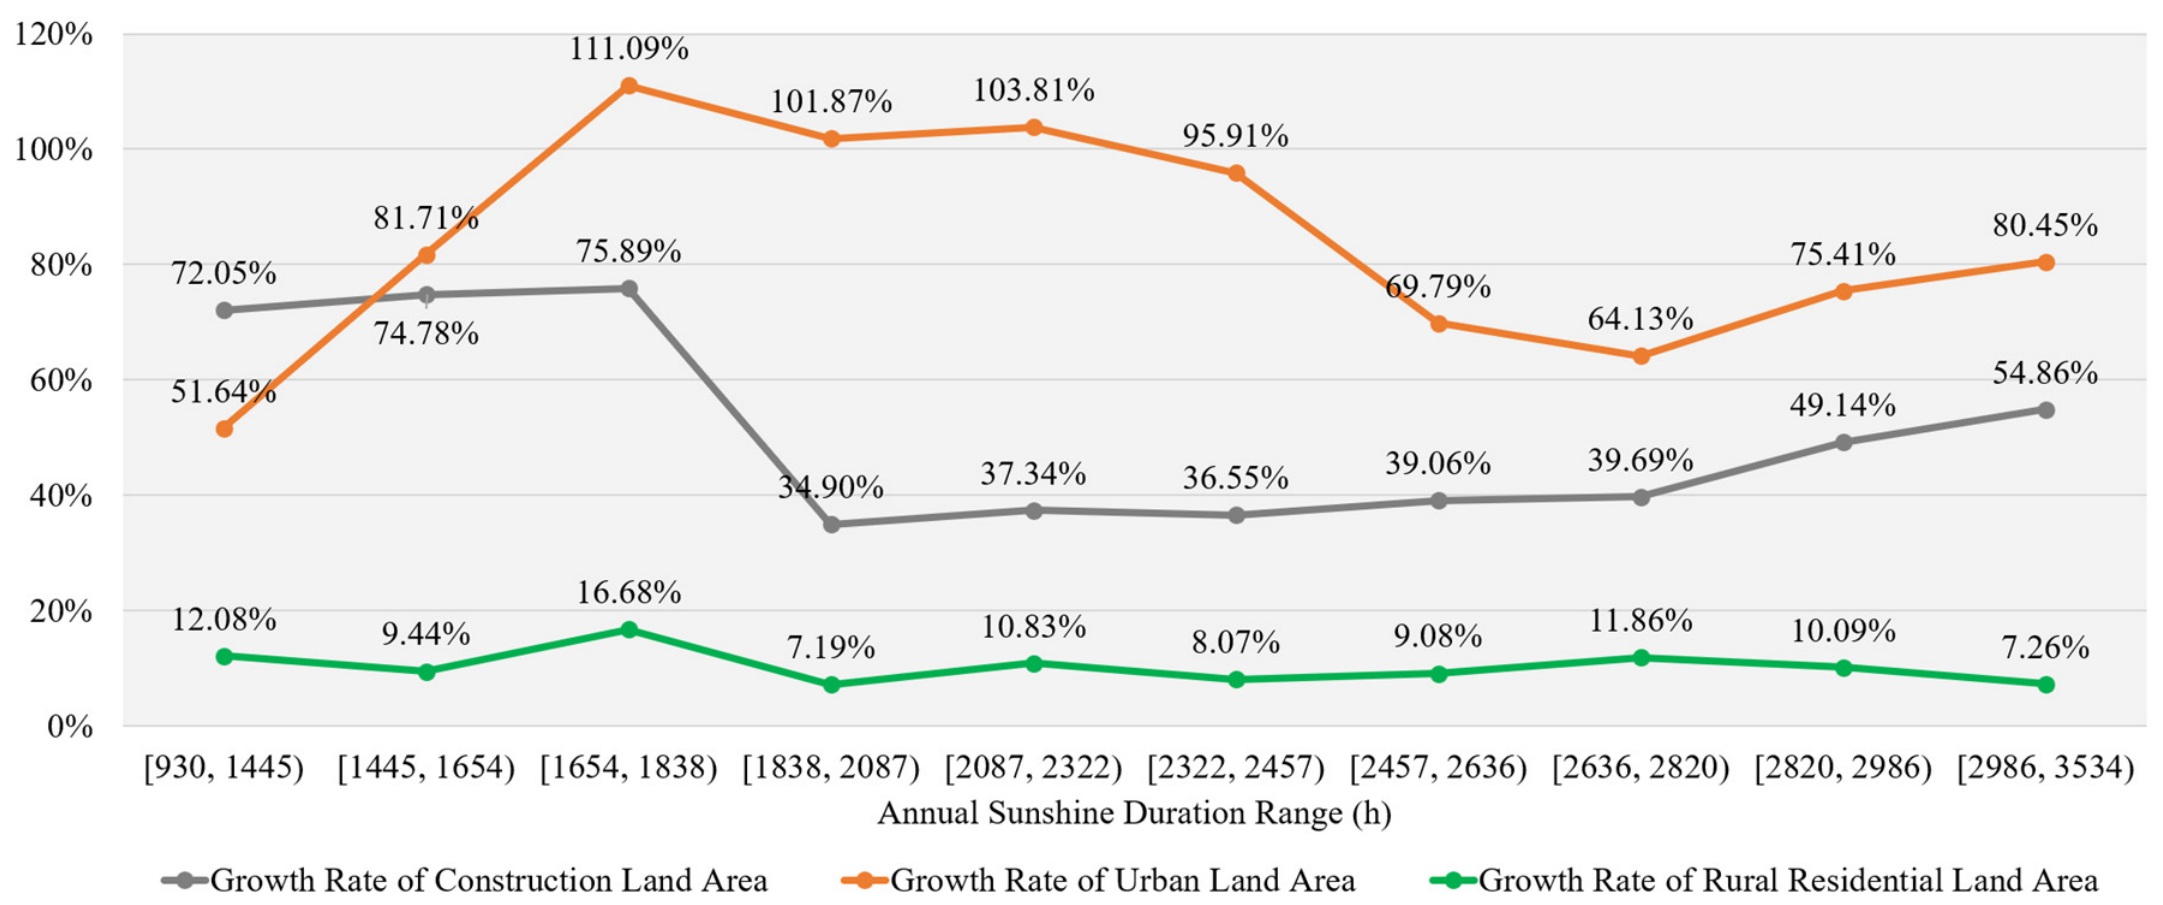
In terms of annual sunshine duration, the fastest growth in construction land area occurred in areas receiving 1654–1838 h of sunshine per year (Figure 6), broadly including northern Jiangnan, the southeastern coastal region, and central Hubei. From 2000 to 2020, construction land area in this range increased by 75.89%.
Figure 6.
Construction land growth by annual sunshine duration (2000–2020).
Different types of construction land also exhibited relatively pronounced growth within this sunshine-duration range. Urban land and rural residential land increased by 111.09% and 16.68%, respectively, representing the highest growth rates among their respective sunshine-duration zones. Notably, in areas with relatively high annual sunshine duration, both construction land and urban land exhibited an upward trend in their growth rates. This pattern indicates a positive spatial association between higher sunshine duration and construction land growth within certain ranges.
3.2.4. Annual Mean Wind Speed and Construction Land Growth
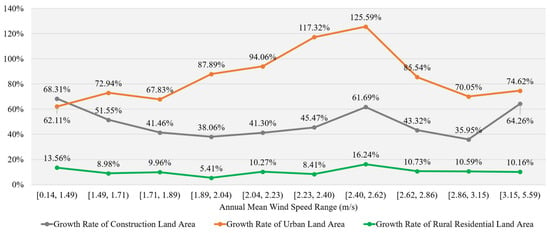
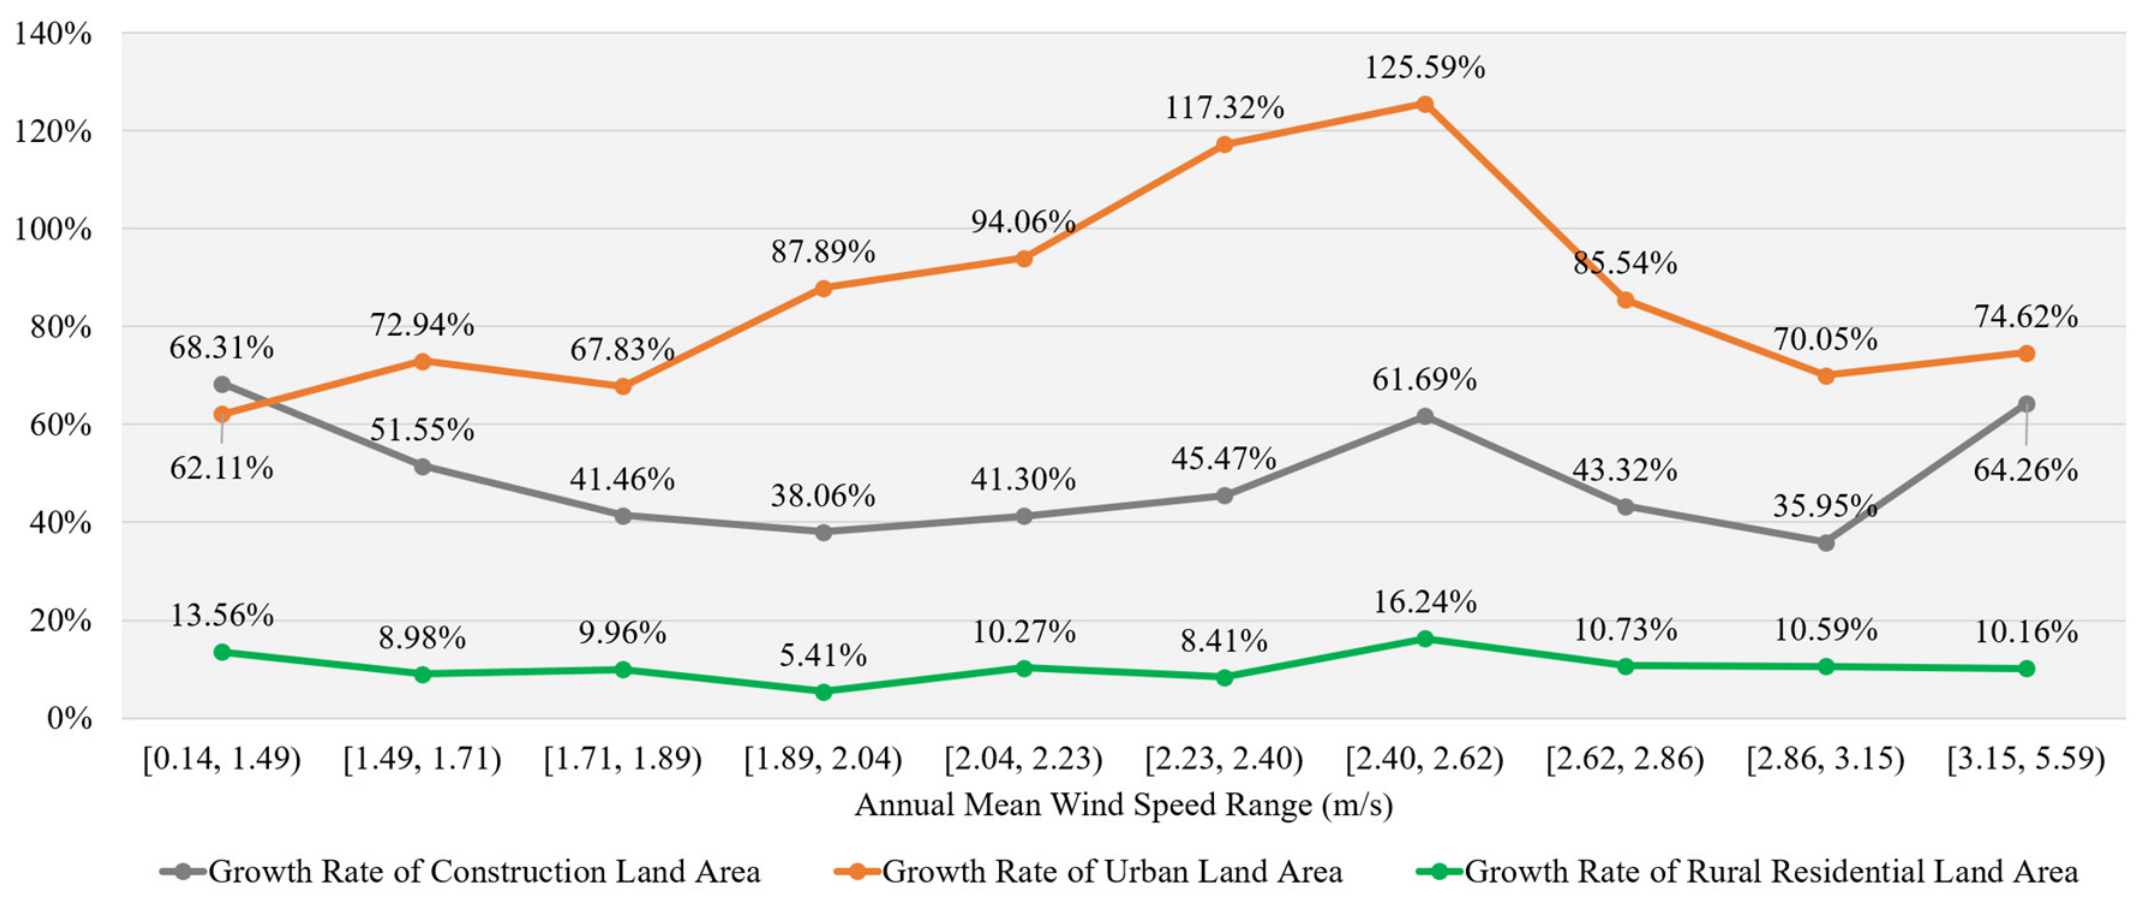
Construction land expansion varied considerably across different annual mean wind-speed zones. The fastest growth in both urban land and rural residential land occurred in areas with an annual mean wind speed of 2.40–2.62 m/s (Figure 7), broadly including coastal areas across China and inland regions such as the Hetao Plain. From 2000 to 2020, urban land and rural residential land in this wind-speed range increased by 125.59% and 16.24%, respectively.
Figure 7.
Construction land growth by annual mean wind speed (2000–2020).
For urban land, expansion was particularly pronounced under moderate wind-speed conditions, whereas areas with either very low or very high wind speeds experienced relatively slower urban land growth. This pattern indicates that urban land growth varies across wind-speed conditions. In contrast, total construction land exhibited its highest growth rate in areas with annual mean wind speeds above 3.15 m/s, reaching 64.26%.
3.2.5. Annual Mean Atmospheric Pressure and Construction Land Growth
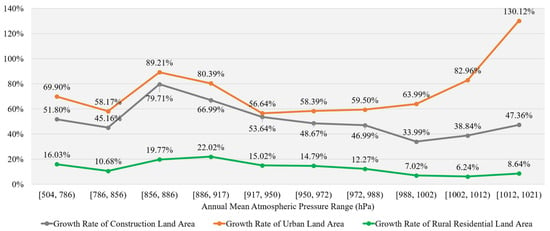
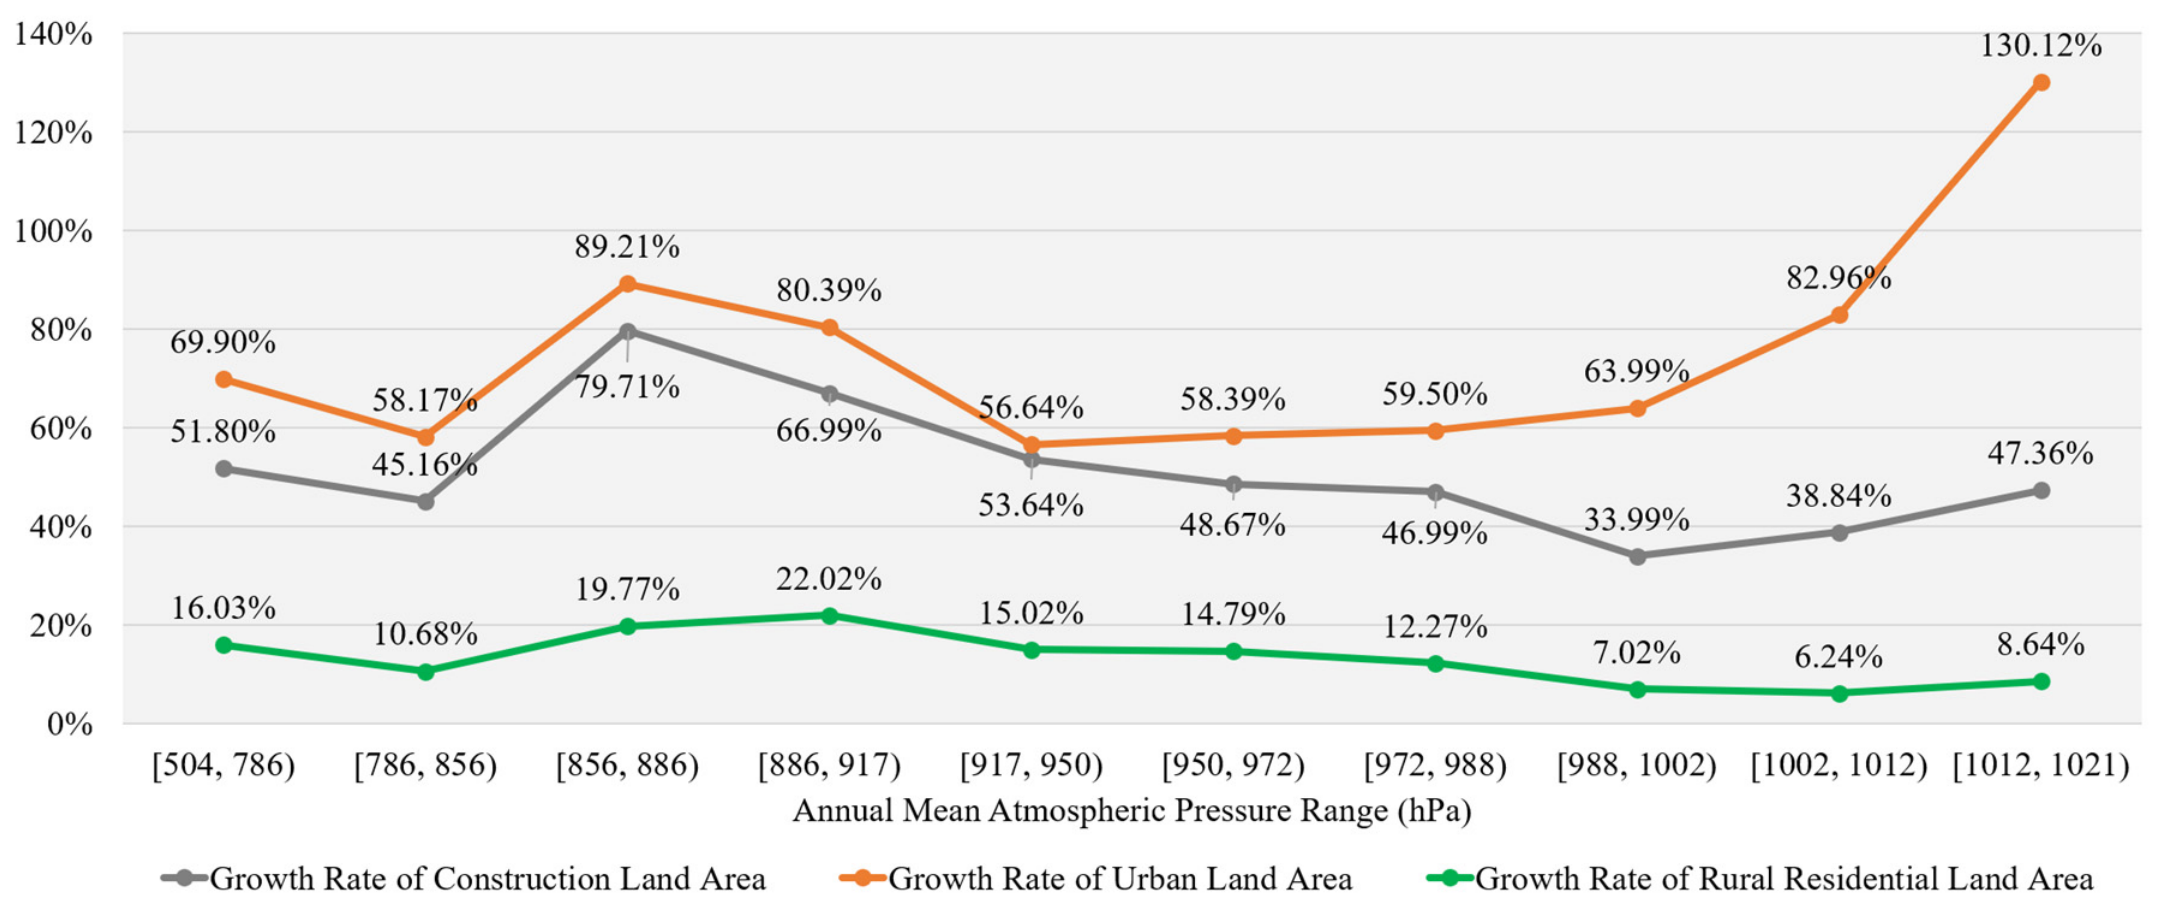
Changes in construction land area across different annual mean atmospheric pressure zones exhibited a relatively pronounced bimodal pattern, with two major intervals characterized by relatively rapid expansion. The most prominent growth peak occurred in areas with annual mean atmospheric pressure of 1012–1021 hPa (Figure 8), a range close to standard atmospheric pressure. Urban land expansion was particularly pronounced in this range, increasing by 130.12% between 2000 and 2020. This pattern indicates that construction land and urban land growth were relatively pronounced within this atmospheric-pressure range.
Figure 8.
Construction land growth by annual mean atmospheric pressure (2000–2020).
Another notable growth peak occurred in areas with annual mean atmospheric pressure of 856–917 hPa. These areas broadly include the Loess Plateau, central Guizhou, the Inner Mongolian Plateau, the Hexi Corridor, and parts of southern Xinjiang. From 2000 to 2020, construction land area in this range increased by more than 67%, while urban land increased by more than 80% and rural residential land increased by more than 19%. These results indicate relatively strong expansion of construction activities in these regions during the study period. Overall, the relationship between annual mean atmospheric pressure and construction land expansion is not characterized by a simple linear pattern.
3.3. Analysis Results Based on Central Cities
3.3.1. Distribution of Construction Land and Climatic Characteristics
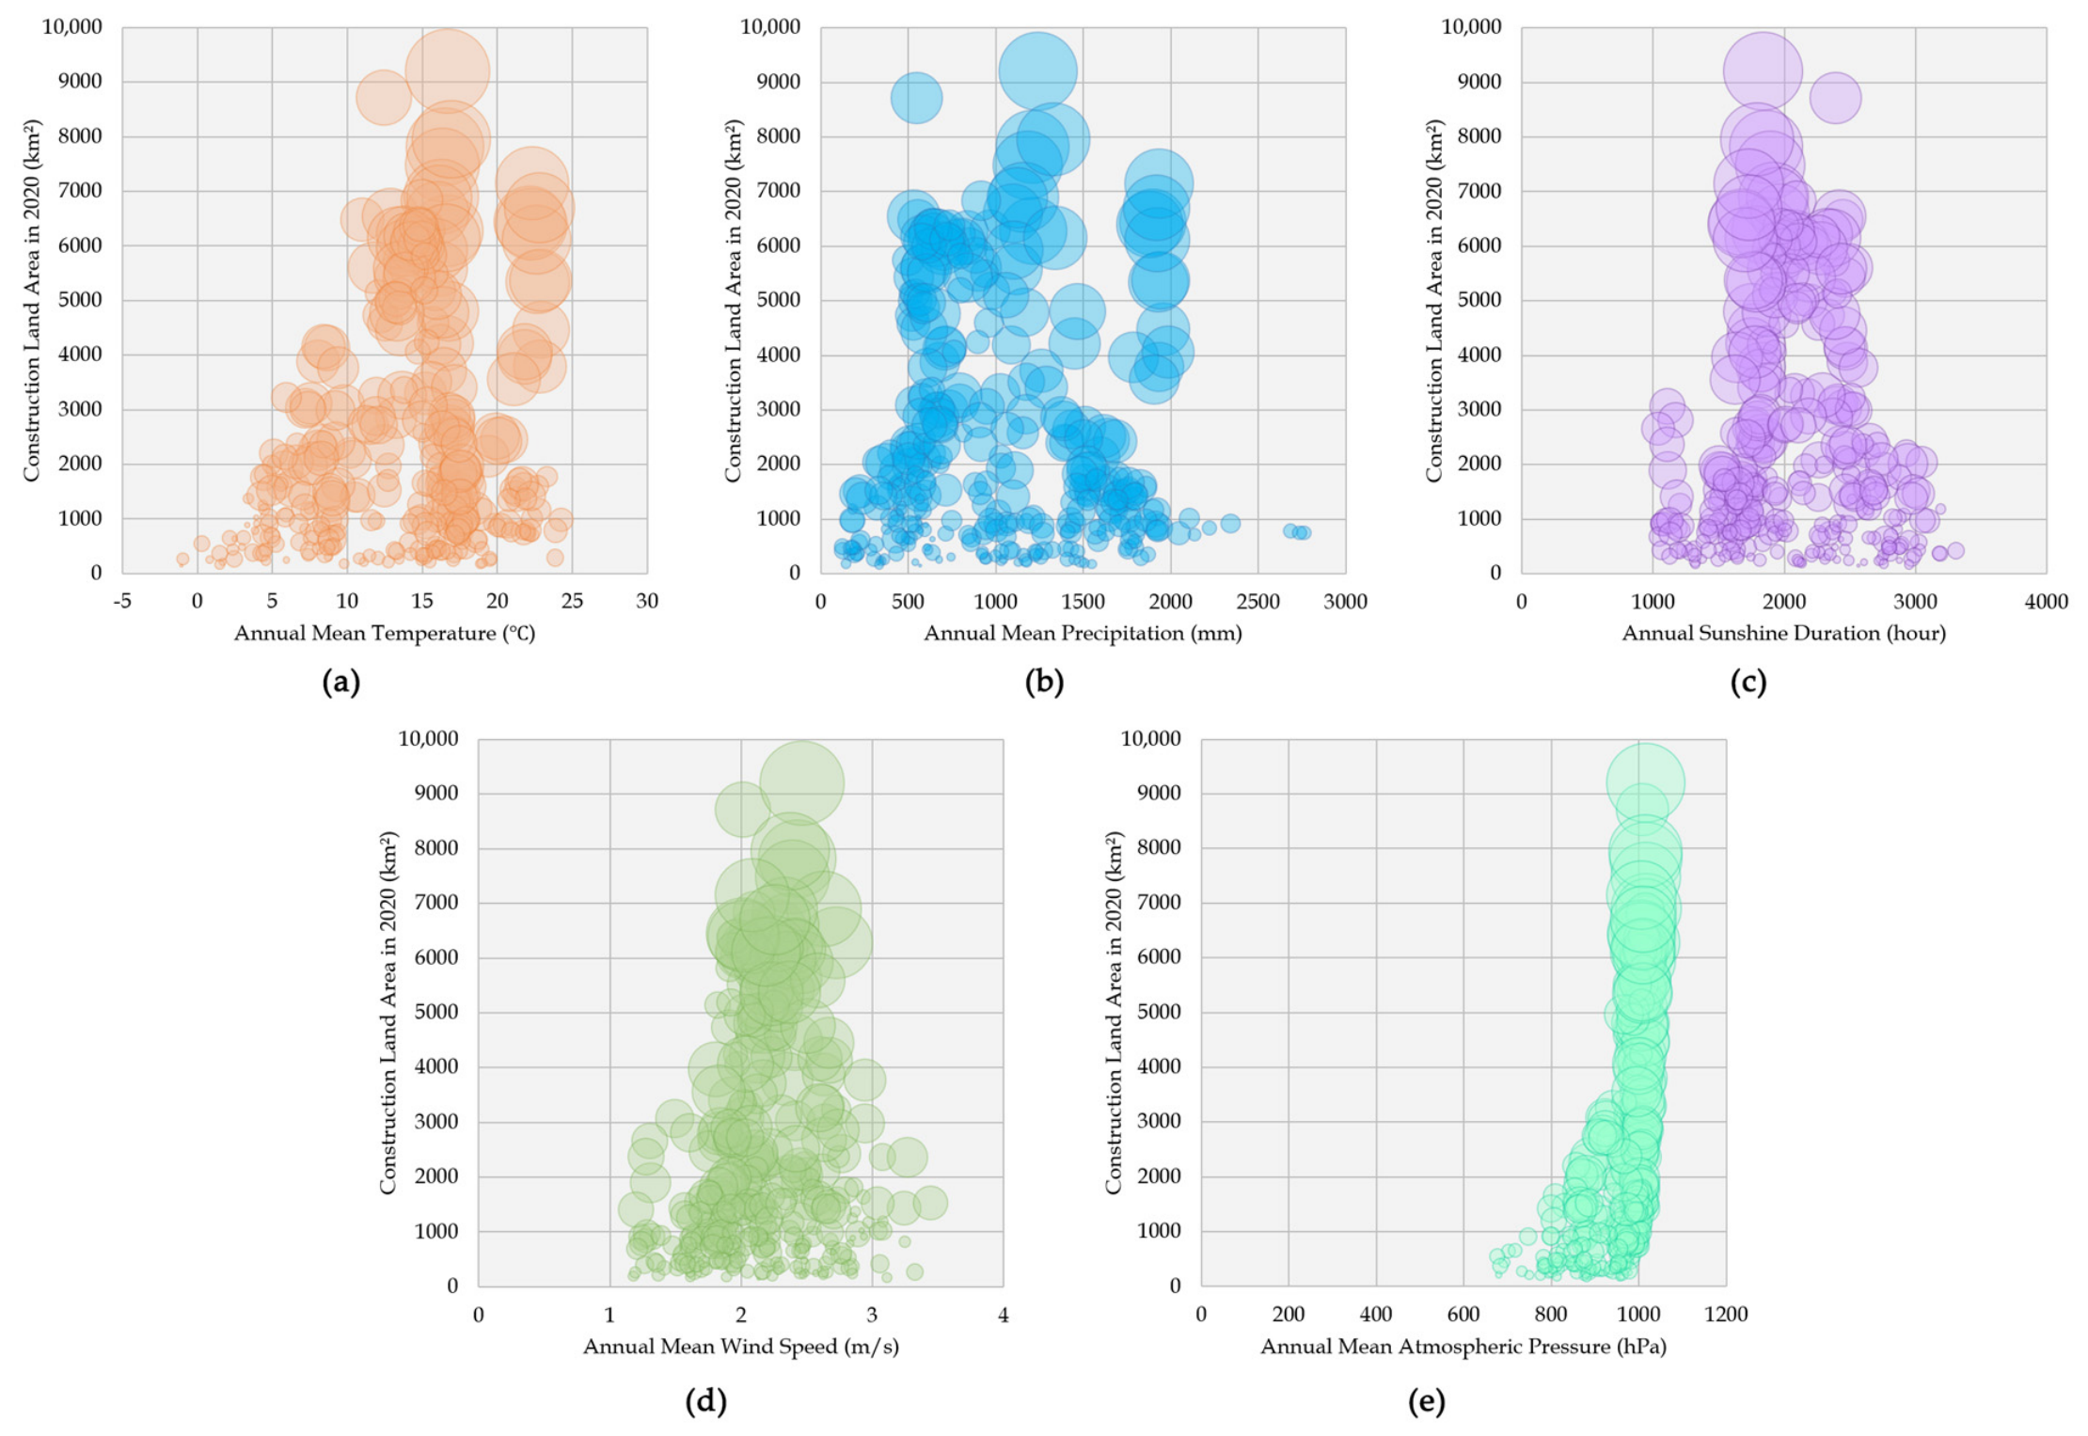
Bubble charts were constructed for different climatic conditions to examine the relationships among climatic conditions, construction land stock, and changes in construction land. The bubble charts include three variables: the X-axis represents climatic characteristics, including annual mean temperature, annual mean precipitation, annual sunshine duration, annual mean wind speed, and annual mean atmospheric pressure; the Y-axis represents construction land area in 2020; and bubble size represents the increase in construction land area from 2000 to 2020. It should be noted that the city samples do not represent only the administrative areas of the cities. Instead, each sample is defined as the terrestrial area within a 100-km radius of the central city. This spatial extent provides a broader spatial context around each central city and generally includes new towns, satellite towns, and other areas within the surrounding metropolitan area. Therefore, the construction land area and growth shown in the figure reflect the overall characteristics of construction land within the broader areas surrounding the central cities. The results are shown in Figure 9.
Figure 9.
Bubble charts of construction land area and growth around central cities under different climate conditions. ((a) Annual mean temperature; (b) annual mean precipitation; (c) annual sunshine duration; (d) annual mean wind speed; (e) annual mean atmospheric pressure).
In terms of annual mean temperature, most cities are located in areas with annual mean temperatures of 10–25 °C, accounting for 70.9% of all cities. Cities with relatively large construction land areas and more pronounced growth are more concentrated in warmer areas with annual mean temperatures above 15 °C, and in some cases above 20 °C. Typical examples include Guangzhou, Shenzhen, and Dongguan. Overall, the bubble charts show a positive spatial association between warmer climatic conditions and larger construction land areas and more rapid construction land growth.
In terms of annual mean precipitation, most cities are located in areas with annual precipitation of 500–1500 mm, accounting for 82.2% of all cities. Cities with relatively large construction land areas and more pronounced growth are more frequently found in areas with annual precipitation above 1000 mm, and in some cases above 1500 mm, where water resources are relatively abundant. Overall, construction land is more frequently associated with areas receiving moderate to relatively high precipitation.
In terms of annual sunshine duration, most cities are located in areas with 1500–2500 h of annual sunshine, accounting for 67.2% of all cities. Cities with relatively large construction land areas and more pronounced growth are more concentrated in areas with around 2000 h of annual sunshine, equivalent to approximately 5.5 h of sunshine per day on average. Shanghai, Suzhou, and Nanjing are representative examples. Overall, construction land is mainly concentrated in areas with moderate levels of sunshine, while cities in areas with either relatively low or high sunshine duration tend to have smaller construction land areas.
In terms of annual mean wind speed, most cities are located in areas with annual mean wind speeds of 1.5–2.5 m/s, accounting for 58.0% of all cities. Cities with relatively large construction land areas and more pronounced growth are more concentrated in areas with annual mean wind speeds of around 2 m/s, with Hangzhou and Linyi being representative examples. Overall, the distribution of construction land and its growth varies across wind-speed conditions, with relatively large values concentrated around moderate wind-speed levels.
In terms of annual mean atmospheric pressure, most cities are located in areas with annual mean atmospheric pressure above 900 hPa, accounting for 77.0% of all cities. Cities with relatively large construction land areas and more pronounced growth are more concentrated in areas with annual mean atmospheric pressure of around 1000 hPa.
3.3.2. Construction Land Change and Climatic Characteristics
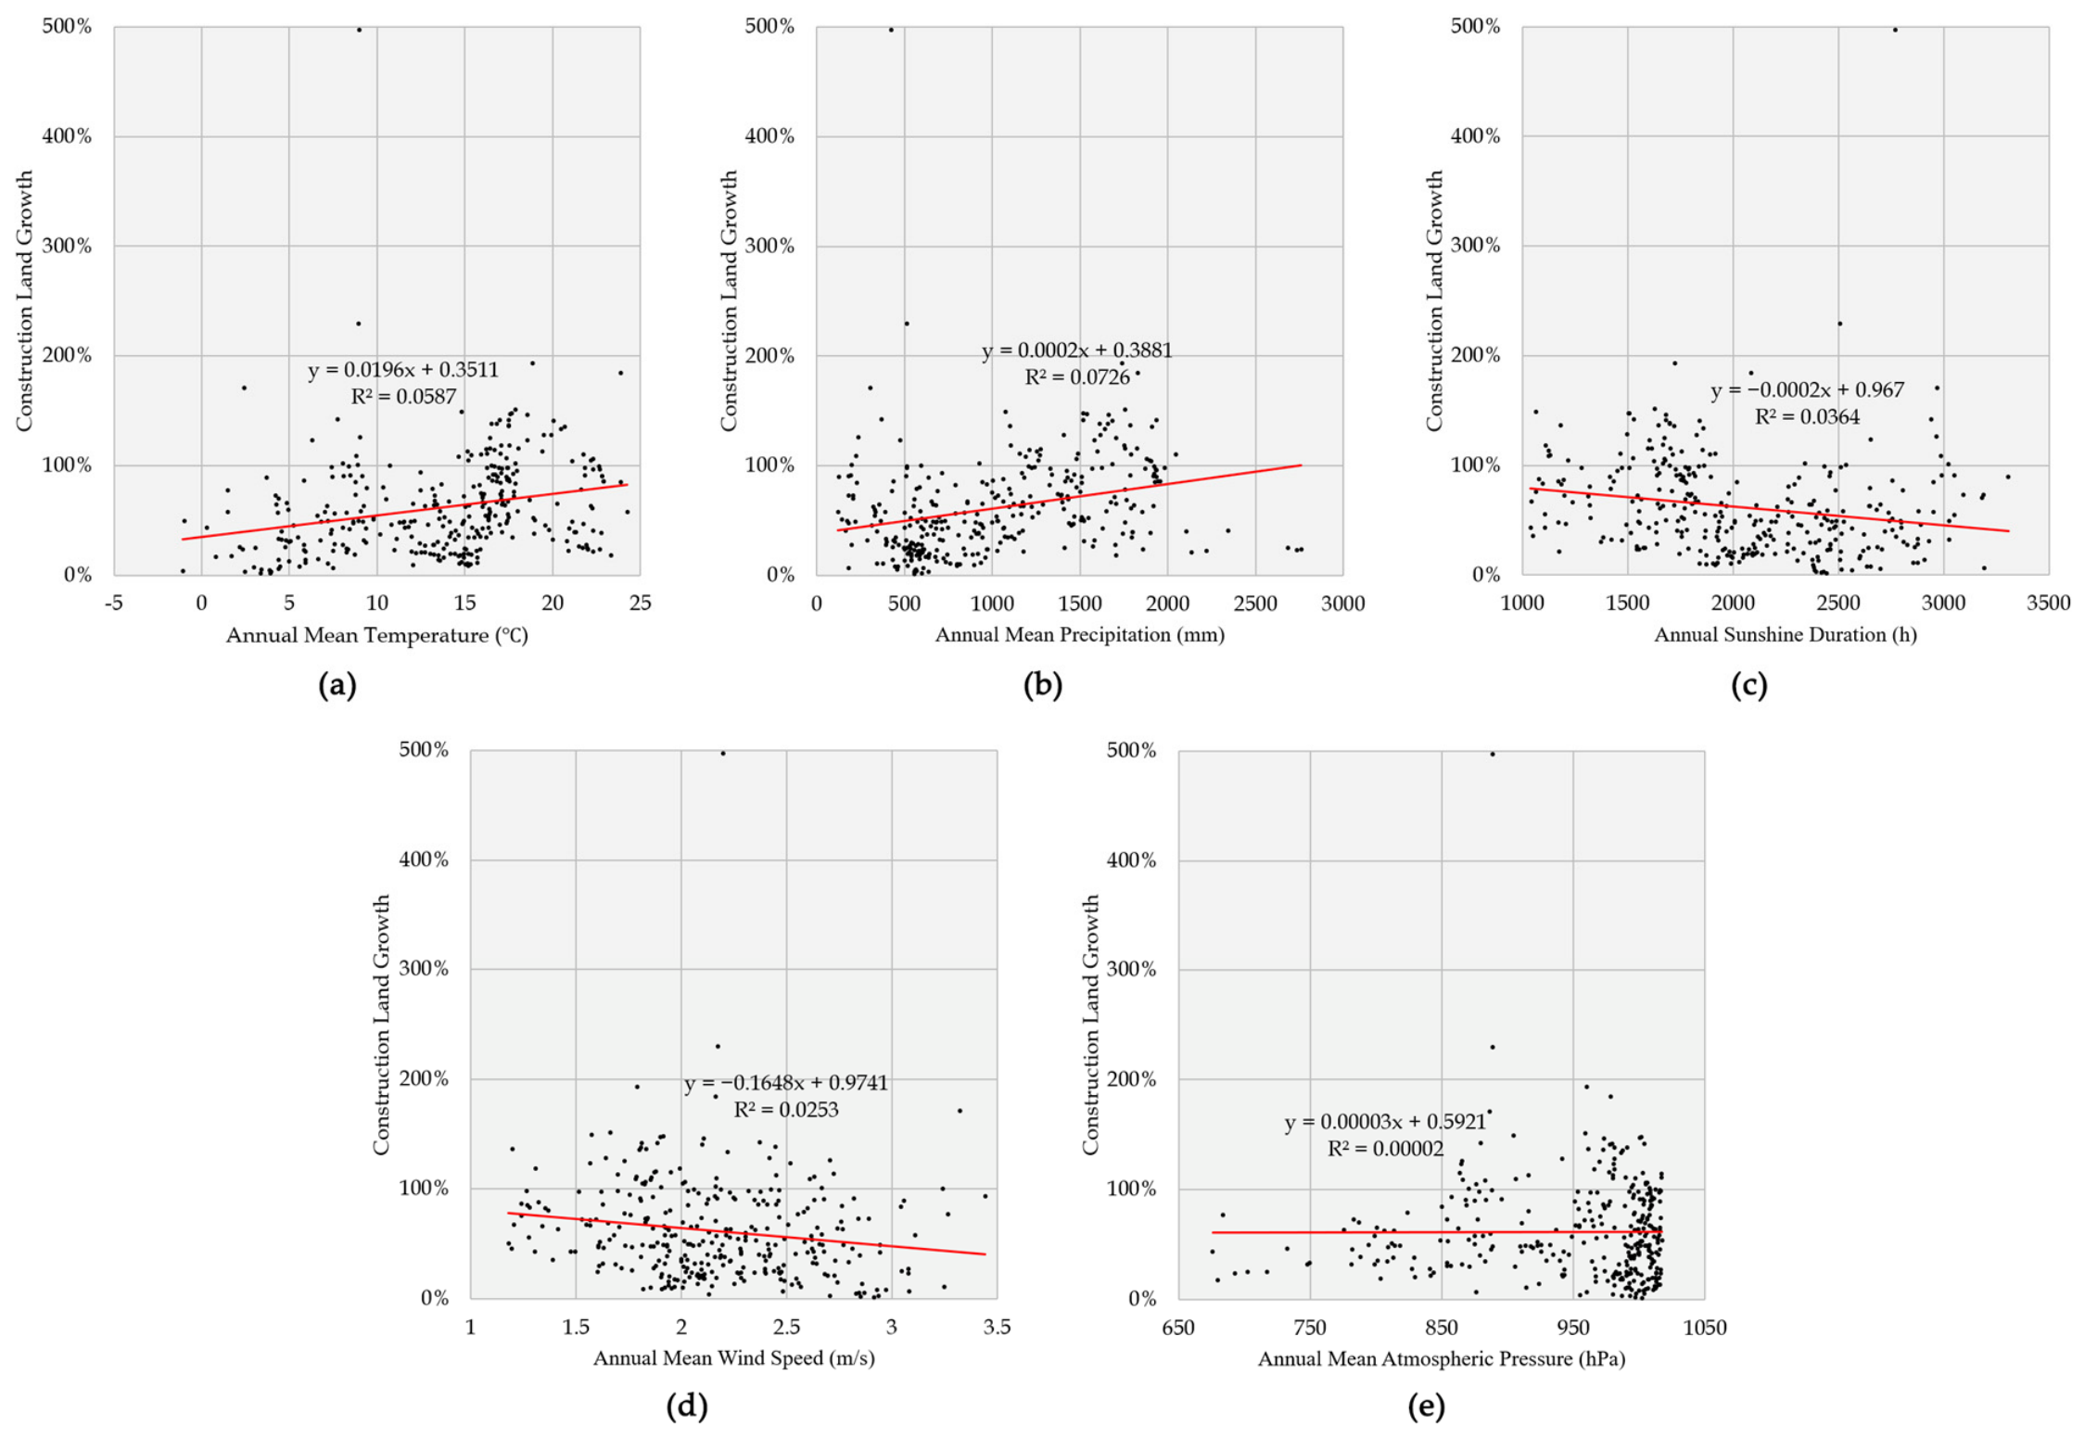
Overall, cities with higher annual mean temperatures tended to experience faster growth in construction land area (Figure 10a). The linear regression indicates a positive association between annual mean temperature and construction land growth, with a correlation coefficient of 0.24 (β = 0.0196, R2 = 0.0587, p < 0.001, 95% CI: 0.0110 to 0.0282). Although the strength of the relationship is relatively modest, the result indicates that warmer cities tended to show somewhat faster construction land expansion during the study period.
Figure 10.
Two-dimensional scatter plots and linear regression results for construction land growth and climatic characteristics around central cities. ((a) Annual mean temperature and construction land growth; (b) annual mean precipitation and construction land growth; (c) annual sunshine duration and construction land growth; (d) annual mean wind speed and construction land growth; (e) annual mean atmospheric pressure and construction land growth).
A similar positive pattern was observed for annual mean precipitation (Figure 10b). Cities receiving more precipitation generally showed greater growth in construction land area, with a correlation coefficient of 0.27 (β = 0.000224, R2 = 0.0726, p < 0.001, 95% CI: 0.000136 to 0.000311). This indicates a moderate positive spatial association between precipitation and construction land growth, although the underlying factors cannot be determined from the present analysis.
In contrast, annual sunshine duration was negatively associated with construction land growth (Figure 10c). Cities with longer annual sunshine durations tended to have lower growth rates in construction land area, with a correlation coefficient of −0.19 (β = −0.000170, R2 = 0.0364, p < 0.001, 95% CI: −0.000266 to −0.0000746). The relationship is relatively weak, indicating that sunshine duration alone provides only limited description of the differences in construction land growth among cities.
Annual mean wind speed also showed a negative association with construction land growth (Figure 10d). Cities with higher mean wind speeds generally experienced slower growth in construction land area, with a correlation coefficient of −0.16 (β = −0.16484, R2 = 0.0253, p = 0.004, 95% CI: −0.27667 to −0.05300). As with sunshine duration, the relatively weak correlation suggests that wind speed alone may not fully explain the observed differences in construction land growth.
In comparison with the other climatic variables, annual mean atmospheric pressure showed virtually no linear relationship with construction land growth (Figure 10e). The regression produced an R2 of only 0.00002 (β = 0.0000267, p = 0.937, 95% CI: −0.00064 to 0.00069), indicating that atmospheric pressure has almost no linear explanatory power for variation in construction land growth in this analysis. Its relationship with construction land expansion may therefore be more complex and potentially intertwined with factors such as topography, population distribution, economic development, and other climatic conditions.
3.3.3. Comparison of Construction Land Spatial Distribution and Growth Patterns Under Different Climatic Conditions
Building on the preceding analysis, a quadrant analysis was further conducted by combining the existing scale of construction land around central cities with its recent growth trend. This approach was used to identify different patterns of construction land stock and growth among cities and to examine how these patterns are distributed across different climatic conditions.
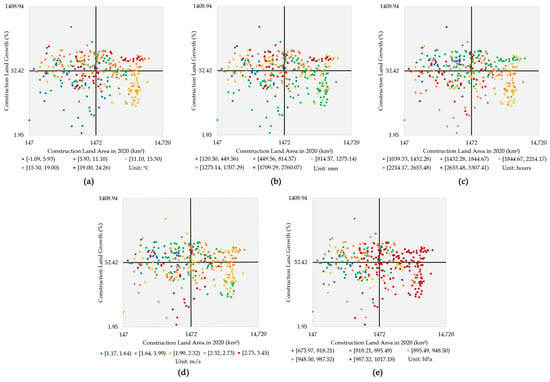
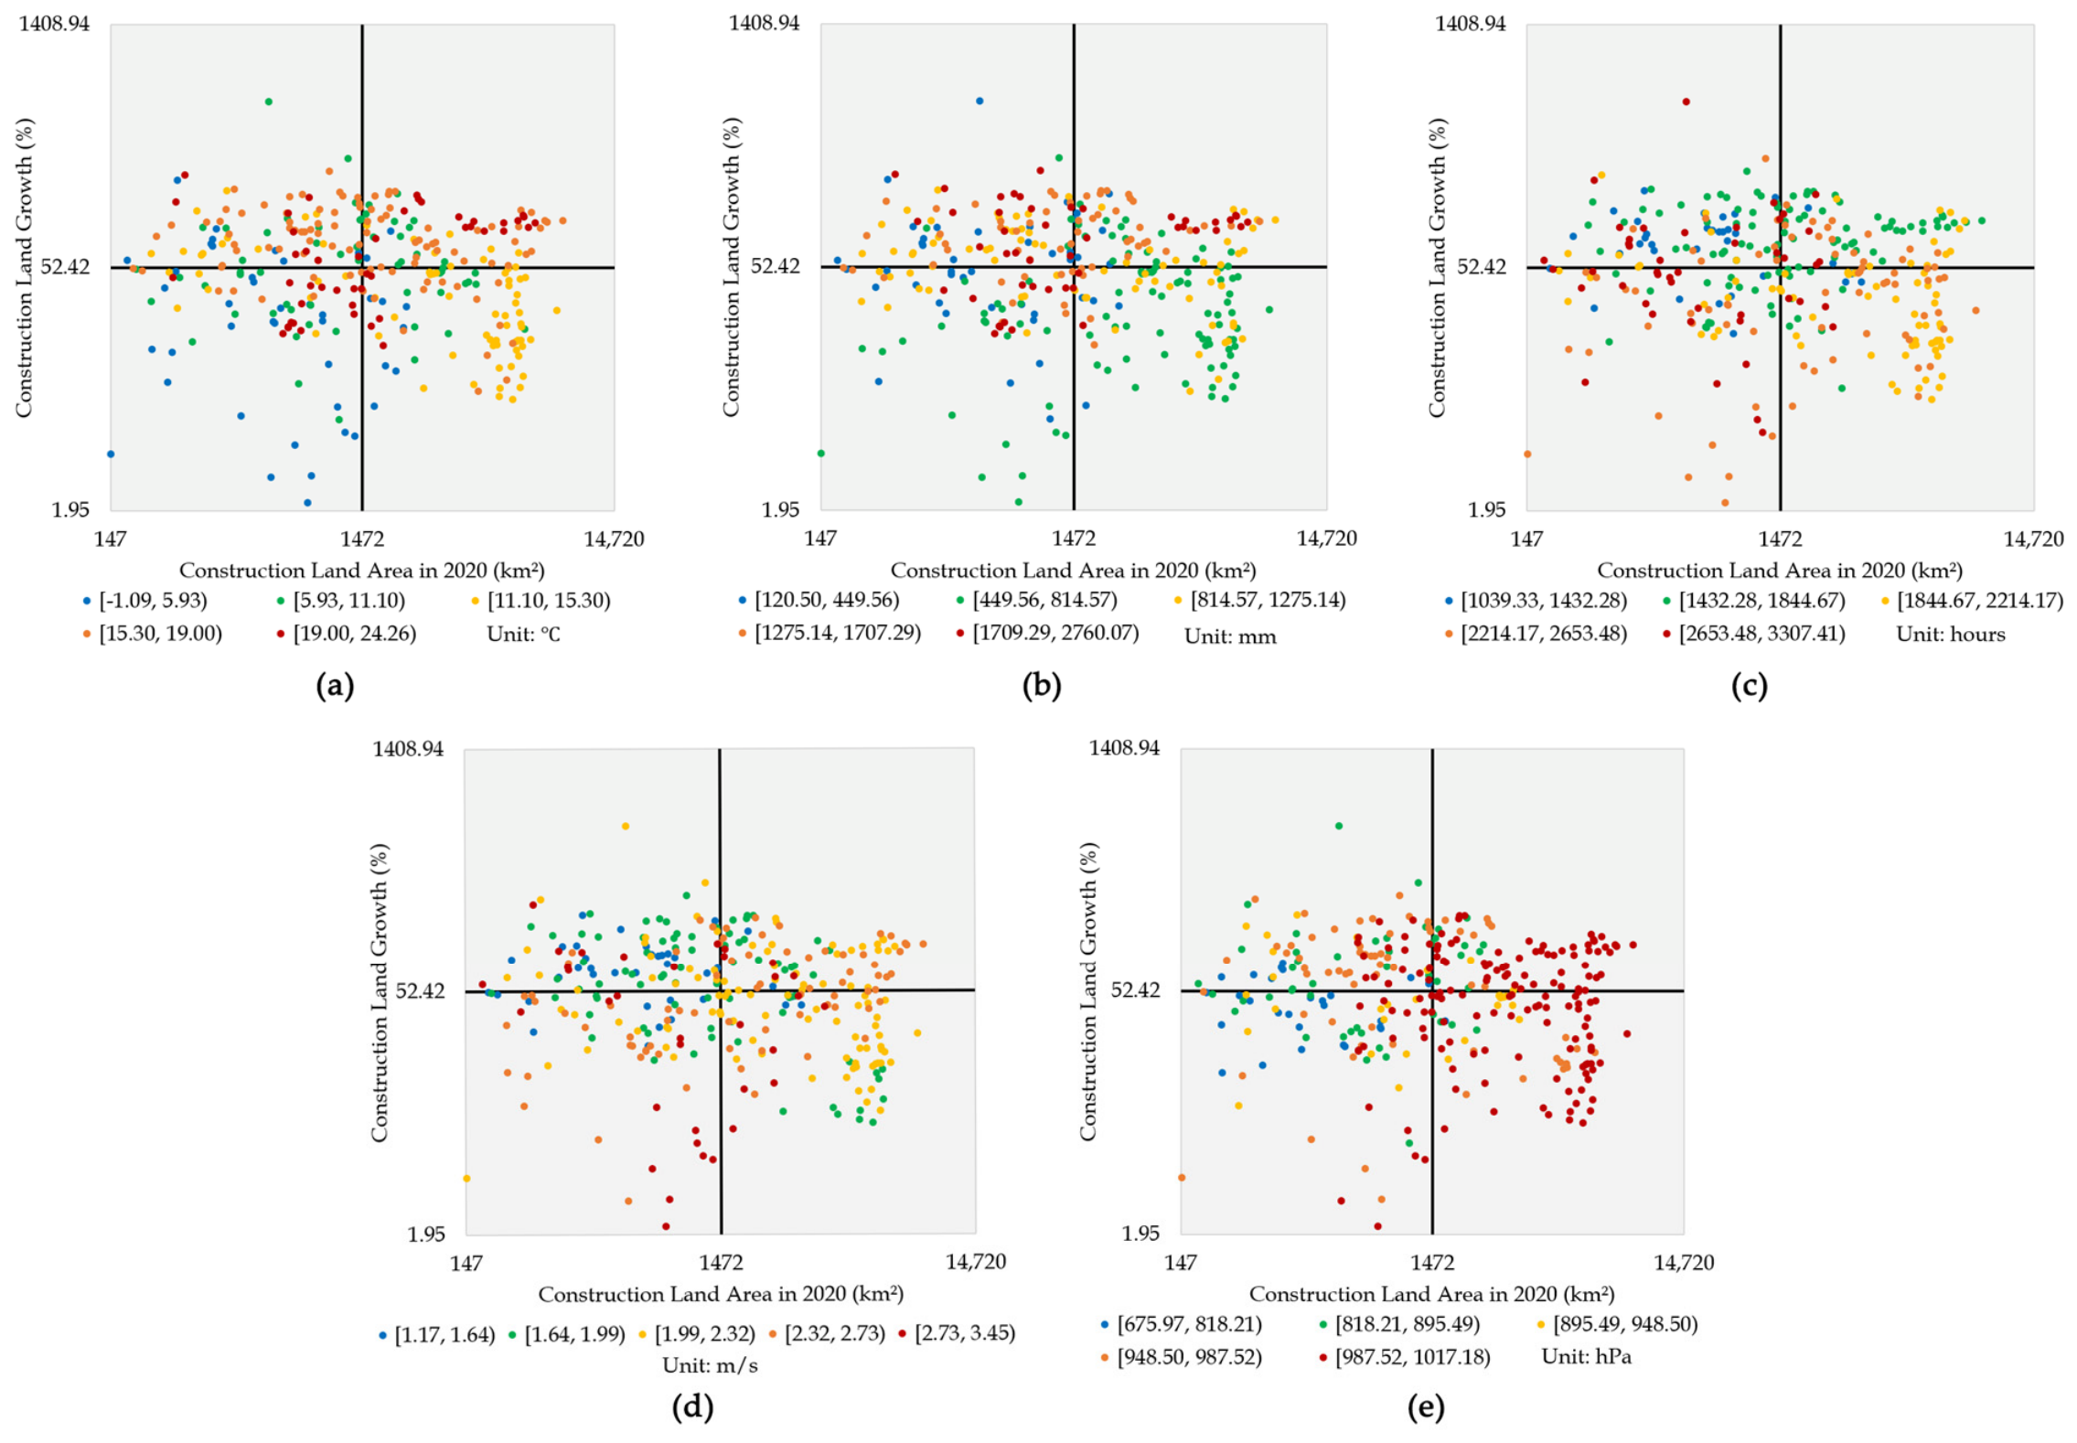
The X-axis of the quadrant plots represents construction land area in 2020, while the Y-axis represents the growth rate of construction land area from 2000 to 2020. The intersection of the X- and Y-axes was defined using the median values of these two indicators across the 326 sampled cities. The median construction land area in 2020 was 1472 km2, while the median growth rate of construction land area from 2000 to 2020 was 52.42%. Based on these thresholds, five quadrant plots were produced. The positions of the city points remain identical across all five plots, while the colors of the points represent the five climatic variables—annual mean temperature, annual mean precipitation, annual sunshine duration, annual mean wind speed, and annual mean atmospheric pressure. For each climatic variable, the 326 cities were classified into five categories using the Jenks Natural Breaks method, with different colors assigned to the respective classes. The results are shown in Figure 11.
Figure 11.
Quadrant analysis of construction land area and growth around central cities under different climate conditions. ((a) Annual mean temperature; (b) annual mean precipitation; (c) annual sunshine duration; (d) annual mean wind speed; (e) annual mean atmospheric pressure).
It should be noted that the distributions of construction land area and its growth rate differ substantially in scale. When linear axes are used, the median thresholds are positioned relatively close to one end of the axes, resulting in considerable differences in the visual proportions of the four quadrants. To facilitate the identification of different city types and provide a more balanced visual representation of the four quadrants, logarithmic scales were therefore used in Figure 11. The logarithmic transformation is intended only to improve the readability of the figures and does not alter the quadrant classification of the cities.
The first quadrant represents cities with high construction land stock and high growth. These cities have already developed relatively large amounts of construction land around the central city while continuing to expand rapidly during 2000–2020. This quadrant contains 77 cities, with mean annual temperature, annual precipitation, annual sunshine duration, annual mean wind speed, and annual mean atmospheric pressure of 15.8 °C, 1218 mm, 1982 h, 2.2 m/s, and 986 hPa, respectively. Typical examples include Shenzhen, Xiamen, Hangzhou, and Wuhu. Overall, these cities are characterized by relatively warm temperatures, relatively abundant precipitation, moderate sunshine duration, and relatively high atmospheric pressure.
The second quadrant represents cities with low construction land stock and high growth. These cities currently have relatively small amounts of construction land but have experienced relatively rapid expansion during 2000–2020, with many showing characteristics of emerging growth. This quadrant contains 86 cities, with mean annual temperature, annual precipitation, annual sunshine duration, annual mean wind speed, and annual mean atmospheric pressure of 14.3 °C, 1157 mm, 1885 h, 2.0 m/s, and 928 hPa, respectively. Compared with cities in the first quadrant, the average values of all five climatic variables are slightly lower: temperatures are somewhat lower, precipitation and sunshine duration are slightly lower, and both wind speed and atmospheric pressure are also relatively low. Typical examples include Zhaotong and Xingyi. Overall, these cities exhibit relatively rapid construction land growth despite having relatively limited construction land stock, indicating that rapid expansion also occurred in areas with comparatively lower values for several climatic indicators.
The third quadrant represents cities with low construction land stock and low growth. These cities have relatively small amounts of construction land and have experienced relatively slow expansion during 2000–2020. This quadrant contains 77 cities, with mean annual temperature, annual precipitation, annual sunshine duration, annual mean wind speed, and annual mean atmospheric pressure of 11.0 °C, 959 mm, 2209 h, 2.3 m/s, and 900 hPa, respectively. Compared with the other quadrants, these cities exhibit a distinctive climatic profile, characterized by lower temperatures and relatively limited precipitation, but more abundant sunshine, higher wind speeds, and lower atmospheric pressure. Typical examples include Jinchang, Lijiang, Tacheng, Chifeng, Haidong, and Guyuan. Overall, these cities are mostly located in relatively cold, dry, or high-elevation areas, where both the existing scale and recent growth of construction land remain relatively limited.
The fourth quadrant represents cities with high construction land stock and low growth. These cities have already developed relatively large amounts of construction land, but their expansion was relatively slow during 2000–2020. This quadrant contains 86 cities, with mean annual temperature, annual precipitation, annual sunshine duration, annual mean wind speed, and annual mean atmospheric pressure of 13.2 °C, 781 mm, 2139 h, 2.2 m/s, and 984 hPa, respectively. Compared with the first quadrant, these cities are generally characterized by slightly lower temperatures, substantially less precipitation, slightly longer sunshine duration, similar wind speeds, and relatively high atmospheric pressure. Typical examples include Liaocheng, Handan, and Hebi.
4. Discussion
4.1. The Associations Between Climatic Conditions and Construction Land Distribution and Change Vary Considerably
The results indicate substantial differences in the spatial distribution and growth of construction land across different climatic conditions. Overall, temperature shows a relatively clear positive spatial association with both the distribution and growth of construction land. Warmer areas generally contain larger amounts of construction land and, in some cases, show higher growth rates. Precipitation also shows a clear spatial association with construction land distribution. Areas with moderate to relatively high precipitation generally contain larger amounts of construction land, while some areas with very low precipitation have also experienced relatively rapid growth. This indicates that the relationship between precipitation and construction land growth is not simply linear.
The relationship between sunshine duration and construction land is comparatively less pronounced. Construction land is mainly concentrated in areas with moderate sunshine duration, while the growth analysis shows a weak negative association between sunshine duration and construction land expansion. Wind speed also shows a range-dependent spatial pattern. Construction land is relatively concentrated in areas with moderate wind speeds, while rapid growth of some types of construction land has also occurred in areas with relatively high wind speeds. This suggests that the association between wind speed and construction land growth varies across wind-speed ranges rather than following a simple linear pattern.
In contrast, the relationship between annual mean atmospheric pressure and construction land distribution and growth is more complex. Construction land is relatively concentrated in areas with higher atmospheric pressure, which generally correspond to lower-elevation areas, while some low-pressure, high-elevation regions have also experienced relatively rapid growth. The very limited linear association between atmospheric pressure and construction land growth further indicates that its relationship with construction land change cannot be adequately characterized by a simple linear pattern.
4.2. Different Types of Construction Land Exhibit Distinct Spatial Patterns Across Climatic Conditions
The analysis further demonstrates that different types of construction land exhibit distinct spatial patterns across climatic conditions. Their distributions and changes therefore cannot be fully characterized by a single pattern. Urban land and rural residential land show broadly similar distributions across climatic classes, as both are generally concentrated in areas where construction land as a whole is relatively extensive. However, their growth patterns differ, with urban land generally showing more pronounced changes than rural residential land during the study period.
Other types of construction land exhibit substantially different spatial patterns from urban and rural residential land. Industrial and mining sites, large industrial zones, oil fields, salt fields, quarries, and related land uses are often associated with specific resource endowments, industrial functions, and transportation conditions. These characteristics may help explain why other construction land shows relatively smaller differences across climatic classes and why substantial concentrations may occur in areas with relatively cold, dry, or high-elevation conditions.
The differences among construction land types indicate that climatic conditions are associated with different spatial patterns depending on the functional characteristics of the land. Urban land and rural residential land are more closely related to settlement patterns, whereas other construction land encompasses a wider range of industrial, resource-related, and infrastructure-related functions. These differences should therefore be considered when examining the spatial associations between climatic conditions and construction land.
4.3. The Distribution and Change Characteristics of Construction Land Provide Different Analytical Perspectives
The preceding analysis examined both the spatial distribution of construction land under different climatic conditions and its changes between 2000 and 2020. The results show that the spatial distribution and changes in construction land do not necessarily exhibit consistent patterns under the same climatic conditions. This apparent divergence does not indicate a contradiction; rather, the two dimensions capture different aspects of construction land dynamics.
The spatial distribution of construction land primarily reflects long-term spatial patterns and accumulated development, whereas changes in construction land capture spatial adjustments and expansion during the study period. Therefore, areas with large amounts of existing construction land do not necessarily correspond to areas with the fastest growth. Some regions with relatively limited construction land stocks experienced substantial expansion during 2000–2020, while some regions with large existing stocks showed comparatively slower growth.
This distinction is important for interpreting the associations between climatic conditions and construction land. Spatial distribution reflects long-term accumulated development, whereas changes in construction land capture more recent dynamics. These two dimensions therefore provide complementary perspectives. The stock–growth analysis around central cities further illustrates this pattern.
4.4. Non-Climatic Factors Associated with Construction Land Changes
The spatial patterns and changes identified above are likely to reflect a combination of climatic and non-climatic factors. Population distribution, migration, urbanization, economic development, industrial restructuring, infrastructure, resource availability, and regional development conditions may all be associated with construction land development. These factors may also overlap spatially with climatic conditions. For example, areas with relatively warm and humid conditions often coincide with regions characterized by higher population concentration, stronger economic activity, and more developed infrastructure, while some cold, dry, or high-elevation regions may differ simultaneously in population distribution, resource endowments, and accessibility. Such spatial overlaps may contribute to the associations observed in this study.
Resource and infrastructure conditions may be particularly relevant to construction land growth under diverse climatic settings. Water availability may constrain development in arid and semi-arid regions, while mineral and energy resources, transportation infrastructure, and regional economic activities may be associated with construction land expansion in areas with relatively unfavorable climatic conditions. These factors provide possible explanations for some of the observed patterns, but their specific contributions are not directly examined in the present study. Future research could therefore integrate demographic, economic, infrastructural, resource, and other territorial variables into a multivariable and longitudinal framework to further examine their relationships with construction land changes.
Climate change and technological and energy transitions provide additional considerations for longer-term research. Changes in temperature and precipitation may alter the spatial context of construction land development, while advances in energy systems, transportation, water-resource utilization, building technologies, and environmental management may modify development conditions in some regions. However, these potential changes cannot be inferred directly from the present analysis and would require scenario-based research integrating climatic and socioeconomic changes.
5. Conclusions
This study examines the associations between climatic conditions and the spatial patterns and changes in construction land in China during 2000–2020. The results reveal distinct spatial associations across climatic factors and construction land types. Temperature shows a relatively clear positive association with construction land growth, while precipitation is associated with both construction land distribution and growth across relatively wet and dry regions. Sunshine duration shows a less pronounced relationship, wind speed exhibits a range-dependent pattern, and atmospheric pressure is strongly associated with the spatial distribution of construction land but has a very limited linear association with its growth. Urban land, rural residential land, and other construction land also show distinct spatial patterns across climatic conditions. Analysis of central cities and their surrounding areas within a 100 km radius further shows that construction land stock and recent growth are not necessarily aligned, indicating that long-term spatial distribution and recent change represent different dimensions of construction land dynamics. The observed associations may reflect the combined roles of climatic and non-climatic factors, including population, economic development, urbanization, infrastructure, resources, topography, and technology. These relationships should therefore be interpreted as spatial associations rather than direct evidence of causal mechanisms or predictions of future construction land change.
Overall, this study provides a macro-level exploratory assessment of the spatial associations between climatic conditions and construction land in China, while several limitations remain regarding spatial scale, climatic indicators, and mechanism identification. First, the characterization of climatic conditions relies mainly on annual indicators, including annual mean temperature, annual precipitation, annual sunshine duration, annual mean wind speed, and annual mean atmospheric pressure. Seasonal variations, intra-annual fluctuations, and extreme climatic events are therefore not fully captured. For example, annual temperature range, seasonal temperature variations, and extreme heat and cold events may provide additional information relevant to human settlement and urban development. Second, the study examines individual climatic factors separately and does not systematically consider their combined effects or potential interactions. In addition, the analysis at the regional and city scales focuses primarily on construction land scale and change, without incorporating population size and migration, economic development, industrial structure, urbanization, topography, infrastructure, and other relevant factors into a unified analytical framework. The findings should therefore be understood primarily as spatial associations rather than causal relationships. Third, the use of the 100 km-radius areas around central cities facilitates cross-city comparison but may overlook differences in urban form and administrative extent. In densely urbanized regions, overlapping areas may result in the same construction land being included in multiple city-level observations, potentially causing data interference and affecting the comparability of the results.
Future research could extend this framework by integrating climatic conditions with population dynamics, economic activity, technological development, and land-use change, while incorporating multiple spatial and temporal scales. Where data availability and consistency permit, municipal administrative boundaries could also be used as an alternative spatial unit for comparison, providing a more consistent basis for integrating socioeconomic and land-use data. A broader climate–population–economy–land-use framework could help examine the potential mechanisms underlying construction land patterns and their spatial and temporal variation, providing a more comprehensive understanding of the formation and evolution of construction land in China.
Author Contributions
Conceptualization, C.C.; methodology, C.C.; software, C.C. and J.W.; validation, C.C. and J.W.; formal analysis, C.C.; investigation, C.C.; resources, C.C.; data curation, C.C. and J.W.; writing—original draft preparation, C.C.; writing—review and editing, C.C. and J.W.; visualization, C.C.; supervision, C.C.; project administration, C.C.; funding acquisition, C.C. All authors have read and agreed to the published version of the manuscript.
Funding
This research was funded by the Shanghai soft science research project (grant number 23692101100).
Data Availability Statement
The CNLUCC data used in this study can be accessed on the website https://www.resdc.cn (accessed on 12 August 2025). The meteorological data for mainland China used in this study can be accessed on the website https://www.resdc.cn (accessed on 12 August 2025). The meteorological data for Taiwan, China, used in this study can be accessed on the website https://www.cwa.gov.tw (accessed on 12 August 2025). The map data required for the study can be found in the atlases for the relevant years.
Conflicts of Interest
The authors declare no conflicts of interest.
References
- Dale, V.H. The relationship between land-use change and climate change. Ecol. Appl. 1997, 7, 753–769. [Google Scholar] [CrossRef]
- Mendelsohn, R.; Dinar, A. Land Use and Climate Change Interactions. Annu. Rev. Resour. Econ. 2009, 1, 309–332. [Google Scholar] [CrossRef] [Scilit]
- Yang, C.; Zhang, L.; Gong, L. Impacts of climate and land use change on soil conservation function in Baiyangdian basin. Bull. Soil Water Conserv. 2025, 45, 363–373. [Google Scholar] [CrossRef]
- Liu, Z.; Jiao, L.; Lian, X. Effects of Climate Change and Cultivated Land Use Change on Climatic Potential Productivity of Cultivated Land in China from 1995 to 2020. China Land Sci. 2022, 36, 62–73. [Google Scholar]
- Kuang, W.; Zhang, S.; Du, G.; Du, G.M.; Yan, C.Z.; Wu, S.X.; Li, R.D.; Liu, J.Y. Remotely sensed mapping and analysis of spatio-temporal patterns of land use change across China in 2015–2020. Acta Geogr. Sin. 2022, 77, 1056–1071. [Google Scholar]
- Zhou, T.; Shi, P.; Wang, S. Impact of Climate Change and Human Activities on Soil Carbon Storage in China. Acta Geogr. Sin. 2003, 58, 727–734. [Google Scholar]
- Zhao, Y.; Ni, Z.; Zhang, Y.; Wan, P.; Geng, C.; Yu, W.; Li, Y.; Long, Z. Exploring the Spatiotemporal Evolution Patterns and Determinants of Construction Land in Mianning County on the Eastern Edge of the Qinghai–Tibet Plateau. Land 2024, 13, 993. [Google Scholar] [CrossRef] [Scilit]
- Ren, Y.; Jia, X.; Zhao, Y.; Wang, H.; Shan, L.; Zhang, P.; Si, S. The changes of ecosystem services in the Hexi Corridor and their driving forces under future climate change scenarios. Acta Ecol. Sin. 2025, 45, 1–16. [Google Scholar] [CrossRef]
- Xiao, Y.; Xu, Y.; Wu, B. Spatial patterns, influencing factors and type classification in villages of Hainan Island, China. Sci. Geogr. Sin. 2023, 43, 1410–1422. [Google Scholar] [CrossRef]
- Liu, Z.; Ding, Y.; Jiao, Y.; Wang, J.; Liu, C.; Yang, Y.; Wei, J. Spatial patterns and controlling factors of settlement distribution in ethnic minority settlements of southwest China: A case study of Hani terraced fields. Prog. Geogr. 2021, 40, 257–271. [Google Scholar] [CrossRef] [Scilit]
- Yang, K.; Song, Y.; Xue, D. Spatiotemporal change of rural settlement land in the Loess Plateau and influencing factors. Resour. Sci. 2020, 42, 1311–1324. [Google Scholar] [CrossRef] [Scilit]
- Cheng, Y.; Wu, C. Planning approach of urban blue-green space based on local climate optimization: A review. Chin. J. Appl. Ecol. 2020, 31, 3935–3945. [Google Scholar] [CrossRef]
- Rui, Y.; Tang, B.; Wang, X.; Teng, M.A.; Liu, X. The spatio-temporal evolutionary characteristics and the impact mechanism of national garden cities in China. Geogr. Res.-Aust. 2018, 37, 20–36. [Google Scholar]
- Freihardt, J. Environmental shocks and migration among a climate-vulnerable population in Bangladesh. Popul Environ. 2025, 47, 6. [Google Scholar] [CrossRef] [Scilit]
- Gray, C.; Wise, E. Country-specific effects of climate variability on human migration. Clim. Change 2016, 135, 555–568. [Google Scholar] [CrossRef] [Scilit]
- Gray, C.L.; Mueller, V. Natural disasters and population mobility in Bangladesh. Proc. Natl. Acad. Sci. USA. 2012, 109, 6000–6005. [Google Scholar] [CrossRef] [Scilit]
- Cattaneo, C.; Peri, G. The migration response to increasing temperatures. J. Dev. Econ. 2016, 122, 127–146. [Google Scholar] [CrossRef] [Scilit]
- Li, M.; Zhang, Y. The Effect of Air Pollution on Migration: A Study Based on the Choice of University City by International Students in China. Econ. Res. J. 2019, 54, 168–182. [Google Scholar]
- Zhang, X.; Sun, N.; Xu, M.; Zhang, W.; Li, J. Soil Organic Carbon in Agricultural Soils in China Under Global Climate Change. Sci. Agric. Sin. 2014, 47, 4618–4627. [Google Scholar] [CrossRef]
- Pielke, R.A., Sr.; Pitman, A.; Niyogi, D.; Mahmood, R.; McAlpine, C.; Hossain, F.; Goldewijk, K.K.; Nair, U.; Betts, R.; Fall, S.; et al. Land use/land cover changes and climate: Modeling analysis and observational evidence. Wiley Interdiscip. Rev. Clim. Change 2011, 2, 828–850. [Google Scholar] [CrossRef] [Scilit]
- Zhang, N.; Gao, Z.; Wang, X.; Chen, Y. Modeling the impact of urbanization on the local and regional climate in Yangtze River Delta, China. Theor. Appl. Climatol. 2010, 102, 331–342. [Google Scholar] [CrossRef] [Scilit]
- Hu, M.; Zhao, Z.; Li, X. Effects of China′s Land Use Changes on Regional Climate Based on RegCM4.7. J. Soil Water Conserv. 2025, 39, 300–308. [Google Scholar] [CrossRef]
- Yang, W.; Yan, Y.; Lin, Z.; Zhao, Y.; Li, C.; Zhang, X.; Shan, L. The Impact of Urbanization on Extreme Climate Indices in the Yangtze River Economic Belt, China. Land 2022, 11, 1379. [Google Scholar] [CrossRef] [Scilit]
- Zhang, N.; Wang, H.; Gallagher, J.; Song, Q.; Tam, V.W.; Duan, H. A dynamic analysis of the global warming potential associated with air conditioning at a city scale: An empirical study in Shenzhen, China. Environ. Impact Assess. Rev. 2020, 81, 106354. [Google Scholar] [CrossRef] [Scilit]
- Wang, M.; Wang, Y.; Wu, Y.; Yue, X.; Wang, M.; Hu, P. Identifying the spatial heterogeneity in the effects of the construction land scale on carbon emissions: Case study of the Yangtze River Economic Belt, China. Environ. Res. 2022, 212, 113397. [Google Scholar] [CrossRef] [Scilit]
- Peng, J.; Zheng, Y.; Liu, C. The Impact of Urban Construction Land Use Change on Carbon Emissions: Evidence from the China Land Market in 2000–2019. Land 2022, 11, 1440. [Google Scholar] [CrossRef] [Scilit]
- Huang, X.; Zhang, X.; Lu, X.; Wang, P.-Y.; Qin, J.-Y.; Jiang, Y.-C.; Liu, Z.-M.; Wang, Z.; Zhu, A.-X. Land development and utilization for carbon neutralization. J. Nat. Resour. 2021, 36, 2995–3006. [Google Scholar] [CrossRef] [Scilit]
- Li, X.; Li, H.; Man, W.; Dehua, M.; Zongming, W. Process and Driving Factors of Urban Land Expansion in Harbin-Changchun City Cluster. Sci. Geogr. Sin. 2018, 38, 1273–1282. [Google Scholar]
- Li, Z.; Luan, W.; Zhang, Z.; Su, M. Relationship between urban construction land expansion and population/economic growth in Liaoning Province, China. Land Use Policy 2020, 99, 105022. [Google Scholar] [CrossRef] [Scilit]
- Li, Y.; Li, Y.; Karácsonyi, D.; Liu, Z.; Wang, Y.; Wang, J. Spatio-temporal pattern and driving forces of construction land change in a poverty-stricken county of China and implications for poverty-alleviation-oriented land use policies. Land Use Policy 2020, 91, 104267. [Google Scholar] [CrossRef] [Scilit]
- Wu, X.; Yang, S.; Yin, S.; Xu, H. Spatial-temporal Dynamic Characteristics and Its Driving Mechanism of Urban Built-Up Area in Yangtze River Delta Based on GTWR Model. Resour. Environ. Yangtze Basin 2021, 30, 2594–2606. [Google Scholar]
- Yang, S.; Zhao, H.; Yan, Y. Research on the Spatiotemporal Patterns and Influencing Factors of Construction Land Changes in Prefecture-level Cities Districts in the Yellow River Basin. Urban Dev. Stud. 2025, 32, 102–110. [Google Scholar] [CrossRef]
- Dang, L.; Xu, Y.; Tang, Q. The pattern of available construction land along the Xijiang River in Guangxi, China. Land Use Policy 2015, 42, 102–112. [Google Scholar] [CrossRef] [Scilit]
- Xu, F.; Zhao, J.; Lin, Y.; Chen, G.P.; Li, K. Runoff prediction and influencing mechanisms in erhai lake basin under coupled climate and land use changes. J. Soil Water Conserv 2025, 39, 1–12. [Google Scholar] [CrossRef]
- Zhi, J.; Han, C.; Wang, X.; Zhang, L.; Zhu, C. Future construction land expansion under multiple simulation development scenarios and its impacts on landscape pattern evolution in China. Geogr. Res.-Aust. 2024, 43, 843–860. [Google Scholar] [CrossRef]
- Hou, L.; Jiang, Y.; Shi, T.; Gui, Q. Overview and prospect of urban planning studies based on climate change. City Plan. Rev. 2019, 43, 121–132. [Google Scholar]
- Wende, W.; Bond, A.; Bobylev, N.; Stratmann, L. Climate change mitigation and adaptation in strategic environmental assessment. Environ. Impact Asses 2012, 32, 88–93. [Google Scholar] [CrossRef] [Scilit]
- Xu, X.; Liu, J.; Zhang, S.; Li, R.; Yan, C.; Wu, S. China’s multi-period land use land cover remote sensing monitoring data set (CNLUCC). In Data Registration and Publication System of Resource and Environmental Science Data Center; Chinese Academy of Sciences: Beijing, China, 2018. [Google Scholar]

Disclaimer/Publisher’s Note: The statements, opinions and data contained in all publications are solely those of the individual author(s) and contributor(s) and not of MDPI and/or the editor(s). MDPI and/or the editor(s) disclaim responsibility for any injury to people or property resulting from any ideas, methods, instructions or products referred to in the content. |
© 2026 by the authors. Licensee MDPI, Basel, Switzerland. This article is an open access article distributed under the terms and conditions of the Creative Commons Attribution (CC BY) license.