


Abstract
This paper presents BSTwin, a computational workflow and application for the automatic generation of multi-level-of-detail building models and semantically enriched building stock records in urban areas of Slovakia. Its outputs are positioned as the building layer of a city information model (CIM) that can support future urban digital twin applications, not as an operational digital twin. BSTwin couples a lightweight, rule-based roof reconstruction engine for airborne LiDAR point clouds with a benchmark dataset mined from 13 open geodata sources: national registers (INSPIRE HVD Buildings, 2021 CENSUS, INFOREG-EC), European and global datasets (European building stock (EUBUCCO v0.2), Global Human Settlement Layer (GHSL R2023A), Copernicus Urban Atlas, GlobalBuildingAtlas (GBA), OpenBuildingMap (OBM), Microsoft Global Building Footprints) and open-source maps (OpenStreetMap, Overture Maps). Rather than proposing new learned segmentation models, the approach integrates published geometric methods (normal-seeded RANSAC with Hough parameter-space merging, ring-based ground estimation, 3DBAG reference heights, mSTEP azimuth rectification and recursive footprint decomposition) into a deterministic pipeline that runs on an ordinary computer without GIS/BIM software. The term GeoAI is used in its knowledge-driven sense, since no machine-learned model is involved. Each reconstruction and integrated attribute is verified through a quality-control block. On synthetic ground truth, the engine classified all five tested roof archetypes correctly with a point-to-plane RMSE of about 5 cm; on real national LiDAR covering 1468 buildings in the Staré Mesto district of Košice, it reconstructed 99.9% of the buildings, 96.2% of them without a quality flag, in a median of 0.20 s per building. The LiDAR ridge heights agreed with the INSPIRE register heights with a median difference of +0.48 m (65% within 1 m). For the Košice Self-governing Region, the bundled EUBUCCO v0.2 extract covers 488,363 buildings, 81.7% of which have heights of governmental origin. The findings indicate the potential of the workflow for building stock monitoring, renovation planning and as a data foundation for future urban digital twins.
1. Introduction
As the most numerous and consequential element of the built environment, a comprehensive and constantly updated knowledge of the state of building stock (more specifically, its geometry, technical condition, age, use and energy behaviour) is essential when considering a broad range of public and private activities, ranging from renovations and structural-safety assessments to energy-demand and solar potential estimates, demolition-waste and mining planning, disaster response [1,2] and through spatial planning. The study of building stock has been transformed in recent years with the emergence of urban digital twins (UDTs), dynamic, continuously updated virtual representations of cities that mirror the physical stock in order to monitor, simulate and optimise urban processes [3]. Because buildings are the dominant objects in such twins, UDTs require building models that are geometrically accurate, semantically rich, available at multiple levels of detail (LoD) and, critically, are continuously updated across their entire range rather than for isolated showcase areas. A distinction is needed at the outset: a digital twin presupposes a living link between the model and the physical asset (sensing, updating, simulation), whereas the static geometric and semantic building layer on which such a twin rests is a city information model (CIM). This paper addresses the latter; it produces and enriches the building layer and does not claim an operational twin. Roof geometry is an indispensable part of that layer. Rooftop solar potential, the volume and material mass of the stock, snow and wind loads, renovation and heritage inventories and the visual credibility of any urban model all depend on the form, area, tilt and orientation of the roof rather than on the footprint alone, and a block model (LoD1) cannot supply them; this is why the workflow presented here targets roof-resolved (LoD2) models next to the block models.
In practice, three-dimensional (3D) building models are reconstructed from several complementary geospatial sources. Airborne LiDAR point clouds provide dense, accurate geometry and have become the primary source for roof and building reconstructions [4,5]; two-dimensional (2D) topographic and cadastral maps supply reliable ground plans and historical representations [6]; orthophotos and very-high-resolution satellite stereo yield digital surface models and, increasingly, direct LoD2 roofs [7,8,9]; and radar techniques, such as SAR tomography, recover 3D structures where optical data are unsuitable [10]. Target details are processed through the CityGML LoD framework, from block models (LoD1) to roof-resolved models (LoD2) and architecturally detailed models (LoD3) [11,12], in which the appropriate LoD is determined jointly by the application and the available source data [13].
Historically, such models were produced almost exclusively within GIS and BIM software environments, such as ArcGIS, CityEngine, Bentley or Revit, in semi-manual, project-by-project workflows constrained by software licences, hardware capacity and user skill, and therefore limited to comparatively small areas. Fully automatic reconstruction methods are now deployed as standalone applications that run without interactive GIS/BIM desktops and generate 3D models for entire cities or countries in a single, reproducible pass. The 3DBAG service is the textbook case of this shift. It reconstructs consistent LoD1.2/LoD1.3/LoD2.2 models for the more than 10 million buildings of the Netherlands from airborne LiDAR and footprints, with each building monitored for quality [5], its countrywide workflow from generation through storage and updating to dissemination is documented by Dukai et al. [14], and its open-source engine, roofer, is available as a command-line application and a Python/C++ library outputting CityJSON [15]. This transition toward the automated reconstruction of millions of objects without GIS/BIM software is the operational context which the present work explores.
A second factor responsible for this shift is the proliferation of databases in which buildings are recorded as individual physical objects together with rich non-graphic attributes. Volunteered geographic information, accessible through OpenStreetMap and its Overpass query interface, provides continuously updated footprints and semantic tags that can enhance official building data [16], while national registers provide the authoritative grounding: the Dutch Basisregistratie Adressen en Gebouwen (BAG) underpinning 3DBAG [5] and, for Slovakia, the real estate cadastre (REC) and the general database for the geographic information system (ZBGIS) maintained by the Geodesy, Cartography and Cadastre Authority of the Slovak Republic, both combined with LiDAR bases [17]. At the European scale, EUBUCCO v0.2 harmonises 50 open government datasets and OpenStreetMap into one database of more than 200 million buildings with type, height, number of floors and construction year [18]; globally, the GlobalBuildingAtlas provides 2.75 billion building polygons and 2.68 billion LoD1 models with estimated heights (RMSE 1.5–8.9 m by continent) [19], and national mapping agencies publish ready-made 3D datasets, such as swissBUILDINGS3D with LoD2 roof geometries [20]. Studies that integrate such sources have so far combined one or two of them at a time: volunteered tags with official building data to improve dwelling and population mappings [16], multi-source data with architectural knowledge for high-density districts [6], BIM and GIS layers for holistic stock assessment [2], or 50 national datasets harmonised into one European table [18]. The value of these sources for building-stock monitoring lies in their combination rather than in any individual source. Fused across cadastral, volunteered, national-3D, European and global datasets, the attribute space of each building expands far beyond what any single register holds, and the combined record constitutes the benchmark dataset against which reconstructions can be generated and evaluated.
Of equal importance is the class of segmentation and reconstruction methods that process point clouds directly, outside the GIS and BIM paradigm. Deep neural networks derived from PointNet++, RandLA-Net and hierarchical architectures perform point-wise semantic and instance segmentation of buildings, roofs and façades at large scale [21,22,23,24,25], and learned reconstructors based on deep implicit fields and polyhedron-based graph neural networks assemble the segmented points into compact building models [26,27]. Geometric methods serve the same purpose without training data. Roofer detects roof planes by region growing and assembles them through graph-cut optimisation [5], Romanengo et al. fit primitives to city-scale point clouds by normal-seeded RANSAC with Hough-space merging [28], and Dehbi et al. reconstruct complex roofs robustly and quickly by active sampling and evaluation of roof hypotheses [29]. Within the Slovak context, research to date has applied GIS-based processes to roof and building extraction. In the two studies that formed the impetus for the present work, a solar-potential and photovoltaic-suitability assessment of roofs in Komárno [17] and the identification of roof surfaces from LiDAR in Lučenec [30], roof planes were segmented from classified LiDAR by raster slope, aspect and hillshade analyses, α-shape boundary extraction and watershed ridge modelling within ArcGIS, and 3D models were produced by extrusion in ArcGIS Pro and CityEngine. These studies confirmed the value of the nationwide Slovak LiDAR and cadastral/ZBGIS data for roof analysis, but they remained semi-automatic, single-city and limited to 2D outlines and visual 3D models rather than watertight, multi-LoD solids.
Two gaps follow from this review. Internationally, countrywide automated LoD2 reconstruction exists where a national LiDAR campaign, a building register and a dedicated processing infrastructure have been coupled by a mapping agency (3DBAG, swissBUILDINGS3D), and multi-source attribute integration has been demonstrated for one or two sources at a time; no open workflow has yet combined per-building attribute fusion across national, European, global and volunteered sources, with the provenance of every value, with LiDAR roof reconstruction on a standard computer. In Slovakia, the gap is one of implementation: no automated, GIS-independent reconstruction of the building stock exists, the two published roof studies [17,30] are GIS-based, single-city and not watertight, and the national INSPIRE Buildings layer, the 2021 Census, the INFOREG certificate register and the European and global datasets have never been queried together for one building. In response, this paper presents BSTwin, a computational workflow, which offers the automatic generation of building models from LiDAR point clouds without the need for GIS/BIM software, coupled with a benchmark dataset that integrates national LiDAR with multi-source building attributes (cadastre/ZBGIS, INSPIRE, OpenStreetMap, EUBUCCO v0.2 [18,31], the GlobalBuildingAtlas [19] and further sources listed in Section 2) and generates consistent LoD0/LoD1.2/LoD1.3/LoD2 models with per-building quality control. The original contribution is stated explicitly by distinguishing (i) components reused from the literature and existing software, (ii) components adapted from them and (iii) components developed in this work (Table 1). The reconstruction engine is not roofer: it is a pure Python (3.10.12) implementation that combines the ground-estimation and LoD conventions of 3DBAG [5], the normal-seeded RANSAC with Hough-space merging of Romanengo et al. [28], the architectural regularity idea of mSTEP [6] and the footprint decomposition of Kwak and Habib [4] with an original quality-control block, a rule-based classifier and the 13-source benchmark. Roofer is supported only as an optional external engine in the batch tool. The term GeoAI is used in its knowledge-driven sense, that is, automated geospatial reasoning through model fitting, rule-based classification, and multi-source data fusion. No machine-learned model is trained or applied, and the term is therefore confined to this meaning throughout the paper. The empirical scope is the Košice Self-governing Region for the attribute benchmark and the historic centre of Košice for the LiDAR validation. The software accepts any building in Slovakia, but nationwide performance is not claimed.
Table 1.
Existing components, their adaptation and the original contribution of BSTwin.
The research problem is therefore to establish whether open geodata and the national LiDAR can be turned into a per-building CIM layer whose attributes and geometry are complete, consistent and verifiable enough for building-stock monitoring, on an ordinary computer and without GIS/BIM software. Three research questions follow. RQ1: Can building-stock attributes from national, European, global and volunteered open sources be fused into one per-building record with provenance and quality metering, and how complete and mutually consistent is that record for a Slovak city? RQ2: Can roof-resolved multi-LoD models be reconstructed from the national LiDAR by a deterministic, dependency-free engine, and with what accuracy, speed and failure rate on real buildings? RQ3: What are the measurable limits of the workflow (parameter sensitivity and failure modes) and how are they signalled to the user? The objectives are (i) to assemble and document the 13-source benchmark and its mining and caching layer, (ii) to implement and formalise the reconstruction engine, (iii) to verify both on synthetic ground truth and on real buildings, and (iv) to quantify the limits. The evaluation criteria are attribute completeness and cross-source agreement for the benchmark, classification accuracy, tilt, area and height errors against synthetic truth and against the INSPIRE register for the engine, runtime per building, and the share of buildings flagged by the quality-control block. The scope is the Košice Self-governing Region (benchmark) and the historic centre of Košice (LiDAR validation, 1468 buildings). The automatic, process-based approach is also benchmarked against the GIS-based methods previously tested in Slovakia [17,30] in order to quantify the gains in automation, scalability and geometric completeness. Section 2 describes the data, the integration and mining layer, the architecture, the engine with all of its parameters, a worked example and the verification design; Section 3 reports the results; Section 4 discusses limitations, sensitivity and the position of the work with respect to existing systems; Section 5 concludes.
2. Materials and Methods
This section sets out the data and the computational framework underlying the benchmarks applied to the BSTwin application, starting from the input datasets and their provenance, followed by the integration procedure through which various heterogeneous records are consolidated into a single entry per building. Because several of these datasets exceed the capacity of a conventional workstation, the preprocessing and indexing strategies adopted to render them applicable within a local computing environment are then described in operational detail. The section continues with an account of the architecture of the application, the roof-reconstruction engine that constitutes its computational core together with all of its parameters, a worked example of the model generation process for one real building, and it concludes with the design of the verification experiments. Readers who do not need the technical detail can follow the plain-language opening paragraphs of Section 2.2, Section 2.3, Section 2.4 and Section 2.5 and the worked example in Section 2.6.
2.1. Collection of Data Sources
The process draws its benchmark from open databases that record each building as an individual object. The strongest single addition to the registers cited above is Slovakia’s Infrastructure for Spatial Information in the European Community (INSPIRE) Buildings theme, an official, European Union (EU) -mandated harmonised layer, which carries all four key non-graphic attributes per building (current use, height, number of floors and construction year) and is published as a high-value dataset by the Geodesy, Cartography and Cadastre Authority of the Slovak Republic (GCCA SR). Table 2 summarises the additional sources collected for Slovakia and the data which each provides.
Table 2.
Additional data sources collected for Slovakia and the four key attributes each provides (type/use, height, number of floors, construction year).
Two of these sources offer all four attributes at once: INSPIRE High Value Datasets (HVD) Buildings (SK) and, at the European scale, EUBUCCO [18]. EUBUCCO in fact draws on national INSPIRE layers and OpenStreetMap, and the Slovak INSPIRE theme therefore builds on these. For a Slovakia-specific benchmark, INSPIRE, together with the 2021 Census and the INFOREG energy-certificate register, provides authoritative types, number of floors and construction years (the Census gives construction-period classes for the entire building stock, while INFOREG adds exact values for the certified subset). Overture Maps and the height rasters (GHSL GHS-BUILT-H and the Copernicus Urban Atlas, complemented by the GlobalBuildingAtlas [19]) contribute height at per-building or grid levels. OpenStreetMap itself, accessible through Overpass, rarely provides all four attributes in the tags building, building:levels, height and start_date, and should therefore be used as a complementary source rather than as a primary source [16].
The benchmark, therefore, layers different sources ranging from authoritative to global: cadastre/ZBGIS geometry and use, INSPIRE harmonised attributes, Census and INFOREG construction periods, floors and types, OpenStreetMap and Overture crowd attributes, and EUBUCCO v0.2, GlobalBuildingAtlas and GHSL at the European to global level. The combination of their non-graphic fields expands the information set of each building far beyond what any single register records. The principal access points used in this study are the Overture Buildings schema, the INSPIRE HVD Buildings theme on the Slovak national geoportal, the 2021 Census portal, the INFOREG central register of energy certificates as listed on data.gov.sk, and the GHSL GHS-BUILT-H product of JRC/Copernicus.
2.2. Construction of the Benchmark Dataset
In plain terms, the benchmark is a table with one row per building in which every column is a source and every cell keeps its origin. The application uses the sources discussed in Section 2.1 as a benchmark dataset that is assembled live, per building, from 13 switchable sources (Figure 1). Three access patterns are combined. Firstly, sources with public interfaces (OpenStreetMap Overpass, Nominatim, the GlobalBuildingAtlas WFS and the OpenTopoData terrain service) are accessible directly by the browser client.
Figure 1.
Composition of the benchmark dataset: 13 sources grouped by origin, the attributes each provides for Slovakia, and the fused per-building record.
Secondly, sources that require the use of large files, reformulations of coordinates or problematic request patterns are handled by a small local server, which maintains disk caches. The INSPIRE HVD Buildings (SK) GeoPackage (3.64 million footprints) is read locally; Slovakia’s Overture buildings are extracted into 12 GeoParquet tiles; EUBUCCO v0.2 is separated into compact local GeoParquet files for each region (the region covering Košice Self-governing Region is bundled with the application, while those of the other regions are processed in the background upon initialisation), one GHSL Mollweide tile covering all of Slovakia is bundled and decoded with a pure-Python (3.10.12)*.GeoTIFF reader verified with pixel-exact accuracy against rasterio; Census reports are downloaded in bulk and integrated into municipality polygons, which are transformed from the national S-JTSK system (the Slovak national coordinate system) to WGS84 (the global latitude/longitude coordinate system used by GPS); and the INFOREG register, which has no open API, can be accessed at an acceptable speed (at most three result pages per query, 0.8 s between requests) with a seven-day cache. Third, two of the sources are processed in the application itself: LoD2 reconstructions of selected roofs (Section 2.5) and indicative stock estimates of dwellings, population and material mass, following the dwelling-based method of Kunze and Hecht [16] and published material intensity tables [2].
The combinations are made deliberately transparent rather than opaque. The record of a selected building is an integrated matrix of all attributes from every active source. Rows show attributes, columns show sources, duplicate values are highlighted so that discrepancies are visible at a glance, and every value retains its provenance. A completeness meter summarises how many of the attributes are given by the sources for the given building. Building height, the attribute with the most comprehensive coverage, can be derived from up to five independent sources at once and is cross-validated in a dedicated card of the 3D model module. The entire record can be downloaded as *. GeoJSON, *.CSV or *. JSON. The 11 external sources are open data (licences range from the EU high-value-dataset regime and CC-BY 4.0 to ODbL and CC0) and the two derived layers are built around open licensing, so the integrated benchmark is fully open; Table 3 lists the sources, their contributions and how the application accesses them.
Table 3.
The 13 benchmark sources and their integration in the application.
Records are matched across sources by geometry rather than by identifiers, because no common building identifier exists between the Slovak registers and the European, global and volunteered datasets (Table 4). The selected building is defined by its INSPIRE outline. Its centroid is the query point for every polygon source (the EUBUCCO, Overture and OSM building that contains the point is taken, after a bounding-box pre-filter); the enclosing 100 m cell is read from the GHSL rasters and the enclosing 10 m cell from the Urban Atlas layer; and the enclosing municipality polygon selects the Census profile, and INFOREG certificates are matched by street name within the municipality because the register exposes addresses only. Conflicting attributes are never merged into a single value. The record keeps every source’s value side by side with its provenance and the reference epoch of the source, highlights disagreements between sources, and quantifies them for building height in the cross-validation card. The recommended priority for downstream use is authoritative before European before global before volunteered, but the choice is left to the user or the consuming script because the appropriate priority depends on the task (a renovation inventory trusts the newest register, an energy study may prefer the source with a certified height). Temporal inconsistency is handled in the same transparent way: each value carries the epoch of its source (INSPIRE 2024, EUBUCCO v0.2 snapshot of 2023 built on the 2022 registers, Census reference date 1 January 2021, GHSL epochs 2018 and 2025, Urban Atlas 2012, the Overture release of June 2026 and live OSM), the LiDAR epoch of the first national campaign (2017 to 2022) is reported with every reconstruction, and the cross-validation treats the register with the newest epoch as the reference so that a disagreement can be read as change over time rather than as error.
Table 4.
How each source is matched to the selected building and the reference epoch carried with its values.
2.3. Mining Engineering for Larger Sources
The 13 sources differ by orders of magnitude in volume, ranging from the kilobyte level in *.JSON responses to country-scale GeoParquet and raster archives. Additionally, several of the sources were never intended for per-building random access. The application therefore follows one consistent mining pattern: it downloads or derives a Slovakia-sized extract once, stores it next to the server with a completion marker, and answers all subsequent queries locally. In cases where builds require several minutes to be processed, it runs in a background thread while the server continues to respond from a fallback path, and the user is shown the progress. Demanding columnar queries use DuckDB, which the server installs automatically on first use, so the base installation stays standard-library only. These choices allow country-scale sources to be usable from a two-file local application. The largest bundled item is the national INSPIRE HVD Buildings (SK) layer, a 3.7 GB GeoPackage with 3,635,930 building footprints; this resource is prepared when accessed for the first time. Table 5 makes the pattern operational. For every local store, it lists the folder next to the server, the trigger of the one-time build, the completion marker, the integrity checks and the update policy. Every build writes to a temporary part file and is renamed atomically only when complete, so a half-written extract never looks complete. Each start-up removes leftover part files and zero-length files. The GHSL tiles are accepted only above a minimum size. The Overture clip records the release string in its marker, and the /stats endpoint audits the row counts and the height provenance of every extract after a build and caches the audit for the dashboard.
Table 5.
Local data store of the application: folder, build trigger, completion marker, integrity checks and update policy.
The dependencies are equally explicit (Table 6). The base installation requires only a Python interpreter (3.8 or newer; the application has been run with 3.10, 3.13 and 3.14) and a modern web browser; the server, the roof engine and the GeoTIFF reader use the standard library exclusively, and no compiled geospatial library (GDAL, PROJ, NumPy, SciPy) is needed. DuckDB (version 1.5.5 at the time of writing, with its spatial and httpfs extensions) is the only automatically installed dependency; it is installed into the user site-packages by pip on the first request that needs it (Overture, EUBUCCO or the one-time transformation of the census polygons), while the application keeps answering from the fallback paths. Optional packages serve the batch tool only (laspy with the lazrs backend for reading LAZ tiles, pyproj for transforming footprints into the LiDAR projection) and the verification (rasterio, used once to confirm the pure-Python GeoTIFF reader; the 3DBAG roofer executable for LoD2.2 comparison). This separation determines the transferability of the system. The engine, the caching pattern, the DuckDB paths and the global sources (Overture, EUBUCCO, GHSL, OpenStreetMap, GlobalBuildingAtlas) are country independent and need only a new bounding box and the NUTS-2 codes of the target regions. The Slovakia-specific parts are the INSPIRE GeoPackage reader, the census bulk-report parser with its S-JTSK polygons, the INFOREG reader and the national LiDAR projection (EPSG:8353), which another country would replace with its own register, census and cadastral projection. Moving the application to another computer requires copying the two program files and, optionally, the already built stores in Table 5; nothing is written outside the application folder.
Table 6.
Software dependencies of BSTwin and how each is obtained.
Overture Maps distributes its buildings theme as GeoParquet on S3, but the release used here is not spatially partitioned. A simple bounding-box query reads the footers of roughly five hundred remote files, a process that takes 30–90 s per building when accessed from Slovakia. The server responds to this in two stages. As a fallback, it runs the S3 query on a persistent parallel connection (16 threads, HTTP metadata caching), ensuring that the slower initial footer scan is performed only once per server session. As the primary path, it extracts all Slovak buildings at once into 12 local GeoParquet tiles (bounding box 16.83–22.57° E, 47.73–49.62° N) with per-feature bounding-box columns, after which every query can be accessed immediately. A dispatcher serves the local clip when it exists and the S3 path while the clip is still building. A single folder is deleted when the application is refreshed after a new Overture release.
EUBUCCO v0.2 is published per NUTS-2 region as GeoParquet with a native bounding-box column, which allows row-group pruning during remote reads. The server builds a compact local clip per region when accessed for the first time; the region covering the Košice Self-governing Region (NUTS-2 region SK04, eastern Slovakia, of which the Košice Self-governing Region is the NUTS-3 unit SK042) is preset, while the remaining Slovak regions, about 1.9 GB of Parquet source files, are processed in the background instead of being bundled with the core application. The clips preserve EUBUCCO’s per-value provenance fields, including the geometry source and the raw type, so the benchmark not only reports a value but also states where EUBUCCO v0.2 obtained it; 82–86% of Slovak heights turn out to be of state origin.
The GHSL layers are bundled as a single raster tile. The products are distributed on the Mollweide grid (ESRI:54009) at a 100 m cell size, meaning each raster cell represents a 100 m by 100 m patch of ground; a single tile of this grid, which spans 1000 km, covers the whole of Slovakia, whereas the alternative WGS84 3-arc-second tiling would require four tiles; by bundling the data, only one download is required. The tile is decoded by a dependency-free GeoTIFF reader written for this purpose (tiled layout, LZW and deflate compression, Mollweide sphere radius 6,378,137 m), and the reader was verified as pixel exact against the rasterio reference implementation.
For the 2021 Census, the official statistical API was examined first. All 668 exposed data cubes were enumerated, but none of the required house and dwelling cubes was available. The endpoint therefore uses the bulk CSV reports of the census portal (the house and dwelling report series) together with the published municipality polygons, which are downloaded in the national S-JTSK coordinate system (EPSG:5514) before being converted to WGS84 (the global GPS coordinate system). A selected building is assigned to its municipality by point-in-polygon lookup of the 12-character municipality code, and all reports are connected to that code.
The INFOREG register of energy certificates has no open dataset or API; the national open-data catalogue lists only links to search pages under a CC0 licence. Full access to the register, approximately 330,000 certificates or about 6600 consecutive requests against a fragile form-based search, was rejected as being unsuitable and unstable. Instead, the server reads a maximum of three result pages for two recent years for the municipality of the selected building, waits 0.8 s between requests, caches the result for seven days and matches the building’s street against the certificate addresses. The pattern generalises across sources: each one is accessed at the smallest acceptable granularity that still answers the per-building question.
2.4. Architecture and Processing Pipeline
BSTwin application is an intentionally small and portable process (Figure 2). The client is the user interface, a single bilingual (Slovak and English) HTML page that runs in any modern web browser, organised into eight modules: an overview dashboard with live probes of every source, the reconstruction pipeline, an interactive 3D model viewer with selectable LoD and layers, a benchmark dataset module, a technical-potential module (outside the scope of this paper), the ASPECT module for per-segment roof orientation, an all-in-one view that combines the full record for one building, and a documentation module with tested access points and code snippets for every source. The server is a single Python file that runs on the standard library alone (DuckDB is installed automatically only when Overture or EUBUCCO v0.2 queries are first requested) and exposes 13 endpoints. Everything runs locally, and once the one-time cache has been built, the core workflow can also be operated without internet access, with the live sources reported as unavailable.
Figure 2.
Architecture of the BSTwin application: a single-file browser client with eight modules, a standard-library Python server with 13 endpoints, bundled local data and external open services.
The processing workflow (Figure 3) starts with building selection. A click on the map sets the footprint and attributes INSPIRE HVD Buildings (SK)-first, with an automatic OSM fallback when the local layer is unavailable, and the chosen source is always reported. The footprint is converted to a local metric east–north frame centred on its centroid, which retains all geometry in metres without a projection library. The /roof endpoint then obtains a point cloud in a strict priority of three branches, whose activation conditions, output fields and consequences for the reliability of the metrics are formalised in Table 7: (a) real measured roofs precomputed from classified national airborne LiDAR point clouds (laser scanning data provided by the GCCA SR, typically 5–30 points/m2) using an accompanying batch tool, which can run either the built-in engine or the open-source roofer reconstructor of 3DBAG [5,15]; (b) if no measurement exists for the selected building, a synthetic demonstration cloud generated from the footprint and template parameters and pushed through the same engine, always explicitly labelled as synthetic to ensure that the demonstration output cannot be mistaken for measurement; or (c) alternatively, a pure template mode that skips the engine entirely. Since the revision, every response classifies its own output type (measured, synthetic or template) in the quality report and carries an automatic warning whenever the model is not derived from measured data; the client renders the warning as a badge next to the roof statistics, so the distinction is visible in the interface and in every export. Using the reconstructed segments and heights, the application generates models at LoD0, LoD1.2 with p50/p70 reference heights, LoD1.3 with height parts, and LoD2 with roof-resolved faces (Figure 4), following the LoD specification of [11,12] and the 3DBAG production recipe [5]. Finally, the obtained geometries and records are exported in formats grouped by type: 3D GIS vector formats (Shapefile PolygonZ, MultiPatch), 3D mesh and model formats (*.OBJ, *.PLY, *.STL, *.glTF/*.GLB), a CAD drawing-exchange format (*.DXF), and geospatial or tabular attribute formats (*.GeoJSON, *.CSV, *.JSON). A per-building quality report accompanies the model. A ring-buffer JSON-Lines log captures every request and client event for usage and error analysis.
Figure 3.
The processing workflow from inputs to outputs.
Table 7.
Decision logic of the /roof endpoint: the three operational branches, their activation conditions, the fields that identify the branch in the response and the consequences for the reliability of the derived metrics.
Figure 4.
Levels of detail generated for each selected building.
Figure 3 traces the processing workflow from inputs to outputs, showing that the geometric output is a family of models with increasing levels of detail.
Figure 4 shows the four levels the workflow produces for every selected building, from the flat footprint (LoD0) through the block and height-part models (LoD1.2 and LoD1.3) to the roof-resolved LoD2 solid.
2.5. Roof Reconstruction Process
In simple terms, the process operates using the cloud of measurement points generated over a building by airborne laser scanning. It first extracts only the points above the selected footprint, then asks how high the ground is around the house by looking at the ring of points outside the outline, adopting low but not extreme values in order to ensure that a single bird or ditch does not corrupt the level. Everything above that level and inside the outline is deemed a roof candidate. The engine then hunts for tilted planar sheets hidden in the points, retains the sheets with the greatest degree of support, merges fragments that share tilt, direction and offset, measures and aligns what remains, names the shape, and attaches a report stating how well the points actually fit. The technical stages implement this idea as follows.
The reconstruction process runs a single deterministic pass and applies a combination of methods selected from a review of recent roof-reconstruction literature in pure standard-library Python [4,5,6,21,22,23,24,25,26,27,28,29]. Its stages are presented in Figure 5. Every numerical threshold mentioned below is a named module-level constant of the engine, and all of them are collected with their values and rationale in Table 8:
Figure 5.
The roof reconstruction engine: footprint-guided cropping, ring-based ground estimation, per-point normals, normal-seeded RANSAC, Hough-space merging, azimuth rectification, rule-based classification and the attached quality report.
Table 8.
Parameters of the roof-reconstruction engine (v6.1) with their values, rationale and sensitivity (Section 3.3).
- Crop. Points are kept within the footprint bounding box expanded by 3 m; the footprint polygon guides all later stages.
- Ground estimation. Ground level is the 5th percentile of point heights in the ring outside the footprint, following the 3DBAG procedure [5]; a fallback global percentile and a verification check against the 98th percentile guard against rings, which might be distorted by neighbouring roofs. All heights are relative to the surrounding ground.
- Roof candidates. Points inside the footprint above an adaptive limit are retained and, to ensure determinism and speed, subsampled to an upper limit of 9000 points; at the national LiDAR densities of 5 to 30 points per square meter this cap is reached only by unusually large roofs (for example a 600 m2 roof sampled at 15 points per square metre); this sets the per-building runtime and maintains the RANSAC pass deterministic without discarding the plane structure of ordinary buildings. Because the dominant stages, per-point normal estimation and RANSAC inlier scoring, all scale in a roughly linear manner with the number of points, this fixed ceiling limits the algorithm’s time complexity to a predictable per-building cost. The limit of 9000 points already constitutes an over-sampling of the roof planes at these densities, with the subsampling leaving the plane fits and the point-to-plane RMSE unchanged; as a result, the acceleration of the process has no negative impact on the reconstruction quality.
- Adaptive tolerance. The plane distance tolerance scales with point density at the ratio tol = 0.5/√density, clamped to 0.08–0.25 m; the tolerance is stricter in the case of dense clouds and more lenient in sparse clouds.
- Per-point normal (PCA). A grid-hash neighbourhood (0.9 m cells, k = 10) with a PCA plane fit assigns each point a normal.
- Normal-seeded RANSAC. In an approach that mirrors that of Romanengo et al. [28], plane hypotheses are seeded by a point and its normal instead of random triples; a point is an inlier only if its plane distance is within the tolerance and its normal agrees within 25°; inlier sets are refit by PCA; up to 12 planes with a minimum support of max (18 points, 4%) are extracted.
- Hough parameter-space merge. Extracted planes are binned by azimuth (6°), tilt (6°) and offset (0.20 m); neighbouring bins are merged and refit in combination, ensuring that one physical roof face ends up as exactly one plane [28]. This step removes the over-segmentation that is typical of standard RANSAC methods.
- Connectivity cleaning. Two-dimensional grid components are computed per plane; floating noise clusters are eliminated, and any aberrations are reassigned.
- Segment metrics and azimuth rectification. Tilt and azimuth follow from the plane normal; azimuths are fixed within ±7° of the dominant footprint edge directions, adopting the mSTEP idea of architectural regularity [6]; the plan area of a face is the smaller of two estimators that are both corrected for the sampling bias revealed by the density sweep of Section 3.3, the convex hull of the face points enlarged by half a point spacing and the occupancy grid divided by the expected occupied share 1 − exp(−density × cell2), and the sloped area equals the plan area divided by cos(tilt).
- Building metrics. Eaves and ridge heights can be used to determine wall and roof heights; LoD1.2 reference heights are the p50 and p70 percentiles, and LoD1.3 parts merge segments that are closer than 3 m in height, both adopted from 3DBAG [5].
- Footprint decomposition. A recursive minimum-bounding-rectangle split with an area-ratio gate, according to the method described by Kwak and Habib [4], is used to handle structures with complex outlines; this approach boosts the confidence score and the template engine.
- Classification. A rule set on plane count, tilts and opposing-azimuth pairs labels the roof as flat, shed, gabled, hipped, pyramidal or complex (Figure 6); a four-plane roof is pyramidal only when the footprint is close to square (minimum bounding rectangle aspect ratio below 1.2), otherwise hipped. No machine-learning model is required at the point densities of the national airborne laser scanning (ALS) data.Figure 6. Roof archetypes distinguished by the rule-based classification.
- Quality control. Every response bears a degree of completeness (share of roof points explained by planes), point-to-plane RMSE, density, point spacing, the share of the footprint explained by roof planes (footprint coverage), the ground-estimation method that was applied, a validity code (OK, LOW_COVERAGE, HIGH_RMSE, FEW_POINTS, FOOTPRINT_MISMATCH), the output type with its warning (Table 7) and a bounded confidence between 0.25 and 0.97.
The final stage of the process in Figure 5 assigns each reconstructed roof to one of six archetypes. Figure 6 shows these archetypes and the plane arrangement that distinguishes them, from a single flat or tilted plane, through gabled, hipped and pyramidal forms, to complex roofs bearing superstructures.
The engine also powers a dual-engine comparison in the user interface: every roof-related module can switch between the template roof derived from attributes and the LiDAR-measured roof, and a comparison table reports shape, segment count, roof area, tilt, azimuth and their differences per building. The measured branch is used only when a reconstruction is available; otherwise, the application reverts to a transparent template. Three refinements were made to the engine during the revision of this paper and are included in release v6.1: the plan-area estimator is corrected for sampling bias, the pyramidal rule uses the footprint aspect ratio, and the quality report gained the footprint-coverage, ground-method and output-type fields. The plane detection itself and all parameters of Table 8 are unchanged.
2.6. Demonstration of the Model Generation Process for One Building
To make the combination of sources concrete, the workflow is followed here step by step for one real building, a detached residential house in the northern part of the historic centre of Košice (INSPIRE feature id Building.2109723, localId C33DEF11-9C56-428F-831B-DC7575BB189B, centroid 48.7271° N, 21.2604° E; the building is identified by the id and localId attributes of the INSPIRE delivery, which are independent of the feature number of the layer). Step 1, selection: a click on the map returns the INSPIRE outline (181 m2, roof-edge geometry reference, current use individualResidence, height above ground 6.9 m) and converts it to the local metric frame. Step 2, benchmark record: the centroid is sent to the 13 sources and the fused record of Table 9 is returned within a few seconds; EUBUCCO v0.2 confirms the height (6.9 m, governmental origin) and adds a residential type and an estimated 2.8 floors, Overture holds a matching footprint without attributes, the GHSL cell gives an average net building height of 13.6 m for the surrounding 100 m cell, the Urban Atlas block raster gives 3 m, the Census profile of the municipality the Staré Mesto district of Košice reports 1218 houses, of which 29.4% date from before 1919, 65.2% have brick bearing walls and 69.1% have a renovated roof, and the INFOREG register lists 1087 energy certificates for the city of Košice for 2024 and 2025 with no certificate on the street of the selected building among the pages read. Step 3, roof reconstruction: the batch tool has precomputed a measured roof from the GCCA SR point cloud (2807 roof points, 15.5 points/m2), so the measured branch of Table 7 is active; the engine returns a hipped roof with 4 planes (tilts 23°/23°/27°/1°, azimuths 335°/155°/245°/322°, sloped areas 81/73/46/13 m2), an eave height of 3.15 m, a ridge height of 6.91 m, a completeness of 0.96, a point-to-plane RMSE of 0.046 m, a footprint coverage of 1.00, validity OK and a confidence of 0.95 (Figure 7). Step 4, multi-LoD models: LoD0 is the outline, LoD1.2 uses the p50 and p70 reference heights (5.59 and 6.14 m), LoD1.3 has one height part (h70 6.52 m over 195 m2), and LoD2 carries the four roof faces. Step 5, cross-validation and export: the height card lists INSPIRE 6.9 m, EUBUCCO 6.9 m and the LiDAR ridge 6.91 m as agreeing per-building sources and marks the GHSL and Urban Atlas values as cell averages that are not comparable per building; the record and the models are exported in the formats of Section 2.4 together with the quality report.
Figure 7.
Model generation for one real building in the historic centre of Košice: (a) the GCCA SR LiDAR points inside the crop, coloured by their height above ground, with the INSPIRE outline in red; (b) the four reconstructed roof planes, drawn as a partition of the complete INSPIRE outline, with an arrow giving the downslope direction of each plane (no arrow is drawn for the near-horizontal face 4); (c) the sloped area of each face on the left axis, its tilt on the right axis and its azimuth below the axis, together with the quality report of the model. In (a,b) the horizontal and the vertical axis are metres east and north of the outline centroid in the local metric frame of the engine.
Table 9.
Fused benchmark record of the demonstration building as returned by the application (values with their source and epoch).
2.7. Verification Design
The engine is verified at three levels, each answering a different question. Synthetic ground truth answers whether the engine recovers known geometry. A purpose-built generator produces point clouds for the five basic archetypes on a 12 × 8 m footprint (10 × 10 m for the pyramidal roof) at 6, 10 and 30 points/m2 with 5 cm Gaussian noise, wall returns, a ground ring and 2% outliers, so that tilt, azimuth, area, eave and ridge are known by construction. Controlled failure-mode experiments answer where the engine breaks. One nuisance factor at a time is added to the gabled reference roof at 10 points/m2 (footprint offset, dormers at several densities, neighbouring roofs in the ground ring, sloped terrain, canopy over the roof, parallel planes at decreasing height difference, roof overhang, near-flat tilts and outliers), each in five random realisations, and the quality metrics are recorded until a threshold is crossed. Parameter sensitivity is examined by re-running the synthetic set and 150 real buildings with each parameter of Table 8 moved to a lower and a higher value. Finally, real data answer what the engine does on the national LiDAR. The classified point cloud of the first GCCA SR laser-scanning cycle (2017 to 2022) was exported for the historic centre of Košice from the application ZBGIS MAPKA in windows of about 0.65 km2 (LAS 1.4, S-JTSK (JTSK03) Krovák East-North (EPSG:8353), only ground and non-ground classes are distinguished in the export, 16 points/m2 on average over the roofs). The INSPIRE outlines were transformed into the same projection with pyproj; their alignment with the cloud was confirmed by a cross-correlation of the elevated-point mask with the footprint mask (best offset 0.0 m in both axes); and the batch tool ran the engine on every outline lying fully inside a window (1468 buildings, 46.1 ha of footprint). Because no independent roof survey exists for the area, the LiDAR ridge heights are compared with the INSPIRE height above ground, an attribute derived by the GCCA SR from the same laser-scanning campaign but by an independent process, and the completeness, RMSE, validity codes and runtime are reported as distributions. The performance benchmark runs the engine on the 3082 real INSPIRE outlines of the wider centre with synthetic clouds at 6, 15 and 30 points/m2 so that runtime can be related to point density with the real footprint geometry, and per-stage timers are attached to an otherwise unchanged copy of the engine. All experiments are deterministic (fixed seeds), and the scripts are provided with the application.
3. Results
This section reports the results of our practical use of the application and its modules (Section 3.1), the coverage and mutual consistency that the sources provide for the study area (Section 3.2), the verification of the roof-reconstruction engine on synthetic ground truth, its performance, its failure thresholds and its parameter sensitivity (Section 3.3), and the application of the whole workflow to the historic centre of Košice on real national LiDAR (Section 3.4).
3.1. The Application
The primary result is a working, freely deployable system. On a standard computer running Python, the application starts from a server file and an HTML file, runs on the localhost, and gives users interactive access to the complete workflow outlined in Section 2.2, Section 2.3, Section 2.4 and Section 2.5 for any building in Slovakia. An overview interface examines every source in real time and shows a module-by-source usage matrix, so users are continually aware of which module depends on which dataset and whether it is currently accessible.
Deployment of the application mirrors the two-file design. Windows launchers identify Python or install a per-user Python without administrator rights if none is found. The application then starts the server in minimised form while the health check is run (installed as a one-time cache extraction when the application is initialised) and opens the browser. The client accesses the server port from its own URL, so separate copies of the application can run side by side. Once the local caches have been created, some functions, such as building selection, the benchmark framework and roof reconstruction work, can be run without internet access, while live sources and basemap tiles are reported as unavailable when offline.
The operability of the application can be observed. The server maintains a single JSON-Lines diagnostic log with a 64 MB ring-buffer cap that trims itself to 48 MB and records the trim with an explicit rotation marker. It records every request and response, including durations and tracebacks, logs server console events and, through a passive browser beacon, every fetch the client performs together with script errors, which allows usage and error analysis to be reproduced after the fact.
3.2. Benchmark Dataset Coverage
The sources provide a remarkable degree of coverage. For the study area of the Košice Self-governing Region, EUBUCCO v0.2 contributes 488,363 buildings, 81.7% of which carry heights of governmental origin (the remainder are model predictions with confidence limits), and every EUBUCCO v0.2 value remains verifiable. Because EUBUCCO is clipped for each NUTS-2 region, the file that covers the region of eastern Slovakia is bundled with the application, while the remaining Slovak regions generate their clips in the background on first use. The Census endpoint returns, for the municipality of any selected building, construction-period distribution, bearing-structure material, roof-renovation share, heating type and energy source; the bulk reports behind it cover the whole country, 2927 municipalities and city boroughs. The endpoint was spot checked on two units of different size and administrative type in Košice Self-governing Region, the city borough of the Staré Mesto district of Košice and the town of Michalovce, and returned complete attribute sets for both. The INFOREG endpoint integrates current energy-certificate pages; for the city of Košice, it returned 1087 certificates listed in the register for 2024 and 2025 with their energy classes and cadastral parcels. The bundled GHSL reader reproduces reference raster values with pixel-exact precision, and the Urban Atlas height layer, whose independent Slovak validation reports a mean deviation of about 2.56 m in its production documentation, provides an independent 10 m height check. When combined, these sources raise the number of independently confirmed attributes per building far above that which any single Slovak register can provide; heights in particular are typically covered by between three and five sources in urban areas.
To quantify this at city scale, the matching rules of Table 4 were applied to all 3082 INSPIRE building outlines of a 3.8 km2 envelope around the historic centre of Košice (Table 10). The INSPIRE layer itself carries a height for 99.8% of the buildings and a current use for 91.1%, but no floor count or construction year in this area. EUBUCCO v0.2 matches 92.5% of the outlines by centroid and supplies a height, floor count and type for all of them (heights of governmental origin for 89.8% of all buildings, estimated for 2.7%), but a construction year for only 1.4%. Overture matches 85.1% of the outlines yet carries a class for 29.4%, a floor count for 18.5%, a roof shape for 2.9% and a height for 0.8%. The GHSL cell value exists for every building. Cross-source agreement of the height reveals the provenance chain: the EUBUCCO heights of governmental origin differ from the INSPIRE heights by a mean absolute error of 0.33 m with 97.1% within 1 m, which confirms that both descend from the same GCCA SR measurement at different release dates, whereas the EUBUCCO model-estimated heights deviate by 3.32 m on average and the 100 m GHSL cell average by 5.27 m, as expected for a cell statistic compared with a single building. Counting INSPIRE, EUBUCCO, Overture and GHSL, 91.5% of the buildings have three independent height values and 0.8% have four; where the LiDAR reconstruction of Section 3.4 is available, the count rises to four or five. The benchmark thus answers RQ1 for a Slovak city: the fused record is complete for use and height and for the European type and floor attributes, the construction year remains the sparsest attribute (Census period classes at municipality level and EUBUCCO for 1.4% of the buildings), and disagreements between sources are small where the sources share provenance and large, but explicable, where a cell average or a model estimate is compared with a measured value.
Table 10.
Completeness of the fused record and cross-source agreement of building height for the 3082 INSPIRE buildings of the Košice city-centre envelope (3.8 km2).
The derived stock estimates translate geometry and census contexts into indicative per-building quantities. Dwelling counts follow the established dwelling-based enrichment process, comparing floor area and number of storeys to typical dwelling sizes [15]. The population metric is derived from dwellings and municipal occupancy, and material mass applies published material-intensity coefficients per square metre of floor area to the reconstructed volumes [2]. All three of these aspects are displayed with a label that explicitly states that they are calibrated against Slovak building archetypes and apply the same verification; users are thus informed that the values are computed rather than reported.
3.3. Roof Process Verification, Performance, Failure Thresholds and Parameter Sensitivity
The verification process uses a purpose-built synthetic generator; a footprint and archetype specification is used to generate a point cloud at a chosen density with 5 cm Gaussian noise, wall returns, and a ground ring. The process applied here is directly equivalent to a measured cloud. Ground truth data (tilts, azimuths, areas and heights) is established by construction, so the recovered values can be scored to a stricter standard. The same process also scales beyond single picks. The batch tool processes an entire classified tile into the measured-roof cache, and the server matches any map picks against it by coordinates, so municipal-scale runs reuse the interactive code path in an unchanged form. Synthetic validation has clear limits, which are acknowledged here and returned to in Section 4. It cannot reproduce the multi-return structure, occlusions, vegetation, chimneys, dormers and outline errors of real data, so it establishes the correctness of the geometry recovered from planar roofs, not the accuracy on the national stock; the latter is addressed with real data in Section 3.4.
The engine was verified on synthetic ground truth generated for the five basic archetypes at 6, 10 and 30 points/m2, with added noise and outliers, in five realisations each (Table 11). All shapes were classified correctly at every density; recovered tilts matched the ground truth to within 0.09° on average (worst case 0.32°), sloped roof areas to within 4.8% at 6 points/m2 and 5.1% at 30 points/m2, eave and ridge heights to within 0.19 m, and the point-to-plane RMSE stayed at about 5 cm, the level of the injected noise. The pass is deterministic (a fixed seed yields an identical output) and robust against empty and noise-only inputs. The runtime claim is supported by the performance benchmark of Table 12, which ran the engine on the 3082 real building outlines of the Košice centre envelope with synthetic clouds at three densities on a single core of the test computer (Intel Core Ultra 9 285H, Ubuntu 22.04 LTS (Linux 6.8, virtual machine, 2 vCPU), Python 3.10.12): at 6 points/m2 the median building took 43.6 ms (mean 79.4 ms, 95th percentile 308.1 ms) and buildings up to 200 m2 took 20.7 ms; at the higher densities of the national campaign, the median rose to 165.1 ms (15 points/m2) and 461.6 ms (30 points/m2), with the largest outlines reaching the 9000-point cap. Per-point normal estimation and RANSAC inlier scoring account for about 85% of the time at every density, which is why the fixed cap keeps the worst case below about 1.5 s. Interactive use and municipal batches therefore remain practical without a GPU, but the figure of about 50 ms quoted for the synthetic verification holds for the sparse test density only; on real clouds at 15 points/m2 the typical value is 0.2 s (Section 3.4). The quality-control block is surfaced directly at the application toggle in every roof-related module, so users can inspect completeness, RMSE, footprint coverage and the validity verdict at the point at which they switch to measured roofs. On real classified tiles, the accuracy is bounded by the input data rather than by the algorithm; Section 3.4 quantifies this. Table 13 summarises the verification set of the released version with the actual outcome of every test.
Table 11.
Accuracy of the engine on synthetic ground truth by archetype and point density (mean of five realisations; 12 × 8 m footprint, 10 × 10 m for the pyramidal roof).
Table 12.
Performance of the engine on the 3082 real INSPIRE outlines of the Košice centre envelope with synthetic clouds (one core of an Intel Core Ultra 9 285H, Ubuntu 22.04 LTS (Linux 6.8, virtual machine, 2 vCPU), Python 3.10.12; time per building includes all stages up to the quality report).
Table 13.
Verification performed for the released version and its outcome.
Each failure mode of the limitations table (Table 14) was then provoked deliberately so that it can be associated with a measurable threshold rather than a qualitative warning (Table 14). A footprint offset lowers the roof area by roughly 5.5% per metre while completeness stays above 0.95, because the part of the outline that no longer covers the roof contains only ground points, which are excluded before completeness is computed. The new footprint-coverage indicator falls linearly instead (0.89 at 2 m, 0.82 at 3 m), and the FOOTPRINT_MISMATCH code is raised below 0.70. A superstructure is detected only when its points reach the minimum plane support, max (18 points, 4% of the roof points). Dormers of 8 m2 were found in every realisation from 8 points/m2 upwards, dormers of 4 m2 in at most 40% of the cases at any density, and smaller ones never; thus, the detectable superstructure area is about 4% of the roof plan area regardless of density. Neighbouring roofs in the ground ring leave the ground within 0.1 m as long as at least 10% of the ring still contains ground returns; a house enclosed on all sides (no ground in the ring) shifts the ground to the neighbour height, and the wall height is underestimated by that amount (2.94 m for neighbours at half the eave height), a case that the percentile guard cannot detect because the neighbour roof lies below the 98th percentile of the cloud. Sloped terrain leaves tilt and completeness intact but adds the ground drop to the ridge height (1.13 m at a 10% gradient over 12 m). Canopy over the roof lowers completeness almost linearly (0.75 at 20% cover, 0.58 at 50%) and area by the covered share; LOW_COVERAGE is raised when more than about 70% of the roof is covered. Two parallel planes are merged into one by the Hough step when their offsets differ by less than 0.4 m (two offset bins) and are kept apart from 0.5 m; the merged case is visible as an increased RMSE (0.08 m instead of 0.05 m). Roof overhang beyond a wall-line footprint reduces the roof area by exactly the overhang share (17.9% at 0.5 m) with no other symptom. In the study area, this failure mode is largely inactive because 99.1% of the INSPIRE outlines are roof-edge outlines (horizontalGeometryReference roofEdge) that already include the overhang. The flat/shed decision flips at the 7° threshold with a transition width of about 0.5°, and the classification is unaffected by random outliers up to 30% of the roof points, which only depress completeness (0.94 at 10%, 0.87 at 30%).
Table 14.
Failure modes provoked in controlled experiments (gabled 12 × 8 m reference roof, 10 points/m2, five realisations): the measured indicator, the threshold at which the quality report reacts, and the residual effect.
The parameter sensitivity (Table 15) answers the question of whether the thresholds of Table 8 are specific to the test data. Each parameter was moved to a lower and a higher value, and the engine was re-run on the synthetic set and on 150 real buildings of the historic centre. The engine proved insensitive to most of them. The crop margin (2 to 5 m), the tolerance clamp, the neighbourhood size and angle gate of the normals, the Hough bin sizes, the azimuth snapping, the LoD1.3 merge distance, the flat threshold and the ground percentile change the real-data completeness by less than 0.01, the RMSE by less than 0.006 m and the height error against INSPIRE by less than 0.1 m, and none of them changes the synthetic classification. The one influential parameter is the minimum plane support. Halving it to 2% raises the mean number of planes from 3.45 to 4.12 and the completeness from 0.84 to 0.86 at the cost of a larger height error (2.06 instead of 1.84 m), whereas doubling it to 8% drops the share of unflagged buildings from 0.96 to 0.89 and the completeness to 0.78. The normal-estimation cell size trades speed for nothing else (172 ms at 0.6 m, 332 ms at 1.5 m, identical accuracy). The default of 4% therefore sits at the balance between over-segmentation and lost superstructures, and the other thresholds can be transferred to a different LiDAR campaign or country without re-tuning. Only the minimum support and the density-adaptive tolerance, which already scales with the point spacing, would deserve a check on clouds outside the 5 to 30 points/m2 range studied here.
Table 15.
Sensitivity of the engine to its parameters (synthetic set: 5 archetypes × 2 densities × 3 realisations; real set: 150 buildings of the historic centre of Košice with INSPIRE heights).
3.4. Application to the Historic Centre of Košice on Real National LiDAR
The workflow was applied to every INSPIRE outline lying fully inside the exported LiDAR windows of the historic centre of Košice (1468 buildings, 46.1 ha of footprint, median outline 206 m2), which is the first application of the engine to real national data and answers RQ2 (Figure 8 and Table 16). The engine returned a model for 1466 of the 1468 buildings (99.9%). The two failures were a building with only vertical returns and a building for which no planar segment reached the minimum support. The point density over the roofs was 15.6 points/m2 on average (5th to 95th percentile 8.8 to 21.0), so that the median building was represented by 3370 roof points and 209 buildings reached the 9000-point cap. The quality report left 96.2% of the models unflagged (valid), flagged 2.8% for insufficient footprint coverage, 0.8% for low completeness and 2 for too few points; completeness averaged 0.83 (median 0.85) and the point-to-plane RMSE was 0.046 m (median 0.042 m), which is the noise level of the campaign, and the footprint coverage averaged 0.94. The archetype distribution of the historic core is dominated by complex (29.8%) and hipped (28.5%) roofs, followed by gabled (15.3%), flat (14.6%) and shed (11.6%) roofs, with an average of 3.21 planes per building; 21.1% of the buildings received five or more planes, which is where the closed courtyard blocks of the city centre are decomposed into several roofs by the outlines. The runtime on real clouds was 270 ms per building on average (median 204 ms, 95th percentile 680 ms, maximum 1.5 s), which is 70 ms for outlines up to 150 m2 and 603 ms for outlines above 400 m2. The whole set took 395 s of single-core time, so the historic centre is reconstructed in less than seven minutes.
Figure 8.
Application of the workflow to the historic centre of Košice (1468 buildings, GCCA SR LiDAR of the first laser-scanning cycle): (a) the reconstructed roof archetype; (b) the validity code of the quality report, in which valid marks a model that the quality report left without a flag and the remaining codes mark insufficient footprint coverage, low completeness and too few points; (c) the LiDAR ridge height above ground. Each part carries below it the legend or the colour scale of the quantity it shows, together with the number of buildings in every class; the colour scale of (c) is clipped at 3 m and at 30 m, and the arrowheads at its two ends mark the buildings outside that range. North is up, and the scale bar is 200 m in all three parts. In (a,b), each building of a class too small to be seen at this scale is ringed in the colour of its class
Table 16.
Results of the workflow on real national LiDAR for the historic centre of Košice (1468 INSPIRE outlines fully inside the exported windows).
The cross-validation against the INSPIRE register (Figure 9) is the strongest quantitative evidence available for real buildings in the absence of a surveyed reference. The LiDAR ridge height agrees with the INSPIRE height above ground with a median difference of +0.48 m and a mean absolute error of 1.25 m (RMSE 2.52 m, 1466 buildings); 64.7% of the buildings agree within 1 m and 85.4% within 2 m. Restricting the comparison to unflagged models improves the agreement to a mean absolute error of 1.18 m and 86.4% within 2 m, which shows that the validity codes isolate the less reliable reconstructions. The positive median reflects the different reference surfaces (the ring percentile ground of the engine against the lowest ground point of the register) and is of the order of the register’s own vertical accuracy. The agreement is uniform across offices, trade and residential buildings (mean absolute errors of 0.80 to 1.03 m) and weaker for industrial buildings (1.99 m) and for outlines without a registered use (2.34 m), where large halls with several roof levels and decomposed courtyard blocks concentrate. A comparison with the EUBUCCO heights of governmental origin gives the same picture (mean absolute error 1.38 m, 84.7% within 2 m). The LoD1.2 p70 reference height, by construction lower than the ridge, sits 1.12 m below the register on average. Counting the LiDAR value, 93.2% of the buildings’ windows now have four independent heights and 0.4% have five. Taken together, the city-centre run answers RQ2 and RQ3 on real data: the engine reconstructs essentially every outline of a dense historic core in a fifth of a second, flags about 3.8% of the results for a measurable reason, and its heights agree with the national register at the metre level for the vast majority of buildings. What it cannot yet provide is a surveyed accuracy figure for the roof planes themselves, which remains the object of the accuracy campaign planned in Section 4.
Figure 9.
Real-data validation in the historic centre of Košice: (a) the LiDAR ridge height above ground against the INSPIRE height above ground, both in metres, with the 1:1 line and the dotted ±2 m band; (b) the distribution of the difference between the two heights, the vertical axis giving the number of buildings; (c) the runtime per building in milliseconds against the number of roof points per building retained after subsampling.
4. Discussion
Compared with the GIS-based workflows previously applied in Slovakia [17,30], the process described here changes the mode of operation rather than just increasing the speed at which data can be processed. The earlier case studies required licensed desktop software, manual staging of rasters and thresholds per city, and produced visual models for only a single municipality at a time. In contrast, the process described here reconstructs a roof in a fifth of a second on real clouds inside a reproducible, scriptable procedure, attaching an explicit quality verdict to every building; the batch tool scales the same code from one building to a tile of thousands, and the definitive record it provides is assembled from 13 sources instead of the two or three used in previous approaches. The cost of this portability is the loss of the interactive cartographic tooling of desktop GIS applications, which the workflow described here compensates for with its own focused modules. Table 17 contrasts the two modes of operation. With respect to the international systems, BSTwin is not a competitor of 3DBAG or roofer but a lightweight complement. 3DBAG reconstructs LoD2.2 with a region-growing and graph-cut engine on dedicated infrastructure for one country [5,14], roofer offers that engine as a compiled library [15], and Dehbi et al. reach high robustness on complex roofs through active sampling of roof hypotheses [29]. BSTwin trades some of that fidelity for a dependency-free engine that any office computer can run, and it adds the attribute benchmark that none of these systems provides. Where the highest geometric fidelity is required, the batch tool can hand the same footprints and clouds to roofer and import its LoD2.2 output into the same record.
Table 17.
Earlier GIS-based case studies [17,30] compared with the presented workflow.
It should be stated that the process workflow described here has some limitations, many of which have been identified by the application itself (Table 18) and quantified in Section 3.3 (Table 14). Ground estimation from a ring is less effective in dense terraced blocks and on slopes, as a single scalar is unable to represent a hillside, but the implementation of a digital terrain model would remove this bias. Sparse clouds hide dormers and chimneys below the minimum plane support, footprint-to-cloud misalignment reduces the roof area, and roof overhangs are cropped where the outline is a wall line rather than a roof edge. The Hough merge that removes over-segmentation can, conversely, merge two parallel wings whose offsets differ by less than 0.4 m. Nonetheless, none of these failure modes is hidden. They are visualised as lowered completeness or footprint coverage, increased RMSE values or explicitly indicated with a validity code, while synthetic demonstration clouds are labelled as such in all cases and now carry an explicit warning.
Table 18.
Known failure modes of the reconstruction and how they are signalled or mitigated (thresholds in Table 14).
The limits of the validation must be stated as clearly as the results. The synthetic ground truth establishes that the engine recovers planar roofs correctly, and the controlled experiments establish where it stops doing so, but neither reproduces the full complexity of real returns. The real-data evidence is confined to the historic centre of Košice, about 1.3 km2 of dense, predominantly pre-war building stock scanned in the first national campaign at 9 to 21 points/m2, and it validates heights against an independent product of the same campaign rather than against a field survey. Roof-plane tilts, azimuths and areas on real buildings are therefore verified only indirectly, through completeness, RMSE and the archetype plausibility of Figure 8. The performance figures likewise refer to one computer. Claims of nationwide applicability are accordingly restricted to the statement that the software accepts any building in Slovakia and that its stores are built for the whole country; nationally validated accuracy is not claimed, and the benchmark statistics of Section 3.2 refer to the Košice Self-governing Region and to one city-centre envelope. The applications named in the Introduction (renovation planning, solar potential, material stocks) are potential uses of the produced layer and have not been tested here.
Two terms of the submitted version are moderated in the light of this evidence. The outputs of the workflow are the geometric and semantic building layer of a city information model: static, provenance-annotated, multi-LoD models that a digital twin would consume, but without the sensing, updating and simulation loop that defines a twin. The name BSTwin is retained as the name of the software and refers to that intended use. Likewise, the method relies on geometric model fitting and rules rather than on learned models. GeoAI is used only in the knowledge-driven sense defined in the Introduction, and the contribution should be read as an automated 3D building-modelling and data-integration workflow that can support future digital twin applications rather than as an operational digital twin or a machine-learning result.
Several data-source options were examined and rejected on the basis of evidence rather than assumption. The statistical DATAcube API visualises 668 cubes, none of which bear the census house and dwelling tables, so bulk reports are used instead. The building-height layer in the 2021 Urban Atlas is behind an EU-Login barrier without anonymous programmatic access, so the open 2012 layer is integrated in its place and the newer version is documented for manual retrieval. The 10 m built-up surface output of GHSL was skipped because it adds little analytical value per megabyte to the bundled height, volume and population set, and the full INFOREG output was rejected in favour of suitable on-demand reads, as described in Section 2.3. Licensing conditions were also checked for each source; because OpenStreetMap-derived layers use the share-alike ODbL, the exported fused record retains this per-value provenance, allowing users to separate ODbL-derived values from those that are permissively licensed.
A deliberate design decision was made to reject, for now, the learned reconstruction of workflows examined during the method selection. End-to-end networks, such as Point2Roof [23], deep implicit fields [26] and PolyGNN [27], are GPU-bound, require thousands of labelled training buildings per region, and in several cases lack released code; the geometric RANSAC-plus-Hough path achieves comparable levels of accuracy in Section 3 on the 5–30 points/m2 national LiDAR without these requirements, and its server can be installed on any computer with stock Python. Diffusion-based corrections of sparse roof height maps remain an attractive option for preprocessing if the use of a GPU is assumed, and satellite-only methods address an input modality that this workflow does not use. Future work should concentrate on four distinct aspects: an accuracy campaign on real classified tiles against surveyed roofs, terrain-aware ground estimation from a DTM (which would also resolve the enclosed-house case of Table 14), the calibration of indicative dwelling and material estimates to Slovak archetypes, and the pre-building of the other regional EUBUCCO v0.2 clips.
5. Conclusions
This paper has described the BSTwin application, an automated 3D building-modelling and data-integration workflow that applies an open, multi-source benchmark dataset for the Slovak building stock and reconstructs multi-LoD building models from national airborne LiDAR outside of GIS/BIM software environments. The benchmark fuses authoritative, European, global and open-source data into per-building records with provenance, epoch, completeness metering and multi-source height cross-validation. The reconstruction engine combines normal-seeded RANSAC, Hough parameter-space merging, ring-based ground estimation, mSTEP azimuth rectification and recursive footprint decomposition into a deterministic pass with an attached quality verdict. The whole system runs from just two files on stock Python using exclusively open data. On real national LiDAR for the historic centre of Košice, the workflow reconstructed 99.9% of 1468 buildings in a median of 0.20 s each, left 96.2% of them without a quality flag and agreed with the INSPIRE register heights within 2 m for 85.4% of the buildings. For the same city centre, the benchmark supplied use and height for practically every building and European type and floor attributes for 92.5% of them. The result is a city information model layer with a practical pathway from bulk open geodata to updated, semantically rich building stock knowledge, and a baseline onto which terrain-aware corrections, real-tile accuracy campaigns, archetype-calibrated stock estimates and, eventually, the updating and simulation loops of an urban digital twin can be added incrementally.
Future work on this project will follow two distinct lines. Firstly, the interactive per-building workflow tested here will be extended from the city centre to whole districts and municipalities in batch, because automating a larger area, such as, for example, a specific city district or a housing estate in Košice, is the natural next step for building-stock monitoring and the main reason why the application has been developed as fast and deterministically. A surveyed reference for a sample of roofs will accompany that step so that the accuracy of the roof planes, and not only of the heights, can be stated for real buildings. Secondly, roofs with solar panels, chimneys, dormers or other superstructures currently remain difficult to process. These elements disrupt the planar assumptions of the current application, and a dedicated algorithm for these complex roof segments is needed to reconstruct them with a greater degree of reliability.
Author Contributions
Conceptualization, M.B.G. and M.Z.; methodology M.B.G.; validation, M.B.G.; formal analysis, M.B.G.; investigation, M.B.G. and M.Z.; resources M.B.G.; data curation, M.B.G.; writing—original draft preparation, M.B.G.; writing—review and editing, M.B.G. and M.Z.; visualization, M.B.G.; supervision, M.B.G. and M.Z. All authors have read and agreed to the published version of the manuscript.
Funding
This research was supported by the project of the Ministry of Education of the Slovak Republic VEGA 1/0588/24. This work was funded by project HUSK/2302/1.2/063 Development of an ENVironmental Impact and Risk Assessment focusing on the activities on the catchment of Sajó/Slaná river basin.
Data Availability Statement
All data sources used are open: INSPIRE HVD Buildings (SK) (opendata.skgeodesy.sk), 2021 Census (scitanie.sk), INFOREG (inforeg.sk, listed on data.gov.sk), EUBUCCO v0.2 (eubucco.com), GHSL R2023A (JRC), Copernicus Urban Atlas BH2012 (EEA), OpenStreetMap (Overpass, Nominatim), Overture Maps and the GlobalBuildingAtlas. The classified point clouds of the first laser-scanning cycle were exported from the ZBGIS MAPKA application of the GCCA SR under its licence conditions (source of LLS products: GCCA SR). Access points and licences are documented in Section 2 and inside the application.
Acknowledgments
This research was supported by project of the Educational Grant Agency of the Ministry of Education, Research, Development, and Youth of the Slovak Republic KEGA No. 034TUKE–4/2026 and by the project of the Ministry of Education of the Slovak Republic VEGA 1/0231/26.
Conflicts of Interest
The author declare no conflicts of interest.
Abbreviations
The following abbreviations are used in this manuscript:
| ANBH | Average net building height |
| ALS | Airborne laser scanning |
| CIM | City information model |
| DTM | Digital terrain model |
| ENU | East-north-up local frame |
| EPC | Energy performance certificate |
| HVD | High-value dataset |
| LiDAR | Light detection and ranging |
| LLS | Slovak airborne laser scanning programme of the GCCA SR |
| LoD | Level of detail |
| NUTS | Nomenclature of territorial units for statistics |
| PCA | Principal component analysis |
| QC | Quality control |
| RANSAC | Random sample consensus |
| RMBR | Recursive minimum bounding rectangle |
| RMSE | Root mean square error |
| UDT | Urban digital twin |
| VGI | Volunteered geographic information |
References
- Biljecki, F.; Stoter, J.; Ledoux, H.; Zlatanova, S.; Çöltekin, A. Applications of 3D City Models: State of the Art Review. ISPRS Int. J. Geo-Inf. 2015, 4, 2842–2889. [Google Scholar] [CrossRef] [Scilit]
- Elshaboury, N.; AlMetwaly, W.M.; Hesham, A.; Abbas, A. Integrated BIM-GIS Framework for Holistic Building Stock Assessment Using 5D Geo-Modeling and Digital Twin Concepts. J. Build. Eng. 2025, 111, 113391. [Google Scholar] [CrossRef] [Scilit]
- Ali, Z.; Traoré, M.K. A Holistic Approach to Multi-Scale and Multi-Perspective Urban Digital Twin Development. Comput. Environ. Urban Syst. 2026, 127, 102432. [Google Scholar] [CrossRef] [Scilit]
- Kwak, E.; Habib, A. Automatic Representation and Reconstruction of DBM from LiDAR Data Using Recursive Minimum Bounding Rectangle. ISPRS J. Photogramm. Remote Sens. 2014, 93, 171–191. [Google Scholar] [CrossRef] [Scilit]
- Peters, R.; Dukai, B.; Vitalis, S.; van Liempt, J.; Stoter, J. Automated 3D Reconstruction of LoD2 and LoD1 Models for All 10 Million Buildings of the Netherlands. Photogramm. Eng. Remote Sens. 2022, 88, 165–170. [Google Scholar] [CrossRef] [Scilit]
- Chen, K.; Lu, W.; Xue, F.; Tang, P.; Li, L.H. Automatic Building Information Model Reconstruction in High-Density Urban Areas: Augmenting Multi-Source Data with Architectural Knowledge. Autom. Constr. 2018, 93, 22–34. [Google Scholar] [CrossRef] [Scilit]
- Poli, D.; Remondino, F.; Angiuli, E.; Agugiaro, G. Radiometric and Geometric Evaluation of GeoEye-1, WorldView-2 and Pléiades-1A Stereo Images for 3D Information Extraction. ISPRS J. Photogramm. Remote Sens. 2015, 100, 35–47. [Google Scholar] [CrossRef] [Scilit]
- Fuentes Reyes, M.; Xie, Y.; Yuan, X.; d’Angelo, P.; Kurz, F.; Cerra, D.; Tian, J. A 2D/3D Multimodal Data Simulation Approach with Applications on Urban Semantic Segmentation, Building Extraction and Change Detection. ISPRS J. Photogramm. Remote Sens. 2023, 205, 74–97. [Google Scholar] [CrossRef] [Scilit]
- Lussange, J.; Yu, M.; Tarabalka, Y.; Lafarge, F. KIBS: 3D Detection of Planar Roof Sections from a Single Satellite Image. ISPRS J. Photogramm. Remote Sens. 2025, 220, 207–216. [Google Scholar] [CrossRef] [Scilit]
- Jiao, Z.; Qiu, X.; Dong, S.; Yan, Q.; Zhou, L.; Ding, C. Preliminary Exploration of Geometrical Regularized SAR Tomography. ISPRS J. Photogramm. Remote Sens. 2023, 201, 174–192. [Google Scholar] [CrossRef] [Scilit]
- Open Geospatial Consortium. OGC City Geography Markup Language (CityGML) Encoding Standard, Version 2.0.0; Document No. 12-019; Open Geospatial Consortium: Wayland, MA, USA, 2012. [Google Scholar]
- Biljecki, F.; Ledoux, H.; Stoter, J. An Improved LOD Specification for 3D Building Models. Comput. Environ. Urban Syst. 2016, 59, 25–37. [Google Scholar] [CrossRef] [Scilit]
- Biljecki, F.; Heuvelink, G.B.M.; Ledoux, H.; Stoter, J. The Effect of Acquisition Error and Level of Detail on the Accuracy of Spatial Analyses. Cartogr. Geogr. Inf. Sci. 2018, 45, 156–176. [Google Scholar] [CrossRef] [Scilit]
- Dukai, B.; Peters, R.; Wu, T.; Commandeur, T.; Ledoux, H.; Baving, T.; Post, M.; van Altena, V.; van Hinsbergh, W.; Stoter, J. Generating, Storing, Updating and Disseminating a Countrywide 3D Model. Int. Arch. Photogramm. Remote Sens. Spat. Inf. Sci. 2020, XLIV-4/W1-2020, 27–32. [Google Scholar] [CrossRef] [Scilit]
- Geoinformation Group, Delft University of Technology; 3DGI. Roofer: Large-Scale Automatic LoD2.2 Building Reconstruction (Software). Delft University of Technology. Available online: https://github.com/3DBAG/roofer (accessed on 7 July 2026).
- Kunze, C.; Hecht, R. Semantic Enrichment of Building Data with Volunteered Geographic Information to Improve Mappings of Dwelling Units and Population. Comput. Environ. Urban Syst. 2015, 53, 4–18. [Google Scholar] [CrossRef] [Scilit]
- Gergelova, M.B.; Kuzevicova, Z.; Labant, S.; Kuzevic, S.; Bobikova, D.; Mizak, J. Roof’s Potential and Suitability for PV Systems Based on LiDAR: A Case Study of Komárno, Slovakia. Sustainability 2020, 12, 10018. [Google Scholar] [CrossRef] [Scilit]
- Milojevic-Dupont, N.; Wagner, F.; Nachtigall, F.; Hu, J.; Brüser, G.B.; Zumwald, M.; Biljecki, F.; Heeren, N.; Kaack, L.H.; Pichler, P.-P.; et al. EUBUCCO v0.1: European Building Stock Characteristics in a Common and Open Database for 200+ Million Individual Buildings. Sci. Data 2023, 10, 147. [Google Scholar] [CrossRef] [Scilit] [PubMed]
- Zhu, X.X.; Chen, S.; Zhang, F.; Shi, Y.; Wang, Y. GlobalBuildingAtlas: An Open Global and Complete Dataset of Building Polygons, Heights and LoD1 3D Models. Earth Syst. Sci. Data 2025, 17, 6647–6668. [Google Scholar] [CrossRef] [Scilit]
- Federal Office of Topography swisstopo. swissBUILDINGS3D 3.0 Beta; swisstopo: Wabern, Switzerland, 2024; Available online: https://www.swisstopo.admin.ch/en/landscape-model-swissbuildings3d-3-0-beta (accessed on 7 July 2026).
- Yang, Y.; Tang, R.; Wang, J.; Xia, M. A Hierarchical Deep Neural Network with Iterative Features for Semantic Labeling of Airborne LiDAR Point Clouds. Comput. Geosci. 2021, 157, 104932. [Google Scholar] [CrossRef] [Scilit]
- Zhang, L.; Li, Z.; Li, A.; Liu, F. Large-Scale Urban Point Cloud Labeling and Reconstruction. ISPRS J. Photogramm. Remote Sens. 2018, 138, 86–100. [Google Scholar] [CrossRef] [Scilit]
- Li, L.; Song, N.; Sun, F.; Liu, X.; Wang, R.; Yao, J.; Cao, S. Point2Roof: End-to-End 3D Building Roof Modeling from Airborne LiDAR Point Clouds. ISPRS J. Photogramm. Remote Sens. 2022, 193, 17–28. [Google Scholar] [CrossRef] [Scilit]
- Maru, M.B.; Wang, Y.; Kim, H.; Yoon, H.; Park, S. Improved Building Façade Segmentation Through Digital Twin-Enabled RandLA-Net with Empirical Intensity Correction Model. J. Build. Eng. 2023, 78, 107520. [Google Scholar] [CrossRef] [Scilit]
- Chen, Y.; Li, J.; Han, T.; Feng, H.; Chen, J.; Wang, C. City-Facade: A City-Level Large-Scale Point Cloud Building Facade Dataset for Semantic and Instance Segmentation. ISPRS J. Photogramm. Remote Sens. 2026, 232, 675–688. [Google Scholar] [CrossRef] [Scilit]
- Chen, Z.; Ledoux, H.; Khademi, S.; Nan, L. Reconstructing Compact Building Models from Point Clouds Using Deep Implicit Fields. ISPRS J. Photogramm. Remote Sens. 2022, 194, 58–73. [Google Scholar] [CrossRef] [Scilit]
- Chen, Z.; Shi, Y.; Nan, L.; Xiong, Z.; Zhu, X.X. PolyGNN: Polyhedron-Based Graph Neural Network for 3D Building Reconstruction from Point Clouds. ISPRS J. Photogramm. Remote Sens. 2024, 218, 693–706. [Google Scholar] [CrossRef] [Scilit]
- Romanengo, C.; Cabiddu, D.; Pittaluga, S.; Mortara, M. Building Semantic Segmentation from Large-Scale Point Clouds via Primitive Recognition. Graph. Models 2024, 136, 101234. [Google Scholar] [CrossRef] [Scilit]
- Dehbi, Y.; Henn, A.; Gröger, G.; Stroh, V.; Plümer, L. Robust and Fast Reconstruction of Complex Roofs with Active Sampling from 3D Point Clouds. Trans. GIS 2021, 25, 112–133. [Google Scholar] [CrossRef] [Scilit]
- Gergelova, M.B.; Labant, S.; Kuzevic, S.; Kuzevicova, Z.; Pavolova, H. Identification of Roof Surfaces from LiDAR Cloud Points by GIS Tools: A Case Study of Lučenec, Slovakia. Sustainability 2020, 12, 6847. [Google Scholar] [CrossRef] [Scilit]
- EUBUCCO. EUBUCCO v0.2—European Building Stock Database. 2026. Available online: https://eubucco.com/data/download (accessed on 21 July 2026).
- Úrad Geodézie, Kartografie a Katastra Slovenskej Republiky (ÚGKK SR). INSPIRE Theme Buildings for the Slovak Republic (Budovy); ÚGKK SR: Bratislava, Slovakia, 2024; Available online: https://www.skgeodesy.sk/sk/novinky/clanky/open-data.html (accessed on 21 July 2026).
- Statistical Office of the Slovak Republic. 2021 Population and Housing Census (SODB 2021): Houses and Dwellings; Statistical Office of the Slovak Republic: Bratislava, Slovakia, 2021. Available online: https://www.scitanie.sk (accessed on 21 July 2026).
- Ministry of Transport of the Slovak Republic. Inforeg: Central Register of Energy Performance Certificates of Buildings; Ministry of Transport of the Slovak Republic: Bratislava, Slovakia, 2024. Available online: https://www.inforeg.sk (accessed on 21 July 2026).
- Overture Maps Foundation. Overture Maps Data, Buildings Theme; Overture Maps Foundation: San Francisco, CA, USA, 2026; Available online: https://overturemaps.org (accessed on 21 July 2026).
- Microsoft. GlobalMLBuildingFootprints: Worldwide Building Footprints Derived from Satellite Imagery; Microsoft: Redmond, WA, USA, 2023; Available online: https://github.com/microsoft/GlobalMLBuildingFootprints (accessed on 21 July 2026).
- Pesaresi, M.; Politis, P. GHS-BUILT-H R2023A and GHS-BUILT-V R2023A: Global Human Settlement Layer Building Height and Volume Grids; European Commission, Joint Research Centre (JRC): Ispra, Italy, 2023; Available online: https://ghsl.jrc.ec.europa.eu (accessed on 21 July 2026).
- European Environment Agency (EEA). Copernicus Land Monitoring Service, Urban Atlas Building Height 2012; European Environment Agency: Copenhagen, Denmark, 2018; Available online: https://land.copernicus.eu/en/products/urban-atlas (accessed on 21 July 2026).
- Oostwegel, L.J.N.; Schorlemmer, D.; Lingner, L.; Evaz Zadeh, T. OpenBuildingMap. GFZ Data Services. 2025. Available online: https://gfzpublic.gfz.de/pubman/faces/ViewItemFullPage.jsp?itemId=item_5036673_1 (accessed on 21 July 2026). [CrossRef]
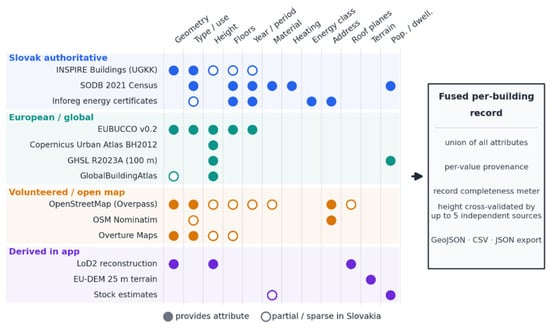
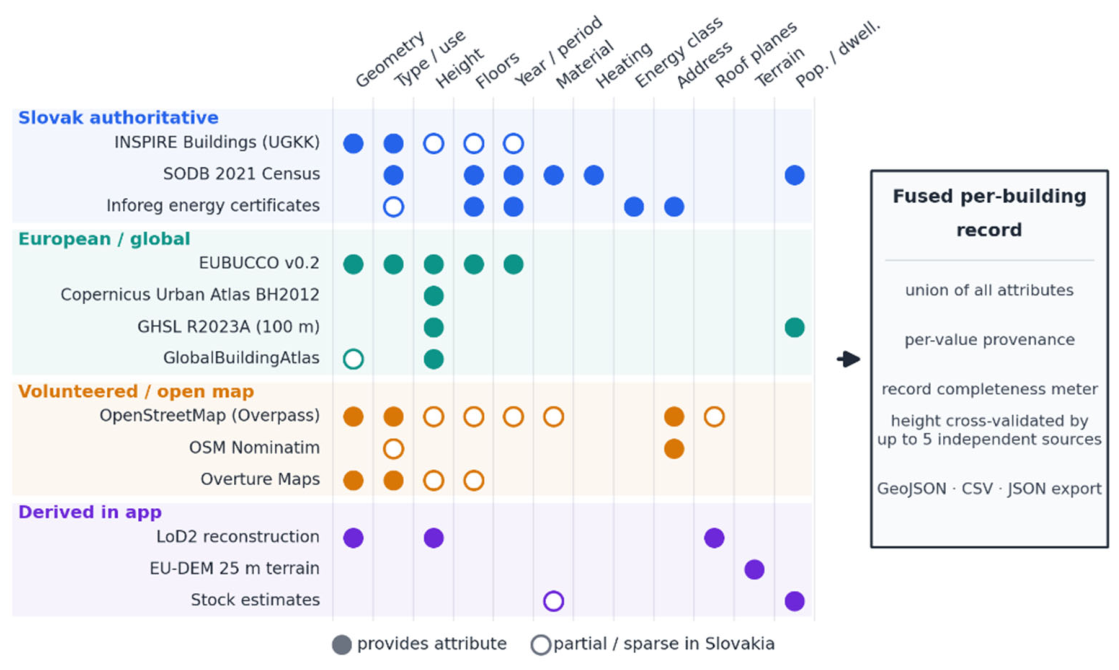
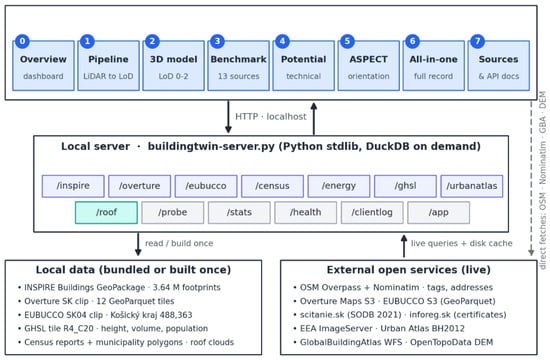
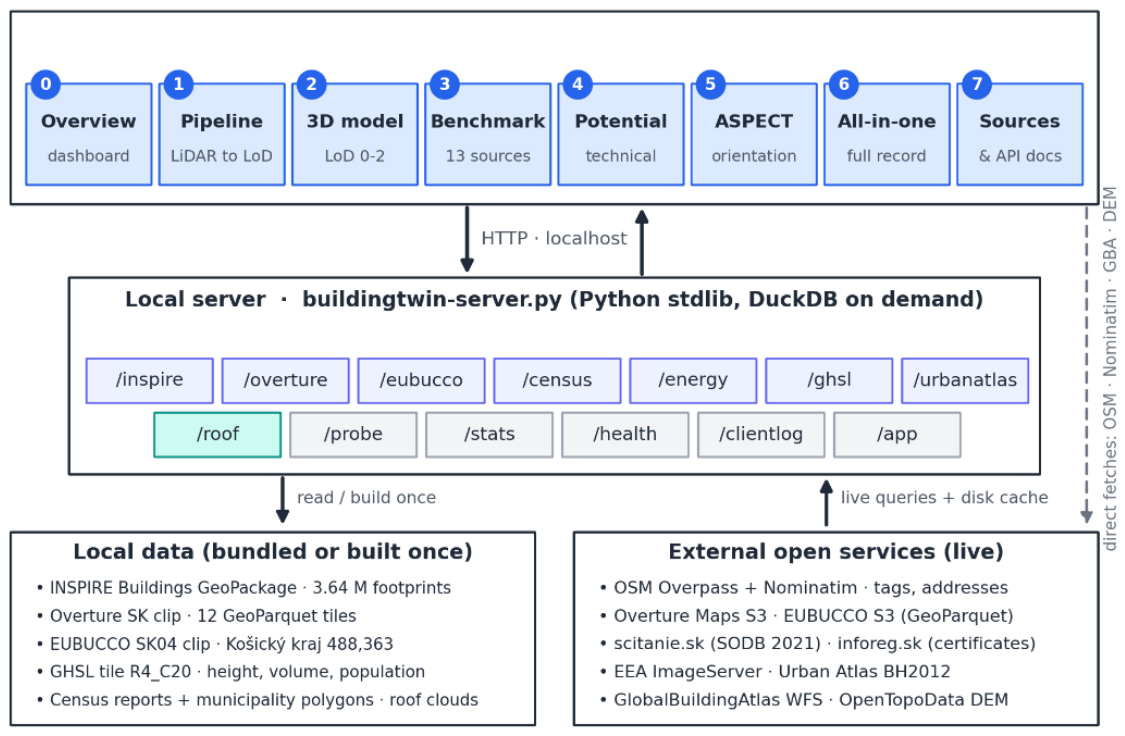
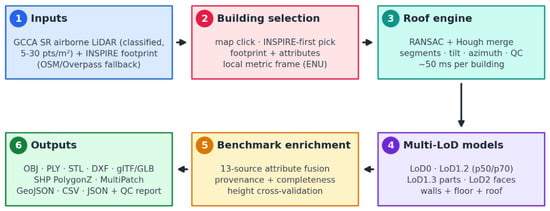
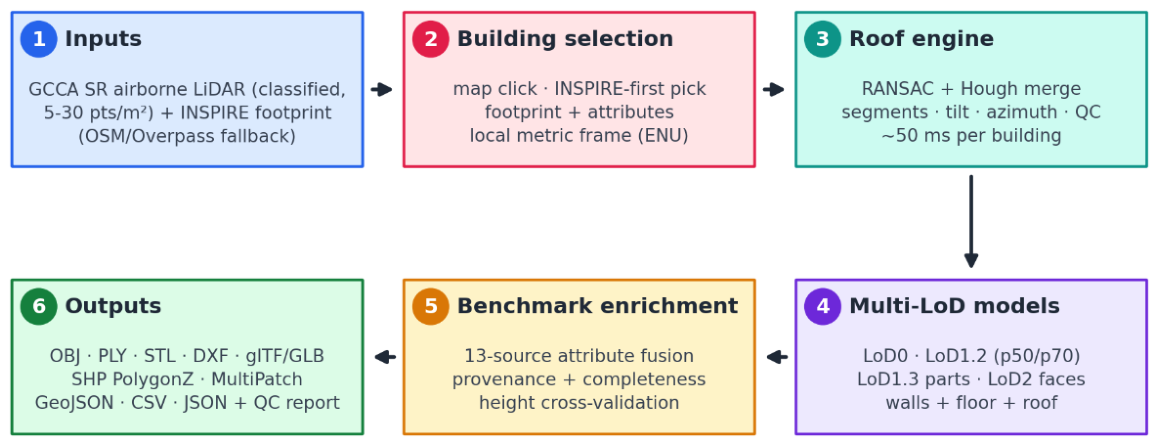
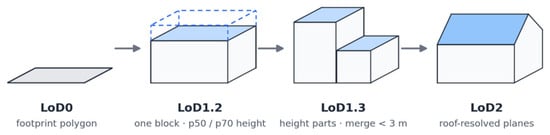
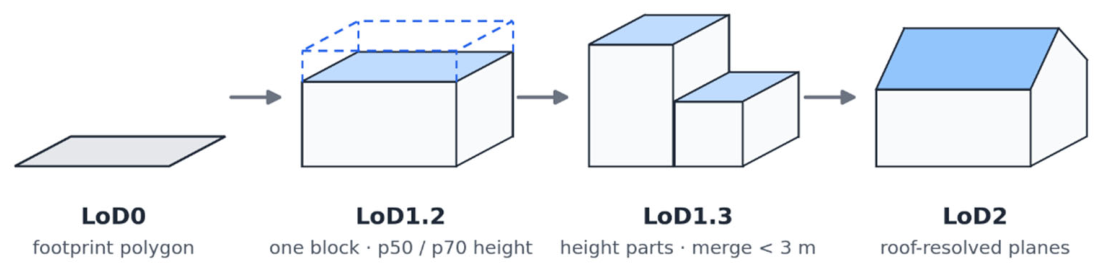
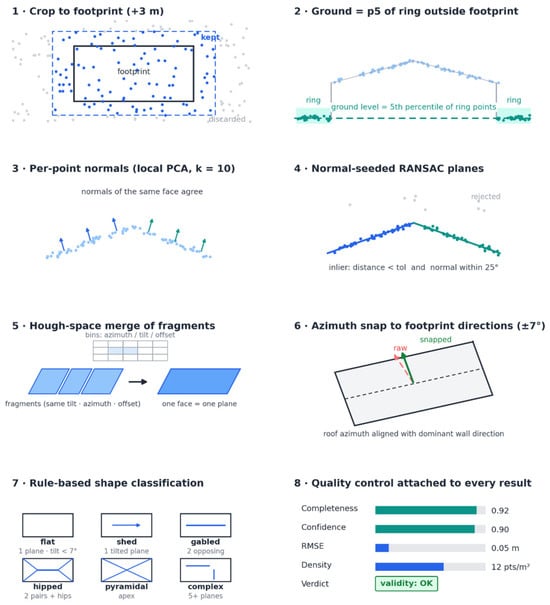
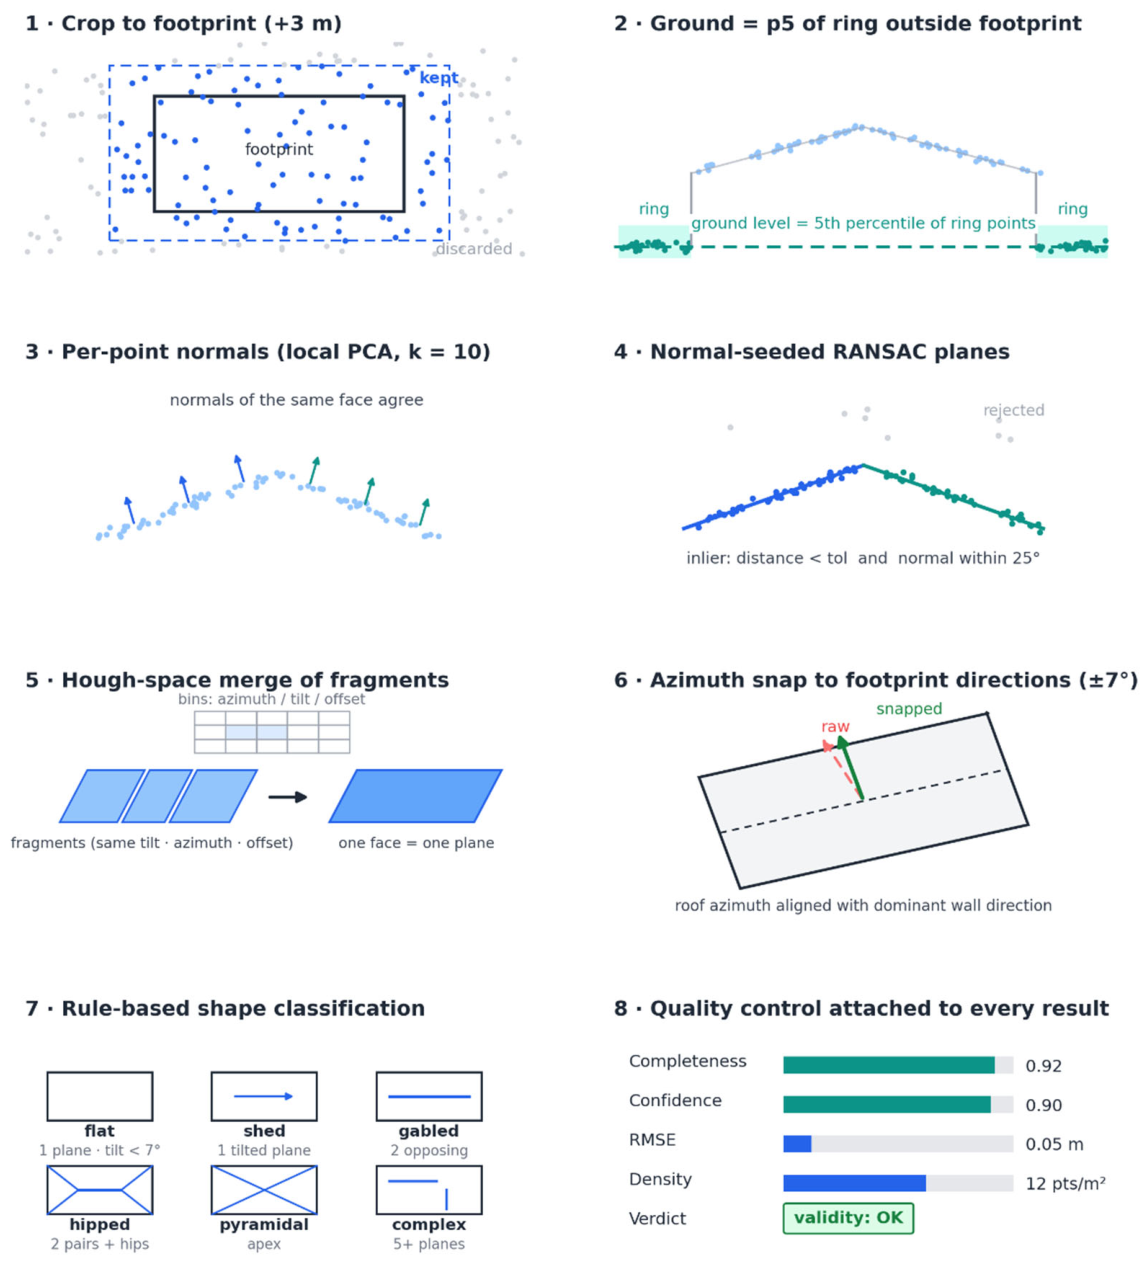
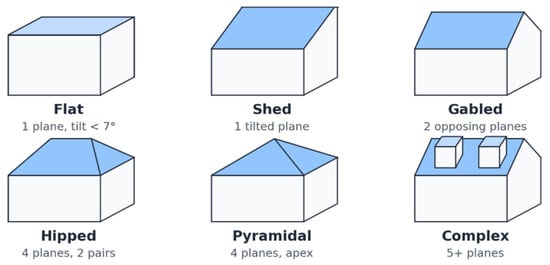
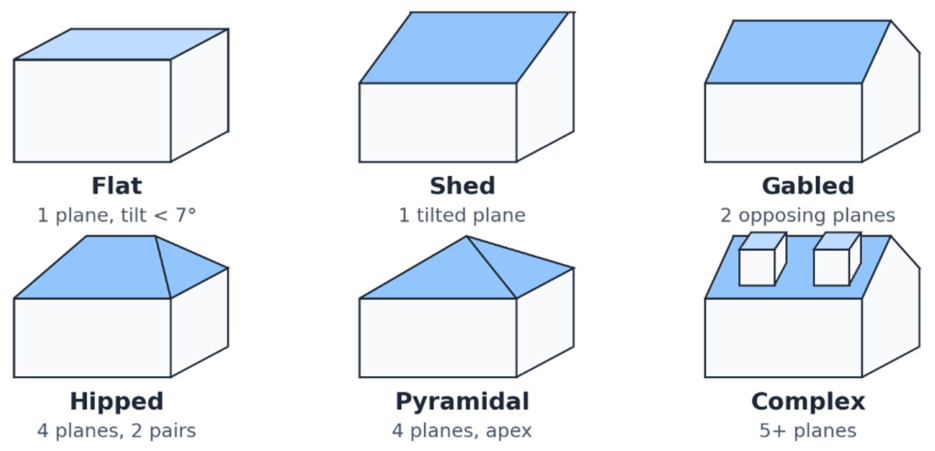
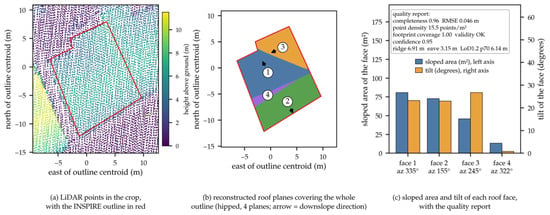
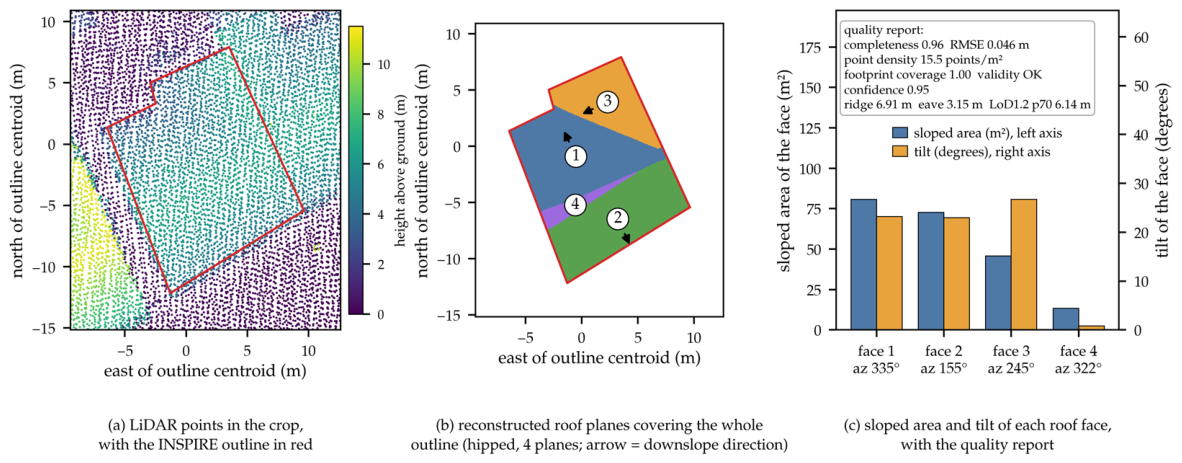
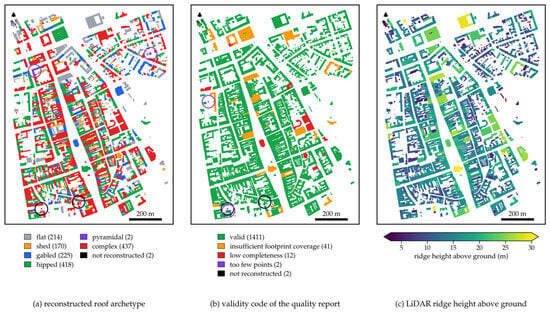
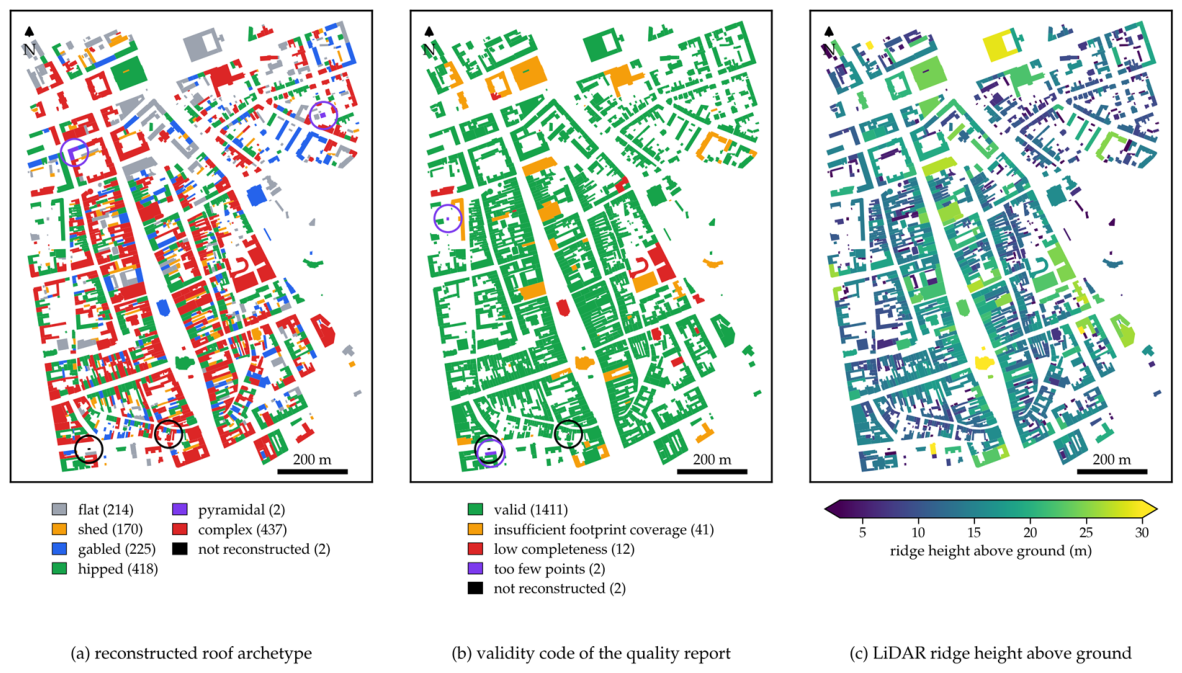
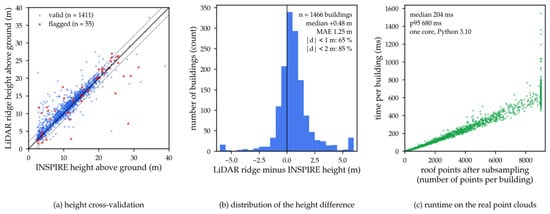
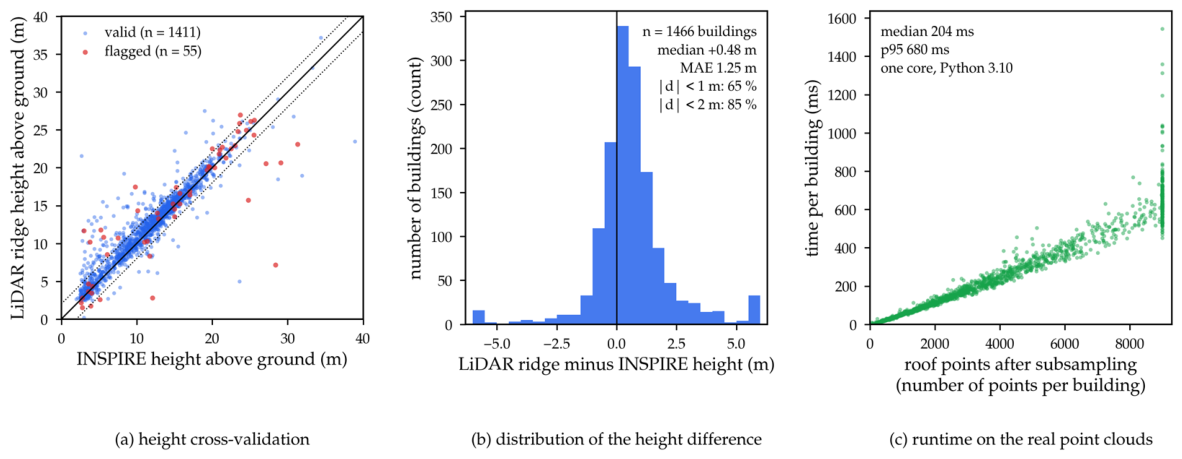

Disclaimer/Publisher’s Note: The statements, opinions and data contained in all publications are solely those of the individual author(s) and contributor(s) and not of MDPI and/or the editor(s). MDPI and/or the editor(s) disclaim responsibility for any injury to people or property resulting from any ideas, methods, instructions or products referred to in the content. |
© 2026 by the authors. Licensee MDPI, Basel, Switzerland. This article is an open access article distributed under the terms and conditions of the Creative Commons Attribution (CC BY) license.