Impact of Land Use Change on the Spatiotemporal Evolution of Ecosystem Services in Tropical Islands: A Case Study of Hainan Island, China


Abstract
1. Introduction
2. Materials and Methods
2.1. Overview of the Study Area
2.2. Data Sources
2.3. Multi-Scenario Prediction Based on the MOP Model
2.4. Optimization Simulation of Land Use Spatial Distribution Based on the PLUS Model
2.5. Evaluation of ESV
3. Results
3.1. Dynamic Characteristics of Land Use Changes
3.1.1. Changes in Land Use Type Area
3.1.2. Analysis of Land Use Type Transitions
3.2. Analysis of Drivers of Land Use Change
3.3. Land Use Structure Prediction under Different Scenarios
3.4. Spatial Simulation of Land Use Based on the PLUS Model
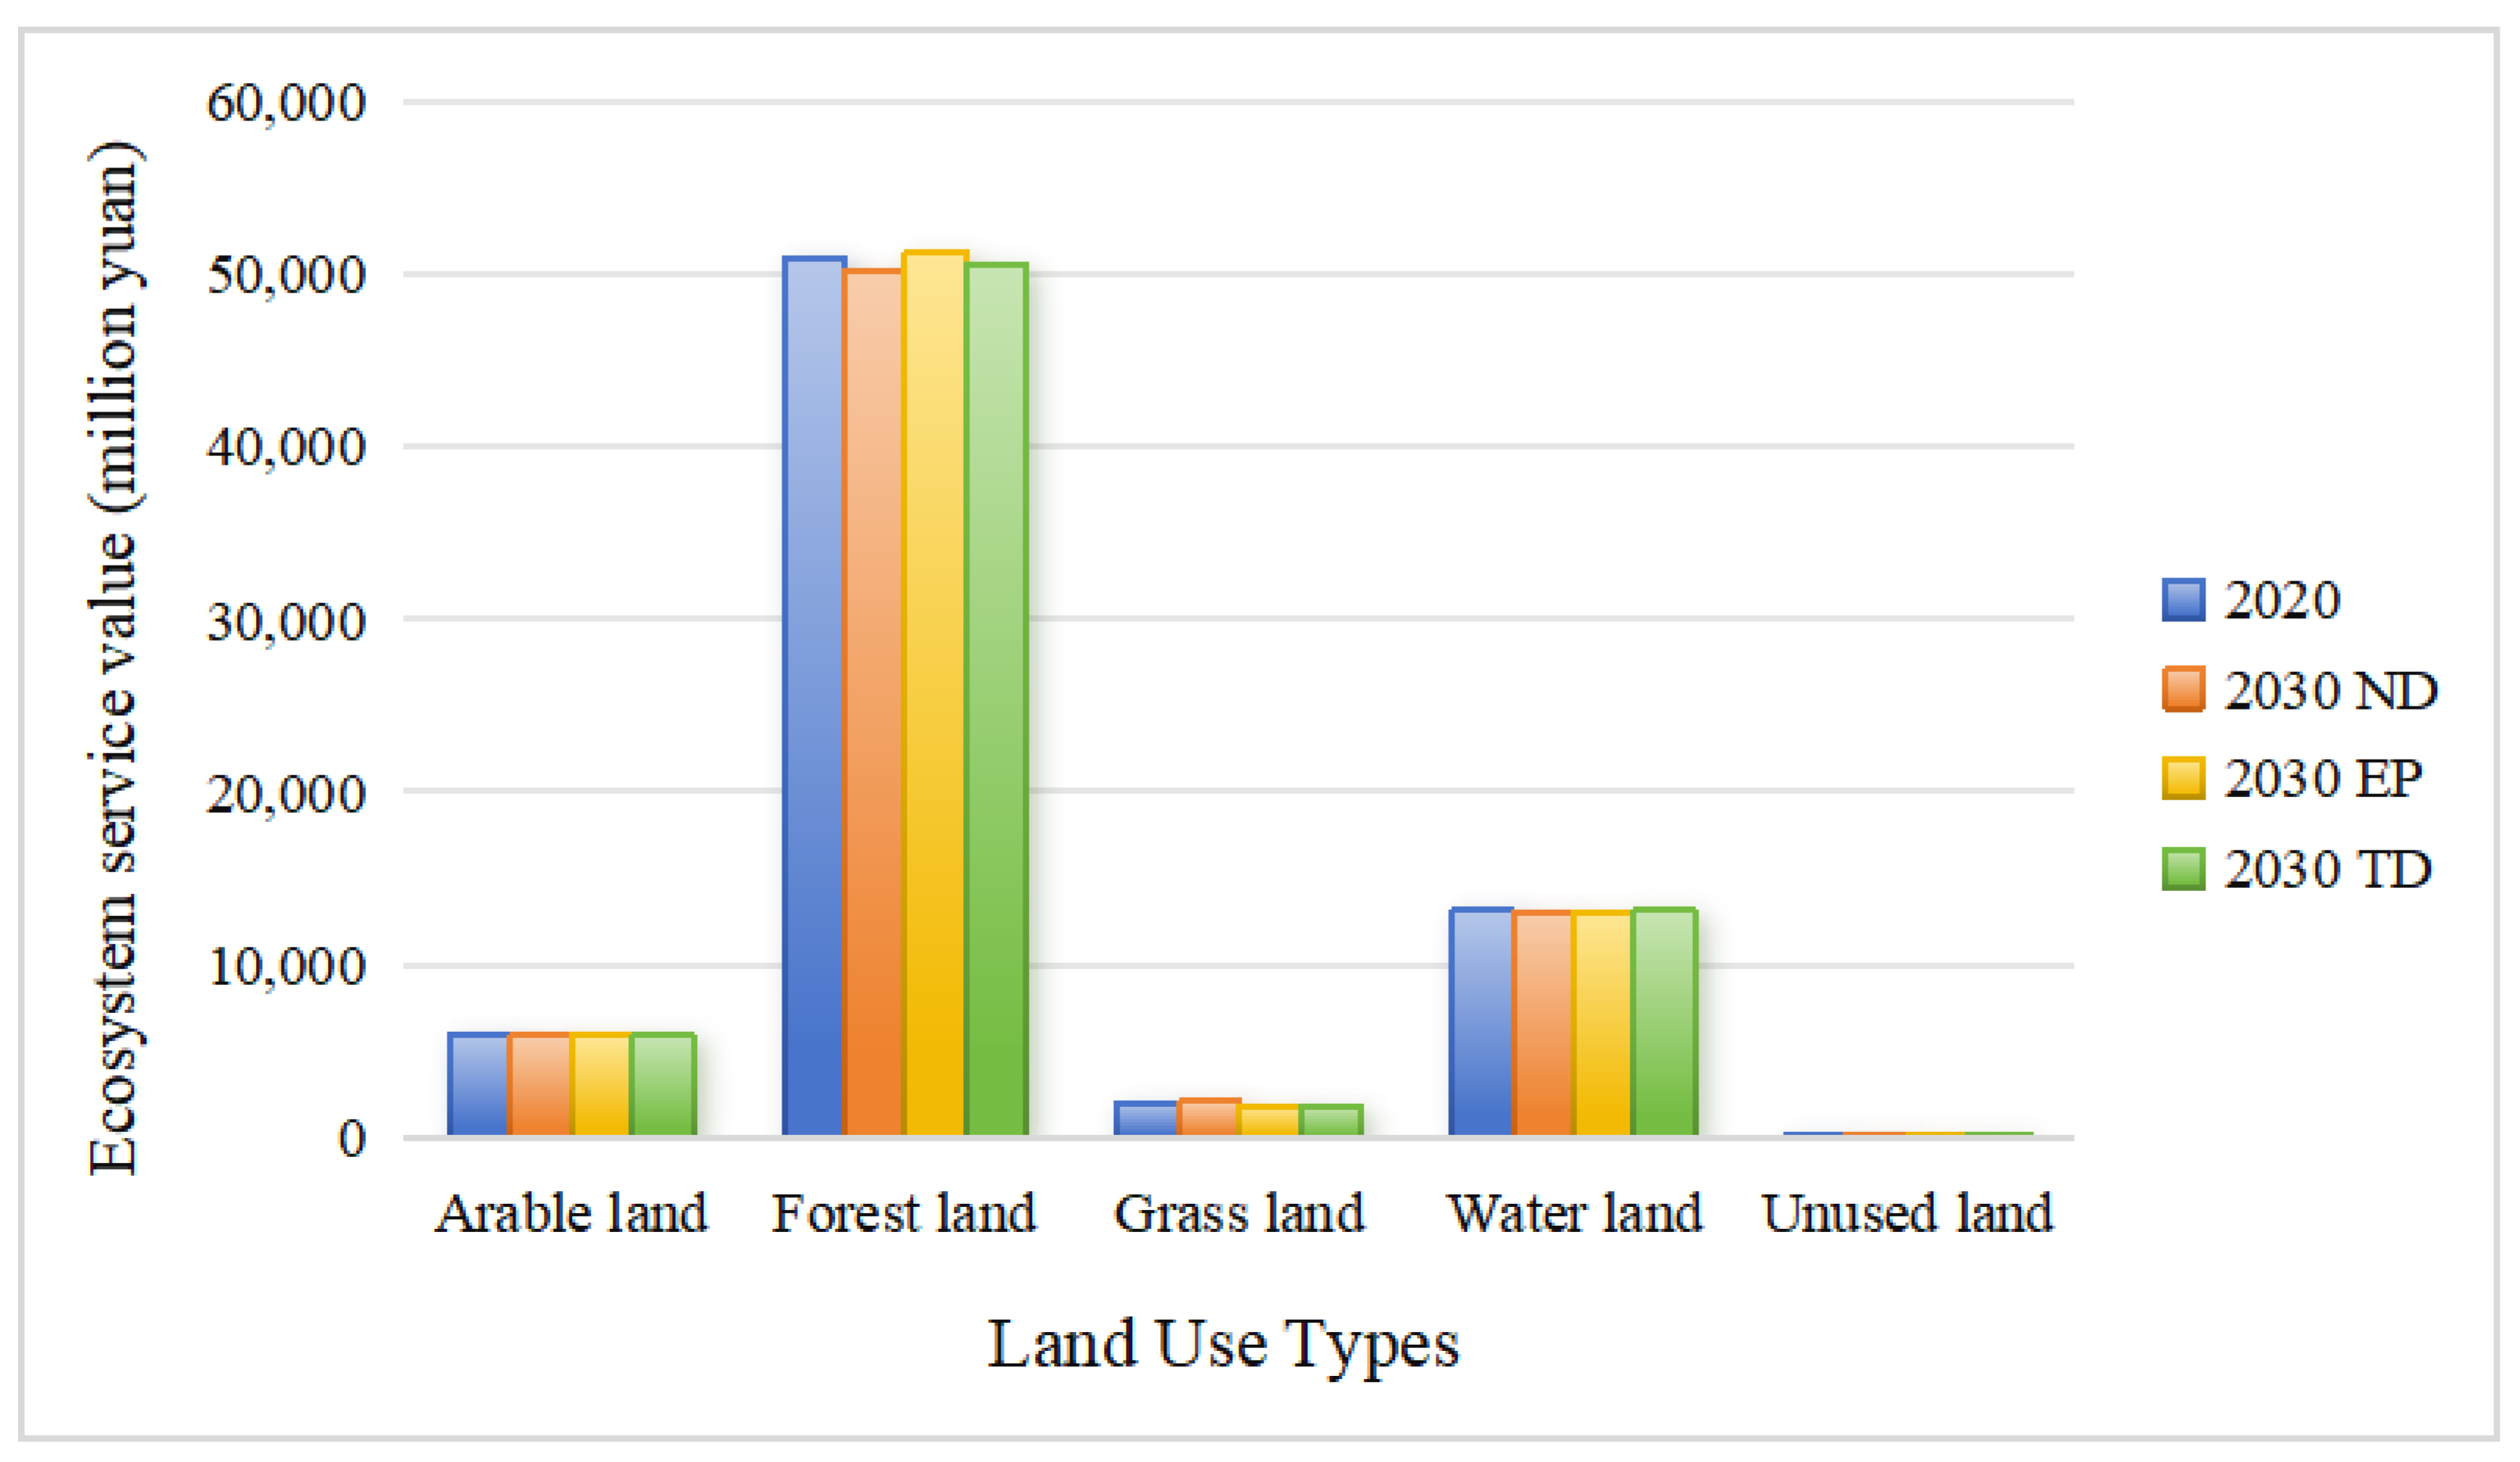
3.5. Evaluation of Ecosystem Service Value under Different Scenarios
3.6. Impact of Different Land Use Type Changes on Ecosystem Service Value
4. Discussion
5. Conclusions
Author Contributions
Funding
Data Availability Statement
Conflicts of Interest
Appendix A

| The Name of the Constraint | Constraint Expression | Interpretation |
|---|---|---|
| Total land area | + + + + + = 34,004.85 | The total area of each land use type remains unchanged. |
| Area of arable land | ≥ 8488.52 | The arable land area predicted by the Markov model is used as the lower limit. |
| Area of forest land | 21,100 ≤ ≤ 25,369.14 | The 20% increase in forest land area predicted by the Markov model is used as the upper limit, and the forest land area specified in the Hainan Provincial Land and Space Planning (2020–2035) is used as the lower limit. |
| Area of grass land | 1036.94 ≤ ≤ 1412.17 | The upper limit is the 20% increase in grass land area predicted by the Markov model, and the lower limit is the 10% decrease in grass land area in 2020. |
| Area of water land | ≥ 1265.16 | The water land area predicted by the Markov model is used as the lower limit. |
| Area of built-up land | 1534.91 ≤ ≤ 1850.69 | The upper limit is the built-up land area predicted by the Markov model, and the lower limit is the 10% increase in built-up land in 2020. |
| Area of unused land | 79.97 ≤ ≤ 82.72 | The upper limit is the unused land area predicted by the Markov model, and the lower limit is a 10% decrease in unused land in 2020. |
References
- Costanza, R.; d’Arge, R.; de Groot, R.; Farber, S.; Grasso, M.; Hannon, B.; Limburg, K.; Naeem, S.; O’Neill, R.V.; Paruelo, J.; et al. The value of the world’s ecosystem services and natural capital. Nature 1997, 387, 253–260. [Google Scholar] [CrossRef] [Scilit]
- Li, F.; Wang, F.; Liu, H.; Huang, K.; Yu, Y.; Huang, B. A comparative analysis of ecosystem service valuation methods: Taking Beijing, China as a case. Ecol. Indic. 2023, 154, 110872. [Google Scholar] [CrossRef] [Scilit]
- Kindu, M.; Schneider, T.; Teketay, D.; Knoke, T. Changes of ecosystem service values in response to land use/land cover dynamics in Munessa–Shashemene landscape of the Ethiopian highlands. Sci. Total Environ. 2016, 547, 137–147. [Google Scholar] [CrossRef] [Scilit]
- Millennium Ecosystem Assessment (Program). Ecosystems and Human Well-Being: Wetlands and Water Synthesis: A Report of the Millennium Ecosystem Assessment; World Resources Institute: Washington, DC, USA, 2005. [Google Scholar]
- Xie, G.D.; Lin, Z.; Lu, C.X.; Yu, X.; Cao, C. Expert knowledge based valuation method of ecosystem services in China. J. Nat. Resour. 2008, 23, 911–919. [Google Scholar]
- Barbier, E.B.; Hacker, S.D.; Kennedy, C.; Koch, E.W.; Stier, A.C.; Silliman, B.R. The value of estuarine and coastal ecosystem services. Ecol. Monogr. 2011, 81, 169–193. [Google Scholar] [CrossRef] [Scilit]
- Brander, L.M.; Wagtendonk, A.J.; Hussain, S.S.; McVittie, A.; Verburg, P.H.; de Groot, R.S.; van der Ploeg, S. Ecosystem service values for mangroves in Southeast Asia: A meta-analysis and value transfer application. Ecosyst. Serv. 2012, 1, 62–69. [Google Scholar] [CrossRef] [Scilit]
- Jiang, W.; Lü, Y.; Liu, Y.; Gao, W. Ecosystem service value of the Qinghai-Tibet Plateau significantly increased during 25 years. Ecosyst. Serv. 2020, 44, 101146. [Google Scholar] [CrossRef] [Scilit]
- Rahman, M.M.; Szabó, G. Impact of Land Use and Land Cover Changes on Urban Ecosystem Service Value in Dhaka, Bangladesh. Land 2021, 10, 793. [Google Scholar] [CrossRef] [Scilit]
- Rimal, B.; Sharma, R.; Kunwar, R.; Keshtkar, H.; Stork, N.E.; Rijal, S.; Rahman, S.A.; Baral, H. Effects of land use and land cover change on ecosystem services in the Koshi River Basin, Eastern Nepal. Ecosyst. Serv. 2019, 38, 100963. [Google Scholar] [CrossRef] [Scilit]
- Kusi, K.K.; Khattabi, A.; Mhammdi, N. Analyzing the impact of land use change on ecosystem service value in the main watersheds of Morocco. Environ. Dev. Sustain. 2023, 25, 2688–2715. [Google Scholar] [CrossRef] [Scilit]
- Verburg, P.H.; Soepboer, W.; Veldkamp, A.; Limpiada, R.; Espaldon, V.; Mastura, S.S. Modeling the spatial dynamics of regional land use: The CLUE-S model. Environ. Manag. 2002, 30, 391–405. [Google Scholar] [CrossRef] [Scilit]
- Coyle, R.G. System Dynamics Modelling: A Practical Approach. J. Oper. Res. Soc. 1997, 48, 544. [Google Scholar] [CrossRef] [Scilit]
- Sang, L.; Zhang, C.; Yang, J.; Zhu, D.; Yun, W. Simulation of land use spatial pattern of towns and villages based on CA–Markov model. Math. Comput. Model. 2011, 54, 938–943. [Google Scholar] [CrossRef] [Scilit]
- Liu, X.; Liang, X.; Li, X.; Xu, X.; Ou, J.; Chen, Y.; Li, S.; Wang, S.; Pei, F. A future land use simulation model (FLUS) for simulating multiple land use scenarios by coupling human and natural effects. Landsc. Urban Plan. 2017, 168, 94–116. [Google Scholar] [CrossRef] [Scilit]
- Qin, X.; Fu, B. Assessing and Predicting Changes of the Ecosystem Service Values Based on Land Use/Land Cover Changes with a Random Forest-Cellular Automata Model in Qingdao Metropolitan Region, China. IEEE J. Sel. Top. Appl. Earth Obs. Remote Sens. 2020, 13, 6484–6494. [Google Scholar] [CrossRef] [Scilit]
- Liang, X.; Guan, Q.; Clarke, K.C.; Liu, S.; Wang, B.; Yao, Y. Understanding the drivers of sustainable land expansion using a patch-generating land use simulation (PLUS) model: A case study in Wuhan, China. Comput. Environ. Urban Syst. 2021, 85, 101569. [Google Scholar] [CrossRef] [Scilit]
- Wang, Y.; Li, X.; Zhang, Q.; Li, J.; Zhou, X. Projections of future land use changes: Multiple scenarios-based impacts analysis on ecosystem services for Wuhan city, China. Ecol. Indic. 2018, 94, 430–445. [Google Scholar] [CrossRef] [Scilit]
- Fu, W. On tourism development and environmental management in China. Econ. Geogr. 1994, 1, 79–81. [Google Scholar]
- Zhang, Y.; Han, N.; Zhang, W.; Li, X. Multi-scenario simulation of land use change in Sanya City. Ecol. Sci. 2022, 41, 52–62. [Google Scholar]
- Deng, Z.; Quan, B. Intensity Characteristics and Multi-Scenario Projection of Land Use and Land Cover Change in Hengyang, China. Int. J. Environ. Res. Public Health 2022, 19, 8491. [Google Scholar] [CrossRef] [Scilit]
- Lin, X.; Fu, H. Multi-scenario simulation analysis of cultivated land based on PLUS model—A case study of Haikou, China. Front. Ecol. Evol. 2023, 11, 1197419. [Google Scholar] [CrossRef] [Scilit]
- Xie, G.D.; Lu, C.X.; Leng, Y.F.; Zheng, D.U.; Li, S.C. Ecological assets valuation of the Tibetan Plateau. J. Nat. Resour. 2003, 18, 189–196. [Google Scholar]
- Xie, G.D. Improvement of the Evaluation Method for Ecosystem Service Value Based on Per Unit Area. J. Nat. Resour. 2015, 30, 1243–1254. [Google Scholar]
- Lei, J.; Chen, Z.; Chen, X.; Li, Y.; Wu, T. Spatio-temporal changes of land use and ecosystem services value in Hainan Island from 1980 to 2018. Acta Ecol. Sin 2020, 40, 4760–4773. [Google Scholar]
- Li, C.; Wu, Y.; Gao, B.; Zheng, K.; Wu, Y.; Li, C. Multi-scenario simulation of ecosystem service value for optimization of land use in the Sichuan-Yunnan ecological barrier, China. Ecol. Indic. 2021, 132, 108328. [Google Scholar] [CrossRef] [Scilit]
- Kueffer, C.; Kinney, K. What is the importance of islands to environmental conservation? Environ. Conserv. 2017, 44, 311–322. [Google Scholar] [CrossRef] [Scilit]
- Lee, T.H.; Jan, F.H.; Tseng, C.H.; Lin, Y.F. Segmentation by recreation experience in island-based tourism: A case study of Taiwan’s Liuqiu Island. J. Sustain. Tour. 2018, 26, 362–378. [Google Scholar] [CrossRef] [Scilit]
- Moon, H.; Han, H. Destination attributes influencing Chinese travelers’ perceptions of experience quality and intentions for island tourism: A case of Jeju Island. Tour. Manag. Perspect. 2018, 28, 71–82. [Google Scholar] [CrossRef] [Scilit]
- Sun, R.; Wu, Z.; Chen, B.; Yang, C.; Qi, D.; Lan, G.; Fraedrich, K. Effects of land-use change on eco-environmental quality in Hainan Island, China. Ecol. Indic. 2020, 109, 105777. [Google Scholar] [CrossRef] [Scilit]
- Gao, X.; Wang, J.; Li, C.; Shen, W.; Song, Z.; Nie, C.; Zhang, X. Land use change simulation and spatial analysis of ecosystem service value in Shijiazhuang under multi-scenarios. Environ. Sci. Pollut. Res. 2021, 28, 31043–31058. [Google Scholar] [CrossRef] [Scilit]
- Li, B.; Yang, Z.; Cai, Y.; Xie, Y.; Guo, H.; Wang, Y.; Zhang, P.; Li, B.; Jia, Q.; Huang, Y.; et al. Prediction and valuation of ecosystem service based on land use/land cover change: A case study of the Pearl River Delta. Ecol. Eng. 2022, 179, 106612. [Google Scholar] [CrossRef] [Scilit]
- Jin, Z.; Xiong, C.; Luan, Q.; Wang, F. Dynamic Evolutionary Analysis of Land Use/Cover and Ecosystem Service Values on Hainan Island. Int. J. Environ. Res. Public Health 2023, 20, 776. [Google Scholar] [CrossRef] [Scilit] [PubMed]
- Kou, J.; Wang, J.; Ding, J.; Ge, X. Spatial simulation and prediction of land use/land cover in the transnational Ili-Balkhash Basin. Remote Sens. 2023, 15, 3059. [Google Scholar] [CrossRef] [Scilit]
- Liu, Q.; Yang, Z.Y.; Chen, Y.Q.; Lei, J.R.; Chen, Z.Z.; Chen, X.H. Multi-scenario Simulation of Land Use Change and Its Eco-environmental Effect in Hainan Island Based on CA-Markov Model. Ecol. Environ. 2021, 30, 1522. [Google Scholar]
- Li, H.; He, W.; Wang, J.; Yang, S.; Yao, Y. Multi-scenario prediction of ecosystem service values based on PLSR-FLUS-MarKov model: A case study of the Li River Basin. J. Aquat. Ecosyst. Health 2023, 1–14. [Google Scholar] [CrossRef]
- Han, N.; Zhang, Y. Trade-Offs and Synergies Analysis of Ecosystem Services and Simulation in Tropical Islands: A Case Study of Hainan Island, China. Pol. J. Environ. Stud. 2024, 33, 671–683. [Google Scholar] [CrossRef] [Scilit] [PubMed]
- Han, J.; Hu, Z.; Wang, P.; Yan, Z.; Li, G.; Zhang, Y.; Zhou, T. Spatio-temporal evolution and optimization analysis of ecosystem service value—A case study of coal resource-based city group in Shandong, China. J. Clean. Prod. 2022, 363, 132602. [Google Scholar] [CrossRef] [Scilit]
- Zhao, S.H.; Bai, M.; Ruan, M.Z.; Qian, H. Spatio-temporal evolution characteristics and obstacle factors of coordinated development of tourism resources and ecological security in Yunnan province. Sci. Geogr. Sin. 2021, 41, 493–503. [Google Scholar]

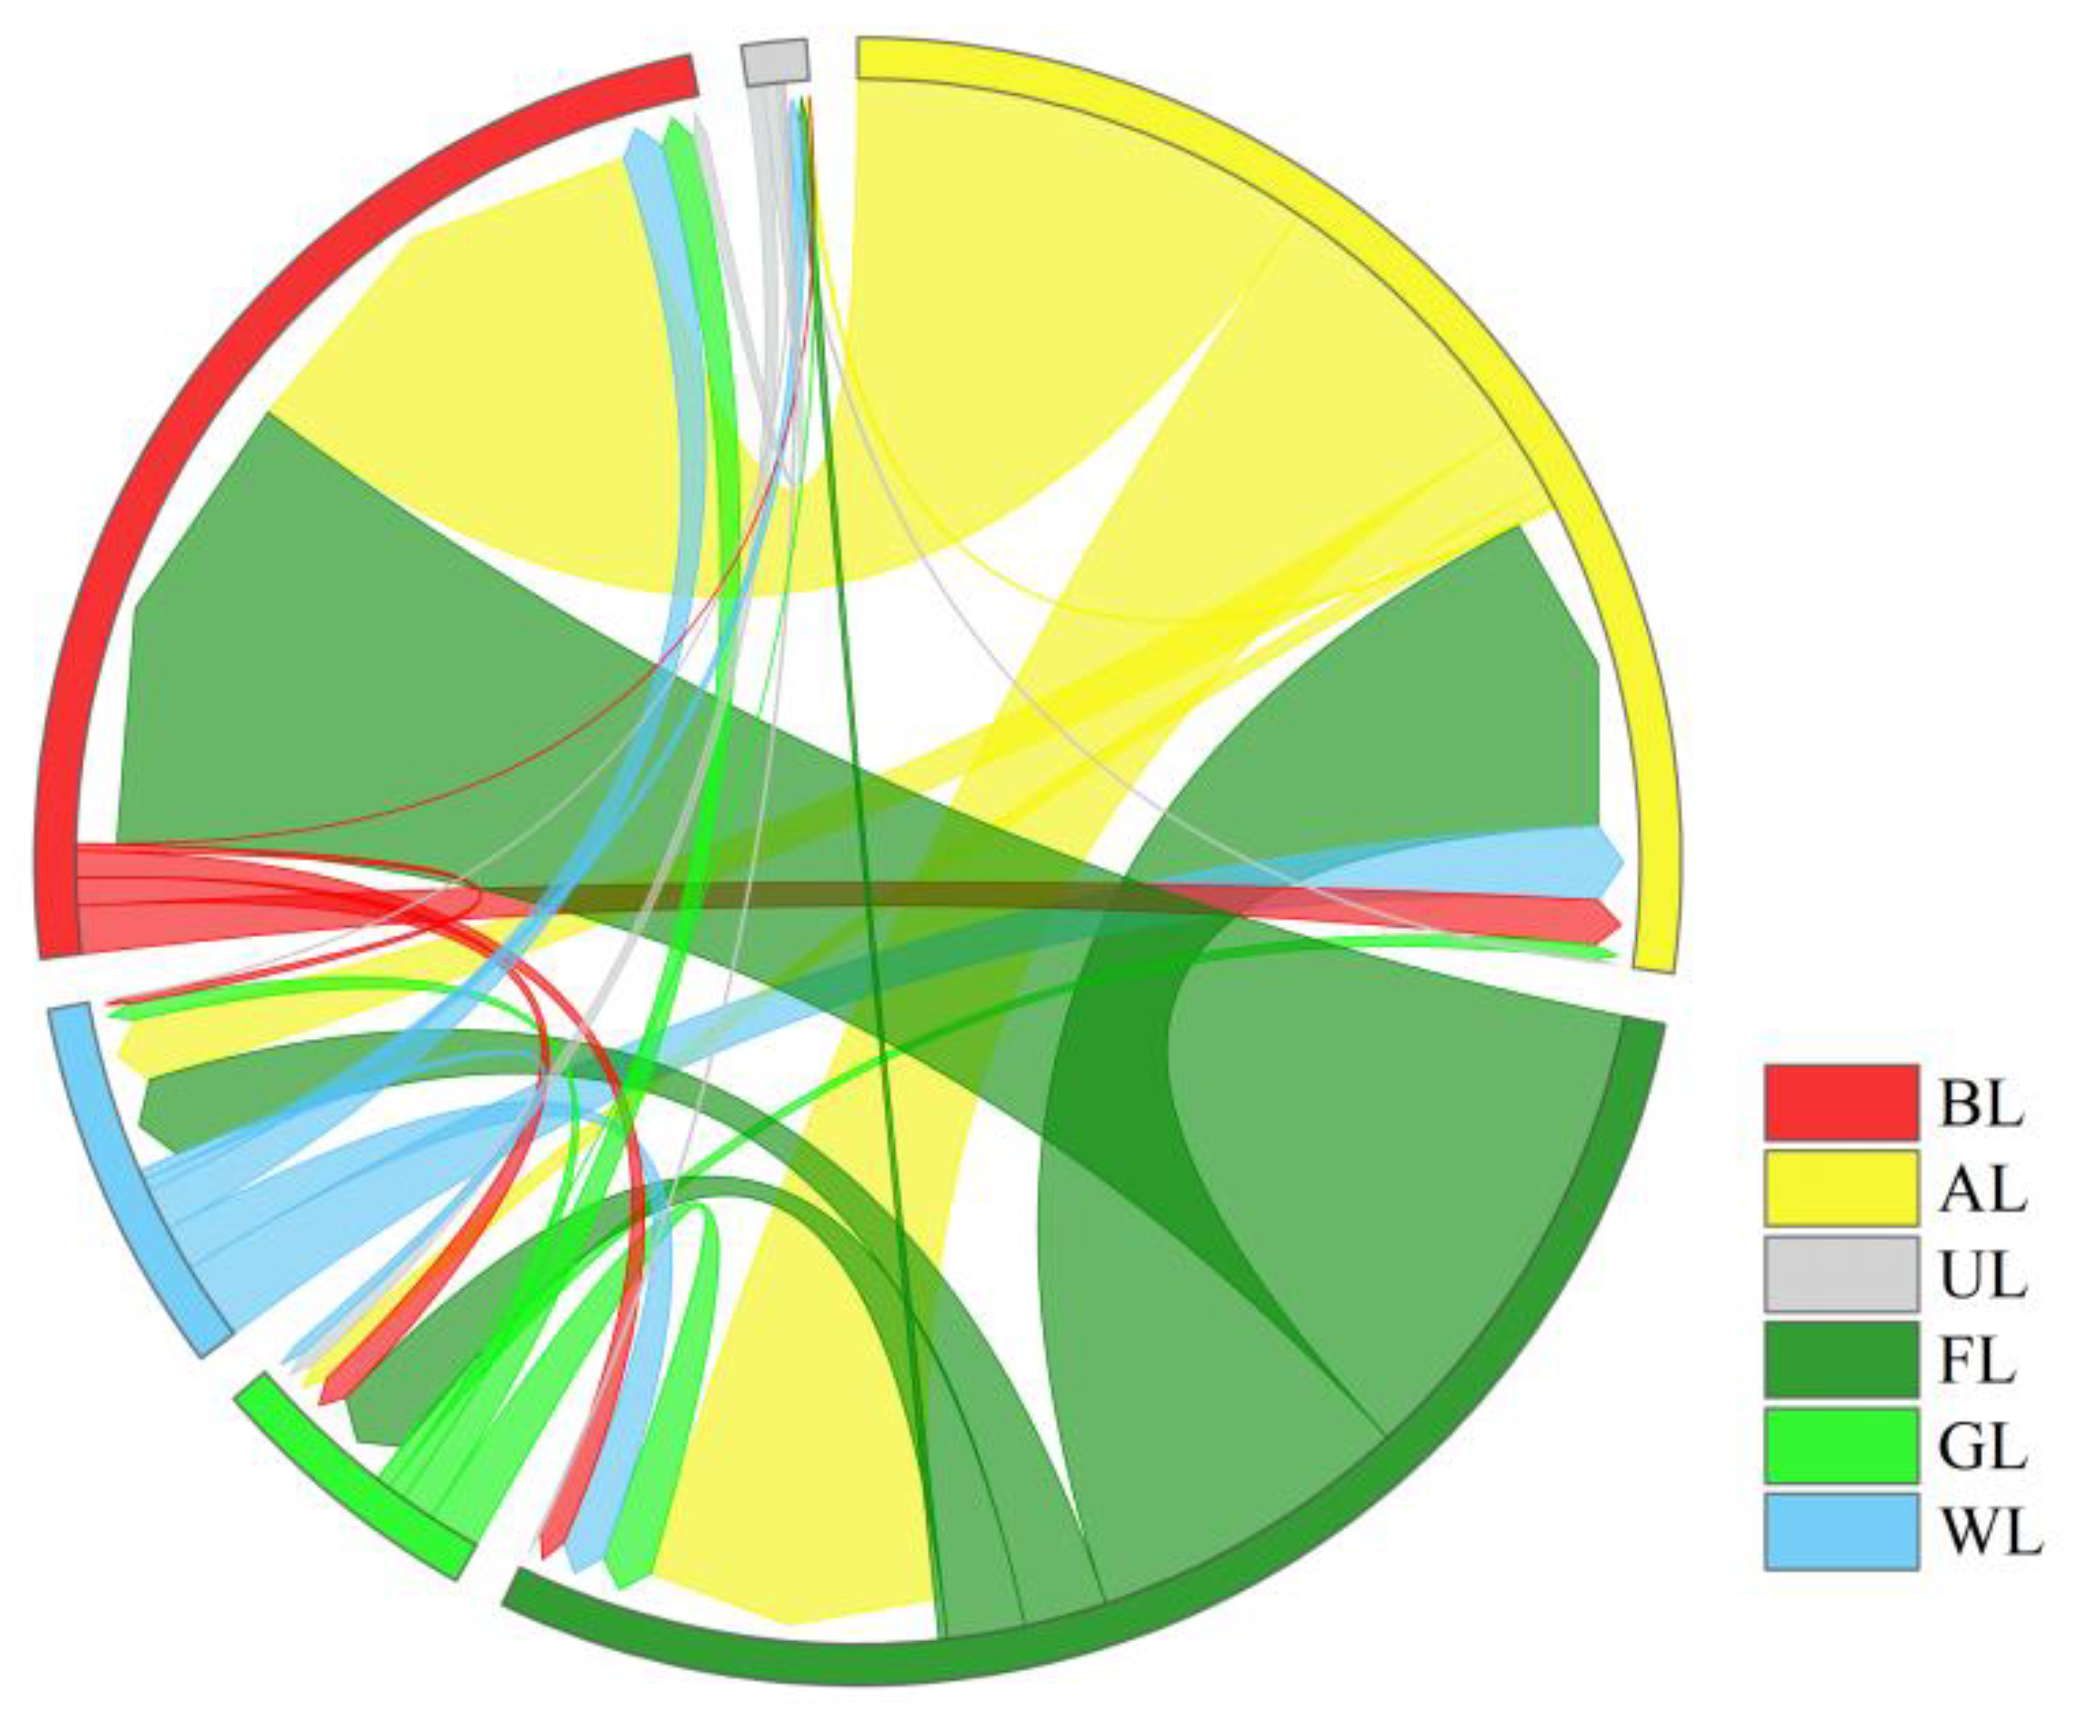
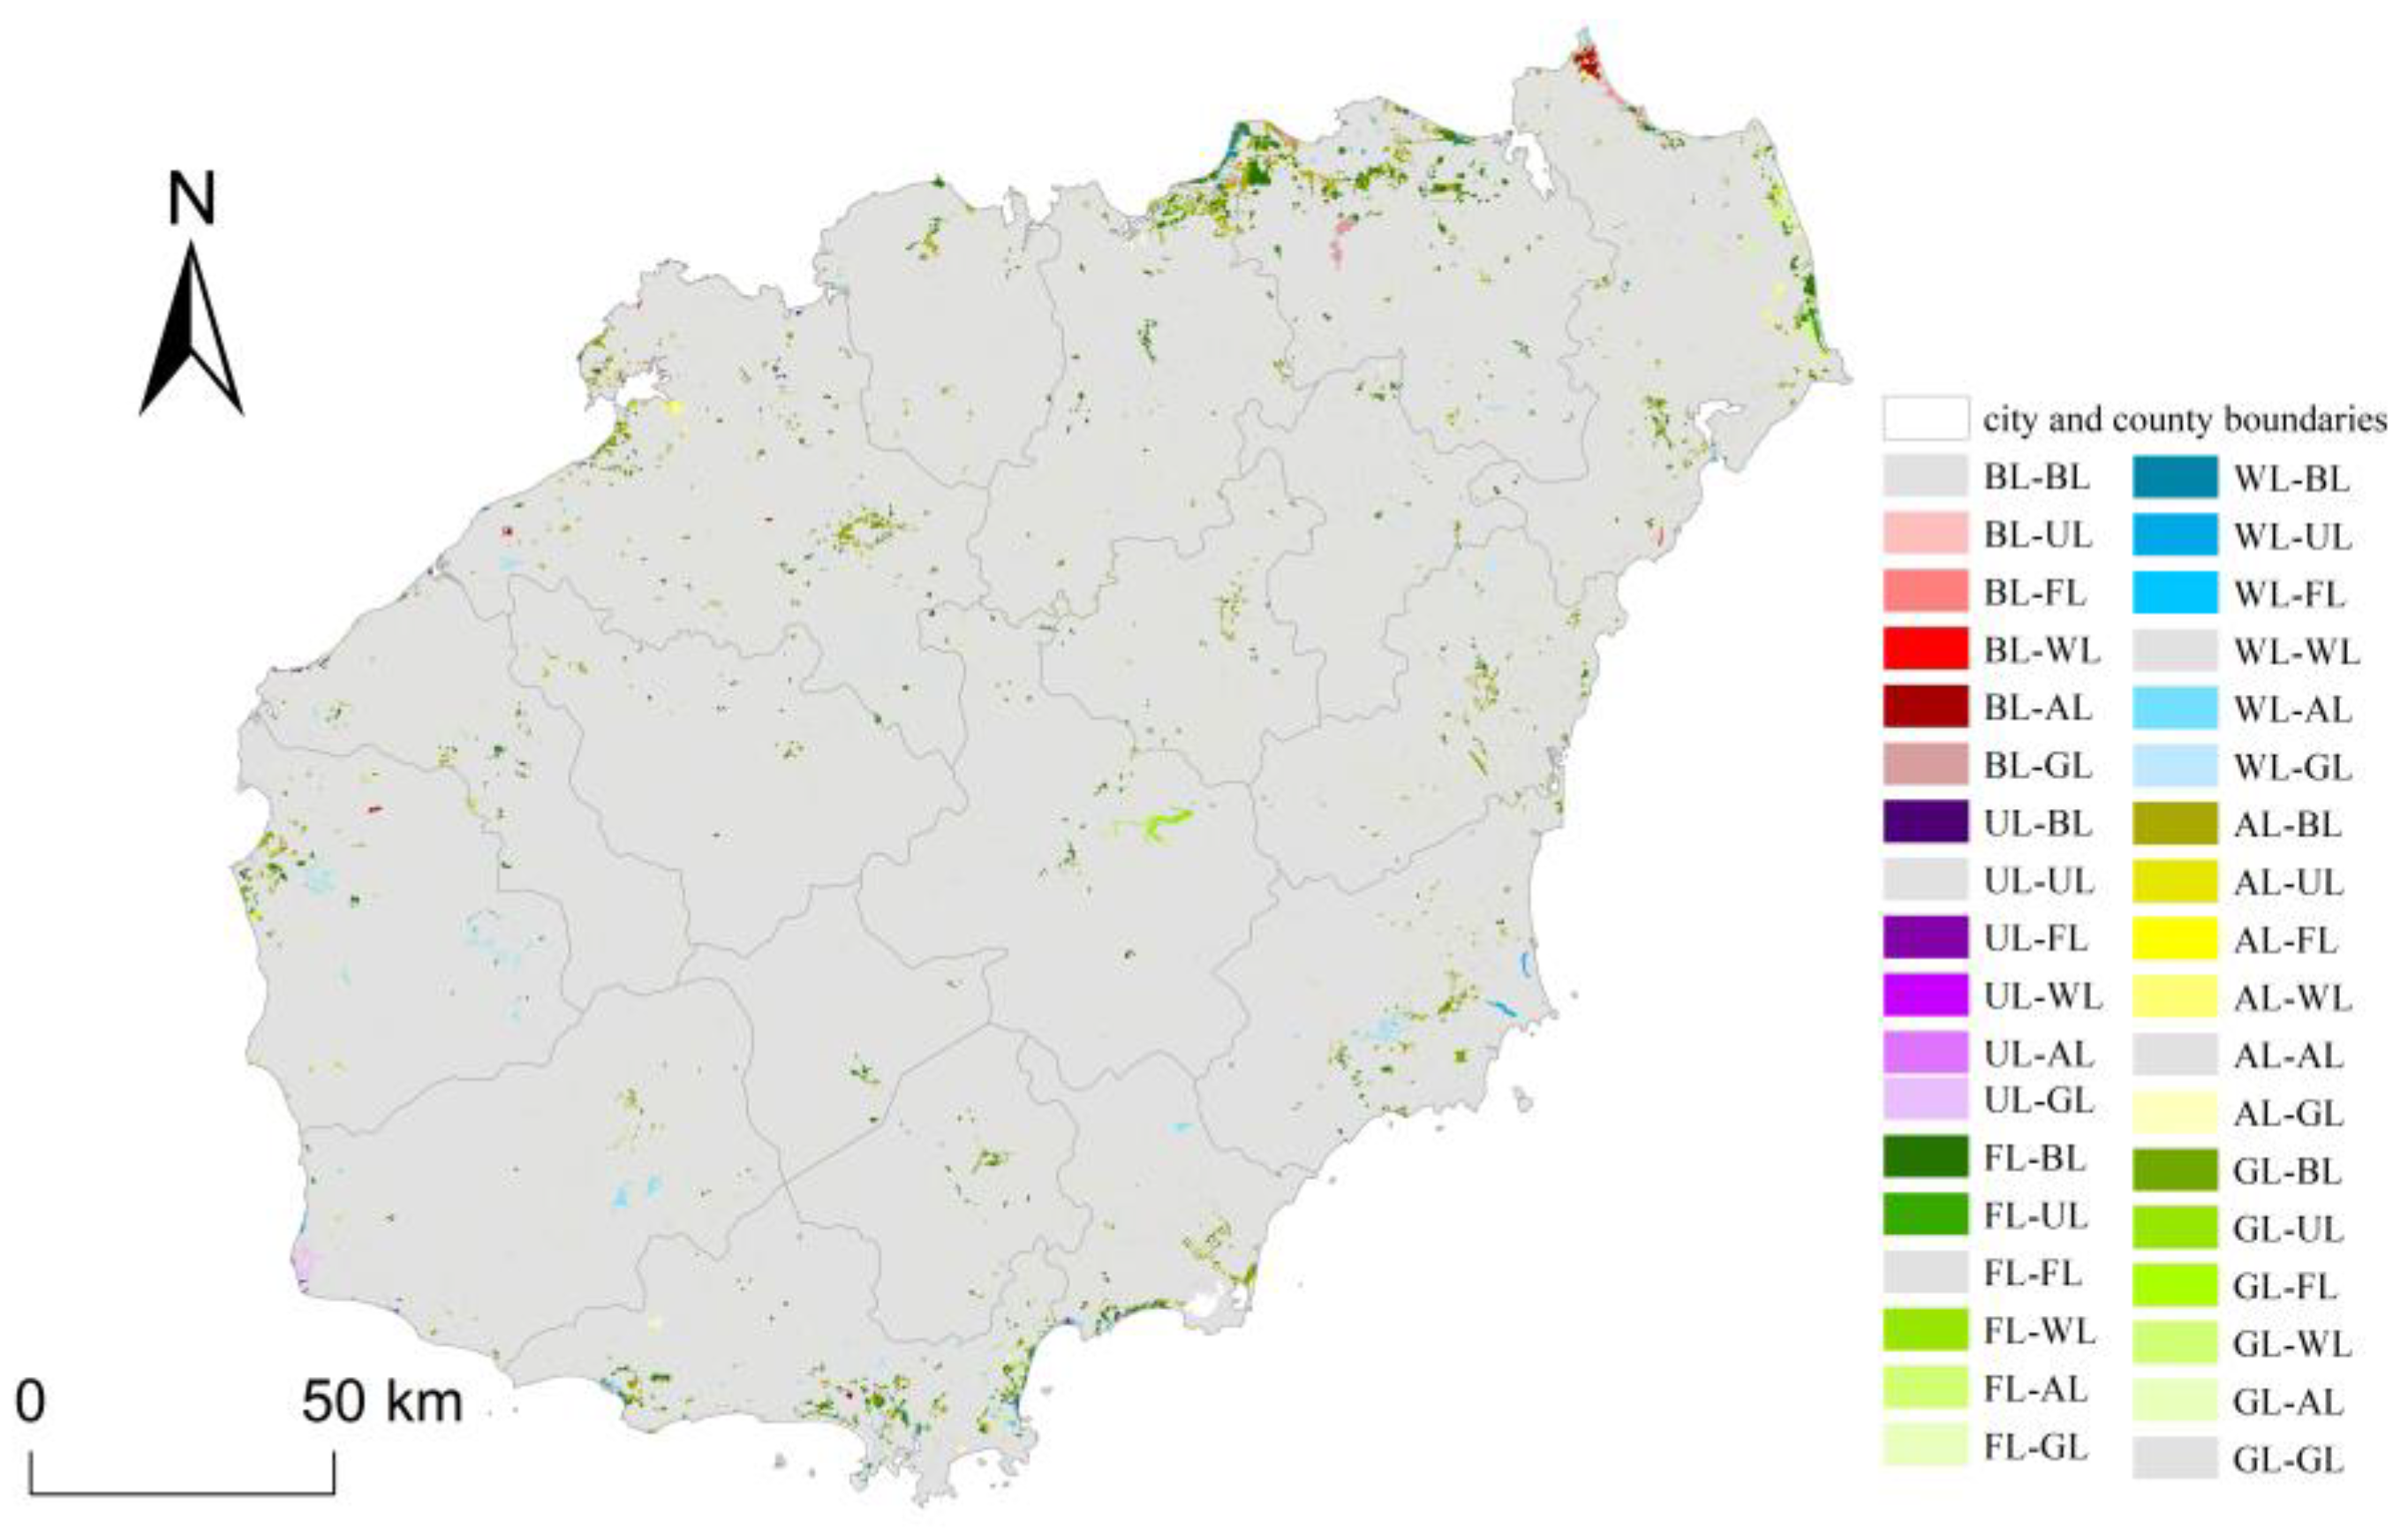


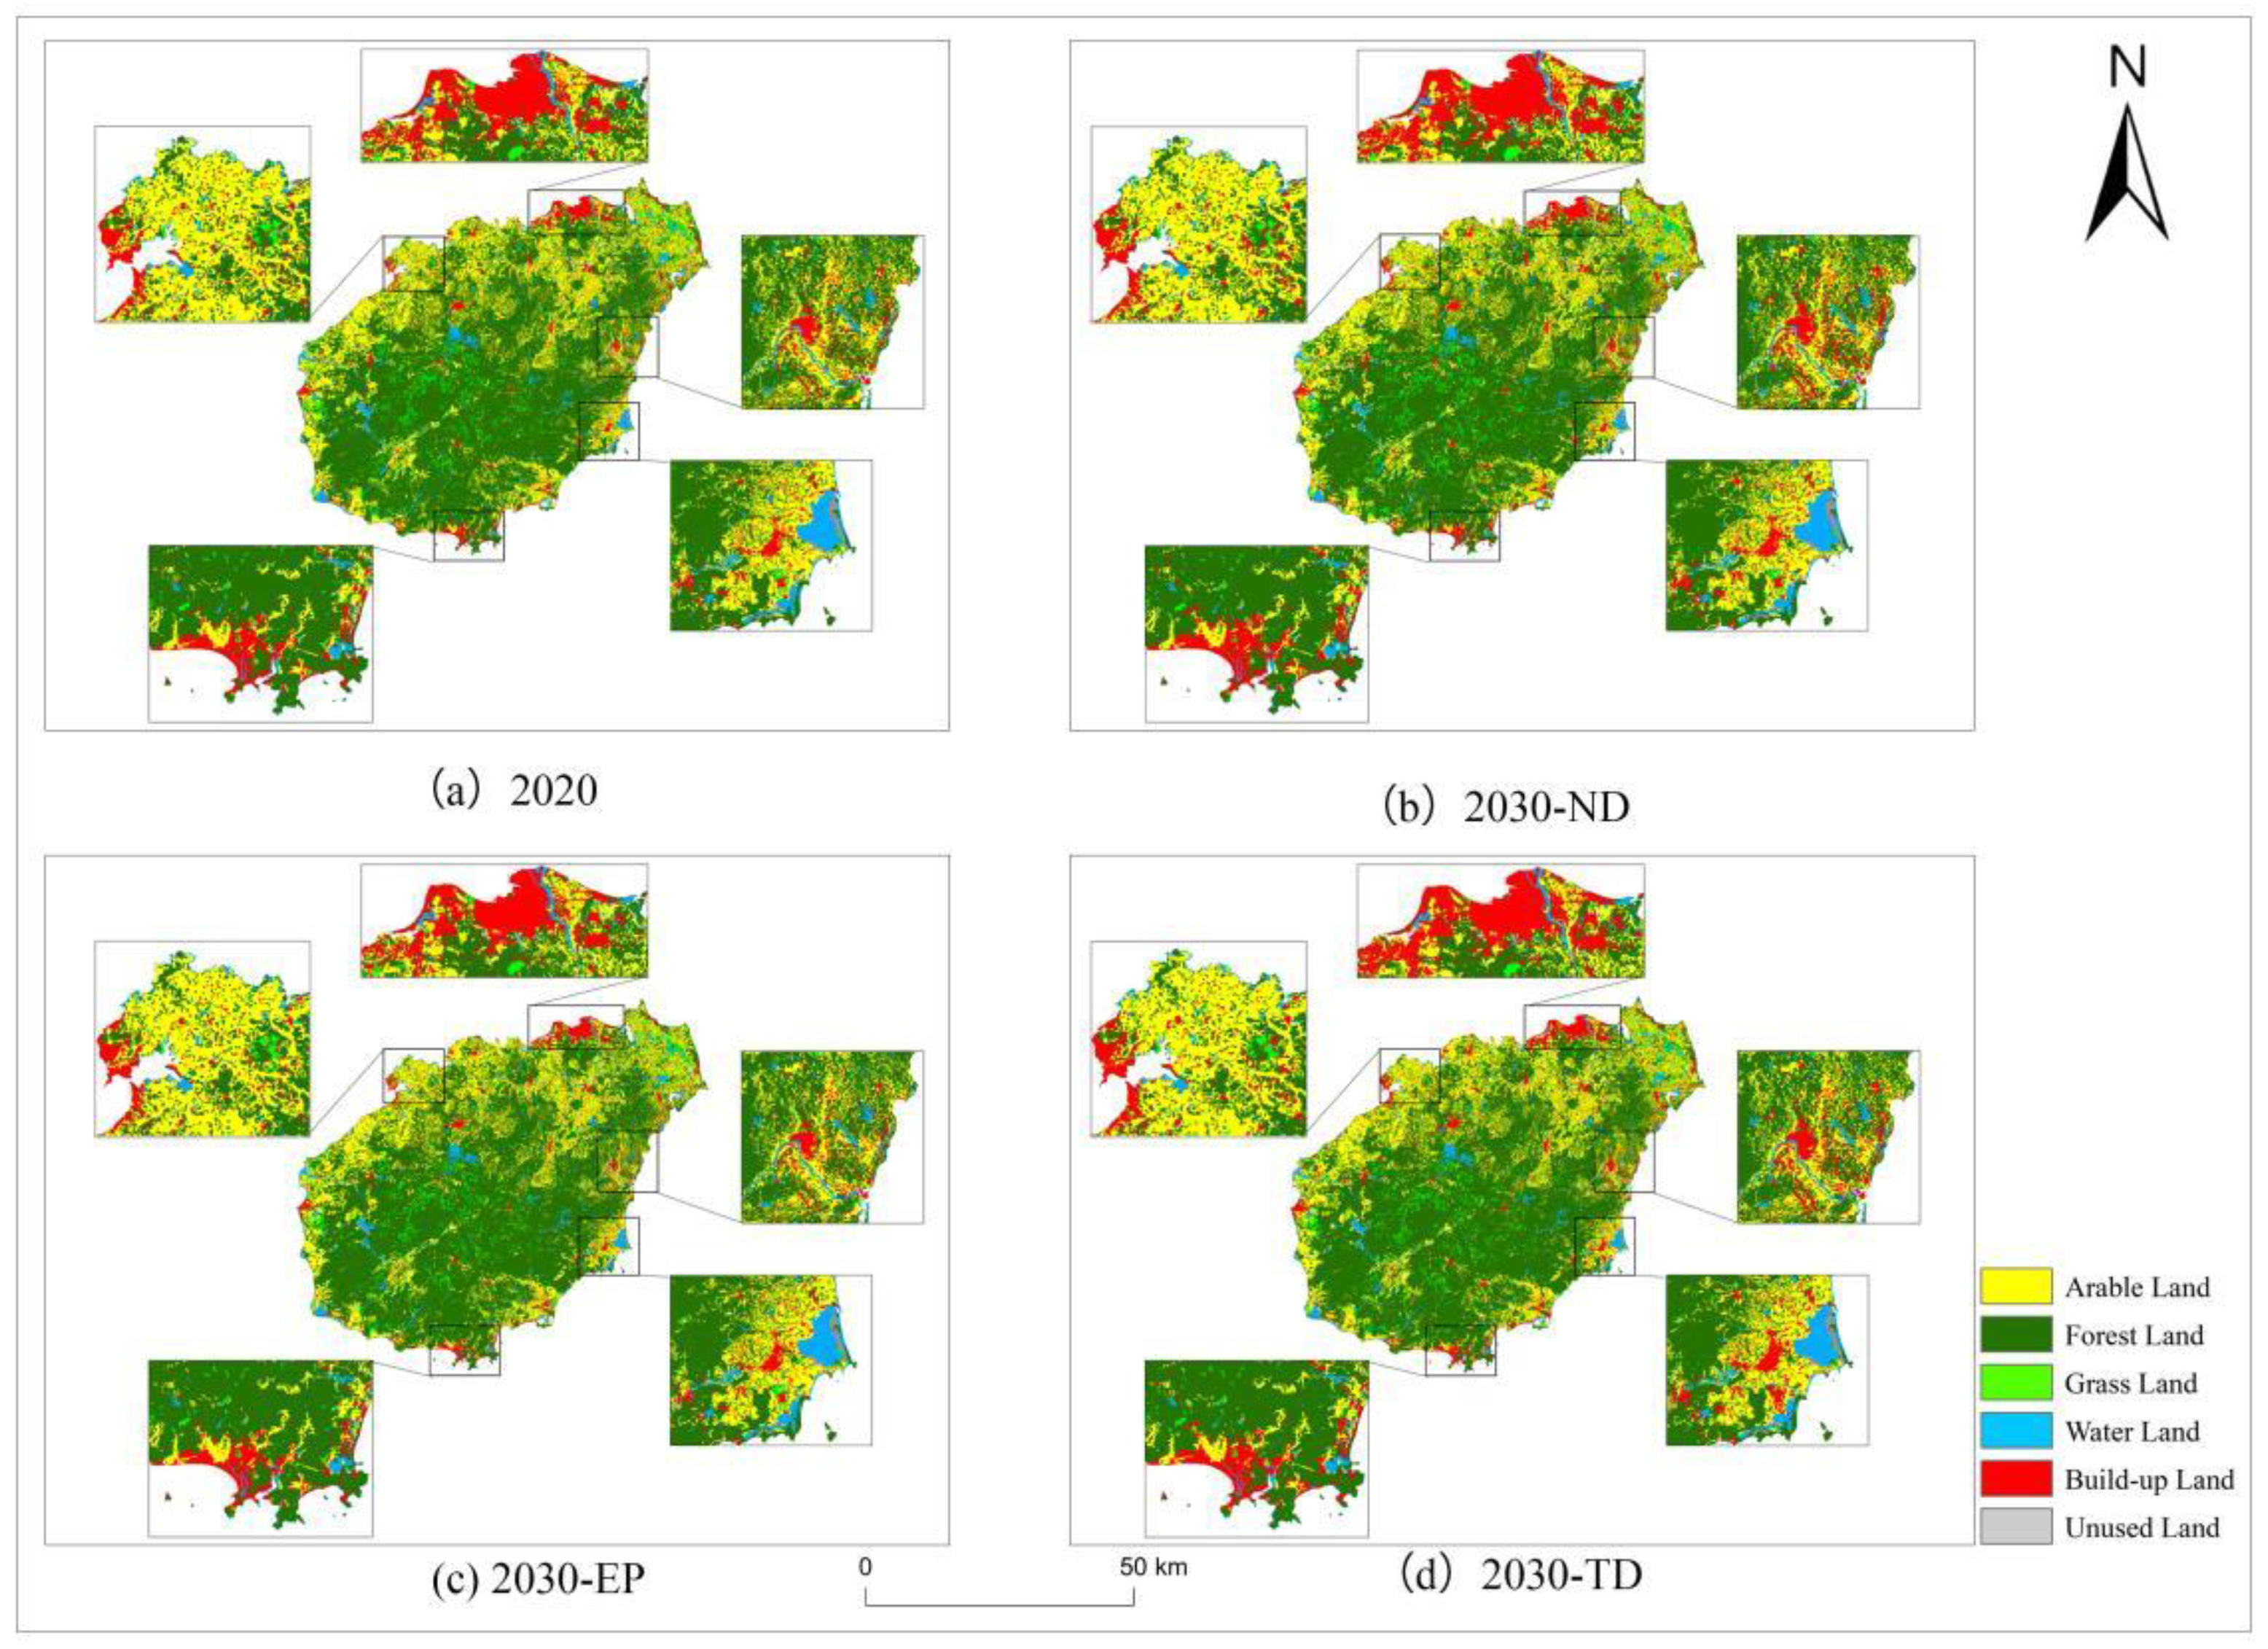
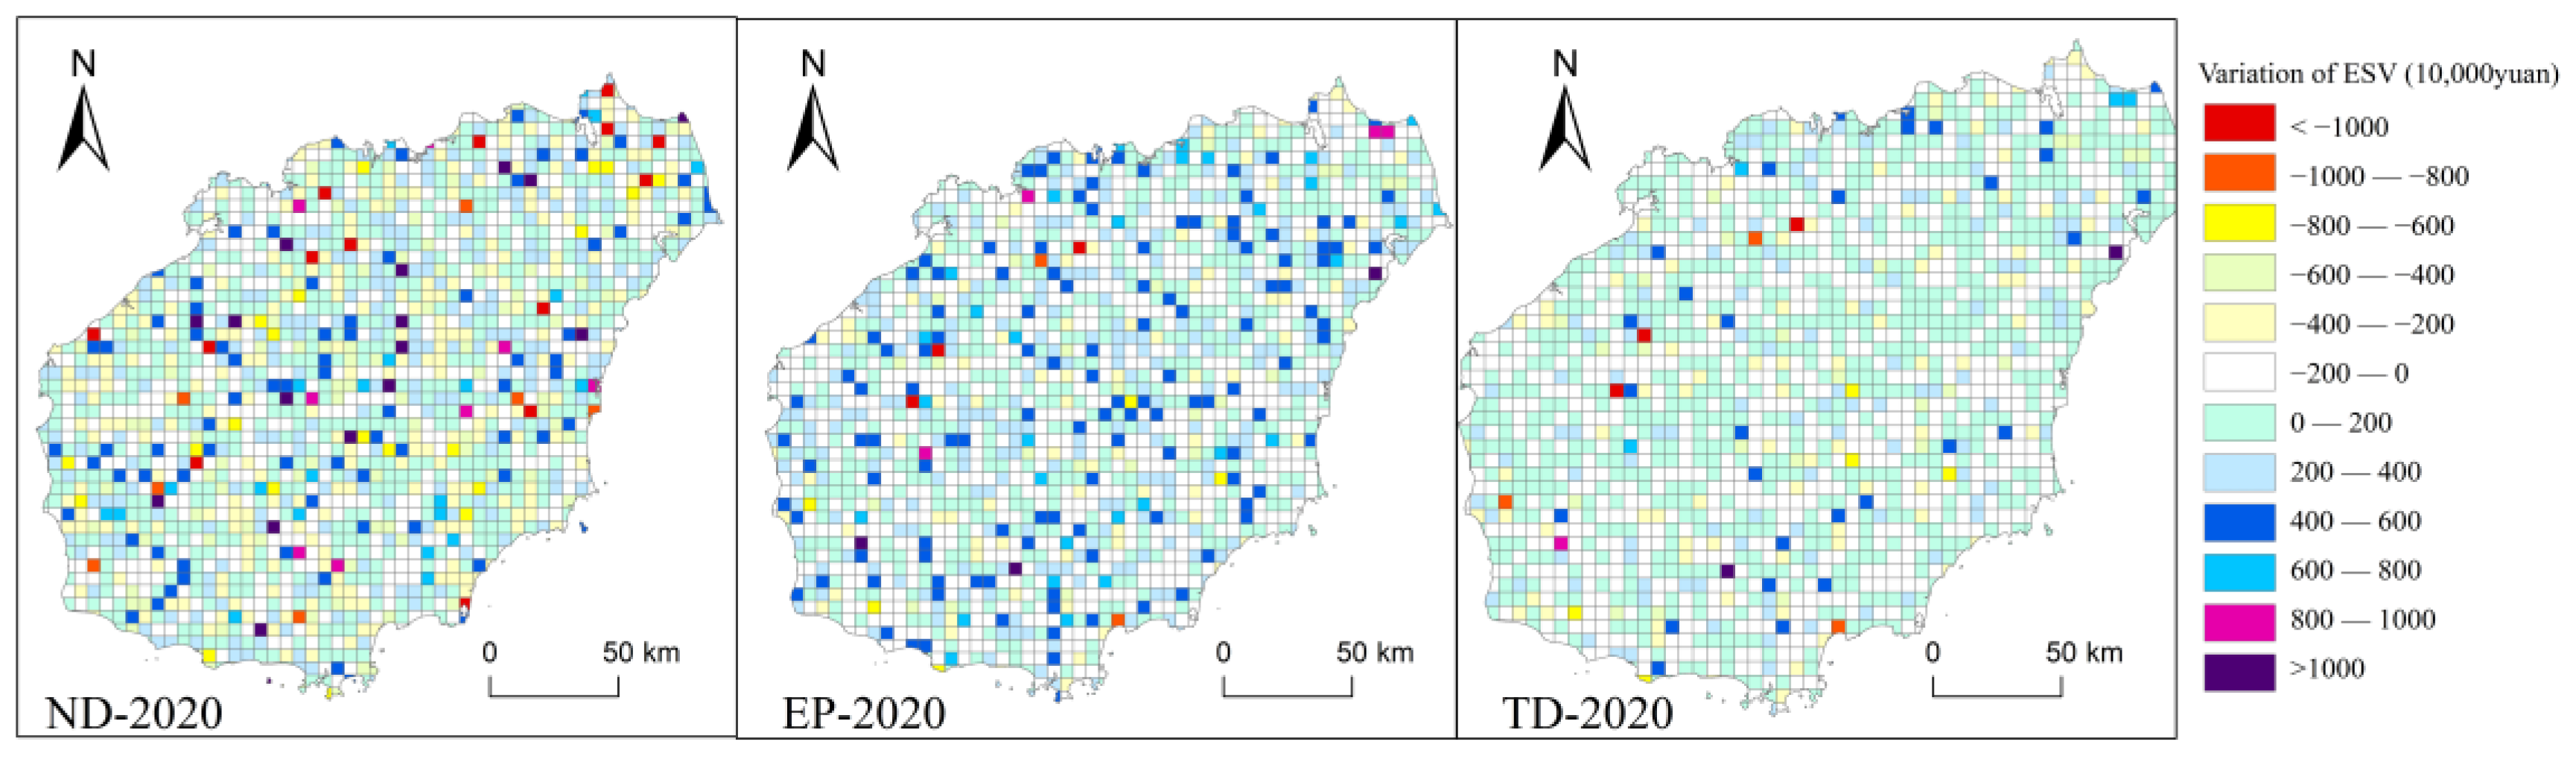
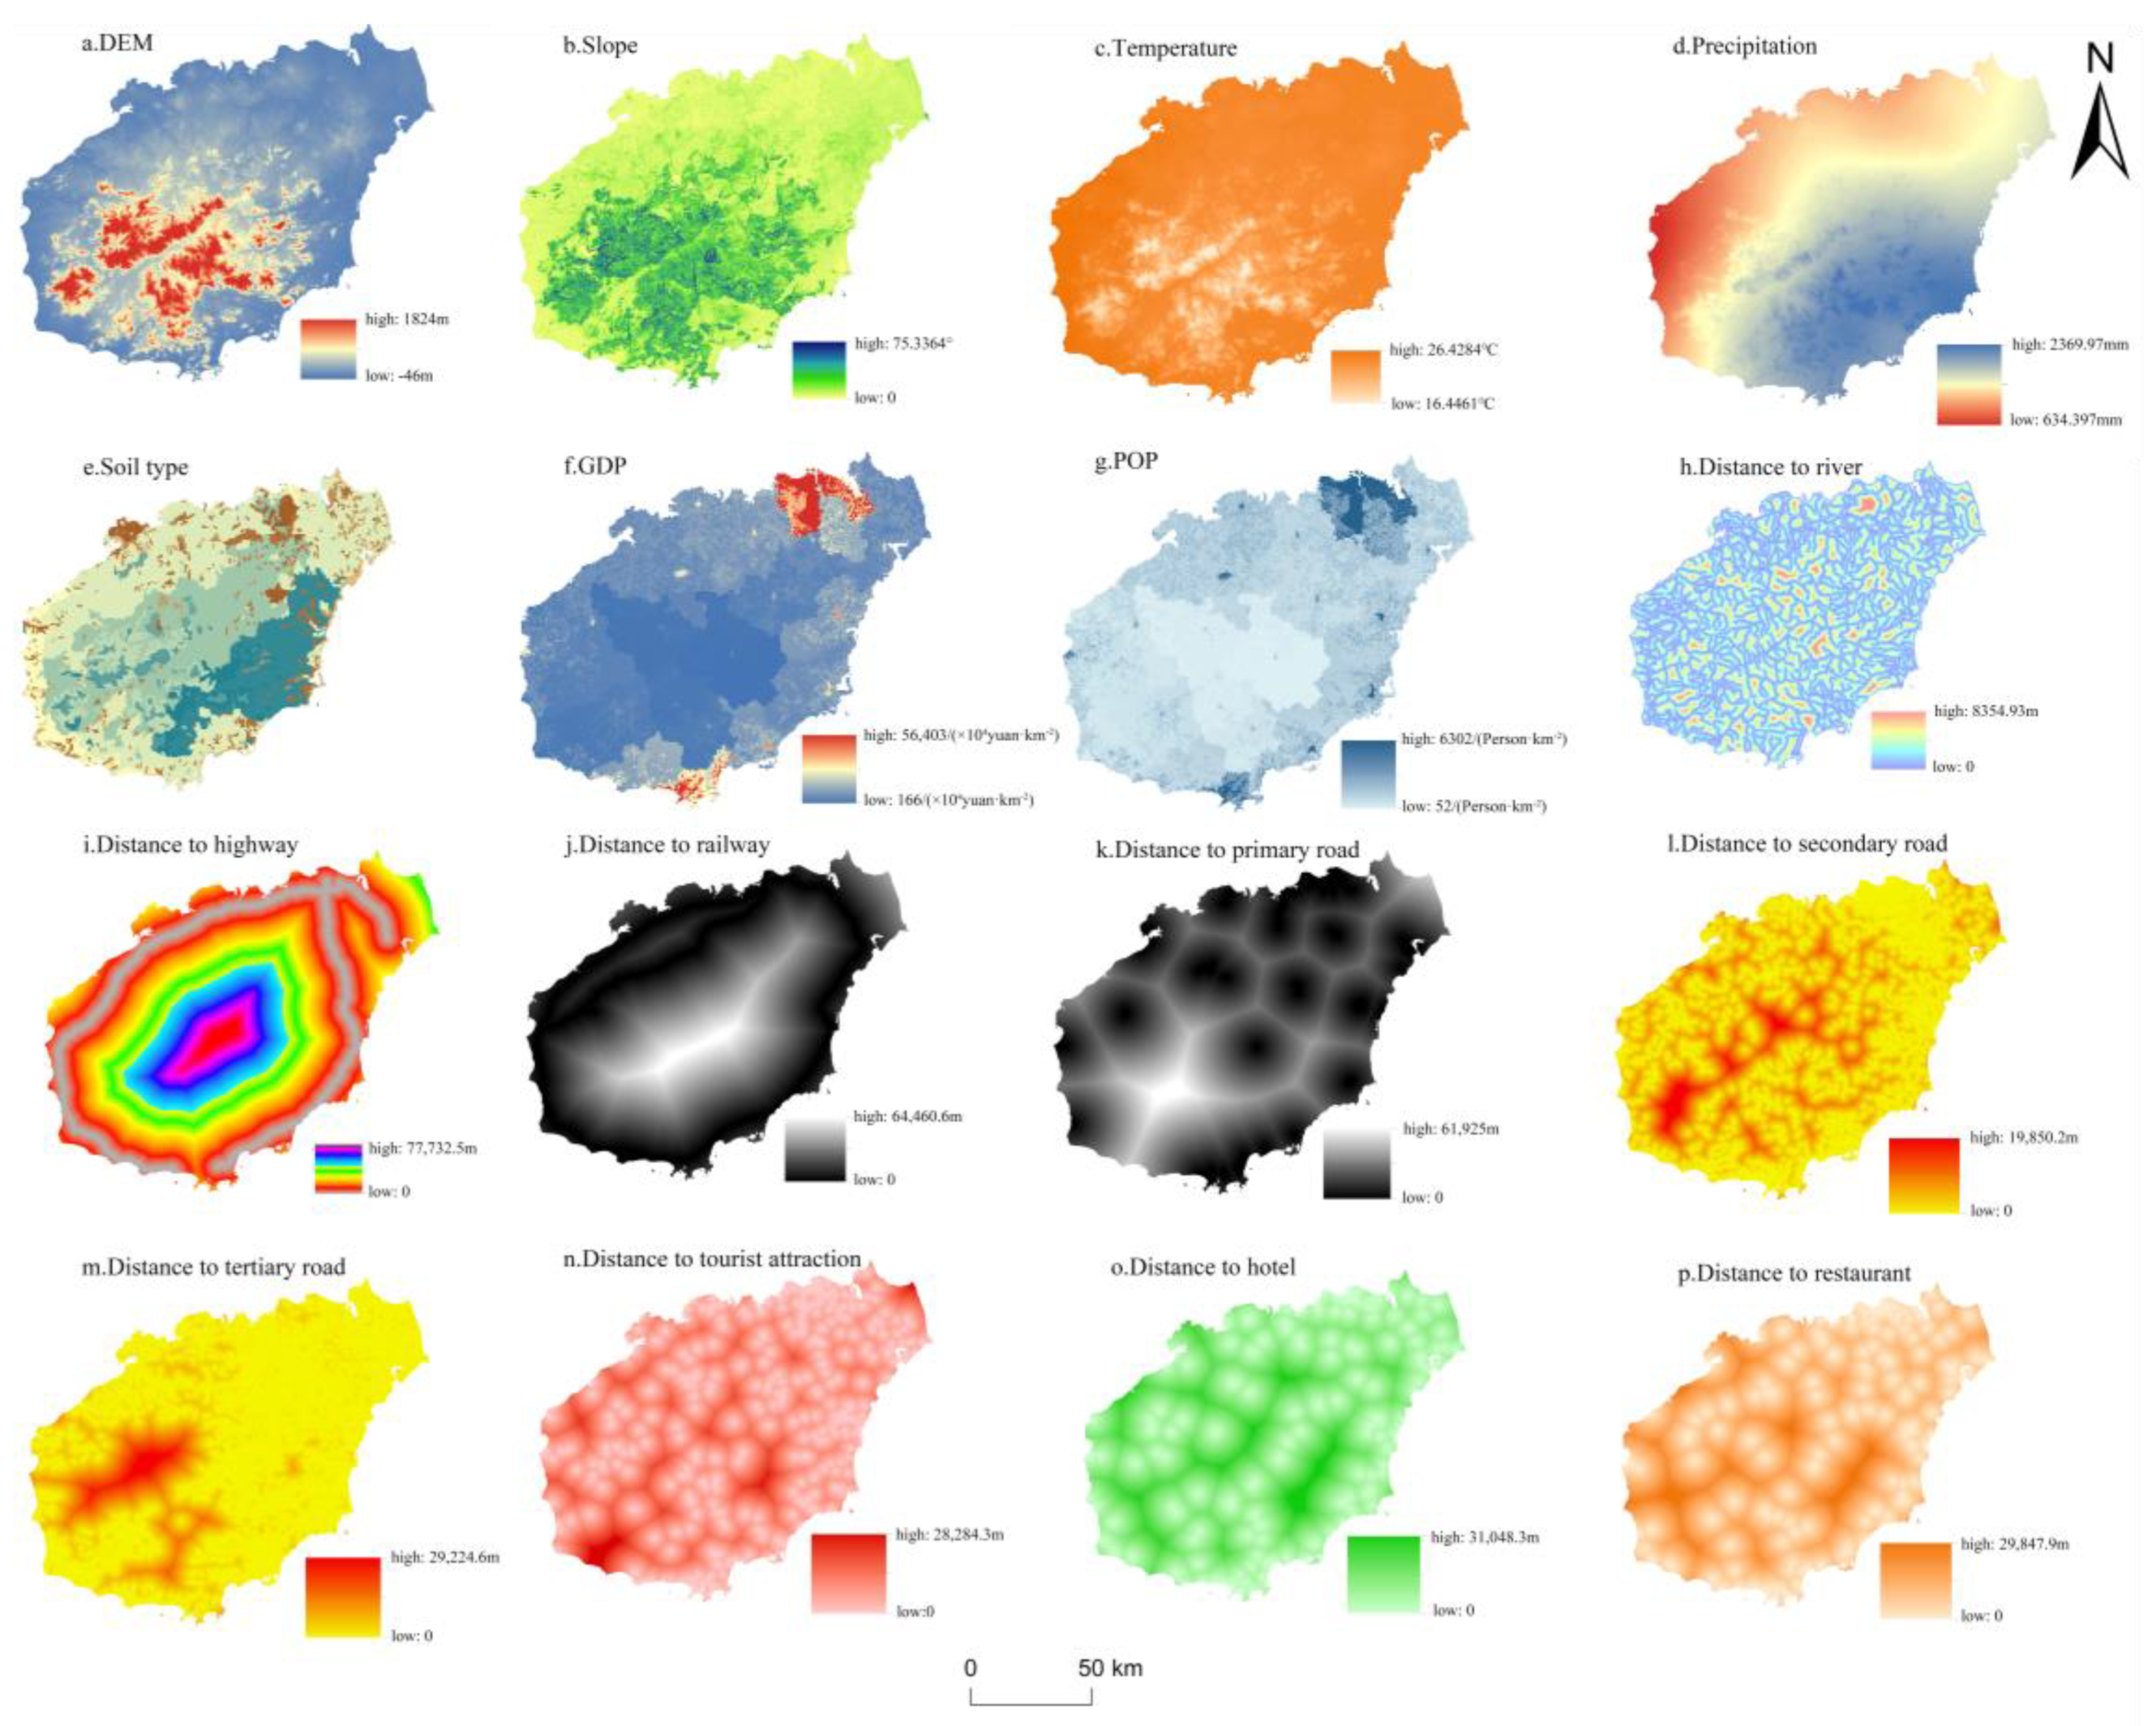
| Data Type | Data Name | Spatial Resolution | Data Sources |
|---|---|---|---|
| Land use | — | 30 m | http://www.resdc.cn, accessed on 10 July 2023 |
| Natural environment | DEM | 30 m | https://www.gscloud.cn, accessed on 10 July 2023 |
| Slope | 30 m | Calculated using DEM using ArcGIS 10.7 | |
| Temperature | 1000 m | http://www.Resdc.cn, accessed on 10 July 2023 | |
| Precipitation | 1000 m | http://www.Resdc.cn, accessed on 10 July 2023 | |
| Soil type | 1000 m | http://www.Resdc.cn, accessed on 10 July 2023 | |
| Social economy | GDP | 1000 m | http://www.Resdc.cn, accessed on 11 July 2023 |
| POP | 1000 m | http://www.Resdc.cn, accessed on 11 July 2023 | |
| Accessibility | Road, rail, and river vector data | — | http://www.webmap.cn, accessed on 11 July 2023 |
| Tourism | Tourist attraction | — | Amap |
| Hotel | — | Amap | |
| Restaurant | — | Amap | |
| Statistical data | Grain production per-unit area | — | Hainan Province Statistical Yearbook China Agricultural Statistical Yearbook |
| Crop planting area | — | Hainan Province Statistical Yearbook China Agricultural Statistical Yearbook |
| Efficiency Coefficient | Arable Land | Forest Land | Grass Land | Water Land | Built-up Land | Unused Land |
|---|---|---|---|---|---|---|
| Economic efficiency coefficient | 1.85 | 0.07 | 4.05 | 5.53 | 46.88 | 0 |
| Ecological efficiency coefficient | 6.00 | 50.86 | 2.02 | 13.13 | 0 | 0.01 |
| Primary Functions | Secondary Functions | ESV Coefficient | |||||
|---|---|---|---|---|---|---|---|
| Arable Land | Forest Land | Grass Land | Water Land | Unused Land | Total | ||
| Provisioning services | Food production | 1197.93 | 302.39 | 337.28 | 767.61 | 11.63 | 2616.84 |
| Raw material supply | 2663.36 | 697.82 | 500.11 | 430.32 | 34.89 | 4326.51 | |
| Water resource supply | −1058.37 | 360.54 | 279.13 | 6326.94 | 23.26 | 5931.50 | |
| Regulating services | Gas regulation | 953.69 | 2302.82 | 1756.19 | 1558.47 | 127.93 | 6699.11 |
| Climate regulation | 500.11 | 6885.20 | 4652.16 | 3430.97 | 116.30 | 15,584.74 | |
| Purify the environment | 139.56 | 2012.06 | 1535.21 | 5326.72 | 360.54 | 9374.10 | |
| Hydrological regulation | 1314.24 | 4500.96 | 3407.71 | 73,550.65 | 244.24 | 83,017.80 | |
| Supporting services | Soil retention | 779.24 | 2802.93 | 2139.99 | 1884.12 | 151.20 | 7757.48 |
| Maintaining nutrient cycles | 162.83 | 209.35 | 162.83 | 151.20 | 11.63 | 697.82 | |
| Biodiversity | 186.09 | 2547.06 | 1942.28 | 6059.44 | 139.56 | 10,874.42 | |
| Cultural services | Esthetic Landscape | 81.41 | 1116.52 | 860.65 | 3849.66 | 58.15 | 5966.40 |
| Total | 6920.09 | 23,737.65 | 17,573.53 | 103,336.10 | 1279.34 | — | |
| Land Use Types | Arable Land | Forest Land | Grass Land | Water Land | Built-Up Land | Unused Land | |
|---|---|---|---|---|---|---|---|
| 2010 | Area (km2) | 8876.33 | 21,724.03 | 1133.28 | 1280.02 | 898.24 | 96.76 |
| Proportion | 26.10% | 63.88% | 3.33% | 3.76% | 2.64% | 0.28% | |
| 2020 | Area (km2) | 8671.36 | 21,426.18 | 1152.15 | 1270.94 | 1395.37 | 88.86 |
| Proportion | 25.50% | 63.01% | 3.39% | 3.74% | 4.10% | 0.26% | |
| Area change from 2010 to 2020 (km2) | −204.98 | −297.85 | 18.87 | −9.08 | 497.13 | −7.90 | |
| Area change rate from 2010 to 2020 | −2.31% | −1.37% | 1.67% | −0.71% | 55.35% | −8.16% | |
| Land Use Types | Land Use Status in 2020 | Natural Development | Ecological Protection Priority | Tourism Development Priority | ||||
|---|---|---|---|---|---|---|---|---|
| Area (km2) | Proportion | Area (km2) | Proportion | Area (km2) | Proportion | Area (km2) | Proportion | |
| Arable land | 8671.36 | 25.50% | 8488.52 | 24.96% | 8488.52 | 24.96% | 8488.52 | 24.96% |
| Forest land | 21,426.18 | 63.01% | 21,140.95 | 62.17% | 21,599.35 | 63.52% | 21,314.5 | 62.68% |
| Grass land | 1152.15 | 3.39% | 1176.81 | 3.46% | 1036.94 | 3.05% | 1036.94 | 3.05% |
| Water land | 1270.94 | 3.74% | 1265.16 | 3.72% | 1265.16 | 3.72% | 1270.94 | 3.74% |
| Built-up land | 1395.37 | 4.10% | 1850.69 | 5.44% | 1534.91 | 4.51% | 1813.98 | 5.33% |
| Unused land | 88.86 | 0.26% | 82.72 | 0.24% | 79.97 | 0.24% | 79.97 | 0.24% |
| Total | 34,004.85 | 100.00% | 34,004.85 | 100.00% | 34,004.85 | 100.00% | 34,004.85 | 100.00% |
| Land Use Types | 2020 | 2030 | ||
|---|---|---|---|---|
| Natural Development | Ecological Protection Priority | Tourism Development Priority | ||
| Arable land | 6000.65 | 5874.13 | 5874.13 | 5874.13 |
| Forest land | 50,860.71 | 50,183.64 | 51,271.77 | 50,595.61 |
| Grass land | 2024.73 | 2068.07 | 1822.27 | 1822.27 |
| Water land | 13,133.41 | 13,073.67 | 13,073.67 | 13,133.40 |
| Unused land | 11.37 | 10.58 | 10.23 | 10.23 |
| Total | 72,030.88 | 71,210.09 | 72,052.07 | 71,435.64 |
Disclaimer/Publisher’s Note: The statements, opinions and data contained in all publications are solely those of the individual author(s) and contributor(s) and not of MDPI and/or the editor(s). MDPI and/or the editor(s) disclaim responsibility for any injury to people or property resulting from any ideas, methods, instructions or products referred to in the content. |
© 2024 by the authors. Licensee MDPI, Basel, Switzerland. This article is an open access article distributed under the terms and conditions of the Creative Commons Attribution (CC BY) license (https://creativecommons.org/licenses/by/4.0/).
Share and Cite
Yang, M.; Luo, J.; Zhu, L.; Lu, P. Impact of Land Use Change on the Spatiotemporal Evolution of Ecosystem Services in Tropical Islands: A Case Study of Hainan Island, China. Land 2024, 13, 1244. https://doi.org/10.3390/land13081244
Yang M, Luo J, Zhu L, Lu P. Impact of Land Use Change on the Spatiotemporal Evolution of Ecosystem Services in Tropical Islands: A Case Study of Hainan Island, China. Land. 2024; 13(8):1244. https://doi.org/10.3390/land13081244
Chicago/Turabian StyleYang, Mingjia, Jiabao Luo, Lirong Zhu, and Peng Lu. 2024. "Impact of Land Use Change on the Spatiotemporal Evolution of Ecosystem Services in Tropical Islands: A Case Study of Hainan Island, China" Land 13, no. 8: 1244. https://doi.org/10.3390/land13081244
APA StyleYang, M., Luo, J., Zhu, L., & Lu, P. (2024). Impact of Land Use Change on the Spatiotemporal Evolution of Ecosystem Services in Tropical Islands: A Case Study of Hainan Island, China. Land, 13(8), 1244. https://doi.org/10.3390/land13081244