


Abstract
Temporal changes in the bird community of an agricultural landscape in northeast Germany were analysed covering three different analytical foci (landscape-wide, habitat types, sample plots) and two aggregation levels of bird observation data (whole bird community, bird guilds). The analyses are based on a systematic data sampling over two multi-year campaigns (1999–2002; 2013–2015). Our analyses address the question of how changes in the occurrences of agricultural birds (numbers of species and of individuals) at local spots manifest themselves in the landscape as a whole. By summarizing all findings concerning single variables (number of species, observation frequencies, abundances, different habitat types, bird guilds), a dramatic, systematic decline of the bird community at sample plots was discovered between the campaigns, which is not yet recognisable across the whole landscape in terms of species richness. Furthermore, we found that landscape-wide, the birds’ use of habitat changed; the variability between single sample plots increased strongly and most species occurred at fewer sample plots over the whole landscape. Obviously, sample plots with high bird occurrences are becoming more relevant for maintaining bird communities over the whole landscape. Bird community composition changed significantly within the observation period.
1. Introduction
The loss of global biodiversity is well documented in various studies worldwide. Projections of future development predict further declines [1]. Agricultural land use is considered particularly harmful for biodiversity, as indicated by the strongly shrinking populations of typical species in agricultural landscapes.
Although the trends have been clearly documented, the list of possible drivers related to agriculture is long, often summarised as “intensive land use”, comprising, for example, increasing field sizes, decline of field edges, and less crop diversity [2,3]. Plant breeding and the use of pesticides and fertilisers have led to high-yield crops with dense vegetation cover, often with poorer habitat quality for farmland birds [4]. Connected to this, the abundance of food resources for birds, such as arthropods, has declined in agricultural areas [5,6]. While each of these factors may contribute individually to biodiversity decline, it is obvious that many of these factors act simultaneously [7].
As the relevance of the individual drivers of agricultural change and their mutual interactions are landscape-specific [8], countermeasures must, obviously, be adapted to the specific landscape situation. Agricultural landscapes are characterised by the composition and configuration of habitat types, including settlements, forest patches, ponds, and other non-used ecosystems, embedded in the landscape matrix of arable land and grassland areas. Birds occupy all these habitat types, and therefore the bird community of an agricultural landscape can be seen as composed of sub-communities, each with a propensity for specific habitat types.
Therefore, any approach to characterize the bird biodiversity of a landscape should allow for the detection of changes over time, and from different analytical foci. Conservation efforts will only be successful if change processes can be related to the relevant spatial and temporal scales and their respective driving forces [9].
Birds are reported to be reliable indicators for the biodiversity of landscapes. The occurrence of bird species and the abundance of individuals are intimately related to landscape structure and land use [10]. Their habitat requirements are well known, they occur in practically all habitats across the landscape, can be observed by applying standard methods, and are comparably simple detectable by sight or sound. The presence or absence of bird species (occurrence) indicates the habitat diversity within a landscape, while the number of individuals (abundance) indicates how intensively the habitats are used by the bird species. Together, occurrence and abundance data can be regarded as an indication of the real habitat suitability and use.
One important limitation of bird studies for landscape-related interpretations arises when the focus is only on a single species. Habitats that seem unimportant to the species in question within the study area may be ignored, limiting the transferability of the results to other landscape settings [11] or species. The “bird guild” approach, which aggregates species with similar habitat requirements, allows for a more holistic assessment of bird communities and has been successfully applied in many studies [12].
Therefore, the aims of this study were twofold: to detect and analyse changes in bird species occurrence and abundance between two multi-year observation campaigns covering a 17-year period in a typical agricultural landscape in northern Central Europe, and to demonstrate how changes in the occurrence of agricultural birds (numbers of species and of individuals) at local spots manifests themselves in the landscape as a whole.
Analyses of the data were intended to describe temporal and structural changes on different analytical foci and aggregation levels of bird observation data, and focused on four research questions (RQs):
- Changes across the landscape: “How do changes at individual sample plots affect species occurrence and abundance across the entire landscape?”
- Habitat type-specific changes: “Are there differences between the sample plots dominated by different habitat types?”
- Bird guild-specific changes: “How have different bird guilds been affected by temporal changes?”
- Changes in bird community composition: “Did the temporal changes affect the bird community composition?”
2. Materials and Methods
2.1. Study Area, Land Use and Climate
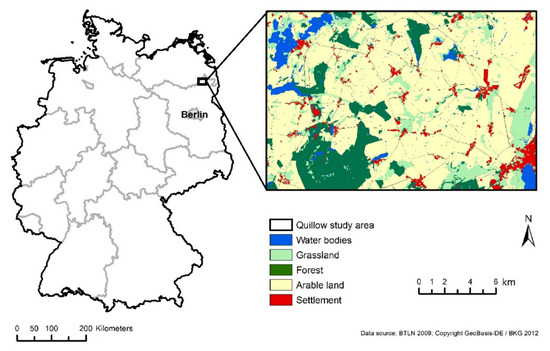
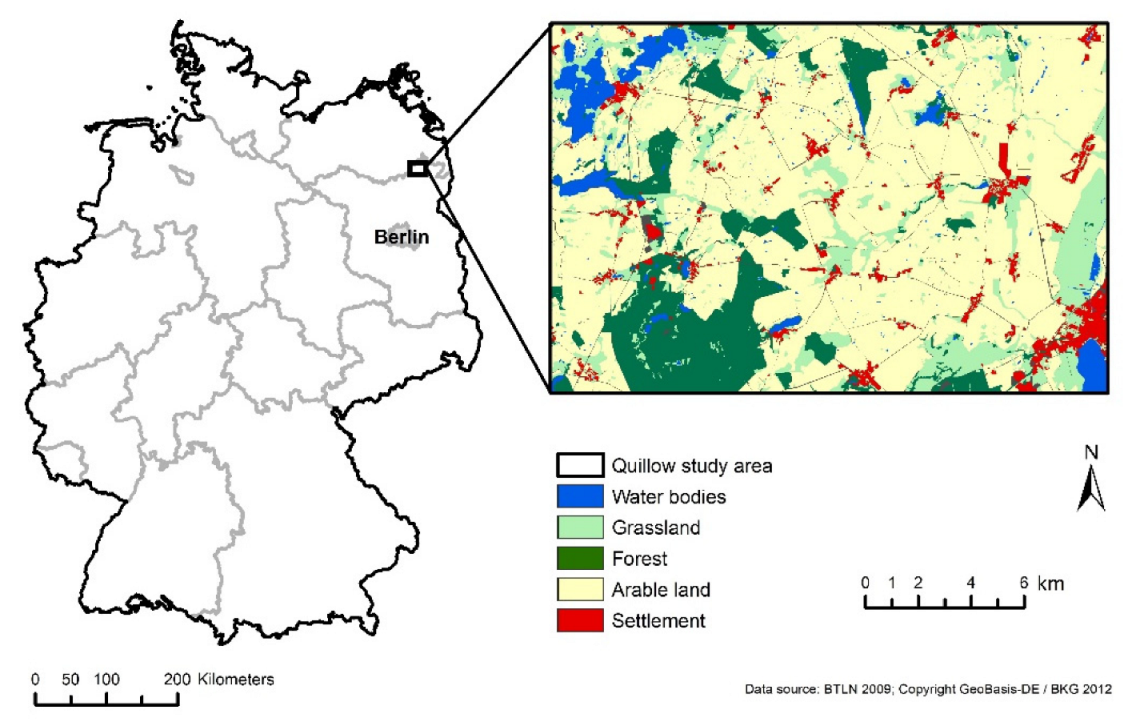
Systematic bird surveys were performed from 1999 to 2002 (“first campaign”) and from 2013 to 2015 (“second campaign”) within the “Quillow-AgroScapeLab”, located in the north-eastern part of the German lowlands (Figure 1). The area is 290 km2, the altitude ranges between 0–100 m above sea level. The landscape is of glacial origin and is characterised by a heterogeneous distribution of the following soil types: luvisols, arenosols, phaeozem, retisols, histosols, and planosols. A variety of habitat types, such as ponds, reeds, wet grasslands, and hilltops with dry grasslands or shrubs, is intertwined with agricultural fields. BirdLife International, a leading NGO in bird conservation, identified the region as one of Europe’s Important Bird and Biodiversity Areas (IBAs) [13].
Figure 1.
Location of the “Quillow-AgroScapeLab” study area in the northeast German lowlands.
Habitat mapping of the area, based on remote sensing, took place in 1995 and 2009 [14], shortly before our two survey campaigns. Based on these mappings the main habitat-type changes over time can be inferred (Table 1).
Table 1.
Changes in the main habitat types between the two observational campaigns; changes in percentage points (%).
Although the habitat classification key used in 2009 was slightly different to that deployed in 1995, the detected increase in arable land at the expense of cultivated grasslands is the obvious major change between the two observational campaigns.
The arable land in this area has medium to high yield potential (winter wheat yield between 7.0 and 9.5 t/ha). Land use is dominated by conventional farming; the average farm size is approximately 350 ha. Winter cereals (mostly wheat), silage maize, and oilseed rape are the dominant crops (Table S1 in the Supplementary Materials). Crop diversity decreased between the campaigns, indicated by the increased acreage of the three main crops (winter wheat, oil seeds, and silage maize).
The long-term (1992 to 2015) average temperature in the observation area was 8.6 °C and the average annual precipitation was 495 mm. The weather conditions in the two campaigns showed only slight differences: two years of the first campaign (2000 and 2002) were slightly warmer than the long-term average; in the second campaign, two years (2014 and 2015) had lower temperatures compared to the long-term average. In two of the years (2000 and 2015), rainfall was remarkably below average.
2.2. Bird Observation Data
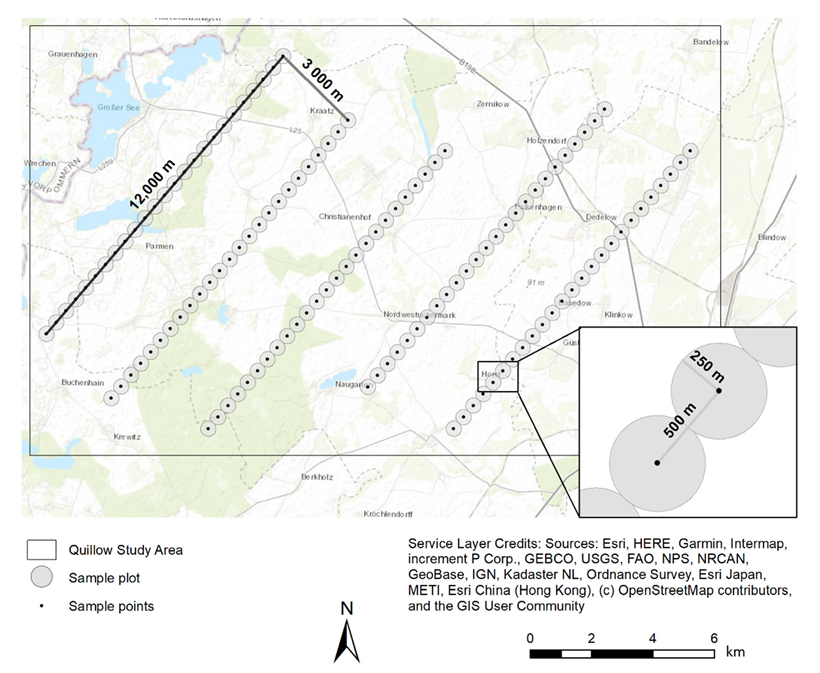
Figure 2 depicts the spatial arrangement of the sample plots in the study area. There was a total of 125 sample plots in five parallel transects. Each transect had a distance of 3000 m to the neighbouring transects; there were 25 sample plots on each transect with a distance of 500 m between neighbouring plots. In the following, the term “sample plot” refers to each circular area with an observation point at the centre and a radius of 250 m; the total area of each sample plot is therefore about 20 ha. Depending on the dominant habitat type inside this circular area, the sample plots were classified to the habitat types “arable”, “grassland”, or “forest” (see examples in the Supplementary Material: Figures S1–S3). Due to access restrictions, the total number of accessible sample plots varied, but 111 sample plots were visited across all observation dates (Table S2 in the Supplementary Materials). The bird observation datasets for both campaigns are published [15,16].
Figure 2.
Arrangement of the sample plots for the bird observations within the Quillow catchment area.
During the main bird-breeding period, ornithologists with profound local species knowledge conducted bird surveys five times in each year (but only four times in 1999), with intervals of approximately 2 weeks between the surveys. Depending on the variable weather conditions and thus on the beginning of the breeding season, the surveys begun with the first arrivals of the migrant bird species and ended well after the main breeding season. These timings were decided by ornithologists, the dates of the surveys are summarized in Table S13 (Supplementary Materials). All observations were carried out according to the point-stop-count method [17], which involves the recording of individual birds by direct sight and/or hearing within 10 min at the centre of the sample plot. The plots were visited in the morning, starting between 5 and 8 a.m. and finishing not later than 1 p.m. To avoid rough systematic errors, the surveys started at different ends of transects, and the ornithologists occasionally changed which transect they observed over the years. Both bird species and the number of individuals for every detected species were recorded.
2.3. Data Analysis
In order to consistently derive and compare the results for each of the four research questions, each of the analyses followed the same general procedure, i.e., quantification of both species occurrence and abundance (numbers of individual recordings) (Table 2).
Table 2.
Overview of research questions A–D on the occurrence and abundance of bird species across four foci of analysis, related data sources, and the statistical methods applied.
Analyses related to habitat type (RQ B) considered the three dominant types of habitat in the study area, i.e., arable land, grassland, and forest. The assignment of each sample plot to one of these types was done according to the habitat map of the Federal State of Brandenburg [14]. The numbers of sample plots for the three habitat types in each campaign are shown in Table S2 in the Supplementary Materials.
Analyses related to bird guilds (RQ C) addressed the three bird guilds: arable land, grassland, and forest, each consisting of three representative species that were selected based on literature and their frequent and consistent occurrence in the study area (Table S3 in the Supplementary Materials).
2.4. Statistical Analyses
The aim of the statistical analysis of the observation data was to identify longer-term trends in changes in occurrence and abundance rather than significant differences between individual observation years. It is known from ecological monitoring practice that fluctuations between single years can be considerable and that differences between individual years can be contrary to the general trend due to weather or ancillary agricultural conditions. Therefore, we decided not to apply a year-oriented multi-factorial analysis of the observation data, taking a multi-year interval-based approach to compare the two campaigns with each other as whole entities instead.
In order to analyse abundance, individual recordings were always summarized over all observation dates to express abundance. The different numbers of observation dates in the two campaigns, 19 in the first (1999 to 2002) and 15 in the second (2013 to 2015), required a standardisation of the sum of individuals for the sake of comparability. Thus, the observed numbers of individuals in the second campaign were multiplied by a factor of 19/15. In the result tables, all results for abundances refer to the number of adjusted recordings. The species numbers, on the other hand, always refer to the actual data entered. Here it is assumed that a higher number of visits do not necessarily yield a greater number of species.
Since the analytical focus was on comparison of the two campaigns over time, appropriate analytical procedures were chosen for the four RQs to detect differences, both in species occurrence and in abundance of individuals. The data properties allowed only non-parametric statistical procedures. Due to the repetition of observations at the same sample plots, a paired situation can always be assumed if analyses are related to the sample plot. Depending on the RQ, we employed one of the following tests [18]:
- The Wilcoxon signed rank test (if species numbers or abundance at sample plots were considered);
- The sign test (if only an increase or decrease in the target feature was considered);
- The Spearman rank correlation coefficient rS (if mutual dependencies of target features at sample plots were considered).
Since the results of the Wilcoxon signed rank test are rankings, the average situation is shown by the median and not by the arithmetic mean. We consistently interpreted all significance tests with an α error probability of 5%. Data analyses were performed using SPSS Statistics, version 22.
In order to uncover dependencies between the study characteristics species number and number of individuals and the factors observation year and habitat type, various 1- and 2-factorial variance analyses were carried out additionally (Tables S4 and S5 in the Supplementary Materials).
3. Results
3.1. RQ A: Changes across the Landscape
Table 3 and Table S6 (in the Supplementary Materials) provide an overview of total species occurrence (number of species) and of abundance (sum of individual bird recordings) over the entire investigation area and their relative changes between both campaigns. Both numbers indicate a decline; the relative change in the sum of individual recordings (−21.1%) is strikingly and three times greater than the change in the species number (−6.7%).
Table 3.
Change in numbers of bird species and abundance over the entire landscape.
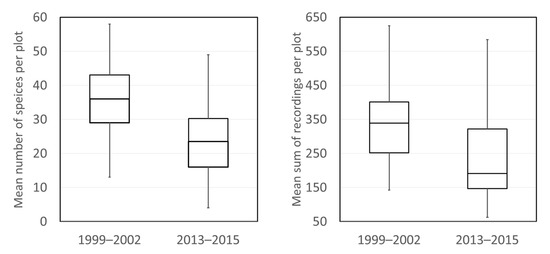
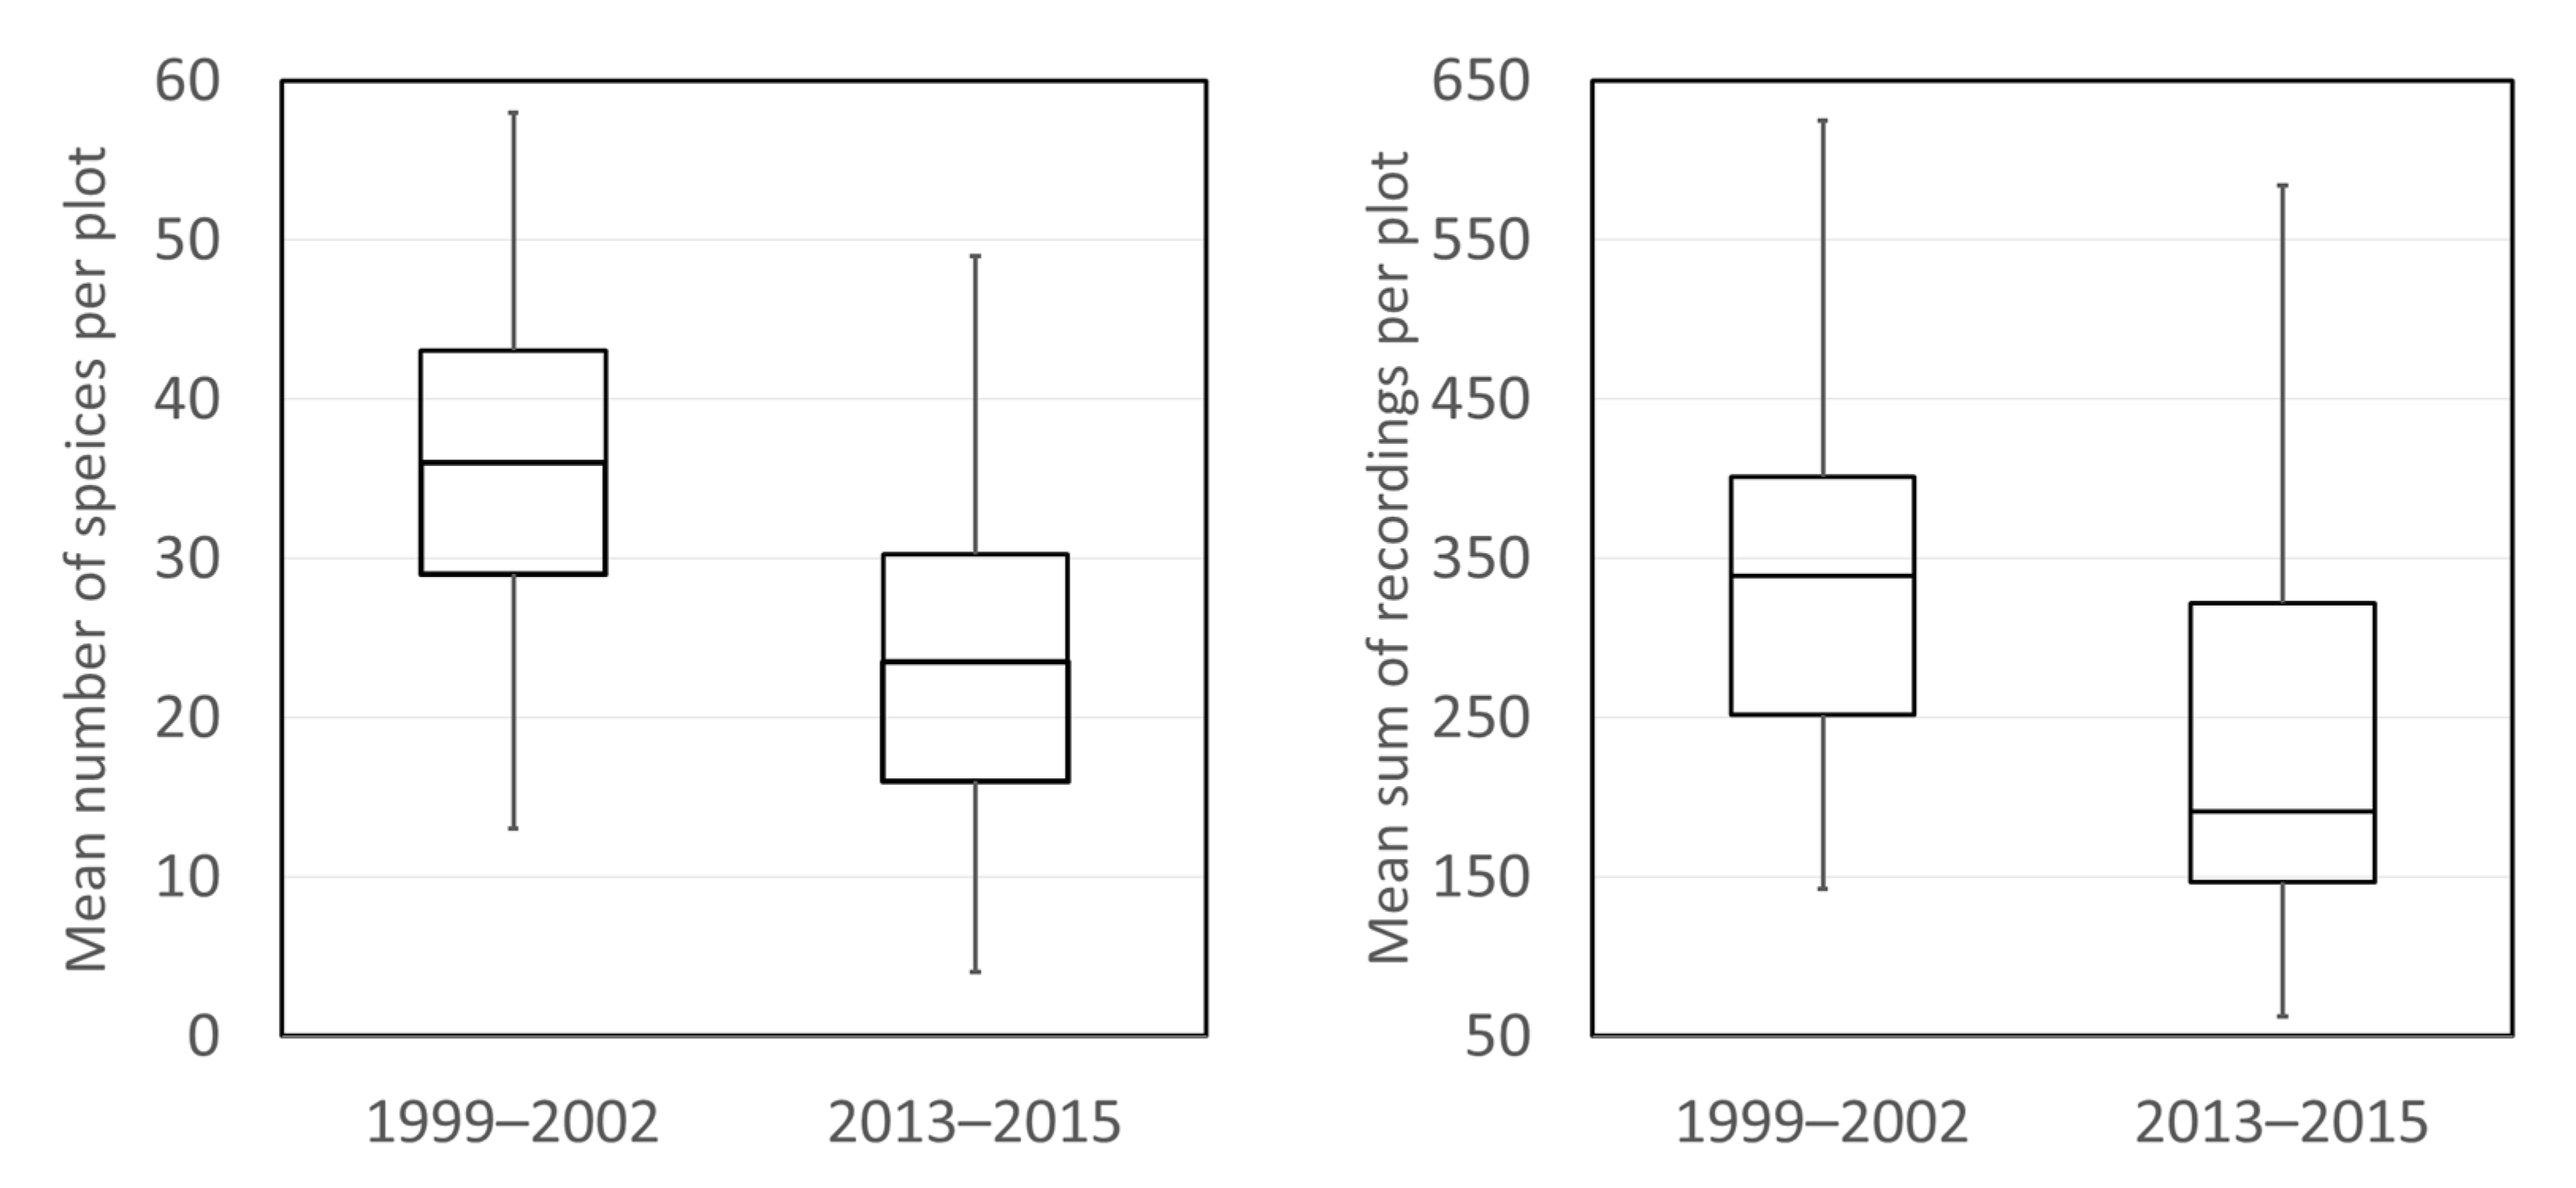
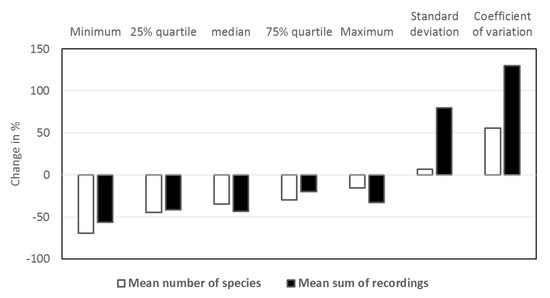
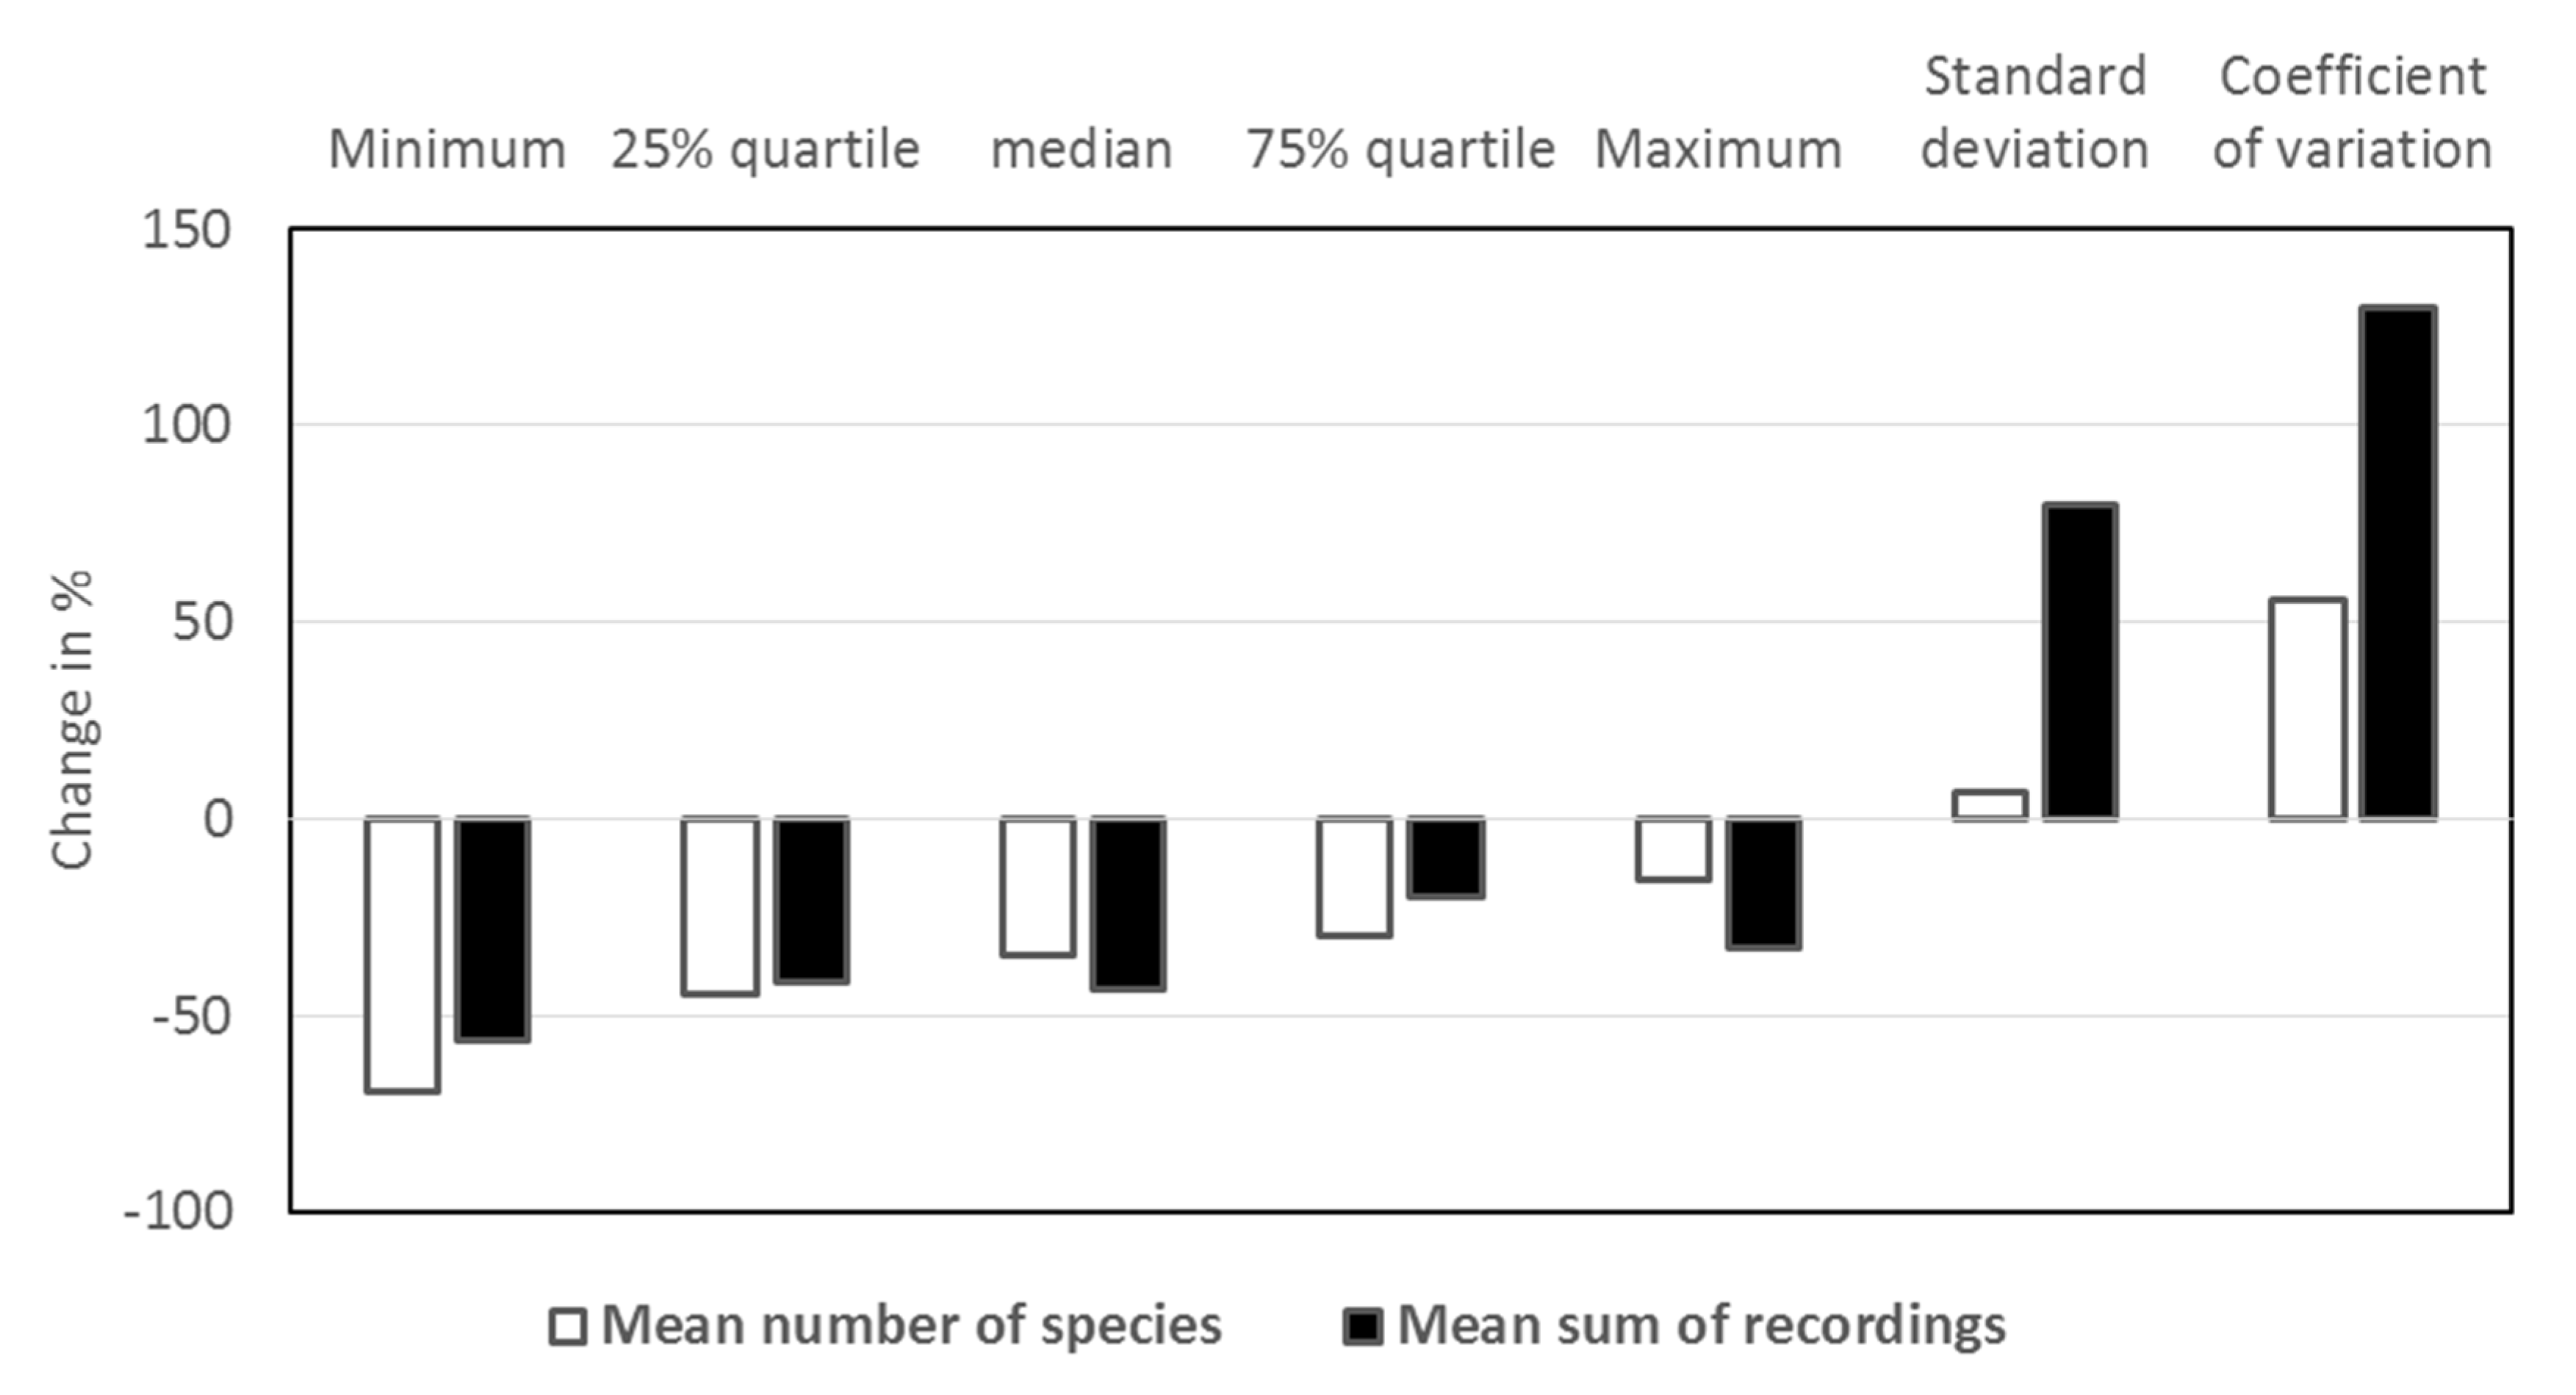
The mean total number of species detected per plot decreased between the two campaigns by approximately 12 species (from 35.7 to 24.1), while the coefficient of variation increased from 0.27 to 0.42 (from 15% to 42%) (Figure 3 and Figure 4, Table S7 in the Supplementary Materials). The maximum number of species observed at a single sample plot decreased from 58 to 49, and the minimum number decreased from 13 to 4. The range of species numbers at single sample plots within a campaign remained almost the same, but the overall distribution had shifted by 9 species to the left in the second campaign.
Figure 3.
Change in the species occurrence and abundance between the observation campaigns (1999–2002; 2013–2015) at sample plots.
Figure 4.
Change of distribution parameters of the mean species numbers and sum of individual bird recording between the observation campaigns (1999–2002; 2013–2015) at the sample plots.
The increase in plot-related variance indicates that the decline is not evenly distributed across the landscape but is particularly striking at certain sample plots. The decline in species numbers is generally more dramatic at the sample plots that already had lower than average species numbers in the first campaign (i.e., below the median). Only eight sample plots out of a total of 111 showed no decline in the number of occurring bird species. The statistical comparison of species numbers at the single sample plots between the two observation campaigns with the Wilcoxon signed rank test revealed a statistically significant decline in α-diversity, with p = 1.2 × 10⁻¹⁸ < 0.05 = 5%.
The decline in the sum of individual bird recordings was similar to that of the species numbers, but even more pronounced. The variations between single sample plots have more than doubled (Table S7). A comparison of the sum of recordings at the sample plots using the Wilcoxon signed rank test revealed a statistically significant difference with p = 6.0 × 10⁻²⁰ < 0.05 = 5%.
3.2. RQ B: Habitat Type-Specific Changes
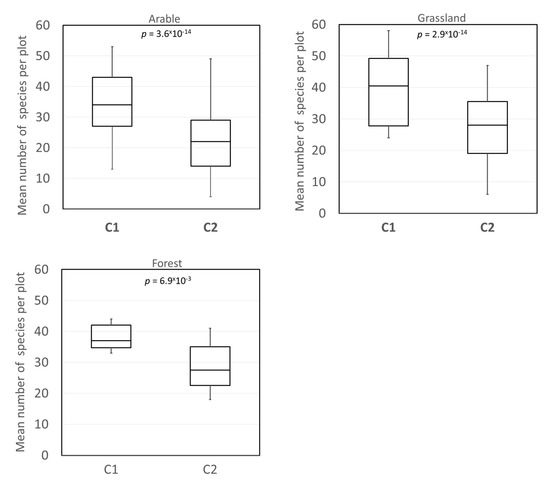
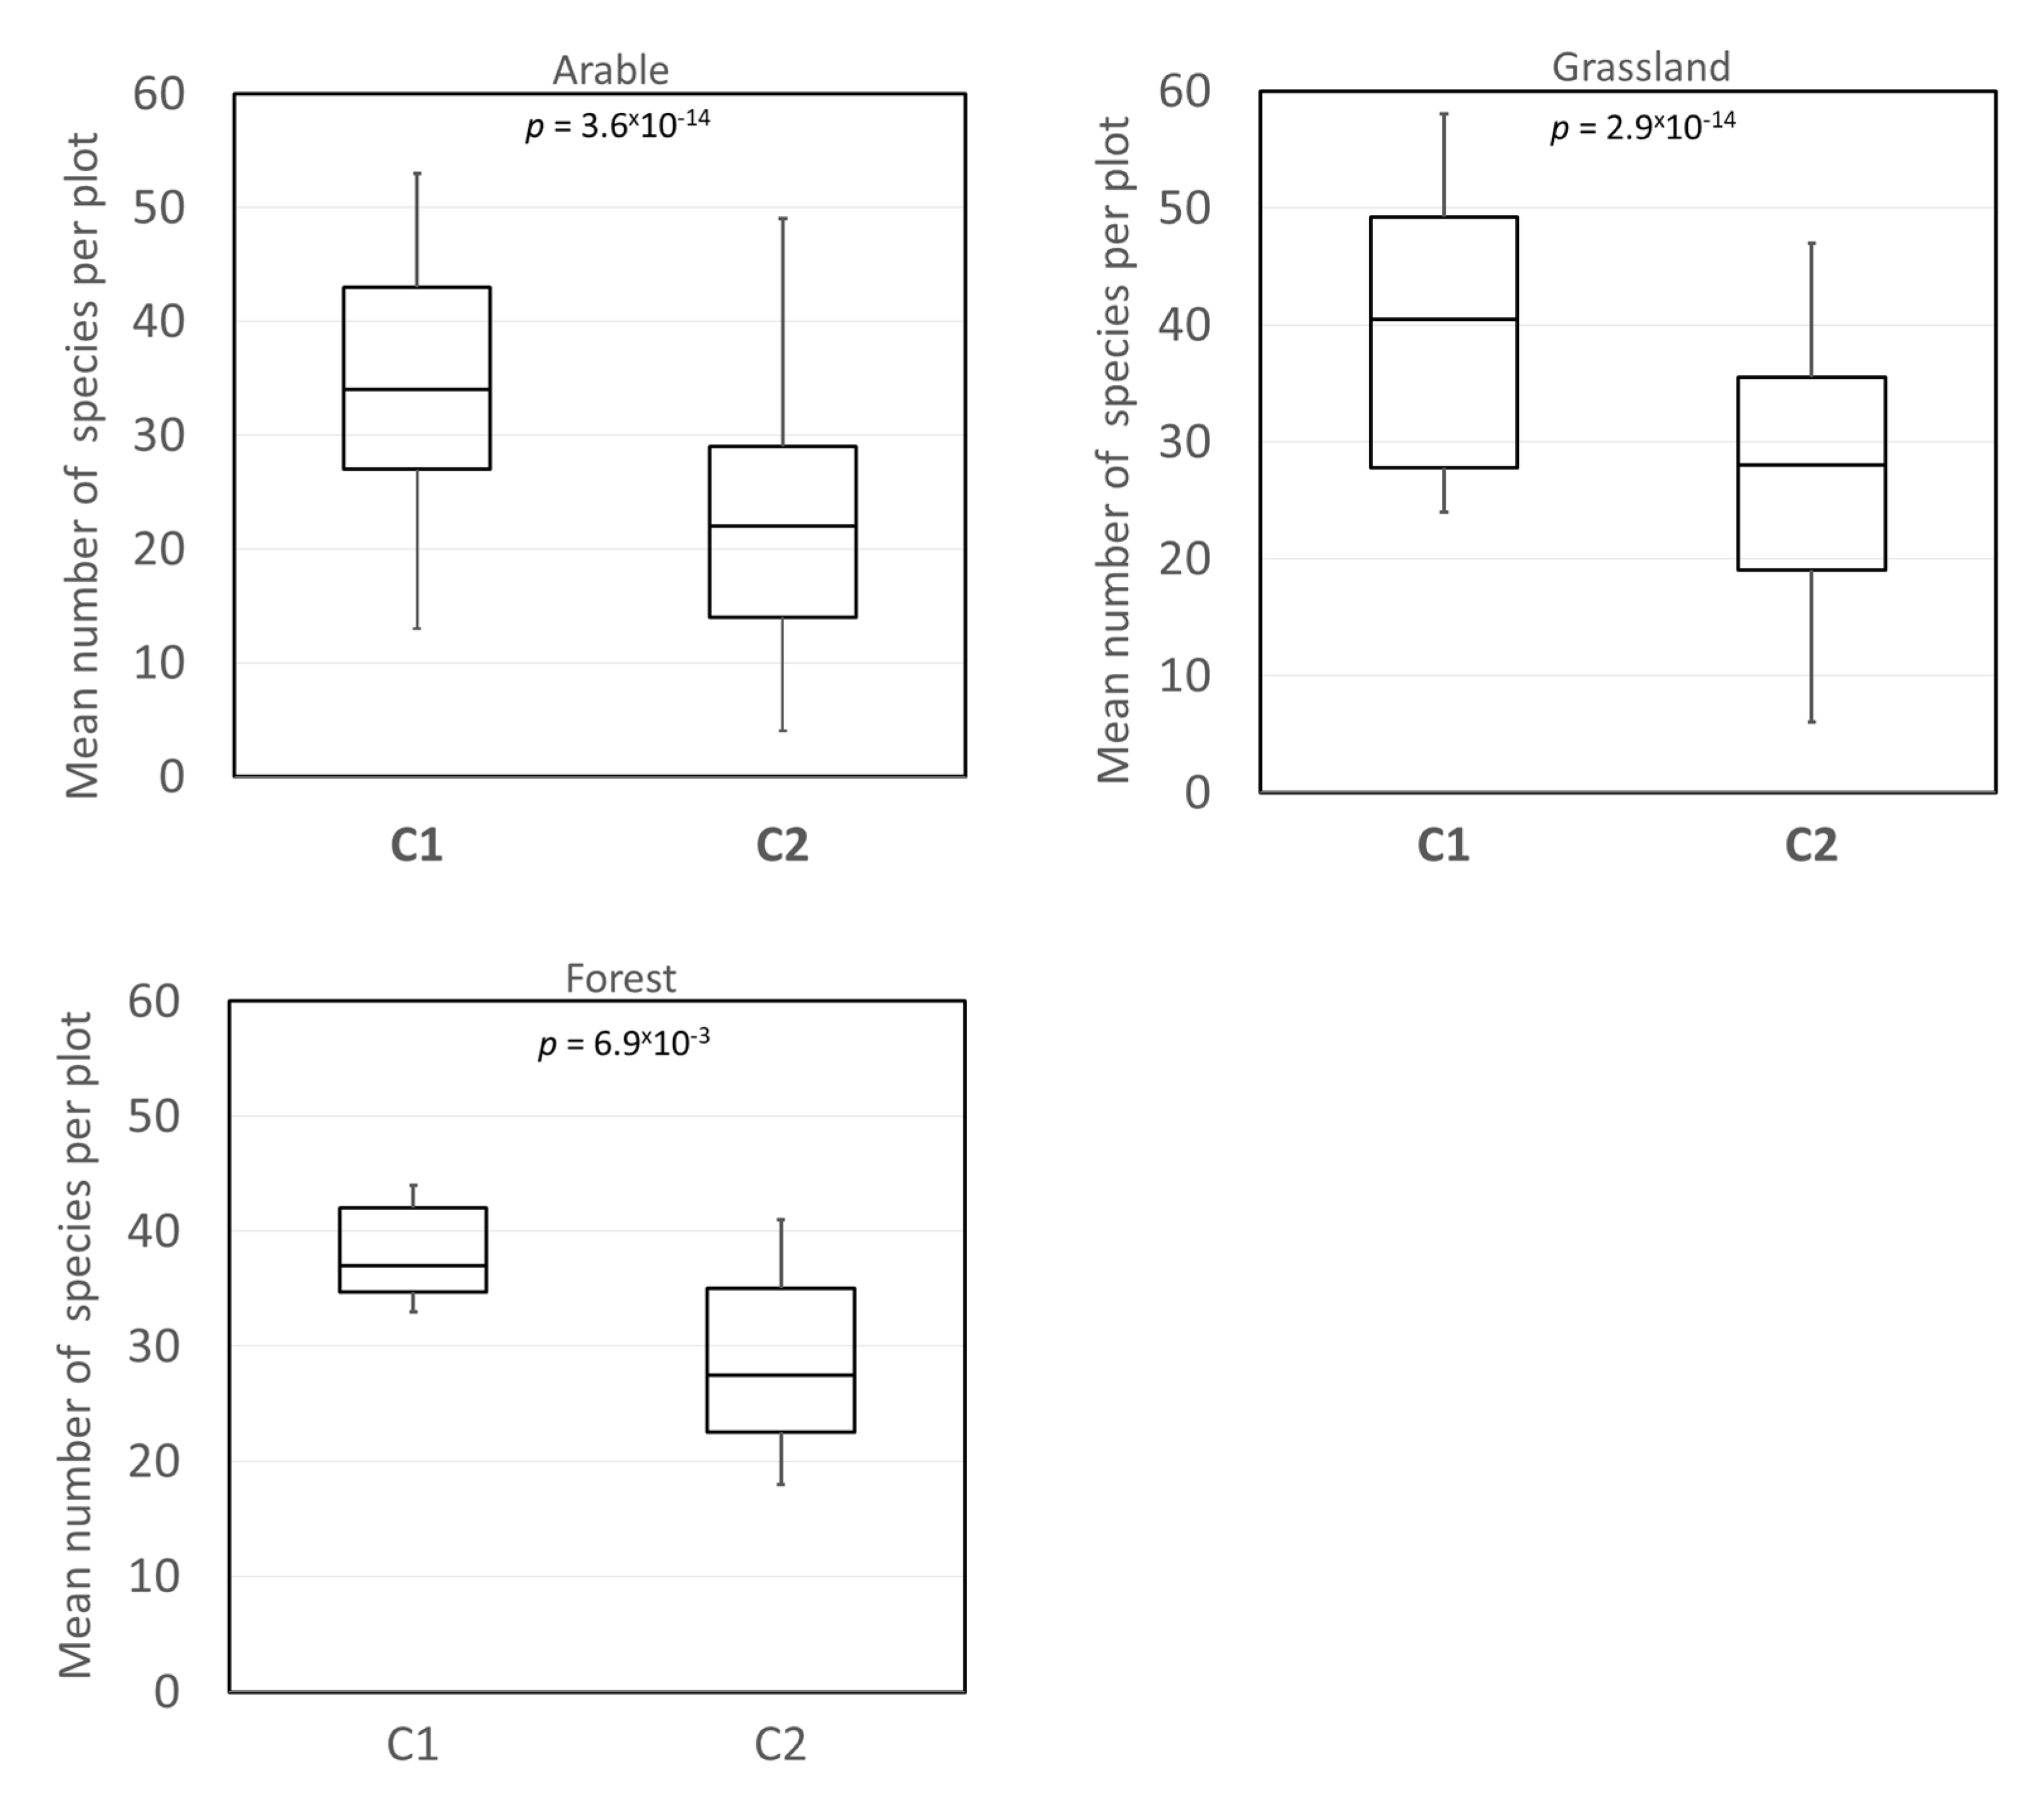
Figure 5 summarises the species numbers at the sample plots, classified regarding their dominant habitat type (arable land, grassland and forest). The mean number of bird species at the sample plots declined for all three habitat types significantly (p < 0.05). The Wilcoxon test resulted in the following p’s: 3.6 × 10⁻¹⁴ for arable land, 2.9 × 10⁻⁴ for grassland and 6.9 × 10⁻³ for forest. The variation between the plots approximately doubled for all habitat types (Table S8 in the Supplementary Materials).
Figure 5.
Comparison of species occurrence in the two observation campaigns (C1: 1999–2002; C2: 2013–2015) separated for different habitat types (for details see Tables S8 and S9 in the Supplementary Materials), p of Wilcoxon signed rank test.
On average, in both campaigns we found 15–20% lower species numbers at plots dominated by arable land compared to forest or grassland plots. Between both campaigns, the maximum and minimum numbers of species decreased. It is striking that the ranges of species numbers at the single plots, however, widened in the second campaign for all three habitat types, indicating an increase in differences among single sample plots.
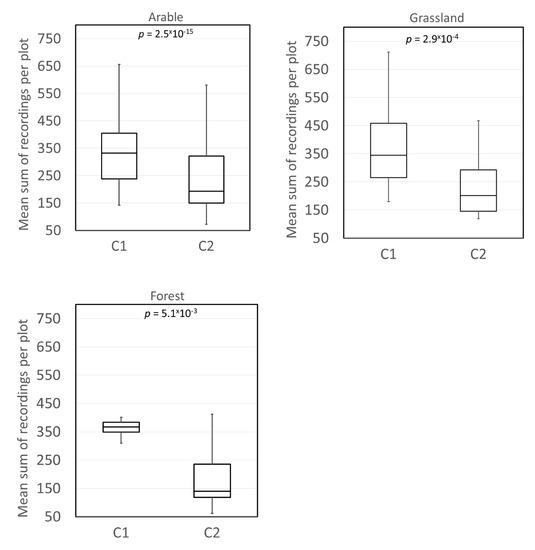
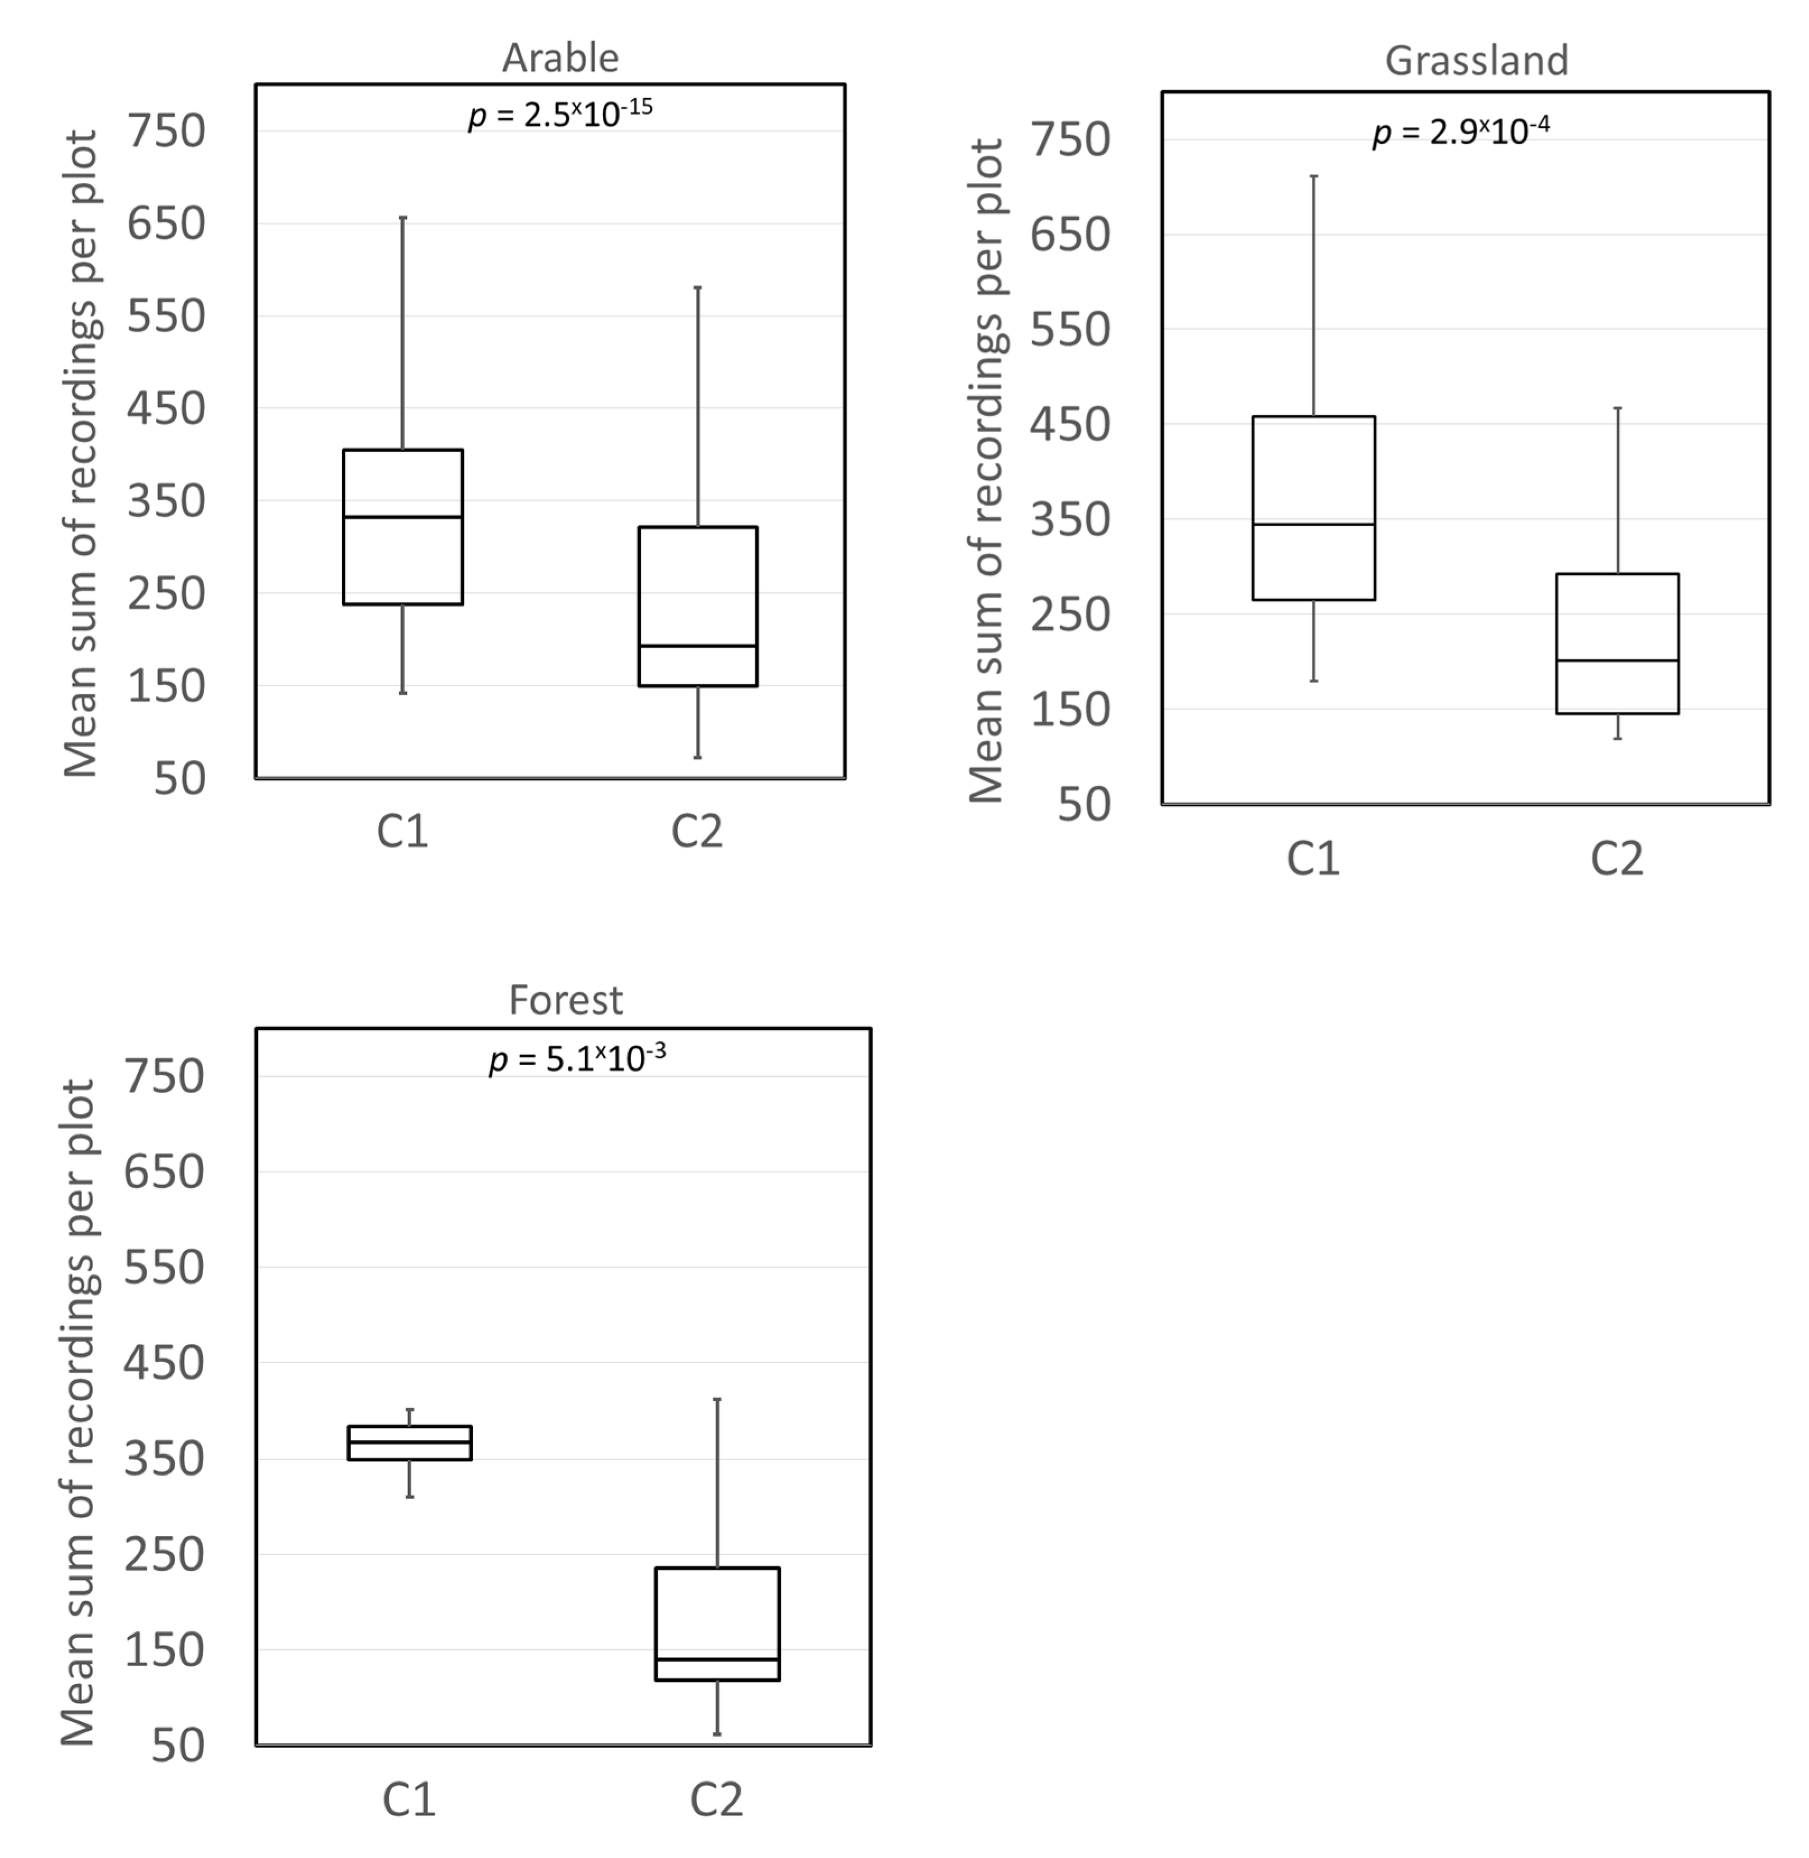
Figure 6 shows decreased numbers for abundance between the campaigns regardless of the habitat type of the sample plots. The declines were significant for all three habitat types (p < 0.05). The Wilcoxon test showed the following p-values: 2.5 × 10⁻¹⁵ for arable land, 2.9 × 10⁻⁴ for grassland and 5.1 × 10⁻³ for forest.
Figure 6.
Comparison of abundance in the two observation campaigns (C1: 1999–2002; C2: 2013–2015) separated for different habitat types (for details see Tables S8 and S9 in the Supplementary Materials) p of Wilcoxon signed rank test.
Table 4 details the results on individual bird recordings at the sample plots in absolute and relative terms. Overall, the absolute numbers of individual bird recordings decreased by more than 25%; the decline was steepest in forest habitats, followed by grassland habitats (see also Table S9 in the Supplementary Materials).
Table 4.
Bird abundance at different habitat types and its share on abundance in the entire landscape (γ diversity).
3.3. RQ C: Bird Guild-Specific Changes
The presence of the three bird guilds and their respective species (see Table S3 in the Supplement) was statistically evaluated in two different ways. First, we tested if the presence of each guild (represented by at least one guild representative) had changed between the two campaigns. Secondly, we analysed the changes in the occurrence frequency of the guild representatives at the sample plots.
For the arable land guild, the sign test revealed a non-significant change for the landscape wide occurrence of the bird guild (p = 6.3 × 10⁻²) but a significant change for the frequency of the guild representatives at the sample plots (p = 7.6 × 10⁻⁸). The presence of the guild over the landscape was maintained; but the frequency of the three guild representatives at the sample plots decreased between the two campaigns.
Regarding the grassland guild, the sign test gained statistically significant results for both test questions (p = 3.0 × 10⁻⁶ for guild occurrence, p = 7.0 × 10⁻⁷ for guild representatives’ frequency). The presence of the grassland guild over the landscape declined significantly and the frequency of guild representatives was significantly reduced over time at the sample plots where the guild was present.
The sign test for the forest bird guild showed no significant results for both questions (p = 4.5 × 10⁻¹ for guild occurrence, p = 7.1 × 10⁻¹ for guild representatives’ frequency). The forest guild occurred in nearly the same number of sample plots in both campaigns. The frequency of forest guild representatives at sample plots where the guild was present did not significantly change between the two campaigns.
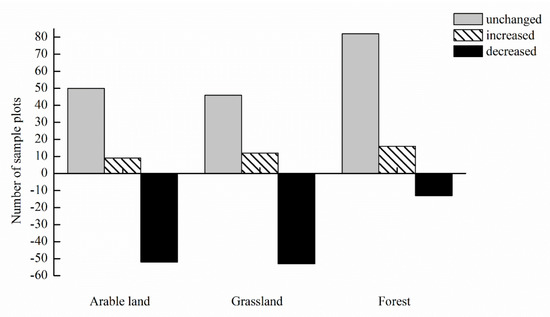
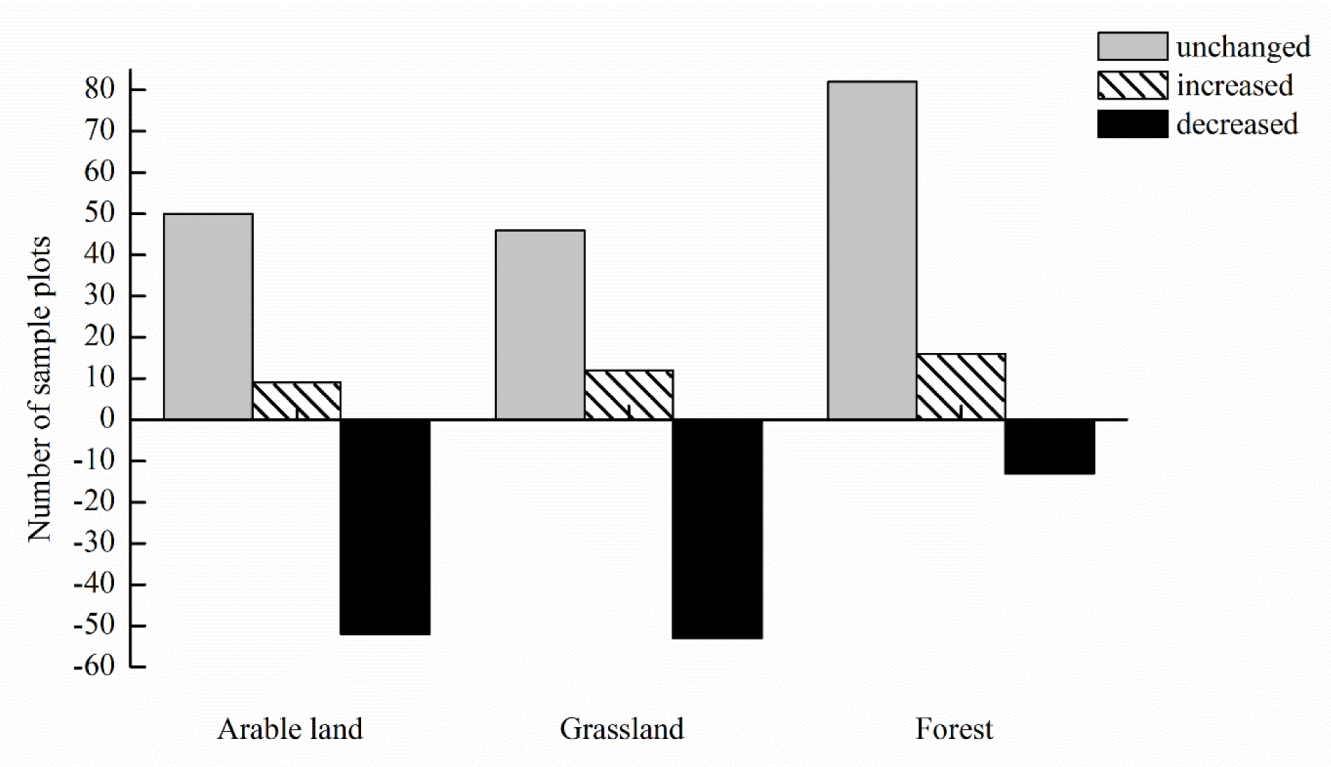
Over the entire study area, the occurrence frequency of guild representatives from arable and grassland guilds decreased at about 50 out of a total of 111 sample plots (Figure 7). The grassland guild representatives disappeared at 42 sample plots.
Figure 7.
Change of guild species frequency at single sample plots (number of plots at which the frequency of guild representatives changed, including zero values).
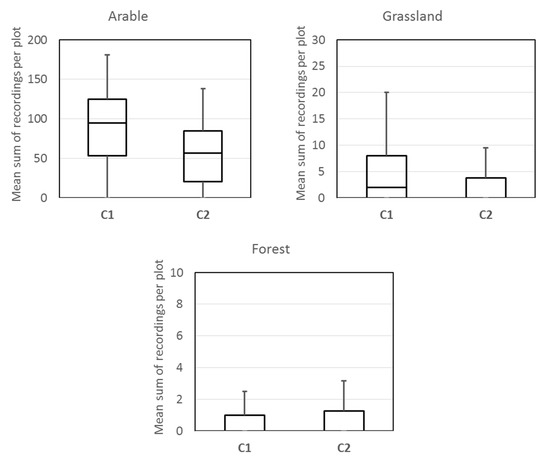
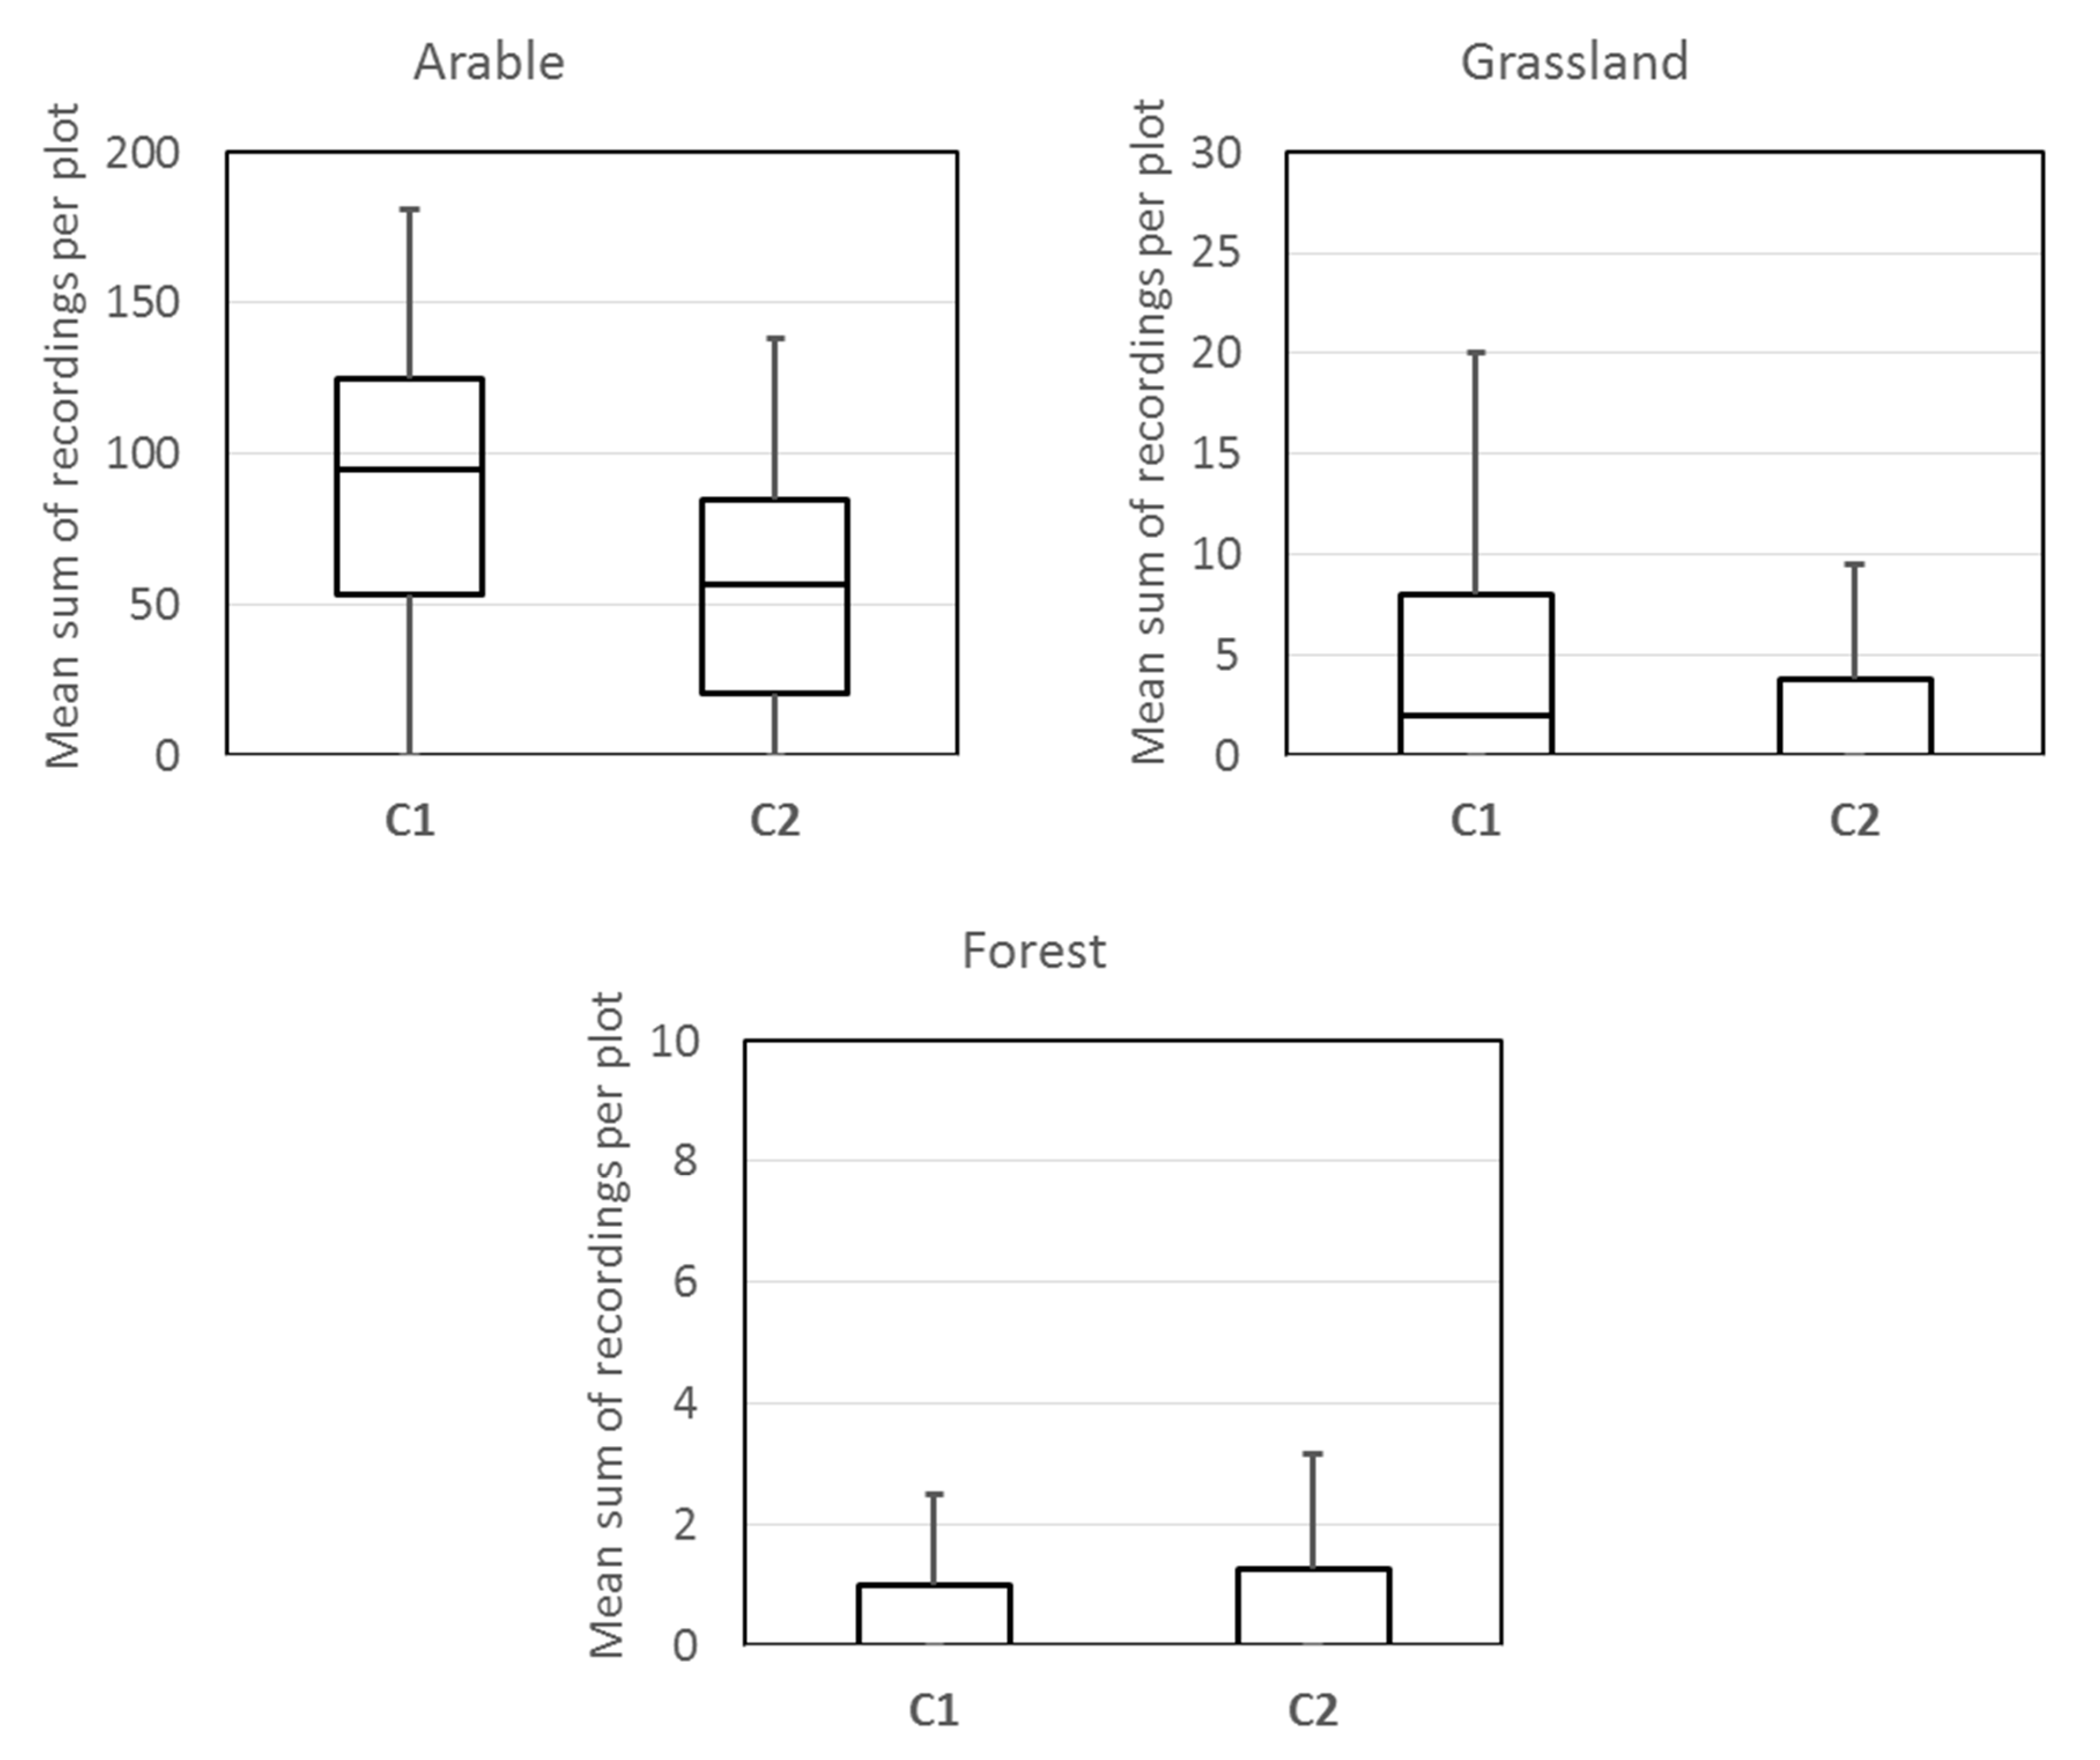
The changes in abundance for the three guilds are shown in Figure 8a–c (see also Table S10 in the Supplement). The abundances of the arable and forest guilds species declined by about 20% and 40%, respectively. In contrast, the individual recordings for grassland guild species increased slightly. While the relative variation between the plots for the arable and forest guild species decreased, it rose for the grassland guild.
Figure 8.
Changes in the abundance of the bird guild representatives at three types of single sample plots between the two campaigns (C1: 1999–2002; C2: 2013–2015).
The Wilcoxon signed rank test revealed significant changes for both the arable land and the grassland guild (p = 7.9 × 10⁻¹⁸ for arable; 3.3 × 10⁻³ for grassland). Despite a relative decline of more than 20% in recording numbers, no statistically significant change in the median was discernible for the forest guild (p = 5.4 × 10⁻¹). While recordings of all three guild representatives of the arable land guild decreased significantly, there were no significant changes in the forest guild representatives recordings (see also Table S11 in the Supplementary Materials).
3.4. RQ D: Bird Community Composition Changes
Changes in bird community composition were analysed through relative observation frequency occurrence of the 20 most frequent species. (Table S12 in the Supplementary Materials). The rank orders of the bird species in both campaigns are correlated (rS = 0.623 significant at 5% error level, p = 8.8 × 10⁻⁴), indicating no significant change in the rank order of the species over time.
A striking difference between the two campaigns is the generally smaller observation frequency of the 20 spatially most widespread species at the sample plots across the landscape. A Wilcoxon signed rank test between the related frequencies of species in the campaigns indicates a significant difference, with a p of 3.6 × 10⁻⁵.
For the abundance of the 20 dominant species, that is for those with the greatest numbers of individual recordings, there is no significant correlation between the two observation campaigns (rS = 0.345, p = 9.8 × 10⁻²). Thus, the internal rank orders of species abundances are uncorrelated (that is have changed). On the other side, the Wilcoxon signed rank test for the individual recordings of the dominant species is also not significant (p of 2.7 × 10⁻¹), indicating that the central tendency (expressed by the median) in the individual recordings is statistically unchanged.
Above all, the overall dominance structure of the bird community changed, but the general spatial distribution of the dominant species in the landscape did not change significantly. Many species occurred with fewer individuals, but a significant number of species also occurred with more individuals.
In both observation campaigns, there was a significant overall correlation between the occurrence frequency and the abundance of single species (rS = 0.697, p = 3.8 × 10⁻³ for the first observation campaign; rS = 0.544, p = 3.6 × 10⁻² for second campaign). Thus, a high frequency of occurrence typically goes along with a large number of individuals.
3.5. Synthesis of Results
The multi-perspective view of changes in the bird community of the agrarian landscape under study over 17 years revealed multi-faceted results, which are summarised in Table 5.
Table 5.
Changes in bird community over 17 years (first campaign: 1999–2002; second campaign: 2013–2015) on multiple analytical foci and data aggregation levels.
4. Discussion
Previous research addressing land use impacts on bird populations and related long-term trends in agricultural landscapes [8] have resulted in partly inconsistent findings for different aspects or distinct bird guilds and species [19], as well as for abundance and diversity indicators. This may be partly attributable to the diversity of landscapes in which the studies were conducted. Thus, it often remains unclear which trends occur simultaneously in one landscape and what impact local counteraction will have on it. In order to take the multi-faceted nature of biodiversity change into account, Fischer and Lindenmayer [20] suggested the application of methods with a holistic, landscape-centred approach, with which various aspects can be illuminated simultaneously and thus misinterpretations can be avoided. A corresponding multi-perspective approach was taken here, the main findings are summarised and discussed in the following four statements.
- Changes at sample plots manifest differently at the landscape level depending on the target variable, whereas changes in species diversity might be compensated by different change patterns at single sample plots, and changes in bird abundance at sample plots cumulate to the landscape scale.
The total number of bird species observed in our study (143) corresponds to the long-term mapping of a working group of ornithologists in the Federal States of Brandenburg and Berlin [21], who recorded 131–140 bird species in the two respective ordnance survey map grids (100 km2 each). Putting together all the single aspects (number of species, observation frequencies and abundance), we found a dramatic, systematic decline in bird community at the sample plots. Only a very small number of species showed an opposite trend for any of the considered variables (e.g., abundance). However, the overall decline at sample plots was not yet recognisable in total species richness over the whole landscape; our results showed only a slight reduction (nine species) in the total number of occurring bird species from 1999–2002 to 2013–2015 over the whole landscape.
In accordance with other authors [22,23], we can conclude that bird species richness over the whole landscape seems to be supported by diversity at the habitat level, which in our study area changed only slightly over time. Obviously, bird species diversity at the landscape level (γ diversity) remained nearly unchanged, even within intensively used agricultural landscapes, as long as habitat diversity was maintained. However, as indicated by the increasing variation between single sample plots, local bird diversity hot spots (high α diversity) became more important as keystones of γ diversity. Our results are in agreement with the conclusion of [24] that the relationship between habitat diversity and bird species numbers is not linear, and key structural components can have disproportionally positive impacts on bird richness at the landscape level. Accordingly, for bird conservation practice it seems possible to promote farmland biodiversity by applying appropriate management systems to “bird diversity hot spots” within the landscape, such as “High Nature Value” (HNV) farmland areas [25]. The contrasting trends in bird species diversity at the landscape level (γ diversity) and at the sample plot level (α diversity) might be affected by time-lag effects between more local population declines and landscape-wide species disappearances [26].
In contrast to the diversity measures, changes in bird abundance at single sample plots accumulated to a clear declining trend over the whole landscape. Changes in land management are a possible explanation of the generic declining trend demonstrated by many other studies [27]. Counteracting this trend calls for a set of adapted strategies. Previous studies [25,28] show that field-level bird abundance can be enhanced by the amount of agri-environment scheme (AES) adoption at the landscape scale or within HNV farmland areas. They found that the more AES or HNV farmland that was applied in the surrounding landscape, the more the field-level bird abundance increased.
In our study area, both changes in the habitat and cropping structure of arable land affected less than 10% of the area within the 17-year time span of our study. These limited alterations alone hardly explain the massive changes within the bird community. The strong decline in diversity and abundance at the single sample plots suggests additional overarching impact factors, such as limited food resources, e.g., the decline in insects [29] or even still-hidden effects of climate change [30].
- 2.
- The decline in bird species occurrence and abundance is systematic and similar in range in different habitat types and bird guilds.
Some authors [19] found the bird declines were strongest on farmland compared to other land uses. Our results do not confirm this statement for our investigated area. Regarding absolute numbers, we found 10–30% higher species richness on grassland or forest compared to arable plots. However, the relative decline in species numbers between the two campaigns was within the same range (25–34%) among all the different habitats. In contrast to bird species numbers, the relative decline in bird abundance was much steeper on grassland and forest plots compared to arable plots. While the steepest decline on grasslands occurred at previous hot spots (over the 75% quartile) for bird abundances, bird abundance at forest sample plots declined stronger in all quartiles compared to arable sample plots. This is in contrast to the results of [19], who found relatively stable population sizes for forest bird species in a pan-European study, but severe declines in farmland bird populations. The reasons for the sharp decline in bird abundance on grassland and forest plots in our study obviously need to be analysed in more detail, e.g., including information on the habitat quality of the sample plots, which is important, e.g., for grassland birds [31]. The forest habitats of the study area are embedded in an agricultural matrix. The related edge effects might be one possible reason for the declines at forest plots [32]. Moreover, the birds are exposed to risks during their migration and at their wintering grounds. Studies of common breeding birds in Germany [33,34] came to the conclusion that long-distance migrants show more negative trends compared to short-distance migrants and resident species. In our study, just seven bird species out of the most common 25 belonged to long distance migrants, e.g., common cuckoo, barn swallow, yellow wagtail, and willow warbler.
- 3.
- The habitat use pattern of birds has changed over the landscape.
The total number of bird recordings decreased by about 21% between the two observation campaigns. This is even higher than calculations by [35], who estimated a reduction of 7–10% in breeding pairs between 1992 and 2016 for Germany. Our results may indicate a kind of decreasing local presence. Many species became restricted to fewer sample plots in the overall landscape, as shown by the increases in variability between the plots for most of the considered variables. In our study, the landscape-wide spatial presence of forest guild representatives remained nearly unchanged over time while the occurrence of grassland guild representatives was significantly restricted to fewer sample plots. Together with the lower frequency of the grassland guild representatives at single sample plots, this indicates that the habitat use of grassland-related birds faced a reduction throughout the entire landscape. Only the grassland guild representatives showed similar numbers of recordings between the campaigns. The conversion of grasslands into arable land between the two campaigns is one possible reason for the more limited spatial coverage of grassland guild representatives. Previous studies [36,37] showed that grassland birds were closely tied to extensive management and landscape structures, e.g., grassland strips or edges, did not limit the habitat suitability. The spatial coverage of the arable bird guild did not change within our study period. Nevertheless, the frequency and abundance of the arable guild representatives did decrease significantly (−40%) over all plots. The decline was steepest at species-poor spots (species numbers below 25% and 50% quartile).
- 4.
- The composition of the bird community has changed.
The analyses of landscape-wide occurrences of the dominant species showed a generic decline. The number of sample plots in which a certain species was detected declined by about 20% on average. The bird community structure was slightly, but significantly modified regarding the ranking of the most dominant species. In contrast to species occurrence, changes in abundance were more species-specific. We found clear shifts within the ranking of the dominant species, which is consistent with the findings of [19] for forest and farmland birds in Europe, and [38] for different breeding habitat groups (guilds) in North American bird assemblages. However, the changes in single-species abundance in our study were not parallel to changes in their occurrence/frequency across the landscape.
In summary, the diversity of the landscape under study’s bird community deteriorated significantly between observation campaigns. If we imagine the bird community as a carpet spread over the physical landscape, the carpet has a certain pattern with different colours in different places. Assuming the appearance and quality of the carpet 20 years before as starting point, the carpet has worn, showing many thin spots and even some holes. It calls for repair.
5. Conclusions
Three main recommendations can be drawn from our study that may help to maintain and improve both bird diversity and abundance in agricultural landscapes: (i) a key to promoting overall bird diversity, i.e., the number of bird species in the landscape, seems to be the application of appropriate management systems to “bird diversity hot spots”. These are distinct areas where many species occur, such as HNV farmland areas [25]. A set of adapted strategies is required with respect to the diversity and spatial distribution of the habitats as well as appropriate management systems; (ii) to maintain and promote bird abundances on the landscape level, conservation measures across the whole landscape are needed, which may include adapted agricultural practices through AES adoption at the landscape scale, as other studies have shown [25,28]; (iii) the data needed to devise specifically adapted measurements and management schemes, in the sense stated above, should be based on long-term observations in representative parts of the landscape that allow analyses from different perspectives.
Supplementary Materials
The following supporting information can be downloaded at: https://www.mdpi.com/article/10.3390/land11122115/s1, Figure S1: Example for a sample plot classified as forest plot (data base: habitat map of Brandenburg State (MLUL 2014); Figure S2: Example for a sample plot classified as grassland plot (data base: habitat map of Brandenburg State (MLUL 2014); Figure S3: Example for a sample plot classified as arable plot (data base: habitat map of Brandenburg State (MLUL 2014); Table S1: Cropping area of the main crops within the bird sample plots and the rate of change between the two observational campaigns (cropping area in % of the total arable area, change in percentage points [%]; data source: the authors); Table S2: Classification of sample plots related to the dominant habitat type; Table S3: Assignment of representative bird species to habitat-specific guilds; Table S4: Overview of the 1-factorial variance analysis of the feature number of species dependent on factor observation year; Table S5: Overview of the 1-factorial variance analysis of the feature number of individual units dependent on factor observation year; Table S6: Change in numbers of species and individual recordings between the two observation campaigns; Table S7: Descriptive statistics of species occurrence and individual activity density during the observation campaigns at the plots; Table S8: Selected descriptive statistics of species occurrence at sample plots with respect to observation campaign and dominant habitat type; Table S9: Selected descriptive statistics of the sum of individual recordings at sample plots with respect to observation campaign and dominant habitat type; Table S10: Sum of individual recordings of arable land, grassland and forest bird guild species over all sample plots in the two observation campaigns; Table S11: Sum of individual recordings of bird individuals of the particular species of three bird guilds during the two observation campaigns; Table S12: Change in the landscape-wide occurrence and abundance of the 20 most frequent and most abundant species; Table S13: Periods of five bird observation surveys (four in 1999) in the two campaigns (1999–2002 and 2013–2015).
Author Contributions
Conceptualization, A.S., M.G. and U.S.; Methodology, A.S. and U.S.; Formal analysis, A.S.; Data curation, A.S., M.G. and F.S.; Writing—original draft, M.G. and A.S.; Writing—review & editing, U.S. and F.S.; Visualization, F.S.; Project administration, M.G. All authors have read and agreed to the published version of the manuscript.
Funding
The bird survey was supported by the German Federal Ministry of Food and Agriculture (BMEL) and the Brandenburg Ministry of Sciences, Research and Culture (MWFK).
Data Availability Statement
The original data are publicly archived and downloadable [15] und [16].
Acknowledgments
We are very grateful to the ornithologists for their field work: Sarah Fuchs, Bettina Saacke, Andreas and Adele Matthews.
Conflicts of Interest
The authors declare no conflict of interest.
References
- Johnson, C.N.; Balmford, A.; Brook, B.W.; Buettel, J.C.; Galetti, M.; Guangchun, L.; Wilmshurst, J.M. Biodiversity losses and conservation responses in the Anthropocene. Science 2017, 356, 270–275. [Google Scholar] [CrossRef] [Scilit]
- Butler, S.J.; Boccaccio, L.; Gregory, R.D.; Vorisek, P.; Norris, K. Quantifying the impact of land-use change to European farmland bird populations. Agric. Ecosyst. Environ. 2010, 137, 348–357. [Google Scholar] [CrossRef] [Scilit]
- Defra. Defra National Statistics Release: Wild bird populations in the UK, 1970 to 2012; Department for Environment, Food and Rural Affairs: London, UK, 17 October 2013. [Google Scholar]
- Whittingham, M.J.; Devereux, C.L.; Evans, A.D.; Bradbury, R.B. Altering perceived predation risk and food availability: Management prescriptions to benefit farmland birds on stubble fields. J. Appl. Ecol. 2006, 43, 640–650. [Google Scholar] [CrossRef] [Scilit]
- Stanton, R.L.; Morrissey, C.A.; Clark, R.G. Analysis of trends and agricultural drivers of farmland bird declines in North America: A review. Agric. Ecosyst. Environ. 2018, 254, 244–254. [Google Scholar] [CrossRef] [Scilit]
- Hallmann, C.A.; Foppen, R.P.; van Turnhout, C.A.; de Kroon, H.; Jongejans, E. Declines in insectivorous birds are associated with high neonicotinoid concentrations. Nature 2014, 511, 341–343. [Google Scholar] [CrossRef] [Scilit]
- Spiller, K.J.; Dettmers, R. Evidence for multiple drivers of aerial insectivore declines in North America. Condor 2019, 121, duz010. [Google Scholar] [CrossRef] [Scilit]
- Spake, R.; Soga, M.; Kawamura, K.; Cooke, R.S.; Yamaura, Y.; Eigenbrod, F. Regional variability in landscape effects on forest bird communities. Landsc. Ecol. 2020, 35, 1055–1071. [Google Scholar] [CrossRef] [Scilit]
- Du Toit, J.T. Considerations of scale in biodiversity conservation. Anim. Conserv. 2010, 13, 229–236. [Google Scholar] [CrossRef] [Scilit]
- Gayer, C.; Kurucz, K.; Fischer, C.; Tscharntke, T.; Batáry, P. Agricultural intensification at local and land-scape scales impairs farmland birds, but not skylarks (Alauda arvensis). Agric. Ecosyst. Environ. 2019, 277, 21–24. [Google Scholar] [CrossRef] [Scilit]
- Duflot, R.; Ernoult, A.; Aviron, S.; Fahrig, L.; Burel, F. Relative effects of landscape composition and con-figuration on multi-habitat gamma diversity in agricultural landscapes. Agric. Ecosyst. Environ. 2017, 241, 62–69. [Google Scholar] [CrossRef] [Scilit]
- Marja, R.; Uuemaa, E.; Mander, Ü.; Elts, J.; Truu, J. Landscape pattern and census area as determinants of the diversity of farmland avifauna in Estonia. Reg. Environ. Chang. 2013, 13, 1013–1020. [Google Scholar] [CrossRef] [Scilit]
- Heath, M.; Evans, M.; Hoccom, D. Important Bird Areas in Europe: Priority Sites for Conservation Volume 1; Heath, M., Evans, M., Hoccom, D., Eds.; BirdLife International: Cambridge, UK, 2000; p. 866. [Google Scholar]
- MLUL. Ministerium für Ländliche Entwicklung, Umwelt und Landwirtschaft des Landes Brandenburg (MLUL). Flächendeckende Biotop- und Landnutzungskartierung (BTLN) im Land Brandenburg—CIR-Biotoptypen 2009, dl-de/by-2-0. Potsdam. 2014. Available online: http://www.mlul.brandenburg.de/cms/detail.php/bb1.c.310474.de (accessed on 10 October 2017).
- Glemnitz, M.; Schultz, A.; Stachow, U.; Meier, K. Farmland Bird Monitoring Data in North-East Germany from 1999–2002; Leibniz Centre for Agricultural Landscape Research (ZALF): Müncheberg, Germany, 2018. [Google Scholar] [CrossRef]
- Glemnitz, M.; Schultz, A.; Stachow, U.; Meier, K. Farmland Bird Monitoring Data in North-East Germany from 2013–2015; Leibniz Centre for Agricultural Landscape Research (ZALF): Müncheberg, Germany, 2018. [Google Scholar] [CrossRef]
- Drapeau, P.; Leduc, A.; McNeil, R. Refining the use of point counts at the scale of individual points in studies of bird-habitat relationships. J. Avian Biol. 1999, 30, 367–382. [Google Scholar] [CrossRef] [Scilit]
- Field, A. Discovering Statistics Using SPSS, 4th ed, 4th ed.Sage Publications: Newbury Park, CA, USA, 2013. [Google Scholar]
- Gregory, R.D.; Skorpilova, J.; Vorisek, P.; Butler, S. An analysis of trends, uncertainty and species selection shows contrasting trends of widespread forest and farmland birds in Europe. Ecol. Indic. 2019, 103, 676–687. [Google Scholar] [CrossRef] [Scilit]
- Fischer, J.; Lindenmayer, D.B. Beyond fragmentation: The continuum model for fauna research and conservation in human-modified landscapes. Oikos 2006, 112, 473–480. [Google Scholar] [CrossRef] [Scilit]
- Association for Ornithologists in Berlin-Brandenburg (ABBO). Die Brutvögel in Brandenburg und Berlin—Ergebnisse der ADEBAR Kartierung 2005–2009. Otis 2011, 19, 450. [Google Scholar]
- Benton, T.G.; Vickery, J.A.; Wilson, J.D. Farmland biodiversity: Is habitat heterogeneity the key? Trends Ecol. Evol. 2003, 18, 182–188. [Google Scholar] [CrossRef] [Scilit]
- Fuller, R.J.; Hinsley, S.A.; Swetnam, R.D. The relevance of non-farmland habitats, uncropped areas and habitat diversity to the conservation of farmland birds. Ibis 2004, 146, 22–31. [Google Scholar] [CrossRef] [Scilit]
- Carrasco, L.; Norton, L.; Henrys, P.; Siriwardena, G.M.; Rhodes, C.J.; Rowland, C.; Morton, D. Habitat diversity and structure regulate British bird richness: Implications of non-linear relationships for conservation. Biol. Conserv. 2018, 226, 256–263. [Google Scholar] [CrossRef] [Scilit]
- Doxa, A.; Bas, Y.; Paracchini, M.L.; Pointereau, P.; Terres, J.M.; Jiguet, F. Low-intensity agriculture increases farmland bird abundances in France. J. Appl. Ecol. 2010, 47, 1348–1356. [Google Scholar] [CrossRef] [Scilit]
- Balmford, A.; Green, R.E.; Jenkins, M. Measuring the changing state of nature. Trends Ecol. Evol. 2003, 18, 326–330. [Google Scholar] [CrossRef] [Scilit]
- Douglas, D.J.; Beresford, A.; Selvidge, J.; Garnett, S.; Buchanan, G.M.; Gullett, P.; Grant, M.C. Changes in upland bird abundances show associations with moorland management. Bird Study 2017, 64, 242–254. [Google Scholar] [CrossRef] [Scilit]
- Dallimer, M.; Gaston, K.J.; Skinner, A.M.; Hanley, N.; Acs, S.; Armsworth, P.R. Field-level bird abundances are enhanced by landscape-scale agri-environment scheme uptake. Biol. Lett. 2010, 6, 643–646. [Google Scholar] [CrossRef] [Scilit] [PubMed]
- Møller, A.P. Parallel declines in abundance of insects and insectivorous birds in Denmark over 22 years. Ecol. Evol. 2019, 9, 6581–6587. [Google Scholar] [CrossRef] [Scilit] [PubMed]
- Bay, R.A.; Harrigan, R.J.; Le Underwood, V.; Gibbs, H.L.; Smith, T.B.; Ruegg, K. Genomic signals of selection predict climate-driven population declines in a migratory bird. Science 2018, 359, 83–86. [Google Scholar] [CrossRef] [Scilit]
- Fischer, K.; Busch, R.; Fahl, G.; Kunz, M.; Knopf, M. Habitat preferences and breeding success of Whinchats (Saxicola rubetra) in the Westerwald mountain range. J. Ornithol. 2013, 154, 339–349. [Google Scholar] [CrossRef] [Scilit]
- Borges, F.; Glemnitz, M.; Schultz, A.; Stachow, U. Assessing the habitat suitability of agricultural landscapes for characteristic breeding bird guilds using landscape metrics. Environ. Monit. Assess. 2017, 189, 166. [Google Scholar] [CrossRef] [Scilit]
- Kamp, J.; Frank, C.; Trautmann, S.; Busch, M.; Dröschmeister, R.; Flade, M.; Gerlach, B.; Karthäuser, J.; Kunz, F.; Mitschke, A.; et al. Population trends of common breeding birds in Germany 1990–2018. J. Ornithol. 2021, 162, 1–15. [Google Scholar] [CrossRef] [Scilit]
- Flade, M.; Schwarz, J.; Trautmann, S. Wer weit zieht, lebt gefährlicher: Bestandstrends deutscher Zugvögel. Der Falke 2013, 60, 54–57. [Google Scholar]
- Gerlach, B.; Dröschmeister, R.; Langgemach, T.; Borkenhagen, K.; Busch, M.; Hauswirth, M.; Heinicke, T.; Kamp, J.; Karthäuser, J.; König, C.; et al. Vögel in Deutschland—Übersichten zur Bestandssituation; DDA, BfN, LAG VSW: Münster, Germany, 2019. [Google Scholar]
- Batáry, P.; Báldi, A.; Erdős, S. Grassland versus non-grassland bird abundance and diversity in managed grasslands: Local, landscape and regional scale effects. In Vertebrate Conservation and Biodiversity; Hawksworth, D.L., Bull, A.T., Eds.; Springer: Dordrecht, The Netherlands, 2006; pp. 45–55. [Google Scholar] [CrossRef] [Scilit]
- With, K.A.; King, A.W.; Jensen, W.E. Remaining large grasslands may not be sufficient to prevent grassland bird declines. Biol. Conserv. 2008, 141, 3152–3167. [Google Scholar] [CrossRef] [Scilit]
- Schipper, A.M.; Belmaker, J.; de Miranda, M.D.; Navarro, L.M.; Böhning-Gaese, K.; Costello, M.J.; Dornelas, M.; Foppen, R.; Hortal, J.; Huijbregts, M.A.J.; et al. Contrasting changes in the abundance and diversity of North American bird assemblages from 1971 to 2010. Glob. Chang. Biol. 2016, 22, 3948–3959. [Google Scholar] [CrossRef] [Scilit]

Publisher’s Note: MDPI stays neutral with regard to jurisdictional claims in published maps and institutional affiliations. |
© 2022 by the authors. Licensee MDPI, Basel, Switzerland. This article is an open access article distributed under the terms and conditions of the Creative Commons Attribution (CC BY) license (https://creativecommons.org/licenses/by/4.0/).