


Abstract
Wildlife–vehicle collisions, as well as environmental factors that affect collisions and mitigation measures, are usually modelled and analysed in the vicinity of or within roads, while habitat attractiveness to wildlife along with risk to drivers remain mostly underestimated. The main goal of this study was the identification, characterisation, and ranking of mammalian habitats in Lithuania in relation to 2002–2017 roadkill data. We identified habitat patches as areas (varying from 1 to 1488 square kilometres) isolated by neighbouring roads characterised by at least one wildlife–vehicle collision hotspot. We ranked all identified habitats on the basis of land cover, the presence of an ecological corridor, a mammalian pathway, and roadkill hotspot data. A ranking scenario describing both habitat attractiveness to wildlife and the risk to drivers was defined and applied. Ranks for each habitat were calculated using multiple criteria spatial decision support techniques. Multiple regression analyses were used to identify the relationship between habitat ranks, species richness, and land cover classes. Strong relationships were identified and are discussed between the habitat patch ranks in five (out of 28) land cover classes and in eight (out of 28) species (97% of all mammal road kills). We conclude that, along with conventional roadkill hotspot identification, roadkill-based habitat identification and characterisation as well as species richness analysis should be used in road safety infrastructure planning.
1. Introduction
Wildlife–vehicle collisions (WVCs) pose a threat to human life and biological diversity and result in damage to property [1,2,3,4,5,6]. Over the last two decades in Lithuania, while the overall number of road traffic accidents has continuously decreased, road accidents involving wildlife have increased [7].
To mitigate mammal–vehicle collisions (MVCs), fencing, underpasses, gates, and jump-out ramps are used as the most common mitigation measures in the country [8]. Additional road safety infrastructure elements such as repellents, reflectors, noise, and natural predators can also be used; these focus on a single and/or multiple wildlife species. They repel, attract, or redirect wildlife with different ecological and financial efficiencies [9,10,11,12,13,14,15,16,17,18]. The selection of tangible multi-scale [19], multi-objective, and multi-functional WVC mitigation measures is the focus of a considerable research challenge [20].
The identification of roadkill hotspots (road sections where collisions occur more frequently than expected) is the first step of the highway safety management process. However, erroneous hotspot identification [21] as well as gaps in roadkill data [1] may result in inefficient use of resources for safety improvements [22]. There are many generalised linear models [23] that can be used to identify hotspots, such as ecological niche modelling [24], kernel density estimation [25,26,27], distance-based approaches [28], and methods based on modelling the number of collisions in a road section assuming a Poisson distribution [21,29,30,31,32]. These methods use roadkill data to detect collision hotspots as well as their risk to drivers. In order to assess habitat attractiveness to wildlife and the associated habitat risk to drivers, it is important to understand where mammals cross roads more frequently.
Multiple habitat suitability [33,34,35] is determined by spatial [36,37] and temporal [7,38,39,40,41] factors that might help us to identify and characterise wildlife habitats, animal movement patterns, and corridors [42,43,44,45,46]. Habitat suitability, together with spatial and temporal factors, helps us to obtain knowledge on how and when mammals traverse the landscape.
Field research usually brings disparate results [47] of differential scale and quality [1]. Consequently, the results are frequently not fit for deriving habitat patch characteristics and assessing habitat attractiveness to wildlife. This would require standardised habitat data that are usually lacking.
Habitats can be characterised using behavioural and spatiotemporal events, landscape connectivity and fragmentation, species richness, animal abundance, and other field research data. Large scale, long-term, and accurate data that can characterise habitats usually require methodologically robust and expensive research. Employing the available roadkill data from police reports would decrease (not replace) the amount of field research required in cases when there is insufficient habitat data available. Multiple, long-term, and standardised habitat characteristics (criteria) can help us to identify MVC mitigation measures focused on single or multiple species.
Decision-makers often deal with problems that involve multiple criteria [48,49,50,51]. Identification of the primary sources of MVCs, namely the habitats that are highly attractive to wildlife and simultaneously of high risk to drivers, is also a multiple criteria analysis problem. Therefore, we selected Simple Additive Weighting (SAW) and Technique for Order of Preference by Similarity to Ideal Solution (TOPSIS) [49,52] multi-criteria spatial decision support techniques for the ranking of habitats. The habitat ranking outcomes can be considered reliable if both methods generate similar ranking results [8].
Wildlife–vehicle collisions, as well as environmental factors that affect collisions and mitigation measures, are usually modelled and analysed at the level of the roads themselves [7,8,53,54,55,56], while the wider issues of adjacent habitat attractiveness to wildlife and its risk to drivers remain underestimated. MVCs with wild species accounted for about 91% of all WVCs in Lithuania in 2002–2017 [57]. There is a need for a framework that helps us to unify the disparate results emerging from different data sources and field studies on MVC occurrence, which allows for roadkill-based identification, characterisation, and multi-objective ranking of mammalian habitats by their attractiveness to wildlife and their risk to drivers. Here, we understand “risk to the driver” as a derivative of the cluster strength in KDE+ [26,27].
In this study, habitat identification, characterisation, and ranking are based on the definition of habitats as “areas isolated by neighbouring roads that have at least one hotspot (a road section where MVCs occur more frequently than expected)” and the assumptions that (1) highly attractive habitats for wildlife increase the risk of MVCs on adjacent roads; (2) habitats that are surrounded by roads with an abundance of MVC hotspots are of high attractiveness to wildlife movement; and (3) road kills in the hotspots can help us to identify species richness within adjacent habitats. However, the accuracy of such estimations depends on the completeness of MVC data [1].
The overall purpose of this study, therefore, is to:
- Identify habitat patches that are surrounded by roads with kernel density estimation (KDE+)-based [27] MVC hotspots;
- Characterise habitat patches using the properties of adjacent habitats, hypothetical corridors and wildlife pathways, hotspots, and land cover data;
- Define ranking scenarios (criteria utility functions and criteria weights) to detect habitat patches that are highly attractive to wildlife [37] and pose a risk to drivers [27];
- Rank habitat patches using two different multiple criteria spatial decision support techniques: SAW and TOPSIS; and
- Find relationships between habitat ranks, species richness, and land cover classes for use in the planning of multispecies MVC mitigation measures using multiple linear regressions.
2. Materials and Methods
2.1. Study Area
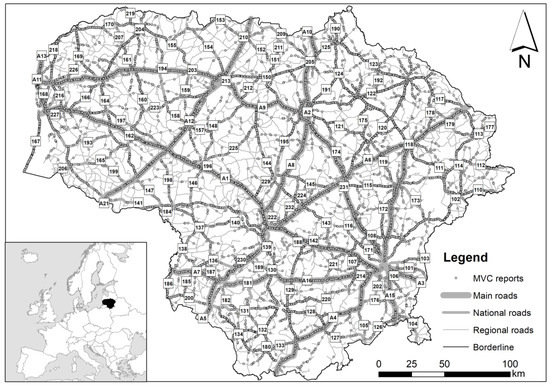
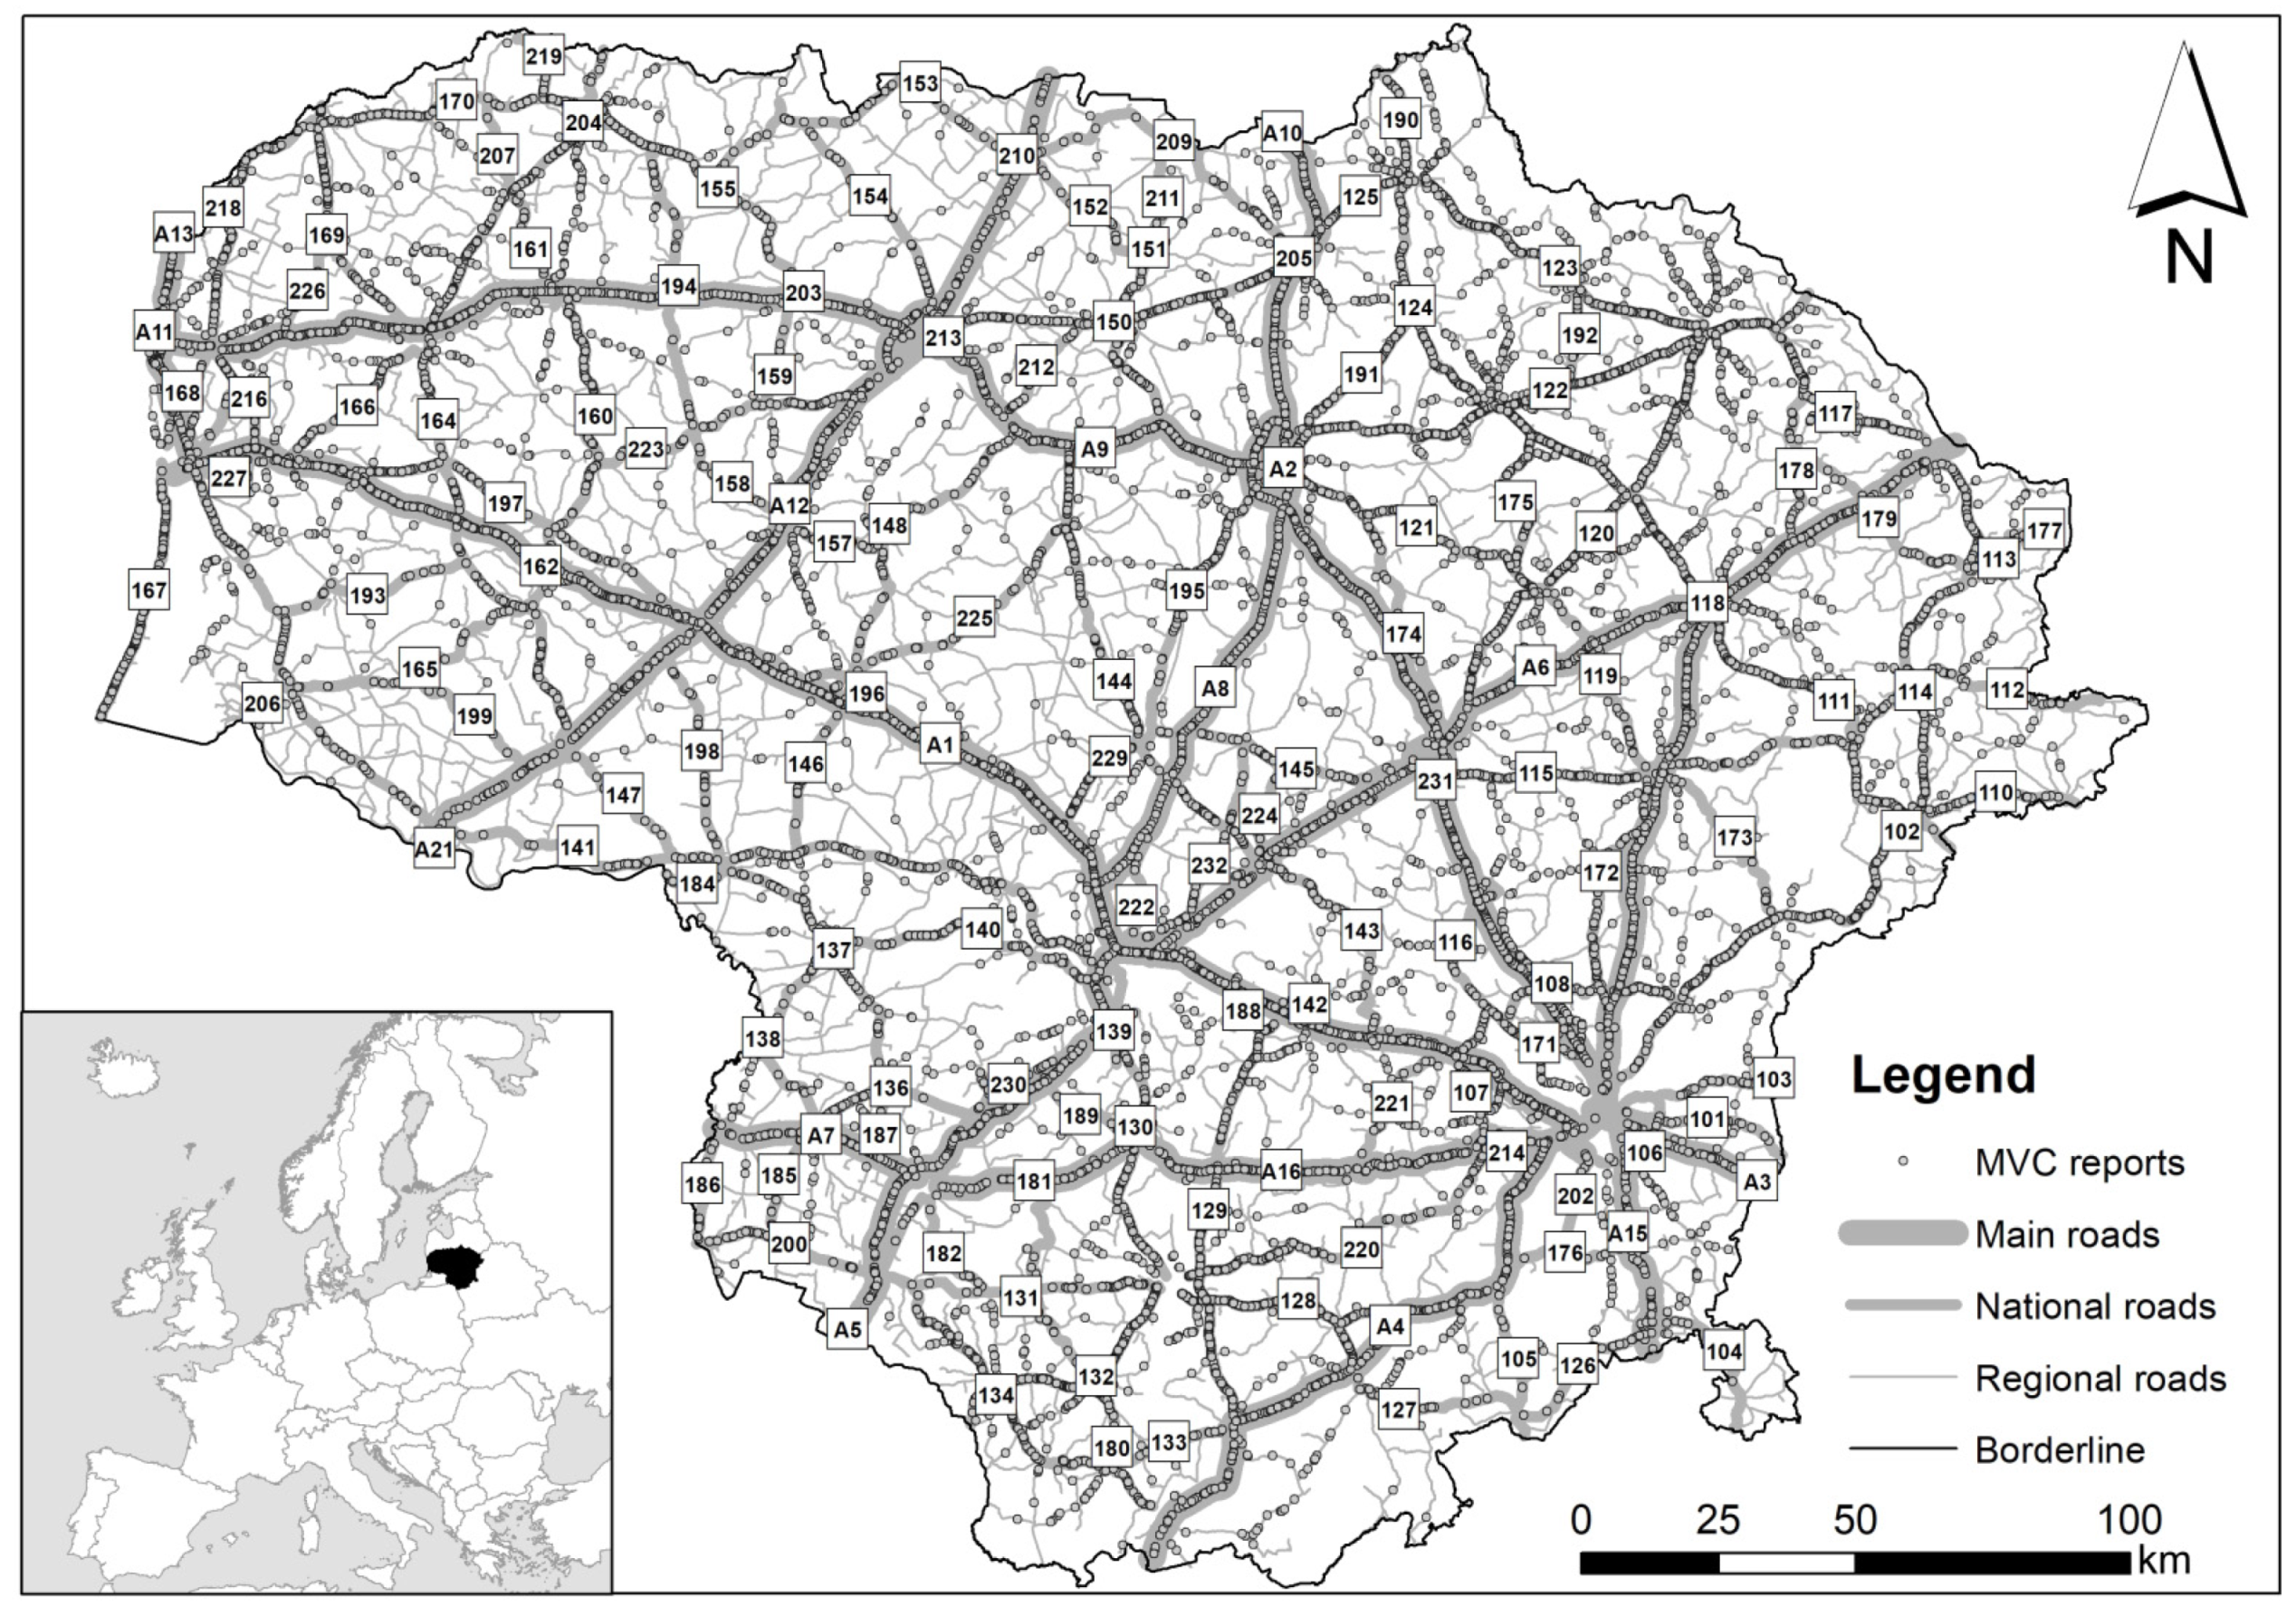
Our study area covers the entire territory of Lithuania (Figure 1), which can be characterised as mostly a plain. It represents a surface area of 65,286 square kilometres. In 2012, 33% of the surface was covered by arable land and permanent crops, 27% by semi-natural vegetation, 33% by forested land, 3% by developed (artificial) areas, and 4% by water bodies and other land. The land cover change (a 0.48% change rate per year) in the country is slowing, mainly due to a rapid decrease in the intensity of forest conversion [58].
Figure 1.
The study area, roads (main roads/highways, national and regional), and locations of MVCs in 2002–2017.
In 2017, there were 21,244 km of State-owned roads of national significance (excluding roads in cities): 1751 km of main roads; 4925 km of national roads; and 14,568 km of regional roads [59]. In this study, we analysed 1784 roads (21 main/highway, 13 national, and 1631 regional) as shown in Figure 1.
In the period 2002–2017, the annual average daily traffic (AADT) increased from 5600 to 11,000 vehicles a day on main roads, from 2200 to 2900 vehicles a day on national roads, and remained at up to 500 vehicles a day on regional roads [60].
2.2. Mammal–Vehicle Collision Data
According to the data from the Lithuanian Police Traffic Supervision Service and the Nature Research Centre, a total of 24,083 WVCs were recorded over the period 2002–2017 in Lithuania [57]. These numbers may, however, have a bias regarding taxonomic groups and not account for all accidents as reporting to the authorities is not mandatory in Lithuania. The Traffic Supervision Service registers only road kills from those accidents that were reported by drivers; therefore, their data are biased to larger species. Small mammals are represented exclusively in the data from the Nature Research Centre, which registered all road kills.
Out of all WVCs, we selected 21,911 WVC reports that involved mammals. A total of 19,622 reports included accurate information relating to 32 wild mammal species (Table 1). Of these reports, we mapped the 18,218 reports that included precise information on location (Figure 1, Table 1).
Table 1.
Numbers of MVCs with wild mammals in Lithuania with precise location and species information. Species included in the national Red data list are marked with an asterisk.
2.3. Clustering of Collision Data
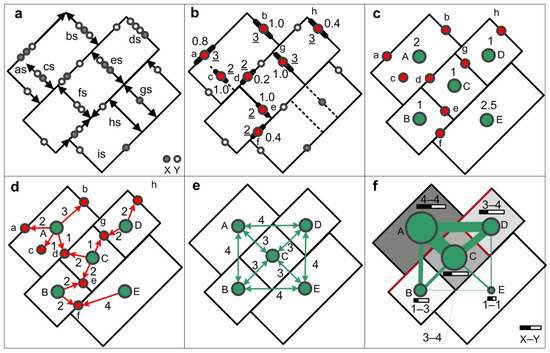
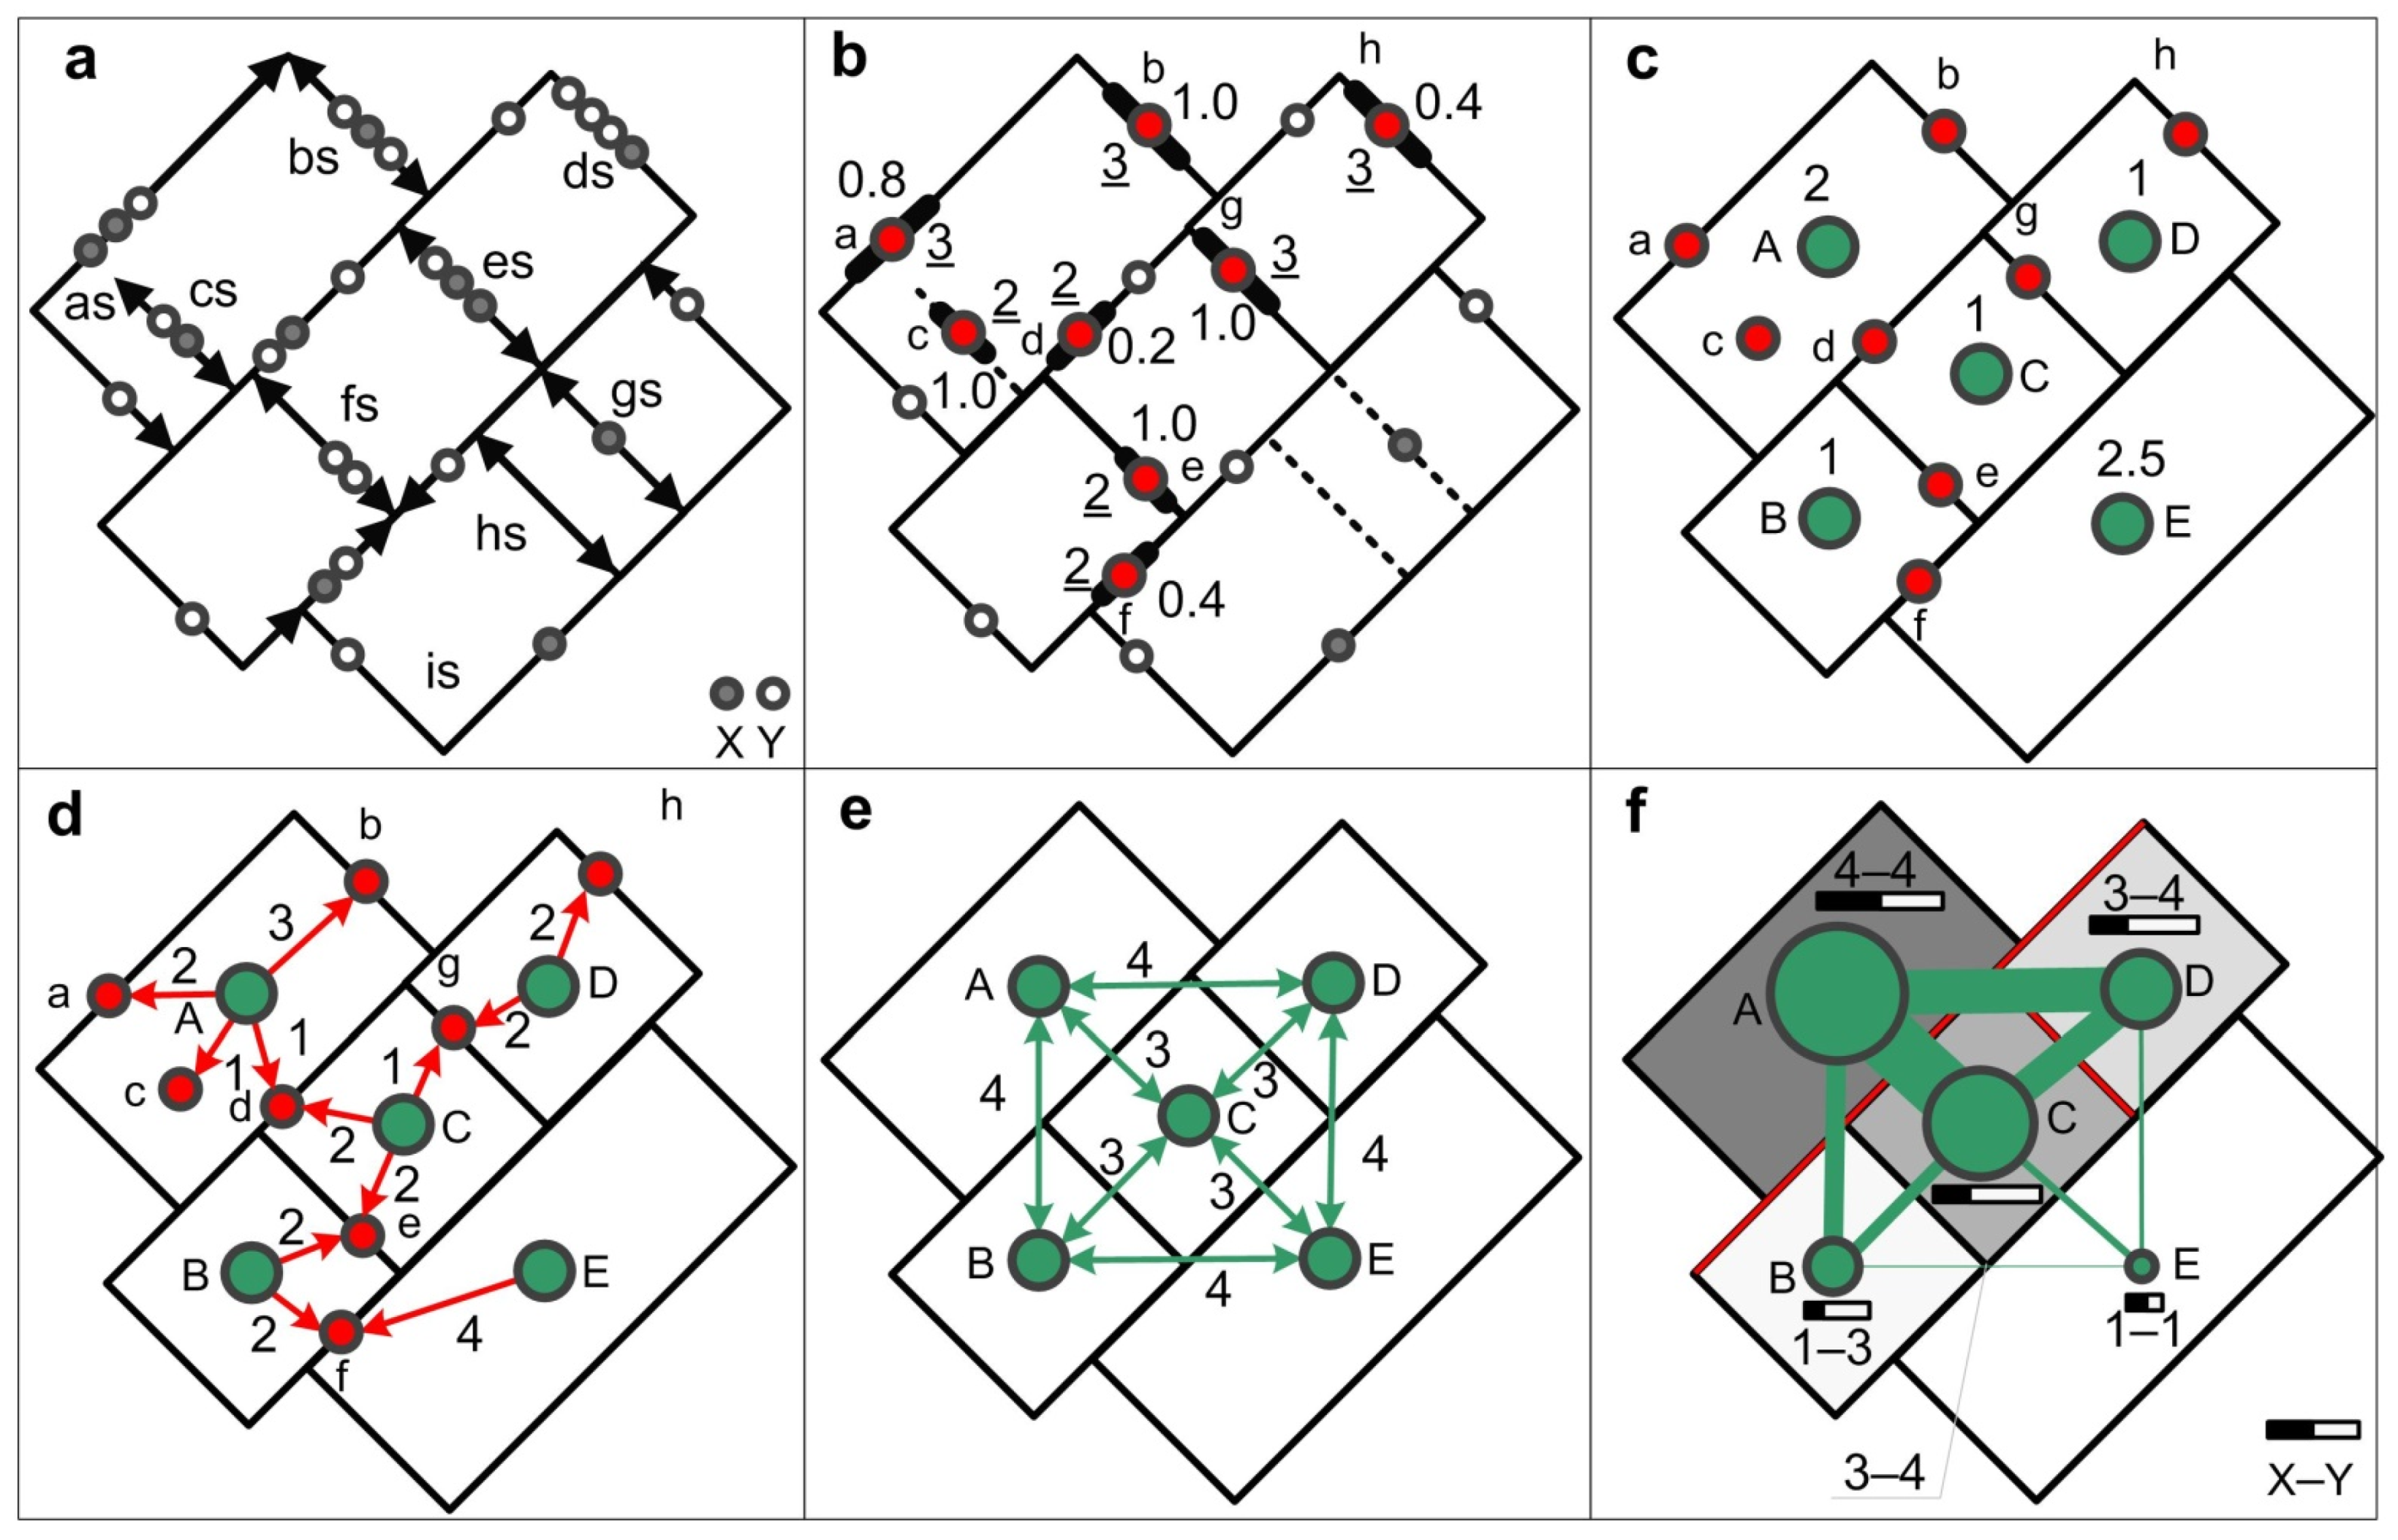
Using a clustering method, habitats were identified according to the location of hotspots. The literature contains many different spatial techniques for identifying short, significant road segments where collisions occur more frequently than usual [21,27,32,61,62,63,64,65,66]. We utilized the KDE+, which analyses MVCs that are represented as point features and are located along the roads represented as line features (Figure 2a). The KDE+ algorithm finds locations (clusters) with statistically significant concentrations of collisions and assigns strength values (measured from 0 to 1) showing the risk severity to drivers [27,36] (Figure 2b). We performed MVC clustering analysis and created MVC clusters using the KDE+ parameters derived from the road network properties (KDE+ bandwidth—150 metres, Monte Carlo simulations—800, and minimal cluster strength—0.2).
Figure 2.
Roadkill-data-based identification, characterisation, and ranking of mammalian habitats: (a) MVC reports (small dots) with different species (dots marked as X and Y) placed within a road network (double-arrowed and labelled lines); (b) KDE+ clusters (short thick lines) labelled with underlined integer numbers show the length and non-integer numbers the strength of a cluster, small grey and white dots represent MVCs that did not form a cluster, and dashed lines represent the roads without clusters that did not form habitat patches; (c) Numbers show areas of habitat patches; (d) Numbers represent the length of hypothetical wildlife pathways (single-arrowed lines); (e) Numbers represent the length of hypothetical mammal corridors (double-arrowed lines); (f) Larger dots (habitat patches), darker colours of habitat patches, and thicker lines (corridors) represent a higher risk to drivers and higher attractiveness to wildlife, red lines (roads) highlight the highly ranked adjacent habitat patches, white- and black-coloured bars illustrate the share of species richness (for species X and Y), and labels show the number of mammals involved in MVCs (within the clusters); (b–d) Red dots represent the centre points of clusters; (c–f) Habitat patches (large green dots and polygons) labelled as ABCDE are represented by centre points.
2.4. Definition of Mammalian Habitats and Movement Patterns
Our conceptual model for the identification of mammalian habitats is shown in Figure 2a–c, characterization in Figure 2d,e, and ranking of habitat patches in Figure 2e. MVC reports with different species were mapped on the road network. Road sections where MVCs occurred more frequently were identified using the KDE+ clustering method [27].
We assumed that roadkill clusters are important indicators not only of risk to drivers [27], but also indicate locations where important mammalian pathways and roads intersect. We identified habitat patches as areas that are bounded (surrounded) by neighbouring road sections characterised by at least one cluster. We merged habitats having no clusters with neighbouring habitats iteratively until a merged habitat patch had a road with at least one neighbouring cluster. In our study, urban areas and urban clusters were excluded and not used for the identification of habitats. Identified habitats were used for their characterisation and, later, for ranking.
Hypothetical wildlife pathways were created by connecting the Clementini [67] centroids of habitat patches and cluster centroids using spider lines illustrating the shortest (Euclidean) distances. Hypothetical mammal corridors were created using the triangulated irregular network (TIN) between the Clementini [67] habitat patch centroids as peaks [37,42].
2.5. Characterisation of Mammalian Habitats
The habitat patches (Figure 2c) were characterised using topological relationships between habitat patches, hypothetical pathways, and corridors. Each cluster centroid illustrates a “gateway” that mammals use to traverse from one habitat patch to another.
Following this conceptual framework (Figure 2), we identified and collected the necessary network-based criteria (Table 2) for each habitat patch. Later, the habitat patches were ranked according to their attractiveness to wildlife and risk severity to drivers.
Table 2.
Criteria used for ranking the habitat patches described in Figure 2.
2.6. Objective Functions and Criteria Importance
The objective criterion importance (weights) for all criteria was calculated based on criteria utility (minimisation/maximisation) functions using SortViz for the ESRI inc. ArcGIS desktop software add-in [37,68].
Using the same ArcGIS desktop software add-in, we ranked habitat patches based on criteria derived from the individual (Figure 2) and spatial connectivity properties (Table 2) of the habitat patch. In order to find habitat patches that were simultaneously the most attractive to wildlife and of most severe risk to drivers, modelling assumptions (see Table 2’s footnote) and objective (utility) functions (Table 2) were set.
2.7. Ranking of Habitats and Ecological Corridors
Criterion importance values, defined as weights (Table 2), were then used as an input for ranking the habitat patches using the SAW and TOPSIS [49,52] methods. Both ranking approaches use the same input habitat data (Table 2). The final SAW and TOPSIS values ranged from 0 (worst) to 1 (best) and altogether built the so-called ‘composite indicator’ of habitat attractiveness to wildlife (mammals) and risk to drivers. A higher rank value means higher attractiveness to wildlife and a higher risk to drivers. The SAW and TOPSIS values for each habitat patch were separately calculated and compared with each other (Table 2).
Average SAW and average TOPSIS rank values, derived from the habitat patches connecting the two ends of the corridor, were allocated to each ecological corridor to determine the relative importance of the corridor (Figure 2f, Table 3).
Table 3.
Average SAW and TOPSIS rank values (Figure 2f).
2.8. Identification of Key Habitat Characteristics
We assessed the relationship (a correlation matrix using Pearson’s correlation index) between habitat patch ranks, number of species, and CLC land cover [70,71] classes [72]. Interpretation of r: 0—no association; 0 to 0.25 (0 to −0.25)—weak association; 0.25 to 0.50 (−0.25 to −0.50)—moderate association; 0.50–0.75 (−0.50 to −0.75)—strong association; 0.75 to 1.00 (−0.75 to −1.00)—very strong association; and 1 (−1) perfect association [73].
We analysed land cover classes and species that had a strong (r > 0.50) relationship to habitat ranks (SAW and TOPSIS values). Habitat ranks were used as intercept and land cover classes and species as independent regressors.
3. Results
3.1. Habitats and Habitat Characteristics
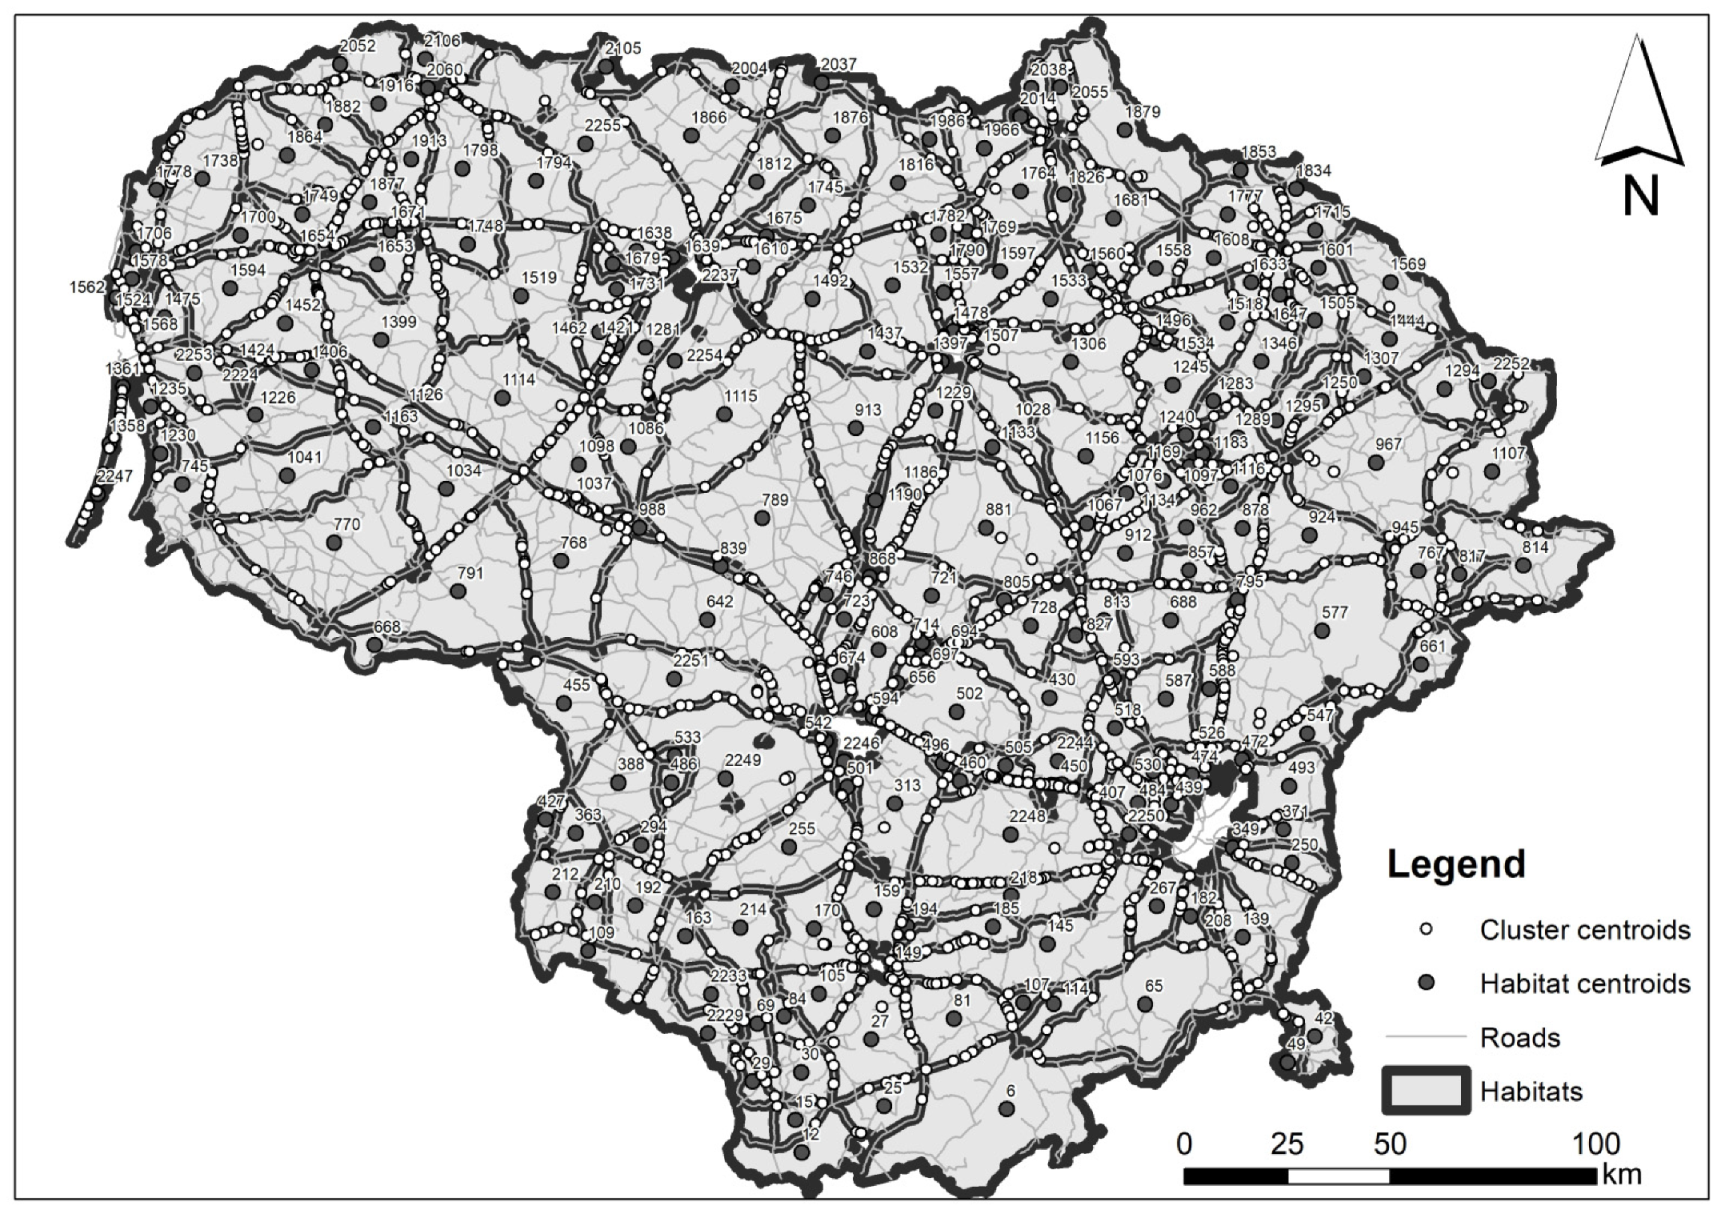
We identified 281 state-owned roads with at least one KDE+ cluster (Figure 3): 18 main roads/highways; 107 national roads; and 156 regional roads (85.7%, 81.1%, and 9.6% of all roads in their respective category). The rest of the roads (thin grey lines in Figure 4) were not taken into account.
Figure 4.
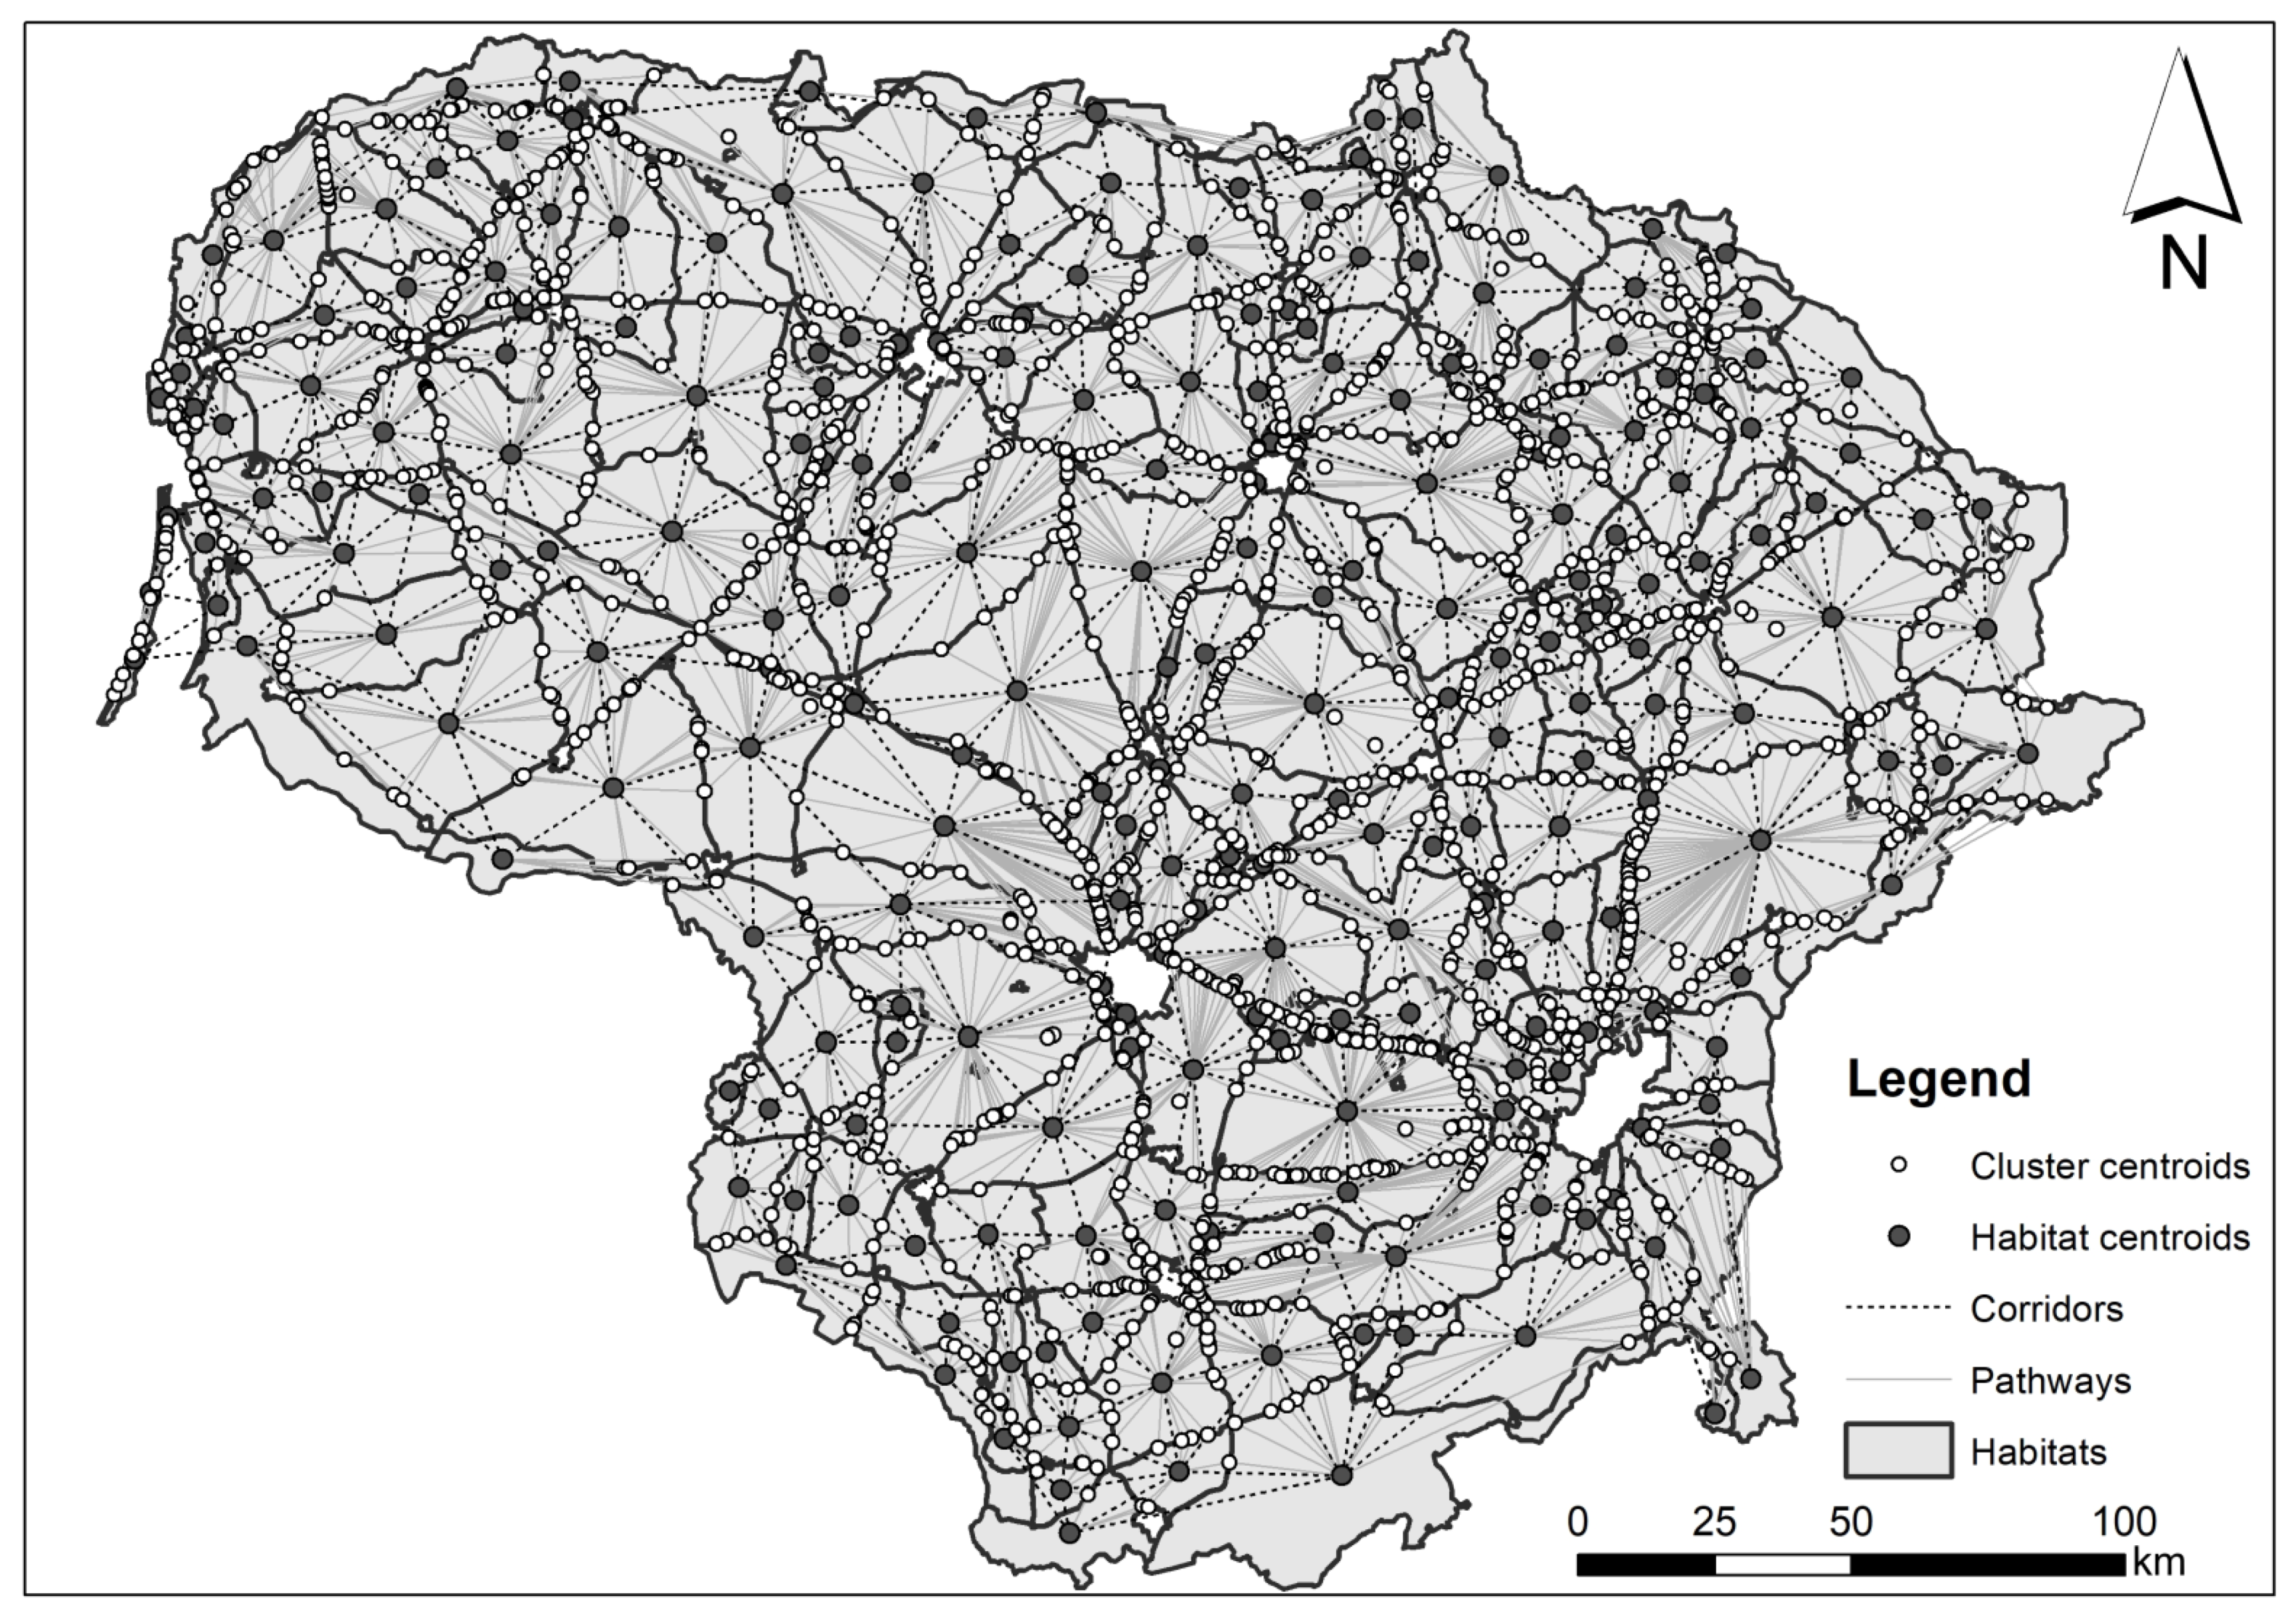
Topologically connected hypothetical mammalian pathways (spider lines) and ecological corridors (the triangulated network) used for the characterisation of newly identified habitat patches.
Using the KDE+ method, we found 1642 mammalian clusters (Figure 3), of which 22 (1.3%) were located in urban areas and therefore were excluded from further analyses. A total of 28 out of the 32 road-killed mammal species were identified within the clusters. Four small-sized mammals (M. glareolus, S. araneus, R. rattus, N. fodiens) were only registered as road kills outside the clusters. However, small numbers of these species registered in the road kills (Table 1) had no impact on the location and number of identified clusters.
We identified 3171 hypothetical mammalian pathways (thin grey lines in Figure 4), 672 corridors (dashed lines in Figure 4), and 243 habitat patches (Figure 4). The hypothetical mammalian pathways (Figure 2d and Figure 4) and corridors (Figure 2e and Figure 4) were used for the characterisation and collection of criteria (Table A1 and Table A2) for habitat patches (Figure 4).
3.2. Criteria Weights, Habitat Ranks, Ecological Corridors, and Movement Patterns
In order to rank the identified habitat patches (Table A1), the criteria weights (Table 4) were calculated using objective functions (Table 2). The most important criterion for assessment was the shortest length of adjacent pathways, while the least important was the number of adjacent corridors.
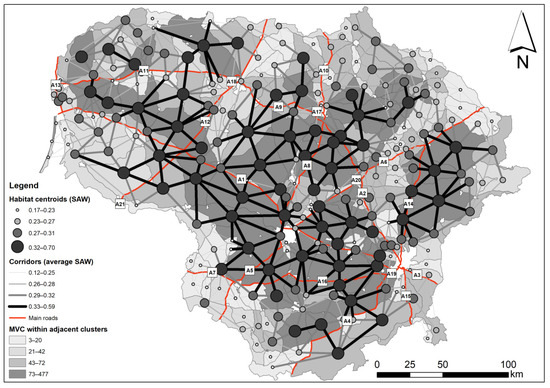
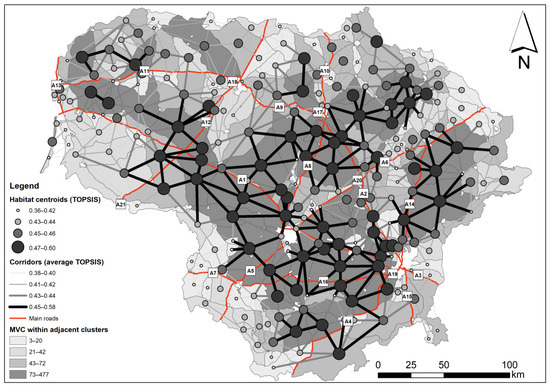
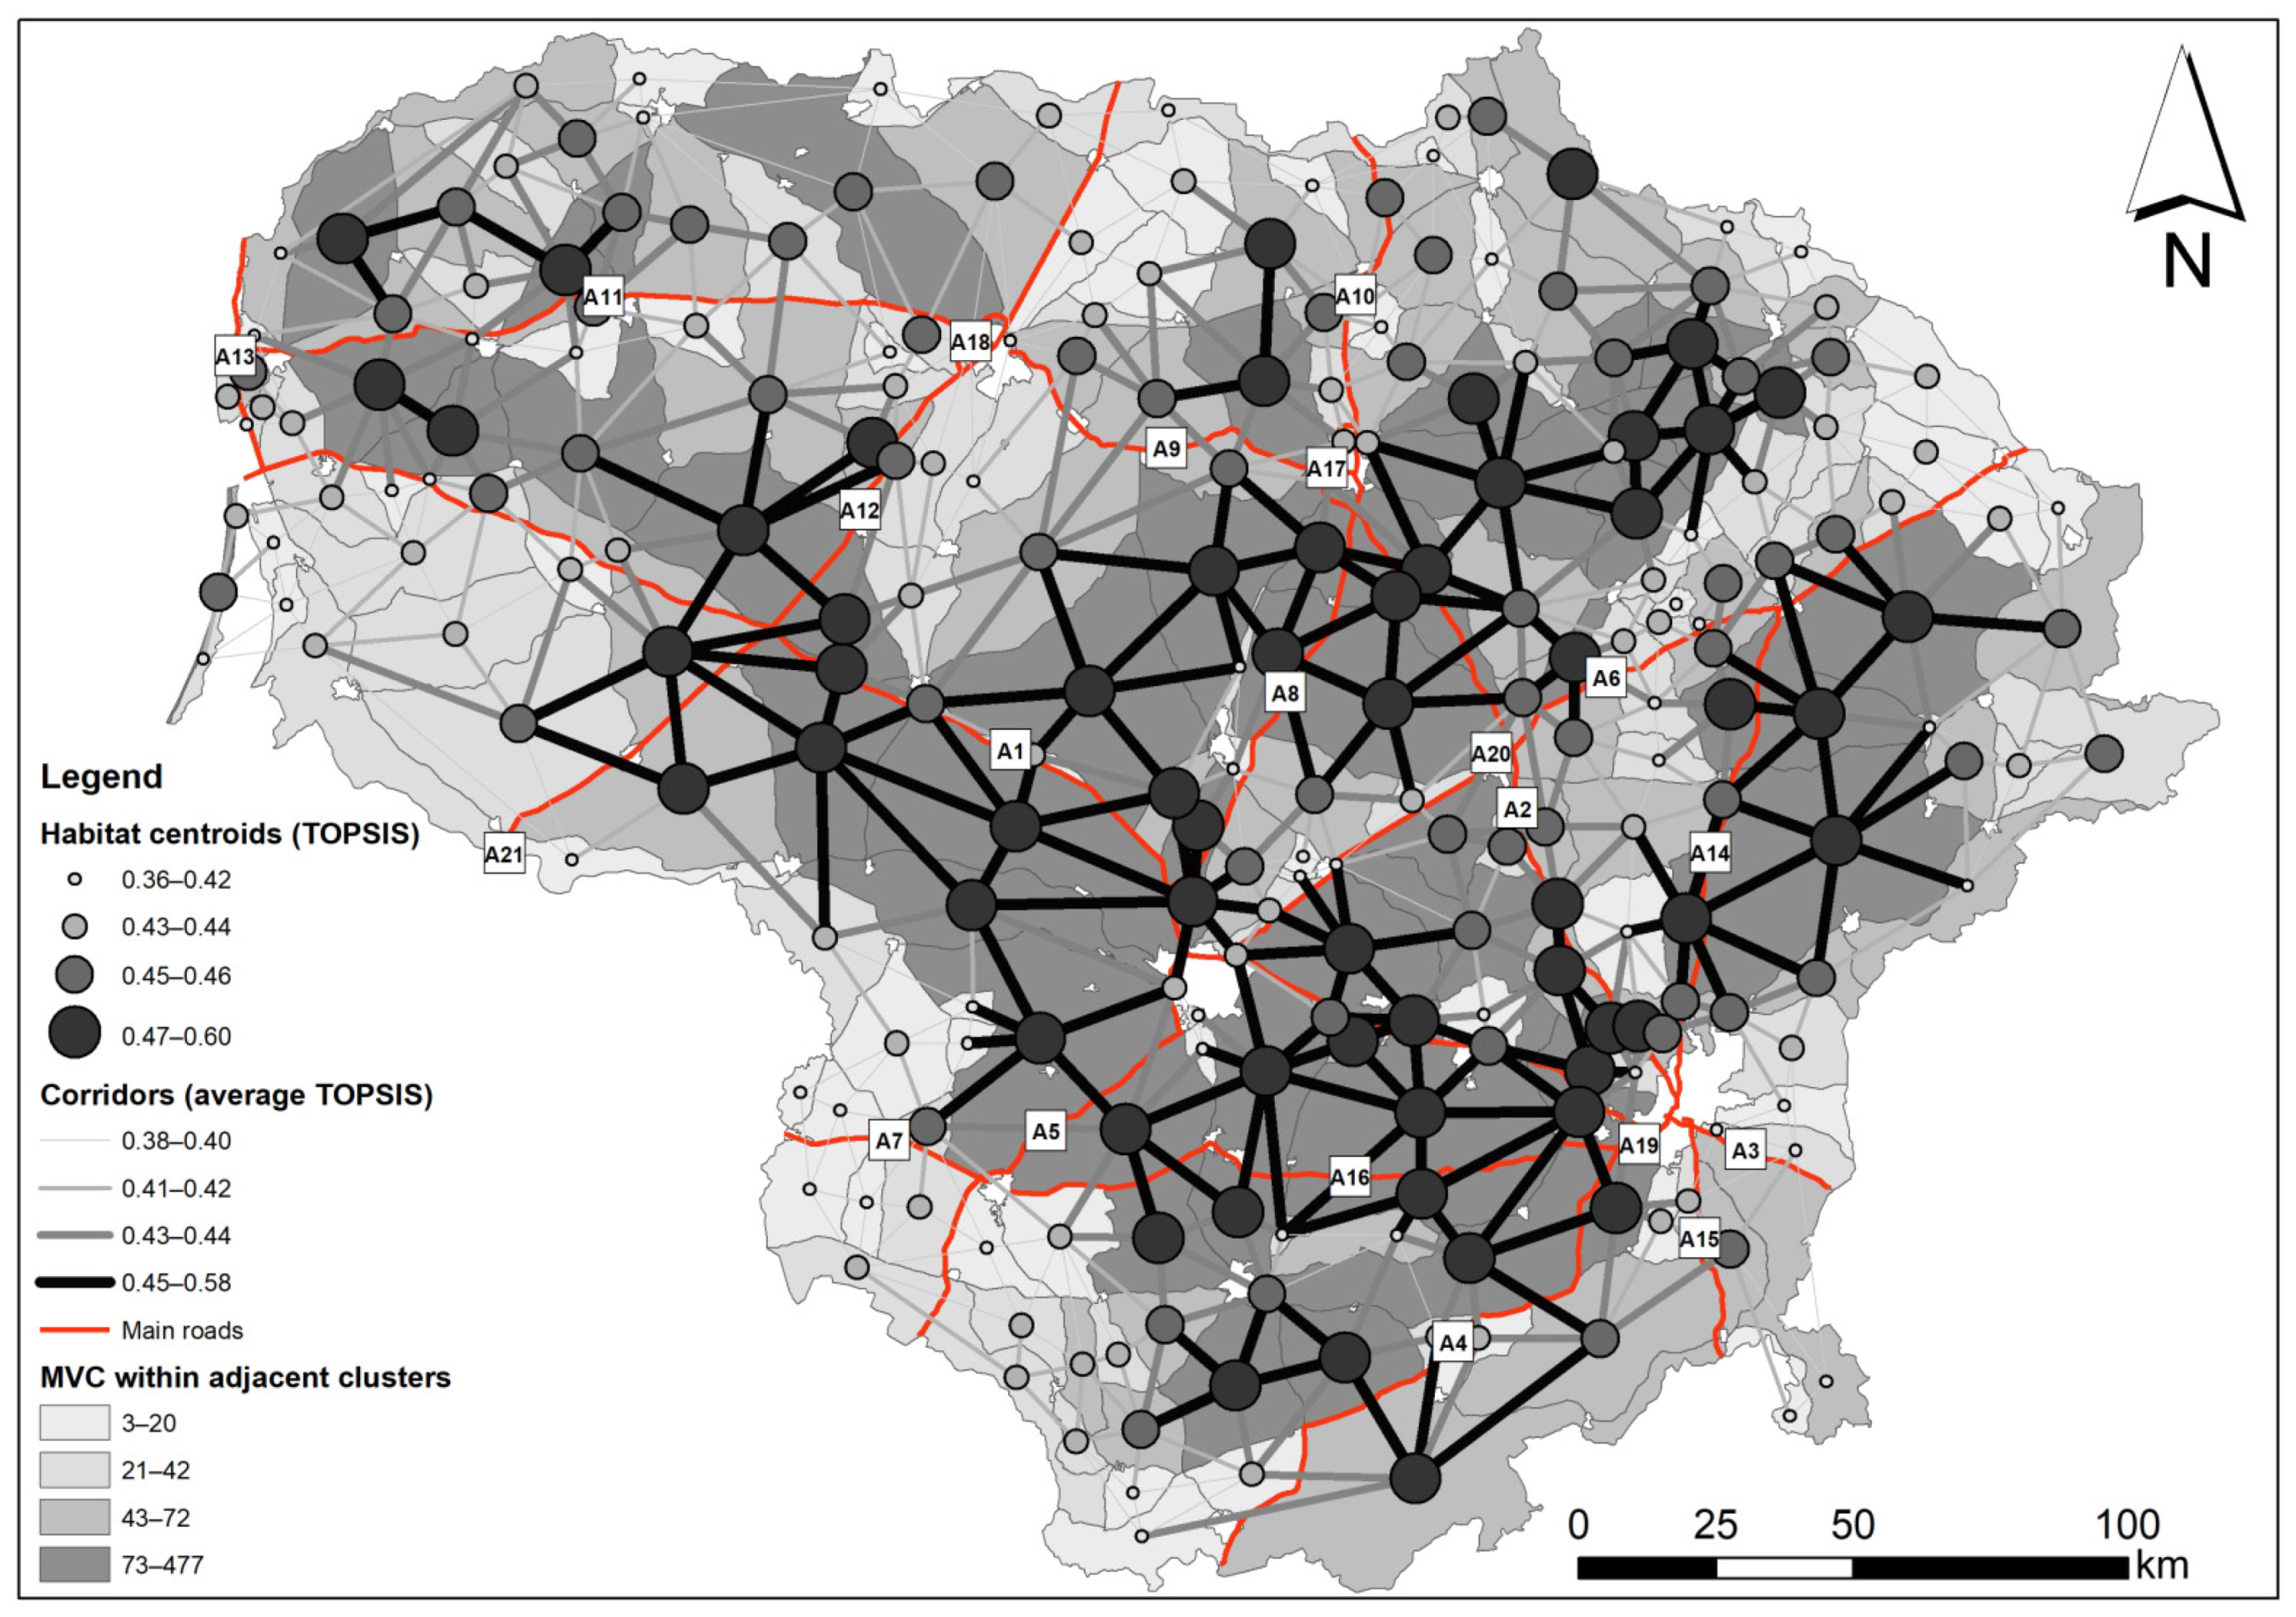
Following objective functions, the SAW (Figure 5) and TOPSIS (Figure 6) ranks (Table A2) were assigned to each habitat patch. The average rank values were calculated for the corridors as well. The labels (Figure 5 and Figure 6) identify the main roads.
Figure 5.
Habitat centroids, corridor links, and MVC quartiles derived using SAW values (the mapping approach is shown in Figure 2f).
Figure 6.
Habitat centroids, corridor links, and MVC quartiles derived using TOPSIS values (the mapping approach is shown in Figure 2f).
The highest SAW and TOPSIS rank values assigned to the habitat patches were 0.7 and 0.6, respectively. Furthermore, the SAW and TOPSIS ranks of habitats had a very strong correlation (r = 0.86), which means that the ranking results are similar and can be trusted.
The habitat patches contained from 3 to 477 MVCs and from 1 to 20 road-killed mammal species (Table A2). The corridor links (Figure 5 and Figure 6) indicate the most probable movement patterns. The highly ranked corridors that intersect main roads highlight the highest potential risk to drivers and wildlife. Consequently, the MCV clusters that are on the roads with such intersections are of the highest importance for MVC mitigation actions.
3.3. Relationship between Habitat Ranks, Species Richness, and Land Cover Classes
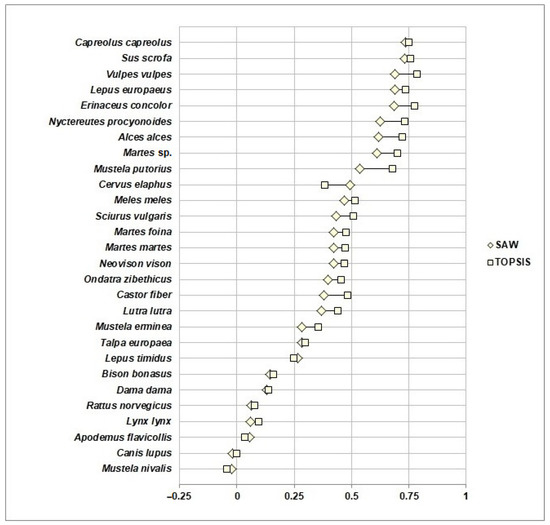
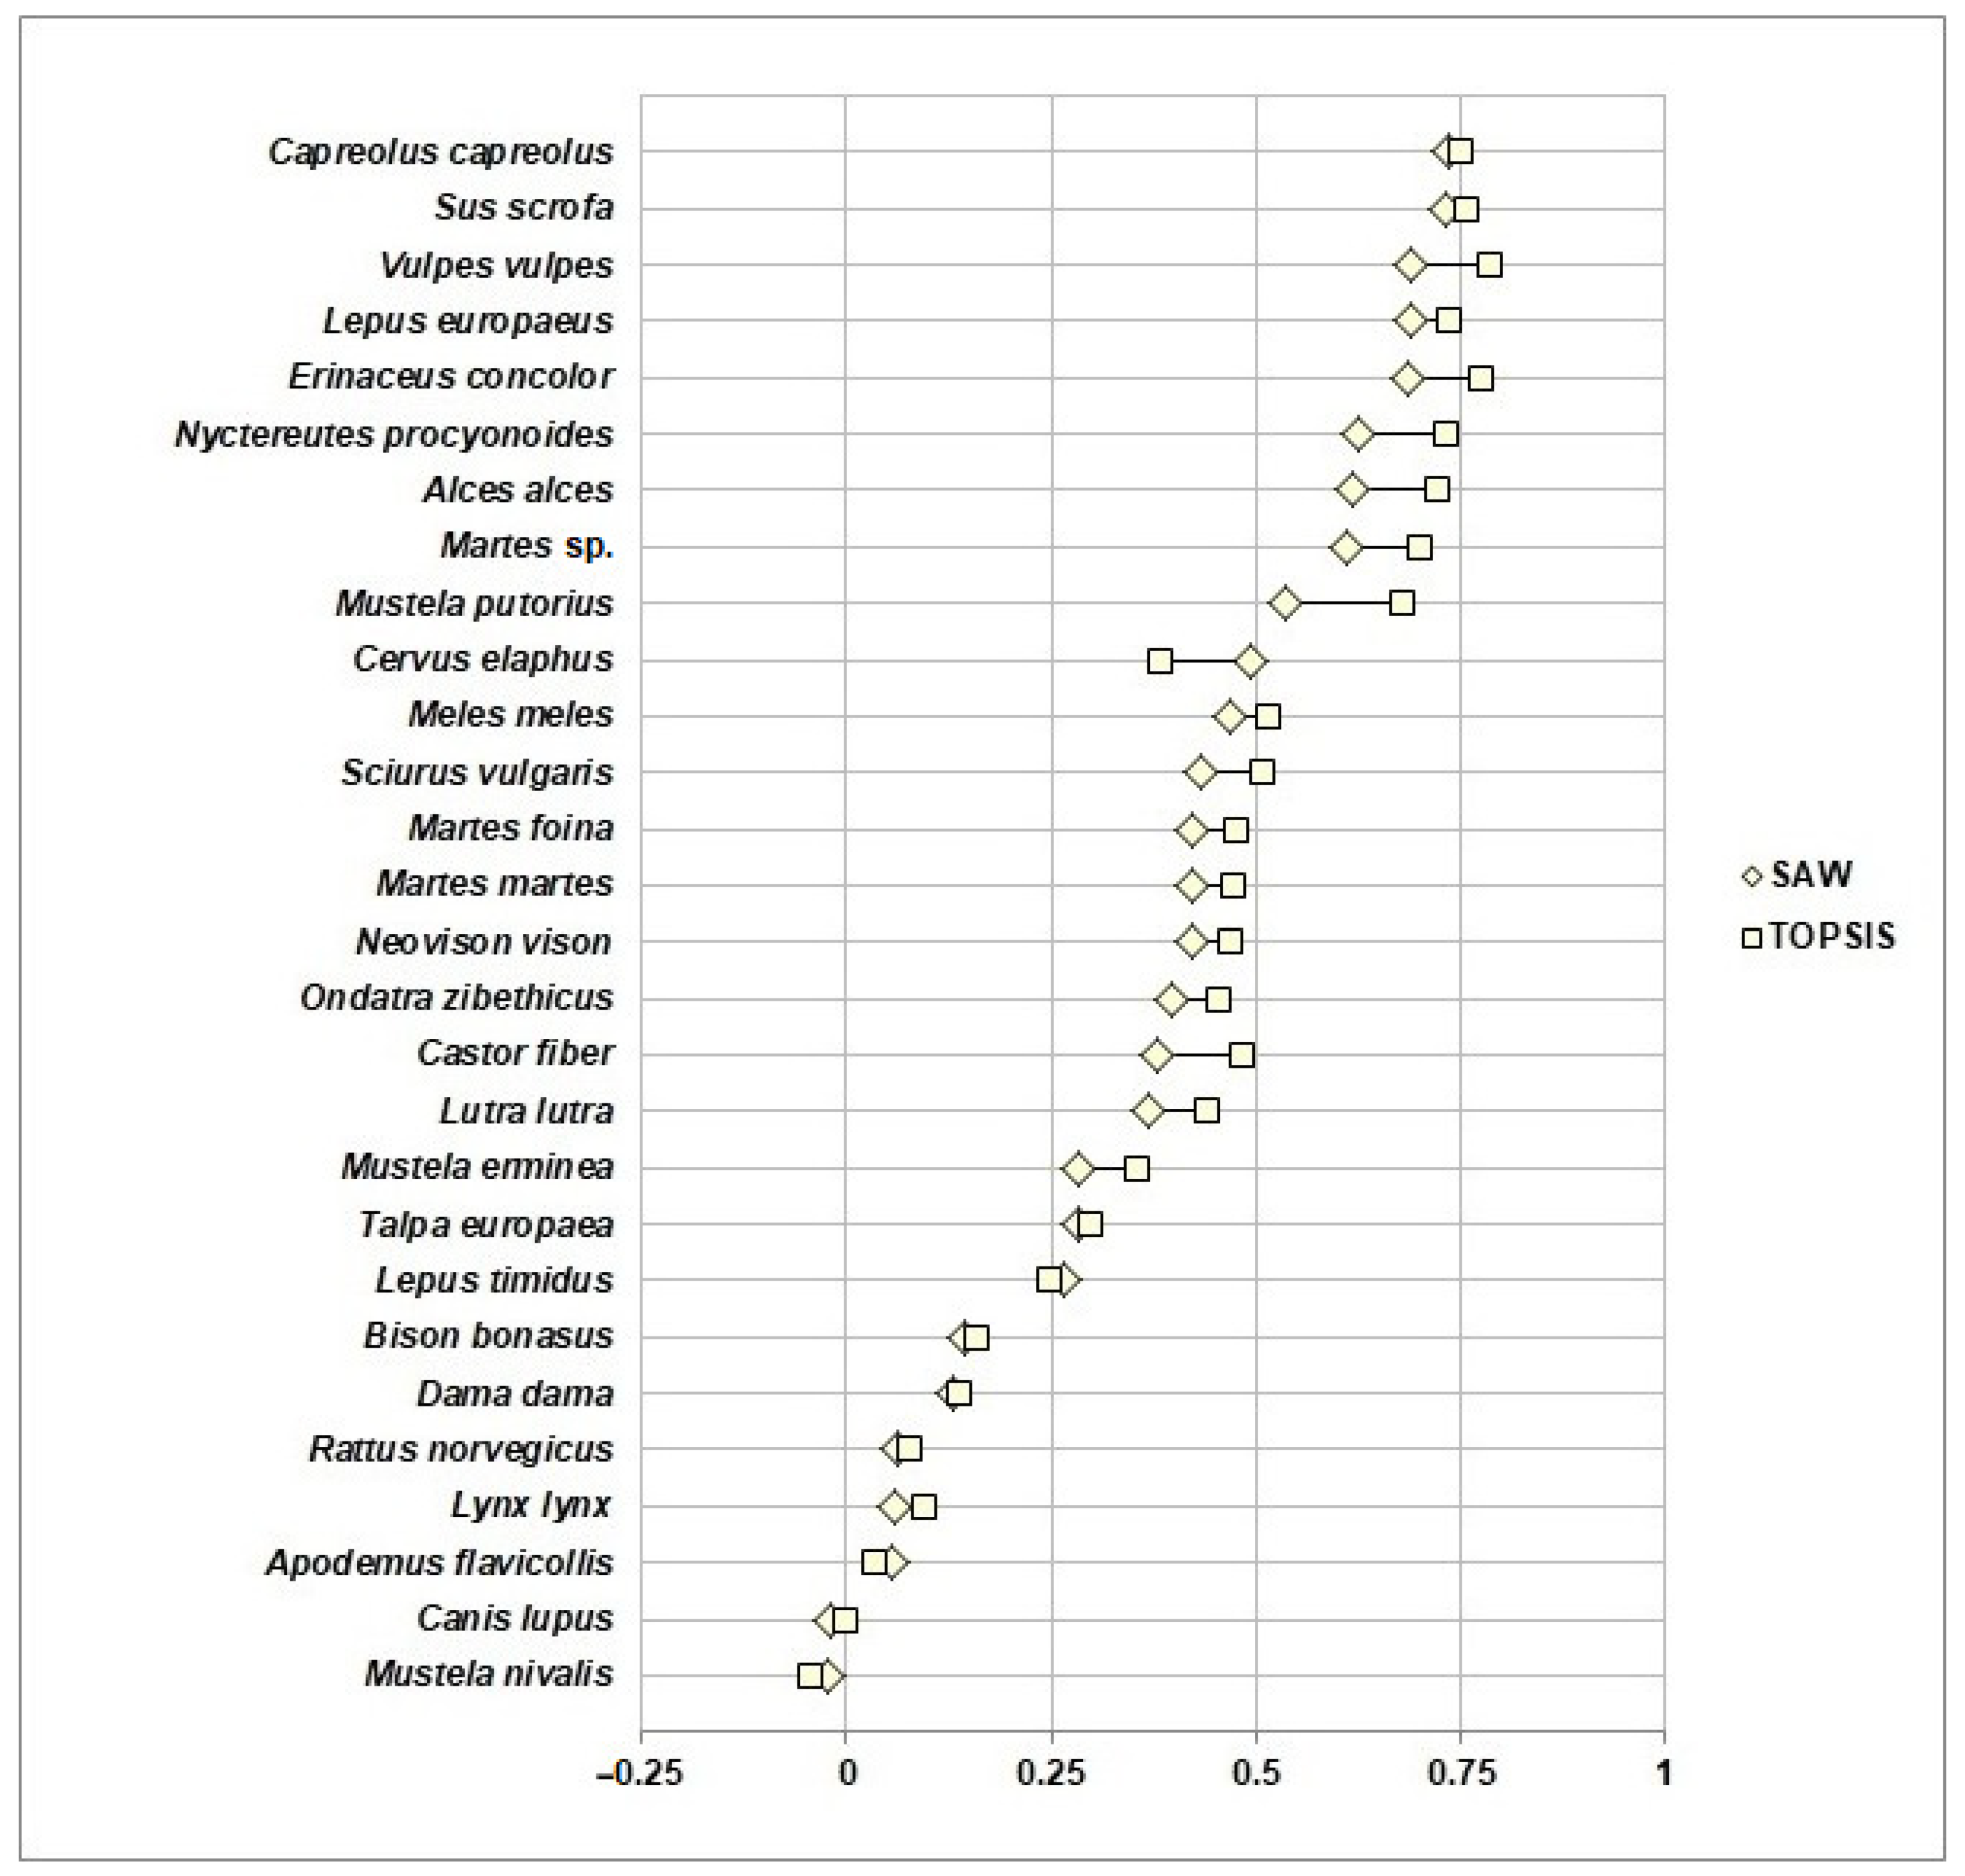
Inside the clusters, MVCs with C. capreolus, S. scrofa, V. vulpes, L. europaeus, E. concolor, N. procyonoides, A. alces, M. putorius, and Martes sp. had strong relationships (r > ~0.5) with habitat patch ranks, showing the high severity risk to drivers and wildlife (Figure 7). All other species had a weak or no relationship with habitat patch ranks. Five of these species, B. bonasus, L. lynx, M. erminea, L. lutra, and L. timidus, are rare in nature (Table 1), while others are small in size and their road kills were most probably under-registered.
Figure 7.
Relationships between different habitat patch ranks and species involved in MVC clusters.
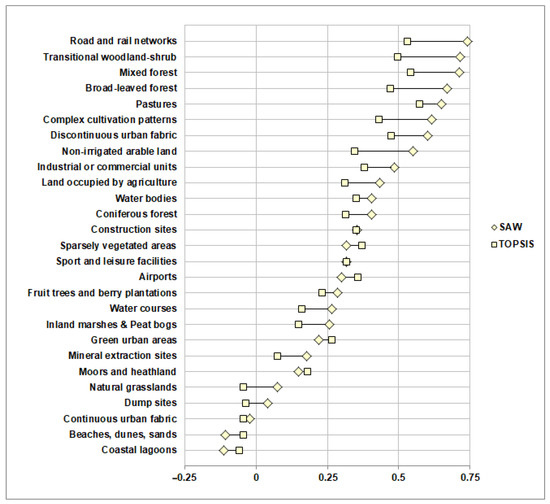
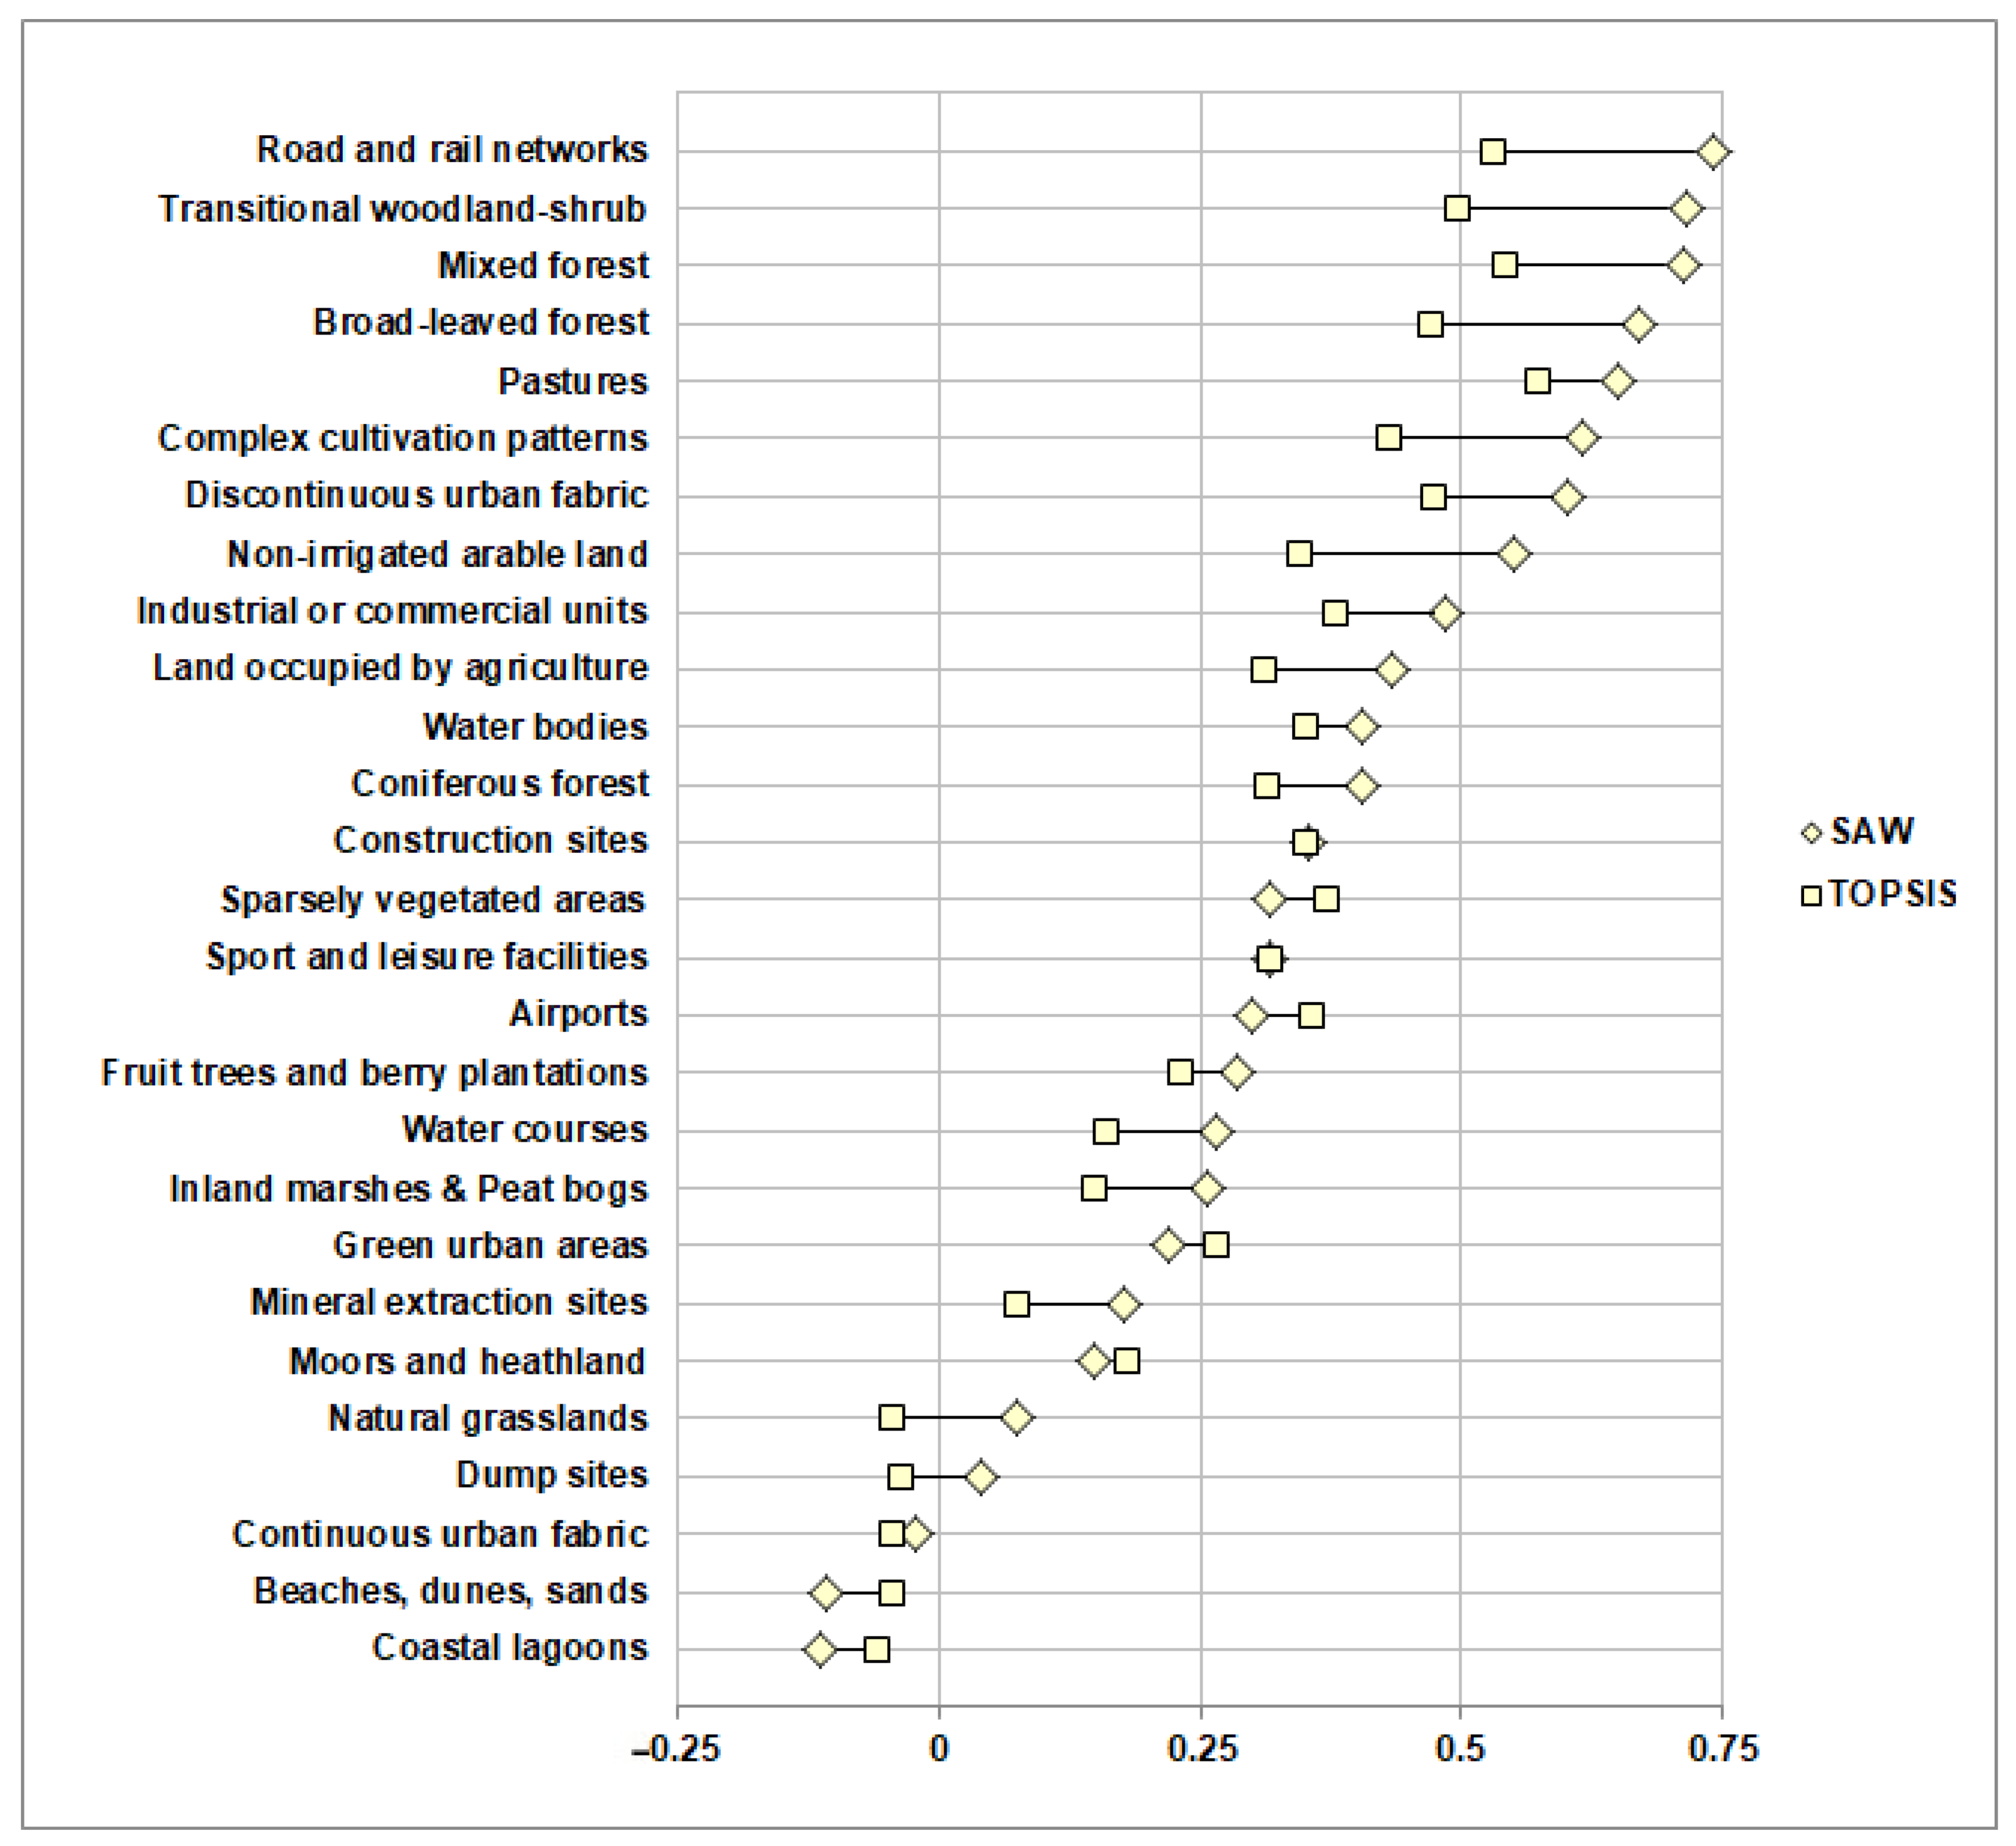
Land cover classes such as road and rail networks, transitional woodland–shrub areas, mixed forest, broad-leaved forest, pastures, complex cultivation patterns, and discontinuous urban fabrics showed strong relationships (r > 0.5) with habitat patch ranks (Figure 8). All other land cover classes had a weak or no relationship with habitat patch ranks, indicating that these land cover classes do not pose a severe risk to drivers and wildlife.
Figure 8.
Relationships between different habitat patch ranks and land cover classes.
The results of multiple linear regression analyses (Table 5) indicate that broad-leaved forests and transitional woodland–shrub areas bordered by road and rail networks are characterised by the highest risk to drivers and wildlife. In the vicinity of such habitats, MVCs mostly occur with C. capreolus and S. scrofa. MVCs with other species such as A. alces, V. vulpes, Martes sp., M. putorius, L. europaeus, and E. concolor are also likely.
Table 5.
Relationships between habitat ranks, land cover classes, and species involved in MVC clusters.
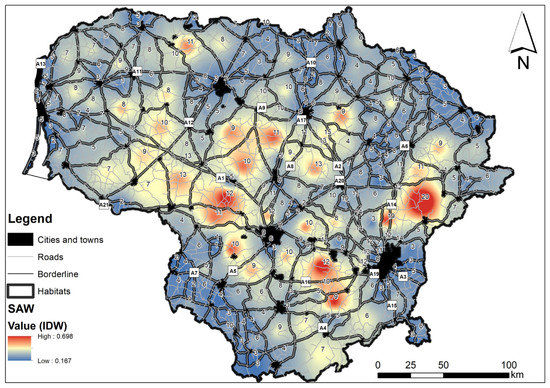
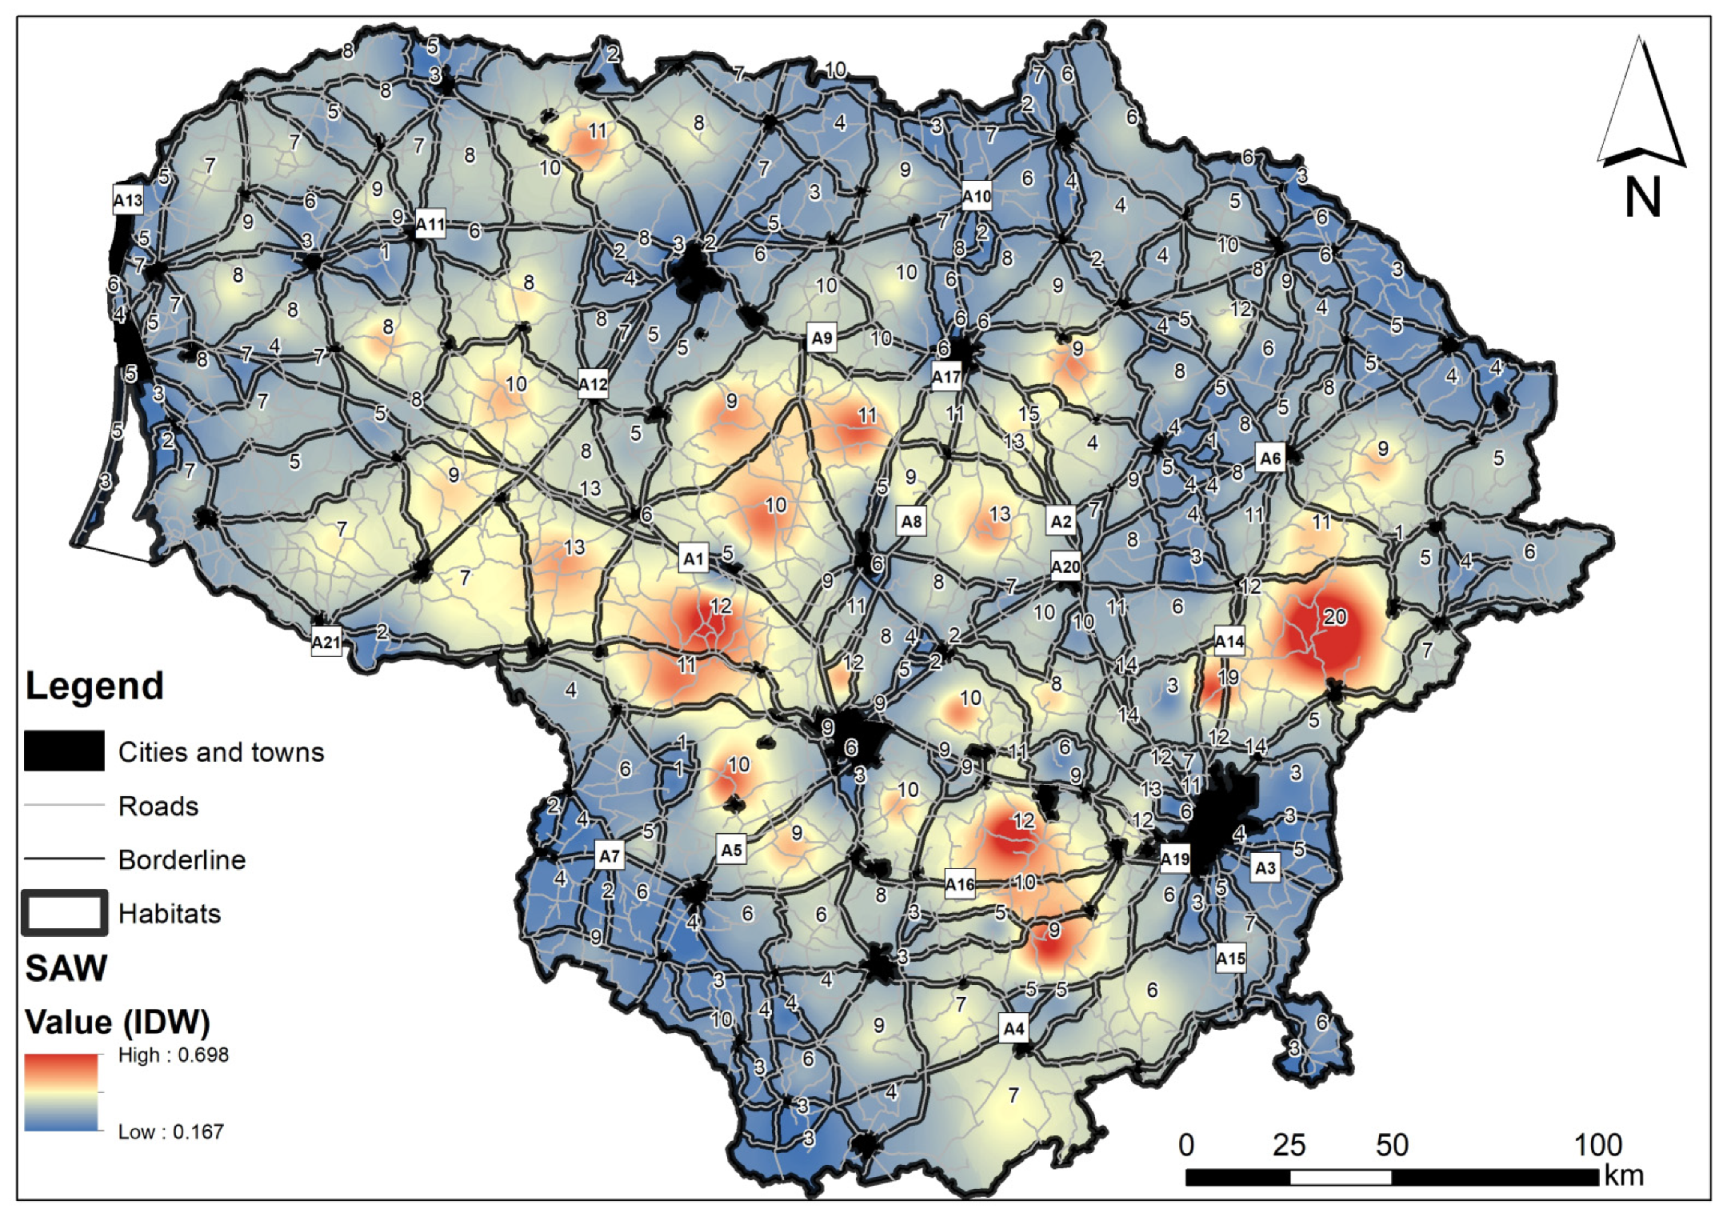
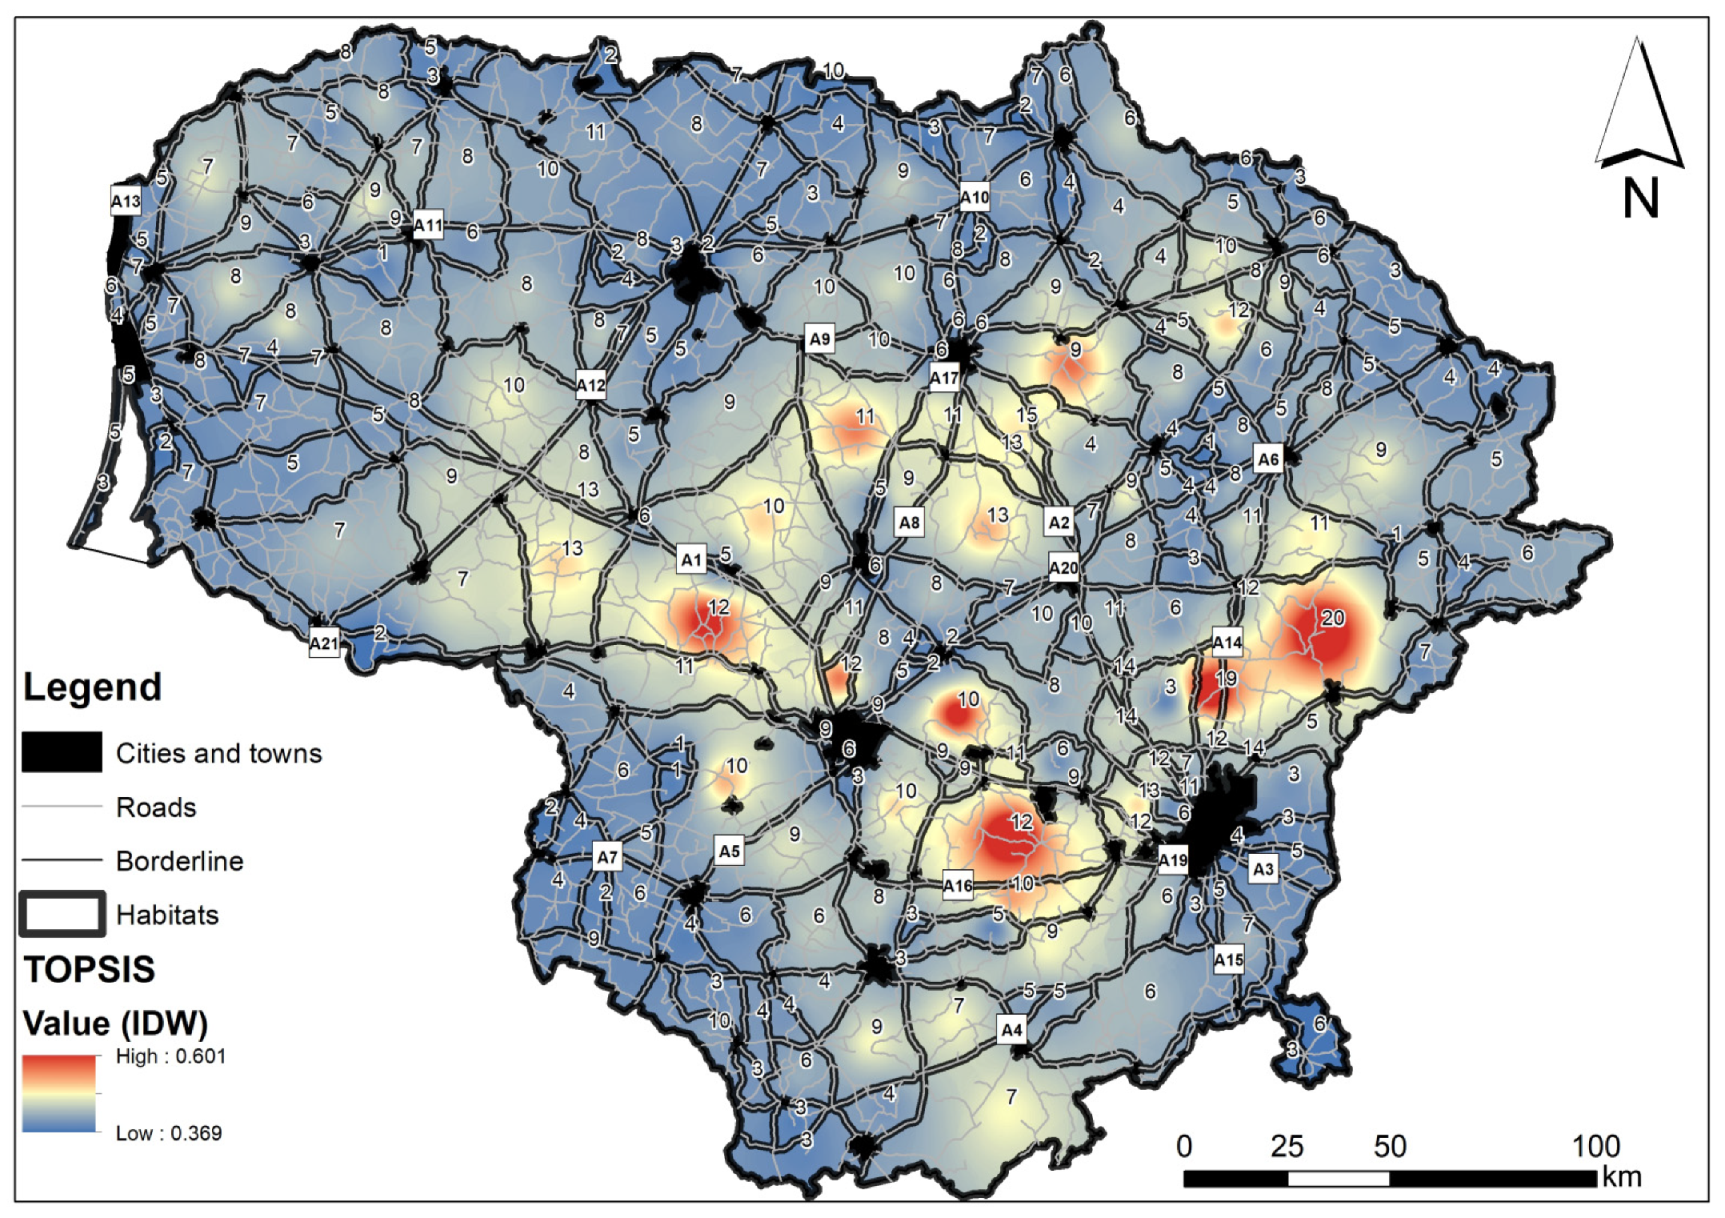
Using SAW (Figure 9) and TOPSIS (Figure 10) values, we created heat maps that show the potential risk severity to drivers and wildlife (urban areas were used as a reference). For better visual representation, the maps were created using the inverse distance weighed (IDW) interpolation method. The IDW method is used to interpolate spatial data and is based on the concept of distance weighting [74,75].
Figure 9.
Overlay of habitat patch boundaries, roads (all categories), urban areas, the habitat rank (SAW) heat map, and the number of species. Labels within the square show the identification numbers of main roads, while other labels show the total number of species involved in the MVC clusters located in the vicinity of habitat patches.
Figure 10.
Overlay of habitat patch boundaries, roads (all categories), urban areas, the habitat rank (TOPSIS) heat map, and the number of species. Labels within the square show the identification numbers of main roads, while other labels show the total number of species involved in the MVC clusters located in the vicinity of habitat patches.
The SAW-based habitat patch heat map (Figure 9) shows more severe risk habitat patches than the TOPSIS-based heat map (Figure 10) due to the differences in the ranking methods. However, both heat maps identified the same highly severe locations for drivers and wildlife.
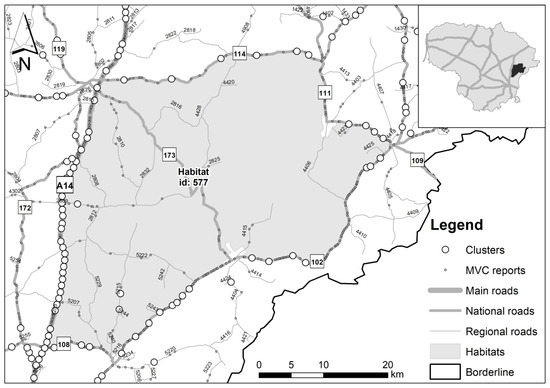
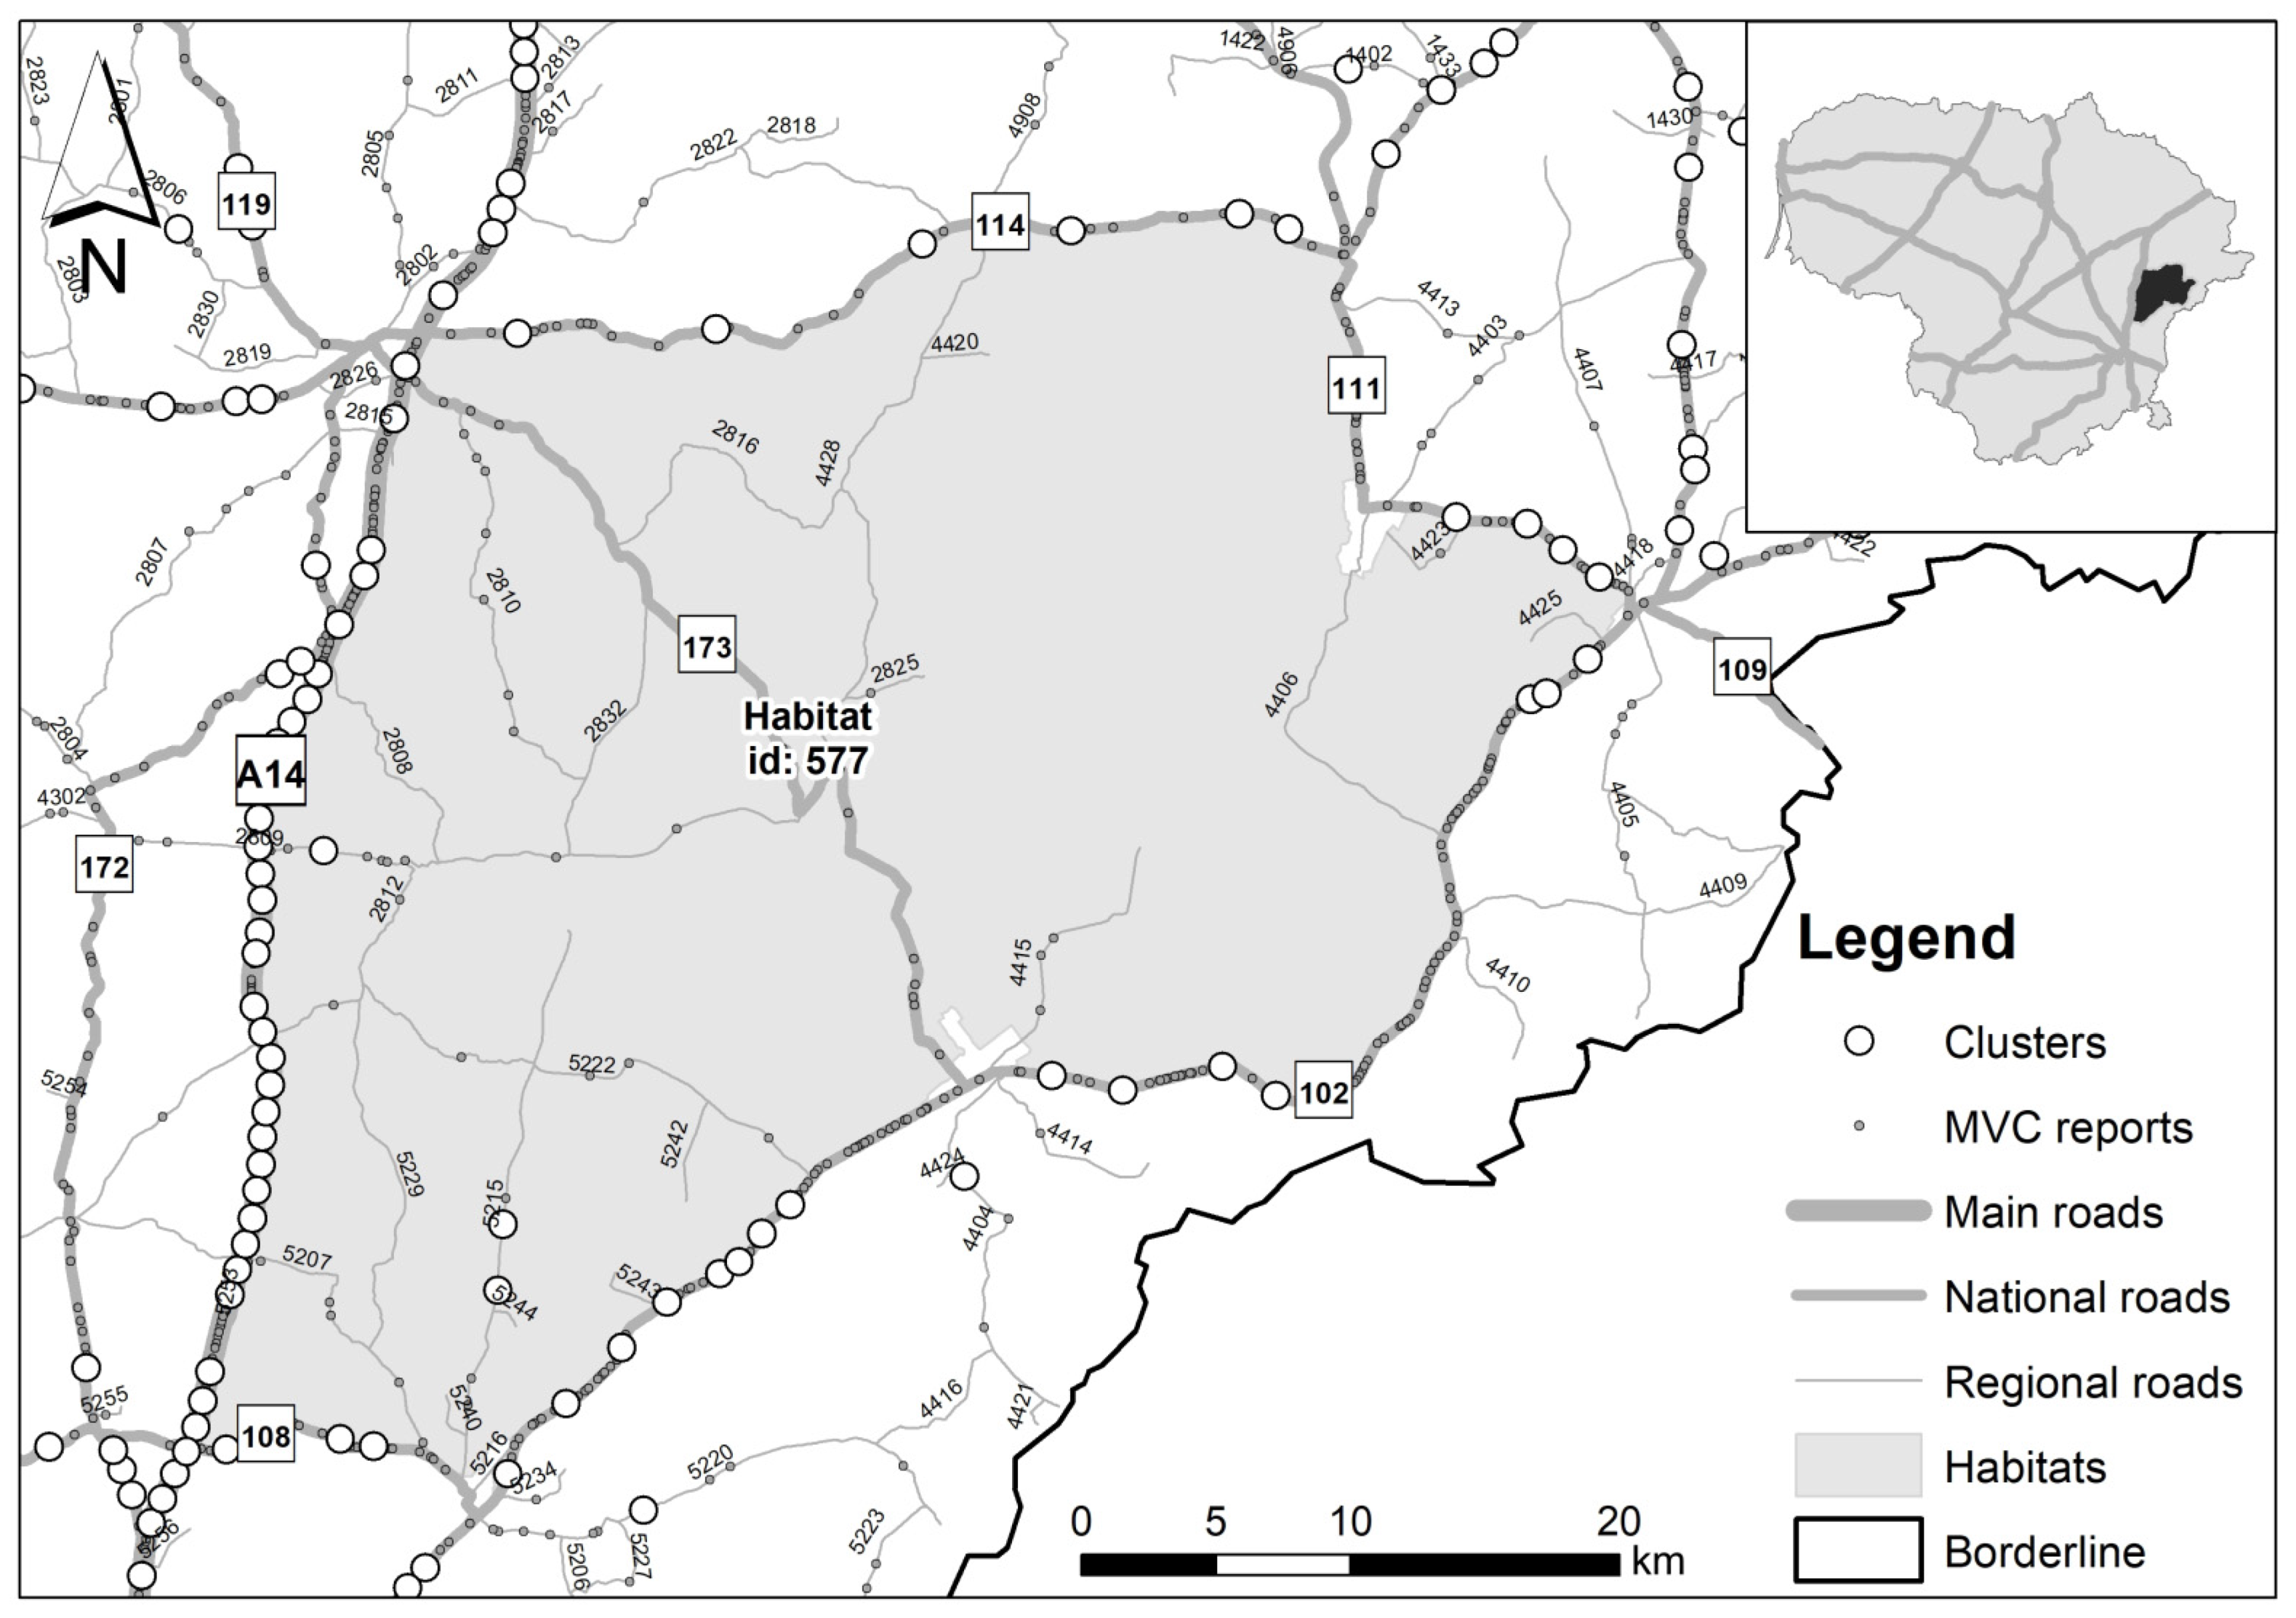
Following the results from both ranking methods (Figure 9 and Figure 10), we identified that the habitat patches with the unique identification numbers 577 and 2248 (Figure 3, Table A1 and Table A2) posed the most severe risk to drivers and wildlife. For instance, around the top-ranked habitat patch (id: 577), which is bordered by the A14 main road and national roads 114, 111, 102, and 108, we found MVC clusters including 20 different mammal species (Figure 11). Most of the MVC clusters were found on A14. Clusters on the roads at the edge and within the habitat patch were also present. Due to the low traffic intensity there, we did not find any cluster on the national road 173, which is within the habitat patch.
Figure 11.
The habitat patch with id: 577 in the eastern part of Lithuania.
4. Discussion
4.1. Habitat Risk Severity to Drivers
In order to plan MVC mitigation measures, spatial habitat characteristics together with MVCs and MVC cluster data are needed [76]. Habitat characteristics and factors that allow us to predict MVCs are important, but are usually the missing component. This can be explained by the disparate character of field research data [47]. Thus, the framework we propose may help to identify and characterise the missing components in a unified form.
Our results on habitat risk severity to drivers and wildlife at the local level are based on a long-term mammal roadkill dataset [77,78]. The main A14 road, delimiting the top-ranked habitat patch (id: 577, see Figure 11), is one of the most frequently checked for roadkill [1]. Because of ongoing long-term reconstruction of the A14 road (until 2030), short-term redirection of traffic onto national road 173 might be foreseen, thereby increasing the traffic intensity on that road, thus also increasing the likelihood of more MVCs than before and a higher risk to drivers.
4.2. Habitat Attractiveness to Mammals
The rates of annual land cover change in Lithuania are decreasing, dropping from 0.48% in 1990 to 0.18% in 2012 [58]. This indicates that the habitat composition has remained stable over time. A growing rate of forest land (woodland) and a rapid decline in active farming [58] has improved habitat attractiveness to different wildlife species, especially for forest dwellers. The increasing MVC numbers in all categories of roads and the increase in annual average daily traffic [79] have coincided with an enlargement of wildlife populations in the country. Species richness (the number of species in Table A2) has a strong relationship (r = 0.72) with the number of MVCs (the number of MVCs within adjacent clusters in Table A1).
We assumed that larger values of species richness indicate higher habitat diversity [80], suitability [81], and attractiveness to wildlife. We found 20 different species within MVC clusters that are adjacent to habitat patch id: 577, which means that road 137 (Figure 11) is more dangerous than the roads adjacent to habitats with a smaller number of species. However, species richness does not take into account the abundances of the species or their relative abundance distributions. The proposed framework allows for the accurate identification of species richness in relation to MVCs that are in the vicinity of the particular habitat. This information is especially useful when wildlife observation data (ground-truth) are not available at all. However, the accuracy of the result is very much dependent on the quality of the available police registered reports and professional field research data [1].
Habitats were defined and characterised across all territory of Lithuania; therefore, the validation of our model is possible: (i) using data from a similar territory, such as a neighbouring country; or (ii) using data from Lithuania from a different time period, e.g., 2018–2021 (our model covered 2002–2017). At the moment, however, such a dataset is not available.
Species richness may be validated by intensive roadkill counts or using wildlife cameras to check for animal movement across roads.
4.3. Multi-Objective Mitigation Measures
The only effective mitigation of road kills in a multi-species animal community is a complex of wildlife fencing (with a sufficient number of wildlife underpasses and overpasses according to the length of the fence) and active driver warning systems on roads without wildlife fences. We did not manage to find tangible research on other effective multi-species and multi-objective mitigation measures for large and small mammal species.
Mitigating MVCs on road 173 (Figure 11) may be challenging, as the MVC-targeting measures are likely to focus de minimis on ungulates, namely C. capreolus, S. scrofa, and A. alces (Table 5 and Table A2), rather than on the other 17 large and small body size mammal species recorded (Table A2). Numbers of carnivore road kills also grow in areas with a higher abundance of small mammal species [55]. MVC clusters found in different locations can help us to select species-specific mitigation measures. However, due to the high cost of the abovementioned complex of measures and the low traffic intensity on roads other than A14 and 102 (Figure 11), implementation of such measures is not possible in the near future. Therefore, our method currently may serve as part of the toolbox to identify the most dangerous roads and the most important habitat patches.
The observation of near misses (road 173 in Figure 11) might provide further input for the task. Field studies should incorporate long-term data collection, before the mitigation measure is applied [18]. Last, but not least, clearing vegetation along roads can also help to lower the MVC risk [54,82]. The mitigation measures for managing the risks to drivers and wildlife may be more challenging when many species are present. This may result in higher road reconstruction costs. The lack of data on the effectiveness of road mitigation measures [18,20] is a further obstacle to decision-making. The most common MVC mitigation measure in Lithuania is fencing. Short wildlife fences may not sufficiently reduce the risk of MVCs, but they are economically more affordable. Long fences are less efficient economically, but may perform better [9,10,11,17] on the roads with the highest traffic intensity. Therefore, we conclude that, even when involving all habitat data, the selection of multi-objective MVC mitigation measures in a dynamic environment still remains a considerable research challenge.
5. Conclusions
This study developed models that allow for the identification, characterisation, and ranking of habitats based on mammal roadkill data. The main conclusions are:
- Habitats were characterised by connectivity, land cover, roadkill, roadkill cluster, and mammal species and ranked using multiple criteria for the identification of habitat risk severity to drivers and attractiveness to wildlife;
- Despite the potential limitations of the scope of the roadkill data, our habitat ranking suggests that this procedure can provide information on habitats, habitat locations, species richness, habitat risk severity to drivers, and attractiveness to wildlife;
- Strong relationships were identified and discussed between the habitat patch ranks, five (out of 28) land cover classes, and eight (out of 28) species (97% of all mammal road kills);
- This methodology facilitates decision-making on the habitats that must be prioritized to preserve wildlife in the vicinity of roads that are prone to MVCs. It is also suitable for the planning of multi-objective mitigation measures to improve road security in a dynamic environment.
Author Contributions
Conceptualization, A.K. and L.B.; methodology, A.K.; software, A.K.; validation, A.K.; formal analysis, A.K.; investigation, A.K. and L.B.; resources, L.B.; data curation, L.B.; writing—original draft preparation, A.K.; writing—review and editing, L.B.; visualization, A.K.; supervision, L.B.; project administration, L.B. All authors have read and agreed to the published version of the manuscript.
Funding
This research received no external funding.
Institutional Review Board Statement
Not applicable.
Data Availability Statement
Supplementary spatial data for this article can be found online at http://dx.doi.org/10.17632/4c58n345h5.1 (last accessed on 1 May 2021).
Acknowledgments
The authors thank Jos Stratford for linguistic revision of the manuscript as well as the anonymous reviewers for their suggestions and contributions.
Conflicts of Interest
The authors declare no conflict of interest.
Appendix A
Table A1.
The habitat characterisation data (criteria) used to rank the habitat patches.
Table A2.
List of all identified habitats, their ranks, and wildlife species (species richness) identified within habitats.
References
- Balčiauskas, L.; Stratford, J.; Balčiauskienė, L.; Kučas, A. Importance of professional roadkill data in assessing diversity of mammal roadkills. Transp. Res. Part D Transp. Environ. 2020, 87, 102493. [Google Scholar] [CrossRef] [Scilit]
- Cherry, C.C.; Dietz, S.; Sauber-Schatz, E.; Russell, S.; Proctor, J.; Buttke, D. Characteristics of animal-related motor vehicle crashes in select National Park Service units—United States, 1990–2013. Traffic Inj. Prev. 2019, 20, 58–63. [Google Scholar] [CrossRef] [Scilit] [PubMed]
- Abra, F.D.; Granziera, B.M.; Huijser, M.P.; Ferraz, K.M.P.M.d.B.; Haddad, C.M.; Paolino, R.M. Pay or prevent? Human safety, costs to society and legal perspectives on animal-vehicle collisions in São Paulo state, Brazil. PLoS ONE 2019, 14, e0215152. [Google Scholar] [CrossRef] [Scilit]
- Coffin, A.W. From roadkill to road ecology: A review of the ecological effects of roads. J. Transp. Geogr. 2007, 15, 396–406. [Google Scholar] [CrossRef] [Scilit]
- González-Gallina, A.; Benítez-Badillo, G.; Rojas-Soto, O.R.; Hidalgo-Mihart, M.G. The small, the forgotten and the dead: Highway impact on vertebrates and its implications for mitigation strategies. Biodivers. Conserv. 2013, 22, 325–342. [Google Scholar] [CrossRef] [Scilit]
- Gilbert, S.L.; Sivy, K.J.; Pozzanghera, C.B.; DuBour, A.; Overduijn, K.; Smith, M.M.; Zhou, J.; Little, J.M.; Prugh, L.R. Socioeconomic Benefits of Large Carnivore Recolonization Through Reduced Wildlife-Vehicle Collisions. Conserv. Lett. 2017, 10, 431–439. [Google Scholar] [CrossRef] [Scilit]
- Kučas, A.; Balčiauskas, L. Temporal patterns of ungulate-vehicle collisions in Lithuania. J. Environ. Manag. 2020, 273, 111172. [Google Scholar] [CrossRef] [Scilit]
- Kučas, A.; Balčiauskas, L. Impact of Road Fencing on Ungulate-Vehicle Collisions and Hotspot Patterns. Land 2021, 10, 338. [Google Scholar] [CrossRef] [Scilit]
- Ford, A.T.; Clevenger, A.P.; Huijser, M.P.; Dibb, A. Planning and prioritization strategies for phased highway mitigation using wildlife-vehicle collision data. Wildl. Biol. 2011, 17, 253–265. [Google Scholar] [CrossRef] [Scilit]
- Huijser, M.P.; Fairbank, E.R.; Camel-Means, W.; Graham, J.; Watson, V.; Basting, P.; Becker, D. Effectiveness of short sections of wildlife fencing and crossing structures along highways in reducing wildlife–vehicle collisions and providing safe crossing opportunities for large mammals. Biol. Conserv. 2016, 197, 61–68. [Google Scholar] [CrossRef] [Scilit]
- Davenport, J.; Davenport, J.L. (Eds.) The Ecology of Transportation: Managing Mobility for the Environment; Environmental Pollution; Springer: Dordrecht, The Netherlands, 2006; Volume 10, ISBN 978-1-4020-4503-5. [Google Scholar]
- Ford, A.T.; Clevenger, A.P.; Bennett, A. Comparison of Methods of Monitoring Wildlife Crossing-Structures on Highways. J. Wildl. Manag. 2009, 73, 1213–1222. [Google Scholar] [CrossRef] [Scilit]
- Clevenger, A.P.; Waltho, N. Factors Influencing the Effectiveness of Wildlife Underpasses in Banff National Park, Alberta, Canada. Conserv. Biol. 2000, 14, 47–56. [Google Scholar] [CrossRef] [Scilit]
- Bager, A.; Fontoura, V. Evaluation of the effectiveness of a wildlife roadkill mitigation system in wetland habitat. Ecol. Eng. 2013, 53, 31–38. [Google Scholar] [CrossRef] [Scilit]
- Ascensão, F.; Clevenger, A.; Santos-Reis, M.; Urbano, P.; Jackson, N. Wildlife–vehicle collision mitigation: Is partial fencing the answer? An agent-based model approach. Ecol. Model. 2013, 257, 36–43. [Google Scholar] [CrossRef] [Scilit]
- Little, S.J.; Harcourt, R.G.; Clevenger, A.P. Do wildlife passages act as prey-traps? Biol. Conserv. 2002, 107, 135–145. [Google Scholar] [CrossRef] [Scilit]
- Plante, J.; Jaeger, J.A.G.; Desrochers, A. How do landscape context and fences influence roadkill locations of small and medium-sized mammals? J. Environ. Manag. 2019, 235, 511–520. [Google Scholar] [CrossRef] [Scilit] [PubMed]
- Rytwinski, T.; Soanes, K.; Jaeger, J.A.G.; Fahrig, L.; Findlay, C.S.; Houlahan, J.; van der Ree, R.; van der Grift, E.A. How Effective Is Road Mitigation at Reducing Road-Kill? A Meta-Analysis. PLoS ONE 2016, 11, e0166941. [Google Scholar] [CrossRef] [Scilit]
- Spanowicz, A.G.; Teixeira, F.Z.; Jaeger, J.A.G. An adaptive plan for prioritizing road sections for fencing to reduce animal mortality. Conserv. Biol. 2020, 34, 1210–1220. [Google Scholar] [CrossRef] [Scilit] [PubMed]
- Rytwinski, T.; van der Ree, R.; Cunnington, G.M.; Fahrig, L.; Findlay, C.S.; Houlahan, J.; Jaeger, J.A.G.; Soanes, K.; van der Grift, E.A. Experimental study designs to improve the evaluation of road mitigation measures for wildlife. J. Environ. Manag. 2015, 154, 48–64. [Google Scholar] [CrossRef] [Scilit]
- Borda-de-Água, L.; Ascensão, F.; Sapage, M.; Barrientos, R.; Pereira, H.M. On the identification of mortality hotspots in linear infrastructures. Basic Appl. Ecol. 2019, 34, 25–35. [Google Scholar] [CrossRef] [Scilit]
- Montella, A. A comparative analysis of hotspot identification methods. Accid. Anal. Prev. 2010, 42, 571–581. [Google Scholar] [CrossRef] [Scilit] [PubMed]
- Gomes, L.; Grilo, C.; Silva, C.; Mira, A. Identification methods and deterministic factors of owl roadkill hotspot locations in Mediterranean landscapes. Ecol. Res. 2009, 24, 355–370. [Google Scholar] [CrossRef] [Scilit]
- Hirzel, A.H.; Hausser, J.; Chessel, D.; Perrin, N. Ecological-Niche Factor Analysis: How to Compute Habitat-Suitability Maps without Absence Data? Ecology 2002, 83, 2027–2036. [Google Scholar] [CrossRef]
- Gitman, I.; Levine, M.D. An Algorithm for Detecting Unimodal Fuzzy Sets and Its Application as a Clustering Technique. IEEE Trans. Comput. 1970, 100, 583–593. [Google Scholar] [CrossRef] [Scilit]
- Bíl, M.; Andrášik, R.; Janoška, Z. Identification of hazardous road locations of traffic accidents by means of kernel density estimation and cluster significance evaluation. Accid. Anal. Prev. 2013, 55, 265–273. [Google Scholar] [CrossRef] [Scilit] [PubMed]
- Bíl, M.; Andrášik, R.; Svoboda, T.; Sedoník, J. The KDE+ software: A tool for effective identification and ranking of animal-vehicle collision hotspots along networks. Landsc. Ecol. 2016, 31, 231–237. [Google Scholar] [CrossRef] [Scilit]
- Kolowski, J.M.; Nielsen, C.K. Using Penrose distance to identify potential risk of wildlife–vehicle collisions. Biol. Conserv. 2008, 141, 1119–1128. [Google Scholar] [CrossRef] [Scilit]
- Malo, J.E.; Suarez, F.; Diez, A. Can we mitigate animal-vehicle accidents using predictive models? J. Appl. Ecol. 2004, 41, 701–710. [Google Scholar] [CrossRef] [Scilit]
- Grilo, C.; Ascensão, F.; Santos-Reis, M.; Bissonette, J.A. Do well-connected landscapes promote road-related mortality? Eur. J. Wildl. Res. 2011, 57, 707–716. [Google Scholar] [CrossRef] [Scilit]
- Planillo, A.; Kramer-Schadt, S.; Malo, J.E. Transport Infrastructure Shapes Foraging Habitat in a Raptor Community. PLoS ONE 2015, 10, e0118604. [Google Scholar] [CrossRef] [Scilit]
- Santos, S.M.; Marques, J.T.; Lourenço, A.; Medinas, D.; Barbosa, A.M.; Beja, P.; Mira, A. Sampling effects on the identification of roadkill hotspots: Implications for survey design. J. Environ. Manag. 2015, 162, 87–95. [Google Scholar] [CrossRef] [Scilit] [PubMed]
- Dussault, C.; Courtois, R.; Ouellet, J.-P. A habitat suitability index model to assess moose habitat selection at multiple spatial scales. Can. J. For. Res. 2006, 36, 1097–1107. [Google Scholar] [CrossRef] [Scilit]
- Andrén, H.; Andren, H. Effects of Habitat Fragmentation on Birds and Mammals in Landscapes with Different Proportions of Suitable Habitat: A Review. Oikos 1994, 71, 355–366. [Google Scholar] [CrossRef] [Scilit]
- Balčiauskas, L.; Wierzchowski, J.; Kučas, A.; Balčiauskienė, L. Habitat Suitability Based Models for Ungulate Roadkill Prognosis. Animals 2020, 10, 1345. [Google Scholar] [CrossRef] [Scilit] [PubMed]
- Bíl, M.; Andrášik, R.; Sedoník, J. A detailed spatiotemporal analysis of traffic crash hotspots. Appl. Geogr. 2019, 107, 82–90. [Google Scholar] [CrossRef] [Scilit]
- Kučas, A. Graph-based multi-attribute decision making: Impact of road fencing on ecological network. Balt. J. Road Bridg. Eng. 2015, 10, 105–111. [Google Scholar] [CrossRef] [Scilit]
- Putzu, N.; Bonetto, D.; Civallero, V.; Fenoglio, S.; Meneguz, P.G.; Preacco, N.; Tizzani, P. Temporal patterns of ungulate-vehicle collisions in a subalpine Italian region. Ital. J. Zool. 2014, 81, 463–470. [Google Scholar] [CrossRef] [Scilit]
- Zhang, W.; Shu, G.; Li, Y.; Xiong, S.; Liang, C.; Li, C. Daytime driving decreases amphibian roadkill. PeerJ 2018, 6, e5385. [Google Scholar] [CrossRef] [Scilit]
- Hastings, H.; Barr, J.; Bateman, P.W. Spatial and temporal patterns of reptile roadkill in the north-west Australian tropics. Pac. Conserv. Biol. 2019, 25, 370–376. [Google Scholar] [CrossRef] [Scilit]
- Kammerle, J.-L.; Brieger, F.; Kroschel, M.; Hagen, R.; Storch, I.; Suchant, R. Temporal patterns in road crossing behaviour in roe deer (Capreolus capreolus) at sites with wildlife warning reflectors. PLoS ONE 2017, 12, e0184761. [Google Scholar] [CrossRef] [Scilit]
- Sepp, K.; Kaasik, A. Development of National Ecological Networks in the Baltic Countries in the Framework of the Pan-European Ecological Network; IUCN Office for Central Europe: Warsaw, Poland, 2002; ISBN 2-8317-0679-3. [Google Scholar]
- McRae, B.H.; Hall, S.A.; Beier, P.; Theobald, D.M. Where to Restore Ecological Connectivity? Detecting Barriers and Quantifying Restoration Benefits. PLoS ONE 2012, 7, e52604. [Google Scholar] [CrossRef] [Scilit] [PubMed]
- McRae, B.H. Isolation by resistance. Evolution 2006, 60, 1551–1561. [Google Scholar] [CrossRef] [Scilit] [PubMed]
- McRae, B.H.; Dickson, B.G.; Keitt, T.H.; Shah, V.B. Using circuit theory to model connectivity in ecology, evolution, and conservation. Ecology 2008, 89, 2712–2724. [Google Scholar] [CrossRef] [Scilit]
- Wierzchowski, J.; Kučas, A.; Balčiauskas, L. Application of Least-Cost Movement Modeling in Planning Wildlife Mitigation Measures along Transport Corridors: Case Study of Forests and Moose in Lithuania. Forests 2019, 10, 831. [Google Scholar] [CrossRef] [Scilit]
- Clevenger, A.P.; Barrueto, M.; Gunson, K.E.; Caryl, F.M.; Ford, A.T. Context-dependent effects on spatial variation in deer-vehicle collisions. Ecosphere 2015, 6, 7. [Google Scholar] [CrossRef] [Scilit]
- Jankowski, P. Integrating geographical information systems and multiple criteria decision-making methods. Int. J. Geogr. Inf. Syst. 1995, 9, 251–273. [Google Scholar] [CrossRef] [Scilit]
- Hwang, C.-L.; Yoon, K. Multiple Attribute Decision Making; Lecture Notes in Economics and Mathematical Systems; Springer: Berlin/Heidelberg, Germany, 1981; Volume 186, ISBN 978-3-540-10558-9. [Google Scholar]
- Mardani, A.; Jusoh, A.; Zavadskas, E.K. Fuzzy multiple criteria decision-making techniques and applications—Two decades review from 1994 to 2014. Expert Syst. Appl. 2015, 42, 4126–4148. [Google Scholar] [CrossRef] [Scilit]
- Malczewski, J. GIS-based multicriteria decision analysis: A survey of the literature. Int. J. Geogr. Inf. Sci. 2006, 20, 703–726. [Google Scholar] [CrossRef] [Scilit]
- Wira Trise Putra, D.; Agustian Punggara, A. Comparison Analysis of Simple Additive Weighting (SAW) and Weigthed Product (WP) In Decision Support Systems. MATEC Web Conf. 2018, 215, 01003. [Google Scholar] [CrossRef] [Scilit]
- Keken, Z.; Sedoník, J.; Kušta, T.; Andrášik, R.; Bíl, M. Roadside vegetation influences clustering of ungulate vehicle collisions. Transp. Res. Part D Transp. Environ. 2019, 73, 381–390. [Google Scholar] [CrossRef] [Scilit]
- Ascensão, F.; Clevenger, A.P.; Grilo, C.; Filipe, J.; Santos-Reis, M. Highway verges as habitat providers for small mammals in agrosilvopastoral environments. Biodivers. Conserv. 2012, 21, 3681–3697. [Google Scholar] [CrossRef] [Scilit]
- Silva, C.; Simões, M.P.; Mira, A.; Santos, S.M. Factors influencing predator roadkills: The availability of prey in road verges. J. Environ. Manag. 2019, 247, 644–650. [Google Scholar] [CrossRef] [Scilit] [PubMed]
- Bíl, M.; Andrášik, R.; Duľa, M.; Sedoník, J. On reliable identification of factors influencing wildlife-vehicle collisions along roads. J. Environ. Manag. 2019, 237, 297–304. [Google Scholar] [CrossRef] [Scilit] [PubMed]
- Lithuanian Road Administration under the Ministry of Transport and Communications. Web Map of Animal-Vehicle Collision Distributions in Lithuania. Available online: http://gissrv.eismoinfo.lt/server/rest/services/LAKIS/su_gyvunais/MapServer?f=jsapi (accessed on 16 March 2020).
- European Environmental Agency. Lithuania Land Cover Country Fact Sheet 2012. Available online: https://www.eea.europa.eu/ds_resolveuid/1ca731f33d0c48a0a4ed60abe67fa6bf (accessed on 16 March 2020).
- Jakimavičius, M. Analysis and Assessment of Lithuanian Road Accidents by AHP Method. Balt. J. Road Bridg. Eng. 2018, 13, 238–260. [Google Scholar] [CrossRef] [Scilit]
- Lithuanian Road Administration under the Ministry of Transport and Communications. Web Map of Annual Average Daily Traffic Data in Lithuania. Available online: http://gissrv.eismoinfo.lt/server/rest/services/LAKD/VMPEI/MapServer?f=jsapi (accessed on 16 March 2020).
- Clevenger, A.P.; Wierzchowski, J.; Chruszcz, B.; Gunson, K. GIS-Generated, Expert-Based Models for Identifying Wildlife Habitat Linkages and Planning Mitigation Passages. Conserv. Biol. 2002, 16, 503–514. [Google Scholar] [CrossRef] [Scilit]
- Gunson, K.E.; Mountrakis, G.; Quackenbush, L.J. Spatial wildlife-vehicle collision models: A review of current work and its application to transportation mitigation projects. J. Environ. Manag. 2011, 92, 1074–1082. [Google Scholar] [CrossRef] [Scilit]
- Santos, R.A.L.; Mota-Ferreira, M.; Aguiar, L.M.S.; Ascensão, F. Predicting wildlife road-crossing probability from roadkill data using occupancy-detection models. Sci. Total Environ. 2018, 642, 629–637. [Google Scholar] [CrossRef] [Scilit]
- Seiler, A. Predicting locations of moose-vehicle collisions in Sweden. J. Appl. Ecol. 2005, 42, 371–382. [Google Scholar] [CrossRef] [Scilit]
- Okabe, A.; Okunuki, K.; Shiode, S. SANET: A Toolbox for Spatial Analysis on a Network. Geogr. Anal. 2006, 38, 57–66. [Google Scholar] [CrossRef] [Scilit]
- Okabe, A.; Satoh, T.; Sugihara, K. A kernel density estimation method for networks, its computational method and a GIS-based tool. Int. J. Geogr. Inf. Sci. 2009, 23, 7–32. [Google Scholar] [CrossRef] [Scilit]
- Clementini, E.; Di Felice, P.; van Oosterom, P. A small set of formal topological relationships suitable for end-user interaction. In International Symposium on Spatial Databases; Springer: Berlin/Heidelberg, Germany, 1993; pp. 277–295. [Google Scholar]
- Kučas, A. Location prioritization by means of multicriteria spatial decision-support systems: A case study of forest fragmentation-based ranking of forest administrative areas. J. Environ. Eng. Landsc. Manag. 2010, 18, 312–320. [Google Scholar] [CrossRef] [Scilit]
- Kušta, T.; Keken, Z.; Ježek, M.; Holá, M.; Šmíd, P. The effect of traffic intensity and animal activity on probability of ungulate-vehicle collisions in the Czech Republic. Saf. Sci. 2017, 91, 105–113. [Google Scholar] [CrossRef] [Scilit]
- Feranec, J.; Jaffrain, G.; Soukup, T.; Hazeu, G. Determining changes and flows in European landscapes 1990–2000 using CORINE land cover data. Appl. Geogr. 2010, 30, 19–35. [Google Scholar] [CrossRef] [Scilit]
- European Environmental Agency. CORINE Land Cover—Copernicus Land Monitoring Service. Available online: https://land.copernicus.eu/pan-european/corine-land-cover (accessed on 16 March 2020).
- European Environmental Agency. CORINE Land Cover Nomenclature Guidelines. Available online: https://land.copernicus.eu/user-corner/technical-library/corine-land-cover-nomenclature-guidelines/html (accessed on 12 November 2020).
- Akoglu, H. User’s guide to correlation coefficients. Turk. J. Emerg. Med. 2018, 18, 91–93. [Google Scholar] [CrossRef] [Scilit] [PubMed]
- Maleika, W. Inverse distance weighting method optimization in the process of digital terrain model creation based on data collected from a multibeam echosounder. Appl. Geomat. 2020, 12, 397–407. [Google Scholar] [CrossRef] [Scilit]
- Chen, F.-W.; Liu, C.-W. Estimation of the spatial rainfall distribution using inverse distance weighting (IDW) in the middle of Taiwan. Paddy Water Environ. 2012, 10, 209–222. [Google Scholar] [CrossRef] [Scilit]
- Luque, S.; Saura, S.; Fortin, M.-J. Landscape connectivity analysis for conservation: Insights from combining new methods with ecological and genetic data. Landsc. Ecol. 2012, 27, 153–157. [Google Scholar] [CrossRef] [Scilit]
- Kučas, A. Web Map of Ungulate-Vehicle Collision Hotspots in Lithuania 2002–2017. Available online: https://www.arcgis.com/apps/MapJournal/index.html?appid=d81195212a4b4bcc9c5aab34a0037609 (accessed on 16 March 2020).
- Kučas, A.; Balčiauskas, L. Mammal Roadkill Clusters, Corridors, Pathways and Habitats. [WWW Document]. Mendeley Data, V1. Available online: https://doi.org/10.17632/4c58n345h5.1 (accessed on 1 May 2021).
- Lithuanian Road Administration under the Ministry of Transport and Communications. Annual Average Daily Traffic Volumes in Lithuania. Available online: https://lakd.lrv.lt/en/sector-activities/traffic-volumes (accessed on 16 March 2020).
- Hortal, J.; Triantis, K.A.; Meiri, S.; Thébault, E.; Sfenthourakis, S. Island Species Richness Increases with Habitat Diversity. Am. Nat. 2009, 174, E205–E217. [Google Scholar] [CrossRef] [Scilit]
- Hernández-Quiroz, N.S.; Badano, E.I.; Barragán-Torres, F.; Flores, J.; Pinedo-Álvarez, C. Habitat suitability models to make conservation decisions based on areas of high species richness and endemism. Biodivers. Conserv. 2018, 27, 3185–3200. [Google Scholar] [CrossRef] [Scilit]
- Ramp, D.; Wilson, V.K.; Croft, D.B. Assessing the impacts of roads in peri-urban reserves: Road-based fatalities and road usage by wildlife in the Royal National Park, New South Wales, Australia. Biol. Conserv. 2006, 129, 348–359. [Google Scholar] [CrossRef] [Scilit]


Publisher’s Note: MDPI stays neutral with regard to jurisdictional claims in published maps and institutional affiliations. |
© 2021 by the authors. Licensee MDPI, Basel, Switzerland. This article is an open access article distributed under the terms and conditions of the Creative Commons Attribution (CC BY) license (https://creativecommons.org/licenses/by/4.0/).