


Abstract
Deep saline aquifers are key targets for secure CO2 geological storage because of their petrophysical and geochemical characteristics. This study conducts two-dimensional radial numerical simulations of CO2–brine flow and dissolution to examine plume migration and dissolution in saline aquifers while allowing porosity and permeability to evolve with pressure. The model outputs include reservoir pressure, porosity, permeability, gas saturation, and dissolved CO2, with additional analyses of permeability anisotropy, initial reservoir pressure, and stratified sandstone–shale architecture. Simulations with evolving properties predict a smaller radial plume extent than simulations with fixed properties, together with a maximum pressure buildup of about 2 MPa near the injection well. In a homogeneous aquifer, porosity and permeability increase nonlinearly during injection and reach about 1.25 and 2.6 times their initial values near the injection well after 1200 days, whereas the increases are lower in the sandstone–shale case at about 1.16 and 2.0 times because shale interlayers confine the enhanced zone to the lower sandstone. Increasing permeability anisotropy shifts migration toward lateral spreading, and higher initial reservoir pressure reduces plume extent. Overall, the assumption of constant porosity and permeability tends to predict larger plume footprints and different pressure responses, with sensitivity controlled by anisotropy, initial pressure, and shale interlayers.
1. Introduction
In recent decades, concerns over climate change and greenhouse-gas emissions have intensified, with CO2 remaining a central focus in energy-transition and mitigation discussions [1]. Carbon capture, utilization and storage (CCUS) is widely regarded as one of the potential pathways for reducing emissions, and geological storage is a core component of this strategy [2]. In geological storage, captured CO2 is injected into subsurface formations, such as depleted oil and gas reservoirs and deep saline aquifers, where CO2–brine interfacial behavior and mass transfer are important processes [3]. These formations have therefore been widely evaluated as potential candidates for long-term CO2 storage [4]. During storage in saline aquifers, dissolution into resident brine is recognized as an important trapping mechanism affecting long-term storage security [5].
CO2 migration and dissolution in saline aquifers depend on formation pressure, temperature, mineral reactions, and porous-medium properties, for which porosity and permeability are key controls [6,7]. Porosity determines the fraction of the bulk volume that is available for fluid occupancy and the pore space over which capillary forces act. Stress-related changes in pore structure and porosity alter the distribution of flow channels and capillary throats, which affects permeability and the spatial arrangement of fluid phases in the pore space [8]. Permeability governs fluid connectivity and flow rates. Its spatiotemporal evolution changes the flow field, saturation distribution, and interfacial residence time, which shifts the relative roles of advective transport, molecular diffusion, capillary trapping, and dissolution mass transfer [9]. Changes in local porosity and permeability may redirect CO2 into preferential flow pathways and alter displacement behavior, which supports the broader expectation that similar property variations may influence CO2 transport during injection in saline aquifers [10]. Pressure perturbations during injection may change pore volume and transmissivity near the well, which may alter the CO2–brine contact area and residence time under heterogeneous conditions. Within heterogeneous domains, high-permeability zones promote advective–diffusive mixing and hydrodynamic instabilities, which increases dissolution fluxes [11]. Treating porosity and permeability as uniform fixed inputs may simplify predictions of CO2 plume migration and trapping in saline aquifers [12]. Storage capacity forecasts therefore require flow models that represent both dissolution- and pressure-dependent changes in porosity and permeability.
Previous studies have evaluated the storage potential of candidate reservoirs and found that porosity, permeability, and formation integrity are the primary controls on storage capacity and injectivity under static-property assumptions [13]. Recent reviews have highlighted deep saline aquifers as major storage targets and have emphasized that site characterization remains central to injectivity and storage assessment [14]. Regional screening studies have shown that storage potential depends on basin-scale capacity and site suitability, which motivates closer evaluation of flow properties in formation-scale models [15]. For coal mining areas, in assessing geological CO2 storage potential, Liu et al. [16] used porosity and permeability distributions as key inputs and evaluated their effects on storage efficiency and injectivity. Most feasibility studies use porosity and permeability as prescribed inputs, while the effects of pressure-driven property evolution on plume migration and dissolution remain less constrained [13].
Numerous experimental studies have investigated the influence of effective stress on porosity and permeability. Haghi et al. [17] tested low-porosity rock samples and reported that porosity decreased from 13.16% to 12.24% as effective stress increased, while permeability decreased from 58 mD to 36 mD, which indicates combined effects of mechanical compaction and pore channel closure. Furthermore, under variable effective stress conditions, Haghi et al. [18] measured pore structure, pore size distribution, relative permeability, and capillary pressure curves in carbonate rock samples and found that permeability and relative permeability decreased with increasing effective stress. Hamid et al. [19] measured permeability responses to effective stress and pore pressure, showed that permeability depends strongly on stress level, and derived empirical relationships between permeability and effective stress. Rathnaweera et al. [20] examined the relationship between permeability and injection pressure and identified factors that alter pore structure, permeability, and the effective stress coefficient. Song et al. [21] investigated effective stress effects on permeability in deep tight sandstone reservoirs and used the data to develop a coupled numerical model that quantifies stress controls on permeability evolution and gas production.
Coupled numerical models have been used to examine non-isothermal multiphase flow and geomechanical response during CO2 injection in deep saline aquifers. In the context of CO2 storage, previous studies have further incorporated geomechanical response and permeability evolution into coupled numerical models. Kanin et al. [22] developed a non-isothermal multiphase flow–geomechanics coupled model that relates injection-driven changes in pressure, temperature, and density to stress changes and derived empirical relationships between these variables and effective stress. Roded et al. [23] showed that stress evolution constrained permeability enhancement under specific conditions, indicating that these mechanisms warrant consideration. Sabo et al. [24] constructed a pore-scale coupled model to examine porosity and permeability co-evolution and found a nonlinear permeability response to porosity changes as pore volume varied. Li et al. [25] proposed and validated a mathematical model for coal permeability evolution during liquid CO2 injection under mechanical deformation and found that coupled effects modify pore structure so that coal permeability increases logarithmically with injection pressure. Ye et al. [26] developed a numerical model to evaluate how porosity and permeability distributions, together with their evolution during CO2 injection, affect estimates of storage capacity and injectivity. The results show that heterogeneity in porosity and permeability influences the injection pressure field, plume spreading, and attainable storage capacity.
Although previous carbon-storage simulations have examined model uncertainty and CO2 plume evolution in stratified saline aquifers with prescribed petrophysical properties, direct comparisons that isolate how fixed porosity and permeability affect predicted plume migration and dissolution remain limited [27,28]. This gap is more important in strongly heterogeneous stratified saline aquifers, where pressure buildup, permeability anisotropy, and shale interlayers interact to control CO2 migration and dissolution. Under these conditions, constant porosity and permeability may not represent the feedback between pressure perturbation and pore-structure evolution, which may bias predictions of plume extent, dissolution trapping, and near-well pressure buildup. To address this gap, this study uses a consistent set of two-dimensional radial simulations to compare static-property and pressure-sensitive models under both homogeneous and layered architectures. The analysis extends recent work on stratified saline aquifers that examined plume evolution and dissolution under fixed petrophysical properties by incorporating pressure-driven porosity and permeability evolution together with anisotropy and shale interlayers [29]. The main contribution of this study is the quantification of the bias introduced by static-property assumptions and its variation with initial reservoir pressure, permeability anisotropy, and shale interlayers.
2. Theoretical Model
In this study, a coupled two-phase flow and mass-transfer model is employed to describe the flow, migration and dissolution of supercritical CO2 in saline formations while accounting for reservoir rock heterogeneity. The model is formulated based on mass conservation and Darcy’s law and incorporates a mass-transfer equation to characterize the transport and dissolution of CO2.
2.1. Governing Equations for the Two-Phase Flow Field
The present formulation is developed for isothermal CO2–brine two-phase flow in porous media under Darcy-scale conditions. In this study, brine is treated as incompressible, the gas and aqueous phases are governed by mass conservation and extended Darcy’s law, and geochemical reactions are neglected over the simulated timescale. For two-phase flow in a porous medium, the mass conservation equation can be written as
Here, φp denotes porosity, ρi is the density of phase i (i = g for CO2 and i = w for brine), si is the saturation of phase i, ui is the Darcy flux of phase i, and Qi is the mass source term of phase i. The Darcy fluxes are given by the extended Darcy law:
Here, k is the absolute permeability of the porous medium (m2), kri is the relative permeability of phase i, μi is the dynamic viscosity of phase i (Pa·s), pi is the pressure of phase i (Pa), and g is the gravitational acceleration vector (m/s2). Assuming that only two phases are present, the phase saturations satisfy
Phase interactions are characterized by the capillary pressure pc and the relative permeability kri. Capillary pressure equals the pressure difference between the non-wetting CO2 phase and the wetting brine phase:
Here, pc represents the capillary pressure (Pa), defined as the pressure difference between the non-wetting and wetting phases. pnw and pw denote the pressures of the non-wetting and wetting phases, respectively. To describe the flow behavior of the wetting and non-wetting phases, relative permeability functions are introduced, and, following previous studies, the Brooks–Corey model is adopted in this work [30]:
Here, se denotes the effective saturation, srw and srg are the residual saturations of the water and gas phases, respectively, pec is the entry pressure, and λ is the pore-size distribution index [31].
We validated the capillary pressure–saturation submodel after model construction. We built a numerical model to simulate CO2 displacing brine using Berea sandstone core experiments as reference data [32]. The model employs no-flow boundaries at the top and bottom, CO2 injection at the left boundary, and a far-field boundary condition at the right boundary. The simulated capillary pressure–water saturation curve was then compared with the fitted experimental curve reported by Pini et al. [32].
As shown in Figure 1a, within the capillary pressure range from 0 to 30 kPa, the curve predicted by the model follows the trend of the fitted experimental curve reported by Pini et al. [32]. These results indicate that the adopted Brooks–Corey-type capillary pressure model represents the relationship between saturation and capillary pressure in two-phase flow.
Figure 1.
Validation of the proposed model’s predictions against the experimental curve fits reported by (a) Pini et al. [32] and (b) Oak et al. and Krevor et al. [33,34].
The relative permeability of the wetting phase is given by
The relative permeability of the non-wetting phase is given by
After constructing the relative permeability model, representative relative permeability versus saturation data were extracted from the literature [33,34] to validate the model. Relative permeabilities were computed across saturations, and results were compared with published reference curves. As illustrated in Figure 1b, the relative permeability versus saturation curves for both phases agree with the fitted experimental curves. These validation steps indicate that the two-phase flow submodel is physically consistent and provides the basis for the coupled mass-transfer model.
By combining the above conservation equations, we obtain
The thermophysical properties of supercritical CO2, such as viscosity and density, vary as functions of temperature and pressure. In this study, empirical correlations valid over pressures from 15 to 40 MPa and temperatures from 273 to 553 K are employed [35]:
To evaluate the overall two-phase displacement model, simulation results were compared with experimental observations from Vivek et al. [36] and with the analytical Buckley–Leverett solution [37]. As shown in Figure 2, The comparison shows that saturation profiles predicted by the model agree with the analytical Buckley–Leverett solution and the numerical results of Vivek et al. [36] at multiple times. This agreement indicates that the numerical model reproduces CO2–brine displacement behavior across multiple temporal scales.
Figure 2.
Accuracy check for the predicted gas-saturation profiles using (a) Buckley–Leverett analytical solution [37] and (b) reference data from Vivek and Kumar [36].
Recent field-scale and mechanism-oriented studies provide external quantitative consistency checks for the present model. Shen et al. [38] reported average horizontal CO2 migration distances of 531.3 m after 1 year and 2988.8 m after 10 years in an offshore multilayer saline aquifer. At monitoring points located 3000 m from the injection well, pore-pressure increments remained within 0.37 to 0.64 MPa over the same period. In comparison, the present model predicts plume radii of 489.22 to 732.44 m at 1200 days and maximum pressure buildups of 2.277 to 2.500 MPa, which indicates plume extents of the same order of magnitude and pressure responses within a realistic MPa-scale range.
Rezk and Ibrahim [39] used a 3D Sleipner-based model with nine permeable sand layers separated by thin shale barriers. They found that about 80% of the injected CO2 remained structurally trapped beneath the caprock and shale barriers during injection, while heterogeneity increased solubility trapping and reduced residual trapping. The present layered model shows the same baffle effect. Only 3.3% of CO2 reaches the top aquifer, whereas 61.4% remains in the bottom injection aquifer and 85.1% is retained within the lower two aquifers. This distribution indicates strong vertical compartmentalization and shale-controlled plume redistribution.
A related anisotropy study by Guo and Wang [40] represented anisotropy as α = kv/kh and showed that lower α suppressed vertical migration. In their isotropic case, α = 1, the upward migration distance after 10 years was about 600 m. Because α is the reciprocal of the kh/kv ratio used here, the reduction in plume radius from 732.44 m to 489.22 m as kh/kv increases from 1 to 1000 is physically consistent with the anisotropy trend reported in that study.
These studies are not direct benchmarks because they differ in geometry, timescale, dimensionality, and boundary conditions. Even so, they provide independent reference points for evaluating the present results. The present model reproduces the same order of magnitude for plume extent and pressure buildup and captures the same trends in shale-controlled vertical compartmentalization and anisotropy effects. This agreement supports the physical credibility of the model for the processes and scales examined here. In general, these comparisons provide quantitative checks on plume radius, pressure buildup, and stratification-controlled trapping trends across independent studies, even though they do not constitute one-to-one benchmark cases.
2.2. Mass-Transfer Model
In this study, CO2 migration and dissolution in saline aquifer are treated as a coupled convection–diffusion mass-transfer process. The evolution of CO2 concentration in the aqueous phase is governed by a convection–diffusion equation with an additional interfacial mass-transfer source term, which can be written as [31]
Here, θw denotes the volume fraction of brine in the pore space, cg denotes the actual concentration of CO2 in the aqueous phase (mol/m3), ceq is the equilibrium aqueous CO2 concentration (mol/m3) determined by thermodynamic solubility at the prevailing temperature, pressure and salinity, Deff is the effective diffusion coefficient, aI represents the specific gas–water interfacial area per unit volume of porous medium (m−1), and kI is the interfacial mass-transfer coefficient (m/s) [9]. The term represents the interfacial non-equilibrium mass-transfer rate per unit bulk volume. When the actual concentration cg is lower than the equilibrium concentration ceq, CO2 dissolves from the gas phase into the aqueous phase. Conversely, when the actual concentration exceeds the equilibrium concentration, CO2 exsolves from the aqueous phase back into the gas phase.
To verify the numerical implementation of the mass-transfer submodel, the simulated one-dimensional radial profile of dissolved CO2 concentration was compared with the published results of Ding et al. [31] for an isothermal constant-rate injection case in a homogeneous domain. As shown in Figure 3, the ratio of dissolved CO2 concentration along a radial cross-section varies with the distance from the injection well. Initially, the concentration ratio is close to unity, but, as CO2 migrates to a distance of about 1000 m, it gradually decreases to zero, indicating that only a limited fraction of CO2 remains dissolved in the brine along the migration path. The simulated profile agrees well with the published profile of Ding et al. for the same baseline case. This comparison verifies the implementation of the convection–diffusion equation and the interphase mass-transfer source term for the baseline isothermal radial-injection problem considered here rather than serving as a universal validation of all heterogeneous storage scenarios.
Figure 3.
Comparative analysis between the numerical predictions of our proposed model and the prior simulation data by Ding et al. [31].
2.3. Dynamic Porosity and Dynamic Permeability Model
The rock compressibility coefficient cφ is defined as the change in rock porosity per unit change in reservoir pressure. Variations in porosity within the saline aquifer are controlled by the pressure perturbations induced by CO2 injection into the reservoir. During the early stage of injection, substantial pressure buildup occurs near the injection well, which in turn alters the formation porosity and the storage capacity of the saline aquifer. Porosity is commonly assumed to vary exponentially with pore pressure [41]:
Here, φ0 is the initial reservoir porosity, φp is the porosity at a given time, P0 is the initial reservoir pressure, and P is the pore pressure at that time. In low-permeability saline formations, permeability is often assumed to vary exponentially with pore pressure, controlled by a permeability modulus ck, consistent with pore-scale fluid–solid coupling simulations that link stress concentration at pore throats to permeability change [42]:
Here, k0 is the initial reservoir permeability, and kp is the permeability at a given time.
The porosity and permeability relations in Equations (13) and (14) are introduced here as phenomenological constitutive laws for a conceptual sensitivity analysis rather than as site-calibrated geomechanical laws for the target storage formation. Their physical basis is the reduction in effective stress caused by injection-induced pore-pressure buildup when the total stress remains approximately unchanged [43]. In low-permeability sandstone, increasing effective stress tends to close compliant microcracks and pore throats, which usually causes small porosity reductions but larger permeability decreases, with the strongest sensitivity often associated with small pore-throat systems [44,45]. Under the reversible poroelastic assumption adopted here, the opposite stress path provides a physical basis for a modest local increase in porosity and a stronger increase in permeability during pore-pressure buildup. The sign and magnitude of this response are not universal and depend on stress path, confinement, rock type, pre-existing damage, and chemical alteration [44,45,46].
Equations (13) and (14) are applied here only within a limited range of conditions. They assume monotonic pressure buildup, reversible small-strain deformation, spatially averaged matrix response, and approximately constant coefficients cφ and ck over the tested pressure interval. In this study, cφ and ck are treated as bounded sensitivity parameters for a simplified low-permeability sandstone analogue rather than as calibrated formation constants. If injection-induced pressure exceeds the tensile strength of the rock or causes plastic yielding, these relations no longer apply, and more advanced constitutive descriptions would be required. In the present simulations, the maximum localized pressure buildup is about 2.7 MPa, so the exponential poroelastic assumption is used only as a bounded approximation for the moderate-pressure range examined in this study [46].
3. Conceptual Model
3.1. Establishment of the Geometric Model
This study develops a simplified two-dimensional radial numerical model to investigate the migration and dissolution behavior of supercritical CO2 in a saline aquifer. In actual geological settings, reservoir architecture is often complex and exhibits pronounced heterogeneity. However, due to the limited availability of publicly accessible geological data, the formation is simplified here as a horizontal homogeneous sandstone layer with a thickness of 50 m [38,47]. It should be noted that, because the model adopts several simplifying assumptions and generalized parameters, the results are intended primarily to elucidate governing mechanisms and parameter sensitivities rather than to quantitatively reproduce the storage performance of any specific site. Future work may incorporate more detailed geological information, such as well logs, core data, and three-dimensional structural models, to better constrain the model and develop fully coupled three-dimensional simulations that more realistically represent subsurface conditions, thereby providing a stronger basis for assessing storage capacity and containment security.
Selected reservoir parameters are partly taken from the literature for sensitivity analyses [47,48,49]. The baseline petrophysical parameters used in the model were adopted from our previous study [29]. The initial reservoir porosity and permeability are set to 0.25 and 50.65 mD, respectively, and both are allowed to evolve in space and time during subsequent CO2 injection. The residual CO2 saturation is parameterized using the Brooks–Corey model, with experimental saturation-distribution data for CO2–brine systems used as reference to ensure the physical consistency of the two-phase flow simulations [32]. For model simplification and baseline evaluation, the initial formation pore pressure is set to 18 MPa. In this study, conservative refers to a baseline choice that avoids underestimating the affected reservoir footprint and the near-well pressure response under the tested conditions. Under isothermal conditions, lower initial reservoir pressure yields lower supercritical CO2 density and viscosity [50]. For a fixed mass injection rate, the injected CO2 therefore occupies a larger volume and has higher mobility, which promotes a larger lateral plume footprint in the present model. The broader gas-phase distribution also enlarges the gas–brine contact area and leads to a wider dissolution footprint.
As shown in this study (Section 4.7), increasing the initial pressure from 18 MPa to 24 MPa reduces the lateral plume extent by about 96.68 m, decreases ΔPmax from 2.277 MPa to 2.027 MPa, and lowers the dissolved CO2 fraction from 12.2% to 10.8%. The 18 MPa case therefore gives the largest plume extent, the highest local pressure buildup, and the largest dissolved CO2 fraction among the tested initial-pressure scenarios, and it is adopted here as the conservative baseline. This value is also consistent with engineering conditions. Assuming a typical hydrostatic gradient of 10.0–10.5 MPa/km, an initial pore pressure of 18 MPa corresponds to a reservoir depth of about 1700–1800 m. For comparison, the range is close to the Krechba storage interval at In Salah, which is commonly reported at about 1800–1900 m depth and about 18 MPa initial reservoir pressure [51,52].
In this study, the thermophysical properties of CO2 are evaluated through Equations (10) and (11) under the reservoir conditions considered in this study. To simplify the flow calculations, brine is treated as an incompressible fluid with a constant density of 1020.7 kg/m3. This simplification omits some coupled fluid processes that may become important over longer timescales. Dissolution of CO2 into brine may increase aqueous-phase density. Previous studies reported density increases of about 1% in low-salinity systems and smaller increases in saline brines. Under certain conditions, this density increase may induce density-driven convection and promote dissolution by bringing undersaturated brine to the CO2–brine interface [53,54]. Pressure-induced brine compressibility is also small under typical deep saline-aquifer conditions. Using a representative brine compressibility of about 3.5 × 10⁻¹⁰ Pa−1 together with the simulated maximum pressure perturbation, the corresponding volumetric strain remains very small [55]. For the present 50-meter-thick model, a simple hydrostatic estimate indicates that, even if CO2 dissolution increases brine density by about 0.3% to 1.0%, the additional vertical pressure difference across the layer is only about 0.0015 to 0.0050 MPa [53,54]. This increment is much smaller than the injection-induced pressure perturbation resolved in the simulations. Neglecting variable brine density is therefore not expected to alter the first-order pressure buildup during the injection stage. This assumption may, however, lead to underestimation of longer-term convective dissolution and post-injection mixing [56].
Geochemical reactions among CO2, formation water, and minerals may modify pore structure and permeability, but these effects usually develop over timescales of decades to centuries [57]. The simulations in this study focus on a much shorter injection period. Over this time span, the impact of geochemical reactions on porosity and permeability is expected to be secondary relative to the pressure-driven poroelastic response examined here. These reactions and their effects on pore structure are therefore neglected.
The boundary conditions follow a near-well two-dimensional radial framework. CO2 is injected at the left boundary, which represents the cylindrical wall of a fully penetrating injection well with a radius of rw = 0.15 m [58]. The constant mass flux is distributed uniformly along the wellbore face over the full thickness of the storage interval. The right boundary is located 1000 m from the injection well and is prescribed as a constant-pressure boundary. In the present plume-scale radial model, this outer boundary is placed far enough from the injection well that the mobile CO2 plume remains within the computational domain while pressure dissipates in the outer single-phase region. Under the tested conditions, the maximum lateral extent of the mobile plume remains inside the model domain according to the plume criterion used in this study. The outer boundary therefore does not truncate the mobile two-phase plume itself. This truncated far-field boundary is consistent with axisymmetric CO2 injection models that focus on near-well multiphase flow and capillary-front development rather than basin-scale pressure propagation [58,59]. The present model is intended to resolve local plume migration, dissolution behavior, and near-well pressure evolution under this boundary configuration. As discussed in Section 4.1, the early pressure peak near the injection well is controlled mainly by local capillary resistance and relative-permeability reduction during capillary-front development [58].
To further verify that the adopted outer constant-pressure boundary does not materially affect the reported plume-scale results, a boundary-distance sensitivity test was performed for the baseline case at 1200 days by extending the outer boundary from 1000 m to 1500 m while keeping all other model settings unchanged. As summarized in Table 1, ΔPmax changes from 2.32 MPa to 2.36 MPa, the lateral plume radius from 722.8 m to 709.02 m, and the dissolved CO2 fraction from 12.197% to 12.043%. These differences are small, indicating that the adopted 1000 m outer boundary does not materially influence the key near-well pressure, plume, or dissolution metrics discussed in this study and is therefore sufficient for the present near-well plume-scale analysis. The conceptual model geometry is shown in Figure 4.
Table 1.
Boundary-distance sensitivity of key metrics for the baseline case at 1200 days.
Figure 4.
Schematic diagram of the model geometry.
The mathematical model is built on the following assumptions:
(1) The brine phase is treated as incompressible;
(2) Under the low-velocity conditions considered, two-phase flow of CO2 and brine follows Darcy’s law;
(3) Heat transfer is not considered, and no energy equation is solved;
(4) Geochemical reactions among CO2, brine, and minerals, and their effects on pore structure, are neglected within the simulated time frame.
3.2. Initial and Boundary Conditions
In the present model, the initial pressure condition is specified by Equation (15), and the temperature is prescribed as a fixed parameter by Equation (16). The fixed temperature is used to evaluate the density and viscosity of CO2:
The injection-flux boundary at the wellbore and the pressure boundary at the outer radial boundary are prescribed by Equations (17) and (18), respectively:
In all simulation scenarios, both the formation and the injected CO2 are assigned the same fixed temperature of 325.15 K. Temperature is prescribed as a fixed model parameter rather than a solved variable, and no energy equation is included in the present model. Therefore, no injection–temperature contrast is introduced, and CO2 density and viscosity vary only with pressure under the conditions considered here. This formulation isolates the effect of pressure-driven mechanical heterogeneity on CO2 plume migration, dissolution behavior, and pressure evolution.
4. Results and Discussion
4.1. Temporal Evolution of Reservoir Pressure
Figure 5 illustrates the reservoir pressure distribution following continuous CO2 injection for a specific duration. As CO2 is injected, the reservoir pressure in the vicinity of the injection well rises rapidly. With increasing injection time, the high-pressure zone gradually propagates into the confined reservoir region and its surroundings. When brine within the porous medium begins to desaturate, the relative permeability of the brine phase decreases markedly, causing the pore pressure in the formation to increase until a capillary front is established. Formation of the capillary front stabilizes pore-pressure accumulation near the injection well and limits further pressure escalation. As CO2 injection continues, the pressure front progressively advances deeper into the saline aquifer away from the injection well. Owing to the presence of the capillary front, pore-pressure accumulation near the injection well is more pronounced during the injection period, with a maximum pressure increase of approximately 2 MPa.
Figure 5.
Temporal variations in reservoir pressure distribution.
Based on the temporal evolution of pressure shown in Figure 5, a radial profile at a vertical depth of 25 m is extracted and plotted in Figure 6a to compare the radial evolution of pressure at injection times of 300, 600, 900 and 1200 days. Under constant-rate injection, the pressure near the injection well is strongly influenced by the gas phase. As injection proceeds, the pressure at the injection well continues to increase because the injected CO2 carries a relatively high pressure that acts on the near-well region, while buoyancy drives CO2 upwards, displacing brine from the pores and continuously dissolving into it. Conversely, distal regions experience minimal pressure perturbation, where pressure declines radially toward initial hydrostatic conditions. In addition, after a certain injection period, substantial CO2 accumulation within local pore spaces gives rise to localized pressure spikes.
Figure 6.
Reservoir pressure variation: (a) pressure variation in radial grids with a vertical distance of 25 m; (b) pressure variation with time at the grid.
To further quantify the temporal evolution of pressure, four representative grid points, A (10, 20), B (10, 40), C (600, 20) and D (600, 40), are selected, as shown in Figure 6b, to track pressure variations at different locations over time. Points A and B are located close to the injection well, where the pressure rises rapidly by about 1 MPa over a relatively short time. Pressures at all monitoring points rise from initial hydrostatic levels during continuous injection. Final pressure increments reach approximately 2 MPa at points A and B compared to 1.5 MPa at distal points C and D.
4.2. Dynamic Evolution of Porosity
Figure 7 illustrates the temporal evolution of porosity in the saline-aquifer model under constant-rate CO2 injection. Porosity changes are expressed as the ratio of the porosity at a given time to the initial porosity, and distributions at 300, 600, 900 and 1200 days of continuous injection are shown. After 300 days of CO2 injection, the porosity ratio is mainly clustered around 1.05, with only a slight increase to about 1.15 in the vicinity of the injection well. When the injection period is extended to 600 days, the porosity ratio increases further to around 1.18, and the region of enhanced porosity begins to spread outward.
Figure 7.
Temporal variations in dynamic porosity distribution.
After 900 days of injection, the porosity ratio continues to rise, reaching about 1.22 near the injection well, and the overall distribution decreases monotonically with distance from the injection well. At 1200 days, the porosity ratio near the well peaks at 1.25, and the enhancement zone expands further, while distal regions remain near the initial porosity. As injection continues, the CO2 plume gradually advances into the interior of the aquifer, pore pressure continues to accumulate, and porosity becomes significantly enhanced over an increasingly large region.
Figure 8a shows that, along the radial profile at a vertical depth of 25 m, the gas saturation is highly sensitive to the evolution of the porosity ratio induced by stress. In the early stage, porosity changes slowly, whereas gas saturation increases rapidly and eventually approaches 0.5. This indicates that, once injected, supercritical CO2 rapidly invades the pore space, increasing gas saturation over a short timescale, whereas pressure-driven porosity changes occur more slowly. Moreover, as the CO2 injection period increases, reservoir porosity increases more, which is consistent with persistent pore-pressure buildup during long-term injection and associated changes in pore structure.
Figure 8.
Variations in gas-phase saturation with porosity ratio: (a) gas-phase saturation variation with porosity ratio at different times; (b) gas-phase saturation variation with porosity ratio at different grid locations.
To further examine gas saturation as a function of porosity, four representative grid points, A (10, 20), B (10, 40), C (200, 20), and D (200, 40), were selected and are shown in Figure 8b. A comparison between points A and B shows that the region close to the caprock exhibits a faster porosity response and attains the highest ultimate gas saturation. Points C and D show a delayed porosity response in regions far from the injection well. Their initial rate of increase exceeds that at points A and B, and the porosity ratio at point D reaches 1.19.
4.3. Dynamic Evolution of Permeability
Figure 9 illustrates the temporal evolution of permeability in the saline-aquifer model under constant-rate CO2 injection. Permeability changes are expressed as the ratio of the permeability at a given time to the initial permeability, and distributions at 300, 600, 900 and 1200 days of injection are shown. After 300 days of CO2 injection, the permeability ratio remains near 1.0 across most of the domain. In the near-well region, the maximum increases from about 2.0 to about 2.2, whereas distal regions remain close to 1.0. Between days 900 and 1200, the maximum permeability ratio increases from 2.4 to 2.6. The high-permeability zone continues to expand outward, exhibiting pronounced spatial heterogeneity in permeability changes. These results indicate that pore pressure increases during constant-rate CO2 injection and alters effective stress and pore structure near the injection point, leading to increased permeability. In distal regions, pressure perturbations remain small, and permeability changes are limited because stress variations are small.
Figure 9.
Temporal variations in dynamic permeability distribution.
Figure 10a illustrates the relationship between gas saturation and the permeability ratio along a radial profile at a vertical depth of 25 m. During early CO2 injection, permeability ratio variations influence gas saturation, producing fluctuations in the saturation profile and a localized discontinuity. In distal regions, gas saturation becomes less sensitive to permeability. This behavior arises from the rapid migration of CO2 within high-permeability streaks, which causes transient local spikes in gas saturation. As the injection period increases, CO2 spreads in both radial and vertical directions, the spatial extent of permeability ratio variation widens, and the number of saturation jumps increases from one to two. This indicates that the spatial–temporal evolution of the permeability ratio controls CO2 displacement efficiency because preferential flow in high-permeability zones increases flow non-uniformity.
Figure 10.
Variations in gas-phase saturation with permeability ratio: (a) gas-phase saturation variation with permeability ratio at different times; (b) gas-phase saturation variation with permeability ratio at different grid locations.
Figure 10b shows the correlation between gas saturation and the permeability ratio at four selected grid points. A comparison of regions A and B indicates that gas saturation near the caprock is sensitive to permeability and increases to 0.5 as higher permeability promotes upward CO2 migration and accumulation. Regions C and D exhibit similar behavior, with local gas-saturation fluctuations associated with elevated permeability ratios. The final gas saturation values at regions B and D are comparable, suggesting that higher permeability leads to similar CO2 accumulation patterns at different locations near the caprock.
4.4. Comparison of the Temporal Evolution of Gas Saturation
Figure 11 presents the gas-saturation distribution in the saline aquifer after 1200 days of continuous CO2 injection. The lateral boundary of the CO2 plume footprint is defined by a gas-saturation threshold of sg > 0.001. In the deep sub-seabed saline aquifer, temperature and pressure exceed the critical point, and CO2 remains supercritical during injection. The density contrast between supercritical CO2 and brine, together with buoyancy, drives CO2 upward until the overlying caprock impedes migration, leading to CO2 accumulation near the caprock. As injection continues, the gas plume near the injection well thickens progressively, forming an expanding gas-saturated-zone. Temporal increases in CO2 plume thickness indicate continuous brine displacement from pore spaces. CO2 migrates upward and spreads laterally beneath the caprock, where pore structure constrains flow and retains CO2 within the sealed region.
Figure 11.
Influence of dynamic porosity and dynamic permeability on CO2 saturation: (a,c,e,g) static-property case; (b,d,f,h) dynamic porosity and dynamic permeability case.
Equations (13) and (14) relate porosity and permeability to pore pressure in the saline aquifer. Figure 11 compares gas migration between a dynamic model and a homogeneous static property model and shows that property coupling restricts the lateral and vertical extent of the gas-saturation front. The coupled evolution of porosity and permeability increases flow resistance, which limits plume spreading and slows the advance of the gas-saturation front. As pore pressure rises, porosity increases accordingly, allowing more supercritical CO2 to be accommodated in the pore space and thus enhancing the storage capacity of the saline formation. Larger CO2–brine interfacial area promotes dissolution, and aqueous phase trapping immobilizes dissolved CO2. This process reduces upward gas migration and increases storage.
To further investigate the influence of porosity and permeability evolution on CO2 saturation migration, a radial profile at a vertical depth of 50 m is extracted and plotted in Figure 12 to compare the extent of gas migration at 300, 600, 900 and 1200 days of injection. At 300 days, the radial extent of CO2 migration is nearly identical between the case with dynamic porosity and dynamic permeability and the case in which these properties are kept constant. The saturation front accelerates, and the migration distance progressively increases. At 600, 900, and 1200 days, differences emerge between the two cases, with a larger migration distance in the static-property case. Constant injection rates sustain pressure gradients, and the pressure-driven increase in pore volume enhances local CO2 retention, yielding plume patterns consistent with Figure 11. This comparison highlights a limitation of static property assumptions. Neglecting dynamic porosity and dynamic permeability tends to overpredict the plume footprint, which may lead to conservative regulatory or monitoring designs in CO2 geological storage assessments.
Figure 12.
Temporal evolution of radial gas-phase saturation profiles for the static-property case and the dynamic porosity and dynamic permeability case: (a) 300 and 600 days; (b) 900 and 1200 days.
Figure 13 shows the vertical distribution of gas saturation at a radial distance of 100 m. At all the sampled times, gas saturation increases with elevation, exhibiting a clear gradient from low values at the bottom to higher values near the top. In the case without porosity and permeability evolution, the vertical gas-saturation profile exhibits two sharp transitions, indicating weaker vertical constraint, a thicker plume, and faster upward advance. By contrast, when porosity and permeability evolve with pressure, CO2 migration is more restricted and the vertical plume is thinner. The total retained CO2 increases, and accumulation beneath the caprock becomes more pronounced.
Figure 13.
Vertical gas-phase saturation profiles at a radial distance of 100 m at 300, 600, 900, and 1200 days for (a) the dynamic porosity and dynamic permeability case and (b) the static-property case.
4.5. Sensitivity Boundaries of Geomechanical Parameters
The dynamic evolution of the saline aquifer is strongly controlled by the selected rock compressibility coefficient cφ and permeability modulus ck. Based on empirical constraints for rock compressibility and published stress-sensitivity data for low-permeability sandstone reservoirs, these parameters are expected to vary within a limited physical range [41,46,60]. In this study, the baseline values cφ = 1.0 × 10⁻⁷ Pa−1 and ck = 4.5 × 10⁻⁷ Pa−1 represent the upper bound of the pressure-sensitive response under the tested conditions [41,60]. These values define the upper-bound response of pressure-driven pore-volume expansion and permeability enhancement within the adopted constitutive framework. If the target formation is mechanically stiffer, with lower cφ and ck values, pressure-driven porosity and permeability evolution is weaker. In that case, the local pressure buildup ΔPmax tends to increase, while the lateral plume footprint extends farther from the injection well [46].
The lower bound of the sensitivity range is cφ = 0 and ck = 0. This end member corresponds exactly to the static-property case presented in Figure 11, Figure 12 and Figure 13. The physically realistic response range is therefore bounded by the dynamic porosity and dynamic permeability case and the static-property case.
Figure 14a shows the temporal evolution of the permeability ratio k/k0 for different permeability moduli in a low-permeability reservoir with k = 50 mD. Higher ck values produce a stronger permeability response to pore-pressure buildup. The baseline value used in the main simulations, ck = 4.5 × 10⁻⁷ Pa−1, gives the largest permeability increase and represents the upper bound of permeability enhancement within the adopted range [41]. As ck decreases to 1.5 × 10⁻⁸ Pa−1, the permeability ratio remains close to 1.0 and approaches a near-static response.
Figure 14.
Sensitivity boundaries of the geomechanical parameters used in this study: (a) effect of ck on k/k0 in a low-permeability reservoir (k = 50 mD); (b) relationship between cφ and φ based on Birdsell et al. [60].
Figure 14b shows the empirical relationship between rock compressibility and initial porosity reported by Birdsell et al. [60]. For the modeled saline aquifer with an initial porosity of 0.25, this relationship provides a physical constraint on cφ and indicates that the selected value cφ = 1.0 × 10⁻⁷ Pa−1 lies within a geomechanically reasonable range [41]. Together, Figure 14a,b define the physically constrained range used in this study and support interpretation of the baseline case as an upper-bound response.
The influence of these geomechanical parameters on plume migration, pressure buildup, and dissolution is therefore interpreted through the two end members already presented in this study. Figure 11, Figure 12 and Figure 13 show that the static-property case produces a larger lateral plume footprint and a less confined vertical saturation profile than the dynamic porosity and dynamic permeability case. Table 2 further shows that the maximum pressure buildup is 2.277 MPa and the dissolved CO2 fraction is 12.2% in the dynamic porosity and dynamic permeability case, whereas ΔPmax increases to 2.732 MPa and the dissolved fraction decreases to 9.5% in the static-property case. These results indicate that weaker geomechanical sensitivity shifts the model response toward a larger plume footprint, higher near-well pressure buildup, and lower dissolution trapping. This trend is consistent with published coupled laboratory–numerical studies showing that the mechanical response of low-permeability sandstone reservoirs can alter migration distance, pressure response, and storage performance during CO2 injection [46].
Table 2.
Quantitative summary of CO2 mass partitioning and maximum pressure buildup for different simulation scenarios at 1200 days. Cases 1–4 denote the calculated results for the four initial reservoir pressure cases defined in Section 4.7.
Equations (13) and (14) define monotonic exponential responses to positive pressure perturbation. Figure 14a shows the same monotonic trend in k/k0 as ck varies. Intermediate cφ and ck values within the physically constrained range are therefore expected to yield plume footprint, ΔPmax, and dissolved fraction bounded by the two end members examined here. The dynamic porosity and dynamic permeability case and the static-property case thus define practical upper and lower bounds and provide a first-order uncertainty envelope for the moderate-pressure range considered in this study.
4.6. Dissolution Behavior of CO2
Figure 15 shows the spatial distribution of normalized dissolved CO2 concentration at different times under conditions with dynamic porosity and dynamic permeability. The lateral boundary of the dissolved CO2 footprint is defined by a concentration ratio threshold of cg > 0.001. At 300 days, the dissolved CO2 concentration gradient near the injection well is steep, and the dissolved concentration ratio decreases from 1 to 0 over a penetration distance of about 204.6 m, indicating a narrow dissolution zone. In the early stage, high-concentration CO2 at the injection well contacts brine, and the concentration gradient drives dissolution, while the unsaturated aqueous phase provides capacity for CO2 uptake. However, the penetration distance remains limited, partly because the time available for diffusion is short and partly because the initial pore structure constrains long-range CO2 migration. At 600 days of injection, the dissolution front advances to about 381.44 m, the concentration gradient becomes less steep, the penetration depth increases, and the transition zone broadens.
Figure 15.
Temporal variations in CO2 dissolution distribution in the saline aquifer.
At 900 days, the penetration distance increases to about 551.21 m, the dissolution zone broadens, and the concentration gradient steepens again. This pattern reflects sustained pressure gradients that drive deeper CO2 transport over time. Rising pore pressure alters porosity and permeability, which slows local CO2 transport but increases dissolution. Although pore stress effects add flow resistance, constant CO2 injection maintains the driving force, and diffusion complements advection by sustaining CO2 transport as pore structure evolves. By 1200 days, the dissolution front advances to about 732.44 m, and the concentration gradient flattens, yielding a smoother spatial distribution of dissolved CO2 concentration. This indicates that the system approaches a quasi-steady state in which diffusion becomes more important than in the earlier advection-dominated stage. As a result, dissolved CO2 becomes more uniform across the domain, consistent with long-term dissolution.
Four grid points, A (10, 39), B (100, 39), C (300, 39) and D (400, 39), are selected to examine the temporal evolution of dissolved CO2 concentration. Figure 16a shows that dissolved CO2 increases rapidly at points A and B, with higher dissolution rates closer to the injection well. This indicates that, when the CO2 front reaches these locations, high local CO2 concentration and CO2–brine contact increase dissolution. Figure 16b shows continued dissolution at points C and D, with lower dissolved CO2 concentration at point D than at point C. This suggests that brine dissolves CO2 upstream along the migration path, leaving lower CO2 concentration when the front reaches point D. A comparison regarding Figure 16a,b shows that points A and B are closer to the injection well, whereas points C and D are farther away and are reached later by the CO2 front. Throughout the dissolution process, most dissolution occurs near the injection well, which reduces the amount of CO2 reaching points C and D.
Figure 16.
Temporal variations in dissolved concentration ratio at different grid locations. (a) Concentration ratio at locations A and B. (b) Concentration ratio at locations C and D.
4.7. Influence of Reservoir Pressure on the Dissolution Behavior of CO2
As reservoir pressure increases in Equations (13) and (14), both porosity and permeability increase accordingly, which influences the migration and dissolution behavior of supercritical CO2 in saline aquifers. This study defines four cases with different initial reservoir pressures to represent reservoir conditions at different formation depths and to evaluate how reservoir pressure affects supercritical CO2 dissolution in saline formations. The parameter settings for these cases are summarized in Table 3.
Table 3.
Case setup for the investigation of reservoir pressure.
The migration and dissolution patterns of CO2 in the different cases are shown in Figure 17a. From Case 1 to Case 4, as the reservoir pressure gradient increases, the lateral extent of the CO2 gas plume decreases by about 96.68 m. This result suggests that porosity exerts stronger control than permeability on phase distribution and on CO2 migration and dissolution, with a large fraction of CO2 retained in dissolved form within pore space. Under higher-pressure conditions, CO2 density and viscosity increase, which increases flow resistance and further limits lateral spreading. In addition, larger pressure differences may promote vertical CO2 migration, which partially suppresses lateral flow.
Figure 17.
(a) Dissolution distribution of CO2 in a layered saline aquifer under different reservoir pressure cases. (b) Variations in CO2 dissolution with radial distance in stratified saline aquifers with different reservoir pressure arithmetic cases.
Figure 17b depicts the variations in dissolved CO2 concentration along the radial profile at a vertical depth of 25 m under different reservoir pressures. Near the injection well, Case 1 exhibits the highest dissolved CO2 concentration, whereas Case 4 has the lowest concentration. In addition, Case 1 exhibits the steepest decay of CO2 concentration with radial distance from the injection well. In Case 1, lower reservoir pressure reduces CO2 resistance to diffusion and flow in brine, which increases dissolution and downstream transport.
To quantitatively evaluate the impact of dynamic petrophysical evolution and varying initial reservoir pressures on CO2 storage performance, Table 2 summarizes the total injected CO2 mass in the 2D section, the gas-phase CO2 fraction, the dissolved CO2 fraction, and the maximum pressure buildup ΔPmax at 1200 days. In Table 2, the baseline corresponds to the 18 MPa reference scenario under dynamic porosity and dynamic permeability. It serves as the reference for comparison with the static-property case to isolate geomechanical feedback and is also identical to Case 1 in the initial-pressure sensitivity analysis. This shared reference state allows direct evaluation of the effect of increasing initial reservoir pressure from 18 MPa to 24 MPa.
As shown in Table 2, neglecting the dynamic evolution of porosity and permeability changes the predicted storage partitioning and pressure response. In the static-property case, ΔPmax increases from 2.277 MPa to 2.732 MPa, the dissolved CO2 fraction decreases from 12.2% to 9.5%, and the gas-phase CO2 fraction increases from 87.8% to 90.5%. These results show that the static property assumption overestimates pressure buildup and underestimates dissolution trapping.
Table 2 also quantifies the effect of initial reservoir pressure. As the initial pressure increases from 18 MPa to 24 MPa, the dissolved CO2 fraction decreases from 12.2% to 10.8%, while the gas-phase CO2 fraction increases from 87.8% to 89.2%. Over the same range, ΔPmax decreases from 2.277 MPa to 2.027 MPa. These quantitative results support the pressure-dependent trends discussed above and enable direct comparison among the different scenarios.
4.8. Influence of Permeability Anisotropy on the Dissolution Behavior of CO2
Permeability anisotropy refers to directional differences in rock permeability and is common in layered saline reservoirs, where it affects CO2 migration pathways and dissolution behavior. To evaluate this effect under dynamic porosity and permeability evolution, four cases with kh/kv values of 1, 10, 100, and 1000 were defined, as summarized in Table 4. Values up to kh/kv = 100 span the anisotropy range commonly examined in layered saline aquifers, where reduced vertical permeability promotes lateral plume spreading [61,62]. The case kh/kv = 1000 was included as an upper-bound stress test, consistent with deep saline-aquifer sensitivity studies that examined the equivalent case kv/kh = 0.001 and reported strong suppression of upward gas migration under very low vertical permeability [49].
Table 4.
Simulation cases for the permeability anisotropy analysis.
Figure 18a illustrates the CO2 dissolution patterns after 1200 days of injection for the different simulation cases. For Case 1 and Case 2, CO2 initially migrates upward and dissolves during ascent until it encounters the caprock and then spreads laterally along the base of the caprock. This pattern indicates vertical CO2 migration within the formation followed by lateral spreading beneath the caprock. As the ratio kh/kv increases, the CO2 dissolution patterns in Case 3 and Case 4 change, shifting from vertical migration to lateral spreading. A higher kh/kv indicates greater horizontal than vertical permeability, which favors lateral spreading of CO2 over its upward migration toward the caprock.
Figure 18.
(a) Dissolution distribution of CO2 in a layered saline aquifer under different permeability anisotropy cases. (b) Variations in CO2 dissolution with radial distance in stratified saline aquifers with different permeability anisotropy algorithms.
Figure 18b shows that dissolved CO2 concentration decreases from high values near the injection well to lower values farther away, exhibiting an overall negative correlation with radial distance. As the ratio kh/kv increases, the rate of concentration decline becomes faster. In Case 1, concentration drops sharply at a distance of about 260 m, whereas, in Cases 2, 3 and 4, a pronounced decrease occurs at around 500 m. In addition, the transition zone narrows as kh/kv increases, and Case 1 exhibits the broadest transition zone. This suggests that higher kh/kv localizes CO2 dissolution. This localization may increase local storage but may also increase the risk of pressure buildup and instability in high-concentration zones.
Table 5 shows that increasing kh/kv suppresses vertical CO2 migration and reduces the lateral plume radius from 732.44 m in Case 1 to 489.22 m in Case 4. Over the same range, ΔPmax increases from 2.277 MPa to 2.500 MPa in Cases 1 to 3 and then decreases slightly to 2.460 MPa in Case 4. The dissolved CO2 fraction changes only slightly across Cases 1 to 3, from 12.199% to 12.245%, and increases to 13.084% in Case 4. These results indicate that permeability anisotropy mainly changes plume geometry and pressure localization. Its effect on the total dissolved fraction remains limited over the standard anisotropy range and becomes more pronounced only in the upper-bound case. This behavior reflects the contrast between vertical and horizontal flow mobility.
Table 5.
Quantitative summary of maximum pressure buildup, plume radius, and dissolved CO2 fraction for different permeability anisotropy ratios at 1200 days.
From a physical standpoint, permeability anisotropy controls the relative mobility of vertical and horizontal flow. In formations closer to isotropy, buoyancy drives CO2 upward more readily, so the plume reaches the caprock before spreading laterally. As kh/kv increases, vertical flow becomes less favorable than horizontal flow. The upward migration of free-phase CO2 is then more strongly restricted, and a larger fraction of the injected CO2 is redistributed along the more permeable horizontal direction. In the present simulations, this shift produces a more confined plume with greater local thickness. This geometry explains the smaller far-field plume radius and the slightly higher local pressure buildup under anisotropic conditions.
This pattern indicates that anisotropy redistributes plume geometry more strongly than it changes bulk storage behavior. For Cases 1 to 3, suppression of upward migration is partly offset by sustained gas–brine contact within the laterally connected sandstone, so the dissolved CO2 fraction changes little. Only under extreme anisotropy does strong vertical confinement increase residence time and interfacial contact in the lower part of the formation, which increases the dissolved fraction. In this model, anisotropy mainly controls plume orientation, local confinement, and pressure localization, whereas its influence on total dissolution becomes appreciable only at high anisotropy.
4.9. Evolution of CO2 in Stratified Saline Aquifers Under Dynamic Porosity and Dynamic Permeability
Deep saline aquifers offer large storage capacity, and alternating high-porosity, high-permeability sandstone and low-porosity, low-permeability shale form a layered architecture. Sandstone layers provide storage space, whereas shale layers restrict upward CO2 migration because of low permeability and reduce leakage risk, which creates natural geological conditions for long-term CO2 containment. Porosity and permeability contrasts across layers control CO2 plume migration pathways and CO2–brine contact efficiency. High-porosity and high-permeability sandstone layers provide the main storage space and preferential flow pathways for CO2, whereas low-porosity and low-permeability shale interlayers impede vertical migration and redirect the plume laterally [63]. As a result, the plume becomes vertically segmented, CO2 residence time within sandstone layers increases, and gas–brine contact near layer interfaces is prolonged, which favors dissolution trapping.
To focus on CO2 migration in stratified saline aquifers with dynamic porosity and permeability evolution, this study combines the dynamic porosity and permeability formulation developed in this chapter with the geometric model proposed by previous research [29] to investigate CO2 evolution. The conceptual model is shown in Figure 19, and the procedure for constructing the numerical model is not repeated here.
Figure 19.
Geometric configuration of the stratified model.
Figure 20a shows that the maximum porosity ratio in the stratified saline formation is about 1.16, whereas Figure 20b indicates that the maximum permeability ratio reaches about 2. This implies that, after 1000 days of CO2 injection, porosity and permeability increase by about 16% and 100%, respectively, consistent with the nonlinear relationship predicted by the Kozeny–Carman model. Permeability increases more than porosity, indicating higher sensitivity to pore structure changes. The spatial patterns of porosity and permeability are correlated, with the central diagonal band exhibiting the strongest changes, reflecting non-uniform spreading of the injected CO2 from the central region outward. In addition, the shale layers act as barriers to porosity and permeability evolution, confining most changes to the lower sandstone aquifer, where changes spread horizontally and vertically.
Figure 20.
Dynamic evolution process of layered saline aquifer: (a) porosity evolution; (b) permeability evolution.
Figure 21 further examines porosity evolution in the stratified saline aquifer. Figure 21a shows the variations in the porosity ratio with radial distance in each layer of the saline aquifer. Porosity in the first lowermost layer is generally higher than in the overlying layers, and the amplitude of porosity ratio variations decreases with increasing layer index. Figure 21b depicts the variations in the porosity ratio with vertical distance in four representative zones extending outward from the left boundary. The vertical trend matches the radial trend, with porosity ratio decreasing with vertical distance. In addition, porosity ratio changes abruptly at shale layers. Near the injection well, three shale layers show sharp drops in porosity ratio, whereas, in distal regions, local spikes occur near shale layers.
Figure 21.
Layered saline-aquifer porosity ratio variations: (a) porosity ratio variation with radial distance; (b) porosity ratio variation with vertical distance; (c) permeability ratio variation with radial distance; (d) permeability ratio variation with vertical distance.
Figure 21c shows permeability ratio as a function of radial distance in each layer of the stratified saline aquifer and as a function of vertical distance in four zones extending outward from the left boundary. The permeability ratio pattern is consistent with that of the porosity ratio, but the magnitude of permeability change is larger, consistent with Figure 21d. As with porosity, sharp transitions in permeability ratio occur at the three shale layers. Sharp decreases occur near the boundary, whereas local increases occur farther from the boundary. This pattern suggests that shale layers may develop pressure discontinuities because their low permeability restricts fluid migration.
Figure 22a compares the gas-saturation distribution in the stratified saline aquifer with and without dynamic porosity and permeability evolution. White contour lines indicate the gas saturation field for the case without permeability and porosity evolution. The gas-saturation front travels farther in the homogeneous case without dynamic porosity and permeability evolution than in the stratified case with dynamic porosity and permeability evolution. In the first aquifer layer, the CO2 gas plume extends vertically to a much greater extent and has already reached the uppermost layer. This is because, in the homogeneous model, CO2 migrates with less resistance, whereas, in the heterogeneous model, pressure-driven porosity and permeability evolution increases flow restriction and enhances dissolution trapping, which shortens the gas-plume travel distance. With more layers, multilayer flow pathways increase the difference in migration distance between the two cases.
Figure 22.
Layered saline-aquifer CO2 migration and distribution: (a) comparison of gas-phase saturation evolution; (b) CO2 dissolution distribution.
Figure 22b presents the spatial distribution of dissolved CO2 in the stratified saline aquifer when permeability and porosity evolution is considered. The results show that CO2 is confined within shale layers because of low permeability and porosity, forming high dissolved CO2 zones at the bases of shale intervals. In addition, CO2 migrates rapidly in the radial direction, consistent with locally increased permeability and preferential flow paths that control CO2 dissolution and migration. These results indicate that shale interlayers act as hydraulic barriers that limit vertical migration and concentrate dissolution near layer interfaces. This mechanism may also apply to injection in other layered media, including waste disposal and hydrogen storage.
Physically, the shale interlayers behave as intra-reservoir baffles rather than perfectly sealing boundaries. Their low permeability sharply reduces vertical transmissibility across layer interfaces, so buoyancy-driven upward migration is repeatedly interrupted and CO2 accumulates beneath the shale beds. This local accumulation increases residence time in the lower sandstone and redirects part of the plume laterally until the pressure gradient becomes large enough to bypass the barriers through more permeable pathways. As a result, pressure buildup, porosity–permeability evolution, and dissolution are concentrated in the lower injection interval, while only a limited fraction of CO2 reaches the overlying layers. This mechanism explains the strong layer-by-layer decay in CO2 mass shown in Table 6.
Table 6.
Layer-by-layer summary of CO2 mass distribution, dissolution, and localized pressure buildup at 1200 days.
Figure 23a shows how gas saturation varies with radial distance in each layer of the stratified saline aquifer under different porosity and permeability conditions. Within each layer, gas saturation follows a similar trend and decreases with radial distance. In the homogeneous model without dynamic porosity and permeability evolution, CO2 migrates farther radially than in the stratified model with dynamic porosity and permeability evolution. With dynamic porosity and permeability evolution, gas saturation remains higher than in the static-property case before it declines, indicating that local high-porosity and high-permeability zones promote initial CO2 accumulation and delay subsequent spreading.
Figure 23.
Comparison of CO2 transport distributions within stratified saline aquifers: (a) gas-phase saturation versus radial distance; (b) gas-phase saturation versus vertical distance.
Figure 23b presents the variations in gas saturation with vertical distance in two representative zones extending outward from the left boundary. In the static-property case, CO2 migrates farther vertically and forms a thicker plume. In the stratified case with dynamic porosity and permeability evolution, heterogeneity restricts vertical migration and yields a thinner gas plume. These findings are consistent with the migration patterns shown in Figure 22a and show that spatial variations in porosity and permeability control the vertical distribution and migration of CO2.
Figure 24 illustrates the variations in dissolved CO2 concentration with radial distance in the first and second layers of the stratified saline aquifer with dynamic porosity and permeability evolution, as well as the variation with vertical distance in two representative zones. Figure 24a shows that dissolved CO2 increases less with increasing layer index, indicating that lower porosity and permeability in upper layers constrain dissolution. Figure 24b indicates that, in both zones, the CO2 dissolution front does not extend to the uppermost layer, and the dissolved CO2 in zone 1 is higher than in zone 2. This suggests that low permeability increases flow resistance and slows CO2 gas migration and dissolution-driven spreading, whereas high porosity promotes CO2 dissolution into brine and increases local dissolution trapping.
Figure 24.
Distribution of dissolved CO2 within the stratified layer: (a) concentration ratio with radial distance; (b) concentration ratio with vertical distance.
Table 6 summarizes the layer-resolved distribution of CO2 mass, dissolved CO2 mass, and local pressure buildup at 1200 days and quantifies how low-permeability shale interlayers control plume redistribution within the layered reservoir. For each sandstone layer, Table 6 reports the total CO2 mass, the corresponding fraction of the total CO2 inventory in the sandstone layers, the dissolved CO2 mass, and the layer-specific maximum pressure buildup ΔPmax. Here, layer-resolved CO2 mass distribution is used as a cumulative proxy for vertical flux partitioning because it integrates the net effect of interlayer transfer over the full injection period. The results show a clear upward decrease in total CO2 mass, dissolved CO2 mass, and ΔPmax. Layer 1 contains 1.184 × 10⁶ kg/m of CO2, which corresponds to 61.4% of the CO2 inventory in the sandstone layers and also exhibits the largest dissolved CO2 mass, 1.46 × 10⁵ kg/m, and the highest ΔPmax, 1.57 MPa. The overlying layers contain progressively less CO2, with 23.7% in Layer 2, 11.7% in Layer 3, and 3.3% in Layer 4. These results indicate that the shale interlayers limit vertical communication and localize CO2 accumulation, dissolution, and pressure buildup in the lower part of the layered reservoir.
The sensitivity analyses reveal a clear hierarchy of controls on the modeled storage behavior. For pressure buildup, the strongest overall sensitivities are associated with initial reservoir pressure and permeability anisotropy. As the initial reservoir pressure increases from 18 MPa to 24 MPa, the maximum pressure buildup decreases from 2.277 MPa to 2.027 MPa, corresponding to a reduction of about 11.0%. By comparison, increasing the permeability anisotropy ratio (kh/kv) from 1 to 100 increases the maximum pressure buildup from 2.277 MPa to 2.500 MPa, i.e., by about 9.8%, indicating a slightly weaker but still significant control. In contrast, shale interlayers mainly affect the vertical distribution of pressure rather than the domain-scale peak, as evidenced by the strong localization of pressure in the bottom injection aquifer.
For plume extent, permeability anisotropy is the dominant control on lateral spreading. As kh/kv increases from 1 to 1000, the lateral plume radius decreases from 732.44 m to 489.22 m, i.e., by 33.2%, which is substantially larger than the 96.68 m reduction caused by increasing the initial reservoir pressure from Case 1 to Case 4. However, shale interlayers exert the strongest control on vertical plume compartmentalization: only 3.3% of the CO2 reaches the top aquifer, whereas 61.4% remains in the bottom injection aquifer and 85.1% is retained within the lower two aquifers.
For CO2 dissolution, initial reservoir pressure exerts the strongest control on the total dissolved fraction among the explicit sensitivity cases. As the initial pressure increases from 18 MPa to 24 MPa, the dissolved fraction decreases from 12.2% to 10.8%. In comparison, permeability anisotropy changes the dissolved fraction only modestly, from 12.199% to 13.084%. The shale interlayers mainly control where dissolution occurs, concentrating dissolved CO2 near layer interfaces and in the lower aquifers rather than causing the strongest change in the domain-integrated dissolved fraction. These results indicate that permeability anisotropy dominates lateral plume prediction, shale interlayers dominate vertical containment and dissolution localization, and initial reservoir pressure exerts the strongest control on total dissolution efficiency and pressure mitigation potential.
4.10. Critical Comparison with Recent Studies
The sensitivity-analysis results for plume extent, pressure buildup, vertical compartmentalization, and dissolution should be interpreted in the context of recent studies on CO2 transport in heterogeneous and layered saline aquifers. First, the present predictions of plume extent and pressure buildup are broadly consistent with recent field-oriented multilayer studies. For example, Shen et al. [38] reported hundred-meter-scale horizontal CO2 migration after one year and MPa-scale pressure increases in an offshore multilayer saline aquifer, indicating that the plume extent and pressure response predicted in the present study fall within a realistic field-relevant range. However, their model focused on hydro-mechanical performance under six-layer injection over a longer timescale, whereas the present study emphasizes the coupled evolution of two-phase flow, dissolution, and dynamic porosity and dynamic permeability. Therefore, exact numerical agreement is not expected, and the value of the comparison lies in consistency of order of magnitude and governing trends.
Second, the strong baffle effect of shale interlayers obtained here is in close agreement with recent studies of stratified and shale-interbedded systems. Rezk and Ibrahim [39] used a Sleipner-based 3D model with nine permeable sand layers separated by thin shale barriers and showed that heterogeneity promotes structural compartmentalization, increases solubility trapping, and reduces residual trapping. Similarly, Wu et al. [29] found that, in a stratified saline aquifer, the plume initially spreads radially in the lower aquifer and then accumulates beneath shale and caprock layers, with dissolution behavior strongly controlled by porosity and permeability contrasts. These results are consistent with those studies in showing that shale barriers do not simply restrict upward migration but also reorganize plume mass, localize pressure buildup, and concentrate dissolved CO2 near shale–sandstone interfaces.
Third, the anisotropy trend observed in the present simulations is physically consistent with recent anisotropy studies. Guo and Wang [40] showed that increasing the vertical-to-horizontal permeability ratio enhances upward migration, whereas a lower vertical permeability suppresses vertical transport. Because their anisotropy parameter is defined as kv/kh, while the present study uses kh/kv, the two studies provide reciprocal descriptions of the same directional-permeability control. This comparison indicates that the reduction in plume radius and the stronger lateral confinement observed here under higher kh/kv are consistent with a broader physical trend reported in recent studies rather than being only model-specific numerical outcomes.
Recent studies have emphasized that multiscale geological and capillary heterogeneity may redirect plume migration, alter trapping partitioning, and lead to significant deviations when overly simplified homogeneous models are used [64]. Across these studies, structural heterogeneity controls where CO2 accumulates, whereas pressure-sensitive petrophysical evolution controls how far the plume spreads and how pressure and dissolution partition under the same structural setting. In this sense, the present study demonstrates that plume extent, pressure localization, and dissolution trapping are jointly controlled by layered architecture and dynamic porosity–permeability evolution.
5. Conclusions
Using numerical simulations, this study examines constant-rate injection of supercritical CO2 into sub-seabed saline aquifers while allowing porosity and permeability to evolve with pressure. The results indicate that assumptions of constant porosity and permeability bias predicted plume extent and near-well pressure response, and that the sensitivity depends on anisotropy, initial pressure, and shale interlayers. The main conclusions are as follows:
- (1)
- Under constant-rate injection, the CO2 plume progressively advances and displaces brine. However, when pressure-dependent porosity and permeability are incorporated, the simulated radial extent of the CO2 plume is smaller than in the static-property case. Omitting dynamic porosity and permeability evolution leads to an overestimation of the plume footprint under the tested conditions.
- (2)
- Reservoir pressure increased near the injection well and decayed with radial distance, with a maximum increase of about 2 MPa in the near-well region. The largest porosity and permeability increases occurred where pressure perturbations were strongest, which implies that models assuming constant porosity and permeability omit a localized zone of elevated permeability near the injection well.
- (3)
- The porosity and permeability increases were spatially heterogeneous and peaked near the injection well, reaching ratios of about 1.25 and 2.6 in the homogeneous case. These localized property changes modified the preferential flow pathways and the spatial distribution of gas saturation during injection.
- (4)
- The rapid initial dissolution is driven by strong concentration gradients and fresh brine contact. Over time (e.g., from 300 to 1200 days), the system approaches a quasi-steady state. The dynamic evolution of pore structure maintains a balance between pressure-driven migration and dissolution trapping.
- (5)
- A higher permeability anisotropy ratio, kh/kv, redistributes the CO2 plume by restricting vertical migration relative to horizontal flow. In the present model, this produces a more confined plume, greater local CO2 accumulation, and a slight increase in pressure buildup, while the total dissolved fraction remains nearly unchanged unless anisotropy is strong.
- (6)
- In layered aquifers, shale interlayers act as hydraulic baffles that interrupt buoyancy-driven upward migration and redirect CO2 laterally within sandstone layers. This process compartmentalizes plume evolution, localizes pressure buildup and petrophysical change within the lower injection interval, and extends gas–brine contact near shale–sandstone interfaces, increasing local dissolution trapping.
Overall, this study shows that pressure-driven changes in porosity and permeability modify plume extent, pressure buildup, and dissolution patterns relative to simulations with constant properties. Although the present model is conceptual and designed to isolate parameter sensitivities, it provides a physically interpretable basis for assessing the bias introduced by static-property assumptions in saline-aquifer CO2 storage. One limitation is that variable-density brine flow associated with CO2 dissolution is not represented. Future work may incorporate variable-density flow, geochemical reactions, and more realistic three-dimensional layered architectures constrained by site-specific geological data to evaluate the coupled effects of evolving petrophysical properties and reservoir heterogeneity under field-relevant storage conditions.
Author Contributions
Conceptualization, B.W. (Bohao Wu); methodology, Y.B.; formal analysis, B.W. (Bohao Wu); investigation, X.Z.; resources, C.C.; data curation, B.W. (Ben Wang); writing—original draft preparation, B.W. (Bohao Wu) and Y.T.; writing—review and editing, C.C. and Y.J.; visualization, W.C.; supervision, C.C.; funding acquisition, B.W. (Bohao Wu) and C.C. All authors have read and agreed to the published version of the manuscript.
Funding
This study was supported by the National Natural Science Foundation of China (No. 52306187); the Fundamental Research Funds for the Central Universities of China (Grant Nos. 3132024205 and 3132023527), the China Scholarship Council (No. 201703780060), and the Open Fund of the Key Laboratory of Ocean Energy Utilization and Energy Conservation of Ministry of Education (Grant No. LOEC-202004).
Data Availability Statement
The original contributions presented in this study are included in the article. Further inquiries can be directed to the corresponding author.
Acknowledgments
During the preparation of this manuscript, the authors used DeepSeek V3.1 for the purposes of checking and correcting English grammar errors. The authors have reviewed and edited the output and take full responsibility for the content of this publication.
Conflicts of Interest
The authors declare no conflicts of interest.
References
- Mert, E.; Aksu, M.; Celiktas, M.S. Projections of Global Energy Transition Models in the Wake of Industrial Revolution and Climate Change Policies. Clean Energy Sci. Technol. 2025, 3, 273–301. [Google Scholar] [CrossRef] [Scilit]
- Gidden, M.J.; Joshi, S.; Armitage, J.J.; Christ, A.-B.; Boettcher, M.; Brutschin, E.; Köberle, A.C.; Riahi, K.; Schellnhuber, H.J.; Schleussner, C.-F.; et al. A Prudent Planetary Limit for Geologic Carbon Storage. Nature 2025, 645, 124–132. [Google Scholar] [CrossRef] [Scilit]
- Michaelides, E.E. Power and Energy Requirements for Carbon Capture and Sequestration. Thermo 2025, 5, 8. [Google Scholar] [CrossRef] [Scilit]
- Mahmoodpour, S.; Rostami, B. Design-of-Experiment-Based Proxy Models for the Estimation of the Amount of Dissolved CO2 in Brine: A Tool for Screening of Candidate Aquifers in Geo-Sequestration. Int. J. Greenh. Gas Control 2017, 56, 261–277. [Google Scholar] [CrossRef] [Scilit]
- Alcalde, J.; Flude, S.; Wilkinson, M.; Johnson, G.; Edlmann, K.; Bond, C.E.; Scott, V.; Gilfillan, S.M.V.; Ogaya, X.; Haszeldine, R.S. Estimating Geological CO2 Storage Security to Deliver on Climate Mitigation. Nat. Commun. 2018, 9, 2201. [Google Scholar] [CrossRef] [Scilit]
- Ritzi, R.W.; Freiburg, J.T.; Webb, N.D. Understanding the (Co)Variance in Petrophysical Properties of CO2 Reservoirs Comprising Sedimentary Architecture. Int. J. Greenh. Gas Control 2016, 51, 423–434. [Google Scholar] [CrossRef] [Scilit]
- Gershenzon, N.I.; Ritzi, R.W., Jr.; Dominic, D.F.; Soltanian, M.; Mehnert, E.; Okwen, R.T. Influence of Small-Scale Fluvial Architecture on CO2 Trapping Processes in Deep Brine Reservoirs. Water Resour. Res. 2015, 51, 8240–8256. [Google Scholar] [CrossRef] [Scilit]
- Hu, C.; Agostini, F.; Jia, Y. Porosity and Permeability Evolution with Deviatoric Stress of Reservoir Sandstone: Insights from Triaxial Compression Tests and in Situ Compression CT. Geofluids 2020, 2020, 6611079. [Google Scholar] [CrossRef] [Scilit]
- Li, S.; Wang, X.; Jiang, L.; Wang, L.; Zhang, Y.; Wu, B.; Song, Y. Dynamic Characterize of Interface and Mass Transfer of CO2-Brine during CO2 Storage in Saline Aquifer. Gas Sci. Eng. 2025, 143, 205717. [Google Scholar] [CrossRef] [Scilit]
- Cheng, Z.; Li, Y.; Xie, C.; Du, F.; Zhao, H.; Yin, X.; Huang, J. Effect of Fracture-Matrix Interaction on CO2-Oil Displacement via Dual-Permeability Microfluidics. Energy Fuels 2025, 39, 17386–17396. [Google Scholar] [CrossRef] [Scilit]
- Mahyapour, R.; Mahmoodpour, S.; Singh, M.; Omrani, S. Effect of Permeability Heterogeneity on the Dissolution Process during Carbon Dioxide Sequestration in Saline Aquifers: Two-and Three-Dimensional Structures. Geomech. Geophys. Geo-Energy Geo-Resour. 2022, 8, 70. [Google Scholar] [CrossRef] [Scilit]
- Kone, A.; Boukadi, F.; Trabelsi, R.; Trabelsi, H. Simulating Horizontal CO2 Plume Migration in a Saline Aquifer: The Effect of Injection Depth. Processes 2025, 13, 734. [Google Scholar] [CrossRef] [Scilit]
- Lian, W.; Liu, H.; Li, J.; Wu, Y. Site and Formation Selection for CO2 Geological Sequestration: Research Progress and Case Analyses. Appl. Sci. 2025, 15, 11402. [Google Scholar] [CrossRef] [Scilit]
- Dou, L.; Sun, L.; Lyu, W.; Wang, M.; Gao, F.; Gao, M.; Jiang, H. Trend of Global Carbon Dioxide Capture, Utilization and Storage Industry and Challenges and Countermeasures in China. Pet. Explor. Dev. 2023, 50, 1246–1260. [Google Scholar] [CrossRef] [Scilit]
- Zhong, Z.; Chen, Y.; Fu, M.; Li, M.; Yang, K.; Zeng, L.; Liang, J.; Ma, R.; Xie, Q. Role of CO2 Geological Storage in China’s Pledge to Carbon Peak by 2030 and Carbon Neutrality by 2060. Energy 2023, 272, 127165. [Google Scholar] [CrossRef] [Scilit]
- Liu, S.; Liu, T.; Zheng, S.; Wang, R.; Sang, S. Evaluation of Carbon Dioxide Geological Sequestration Potential in Coal Mining Area. Int. J. Greenh. Gas Control 2023, 122, 103814. [Google Scholar] [CrossRef] [Scilit]
- Haghi, A.H.; Talman, S.; Chalaturnyk, R. Consecutive Experimental Determination of Stress-dependent Fluid Flow Properties of Berea Sandstone and Implications for Two-phase Flow Modeling. Water Resour. Res. 2020, 56, e2018WR024245. [Google Scholar] [CrossRef] [Scilit]
- Haghi, A.H.; Chalaturnyk, R.; Talman, S. Stress-Dependent Pore Deformation Effects on Multiphase Flow Properties of Porous Media. Sci. Rep. 2019, 9, 15004. [Google Scholar] [CrossRef] [Scilit]
- Hamid, O.; Osman, H.; Rahim, Z.; Omair, A. Stress Dependent Permeability of Carbonate Rock. In Proceedings of the SPE Annual Technical Conference and Exhibition; SPE: Dubai, United Arab Emirates, 2016; p. D011S008R005. [Google Scholar]
- Rathnaweera, T.D.; Ranjith, P.G.; Perera, M.S.A.; Yang, S.Q. Determination of Effective Stress Parameters for Effective CO2 Permeability in Deep Saline Aquifers: An Experimental Study. J. Nat. Gas Sci. Eng. 2015, 24, 64–79. [Google Scholar] [CrossRef] [Scilit]
- Song, J.; Liu, J.; Song, R.; Song, Y. Study on Permeability Stress-Sensitivity in Seepage-Geomechanical Coupling of Fractured Deep Tight Sandstone Gas Reservoirs. Appl. Sci. 2022, 12, 11672. [Google Scholar] [CrossRef] [Scilit]
- Kanin, E.; Garagash, I.; Boronin, S.; Zhigulskiy, S.; Penigin, A.; Afanasyev, A.; Garagash, D.; Osiptsov, A. CO2 Storage in Deep Saline Aquifers: Evaluation of Geomechanical Risks Using Integrated Modeling Workflow. J. Rock Mech. Geotech. Eng. 2025, 17, 1986–2008. [Google Scholar] [CrossRef] [Scilit]
- Roded, R.; Paredes, X.; Holtzman, R. Reactive Transport under Stress: Permeability Evolution in Deformable Porous Media. Earth Planet. Sci. Lett. 2018, 493, 198–207. [Google Scholar] [CrossRef] [Scilit]
- Sabo, M.S.; Beckingham, L.E. Porosity-Permeability Evolution during Simultaneous Mineral Dissolution and Precipitation. Water Resour. Res. 2021, 57, e2020WR029072. [Google Scholar] [CrossRef] [Scilit]
- Li, C.; Cheng, Q.; Bai, G.; Zhou, X.; Zhang, F.; Zhang, W. Mathematical Model of Permeability Evolution of Liquid CO2 Pressurized Coal. Sci. Rep. 2024, 14, 26314. [Google Scholar] [CrossRef] [Scilit]
- Ye, Z.; Shi, M.; Lin, Y.; Long, Q.; Zhao, Y.; Sun, H. Numerical Simulation of the Coupled Thermal-Hydro-Mechanical Fields for Evaluating CO2 Geo-Sequestration Storage in Deep Saline Aquifers of Hainan Fushan Sag, China. Phys. Fluids 2024, 36, 116605. [Google Scholar] [CrossRef] [Scilit]
- Huang, J.; Jin, T.; Barrufet, M.; Killough, J. Evaluation of CO2 Injection into Shale Gas Reservoirs Considering Dispersed Distribution of Kerogen. Appl. Energy 2020, 260, 114285. [Google Scholar] [CrossRef] [Scilit]
- Mahjour, S.K.; Saleh, A.; Mahjour, S.S. Dimension-Adaptive Machine Learning for Efficient Uncertainty Quantification in Geological Carbon Storage Models. Processes 2025, 13, 1834. [Google Scholar] [CrossRef] [Scilit]
- Wu, B.; Zhang, X.; Liu, H.; Ji, Y. Numerical Modelling of CO2 Plume Evolution and Dissolution in a Stratified Saline Aquifer. Fluid Dyn. Mater. Process. 2025, 21, 2359–2387. [Google Scholar] [CrossRef] [Scilit]
- Brooks, R.H. Hydraulic Properties of Porous Media; Colorado State University: Fort Collins, CO, USA, 1964. [Google Scholar]
- Ding, T.; Liu, Y.; Hua, X. Influence of Interphase Mass Transfer and Diffusion Processes on CO2-Brine Displacement in Saline Aquifers. Environ. Earth Sci. 2019, 78, 654–669. [Google Scholar] [CrossRef] [Scilit]
- Pini, R.; Benson, S.M. Simultaneous Determination of Capillary Pressure and Relative Permeability Curves from Core-Flooding Experiments with Various Fluid Pairs. Water Resour. Res. 2013, 49, 3516–3530. [Google Scholar] [CrossRef] [Scilit]
- Oak, M.J.; Baker, L.E.; Thomas, D.C. Three-Phase Relative Permeability of Berea Sandstone. J. Pet. Technol. 1990, 42, 1054–1061. [Google Scholar] [CrossRef] [Scilit]
- Krevor, S.C.M.; Pini, R.; Zuo, L.; Benson, S.M. Relative Permeability and Trapping of CO2 and Water in Sandstone Rocks at Reservoir Conditions. Water Resour. Res. 2012, 48, W02532. [Google Scholar] [CrossRef] [Scilit]
- Gudala, M.; Govindarajan, S.K.; Yan, B.; Sun, S. Comparison of Supercritical CO2 with Water as Geofluid in Geothermal Reservoirs with Numerical Investigation Using Fully Coupled Thermo-Hydro-Geomechanical Model. J. Energy Resour. Technol. 2023, 145, 61302. [Google Scholar] [CrossRef] [Scilit]
- Vivek, R.; Kumar, G.S. Numerical Investigation on Effect of Varying Injection Scenario and Relative Permeability Hysteresis on CO2 Dissolution in Saline Aquifer. Environ. Earth Sci. 2016, 75, 1192. [Google Scholar] [CrossRef] [Scilit]
- Buckley, S.E.; Leverett, M.C. Mechanism of Fluid Displacement in Sands. Trans. AIME 1942, 146, 107–116. [Google Scholar] [CrossRef] [Scilit]
- Shen, J.; Mo, F.; Tao, Z.; Hong, Y.; Gao, B.; Xuan, T. Numerical Investigation of Offshore CCUS in Deep Saline Aquifers Using Multi-Layer Injection Method: A Case Study of the Enping 15-1 Oilfield CO2 Storage Project, China. J. Mar. Sci. Eng. 2025, 13, 1247. [Google Scholar] [CrossRef] [Scilit]
- Rezk, M.G.; Ibrahim, A.F. Numerical Investigation of CO2 Plume Migration and Trapping Mechanisms in the Sleipner Field: Does the Aquifer Heterogeneity Matter? Fuel 2025, 394, 135054. [Google Scholar] [CrossRef] [Scilit]
- Guo, C.; Wang, X. Effect of Permeability Anisotropy on the CO2 Saturation Distribution and Phase Change during a Leakage Event in a Saline Aquifer. Front. Energy Res. 2024, 12, 1372655. [Google Scholar] [CrossRef] [Scilit]
- Dong, J.-J.; Hsu, J.-Y.; Wu, W.-J.; Shimamoto, T.; Hung, J.-H.; Yeh, E.-C.; Wu, Y.-H.; Sone, H. Stress-Dependence of the Permeability and Porosity of Sandstone and Shale from TCDP Hole-A. Int. J. Rock Mech. Min. Sci. 2010, 47, 1141–1157. [Google Scholar] [CrossRef] [Scilit]
- Zhao, Y.; Luo, Y.; Luo, Y.; Pang, Y.; Zhang, R.; Zhao, Z. Numerical Simulation of Microscopic Seepage Mechanisms in Gas Reservoir Storage Systems. Fluid Dyn. Mater. Process. 2025, 21, 3073–3090. [Google Scholar] [CrossRef] [Scilit]
- Biot, M.A. General Theory of Three-Dimensional Consolidation. J. Appl. Phys. 1941, 12, 155–164. [Google Scholar] [CrossRef] [Scilit]
- Zheng, J.; Zheng, L.; Liu, H.-H.; Ju, Y. Relationships between Permeability, Porosity and Effective Stress for Low-Permeability Sedimentary Rock. Int. J. Rock Mech. Min. Sci. 2015, 78, 304–318. [Google Scholar] [CrossRef] [Scilit]
- Zhong, X.; Zhu, Y.; Liu, L.; Yang, H.; Li, Y.; Xie, Y.; Liu, L. The Characteristics and Influencing Factors of Permeability Stress Sensitivity of Tight Sandstone Reservoirs. J. Pet. Sci. Eng. 2020, 191, 107221. [Google Scholar] [CrossRef] [Scilit]
- Wang, F.; Ping, S.; Yuan, Y.; Sun, Z.; Tian, H.; Yang, Z. Effects of the Mechanical Response of Low-Permeability Sandstone Reservoirs on CO2 Geological Storage Based on Laboratory Experiments and Numerical Simulations. Sci. Total Environ. 2021, 796, 149066. [Google Scholar] [CrossRef] [Scilit]
- Chen, Q.; Hou, J.; Wei, B.; Gong, R.; Du, Q.; Liu, Y. Study on CO2 Storage Suitability Evaluation and Storage Potential Prediction Method in Site-Level Saline Aquifer: A Case Study of X Saline Aquifer Block in Enping 15-1 Oilfield. Geoenergy Sci. Eng. 2025, 246, 213598. [Google Scholar] [CrossRef] [Scilit]
- Hu, G.; Yi, X.; Tian, X.; Wang, R.; Li, P.; Peng, L.; Liang, X. Assessing CO2 Storage Mechanisms in Marine Shallow Sediments to Mitigate Leakage Risks from Sub-Seabed Carbon Storage: A Numerical Simulation Study. Front. Mar. Sci. 2025, 12, 1547326. [Google Scholar] [CrossRef] [Scilit]
- Kumar, A.; Ozah, R.; Noh, M.; Pope, G.A.; Bryant, S.; Sepehrnoori, K.; Lake, L.W. Reservoir Simulation of CO2 Storage in Deep Saline Aquifers. SPE J. 2005, 10, 336–348. [Google Scholar] [CrossRef] [Scilit]
- Zhang, Y.; Lyu, W.; Zhang, K.; He, D.; Li, A.; Cheng, Y.; Gao, J. Study of Supercritical State Characteristics of Miscible CO2 Used in the Flooding Process. Energies 2023, 16, 6693. [Google Scholar] [CrossRef] [Scilit]
- Rutqvist, J.; Vasco, D.W.; Myer, L. Coupled Reservoir-Geomechanical Analysis of CO2 Injection and Ground Deformations at in Salah, Algeria. Int. J. Greenh. Gas Control 2010, 4, 225–230. [Google Scholar] [CrossRef] [Scilit]
- Jun, S.; Song, Y.; Wang, J.; Weijermars, R. Formation Uplift Analysis during Geological CO2-Storage Using the Gaussian Pressure Transient Method: Krechba (Algeria) Validation and South Korean Case Studies. Geoenergy Sci. Eng. 2023, 221, 211404. [Google Scholar] [CrossRef] [Scilit]
- Schovsbo, N.H.; Holmslykke, H.D.; Mathiesen, A.; Nielsen, C.M. Assessment of Formation Brine Salinity, Pressure and Temperature in Selected Structures in Eastern Denmark and Implications for CO2 Storage. GEUS Bull. 2025, 60, 8383. [Google Scholar] [CrossRef] [Scilit]
- Emami-Meybodi, H.; Hassanzadeh, H.; Green, C.P.; Ennis-King, J. Convective Dissolution of CO2 in Saline Aquifers: Progress in Modeling and Experiments. Int. J. Greenh. Gas Control 2015, 40, 238–266. [Google Scholar] [CrossRef] [Scilit]
- Buscheck, T.A.; Bielicki, J.M.; White, J.A.; Sun, Y.; Hao, Y.; Bourcier, W.L.; Carroll, S.A.; Aines, R.D. Pre-Injection Brine Production in CO2 Storage Reservoirs: An Approach to Augment the Development, Operation, and Performance of CCS While Generating Water. Int. J. Greenh. Gas Control 2016, 54, 499–512. [Google Scholar] [CrossRef] [Scilit]
- Wang, Y.; Fernàndez-Garcia, D.; Saaltink, M.W. Numerical Analysis of the Effect of Heterogeneity on CO2 Dissolution Enhanced by Gravity-Driven Convection. Hydrol. Earth Syst. Sci. 2025, 29, 2485–2503. [Google Scholar] [CrossRef] [Scilit]
- Qin, N.; Ning, S.; Zhao, Z.; Luo, Y.; Chen, B.; Liu, X.; He, Y. Numerical Investigation of Carbon Capture, Utilization, and Storage–Enhanced Gas Recovery. Fluid Dyn. Mater. Process. 2025, 21, 2997–3009. [Google Scholar] [CrossRef] [Scilit]
- Vilarrasa, V.; Bolster, D.; Olivella, S.; Carrera, J. Coupled Hydromechanical Modeling of CO2 Sequestration in Deep Saline Aquifers. Int. J. Greenh. Gas Control 2010, 4, 911–919. [Google Scholar] [CrossRef] [Scilit]
- Yang, Q.; Xie, Q.; Hossain, M.; Liu, X.; Cui, L.; Li, H.; Shi, M. An Optimal Approach for Representing an Open Boundary in Modelling CO2 Storage in a Regionally Extensive Aquifer. Fuel 2025, 398, 135492. [Google Scholar] [CrossRef] [Scilit]
- Birdsell, D.T.; Karra, S.; Rajaram, H. On the Representation of the Porosity-Pressure Relationship in General Subsurface Flow Codes. Water Resour. Res. 2018, 54, 1382–1388. [Google Scholar] [CrossRef] [Scilit]
- Pham, V.T.H.; Riis, F.; Gjeldvik, I.T.; Halland, E.K.; Tappel, I.M.; Aagaard, P. Assessment of CO2 Injection into the South Utsira-Skade Aquifer, the North Sea, Norway. Energy 2013, 55, 529–540. [Google Scholar] [CrossRef] [Scilit]
- Abbaszadeh, M.; Shariatipour, S.M. Investigating the Impact of Reservoir Properties and Injection Parameters on Carbon Dioxide Dissolution in Saline Aquifers. Fluids 2018, 3, 76. [Google Scholar] [CrossRef] [Scilit]
- Wen, G.; Benson, S.M. CO2 Plume Migration and Dissolution in Layered Reservoirs. Int. J. Greenh. Gas Control 2019, 87, 66–79. [Google Scholar] [CrossRef] [Scilit]
- Zhang, L.; Jiang, M.; Yang, Q.; Bian, Y.; Jiang, C. Uncertainty Analysis for CO2 Geological Storage Due to Reservoir Heterogeneity Based on Stochastic Numerical Model. Geoenergy Sci. Eng. 2025, 249, 213772. [Google Scholar] [CrossRef] [Scilit]
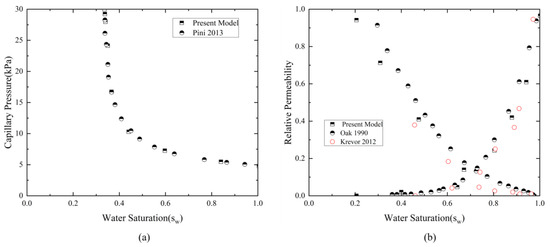
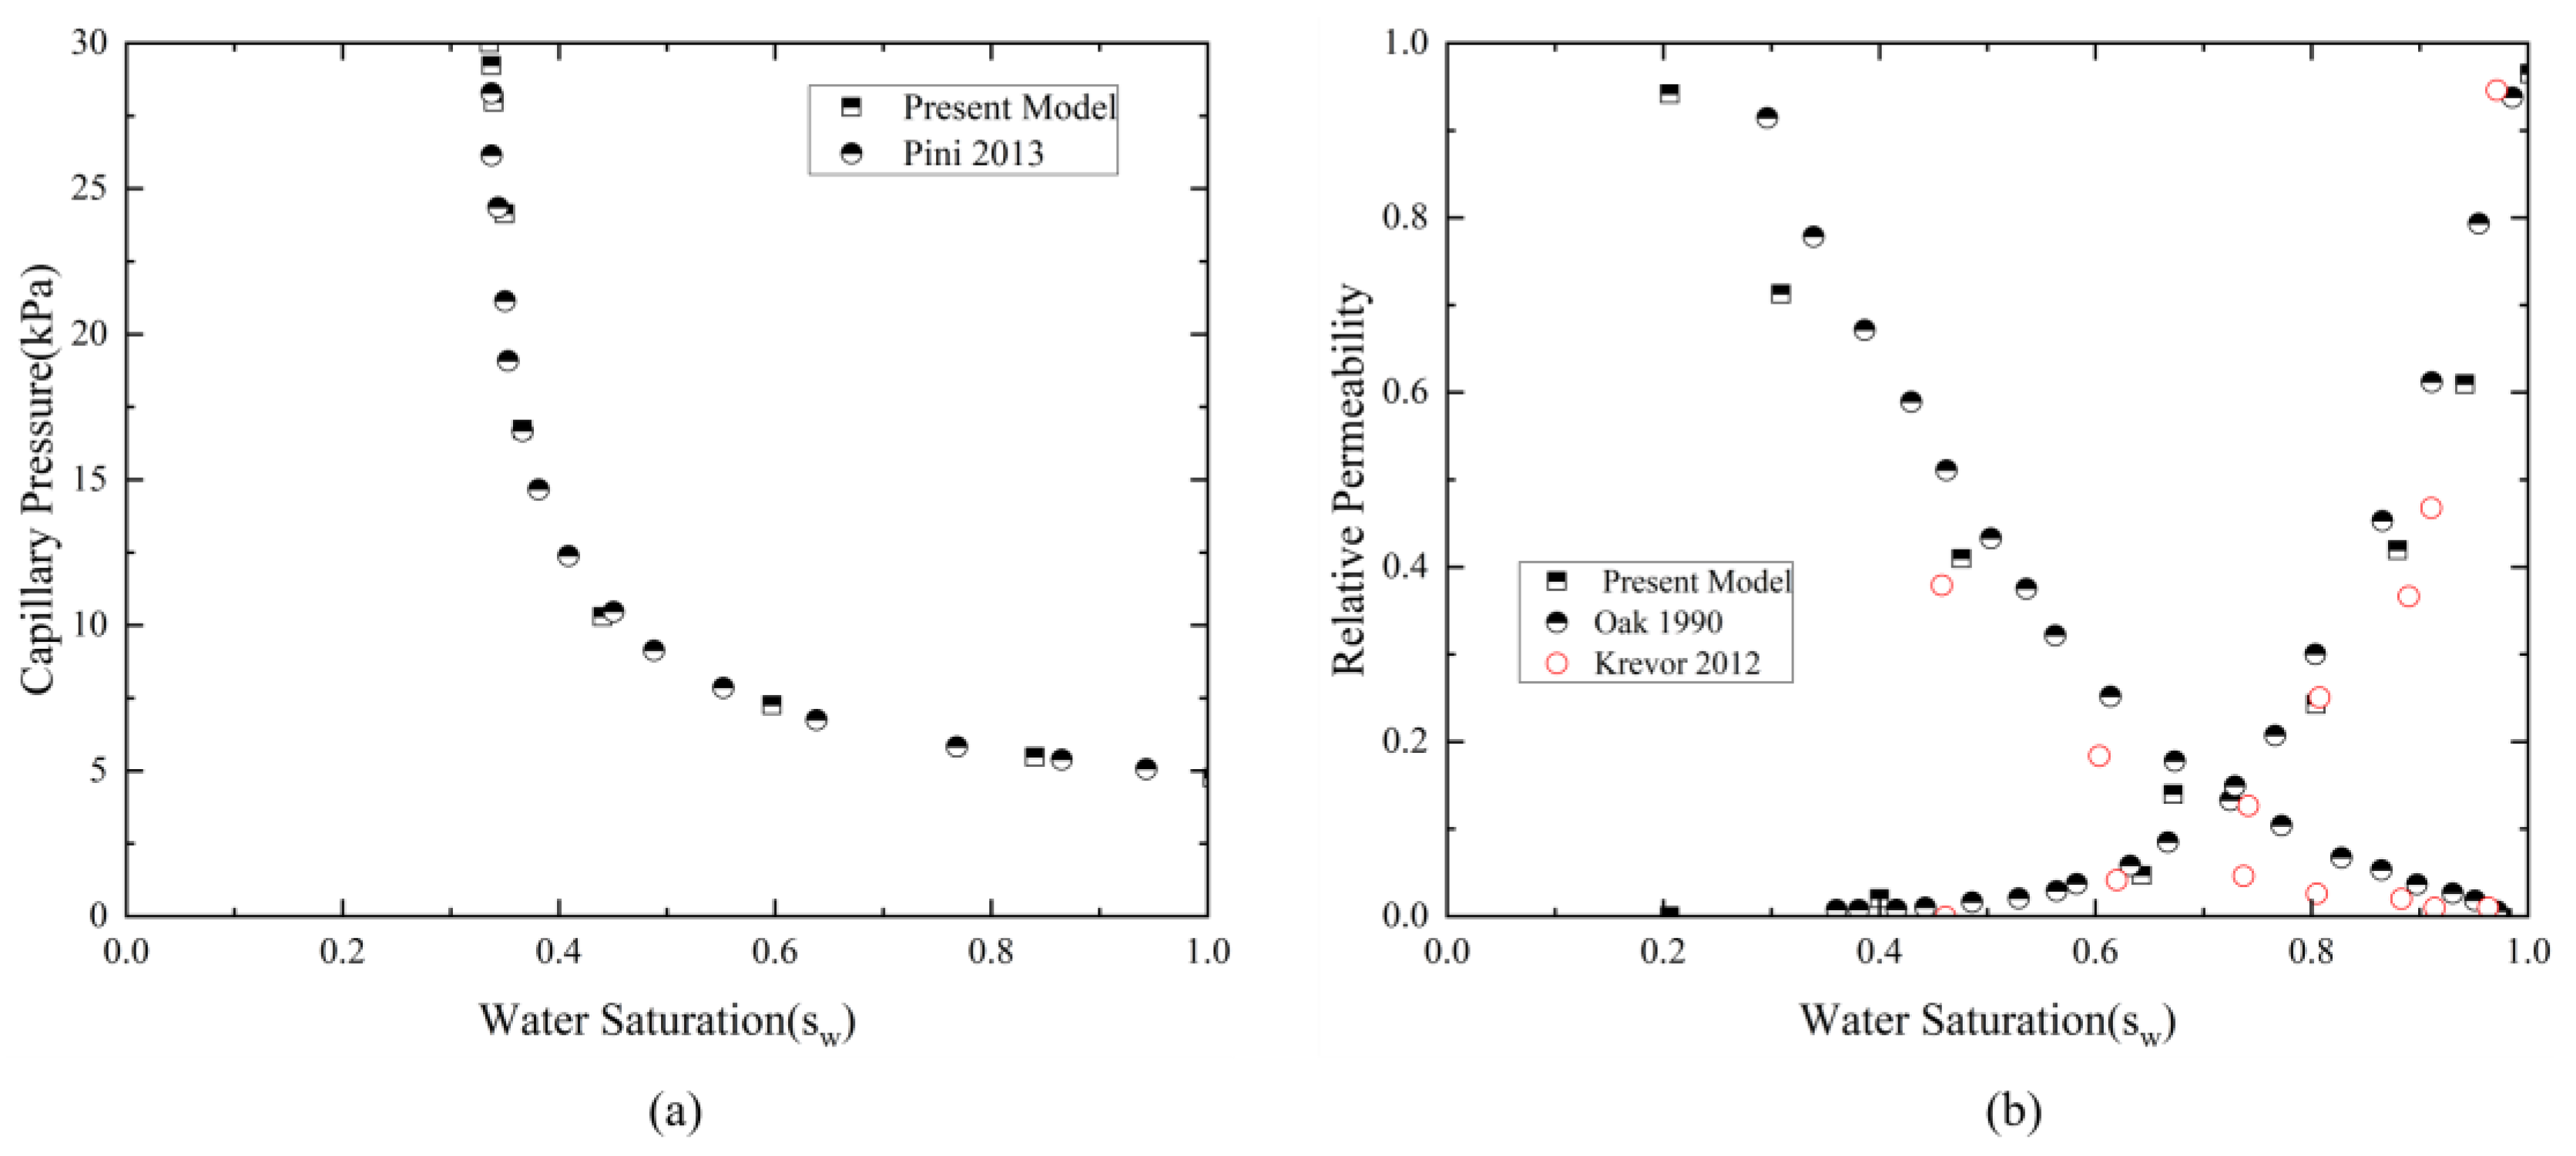
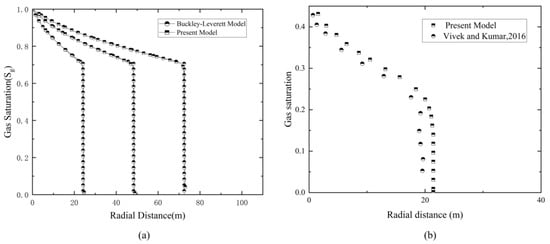
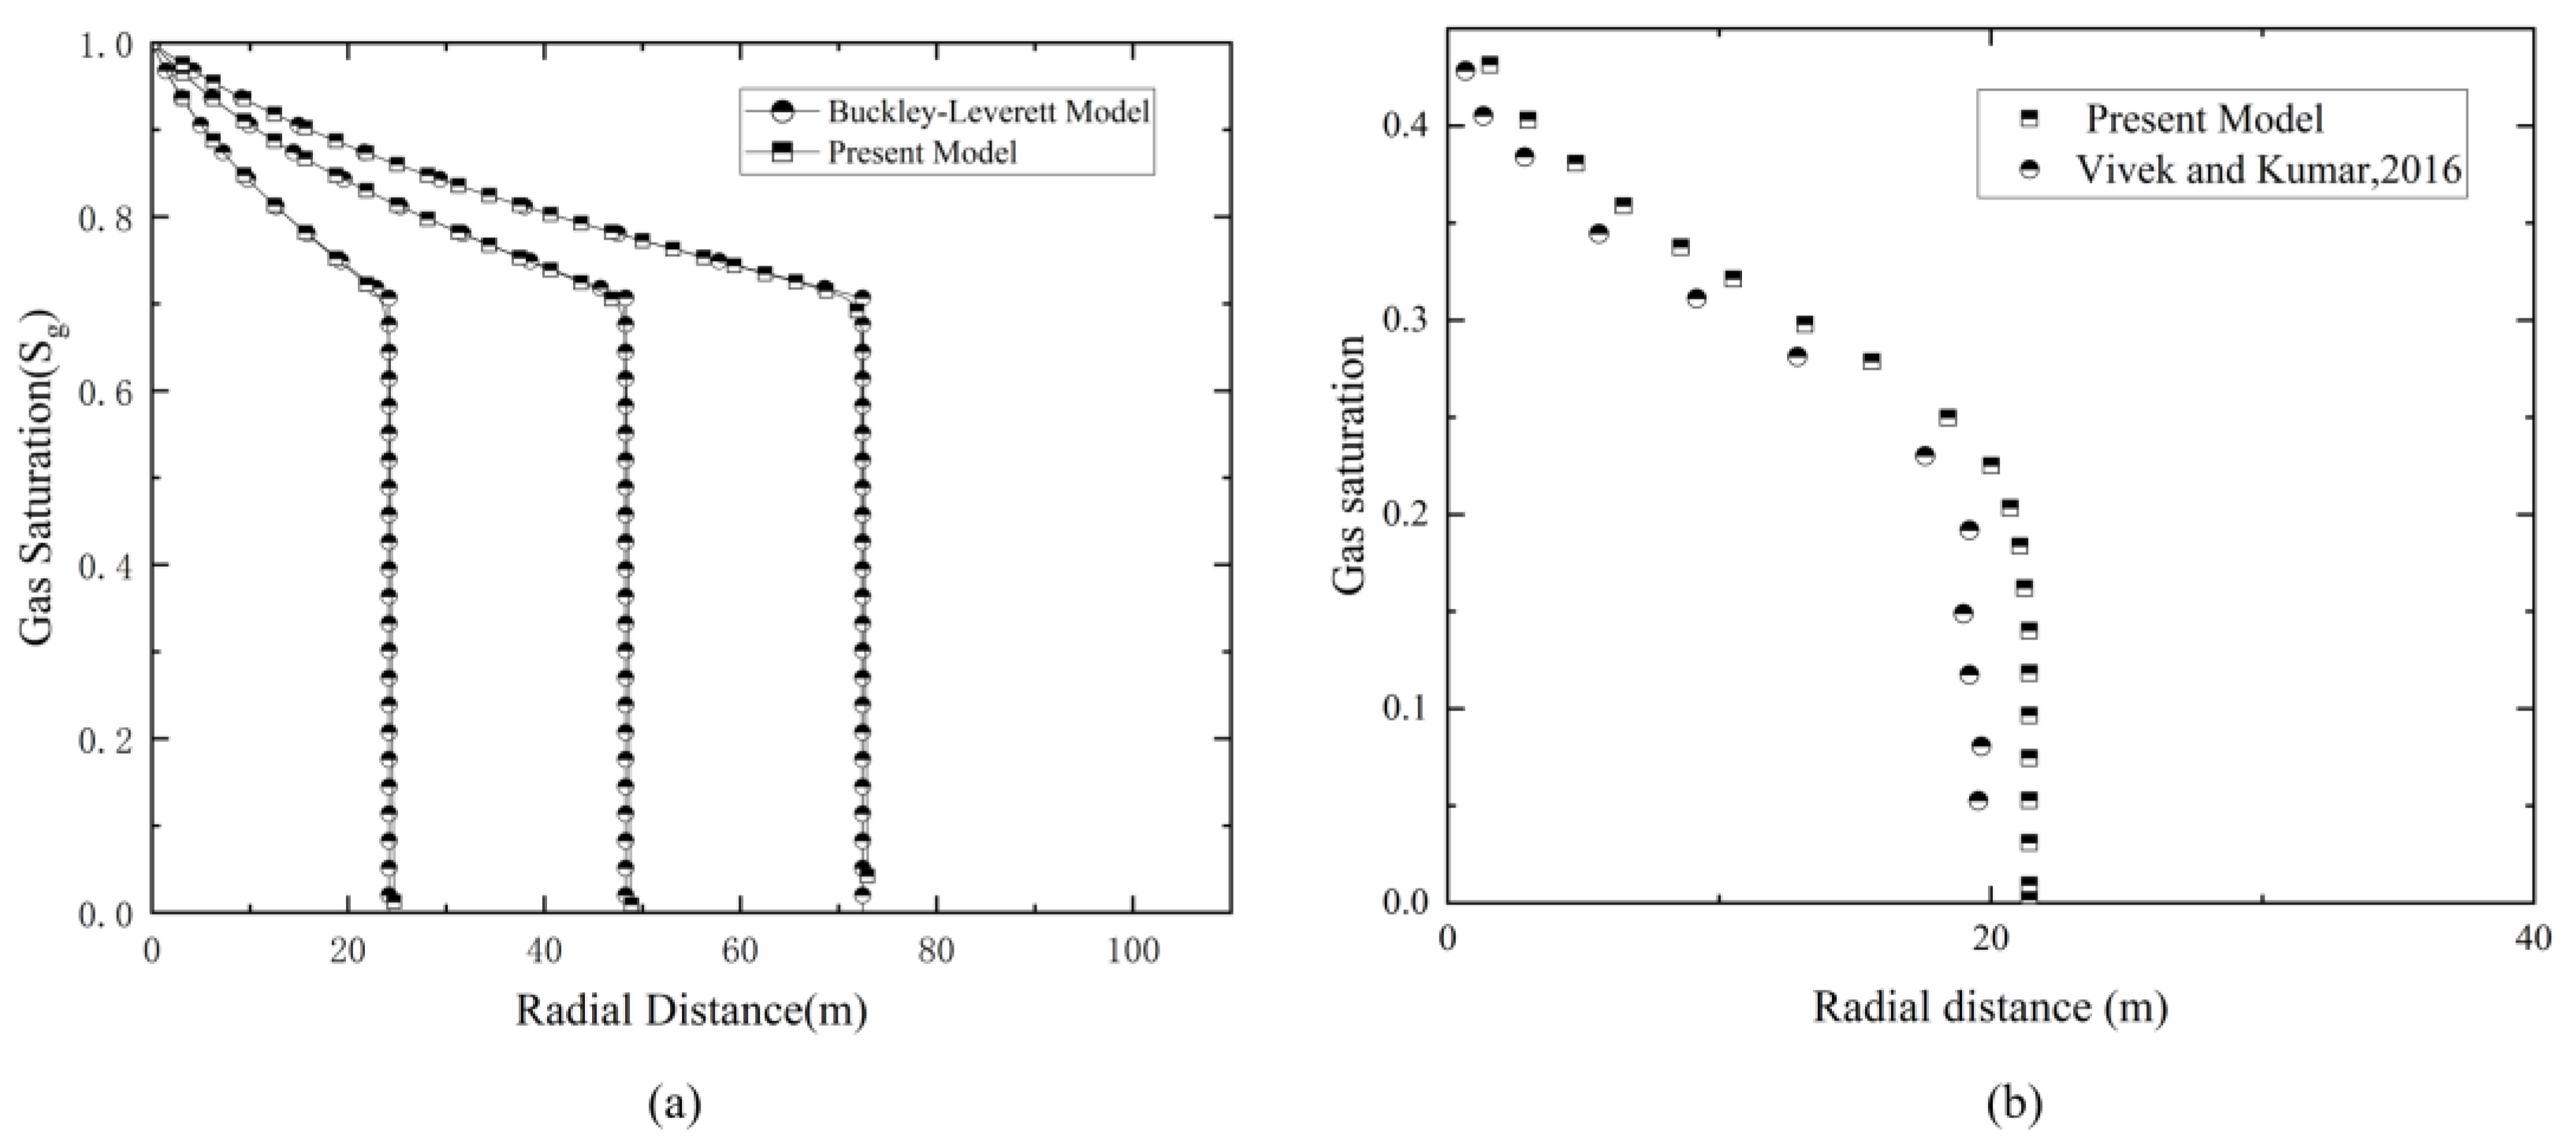
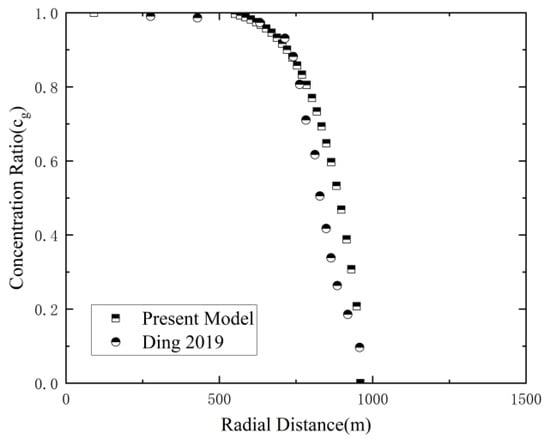
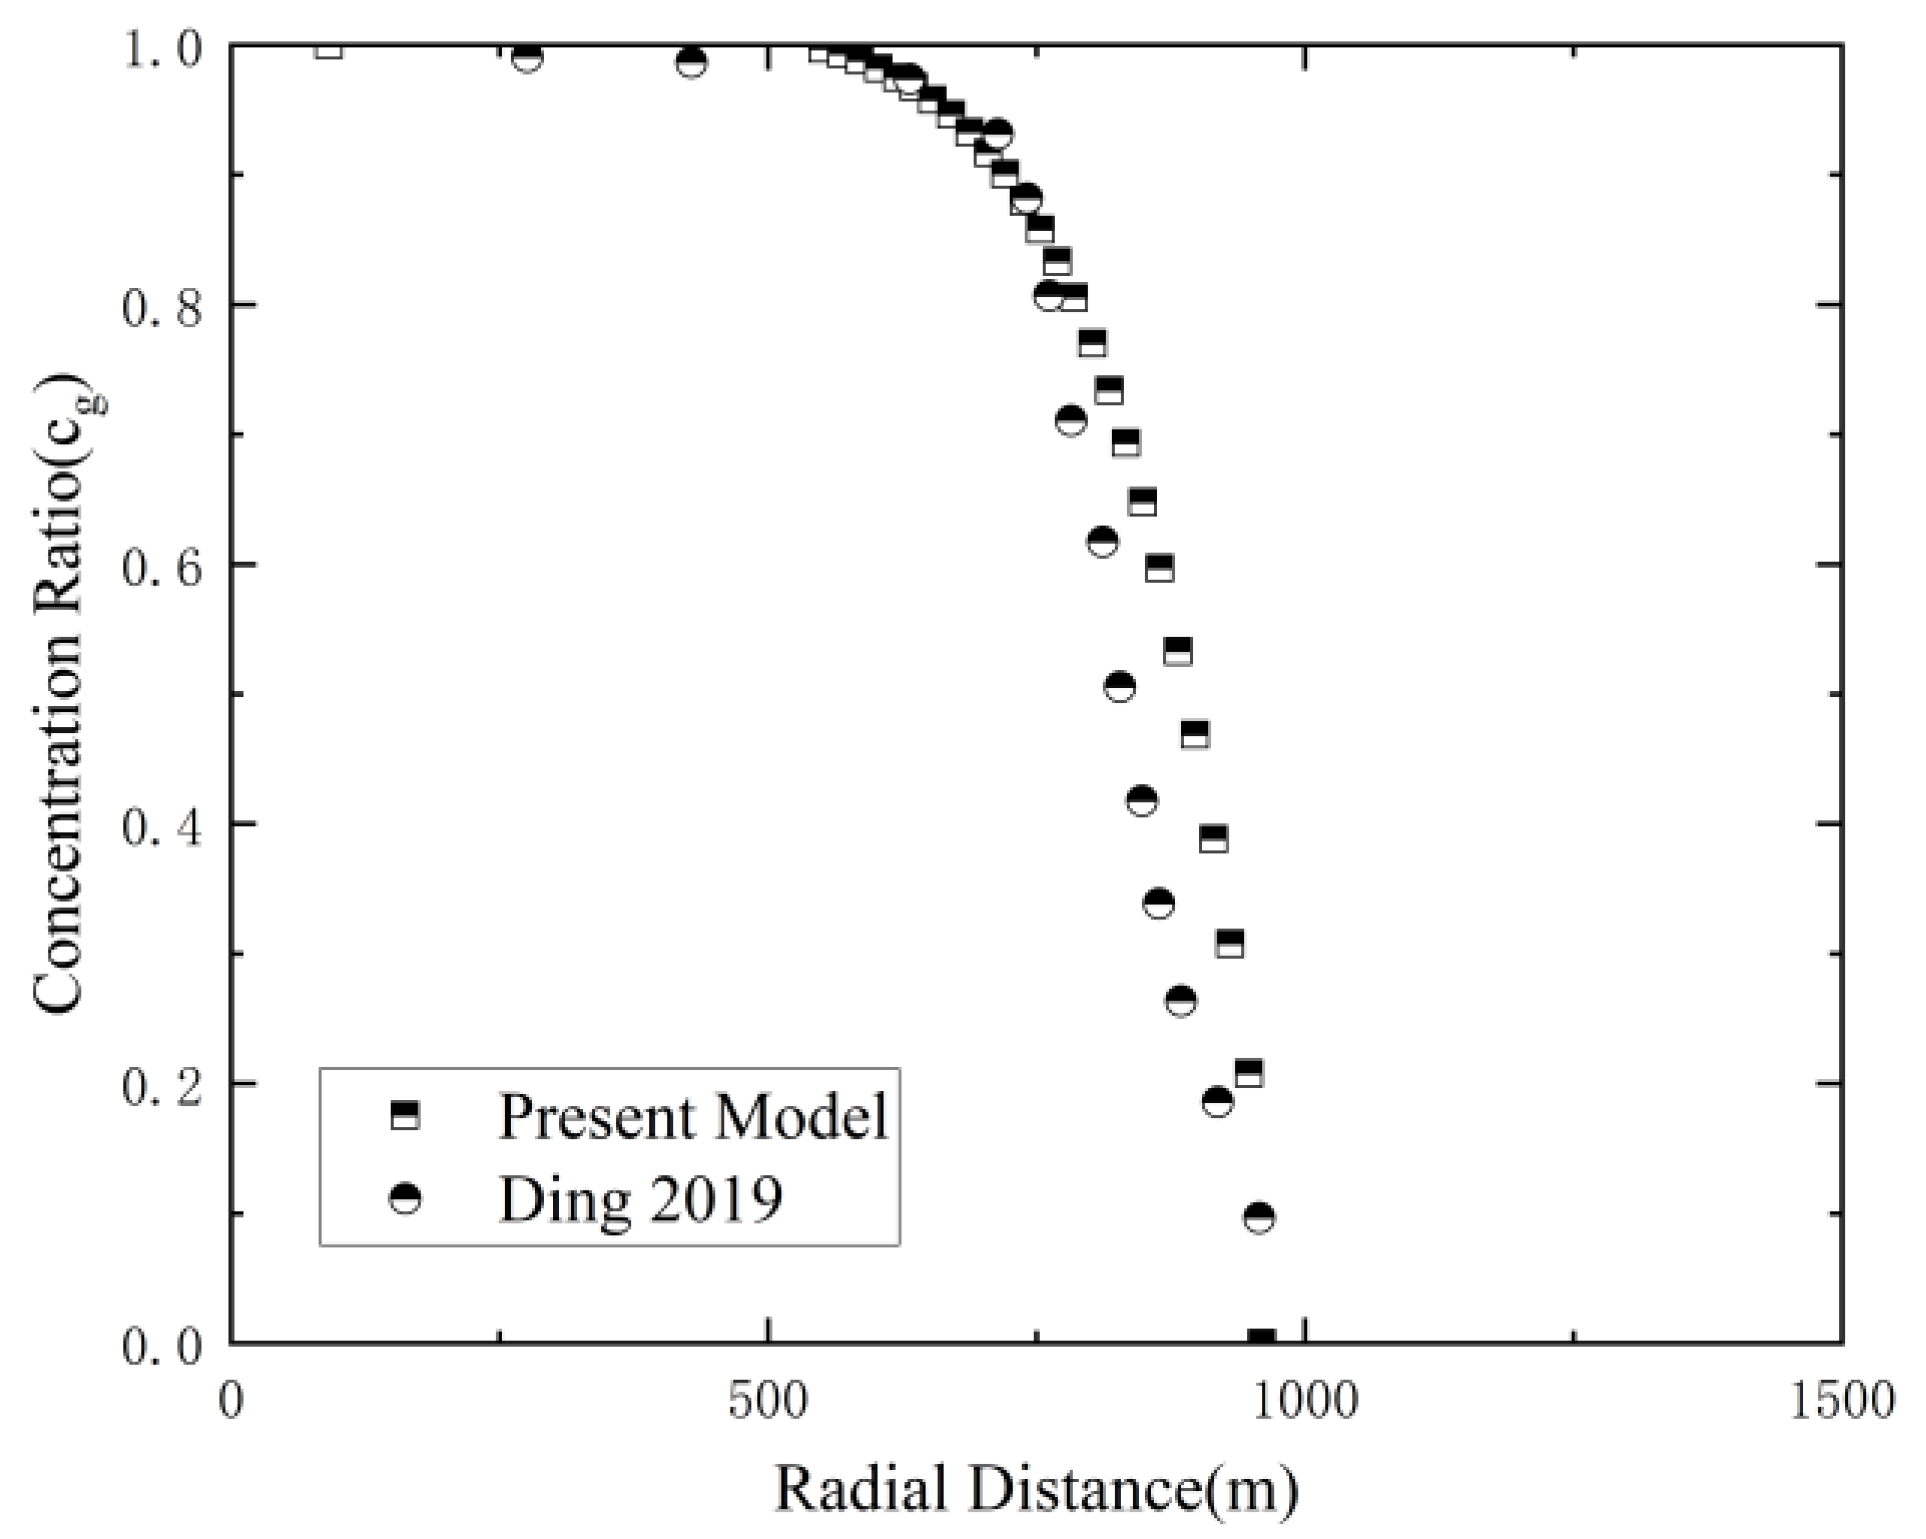
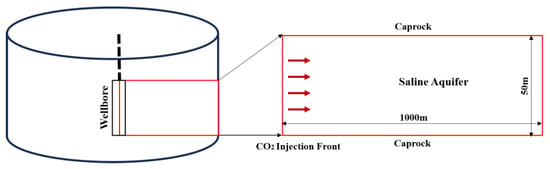
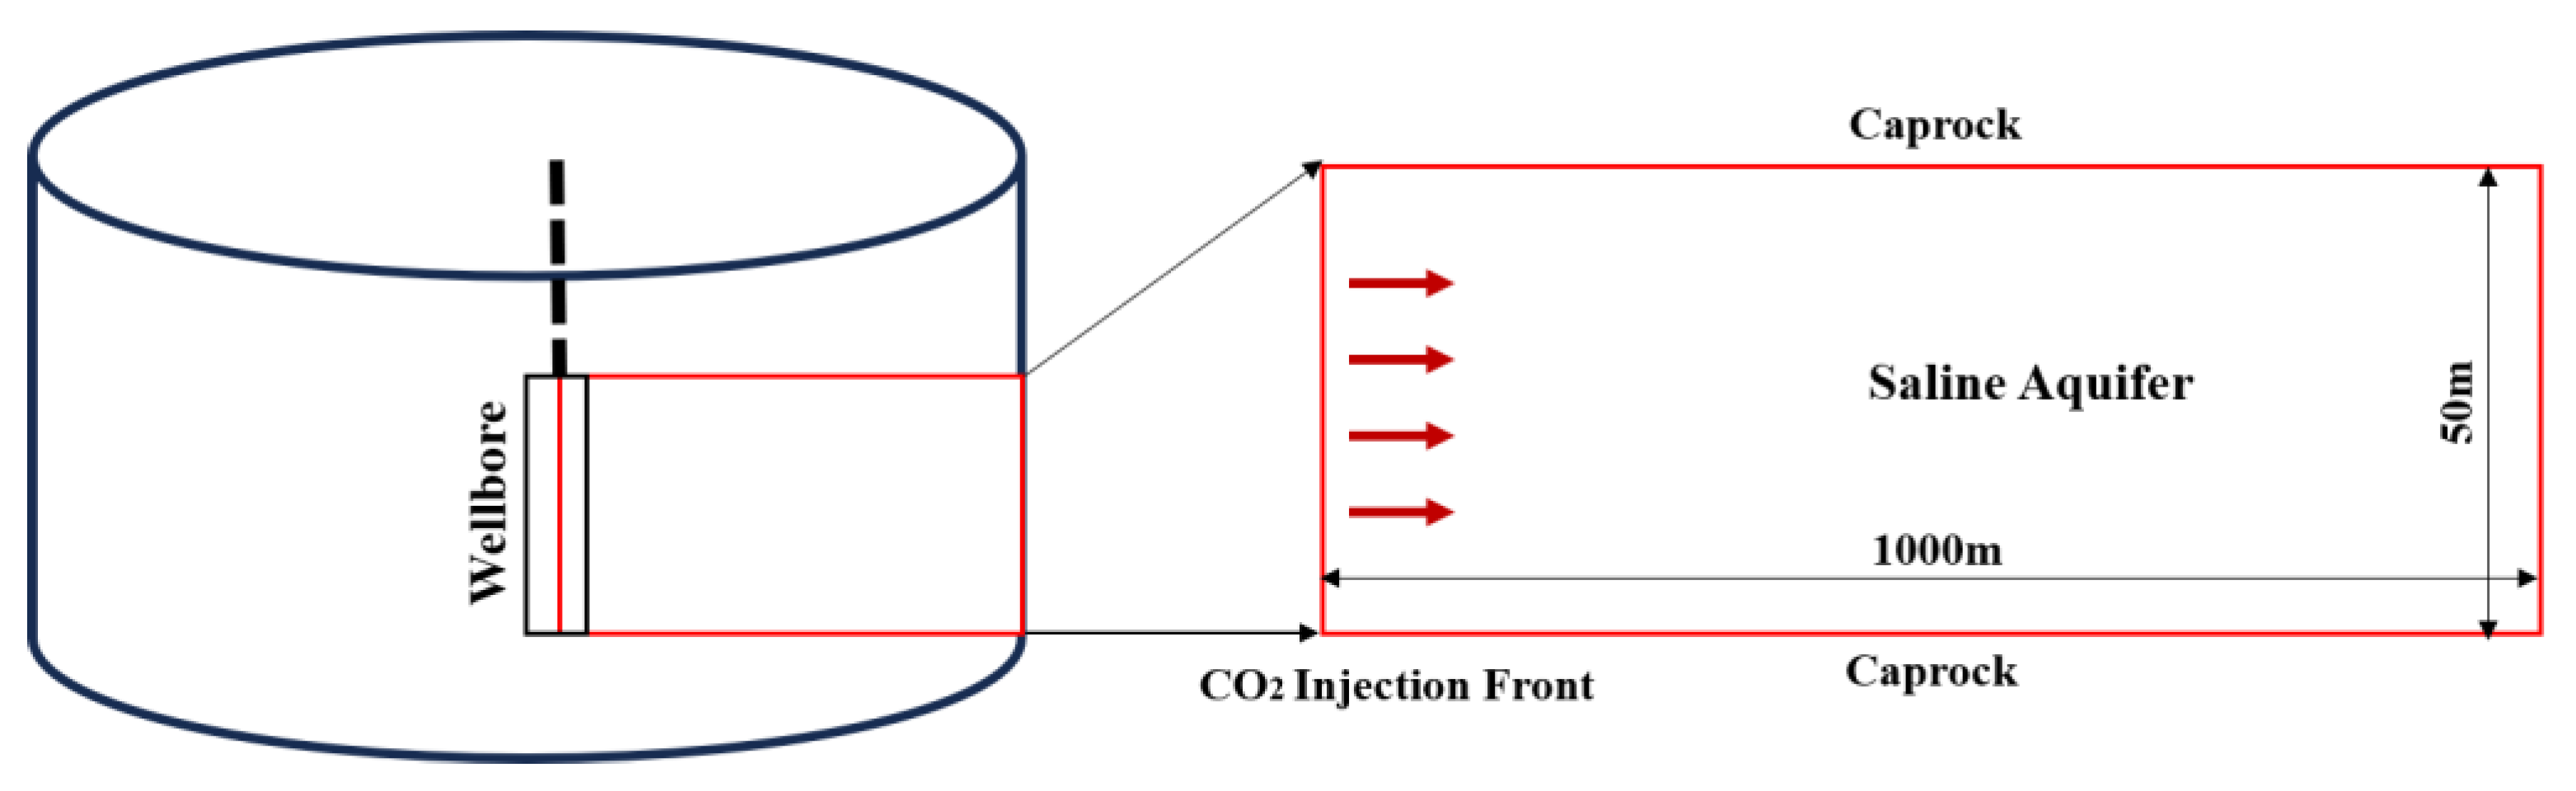
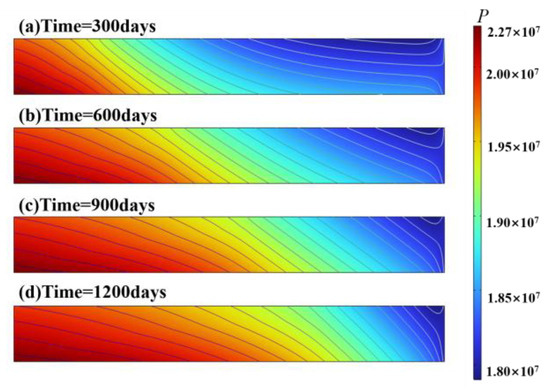
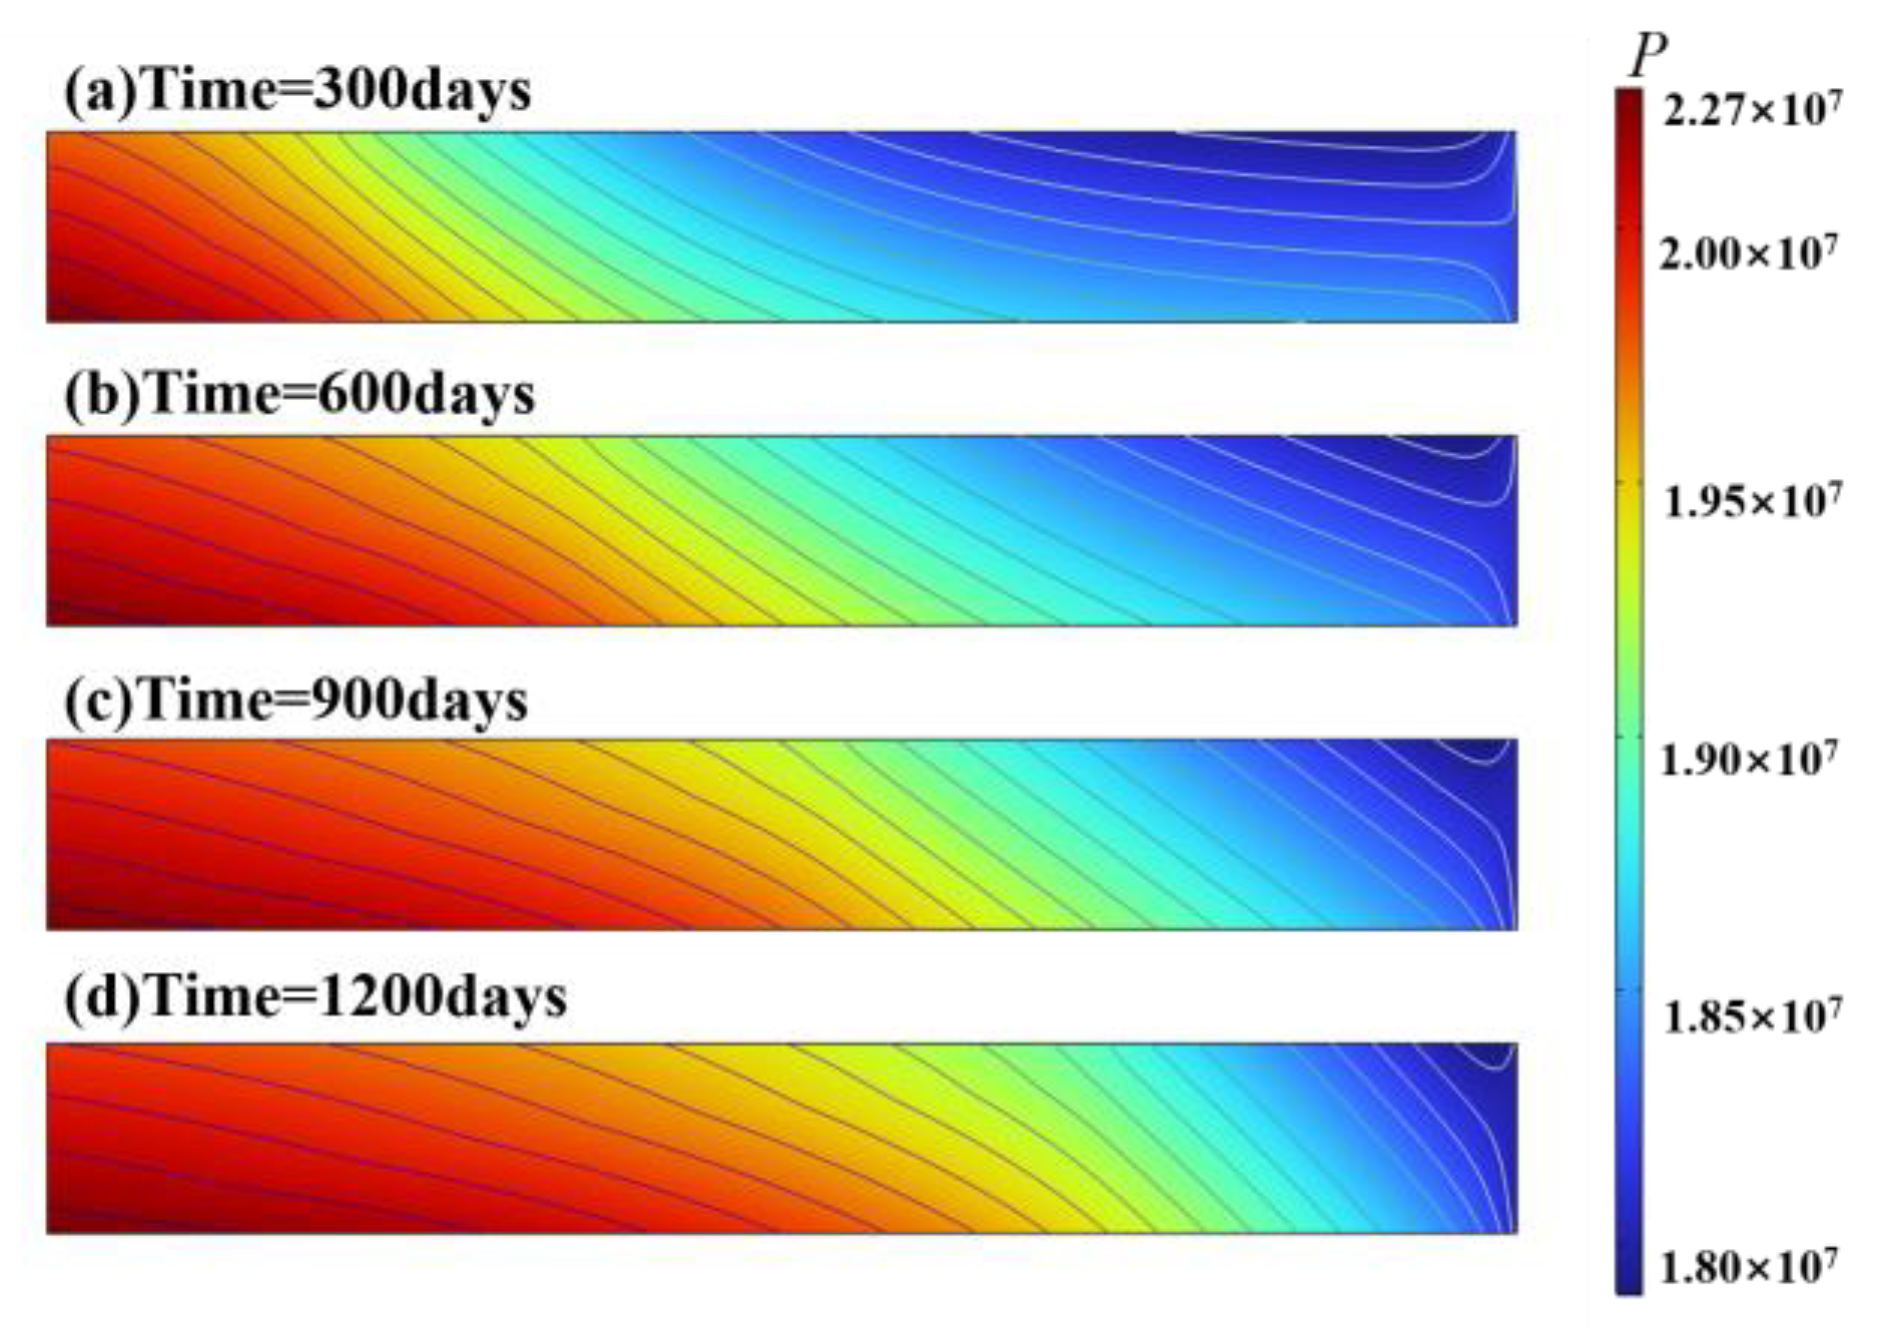
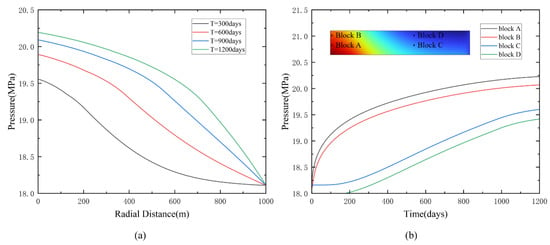
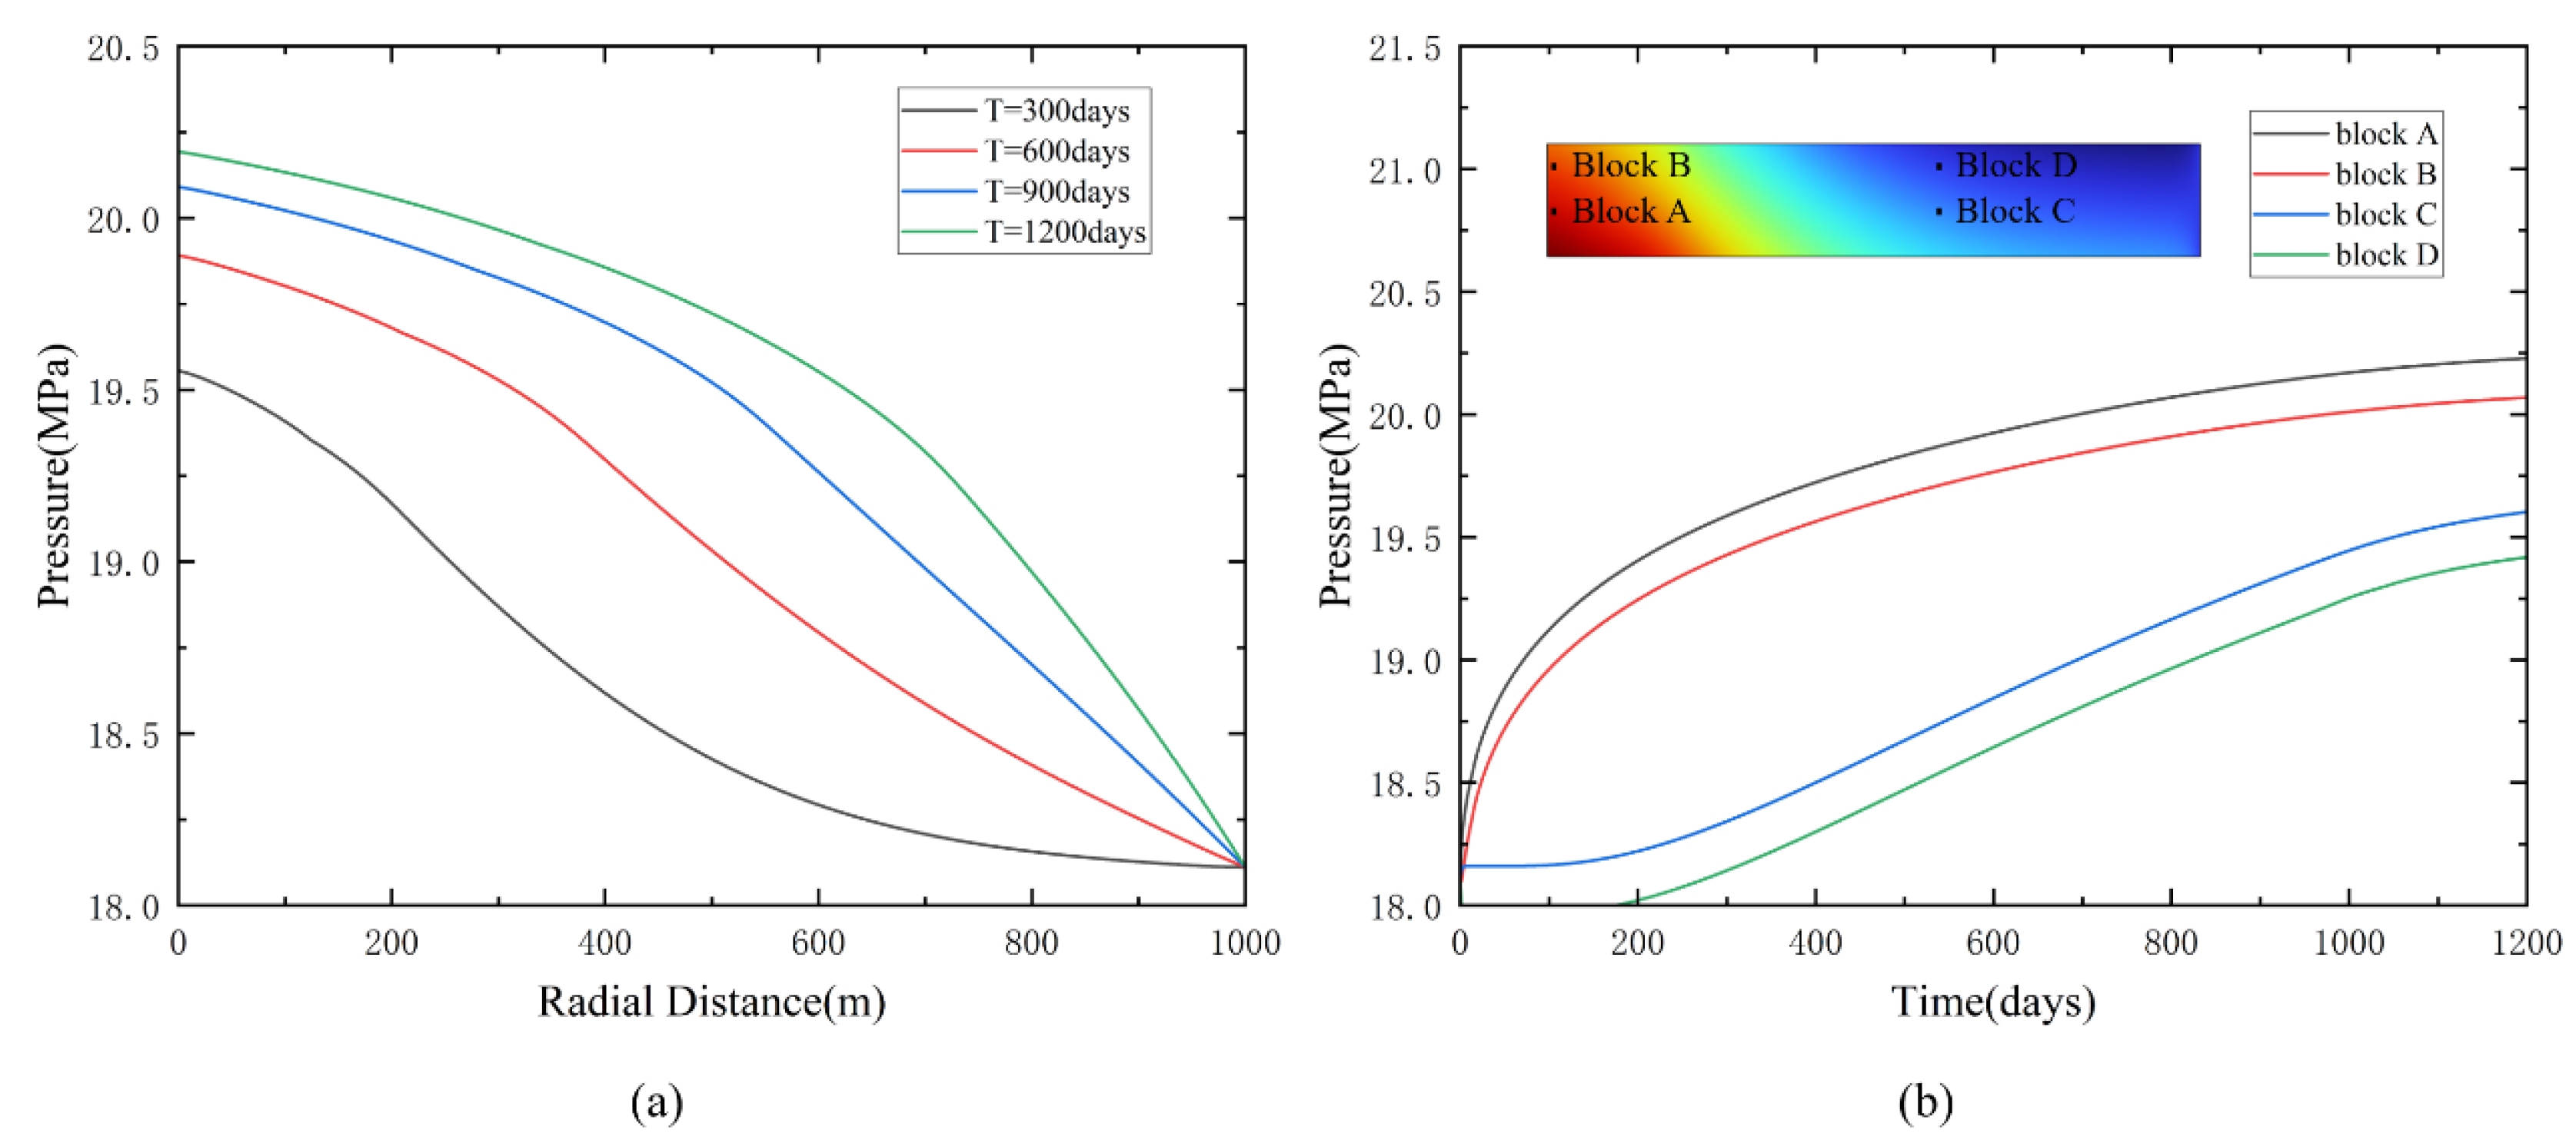
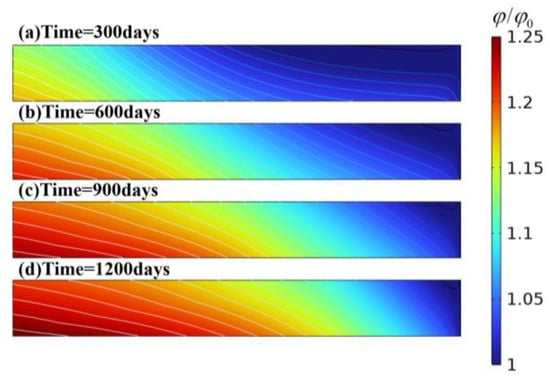
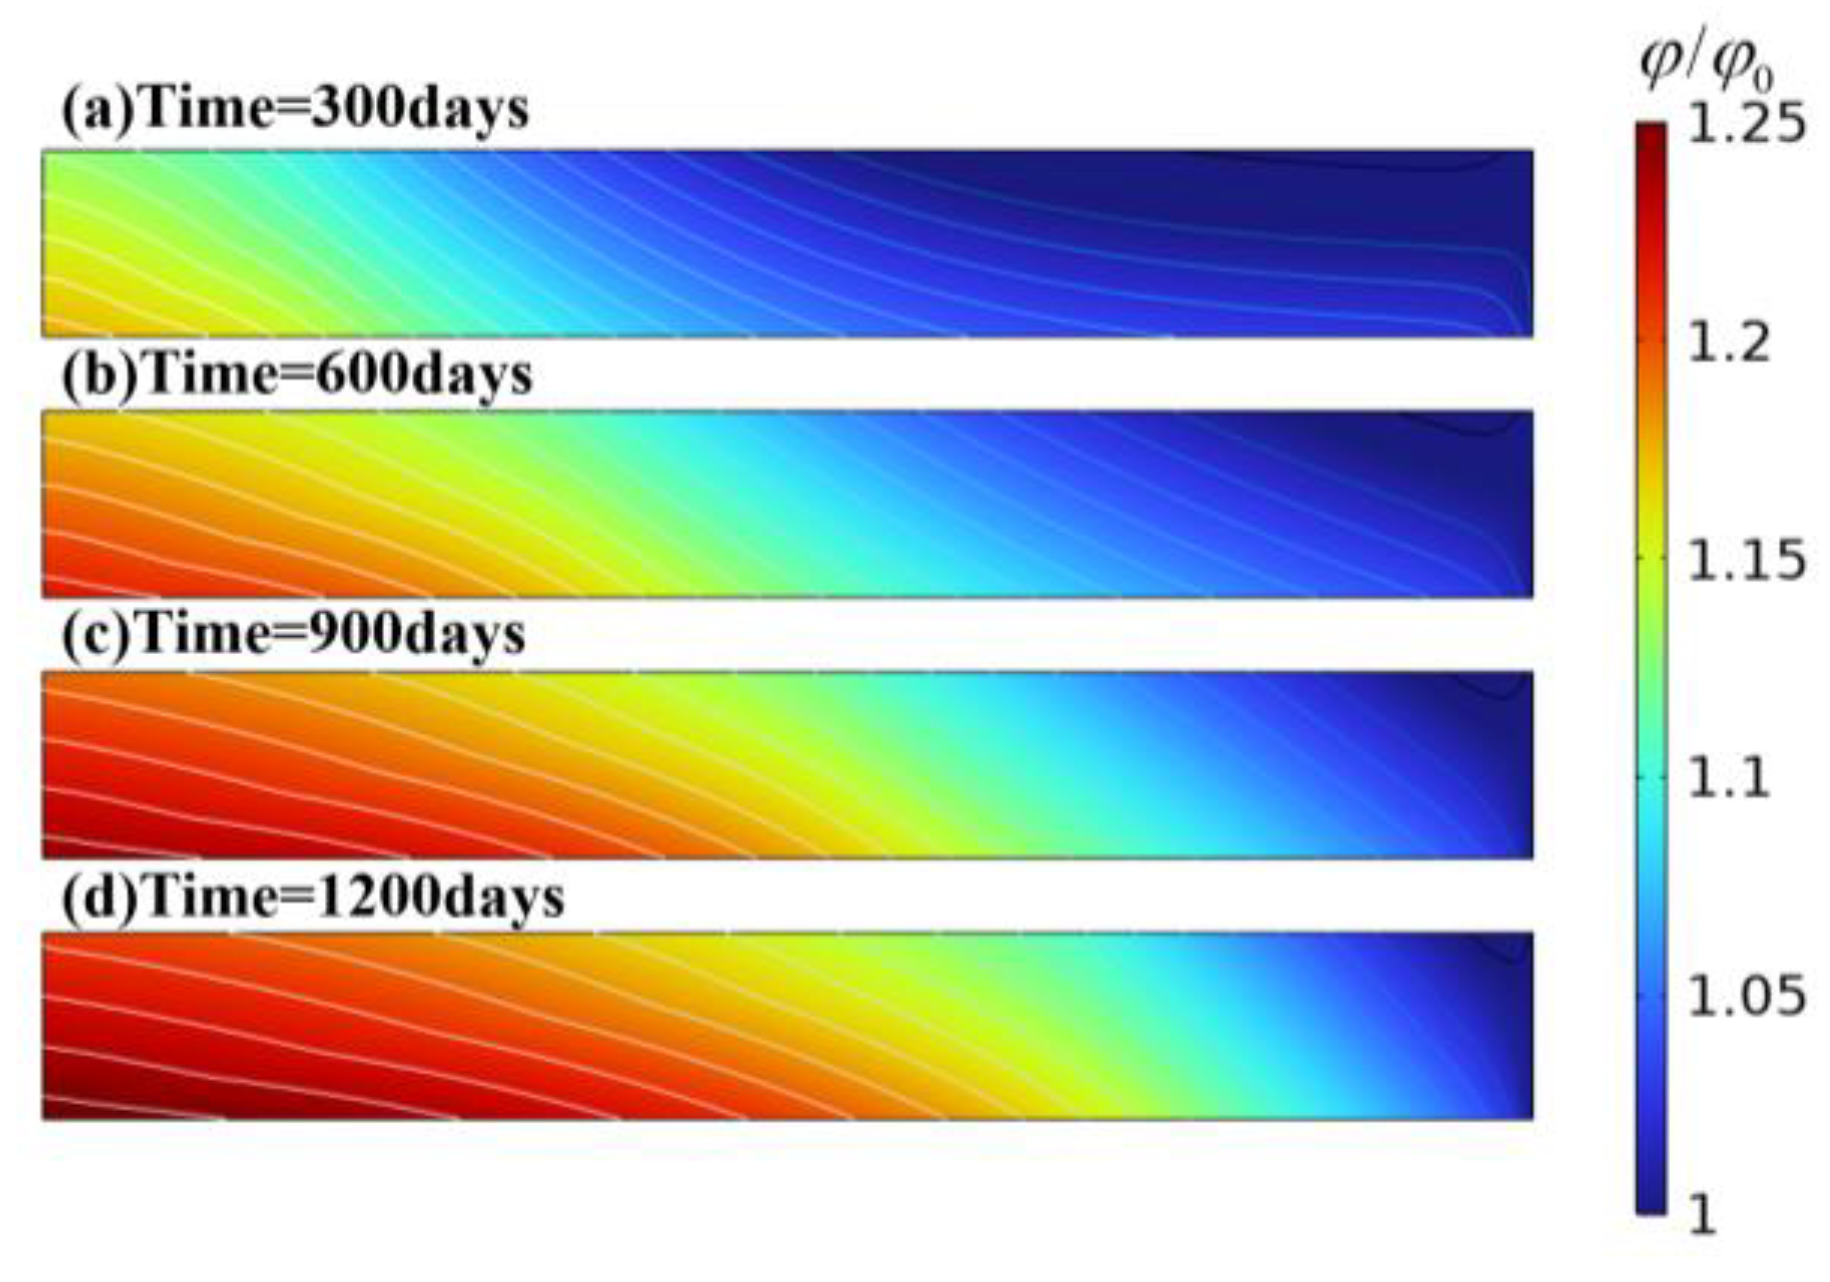
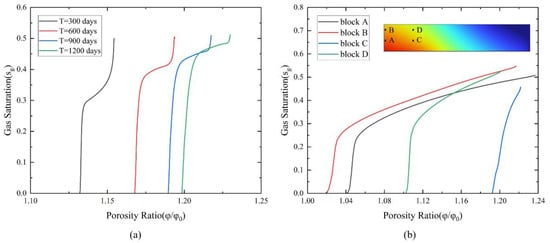
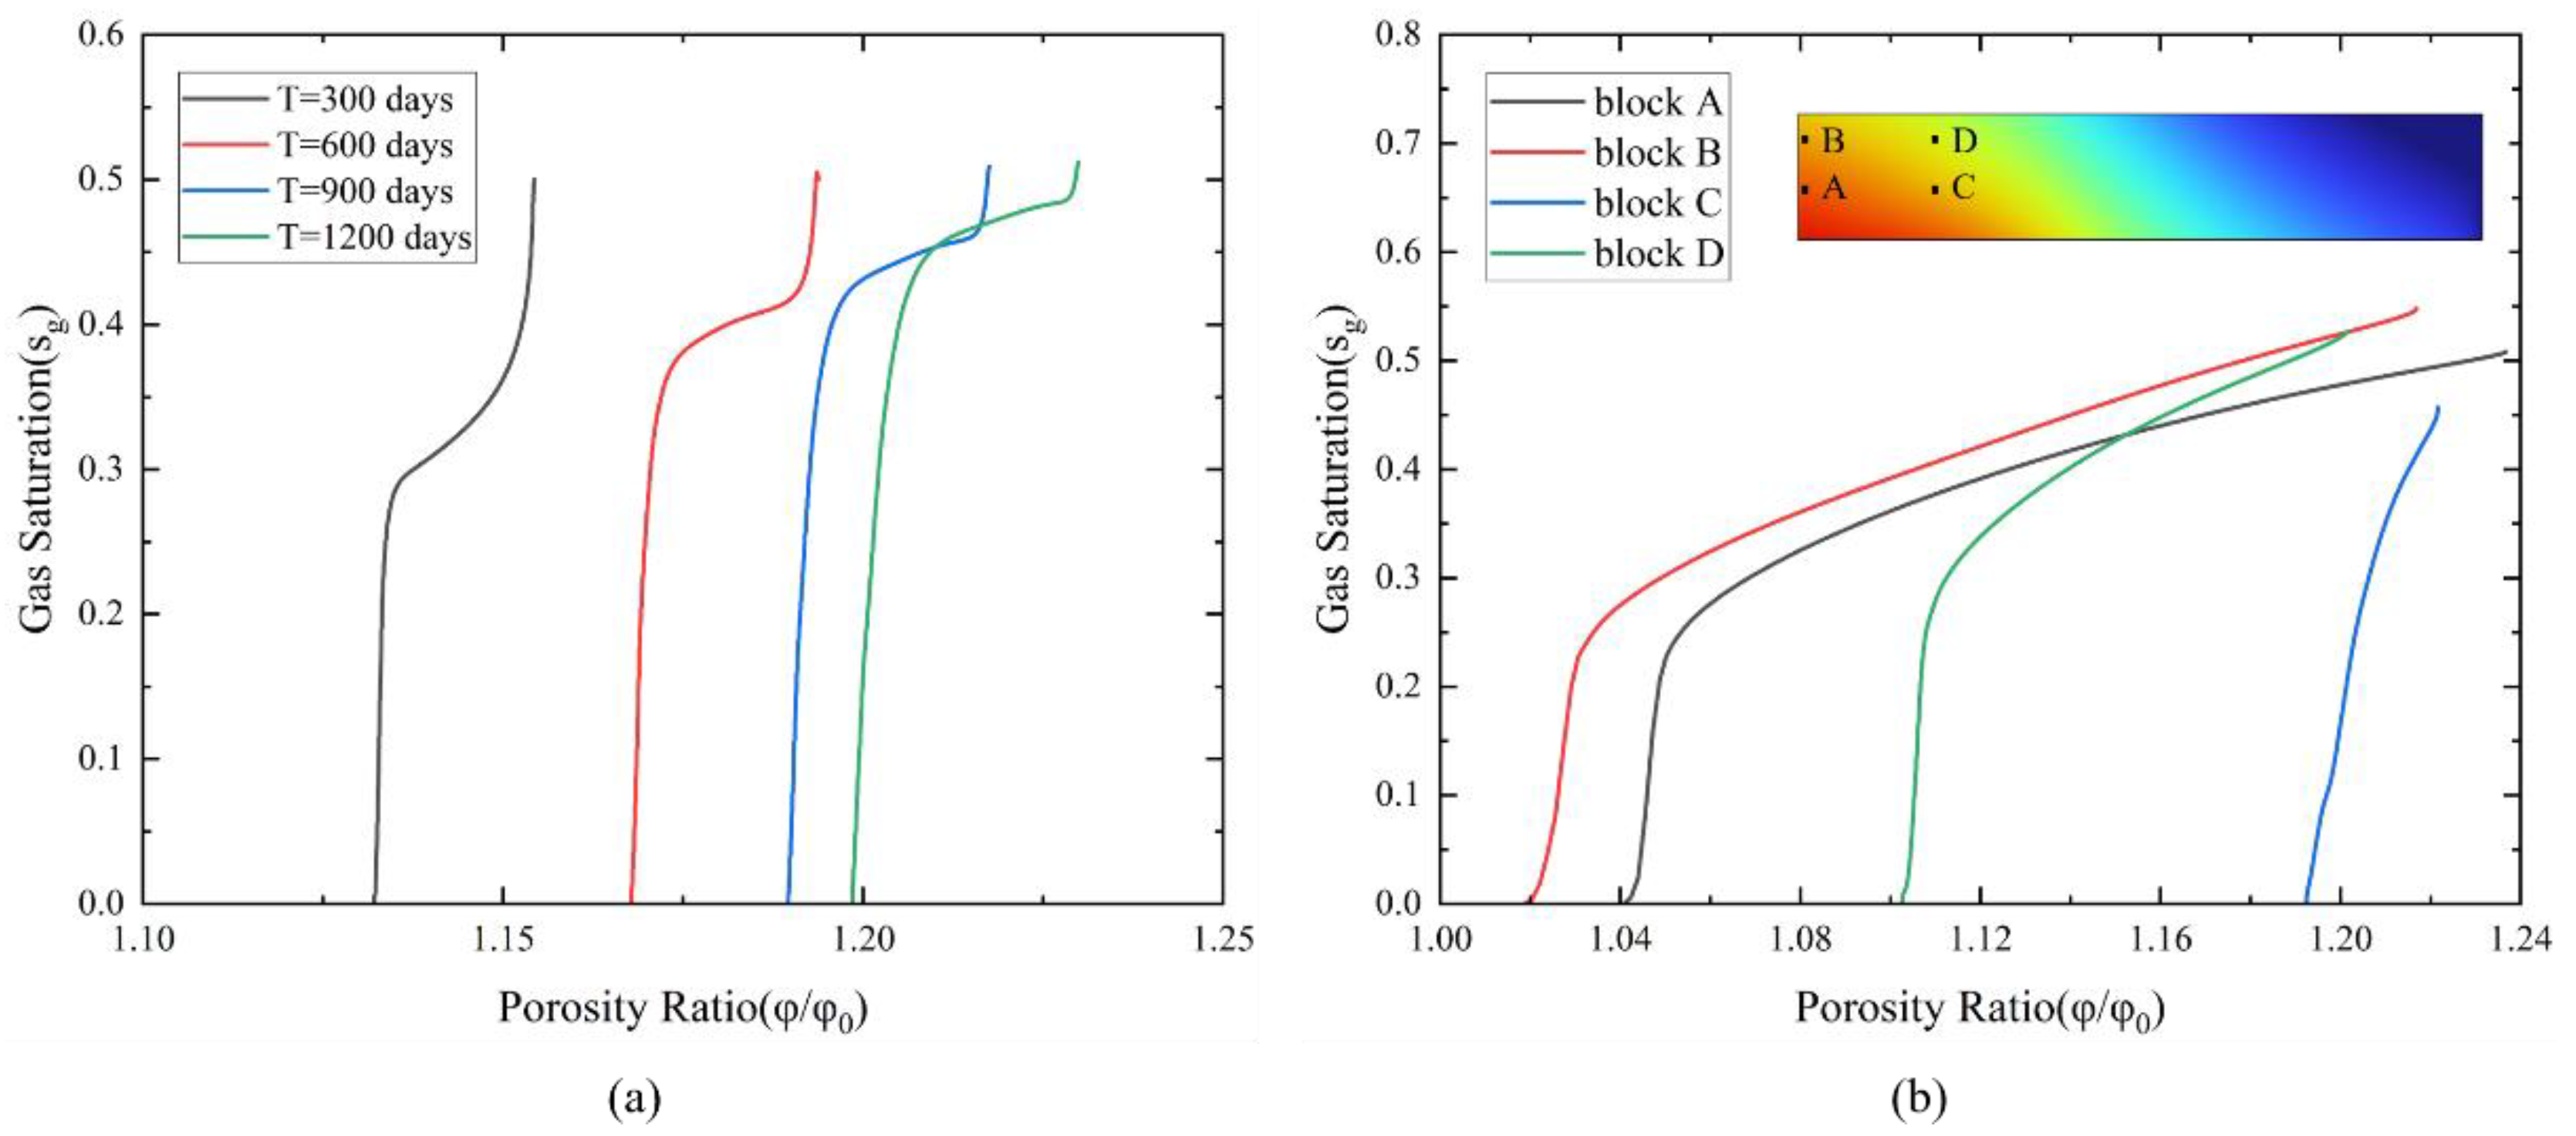
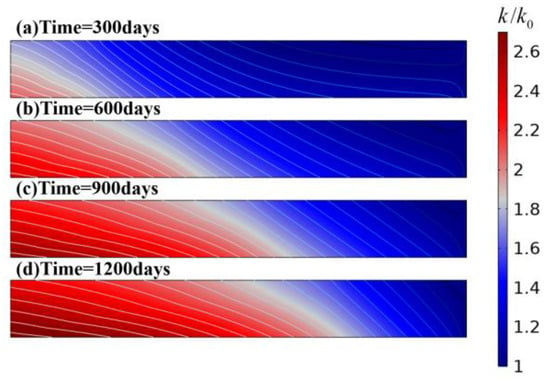
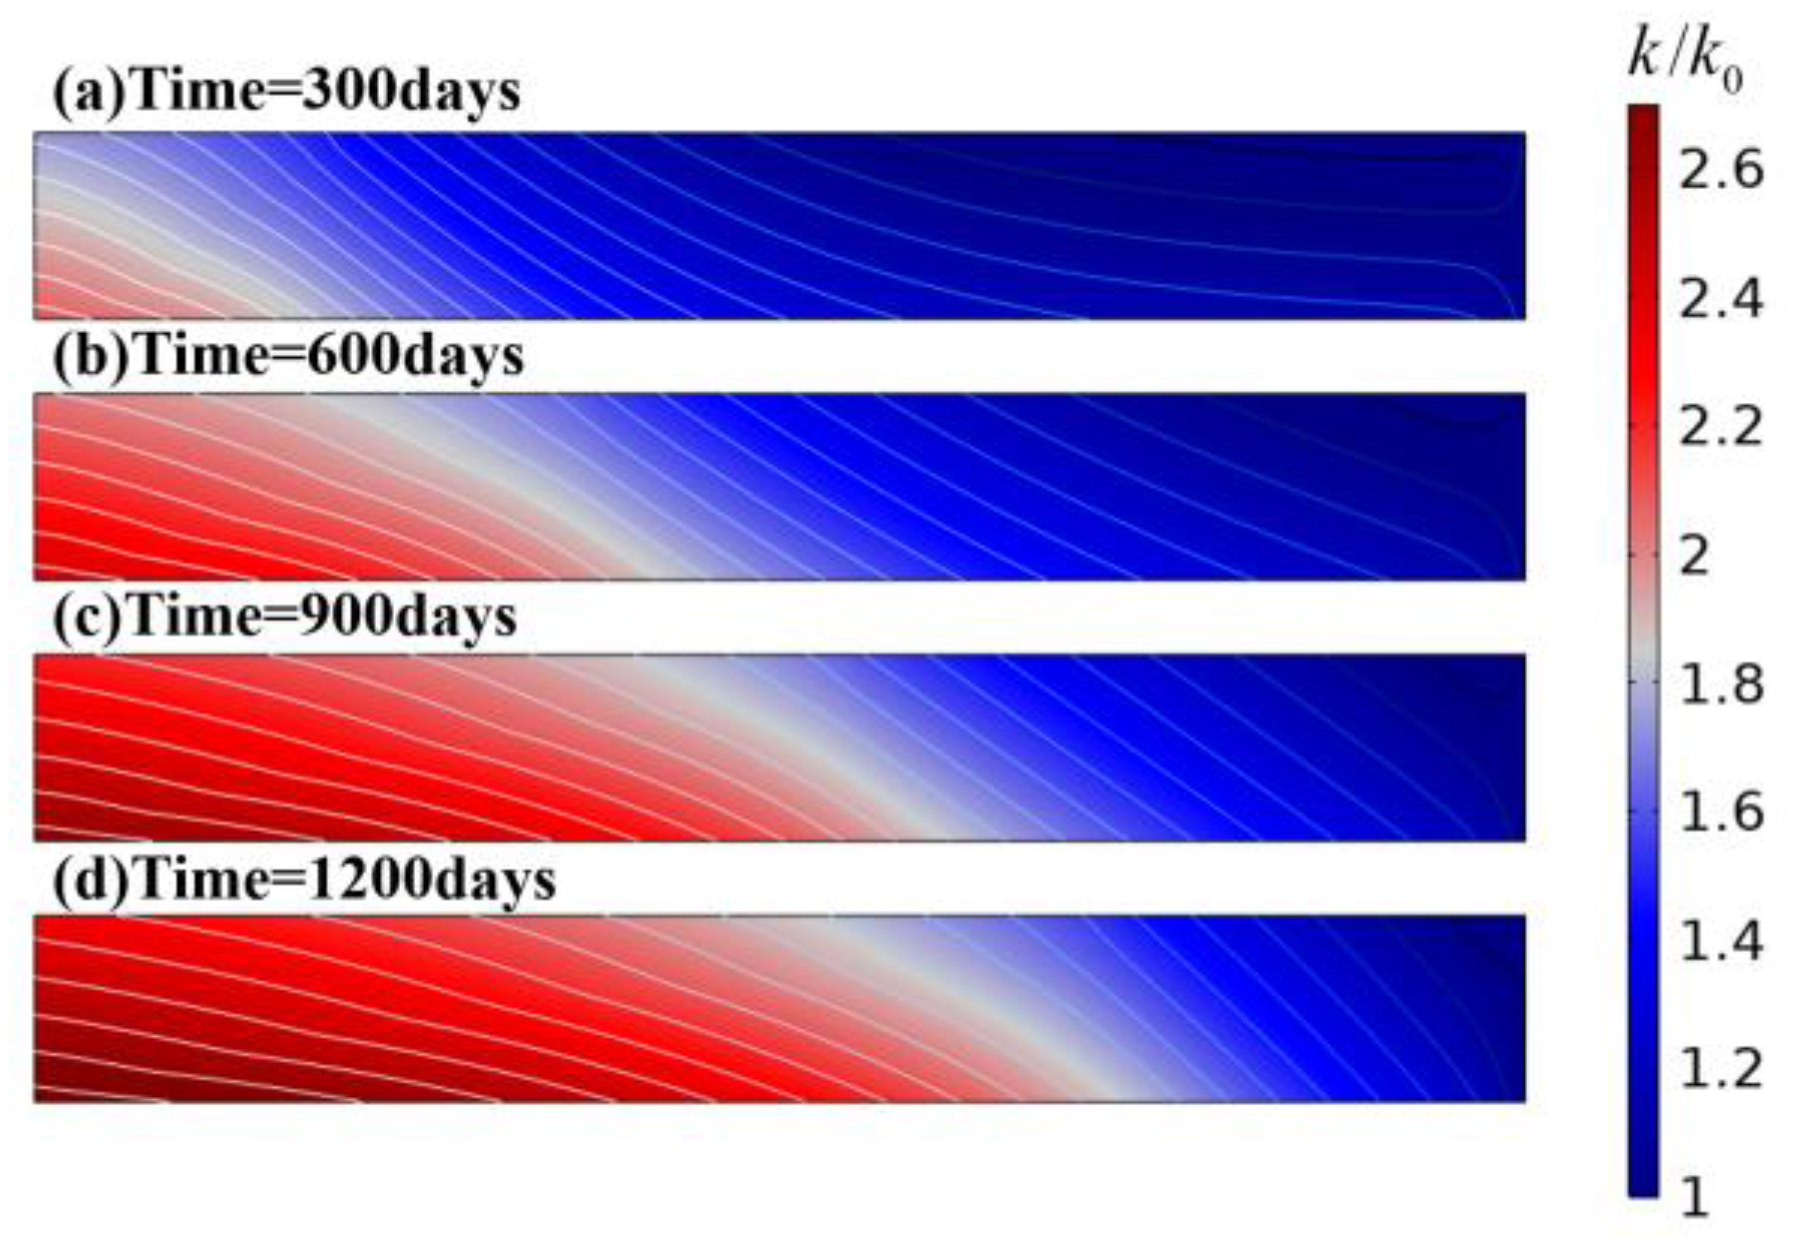
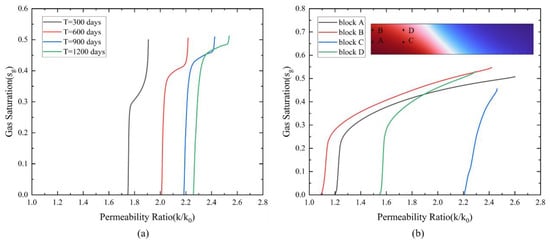
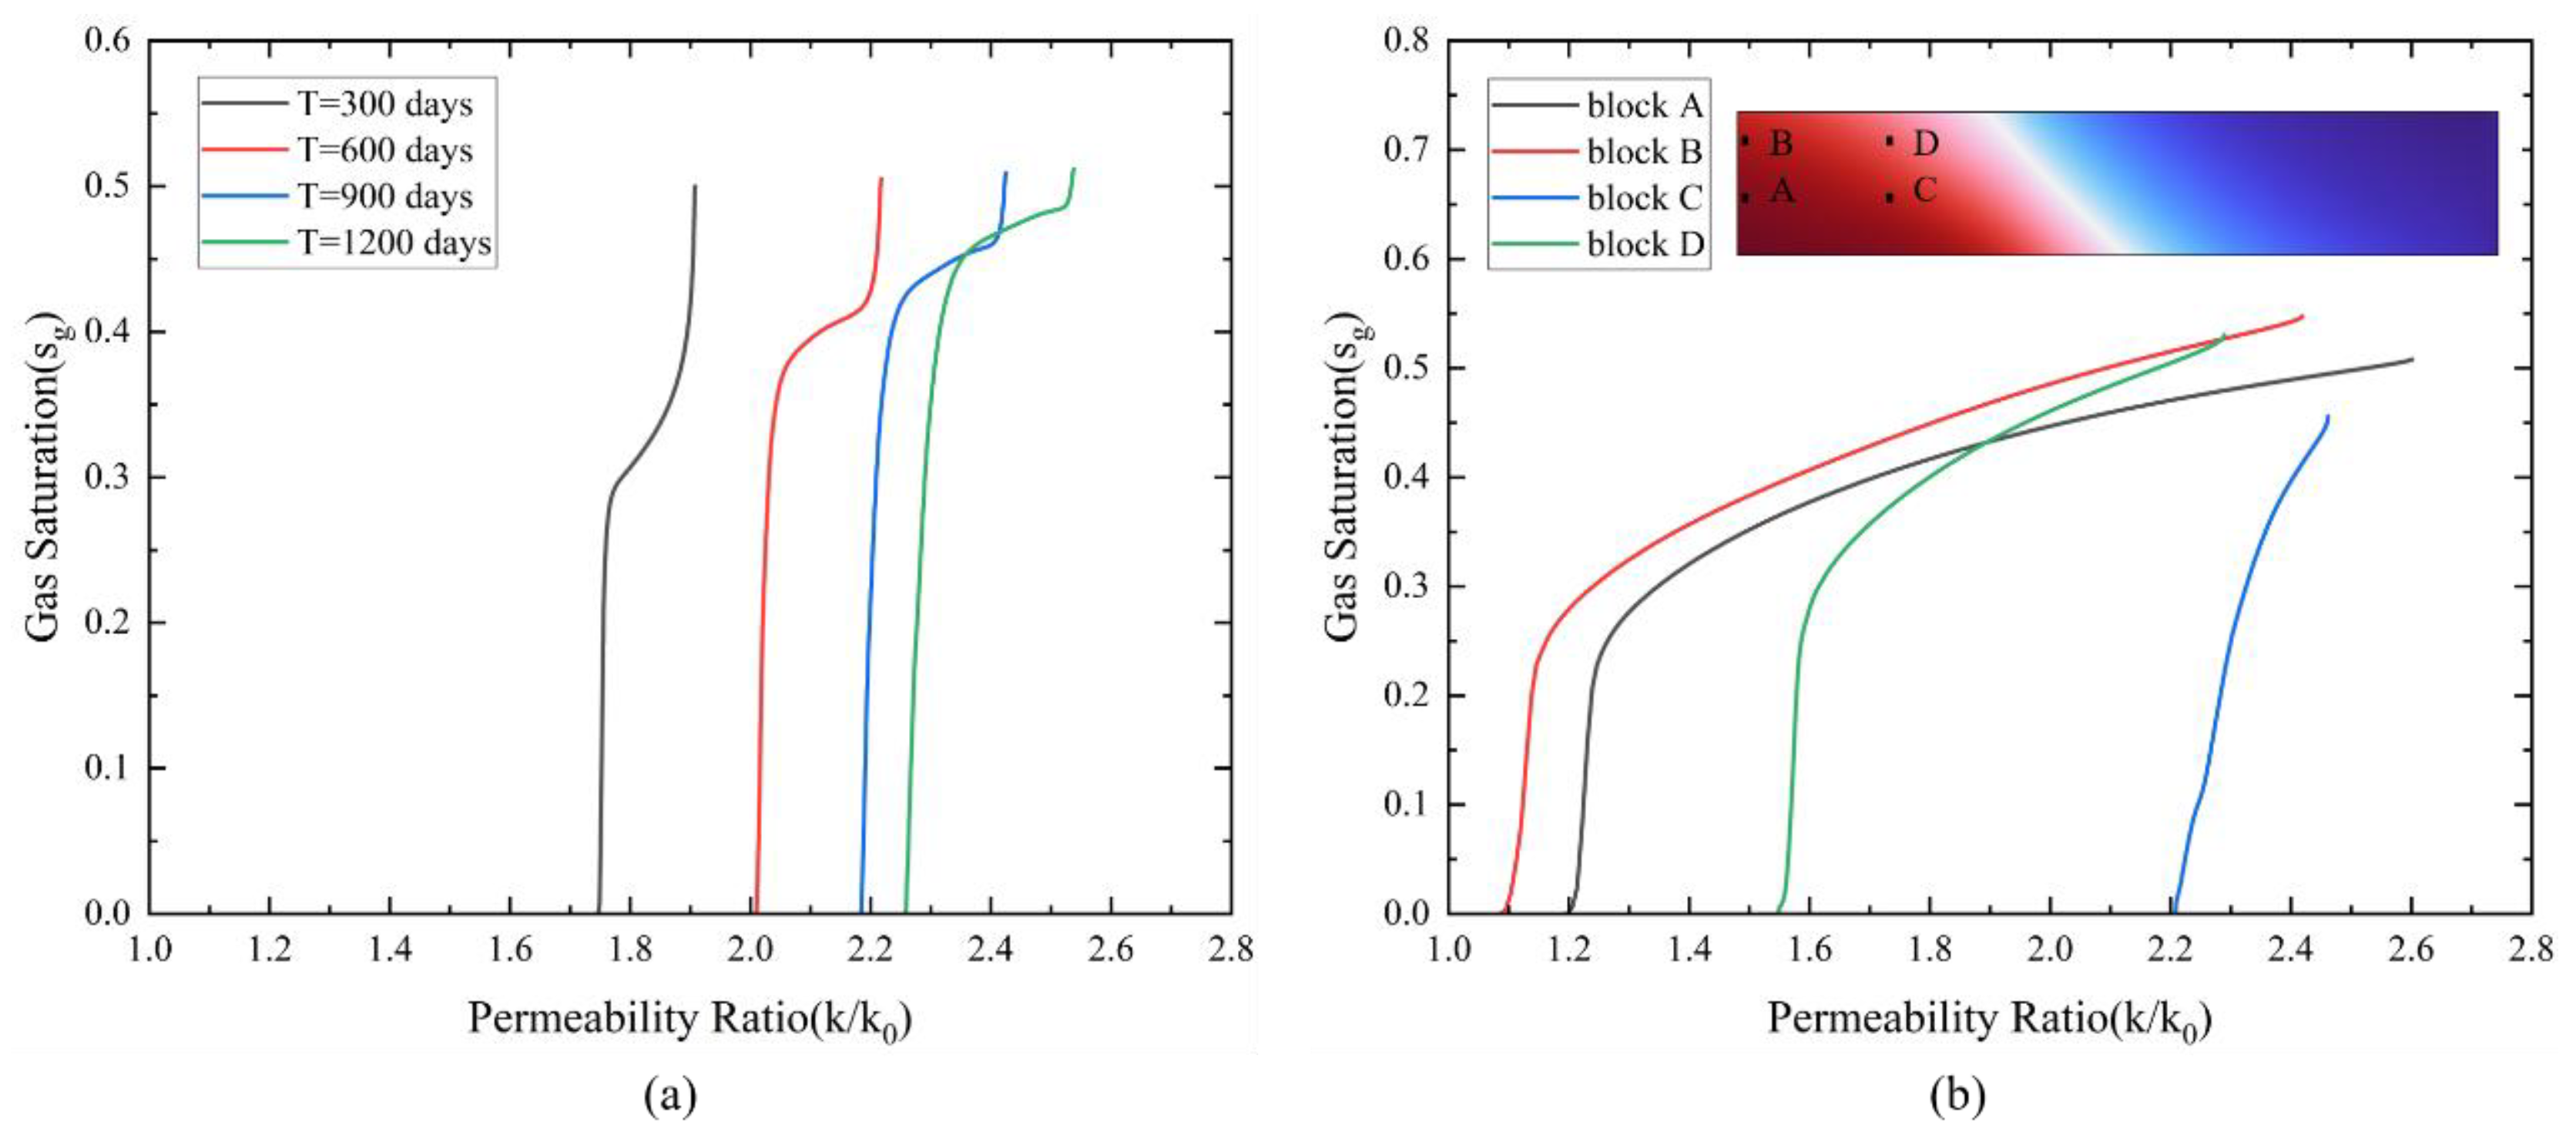
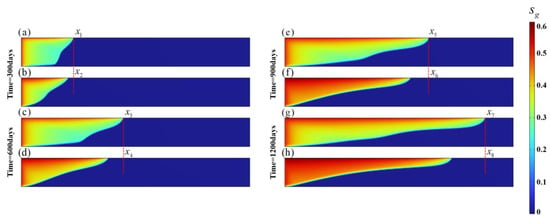
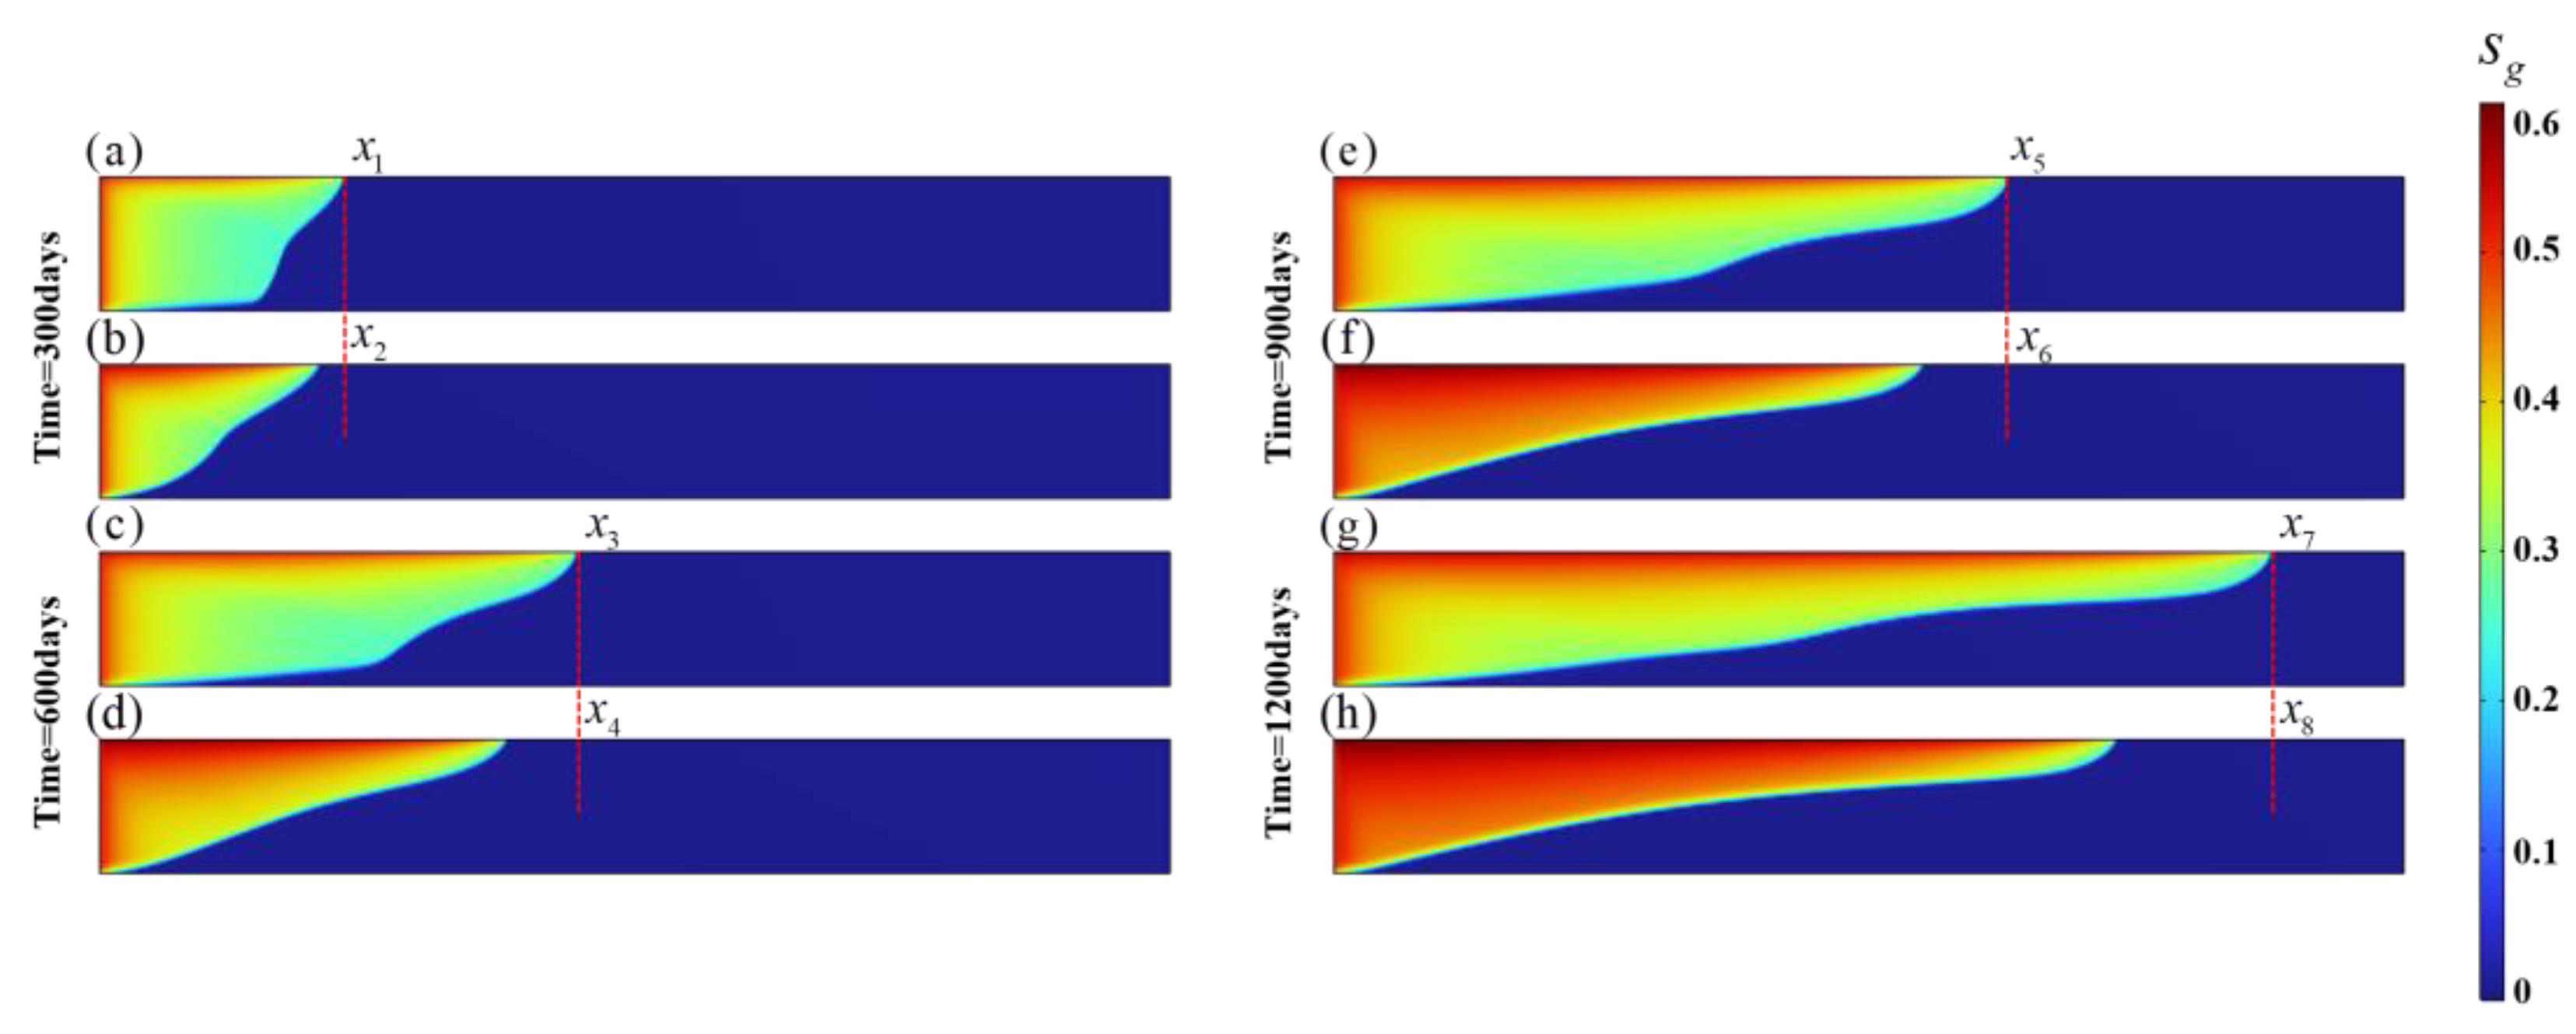
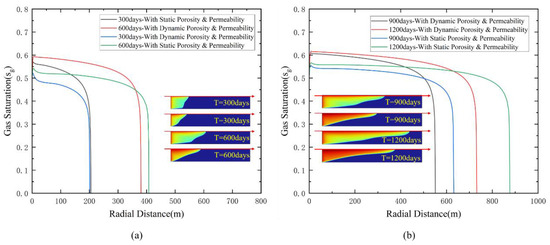
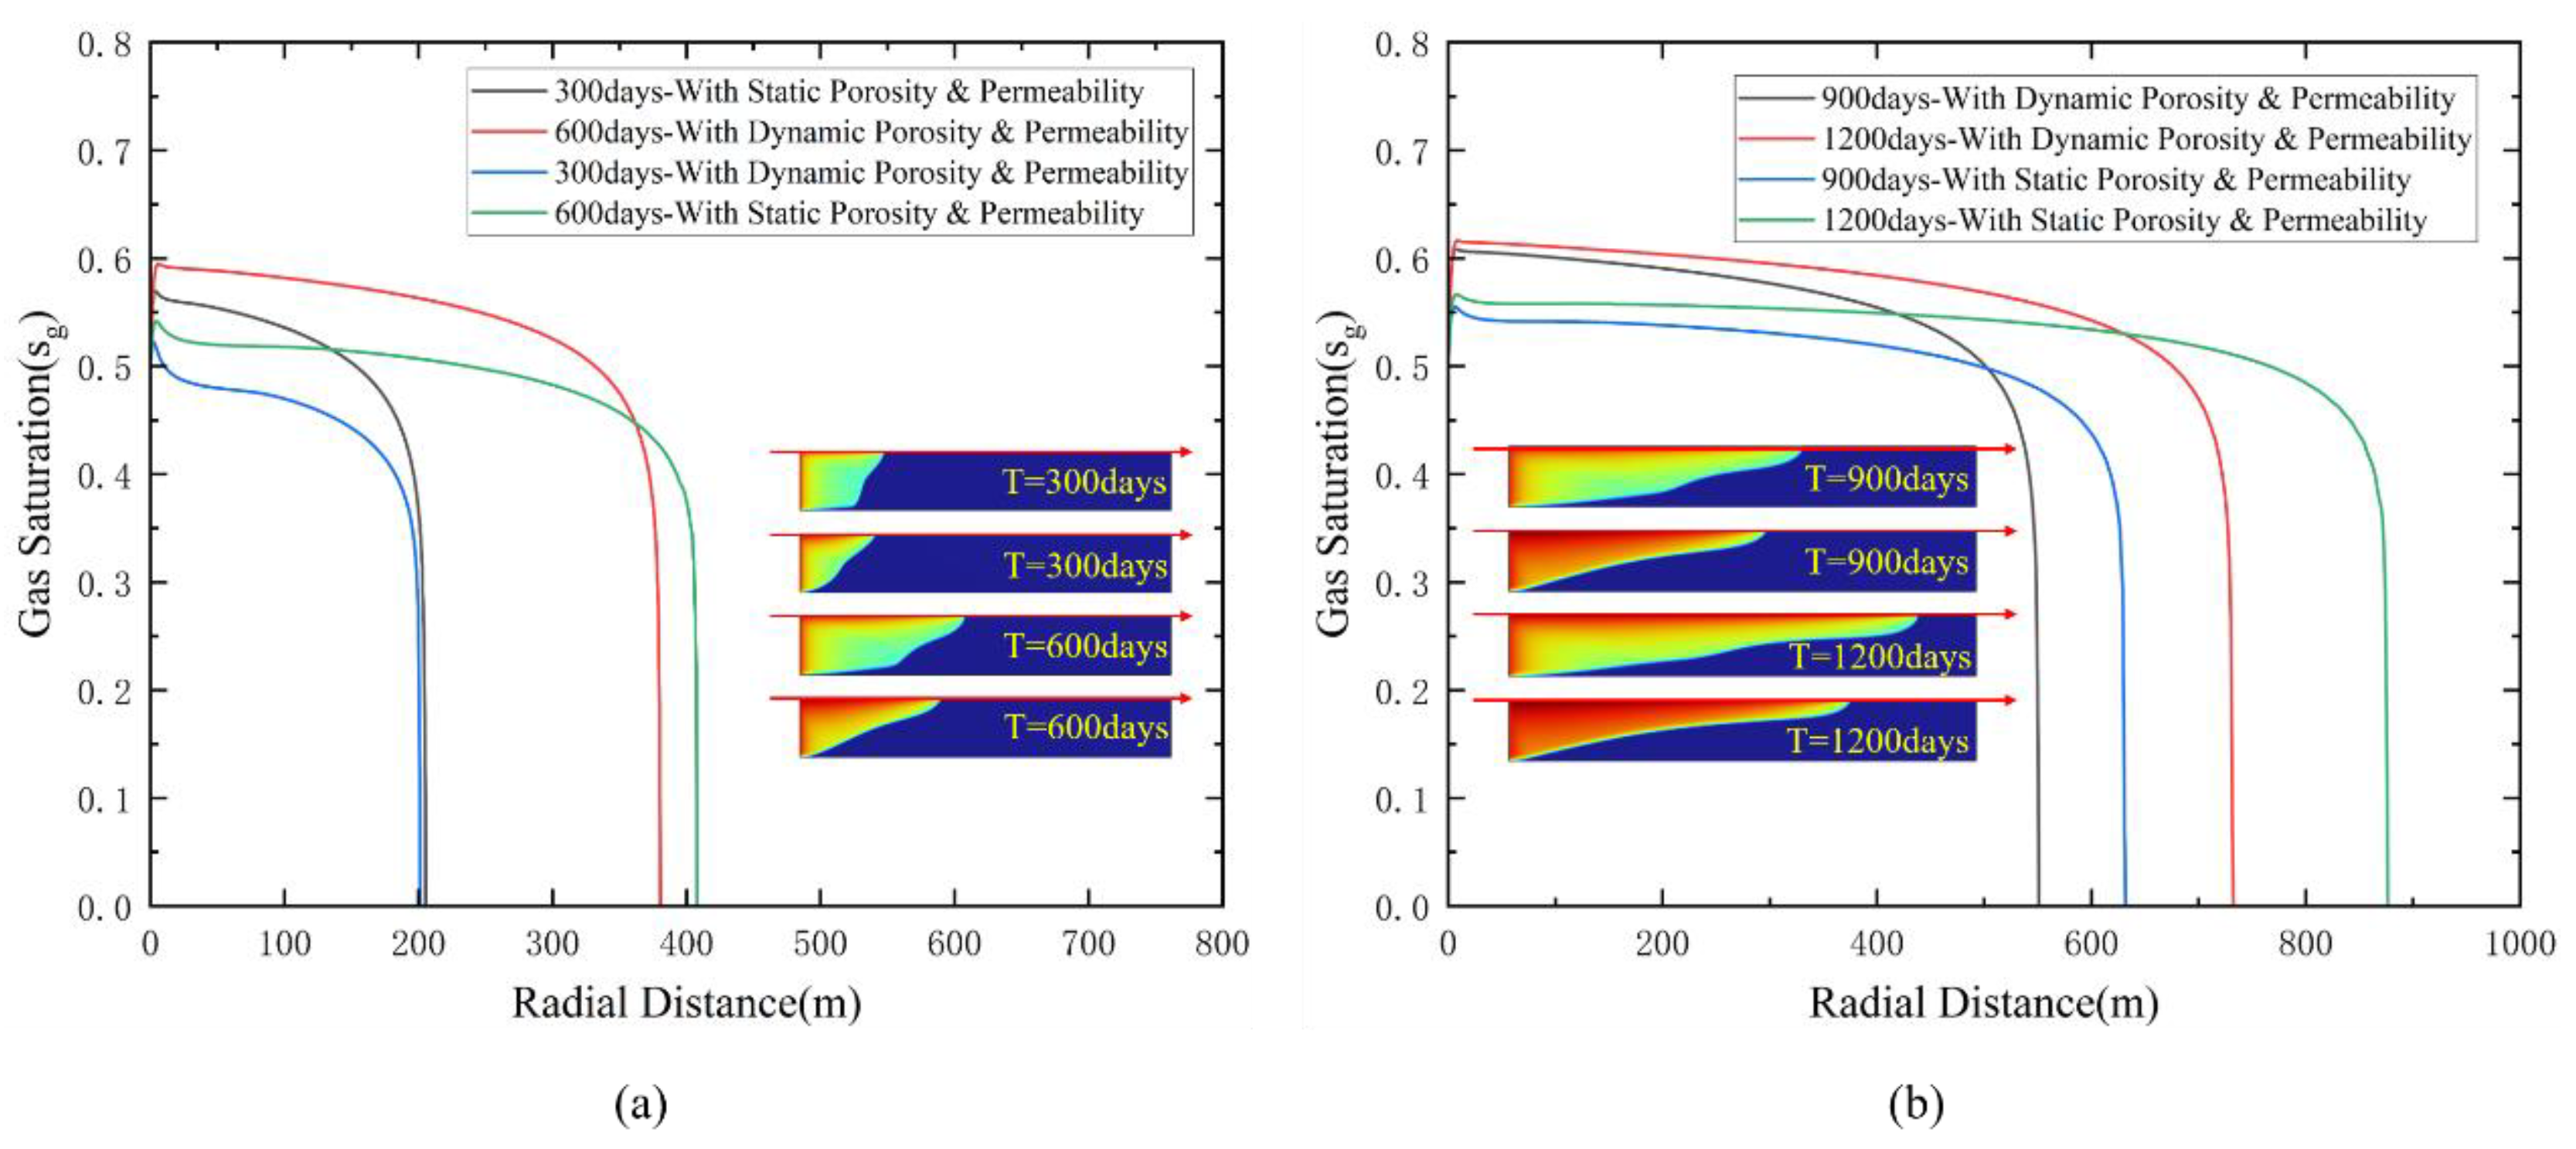
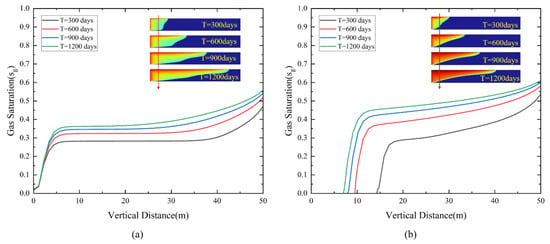
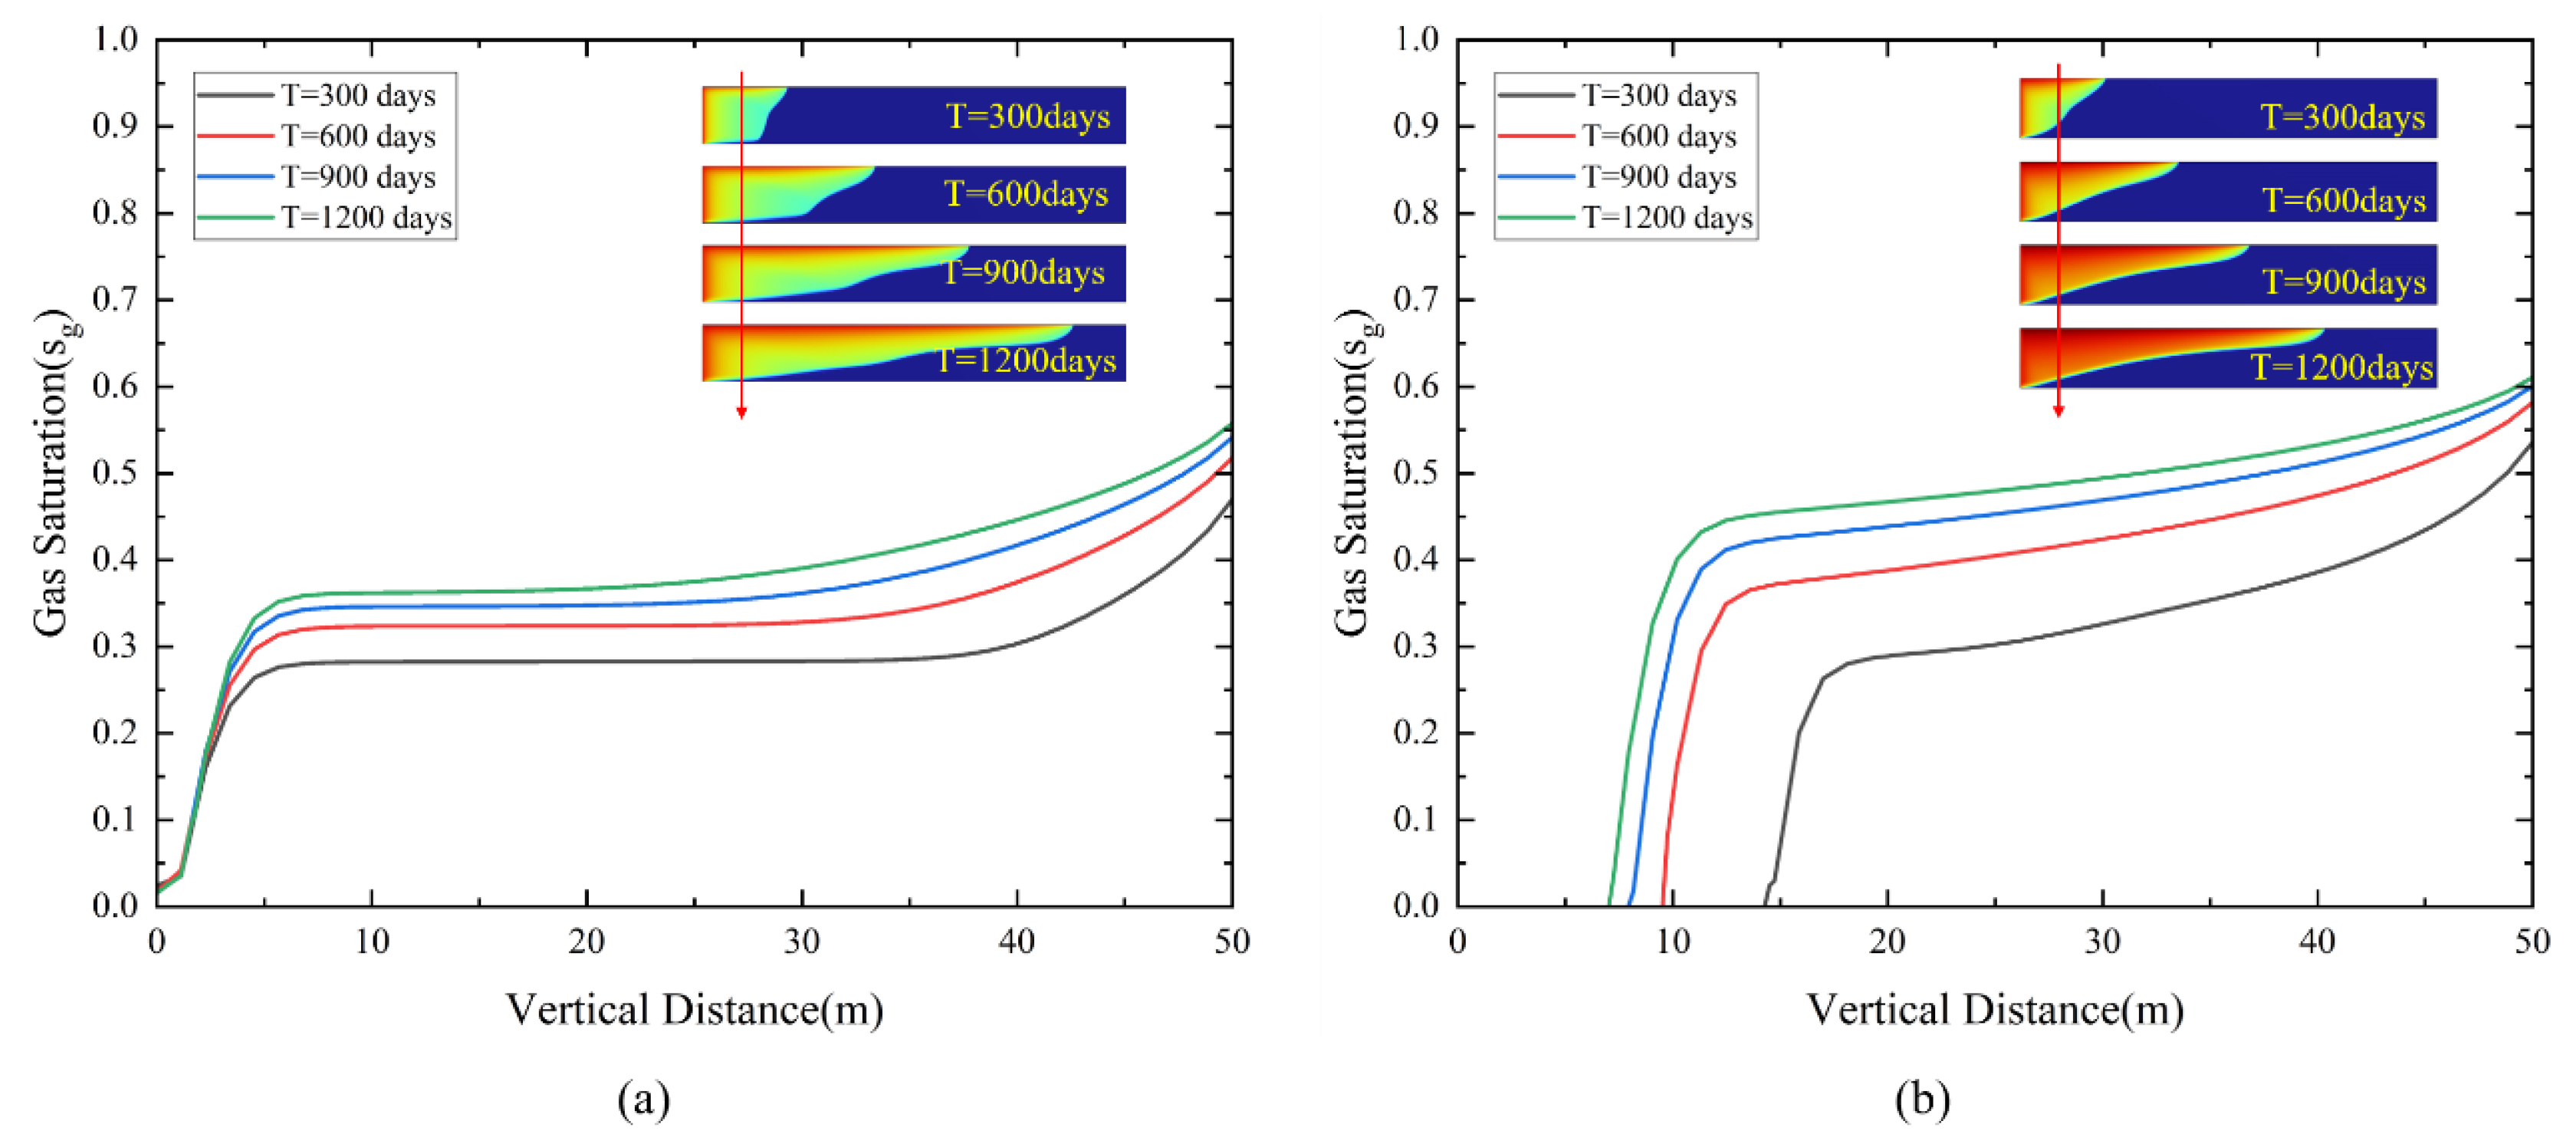
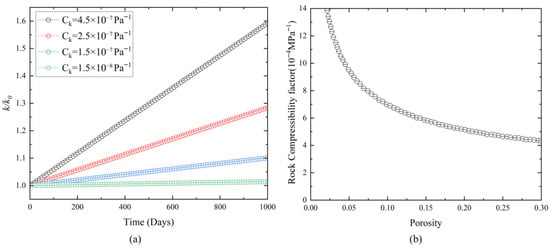
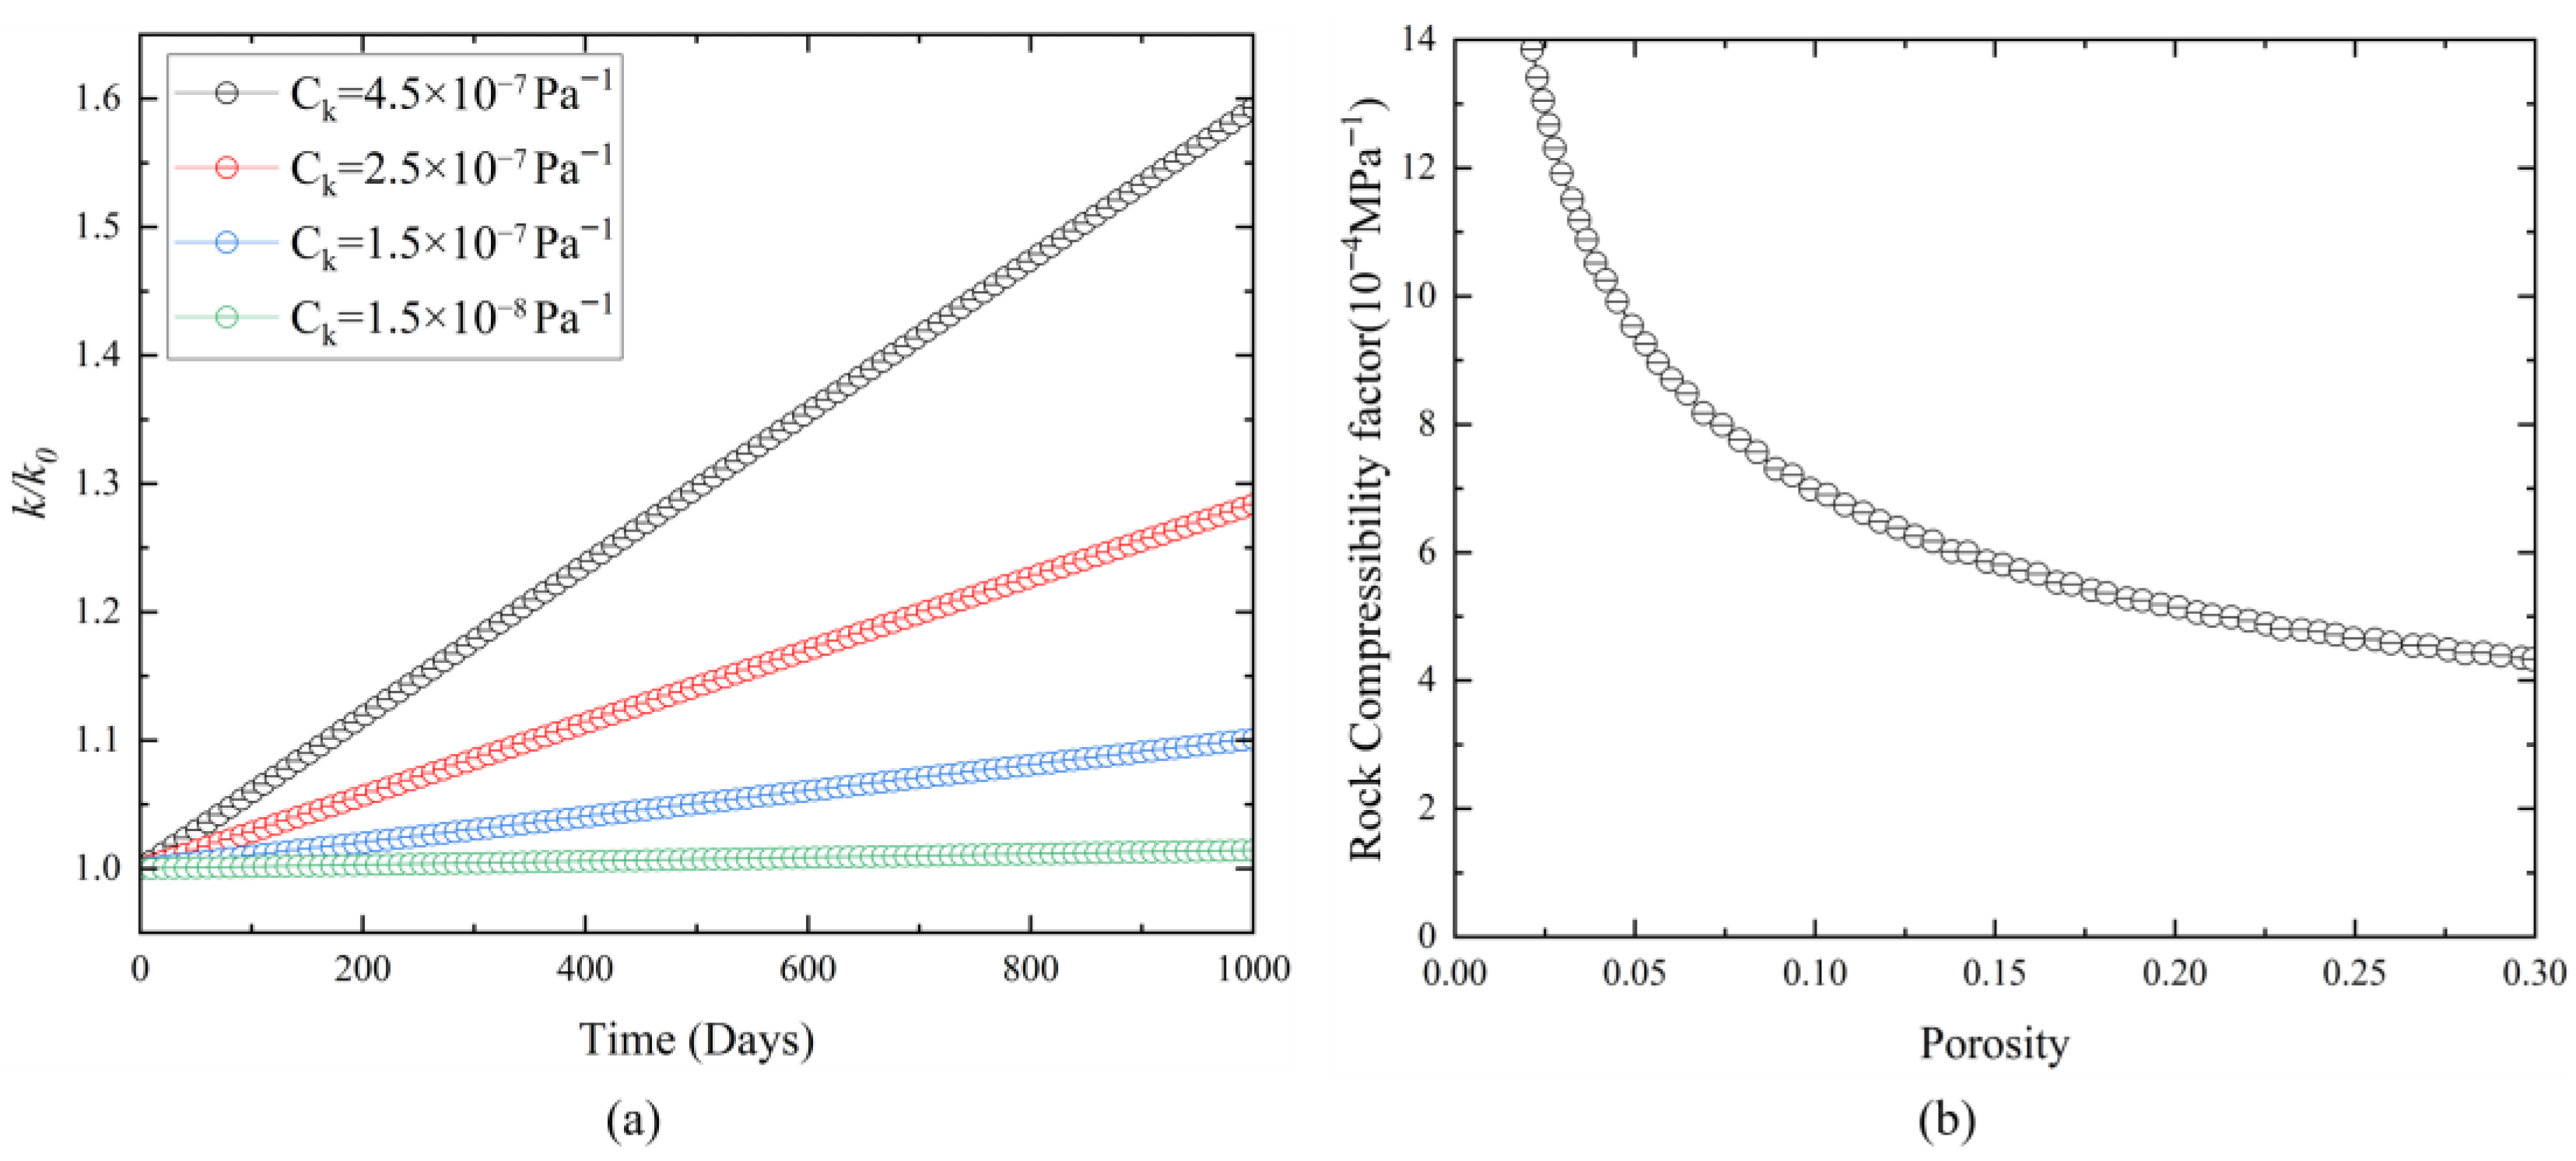
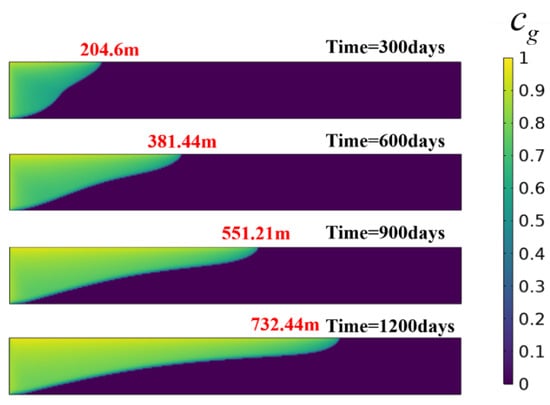
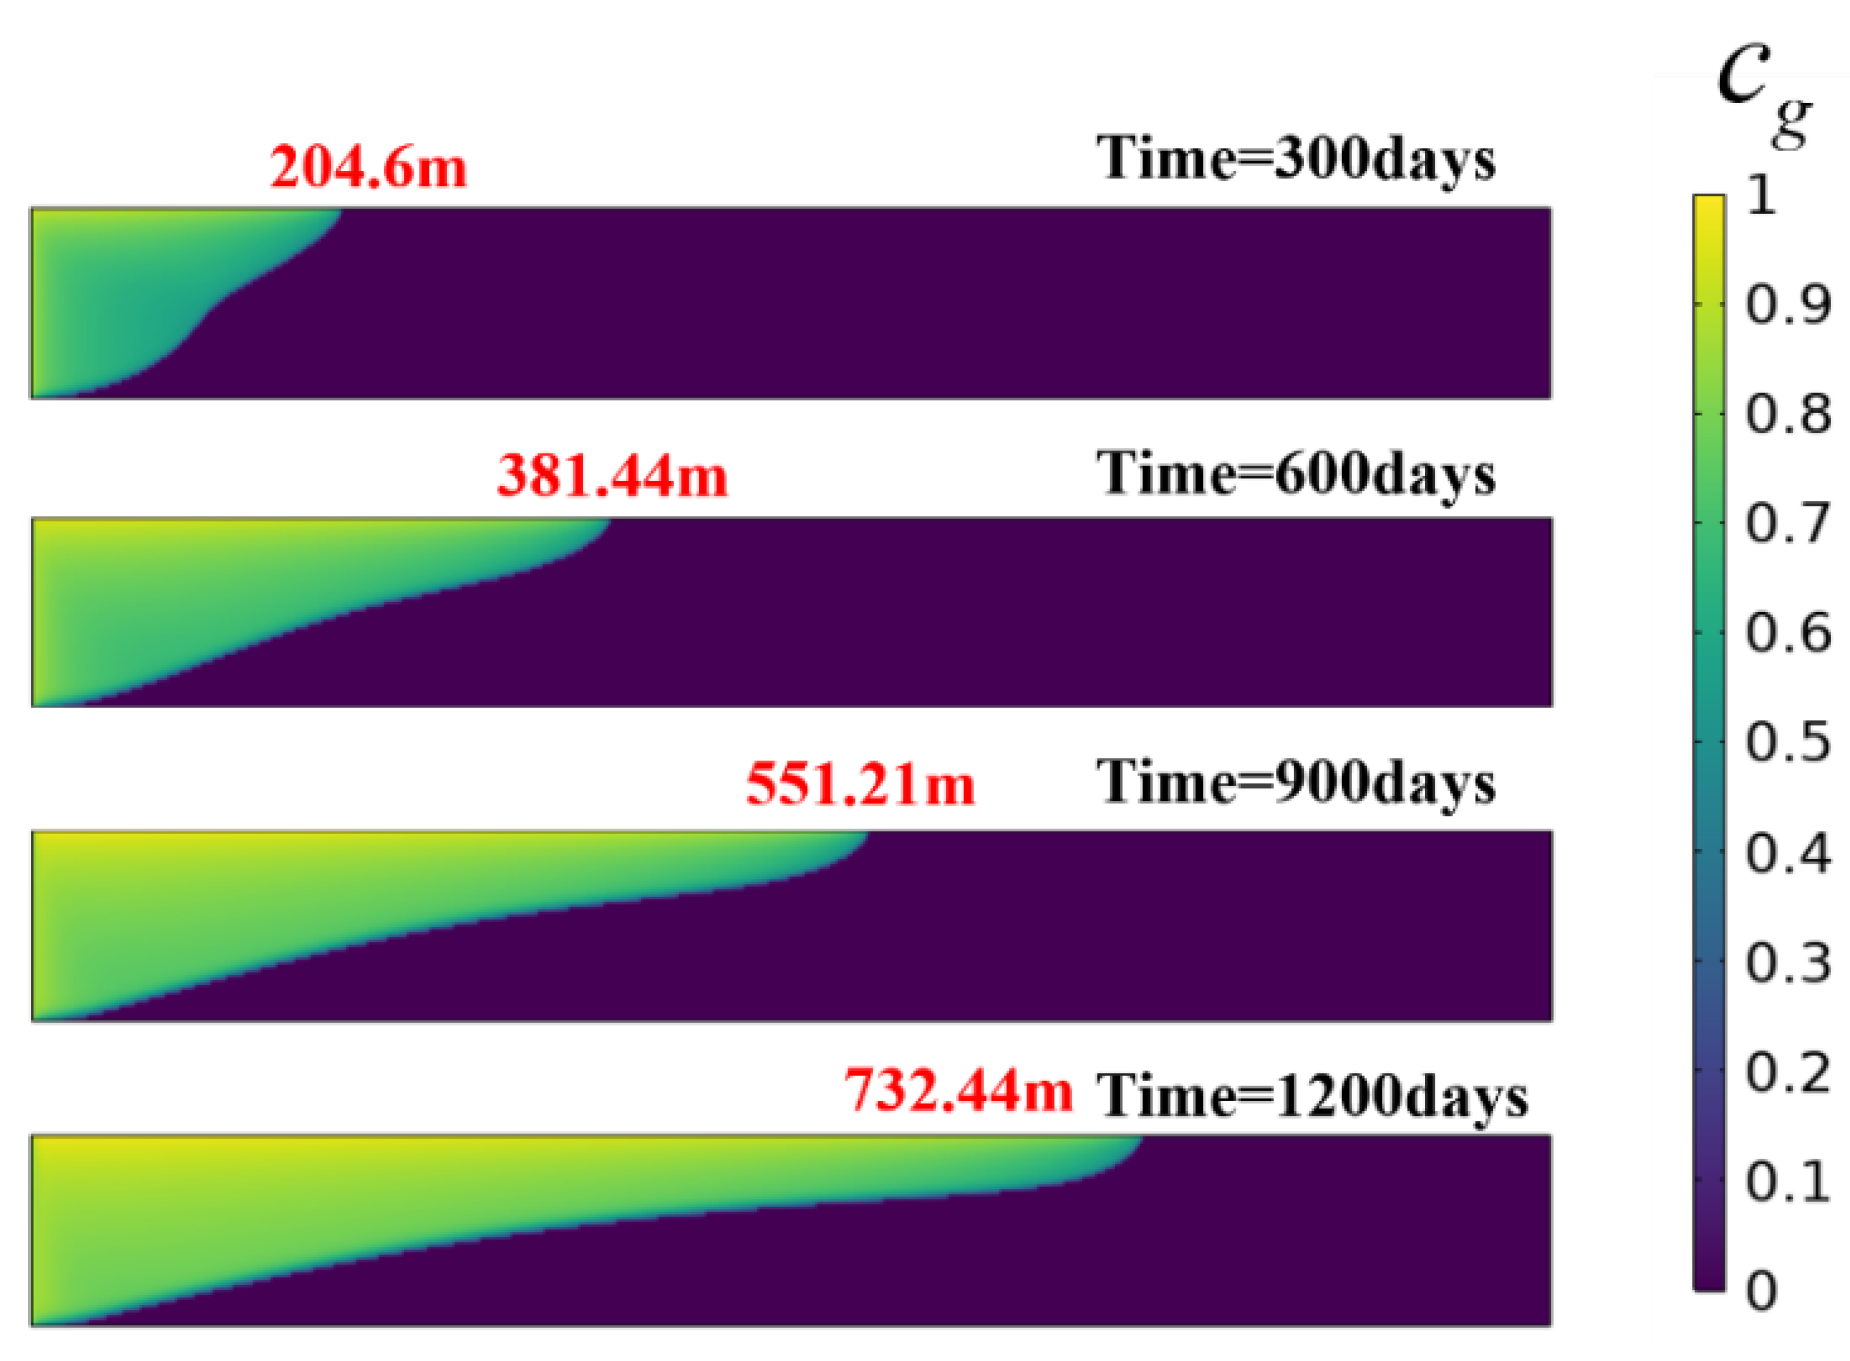
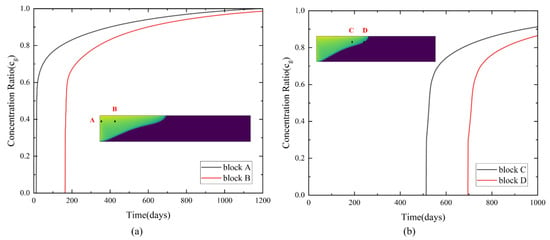
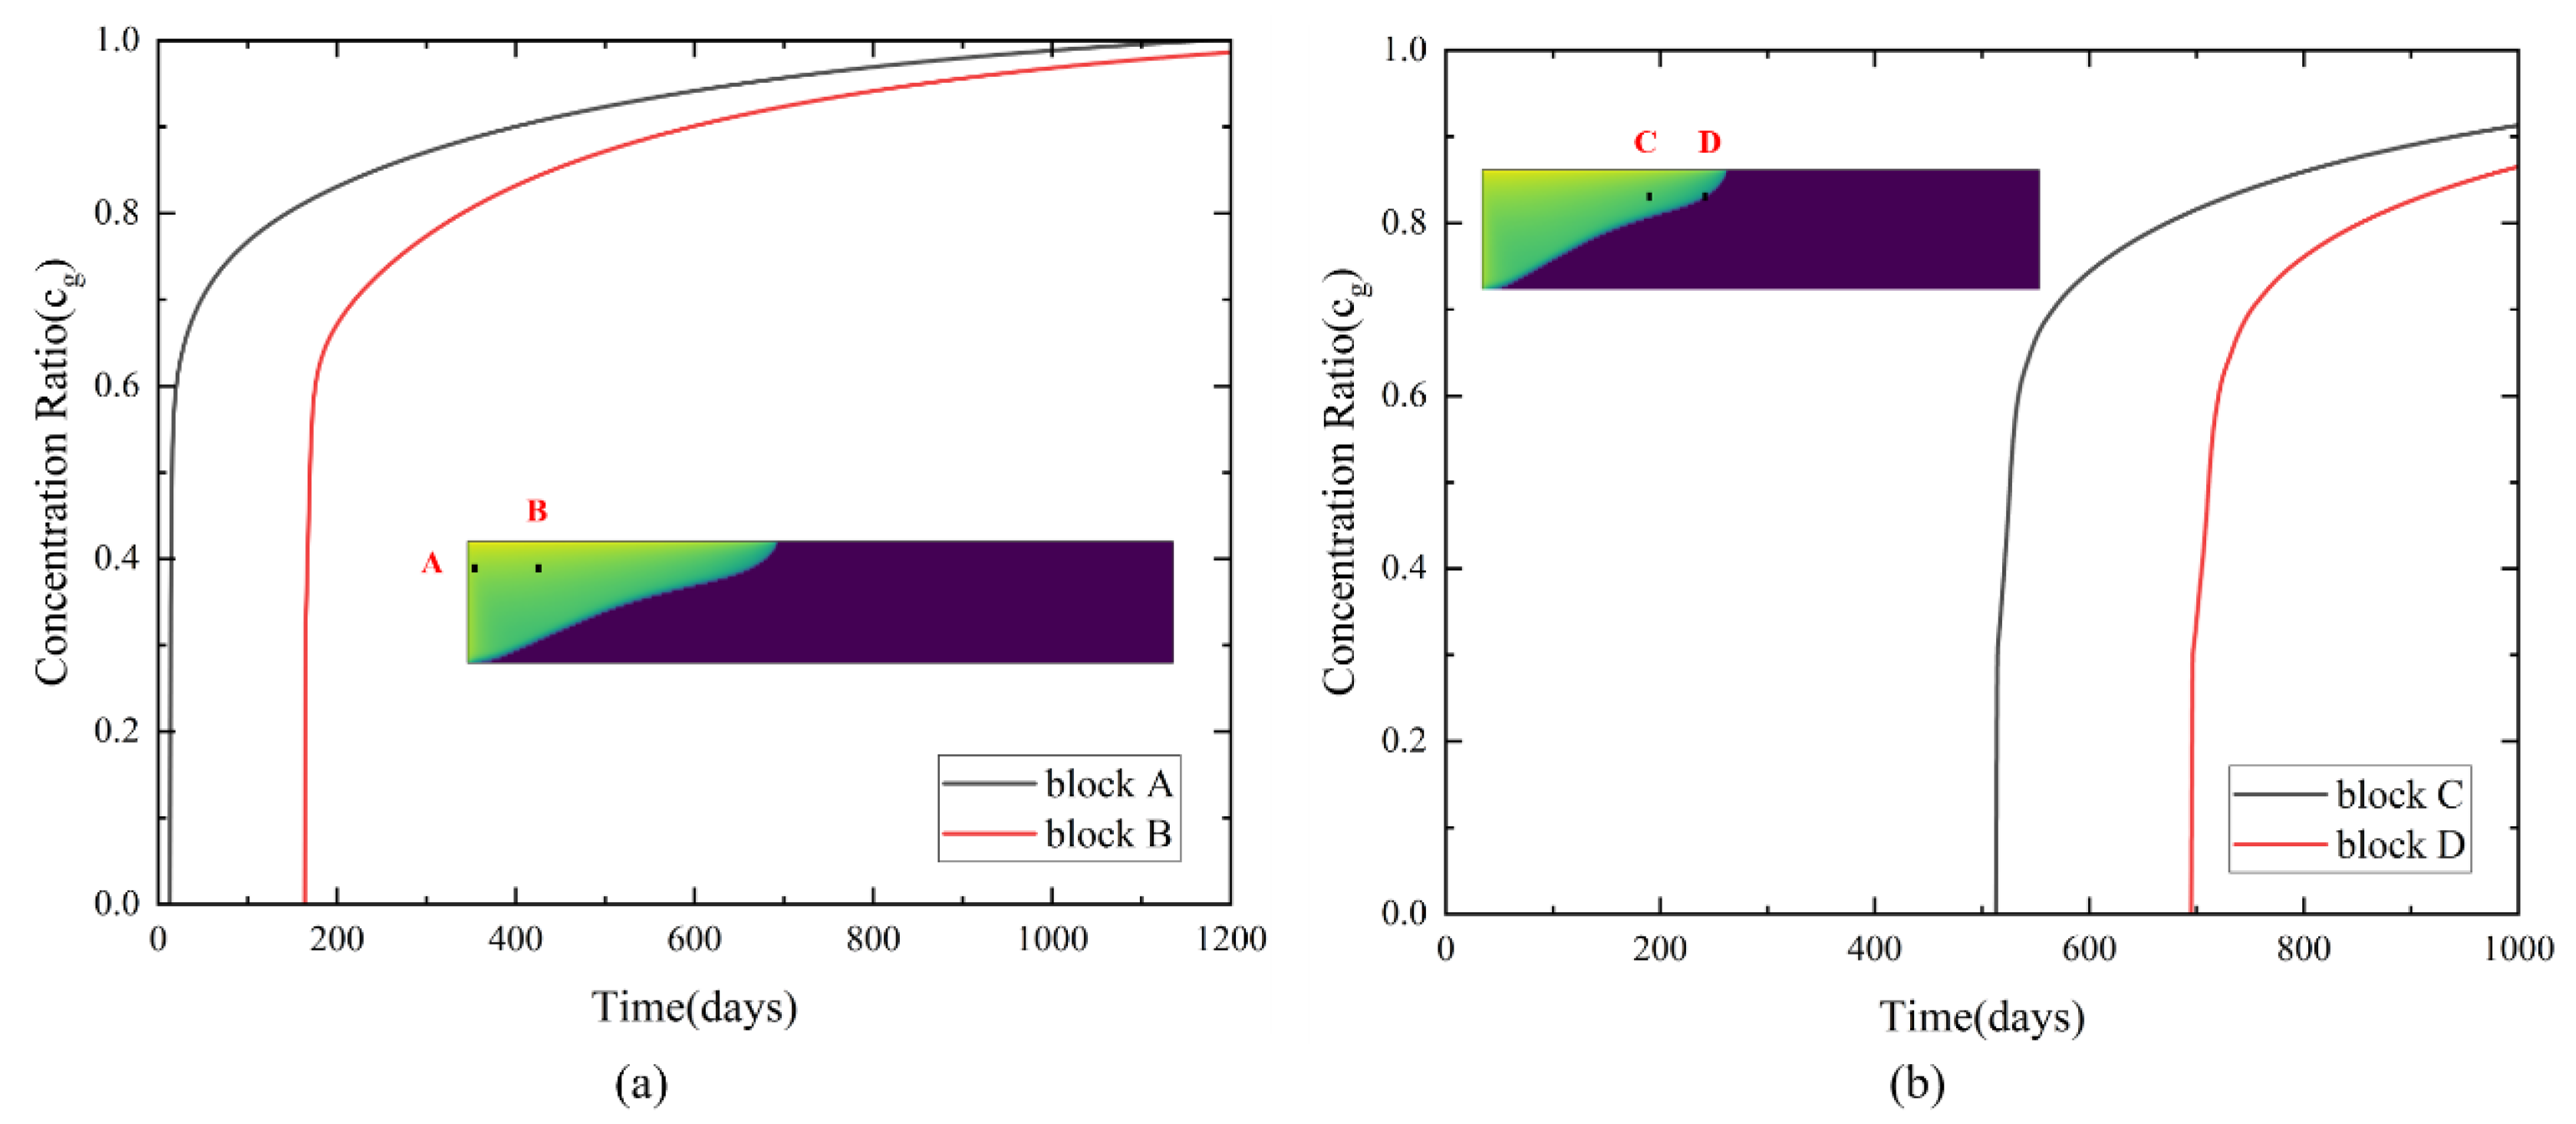
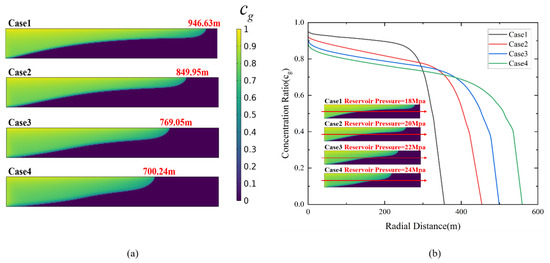
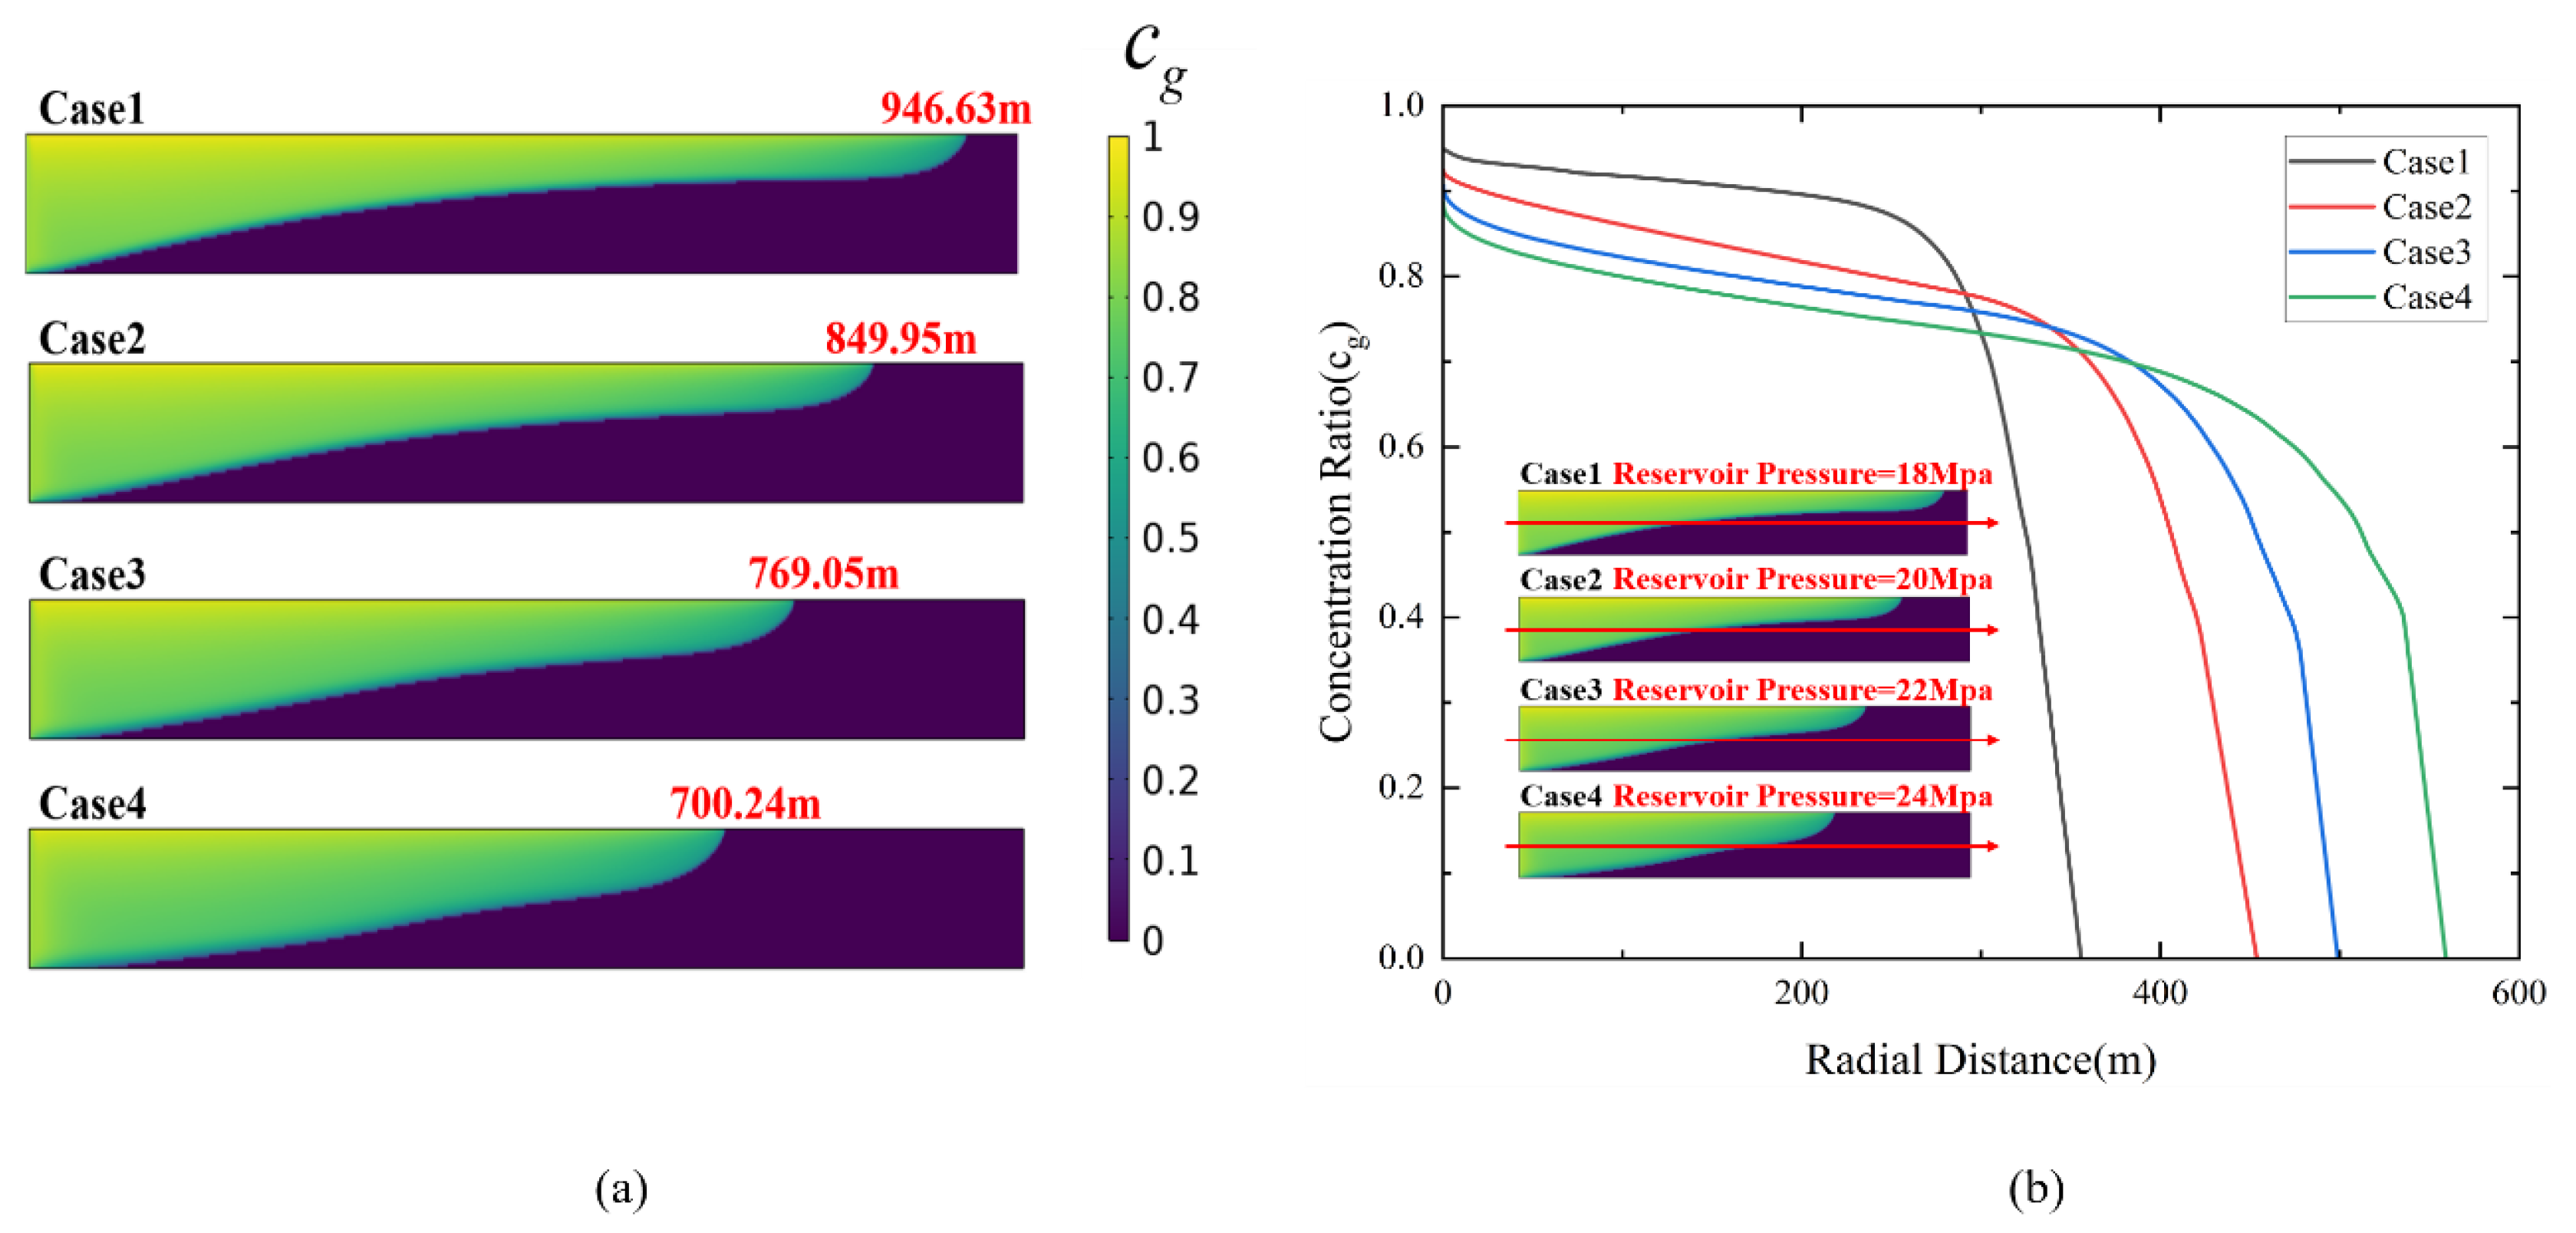
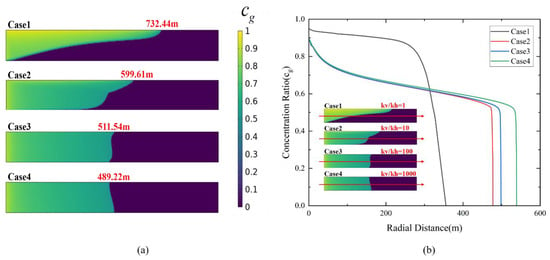
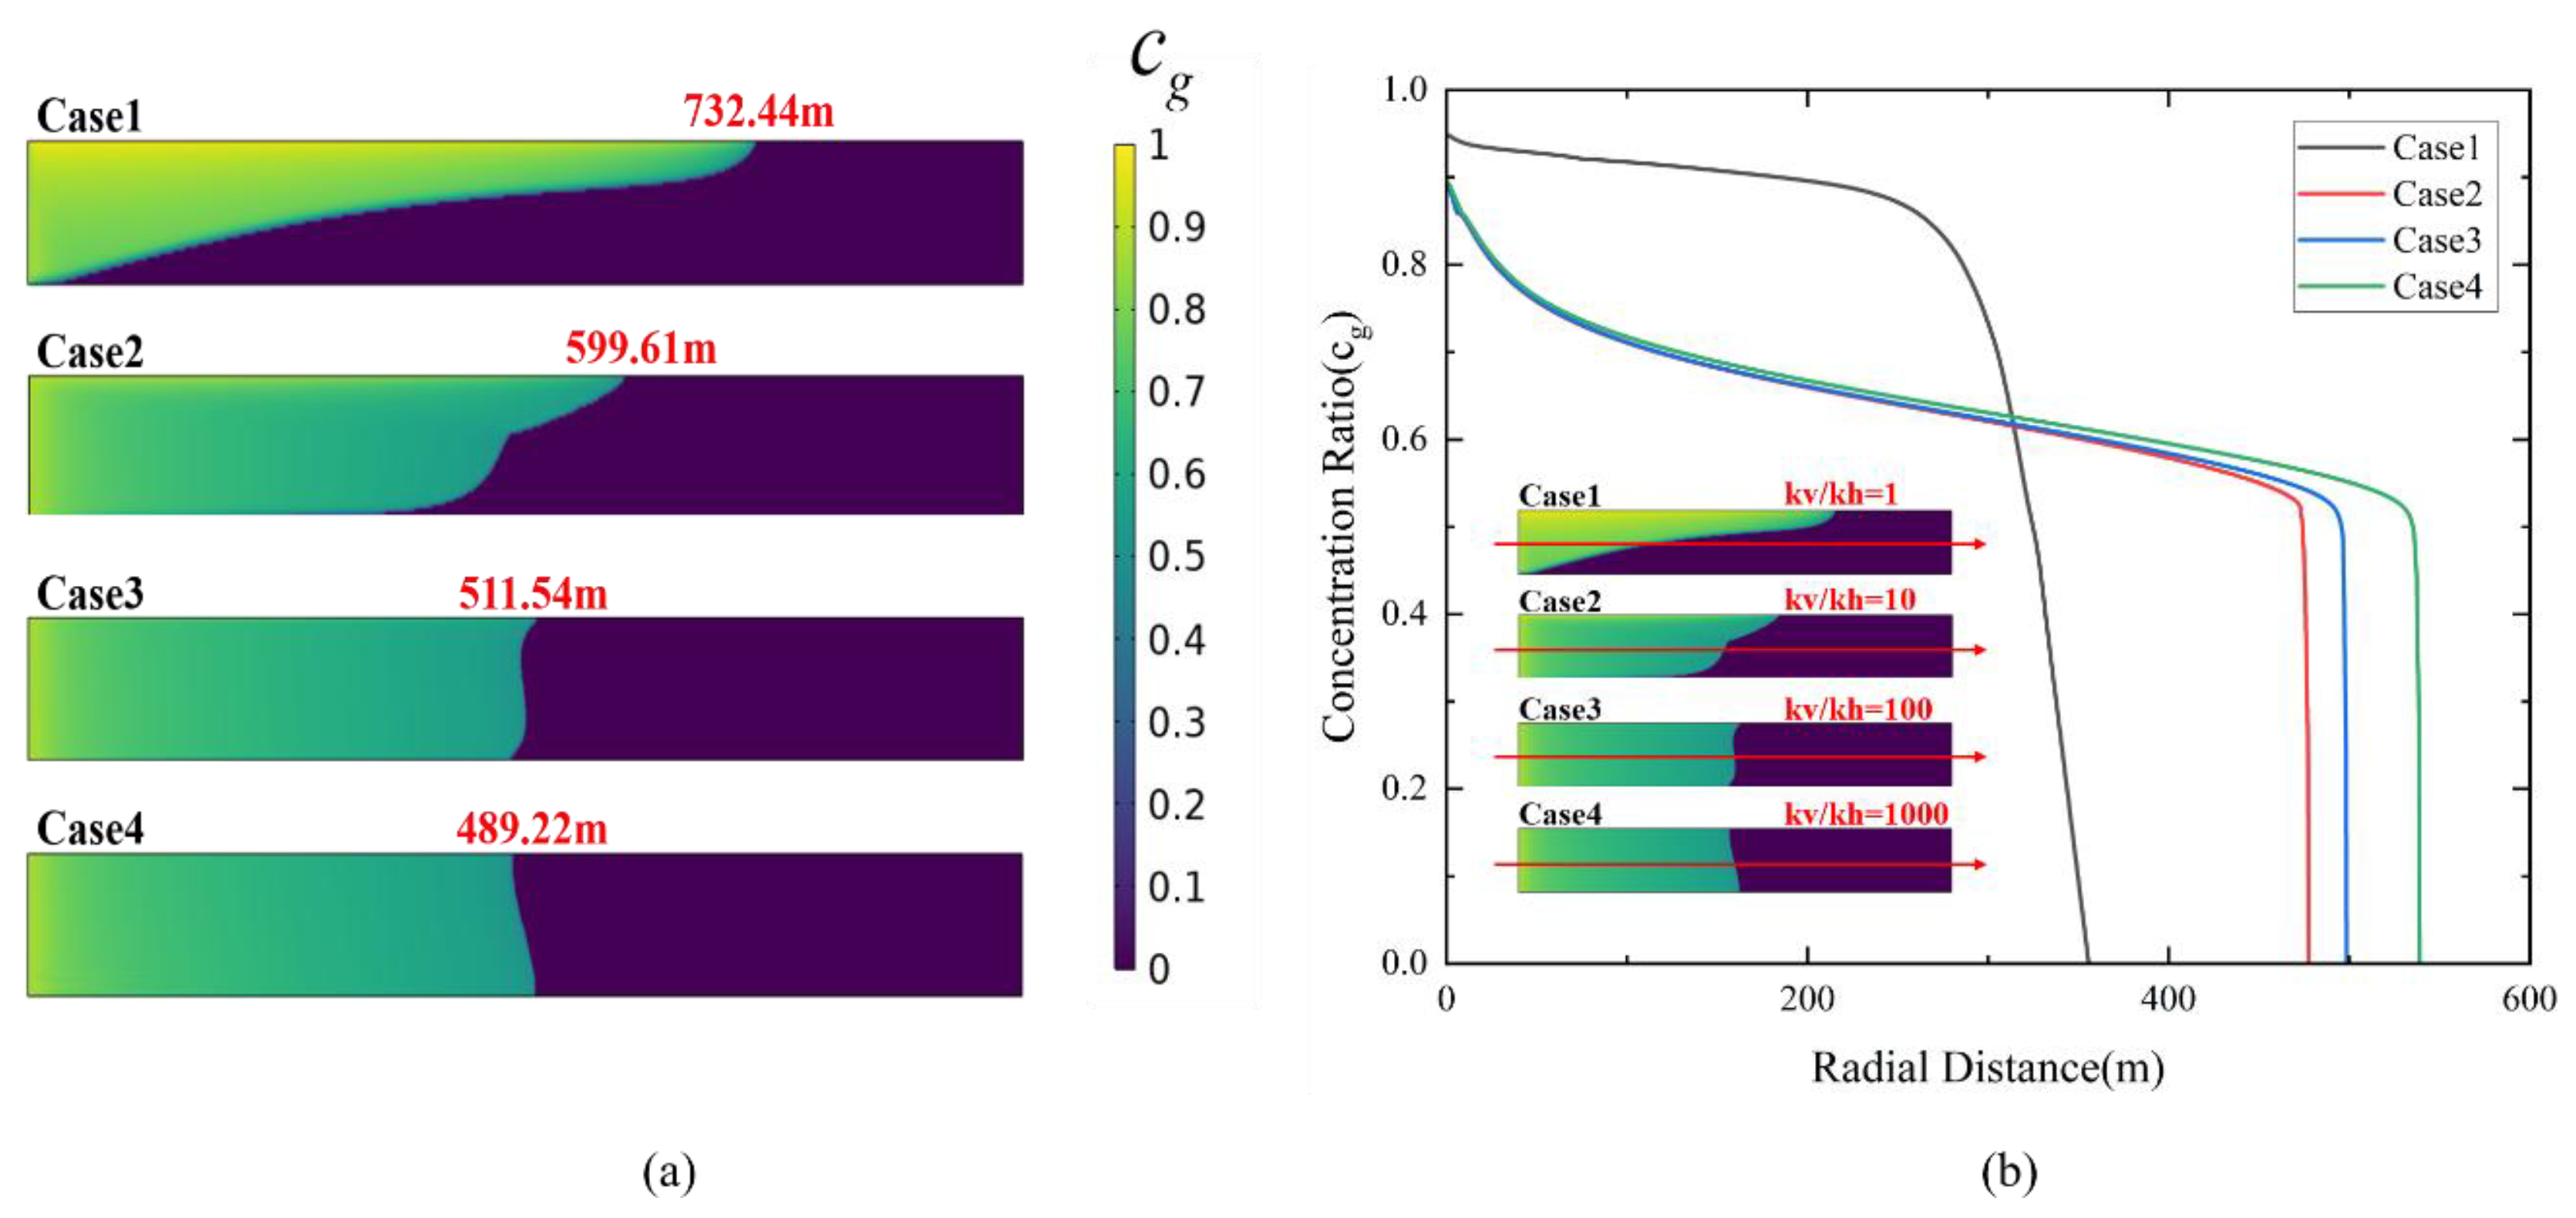
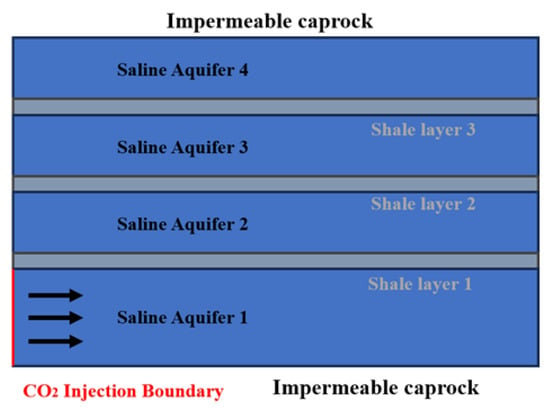
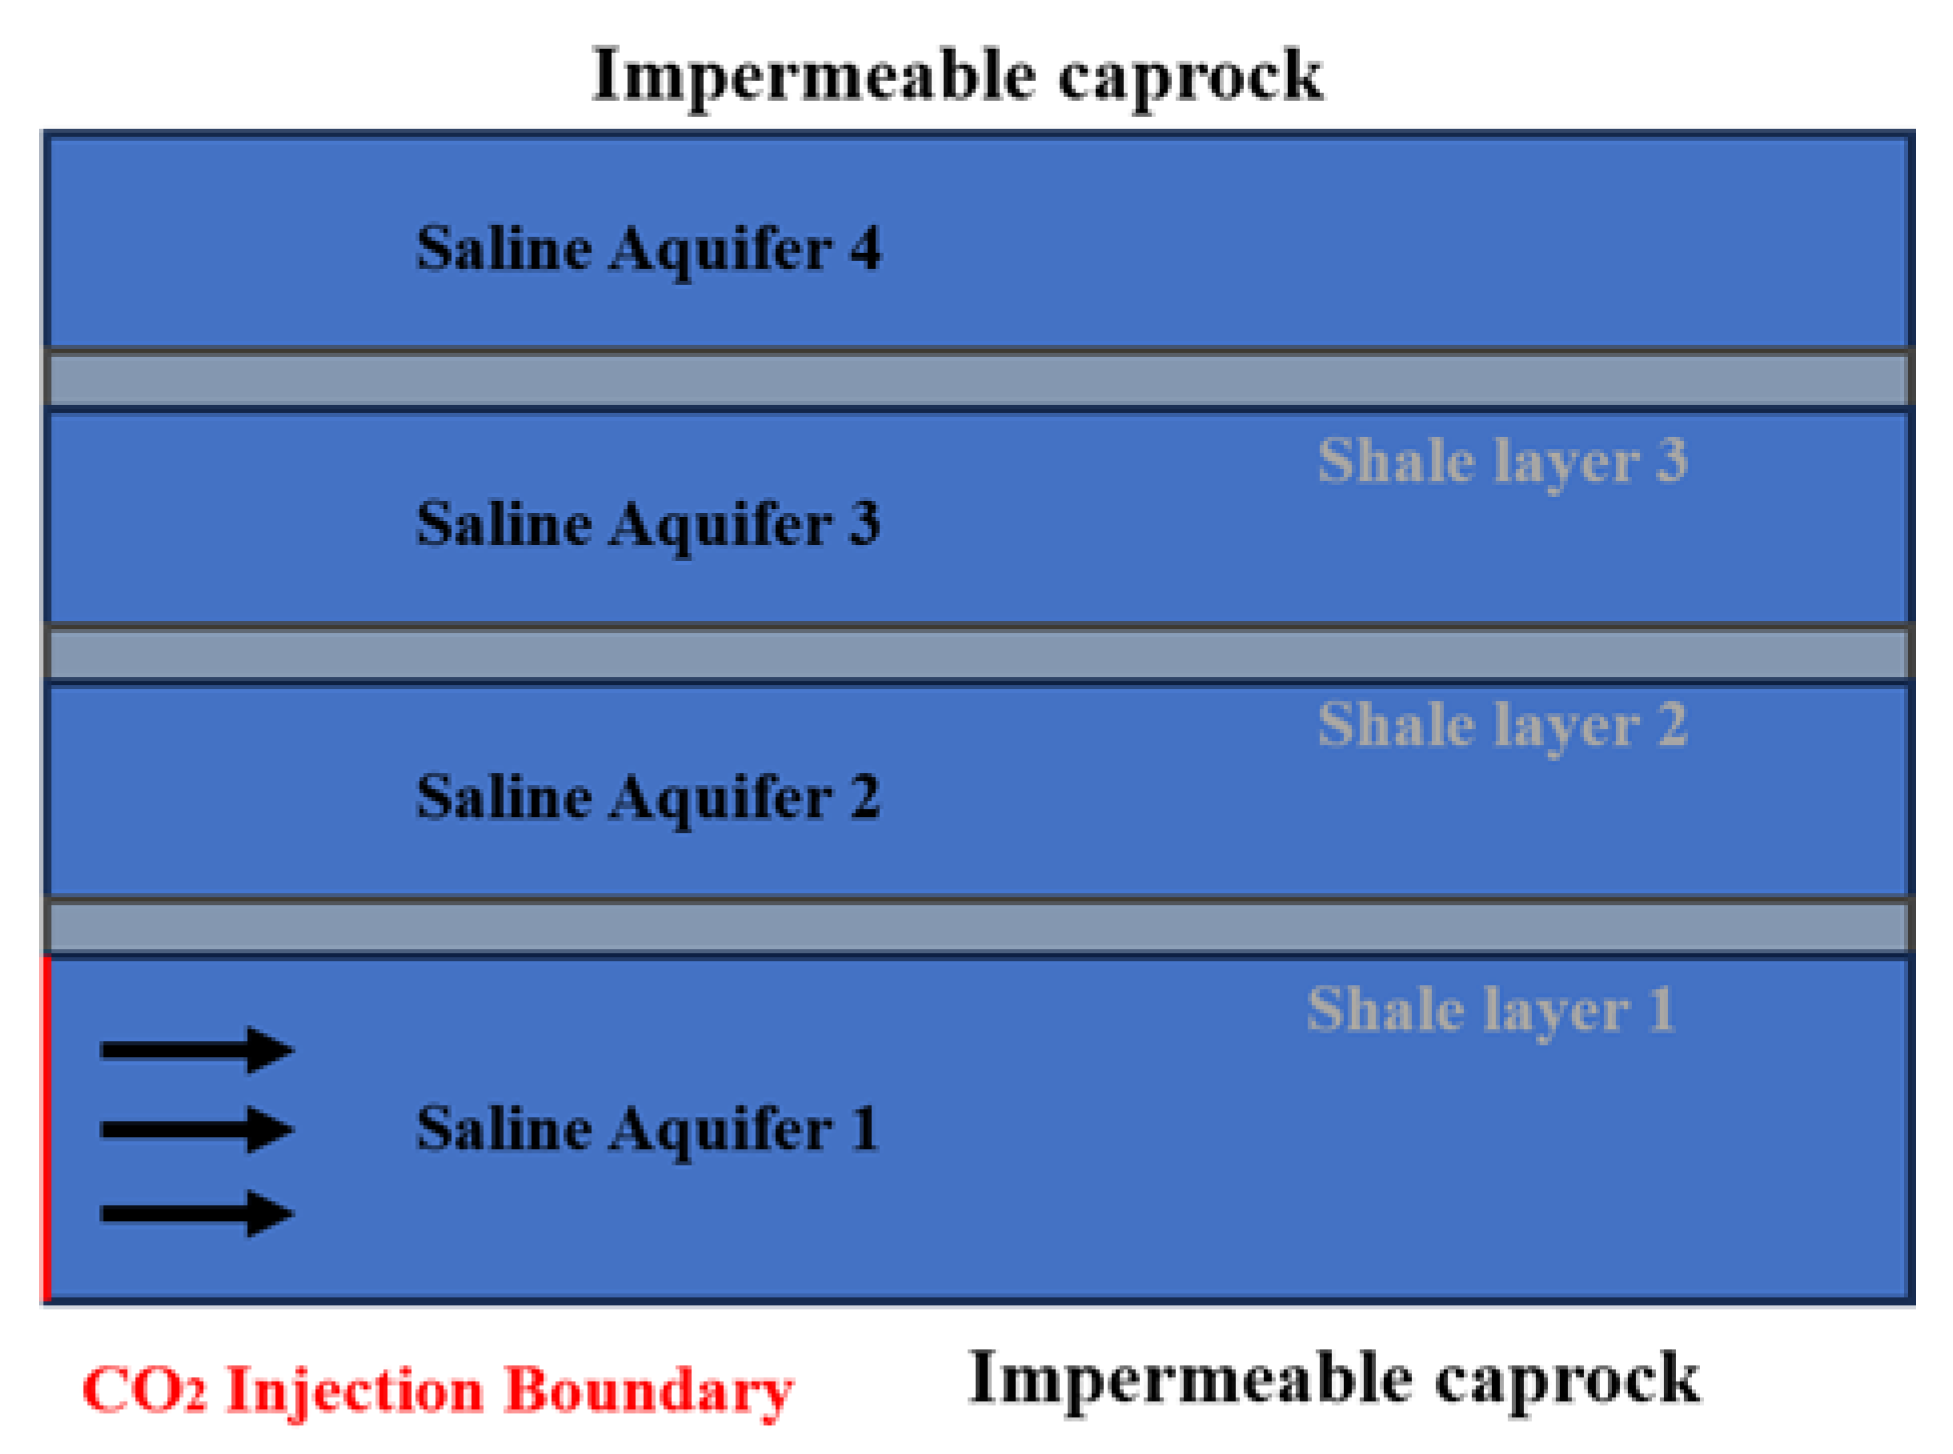
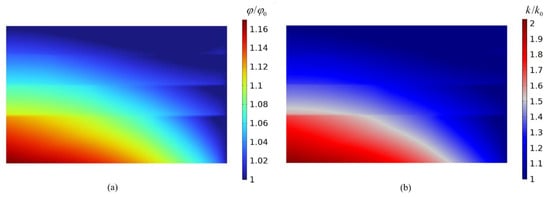
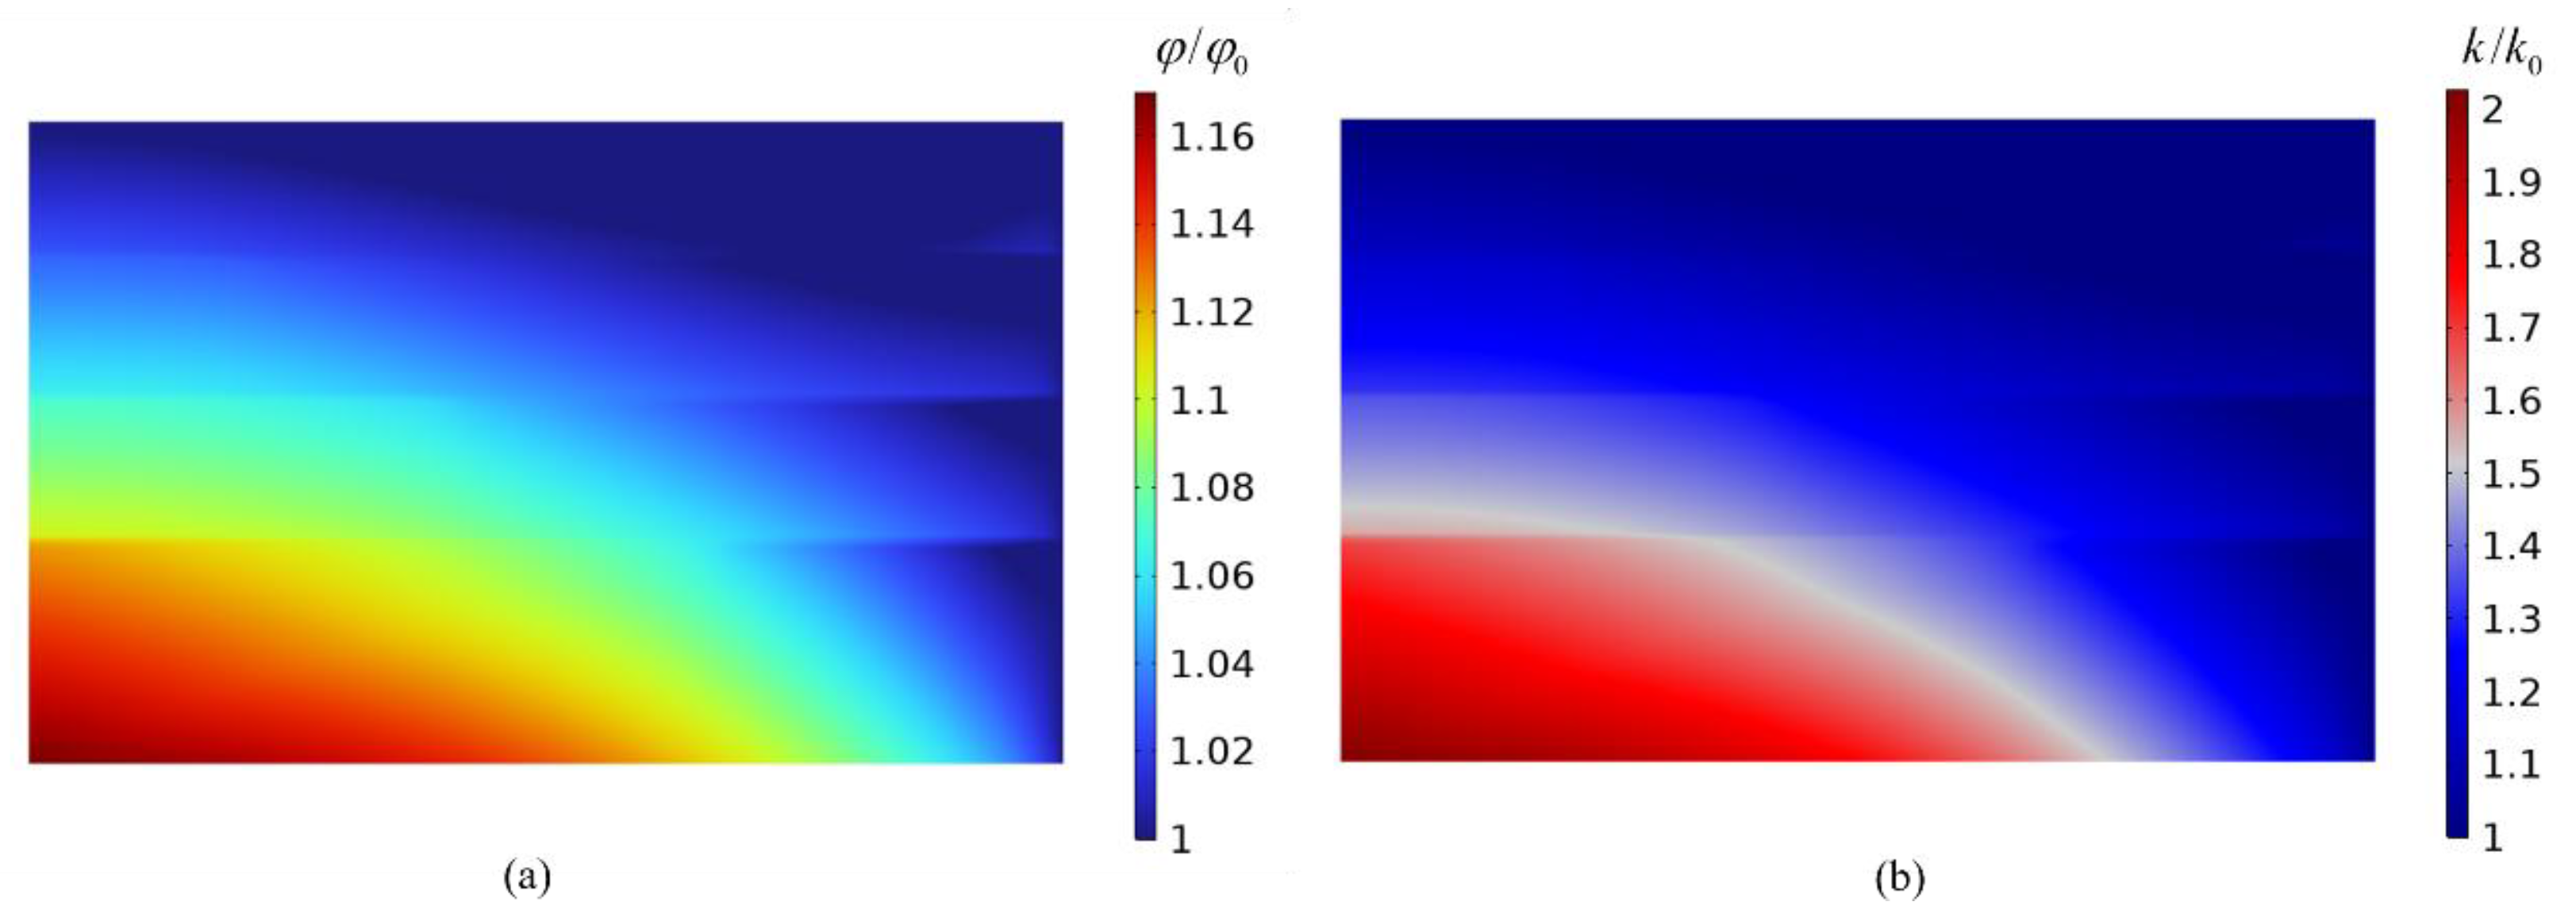
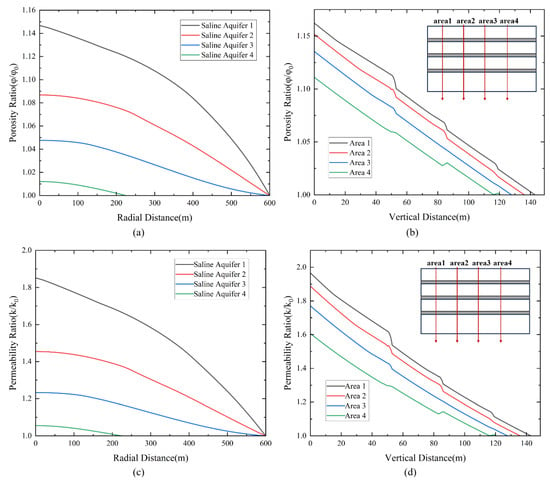
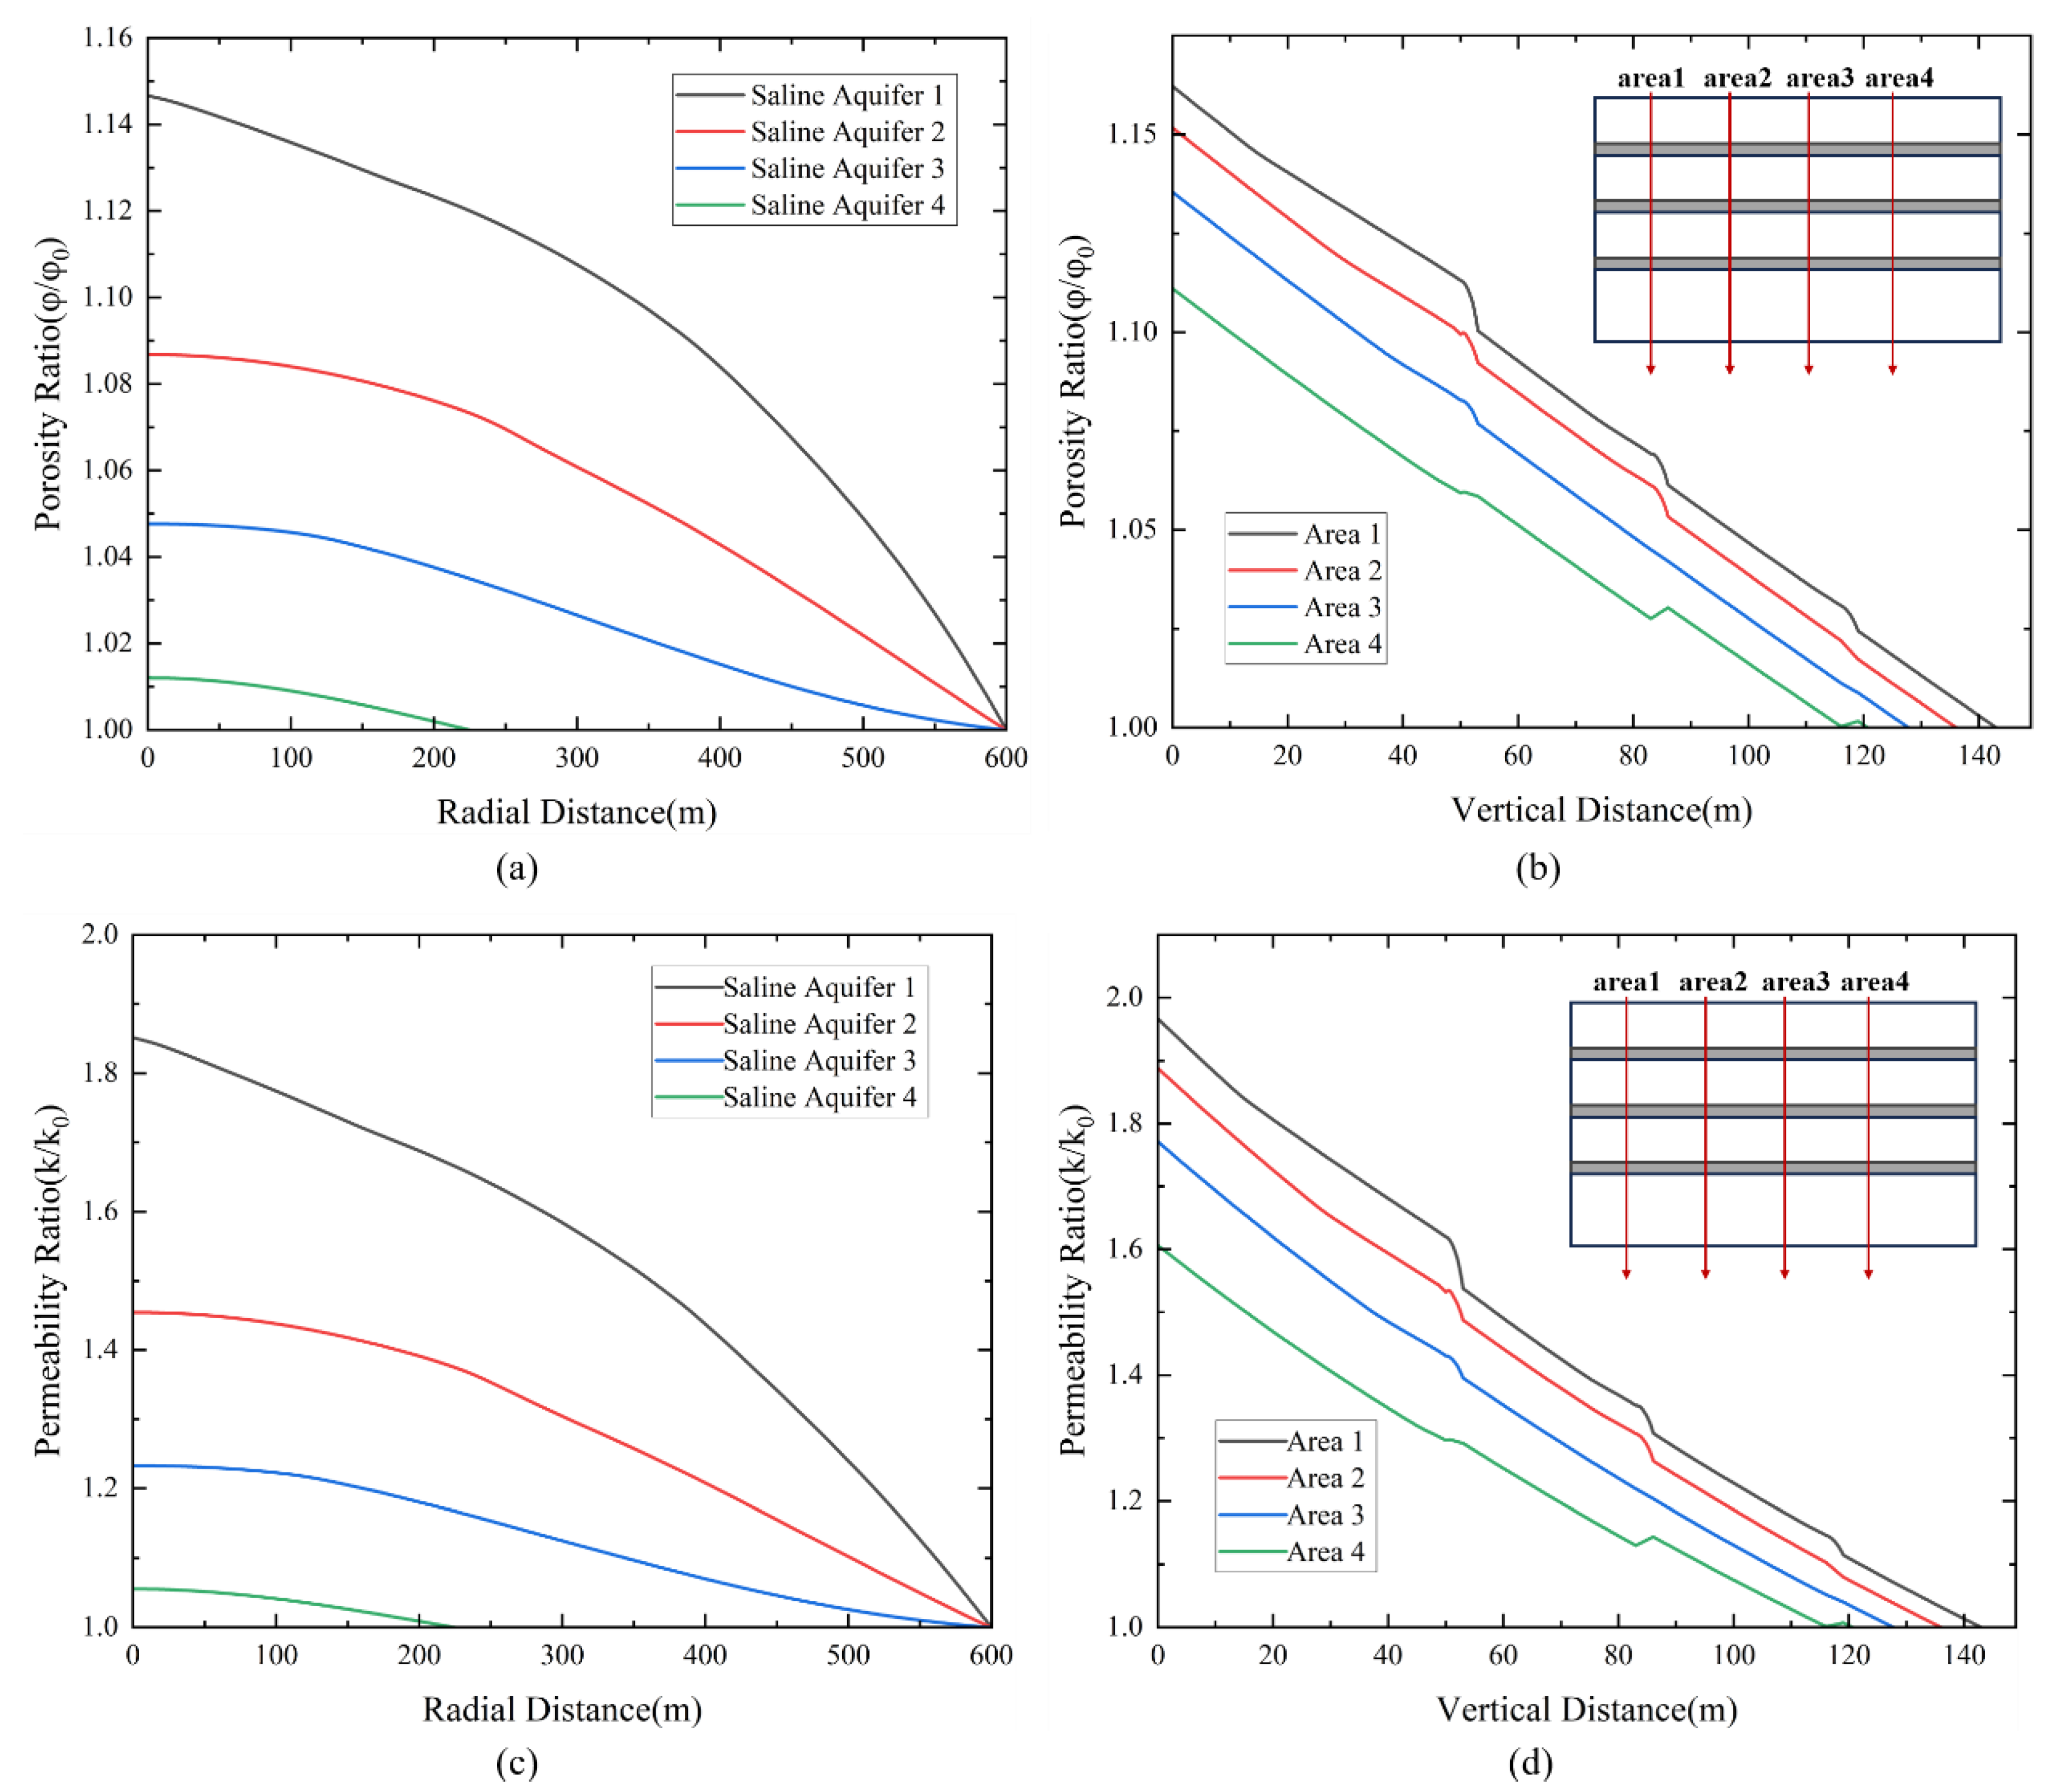
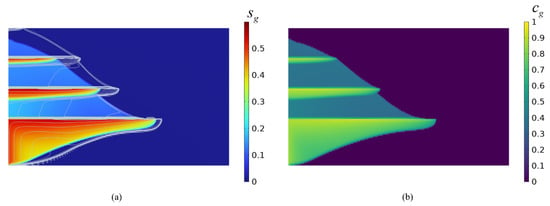
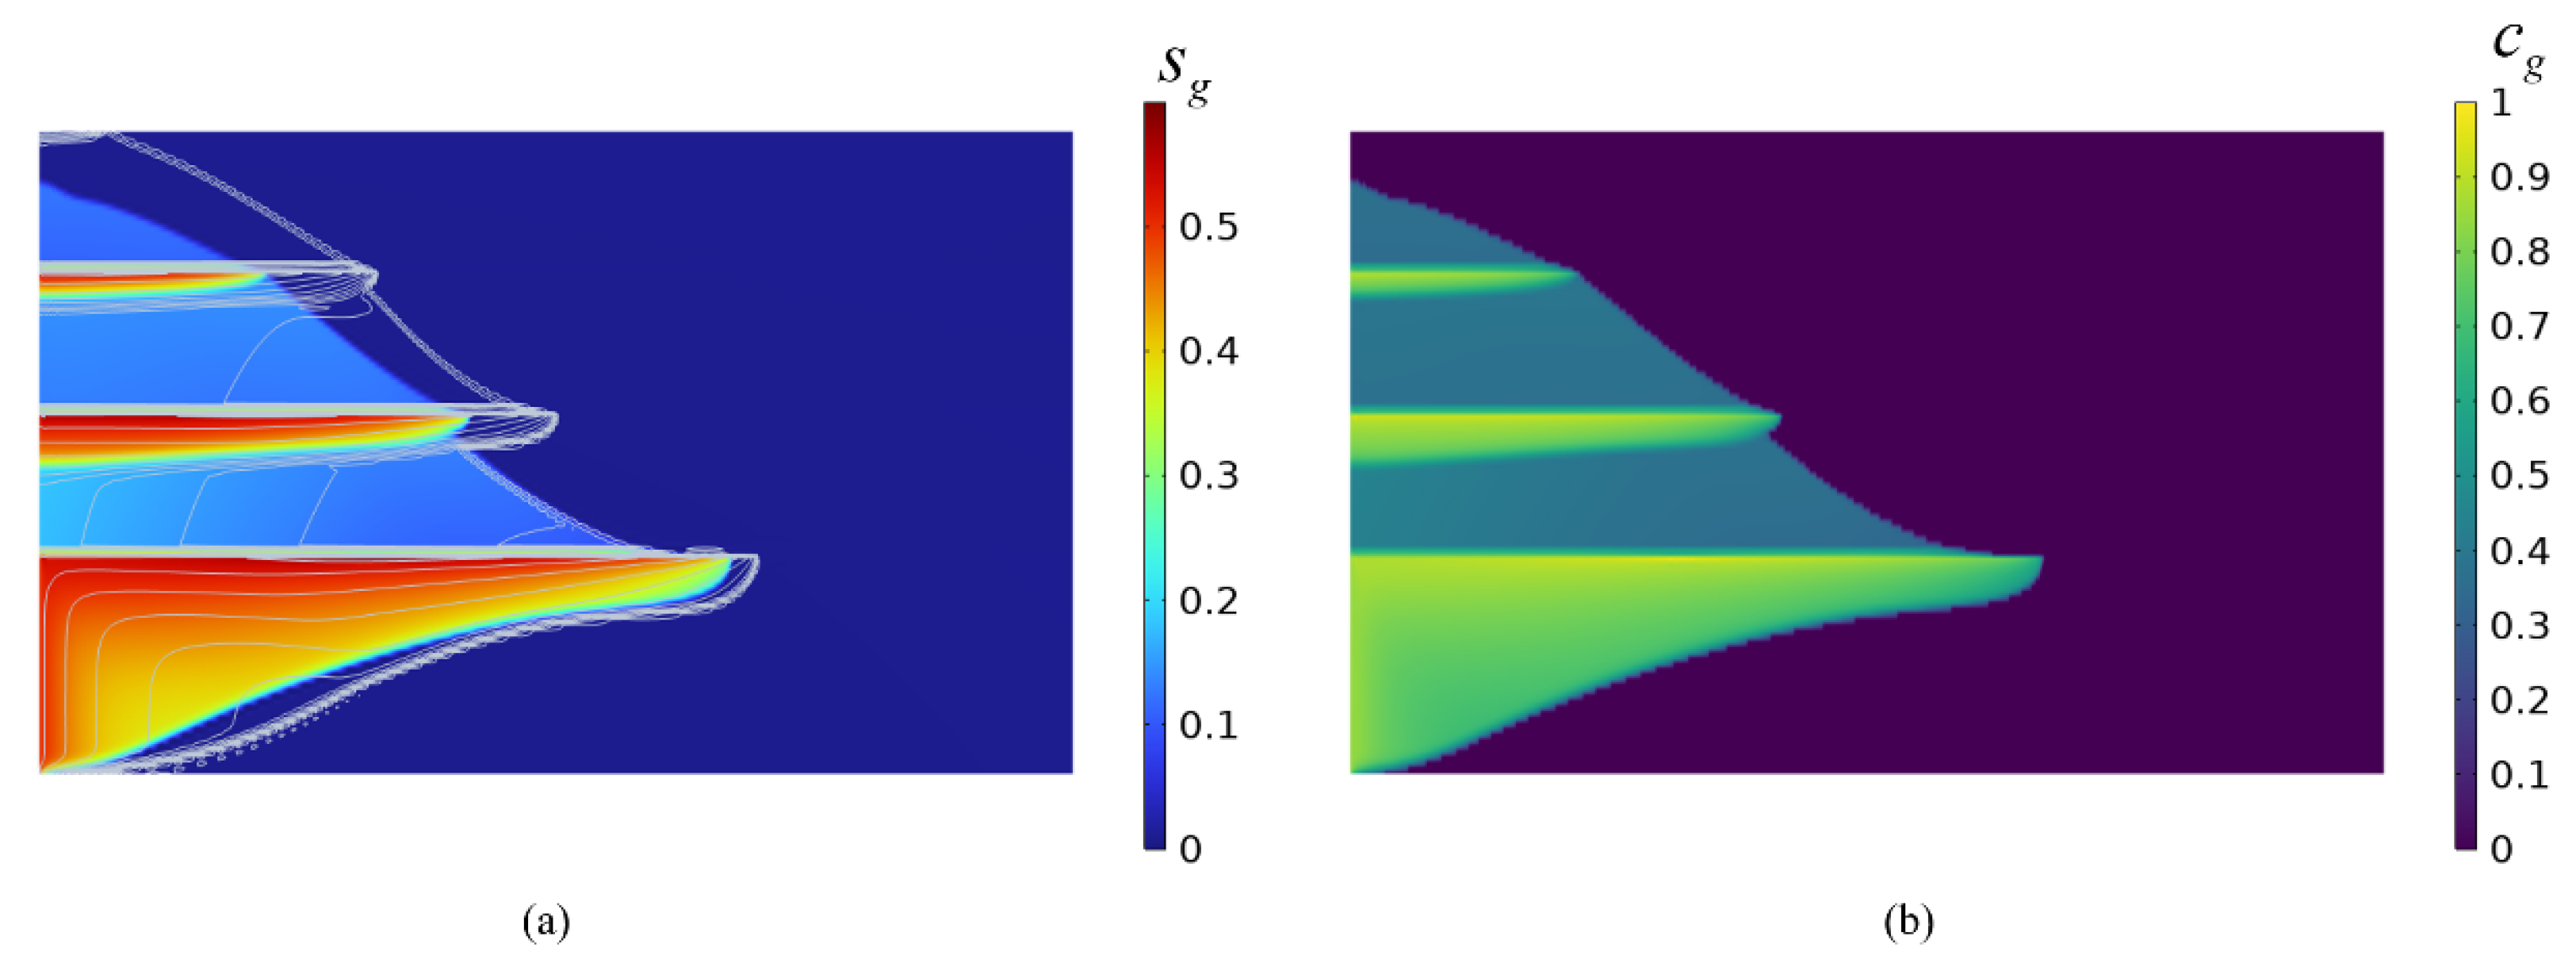
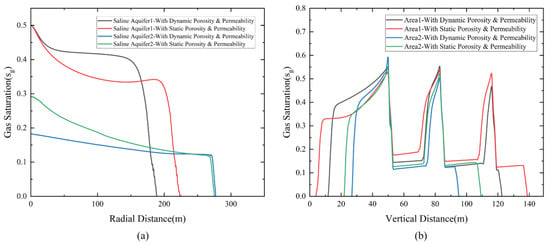
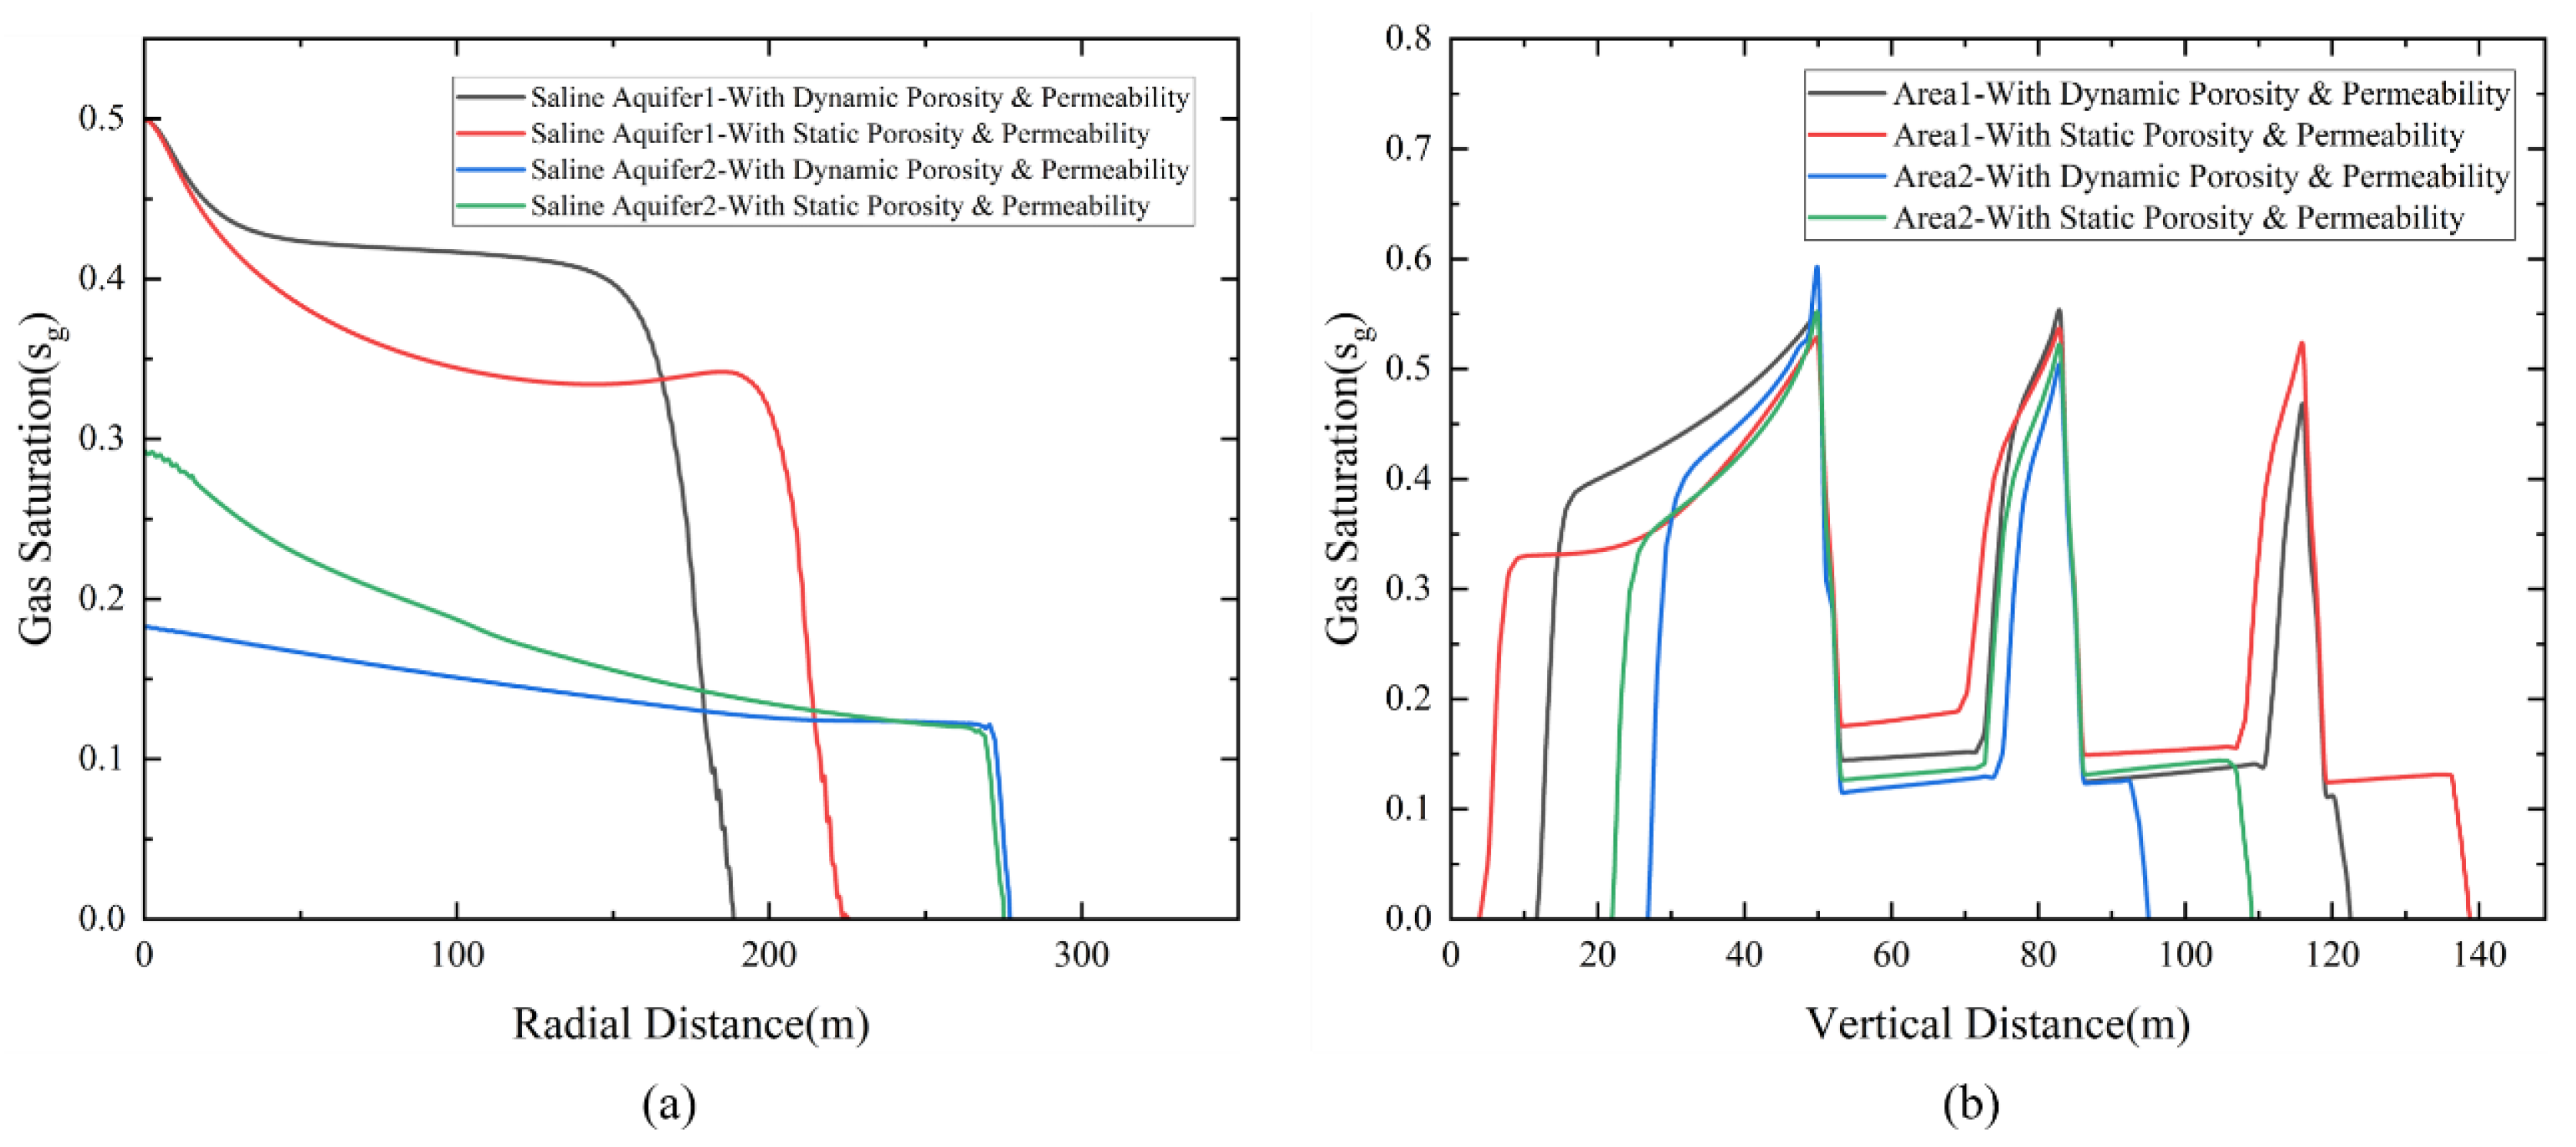
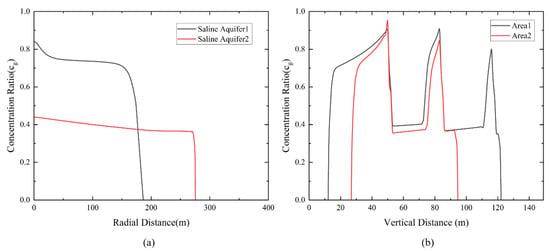
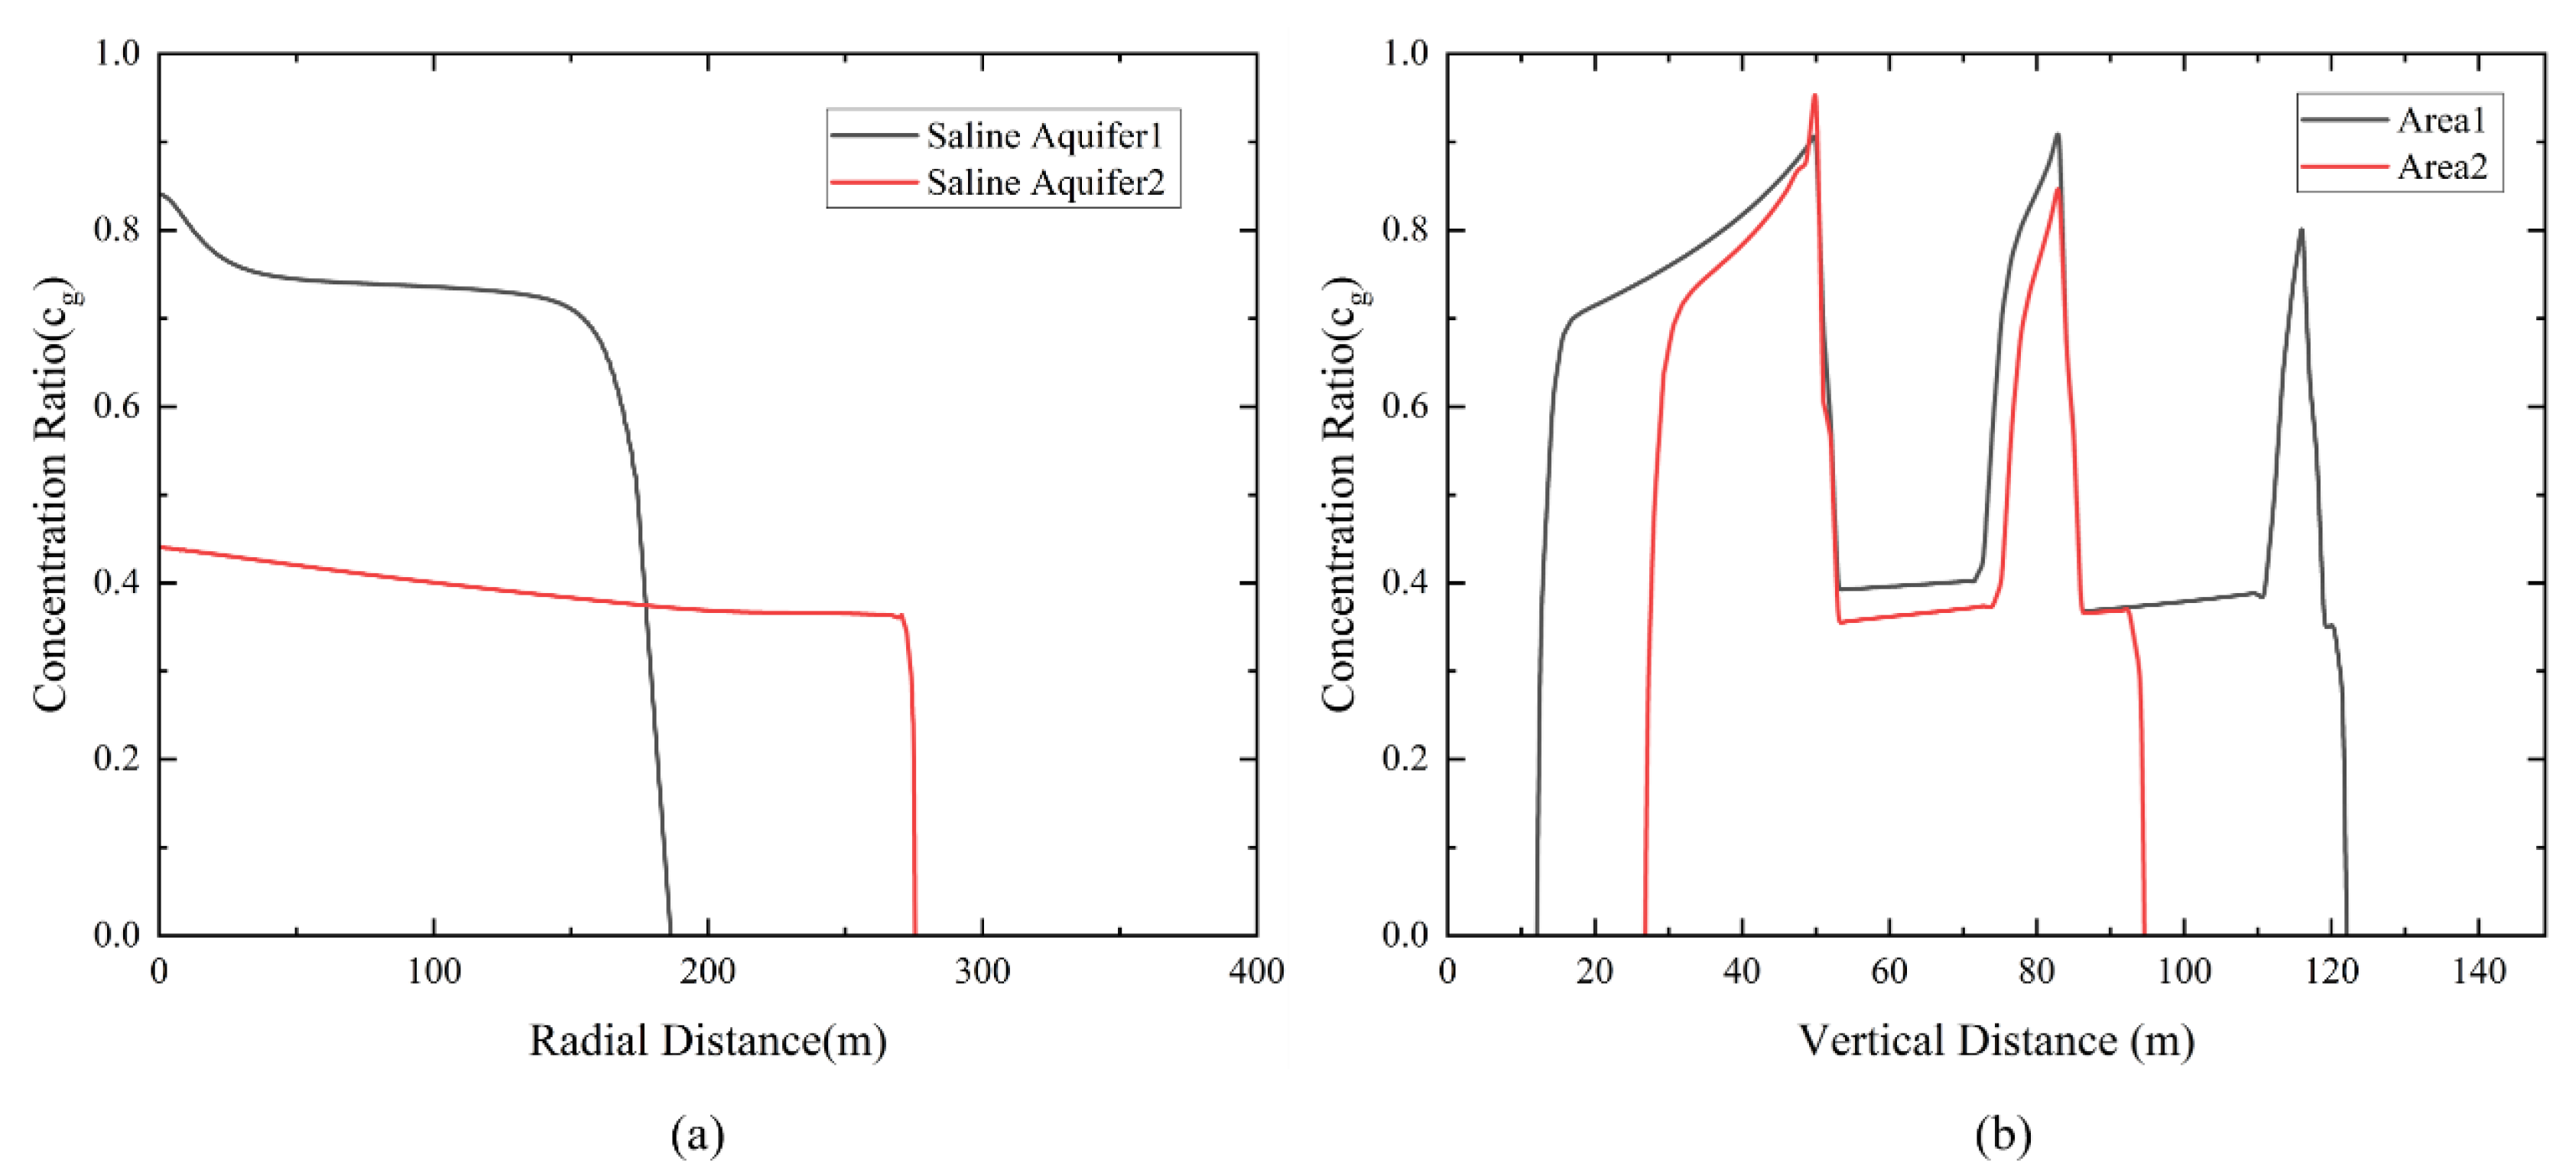

Disclaimer/Publisher’s Note: The statements, opinions and data contained in all publications are solely those of the individual author(s) and contributor(s) and not of MDPI and/or the editor(s). MDPI and/or the editor(s) disclaim responsibility for any injury to people or property resulting from any ideas, methods, instructions or products referred to in the content. |
© 2026 by the authors. Licensee MDPI, Basel, Switzerland. This article is an open access article distributed under the terms and conditions of the Creative Commons Attribution (CC BY) license.