


Abstract
The long-term stability of embankments is directly influenced by the stress paths associated with river water level fluctuations. To investigate the anisotropic characteristics of slope soil in embankments under such drainage-induced gradual loading conditions, a series of drained directional shear tests was conducted on slope soil to investigate the coupled effects of the principal stress direction angle α and the intermediate principal stress coefficient b on its strength, deformation, and non-coaxial characteristics. Results showed that radial strain exhibited minimal sensitivity to variations in the principal stress direction angle α at the constant principal stress coefficient b. The circumferential and axial strain directions demonstrated symmetry. Specimens initially contracted then dilated during shearing. Octahedral shear strain anisotropy was more significant at b = 0.5 and 1 than at b = 0. For a constant α, the normalized strength at b = 0.5 exceeded that at b = 0 and 1. Strength showed significant anisotropy across angles α at a constant b. Specimens exhibited significant non-coaxial behavior under axial-torsional shear loading. This study offers theoretical insight into embankment slope behavior under anisotropic stress paths.
1. Introduction
As a vital component of flood defense systems, embankments play a crucial role in safeguarding coastal regions [1]. As the river water level gradually recedes, the load on the embankment soil is altered, resulting in a complex stress path characterized by changes in both the direction and relative magnitude of the principal stresses [2]. The decline in water level induces significant changes in soil behavior, leading to a gradual shift in the ratio of vertical to horizontal effective stresses. This causes a change in the principal stress direction. Furthermore, it modifies the effects of lateral confinement and Poisson’s ratio within the soil mass, resulting in an evolution of the lateral pressure coefficient. Consequently, the relative magnitudes of the three principal stresses are affected, meaning the intermediate principal stress coefficient undergoes corresponding changes. Particular attention must be paid to the slope soils forming the embankment body, as their mechanical behavior is highly sensitive to water level changes [3]. Given the slow rate of these fluctuations, the soil response aligns with drained shear conditions [4]. Tests under constant confining pressure are employed to simulate the mechanical behavior of soil and to investigate how complex stress history governs its strength and deformation characteristics.
A comprehensive understanding of the mechanical behavior of slope soil under drained shear conditions is therefore essential for preventing failures during construction and maintenance. To investigate the mechanical properties of silty soils, Yang et al. [5], Marzuni et al. [6], Estabragh and Javadi [7], and Tang et al. [8] conducted triaxial tests under various conditions, systematically revealing the stress–strain relationships and strength properties. However, such conventional triaxial tests have inherent limitations in simulating complex stress paths [9,10], such as principal stress rotation, leading to an incomplete characterization of soil deformation and strength. In contrast, the hollow cylinder apparatus (HCA) overcomes these limitations and enables a more comprehensive investigation of soil anisotropy.
Directional shear tests on sandy and clayey soils have demonstrated that both the principal stress direction and the intermediate principal stress jointly govern the mechanical behavior of soil. Miura et al. [11] conducted a series of rotational and directional shear tests on dense anisotropic sand and revealed that the shear deformation mechanisms and volumetric responses of the specimens were significantly influenced by directional shear conditions. Similarly, Jafarzadeh and Zamanian [12] and Xiong et al. [13] performed directional shear tests on Toyoura standard sand under varying principal stress directions and concluded that the stress–strain relationship and failure strength depend on angle α. Rodriguez and Lade [14] carried out directional shear tests on fine Nevada sand and observed notable deviations between the directions of principal strain increments and principal stress, providing direct evidence of non-coaxial soil behavior. Cai et al. [15] conducted directional shear tests under drained conditions on UK Portaway sand and concluded that inherent anisotropy developed during sand deposition induces significant strength variations with principal stress direction. Experimental investigations by Yu et al. [16] involving Nanjing-sourced mica sand subjected to directional shear testing demonstrated that the strength parameters display pronounced sensitivity to variations in the rotation of the angle α and the b-value, with concurrent development of anisotropic strain responses. Shen et al. [17] conducted directional shear tests on soft clay and concluded that the b-value and angle α were the main factors affecting the strength properties of the soil. Non-coaxial characteristic, inherent anisotropy, and shear stress level effects were investigated through directional and rotational shear tests on both undisturbed and remolded clay by Zhou et al. [18].
Existing research has established that the deformation, strength evolution, and anisotropic characteristics of soils under directional shear are critically governed by the interplay between the angle α and b-value. However, most of these studies have focused on sand and clay. Compared to typical sand and clay, the slope soil investigated in this study exhibits finer particles, greater particle sphericity, and physicomechanical properties intermediate between them [19].
Based on this, drained directional shear tests were conducted on slope soil under different angles α and b-values with a hollow cylinder apparatus (HCA) in this paper. This work systematically quantifies the evolution of strain components, three-dimensional strain relationships, octahedral stress–strain response, strength anisotropy, and non-coaxial behavior. Thereby, it provides essential experimental data for developing and validating anisotropic constitutive models that account for complex stress paths. It enables a more accurate assessment of anisotropic characteristics under drained conditions, such as gradual water level fluctuations, providing a scientific basis for mechanism-based disaster mitigation.
2. Research Schemes
2.1. Testing Apparatus and Parameters
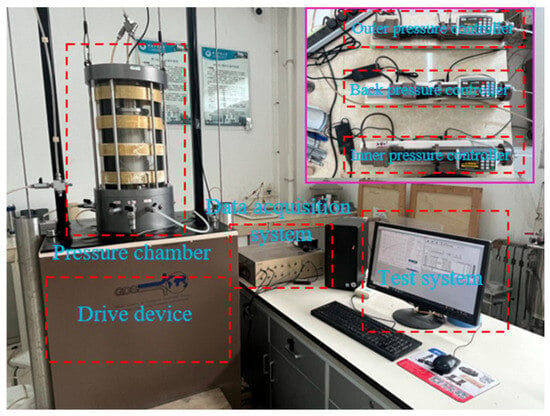
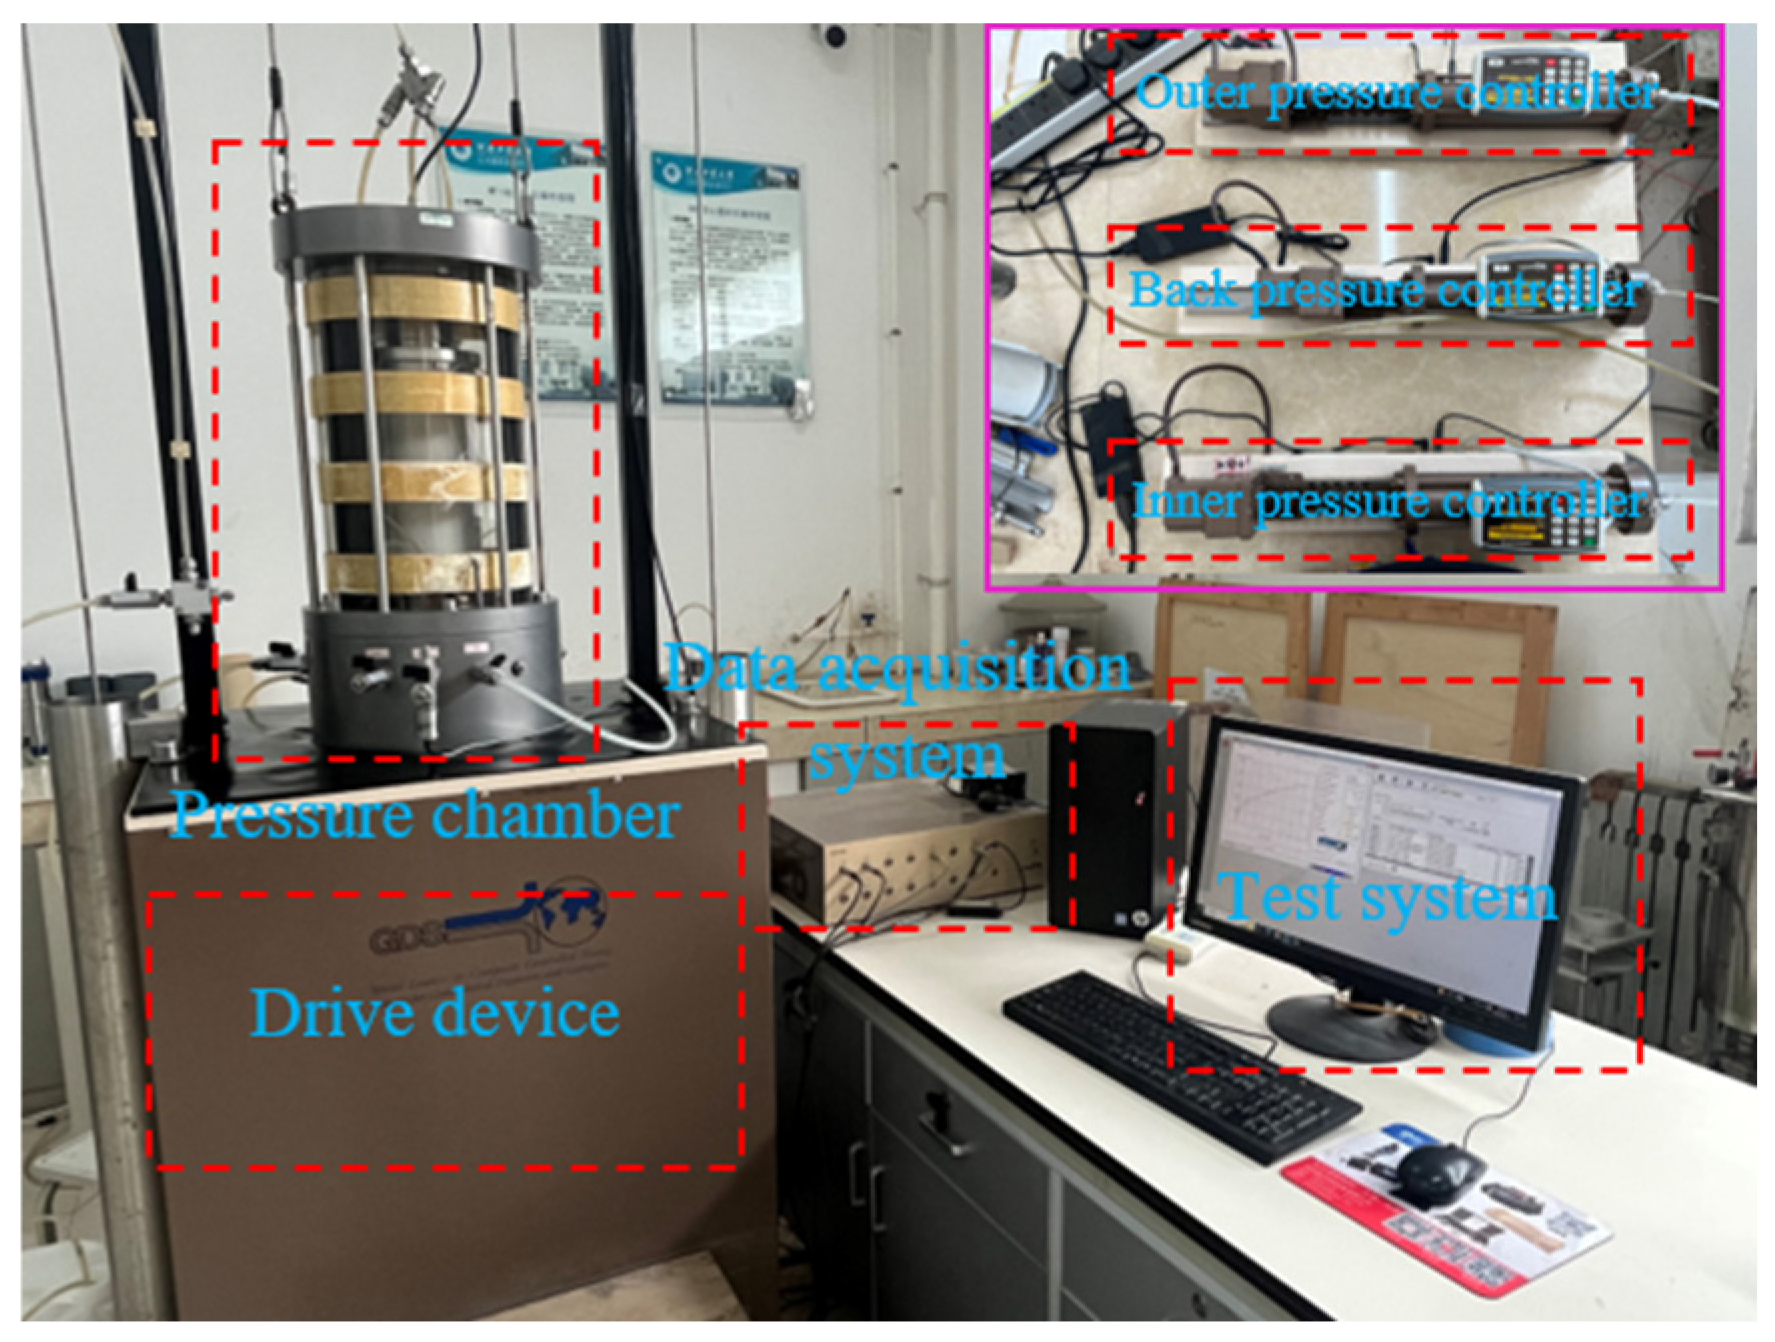
This research employed a GDS hollow cylinder apparatus (Global Digital Systems, Ltd., London, UK) (see Figure 1) to perform directional shear tests. The system integrates five core modules: (1) pressure chamber, (2) axial and torsional drive devices, (3) inner and outer pressure controllers, (4) back pressure controller, and (5) test system. Crucially, the apparatus enables decoupled control of axial load, torque, and differential cell pressures, while providing direct acquisition of specimen axial displacement and rotation angle.
Figure 1.
GDS hollow cylinder apparatus (HCA).
The HCA system can apply an axial load of ±15 kN, a dynamic torque of ±30 N·m, inner and outer cell pressures of ±1 MPa, a counter-pressure of ±1 MPa, and can accommodate an axial displacement of ±50 mm.
The stress path module of the HCA system was employed, enabling controlled stress path testing through the independent adjustment of four parameters: mean stress p, deviator stress q, intermediate principal stress coefficient b, and principal stress direction angle α. The physical meaning of the symbols in the preceding equations is as follows: axial stress σz, circumferential stress σθ, shear stress τzθ, major principal stress σ1, intermediate principal stress σ2, and minor principal stress σ3. The key experimental parameters are defined as follows [20]:
2.2. Specimen Preparation
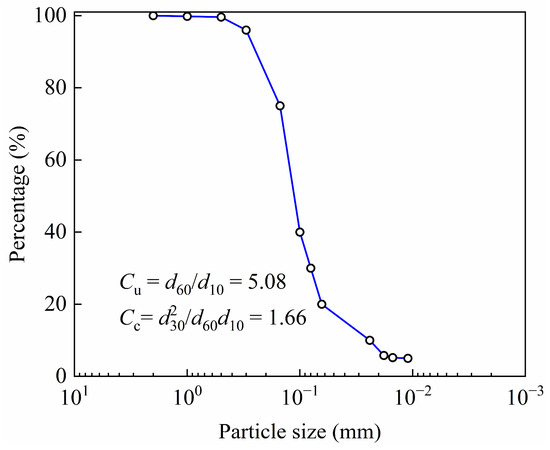
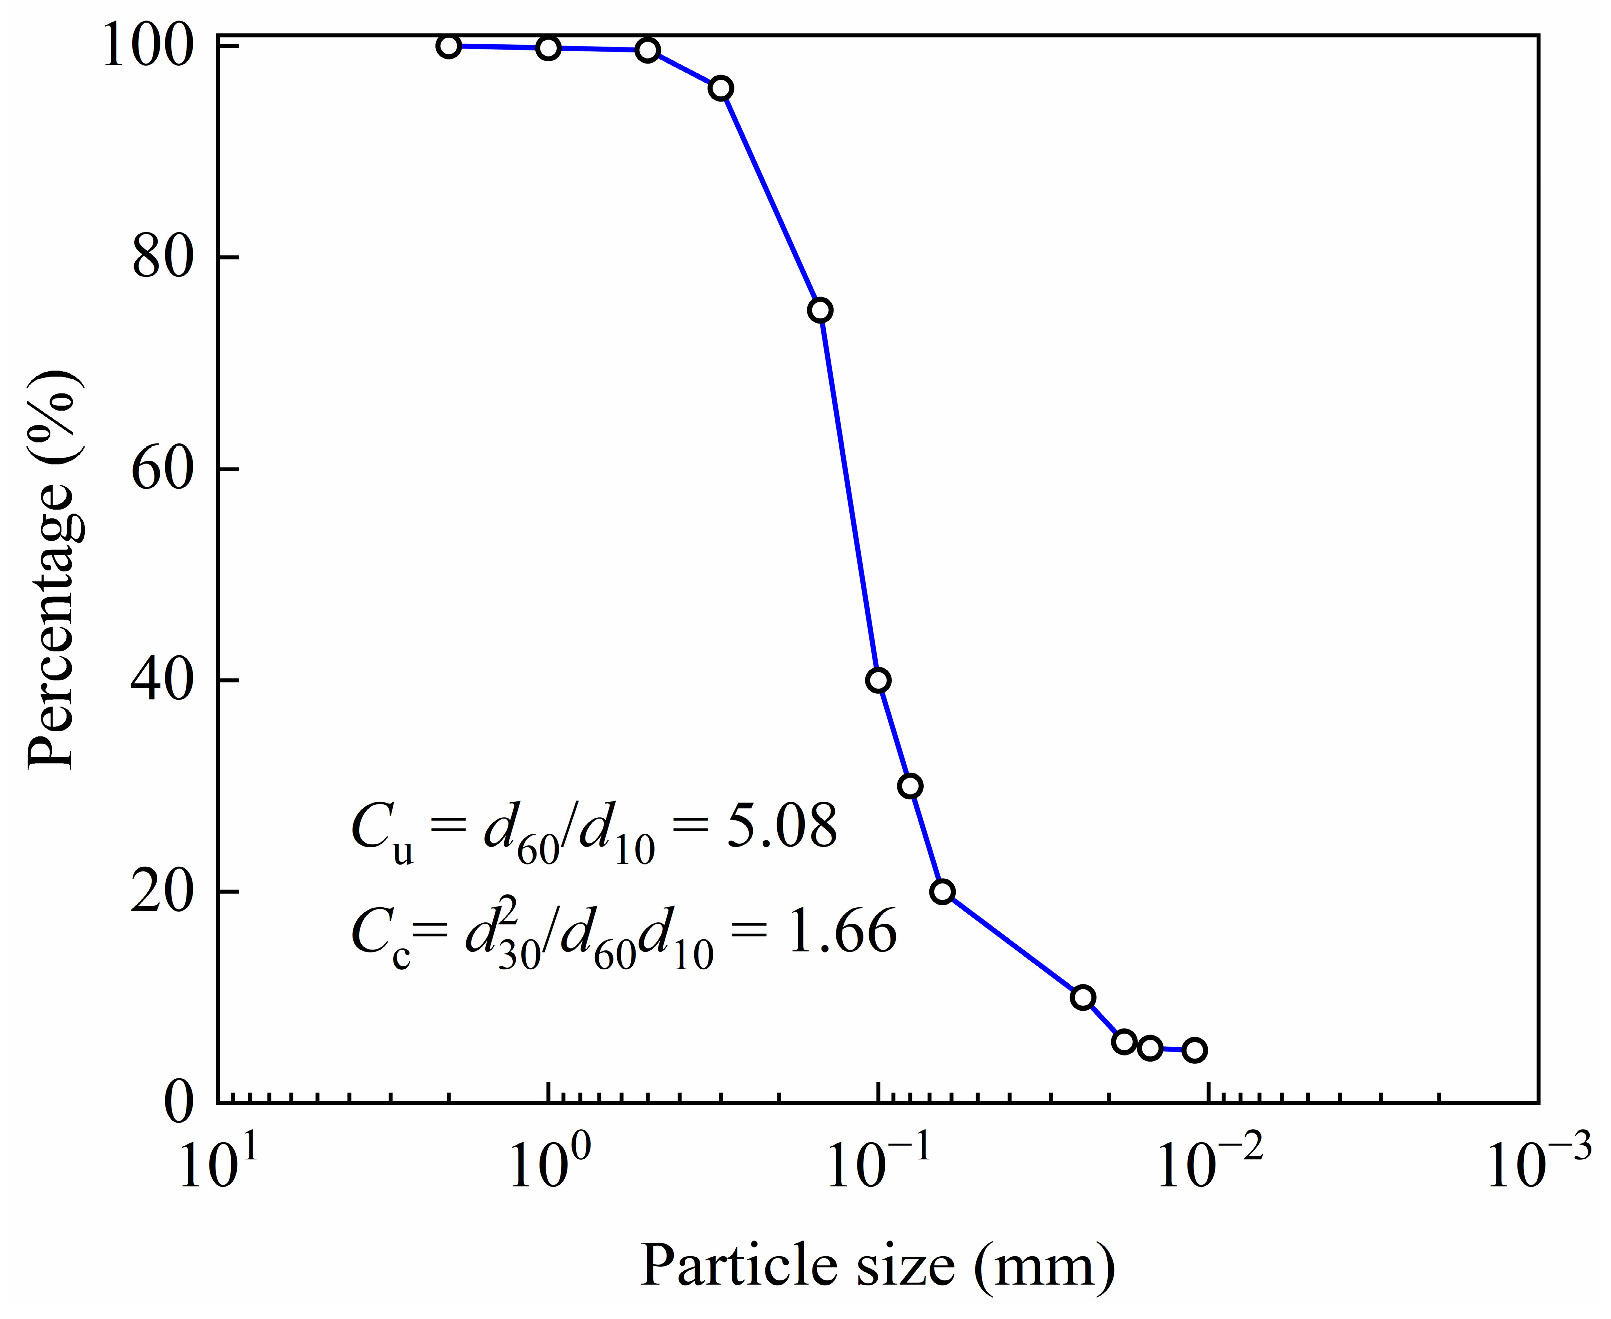
The soil samples were obtained from a shallow embankment in China. Soil samples were collected from the slope, then air-dried and sieved through a 2 mm mesh to remove impurities. The soil is classified as SM (silty sand) according to the Unified Soil Classification System (USCS). The basic physical properties of slope soil investigated in this study, as obtained through standard laboratory procedures, are presented in Table 1. The tested material was characterized by the following parameters: uniformity coefficient Cu, curvature coefficient Cc, maximum dry density ρdmax, minimum dry density ρdmin, liquid limit wL, plastic limit wP, and plasticity index IP, which were measured as 5.08, 1.662, 1.650 g∙cm−3, 1.357 g∙cm−3, 23.8%, 12.4%, and 11.4, respectively. Specific gravity Gs was measured as 2.7. Additionally, the particle size distribution of slope soil is illustrated in Figure 2.
Table 1.
Basic physical properties of slope soil.
Figure 2.
Particle size distribution of slope soil.
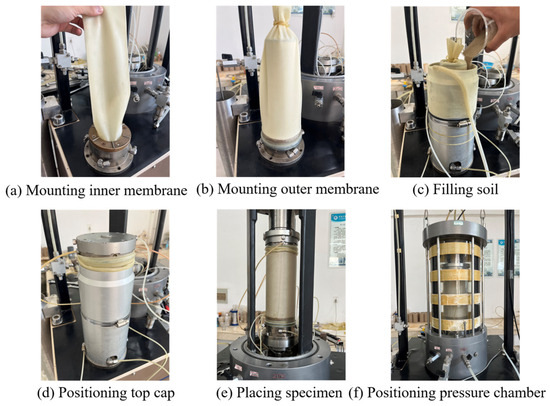
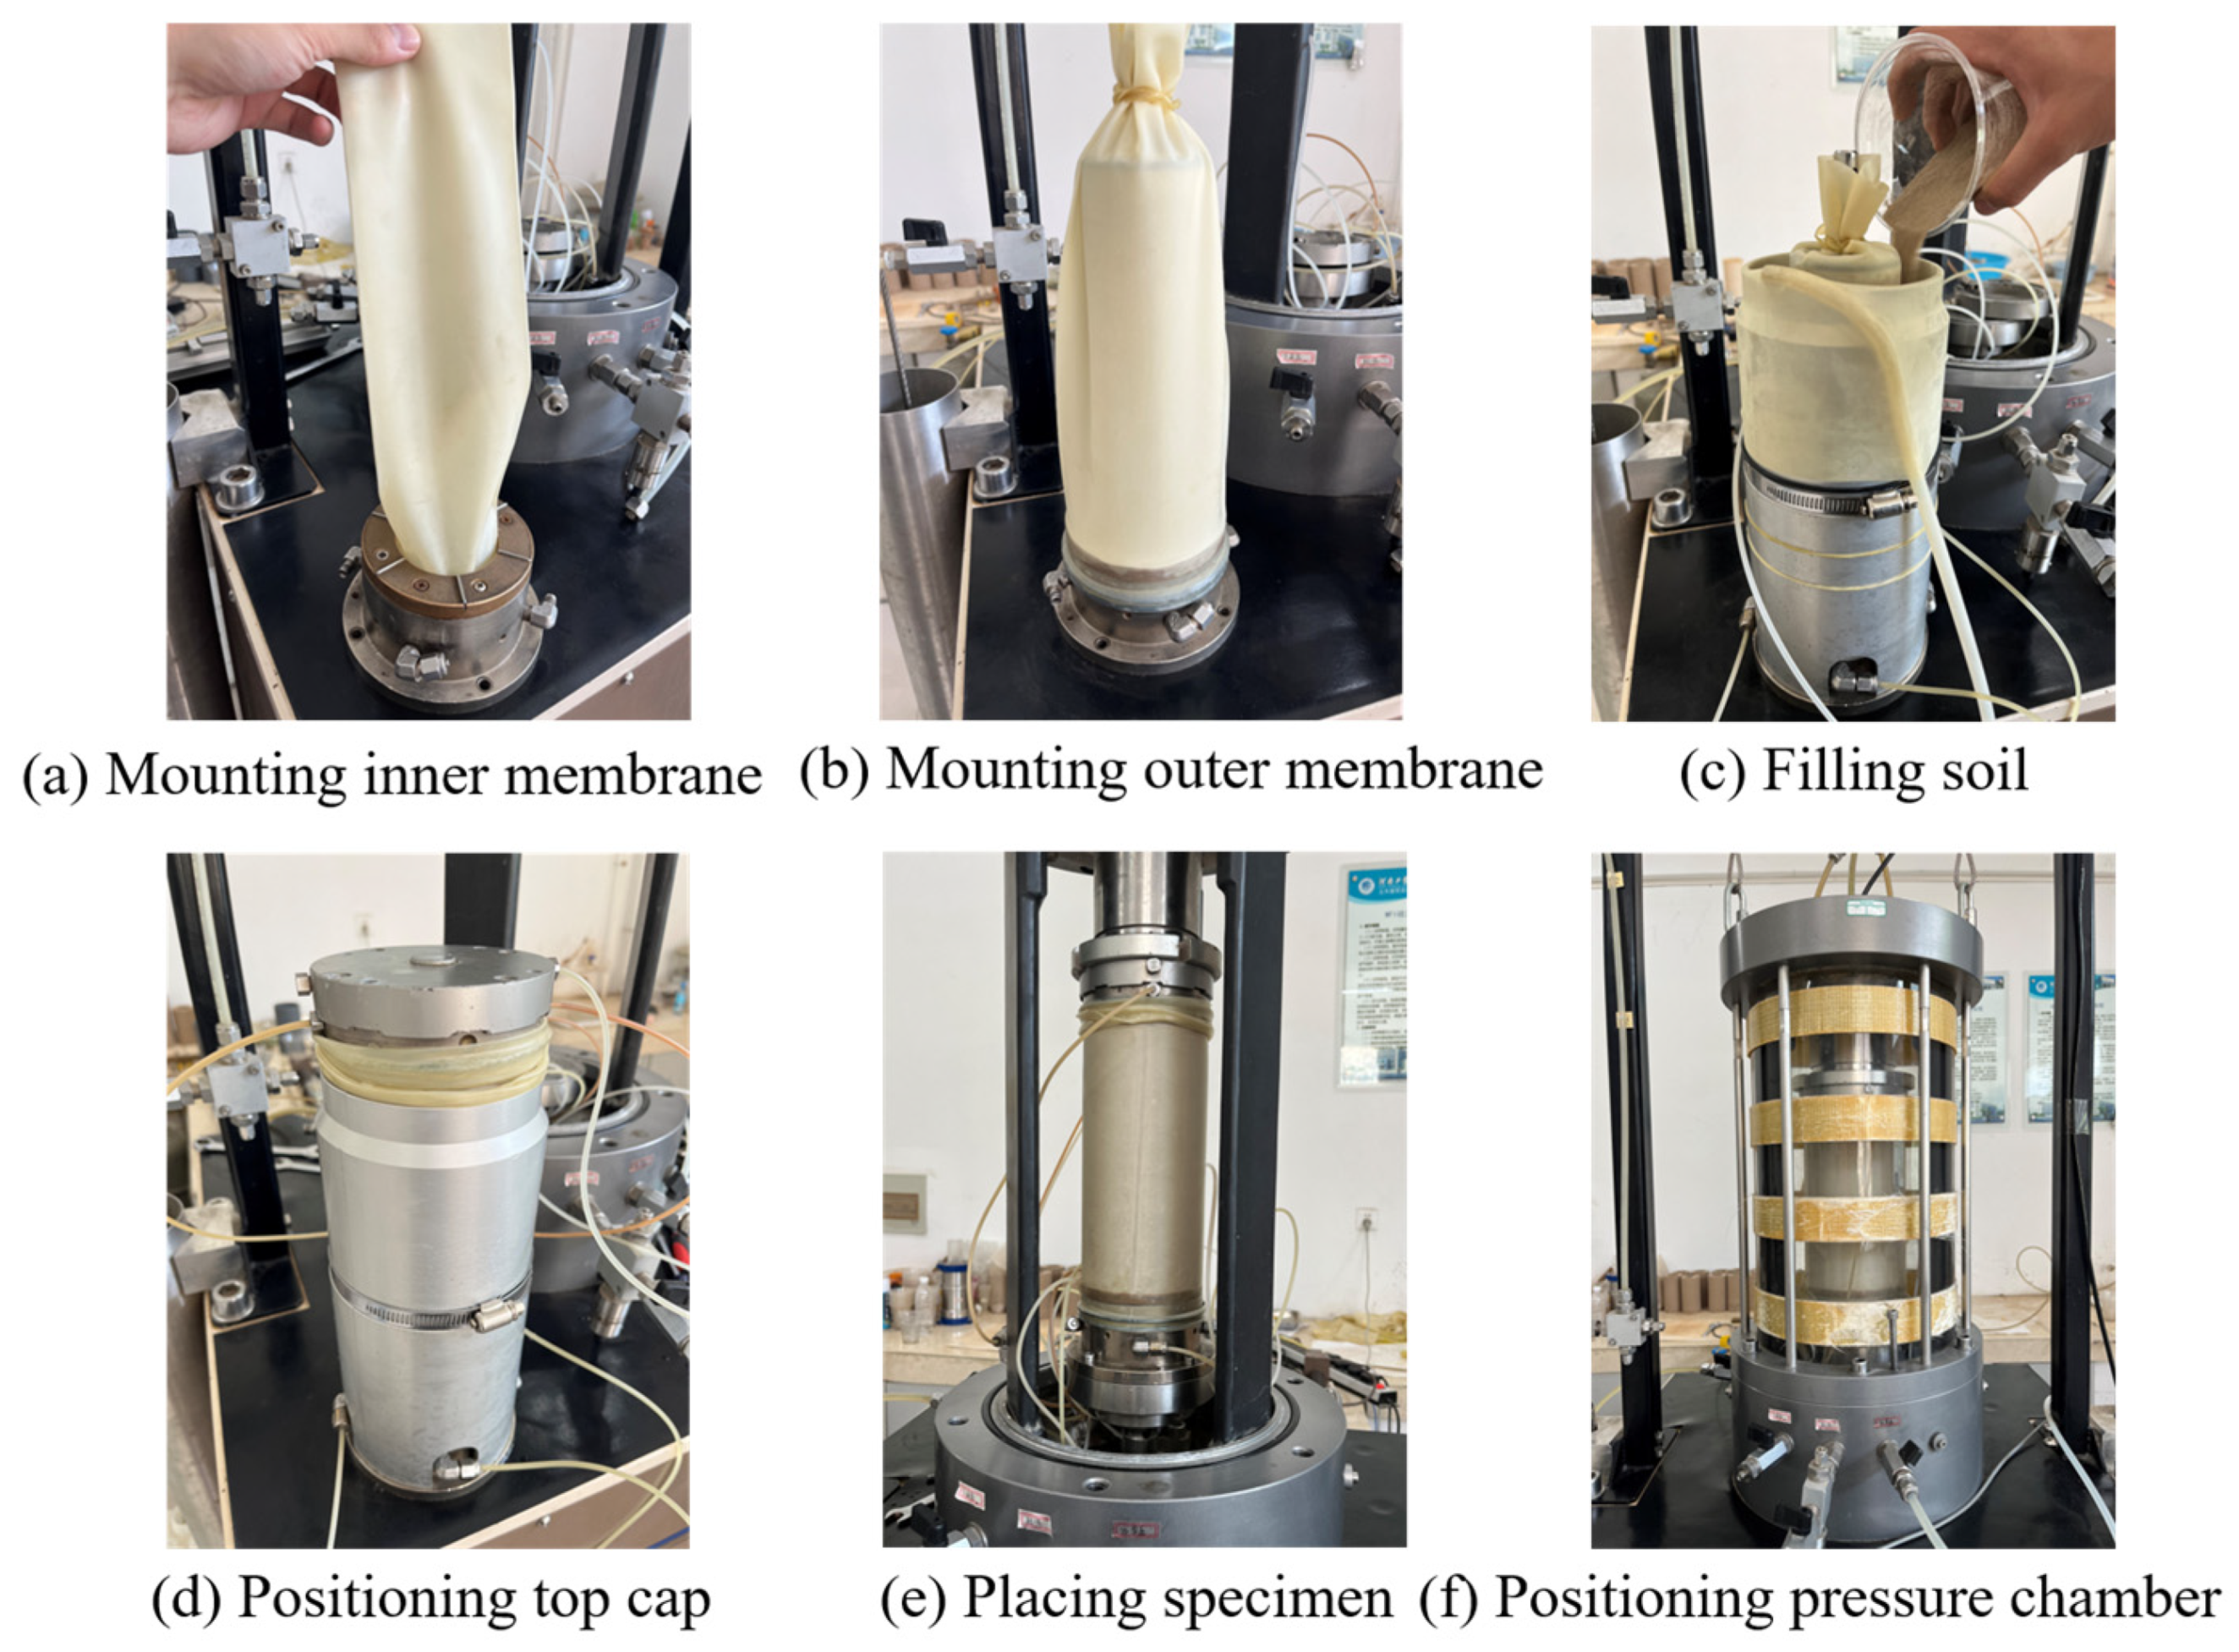
The hollow cylinder specimen was prepared following these steps: mounting the inner membrane; mounting the outer membrane; filling the mold with the soil; positioning the top cap; placing the specimen in the apparatus; and filling the pressure chamber with water. The required slope soil was first sieved through a 2 mm sieve to remove the impurities. Ten 148.85 g portions were prepared, obtaining approximately 1488.5 g of dried soil specimen. Using the layered compaction method, soil was incrementally placed into a three-split membrane, compacted to achieve 20 mm layer thickness, followed by surface trimming. Finally, a hollow cylinder specimen of slope soil was prepared with a relative density of 50%, the size of which was 200 mm × 100 mm × 60 mm (height × outer radius × inner radius), as presented in Figure 3e. This study employed laboratory-remolded specimens, which possess a fabric inherently distinct from that of natural in situ slope soils. Natural soils, by contrast, typically possess cementation, complex stress history, and a more complex anisotropic fabric.
Figure 3.
The preparation process of hollow cylinder specimen.
Following the preparation of the specimen, it was mounted onto the base of the apparatus. To ensure stability during the removal of the membrane, a confining vacuum pressure of 15 kPa was applied. Following installation, the pressure chamber was saturated with water. Thereafter, the inner and outer cell pressures were simultaneously increased to a value of 25 kPa, while vacuum pressure was concurrently released prior to the saturation and consolidation phases. The saturation of slope soil specimens mainly included CO2 saturation, water saturation and back-pressure saturation. CO2 saturation: Upon completion of specimen preparation, CO2 was introduced into the specimen and base via the pore pressure line to facilitate the removal of air. The upper back-pressure valve was connected to a reservoir of saturated limewater through flexible tubing. Water saturation: Distilled water was circulated through the specimen to expel CO2 and achieve full water saturation, until entire system was filled with water. Back-pressure saturation: The specimens underwent back-pressure saturation through incremental back-pressure application for 6–8 h. To verify complete saturation of the specimens, a B-value exceeding 0.95 was employed as the criterion.
Following saturation, the specimens underwent isotropic consolidation using the dedicated loading system of the HCA, with consolidation considered complete when the back-pressure drainage rate was less than 0.1 cm3/h.
2.3. Test Schemes
Drained directional shear tests were carried out on slope soil specimens. Prior to shearing, each specimen was isotropically consolidated under a confining pressure of 40 kPa. Subsequently, the angle α was adjusted to the target value, and both the angle α and the b-value were held constant throughout the shearing phase. Failure was induced by applying stress-controlled loading at a deviator stress q rate of 5 kPa/min. The effects of the angle α and b-value on deformation behavior, strength characteristics, and non-coaxial response were investigated in the experiments, as shown in Table 2, and fifteen sets of specimens were tested in this study.
Table 2.
Directional shear test of slope soil.
3. Test Results and Analysis
3.1. Evolution of Strain Components
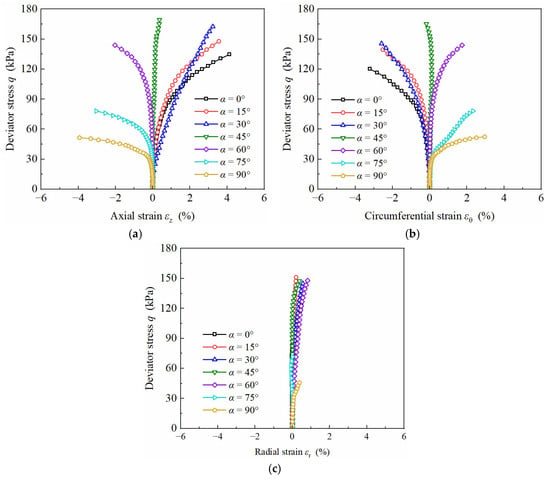
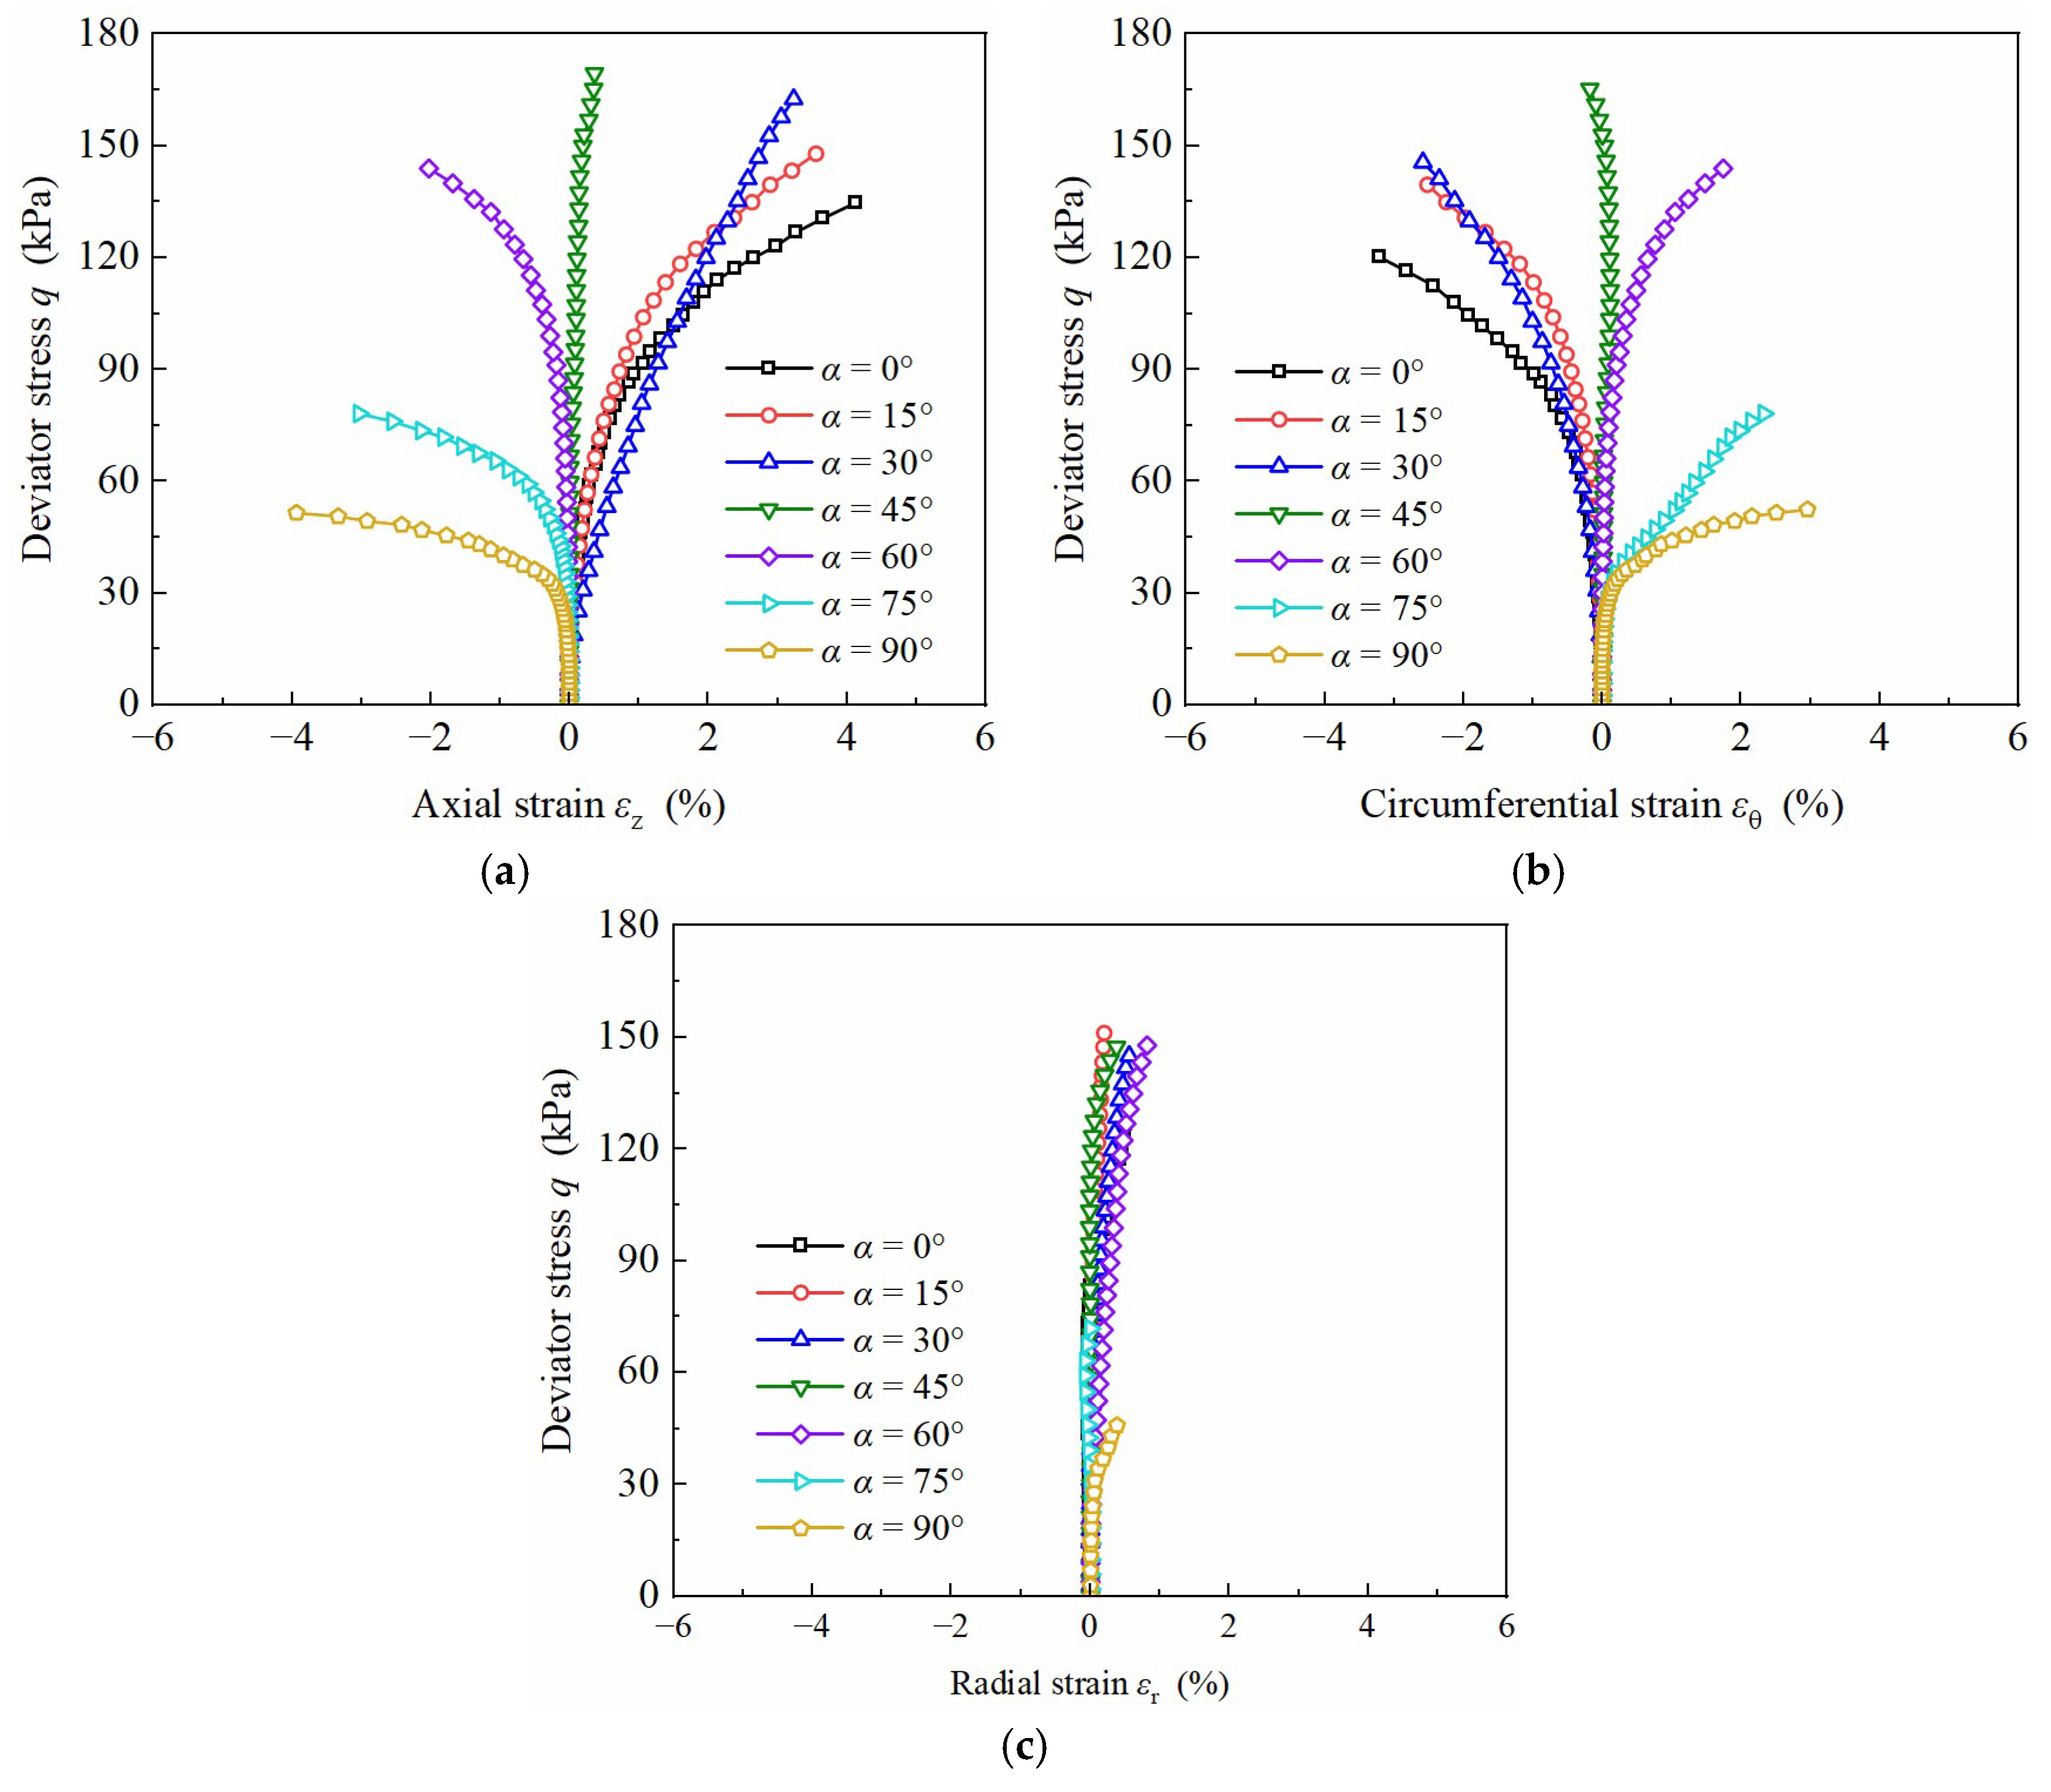
Development curves of axial strain εz, radial strain εr and circumferential strain εθ of slope soil with increasing deviator stress q under different angles α with b = 0.5 are presented in Figure 4 (compressive strains are positive; tensile strains are negative). Figure 4 shows that significant variations exist in axial strain εz for different α. For α < 45°, εz is compressive and εθ is tensile. For α = 45°, both εz and εθ approach zero. For α > 45°, both reverse their states, with εz becoming tensile and εθ becoming compressive. As the principal stress direction angle α increases, axial strain εz transitions from a compressive to a tensile state, whereas circumferential strain εθ shows an inverse transition behavior. A symmetrical pattern exists between axial strain εz and circumferential strain εθ development. The maximum strain magnitudes first decrease then increase with α, approaching zero for α = 45°. The response is due to uniaxial compression at α = 0° and uniaxial tension at α = 90° within the specimen, where torque application is minimal and deformation is dominated by axial load, resulting in larger axial strain εz. For α = 45°, the axial load is minimal and axial strain εz approaches zero.
Figure 4.
Development curves of strain components for different angles α (b = 0.5): (a) axial strain εz; (b) circumferential strain εθ; (c) radial strain εr.
For b = 0.5, εr under various principal stress directions shows minimal variation, with slight compression observed. For α = 75°, radial strain εr approaches zero, with peak radial strain εr (0.8%) occurring for α = 15°. Radial strain magnitude shows negligible dependence on angle α.
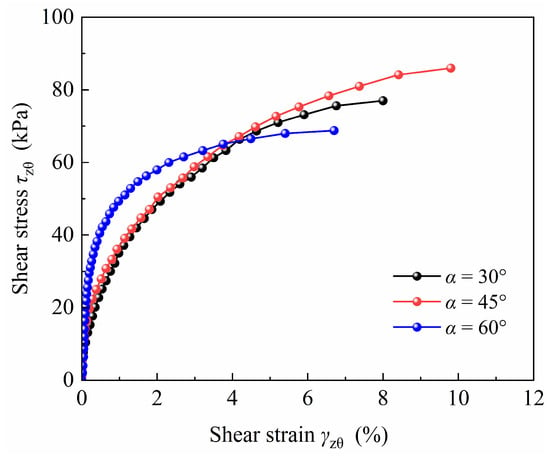
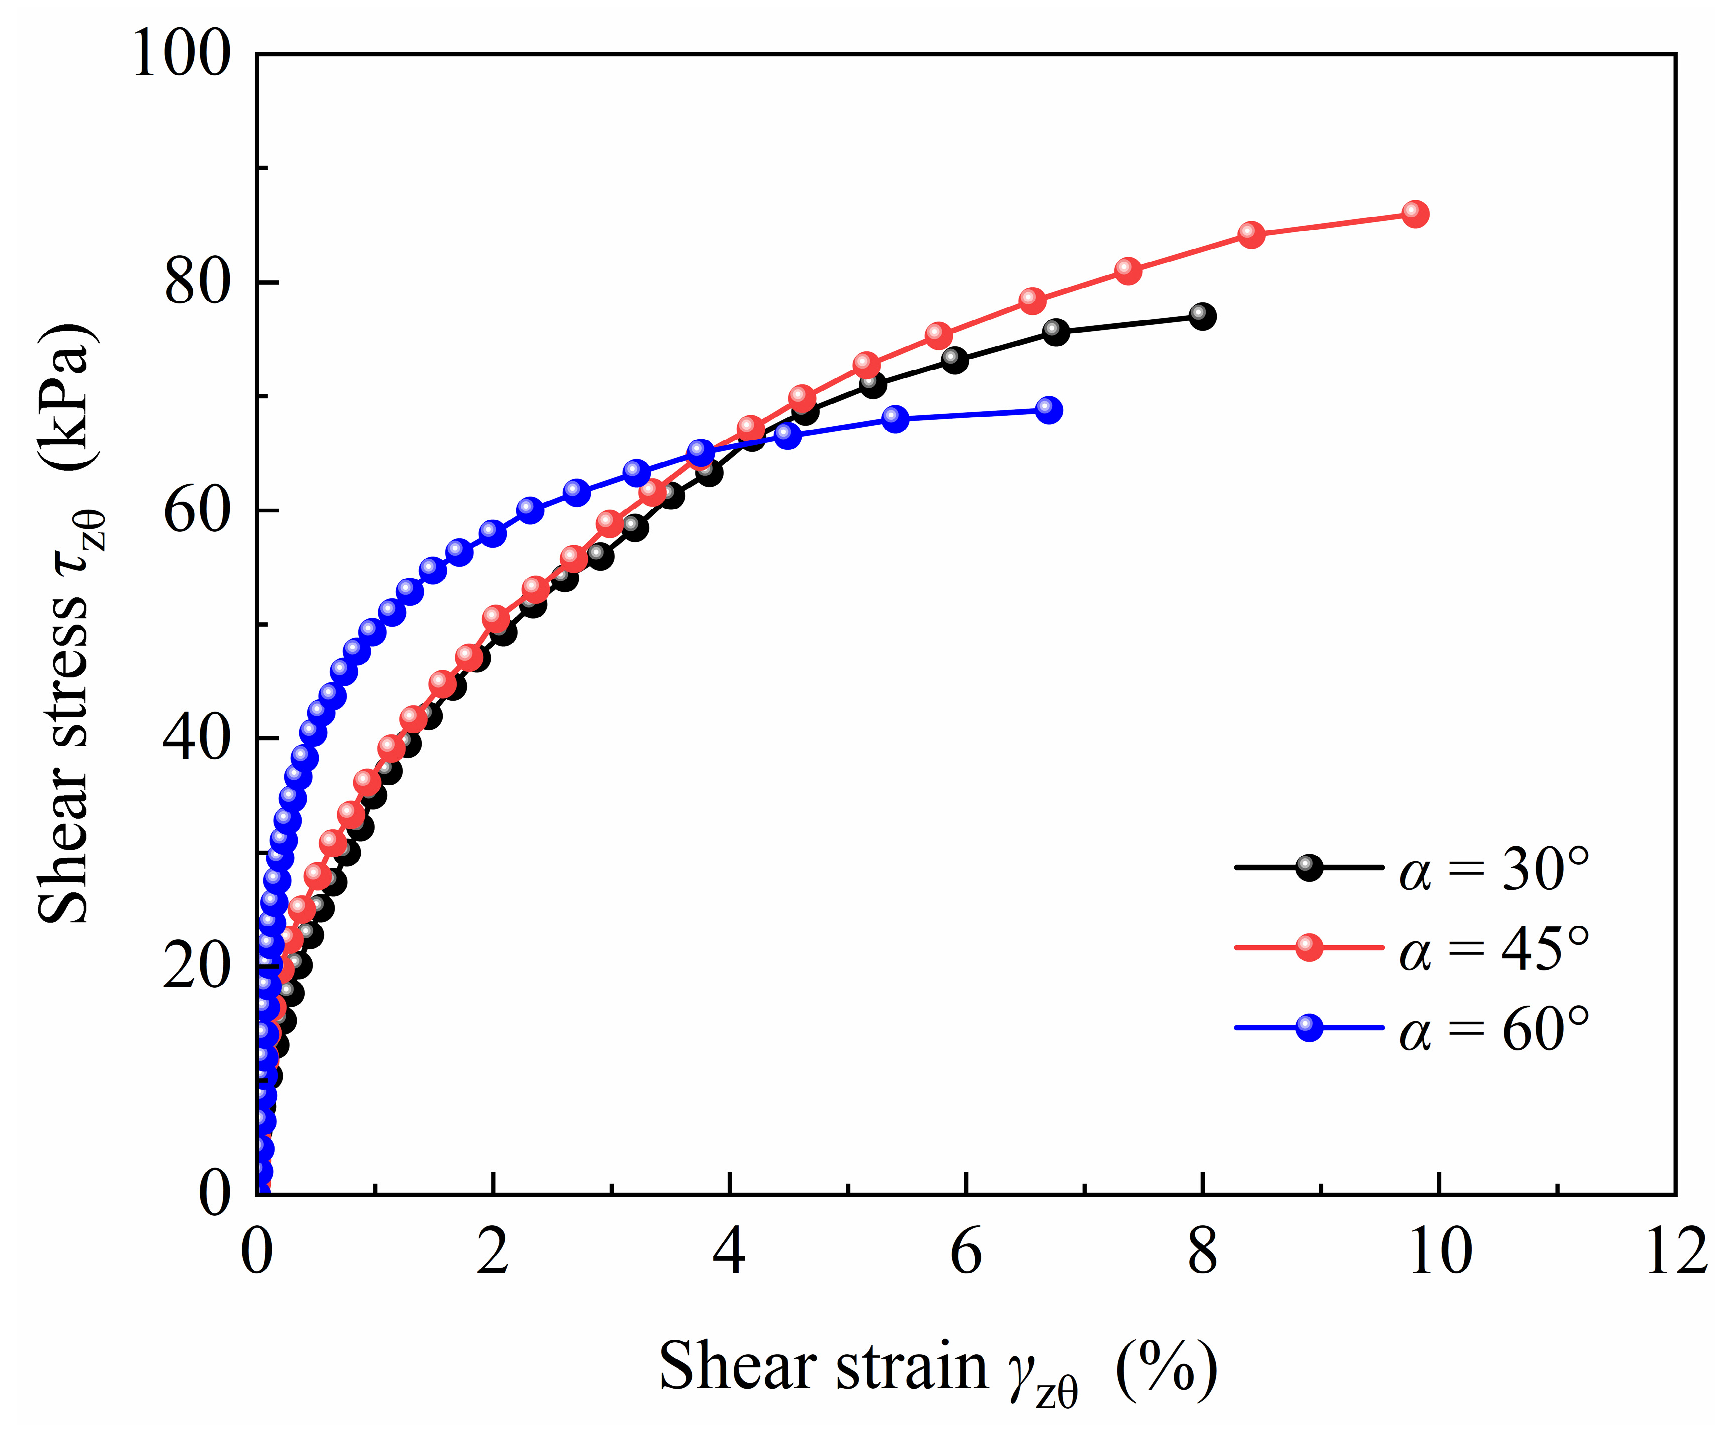
The shear stress–strain relationships of the specimens with different angles α for b = 0.5 are presented in Figure 5. Figure 5 demonstrates that during initial shearing, specimens for α = 30° and α = 45° exhibit comparable shear moduli, while the α = 60° specimen shows significantly different stiffness. With progressive shearing, the shear strain γzθ for α = 60° shows a slower development rate at equivalent torsional shear stress τzθ. Under coupled axial-torsional load, torsional shear strain γzθ for α = 30° and 60° is lower than that for α = 45°. The axial load for α = 45° approaches zero while torsional shear stress τzθ reaches a maximum, with the minimum τzθ observed at α = 60°.
Figure 5.
Shear stress–strain relationships for different angles α (b = 0.5).
3.2. Three-Dimensional Strain Relationships
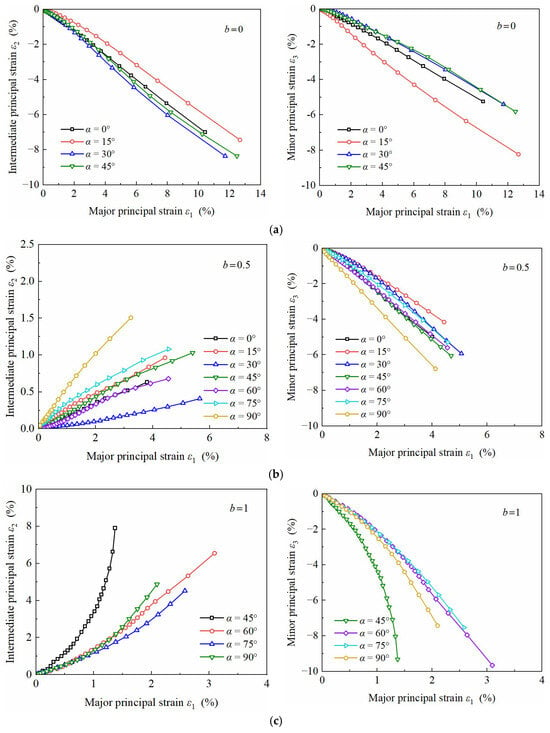
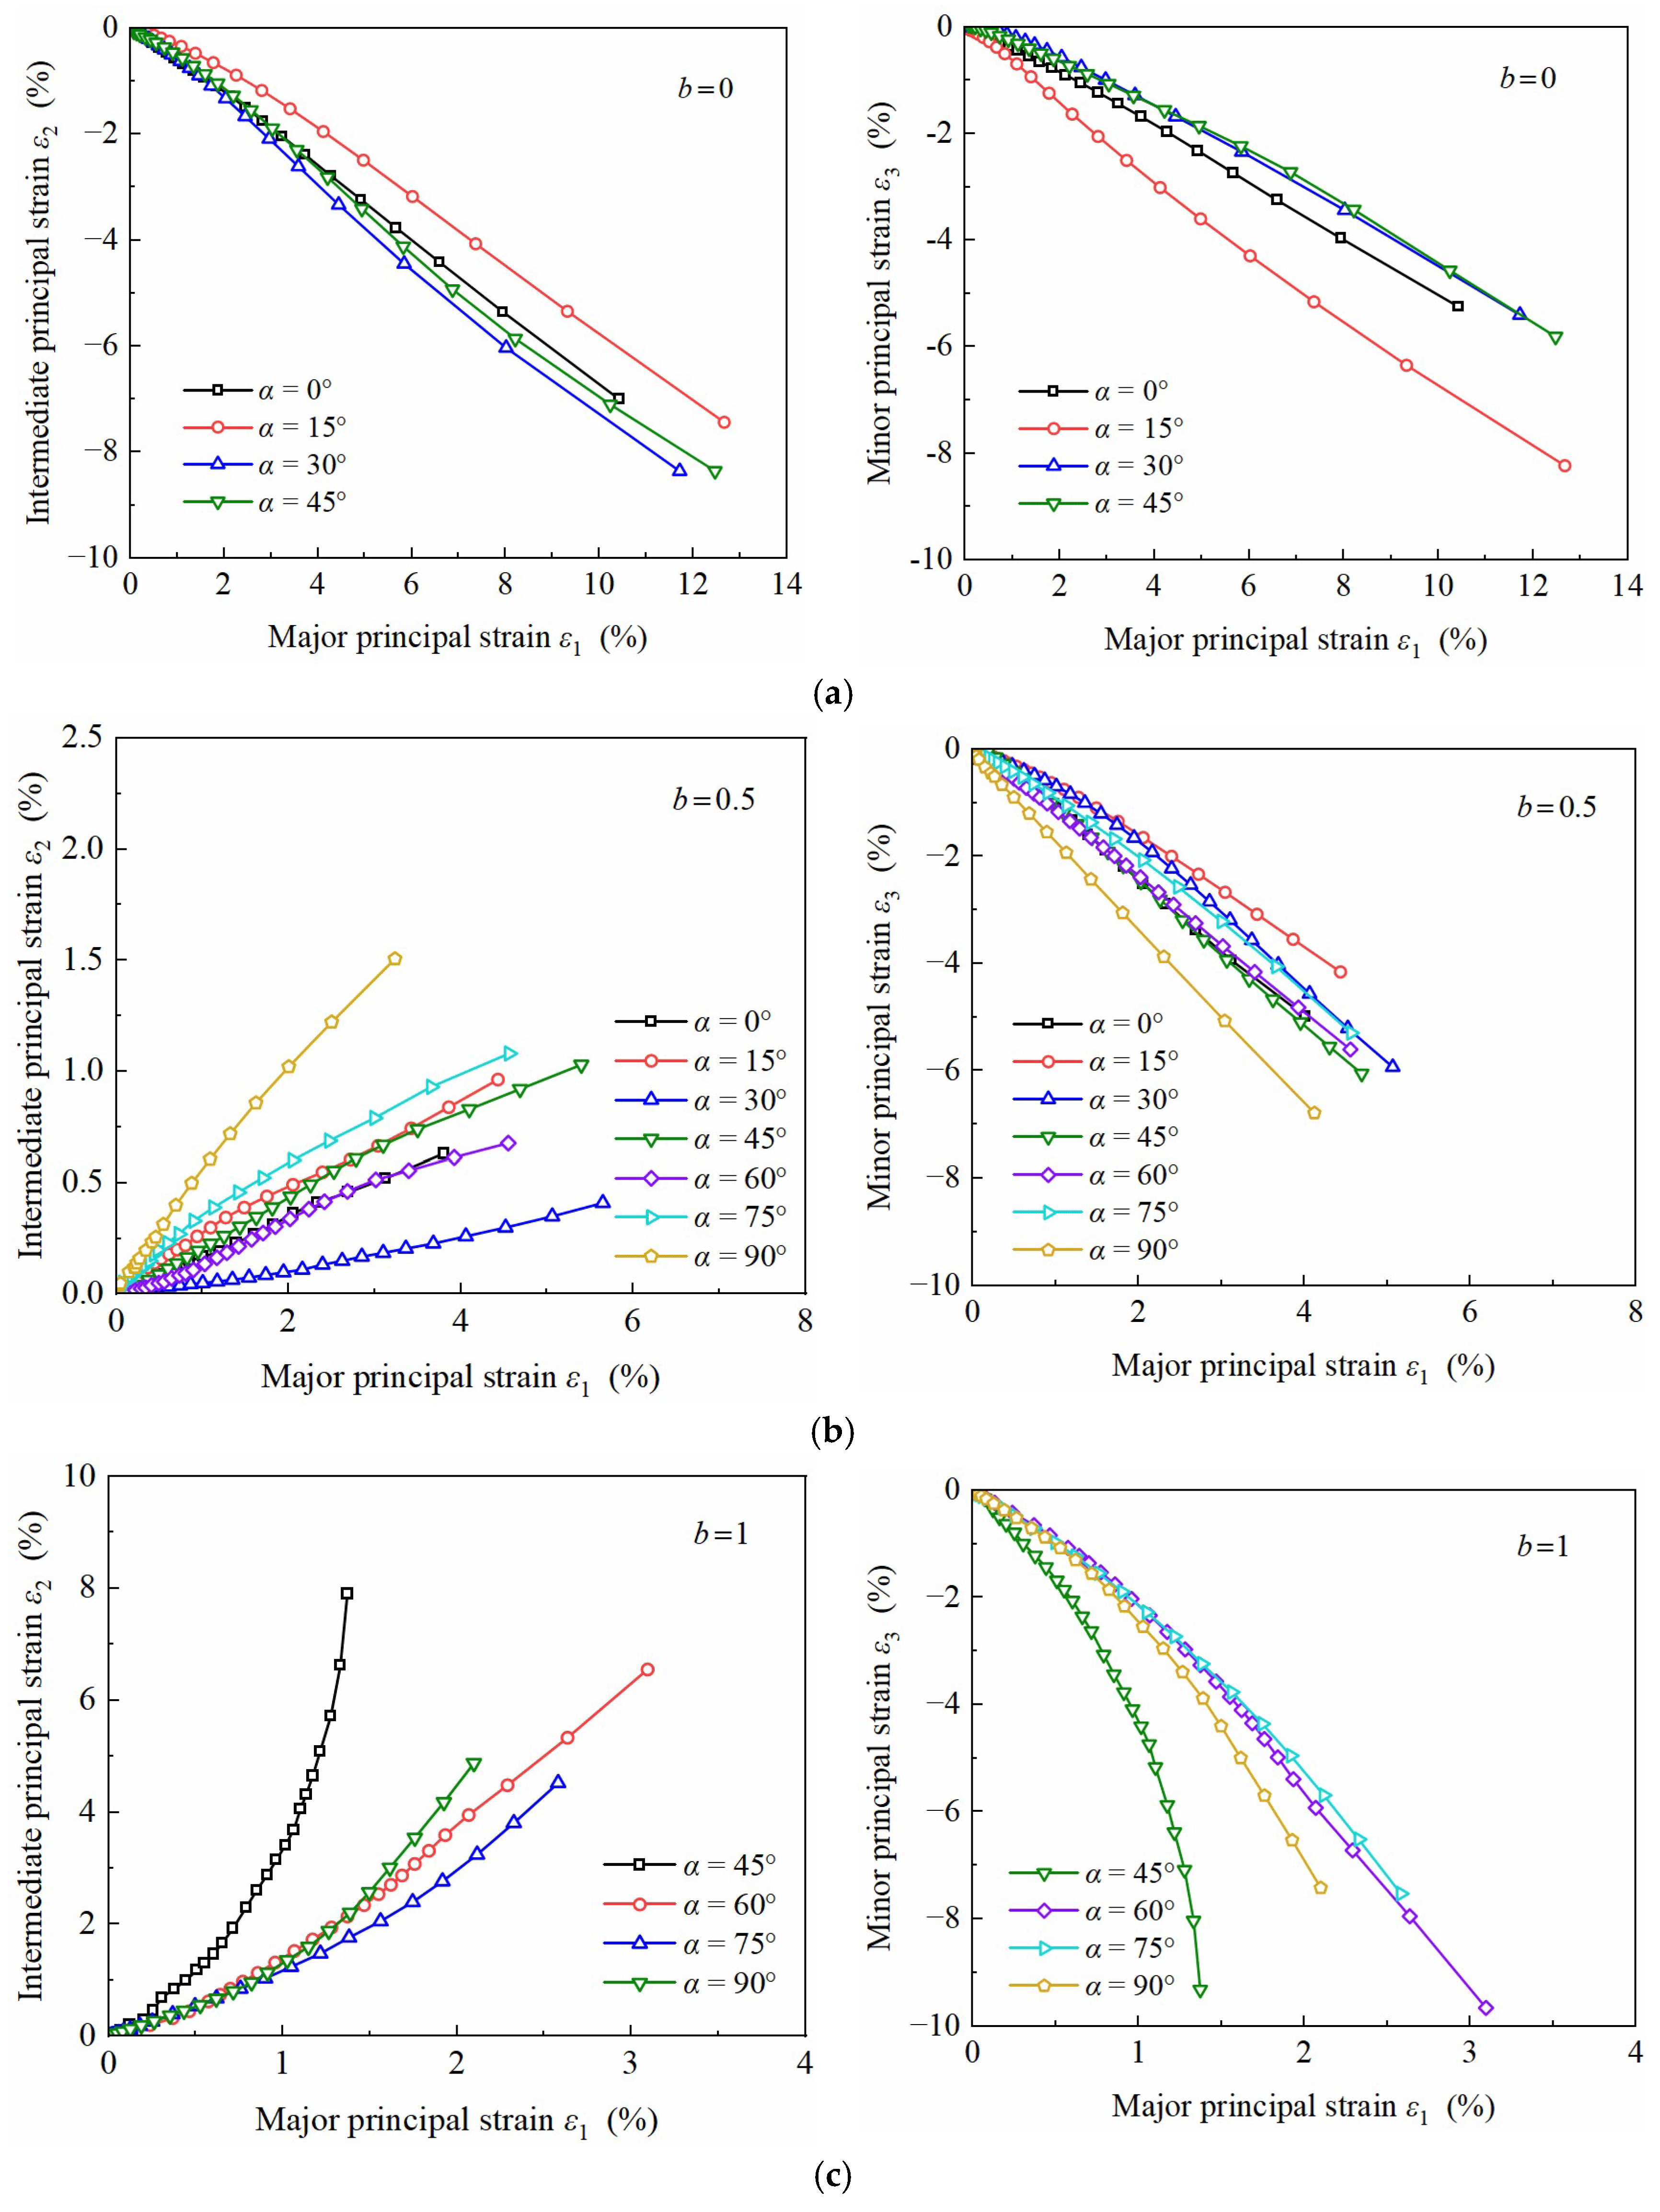
Figure 6 presents the relationships between the intermediate principal strain ε2, the minor principal strain ε3, and the major principal strain ε1 of the specimens under different angles α for b-values = 0, 0.5 and 1. Figure 6 shows that ε1 maintains positive values across all tested b and α conditions, confirming continuous compressive deformation along the ε1 direction. The minor principal strain ε3 consistently shows negative value, demonstrating tensile deformation along ε3. The intermediate principal strain ε2 shows variable trends with b-values, transitioning between compressive and tensile states.
Figure 6.
Relationships between each principal strain for different b-values and angles α: (a) b = 0; (b) b = 0.5; (c) b = 1.
Figure 6a illustrates that ε2 in tension is the maximum for b = 0. Under a constant angle α, the value of σ2 and σ3 are equal, but ε2 and ε3 are not equal in the Figure, which also indicates the anisotropy of slope soil.
Figure 6b reveals that significant variations exist in the intermediate principal strain ε2 development rate and magnitude under different principal stress directions for b = 0.5. The minimum ε2 peak value and development rate occur for α = 30°, while the maximum values occur for α = 90°. The intermediate principal strain ε2 development rates are equivalent for α = 15° and 45°, and for α = 0° and 60°. The minor principal strain ε3 first decreases then increases as the α angle increases. For a constant ε1, the minimum ε3 occurs for α = 15°, with the maximum minor principal strain ε3 observed at α = 90°.
Figure 6c illustrates that the intermediate principal strain ε2 under compression in the specimen reaches its maximum at b = 1. As the b-value increases, the intermediate principal strain ε2 transitions from a tensile to a compressive state. The stress state analysis reveals that σ2 gradually approaches σ1 for b = 1. The inherent anisotropy of slope soil induces different strain responses between σ1 and σ2 orientations for the same α. For α = 45°, the development rates of ε2 and ε3 are significantly greater than those for the other three directions.
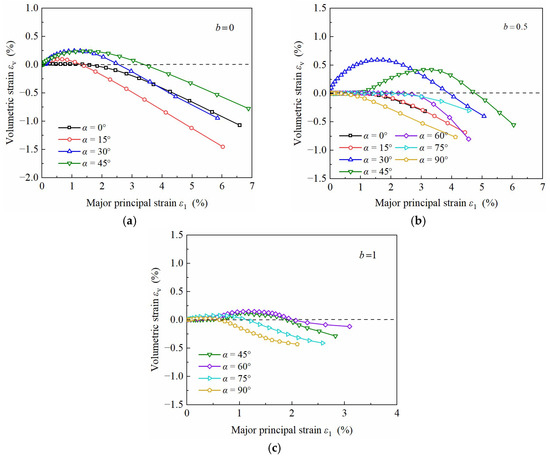
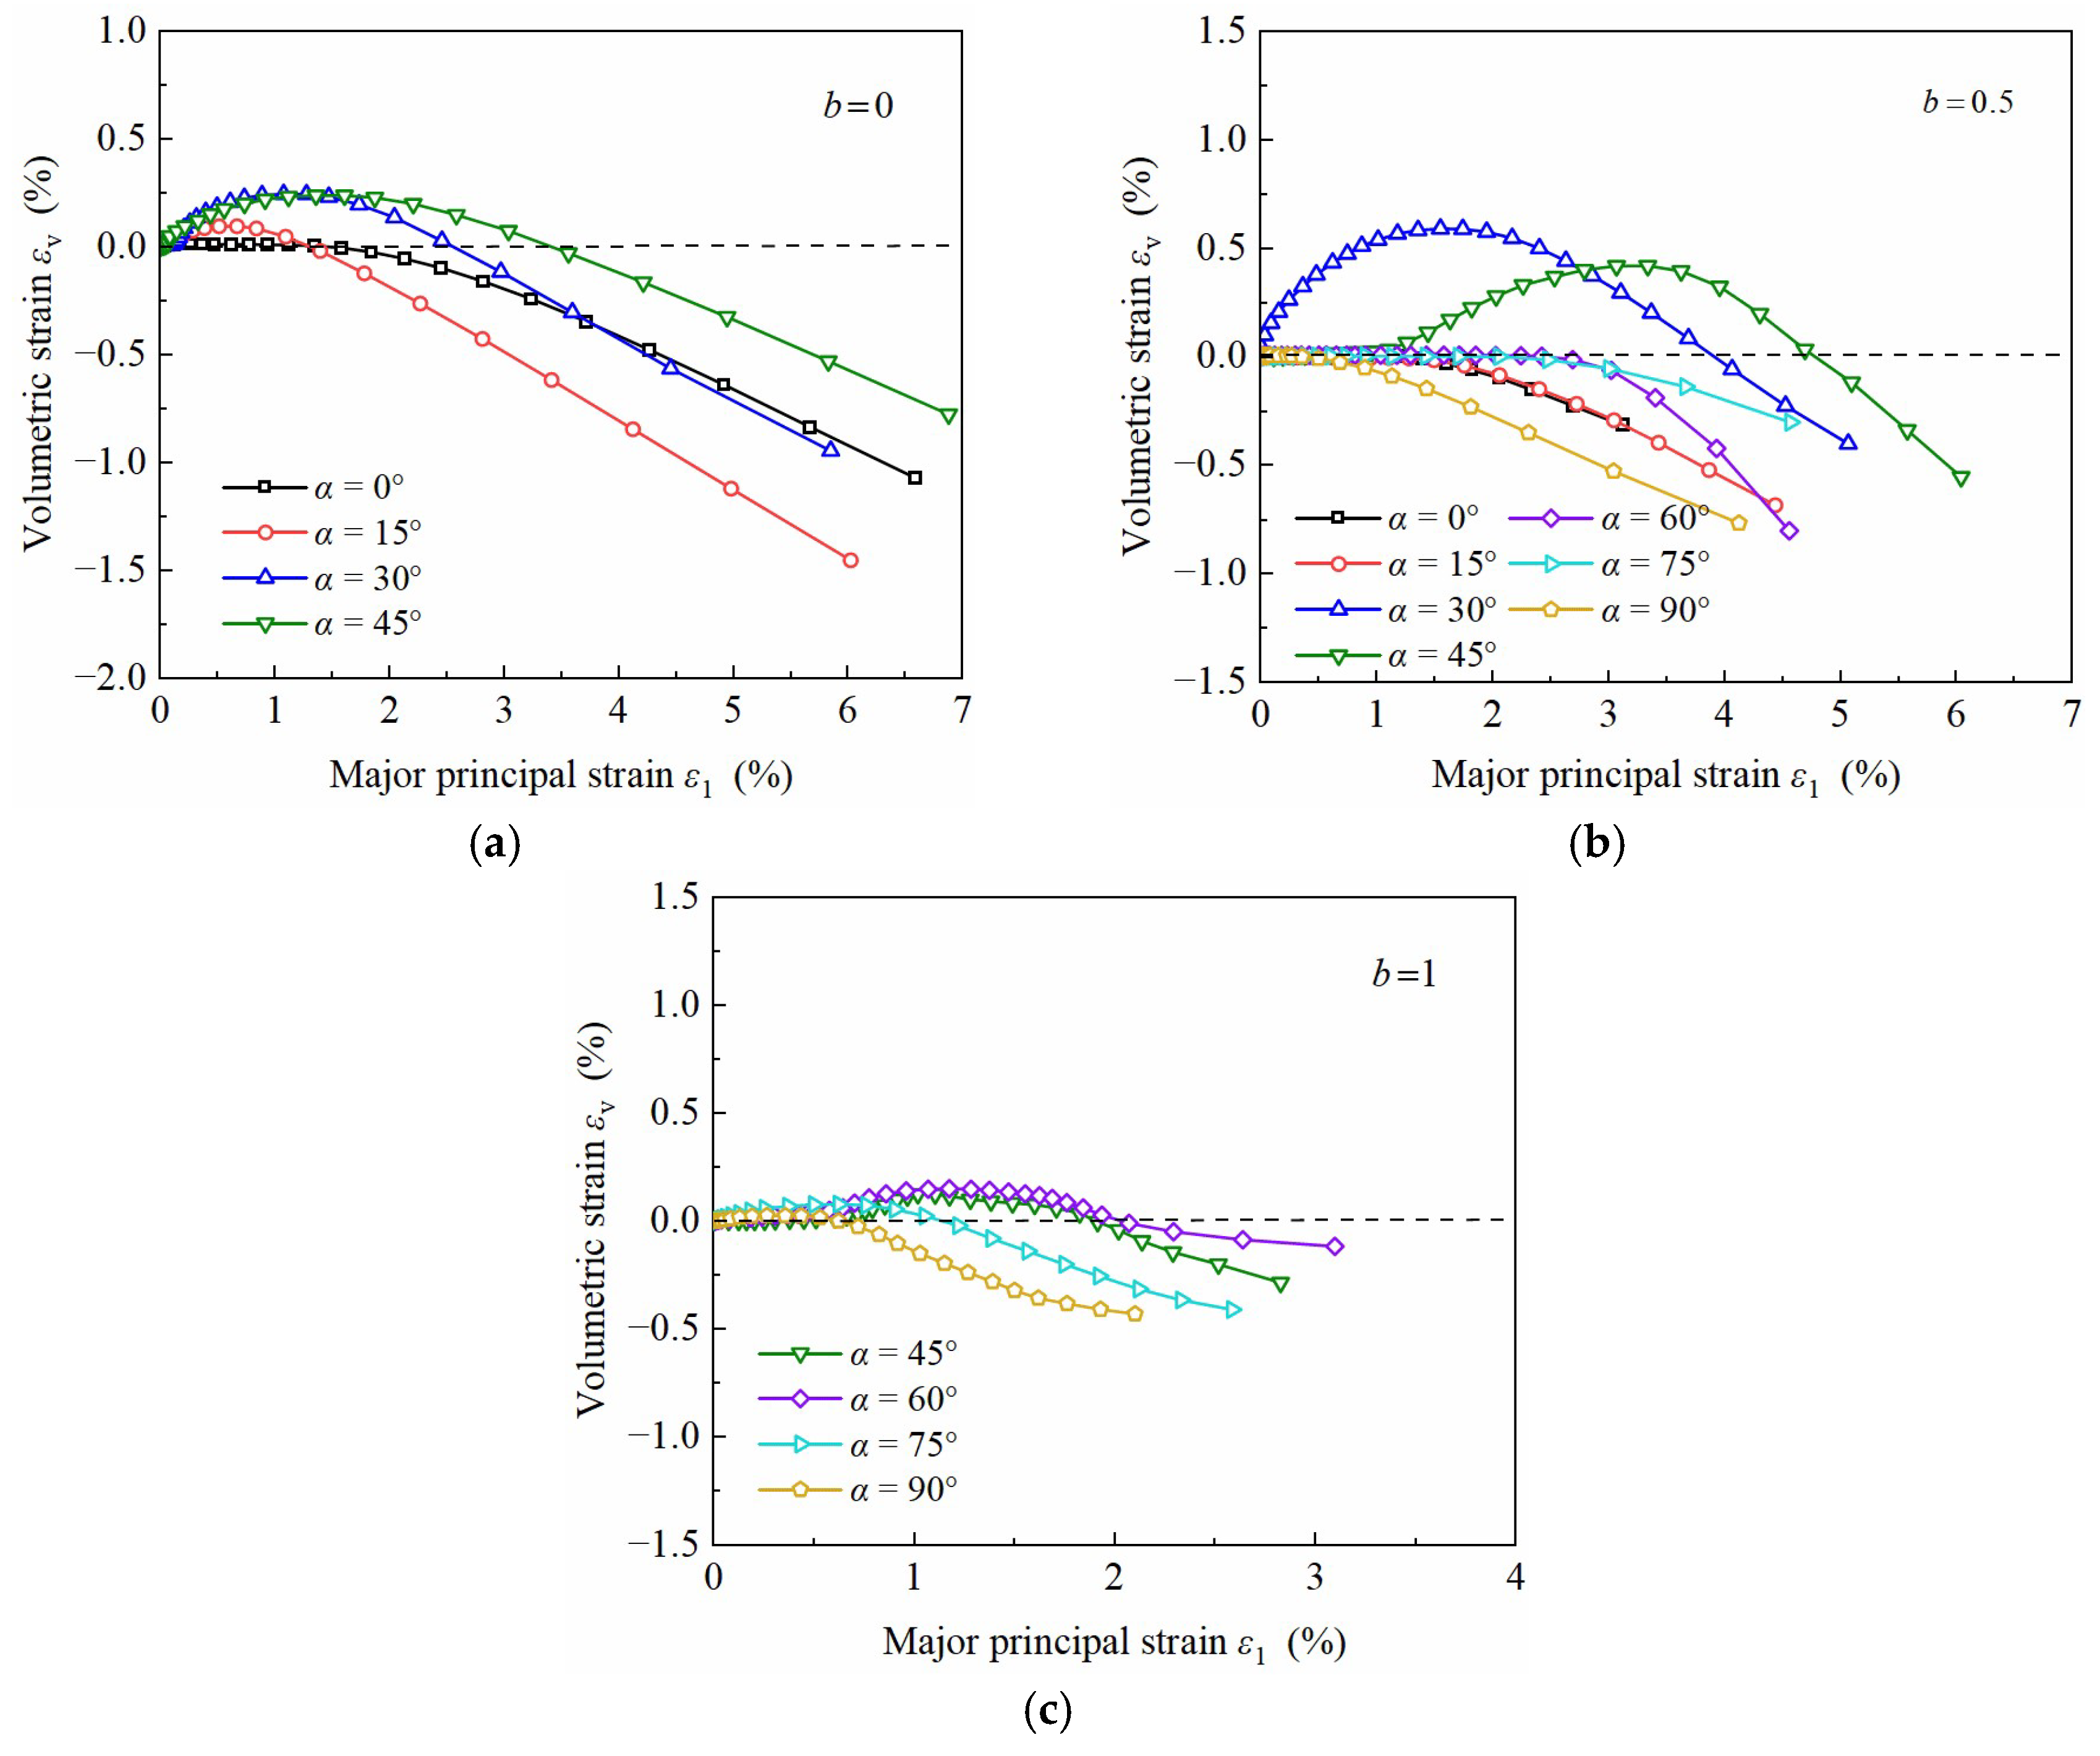
As shown in Figure 7, for a constant b-value, the volumetric strain εv develops predominantly in the positive direction during initial shearing across specimens with varying α. As ε1 becomes larger, volumetric strain begins to show a directional reversal in the negative direction. With a progressive increase in the major principal strain ε1, the volumetric strain εv transitions from positive to negative values, indicating transitions from contraction to dilatancy in slope soil, consistent with the dilatancy behavior reported by Miura, Miura and Toki [11]. The volumetric strain εv in some specimens initially remains essentially unchanged and transitions toward dilatancy with increasing ε1. At b = 0.5 and 0, εv shows significant variations. At b = 0 for α = 15°, 30°, and 45°, specimens show contractive behavior under small major principal strain ε1. With the same major principal strain value, the volumetric strain εv reaches its maximum for α = 15°, exhibiting obvious dilatancy behavior in this direction. At b = 0.5 with α = 30° and 45°, the specimens show significant contractive behavior with a delayed transition from contraction to dilatancy. For α = 0° and α = 15°, the development rate of the volumetric strain εv shows comparable values. At b = 1, a slight contraction occurs under different angles, followed by dilatancy. With the same principal strain value, the volumetric strain εv reaches a maximum at α = 90°.
Figure 7.
Relationship between volumetric strain and major principal strain for different b-values and α-angles: (a) b = 0; (b) b = 0.5; (c) b = 1.
3.3. Octahedral Stress–Strain Relationships
In directional shear tests, specimens experience complex stress states involving axial σz, radial σr, circumferential σθ, and torsional shear τzθ stresses, inducing corresponding strains: εz, εr, εθ, and γzθ. Any individual strain component fails to fully characterize the stress–strain relationships under complex stress states. Therefore, this paper adopts the method proposed by Zdravkovic and Jardine [21] employs the octahedral stress–strain relationship to reflect the comprehensive influence of different b-values and α on each strain component. The expressions for the octahedral shear stress τoct and the octahedral shear strain γoct are as follows:
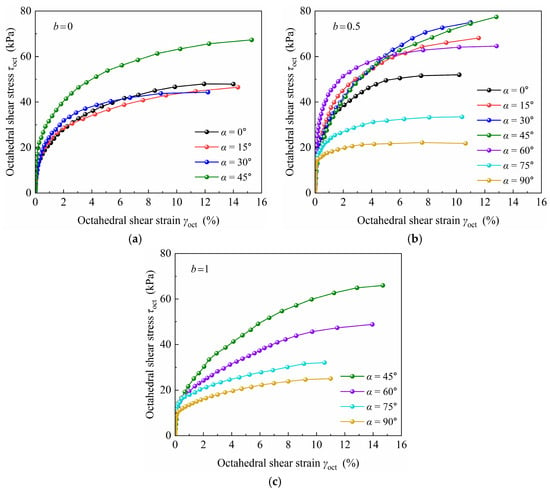
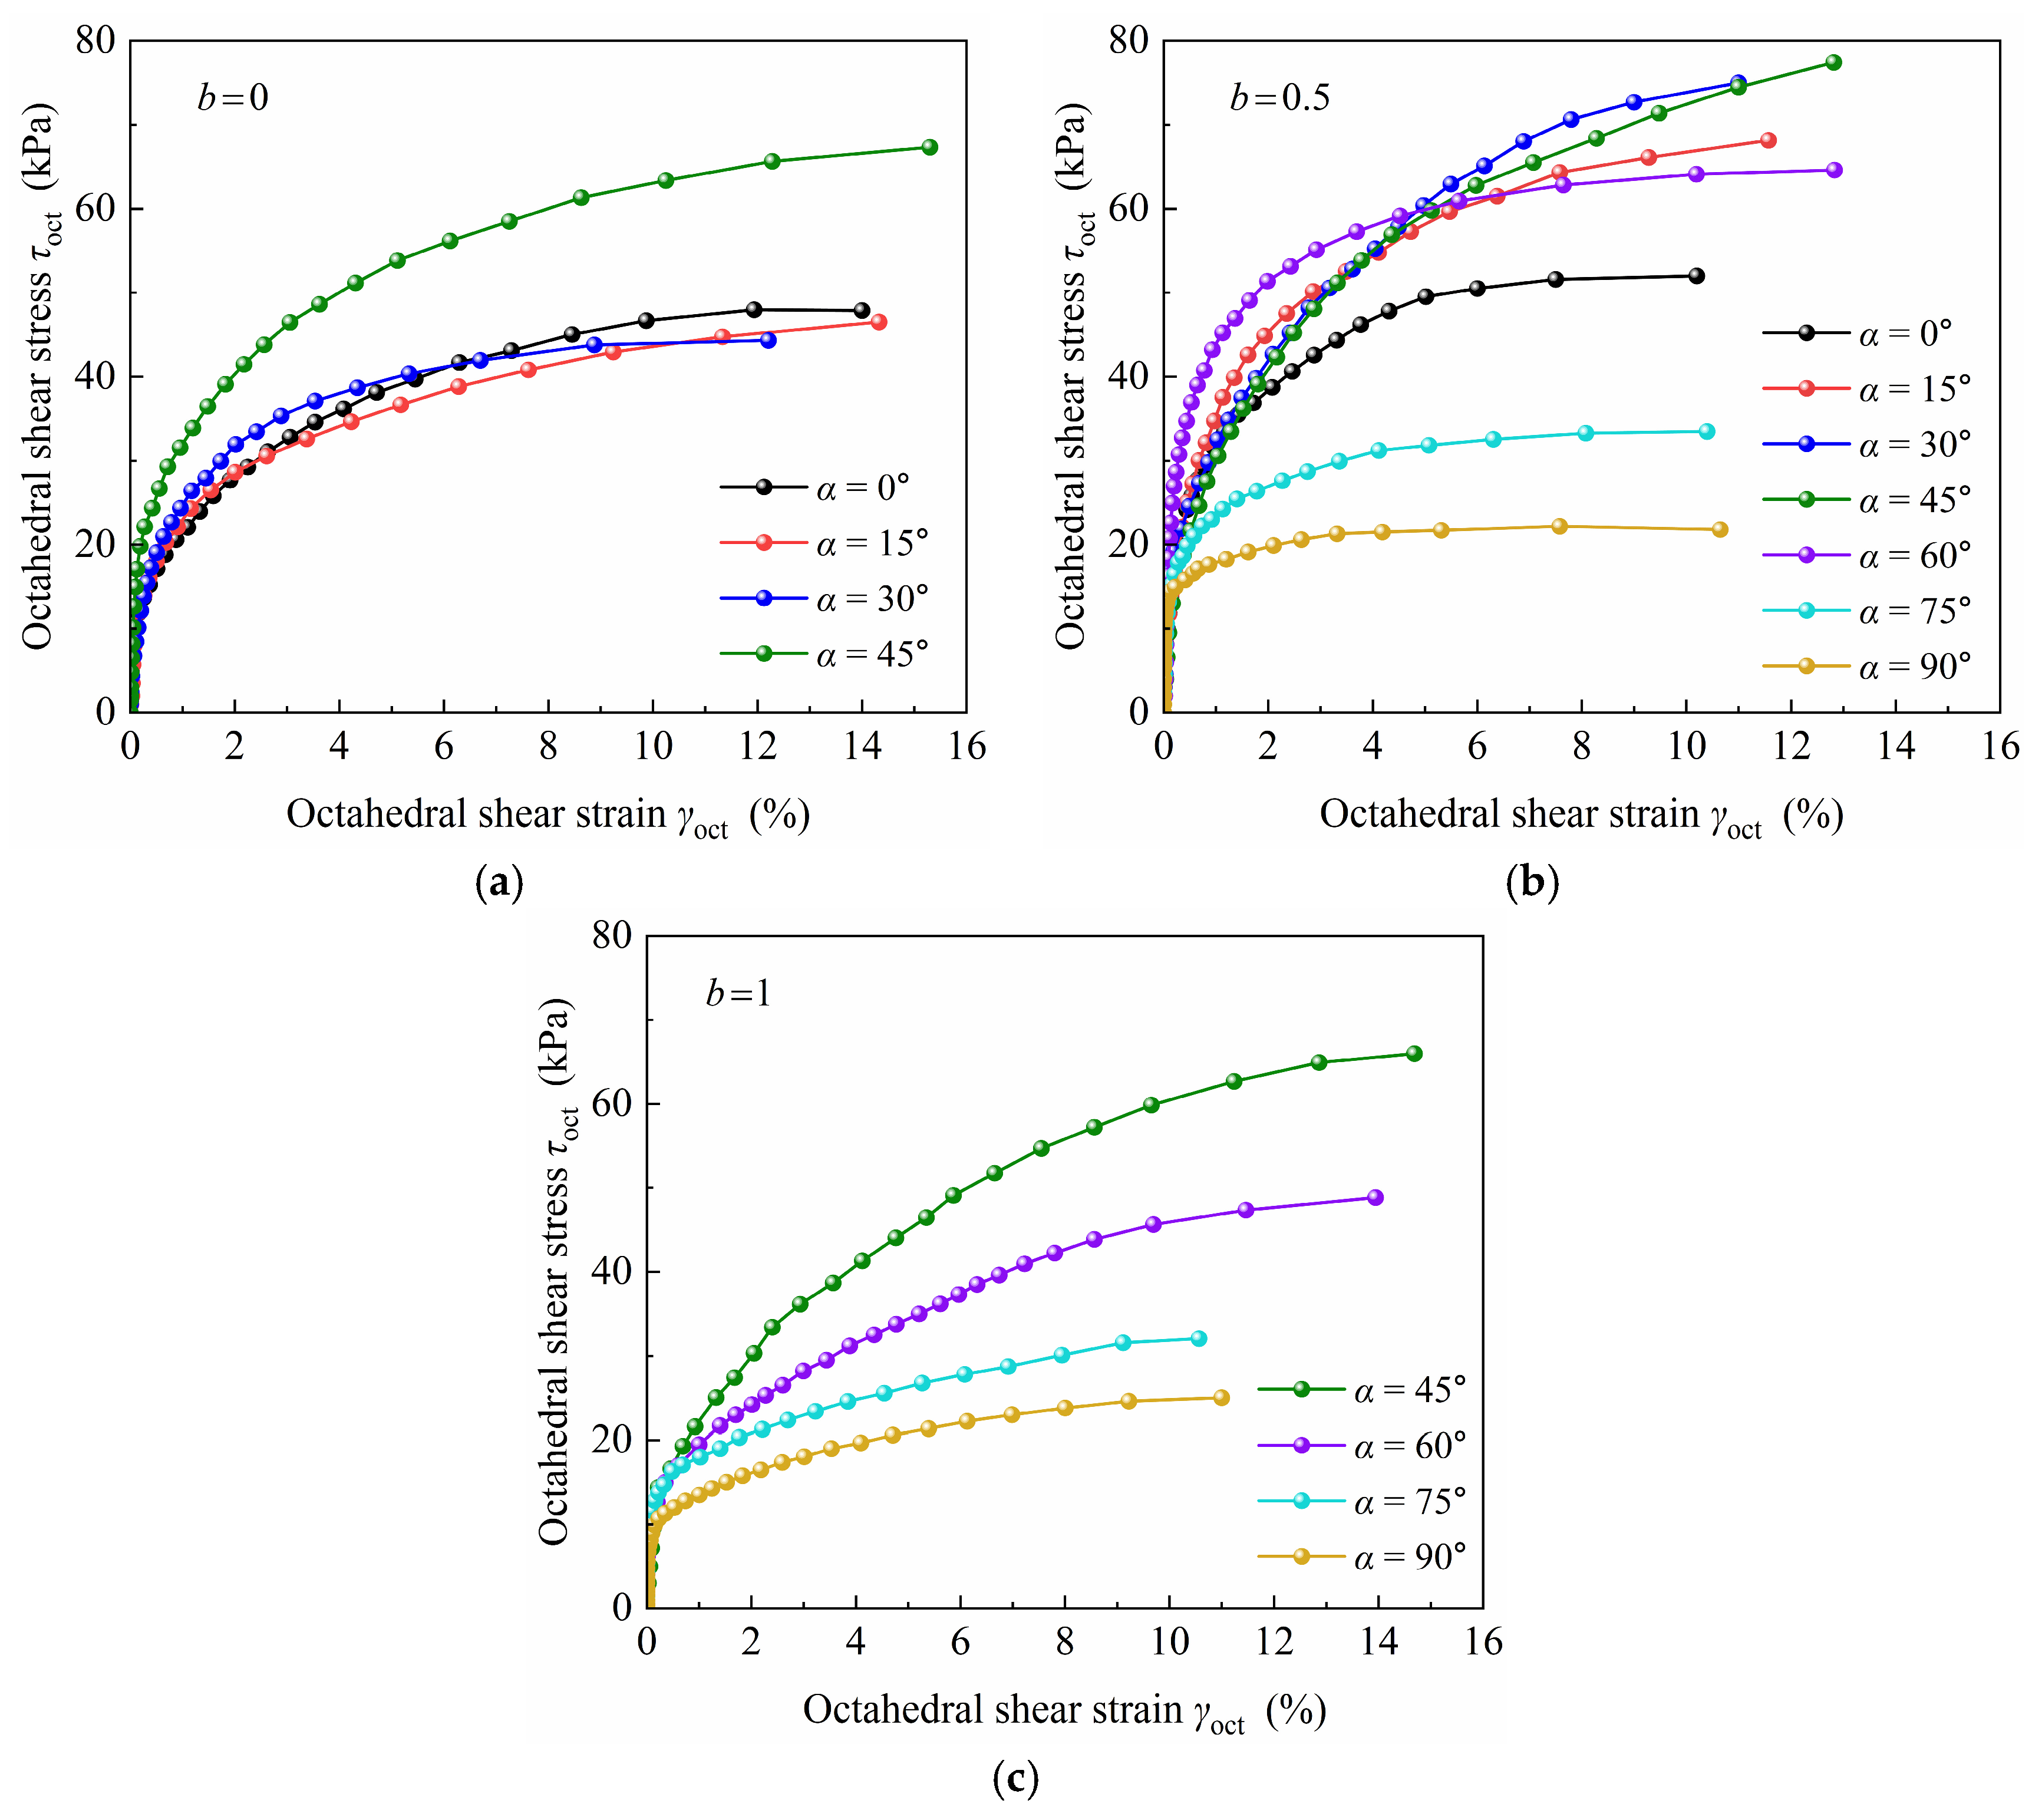
Figure 8 presents the octahedral stress–strain relationships of the slope soil under different angles α for b = 0, 0.5, and 1. The curves reveal distinct anisotropic characteristics in the octahedral shear strain γoct for different b-values and angles α. During initial loading at a constant b-value, octahedral shear strain γoct develops at a low rate, reflecting a high octahedral shear modulus. With increasing τoct, the octahedral shear strain rate accelerates, forming an obvious inflection point in the curve. Subsequently, strain development accelerates further, and the specimen exhibits certain extensional failure characteristics.
Figure 8.
Octahedral stress–strain relations for different b-values and α-angles: (a) b = 0; (b) b = 0.5; (c) b = 1.
Under different b-values, the specimens also exhibit different stress–strain relationships. At b = 0, specimens show consistent strain development rates for α = 0°, 15°, and 30°, with nearly identical shear moduli in stress–strain responses. Under equivalent shear strain levels, peak shear stress and strength occur for the principal stress direction angle α = 45°. At b = 0.5, specimens exhibit strain anisotropy across α angles for the octahedral shear strain γoct < 1%, with angle-dependent strain rate variations. During the initial loading phase, at equivalent octahedral shear strain levels, the specimen with α = 60° develops peak octahedral shear stress τoct. With progressive loading, the specimen with α = 45° attains peak octahedral shear stress τoct, achieving maximum shear strength.
For α = 90°, the specimen first shows extensional failure, exhibiting minimum octahedral shear stress τoct and shear strength. As α increases from 0° to 90°, the peak octahedral shear stress τoct first rises and subsequently declines. Under the condition of b = 1, the τoct value progressively decreases as α increases from 45° to 90°. The anisotropic behavior of the octahedral shear strain γoct is more significantly influenced under b = 0.5 and b = 1 than under b = 0.
3.4. Normalized Strength
The selection of appropriate failure criteria for soils under diverse complex stress paths has been widely investigated. For instance, Shen et al. [22] defined the strength of calcareous sand and quartz sand based on the deviatoric stress ratio at a generalized shear strain of 3%. Similarly, Chen et al. [23] adopted the deviatoric stress at 15% generalized shear strain as the failure criterion for frozen soil, while Yang et al. [24] also employed generalized shear strain to characterize soil strength. Due to the absence of a universally accepted standard, failure criteria must be tailored according to the specific deformation behavior of the soil being tested. The octahedral shear stress–strain relationship offers a comprehensive representation of material response under complex stress conditions. Accordingly, this study defines the failure shear stress as the octahedral shear stress at 10% octahedral shear strain, establishing it as the failure criterion for slope soil.
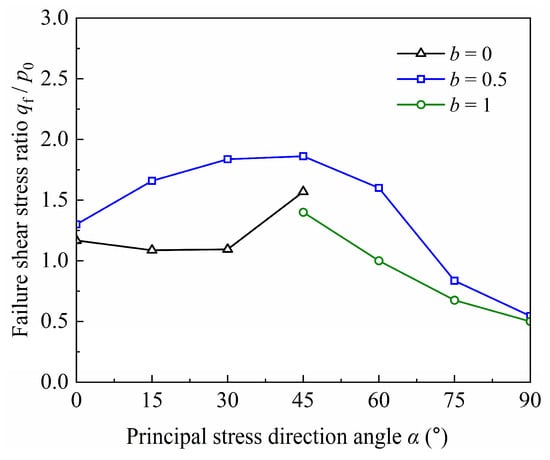
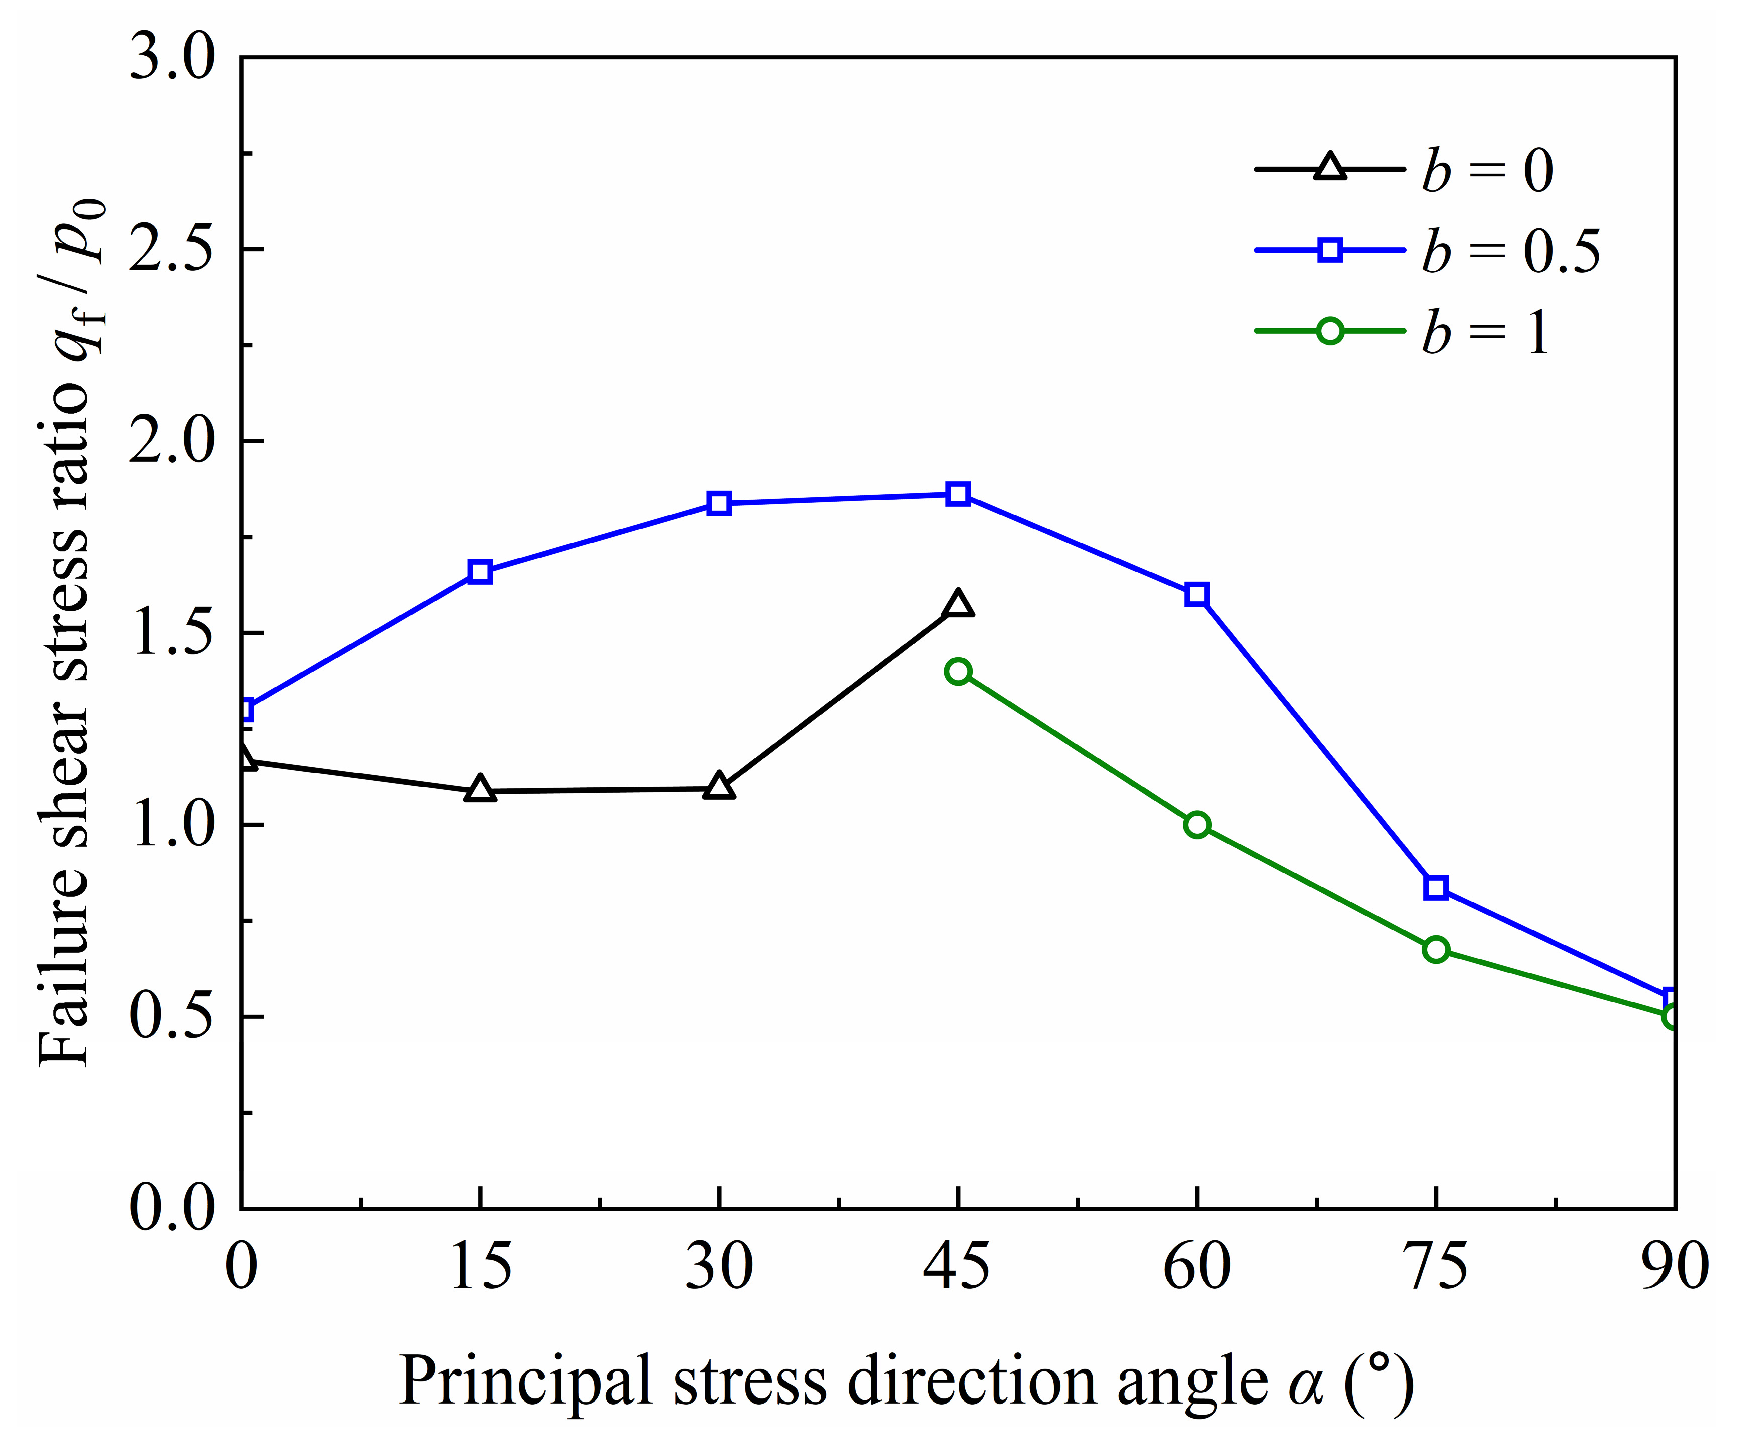
Figure 9 illustrates the normalized strength under different α angles for b = 0, 0.5, and 1, where qf denotes the deviator stress at failure for slope soil, p0 represents the effective mean principal stress, and η = qf/p0 defines the stress ratio at failure. As shown in Figure 9, for a given α, the normalized shear strength peaks at b = 0.5, exceeding values for b = 0, 1. Furthermore, at b = 0.5, the strength of the specimen changes significantly, showing a trend of first increasing and then decreasing [25]. At α = 0°, sliding between aligned particles may result in lower strength. As α increases, the particles likely experience greater rolling resistance and interlocking, which could promote force-chain reorganization and gradual strength increase. Peak strength near α = 45° may correspond to a more uniform force-chain distribution. Beyond this, as α approaches 75–90°, strength decreases markedly, possibly due to the principal stress direction becoming perpendicular to particle orientation. This facilitates particle rolling and force-chain buckling, consistent with the soil’s lower resistance to tensile than compressive stresses.
Figure 9.
Normalized strength of slope soil for different b-values and angles α.
For b = 0, the specimen strength increases gradually with angle α. For b = 1, the specimen strength decreases gradually with angle α. When b is constant, the specimen strength displays significant anisotropy across angles α. For b = 0.5, the difference between its extreme values of failure shear stress ratio qf/p0 is about 70%, whereas this difference is about 25% for b = 0. As shown in Figure 9, specimen strength for b = 0.5 displays more significant anisotropy than those for b = 0 and 1 [26].
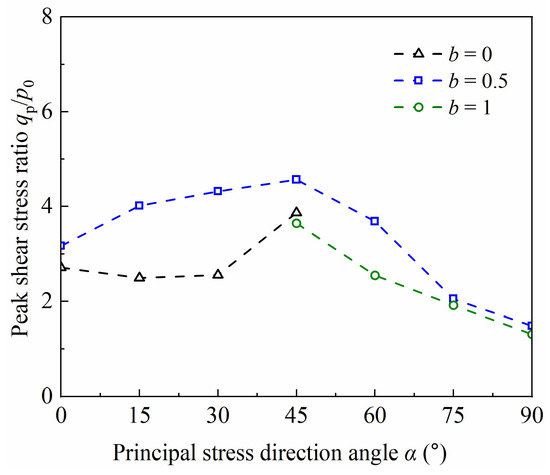
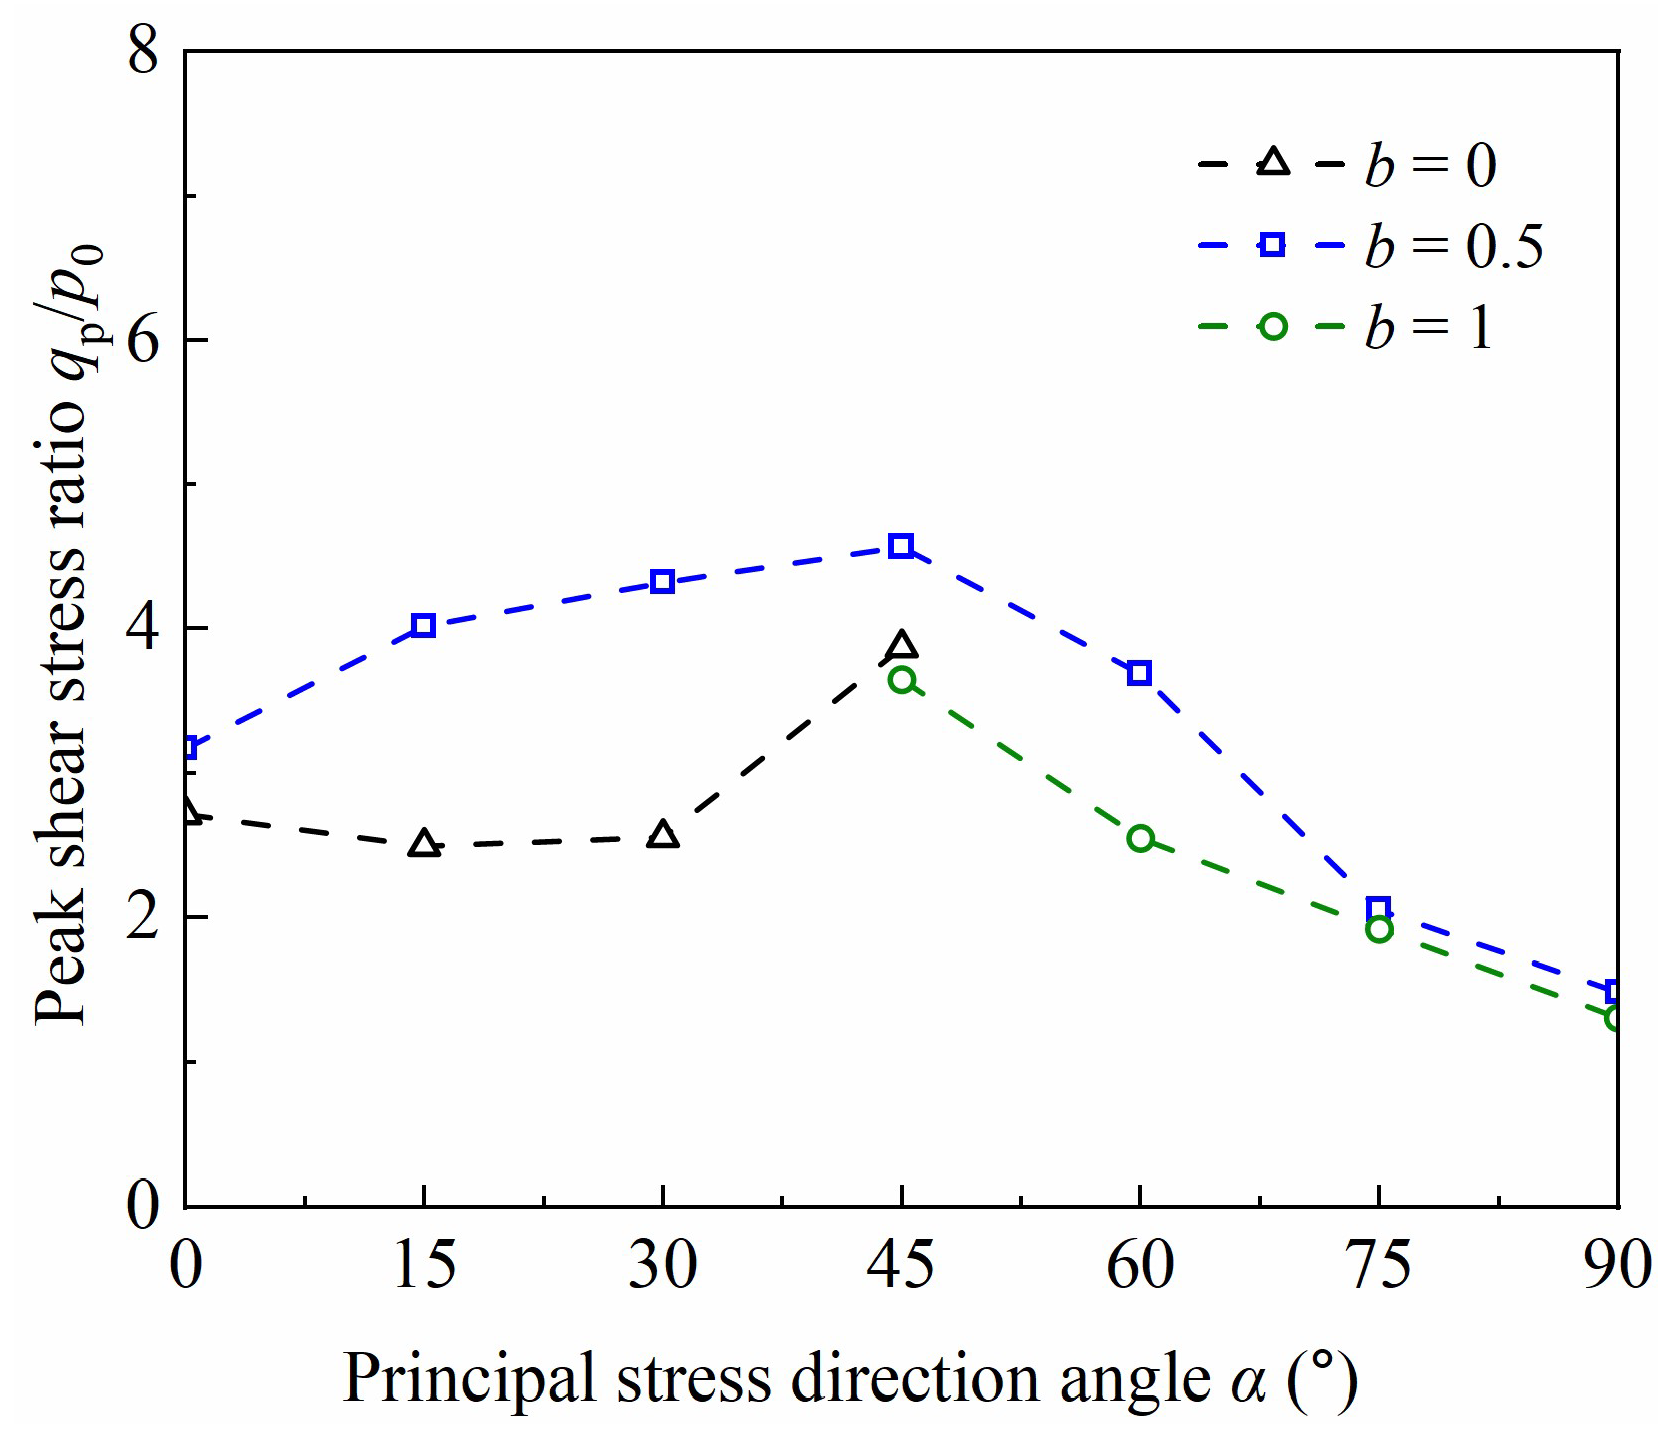
Figure 10 illustrates the variation in peak shear stress ratio of slope soil for different b values and angles α. For a given b value, the variation pattern of peak strength is largely consistent with that of normalized strength. Under different angles α, the relative magnitudes of peak strength for different b-values also align with those of the normalized strength. However, the peak shear stress ratio values exceed the normalized strength across varying b-values and angles α. This discrepancy arises because the normalized shear stress represents the octahedral shear stress, which is an integrated value from multiple directions and thus functions as an average. In contrast, the shear process in this experiment was stress-controlled, with the principal stress continuously evolving over time until the test concluded automatically. Consequently, using this peak strength to determine specimen failure carries a significant degree of randomness.
Figure 10.
Peak shear stress ratio of slope soil for different b-values and angles α.
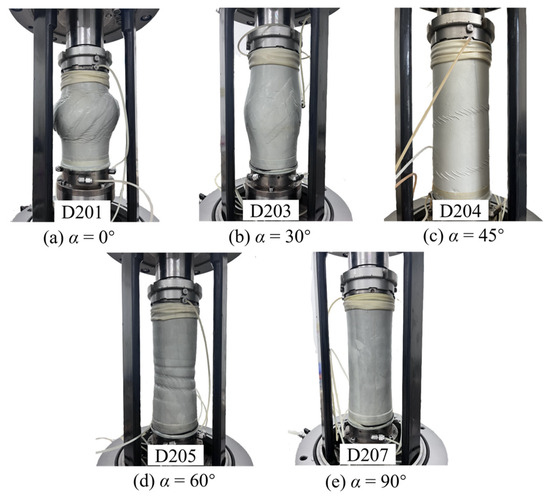
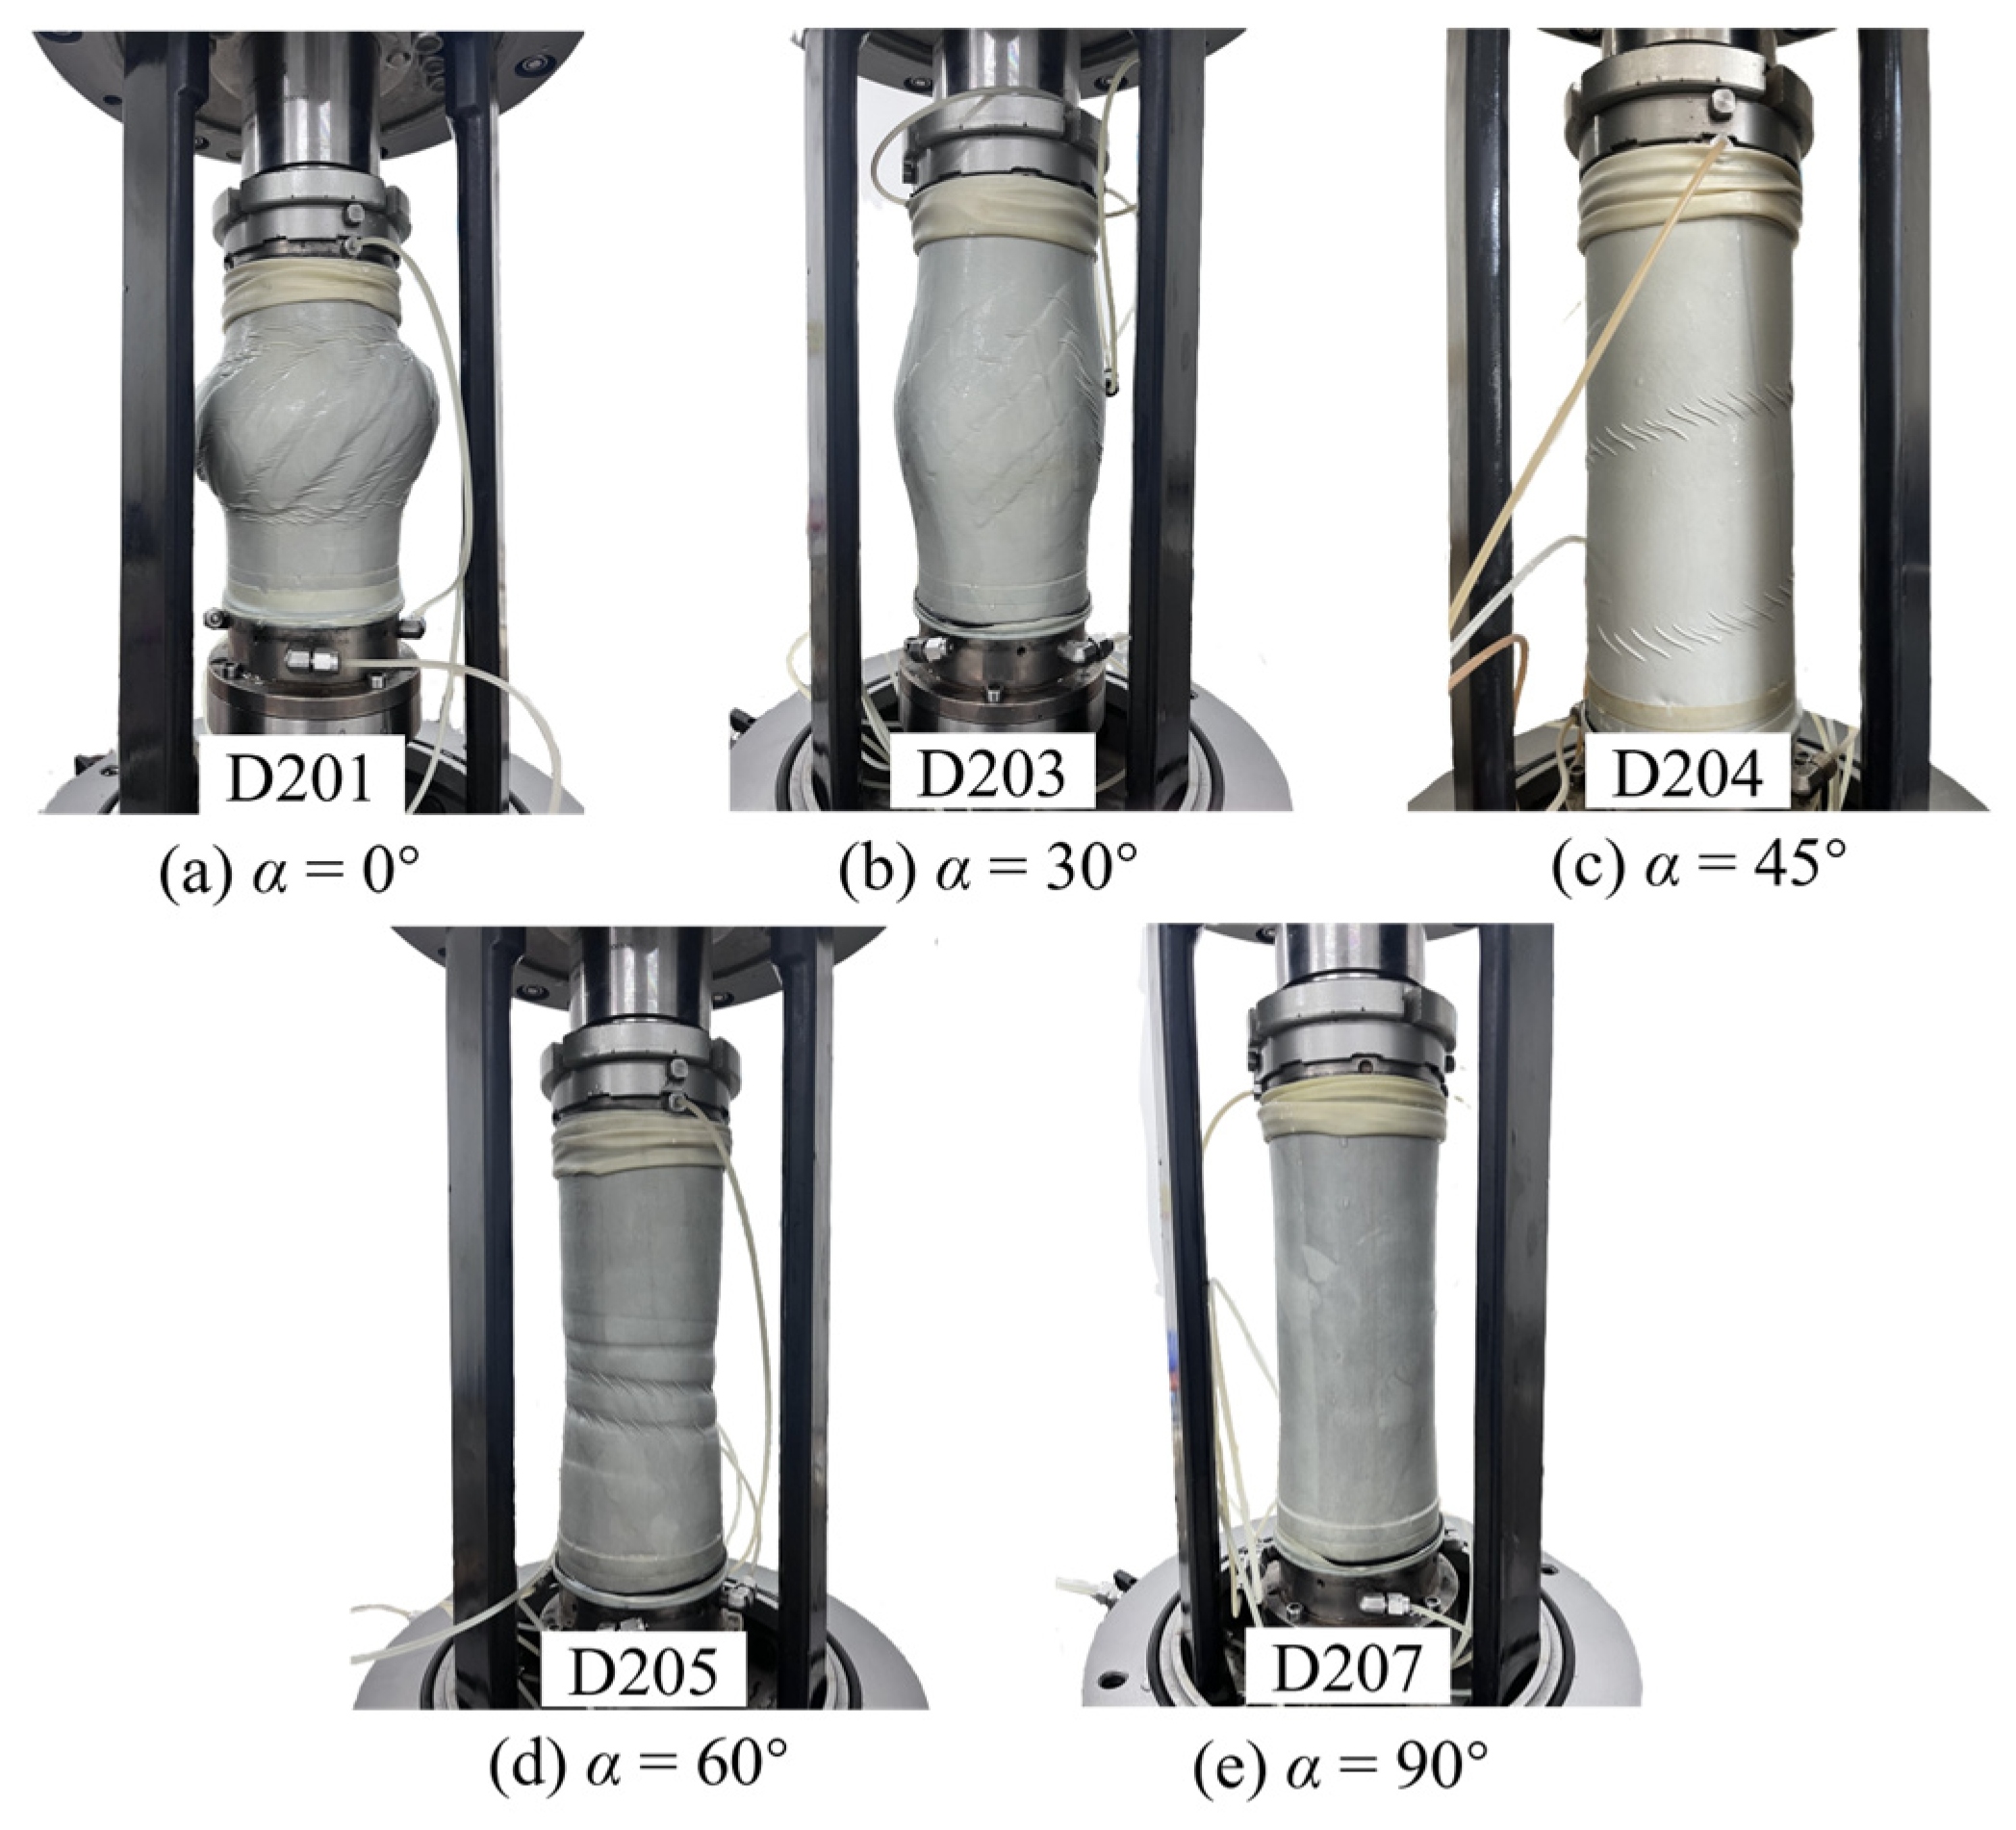
Figure 11 shows the shear band patterns in failed specimens under various α. At α = 0°, the shear bands are numerous but uniform, with limited inclination range. Some bands widen or curve slightly. Shear acts along the weakest plane, accompanied by a marked volume change. At α = 30°, the bands lengthen into a complex “X”-shaped network with parallel and intersecting branches, showing lower strain localization. The strong anisotropy disrupts granular fabric; deformation spreads broadly via particle rotation, avoiding a single narrow band. At α = 45° (pure torsion), a single gentle band appears with two diffuse, parallel bands. The volume change is negligible. At α = 60°, a broad annular band forms, concentrated in the mid-lower section. At α = 90°, steeper bands emerge, concentrated in the upper section; these bands are narrower.
Figure 11.
Failure patterns of specimens under different principal stress direction angles α: (a) α = 0°; (b) α = 30°; (c) α = 45°; (d) α = 60°; (e) α = 90°.
3.5. Non-Coaxial Response
The non-coaxial characteristic of soil refers to the fact that the direction of principal stress and principal strain in the soil are not consistent [27,28,29]. Numerous scholars, such as Zhuang et al. [30], Qian et al. [31], Yan et al. [32], Tong et al. [33], and Liang et al. [34], have conducted research on non-coaxial characteristic of all kinds of soils. Due to the high requirements for the measurement accuracy of the testing apparatus and the computational precision in studying the non-coaxial characteristic, the patterns of the non-coaxial characteristic derived by different scholars vary significantly. However, there have been few studies on the non-coaxial characteristic of slope soil. In this paper, the non-coaxial angle β is defined as the difference between the principal strain increment direction angle βdε and the principal stress direction angle α, expressed as follows:
Equations (6) and (7) yield the following expression for the non-coaxial angle β:
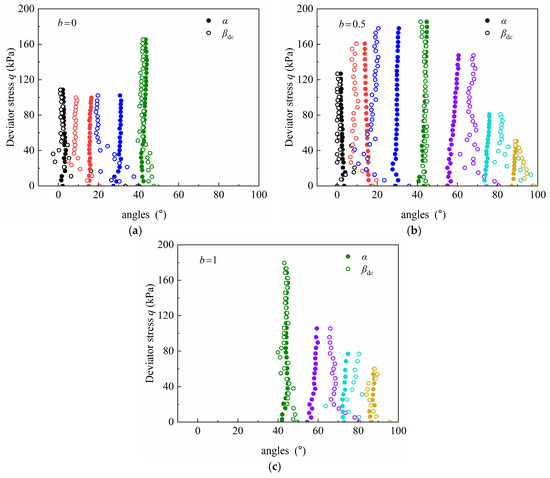
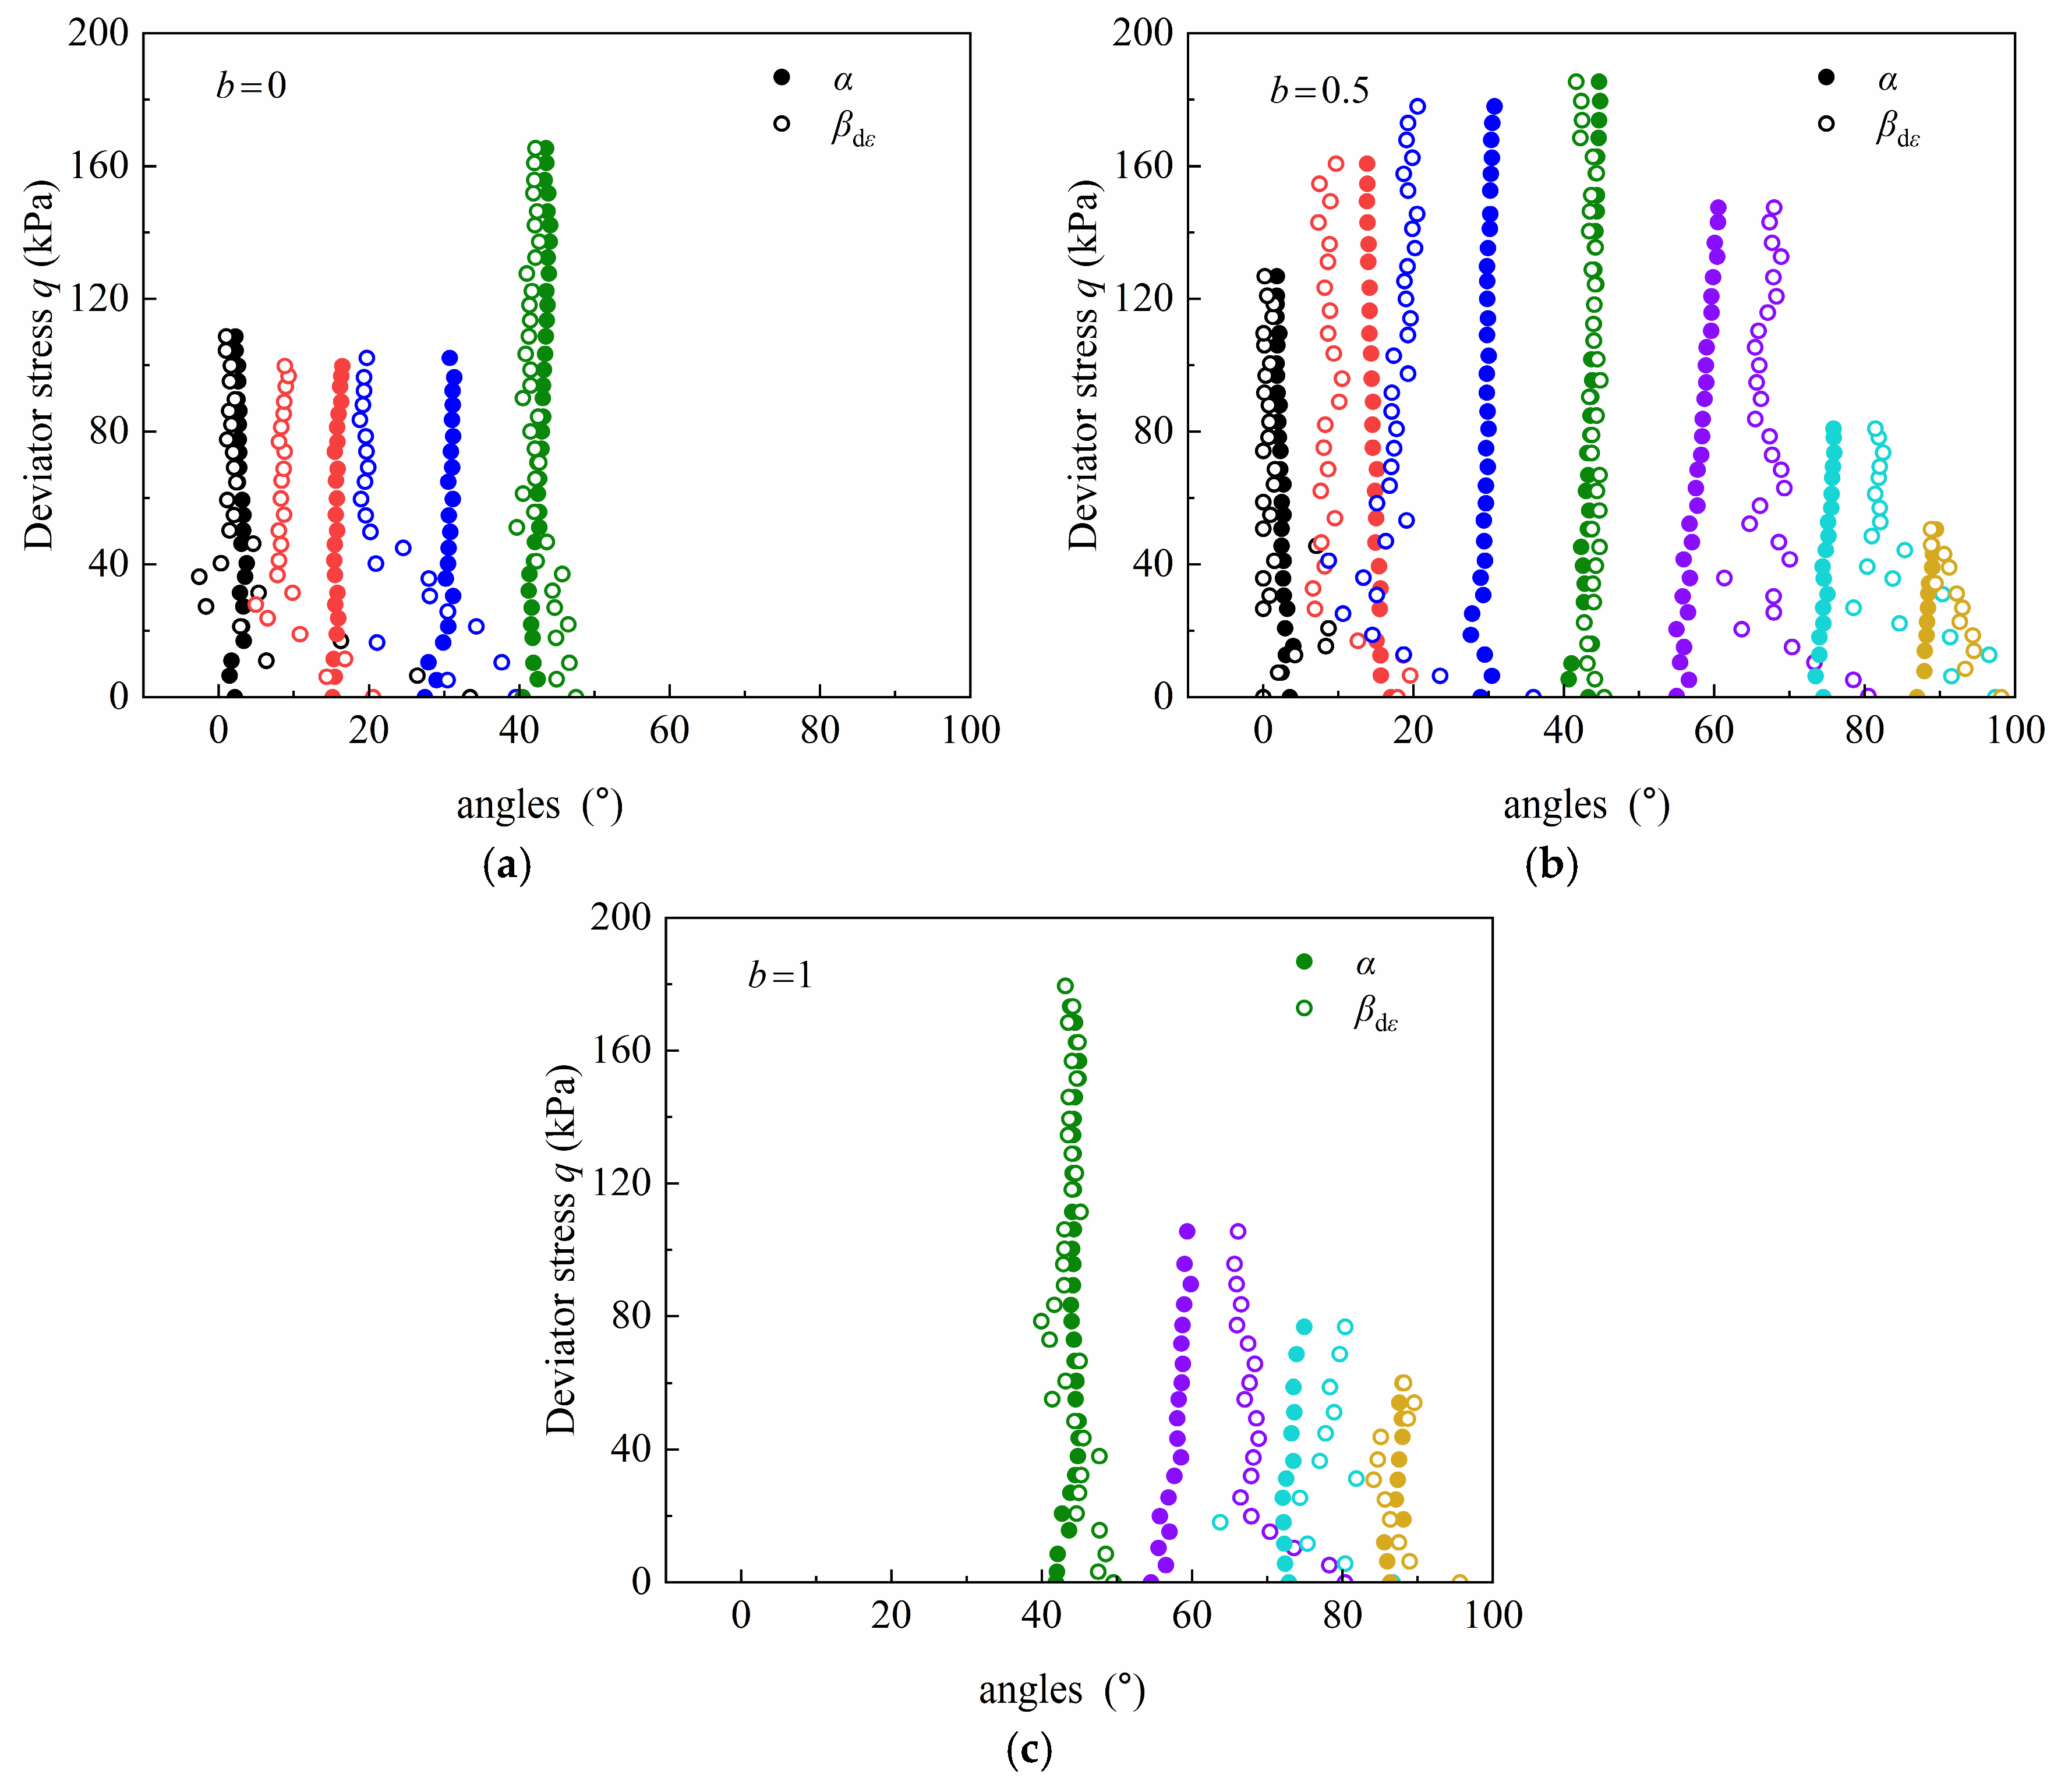
To analyze the effects of the intermediate principal stress and the principal stress direction on the non-coaxial characteristic of slope soil, Figure 12 illustrates the relationship between angle α and angle βdε for different b-values on slope soil specimens. Different colors indicate specimens from different angles α. During initial loading, both angle α and angle βdε exhibit instability. However, after experiencing slight fluctuations, angle α quickly reaches a stable state. This is consistent with the existing non-coaxial properties of silty sand [28]. βdε progressively stabilizes as the applied shear stress is incrementally raised. Regardless of the b-value, at α = 0°, α = 45°, and α = 90°, the α and βdε of the specimen are essentially coincident in the stable state, i.e., when the specimen is in pure compression, pure torsion-shear, and pure tension states, respectively, the specimen exhibits coaxial characteristics.
Figure 12.
Relationship between principal stress direction and principal strain increment direction for different b-values: (a) b = 0; (b) b = 0.5; (c) b = 1.
For b = 0, in the final steady state, angle α of the specimen is less than angle βdε at α = 15° and α = 30°, i.e., β < 0, indicating a distinct non-coaxial characteristic. The non-coaxial angle β for α = 30° exceeds that for α = 15°. For b = 0.5, the negative non-coaxial angles β for specimens at α = 15° and 30° are 4.1° and 10.2°, respectively. For α = 60° and 75°, the non-coaxial angles β of the specimens are 7.5° and 5.6°, respectively, but at this point, angle β is positive. For b = 1, the non-coaxial angles β of the specimens at α = 60° and 75° remain positive, at 6.8° and 5.4°, respectively. This demonstrates that there is a more pronounced non-coaxial characteristic at α = 30° and 60°. When α is less than 45°, the non-coaxial angle β of the specimen is negative, whereas when α is greater than 45°, the non-coaxial angle β of the specimen is positive.
4. Conclusions
A hollow cylinder apparatus was used to conduct directional shear tests on the slope soil to investigate its anisotropic characteristics under different principal stress direction angles α and intermediate principal stress coefficients b. This study offers theoretical insight into embankment slope behavior under anisotropic stress paths. It provides a mechanism-based interpretation derived from macroscopic mechanical responses and it does not include direct microstructural evidence. The conclusions primarily apply to shallow stress conditions (p = 40 kPa) and require validation under higher confining pressures.
- Under a constant b-value, the influence of the principal stress direction angle α on εr is minimal. As α increases, the axial strain εz transitions from compression to tension, whereas the circumferential strain εθ shows the reverse transition. The development of εz and εθ shows complementary behavior. Under shear loading conditions, shear stress τzθ peaks for α = 45°.
- The b-value governs the evolution direction of ε2. With an increasing b-value, ε2 transitions from negative to positive. Angle α controls the development rate of the principal strains. The principal strains display significant anisotropy for different angles α. During shearing, the soil first exhibits contraction then dilatancy behavior. For α = 45°, the specimens show a stronger contractive response, whereas for b = 0 they display enhanced dilatant behavior.
- During initial shearing under a constant b-value, the development rate of octahedral shear strain γoct is low for different angles α, causing a slow development of shear strains and a relatively high shear modulus. With progressive shearing, the shear strain rate increases, leading to rapid strain accumulation with a ductile response. For b = 0.5 and 1, specimens show more significant anisotropy in γoct than that for b = 0.
- For a given α, the normalized strength for b = 0.5 exceeds that for b = 0, 1. When b = 0.5, the normalized strength first increases then decreases, peaking at α = 45°. For b = 0, the strength increases gradually, while for b = 1 it decreases gradually. Under a constant b-value, the normalized strength displays significant anisotropy for different angles α. Under b = 0.5, the strength exhibits stronger anisotropy than that for b = 0 and b = 1.
- During initial loading, both the principal stress direction angle α and the principal strain increment direction βdε vary significantly. With increasing shear stress, angle α stabilizes after minor fluctuations, whereas βdε stabilizes with greater hysteresis. For α = 0°, 45°, and 90°, the specimens show a subtle non-coaxial characteristic. For α = 30° and 60°, they exhibit a pronounced non-coaxial characteristic. When α < 45°, β is negative. When α > 45°, β is positive.
Author Contributions
Conceptualization, Y.W.; Methodology, F.Z. and Y.W.; Software, Q.L. and S.B.; Validation, X.Z.; Formal analysis, N.C.; Resources, Y.W.; Data curation, X.Z. and Y.L.; Writing—original draft, F.Z.; Writing—review & editing, F.Z. and S.B. All authors have read and agreed to the published version of the manuscript.
Funding
This research was funded by the Program for Science and Technology Innovation Talents in Universities of Henan Province (24HASTIT014); Excellent Youth Fund of Henan Natural Science Foundation (232300421069); Central Plains Science and Technology Innovation Leader Project (234200510014); Henan Provincial Natural Science Foundation Interdisciplinary Innovative Research Group Project (252300421827).
Data Availability Statement
The original contributions presented in this study are included in the article. Further inquiries can be directed to the corresponding author.
Acknowledgments
We would like to thank the reviewers and editors for their thoughtful review of this paper.
Conflicts of Interest
The author Fengming Zhou was employed by the company Nanyang Yuzi Investment Development Co., Ltd. The author Xinqi Zhao, Quanling Li, Yu Li was employed by the company Nanyang Yuzi Hanshan Reservoir Construction and Management Co., Ltd. The remaining authors declare that the research was conducted in the absence of any commercial or financial relationships that could be construed as potential conflicts of interest.
References
- Li, Y.; Xie, Z.; Qin, F.; Qin, Y.C.; Zheng, Z.C.; Xia, H.M.; Zhang, L.J. Geomorphological characteristics of a transect from the Yellow River to the Iron Pagoda in Kaifeng city, China. Carpathian J. Earth Environ. Sci. 2019, 14, 245–254. [Google Scholar] [CrossRef] [Scilit]
- Wu, C.W.; Zhang, D.F.; Xia, H.; Luo, J.H.; Huang, H.F.; Qin, D. Embankment deformation characteristics analysis of an expressway widening project near a pond. Sci. Rep. 2023, 13, 717. [Google Scholar] [CrossRef] [Scilit]
- Hao, J.N.; Zhu, S.R.; Cheng, P.; Ren, G.X.; Du, L.B.; Li, Q.; Zhao, S.L. Effects of clay grains on the shear properties of unsaturated loess and microscopic mechanism. Sci. Rep. 2024, 14, 22666. [Google Scholar] [CrossRef] [Scilit]
- Nguyen, T.T.T.; Doanh, T.; Le Bot, A.; Dalmas, D. High-temporal-resolution quasideterministic dynamics of granular stick-slip. Sci. Rep. 2021, 11, 2902. [Google Scholar] [CrossRef] [Scilit]
- Yang, Y.; Kou, H.L.; Li, Z.H.; Jia, Y.G.; Zhu, C.Q. Normalized Stress-Strain Behavior of Deep-Sea Soft Soils in the Northern South China Sea. J. Mar. Sci. Eng. 2022, 10, 1142. [Google Scholar] [CrossRef] [Scilit]
- Marzuni, S.; Fadaee, M.; Bahmanpour, A.; Derakhshandi, M. Effect of Cyclic Stress Ratio and Non-Plastic Fines Content on the Liquefaction Potential of Sandy and Silty Soil in Cyclic Triaxial Testing. Soil Mech. Found. Eng. 2022, 58, 467–473. [Google Scholar] [CrossRef] [Scilit]
- Estabragh, A.R.; Javadi, A.A. Roscoe and Hvorslev Surfaces for Unsaturated Silty Soil. Int. J. Geomech. 2014, 14, 230–238. [Google Scholar] [CrossRef] [Scilit]
- Tang, Y.; Yang, Q.; Yu, H. Changes of the pore distribution of silty clay under the subway train loads. Environ. Earth Sci. 2014, 72, 3099–3110. [Google Scholar] [CrossRef] [Scilit]
- Bai, J.T.; Diao, Y.; Jia, C.H.; Liu, C.Y.; Zhang, M.H.; Wang, C. A Review of Advances in Triaxial Tests: Instruments, Test Techniques and Prospects. KSCE J. Civ. Eng. 2022, 26, 3325–3341. [Google Scholar] [CrossRef] [Scilit]
- Wang, G.; Feng, X.T.; Yang, C.X.; Han, Q.; Kong, R. Experimental Study of the Mechanical Characteristics of Jinping Marble Under Multi-stage True Triaxial Compression Testing. Rock Mech. Rock Eng. 2022, 55, 953–966. [Google Scholar] [CrossRef] [Scilit]
- Miura, K.; Miura, S.; Toki, S. Deformation behavior of anisotropic dense sand under principal stress axes rotation. Soils Found. 1986, 26, 36–52. [Google Scholar] [CrossRef] [Scilit]
- Jafarzadeh, F.; Zamanian, M. Effect of stress direction on the undrained monotonic and cyclic behavior of dense sands. Sci. Iran. 2020, 27, 551–565. [Google Scholar] [CrossRef] [Scilit]
- Xiong, H.; Guo, L.; Cai, Y.Q.; Yang, Z.X. Experimental study of drained anisotropy of granular soils involving rotation of principal stress direction. Eur. J. Environ. Civ. Eng. 2016, 20, 431–454. [Google Scholar] [CrossRef] [Scilit]
- Rodriguez, N.M.; Lade, P.V. Non-coaxiality of strain increment and stress directions in cross-anisotropic sand. Int. J. Solids Struct. 2014, 51, 1103–1114. [Google Scholar] [CrossRef] [Scilit]
- Cai, Y.Y.; Yu, J.; Yu, H.S.; Guo, L.Q. Experimental study on effect of loading path on non-coaxiality of granular materials. Chin. J. Geotech. Eng. 2012, 34, 1117–1122. [Google Scholar]
- Yu, Y.L.; Zhang, J.M.; Tong, Z.X.; Zhang, G. Behavior of anisotropic mica sand under fixed principal stress axes drained shear test. Rock Soil Mech. 2011, 32, 1637–1642. [Google Scholar]
- Shen, Y.; Zhou, J.; Gong, X.N.; Liu, H.-L. Experimental study of stress-strain properties of intact soft clay considering the change of principal stress direction. Rock Soil Mech. 2009, 30, 3720–3726. [Google Scholar]
- Zhou, J.; Yan, J.J.; Liu, Z.Y.; Gong, X.N. Undrained anisotropy and non-coaxial behavior of clayey soil under principal stress rotation. J. Zhejiang Univ.-Sci. A 2014, 15, 241–254. [Google Scholar] [CrossRef] [Scilit]
- Zhang, J.; Meng, Q.; Zhang, Y.; Feng, X.L.; Wei, G.L.; Su, X.T.; Liu, T. Effect of Penetration Rates on the Piezocone Penetration Test in the Yellow River Delta Silt. J. Ocean Univ. China 2022, 21, 361–374. [Google Scholar] [CrossRef] [Scilit]
- Kumruzzaman, M.; Yin, J. Influences of principal stress direction and intermediate principal stress on the stress-strain-strength behaviour of completely decomposed granite. Can. Geotech. J. 2010, 47, 164–179. [Google Scholar] [CrossRef] [Scilit]
- Zdravkovic, L.; Jardine, R. Some anisotropic stiffness characteristics of a silt under general stress conditions. Geotechnique 1997, 47, 407–437. [Google Scholar] [CrossRef] [Scilit]
- Shen, Y.; Liang, H.; Ge, H.-Y.; Yu, Y.-M.; Shen, X. Fixed-axis shear characteristics of anisotropic calcareous sand under variation of principal stress axes. Chin. J. Geotech. Eng. 2020, 42, 22–26. [Google Scholar] [CrossRef]
- Chen, D.; Ma, W.; Li, G.; Zhou, Z.; Mu, Y.; Chen, S. Definition of failure criterion for frozen soil under directional shear-stress path. Sci. Cold Arid Reg. 2019, 11, 428–434. [Google Scholar]
- Yang, A.W.; Yang, S.K.; Yu, Y.P. Dynamic properties of dredger fill involved coupling action of initial stress and principal stress rotation. Mar. Georesources Geotechnol. 2024, 42, 825–839. [Google Scholar] [CrossRef] [Scilit]
- Raj, S.V.D.; Mukherjee, M.; Peña-Olarte, A.A.; Cudmani, R. Influence of intermediate principal stress and rolling resistance on the shearing response of sand: A micromechanical investigation. Comput. Part. Mech. 2025, 12, 107–132. [Google Scholar] [CrossRef] [Scilit]
- Li, B.; Chen, L.L.; Gutierrez, M. Influence of the intermediate principal stress and principal stress direction on the mechanical behavior of cohesionless soils using the discrete element method. Comput. Geotech. 2017, 86, 52–66. [Google Scholar] [CrossRef] [Scilit]
- Lashkari, A.; Latifi, M. A non-coaxial constitutive model for sand deformation under rotation of principal stress axes. Int. J. Numer. Anal. Methods Geomech. 2008, 32, 1051–1086. [Google Scholar] [CrossRef] [Scilit]
- Triantafyllos, P.; Georgiannou, V.; Dafalias, Y.; Georgopoulos, I. Novel findings on the dilatancy and non-coaxiality of sand under generalised loading. Acta Geotech. 2021, 16, 1699–1734. [Google Scholar] [CrossRef] [Scilit]
- Yang, L.T.; Li, X.; Yu, H.S.; Wanatowski, D. A laboratory study of anisotropic geomaterials incorporating recent micromechanical understanding. Acta Geotech. 2016, 11, 1111–1129. [Google Scholar] [CrossRef] [Scilit]
- Zhuang, H.; Hu, X.; Guo, L.; Li, M.; Wang, C.; Du, H.; Jin, J. Effect of initial deviatoric stress on anisotropy of marine clay during principal stress rotation. Mar. Georesources Geotechnol. 2022, 40, 64–77. [Google Scholar] [CrossRef] [Scilit]
- Qian, J.; Du, Z.; Lu, X.; Gu, X.; Huang, M. Effects of principal stress rotation on stress–strain behaviors of saturated clay under traffic–load–induced stress path. Soils Found. 2019, 59, 41–55. [Google Scholar] [CrossRef] [Scilit]
- Yan, J.; Zhou, J.; Gong, X.; Cao, Y. Undrained response of reconstituted clay to cyclic pure principal stress rotation. J. Cent. South Univ. 2015, 22, 280–289. [Google Scholar] [CrossRef] [Scilit]
- Tong, Z.X.; Zhang, J.M.; Yu, Y.L.; Zhang, G. Drained deformation behavior of anisotropic sands during cyclic rotation of principal stress axes. J. Geotech. Geoenvironmental Eng. 2010, 136, 1509–1518. [Google Scholar] [CrossRef] [Scilit]
- Liang, Z.; Liu, Y.; Liu, Z. The undrained behaviour of over-consolidated clay subjected to pure rotation of principal stress directions. Mar. Georesources Geotechnol. 2023, 41, 1013–1025. [Google Scholar] [CrossRef] [Scilit]

Disclaimer/Publisher’s Note: The statements, opinions and data contained in all publications are solely those of the individual author(s) and contributor(s) and not of MDPI and/or the editor(s). MDPI and/or the editor(s) disclaim responsibility for any injury to people or property resulting from any ideas, methods, instructions or products referred to in the content. |
© 2026 by the authors. Licensee MDPI, Basel, Switzerland. This article is an open access article distributed under the terms and conditions of the Creative Commons Attribution (CC BY) license.