


Abstract
Unfavorable flow patterns, such as vortices and backflow in pump station forebays, can deteriorate pump suction conditions and exacerbate sediment deposition. This study investigates the effects of different pump unit operation combinations on the flow patterns in the forward-intake forebay of the Hongsi Pumping Station. A three-dimensional numerical model was established using the RNG k-ε turbulence model combined with the VOF method for free surface tracking, with Enhanced Wall Treatment employed for the near-wall region. The model was validated against field measurements, with mean absolute errors of 0.058 and 0.085 for two characteristic lines, respectively. Four unit operation combination schemes were simulated and compared. Results show that the velocity in the front end of the main flow zone reaches 0.344–0.345 m/s across all schemes, which is 19–24% higher than in the middle section and 26–37% higher than in the rear section. The inter-scheme velocity variation is minimal near the forebay inlet (1.1% at section X1) but increases significantly near the pump inlets (approximately 11% at section X4), indicating that unit operation combinations primarily affect the rear forebay region. Large-scale vortices are observed near the side walls and pump inlets, with vortex cores located at different positions depending on the operation scheme. When the units at both ends are operated symmetrically (Scheme 1: units 1#, 2#, 5#, 6#), the flow pattern is the most favorable, displaying characteristic dual-core vorticity distribution with symmetric pattern and moderate intensity, with the velocity uniformity at the inlet section reaching 81.77%, which is 5.21, 11.35, and 1.91 percentage points higher than Schemes 2, 3, and 4, respectively. For practical operation, Scheme 4 (1#, 2#, 4#, 5#) can serve as an alternative with a velocity uniformity of 79.86%, while central concentration and single-side bias configurations should be avoided due to their larger vortex scales and lower velocity uniformity. The findings provide quantitative guidance for the operation management of forward-intake pump stations.
1. Introduction
The pumping station is the core facility in the irrigation system, and the forebay, as the key inlet structure connecting the approach channel to the pumps, directly affects the flow structure and water supply efficiency through its hydraulic performance [1]. In pumping stations extracting water from sediment-laden rivers, the problem of sediment deposition in the forebay is particularly prominent. Therefore, the design and operation of the forebay flow structure must not only meet hydrodynamic requirements but also take into account the movement patterns of suspended sediment [2]. Different pump operation combinations have significant effects on the flow structure in the forebay. Improper operation modes can easily induce unfavorable flow conditions such as vortices and backflow in the forebay, deteriorating the pump suction conditions, increasing energy consumption, and shortening the service life of the units [3]. Meanwhile, uneven velocity distribution can exacerbate sediment deposition, further reducing water conveyance efficiency [4]. More seriously, continuous sediment deposition will alter the original flow conditions in the forebay, forming a vicious cycle of “flow condition deterioration—aggravated sediment deposition,” ultimately leading to insufficient effective volume in the forebay and severely affecting the irrigation water supply capacity [5]. The effects of pump unit operation combinations on forebay flow patterns have been extensively investigated through numerical simulations and physical experiments. In forward-intake forebays, Hu et al. [6] employed three-dimensional turbulent numerical simulation using Fluent software and found that symmetric interval startup of units produces favorable flow patterns with reduced sediment deposition in large-scale multi-unit pumping stations. Wang et al. [7] investigated water-sediment two-phase flow under five unit operation combinations using the Mixture multiphase flow model and Realizable k-ε turbulence model, demonstrating that optimized combinations can reduce the flow deflection angle by 3.35°, improve velocity uniformity by 5.84 percentage points, and decrease sediment concentration by 58.60%. For lateral-intake forebays, Xu et al. [8] conducted numerical simulations of 10 different unit operation combinations in sediment-laden river conditions, concluding that symmetric operation while avoiding shutdown of end units, especially terminal units, produces more stable flow conditions. Li et al. [9] applied entropy production theory for the first time to analyze hydraulic losses in lateral-intake forebays, revealing that turbulence dissipation accounts for over 90% of total hydraulic loss and proposing an optimal strategy of prioritizing downstream unit startup. Wang et al. [10] proposed nine unit operation combinations for lateral forebays, achieving an 18.63% improvement in velocity uniformity and a 75.47% reduction in vortex area through optimization. Zi et al. [11] demonstrated that when side units are non-operational, flow field symmetry is disrupted, forming dead water zones that significantly increase sediment concentration.
Regarding flow rectification measures, various engineering modifications have been proposed to improve forebay flow conditions. Liu et al. [12,13] conducted experimental and numerical studies on combined sills, successfully eliminating large-scale circulations and vortices in forebays. Luo et al. [14] investigated the influence of bottom sill positions and identified optimal locations for uniform flow distribution. Mi et al. [15] compared different sill configurations based on Eulerian solid–liquid two-phase flow models, finding that discontinuous bottom sills are most effective in eliminating surface backflow while reducing sediment accumulation. For lateral-intake configurations, Nasr et al. [16] demonstrated that parabolic walls combined with rectification piers can improve velocity uniformity by 8% and reduce vortex area by 70%. Zhang et al. [17] applied the orthogonal test method to optimize diversion pier layouts, significantly improving axial velocity uniformity and weighted average flow angle. Li et al. [18] conducted physical model experiments showing that additional flow isolation piers increased inlet flow uniformity by 9% and 2% at different inlets.
From the perspective of numerical methodology, various approaches have been developed for forebay flow simulation. Dou et al. [19] established a two-dimensional mathematical model in orthogonal curvilinear coordinates to predict flow and sediment deposition characteristics. Liu et al. [20] combined steady-state simulation with unsteady VOF modeling, successfully reproducing free surface distribution and the development process of air-entraining vortices. Lv et al. [21] employed the coupled VOF and Level Set method to investigate the formation mechanism of suction vortices under high flow rates, elucidating the correlation between entrained vortex development and excessive inflow angles. Li et al. [22] conducted systematic hydraulic model experiments, measuring velocity distribution, water level variations, and head loss under different operating conditions.
Despite these advances, three critical knowledge gaps remain in the current understanding of forebay flow patterns. First, regarding the research object, most investigations on unit operation combinations have focused on lateral-intake forebays [3,4,5,11,12] or water-sediment two-phase flow conditions [2,3,5,6], while systematic studies on forward-intake forebays under pure water flow conditions remain scarce. Although Hu et al. [6] examined a forward-intake forebay with clear water, the analysis was limited to planar flow structures without a comprehensive three-dimensional evaluation. Second, concerning the analysis methodology, existing studies have predominantly examined flow fields from single perspectives—Liu et al. [13] focused primarily on longitudinal velocity characteristics, while Lv et al. [21] concentrated on cross-sectional velocity distributions and uniformity at inlet sections. A comprehensive analysis integrating longitudinal, transverse, and vertical velocity distributions under different unit operation combinations has not been systematically conducted. Third, with respect to quantitative evaluation, while various indicators such as velocity uniformity, flow deflection angle, and vortex area have been employed individually, a systematic multi-directional evaluation framework for comparing unit operation combinations in forward-intake forebays is lacking.
Although previous studies have investigated the flow patterns in pump station forebays under different unit operation combinations, most of them focused on lateral-intake configurations or water-sediment two-phase flow characteristics. Research on forward-intake forebays with pure water flow conditions remains relatively limited. Moreover, existing studies often analyzed the flow field from a single perspective, lacking a comprehensive evaluation from multiple directions, including longitudinal, transverse, and vertical velocity distributions. Therefore, further investigation is necessary to systematically understand the three-dimensional flow characteristics in forward-intake forebays and to identify optimal unit operation strategies. The objective of this study is to investigate the effects of different pump unit operation combinations on the flow patterns in the forward-intake forebay of the Hongsi Pumping Station, using a combination of numerical simulation and field measurement. The main contributions of this work include: (1) establishing a validated three-dimensional numerical model using the RNG k-ε turbulence model with Enhanced Wall Treatment, which accounts for the effects of swirl on turbulence; (2) conducting a comprehensive analysis of velocity distributions from three directions (longitudinal, transverse, and vertical) under four unit operation combinations; and (3) quantitatively evaluating the velocity uniformity and identifying the optimal operation scheme that achieves 81.77% velocity uniformity at the inlet section.
2. Materials and Methods
2.1. Research Object
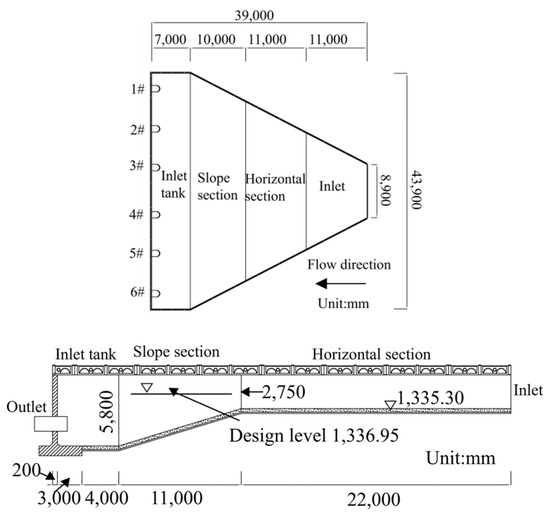
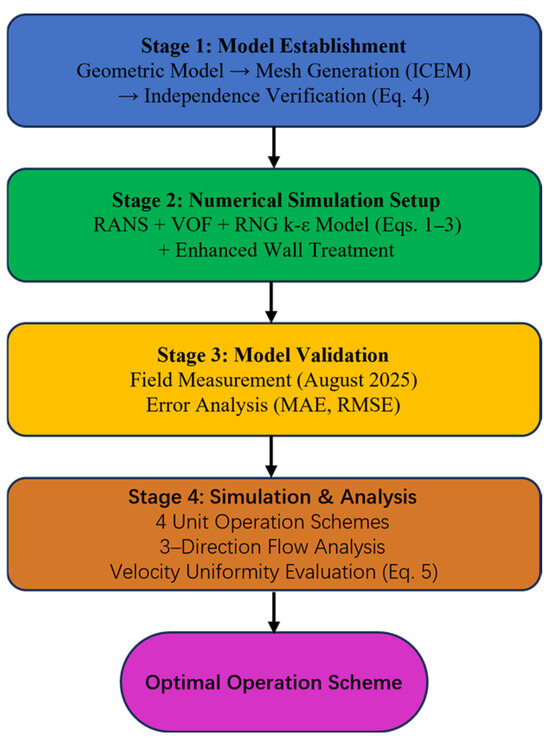
The Hongsibu Water Diversion Project is an important component of the Ningxia Poverty Alleviation Yellow River Irrigation Project. Located in the core area of the arid zone in central Ningxia, it undertakes the critical water supply tasks for agricultural irrigation, domestic and industrial water use, and ecological water consumption for one million mu (approximately 66,667 hectares) of farmland and a population of 300,000. After the renovation in 2018, problems such as adverse flow conditions, severe sediment deposition, poor flow conveyance, and insufficient effective capacity in the forebay still persist. The forward-intake forebay of the Hongsi Pumping Station consists of an inlet section, a horizontal section, a gentle slope section, and an intake basin. The total length of the forebay is 39 m, with an inlet section width of 8.9 m and an intake basin width of 43.9 m. The diffusion angle of the side walls is 29°, and the slope of the gentle slope section at the bottom is 16°. The design discharge of the pumping station is 4.19 m3/s, and the design water level of the intake basin is 1336.95 m. Six units are installed (four in operation and two on standby). The structural configuration of the forebay is shown in Figure 1.
Figure 1.
Structural diagram of the forward-intake forebay of the Hongsi Pumping Station.
2.2. Research Methodology
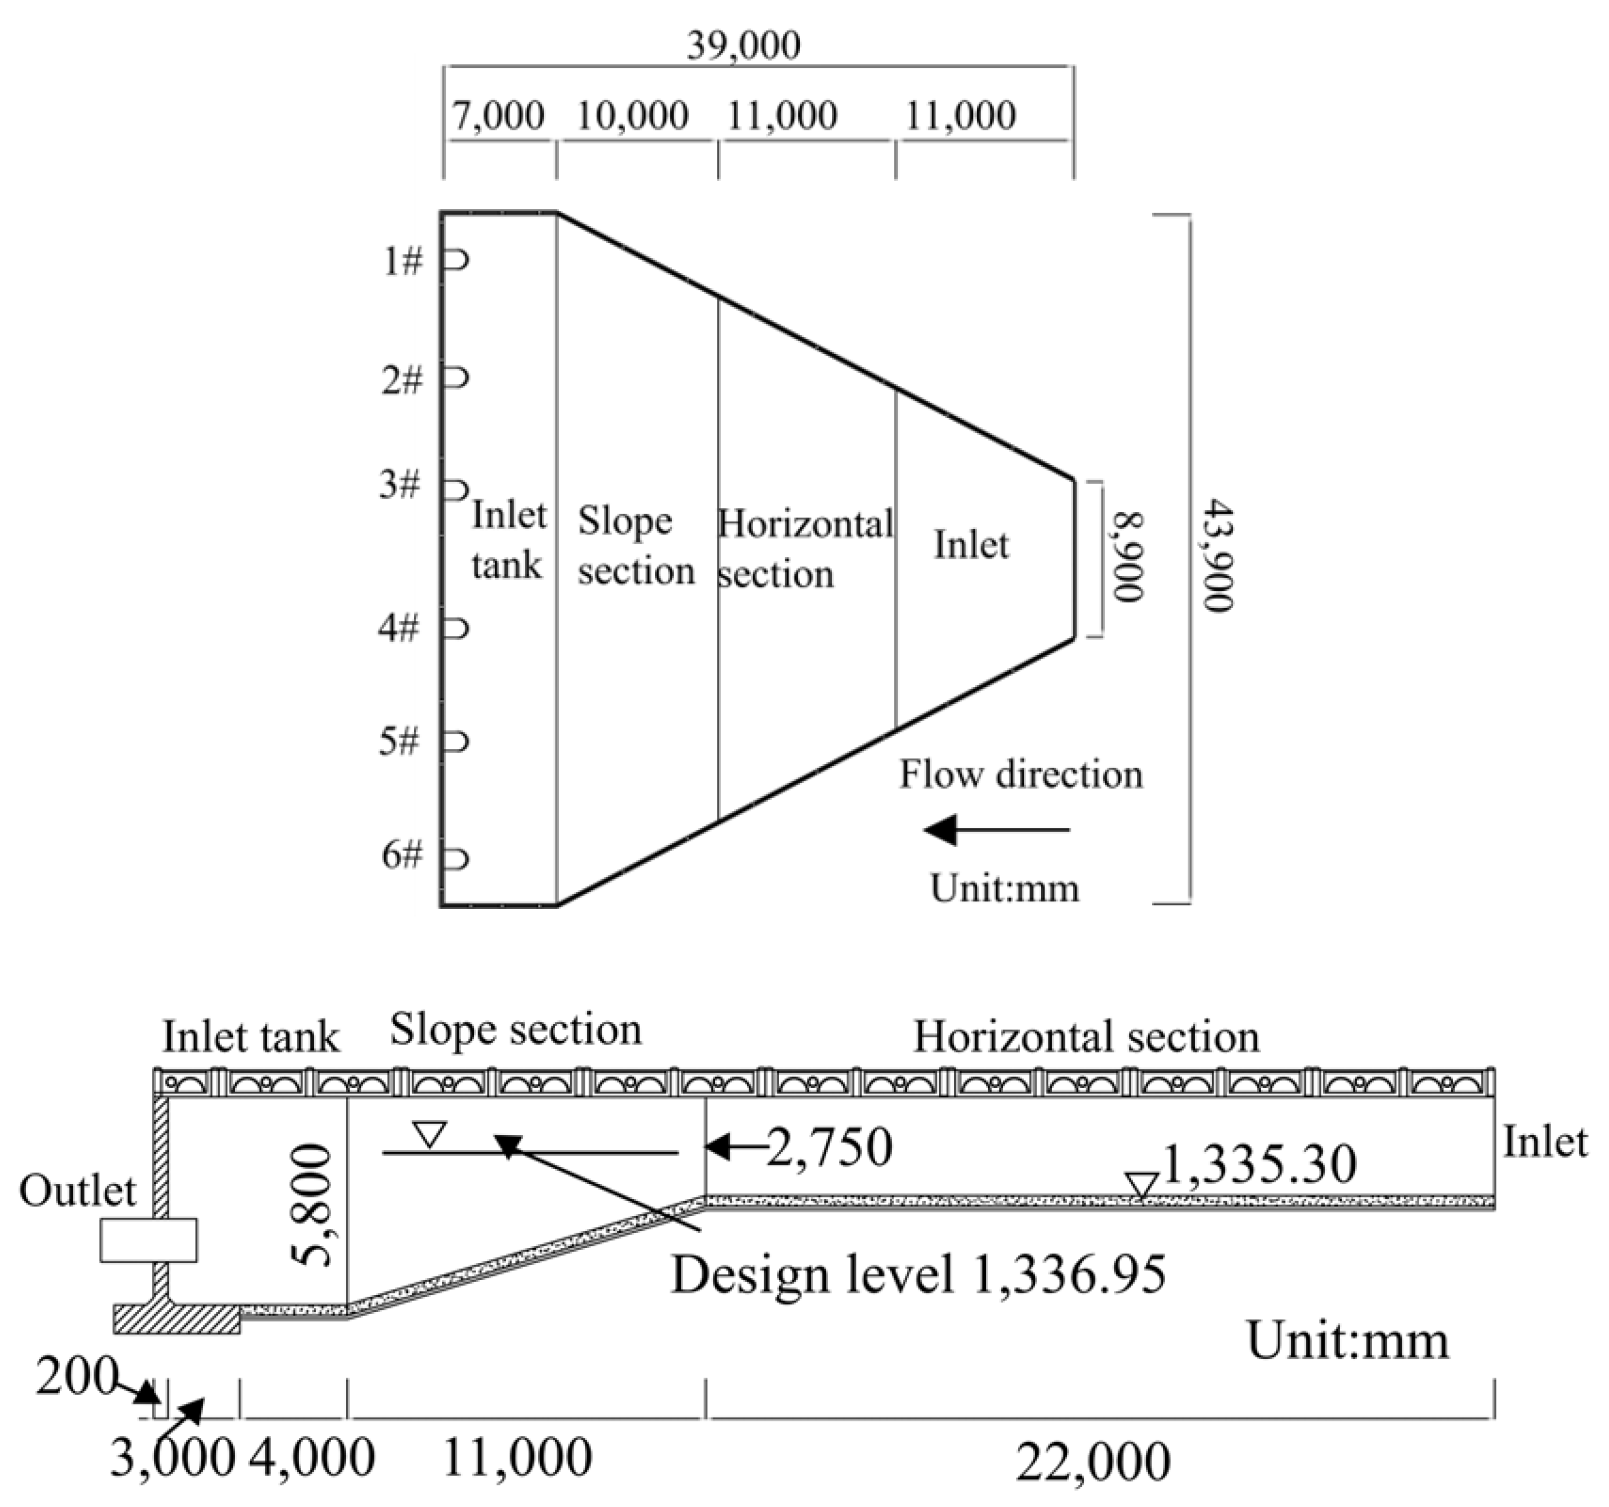
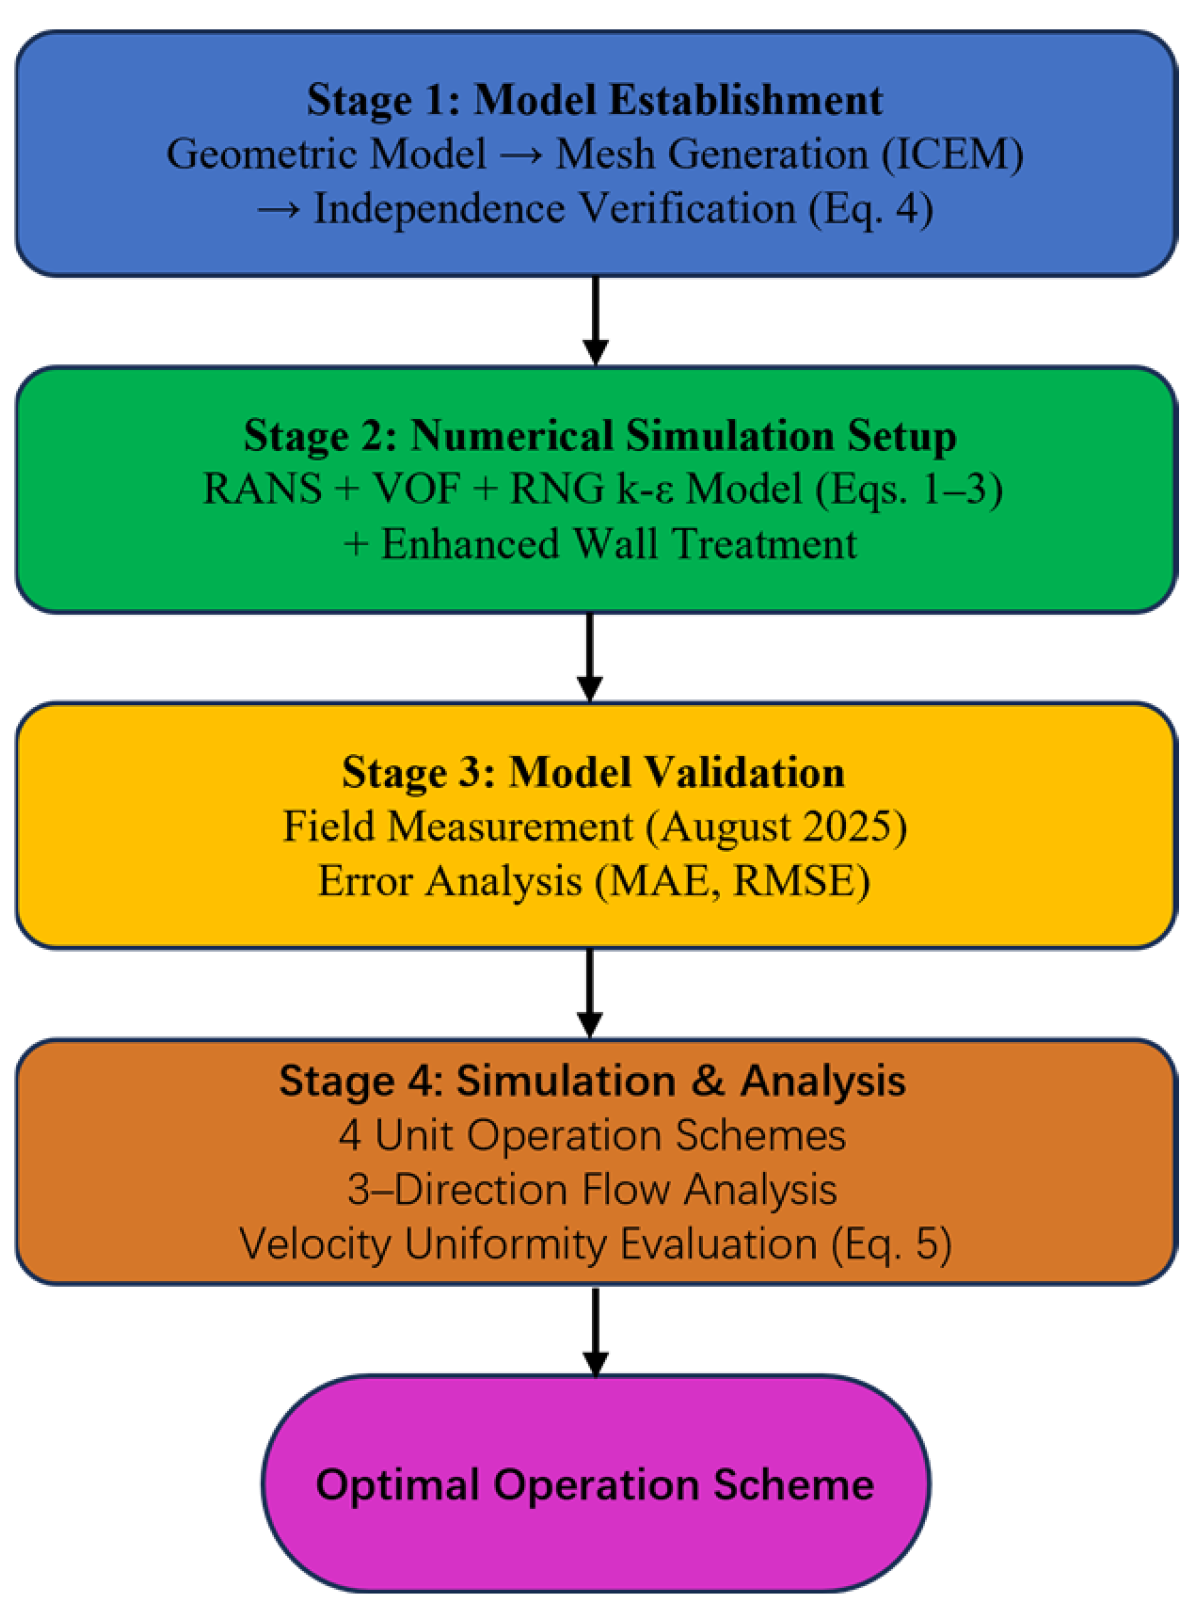
This study employs a combination of numerical simulation and field measurement to investigate the flow patterns in the forward-intake forebay under different unit operation combinations. The overall research methodology is illustrated in Figure 2, which shows the relationships among the different methods, governing equations, and analysis procedures used throughout this study.
Figure 2.
Flowchart of the research methodology.
The research methodology consists of four main stages. In the first stage, the geometric model of the forebay was established based on the actual dimensions of the Hongsi Pumping Station, and structured meshes were generated using ICEM software (2023). Mesh independence verification was conducted using head loss as the evaluation criterion (Equation (4)) to ensure the reliability of the computational results.
In the second stage, the numerical model was established based on the Reynolds-averaged Navier–Stokes (RANS) equations for incompressible flow. The Volume of Fluid (VOF) method was adopted to track the free surface between air and water phases. The RNG k-ε turbulence model (Equations (1)–(3)) was selected to simulate the turbulent flow characteristics, with Enhanced Wall Treatment employed for the near-wall region. This turbulence model was chosen because it incorporates an additional term that accounts for the effects of swirl on turbulence, making it particularly suitable for simulating the vortex structures observed in the forebay.
In the third stage, the numerical model was validated against field measurements conducted in August 2025. The simulated velocity distributions along characteristic lines were compared with the measured data, and the mean absolute error and root mean square error were calculated to quantify the model accuracy.
In the fourth stage, four unit operation combination schemes were simulated using the validated model. The flow patterns were analyzed from three directions: planar flow structure at different water depths, velocity distributions along transverse sections, and velocity distributions along longitudinal sections and the water depth direction. The velocity uniformity (Equation (5)) was adopted as the quantitative evaluation criterion to identify the optimal unit operation combination.
2.3. Governing Equations and Turbulence Modeling
The flow in the pumping station forebay is characterized as high Reynolds number, incompressible, three-dimensional turbulent flow with a free surface. To capture these flow features, this study employs the Reynolds-averaged Navier–Stokes (RANS) equations for incompressible flow coupled with the Volume of Fluid (VOF) method and the RNG k-ε turbulence model [23]. The fundamental RANS equations and VOF formulations are well established and can be found in standard references.
The VOF method was adopted to track the free surface between air and water phases, which is essential for accurately simulating the water surface variations in the forebay under different operating conditions. A single set of momentum equations is solved for the mixture, and the volume fraction of each phase is tracked throughout the computational domain. The RNG k-ε turbulence model was adopted in this study because it incorporates an additional term in the dissipation rate equation that accounts for the effects of swirl on turbulence, making it particularly suitable for simulating the vortex structures observed in the forebay. Additionally, this model provides improved predictions for flows with high strain rates and streamline curvature, which are characteristic of the diffusing flow in pump station forebays. The Enhanced Wall Treatment was employed for the near-wall region, with the y+ value maintained around 86. This treatment is suitable for the present study, as the primary focus is on the overall flow patterns in the forebay rather than the detailed boundary layer characteristics near the walls. Compared with more complex models such as RSM or LES, the RNG k-ε model offers a good balance between accuracy and computational cost, which is beneficial for the parametric studies involving multiple operating conditions in this research. The transport equations for turbulent kinetic energy k and dissipation rate ε in the RNG k-ε model are expressed as:
where represents the generation of turbulent kinetic energy due to the mean velocity gradients; is the effective dynamic viscosity; and are the inverse effective Prandtl numbers for k and ε, respectively. The coefficient is defined as:
where , and S is the modulus of the mean strain rate tensor. This additional term in distinguishes the RNG model from the standard k-ε model and improves the accuracy for swirling flows and flows with high strain rates. The model constants are: , , , , , and .
2.4. Computational Model and Boundary Conditions
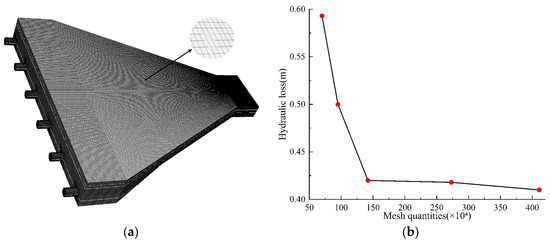
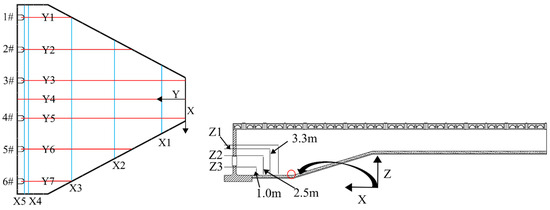
The three-dimensional geometric model of the forward-intake forebay was established based on the actual engineering dimensions and imported into ANSYS ICEM CFD 2024 R1 for mesh generation. Considering the geometric characteristics of the forebay structure, structured hexahedral meshes were adopted to ensure computational accuracy and efficiency. Local mesh refinement was applied to regions with complex flow patterns, including the inlet section, the areas near the trash racks, and the suction pipes of the pump units. The total number of mesh elements was approximately 2.8 million after the independence verification (Figure 3).
Figure 3.
Mesh generation and verification analysis of the forebay: (a) Mesh discretization of the forebay; (b) Mesh independence verification analysis.
To ensure the reliability of the numerical results, a mesh independence study was conducted by comparing three mesh schemes with different resolutions (coarse: 1.5 million, medium: 2.8 million, and fine: 4.2 million elements). The head loss [24] coefficient was selected as the evaluation criterion, calculated using Equation (4). The results showed that the relative difference between the medium and fine mesh schemes was less than 2%, indicating that the medium mesh scheme was sufficient for the present study. The mesh quality was also checked, with the minimum orthogonal quality exceeding 0.3 and the maximum aspect ratio below 50, meeting the requirements for CFD simulations.
where h is the head loss (m); pin is the total pressure at the inlet (Pa); pout is the total pressure at the outlet (Pa); p is the water density (kg/m3); and g is the gravitational acceleration (m/s2).
The boundary conditions were specified as follows: the inlet boundary was set as a velocity inlet [25] with a uniform velocity distribution of 0.345 m/s, which was obtained from field measurements using an Acoustic Doppler Velocimeter (ADV); the outlet boundaries at the suction pipes were defined as outflow conditions according to the flow distribution among the operating units; the free water surface was treated using the VOF method with a pressure inlet boundary for the air phase; the solid walls including the bottom, side walls, and trash racks were treated as no-slip walls with the Enhanced Wall Treatment. The simulations were performed under steady-state conditions using the SIMPLEC [26] algorithm for pressure-velocity coupling. The convergence criterion was set as residuals below 10−4 for all equations, and the flow rate balance error between the inlet and outlets was less than 0.5%.
To investigate the effects of different unit operation combinations on the flow structure in the forward-intake forebay, the geometric configuration of the forebay was kept unchanged. Under the condition of meeting the normal water supply demand, the number of operating pump units was adjusted, and numerical simulations were conducted for four operating conditions. The unit operation combination schemes are presented in Table 1.
Table 1.
Pump unit combination schemes.
2.5. Selection of Characteristic Cross-Sections and Evaluation Criteria
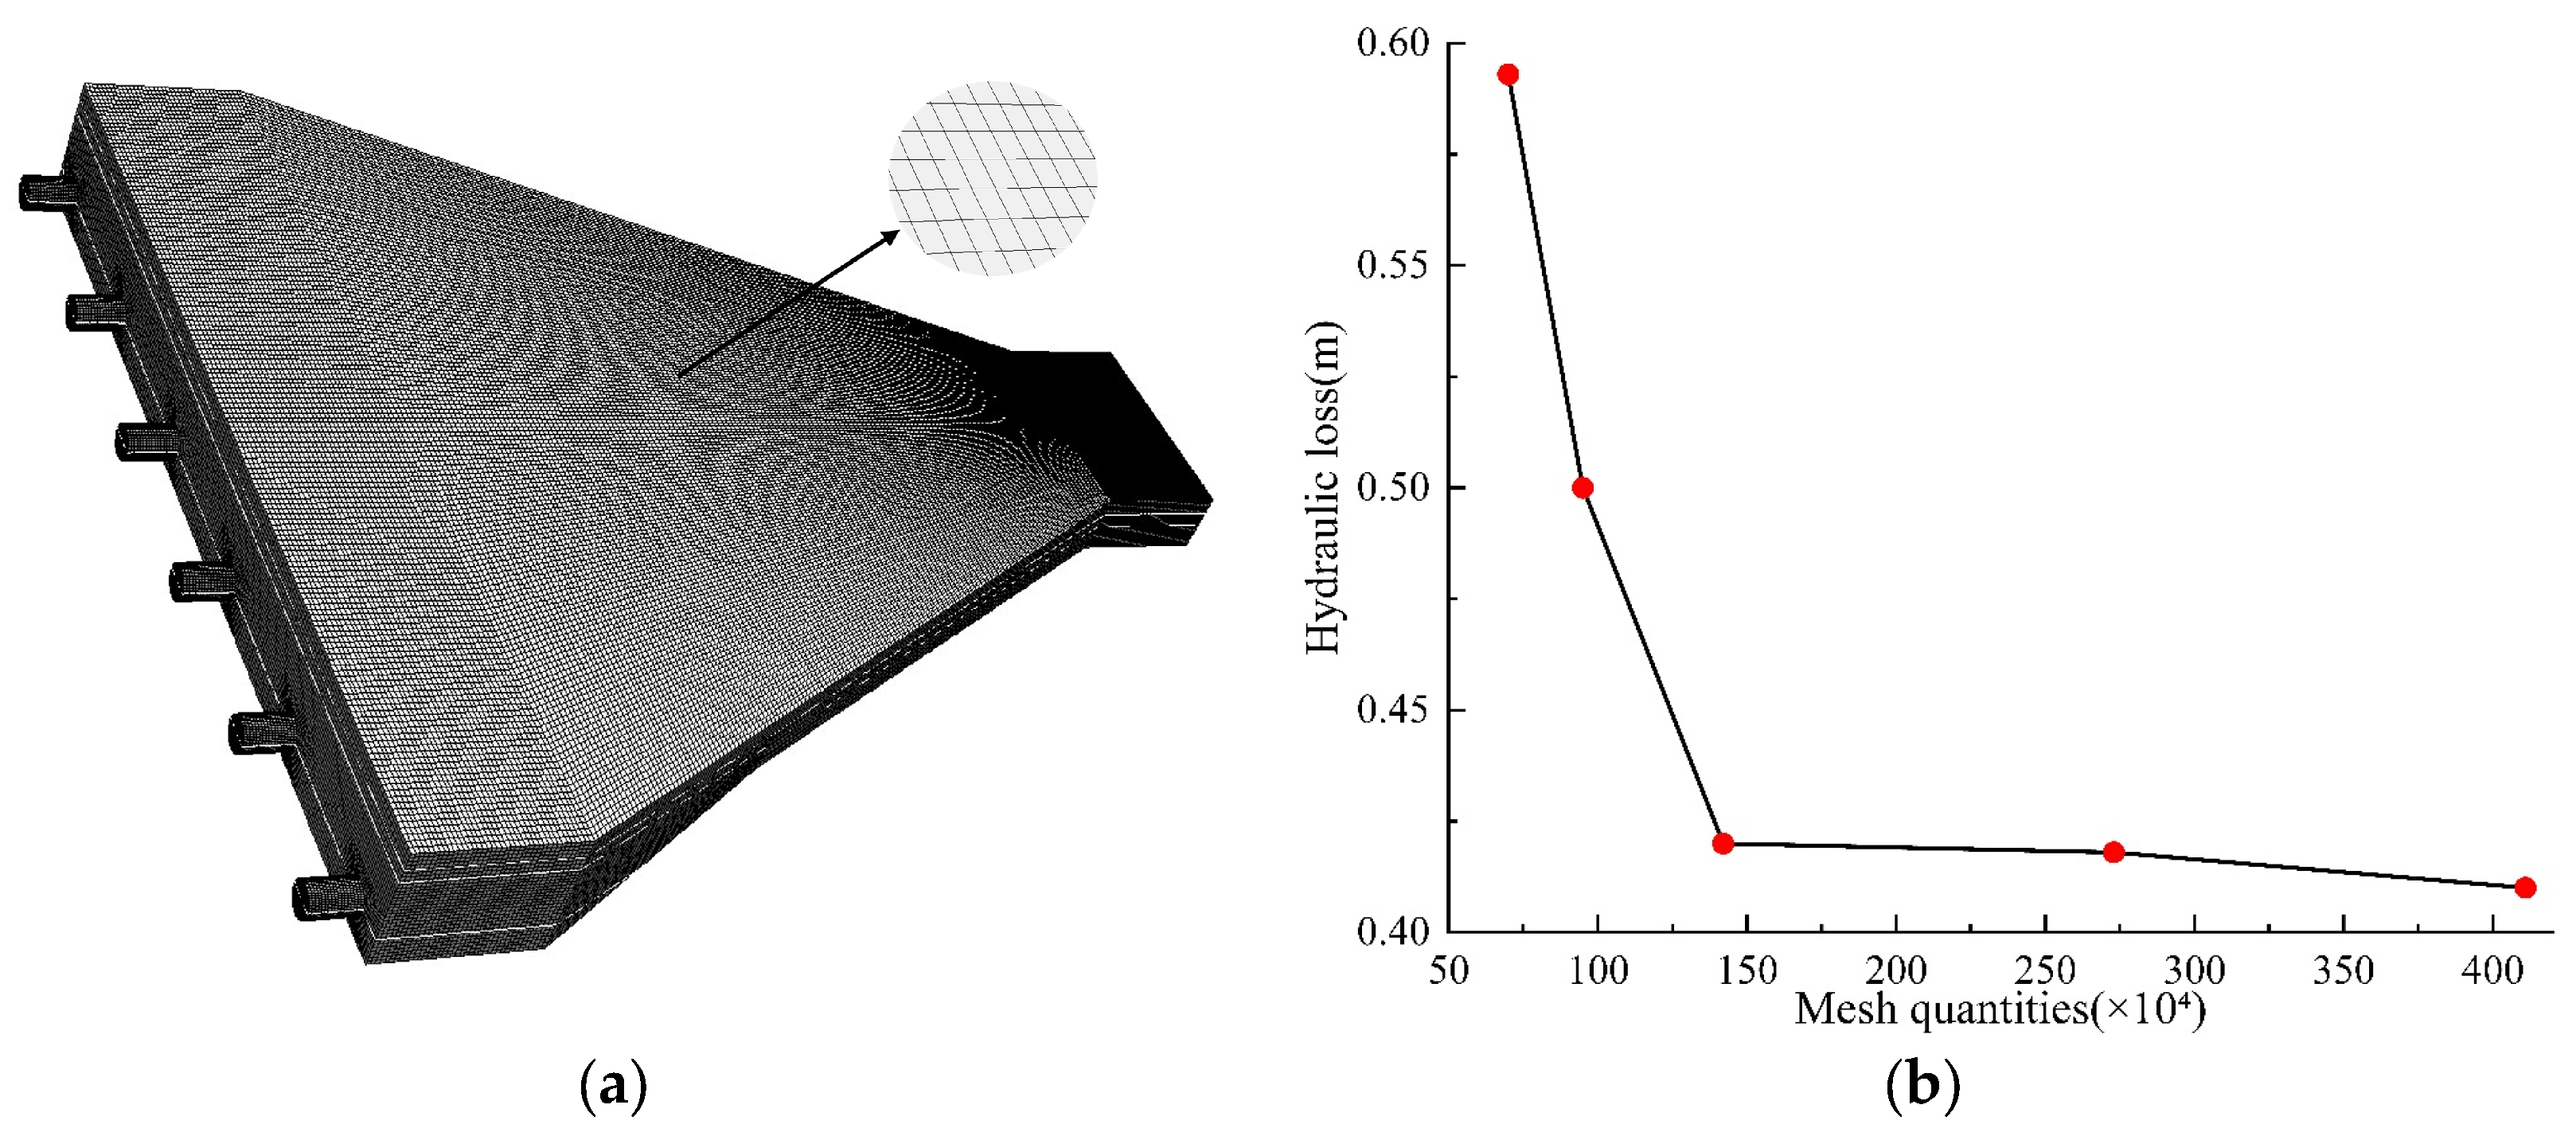
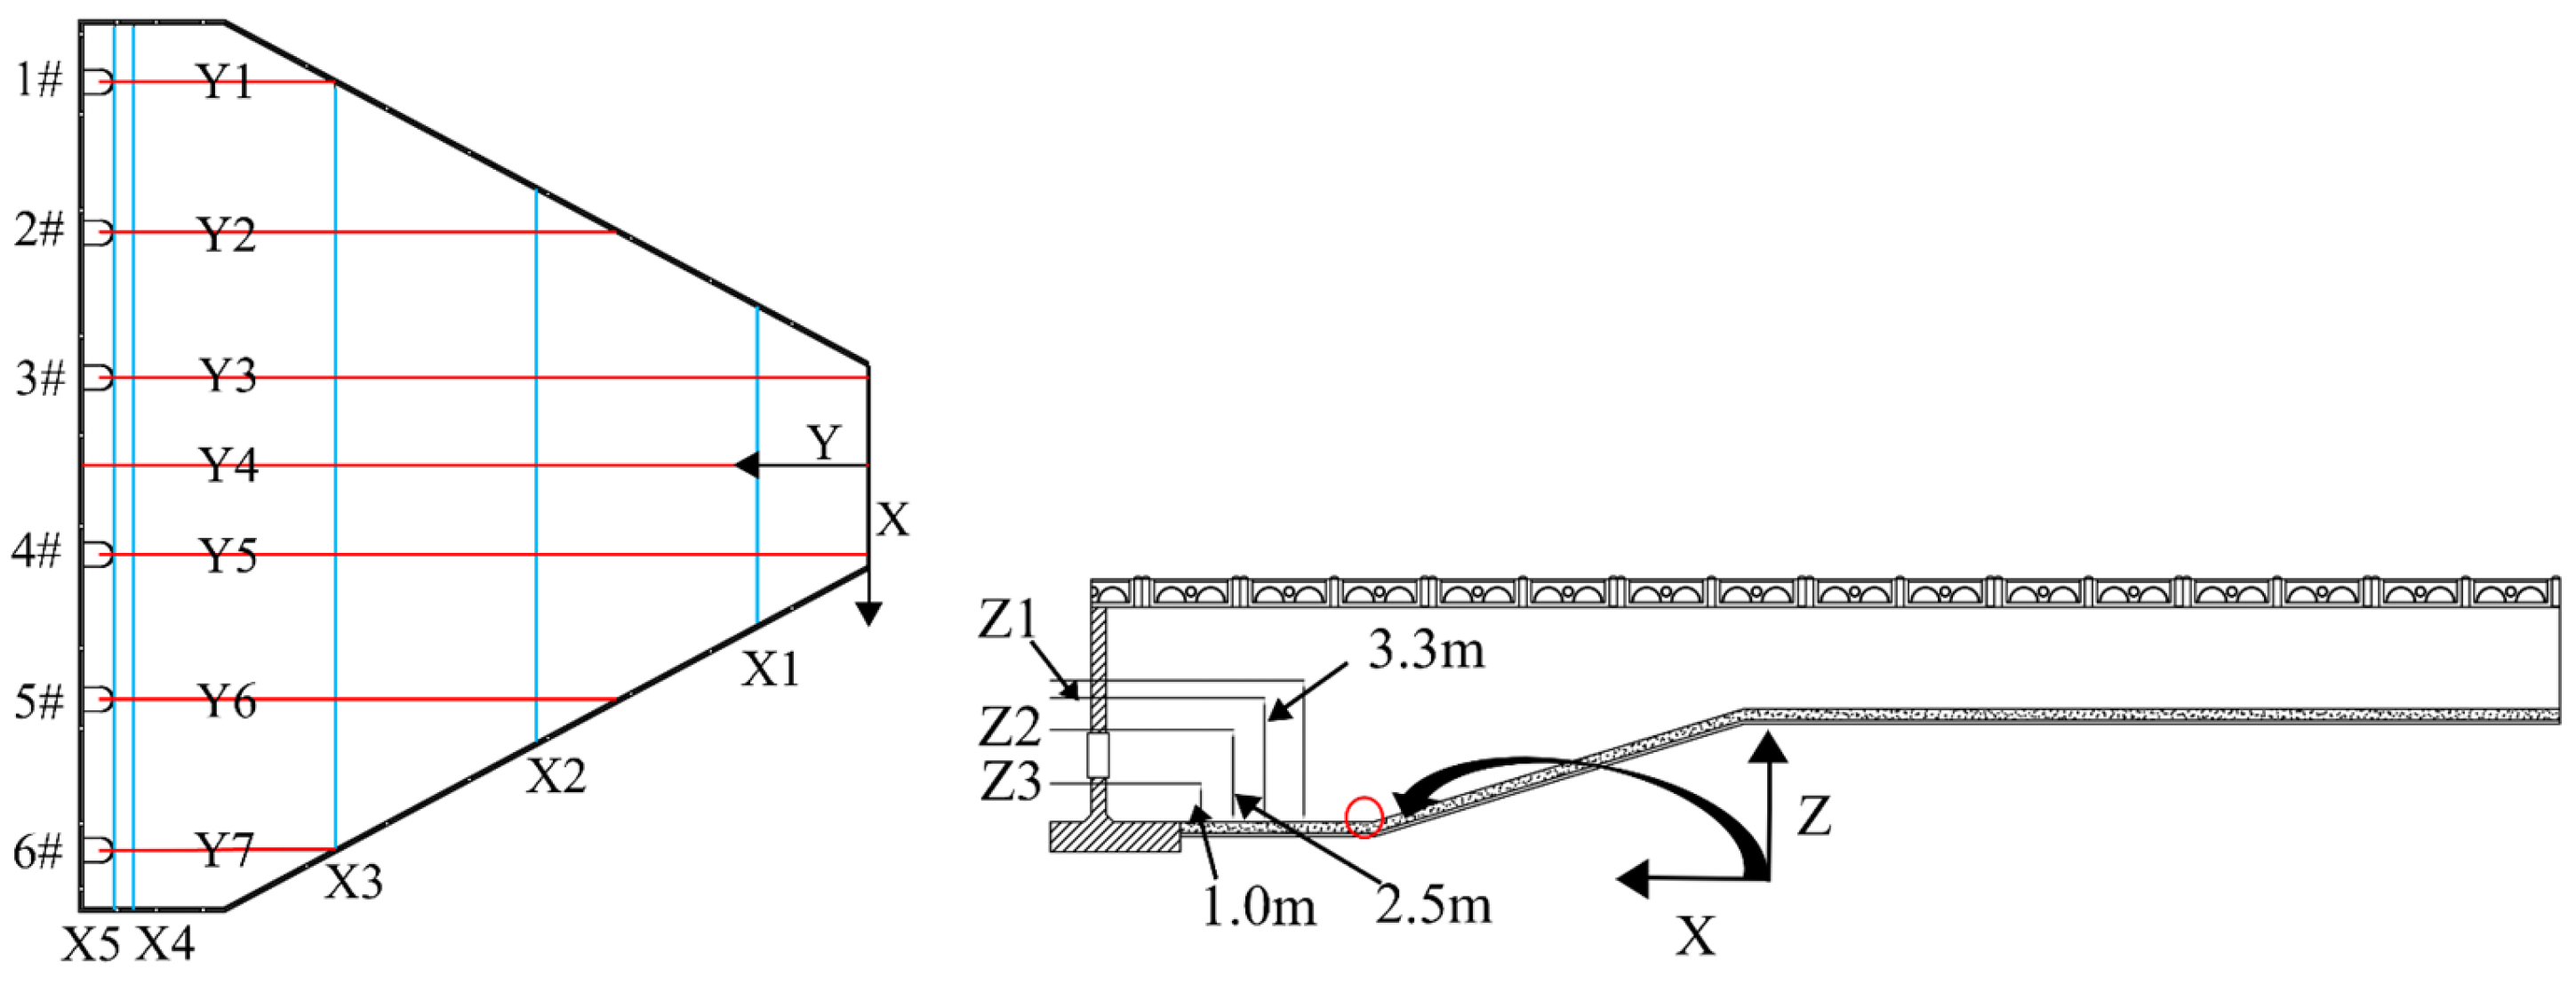
During the field measurement in August 2025, the operating units of the Hongsi Pumping Station were pumps 1#, 2#, 5#, 6#, which correspond to Scheme 1 in the design schemes. To verify the correctness and reliability of the established numerical model of the Hongsi Pumping Station, the simulation results of Scheme 1 were compared and analyzed with the measured data. The cross-section perpendicular to the flow direction is defined as the transverse section, the longitudinal section parallel to the flow direction is defined as the longitudinal section, and the horizontal plane cut along the water depth direction is defined as the horizontal plane. The intersection lines between these planes are determined as the observation characteristic lines. The layout of the observation sections is shown in Figure 4, and the parameters of the observation sections are listed in Table 2.
Figure 4.
Layout of observation sections.
Table 2.
Parameters of observation sections.
Four transverse sections were established perpendicular to the flow direction, where X represents the distance from the observation section to the inlet section of the forebay. Seven longitudinal sections were established parallel to the flow direction, with the Y4 section serving as the axis of symmetry of the forebay. The left side of the axis of symmetry is defined as negative, and the right side is defined as positive, where Y represents the distance from the axis of symmetry. Three horizontal planes were established along the water depth direction, where Z represents the distance from the horizontal plane to the bottom of the forebay.
To accurately characterize the flow patterns and hydraulic properties in the forebay, a characteristic plane was selected for in-depth analysis. As shown in the figure, the cross-section at X = 37 m near the inlet was selected as the characteristic section for analyzing the flow field, and the velocity distribution uniformity of the section was analyzed. A higher velocity uniformity indicates a more uniform flow field distribution and a more stable flow field in the forebay. The velocity distribution uniformity Vau [27] is calculated by the following formula:
where Vai is the average axial velocity of each section in m/s; n is the number of nodes; and Va is the average axial velocity of each section element in m/s.
2.6. Model Validation
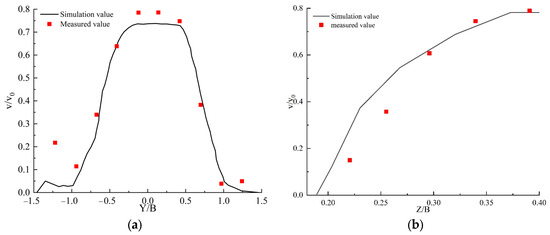
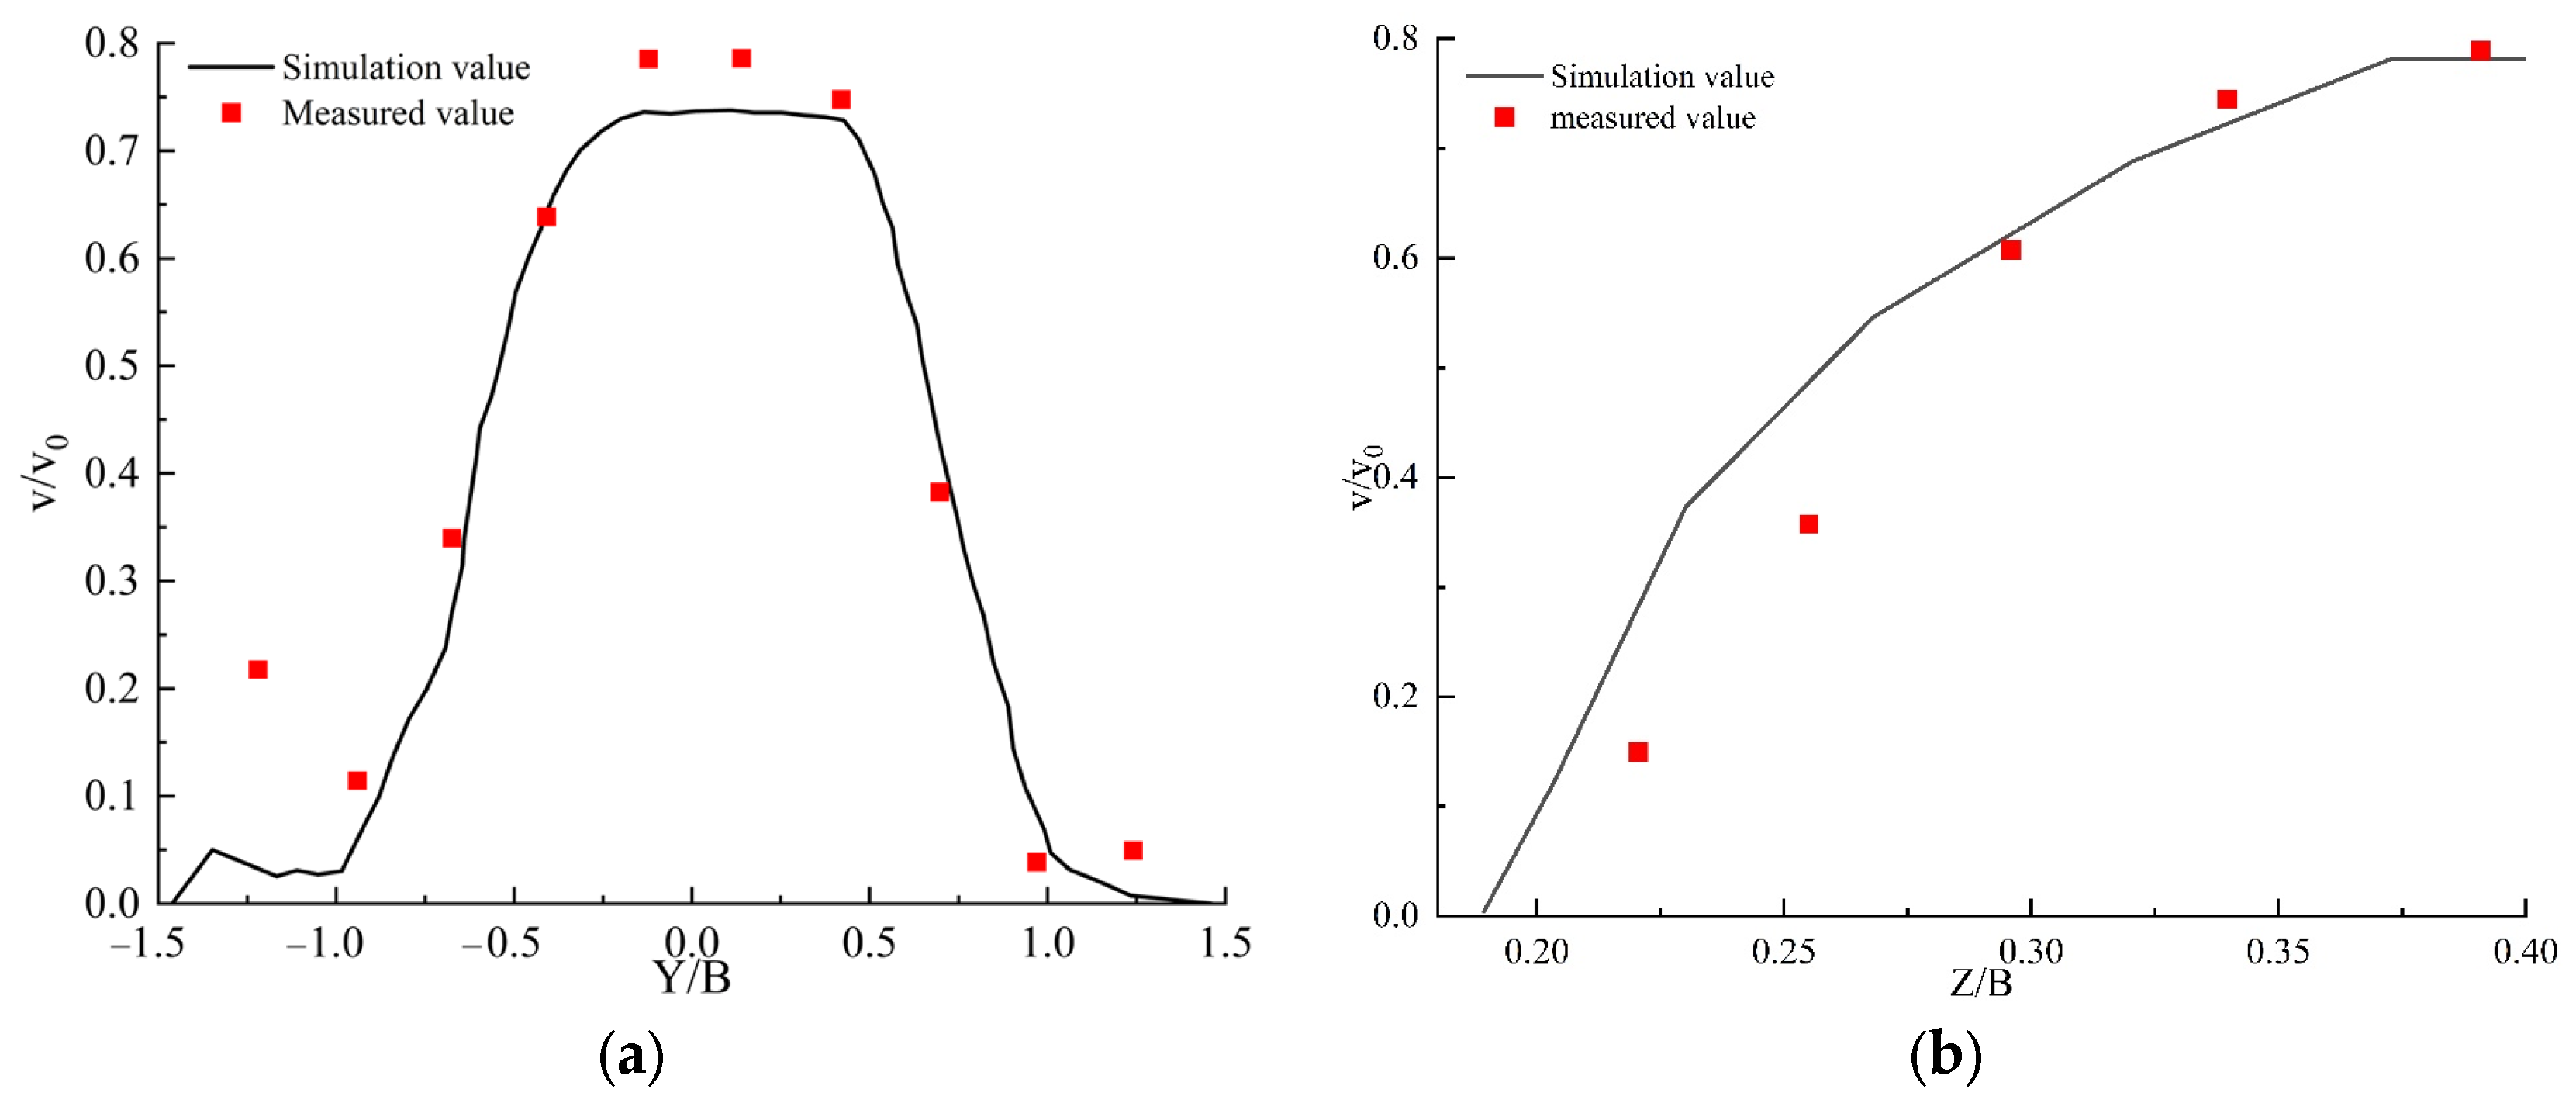
Let v0 denote the average flow velocity at the inlet section of the forebay, and v denote the flow velocity within the forebay. The velocity was non-dimensionalized by dividing v by v0 to plot the velocity distribution diagrams of the corresponding sections in the forebay. The width of the forebay inlet is denoted as B, which is used for the non-dimensionalization of length. Figure 5a presents the comparison between the computed values and measured values along the characteristic line Z1-X2, which is the intersection of the horizontal plane Z1 at 3.8 m above the bottom and the transverse section X2. Figure 5b presents the comparison between the measured and simulated velocity values along the characteristic line Y4-X3. As shown in the figures, the overall variation trends of the measured and simulated velocity values along Z1-X2 are generally consistent, with a mean absolute error [28] of 0.0582 and a root mean square error of 0.0789. For Y4-X3, the mean absolute error is 0.085 and the root mean square error is 0.121. The measured results are close to the simulated results, indicating that the mathematical model provides accurate and reliable computational results for the flow field in the forward-intake forebay.
Figure 5.
Comparison between simulated and measured results: (a) comparison of simulated and measured values along line Z1-X2; (b) comparison of simulated and measured values along line Y4-X3.
3. Results and Discussion
3.1. Distribution Patterns of Planar Flow Structure
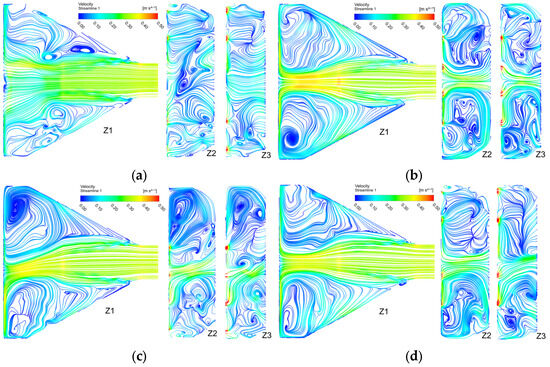
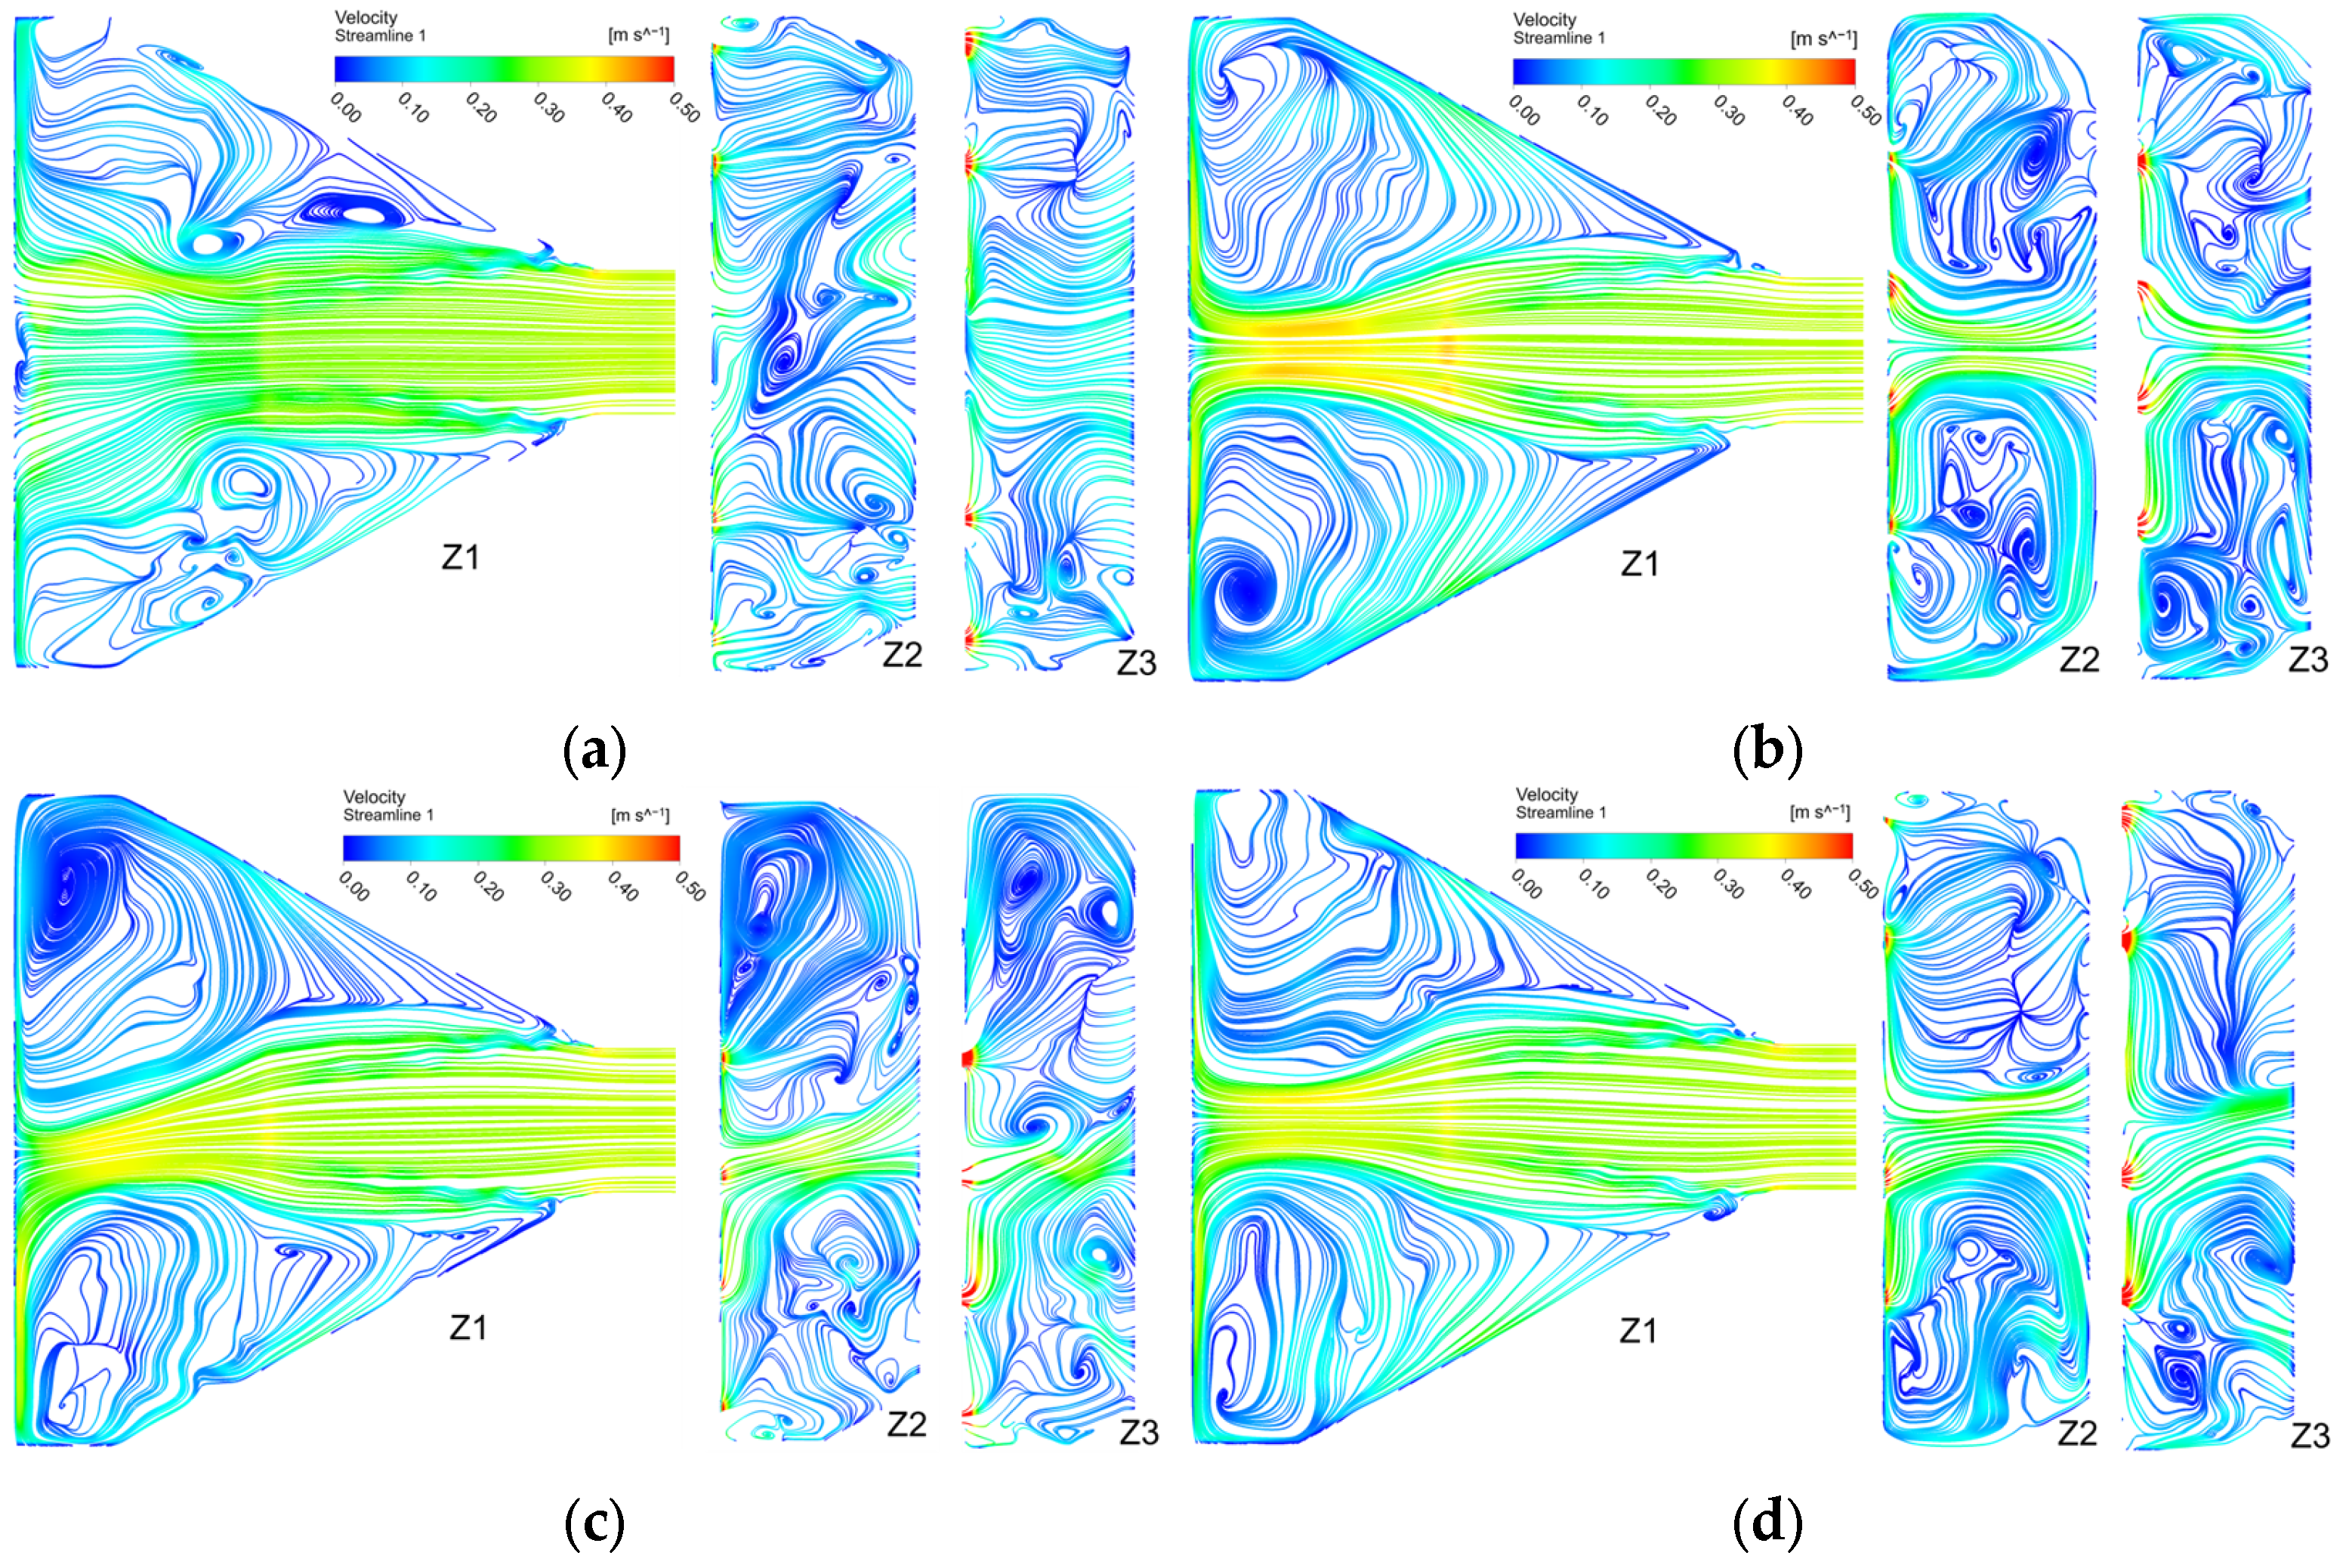
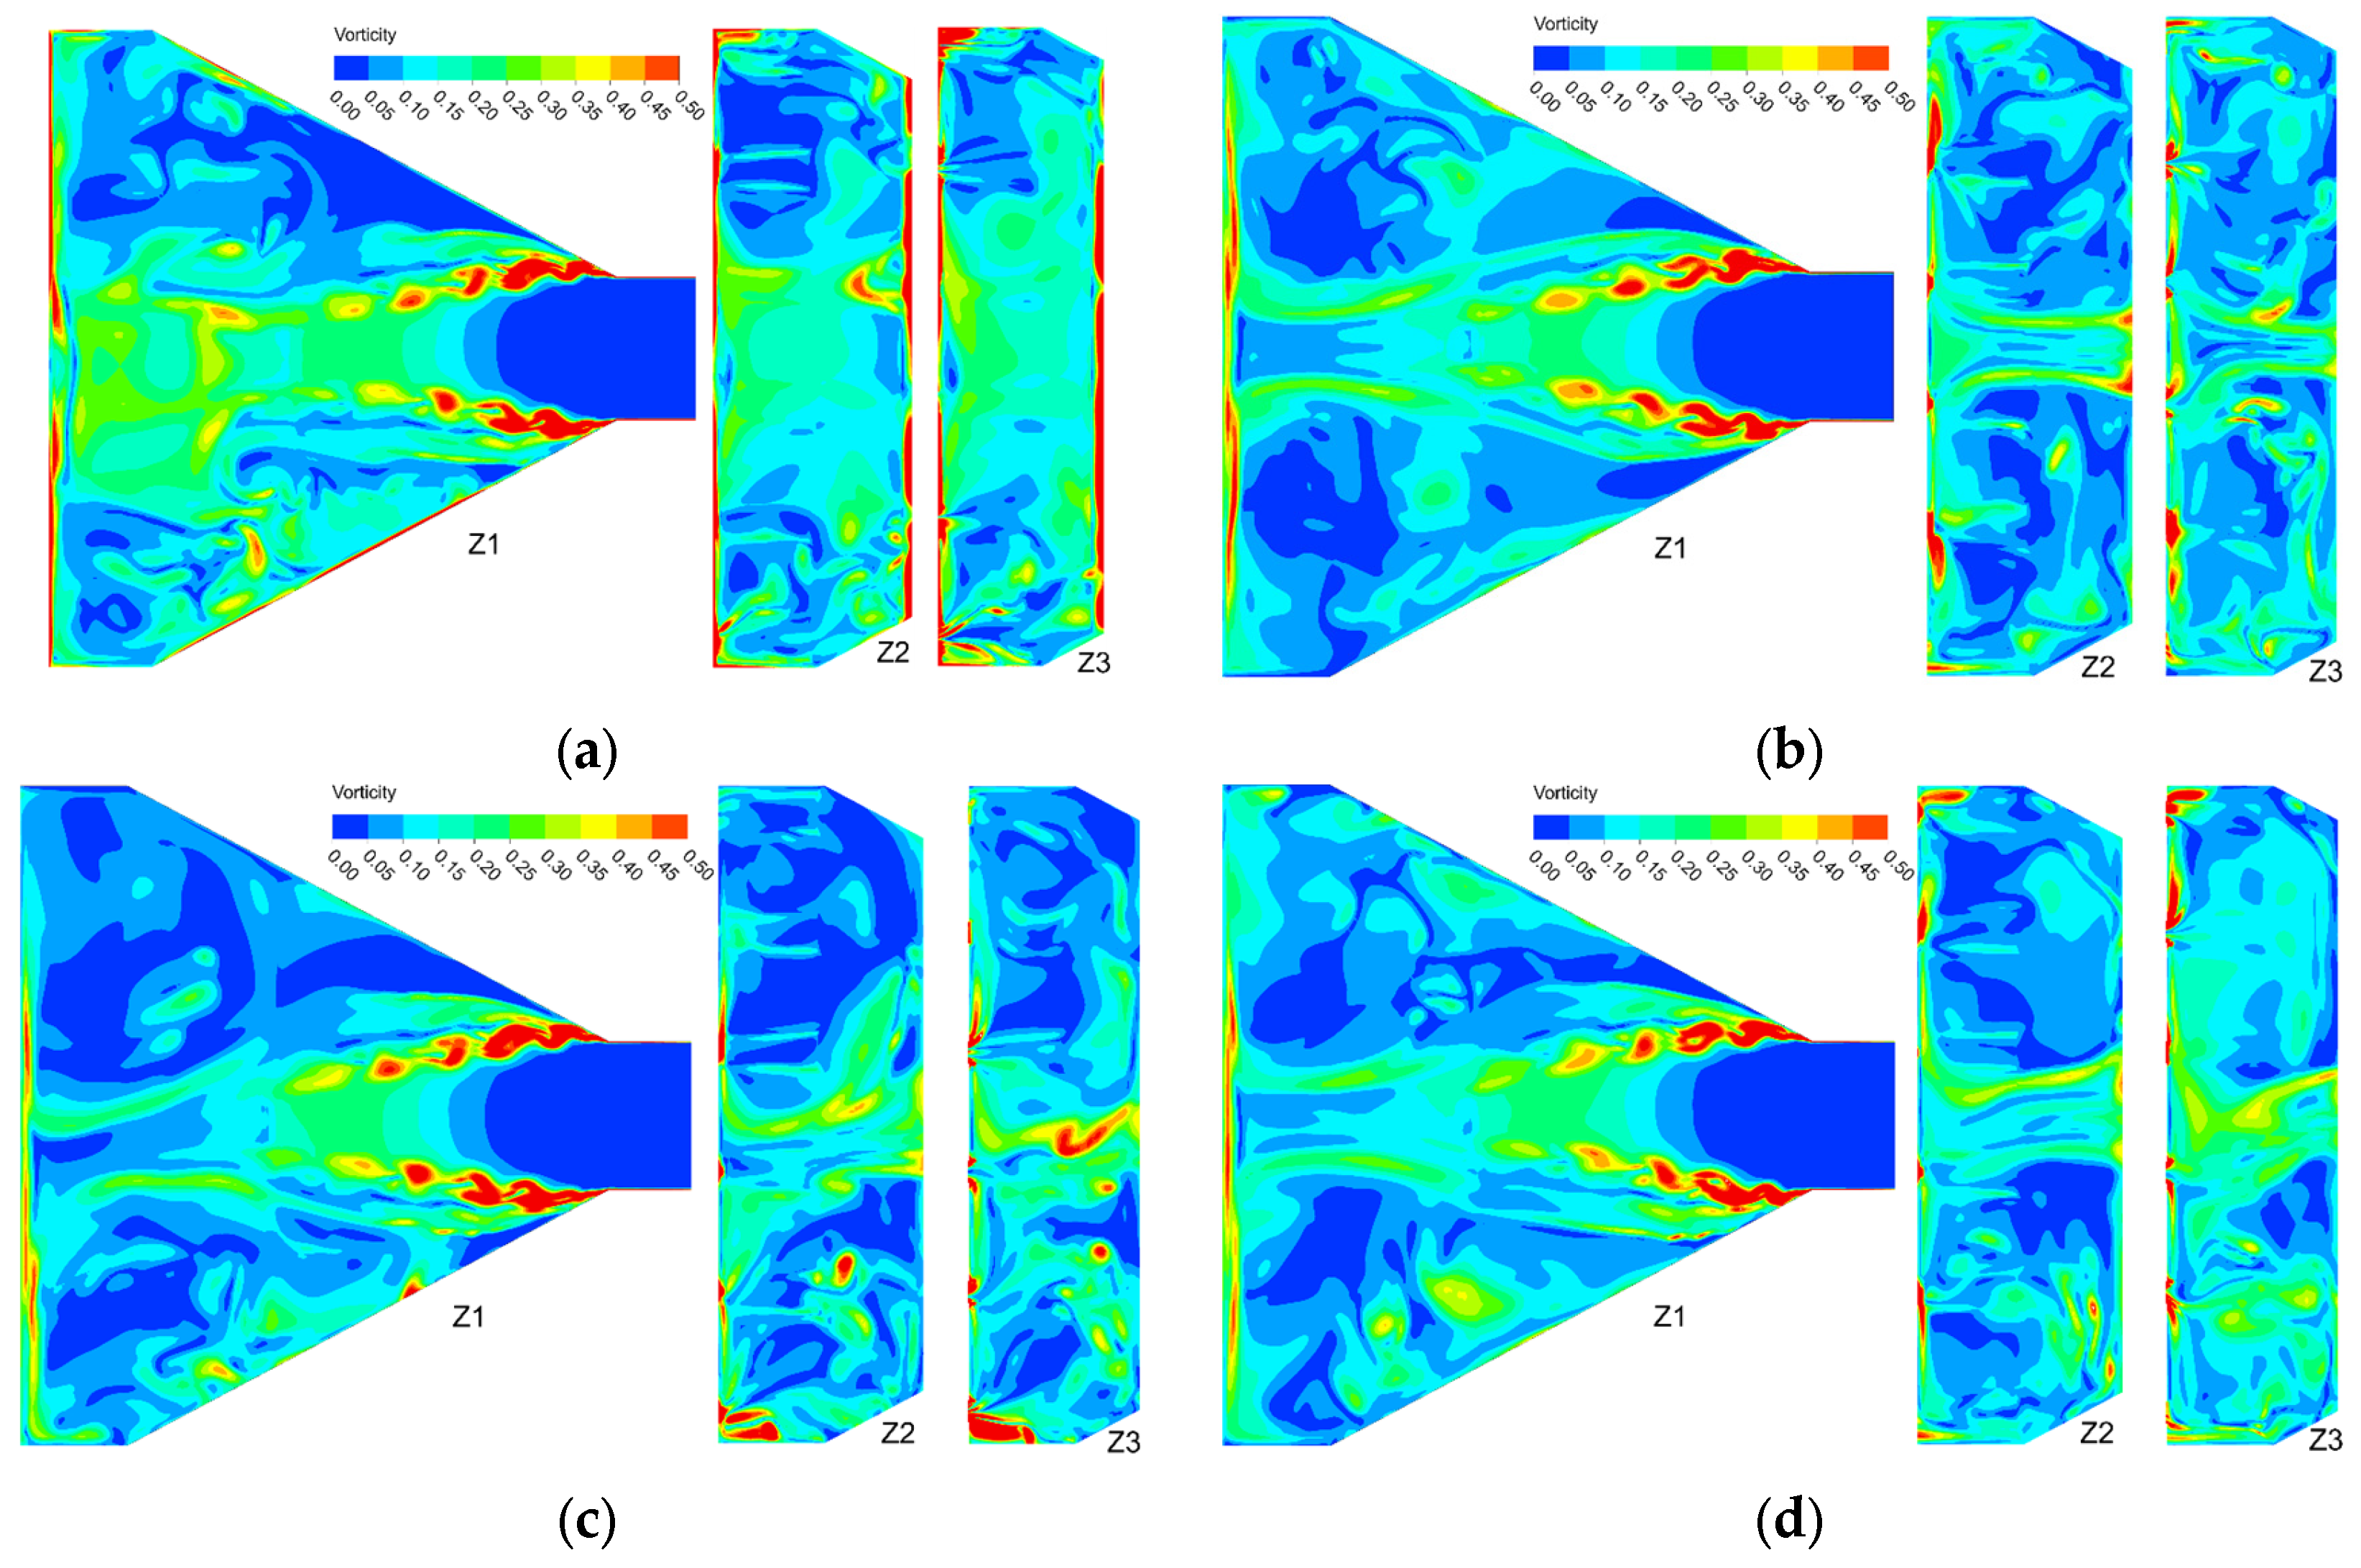
The flow structure in the forward-intake forebay is significantly affected by the pump operation combination mode. After the water enters the forebay from the approach channel, the flow field exhibits distinct zonal characteristics due to the influence of the forebay diffusion angle. Figure 6 presents the variations in the flow conditions and vortex structures in the forebay under the four operating conditions, and Figure 7 presents the corresponding vorticity contour maps at three horizontal planes (Z1, Z2, and Z3).
Figure 6.
Distribution of planar flow structure at different water depths: (a) streamline diagram of velocity distribution for Scheme 1; (b) streamline diagram of velocity distribution for Scheme 2; (c) streamline diagram of velocity distribution for Scheme 3; (d) streamline diagram of velocity distribution for Scheme 4.
Figure 7.
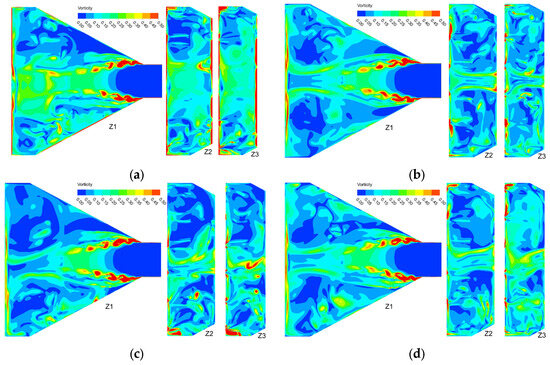
Vorticity contour maps at different water depths: (a) Vorticity contour map of Scheme 1; (b) Vorticity contour map of Scheme 2; (c) Vorticity contour map of Scheme 3; (d) Vorticity contour map of Scheme 4.
Figure 6a and Figure 7a show Scheme 1, in which the operating units are pumps 1#, 2#, 5#, and 6#. It can be observed that the main flow movement is relatively uniform on the Z1, Z2, and Z3 planes at different water depths, with smooth flow. Backflow zones appear on both sides, but the vortex scale and intensity are relatively small, with the vortex cores located in the middle region of the forebay. The vorticity distribution displays a characteristic dual-core pattern, with high vorticity regions (ω > 0.40 s−1) concentrated on both lateral sides. The symmetrical operation at both ends results in basically symmetric vorticity distribution with moderate intensity. Figure 6b and Figure 7b show Scheme 2, in which the operating units are pumps 2#, 3#, 4#, and 5#. The main flow deflects toward the left side, and the vortex scales on both sides are relatively large, especially with high vortex intensity in the right-side region. The vortex cores are located near the pump inlets, which may cause sedimentation and blockage at the inlets of pumps 1# and 6#. The vorticity contours show a centralized distribution pattern, with high vorticity zones (ω > 0.45 s−1) primarily located at the central intake region, while larger low-vorticity zones (ω < 0.10 s−1) appear along both lateral walls. Figure 6c and Figure 7c show Scheme 3, in which the operating units are pumps 3#, 4#, 5#, and 6#. The main flow movement is uniform and smooth, and the backflow zones on both sides are basically symmetrical, but the vortex scale and intensity are relatively large. The vorticity distribution exhibits pronounced asymmetry, with significantly higher intensity on the side of Unit 6#. The peak vorticity values exceed ω = 0.50 s−1 near the Unit 6# intake, and a large-scale recirculation zone forms on the left side where Units 1# and 2# remain inactive. Figure 6d and Figure 7d show Scheme 4, in which the operating units are pumps 1#, 2#, 4#, and 5#. The main flow movement is uniform, and similar to Scheme 3, the vortex structures on both sides are symmetrical, but with lower vortex intensity. The staggered configuration with Unit 3# non-operational produces the most uniform vorticity distribution among all four schemes. The high vorticity regions are symmetrically distributed with moderate intensity (ω ≈ 0.35–0.45 s−1), and the forebay region is dominated by low vorticity levels (ω < 0.15 s−1).
The vortex cores in Schemes 2, 3, and 4 are basically located near the pump inlets. The reduction in flow velocity in the vortex zones can significantly weaken the sediment transport capacity of the flow, affecting pump operation. The velocity in the front end of the main flow zone is the highest, ranging between 0.344 and 0.345 m/s, which is 19–24% higher than the velocity in the middle section and 26–37% higher than the velocity in the rear section. The specific data are shown in Table 3.
Table 3.
Comparison of main flow zone velocities for different schemes.
3.2. Velocity Distribution Patterns of Transverse Sections
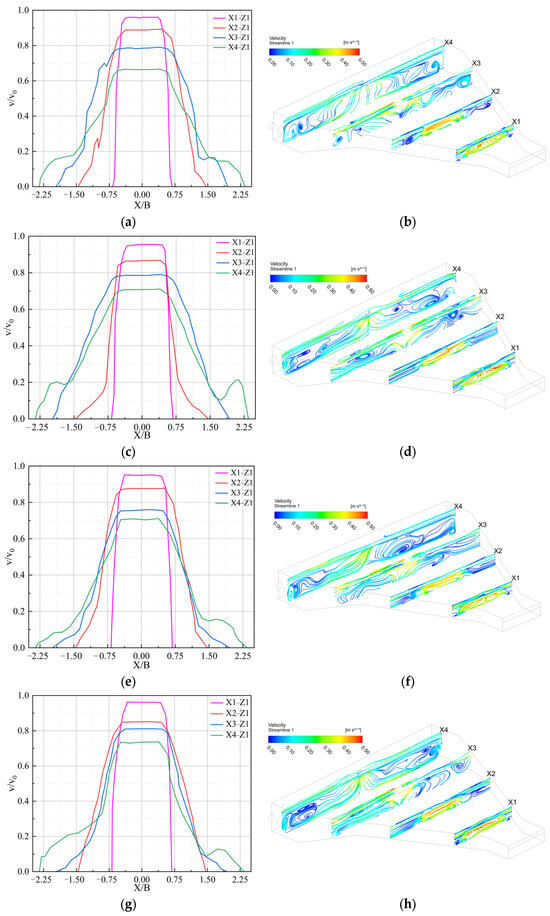
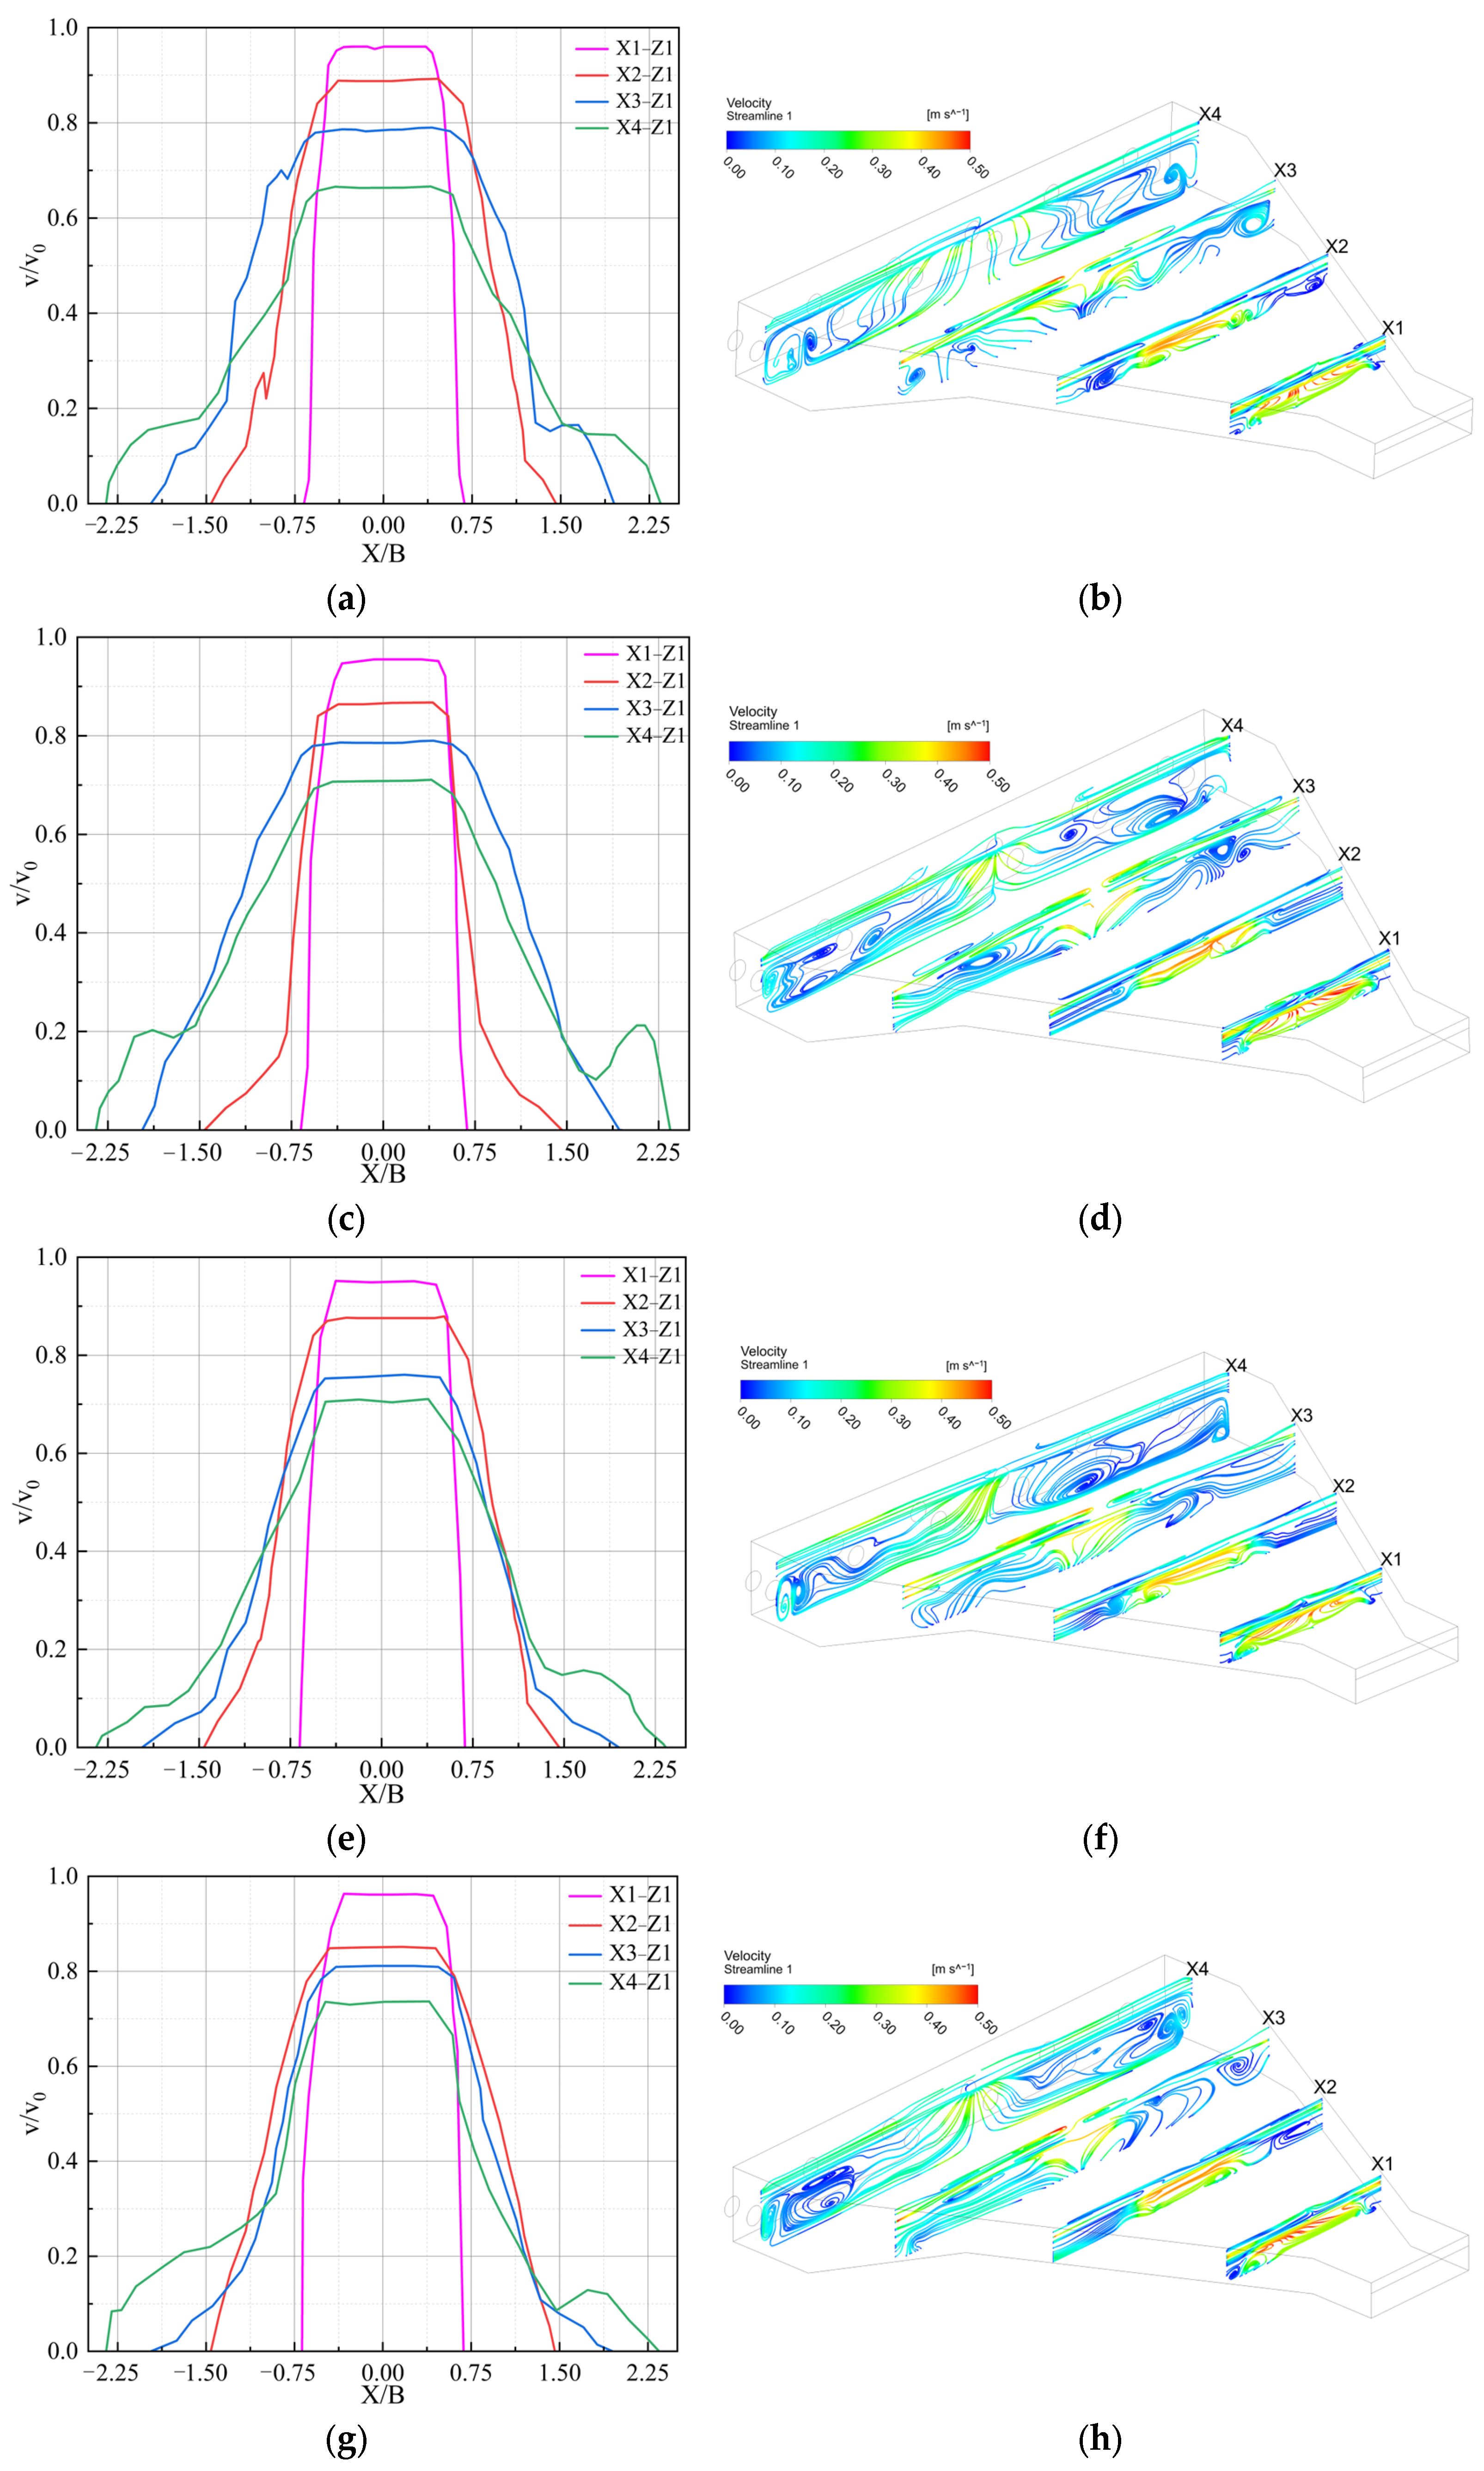
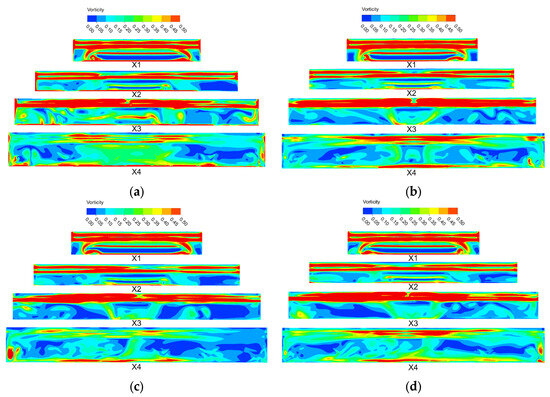
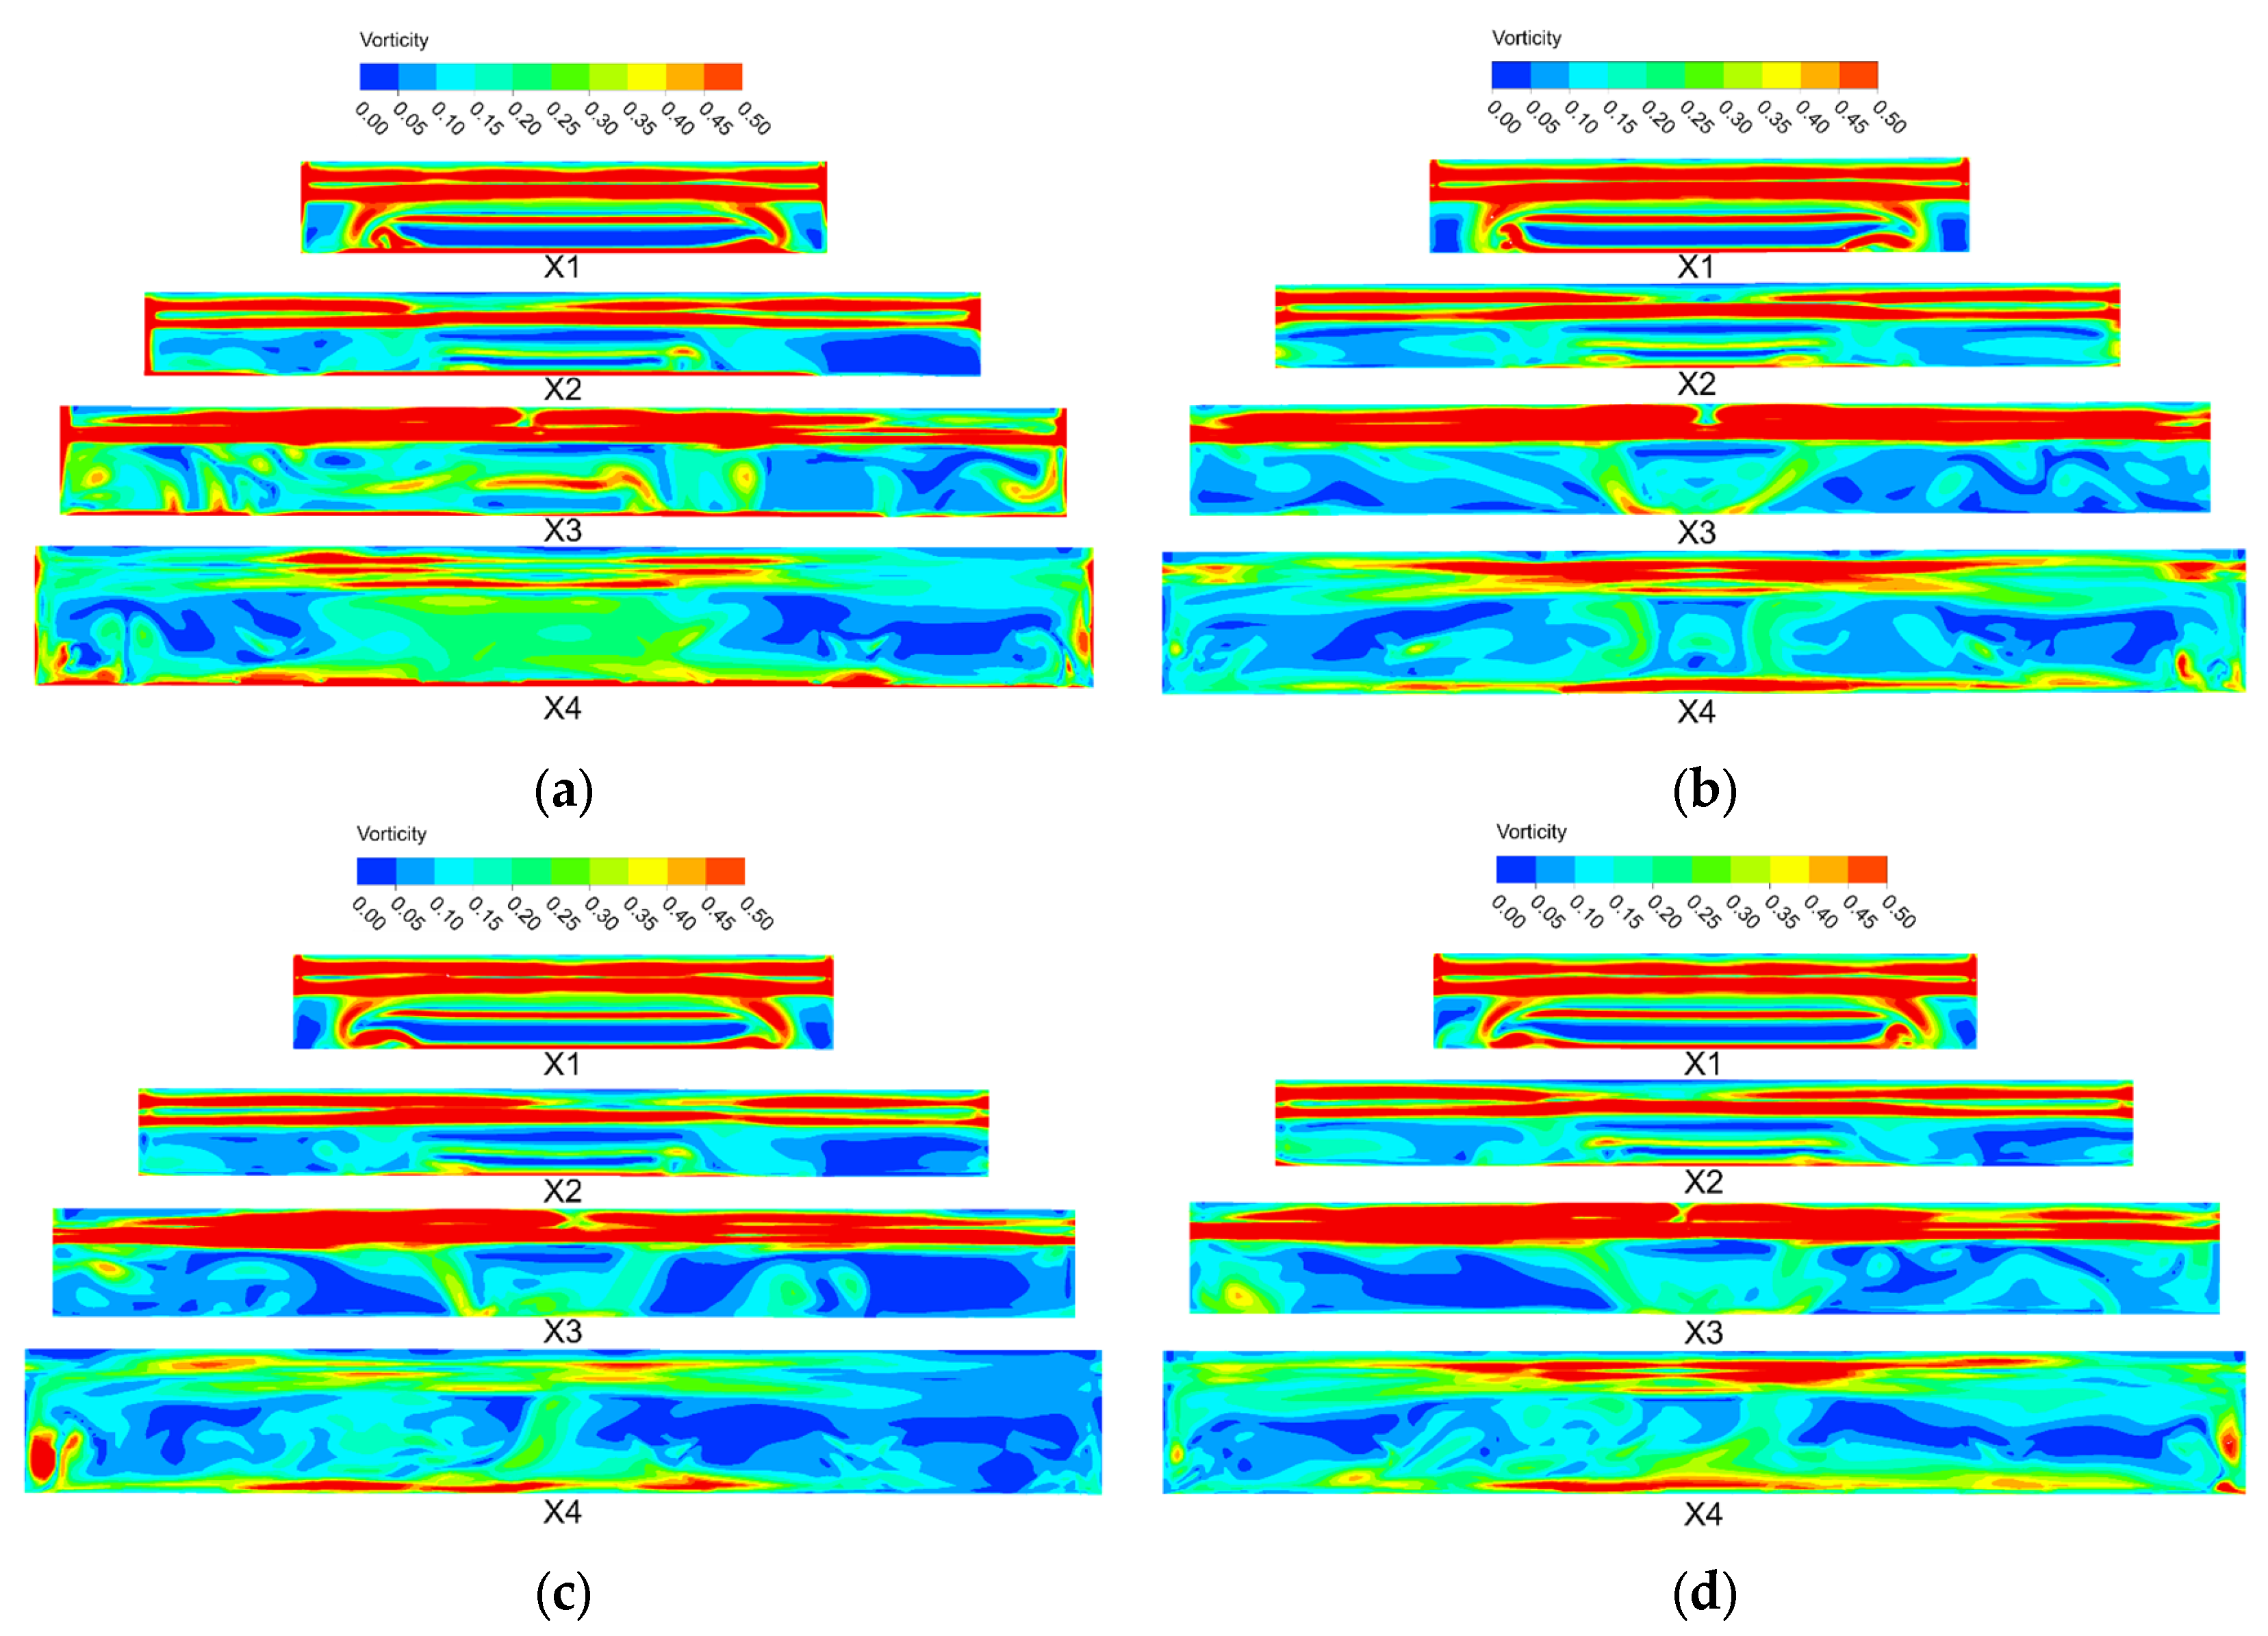
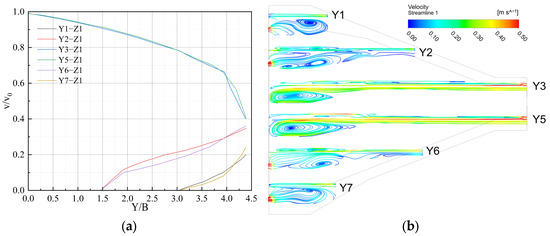
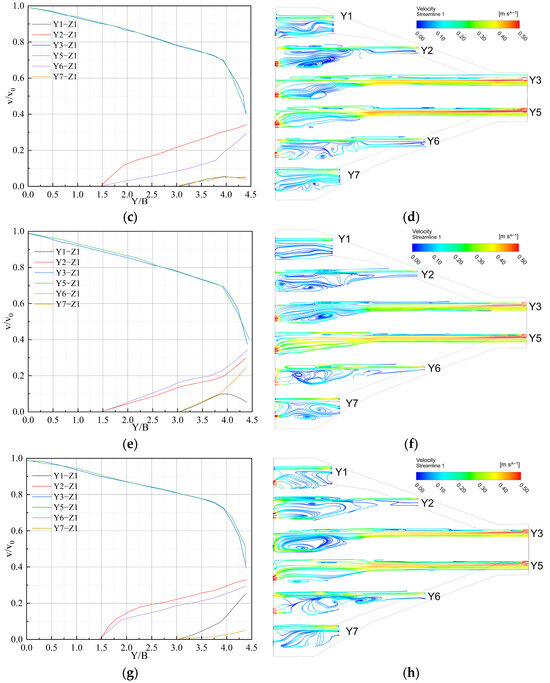
Figure 8 presents the velocity distribution along the transverse characteristic lines at a water depth of 3.3 m intersecting with transverse sections X1, X2, X3, and X4, as well as the streamline distribution of each transverse section. Figure 9 presents the vorticity distribution contours for the four operation schemes at cross-sections X1, X2, X3, and X4.
Figure 8.
Velocity distribution patterns of transverse sections and transverse characteristic lines: (a) Velocity distribution along transverse characteristic lines for Scheme 1; (b) streamline distribution on different transverse sections for Scheme 1; (c) velocity distribution along transverse characteristic lines for Scheme 2; (d) streamline distribution on different transverse sections for Scheme 2; (e) velocity distribution along transverse characteristic lines for Scheme 3; (f) streamline distribution on different transverse sections for Scheme 3; (g) velocity distribution along transverse characteristic lines for Scheme 4; (h) streamline distribution on different transverse sections for Scheme 4.
Figure 9.
Vorticity contour maps for transverse sections: (a) vorticity contour map of Scheme 1; (b) vorticity contour map of Scheme 2; (c) vorticity contour map of Scheme 3; (d) vorticity contour map of Scheme 4.
From Figure 8a,c,e,g, it can be observed that the velocity distributions along the transverse characteristic lines X1-Z1, X2-Z1, X3-Z1, and X4-Z1 are similar under the four different operating conditions. The velocity is highest in the main flow region and gradually decreases toward both sides. As the flow enters the forebay from the channel and gradually diffuses, the dimensionless velocity in the central main flow region decreases gradually from 0.98 to 0.72.
From the transverse section diagrams, it can be observed that Scheme 1 exhibits small-scale vortices on both sides of sections X2 and X3; Scheme 2 shows large-scale vortices near the side walls at sections X3 and X4; Scheme 3 displays large-scale vortices near the left side and middle region at section X4; and Scheme 4 presents relatively small-scale vortices in the regions near both side walls at section X4. Overall, Scheme 1 represents the optimal operation combination. Although Scheme 4 exhibits vortices near the inlets of pumps 1# and 6#, the vortex scale and intensity are relatively small, making it a favorable operation combination. Scheme 3 ranks next, while Scheme 2, with its large vortex scale and intensity, represents the most unfavorable operation combination.
From the vorticity contour maps, it can be observed that Scheme 1 exhibits small-scale high vorticity patches on both sides of sections X2 and X3, indicating the presence of localized small-scale vortices in these regions. Scheme 2 shows extensive high-vorticity zones (ω > 0.40 s−1) near the side walls at sections X3 and X4, corresponding to large-scale vortices with significant intensity. Scheme 3 displays pronounced high-vorticity concentrations near the left side and middle region at section X4, reflecting the formation of large-scale vortices due to the asymmetric pump configuration. Scheme 4 presents relatively small high-vorticity patches in the regions near both side walls at section X4, with comparatively lower vortex scale and intensity.
3.3. Velocity Distribution Patterns of Longitudinal Sections
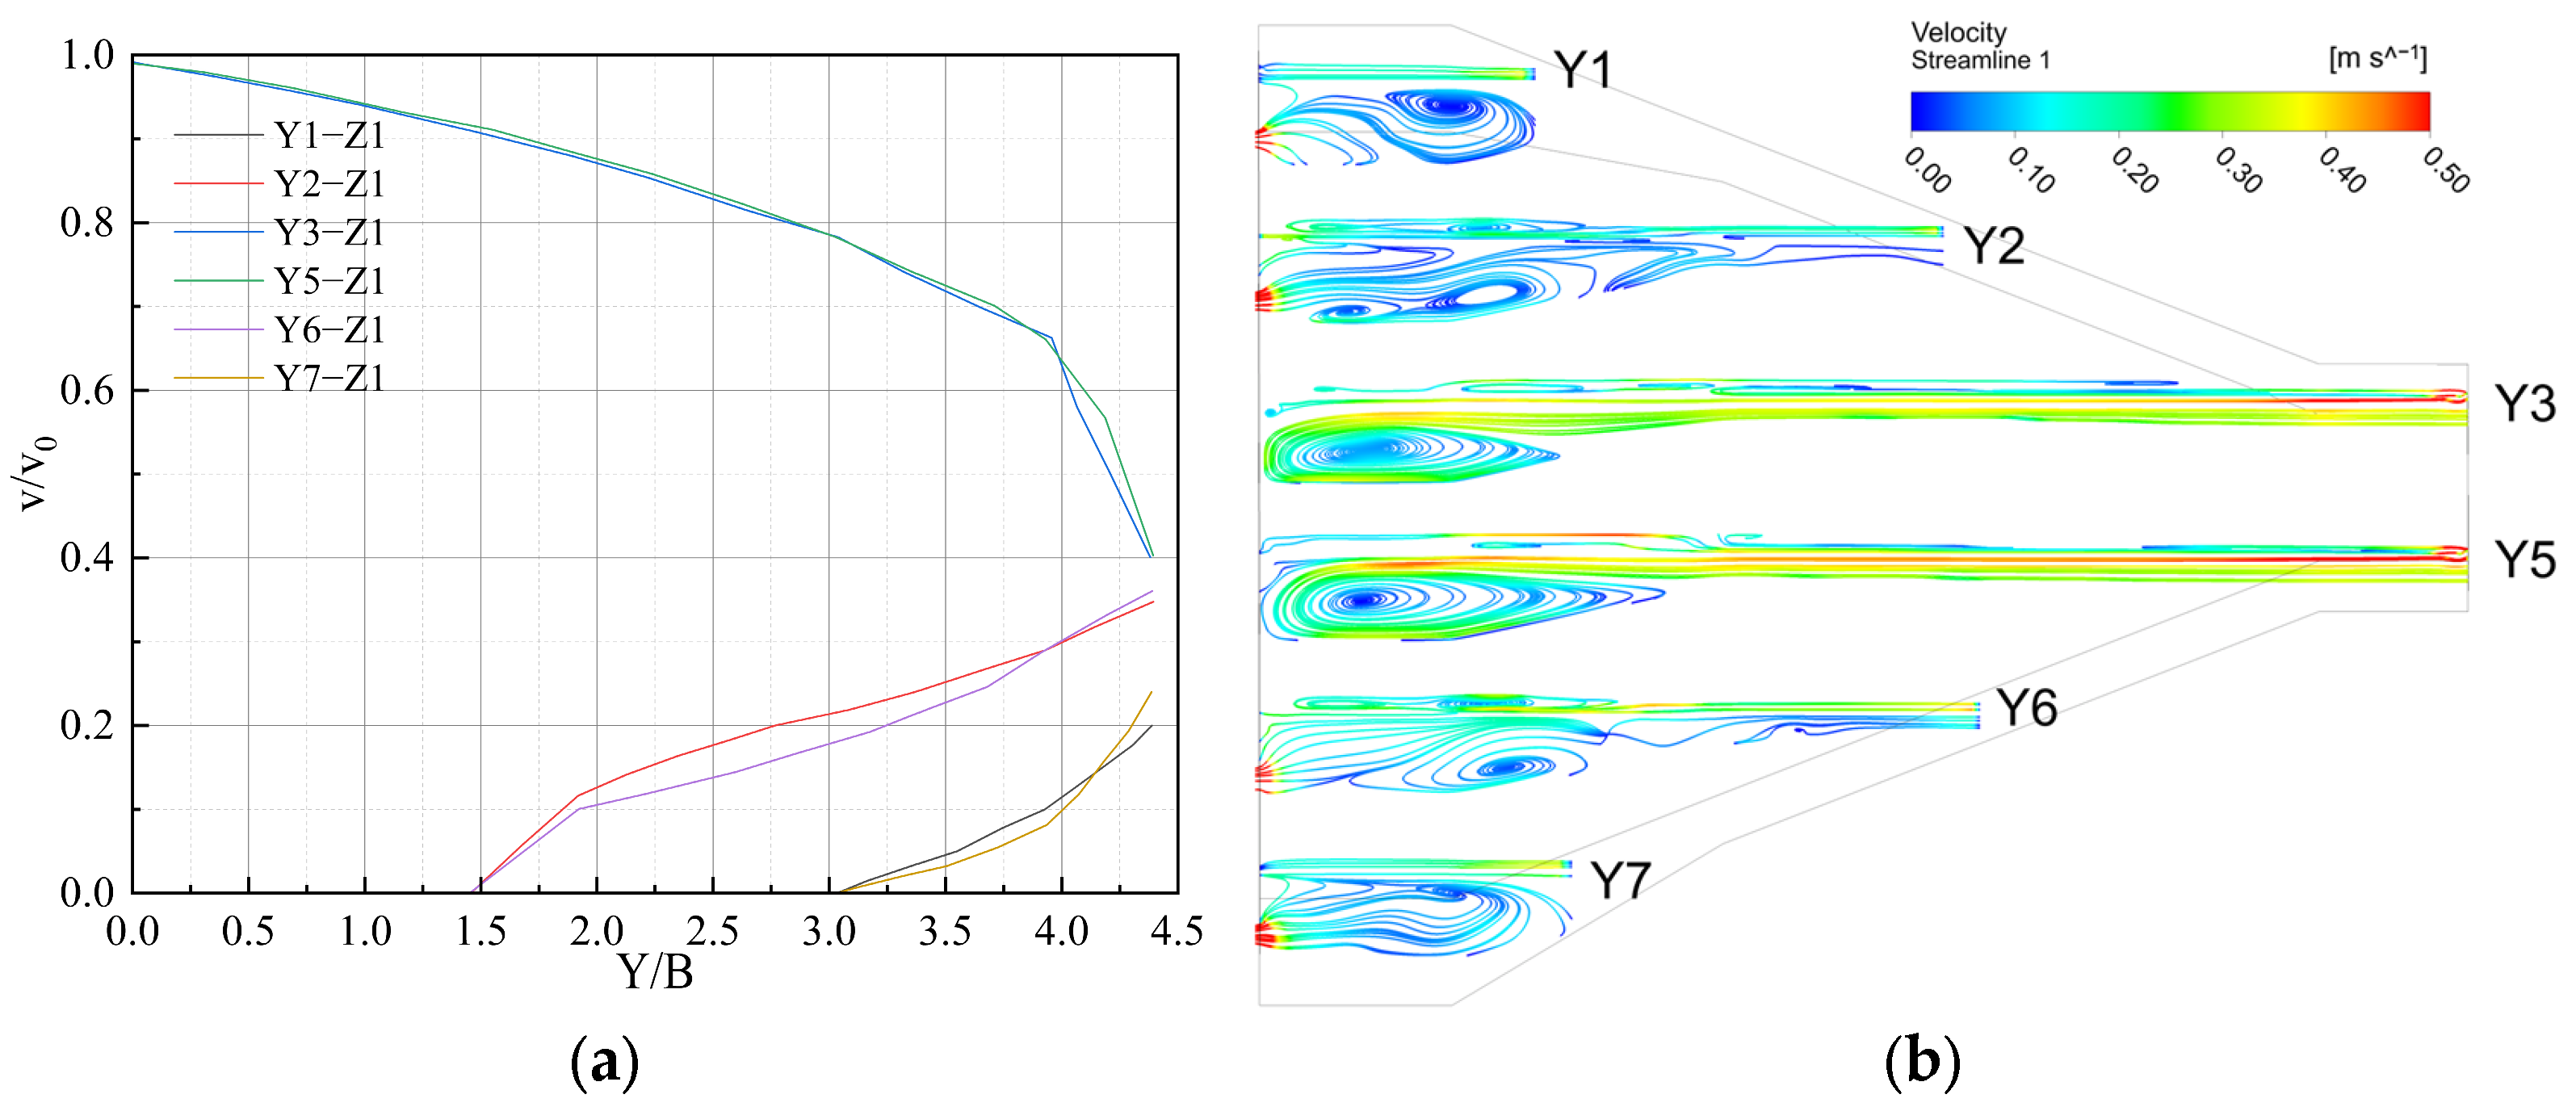
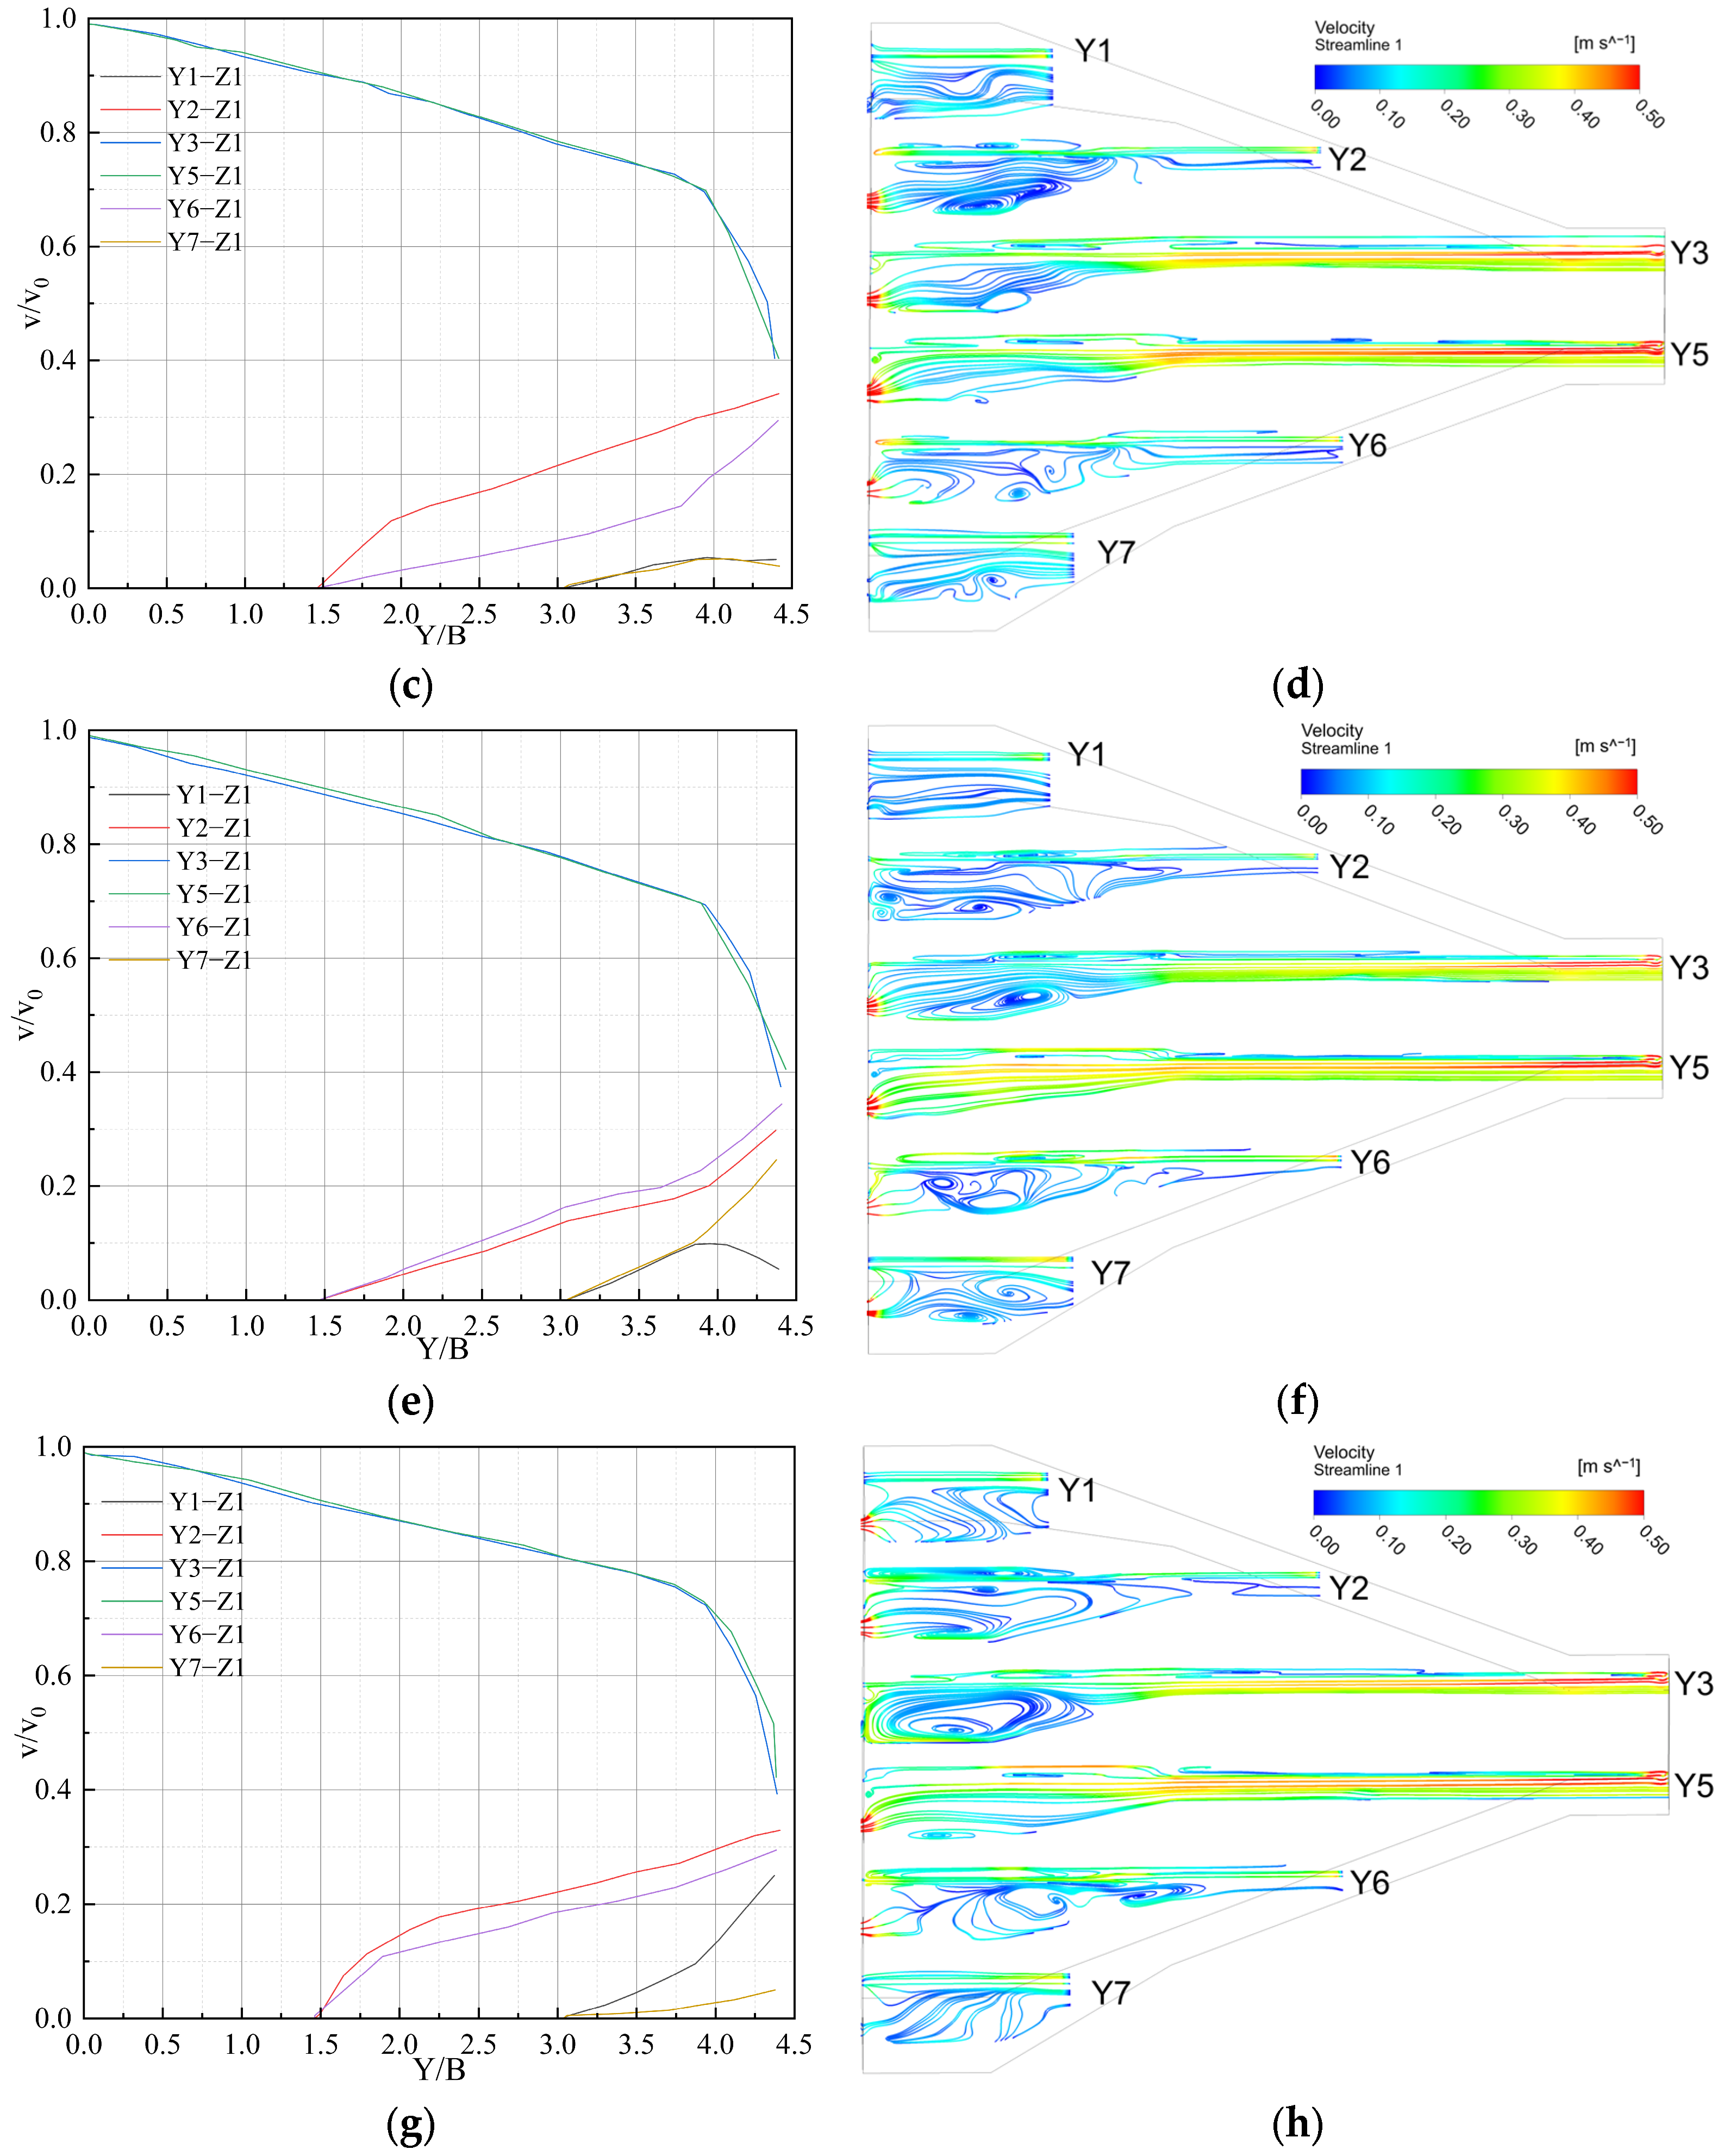
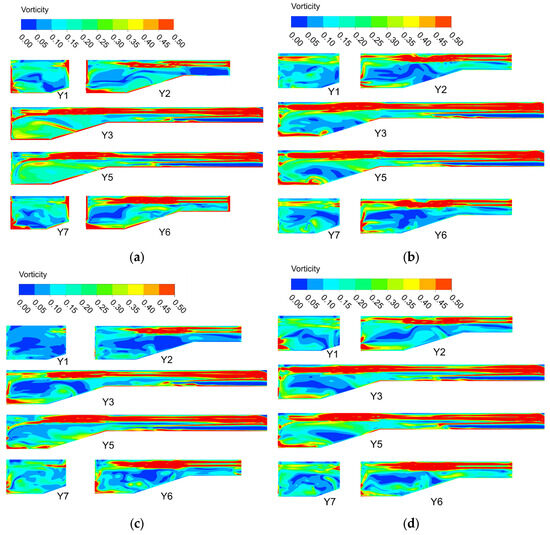
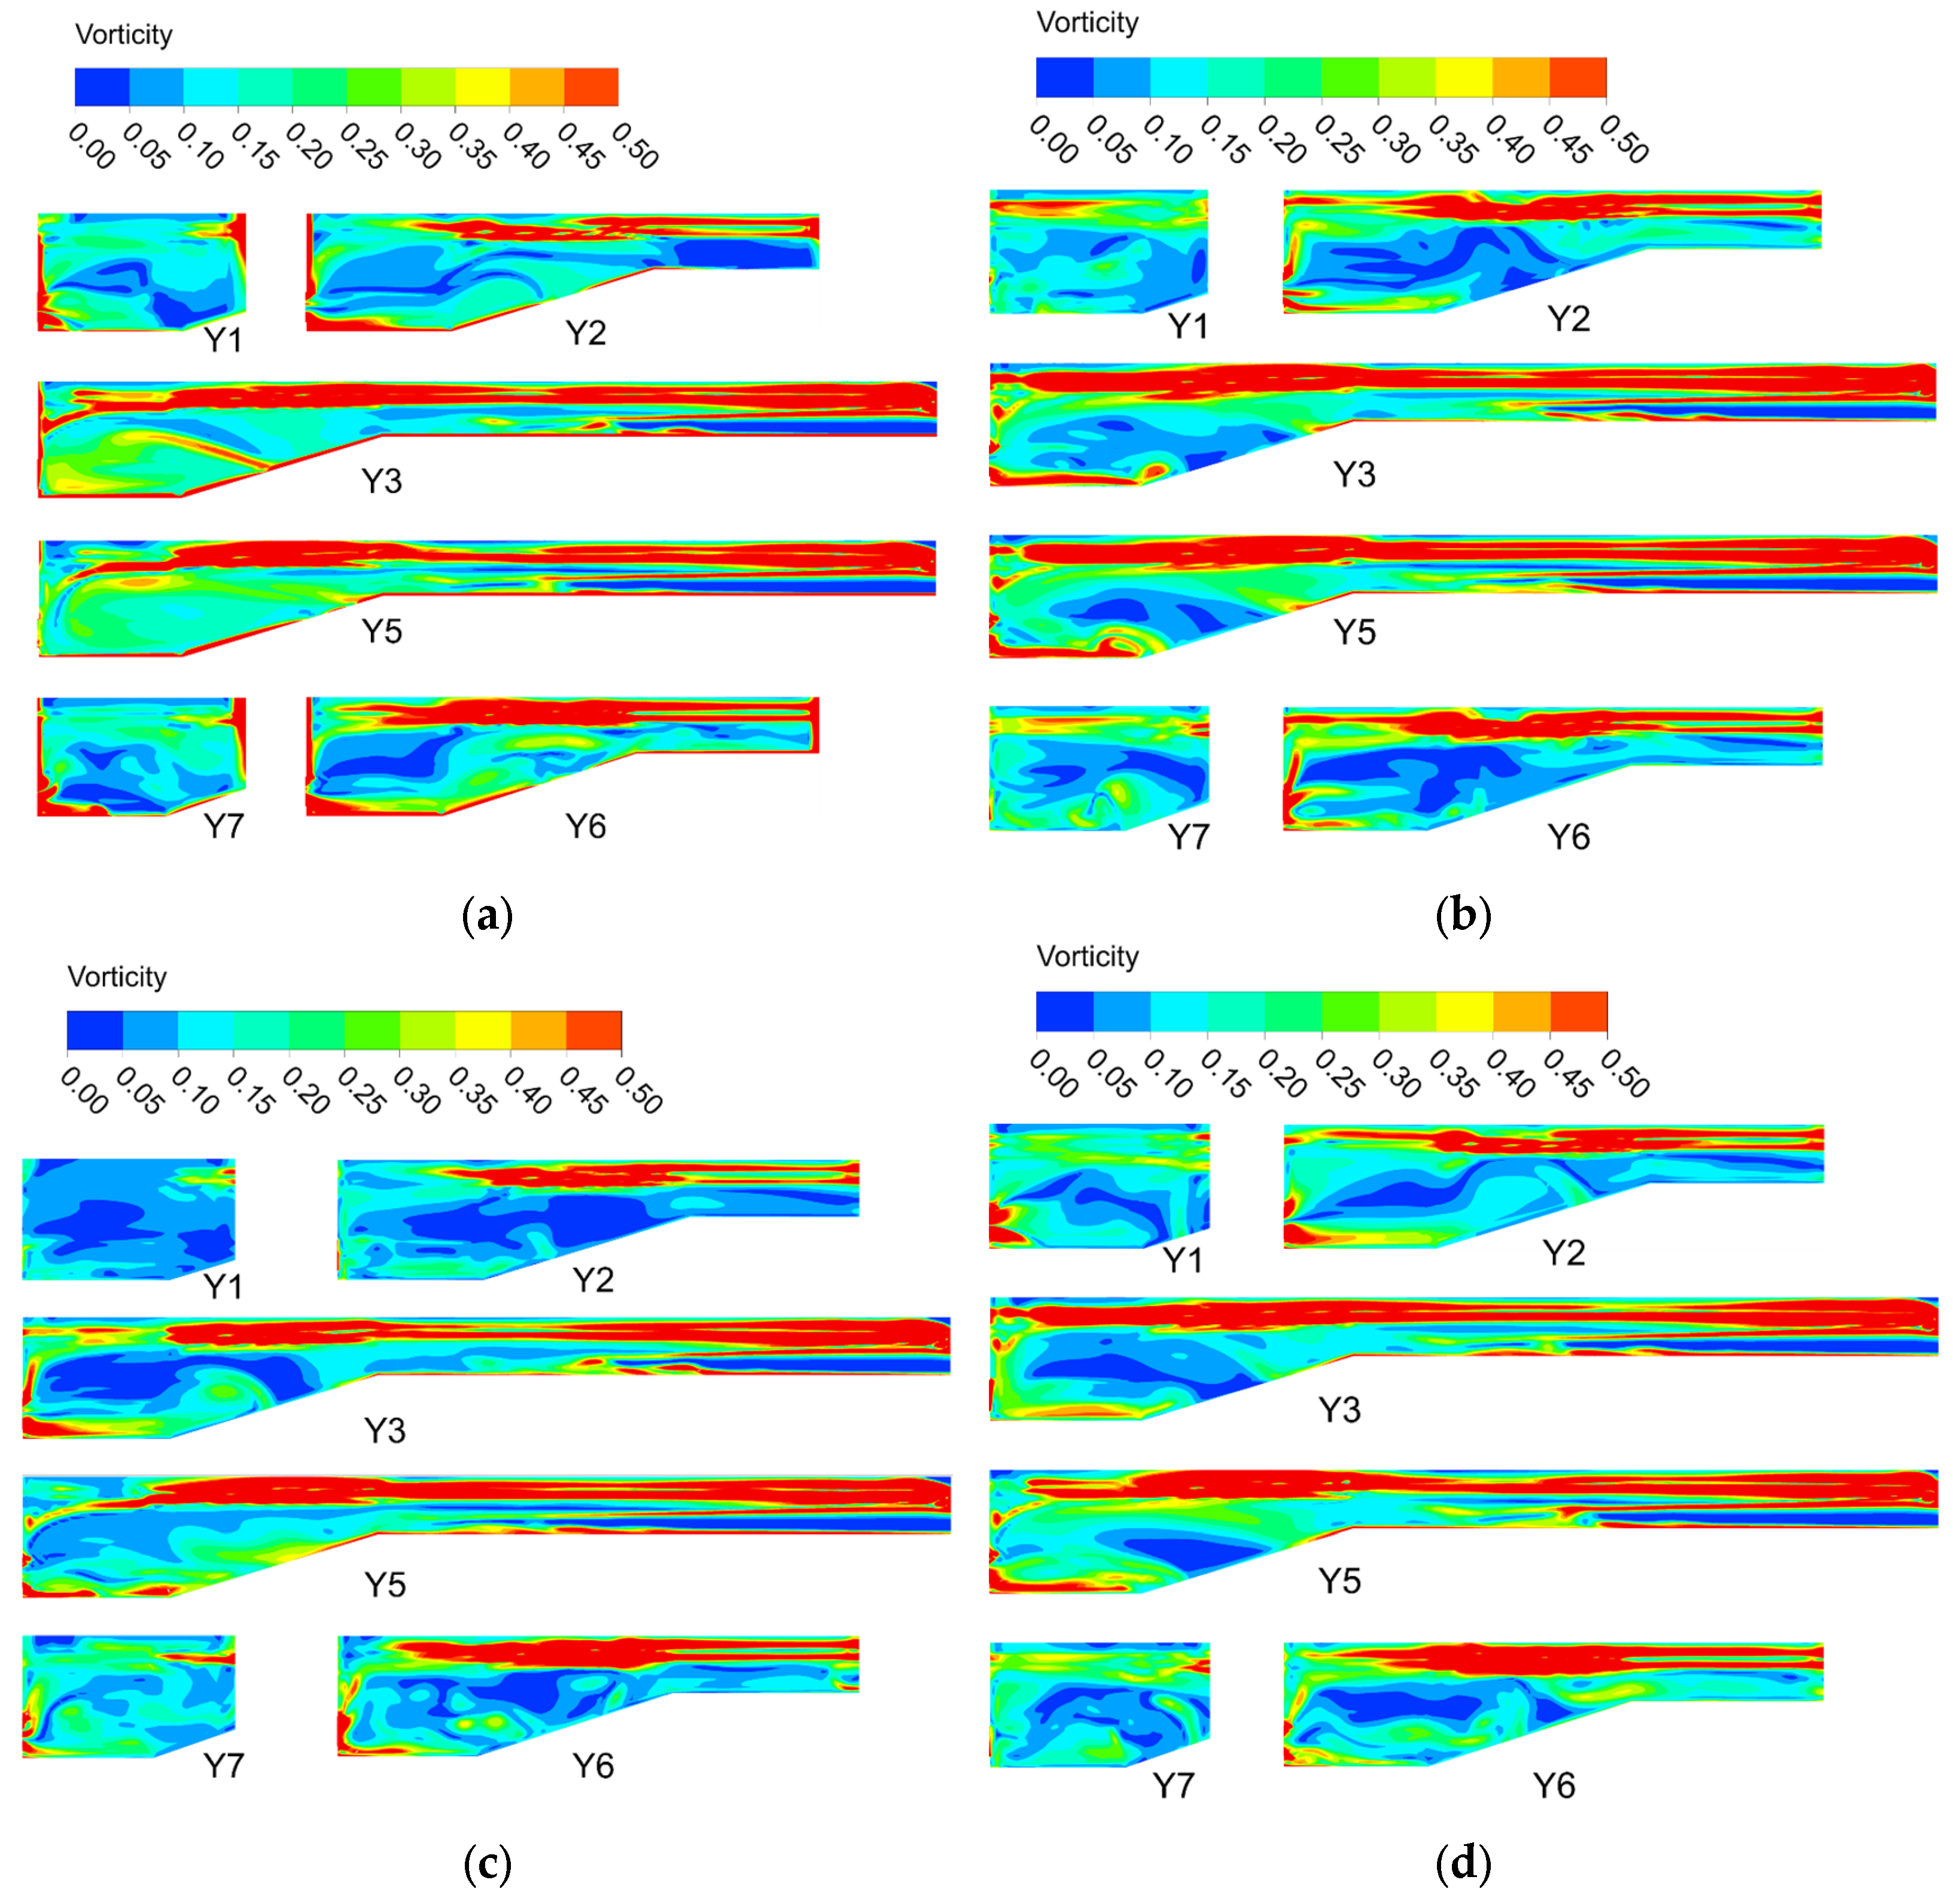
Figure 10 presents the velocity distribution along the longitudinal characteristic lines at a water depth of 3.3 m intersecting with longitudinal sections Y1, Y2, Y3, Y5, Y6, and Y7, as well as the streamline distribution of each longitudinal section. Figure 11 presents the vorticity contour maps at longitudinal sections Y1, Y2, Y3, Y5, Y6, and Y7 under the four operating schemes, with the vorticity magnitude ranging from 0.00 to 0.50 s−1. The longitudinal sections Y1, Y2, Y3, Y5, Y6, and Y7 are located at the front of the suction pipes of pumps 1#, 2#, 3#, 4#, 5#, and 6#, respectively. The simulation length extends from the forebay inlet to the pump suction pipe section.
Figure 10.
Velocity distribution patterns of longitudinal sections and longitudinal characteristic lines: (a) Velocity distribution along longitudinal characteristic lines for Scheme 1; (b) streamline distribution on longitudinal sections for Scheme 1; (c) velocity distribution along longitudinal characteristic lines for Scheme 2; (d) streamline distribution on longitudinal sections for Scheme 2; (e) velocity distribution along longitudinal characteristic lines for Scheme 3; (f) streamline distribution on longitudinal sections for Scheme 3; (g) velocity distribution along longitudinal characteristic lines for Scheme 4; (h) streamline distribution on longitudinal sections for Scheme 4.
Figure 11.
Vorticity contour maps for longitudinal sections: (a) vorticity contour map of Scheme 1; (b) vorticity contour map of Scheme 2; (c) vorticity contour map of Scheme 3; (d) vorticity contour map of Scheme 4.
From Figure 10a,c,e,g, it can be observed that the velocity distribution patterns along the longitudinal characteristic lines Y1-Z2, Y2-Z2, Y3-Z2, Y5-Z2, Y6-Z2, and Y7-Z2 are similar under the four different operating conditions. The velocities along the main flow longitudinal characteristic lines Y3-Z2 and Y5-Z2 are the highest. As shown in Table 4, the velocities are all around 0.345 m·s−1, with very similar distribution trends, and the main flow velocity decreases progressively from the forebay inlet to the pump inlet. The average velocity is 0.24 m·s−1. The velocities along the characteristic lines Y2-Z2 and Y6-Z2 on both sides are lowest near the forebay side walls and gradually increase toward the pump inlets. The average velocity is 0.06 m·s−1. The overall velocities along characteristic lines Y1-Z2 and Y7-Z2 are relatively low, with the same distribution pattern showing the lowest velocity near the side walls and gradually increasing toward the pump inlets. The maximum velocity is 0.086 m·s−1. The longitudinal characteristic lines reveal that the overall velocities on both sides of the forebay diffusion zone are relatively low, which is the main cause of severe sediment deposition. From the vorticity contour maps, the vorticity distributions along the main flow longitudinal sections Y3 and Y5 are similar under all four schemes, characterized by high vorticity bands (ω > 0.45 s−1) concentrated at the water surface and bottom boundaries, while the central flow region maintains moderate vorticity levels (ω ≈ 0.15–0.30 s−1). The vorticity distributions along sections Y1, Y2, Y6, and Y7 vary significantly among different schemes, reflecting the influence of different pump operation combinations on the flow field.
Table 4.
Comparison of longitudinal section velocities for different schemes.
In Scheme 1, vortices of varying degrees are generated near the pump suction pipes, but these vortices are located relatively far from the pump suction pipes, resulting in minimal impact on the pumps. Since pumps 3# and 4# are not in operation, the flow rebounds after contacting the wall and forms spiral vortices that diffuse toward both sides. Overall, the velocity distribution is uniform and symmetrical, with similar velocity gradients near each suction pipe. From the vorticity contour maps, sections Y1 and Y7 exhibit localized low-vorticity cores (ω < 0.10 s−1) in the central region with moderate vorticity distributions near the boundaries. The vorticity distribution shows good bilateral symmetry, which is consistent with the symmetric pump configuration. As shown in Table 4, the maximum velocities at Y1 (0.069 m·s−1) and Y7 (0.082 m·s−1) are relatively balanced, with average velocities of 0.034 m·s−1 and 0.041 m·s−1, respectively. From the streamline diagram of Scheme 2, it can be observed that the flow is smooth near sections Y3 and Y5, while the flow is turbulent at other sections. The velocity gradient at section Y2 is relatively large, leading to increased sediment deposition in the right-side region of the forebay. The vorticity contour maps show that sections Y1 and Y7 display more pronounced low-vorticity regions compared to Scheme 1, indicating weaker flow activity near the side walls. Localized high vorticity patches appear in the diffusion zone, corresponding to the turbulent flow characteristics. Table 4 shows that the maximum velocity at Y1 (0.034 m·s−1) is significantly lower than Y7 (0.084 m·s−1), with average velocities of 0.017 m·s−1 and 0.042 m·s−1, respectively, indicating asymmetric flow characteristics. From the streamline diagram of Scheme 3, it can be observed that the flow is stable and smooth, but there are also large velocity gradients at the sections on both sides, causing sediment deposition and affecting pump operation. The vorticity contour maps reveal that sections Y1 and Y7 exhibit extensive low-vorticity regions (ω < 0.05 s−1), reflecting the stagnant flow conditions due to the shutdown of pumps 1# and 2#. The vorticity distribution shows pronounced asymmetry, with higher vorticity concentrations on the right side. This is confirmed by Table 4, where both Y1 (0.018 m·s−1) and Y7 (0.017 m·s−1) show the lowest maximum velocities among all schemes, with average velocities of only 0.009 m·s−1 and 0.008 m·s−1, respectively, indicating severe flow stagnation on both sides. In Scheme 4, the flow is turbulent at the sections on both sides, and the overall velocity at section Y7 is relatively low, which may cause sediment deposition near pump 6#. The vorticity contour maps show contrasting characteristics between sections Y1 and Y7. Section Y1 exhibits relatively higher vorticity with localized vortex structures, while section Y7 displays extensive low-vorticity regions. Table 4 confirms this asymmetry, with Y1 showing the highest maximum velocity (0.086 m·s−1) and average velocity (0.043 m·s−1) among all schemes, while Y7 has the lowest maximum velocity (0.017 m·s−1) and average velocity (0.008 m·s−1), indicating that sediment deposition is more likely to occur near pump 6#.
3.4. Velocity Distribution Patterns Along the Water Depth Direction
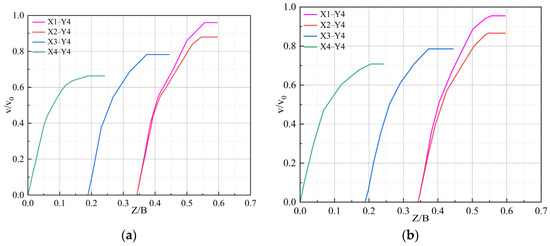
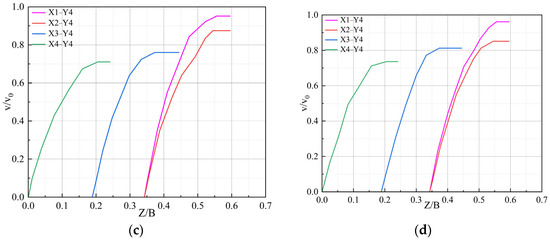
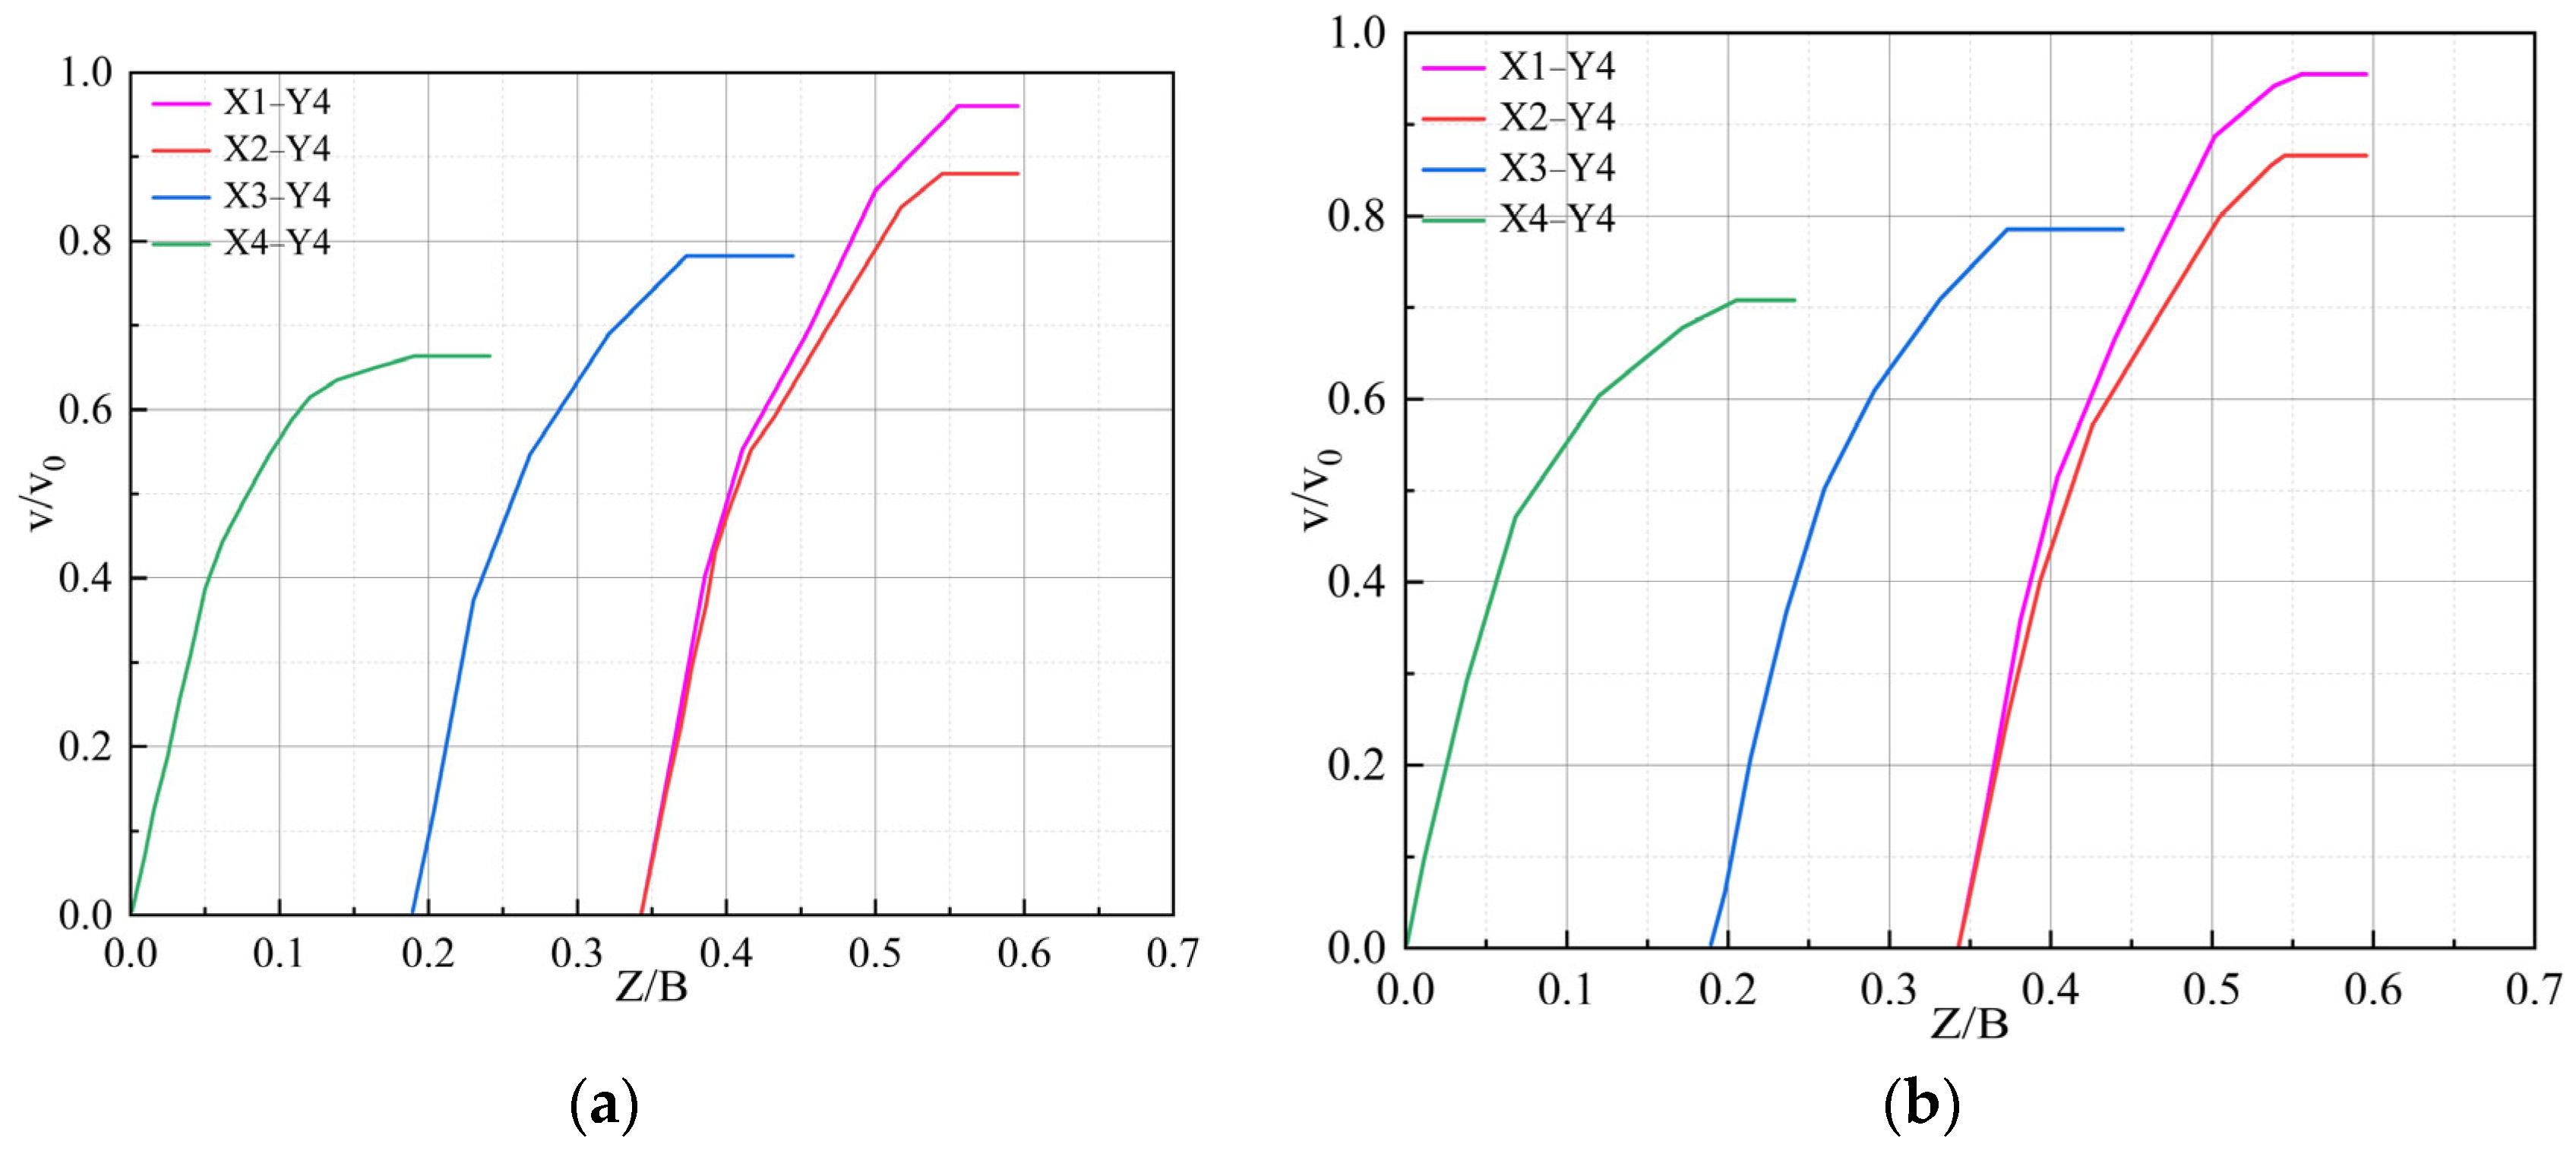
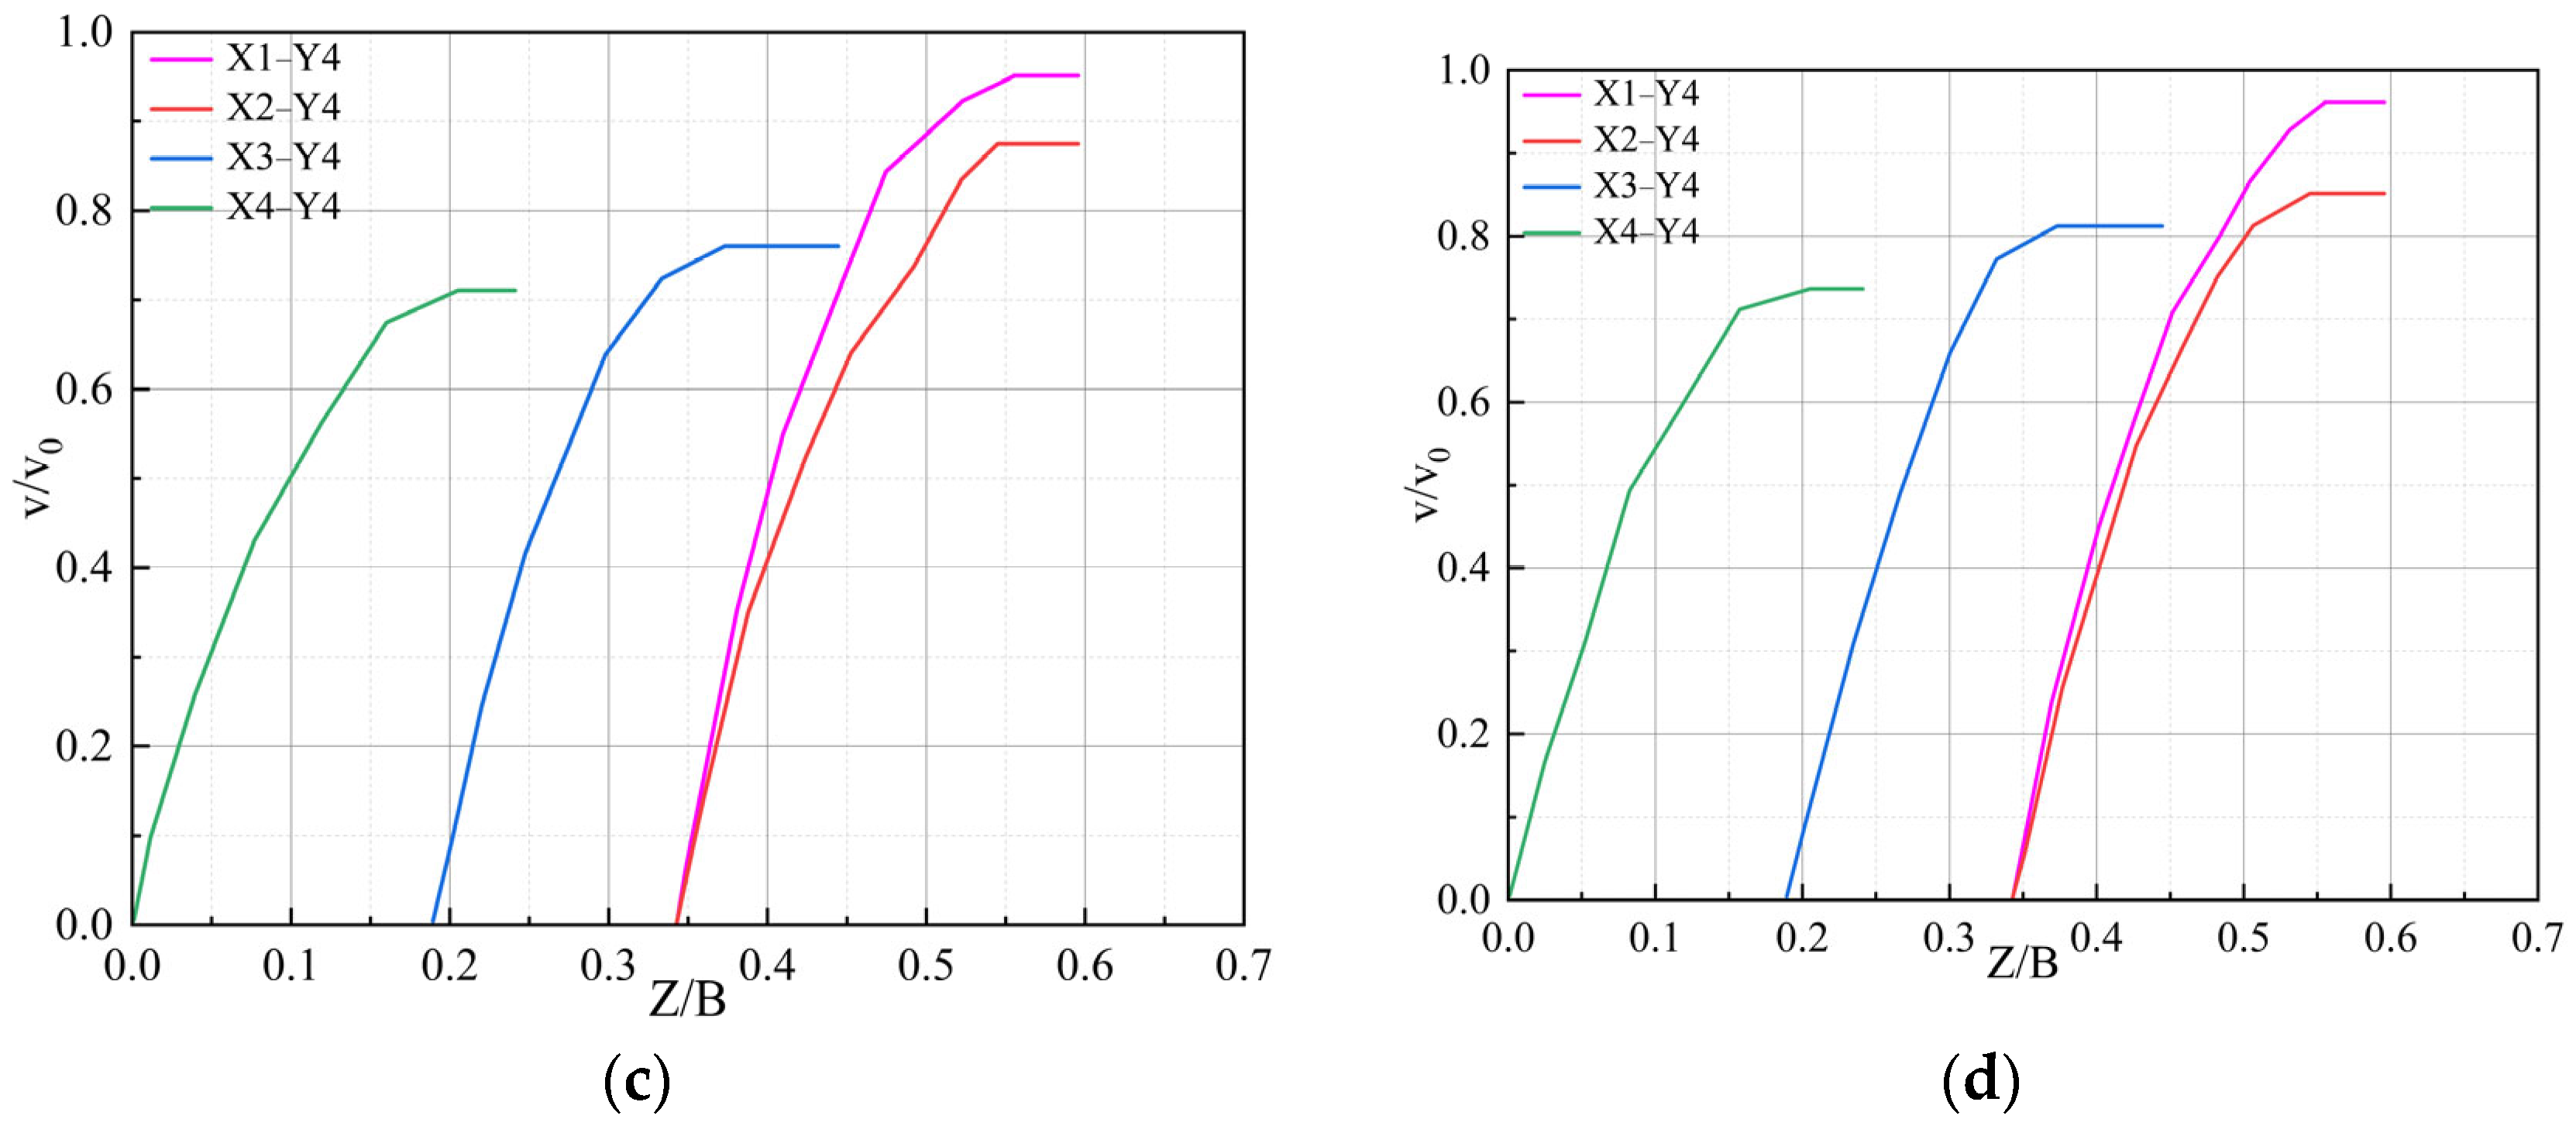
Figure 12 presents the velocity distribution along the vertical characteristic lines at the intersection of the longitudinal section Y4 and transverse sections X1, X2, X3, and X4 under the four operating conditions.
Figure 12.
Velocity distribution patterns along the water depth direction: (a) velocity distribution pattern diagram for Scheme 1; (b) velocity distribution pattern diagram for Scheme 2; (c) velocity distribution pattern diagram for Scheme 3; (d) velocity distribution pattern diagram for Scheme 4.
Figure 12 illustrates the dimensionless vertical velocity distribution characteristics along the intersections of longitudinal section Y4 with transverse sections X1, X2, X3, and X4 under four operating schemes. As observed from the figures, all four operating schemes exhibit similar velocity distribution patterns along the vertical characteristic lines. Due to the geometric diffusion effect of the forebay structure, the flow velocity progressively attenuates from the forebay inlet (section X1) toward the pump suction inlet (section X4). Along each vertical characteristic line, the velocity demonstrates a distinct gradient distribution in the water depth direction, characterized by higher velocities near the water surface and lower velocities approaching the bottom, exhibiting a typical vertically stratified structure. Across all schemes, the dimensionless velocity v/v0 reaches a maximum value of approximately 0.96 along the X1-Y4 line and stabilizes within the range of 0.65–0.75 along the X4-Y4 line.
The quantitative analysis based on Table 5 further reveals the flow characteristics under different operating conditions. At section X1, the maximum velocities across the four schemes range from 0.328 to 0.331 m·s−1, with average velocities ranging from 0.164 to 0.165 m·s−1, exhibiting the smallest inter-scheme variation in only 1.1%. At section X2, the maximum velocities range from 0.293 to 0.303 m·s−1, with average velocities ranging from 0.147 to 0.152 m·s−1. At section X3, the maximum velocities range from 0.262 to 0.280 m·s−1, with average velocities ranging from 0.131 to 0.140 m·s−1, where Scheme 4 exhibits the highest values and Scheme 3 shows the lowest average velocity. At section X4, the maximum velocities range from 0.229 to 0.254 m·s−1, with average velocities ranging from 0.114 to 0.127 m·s−1. This section demonstrates the most significant inter-scheme variation among all four sections, with an average velocity variation amplitude of approximately 11%.
Table 5.
Comparison of velocities along the water depth direction for different schemes.
A comparison of the velocity curves among the four schemes in Figure 12 reveals distinct spatial variation characteristics. Along the X1-Y4 and X2-Y4 characteristic lines, the velocity distribution curves of all four schemes exhibit a high degree of overlap, indicating that the velocity distribution in the region near the forebay inlet is minimally affected by the operating scheme. Along the X3-Y4 line, differentiation among the schemes begins to emerge, with the stabilized velocity value of Scheme 4 (v/v0 ≈ 0.81) being slightly higher than those of the other schemes (v/v0 ≈ 0.77–0.79). Along the X4-Y4 line, the inter-scheme differences become most pronounced: Scheme 4 exhibits the highest stabilized velocity value (v/v0 ≈ 0.74), while Scheme 1 shows the lowest stabilized velocity value (v/v0 ≈ 0.66). Furthermore, the longitudinal velocity attenuation from section X1 to X4 ranges from 23.4% to 30.9% across the four schemes, with Scheme 1 exhibiting the largest attenuation and Scheme 4 demonstrating the smallest.
3.5. Velocity Uniformity Analysis
Table 6 presents the velocity uniformity at cross-section X5 in front of the inlet for different unit operation combination schemes. The data reveal notable differences in velocity uniformity among the four schemes, with values ranging from 70.42% to 81.77%, representing a range of 11.35 percentage points. Specifically, Scheme 1 exhibits a velocity uniformity of 81.77%, Scheme 4 shows 79.86%, Scheme 2 demonstrates 76.56%, and Scheme 3 presents 70.42%. Ranking the schemes by velocity uniformity in descending order yields: Scheme 1 > Scheme 4 > Scheme 2 > Scheme 3.
Table 6.
Velocity uniformity of different unit operation combinations.
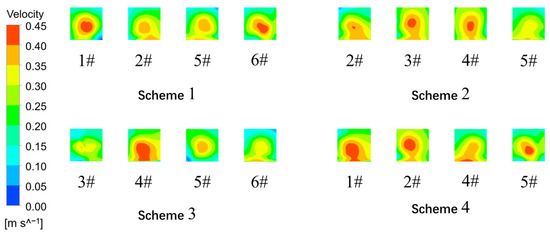
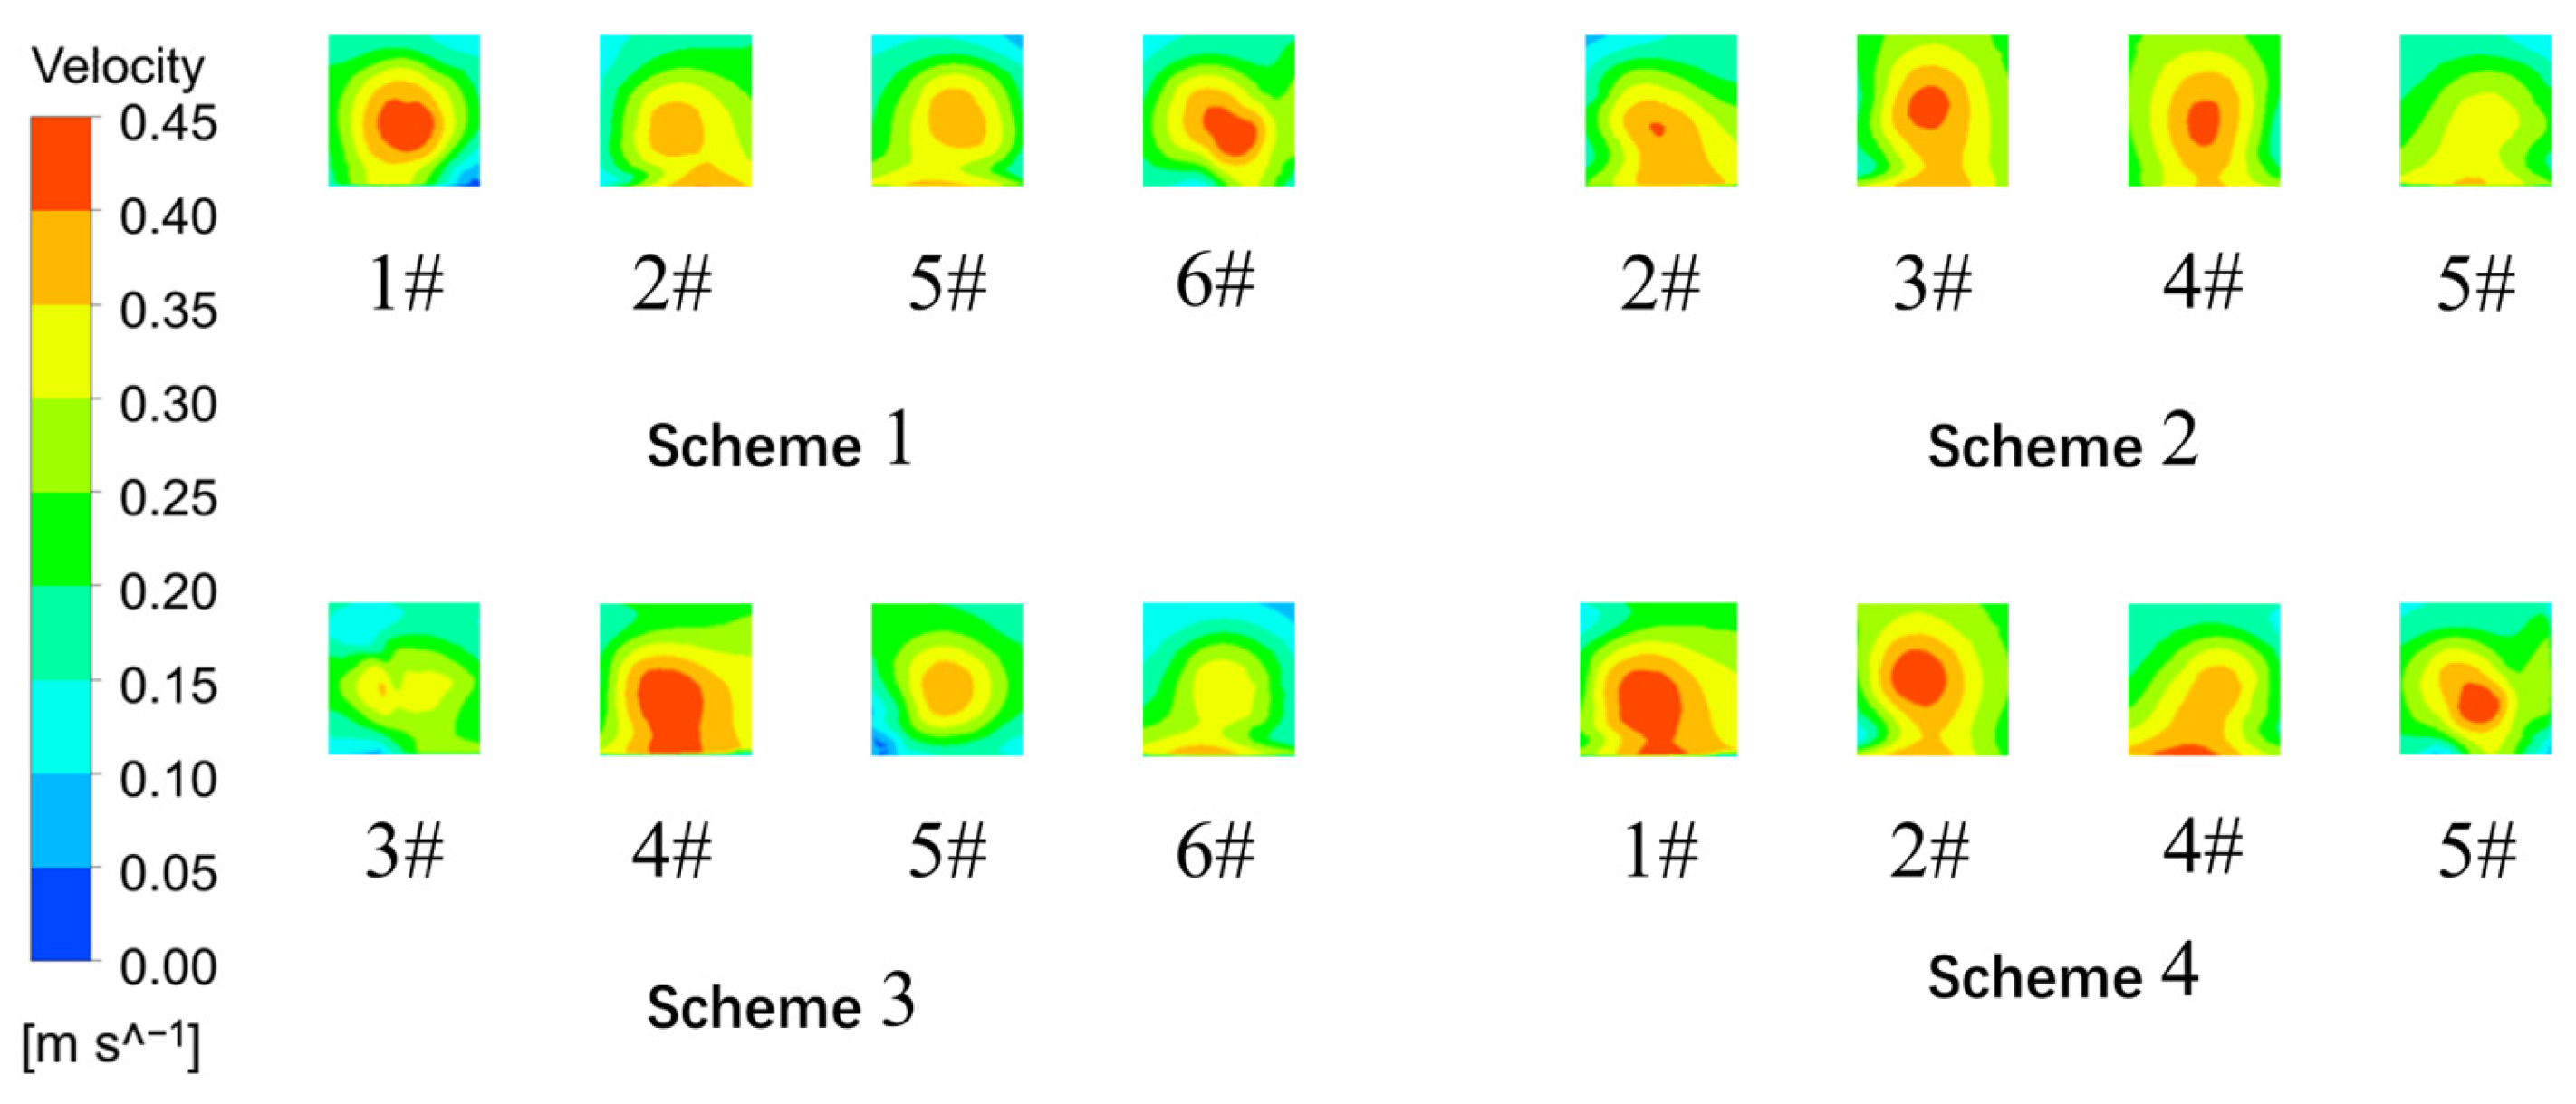
Figure 13 displays the velocity contour distribution characteristics at the inlet cross-sections for each scheme. As observed from the figure, the velocity distributions of the four schemes exhibit distinct spatial characteristics. Scheme 1 presents a velocity distribution pattern characterized by higher velocities on both sides and lower velocities in the middle, with an overall relatively symmetrical distribution. Scheme 2 demonstrates an opposite distribution pattern, with lower velocities on both sides and higher velocities in the central region. Scheme 3 exhibits the most pronounced non-uniformity in velocity distribution, with high-velocity regions concentrated in localized areas. In Scheme 4, the flow field at the No. 4 inlet is influenced by the non-operation of the adjacent No. 3 inlet, resulting in an asymmetrical velocity distribution pattern.
Figure 13.
Velocity contour maps at the inlet cross-sections for each scheme.
From the color scale distribution in the velocity contour maps, the velocity values at the inlet cross-sections of all schemes are primarily distributed within the range of 0.10–0.45 m·s−1. The high-velocity regions (red, approximately 0.40–0.45 m·s−1) differ in position and extent among the schemes: in Scheme 1, the high-velocity zone is mainly located in the upper-middle portion of the cross-section with a relatively concentrated distribution; Schemes 2 and 4 exhibit comparatively larger high-velocity areas; and Scheme 3 shows a more dispersed high-velocity distribution. The low-velocity regions (blue to light blue, approximately 0.00–0.10 m·s−1) predominantly appear at the peripheral positions of each cross-section, with Scheme 3 exhibiting a relatively larger low-velocity zone, which corresponds to its lower velocity uniformity value.
4. Discussion
Xu et al. [8] investigated flow conditions in a lateral forebay under 10 unit operation combinations, demonstrating that symmetric startup with terminal units operational produces more stable flow conditions. Due to the structural particularity of the lateral forebay, its main flow diffusion pattern differs from that of the forward forebay. The present study confirms this finding in forward-intake configurations through comparative analysis of velocities in different directions: as shown in Table 3, while front-end velocities remain stable across schemes (0.344–0.345 m/s), Scheme 1 with symmetric operation exhibits more uniform velocity attenuation (middle: 0.271 m/s, rear: 0.229 m/s) compared to Scheme 3 (0.262 m/s and 0.216 m/s). The velocity uniformity analysis in Table 6 further confirms that Scheme 1 achieves 81.77% uniformity versus 70.42% for Scheme 3, representing an improvement of 11.35 percentage points. This finding is also consistent with Hu et al. [6], who employed three-dimensional turbulent numerical simulation and found that symmetric interval startup of units produces favorable flow patterns with reduced sediment deposition in large-scale multi-unit pumping stations. Wang et al. [10] employed numerical simulation to investigate vortex migration characteristics in lateral pumping station forebays, finding that central forebay flow remains stable while larger vortices form on both sides, achieving 18.63% improvement in velocity uniformity and 75.47% reduction in vortex area through optimization. The present study observes similar vortex formation patterns: as shown in Figure 6 and Figure 7, Scheme 1 displays characteristic dual-core vorticity (ω > 0.40 s−1) concentrated on lateral sides with symmetric distribution, while Scheme 2 shows vortex cores near the pump inlets with high vorticity zones (ω > 0.45 s−1) at the central intake region. The 11.35 percentage point improvement in this study is comparable to but slightly lower than Wang et al.’s 18.63%, which may be attributed to differences in forebay geometry and specific unit combinations evaluated. Wang et al. [7] further investigated water-sediment two-phase flow under five unit operation combinations using the Mixture multiphase flow model and Realizable k-ε turbulence model, demonstrating that optimized combinations can reduce the flow deflection angle by 3.35°, improve velocity uniformity by 5.84 percentage points, and decrease sediment concentration by 58.60%. Although the present study focuses on pure water flow, the velocity distribution patterns provide important implications for sediment transport behavior. Regarding the sediment transport implications, Zi et al. [11] demonstrated that when side units are non-operational, flow field symmetry is disrupted, forming dead water zones that significantly increase sediment concentration, which can reach 8–9 times the inlet concentration. The velocity distribution in the present study provides quantitative evidence supporting this mechanism. Table 4 reveals that under Scheme 3, velocities at Y1 and Y7 (0.009 m/s and 0.008 m/s) are reduced by 73.5% and 80.5% compared to Scheme 1 (0.034 m/s and 0.041 m/s), creating stagnant conditions highly favorable for sediment deposition. Figure 11c shows extensive low-vorticity regions (ω < 0.05 s−1) under Scheme 3 near non-operating pumps 1# and 2#, with peak vorticity exceeding 0.50 s−1 near Unit 6# intake, corroborating Zi et al.’s findings on disrupted flow field symmetry. Dou et al. [19] established a two-dimensional mathematical model to predict flow and sediment deposition characteristics, indicating that low-velocity zones are primary locations for sediment accumulation. The present three-dimensional analysis extends this understanding by revealing that such low-velocity zones are most pronounced when asymmetric unit configurations are adopted. Liu et al. [12,13] conducted experimental and numerical studies on turbulent flow characteristics in pumping forebays, mainly focusing on longitudinal velocity distributions and the effectiveness of combined sills in eliminating large-scale circulations and vortices. The present study extends the analysis methodology to three dimensions. Table 5 shows that at X1 section near forebay inlet, inter-scheme velocity variation is only 1.1% (average: 0.164–0.165 m/s), while at X4 section near pump inlets, the variation reaches approximately 11% (average: 0.114–0.127 m/s), demonstrating that unit combinations primarily affect the rear forebay region. This spatial variation pattern is consistent with the observations of Luo et al. [14], who investigated the influence of bottom sill positions and found that flow conditions near pump inlets are more sensitive to geometric and operational modifications than upstream regions. Lv et al. [21] employed the coupled VOF and Level Set method to investigate the formation mechanism of suction vortices under high flow rates, elucidating the correlation between entrained vortex development and excessive inflow angles. The transverse section analysis in Figure 8 and Figure 9 reveals similar mechanisms in the present study: Scheme 1 exhibits small-scale vortices at sections X2–X3 with vortex cores located relatively far from pump suction pipes, while Scheme 2 shows large-scale vortices near side walls with extensive high vorticity zones (ω > 0.40 s−1) and vortex cores located near the pump inlets, which may deteriorate pump suction conditions. Li et al. [9] applied entropy production theory for the first time to analyze hydraulic losses in lateral-intake forebays, revealing that turbulence dissipation accounts for over 90% of total hydraulic loss and proposing an optimal strategy of prioritizing downstream unit startup. The velocity uniformity ranking in this study (Scheme 1: 81.77% > Scheme 4: 79.86% > Scheme 2: 76.56% > Scheme 3: 70.42%) supports similar optimization principles, with Figure 13 illustrating that Scheme 1 presents symmetrical velocity distribution (0.10–0.45 m/s) while Scheme 3 exhibits pronounced non-uniformity.
For practical engineering applications, various flow rectification measures have been proposed to improve forebay flow conditions. Mi et al. [15] compared different sill configurations based on Eulerian solid–liquid two-phase flow models, finding that discontinuous bottom sills are most effective in eliminating surface backflow while reducing sediment accumulation. Nasr et al. [16] demonstrated that parabolic walls combined with rectification piers can improve velocity uniformity by 8% and reduce vortex area by 70% in lateral-intake configurations. Zhang et al. [17] applied the orthogonal test method to optimize diversion pier layouts, significantly improving axial velocity uniformity and weighted average flow angle. Li et al. [18] conducted physical model experiments showing that additional flow isolation piers increased inlet flow uniformity by 9% and 2% at different inlets. However, these engineering modifications require additional construction costs and may introduce new maintenance requirements. The present study demonstrates that significant improvements in flow uniformity (up to 11.35 percentage points) can be achieved through operational optimization alone, without any structural modifications, providing a cost-effective approach for existing pump stations.
This study has some limitations: it focuses on pure water flow without considering sediment transport; simulations were conducted under steady-state conditions; and only four unit combinations were evaluated with field validation for one scheme. Future research should couple sediment transport models, conduct transient simulations, and combine operational optimization with structural rectification measures.
5. Conclusions
This study investigated the effects of different pump unit operation combinations on flow patterns in the forward-intake forebay of the Hongsi Pumping Station through validated three-dimensional numerical simulation. The main conclusions are as follows:
- (1)
- Unit operation combinations primarily affect the rear forebay region, with inter-scheme velocity variation increasing from 1.1% at the forebay inlet to approximately 11% near the pump inlets, while front-end main flow velocities remain stable at 0.344–0.345 m/s across all schemes.
- (2)
- Symmetric end-unit operation (Scheme 1: units 1#, 2#, 5#, 6#) achieves optimal flow conditions with 81.77% velocity uniformity, characterized by dual-core vorticity distribution with moderate intensity. Asymmetric configurations result in extensive low-vorticity stagnant zones and severely reduced lateral velocities.
- (3)
- For practical operation, symmetric end-unit operation with middle units on standby is recommended. Scheme 4 (1#, 2#, 4#, 5#) can serve as an alternative with 79.86% velocity uniformity, while central concentration and single-side bias configurations should be avoided.
Author Contributions
Software, formal analysis, writing—original draft, Z.L.; project administration, conceptualization, methodology, S.L.; investigation and supervision, W.C.; writing—review and editing, Y.G. All authors have read and agreed to the published version of the manuscript.
Funding
This research was funded by the Ningxia Natural Science Foundation Project of China (2023AAC02050) and The Project for Funding High-level Selected and Cultivated Talents of the Northern Ethnic University (2025BG255).
Data Availability Statement
The data supporting this study’s findings are available from the corresponding author upon reasonable request.
Conflicts of Interest
The authors declare no conflicts of interest.
References
- Appiah, D.; Zhang, F.; Yuan, S.; Osman, M.K. Effects of the geometrical conditions on the performance of a side channel pump: A review. Int. J. Energy Res. 2018, 42, 416–428. [Google Scholar] [CrossRef] [Scilit]
- Dolgin, E. Water and warfare: The battle to control a precious resource. Nature 2023, 624, 7. [Google Scholar] [CrossRef] [Scilit] [PubMed]
- Wang, X.; Weigang, L.; Chuan, W.; Bo, X. Optimization of the Hollow Rectification Sill in the Forebay of the Pump Station Based on the PSO-GP Collaborative Algorithm. Shock Vib. 2021, 2021, 6618280. [Google Scholar] [CrossRef] [Scilit]
- Feng, J.; Rao, N.; Fei, Z.; Xu, H.; Wang, X.; Xie, F.; Li, G. Analysis and optimization of flow pattern in the forebay of shaft-inflow pumping station based on response surface method. Trans. Chin. Soc. Agric. Eng. 2025, 41, 34–44, (In Chinese with English abstract). [Google Scholar] [CrossRef]
- Yuan, L.; Jinde, G.; Chao, G.; Chenlu, Z. Flow Patterns and Rectification Measures in the Forebay of Pumping Station. IOP Conf. Ser. Mater. Sci. Eng. 2020, 794, 012058. [Google Scholar] [CrossRef] [Scilit]
- Hu, J. Simulation of impact of running pumps decision and divergent angle on the flow pattern in the forebay of pumping station. In Proceedings of the International Conference on Energy Equipment Science and Engineering (ICEESE), Guangzhou, China, 30–31 May 2015; CRC Press–Taylor & Francis Group: Boca Raton, FL, USA, 2015; pp. 2053–2057. [Google Scholar]
- Wang, H.; Xu, D.; Ran, Q.; Yuan, S.; Tang, H. Response mechanism for start-up combinations on water-sediment flow pattern in the forebay of forward pumping station. Trans. Chin. Soc. Agric. Eng. 2024, 40, 52–61, (In Chinese with English abstract). [Google Scholar] [CrossRef]
- Xu, C.; Wang, R.; Liu, H.; Lian, H.; Wang, Y.; Wang, G. Research on the influence of start-up combinations on the flow pattern in forebay of side-inlet pumping station on sandy river. J. Hydraul. Eng. 2020, 51, 92–101, (In Chinese with English abstract). [Google Scholar] [CrossRef]
- Li, J.; Qian, S.; Li, P.; He, Q. Hydraulic characteristics of lateral-intake multiple forebays under different pump start-up combinations. J. Hydrodyn. 2025, 37, 938–954. [Google Scholar] [CrossRef] [Scilit]
- Wang, H.; Xu, D.; Ding, C.; Ran, Q.; Yuan, S.; Tang, H. Numerical and experimental study on water-sediment flow in a lateral pumping station forebay. Phys. Fluids 2024, 36, 17. [Google Scholar] [CrossRef] [Scilit]
- Zi, D.; Wang, B.; Wang, F.; He, C.; Xue, S. Influences of start-up pump units on the sediment concentration for the intake system of a pumping station. Trans. Chin. Soc. Agric. Eng. 2022, 38, 59–68, (In Chinese with English abstract). [Google Scholar] [CrossRef]
- Liu, C.; Zhou, J.; Cheng, L.; ASME. The experimental study and numerical simulation of turbulent flow in a pumping forebay. In Proceedings of the ASME Power Conference 2009, Albuquerque, NM, USA, 21–23 July 2009; American Society of Mechanical Engineers: New York, NY, USA, 2009; pp. 171–176. [Google Scholar] [CrossRef] [Scilit]
- Liu, C.; Zhou, J.; Cheng, L.; Jin, Y.; Han, X.; ASME. Study on improving the flow in forebay of the pumping station. In Proceedings of the 3rd Joint US-European Fluids Engineering Division Summer Meeting, Montreal, QC, Canada, 1–5 August 2010; American Society of Mechanical Engineers: New York, NY, USA, 2010; pp. 481–487. [Google Scholar]
- Luo, C.; Cheng, L.; Liu, C.; Zhou, J.; Jin, Y. Numerical simulation of flow pattern with sill in the front inflow forebay of pumping station. In Proceedings of the 26th IAHR Symposium on Hydraulic Machinery and Systems, Beijing, China, 19–23 August 2012; IOP Publishing Ltd.: Bristol, UK, 2013; Volume 15. [Google Scholar] [CrossRef] [Scilit]
- Mi, Z.; Zhou, D.; Mao, Y. Three-dimensional CFD simulation of solid-liquid two-phase flow in the pumping station forebay with sills. In Proceedings of the 26th IAHR Symposium on Hydraulic Machinery and Systems, Beijing, China, 19–23 August 2012; IOP Publishing Ltd.: Bristol, UK, 2013; Volume 15. [Google Scholar] [CrossRef] [Scilit]
- Nasr, A.; Yang, F.; Zhang, Y.; Wang, T.; Hassan, M. Analysis of the Flow Pattern and Flow Rectification Measures of the Side-Intake Forebay in a Multi-Unit Pumping Station. Water 2021, 13, 2025. [Google Scholar] [CrossRef] [Scilit]
- Zhang, C.; Yan, H.; Jamil, M.; Yu, Y. Improvement of the Flow Pattern of a Forebay with a Side-Intake Pumping Station by Diversion Piers Based on Orthogonal Test Method. Water 2022, 14, 2663. [Google Scholar] [CrossRef] [Scilit]
- Li, X.; Zhou, S.; Xu, G. Experimental study on flow pattern in forebay pump station and rectification scheme. IOP Conf. Ser. Earth Environ. Sci. 2021, 768, 012014. [Google Scholar] [CrossRef] [Scilit]
- Dou, S.; Yu, M.; Yang, G. Numerical simulation of sediment movement in heavy silt-laden forebay. In Proceedings of the 16th Asia and Pacific Division Congress of the International Association of Hydraulic Engineering and Research/3rd IAHR International Symposium on Hydraulic Structures, Nanjing, China, 20–23 October 2008; Tsinghua University Press: Beijing, China, 2009; pp. 1061–1066. [Google Scholar] [CrossRef] [Scilit]
- Liu, S.; Li, Y.; Luo, X.; Wu, Y.; ASME. Simulation of the flow condition near the intake of a pump sump. In Proceedings of the 2nd US-European Fluids Engineering Division Summer Meeting, Miami, FL, USA, 17–20 July 2006; American Society of Mechanical Engineers: New York, NY, USA, 2006; pp. 291–295. [Google Scholar]
- Lv, F.; Li, P.; Xiao, W.; Pan, L. Study on the dynamic evolution process of entrainment vortex at the horizontal inlet of a large low-head pump station. Eur. J. Mech. B-Fluids 2026, 117, 11. [Google Scholar] [CrossRef] [Scilit]
- Li, C.; Li, C. Hydraulic model study of pump station for plain reservoir. In Proceedings of the International Conference on Water Resources and Environment (WRE), Beijing, China, 25–28 July 2015; CRC Press–Taylor & Francis Group: Boca Raton, FL, USA, 2016; pp. 97–102. [Google Scholar]
- Butler, K.M.; Farrell, B.F. Three-dimensional optimal perturbations in viscous shear flow. Phys. Fluids A Fluid Dyn. 1992, 4, 1637–1650. [Google Scholar] [CrossRef] [Scilit]
- Yang, F.; Zhang, Y.; Liu, C.; Wang, T.; Jiang, D.; Jin, Y. Numerical and experimental investigations of flow pattern and anti-vortex measures of forebay in a multi-unit pumping station. Water 2021, 13, 935. [Google Scholar] [CrossRef] [Scilit]
- Wang, J. Boundary layers for compressible Navier-Stokes equations with outflow boundary condition. J. Differ. Equ. 2010, 248, 1143–1174. [Google Scholar] [CrossRef] [Scilit]
- Li, J.; Zhao, X.; Zhang, H.; Li, D. Numerical simulation of single-jet impact cooling and double-jet impact cooling of hot-rolled L-shaped steel based on multiphase flow model. Sci. Rep. 2024, 14, 21. [Google Scholar] [CrossRef] [Scilit] [PubMed]
- Tao, H.; Chen, H.; Xie, J.; Hu, Y. An alternative approach to quantifying fluid flow uniformity based on area-weighted average velocity and mass-weighted average velocity. Energy Build. 2012, 45, 116–123. [Google Scholar] [CrossRef] [Scilit]
- Schubert, A.; Hagemann, D.; Voss, A.; Bergmann, K. Evaluating the model fit of diffusion models with the root mean square error of approximation. J. Math. Psychol. 2017, 77, 29–45. [Google Scholar] [CrossRef] [Scilit]

Disclaimer/Publisher’s Note: The statements, opinions and data contained in all publications are solely those of the individual author(s) and contributor(s) and not of MDPI and/or the editor(s). MDPI and/or the editor(s) disclaim responsibility for any injury to people or property resulting from any ideas, methods, instructions or products referred to in the content. |
© 2026 by the authors. Licensee MDPI, Basel, Switzerland. This article is an open access article distributed under the terms and conditions of the Creative Commons Attribution (CC BY) license.