


Abstract
Post-consumer PET bottle recycling generates wash water highly loaded with microplastics (MPs), predominantly PET. This study traces the development of organosilane-induced agglomeration–fixation from a feasibility test and pilot trials (2021–2024) to continuous operation (since 2025). The treatment required no pH adjustment: it was applied to untreated alkaline wash water (pH up to 10.8) on-site, stored wash water (pH 6.2) in the technical centre, and already neutralised wash water (pH 6.3–6.4) in continuous operation. After parameter optimisation, the pilot plant removed 84.9 ± 1.7% of the MPs on-site (n = 5) and 81.1 ± 4.4% in the technical centre (n = 3), whereas the existing dissolved air flotation removed −42.7% to 68.5%. Subsequently, in continuous operation, monitored by fluorescence-based MP detection, turbidity, and total suspended solids (TSS), the MP removal was 96.6 ± 2.7% (n = 4). A higher stirrer speed reduced it from 98.4–99.1% to 93.1–95.8%, which turbidity and TSS indicated more distinctly. About 1.8 kg of dry solids per m3 were separated. Assuming indirect discharge, the treatment reduces MP emissions to surface water and sewage sludge 6.6-fold with the pilot plant and 24-fold in continuous operation.
1. Introduction
Polyethylene terephthalate (PET) beverage bottles are a key product of the circular plastics economy, and bottle-to-bottle recycling has been established for more than two decades [1,2]. The demand for recycled PET is further driven by the European Single-Use Plastics Directive, which requires PET beverage bottles to contain at least 25% recycled plastic from 2025 onwards and all beverage bottles to contain at least 30% from 2030 onwards [3]. Mechanical PET recycling comprises sorting, grinding of the bottles into flakes, washing, including hot washing steps, to remove labels, adhesives, and product residues, separation of foreign polymers, and decontamination [1,2].
Plastic recycling facilities have been identified as relevant point sources of microplastics (MPs) [4,5,6]. Large quantities of MPs are generated and released during mechanical recycling, including bottle recycling, when no adequate treatment is installed [4]. The size reduction step is the predominant source of MP generation, with PET among the polymers showing high generation rates [5], and the wash water of a mixed plastics recycling facility contained up to 1.12 × 10⁸ MPs/m3 [6]. Industrial sources of MPs are increasingly recognised as a known but overlooked problem [7,8], and wastewater from plastic recycling requires dedicated treatment before discharge [9,10].
The Water Framework Directive requires point-source discharges to be controlled on the basis of best available techniques and emission limit values [11]. Among the main pollutants, it lists materials in suspension and substances that affect the oxygen balance [11]. The recast Urban Wastewater Treatment Directive subjects discharges of non-domestic wastewater into collecting systems to prior regulations or authorisations, introduces the monitoring of MPs at the inlets and outlets of urban wastewater treatment plants (WWTPs), and requires that non-domestic discharges do not limit the recovery of resources from wastewater and sludge [12]. The Zero Pollution Action Plan aims to reduce MP releases to the environment by 30% by 2030 [13], and the regulation on plastic pellet losses addresses the pellet supply chain including recycling [14]. Specific emission limits for MPs in industrial wastewater do not exist. In Germany, the relevant particle-related restriction concerns the total suspended solids [15]. MPs discharged indirectly are mainly retained in the sewage sludge of the WWTP, while the remainder is released with the effluent [16,17]. Removing MPs at the industrial source is therefore more effective and adheres to the polluter pays principle.
Established particle separation technologies such as sand filtration, membrane filtration, dissolved air flotation (DAF), and coagulation/flocculation have been evaluated for MP removal [18,19,20]. Recent reviews summarise the rapid development of removal strategies for micro- and nanoplastics [21,22,23], including adsorbents classified by their structural dimensionality [21], engineered biochar [22], and approaches that consider particle ageing and ecological risks [23]. The efficiency of coagulation depends strongly on the polymer type, the particle properties, and the water chemistry [24,25,26]. The pH is particularly important because it controls the hydrolysis of the coagulants. Aluminium sulphate, for example, is most efficient in a narrow range of about pH 6.5–7.5 [25,26]. Alkaline wastewaters, such as the wash water of PET recycling, would therefore usually require pH adjustment prior to conventional coagulation.
Organosilane-induced agglomeration–fixation is an alternative physicochemical approach [27]. Its removal mechanism comprises three steps. (i) Attachment: the organosilanes carry organic groups with an affinity to the hydrophobic MP surfaces and hydrolysable silyl groups, so that the reagent accumulates at the particle surfaces after dosing into the stirred wastewater. (ii) Agglomeration: in contact with water, the silyl groups hydrolyse and condense to siloxane-like bridges, so that particles that collide during mixing are collected in agglomerates. (iii) Fixation: the continuing water-induced sol–gel reaction forms a solid network in which the particles are fixed. The resulting stable agglomerates are much larger than the individual MPs and can be separated by simple filtration [27]. As the reaction is driven by water, it does not rely on a narrow pH range. The reagent is consumed in the reaction and bound as a solid in the agglomerates. Dissolved residues were not detected in a previous study [28]. The process is robust against different polymer types, water compositions, and temperatures [28], so that MPs of polymers other than PET that enter PET recycling wash water with the feedstock are removed as well. It has been applied at pilot scale in municipal wastewater [29] and in industrial wastewater from plastic processing [30].
This study describes the development of organosilane-induced agglomeration–fixation for the wash water of industrial PET recycling, from a feasibility test in a technical centre, via process data acquisition with a mobile pilot plant on-site, including a comparison with the existing DAF, and confirmatory runs in the technical centre (2021–2024) to continuous operation with process monitoring (since 2025). The objectives were (i) to quantify the removal of MPs, which in PET recycling wash water consist predominantly of PET, (ii) to evaluate whether a neutralisation of the alkaline wash water is required, (iii) to describe the effects on COD, TSS, and surfactants and the agglomerates available for recovery, (iv) to demonstrate the transfer to continuous operation and its monitoring with routine parameters, and (v) to estimate the resulting benefits in a screening impact analysis. Describing the complete development, from process data acquisition to monitored continuous operation, shows how an MP removal technology can be transferred from pilot scale to industrial practice.
2. Materials and Methods
2.1. Study Site and Wastewater
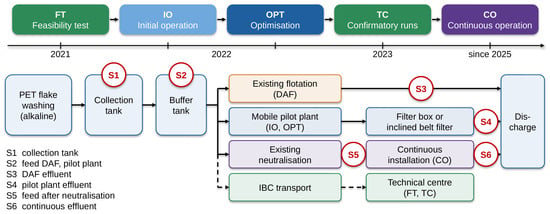
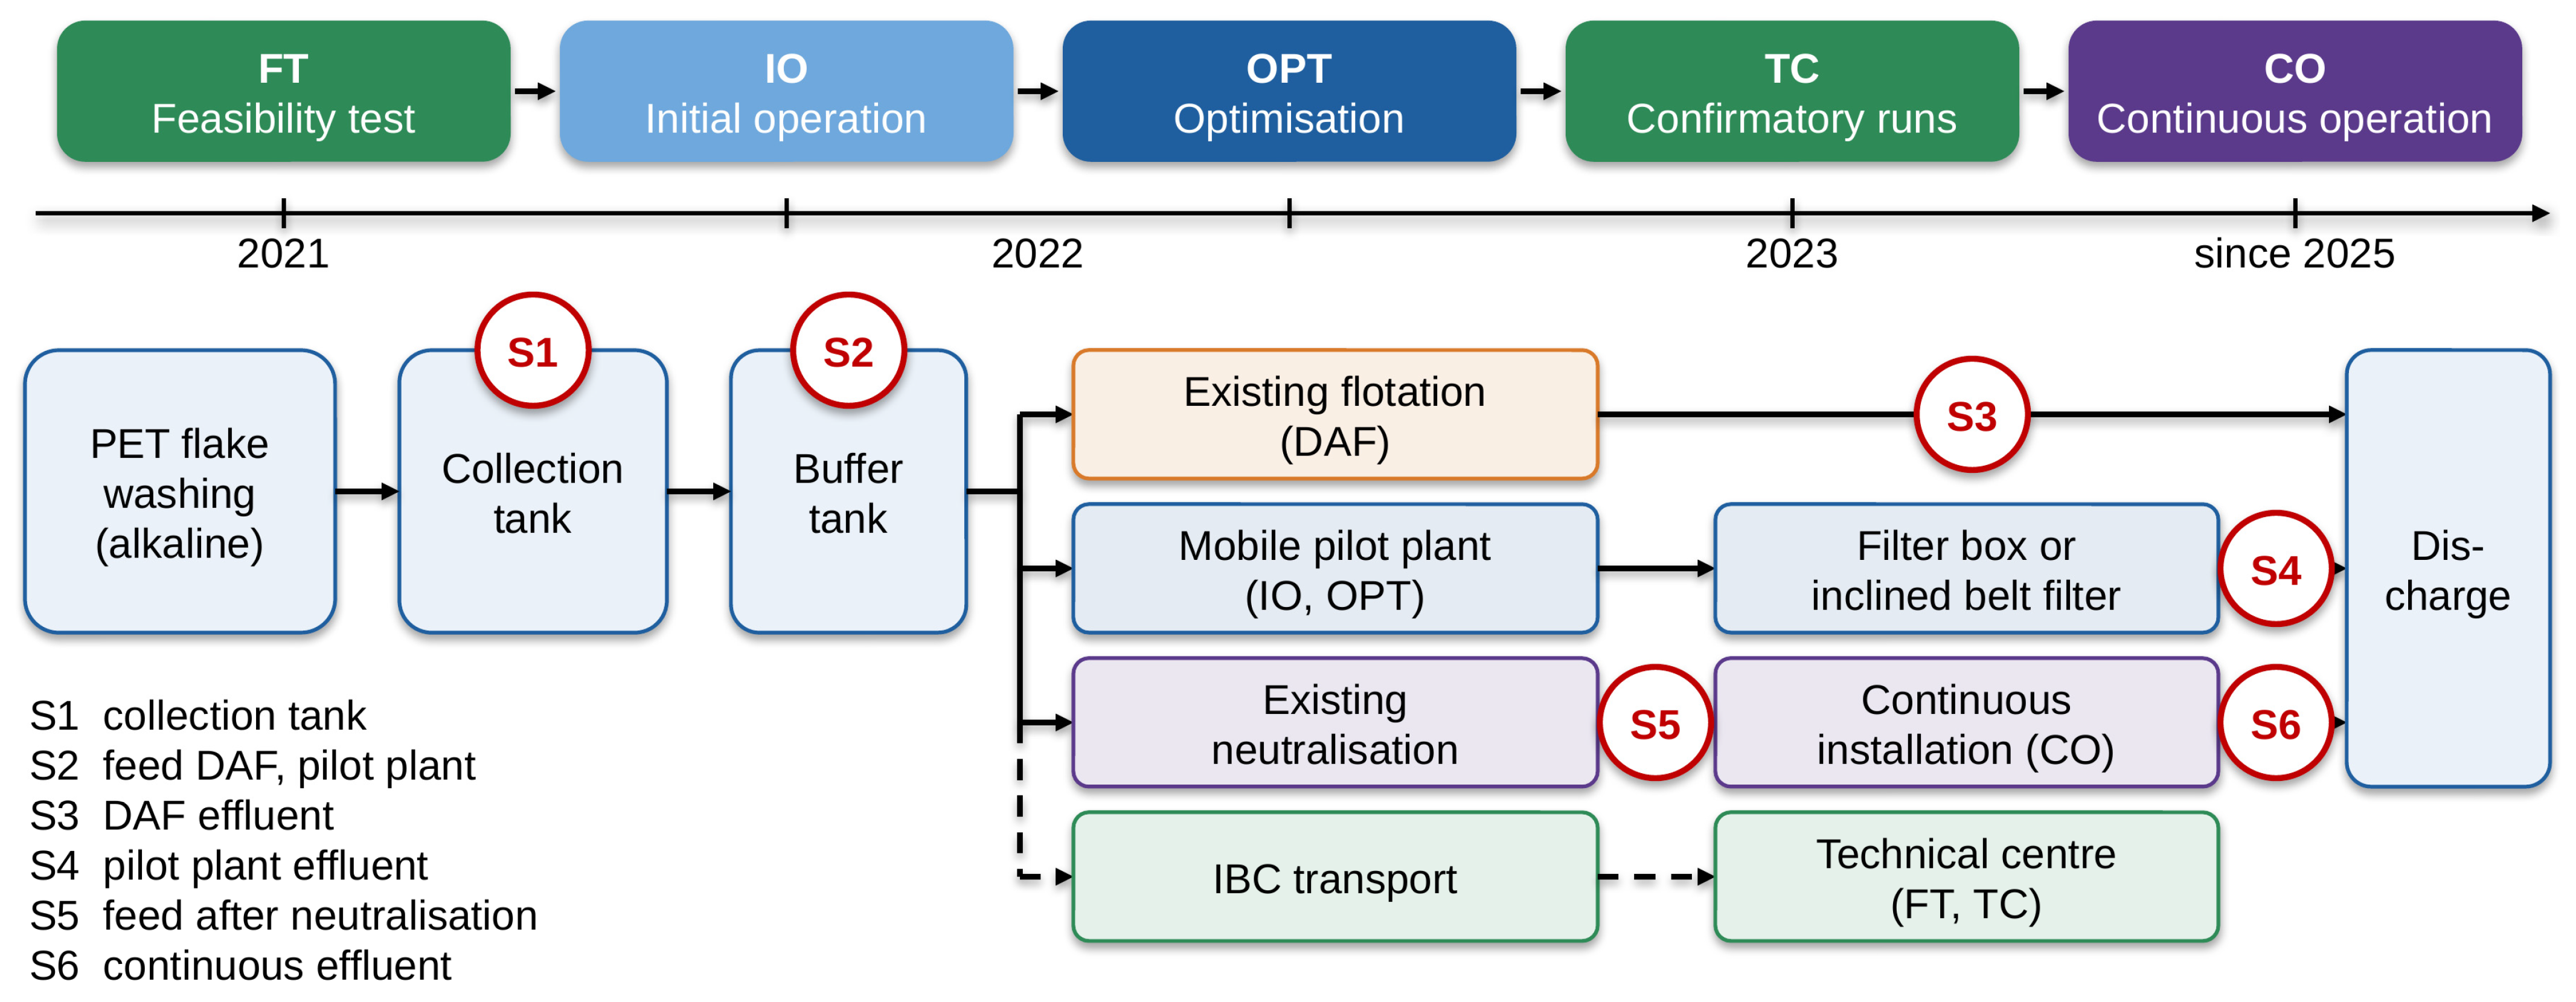
The study was carried out at an industrial post-consumer PET bottle recycling plant in Germany. The wastewater originates from the flake washing line and is collected in a collection tank. From there, it passes a buffer tank and an existing DAF unit before discharge (Figure 1). The mobile pilot plant was fed with the same wastewater as the DAF unit (sampling point S2). During the parameter optimisation on-site, the wastewater had a temperature of 35.5 °C and a pH of 10.8, measured on-site. No pH adjustment was applied in any run. The pilot plant was fed with the untreated alkaline wash water.
Figure 1.
Development stages and simplified scheme of the wastewater path at the PET recycling plant. Top: development stages in chronological order with the run codes used throughout the manuscript: feasibility test (FT) and confirmatory runs (TC-1 to TC-3) in the technical centre with wash water transported in an intermediate bulk container (IBC; dashed arrows); initial operation (IO-1 to IO-3) of the mobile pilot plant in parallel to the existing DAF unit (DAF-1 to DAF-3) and parameter optimisation (OPT-1 to OPT-5) on-site; continuous operation (CO-1 to CO-4). The colours of the stages correspond to those of the treatment paths. Sampling points: S1 (collection tank), S2 (feed of the DAF unit and the mobile pilot plant), S3 (DAF effluent), S4 (pilot plant effluent), S5 (feed of the continuous installation after the existing neutralisation), and S6 (effluent of the continuous installation). During initial operation and series I of the parameter optimisation, the agglomerates were separated in a filter box. From series II onwards and in the confirmatory runs, an inclined belt filter was used (Section 2.2), as in the continuous installation (Section 2.3). The arrangement of collection tank, buffer tank, neutralisation, and discharge was derived from the sample labelling. Arrows indicate wastewater flow in the bottom part of the figure. In the upper part of the figure, they illustrate the temporal development.
2.2. Agglomeration Reagent and Pilot Plants
MP removal was based on the organosilane-based agglomeration reagent abcr eco Wasser 3.0 PE-X® industrial wastewater (AB930006, abcr GmbH, Karlsruhe, Germany), as in previous pilot studies [31]. The removal mechanism is described in Section 1.
The mobile pilot plant was built by Sondermaschinen Oschersleben GmbH (Oschersleben, Germany) and was rented for the investigations. It consists of a reactor with a mechanical stirrer for the agglomeration–fixation, operated with a working volume of 250 L, and a separation unit for the agglomerates. Each batch runs automatically through pre-run, dosing of the reagent, high-speed mixing, a resting phase at low stirrer speed, and emptying into the separation unit. During initial operation and series I of the parameter optimisation, the separation unit was a filter box with filter fleece, which was not designed for the high solids load of this wastewater. From series II onwards, including the runs in the technical centre, the plant was equipped with an inclined belt filter, as used in the pilot plant for wastewater from plastic packaging production [31].
2.3. Campaigns and Runs
Figure 1 and Table 1 give an overview of the campaigns. The development was carried out between 2021 and 2024 in chronological order: a feasibility test in the technical centre, initial operation and parameter optimisation on-site, and confirmatory runs in the technical centre. Based on these results, the process was implemented in continuous operation in 2025 and validated. In the feasibility test (FT, 2021), wash water transported from the recycling plant in an intermediate bulk container (IBC) was first treated in beaker tests (300 mL). Subsequently, 500 L were treated in the reactor of the technical centre (stirrer speed 300 rpm, with baffle) with about 75 mL of the reagent (about 150 mL/m3). Samples were taken from the IBC before the tests and from the reactor after the reagent addition. As a single run, the feasibility test is reported descriptively and is not included in the statistical evaluation. During the initial operation of the mobile pilot plant on-site, the plant was operated in parallel to the existing DAF, and three sample sets (IO-1 to IO-3) were taken at the sampling points S2–S4 (IO-1 and IO-2 additionally at S1), which also allowed a comparison with the DAF.
Table 1.
Overview of the campaigns and runs.
During the parameter optimisation on-site, five runs (OPT-1 to OPT-5) were carried out in two series: in series I (OPT-1–OPT-3), the dosage was varied (80, 100, and 120 mL/m3) at a high-speed mixing time of 45 s. In series II (OPT-4, OPT-5), the high-speed mixing time was shortened from 45 s to 10 s to avoid breaking up the formed agglomerates, at dosages of 120 mL/m3 (OPT-4) and 100 mL/m3 (OPT-5). In addition, the filter box was replaced by the inclined belt filter. Two feed samples were taken, at OPT-1 and at OPT-5. Each run was evaluated against the feed sample of its series. Using the mean of both feed samples instead would change the mean MP removal on-site only marginally (84.8 ± 2.0% instead of 84.9 ± 1.7%), whereas the mean COD removal would change from 16.6 ± 9.2% to 18.6 ± 2.5%.
After the on-site campaigns, wastewater transported from the recycling plant in an IBC was again treated in the technical centre to confirm and replicate the on-site results under controlled conditions and to test adjusted settings. Three valid runs (TC-1 to TC-3) were carried out with increasing dosage and mixing time. A first run was discarded because the belt filter was charged too quickly and overflowed.
The initial-operation runs are evaluated separately, as the plant settings on these days were not documented. The performance of the technology is evaluated from the eight runs after initial operation. The run with the highest MP removal in each setting is reported as the best case.
Since 2025, the process has been operated continuously with an inclined belt filter at the same PET recycling plant, at a reagent dosage of 35 mL/m3. In continuous operation, the treatment is fed with wash water after the existing neutralisation of the plant, so that the feed had a pH of 6.25–6.44, whereas the mobile pilot plant had been fed with the untreated alkaline wash water. For the validation of the continuous operation, four runs (CO-1 to CO-4) were sampled before treatment (after the existing neutralisation) and after the inclined belt filter (sampling points S5 and S6; Figure 1): CO-1 and CO-2 with the original mixing programme, and CO-3 and CO-4 after an adjustment of the programme to a higher stirrer speed.
2.4. Process Analytics
The samples taken during the development stages were sent to the laboratory and analysed there. In total, 24 samples were analysed for pH, COD, and MPs, complemented by 24 surfactant determinations and six determinations of the water content of agglomerates. In the feasibility test, pH, COD, and TSS were determined by an external laboratory in accordance with DIN standards, and the MPs were counted as described in Section 2.4.4. With the implementation of the continuous operation, the MP analytics was revalidated, and the standard process analytics for industrial wastewater—pH, COD, turbidity, gravimetric TSS, and fluorescence-based MP detection—was implemented as described previously [31] (Section 2.4.3 and Section 2.4.4).
2.4.1. pH
The pH was measured in the laboratory in all samples before and after treatment. During the parameter optimisation, the pH and the temperature of the wastewater were additionally measured on-site. The pH was measured with a benchtop pH meter (pH 50 VioLab Set, Dostmann electronic GmbH, Wertheim-Reicholzheim, Germany). In continuous operation, the pH was read several times per sample, and the final reading was used.
2.4.2. Chemical Oxygen Demand
The chemical oxygen demand (COD) was determined in the laboratory in all samples before and after treatment with NANOCOLOR COD 4000 and 15000 tube tests (Macherey-Nagel GmbH & Co. KG, Düren, Germany) in accordance with DIN ISO 15705 (H45). The samples were digested in a thermoblock (NANOCOLOR VARIO C2) at 160 °C for 30 min or at 148 °C for 2 h, cooled to room temperature, and measured with a NANOCOLOR UV/VIS II spectrophotometer (Macherey-Nagel). Samples exceeding the upper limit of the measuring range (15,000 mg/L) were diluted 1:1 with demineralised water. The samples of the continuous operation were analysed with the same method.
2.4.3. Turbidity and Total Suspended Solids
In continuous operation, turbidity and TSS were determined as standard process parameters for industrial wastewater [31]. The turbidity was measured in four readings per sample, and the mean was used. The TSS was determined gravimetrically in accordance with DIN 38409-H2 by filtering 0.5–2 L of sample. Both parameters were included because they correlated closely with the MP concentration in a previous pilot study and can therefore serve as routine control parameters [31].
2.4.4. Microplastics
During the development stages, MPs were quantified as particle counts, analogous to previous studies on industrial wastewaters [30]. The samples were diluted with demineralised water depending on the contamination level, vacuum-filtered onto white membrane filters with a grid, and counted manually without staining under a digital stereo microscope (Leica DMS300 with Leica LAS X software 3.0.14, Leica Microsystems GmbH, Wetzlar, Germany) in defined grid squares. The particle concentration was extrapolated using the filter area and the filtered volume. The same method and microscope were used for all samples, so that the feed and the effluent of each run were analysed identically. For this method, a lower size limit of 5 µm is applicable [30]. As the plant processes post-consumer PET bottles, the MPs in the wash water originate predominantly from PET. MPs of other polymers that enter with the feedstock (e.g., from closures and labels) are counted as well, and concentrations are given as MP/L. Without staining, non-plastic particles (e.g., paper fibres from labels) cannot be excluded. As such particles would be counted in the feed and in the effluent alike, the removal efficiency, which compares two samples analysed with the same method, is less affected than the absolute concentration. The stereomicroscopic counts are therefore evaluated as removal efficiencies within one method, and the polymer-selective fluorescence detection was introduced for the continuous operation (see below).
In continuous operation, MPs were detected by fluorescence staining with abcr eco Wasser 3.0 detect mix MP-1 (AB930015, abcr GmbH, Karlsruhe, Germany), followed by fluorescence microscopy and automated particle counting with a fixed fluorescence-intensity threshold [32]. As in previous studies on industrial wastewater [31], the samples were stained directly without prior digestion: 5 µL of untreated and 100 µL of treated wastewater were pipetted into a beaker, filled up to 100 mL with demineralised water, stained with 25 µL of the dye solution at 80 °C for 1 h, and filtered onto black membrane filters. Five image tiles per filter were evaluated, and the particle concentration was extrapolated using the filter area and the filtered volume. The evaluation is based on one determination per sample. Procedural blanks (n = 3) contained 3.3 × 10³ to 6.7 × 10³ particles per filter. Since a blank correction changed the removal efficiencies by at most 0.1 percentage points, uncorrected values are reported. The dye stains polymers selectively: in the validation of the method, recovery rates of 93.3% (polypropylene) to 101.7% (polyester, the polymer class of PET) were obtained, whereas natural particles (wood, chalk, chitin) were recovered at only 5–6% on average [32]. Because the fluorescence detection includes smaller particles than the stereomicroscopic counting, the absolute concentrations of the two methods are not comparable. The removal efficiency, determined with the same method before and after treatment, is used as the performance measure. Due to the differing methodologies, the absolute MP concentrations of the continuous operation are not compared with those of the pilot plant trials in Section 3.1, Section 3.2, Section 3.3 and Section 3.4. Only the removal efficiencies of all stages are shown together (Figure 2).
Figure 2.
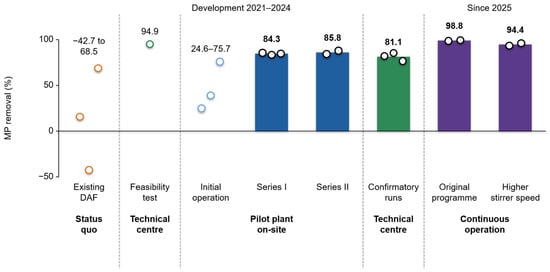
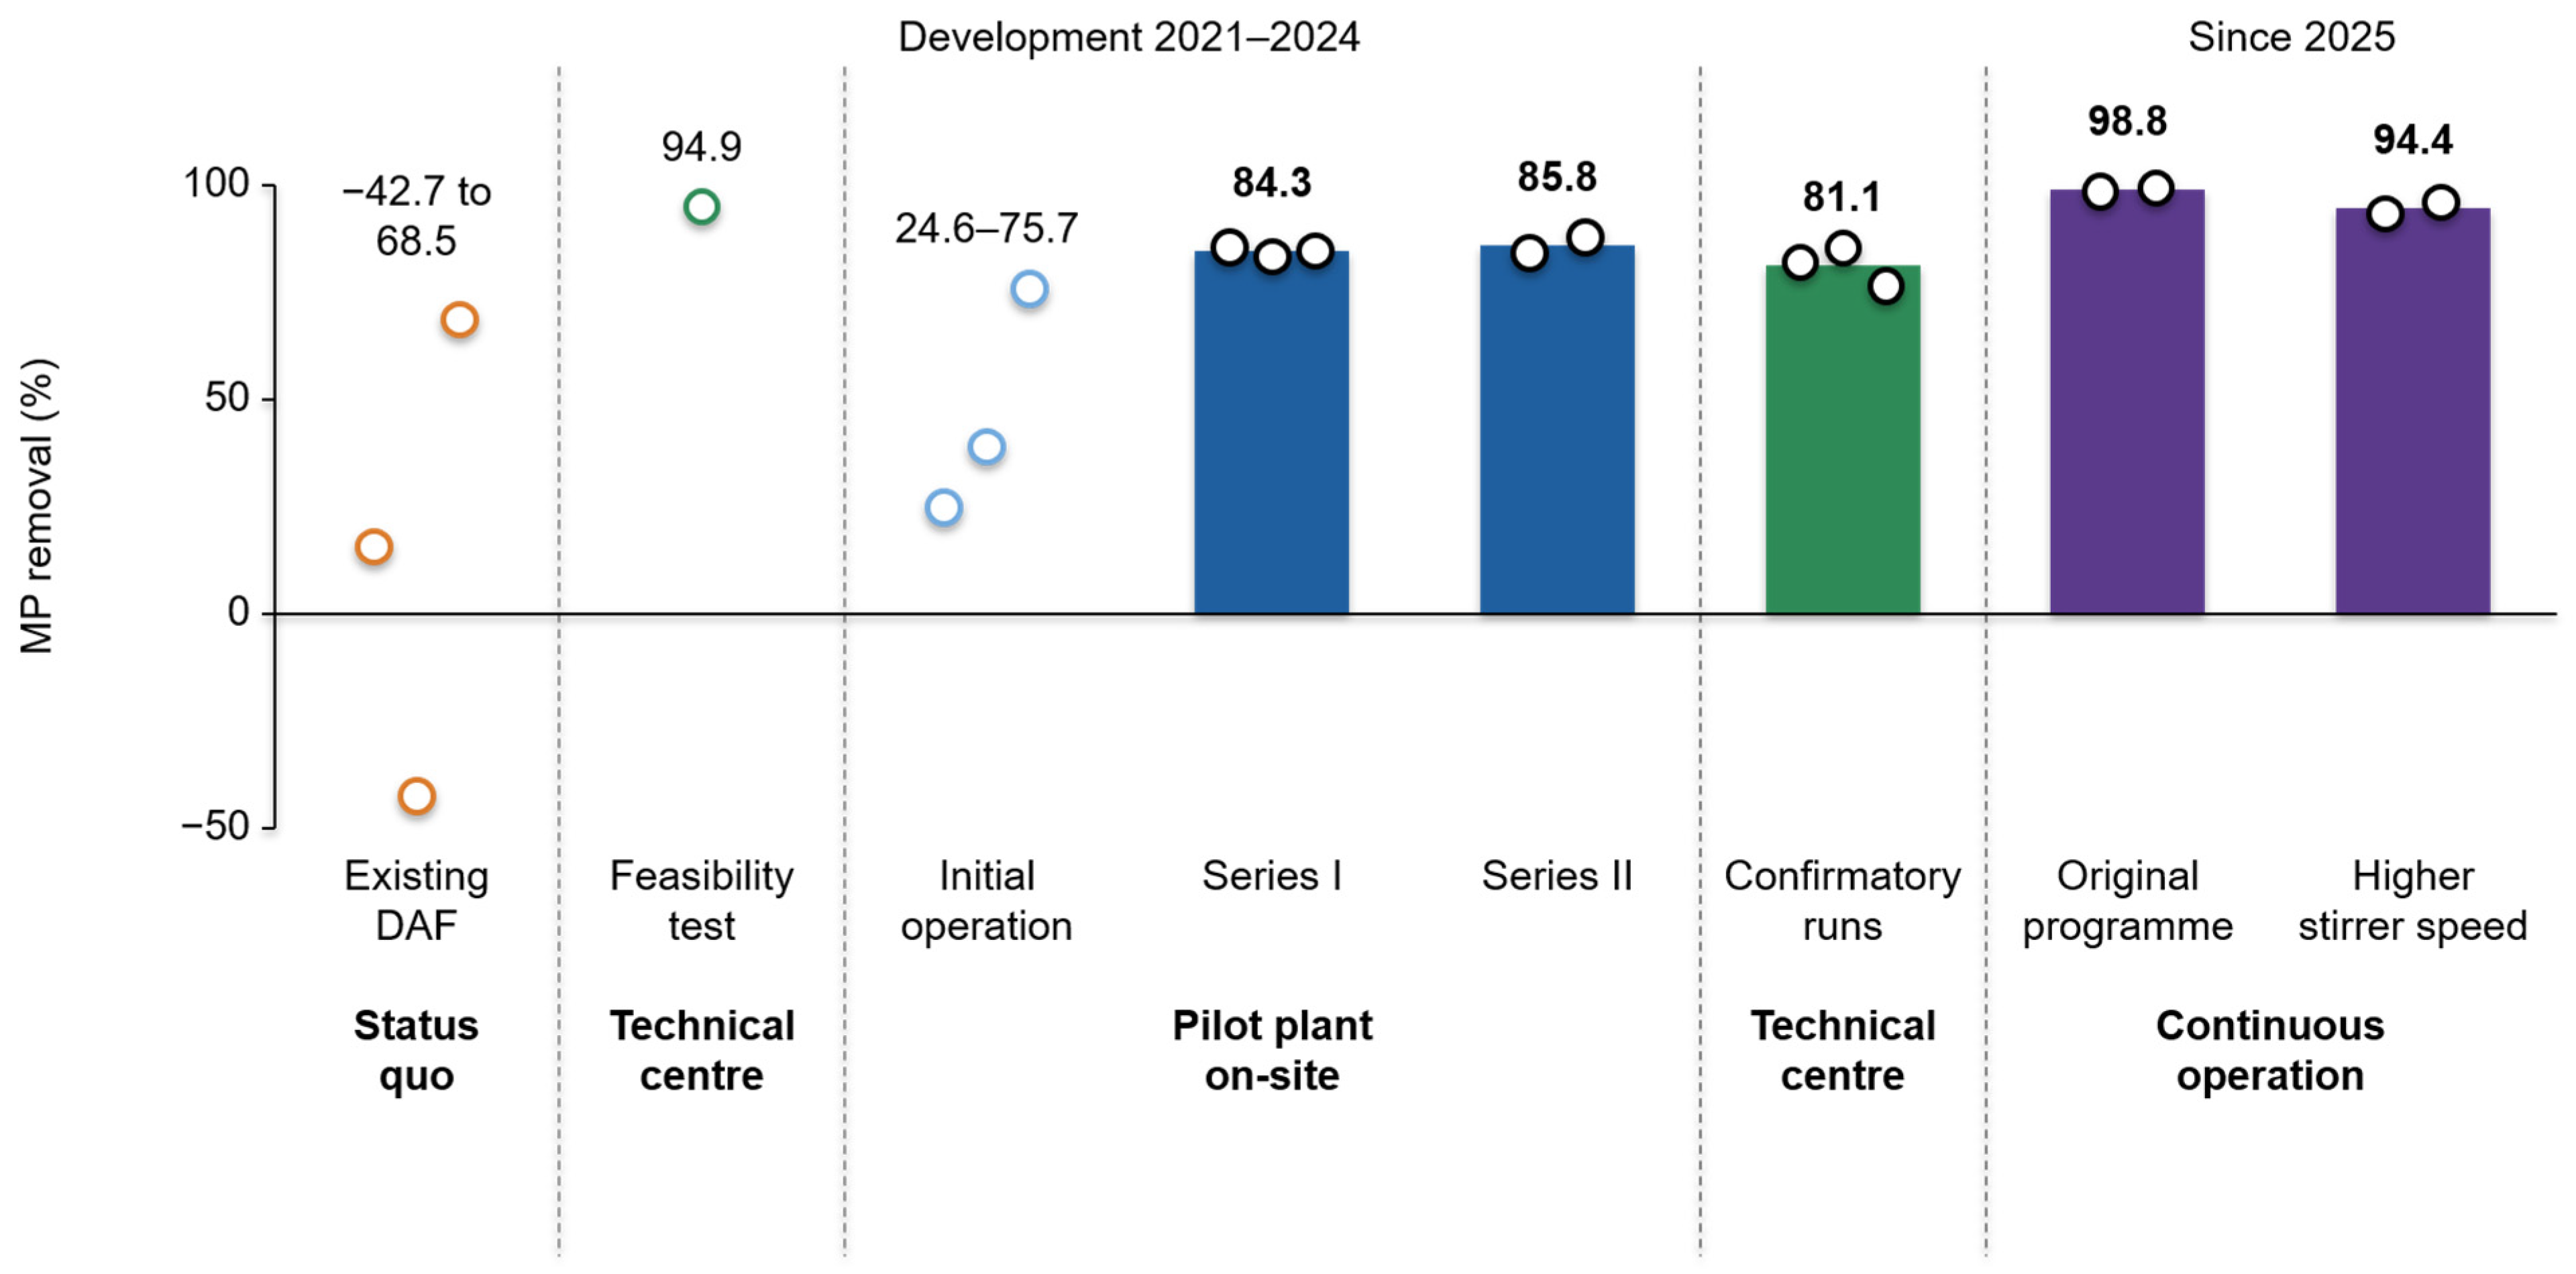
MP removal in all development stages up to continuous operation: status quo with the existing DAF unit (DAF-1 to DAF-3, sampled on the days of initial operation), feasibility test in the technical centre (FT, single run), mobile pilot plant on-site during initial operation (IO-1 to IO-3) and parameter optimisation (series I: OPT-1 to OPT-3; series II: OPT-4, OPT-5), confirmatory runs in the technical centre (TC-1 to TC-3), and continuous operation (CO-1 and CO-2: original mixing programme; CO-3 and CO-4: higher stirrer speed). Circles: individual runs (one sample before and one after treatment); bars: mean removal of each group. As each group comprises only two or three runs, the individual values are shown instead of error bars. DAF, FT, and IO are not included in the performance evaluation. MPs were determined by stereomicroscopic counting in the development stages and by fluorescence staining in continuous operation. Only the removal efficiencies are compared, not the absolute concentrations (Section 2.4.4). Concentrations, dosage, and mixing time of each run are given in Tables 3 and 5.
2.4.5. Surfactants
As supplementary investigations, anionic, cationic, and non-ionic surfactants were determined at the sampling points S1–S4 during initial operation (IO-1, IO-2) with tube tests (NANOCOLOR Cationic surfactants 4, NANOCOLOR Anionic surfactants 4, and NANOCOLOR Nonionic surfactants 15; Macherey-Nagel GmbH & Co. KG, Düren, Germany).
2.4.6. Agglomerates
In the technical centre, the mass of wet agglomerates was determined (about 3 kg per 250 L batch), and their water content was determined in duplicate by weighing approximately 20 g of wet agglomerates before and after drying. The dry agglomerate mass per m3 was calculated for each run from the wet mass and the water content. The mass of separated solids was estimated by subtracting the dosed reagent, assuming a reagent density of 1 kg/L and its complete incorporation into the agglomerates.
2.5. Data Evaluation and Statistics
The removal efficiency RE was calculated as
where cin and cout are the concentrations before and after treatment. The log reduction was calculated as log10(cin/cout), and the number of removed MPs per m3 as (cin − cout) × 1000 L.
RE = (1 − cout/cin) × 100%,
Results are given as mean ± standard deviation (SD) with 95% confidence intervals (CI) based on the t-distribution. The experimental unit is the treatment run. Runs of the same series were fed from one feed sample (on-site, two feed samples for five runs; in the technical centre, one IBC for three runs), so that the runs represent replicate treatments of a common feed rather than independent samples of the wash water, and the variability of the feed between campaigns is not captured. The statistical tests are therefore used descriptively: (i) a two-sided paired t-test (for MPs on log10-transformed values because the concentrations span several orders of magnitude) indicates whether the treatment reduced the MP concentration and the COD consistently across the runs; (ii) Welch’s t-test, which does not assume equal variances for the unequal group sizes (n = 3 and n = 5), compares the removal between the technical centre and the on-site operation, whereby a non-significant result is not interpreted as evidence of equivalence, given the low statistical power; (iii) a paired t-test was used for the pH change; and (iv) Spearman’s rank correlation was used for the relation between removal and feed pH (α = 0.05). In continuous operation, the removal is reported per run and as mean ± SD of the four runs. A paired t-test on log10-transformed concentrations was applied, and Pearson’s correlation coefficient was used to relate the MP data to turbidity and TSS. Given the small number of runs, these results are evaluated descriptively.
2.6. Screening Impact Analysis Methodology
A screening-level impact analysis was performed for the functional unit of 1 m3 of treated wastewater, separately for the technical centre (mean of TC-1 to TC-3), the on-site operation (mean of OPT-1 to OPT-5), and the continuous operation (mean of CO-1 to CO-4). Avoided emissions were calculated from the measured mean concentrations. As the MP concentrations of the continuous operation were determined by fluorescence staining, their absolute values are not comparable with those of the pilot trials. The settings are therefore compared on the basis of the reduction factors. For the status quo, indirect discharge to a municipal WWTP with 90% MP retention in the sewage sludge was assumed, as in a previous life cycle assessment (LCA) of the technology [33]. As a scenario, the reuse of 80% of the treated water in the washing process was considered, as estimated for packaging wastewater [31]. In this case, only 20% of the treated water is discharged. This simplified scenario assumes that the recirculated water is treated again and does not change the feed concentration. The resulting reduction factor is therefore an upper estimate. The electricity demand of the technology was taken as 0.8 kWh/m3 from the same LCA, and the global warming potential (GWP) of the pilot configuration with consumable filter fleece (25.4 kg CO2-eq/m3) and of an optimised configuration with an endless belt filter (1.0 kg CO2-eq/m3) were also taken from this LCA [33]. For the pilot plant for packaging wastewater, an electricity demand of about 1.4 kWh/m3 results from the reported annual electricity consumption and wastewater volume, and a calorific value of the agglomerates of 28.6–38.6 MJ/kg dry residue was reported [31]. For energy recovery, an electrical efficiency of 35% was assumed as in [33]. The results are estimates and do not replace a site-specific LCA.
2.7. Use of Generative Artificial Intelligence
Generative AI was used as an assistant during the preparation of this manuscript and its revision. The authors used Claude (Anthropic; model Claude Opus 5.5, accessed via the Claude app, 2026) for the following tasks: (i) structuring the manuscript and drafting and language editing of text sections based on the authors’ data, notes, and instructions; (ii) compiling the measured process data from the authors’ laboratory data tables into tables, calculating derived values (removal efficiencies, log reductions, means, SDs, and confidence intervals), and performing the statistical tests described in Section 2.5 with Python (3.15) scripts; (iii) preparing the figures from these data; (iv) searching and checking literature and regulatory sources, including the verification of bibliographic data; and (v) checking the consistency of the values between text, tables, and figures. Generative AI was not used to generate, modify, or impute measurement data. All data originate from the authors’ measurements, and all AI-generated content was checked by the authors against the original data and sources. In addition, the authors conducted a supplementary literature review to add relevant literature. The authors take full responsibility for the content of this publication.
3. Results
3.1. Wastewater Before Treatment
The wash water was highly contaminated and variable (Table 2). The on-site samples were alkaline (feed pH 8.8–10.0 measured in the laboratory; pH 10.8 measured on-site during the optimisation), whereas the IBC sample treated in the technical centre had a pH of 6.2 after storage and transport. The causes of the difference between the on-site and laboratory pH values and of the low pH of the IBC sample were not investigated. Thus, the pilot plant was fed with untreated alkaline wash water on-site and with stored, non-neutralised wash water in the technical centre. In neither case was the pH adjusted. The MP concentration in the feed ranged from 5.9 × 10⁷ to 3.9 × 10⁸ MP/L during initial operation and from 5.4 × 10⁸ to 6.1 × 10⁸ MP/L during the optimisation and in the technical centre, and the COD from 6160 to 11,700 mg/L (up to 15,470 mg/L in the collection tank, S1). The IBC sample of the feasibility test had a pH of 6.7, a COD of 9240 mg/L, a TSS of 1440 mg/L, and an MP concentration of 2.6 × 10⁶ MP/L.
Table 2.
Wastewater before treatment (feed: sampling point S2 on-site; IBC in the technical centre).
3.2. MP Removal On-Site, in the Technical Centre, and by the Existing DAF
In the feasibility test in the technical centre (FT), the MP concentration was reduced from 2.6 × 10⁶ to 1.3 × 10⁵ MP/L (94.9%; Figure 2), the TSS from 1440 to 42 mg/L (97.1%), and the COD from 9240 to 6260 mg/L (32.3%), while the pH changed from 6.7 to 7.2 without adjustment. In the preceding beaker tests, agglomerates formed both at the original pH of the wash water (6.6, measured on delivery) and after adjustment to pH 11. This single run demonstrated the feasibility of the treatment for the wash water and was the basis for the pilot trials on-site.
Table 3 lists the results of all runs. In the technical centre (TC-1–TC-3), the MP concentration was reduced from 5.42 × 10⁸ to 1.03 × 10⁸ MP/L on average (81.1 ± 4.4%, 95% CI 70.1–92.1%; 0.73 log units; paired t-test p = 0.006), corresponding to 4.4 × 10¹¹ removed MPs per m3. On-site (OPT-1–OPT-5), the mobile pilot plant reduced the MP concentration from 5.97 × 10⁸ to 9.01 × 10⁷ MP/L on average (84.9 ± 1.7%, 95% CI 82.8–87.1%; 0.83 log units; p < 0.001), corresponding to 5.1 × 10¹¹ removed MPs per m3. The removal in the technical centre was in the same range as on-site (Welch’s t-test p = 0.27). Given the small number of runs, this result does not demonstrate equivalence. The variability on-site was lower. The best cases were TC-2 (85.1%) in the technical centre and OPT-5 (87.7%) on-site.
Table 3.
Results of all runs (feed → effluent of the mobile pilot plant or of the existing DAF).
During initial operation (IO-1 to IO-3), the mobile pilot plant was operated in parallel to the existing DAF with the same feed (S2). The pilot plant reduced the MP concentration by 24.6%, 38.9%, and 75.7%, whereas the DAF reduced it by 15.5% and 68.5% on the first and third sampling day and did not reduce it on the second day, when the DAF effluent contained 42.7% more MPs than the feed (Table 3). On all three sampling days, the MP concentration after the pilot plant was lower than after the DAF. The COD was reduced by 19.6%, 14.1%, and 25.4% by the DAF and by 16.4%, 15.2%, and 22.8% by the pilot plant. During initial operation, the agglomerates were separated in a filter box that was not designed for the high solids load, and the reagent dosage on the sampling days was not recorded. These three runs are therefore not included in the performance evaluation.
In series I of the parameter optimisation, the dosage was varied (80, 100, and 120 mL/m3) at a constant mixing time of 45 s, and the removal remained within 83.1–85.4%. Within this range, the dosage alone did not change the removal substantially. In series II (OPT-4, OPT-5), the shorter mixing time and the inclined belt filter were introduced together and resulted in 84.0% and 87.7%. Their individual effects cannot be separated.
In the technical centre, dosage and mixing time were increased together (Table 1). The combination with the highest dosage and the longest mixing time (TC-3, 240 mL/m3, 70 s) resulted in the lowest removal (76.3%). Within the combinations of operating conditions tested, a higher dosage therefore did not increase the removal, but in these runs, the effect of the dosage cannot be isolated from that of the mixing time.
Across all eight runs after initial operation (OPT-1 to OPT-5, TC-1 to TC-3), the removal was 83.5 ± 3.4% (95% CI 80.7–86.3%; range 76.3–87.7%; Table 4 and Figure 2).
Table 4.
Statistical summary of the MP removal.
3.3. pH Development Without pH Adjustment
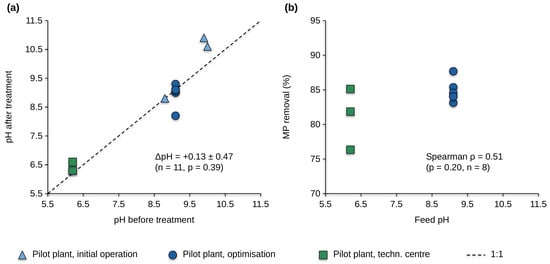
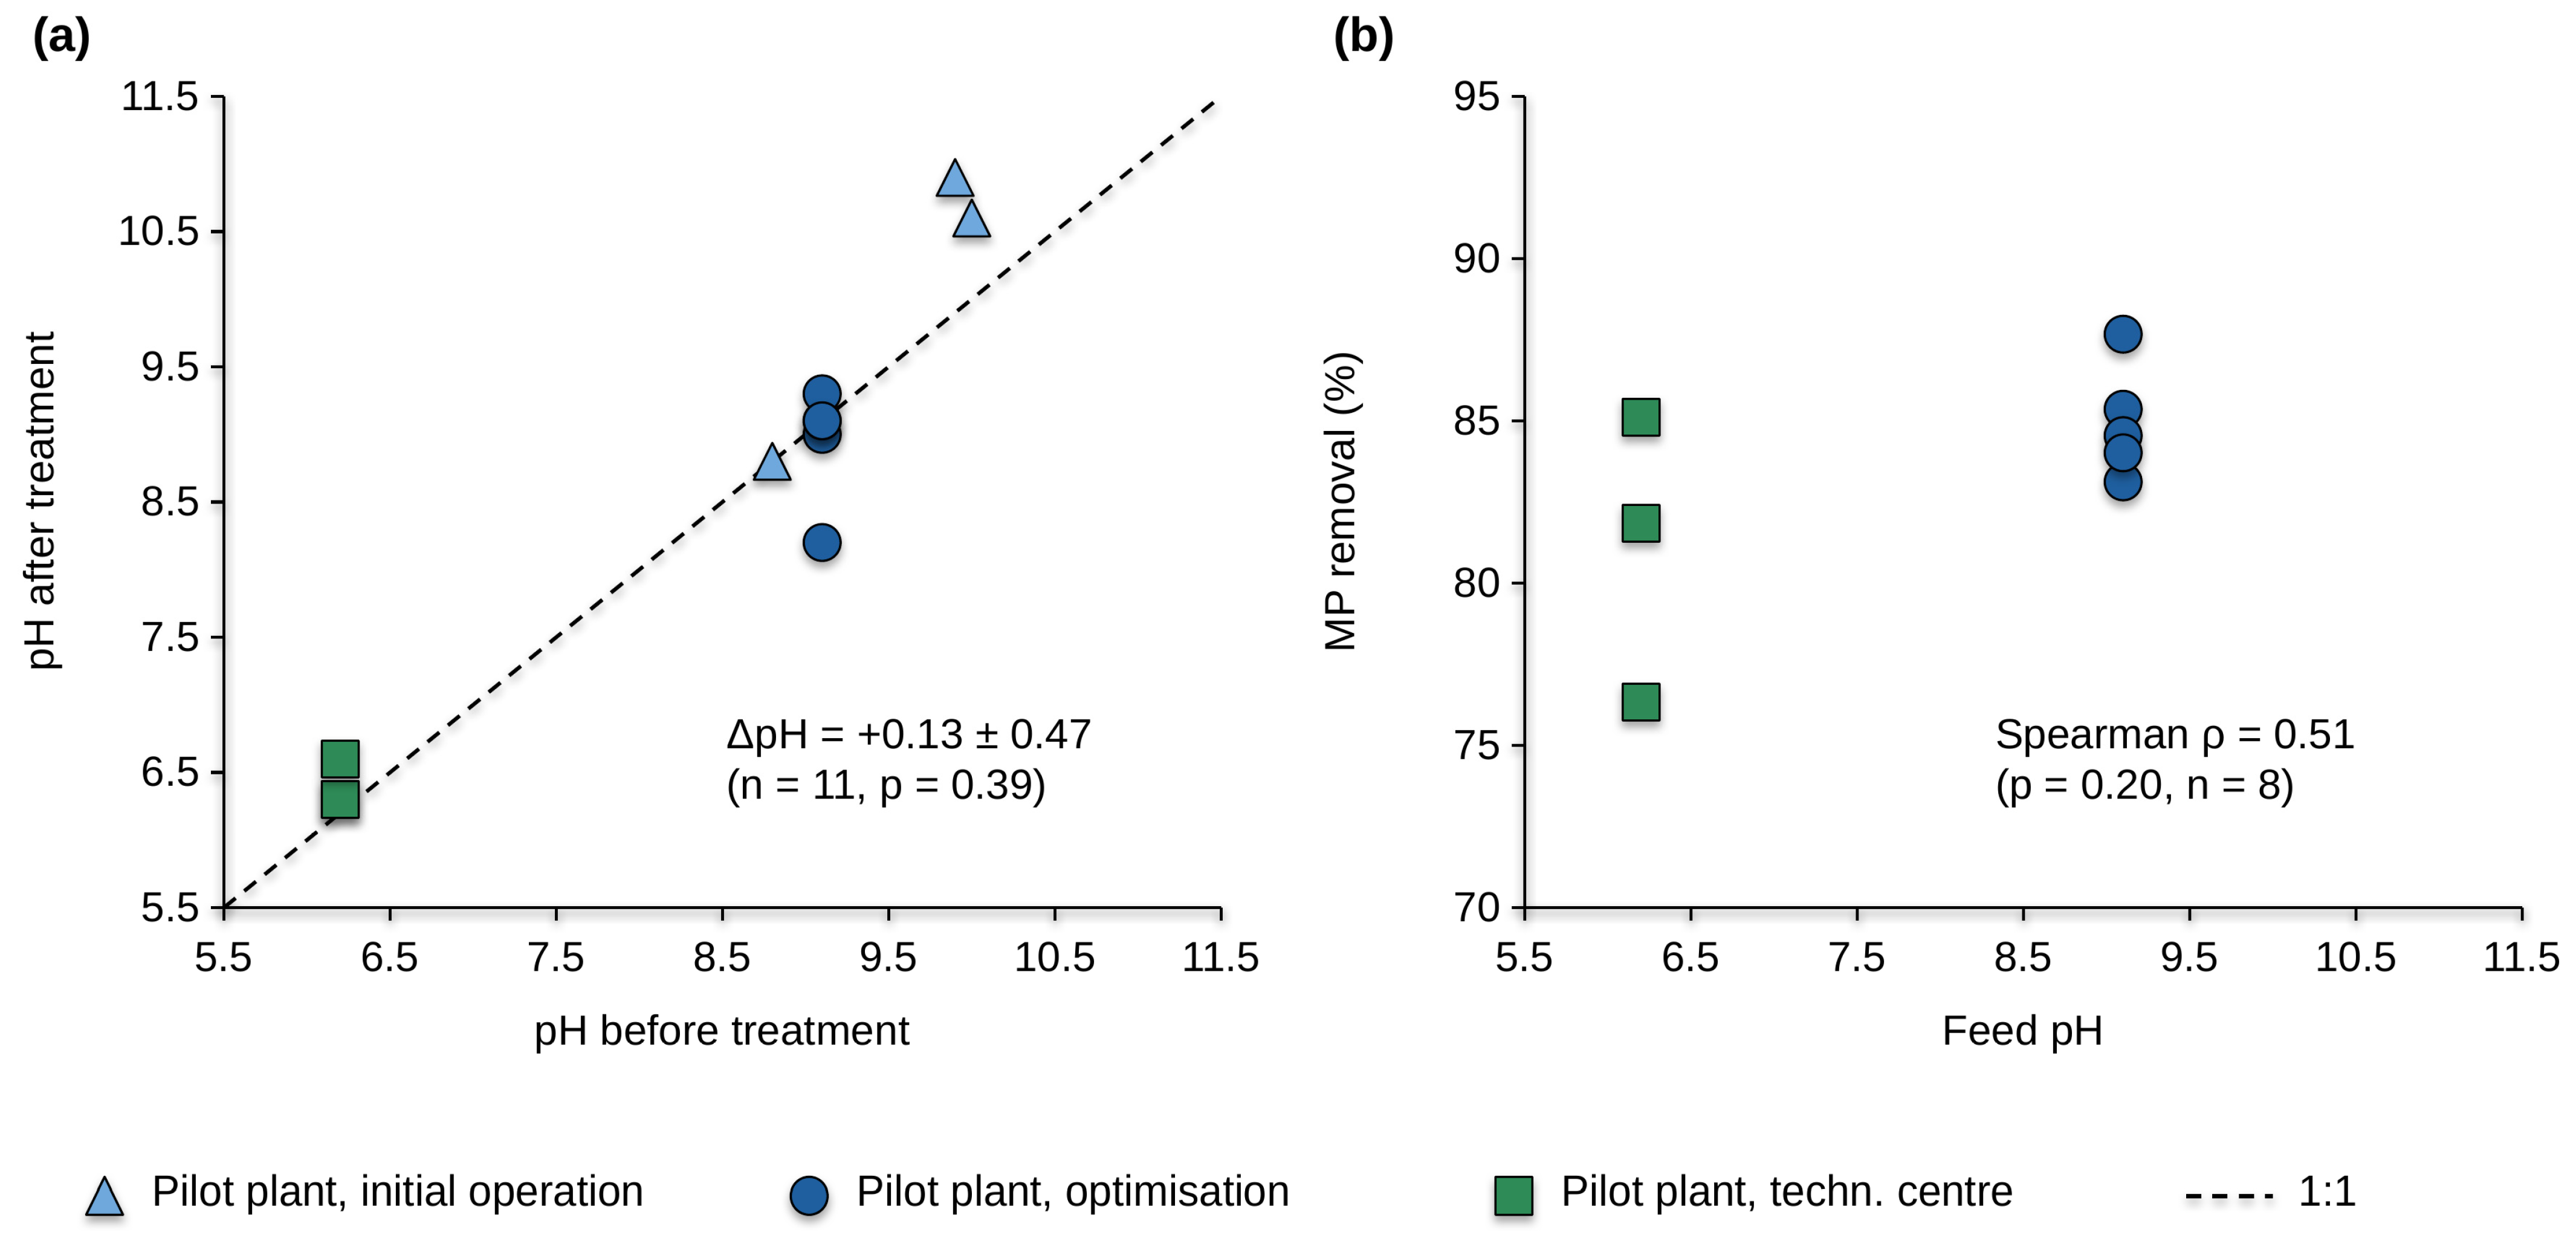
Organosilane-induced agglomeration–fixation worked in the slightly acidic IBC sample (pH 6.2) as well as in the alkaline wash water on-site (pH 8.8–10.0 measured in the laboratory, 10.8 on-site) without any pH adjustment (Figure 3). Across all eleven paired measurements, the pH changed on average by +0.13 ± 0.47 units (mean ± SD of the differences after minus before treatment), which was not significant (paired t-test p = 0.39). In seven of eleven runs, the change was at most 0.2 units. The largest changes occurred during initial operation (IO-1, +1.0; IO-3, +0.6) and in OPT-4 (−0.9). The MP removal after initial operation did not correlate significantly with the feed pH (Spearman ρ = 0.51, p = 0.20, n = 8). As the feed pH differed between the settings, this comparison is confounded with the setting. Thus, the treatment itself requires neither a neutralisation of the alkaline wash water nor a pH conditioning to an optimum range, as is typically necessary for metal-salt coagulation [25,26], and the pH of the wash water was preserved. In continuous operation, the wash water had already passed the existing neutralisation of the plant. There, too, no pH adjustment was made for the treatment, and the pH changed by −0.32 to +0.29 units (Section 3.5).
Figure 3.
pH development without neutralisation: (a) pH after treatment versus pH before treatment for all eleven paired measurements (dashed line: 1:1); (b) MP removal versus feed pH for the eight runs after initial operation. Each point represents a single run. Therefore, no error bars are shown. Coinciding values overlap in (a): OPT-2 and OPT-5 (pH 9.1 → 9.1) and TC-1 and TC-2 (pH 6.2 → 6.3).
3.4. COD, Surfactants, and Agglomerates
The COD removal differed strongly between the settings (Table 3). It was 74.7 ± 1.6% in the technical centre (TC-1–TC-3; p < 0.001) and 16.6 ± 9.2% (7.3–26.7%; p = 0.02) on-site (OPT-1–OPT-5, without the initial-operation runs). Since the treatment separates particles but does not degrade dissolved compounds, the COD removal reflects the particle-bound share of the COD [30,34]. We therefore hypothesise that the COD of the fresh wash water on-site was mainly present in dissolved form, whereas a larger fraction of the COD of the stored IBC sample was particle-bound and was separated together with the MPs. Dissolved COD and TSS were not measured during the development stages, so that this explanation could not be verified directly, and the reason for the different distribution in the stored sample was not investigated. The hypothesis is, however, consistent with the continuous operation, in which the TSS was measured: the TSS of the feed corresponded to only 4–9% of the COD, and the COD decreased by only 7.6–16.1%, although up to 98.3% of the TSS was removed (Section 3.5).
The supplementary surfactant measurements during initial operation (IO-1, IO-2) showed that the wash water contained mainly non-ionic surfactants (100–147 mg/L in the collection tank and the feed), whereas anionic (12.1–18.8 mg/L) and cationic surfactants (7.9–9.3 mg/L) were present at about one order of magnitude lower concentrations. After treatment, the surfactants remained largely in solution: anionic surfactants decreased from 13.3 to 10.9 mg/L and from 18.8 to 16.1 mg/L (−18.1% and −14.4%), non-ionic surfactants from 108 to 104 mg/L and from 147 to 117 mg/L (−3.7% and −20.4%), and cationic surfactants changed from 9.3 to 9.1 mg/L and from 7.9 to 8.5 mg/L (−2.7% and +8.3%). Therefore, they remain in the water for a potential reuse. In the DAF effluent, 13.5 and 16.6 mg/L of anionic, 9.2 and 13.1 mg/L of cationic, and 94 and 137 mg/L of non-ionic surfactants were measured. As these measurements were taken during initial operation, when the MP removal was still low, they indicate the behaviour of the dissolved washing chemistry but should be confirmed under optimised operation.
In the technical centre (TC-1 to TC-3), approximately 3 kg of wet agglomerates were formed from 250 L of wastewater, i.e., about 12 kg/m3. The water content was 83.1 ± 4.6% (77.3–88.0%, n = 6), corresponding to approximately 2.0 kg of dry agglomerates per m3 (1.4–2.7 kg/m3 in the individual runs). After subtraction of the dosed reagent (0.14–0.24 kg/m3), about 1.8 ± 0.6 kg/m3 (1.2–2.5 kg/m3) of separated dry solids remain, i.e., about 1.8 t per 1000 m3 of treated wastewater. The composition of these separated dry solids was not characterised in this study. They are available for recovery instead of being discharged into the sewer and sludge.
3.5. Continuous Operation and Process Monitoring
In continuous operation, the feed had passed the existing neutralisation of the plant and had a pH of 6.25–6.44, a COD of 9300–12,100 mg/L, a turbidity of 590–686 NTU, and a TSS of 514–845 mg/L (Table 5). The MP concentrations determined by fluorescence staining were 3.4 × 10¹⁰ to 5.7 × 10¹¹ MP/L in the feed. They are about two to three orders of magnitude higher than the stereomicroscopic counts during the development stages, which may be due to the detection of smaller particles by the fluorescence method. They also varied considerably between the runs (up to a factor of 17). As only 5 µL of the highly loaded feed could be analysed, this introduces a potential source of error. The removal efficiency, determined with the same method before and after treatment, is therefore used as the performance measure.
Table 5.
Results of the validation runs in continuous operation (feed after the existing neutralisation → effluent of the inclined belt filter).
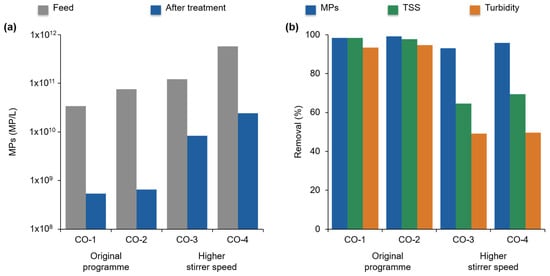
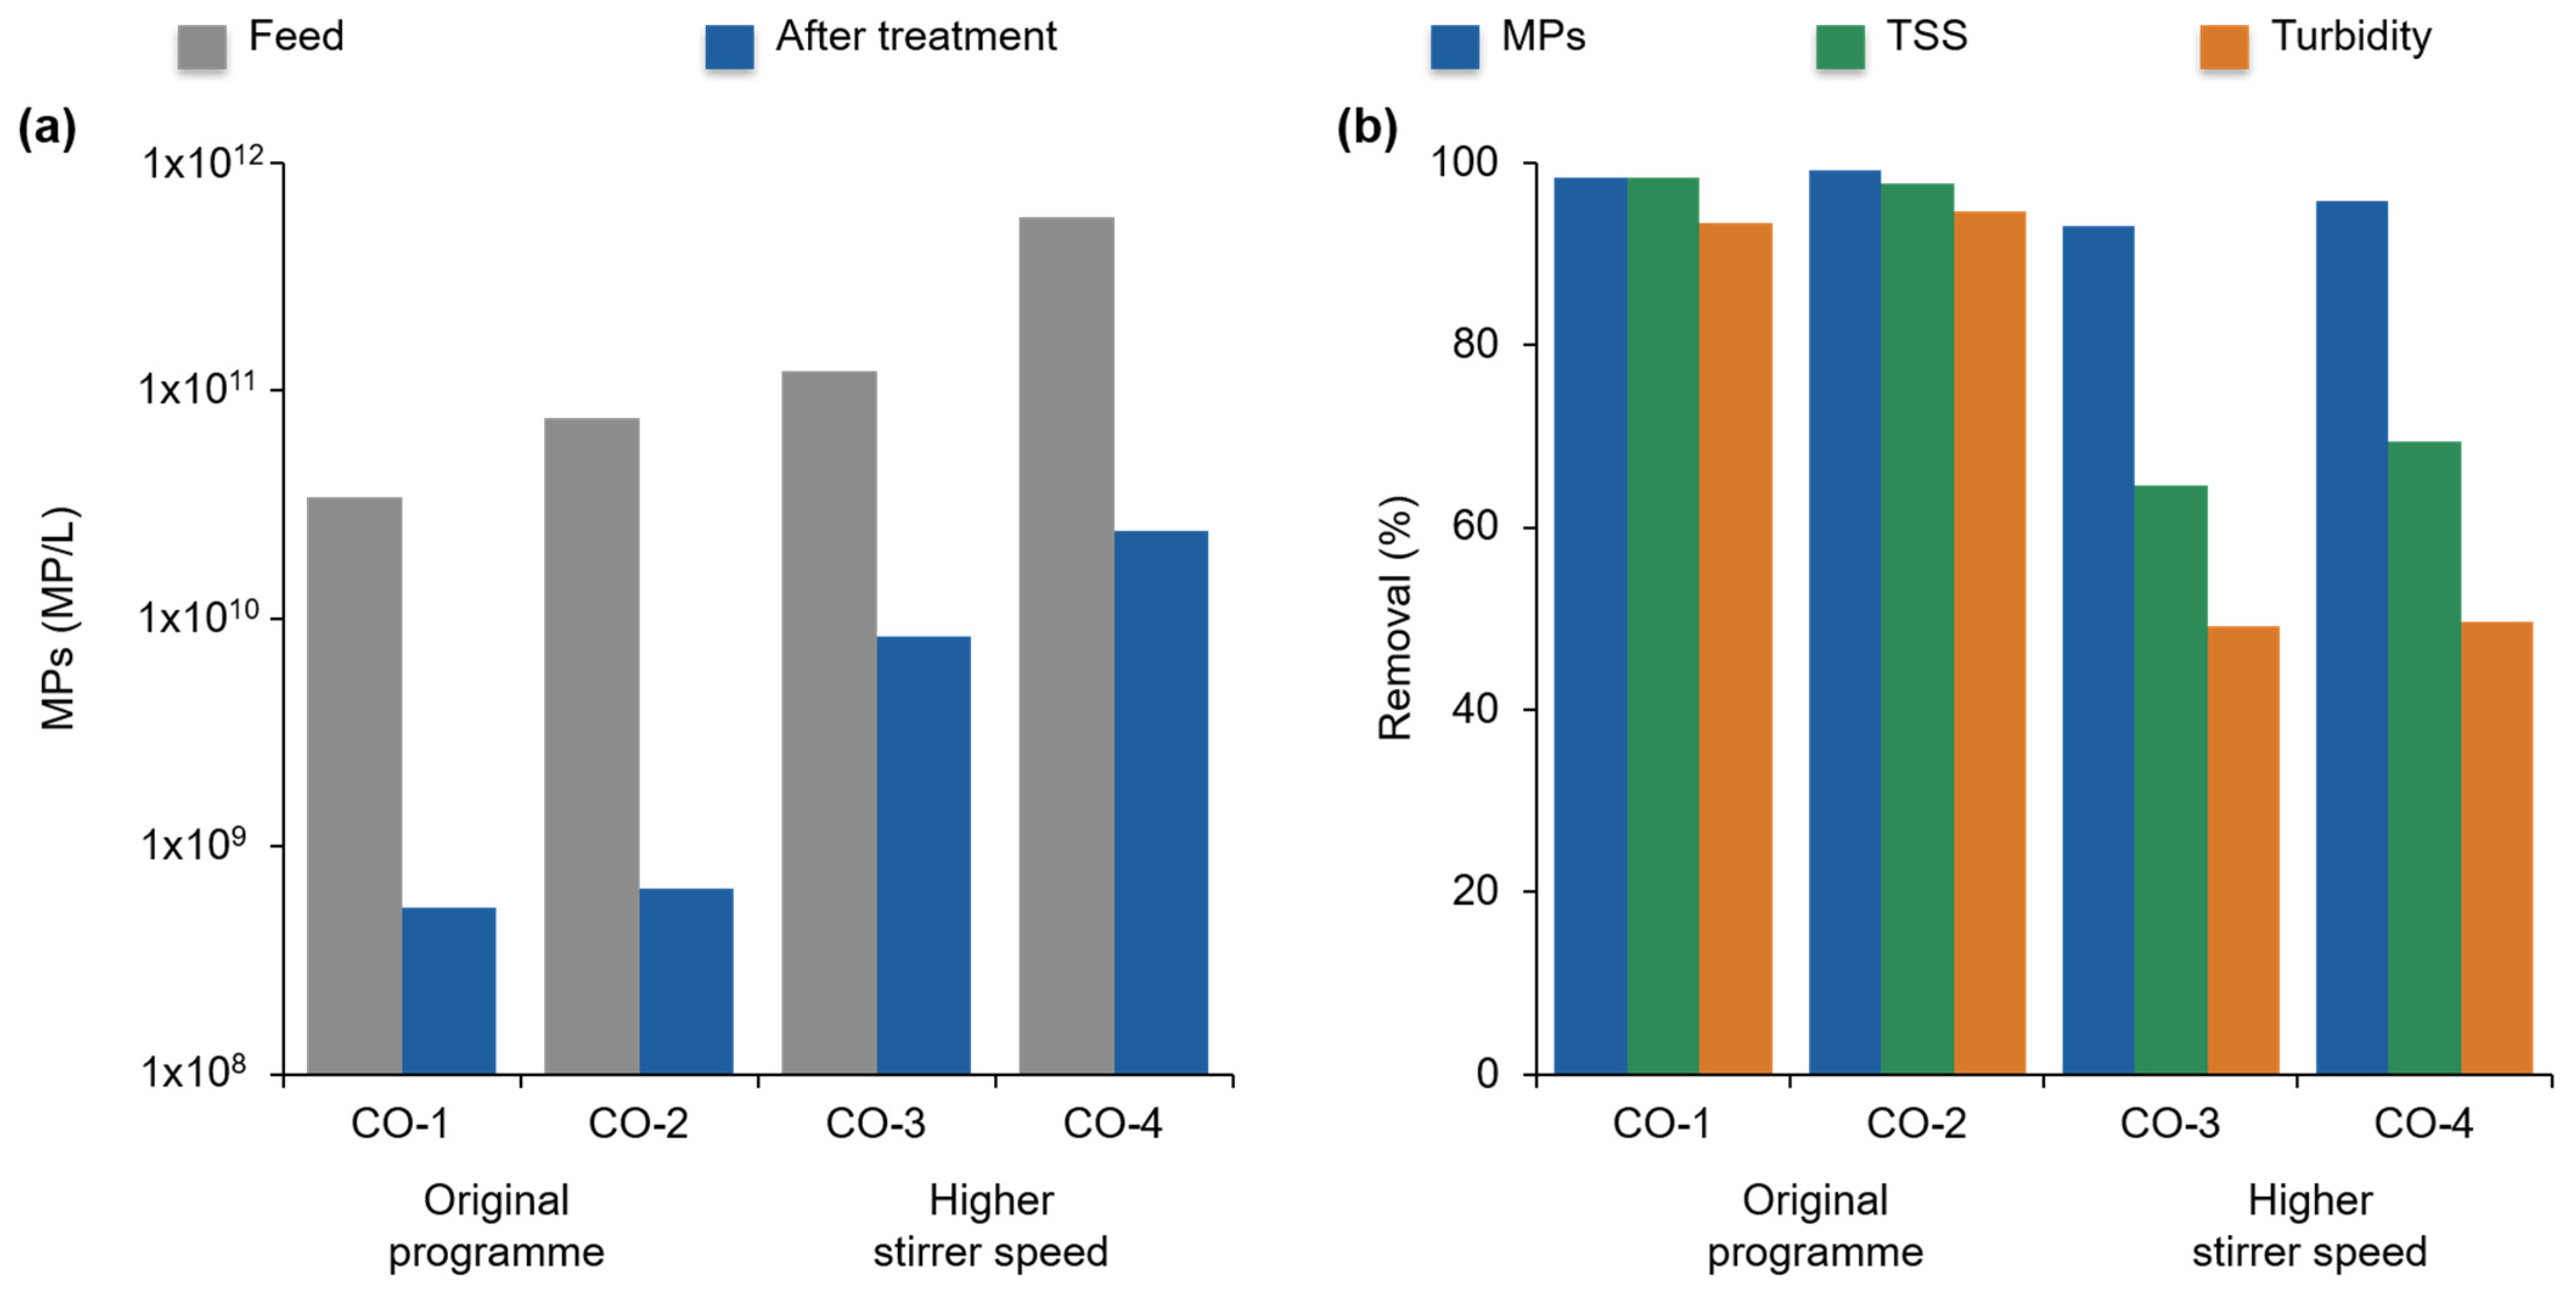
With the original mixing programme (CO-1, CO-2), the MP concentration was reduced from 3.4 × 10¹⁰ to 5.4 × 10⁸ MP/L and from 7.6 × 10¹⁰ to 6.6 × 10⁸ MP/L, i.e., by 98.4% and 99.1% (1.80 and 2.06 log units; Table 5, Figure 2 and Figure 4). The turbidity decreased by 93.4% and 94.7% and the TSS by 98.3% and 97.8%, to 11.6 and 18.9 mg/L. After the programme had been adjusted to a higher stirrer speed (CO-3, CO-4), the MP removal decreased to 93.1% and 95.8% (1.16 and 1.37 log units), whereas the turbidity removal decreased much more strongly, to 49.1% and 49.7%, and the TSS removal to 64.5% and 69.4%. Across all four runs, the MP removal was 96.6 ± 2.7% (1.60 ± 0.41 log units; paired t-test p = 0.004). The deterioration at the higher stirrer speed is in line with the shortening of the high-speed mixing during the parameter optimisation, which aimed to avoid breaking up the formed agglomerates (Section 2.3). The COD decreased by 7.6–16.1%, and the pH changed by −0.32 to +0.29 units.
Figure 4.
Validation runs in continuous operation: (a) MP concentrations in the feed (after the existing neutralisation) and after treatment (effluent of the inclined belt filter), determined by fluorescence staining (log scale); (b) removal of MPs, TSS, and turbidity. Single determinations per sample (turbidity: mean of four readings). Therefore, no error bars are shown. CO-1 and CO-2: original mixing programme; CO-3 and CO-4: higher stirrer speed.
Across the four runs, the MP removal correlated with the TSS removal (Pearson r = 0.95, p = 0.05) and the turbidity removal (r = 0.91, p = 0.09), and across all eight samples, the log-transformed MP concentration correlated with the turbidity (r = 0.91, p = 0.002) and the TSS (r = 0.77, p = 0.02). Given the small number of runs and the paired structure of the samples, these correlations are indicative only. They show, however, that turbidity and gravimetric TSS, which are available within minutes (turbidity) or hours (TSS), reflect changes in the MP removal and respond to them even more distinctly, so that they are suitable as routine control parameters, whereas the fluorescence-based MP detection is used for validation, as shown previously for packaging wastewater [31]. In three of the four runs and on average, the continuous operation achieved the removal efficiency above 95% that had been targeted after the pilot trials.
3.6. Screening Impact Analysis
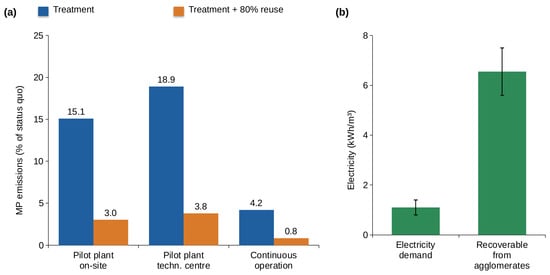
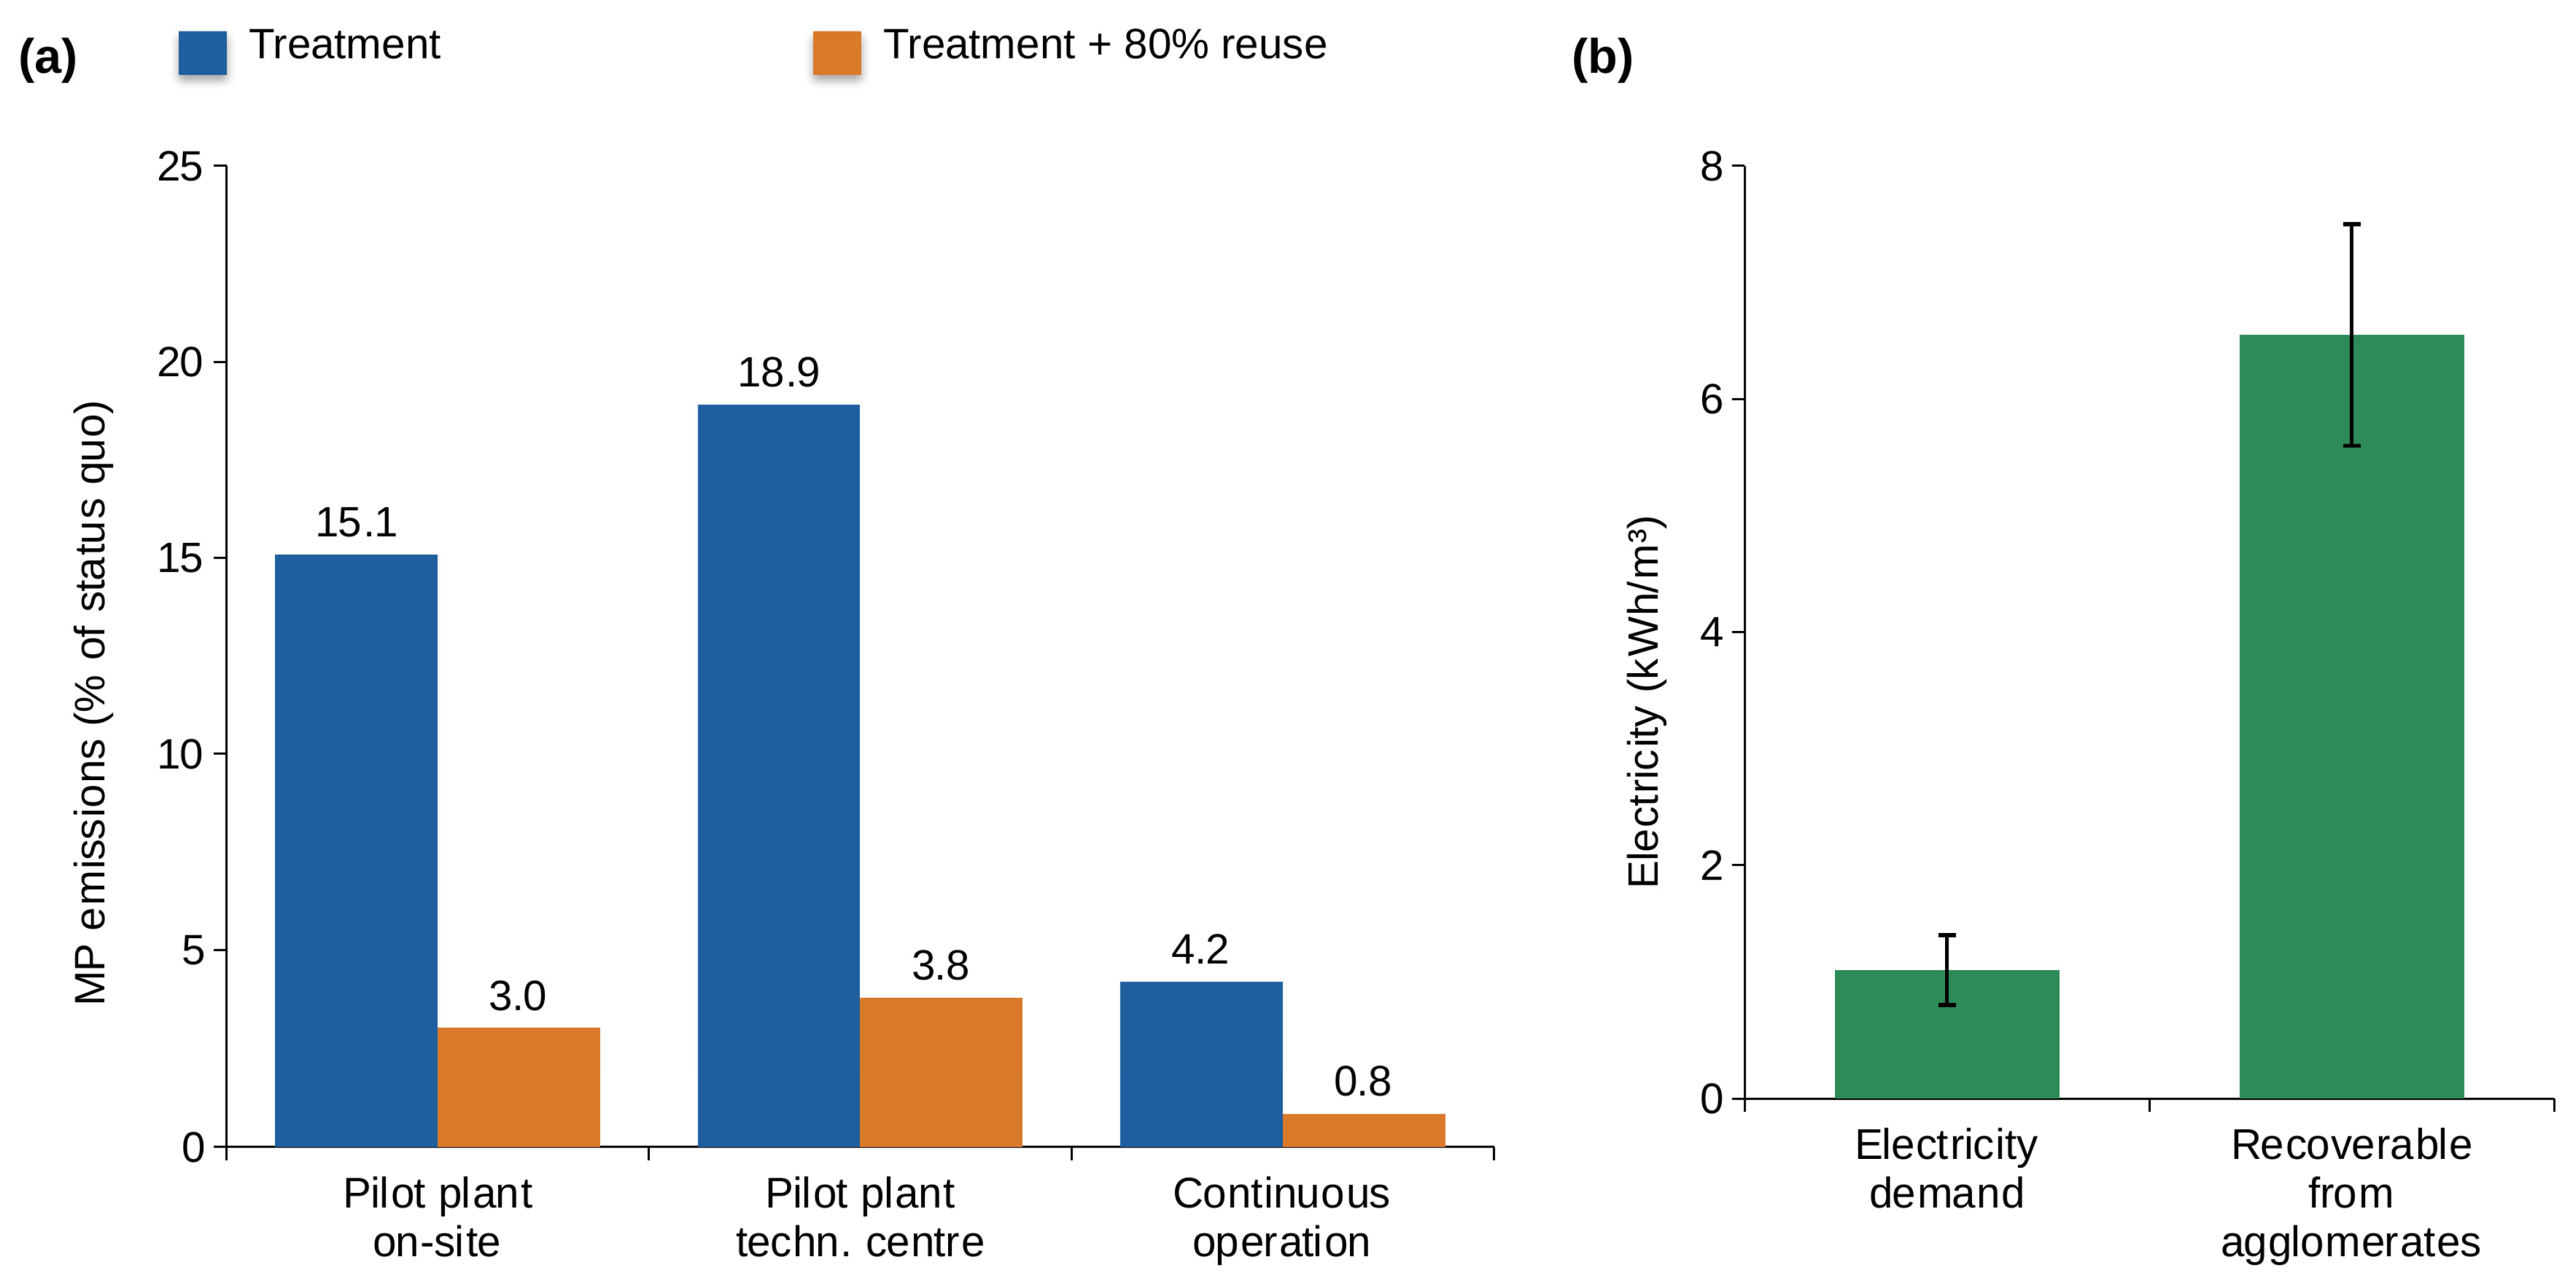
Table 6 summarises the screening impact analysis per m3 of treated wastewater for the three settings. On-site, the mobile pilot plant retained about 5.1 × 10¹¹ MPs per m3 (technical centre: 4.4 × 10¹¹). Under the status quo, the wash water would carry about 6.0 × 10¹¹ MPs per m3 into the municipal WWTP, of which about 6.0 × 10¹⁰ would be released to surface water and 5.4 × 10¹¹ would end up in the sewage sludge (90% retention [33]). With the treatment, these amounts decrease to about 9.0 × 10⁹ and 8.1 × 10¹⁰ MPs, respectively, i.e., by a factor of 6.6 on-site and 5.3 in the technical centre. In continuous operation, the mean MP concentration decreased from 2.0 × 10¹¹ to 8.4 × 10⁹ MP/L (fluorescence staining), which corresponds to a reduction in the emissions to surface water and sewage sludge by a factor of 24 (Figure 5a). If 80% of the treated water is reused in the washing process, only 0.2 m3 is discharged per m3 treated, and the MP emissions decrease by a factor of up to about 33 with the pilot plant on-site and up to about 120 in continuous operation compared to the status quo. These factors are upper estimates to demonstrate the effect of water reuse on emissions: they assume that the recirculated water does not change the feed concentration, whereas in a recirculating system, MPs that are not removed, fines, dissolved salts, surfactants, and COD may accumulate until a steady state is reached. In addition, 1.1 kg (continuous operation) to 4.6 kg (technical centre) of COD per m3 are prevented from entering the sewer system.
Table 6.
Screening impact analysis per m3 of treated wastewater. Measured values are means of the runs after initial operation and of the four runs in continuous operation. The lower part contains estimates based on literature data and assumptions.
Figure 5.
Screening impact analysis per m3 of treated wastewater: (a) MP emissions to surface water and sewage sludge in % of the status quo (indirect discharge of the untreated wash water; 90% MP retention in the municipal WWTP [33]) with treatment and 80% water reuse for the mobile pilot plant on-site and in the technical centre and for the continuous operation. As the WWTP retention is assumed to be constant, the relative reduction applies equally to surface water and sewage sludge; (b) electricity demand of the treatment versus electricity recoverable from the agglomerates measured in the technical centre (estimate, the literature values from Section 2.6). Panel (a) is calculated from mean values and literature-based assumptions and is therefore shown without error bars. The error bars in (b) show the ranges of the literature values (0.8–1.4 and 5.6–7.5 kWh/m3).
With a calorific value of 28.6–38.6 MJ/kg dry residue [31], the approximately 2.0 kg of dry agglomerates per m3 measured in the technical centre contain 57–77 MJ (16–21 kWh), corresponding to 5.6–7.5 kWh of electricity at 35% efficiency [33]. This exceeds the electricity demand of the technology of 0.8–1.4 kWh/m3 (Section 2.6) by a factor of 4–9 (Figure 5b). The LCA of the same technology identified the consumable filter fleece as the dominant driver of the GWP (25.4 kg CO2-eq/m3), which was reduced by 96% to 1.0 kg CO2-eq/m3 with an endless belt filter and the reuse of the agglomerates as concrete filler [33]. Since consumable filter fleece was also used in the separation unit here (Section 2.2), a comparable optimisation potential can be expected.
4. Discussion
4.1. MP Removal and Transferability
Organosilane-induced agglomeration–fixation removed MPs reliably from a wash water containing up to 6 × 10⁸ MP/L (stereomicroscopic counts): 84.9 ± 1.7% on-site after parameter optimisation and 81.1 ± 4.4% in the technical centre, corresponding to about 5 × 10¹¹ retained MPs per m3. The technical-centre runs were not intended to reproduce the chemistry of the fresh, hot, and alkaline wash water, but to repeat the treatment under controlled conditions. That the removal remained in the same range with stored wastewater, at a different pH, with a different COD distribution, and with a different separation unit indicates that the agglomeration is robust against these changes. Given the small number of runs and the common feed of the runs in each setting, this is a reproduction under different conditions rather than a statistical proof of equivalence. The low variability of the five on-site runs shows that the removal was robust to the tested variation in dosage and mixing time.
A previous pilot application of the same technology in industrial wastewater reached about 98% [30]. The lower removal in PET recycling wash water is not explained by the investigated operating parameters, as neither a higher dosage nor a shorter mixing time increased the removal substantially (Section 3.2). During initial operation and series I, the agglomerates were separated in a filter box that was not designed for the high solids load of this wastewater of about 12 kg of wet agglomerates per m3. With the inclined belt filter used in series II and in the technical centre, the removal was in the same range (84.0% and 87.7% in series II; 81.1 ± 4.4% in the technical centre). The first run in the technical centre was discarded because the belt filter was charged too quickly. An adequately dimensioned separation stage is therefore a prerequisite for this application, but the separation stage alone does not explain the removal level. In addition, the wastewater composition may contribute, as the wash water contained 100–147 mg/L of non-ionic surfactants. Non-ionic surfactants at ppm level have been shown to inhibit the removal of MPs by coagulation significantly, as an adsorbed hydrophilic polyethylene glycol layer sterically hinders the agglomeration [35,36]. A comparable shielding of the MP surfaces against the organosilanes is conceivable. Moreover, PET is a polar polyester. In laboratory studies with the organosilane-based process, the removal decreased with increasing polarity of the MPs because smaller agglomerates were formed, while the organic groups of the organosilanes can be adapted to the polymer type [28]. These explanations are hypotheses, as no trials with defined surfactant concentrations or model solutions were carried out. The continuous operation shows, however, that PET MPs are not inherently difficult to remove with this process: with the original mixing programme, 98.4–99.1% of the MPs were removed from PET recycling wash water, and 96.6 ± 2.7% on average across all four runs (Section 3.5). This suggests that the process conditions, in particular the mixing intensity and the separation, are more decisive for the removal level than the polarity of the polymer, while a possible effect of the surfactants remains to be tested with defined surfactant concentrations.
The high solids load of the wash water is the main operational challenge. During initial operation and series I, the filter box was not designed for about 12 kg of wet agglomerates per m3, and the first run in the technical centre was discarded because the belt filter was charged too quickly. In continuous operation, the inclined belt filter therefore has to be operated so that the supply of fresh filter medium matches the solids flux. The effluent turbidity and TSS, which responded even more distinctly than the MP removal to the deterioration in CO-3 and CO-4, provide an early indication of insufficient agglomeration or of a breakthrough of the filter, so that the programme can be readjusted before the removal decreases over longer periods. The consumable filter fleece also dominated the GWP of the technology in a previous LCA, which was reduced by 96% with an endless belt filter [33]. Long-term data over several months are required to quantify clogging, filter-medium consumption, and maintenance intervals in continuous operation.
Where a higher removal is required, the treatment could be applied in two or three sequential cycles. Assuming a constant removal of 85% per cycle, two cycles would theoretically achieve 97.8% and three cycles 99.7%. Whether the remaining, possibly smaller particles are removed with the same efficiency must be verified experimentally. Alternatively, the reuse of 80% of the treated water in the washing process [31] reduces the discharged volume and thus the MP emissions by a factor of up to about 33 with the pilot plant and up to about 120 in continuous operation compared to the status quo (Section 3.6).
Only a few studies have examined MP removal from plastic recycling wastewater. At a mixed plastics recycling facility, the installed 50 µm filtration removed the majority of MPs > 5 µm with high removal for MPs > 40 µm, whereas MPs < 5 µm were generally not removed, and the annual MP discharge after filtration was still estimated at 59–1184 t [6]. The raw wash water of that facility was estimated to contain 5.97 × 10⁶ to 1.12 × 10⁸ MP m−3 (fluorescence microscopy, 1.6 µm filters), i.e., about four to five orders of magnitude less than the wash water in this study [6]. Lab-scale sand filtration of wastewater from a plastic recycling plant achieved up to 100% removal, at an influent concentration of 27 particles/L and a detection limit of 30 µm [9]. At pilot scale, ultrafiltration removed all detectable MPs and microlitter ≥ 25 µm from wastewater of the plastic industry, including PET processing, whereas rapid gravity filtration of urban wastewater removed only 39.5 ± 34.6% [10]. These values are not directly comparable with the present study, which treated a wash water with concentrations several orders of magnitude higher and counted particles from about 5 µm. Membrane processes achieve a high retention [10,19], and DAF requires energy for air saturation, which accounts for about half of its operating costs [37]. In contrast, the organosilane-based process separates the agglomerates by simple filtration, does not require pH conditioning, and produces a defined agglomerate stream for recovery.
The process analytics was adapted during the development, from stereomicroscopic counting during the pilot trials to the standard analytics for industrial wastewater in continuous operation, in which polymer-selective fluorescence staining validates the MP removal and turbidity and TSS serve as routine control parameters [31]. Spectroscopic polymer identification, e.g., by micro-FTIR or Raman microscopy, is suitable for characterising particles in research, but it is too time-consuming for the control of an industrial process with highly loaded samples. For process control, the decisive information is the change between feed and effluent, which is documented with the same standardised protocol before and after treatment. Spectroscopic identification of a subset of particles could nevertheless complement future research studies.
4.2. Benefits for the Recycling Process
The first benefit for industrial practice is that the treatment does not require a neutralisation. On-site, it was applied to the untreated alkaline wash water (pH 8.8–10.8), in the technical centre to stored, non-neutralised wash water (pH 6.2), and in continuous operation to wash water that had already passed the existing neutralisation of the plant (pH 6.25–6.44). In none of these settings was the pH adjusted for the treatment, and the pH of the treated water remained practically unchanged. This distinguishes the process from metal-salt coagulation, whose efficiency depends on pH and which usually requires pH conditioning [25,26], and is consistent with the robustness of the organosilane-based process reported previously [28]. Where a neutralisation is not required for other reasons, avoiding it saves acid and the associated increase in salinity. Because the pH and the surfactants remained largely unchanged while the MPs were removed, the treated water could be returned to the washing process, with an estimated water saving of up to 80% [31]. A reuse was, however, not tested in this study. Its suitability depends on the residual MP concentration, COD, turbidity and TSS, dissolved organic compounds, and salts, as well as on the requirements for washing efficiency and product quality. With repeated recirculation, these substances may accumulate until a steady state is reached. An accumulation of residual reagent is not expected, as the organosilanes are bound in the agglomerates and dissolved residues were not detected previously [28]. The accumulation of the other substances and its effect on the washing efficiency and flake quality should be monitored in a reuse trial, e.g., via conductivity, COD, surfactants, and turbidity. If the treated water is discharged, the pH requirements of the local discharge permit still apply.
The second benefit is the reduction in emissions. Upstream treatment reduces the MP load entering surface waters and sewage sludge by a factor of 6.6 at the removal level achieved with the pilot plant on-site and by a factor of 24 in continuous operation, and by a factor of up to about 33 and 120, respectively, if 80% of the treated water is reused (upper estimates, Section 3.6). This is relevant because sewage sludge is frequently applied to agricultural land in many European countries, making it a major pathway of MPs into soils [17,38]. The treatment thus reduces the load that will be monitored at WWTP inlets and outlets under the recast Urban Wastewater Treatment Directive. It avoids an impairment of sludge recovery by non-domestic discharges [12] and contributes to the reduction target for MP releases [13]. The treatment addresses the particle-bound main pollutants listed in the Water Framework Directive [11]. The dissolved COD can be reduced by a downstream adsorption stage [30].
The third benefit is resource recovery. About 12 kg of wet or 2 kg of dry agglomerates per m3 are collected in a defined form instead of being dispersed in the sewer and sludge. After subtraction of the reagent, they contain about 1.8 kg of separated dry solids per m3, whose composition was not characterised. Their energy content exceeds the electricity demand of the technology several-fold, and the LCA of the same technology showed that the GWP can be reduced by 96% with an endless belt filter and the material reuse of the agglomerates [33]. These findings should be confirmed by a site-specific LCA.
5. Conclusions
Organosilane-induced agglomeration–fixation removed MPs, predominantly PET, effectively from the highly loaded wash water of industrial PET recycling. During development, after a feasibility test in the technical centre (94.9% MP removal, single run), the mobile pilot plant achieved 84.9 ± 1.7% on-site after parameter optimisation (best case 87.7%), corresponding to about 5 × 10¹¹ retained MPs per m3, and 81.1 ± 4.4% in the technical centre with stored wastewater. The removal was consistent across the runs of each setting and in the same range in both settings. On three parallel sampling days during initial operation, the MP concentration after the pilot plant was lower than after the existing DAF. In continuous operation, the removal was 96.6 ± 2.7% (93.1–99.1%) and reached 98.4–99.1% with the original mixing programme.
The treatment did not require any pH adjustment. It worked with untreated alkaline wash water (up to pH 10.8), with stored wash water (pH 6.2), and with wash water from an existing neutralisation (pH 6.25–6.44), and the pH of the treated water remained practically unchanged. Together with the supplementary finding that surfactants remained largely in solution, this is a prerequisite for a reuse of the treated water in the washing process, which remains to be verified in a reuse trial. The COD was reduced by 75% in the stored IBC sample and by 7–27% in the fresh wash water on-site, consistent with a predominantly dissolved COD in the fresh wash water.
The benefits of the technology comprise a 6.6-fold (pilot plant on-site) to 24-fold (continuous operation) reduction in the MP load entering surface waters and sewage sludge, which increases to up to about 33-fold and 120-fold, respectively, with 80% water reuse, the collection of about 12 kg of wet agglomerates per m3 with about 1.8 kg of separated dry solids as a recoverable material stream, and—according to a screening estimate based on literature values—an energy content of the agglomerates that exceeds the electricity demand of the treatment several-fold. The continuous operation showed that removal efficiencies above 95% are achievable in PET recycling wash water and that turbidity and TSS indicate changes in the removal immediately, so that they can be used for process monitoring, while the fluorescence-based MP detection validates the removal. Overall, the data show that organosilane-induced agglomeration–fixation is a functional solution for upstream MP removal in PET recycling and supports the European targets for reducing MP releases.
Author Contributions
Conceptualization, A.K., D.S. and K.S.; methodology, A.K., D.S. and K.S.; investigation, A.K. and D.S.; formal analysis, A.K., M.T.S. and K.S.; data curation, A.K. and K.S.; writing—original draft preparation, A.K., M.T.S. and K.S.; writing—review and editing, all authors; visualization, A.K. and M.T.S.; supervision, K.S.; project administration, K.S. All authors have read and agreed to the published version of the manuscript.
Funding
This research was co-funded by the European Union’s Horizon Europe research and innovation programme under grant agreement No. 101093964 (REMEDIES) and by the Horizon Europe Mission project UPSTREAM (grant agreement No. 101112877), co-funded by the European Union and UK Research and Innovation. This publication reflects the views only of the authors, and the European Commission cannot be held responsible for any use that may be made of the information contained therein.
Data Availability Statement
The data presented in this study are available from the corresponding author upon reasonable request.
Acknowledgments
The authors thank the operator of the PET recycling plant for the opportunity to perform the investigations on-site and in continuous operation and for their support during sampling. During the preparation of this manuscript, the authors used Claude Opus 5.5 (Anthropic, 2026) for the purposes of structuring the manuscript, drafting and language editing of text, compiling the process data into tables and figures, performing the statistical analyses, and searching and checking literature and regulatory sources (see Section 2.7). The authors have reviewed and edited the output and take full responsibility for the content of this publication.
Conflicts of Interest
The authors Anika Korzin, Dennis Schober, Michael Toni Sturm and Katrin Schuhen were employed by the company Wasser 3.0 gGmbH. The agglomeration reagent is commercially distributed by abcr GmbH. All authors declare that the research was conducted in the absence of any commercial or financial relationships that could be construed as a potential conflict of interest.
Abbreviations
The following abbreviations are used in this manuscript:
| CI | Confidence interval |
| CO | Continuous operation (runs CO-1 to CO-4) |
| COD | Chemical oxygen demand |
| DAF | Dissolved air flotation |
| FT | Feasibility test |
| GWP | Global warming potential |
| IBC | Intermediate bulk container |
| IO | Initial operation (runs IO-1 to IO-3) |
| LCA | Life cycle assessment |
| MP(s) | Microplastic(s) |
| NTU | Nephelometric turbidity unit |
| OPT | Parameter optimisation (runs OPT-1 to OPT-5) |
| PET | Polyethylene terephthalate |
| SD | Standard deviation |
| TC | Confirmatory runs in the technical centre (TC-1 to TC-3) |
| TSS | Total suspended solids |
| WWTP | Wastewater treatment plant |
References
- Welle, F. Twenty years of PET bottle to bottle recycling—An overview. Resour. Conserv. Recycl. 2011, 55, 865–875. [Google Scholar] [CrossRef] [Scilit]
- Pinter, E.; Welle, F.; Mayrhofer, E.; Pechhacker, A.; Motloch, L.; Lahme, V.; Grant, A.; Tacker, M. Circularity Study on PET Bottle-To-Bottle Recycling. Sustainability 2021, 13, 7370. [Google Scholar] [CrossRef] [Scilit]
- European Parliament and Council of the European Union. Directive (EU) 2019/904 of the European Parliament and of the Council of 5 June 2019 on the reduction of the impact of certain plastic products on the environment. Off. J. Eur. Union 2019, L 155, 1–19. Available online: http://data.europa.eu/eli/dir/2019/904/oj (accessed on 20 October 2026).
- Suzuki, G.; Uchida, N.; Tuyen, L.H.; Tanaka, K.; Matsukami, H.; Kunisue, T.; Takahashi, S.; Viet, P.H.; Kuramochi, H.; Osako, M. Mechanical recycling of plastic waste as a point source of microplastic pollution. Environ. Pollut. 2022, 303, 119114. [Google Scholar] [CrossRef] [Scilit] [PubMed]
- Stapleton, M.J.; Ansari, A.J.; Ahmed, A.; Hai, F.I. Evaluating the generation of microplastics from an unlikely source: The unintentional consequence of the current plastic recycling process. Sci. Total Environ. 2023, 902, 166090. [Google Scholar] [CrossRef] [Scilit] [PubMed]
- Brown, E.; MacDonald, A.; Allen, S.; Allen, D. The potential for a plastic recycling facility to release microplastic pollution and possible filtration remediation effectiveness. J. Hazard. Mater. Adv. 2023, 10, 100309. [Google Scholar] [CrossRef] [Scilit]
- Karakurt, O.; Altuntaş, O.; Şimşek, İ.; Hatinoğlu, D.; Sanin, F.D. Microplastics from industrial sources: A known but overlooked problem. J. Water Process Eng. 2025, 72, 107487. [Google Scholar] [CrossRef] [Scilit]
- Gkika, D.A.; Tolkou, A.K.; Evgenidou, E.; Bikiaris, D.N.; Lambropoulou, D.A.; Mitropoulos, A.C.; Kalavrouziotis, I.K.; Kyzas, G.Z. Fate and Removal of Microplastics from Industrial Wastewaters. Sustainability 2023, 15, 6969. [Google Scholar] [CrossRef] [Scilit]
- Umar, M.; Singdahl-Larsen, C.; Ranneklev, S.B. Microplastics Removal from a Plastic Recycling Industrial Wastewater Using Sand Filtration. Water 2023, 15, 896. [Google Scholar] [CrossRef] [Scilit]
- González-Camejo, J.; Morales, A.; Peña-Lamas, J.; Lafita, C.; Enguídanos, S.; Seco, A.; Martí, N. Feasibility of rapid gravity filtration and membrane ultrafiltration for the removal of microplastics and microlitter in sewage and wastewater from plastic industry. J. Water Process Eng. 2023, 51, 103452. [Google Scholar] [CrossRef] [Scilit]
- European Parliament and Council of the European Union. Directive 2000/60/EC of the European Parliament and of the Council of 23 October 2000 establishing a framework for Community action in the field of water policy. Off. J. Eur. Communities 2000, L 327, 1–73. Available online: http://data.europa.eu/eli/dir/2000/60/oj (accessed on 20 October 2026).
- European Parliament and Council of the European Union. Directive (EU) 2024/3019 of the European Parliament and of the Council of 27 November 2024 concerning urban wastewater treatment (recast). Off. J. Eur. Union 2024, L 2024/3019. Available online: http://data.europa.eu/eli/dir/2024/3019/oj (accessed on 20 October 2026).
- European Commission. Communication from the Commission to the European Parliament, the Council, the European Economic and Social Committee and the Committee of the Regions: Pathway to a Healthy Planet for All. EU Action Plan: ‘Towards Zero Pollution for Air, Water and Soil’; COM(2021) 400 final; European Commission: Brussels, Belgium, 2021; Available online: https://eur-lex.europa.eu/legal-content/EN/TXT/?uri=CELEX:52021DC0400 (accessed on 20 October 2026).
- European Parliament and Council of the European Union. Regulation (EU) 2025/2365 of the European Parliament and of the Council of 12 November 2025 on preventing plastic pellet losses to reduce microplastic pollution. Off. J. Eur. Union 2025, L 2025/2365. Available online: http://data.europa.eu/eli/reg/2025/2365/oj (accessed on 20 October 2026).
- Verordnung über Anforderungen an das Einleiten von Abwasser in Gewässer (Abwasserverordnung—AbwV) in der Fassung der Bekanntmachung vom 17. Juni 2004 (BGBl. I S. 1108, 2625), Zuletzt Geändert Durch Art. 1 der Verordnung vom 17. April 2024 (BGBl. 2024 I Nr. 132). Available online: https://www.gesetze-im-internet.de/abwv/ (accessed on 9 November 2026).
- Cristaldi, A.; Fiore, M.; Zuccarello, P.; Oliveri Conti, G.; Grasso, A.; Nicolosi, I.; Copat, C.; Ferrante, M. Efficiency of Wastewater Treatment Plants (WWTPs) for Microplastic Removal: A Systematic Review. Int. J. Environ. Res. Public Health 2020, 17, 8014. [Google Scholar] [CrossRef] [Scilit] [PubMed]
- Rolsky, C.; Kelkar, V.; Driver, E.; Halden, R.U. Municipal sewage sludge as a source of microplastics in the environment. Curr. Opin. Environ. Sci. Health 2020, 14, 16–22. [Google Scholar] [CrossRef] [Scilit]
- Singh, S.; Kalyanasundaram, M.; Diwan, V. Removal of microplastics from wastewater: Available techniques and way forward. Water Sci. Technol. 2021, 84, 3689–3704. [Google Scholar] [CrossRef] [Scilit] [PubMed]
- Poerio, T.; Piacentini, E.; Mazzei, R. Membrane Processes for Microplastic Removal. Molecules 2019, 24, 4148. [Google Scholar] [CrossRef] [Scilit] [PubMed]
- Wolff, S.; Weber, F.; Kerpen, J.; Winklhofer, M.; Engelhart, M.; Barkmann, L. Elimination of Microplastics by Downstream Sand Filters in Wastewater Treatment. Water 2021, 13, 33. [Google Scholar] [CrossRef] [Scilit]
- Liu, Z.; Liu, Z.; Bai, L.; Liu, Z. Dimensional engineering of advanced adsorbents for mitigating micro-nanoplastics pollution. Coord. Chem. Rev. 2026, 548, 217192. [Google Scholar] [CrossRef] [Scilit]
- Rasool, A.; Heviánková, S.; Halfar, J.; Brožová, K.; Chromíková, J.; Pertile, E.; Malíková, P.; Motyka, O.; Drabinová, S.; Čabanová, K. Engineered biochar for microplastic remediation in aquatic environments: Interfacial mechanisms, modification strategies, and future perspectives. J. Hazard. Mater. 2026, 515, 143085. [Google Scholar] [CrossRef] [Scilit] [PubMed]
- Lu, F.; Yang, T.; Zhao, J.; Cai, D.; Nolasco, M.A.; Cheng, S.; Graham, N.J.D.; Yang, Z. Nexus between environmental aging, ecological risks, and removal strategies for micro- and nano-plastics in aquatic systems. Chem. Eng. J. 2026, 544, 179072. [Google Scholar] [CrossRef] [Scilit]
- Lapointe, M.; Farner, J.M.; Hernandez, L.M.; Tufenkji, N. Understanding and Improving Microplastic Removal during Water Treatment: Impact of Coagulation and Flocculation. Environ. Sci. Technol. 2020, 54, 8719–8727. [Google Scholar] [CrossRef] [Scilit] [PubMed]
- Tang, W.; Li, H.; Fei, L.; Wei, B.; Zhou, T.; Zhang, H. The removal of microplastics from water by coagulation: A comprehensive review. Sci. Total Environ. 2022, 851, 158224. [Google Scholar] [CrossRef] [Scilit] [PubMed]
- Khan, M.T.; Ahmad, M.; Hossain, M.F.; Nawab, A.; Ahmad, I.; Ahmad, K.; Panyametheekul, S. Microplastic removal by coagulation: A review of optimizing the reaction conditions and mechanisms. Water Emerg. Contam. Nanoplastics 2023, 2, 22. [Google Scholar] [CrossRef] [Scilit]
- Herbort, A.F.; Sturm, M.T.; Fiedler, S.; Abkai, G.; Schuhen, K. Alkoxy-silyl Induced Agglomeration: A New Approach for the Sustainable Removal of Microplastic from Aquatic Systems. J. Polym. Environ. 2018, 26, 4258–4270. [Google Scholar] [CrossRef] [Scilit]
- Sturm, M.T.; Horn, H.; Schuhen, K. Removal of Microplastics from Waters through Agglomeration-Fixation Using Organosilanes—Effects of Polymer Types, Water Composition and Temperature. Water 2021, 13, 675. [Google Scholar] [CrossRef] [Scilit]
- Sturm, M.T.; Myers, E.; Schober, D.; Korzin, A.; Thege, C.; Schuhen, K. Comparison of AOP, GAC, and Novel Organosilane-Based Process for the Removal of Microplastics at a Municipal Wastewater Treatment Plant. Water 2023, 15, 1164. [Google Scholar] [CrossRef] [Scilit]
- Sturm, M.T.; Myers, E.; Schober, D.; Korzin, A.; Schuhen, K. Beyond Microplastics: Implementation of a Two-Stage Removal Process for Microplastics and Chemical Oxygen Demand in Industrial Wastewater Streams. Water 2024, 16, 268. [Google Scholar] [CrossRef] [Scilit]
- Korzin, A.; Sturm, M.T.; Myers, E.; Schober, D.; Ronsse, P.; Schuhen, K. Upstream Microplastic Removal in Industrial Wastewater: A Pilot Study on Agglomeration-Fixation-Reaction Based Treatment for Water Reuse and Waste Recovery. Clean Technol. 2025, 7, 67. [Google Scholar] [CrossRef] [Scilit]
- Sturm, M.T.; Myers, E.; Korzin, A.; Polierer, S.; Schober, D.; Schuhen, K. Fast Forward: Optimized Sample Preparation and Fluorescent Staining for Microplastic Detection. Microplastics 2023, 2, 334–349. [Google Scholar] [CrossRef] [Scilit]
- Puhar, J.; Sturm, M.T.; Myers, E.; Schober, D.; Korzin, A.; Vujanović, A.; Schuhen, K. When Technology Meets Sustainability: Microplastic Removal from Industrial Wastewater, Including Impact Analysis and Life Cycle Assessment. Water 2025, 17, 671. [Google Scholar] [CrossRef] [Scilit]
- Geerdink, R.B.; van den Hurk, R.S.; Epema, O.J. Chemical oxygen demand: Historical perspectives and future challenges. Anal. Chim. Acta 2017, 961, 1–11. [Google Scholar] [CrossRef] [Scilit] [PubMed]
- Xia, Y.; Xiang, X.-M.; Dong, K.-Y.; Gong, Y.-Y.; Li, Z.-J. Surfactant stealth effect of microplastics in traditional coagulation process observed via 3-D fluorescence imaging. Sci. Total Environ. 2020, 729, 138783. [Google Scholar] [CrossRef] [Scilit] [PubMed]
- Ziembowicz, S.; Kida, M.; Koszelnik, P. Elimination of a Mixture of Microplastics Using Conventional and Detergent-Assisted Coagulation. Materials 2023, 16, 4070. [Google Scholar] [CrossRef] [Scilit] [PubMed]
- Muñoz-Alegría, J.A.; Muñoz-España, E.; Flórez-Marulanda, J.F. Dissolved Air Flotation: A Review from the Perspective of System Parameters and Uses in Wastewater Treatment. TecnoLógicas 2021, 24, e2111. [Google Scholar] [CrossRef] [Scilit]
- Lofty, J.; Muhawenimana, V.; Wilson, C.A.M.E.; Ouro, P. Microplastics removal from a primary settler tank in a wastewater treatment plant and estimations of contamination onto European agricultural land via sewage sludge recycling. Environ. Pollut. 2022, 304, 119198. [Google Scholar] [CrossRef] [Scilit] [PubMed]

Disclaimer/Publisher’s Note: The statements, opinions and data contained in all publications are solely those of the individual author(s) and contributor(s) and not of MDPI and/or the editor(s). MDPI and/or the editor(s) disclaim responsibility for any injury to people or property resulting from any ideas, methods, instructions or products referred to in the content. |
© 2026 by the authors. Licensee MDPI, Basel, Switzerland. This article is an open access article distributed under the terms and conditions of the Creative Commons Attribution (CC BY) license.