


Abstract
Urban and agricultural watersheds are increasingly exposed to contamination from multiple human activities, raising concerns about sediment quality and ecological risk. Bed sediments act as long-term archives of potentially toxic elements (PTEs) at the watershed scale. In this study, riverbed sediment samples were collected from two Brazilian coastal watersheds with contrasting land uses (urban and agricultural) during dry and wet seasons. Total element concentrations were determined by optical emission spectrometry (ICP-OES). Six metals were evaluated: Cr, Cu, Mn, Ni, Pb, and Zn. Seasonal variations were evident, with higher Mn and Zn concentrations during the wet season in the urbanized Beberibe River, whereas Cr, Cu, Ni, and Pb predominated during the dry season, with Cr and Cu exceeding the probable effect level (PEL) at least at one sampling point. In the agricultural Jaboatão River watershed, most elements showed higher concentrations during the wet season, and Cr and Pb exceeded the PEL, indicating potential ecological risk. Both watersheds exhibited high contamination factors and severe Cu enrichment. Ecological risk ranged from low to considerable in the Beberibe River, while remaining predominantly low in the Jaboatão River. Sequential extraction results indicated that several PTEs were associated with the exchangeable, reducible, and oxidizable fractions, particularly Cu and Ni in the Beberibe watershed, and Mn and Pb in the Jaboatão watershed, highlighting their potential environmental mobility. In contrast, Fe and Cr were mainly associated with natural sources. These findings emphasize the importance of integrating concentration-based indices and geochemical fractionation to support environmental management of urban and agricultural watersheds.
1. Introduction
Aquatic ecosystems, such as rivers, face constant threats due to pollution derived from various sources, both natural and anthropogenic, including industrial [1,2] and agricultural sources [3]. Among the most frequent potentially toxic elements (PTEs) in sediment are heavy metals [4]. Most of these elements accumulate in sediments in water bodies, either in suspension or on the riverbed, while only a fraction remains dissolved in the water column [5]. Bed sediments, by remaining deposited for long periods, act as a historical archive reflecting inputs from different pollutant sources [6].
PTEs are a significant threat to living organisms in aquatic ecosystems due to their high environmental stability, resistance to biodegradation, and biotoxicity [7,8,9]. This problem is exacerbated by rapid population growth, which increases the demand for resources and, at the same time, generates higher volumes of waste [10,11]. Although PTEs can originate from natural sources, anthropogenic activities near water bodies are often the primary contributors. Among these, industrial activities stand out, which can release pollutants through emissions or improper waste disposal [12]. Likewise, disorganized urban development in large cities contributes to the discharge of significant amounts of untreated domestic waste [13]. In addition, intensive agricultural activity also constitutes a major anthropogenic source due to the extensive use of fertilizers, amendments, and various pesticides [3,14,15]. The PTEs of greatest concern in agricultural soils include Cd, Co, Cr, Cu, Hg, Ni, Pb, and Zn [16].
Sediments in water bodies link terrestrial and aquatic ecosystems, so transporting sediment-associated pollutants can influence water properties [17,18,19]. Metals present in these sediments can also enter other environments through the food chain, which can cause mild or chronic impacts on the human organism, even at low concentrations [20,21,22]. These elements can enter the human body through dermal absorption, ingestion, and inhalation [23]. Their adverse health effects vary depending on the element and the level and duration of exposure [18]. Chromium (Cr), particularly Cr(VI), has been associated with cancer and liver and cardiovascular damage; manganese (Mn) with neurological disorders; copper (Cu) with gastrointestinal and liver damage; arsenic (As) with skin lesions, neuropathies, and cancer; cadmium (Cd) with kidney and liver damage and cancer; mercury (Hg) with oxidative stress, cellular damage, and neurotoxicity; and lead (Pb) with adverse effects on the nervous, immune, and endocrine systems [24].
Numerous studies have assessed sediment contamination to evaluate pollution levels in aquatic environments. For example, Vu et al. [3] and Radomirović et al. [25] reported Cu and Zn contamination in sediments from the Danube River basin, while Ke et al. [26] identified contamination by Cd, As, Cu, Ni, Pb, and Cr in sediments from the Liaohe River. Beyond determining elemental concentrations, integrated approaches combining geochemical indices and statistical methods have been widely applied to assess contamination levels, spatial distribution patterns, and potential ecological risks in freshwater and marine sedimentary environments. Using such approaches, Vu et al. [3] reported severe potential ecological risks associated with Cd, Cu, and Hg in river sediments in Taiwan, while Omwene et al. [27] identified moderate enrichment of Ag, Cd, Cu, Ni, Pb, and Zn in sediments from the Mustafakemalpaşa River. Similarly, Mao et al. [28] reported extremely high potential ecological risk (PER) at 74% of the sampling sites in river sediments from agricultural areas.
In the Beberibe River basin, Serafim-Filho [29] conducted a ten-year water quality assessment, revealing that five out of seven monitoring stations exhibited noticeable or acute impacts, primarily attributed to erosion and the direct discharge of domestic and industrial sewage into the river. Veras et al. [30] investigated water contamination by pharmaceutical residues, detecting the presence of paracetamol, particularly during the dry season. In the Jaboatão River basin, Dos Santos et al. [31] evaluated the bioaccumulation and toxicity of non-destructive biomarkers and metal accumulation in crocodilians. Barcellos et al. [32] assessed the environmental conditions of the river by analyzing sedimentary organic matter, while Köchling et al. [33] investigated the impact of environmental pollution on the biological diversity and composition of sediment microbial communities.
Several studies have demonstrated the impact of human activities on river sediment quality in urban basins [34,35,36] and agricultural basins [37,38,39]. However, a comparative assessment of the extent of impact between urban and agricultural catchments within the same region remains important. Moreover, since the region has seasonal rainfall, it generates changes in the river’s flow, which can lead to changes in the concentrations and distribution of heavy metals in both basins.
In this context, the objectives of this study were to (a) analyze the distribution of PTEs in bed sediments under high and low flow conditions, comparing them with sediment quality guidelines (SQG) and potential ecological risk (PER); (b) assess the degree of bed sediment contamination in both watersheds using quality indices: Contamination Factor (CF), Enrichment Factor (EF), Pollution Load Index (PLI) and Potential Ecological Risk (PER); (c) determine the level of risk that PTEs pose to biota; and (d) identify the sources of contamination, whether of natural or anthropogenic origin through sequential extraction analysis. Bed sediments act as long-term integrators of contaminant inputs, recording cumulative pollution over extended periods rather than instantaneous conditions. Therefore, the concentrations and fractionation patterns observed in this study reflect medium- to long-term contamination processes rather than short-term fluctuations, making the dataset suitable for environmental assessment and source interpretation.
2. Materials and Methods
2.1. Study Area
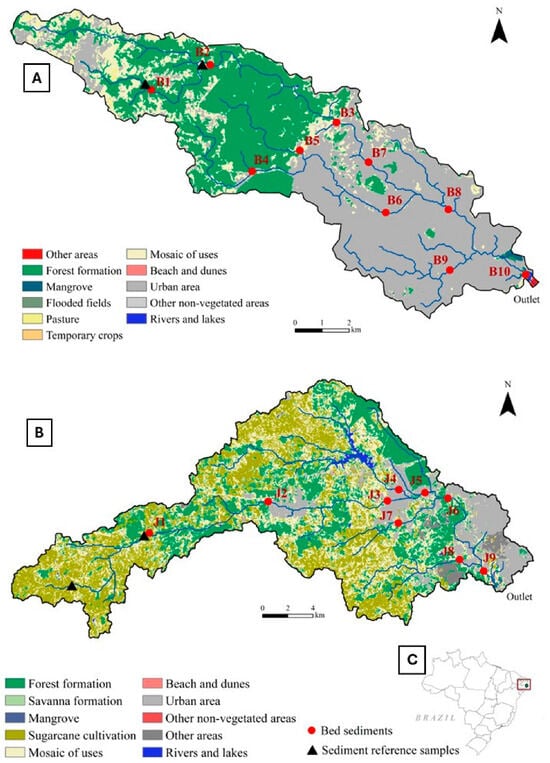
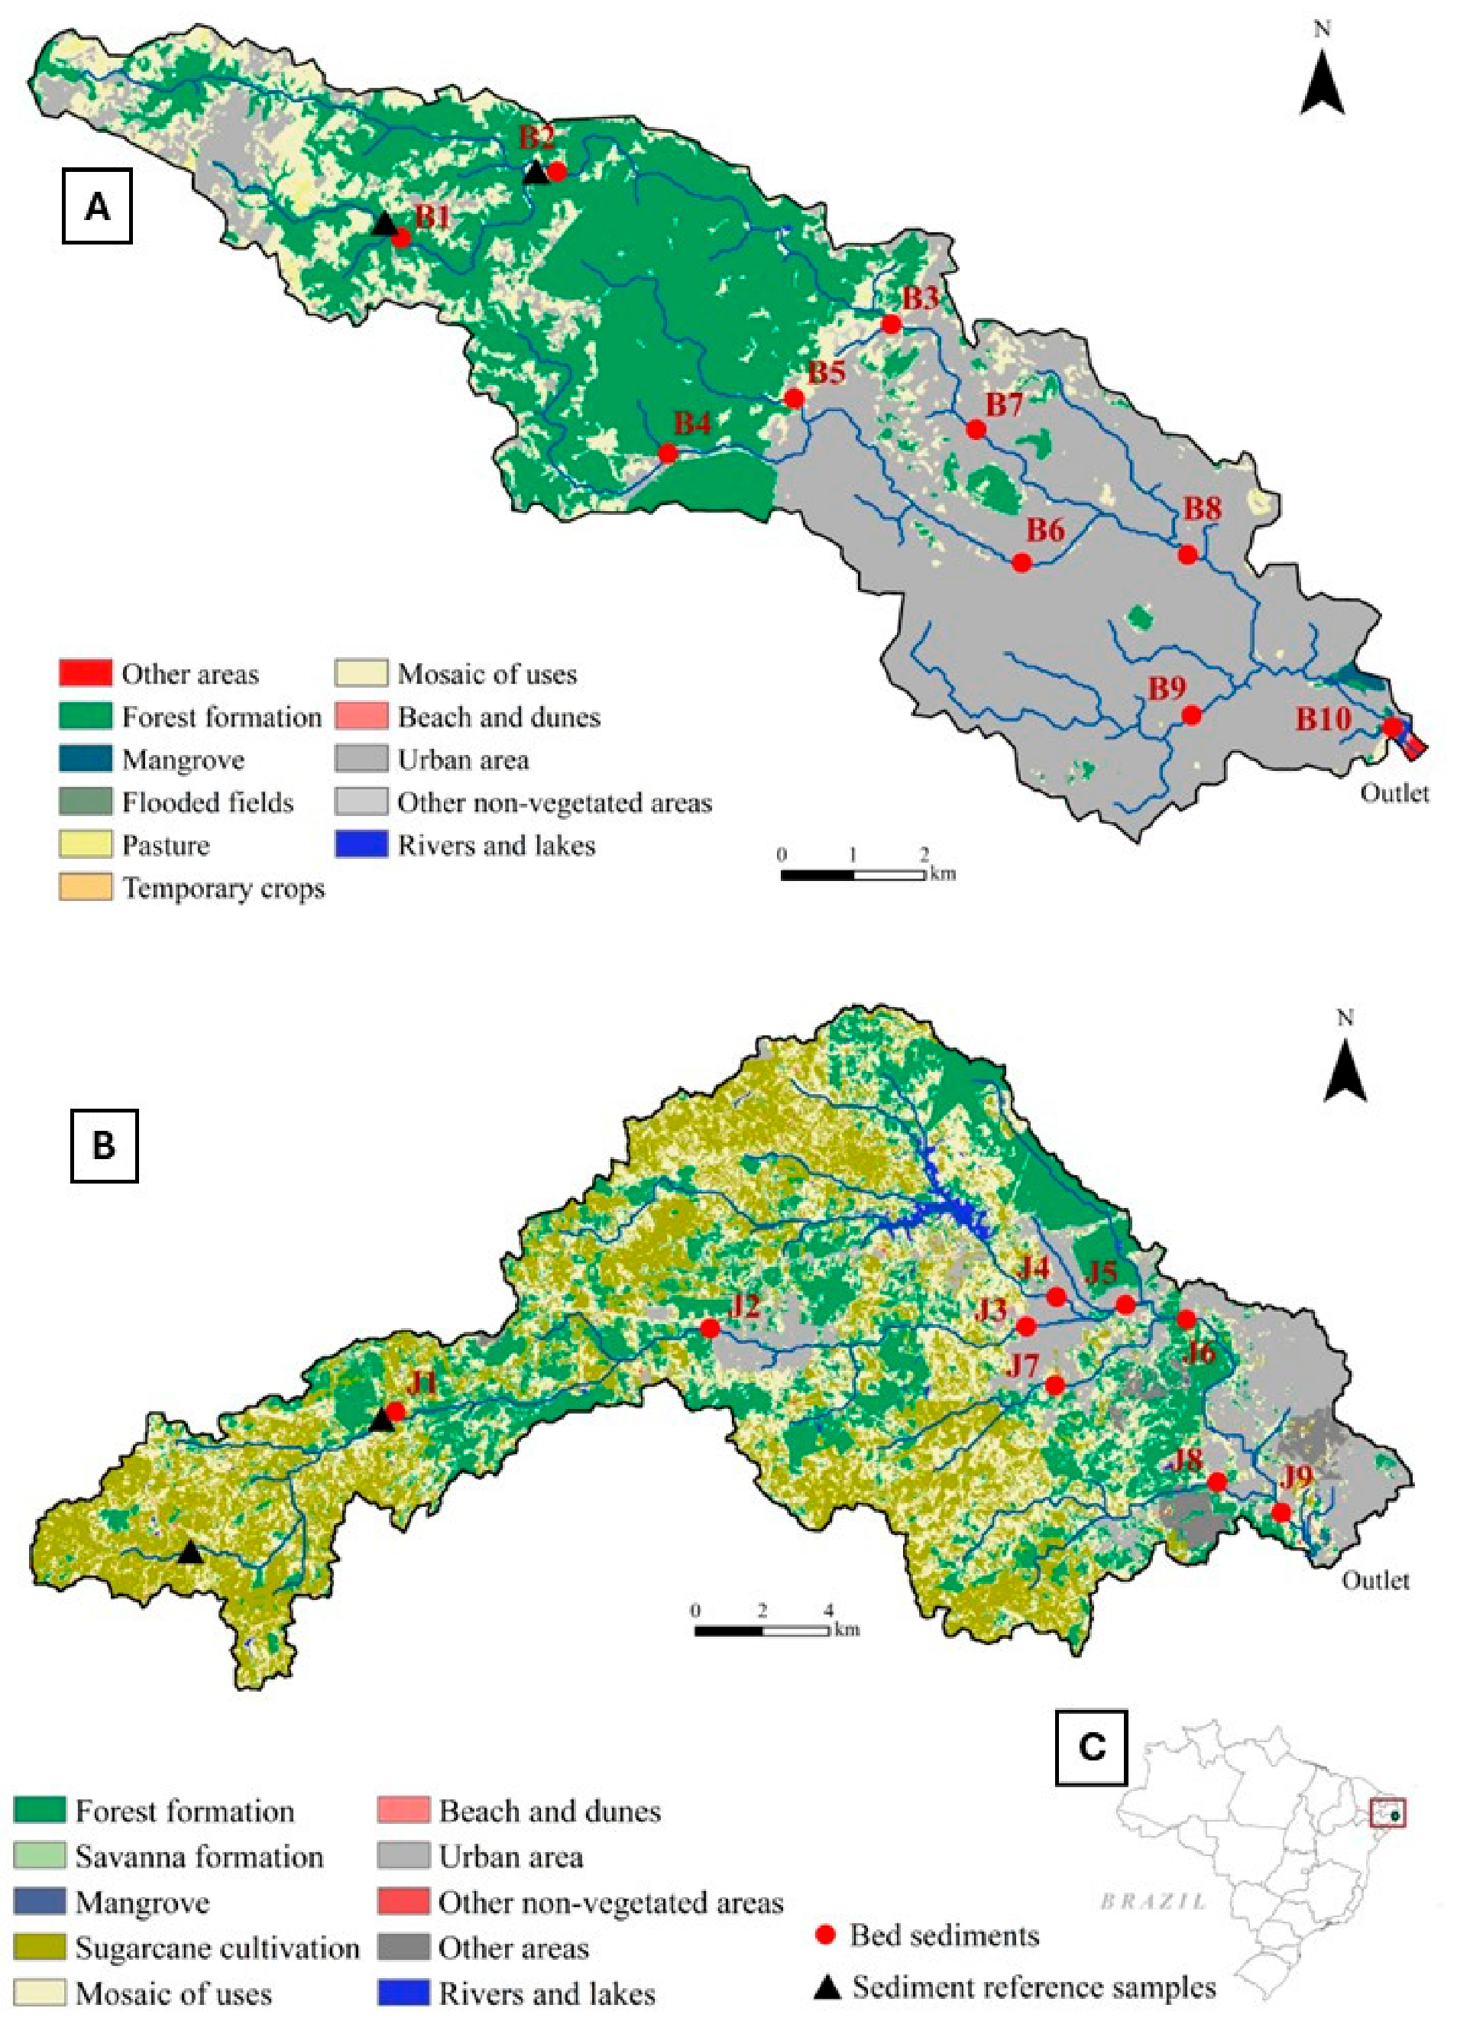
The study was carried out in two coastal watersheds in northeastern Brazil. The Beberibe River watershed (Figure 1A) is located at latitudes 7°56′0″ and 8°3′30″ S and longitudes 34°50′0″ and 35°2′0″ W and has a drainage area of approximately 79 km2. The main watercourse is 19 km long, with much of the upstream course within a semi-conserved area. According to the State Environmental Agency CPRH, during the rainy season (March–August) and dry season (September–February), the watershed has historical average precipitation of 1500 mm and 421 mm, respectively, with an average temperature of 28 °C. The watershed is under a strong anthropogenic influence because it is a predominantly urban watershed, as it crosses the municipalities of Camaragibe, Recife, Olinda, and Paulista. However, upstream, it is part of a protected area. The river’s water is primarily used for public supply but also serves as a receiving body for domestic and industrial effluents. Industrial activities impacting the river include food and beverage production, metallurgy, paper manufacturing, and the perfume industry [40].
Figure 1.
Land use maps of the Beberibe (A) and Jaboatão (B) River basins, showing the location of bed sediment sampling points in each watershed, and (C) the location of the state of Pernambuco in Brazil.
The Jaboatão River watershed (Figure 1B) has a drainage area of 413 km2, between coordinates 8°00′ and 8°14′ S latitude and 34°50′ and 35°15′ W longitude and a length of 75 km of the main watercourse. It covers the municipalities of Cabo de Santo Agostinho, Jaboatão dos Guararapes, Moreno, Recife, São Lourenço da Mata and Vitória de Santo Antão, making it one of the most important watersheds in Greater Recife. Both river basins are located in a predominantly hot and humid climate zone, with an average annual temperature of around 28 °C and an average monthly rainfall of 215 mm in the rainy season and 88 mm in the dry season.
The Jaboatão and Beberibe River watersheds are located in the coastal region of Pernambuco State, northeastern Brazil (Figure 1C). The Jaboatão River watershed is characterized by extensive agricultural areas, predominantly sugarcane cultivation, alongside mangrove ecosystems and urbanized areas. Its waters are primarily used for public supply and irrigation, while also receiving domestic and industrial effluents [40]. In contrast, the Beberibe River watershed is subject to intense anthropogenic pressures due to its predominantly urban setting, extending across the municipalities of Camaragibe, Recife, Olinda, and Paulista. Its waters are mainly used for public supply and also receive domestic and industrial effluents, particularly from the food, beverage, metallurgical, paper, and perfume industries [41]. Furthermore, the watershed has experienced progressive degradation and loss of riparian vegetation, potentially increasing soil erosion and sediment transport into the river system.
The dataset used in this study was obtained as part of the doctoral research conducted by Katerin Manuelita Encina Oliva (first author) at the Federal Rural University of Pernambuco [42]. The present manuscript uses a specific subset of the original dataset, selected according to the objectives of this study. Although these data were previously reported in the doctoral thesis, the present article focuses on a specific aspect of the broader research.
2.2. Sediment Sampling
In both rivers, samples were collected at two distinct times: first in 2021, during the wet season (high flow), and again in 2022, during the dry season (low flow). According to the Pernambucana Water and Climate Agency (APAC), total precipitation in the region during 2021 was approximately 1900 mm in the wet season (April to August) and about 500 mm in the dry season (October to February). The collection points were chosen according to the representative activities of the areas of interest in each river watershed (Figure 1A,B). Ten composite samples were collected from the Beberibe River and nine samples from the Jaboatão River, both at depths of 0 to 10 cm. They were placed in polyethylene bags and transported to a drying room. Samples were collected in two periods, the first during the wet season and the second during the dry season. Two collection points were established in the first third of each watershed for sediment reference samples with minimal anthropogenic interference (Figure 1A,B). The sampling was carried out following the methodology of Silva et al. [6]. These samples were collected only once, under low-flow conditions, using an auger to depths of 50 cm. Subsequently, the samples were separated every 10 cm, and the deepest 10 cm were taken as reference samples (background values) in each basin. These samples were collected closer to the headwaters of each watershed because the downstream reaches are polluted, which limits the reliability of sediment samples collected at a depth of 50 cm as representative background values. It is important to note that these samples adequately represent the pedological and geological diversity of the watersheds and are therefore more appropriate as background references than soil samples collected from preserved areas. The collected samples were placed in polyethylene bags and transported to the laboratory to be air-dried prior to analysis.
2.3. Chemical Analysis
The samples were air-dried and sieved through a stainless-steel sieve with a mesh size of 2 mm. The organic carbon was obtained using the potassium dichromate method [43]. Organic matter content was estimated from organic carbon using a conversion factor of 1.724. Total elemental concentrations for Pb, Zn, Cu, Ni, Cr, Fe, and Mn were determined by optical emission spectrometry (ICP-OES/Optima 7000, PerkinElmer, Shelton, CT, USA), following the digestion method developed by the United States Environmental Protection Agency (USEPA 3052). For total metal digestion, 0.5 g of sediment was placed in Teflon vessels with hydrofluoric acid for 8 h and then digested with concentrated HNO3 and HClO4 at ~180 °C, and then concentrated HCl was added [44]. After digestion, the extracts were transferred to 25 mL certified flasks (NBR ISO/IEC) filled with ultrapure water (Millipore Direct-Q System) and filtered with slow filter paper (Macherey Nagel®, Germany). The glassware was kept in a 5% nitric acid solution for 24 h and then rinsed with distilled water. Quality control involved analyzing the samples in triplicate, performing blank analyses, using high-purity acids, and calibrating and recalibrating the curves with standard reference materials (NIST SMR 2709 San Joaquin Soil, National Institute of Standards and Technology). The recovery rates for the analyzed elements were 95% for Mn, 88% for Zn, 86% for Fe, 67% for Ni, 67% for Pb, and 65% for Cr and Cu.
Two samples for each basin with elevated levels of most of the studied PTEs were selected to perform a sequential extraction analysis in duplicate, following the BCR method proposed by the European Community Reference Bureau. The method made it possible to determine the concentrations of the metals studied in the exchangeable and/or carbonate-bound fraction, the reducible fraction (bound to oxides), the oxidizable fraction (bound to organic matter), and the residual fraction. The BCR method [45] makes it possible to determine the concentrations of PTEs in 4 fractions using successive processes described in Table S1 of the Supplementary Material.
Sequential extraction was performed only on samples exhibiting the highest concentrations of potentially toxic elements, as these best represent contamination hotspots. This approach is analytically justified since BCR fractionation is most informative when applied to sediments with elevated metal levels. Samples with low concentrations would provide limited insight into metal mobility and environmental risk.
2.4. Sediment Contamination Assessment
Geochemical indices:
The contamination factor (CF) was calculated as the ratio of the concentration of each metal in the sediment to the concentration in the reference sample according to the equation:
According to Hakanson [46], contamination was classified as low (CF < 1), moderate (1 < CF < 3), high (3 < CF< 6), and very high (CF > 6).
The enrichment factor (EF) was calculated according to Sucharovà’s equation [47]:
A conservative element was used for geochemical normalization in the calculation of the enrichment factor based on several advantages described in the literature [30,48]. EF values were interpreted as suggested by Sakan et al. [49], where EF < 1 denotes no enrichment; <3 low enrichment; 3–5 moderate enrichment; 5–10 moderately severe enrichment; 10–25 severe enrichment; 25–50 very severe enrichment; and >50 extremely severe enrichment.
The pollution load index (PLI) allows the evaluation of the overall state of contamination in a sample considering all heavy metals simultaneously. It was calculated by the nth root of the CF product [50]:
PLI = (CF1 × CF2 × CF3 × … × CFn)1/n
If PLI > 1, it indicates contamination; if PLI < 1, there is no metal contamination [51].
The potential ecological risk (PER) enables the modeling and numerical estimation of ecotoxicological risks posed by heavy metals to aquatic biota based on the ‘background’ values of the study area. It also considers the biogeochemical behavior and toxicological properties of the metals. The elements included in the study were Cr, Cu, Ni, Pb, and Zn, with toxicological values assigned by Hakanson [46]. PER was calculated as follows:
where
PER: Potential ecological risk.
; potential ecological risk factor of the metal.
contamination factor (CF).
biological toxicity factor:
Cr = 2, Cu = Pb = Ni = 5, Zn = 1.
The method consists of assessing the contamination status and associated toxicological effects to determine a representative index level [3], where PER < 110: low risk; 110 ≤ PER < 200: moderate risk; 200 ≤ PER < 400: considerable risk; > 400: serious risk.
2.5. Sediment Quality Guidelines
To evaluate sediment quality in relation to metals, the Sediment Quality Guidelines (SQG), proposed by the CCME [52] and adopted by Brazilian legislation through CONAMA resolution 454/12 [53], were used for comparative purposes. They determined the Threshold Effect Level (TEL), a value below which adverse effects are rarely expected, and the Probable Effect Level (PEL), a value above which adverse effects are frequently expected.
2.6. Statistical Analysis
The analytical results were evaluated using univariate and multivariate statistical procedures. Descriptive statistics (mean, maximum, minimum, and standard deviation) were used for the univariate methods. The relationship between variables was evaluated using Spearman’s coefficient with a statistical significance of 5% and 1%. A correlation matrix was calculated for PTEs in sediments to establish relationships between metals and determine the common source of metals in the Jaboatão and Beberibe River watersheds. These correlations may reflect the origin and migration of these elements [54]. These analyses were performed using the free software RStudio, version 2023.03.
3. Results and Discussion
3.1. Concentrations of PTEs
In both watersheds, the mean concentrations of heavy metals followed the following order: Mn > Zn > Cr > Cu > Pb > Ni. However, Cr, Cu, and Zn were higher in the predominantly urban Beberibe River watershed. Mn, Ni, and Pb were higher in the Jaboatão River watershed, which has most of its area covered by extensive areas of crops, mainly sugarcane. The Beberibe River watershed receives domestic sewage and industrial effluents, particularly from textile, paint, and metallurgical industries, which may contribute to elevated concentrations of these metals in river sediments. In contrast, the higher metal concentrations observed in the Jaboatão River may be associated with agricultural activities, particularly the long-term application of phosphate fertilizers, micronutrient formulations, and soil amendments [55].
In the Beberibe River watershed (Table 1), the mean concentrations of Mn and Zn were higher in the wet season, by 12% and 19%, respectively, while Cr, Cu, Ni, and Pb were higher in the dry season. Higher metal concentrations during low-flow conditions have also been reported in previous studies and are generally attributed to reduced river discharge, which can favor metal accumulation in sediments [56]. The highest concentrations for most metals were found at points B7 to B10. These points are located within the densely populated areas of Recife and Olinda. Therefore, in these areas, the river receives considerable amounts of sewage and other waste materials (garbage), which at some points accumulate, forming floating garbage mats. In both collection periods, point B10 showed high concentrations of organic matter. The point is located at the mouth of the watershed, so the sediment accumulates pollutants from the different sections of the river, as well as sewage. Wastewater is a complex waste containing various organic compounds and traces of inorganic components such as Cr, Cu, Zn, Ni, Cd, and Pb [57]. During the rainy season, the high organic matter value at point B2 can be attributed to this part of the catchment being in a protected area with dense vegetation (Figure 1A). So, at this point, the river receives a large amount of plant material that accumulates mainly during the dry season.
Table 1.
Total metal concentrations (mg kg−1) in the bed sediment and percentage of organic matter (OM) in the Beberibe watershed.
In the Jaboatão River watershed (Table 2), the mean concentrations of most metals were higher during the wet season, except for Pb. Compared with the dry season, the mean concentrations of Cr, Cu, Mn, Ni, and Zn were approximately 9%, 27%, 11%, 16%, and 39% higher, respectively. These differences may be associated with increased surface runoff and sediment transport during the rainy season, potentially enhancing the delivery of sediment-associated metals from agricultural and other anthropogenic sources to the riverbed. However, as the sampling campaigns were conducted in different years, these variations should be interpreted cautiously, since they may reflect both seasonal and interannual hydrological variability. Point J1 presents high levels of Mn and low levels of OM (<1%), especially during the wet season. The point is located in an area of intensive sugarcane agriculture (Figure 1B) with a long growing season, so large amounts of agricultural products are used yearly to maintain or increase yields. Chemical fertilizers, which may contain micronutrients, can represent a source of contamination in agricultural areas due to constant use, low absorption by plants, and non-degradability [58]. In the present study, elevated Mn concentrations were observed in areas with a long history of sugarcane cultivation. These concentrations exceeded those reported by Silva et al. [6] and Guimarães et al. [59], who found values of 283.38 and 283.4 mg kg−1, respectively, in sediments from watersheds characterized by sugarcane cultivation in the same region and with similar soil parent materials. As for Zn, concentrations increased in the upstream-downstream direction in both watersheds, an expected result due to the high mobility of the metal [60], which could have influenced the distribution and accumulation of the metal downstream of the basin. During the wet season, the highest concentrations of Cr, Ni, and Pb, as well as a high concentration of organic matter, were found at point J8. The point is located in the municipality of Jaboatão, near a company specializing in sewage sludge treatment and waste management.
Table 2.
Total metal concentrations (mg kg−1) in bed sediment and percentage of organic matter (OM) in the Jaboatão watershed.
In the Beberibe River basin, during both sampling periods, samples were obtained with values higher than the TEL for all the studied heavy metals (Table 1), so there is a probability that all the studied PTEs are generating some adverse effect on the aquatic biota. In the wet season, the metals Zn (B9 and B10), Cr (B5), and Cu (B9) presented values higher than the PEL, which usually indicates that these elements are generating adverse effects on the river biota. In the dry season, Cr (B3 and B5) and Cu (B9) again showed values above the PEL. These results indicate that the riverbed sediment may present some degree of risk to biota due to high concentrations, especially of Cr, Cu, and Zn, at some of the collection points, especially B5, B9, and B10. In the Jaboatão River basin, sediment samples were also found with concentrations above the TEL for all the studied PTEs, especially Cr and Cu, which exceeded this value in 89 and 78% of the samples. However, only Cr exceeded the PEL value (90 mg kg−1) in both collection periods, and in the dry season, the Pb value also exceeded the PEL (91.3 mg kg−1). TEL and PEL do not discriminate between natural and anthropogenic sources of PTEs; however, the values were established for Canadian conditions, so it is essential to establish local, site-specific sediment quality guidelines [61,62].
3.2. Assessment of the Degree of Bed Sediment Contamination
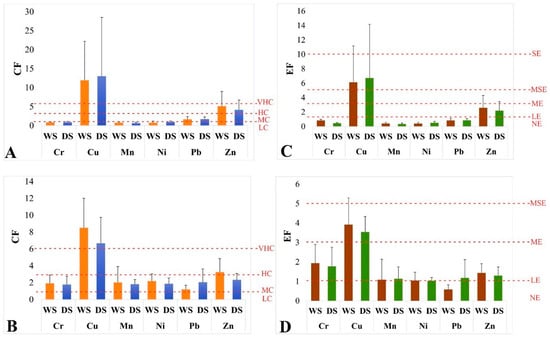
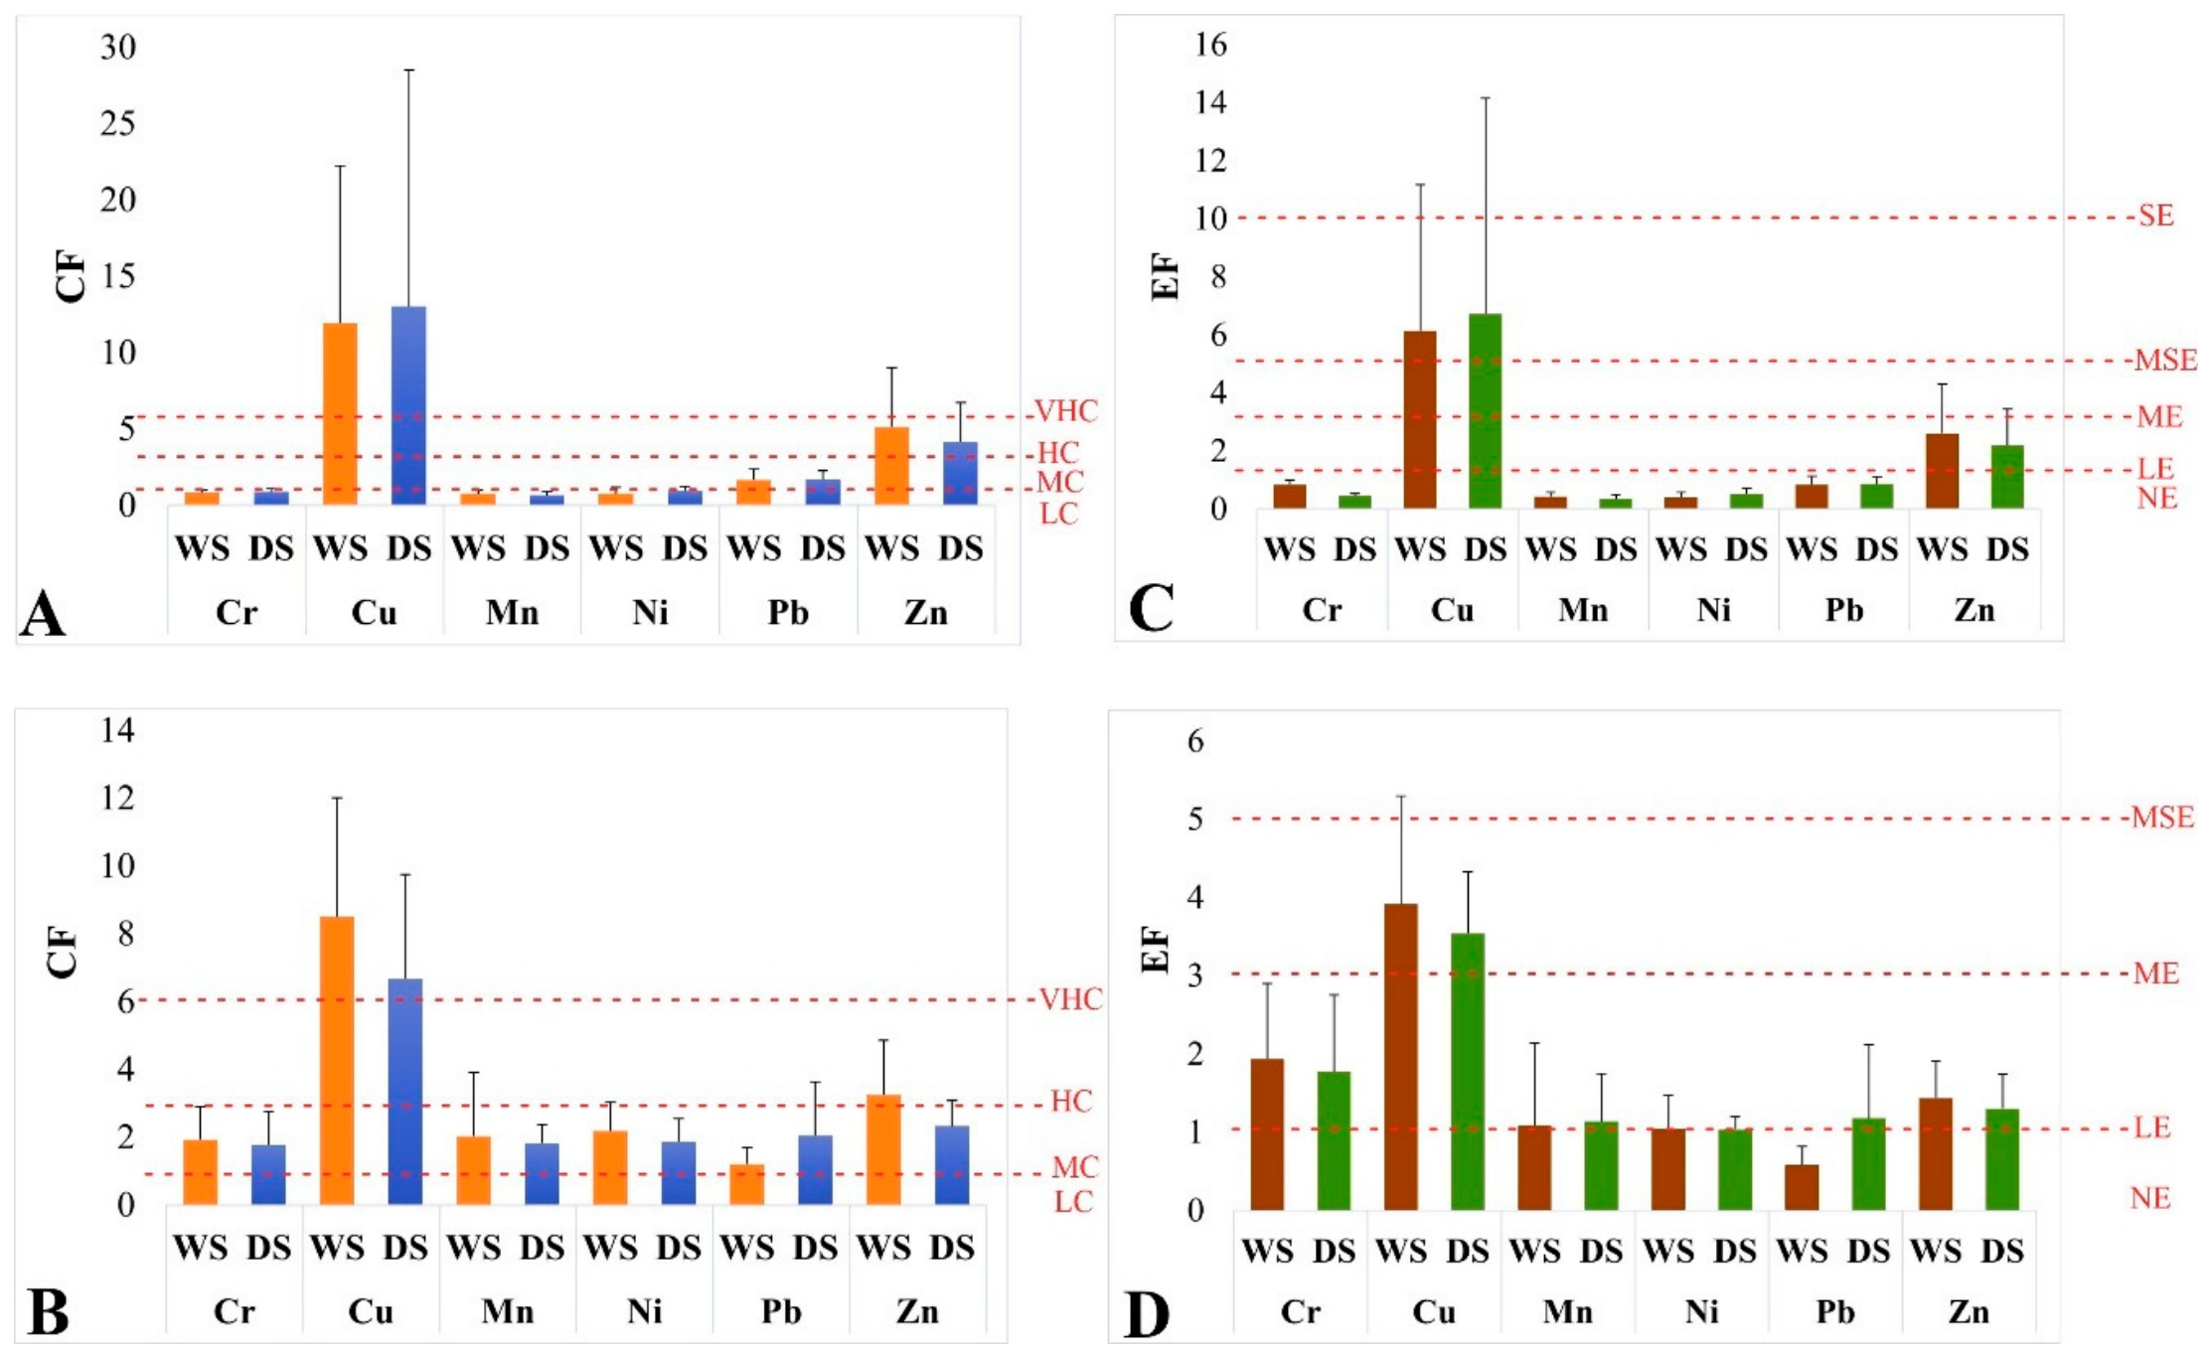
The CF and EF of both basins are shown in Figure 2. The CF results (Figure 2A) for the Beberibe River watershed, a predominantly urban watershed, showed a similar trend in both collection periods in the following descending order: Cu > Zn > Pb > Cr > Mn = Ni in the wet season and Cu > Zn > Pb > Ni > Cr > Mn, in the dry season. The CFs were higher in the low-flow period except for Zn and Mn. In both collection periods, Cr, Mn, and Ni denote low contamination, Pb moderate contamination, Zn considerable contamination, and Cu very high contamination. Notably, 50% of the samples obtained a CF higher than 6 (downstream samples). In the Jaboatão River watershed (Figure 2B), a predominantly agricultural watershed, the mean CFs were in the following order: Cu > Zn > Ni > Mn > Cr > Pb in the wet season and Cu > Zn > Pb > Ni > Mn > Cr in the dry season. Cu showed very high contamination in both periods, whereas Cr, Mn, and Ni exhibited moderate contamination. Pb showed low contamination during the wet season and moderate contamination during the dry season. In the study, Cu showed the highest increase in terms of matrix concentrations (78% of the samples in the first period and 33% in the second period had CF > 6), a result that is related to the high risk to aquatic life that Cu represents, as shown in Figure 2.
Figure 2.
Temporal variation in the Contamination Factor (CF) + standard deviation (SD) and Enrichment Factor (EF) + SD. Contamination factor in the watershed of the Beberibe River (A), Contamination factor in the watershed of the Jaboatão River (B), Enrichment factor in the Beberibe River (C), and enrichment factor in the Jaboatão River (D). WS: wet season, DS: dry season, VHC: very high contamination (CF > 6), HC: high contamination (3 < CF < 6), MC: moderate contamination (1 < CF < 3), LC: low contamination (CF < 1), SE: severe enrichment (>10), MSE: moderately severe enrichment (5–10), ME: moderate enrichment (3–5), LE: low enrichment (<3), and NE: no enrichment (<1).
Similar results were found in the sediment of the Tigris riverbed, Turkey, with moderate to very high contamination factors (CFs). These results were attributed to the upstream copper mine of the watershed [3]. Silva et al. [63] determined moderate contamination by this metal. The authors attributed the results to domestic and industrial wastewater discharges. A similar case occurs in the basins of the present study, mainly in the Beberibe River basin, which receives waste from various industries, untreated domestic waste and considerable amounts of garbage.
The average Enrichment Factor (EF) for the Beberibe River watershed (Figure 2C) was as follows: Cu > Zn > Pb > Cr > Mn > Ni in the wet season and Cu > Zn > Pb > Ni > Cr > Mn in the dry season. The mean enrichment factors for Cr, Mn, Ni, and Pb indicated no enrichment, Zn low enrichment, and Cu moderate enrichment in both collection periods; however, in the case of Cu, 50% and 40% of the samples collected in the first and second periods, respectively, showed moderately severe enrichment. Silva et al. [63] also found moderately severe enrichment for Cu, Zn, and Ni in bed sediments downstream of the Ipojuca River watershed in the same region. Although 80% of the samples presented total Mn concentrations higher than the natural values for Pernambuco soils (160.1 mg kg−1) [64], these represent low contamination, so the EF can be a good tool to distinguish natural from anthropogenic sources [65]. In this case, the concentration of Mn in the reference sample shows values close to the average of the values found throughout the basin (Table 2). Therefore, we can infer that the main source of Mn in this basin is natural and therefore does not represent a significant risk to the environment in the Beberibe River basin. In the Jaboatão River watershed (Figure 2D), the mean EF for Pb in the wet season was <1, indicating no enrichment, whereas Cr showed low enrichment in both periods. Lead (Pb) in the dry season and the metals Zn, Mn, and Ni showed low enrichment in both periods. Only Cu showed moderate enrichment in both periods, and unlike the urban watershed, Cu did not show severe enrichment in 90% of the samples from both collection periods.
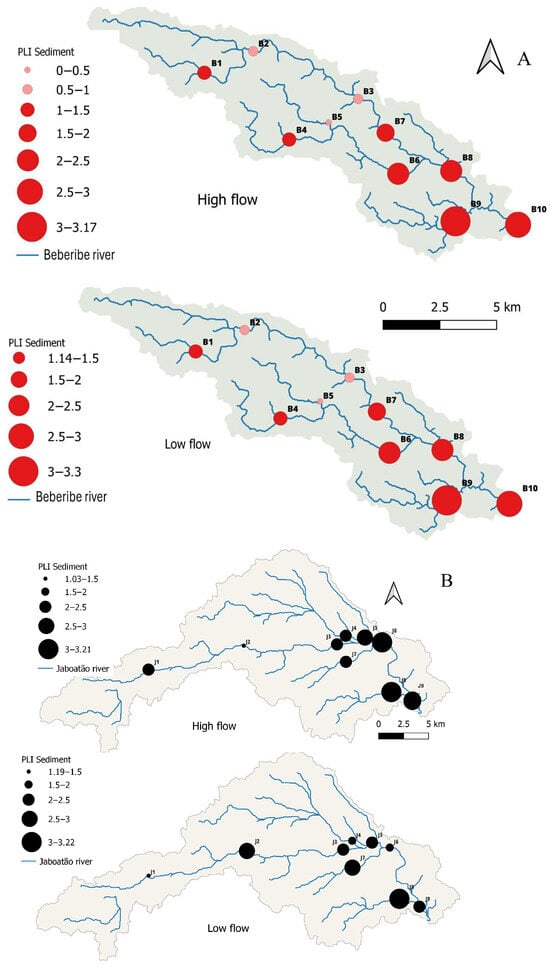
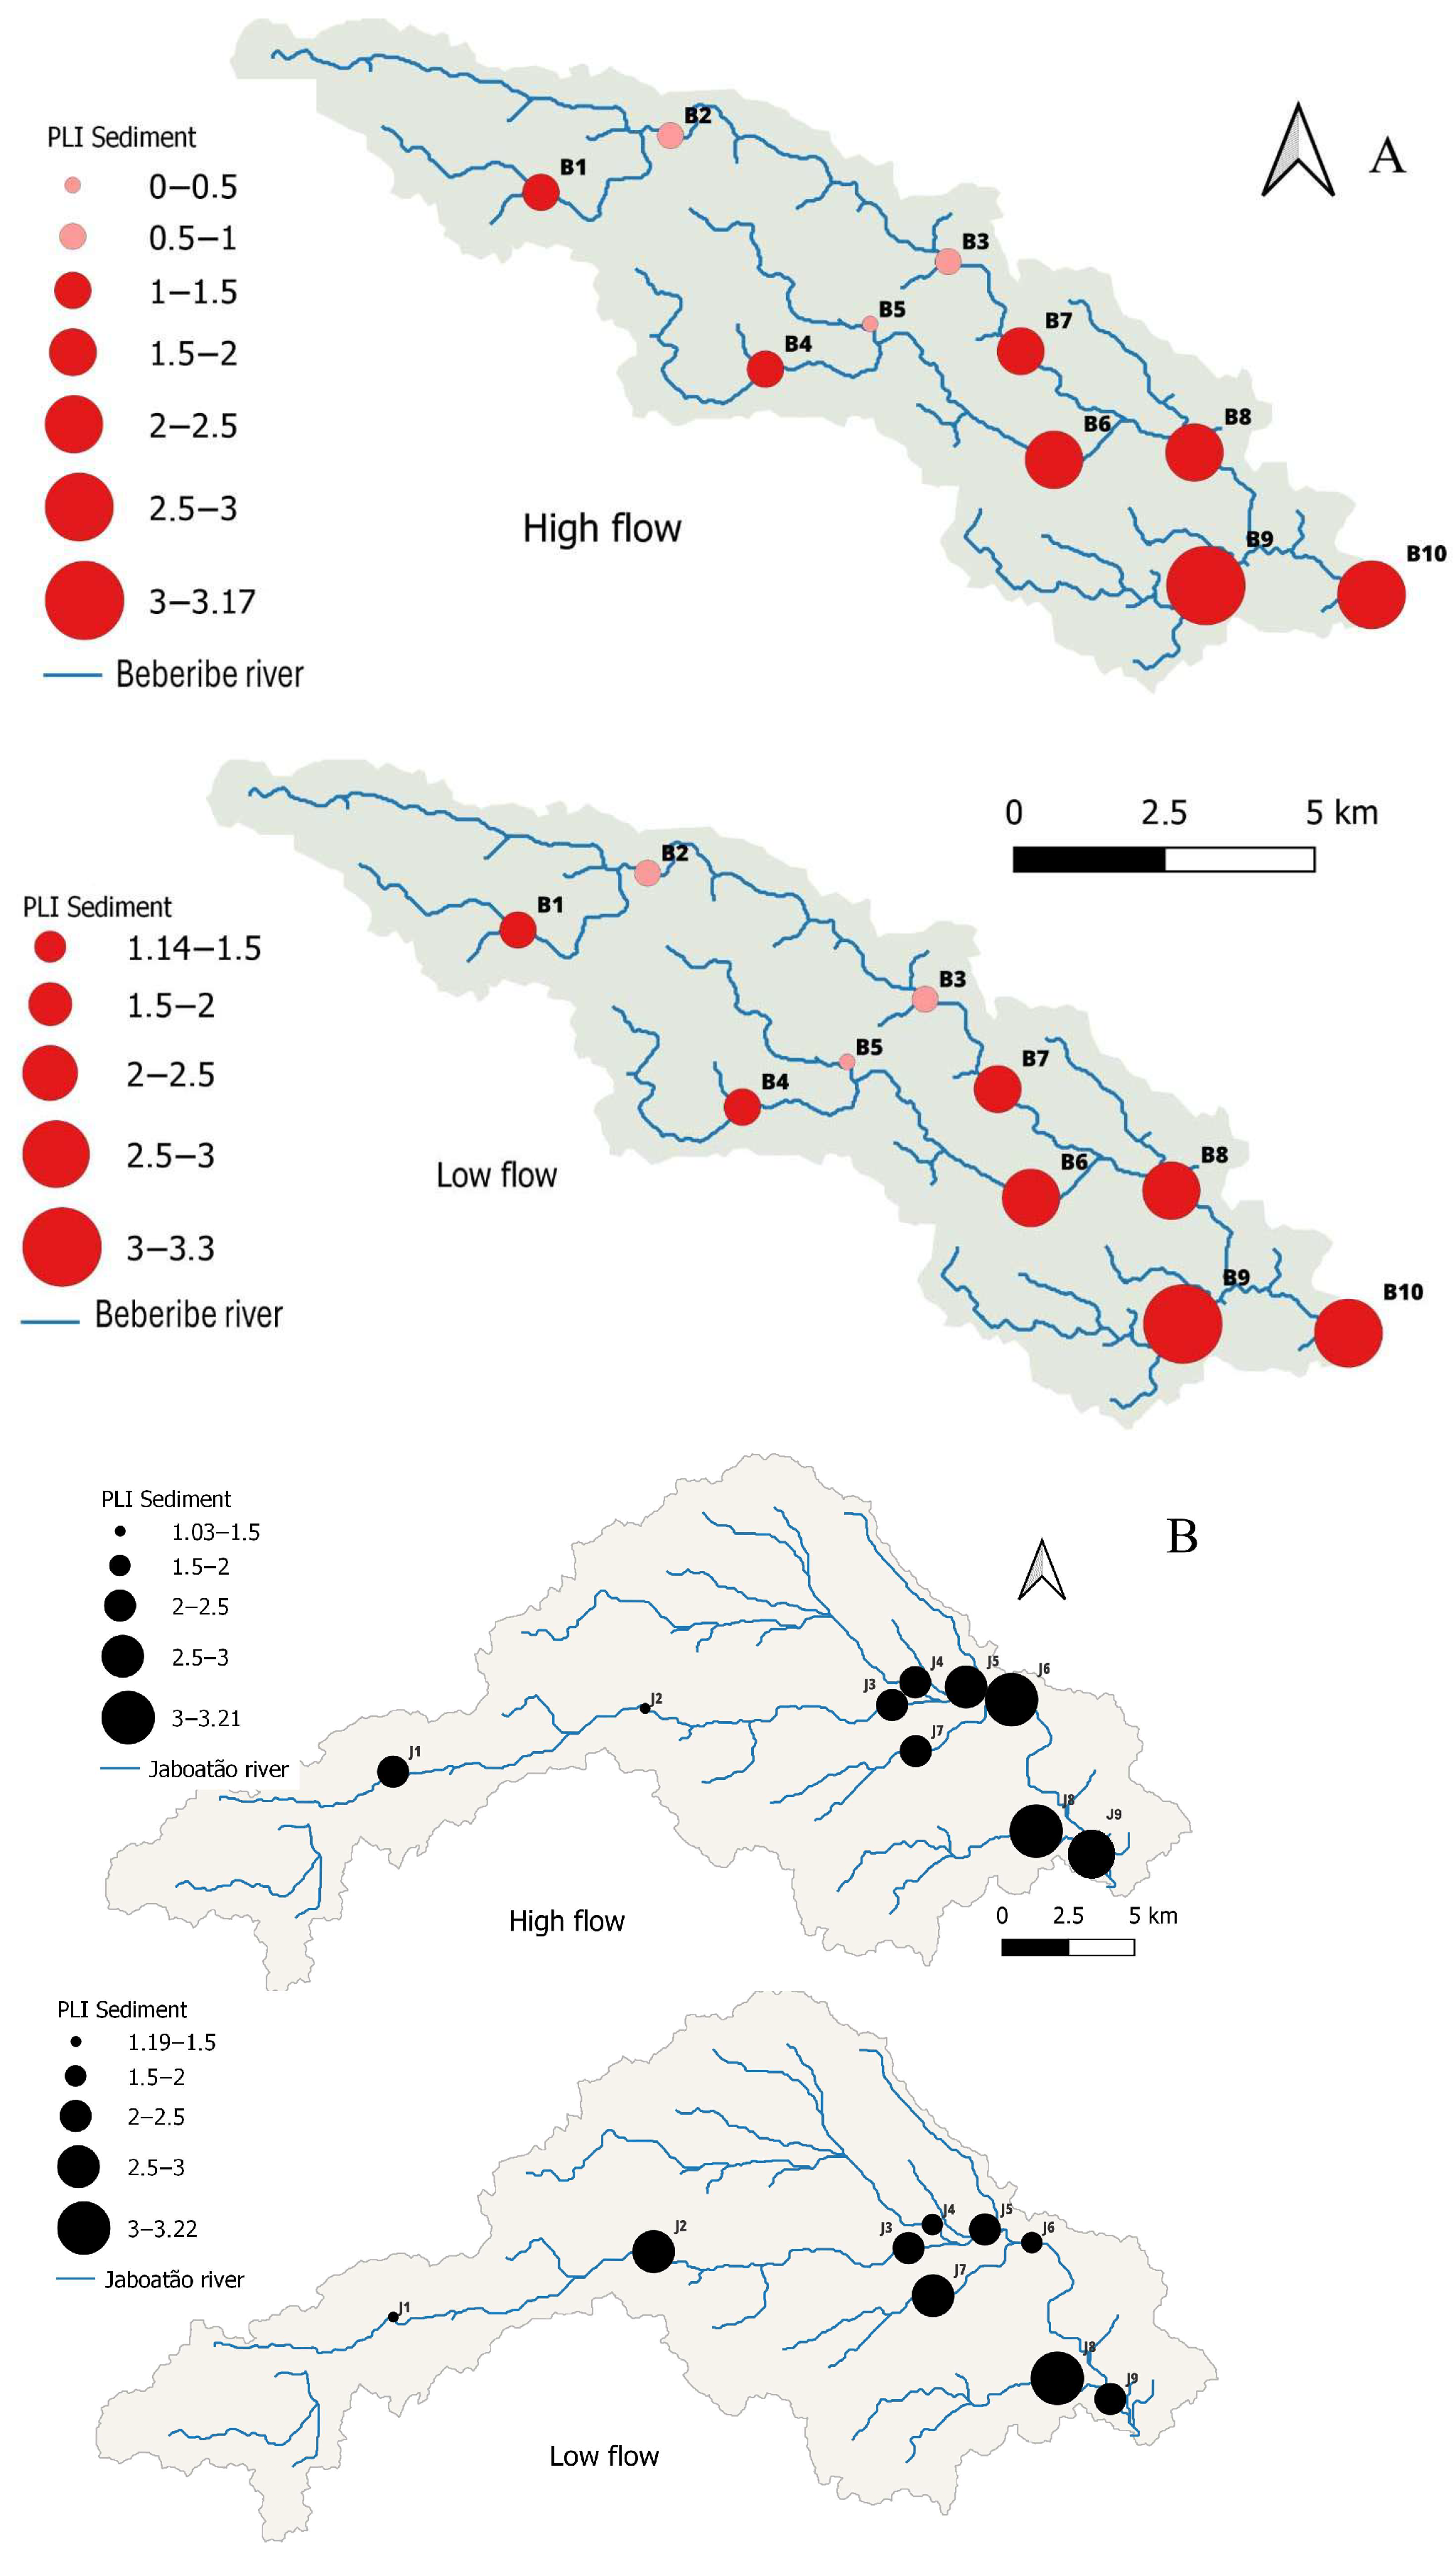
The PLI provides a simple means of assessing the level of contamination, taking into account all potentially toxic metals together [50]. In the watershed of the Beberibe River (Figure 3A), the mean PLI values were higher during low flow, where most sampling points presented contamination, with PLI values ranging from 1.14 to 3.30, confirming once again that in the dry season, there is less water flow, thus favoring the process of sedimentation and accumulation of metals. These values are higher than those found in the sediment of the urban watershed of Bhairab in Bangladesh, with PLI values ranging from 1.024 to 1.160 [3]. Moreover, at both flow levels, PLI values increased downstream. The only exceptions were sampling points B2, B3, and B5 during the wet season in the Beberibe River watershed. Points B2, B3, and B5 in the high flow regime showed PLI values < 1. Point B2 is located upstream in dense vegetation and with little anthropogenic intervention. A high percentage of OM (19.70%) was also found at this point (Table 1). These points are located on the outskirts of a conservation unit, “UCN Beberibe,” so low PLI values are to be expected. The Jaboatão River watershed (Figure 3B) presented contamination in both seasons (PLI > 1), with very similar PLI in both seasons, except for points J1 and J2, which presented marked variations in both periods. Pollution in the watershed can be attributed mainly to the effect of sugarcane cultivation activities, which have a long history and cover most of the watershed area. Kumar et al. [66] also found PLI values >1 in bed sediments collected from a sugarcane-cultivated area in the Nakuvadra-Rakiraki river watershed, Bangladesh, while Islam et al. [19] found PLI values ranging from 2.9 to 13 during winter and 2.4 to 11 during summer in an urban basin in Bangladesh. As in the present study, these studies also showed PLI values above 1, indicating metal contamination in both urban and agricultural basins.
Figure 3.
Spatial distribution of the Pollution Load Index (PLI) of heavy metals in the bed sediment of the Beberibe (A) and Jaboatão (B) river watersheds.
3.3. Potential Ecological Risk (PER)
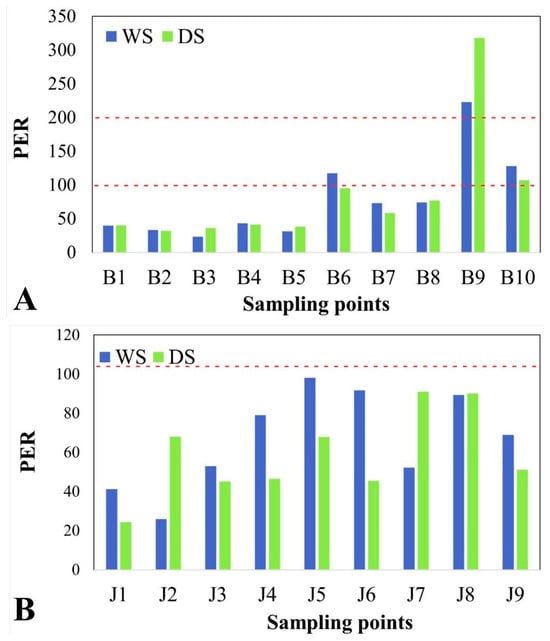
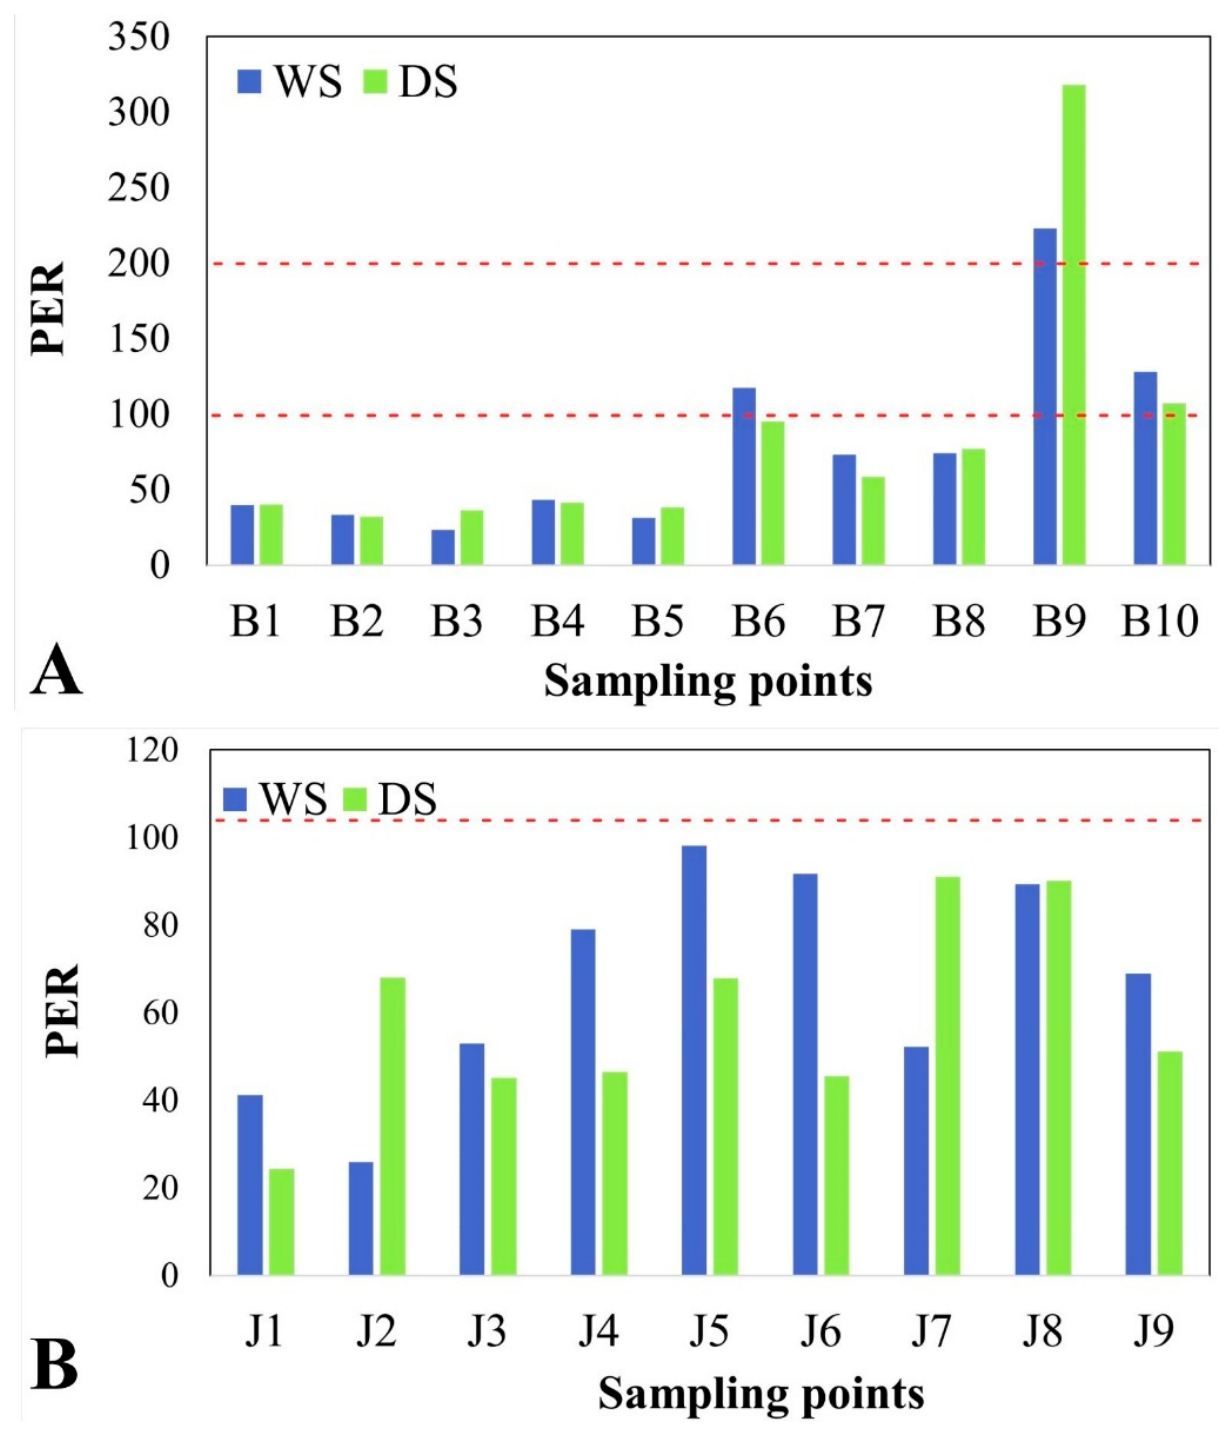
The PER results for both basins are shown in Figure 4. The results of the PER in the Beberibe River watershed (Figure 4A) show that the first points represent a low ecological risk (PER < 110) in both flow periods, an expected result due to the location of these points within preserved areas (B1, B2, and B4), as well as in areas outside the preserved zone, but with low population density (B3). This result is due to the lower mean concentrations for most metals studied (Table 1). Generally, the highest ecological risks for metals were found at points B9 and B10, located downstream of the watershed and under strong anthropogenic influence. Point B10 presented a moderate ecological risk (110 < PER< 200), and point B9 had a considerable ecological risk (200 < PER < 400), a result generated mainly by the elevated concentrations of Cu and Zn (Table 1) in both seasons.
Figure 4.
Potential Ecological Risk (PER) of heavy metals in the bed sediment of the Beberibe (A) and Jaboatão (B) river watersheds. WS: wet season; DS: dry season. The red dashed line at PER 110 indicates the start of moderate risk, and at 200, it indicates the start of considerable risk.
In the Jaboatão River watershed (Figure 4B), all PER values remained below 110, indicating low potential ecological risk across the watershed during both sampling periods. However, point J2 exhibited a relatively higher PER during the dry season, mainly associated with the elevated Pb concentration (167.98 mg kg−1; Table 2), although it remained within the low-risk category. Overall, PER values were generally higher during the wet season, except at points J2 and J7, where increases of 162% and 75%, respectively, were observed during the dry season.
3.4. Geochemical Fractionation of PTEs in Sediments
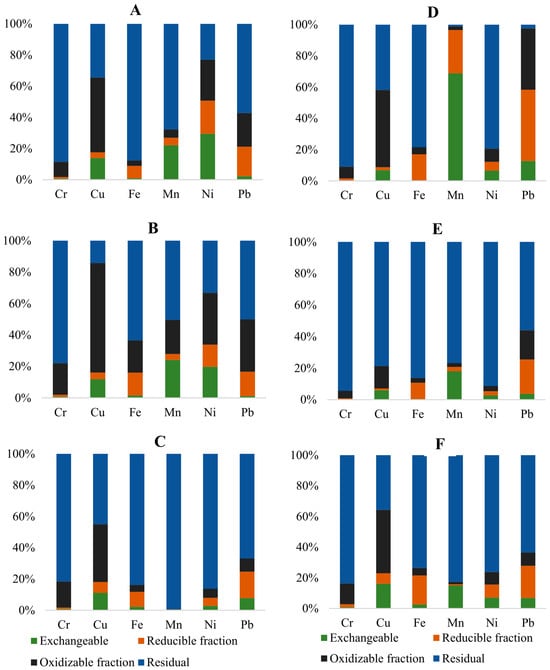
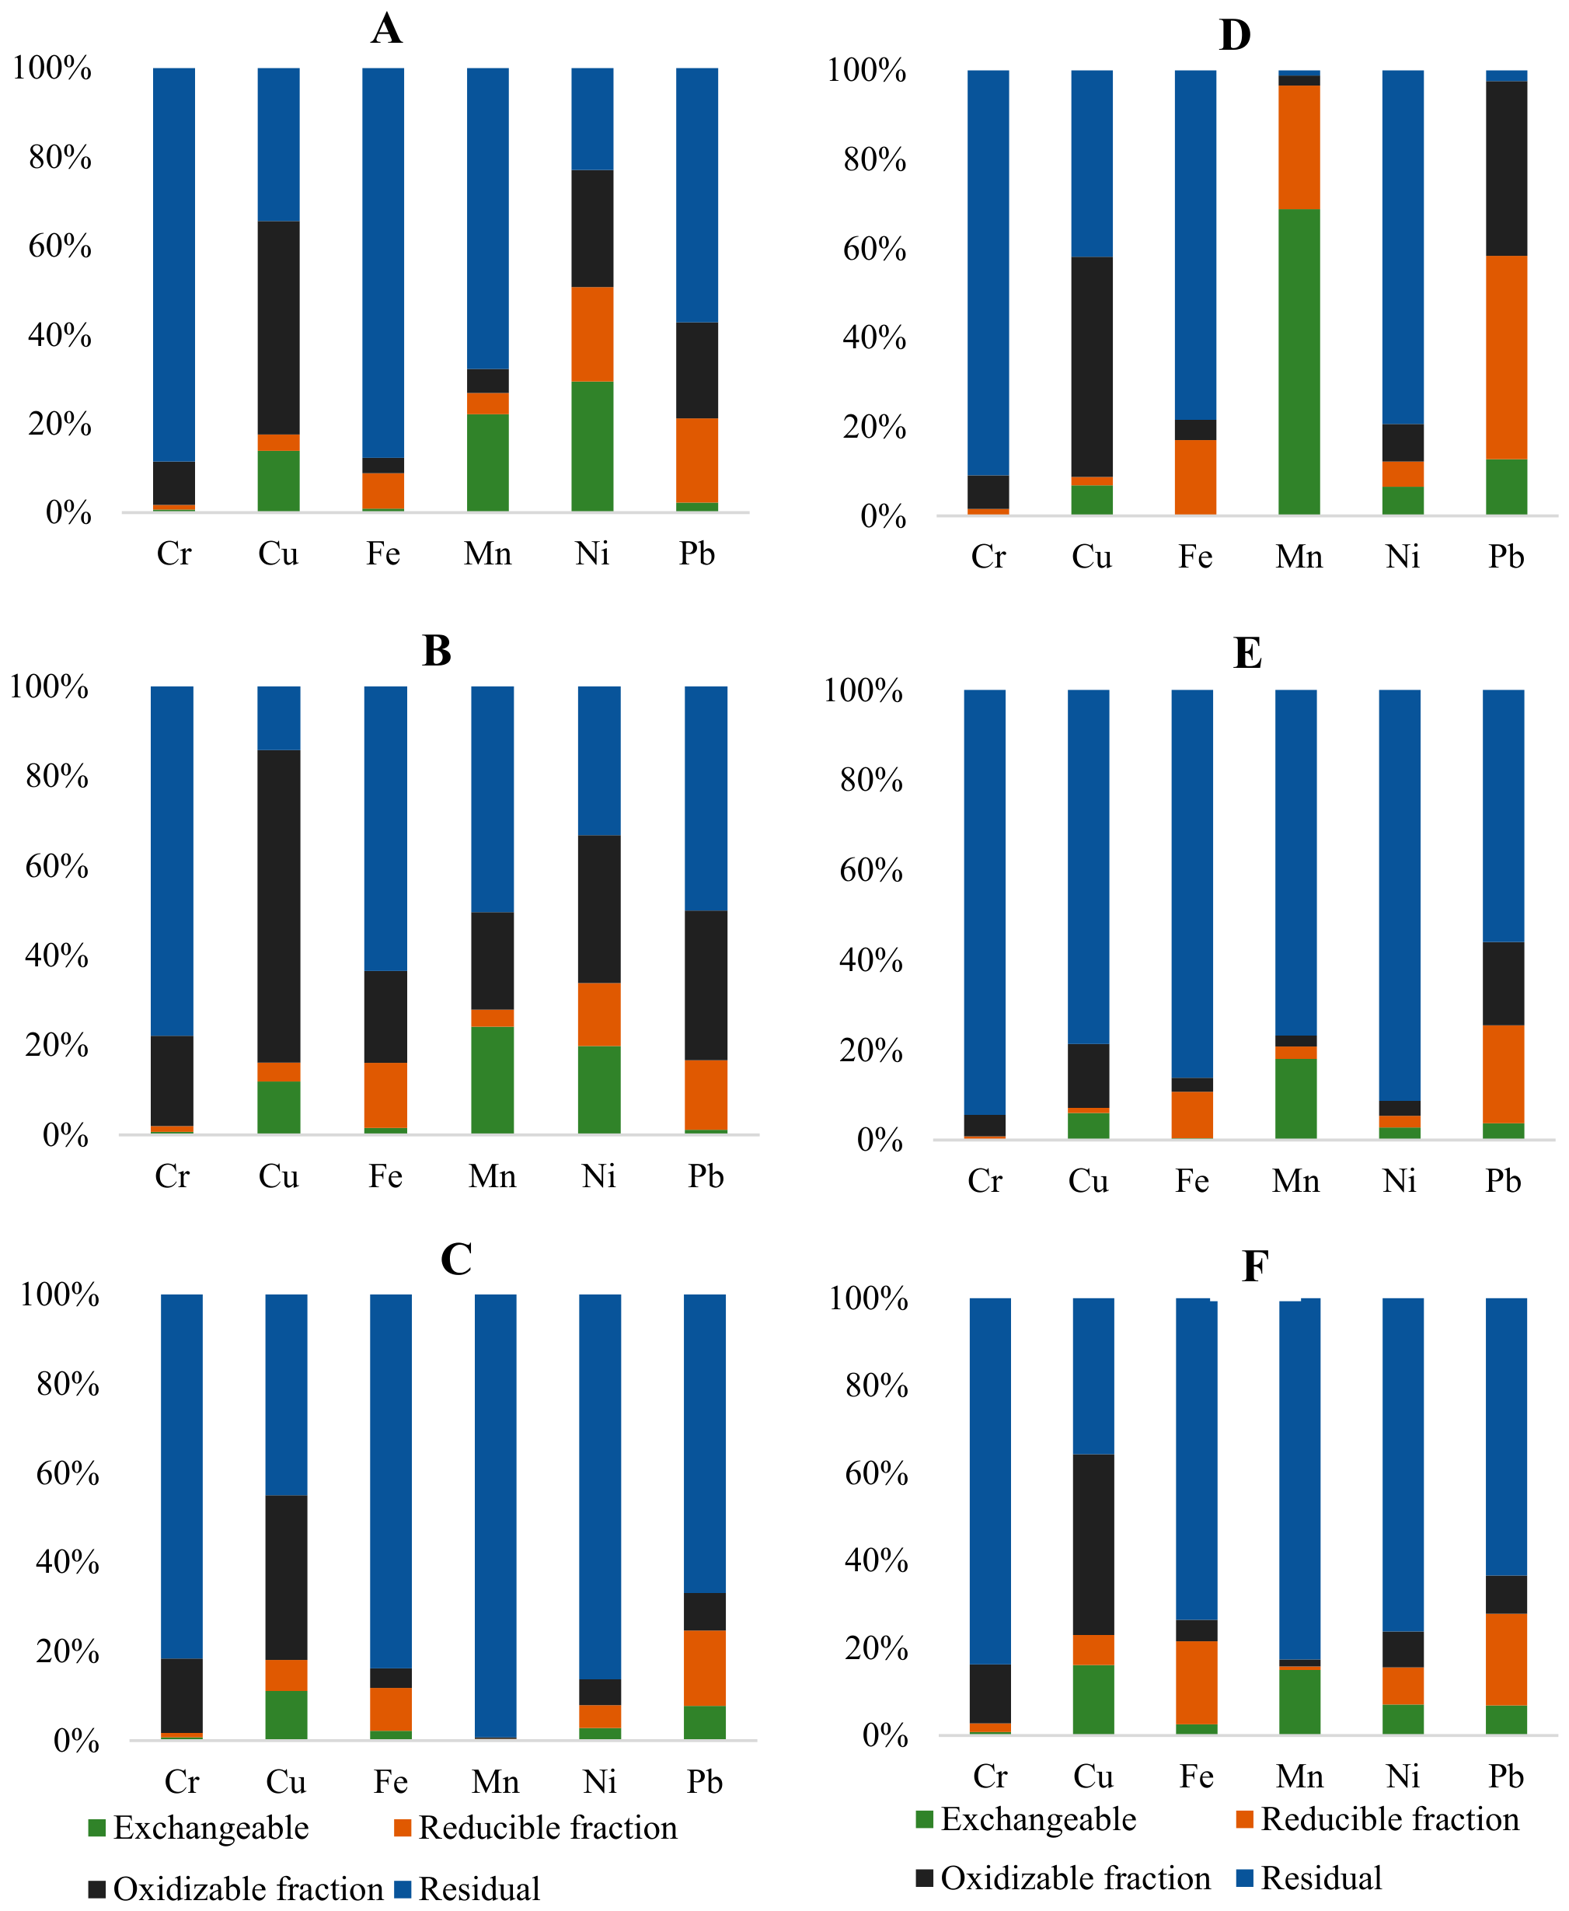
For the sequential extraction analysis (Figure 5), two sampling points with the highest concentrations of most of the studied metals were selected: points B6 (Figure 5A) and B10 (Figure 5B) from the Beberibe River Basin, collected during the wet season, and points J2 (Figure 5D) and J8 (Figure 5E) from the Jaboatão River Basin, collected during the dry season. The analysis was also performed on reference samples from each basin (Figure 5C,F). In the reference samples from both basins, the residual fraction contained the highest proportion of the studied metals, except for Cu in the Jaboatão River Basin, where the greatest proportion was associated with the fraction linked to organic matter. This result is attributed to the observed moderate to high concentrations of organic matter (Table 1 and Table 2).
Figure 5.
Distribution of sequentially extracted fractions of PTEs in sediments from the Beberibe and Jaboatão basins and reference sediment samples. (A): B6 Beberibe, (B): B10 Beberibe, (C): Beberibe reference, (D): J2 Jaboatão, (E): J8 Jaboatão and (F): Jaboatão reference (background).
In the Beberibe River Basin, the primary fraction of Cr and Fe was the residual fraction, which is characterized by maximum stability and represents the lowest environmental risk [33]. This finding aligns with the results shown in Figure 2, where Cr exhibits no enrichment. Manganese (Mn) is nearly absent in the exchangeable fraction of the reference sample, whereas at points B6 and B10, this fraction contains 22% and 24%, respectively. The exchangeable fraction, extractable with weak acid, is of low stability and represents a high environmental risk, as the element could be released under acidic or neutral conditions [67]. The dominant fraction of Cu was the oxidizable fraction at points B6 (48%) and B10 (70%), whereas in the reference sample, the residual fraction predominated. This result may be associated with the affinity of Cu for organic matter, which can favor its retention in the oxidizable fraction. The oxidizable fraction is relatively stable, and the element may be released under strong oxidation of the organic matter. Nickel (Ni) showed an increase in its proportion in the exchangeable, reducible, and oxidizable fractions compared to the reference sample, indicating a higher availability of Ni in its readily available forms at both sampling points. According to Ortega-Calvo et al. [68], the bioavailability of a contaminant is more crucial than its total concentration for risk assessment. It is important to note that bioaccessibility is associated with the fraction of the contaminant rapidly absorbed upon contact with the organism [69]. Lead (Pb) showed an increased concentration in the reducible fraction compared to the reference sample at both collection points. Although the percentage of the most unstable fraction decreased, the element could still become bioavailable under strong oxidation conditions.
In the Jaboatão River Basin, the dynamics of Cr and Fe were similar to those observed in the other basin studied. This aligns with the results shown in Figure 2, where it is evident that Cr is not enriched. At point J2, Cu was predominantly found in the oxidizable fraction (49%), which is bound to organic matter (OM), followed by the residual fraction (41%). A study on sequential extraction in sediments suggested that, during the gradual process, Cu from agricultural areas primarily shifts from the exchangeable and/or carbonate fraction to the Fe and Mn oxide fraction [70]. The exchangeable, reducible, and oxidizable fractions are often regarded as potentially mobile and bioavailable, indicating the presence of anthropogenic impacts [26]. These fractions suggest that pollutants may have been introduced from external sources. At point J2 (Figure 5D), the highest proportion of Mn (69%) is found in the exchangeable fraction, while lead (Pb) is predominantly concentrated in the reducible (25%) and oxidizable (31%) fractions. This point is located upstream, in an area influenced by extensive sugarcane cultivation (Figure 1B), which may suggest that agricultural activities contribute to these metals’ enrichment in the basin [71]. Elevated proportions of Pb in the form of oxides have also been reported in sediments in other studies [72].
3.5. Correlation Analysis
Correlation analyses for both watersheds are shown in Table 3. In the Beberibe watershed, Mn and OM concentrations did not correlate significantly, either positively or negatively, with any of the other elements studied. In contrast, strong positive correlations were observed between Cu and Zn (r = 0.95), Ni and Zn (r = 0.84), and Cu and Ni (r = 0.74), suggesting potentially shared sources or similar geochemical behavior. However, these relationships do not necessarily indicate a common anthropogenic origin. In addition, the significant correlations between Fe and Cr (r = 0.58, p < 0.05) indicate that these elements may have a different, possibly lithogenic, source. This result is consistent with the findings presented in Figure 2C, where Cr showed no enrichment. Both elements exhibited the same trend across the extraction sequence in basins and sampling periods, with their highest concentrations observed in the residual fraction (Figure 5).
Table 3.
Spearman correlation matrix of PTEs and Organic Matter (OM) in the watersheds.
In the Jaboatão watershed, Mn and OM did not correlate with each other or with the other elements studied. Similarly, OM likely originates from wastewater in urban areas. At the same time, Mn possibly comes from agricultural inputs used in upstream sugarcane cultivation, which corroborates the results in Table 3. Similarly, in the Jaboatão River watershed, strong positive correlations were observed between Cu and Zn (r = 0.87), Ni and Zn (r = 0.80), Cu and Ni (r = 0.71), and Cu and Pb (r = 0.70). These relationships suggest potentially shared sources or similar geochemical behavior, although a common anthropogenic origin cannot be conclusively established based on correlation analysis alone. Except for Cu, the metals Ni, Pb, and Zn exhibited low or negligible enrichment in both basins (Figure 2), suggesting a potential positive correlation among their distributions. Finally, Cr correlated significantly with Fe (r = 0.59; p < 0.05), indicating that these elements have a common, possibly lithogenic, source.
4. Limitations of the Study
This study has some limitations that should be considered when interpreting the results. First, wet- and dry-season sampling was conducted in June–July 2021 and January–February 2022, respectively. Since the campaigns took place in different years, the observed differences may reflect both seasonal and interannual variability. Moreover, seasonal comparisons were based on mean concentrations and standard deviations, without formal statistical testing, partly due to the relatively small sample sizes (n = 9–10). Therefore, seasonal patterns should be considered descriptive rather than statistically confirmed.
Background concentrations were estimated using only two sediment samples per watershed, collected near the headwaters, where anthropogenic influence is comparatively lower. The deepest 10-cm interval of the 50-cm sediment cores was used to estimate background values. However, this limited number of samples may not fully represent natural geochemical variability, introducing uncertainty into CF, EF, and PER calculations. Consequently, these indices, particularly in inter-basin comparisons, should be interpreted as semi-quantitative estimates.
The BCR procedure was restricted to four sediment samples (B6, B10, J2, and J8), selected as contamination hotspots due to resource constraints. Thus, the results characterize metal fractionation at selected highly contaminated sites rather than across the entire watersheds. Furthermore, Beberibe samples were collected during the wet season and Jaboatão samples during the dry season, potentially influencing inter-basin comparisons. BCR fractions represent operationally defined geochemical associations and potential metal mobility, rather than direct bioavailability, which was not assessed through bioassays or biological uptake measurements.
The watersheds also present mixed land-use patterns. Although Jaboatão is largely occupied by sugarcane cultivation, urbanized areas are also present, while Beberibe includes urbanized and industrial areas, as well as a relatively protected upper section. Therefore, their comparison reflects differences in predominant anthropogenic pressures rather than a controlled comparison between exclusively agricultural and urban environments. Additionally, sampling sites were purposively selected based on potential contamination sources, and high- and low-flow conditions were defined according to seasonal periods rather than measured discharge or flow velocity. Hydrodynamic processes, including sediment resuspension, coastal erosion, and the removal of fine sediment fractions, were not directly assessed. Accordingly, the results represent the surveyed sites and should not be extrapolated to the entire watersheds.
Metal concentrations were determined by ICP-OES. The extraction recoveries for Cr, Ni, and Pb were relatively low (65–67%), potentially leading to underestimated concentrations and affecting the derived contamination indices. Results below the limit of quantification (LOQ) were reported as “<LOQ” in the tables and assigned a value of zero in the index calculations. These procedures should be considered when interpreting the analytical results and derived indices. Furthermore, CF, EF, PLI, and PER depend on background values, the use of Fe as a normalizing element in EF, and the toxicological coefficients adopted in PER calculations. PLI may mask the contribution of individual metals, while PER does not directly account for metal bioavailability or exposure pathways. Thus, these indices should be interpreted as screening tools rather than absolute measures of environmental risk.
Finally, TEL and PEL are Canadian sediment quality screening guidelines, not regulatory standards specifically established for tropical freshwater environments in Brazil. Exceeding these thresholds indicates a potential for adverse biological effects, rather than confirmed ecological impacts. The study also focused exclusively on six elements (Cr, Cu, Mn, Ni, Pb, and Zn) in bed sediments; other contaminants, such as Cd, As, and Hg, as well as water, suspended sediments, biota, and human health risks, were not investigated. Source identification was primarily based on correlation analysis, without multivariate approaches such as PCA, cluster analysis, or PMF. Therefore, source attribution remains preliminary, and the conclusions are restricted to the elements, matrices, and sampling locations investigated.
5. Conclusions
This study revealed contamination of bed sediments by potentially toxic elements in the Beberibe and Jaboatão River watersheds, with distinct spatial patterns reflecting differences in land use and anthropogenic pressures. Copper (Cu) emerged as the element of greatest concern, exhibiting very high contamination levels and moderate enrichment in both watersheds. The Beberibe River showed particularly elevated contamination in its downstream urban reaches, with the highest potential ecological risks observed at sampling sites B9 and B10.
According to sediment quality guidelines, Cr, Cu, and Zn reached levels potentially harmful to benthic organisms, while sediment quality indices consistently indicated a higher degree of contamination in the urban watershed compared to the agricultural watershed.
In the Jaboatão River watershed, sediment contamination was primarily associated with agricultural activities, although the potential ecological risk remained predominantly low. However, chemical fractionation analysis revealed that certain metals occurred in potentially more mobile and bioavailable forms, indicating that total elemental concentrations alone may not adequately reflect environmental risks. Collectively, these findings highlight the importance of integrating contamination sources, seasonal variability, and metal fractionation into river sediment monitoring to improve ecological risk assessments and support effective pollution management and the protection of aquatic ecosystems.
Overall, the integrated use of concentration data, sediment quality indices, and geochemical fractionation proved effective for distinguishing contamination sources and ecological risks in urban and agricultural watersheds. Future studies should expand the suite of analyzed elements, including Cd, As, and Hg, to provide a more comprehensive assessment of ecological and human health risks in tropical fluvial systems.
Supplementary Materials
The following supporting information can be downloaded at https://www.mdpi.com/article/10.3390/w18222890/s1: Table S1. BCR sequential extraction analytical protocol for 0.5 g of sediment.
Author Contributions
Conceptualization, K.M.E.O., Y.J.A.B.d.S. (Yuri Jacques Agra Bezerra da Silva) and R.C.N.; methodology, K.M.E.O., Y.J.A.B.d.S. (Yuri Jacques Agra Bezerra da Silva), Y.J.A.B.d.S. (Ygor Jacques Agra Bezerra da Silva), R.C.N., A.J.M. and C.W.A.d.N.; resources, Y.J.A.B.d.S. (Yuri Jacques Agra Bezerra da Silva), C.W.A.d.N. and M.O.-C.; writing—original draft preparation, K.M.E.O., L.J.-C., C.N.V. and Y.J.A.B.d.S. (Yuri Jacques Agra Bezerra da Silva); writing—review and editing, K.M.E.O., Y.J.A.B.d.S. (Yuri Jacques Agra Bezerra da Silva), Y.J.A.B.d.S. (Ygor Jacques Agra Bezerra da Silva) and R.C.N.; supervision, Y.J.A.B.d.S. (Yuri Jacques Agra Bezerra da Silva); funding acquisition, Y.J.A.B.d.S. (Yuri Jacques Agra Bezerra da Silva). All authors have read and agreed to the published version of the manuscript.
Funding
This research received the financial support (Process Number 408901/2022-5) from CNPQ (Conselho Nacional de Desenvolvimento Científico e Tecnológico).
Data Availability Statement
All data generated or analyzed during this study are included in this published article; however, if additional information is required, it will be available from the corresponding author upon reasonable request.
Conflicts of Interest
The authors declare no conflicts of interest.
References
- Kahal, A.; El-Sorogy, A.S.; Qaysi, S.; Almadani, S.; Kassem, O.M.; Al-Dossari, A. Contamination and ecological risk assessment of the Red Sea coastal sediments, southwest Saudi Arabia. Mar. Pollut. Bull. 2020, 154, 111125. [Google Scholar] [CrossRef] [Scilit] [PubMed]
- Lemessa, G.; Gabbiye, N.; Alemayehu, E. Waste to resource: Utilization of waste bagasse as an alternative adsorbent to remove heavy metals from wastewaters in sub-Saharan Africa: A review. Water Pract. Technol. 2023, 18, 393–407. [Google Scholar] [CrossRef] [Scilit]
- Vu, C.T.; Lin, C.; Shern, C.C.; Yeh, G.; Le, V.G.; Tran, H.T. Contamination, ecological risk and source apportionment of heavy metals in sediments and water of a contaminated river in Taiwan. Ecol. Indic. 2017, 82, 32–42. [Google Scholar] [CrossRef] [Scilit]
- Sagar, M.V.; Joseph, S.; Ashok, A.; Sheela, A.M.; Kumar, A. Assessment of heavy metal contamination and geochemical characterization of sediments in Kadinamkulam-Anchuthengu Lake a tropical coastal wetland system in south west coast of India. Reg. Stud. Mar. Sci. 2025, 85, 104160. [Google Scholar] [CrossRef] [Scilit]
- Varol, M. Assessment of heavy metal contamination in sediments of the Tigris River (Turkey) using pollution indices and multivariate statistical techniques. J. Hazard. Mater. 2011, 195, 355–364. [Google Scholar] [CrossRef] [Scilit] [PubMed]
- Silva, Y.J.A.B.; do Nascimento, C.W.A.; da Silva, Y.J.A.B.; Amorim, F.F.; Cantalice, J.R.B.; Singh, V.P.; Collins, A.L. Bed and suspended sediment-associated rare earth element concentrations and fluxes in a polluted Brazilian river system. Environ. Sci. Pollut. Res. 2018, 25, 34426–34437. [Google Scholar] [CrossRef] [Scilit] [PubMed]
- Khan, M.B.; Dai, X.; Ni, Q.; Zhang, C.; Cui, X.; Lu, M.; Deng, M.; Yang, X.; He, Z. Toxic metal pollution and ecological risk assessment in sediments of water reservoirs in Southeast China. Soil Sediment. Contam. 2019, 28, 695–715. [Google Scholar] [CrossRef] [Scilit]
- Islam, M.D. Preliminary assessment of trace elements in surface and deep waters of an urban river (Korotoa) in Bangladesh and associated health risk. Environ. Sci. Pollut. Res. 2021, 28, 29287–29303. [Google Scholar] [CrossRef] [Scilit] [PubMed]
- Zhang, C.; Shan, B.; Tang, W.; Wang, C.; Zhang, L. Identifying sediment-associated toxicity in rivers affected by multiple pollutants from the contaminant bioavailability. Ecotoxicol. Environ. Saf. 2019, 171, 84–91. [Google Scholar] [CrossRef] [Scilit] [PubMed]
- Xia, F.; Qu, L.; Wang, T.; Luo, L.; Chen, H.; Dahlgren, R.A.; Zhang, M.; Mei, K.; Huang, H. Distribution and source analysis of heavy metal pollutants in sediments of a rapidly developing urban river system. Chemosphere 2018, 207, 218–228. [Google Scholar] [CrossRef] [Scilit] [PubMed]
- Zhao, G.; Ye, S.; Yuan, H.; Ding, X.; Wang, J. Surface sediment properties and heavy metal pollution assessment in the Pearl River Estuary, China. Environ. Sci. Pollut. Res. 2017, 24, 2966–2979. [Google Scholar] [CrossRef] [Scilit] [PubMed]
- Favarin, J.L.; Marini, J.P. Importância dos Micronutrientes Para a Produção de Grãos; Sociedade Nacional da Agricultura: Rio de Janeiro, Brazil, 2000; Available online: https://sna.agr.br (accessed on 10 March 2023).
- Zhao, K.; Wang, Q.; Qian, S.; Li, F. Spatial and temporal distribution characteristics of antibiotics and heavy metals in the Yitong River basin and ecological risk assessment. Sci. Rep. 2023, 13, 4202. [Google Scholar] [CrossRef] [Scilit] [PubMed]
- Liu, R.; Bao, K.; Yao, S.; Yang, F.; Wang, X. Ecological risk assessment and distribution of potentially harmful trace elements in lake sediments of Songnen Plain, NE China. Ecotoxicol. Environ. Saf. 2018, 163, 117–124. [Google Scholar] [CrossRef] [Scilit] [PubMed]
- Varol, M.; Canpolat, Ö.; Eriş, K.K.; Çağlar, M. Trace metals in core sediments from a deep lake in eastern Turkey: Vertical concentration profiles, eco-environmental risks and possible sources. Ecotoxicol. Environ. Saf. 2020, 189, 110060. [Google Scholar] [CrossRef] [Scilit] [PubMed]
- Rashid, A.; Schutte, B.J.; Ulery, A.; Deyholos, M.K.; Sanogo, S.; Lehnhoff, E.A.; Beck, L. Heavy metal contamination in agricultural soil: Environmental pollutants affecting crop health. Agronomy 2023, 13, 1521. [Google Scholar] [CrossRef] [Scilit]
- Heckmann, T.; Cavalli, M.; Cerdan, O.; Foerster, S.; Javaux, M.; Lode, E.; Smetanová, A.; Brardinoni, F. Indices of sediment connectivity: Opportunities, challenges and limitations. Earth-Sci. Rev. 2018, 187, 77–108. [Google Scholar] [CrossRef] [Scilit]
- Ali, M.; Ali, M.M.; Ali, M.L.; Proshad, R.; Islam, S.; Rahman, Z.; Tusher, T.R.; Kormoker, T.; Al, M.A. Heavy metal concentrations in commercially valuable fishes with health hazard inference from Karnaphuli River, Bangladesh. Hum. Ecol. Risk Assess. 2019, 26, 2646–2662. [Google Scholar] [CrossRef] [Scilit]
- Islam, M.S.; Proshad, R.; Ahmed, S. Ecological risk of heavy metals in sediment of an urban river in Bangladesh. Hum. Ecol. Risk Assess. 2018, 24, 699–720. [Google Scholar] [CrossRef] [Scilit]
- Lian, M.; Wang, J.; Sun, L.; Xu, Z.; Tang, J.; Yan, J.; Zeng, X. Profiles and potential health risks of heavy metals in soil and crops from the watershed of Xi River in Northeast China. Ecotoxicol. Environ. Saf. 2019, 169, 442–448. [Google Scholar] [CrossRef] [Scilit] [PubMed]
- Rodrigues, M.F.; Reichert, J.M.; Burrow, R.A.; Flores, E.M.M.; Minella, J.P.G.; Rodrigues, L.A.; Oliveira, J.S.S.; Cavalcante, R.B.L. Coarse and fine sediment sources in nested watersheds with eucalyptus forest. Land Degrad. Dev. 2018, 29, 2237–2253. [Google Scholar] [CrossRef] [Scilit]
- He, Y.; Men, B.; Yang, X.; Li, Y.; Xu, H.; Wang, D. Relationship between heavy metals and dissolved organic matter released from sediment by bioturbation/bioirrigation. J. Environ. Sci. 2019, 75, 216–223. [Google Scholar] [CrossRef] [Scilit] [PubMed]
- Wu, Z.; Zhang, L.; Xia, T.; Jia, X.; Wang, S. Heavy metal pollution and human health risk assessment at mercury smelting sites in Wanshan district of Guizhou Province, China. RSC Adv. 2020, 10, 23066–23079. [Google Scholar] [CrossRef] [Scilit] [PubMed]
- Ahmad, W.; Alharthy, R.D.; Zubair, M.; Ahmed, M.; Hameed, A.; Rafique, S. Toxic and heavy metals contamination assessment in soil and water to evaluate human health risk. Sci. Rep. 2021, 11, 17006. [Google Scholar] [CrossRef] [Scilit] [PubMed]
- Radomirović, M.; Miletić, A.; Onjia, A. Accumulation of heavy metal (loid) s and polycyclic aromatic hydrocarbons in the sediment of the Prahovo Port (Danube) and associated risks. Environ. Monit. Assess. 2023, 195, 323. [Google Scholar] [CrossRef] [Scilit] [PubMed]
- Ke, X.; Gui, S.; Huang, H.; Zhang, H.; Wang, C.; Guo, W. Ecological risk assessment and source identification for heavy metals in surface sediment from the Liaohe River protected area, China. Chemosphere 2017, 175, 473–481. [Google Scholar] [CrossRef] [Scilit] [PubMed]
- Omwene, P.I.; Öncel, M.S.; Çelen, M.; Kobya, M. Heavy metal pollution and spatial distribution in surface sediments of Mustafakemalpaşa stream located in the world’s largest borate basin (Turkey). Chemosphere 2018, 208, 782–792. [Google Scholar] [CrossRef] [Scilit] [PubMed]
- Mao, L.; Liu, L.; Yan, N.; Li, F.; Tao, H.; Ye, H.; Wen, H. Factors controlling the accumulation and ecological risk of trace metal(loid)s in river sediments in agricultural field. Chemosphere 2020, 243, 125359. [Google Scholar] [CrossRef] [Scilit] [PubMed]
- Serafim-Filho, G.L. Bacia Hidrográfica do Rio Beberibe: Um Estudo de Caso em Perícia; Editora Livro Rápido: Olinda, Brazil, 2019. [Google Scholar]
- Veras, T.B.; de Paiva, A.L.R.; Duarte, M.M.M.B.; Napoleão, D.C.; Cabral, J.J.D.S.P. Analysis of the presence of anti-inflammatories drugs in surface water: A case study in Beberibe river-PE, Brazil. Chemosphere 2019, 222, 961–969. [Google Scholar] [CrossRef] [Scilit]
- Dos Santos, R.L.; Mariz, C.F.; Mascarenhas-Júnior, P.B.; Leitão, R.S.; Dos Santos, E.M.; Sousa, J.M.; Martins, P.S. Avaliação Não Destrutiva da Bioacumulação de Metais e Biomarcadores Bioquímicos no Sangue do Jacaré-de-focinho-largo (Caiman latirostris) do Nordeste do Brasil. Environ. Toxicol. Chem. 2024, 43, 878–895. [Google Scholar] [CrossRef] [Scilit] [PubMed]
- Barcellos, R.L.; Flores-Montes, M.J.; Alves, T.M.; Camargo, P.B. Processos sedimentares modernos e variações sazonais da matéria orgânica em um estuário tropical urbano, Rio Jaboatão (PE), Brasil. J. Coast. Res. 2016, 75, 38–42. [Google Scholar] [CrossRef] [Scilit]
- Köchling, T.; Sanz, J.L.; Galdino, L.; Florencio, L.; Kato, M.T. Impacto da poluição na diversidade microbiana de um rio tropical em uma região urbanizada do nordeste do Brasil. Int. Microbiol. 2017, 20, 11–24. [Google Scholar] [CrossRef] [Scilit] [PubMed]
- Liao, K.; Li, W.; Huang, Z.; Lin, S.; Fu, L.; Liu, W.; Fang, H.; Deng, H. Comprehensive evaluation of the distribution, transport and ecological risk of heavy metals in intra-urban river sediments using high-resolution techniques. Environ. Pollut. 2024, 361, 124808. [Google Scholar] [CrossRef] [Scilit] [PubMed]
- Mohajane, C.; Manjoro, M. Sediment-associated heavy metal contamination and potential ecological risk along an urban river in South Africa. Heliyon 2022, 8, e12499. [Google Scholar] [CrossRef] [Scilit] [PubMed]
- Wang, F.; Dong, W.; Zhao, Z.; Wang, H.; Li, W.; Chen, G.; Wang, F.; Zhao, Y.; Huang, J.; Zhou, T. Heavy metal pollution in urban river sediment of different urban functional areas and its influence on microbial community structure. Sci. Total Environ. 2021, 778, 146383. [Google Scholar] [CrossRef] [Scilit] [PubMed]
- Sultana, S.; Sultana, N.; Moniruzzaman, M.; Dastagir, M.R.; Hossain, M.K. Unmasking heavy metal contamination: Tracing, risk estimating and source fingerprinting from coastal sediments of the Payra River in Bangladesh. Mar. Pollut. Bull. 2025, 211, 117455. [Google Scholar] [CrossRef] [Scilit] [PubMed]
- Skorbiłowicz, E.; Ofman, P.; Skorbiłowicz, M.; Sidoruk, M.; Tarasiuk, U. Geochemical Assessment of Heavy Metal Distribution in Bug River Sediments, Poland: The Impacts of Urbanization and Agricultural Practices. Water 2024, 16, 1573. [Google Scholar] [CrossRef] [Scilit]
- Kazberuk, W.; Szulc, W.; Rutkowska, B. Use bottom sediment to agriculture—Effect on plant and heavy metal content in soil. Agronomy 2021, 11, 1077. [Google Scholar] [CrossRef] [Scilit]
- CPRH (Agência Estadual de Meio Ambiente). Relatório de Monitoramento da Qualidade da Água de Bacias Hidrográficas do Estado de Pernambuco em 2019. 2020. Available online: https://www2.cprh.pe.gov.br/wp-content/uploads/2021/02/quali_agua_2019.pdf (accessed on 10 January 2022).
- CPRH, Agência Estadual de Meio Ambiente. Beberibe. In Relatório de Monitoramento da Qualidade da Água de Bacias Hidrográficas do Estado de Pernambuco; Diretoria de Gestão Territorial e Recursos Hídricos, Governo de Pernambuco: Recife, Brazil, 2017. [Google Scholar]
- Oliva, K.M.E. Sedimentos de Leito para Avaliação da Contaminação por Elementos Potencialmente Tóxicos em Bacias Hidrográficas Costeiras de Pernambuco. Ph.D. Thesis, Programa de Pós-Graduação em Ciência do Solo. Universidade Federal Rural de Pernambuco (UFRPE), Recife, Brazil, 2023. [Google Scholar]
- Silva, F.C. Manual de Análises Químicas de Solos, Plantas e Fertilizantes, 2nd ed.; Embrapa: Brasília, Brazil, 2009; p. 634. [Google Scholar]
- Potts, P.J. A Handbook of Silicate Rock Analysis; Springer Science & Business Media: New York, NY, USA, 2012; ISBN 978-1-4615-3270-5. [Google Scholar]
- Ure, A.M.; Quevauviller, P.H.; Muntau, H.; Griepink, B. Speciation of heavy metals in soils and sediments. An account of the improvement and harmonization of extraction techniques undertaken under the auspices of the BCR of the Commission of the European Communities. Int. J. Environ. Anal. Chem. 1993, 51, 135–151. [Google Scholar] [CrossRef] [Scilit]
- Hakanson, L. An ecological risk index for aquatic pollution control: A sedimentological approach. Water Res. 1980, 14, 975–1001. [Google Scholar] [CrossRef] [Scilit]
- Sucharovà, J.; Suchara, I.; Hola, M.; Marikova, S.; Reimann, C.; Boyd, R.; Filzmoser, P.; Englmaier, P. Top-/bottom-soil ratios and enrichment factors: What do they really show? Appl. Geochem. 2012, 27, 138–145. [Google Scholar] [CrossRef] [Scilit]
- Duodu, G.O.; Goonetilleke, A.; Ayoko, G.A. Comparison of pollution indices for the assessment of heavy metal in Brisbane River sediment. Environ. Pollut. 2016, 219, 1077–1091. [Google Scholar] [CrossRef] [Scilit] [PubMed]
- Sakan, S.M.; Đorđević, D.S.; Manojlović, D.D.; Predrag, P.S. Assessment of heavy metal pollutants accumulation in the Tisza river sediments. J. Environ. Manag. 2009, 90, 3382–3390. [Google Scholar] [CrossRef] [Scilit] [PubMed]
- Suresh, G.; Sutharsan, P.; Ramasamy, V.; Venkatachalapathy, R. Assessment of spatial distribution and potential ecological risk of the heavy metals in relation to granulometric contents of Veeranam lake sediments, India. Ecotoxicol. Environ. Saf. 2012, 84, 117–124. [Google Scholar] [CrossRef] [Scilit] [PubMed]
- Tomlinson, D.L.; Wilson, J.G.; Harris, C.R.; Jeffrey, D.W. Problems in the assessment of heavy-metal levels in estuaries and the formation of a pollution index. Environ. Eval. 1980, 33, 566–575. [Google Scholar] [CrossRef] [Scilit]
- CCME (Canadian Council of Ministers of the Environment). Canadian Sediment Quality Guidelines for the Protection of Aquatic Life. Summary Tables. Canadian Environmental Quality Guidelines. 1995. Available online: https://ccme.ca/en/summary-table (accessed on 10 July 2021).
- CONAMA (Conselho Nacional do Meio Ambiente). Estabelece as Diretrizes Gerais e os Procedimentos Referenciais para o Gerenciamento do Material a ser Dragado em Águas sob Jurisdição Nacional. Resolução Nº 454. 2012. Available online: https://www.suape.pe.gov.br/images/publicacoes/legislacao/22._CONAMA_454_2012.pdf (accessed on 10 December 2022).
- Suresh, G.; Ramasamy, V.; Meenakshisundaram, V.; Venkatachalapathy, R.; Ponnusamy, V. Influence of mineralogical and heavy metal composition on natural radionuclide concentrations in the river sediments. Appl. Radiat. Isot. 2011, 69, 1466–1474. [Google Scholar] [CrossRef] [Scilit] [PubMed]
- Mallagoli, E.D.M.; Manzini, F.F.; Plicas, L.M.D.A. Teores elevados de metais potencialmente tóxicos em amostras de fertilizantes. Saúde Saneam. Meio Ambiente 2013, 9, 11. [Google Scholar] [CrossRef] [Scilit]
- Ali, M.M.; Ali, M.L.; Islam, M.S.; Rahman, M.Z. Preliminary assessment of heavy metals in water and sediment of Karnaphuli River, Bangladesh. Environ. Nanotechnol. Monit. Manag. 2016, 5, 27–35. [Google Scholar] [CrossRef] [Scilit]
- Nahar, K.; Thulasiraman, A.V.; Vuppaladadiyam, A.K.; Hakeem, I.G.; Shah, K. Current understanding on the fate of contaminants during hydrothermal treatment of sewage sludge. Curr. Opin. Green Sustain. Chem. 2024, 49, 100960. [Google Scholar] [CrossRef] [Scilit]
- Adhikari, A.; Kwon, E.; Khan, M.A.; Shaffique, S.; Kang, S.; Lee, I. Enhanced use of chemical fertilizers and mitigation of heavy metal toxicity using biochar and the soil fungus Bipolaris maydis AF7 in rice: Genomic and metabolomic perspectives. Ecotoxicol. Environ. Saf. 2024, 271, 115938. [Google Scholar] [CrossRef] [Scilit] [PubMed]
- Guimarães, R.M.; Corbi, J.J.; Buzá, G. Aquatic insects as bioindicators of heavy metals in sediments in Cerrado streams. Limnetica 2019, 38, 575–586. [Google Scholar] [CrossRef] [Scilit]
- Nordberg, G. Metales: Propiedades Químicas y Toxicidad. In Enciclopedia de Salud y Seguridad en el Trabajo, 4th ed.; Chantal Dufresne, B.A., Ed.; D-INSHT (Instituto Nacional de Seguridad e Higiene en el Trabajo): Madrid, Spain, 2001. [Google Scholar]
- Long, E.R. Calculation and uses of mean sediment quality guideline quotients: A critical review. Environ. Sci. Technol. 2006, 40, 1726–1736. [Google Scholar] [CrossRef] [Scilit] [PubMed]
- Deckere, E.; Cooman, W.; Leloup, V.; Meire, P.; Schmitt, C.; Ohe, P.C. Development of sediment quality guidelines for freshwater ecosystems. J. Soils Sediments 2011, 11, 504–517. [Google Scholar] [CrossRef] [Scilit]
- Silva, Y.J.A.B.; Cantalice, J.R.B.; do Nascimento, C.W.A.; Singh, V.P.; Silva, C.M.C.A.C.; Silva, M.O.; Guerra, S.M. Bedload as an indicator of heavy metal contamination in a Brazilian anthropized watershed. Catena 2017, 153, 106–113. [Google Scholar] [CrossRef] [Scilit]
- Biondi, C.M.; Nascimento, C.W.A.D.; Fabricio Neta, A.D.B.; Ribeiro, M.R. Teores de Fe, Mn, Zn, Cu, Ni e Co em solos de referência de Pernambuco. Rev. Bras. Cienc. Solo 2011, 35, 1057–1066. [Google Scholar] [CrossRef] [Scilit]
- Morillo, J.; Usero, J.; Gracia, I. Heavy metal distribution in marine sediments from the southwest coast of Spain. Chemosphere 2004, 55, 431–442. [Google Scholar] [CrossRef] [Scilit] [PubMed]
- Kumar, S.; Islam, A.R.M.T.; Hasanuzzaman, M.; Salam, R.; Khan, R.; Islam, M.S. Preliminary assessment of heavy metals in surface water and sediment in Nakuvadra-Rakiraki River, Fiji using indexical and chemometric approaches. J. Environ. Manag. 2021, 298, 113517. [Google Scholar] [CrossRef] [Scilit] [PubMed]
- Ma, T.; Sheng, Y.; Meng, Y.; Sun, J. Multistage remediation of heavy metal contaminated river sediments in a mining region based on particle size. Chemosphere 2019, 225, 83–92. [Google Scholar] [CrossRef] [Scilit] [PubMed]
- Ortega-Calvo, J.J.; Harmsen, J.; Parsons, J.R.; Semple, K.T.; Aitken, M.D.; Ajao, C.; Eadsforth, C.; Galay-Burgos, M.; Naidu, R.; Oliver, R.; et al. From bioavailability science to regulation of organic chemicals. Environ. Sci. Technol. 2015, 49, 10246–10255. [Google Scholar] [CrossRef] [Scilit] [PubMed]
- Portet-Koltalo, F.; Gardes, T.; Debret, M.; Copard, Y.; Marcotte, S.; Morin, C.; Laperdrix, Q. Bioaccessibility of polycyclic aromatic compounds (PAHs, PCBs) and trace elements: Influencing factors and determination in a river sediment core. J. Hazard. Mater. 2020, 384, 121499. [Google Scholar] [CrossRef] [Scilit] [PubMed]
- Wang, Q.; Sun, J.; Xu, X.; Yu, H. Integration of chemical and toxicological tools to assess the bioavailability of copper derived from different copper-based fungicides in soil. Ecotoxicol. Environ. Saf. 2018, 161, 662–668. [Google Scholar] [CrossRef] [Scilit] [PubMed]
- Ma, X.; Zuo, H.; Tian, M.; Zhang, L.; Meng, J.; Zhou, X.; Mn, N.; Changa, X.; Liu, Y. Assessment of heavy metals contamination in sediments from three adjacent regions of the Yellow River using metal chemical fractions and multivariate analysis techniques. Chemosphere 2016, 144, 264–272. [Google Scholar] [CrossRef] [Scilit] [PubMed]
- Hu, C.; Yang, X.; Dong, J.; Zhang, X. Heavy metal concentrations and chemical fractions in sediment from Swan Lagoon, China: Their relation to the physiochemical properties of sediment. Chemosphere 2018, 209, 848–856. [Google Scholar] [CrossRef] [Scilit] [PubMed]

Disclaimer/Publisher’s Note: The statements, opinions and data contained in all publications are solely those of the individual author(s) and contributor(s) and not of MDPI and/or the editor(s). MDPI and/or the editor(s) disclaim responsibility for any injury to people or property resulting from any ideas, methods, instructions or products referred to in the content. |
© 2026 by the authors. Licensee MDPI, Basel, Switzerland. This article is an open access article distributed under the terms and conditions of the Creative Commons Attribution (CC BY) license.