


Abstract
Coastal cities face substantial storm surge flood risk, yet detailed information on the urban functions exposed to inundation is often limited. This study presents an integrated, semi-quantitative framework for assessing storm surge risk in four subdistricts of Zhoushan, China. Points of interest (POIs), areas of interest (AOIs), OpenStreetMap (OSM) roads, and land-cover data were integrated to construct an Essential Urban Land Use/Cover (EULUC) map, which provided the spatial basis for assigning relative vulnerability to different land-use categories. Maximum inundation depths from Finite-Volume Community Ocean Model (FVCOM) simulations were used to classify inundation hazard under five typhoon central-pressure scenarios ranging from 955 to 915 hPa. The hazard classes and EULUC-based vulnerability were then combined through a hazard–vulnerability matrix to delineate risk zones for each scenario. The total area classified for storm surge risk increased from 1.25 km2 at 955 hPa to 47.90 km2 at 915 hPa, with the largest increase between the 945 and 935 hPa scenarios, from 4.69 to 34.69 km2. The composition of the classified area also shifted toward higher risk levels. Under the 915 hPa scenario, extremely high risk was the largest class, covering approximately 19.6 km2 (41%), followed by high risk at approximately 12.9 km2 (27%). The dominant risk class varied among subdistricts. High risk was the largest class in Donggang, whereas extremely high risk dominated in Shenjiamen and Lincheng. By identifying where severe inundation coincides with vulnerable urban functions, the framework supports scenario-based risk screening and helps prioritize locations for emergency preparedness and spatial planning.
1. Introduction
Coastal communities worldwide face a growing threat from storm surge flooding (SSF), driven by climate change and increasing development in coastal zones. Changes in tropical cyclone intensity can influence storm surge magnitude, while climate phenomena such as the El Niño–Southern Oscillation (ENSO) can modulate tropical cyclone activity and associated coastal flood hazards [1,2]. Concurrently, rapid population growth, urbanization, and economic expansion have concentrated people, assets, and critical infrastructure in coastal areas, increasing exposure and potential losses [3,4]. The combined effects of changing climatic conditions and expanding socioeconomic exposure may intensify future coastal flood impacts and place greater demands on disaster preparedness and coastal protection [5,6]. Consequently, refined storm surge risk assessment has become an important priority for identifying vulnerable areas and supporting disaster prevention, mitigation, and spatial planning in coastal cities.
Storm surge risk assessment (SSFRA) is conventionally structured around three dimensions: hazard, exposure, and vulnerability [7,8]. While significant advances in hydrodynamic numerical modeling have dramatically improved the simulation and understanding of extreme surge hazards—with unstructured-grid models such as FVCOM and ADCIRC being widely applied to storm surge studies along the Chinese coast [9,10,11]—progress in characterizing exposure and vulnerability has not kept pace. The lack of high-resolution, timely data on the spatial distribution of socioeconomic components remains the primary bottleneck constraining the overall accuracy of risk assessment [12].
Traditional storm surge risk assessment often relies on comprehensive index methods, such as constructing the Coastal Vulnerability Index (CVI) and Social Vulnerability Index (SVI) by integrating static variables such as topography and population to identify high-risk areas [13]. However, such approaches often fail to capture the fine functional differences and dynamic exposure characteristics within cities. National land cover/use (LULC) datasets are valuable sources of exposure maps as they explicitly reflect physical surface characteristics and contribute to vulnerability classification [14]. However, SSFRA imposes strict requirements on data update frequency; the slow update cycle of conventional LULC products cannot match the rapid pace of coastal development and changing climate threats [15]. Remote sensing supports urban surface mapping and the production of land-cover datasets [16,17,18]. Recent deep learning approaches, particularly Swin-UNet, have achieved land-use classification accuracies exceeding 96% using high-resolution remote sensing imagery [19]. Nevertheless, these data struggle to discriminate between land-use categories defined by human social and economic function, such as commercial, residential, and industrial zones. They capture physical attributes but not the underlying socioeconomic patterns or functional contexts necessary to characterize exposure and vulnerability. This gap between physical land cover and socioeconomic function highlights the value of integrating remote sensing with geospatial big data, including points of interest (POIs), for urban land-use mapping [20].
Using POI data to recognize essential urban land use (EULU) has become a research hotspot in recent years [21,22,23]. Recent work has further incorporated graph-based deep learning—such as marginalized graph autoencoders—with POI kernel density estimation to improve urban functional zone identification by accounting for spatial adjacency and barrier effects (e.g., main roads, rivers), achieving classification accuracies exceeding 90% [24]. Most recently, deep learning methods have been integrated with POI-based LULC classification to enable rapid storm surge risk assessment, representing a significant advance in automating the hazard-to-risk pipeline [25]. As one of the most common types of open access data, POIs are free and relatively easy to obtain [26]. They also offer detailed information coverage, high precision, fast frequent updates, and convenient spatial analysis, making them one of the most frequently used data types for urban research and EULU identification [27]. Current methodologies typically rely on a two-step process: delineating spatial units using road network-related blocks from sources such as OSM, followed by assigning POI semantic categories to these blocks [28,29,30,31]. Recent studies have further advanced this paradigm by fusing mobile signaling data with POI features through deep learning, achieving classification accuracies exceeding 95% for urban functional zones [32]. While effective at a city-wide scale, this approach encounters significant limitations at finer, neighborhood-level resolutions. The resulting spatial units are often coarse and contain heterogeneous functions, making it difficult to accurately distinguish between socially defined land uses. This methodological constraint echoes a broader gap in geospatial analysis: the frequent inability to capture the functional socioeconomic patterns that define true urban exposure and vulnerability beyond mere physical attributes. Consequently, while POIs offer a valuable proxy for human activity, there is a critical need for integrated frameworks that can translate these data into high-resolution, functionally accurate EULU classifications.
Areas of Interest (AOIs) represent geographic entities as polygons, particularly those associated with human activities. The parcel boundaries and functional labels contained in the layers provided by AOIs help refine the spatial units of existing sources of EULU based only on OSM and POIs. In addition, the combination of EULU, OSM, and natural features obtained through remote sensing allows for the acquisition of essential urban land use/cover categories (EULUC) [28]. EULUC are widely used as basic units for commercial site selection, landscape design, smart urban planning, and economic- and population-related studies [33,34,35]. Despite their potential utility, there are still few studies employing SSFRA based on EULUC. Given this context, spatialization data derived from OSM, POIs, AOIs, and remote sensing can provide valuable support for SSFRA. By leveraging refined information from EULUC, it is possible to reduce the uncertainty associated with disaster-bearing body data at coarse resolutions.
The Zhoushan Archipelago (29°32′–31°04′ N, 121°30′–123°25′ E), situated in eastern Zhejiang Province, China, presents a critical test case for coastal risk assessment. As China’s first prefecture-level city established in an archipelagic form, Zhoushan comprises 2085 islands, with Zhoushan Island (approximately 503 km2) being the fourth-largest island in China. Between 1949 and 2019, Zhoushan was impacted by 313 typhoons, averaging 4.47 per year [36,37]. Its extensive low-lying coastline and concentrated socio-economic assets are increasingly exposed to storms and typhoons under the subtropical marine monsoon climate [38,39]. Major economic sectors—including international port operations, large-scale tourism, marine capture fisheries, and strategic energy transport facilities—are clustered within flood-prone zones below 10 m elevation. This exposure makes the region highly valuable for understanding SSF risk in the context of intensifying tropical cyclones. However, existing studies involving flood assessment for Zhoushan have relied primarily on hydrodynamic methods with emphasis on hazard simulation [9,40]. Therefore, there is an evident gap in actionable, risk-informed planning.
Despite these advances in geospatial data and hydrodynamic modeling, a systematic semi-quantitative risk zoning framework that leverages urban functional zone information for coastal storm surge assessment remains lacking. A recent semi-quantitative multi-hazard risk assessment framework for European coastal urban areas demonstrated the practical utility of GIS-based index approaches for cross-peril comparison and risk communication [41]; however, its applicability to storm surge-specific risk assessment in East Asian urban contexts, where fine-grained functional zone data are increasingly available, has yet to be explored. Previous studies have primarily focused on either statistical downscaling of exposure elements or monetary quantification of economic losses at the aggregate level, without systematically undertaking risk zoning from an urban functional zone perspective—an approach that holds particular value for identifying risk hotspots by functional type and guiding differentiated disaster prevention strategies.
To address this gap, this study investigates the following research questions: (1) How can multi-source geospatial datasets—POIs, AOIs, OSM, and remote sensing—be effectively integrated to produce a functionally precise, high-resolution EULUC map for coastal risk assessment? (2) How do storm surge inundation extent and hazard levels evolve under different typhoon intensities in a complex archipelagic setting? (3) What spatial risk patterns emerge when hydrodynamic hazard is coupled with the EULUC-based exposure-vulnerability framework through a semi-quantitative risk matrix? The contribution of this study lies in integrating marine hydrodynamic hazard modelling with urban functional exposure mapping and semi-quantitative risk assessment. FVCOM-based inundation scenarios are linked to EULUC categories derived from POIs, AOIs, OSM roads, and land-cover data through category-level vulnerability coefficients and a hazard–vulnerability matrix. This integration produces scenario-conditioned risk zones that identify the urban functions present in affected areas and support differentiated coastal risk management.
2. Materials and Methods
2.1. Study Area
The Zhoushan Archipelago is situated south of the Yangtze River Estuary and seaward of Hangzhou Bay in the East China Sea (Figure 1). The region experiences a subtropical marine monsoon climate and is routinely subjected to typhoon-driven storm surges. Long-term records (1979–2020) from the Dinghai hydrological station reveal an average of one significant storm surge event per year. Over this 42-year period, storm surge heights exceeded 50 cm on 22 occasions and 80 cm on 11 occasions; concurrently, maximum water levels surpassed 200 cm on 22 occasions, attesting to a persistent and severe hazard regime.
Figure 1.
Study area: (a) map of China; (b) map of Zhoushan City; (c) southeastern portion of Zhoushan Island showing the four subdistricts.
The region’s pronounced vulnerability arises from the concentration of population, high-value assets, and critical infrastructure within low-lying coastal terrain, where ground elevations are predominantly below 10 m above mean sea level. To support fine-grained, parcel-level risk assessment, this study focuses on four subdistrict-level administrative units (jiedao) on southeastern Zhoushan Island (Figure 1c), whose combined land area accounts for only 13% of Zhoushan City’s total, yet whose residents constitute 34% of the city’s population [42]. Together, they form the urban core functional area:
Lincheng Subdistrict (85,199 residents) and Qiandao Subdistrict (56,111 residents): the municipal administrative and commercial center, characterized by the highest development intensity, with dense high-rise residential compounds, government offices, and retail establishments.
Donggang Subdistrict (133,518 residents): the core coastal tourism and leisure zone, encompassing major beachfront scenic areas, hotels, and recreational facilities, including extensive reclaimed land behind coastal dikes.
Shenjiamen Subdistrict (118,476 residents): the historic fishing port district, hosting Zhoushan’s largest marine capture fishery harbor and the principal seafood wholesale market serving eastern Zhejiang, also a renowned tourist destination.
The site selection provides a representative microcosm of the compound social, economic, and physical vulnerabilities confronting the archipelago, where intense human development intersects directly with a severe and recurrent geophysical hazard. We propose a general approach for the semi-quantitative SSFRA that systematically integrates ocean models, typhoon models, and open-access datasets. The framework consists of four components: (1) hazard assessment; (2) exposure assessment; (3) vulnerability assessment; and (4) risk assessment. The technical workflow is shown in Figure 2.
Figure 2.
Flowchart of the storm surge risk assessment framework.
2.2. Data Sources
This study synthesizes a diverse array of observational, geospatial, and modeled datasets to drive the coupled hazard-exposure-vulnerability framework. Data integration was designed to maximize resolution and relevance for coastal flood risk assessment, with complete acquisition and preprocessing details provided in Section S1 of the Supplementary Information.
Hazard modeling data: Historical tropical cyclone data (1949–2019) were obtained from the China Meteorological Administration (CMA) best-track dataset [36] for typhoon scenario design. Coastline data for nearshore Zhoushan were digitized from Sentinel-2 imagery using Google Earth Engine (https://earthengine.google.com/). The coastline for the broader domain was supplemented with data from the Global Self-consistent, Hierarchical, High-resolution Geography (GSHHG) database. Bathymetry was constructed from high-resolution electronic nautical charts (Zhoushan Chart Information Technology Co., Ltd., Zhoushan, China) for the Zhejiang nearshore area and the 15 arc-second General Bathymetric Chart of the Oceans (GEBCO) dataset [43] for the broader domain. Background wind fields were derived from ERA5 reanalysis data at 0.25° resolution [44]. Tidal forcing at the open boundary was derived from the TPXO9-atlas global tidal model [45] using thirteen tidal constituents (K1, K2, M2, M4, MF, MM, MN4, MS4, N2, O1, P1, Q1, and S2). Hourly water level observations during typhoon events, sourced from the Zhejiang Province Ocean and Fisheries Bureau, were used for model validation.
Exposure and vulnerability assessment data: Land cover was obtained from ESA WorldCover 2020 at 10 m resolution [18]. Topography was derived from FABDEM (Forest and Buildings removed Copernicus DEM) at 30 m resolution [46]. FABDEM elevations referenced to EGM2008 were approximately converted to the mean-sea-level reference using CNES-CLS18 mean dynamic topography (MDT) [47], following the convention described in Supplementary Section S1. The citywide urban functional classification used 32,552 POI records representing 2020, obtained from the Amap Open Platform [48], and 3723 AOI polygons representing 2020, obtained through the Baidu Maps API [49]. OSM road data [50] and the coastline extracted from Sentinel-2 imagery were used to delineate spatial units. The EULUC map was first constructed for Zhoushan City and then clipped to the boundaries of the four subdistricts for the present assessment.
Administrative and infrastructure data: Township-level administrative boundaries were provided by the Zhoushan Natural Resources and Planning Bureau. Detailed dike elevation and location data were supplied by the Second Surveying and Mapping Institute of Zhejiang Province: the Donggang dike has a 50-year return period defense standard with heights varying from 2.81 to 4.20 m (sampled at approximately 200 m intervals); the Shenjiamen dike has a design high tide level of 3.14 m with heights ranging from approximately 2.5 to 3.9 m; dike heights in Qiandao and Lincheng Subdistricts vary from 3.1 to 5.2 m. Terrain elevations, surveyed dike crest elevations, and simulated water levels were referenced to a common mean-sea-level datum for calculating inundation depth and determining overtopping.
2.3. Hazard Assessment
2.3.1. Storm Surge Model Configuration
The Finite-Volume Community Ocean Model (FVCOM, version 4.1) is a three-dimensional hydrodynamic model that uses an unstructured grid [51]. Chen et al. [42] used FVCOM simulations to assess population and gross domestic product (GDP) exposure to storm surge inundation in Zhoushan. The present study used inundation depths from those simulations to classify flood hazard and combined the resulting hazard classes with relative vulnerability derived from multi-source EULUC mapping in a hazard–vulnerability matrix to delineate storm surge risk zones. The triangular mesh accommodates irregular coastlines and island boundaries, with local refinement around steep bathymetric gradients. The model incorporates a wet/dry scheme [52] and a dike–groyne module [53] to represent seawall barriers and overtopping. Surveyed dike locations were used to define barrier lines in the mesh, with triangular elements arranged on both sides. Surveyed crest elevations were assigned to the corresponding barriers in the dike–groyne module. Flow across the barriers is blocked when water levels are below the crest, while overtopping exchange is permitted when water levels exceed the crest [53]. FVCOM has been applied to storm surge and coastal flood simulations in estuaries and on continental shelves [10,11,54].
As shown in Figure 3a, the computational domain encompasses the Bohai Sea, Yellow Sea, and East China Sea, allowing regional tidal and storm-driven circulation to be represented during typhoon propagation. Mesh resolution ranges from approximately 20 km at the open boundary to 30–50 m in the coastal lowlands (Figure 3c–e). The mesh contains 102,355 nodes and 197,865 triangular elements. The model was initialized from rest with uniform temperature (20 °C) and salinity (30 psu), using four uniform sigma layers. The external time step was 2 s, and the internal-to-external time-step ratio was 3. Bottom friction was calculated using FVCOM’s logarithmic bottom-boundary-layer formulation, with a bottom roughness length of 0.0002 m and a minimum drag coefficient of 0.0025. Horizontal diffusion used the Smagorinsky scheme, and vertical mixing used the Mellor–Yamada level-2.5 closure. The friction formulations are provided in the supplementary material. A seven-day spin-up period preceded the analysis period to allow the model to adjust from its initial state. ERA5 forcing covered both the spin-up and analysis periods. Model outputs from the spin-up period were excluded from the inundation statistics.
Figure 3.
FVCOM domain and mesh: (a) large-regional mesh covering the Bohai Sea, Yellow Sea, and East China Sea, (b) Zhoushan Archipelago region, (c–e) refined mesh in the coastal lowlands of the four subdistricts.
The model was evaluated against coastal water-level and storm-surge observations during Typhoons Fred (9417), Winnie (9711), and Chan-Hom (1509). Across seven event–station comparisons, the mean absolute errors of maximum total water level and maximum storm surge were 0.062 and 0.072 m, respectively, with maximum absolute errors of 0.150 and 0.158 m. Supplementary Section S4 provides the time-series comparisons and quantitative performance metrics.
2.3.2. Typhoon Scenario Design
Typhoon wind fields were generated by combining the Jelesnianski parametric typhoon model [55] with ERA5 reanalysis background wind fields [44]. The reconstructed fields were defined by typhoon central pressure (P0), radius of maximum wind (Rmax), maximum wind speed (Vmax), and typhoon track. The parametric wind field represented the inner typhoon region, while ERA5 supplied the outer background wind field. Within the transition zone, the horizontal wind components were combined using a distance-dependent linear weighting function, as described in Supplementary Section S2. ERA5 forcing was temporally aligned with the simulation and included the preceding seven-day spin-up period. Rmax was calculated using the empirical relationship of Cheung et al. (2007) [56]:
where Rmax is the radius of maximum wind (km), P0 is the central pressure (hPa), and Rk is an empirical constant of 50 km [14]. The coefficients 0.4 and 0.01 have units of km hPa−1 and km hPa−2, respectively.
Within the storm-surge risk assessment context of HY/T 0273-2019 [57], five synthetic typhoon scenarios were specified to span central pressures of 955–915 hPa (Table 1). These pressure values are scenario inputs selected for this study. Maximum wind speeds were assigned according to the corresponding Beaufort wind-force levels. Five typical approach directions (−25°, 5°, 35°, 65°, and 95°) [40] were selected, and the typhoon translation speed was set to 22.5 km/h based on the latitude of the study area [58]. For each intensity scenario, twelve parallel tracks were generated for each approach direction, with adjacent tracks spaced at half the radius of maximum wind, yielding 60 tracks per intensity scenario [42].
Table 1.
Typhoon intensity scenario design parameters.
The hazard map for each intensity scenario was constructed by taking the maximum inundation depth at each location across the 60 simulations. The resulting map represents a spatial envelope of potential inundation across alternative typhoon tracks, rather than the inundation footprint of a single storm.
Astronomical tides and atmospheric forcing were applied jointly in FVCOM, retaining tide–surge interaction. Open-boundary tidal forcing was derived from TPXO9-atlas. The representative astronomical high tide at Zhoushan was 1.78 m, based on the June–October mean high-tide records for 2003–2011 [42]. The simulation start time was adjusted so that peak storm surge coincided with this representative high tide. Inundation calculations used the simulated total water level without adding the 1.78 m high-tide value separately.
2.3.3. Hazard Level Classification
MATLAB (version R2021a, The MathWorks Inc., Natick, MA, USA) [59] and QGIS (version 3.20.1) [60] were used to process FVCOM outputs for inundation mapping and hazard classification. The maximum water-surface elevation at each FVCOM node was extracted, and the local ground elevation was subtracted to obtain the maximum inundation depth. Dike barriers and overtopping processes were represented within FVCOM. Before interpolation, a land polygon layer was used to exclude nodes located in marine areas. Land nodes with zero maximum inundation depth were retained as zero-valued input points. The retained nodal depths were interpolated onto a 30 m × 30 m raster using inverse distance weighting (IDW), with a distance-power parameter of 2. The resulting raster was clipped to the mesh coverage using a polygon layer constructed from the original FVCOM triangular mesh. Raster cells were classified into four hazard levels using the inundation-depth thresholds adopted from previous research [14] (Table 2). A depth of 0.15 m was used as the lower threshold for reporting classified inundation.
Table 2.
Hazard level classification.
2.4. Exposure Assessment
The EULUC workflow was implemented for Zhoushan City before extracting the four-subdistrict study area (Figure 2). POI and AOI records were reclassified into urban functional categories. OSM roads and coastline polygons defined the initial spatial units, which were refined using AOI boundaries and assigned the corresponding AOI functional labels. Units outside AOI coverage were classified using weighted POI kernel densities. The urban functional map was then combined with natural land-cover categories from ESA WorldCover 2020 to produce the citywide EULUC map.
2.4.1. Spatial Unit Delineation
Spatial units were delineated using OSM roads, AOI polygons, and the coastline. Road-network topology was corrected following Liu and Long [31], and road-based spatial units were delineated following the EULUC-China approach of Gong et al. [28]. Class-specific road-buffer distances were adopted from the EULUC-Nanjing study of Sun et al. [61] to delineate the initial spatial units. The adopted distances are listed in Supplementary Table S4. The road buffers and coastline polygons were overlaid to delineate the initial spatial units. AOI boundaries were then used to subdivide these units, and their functional labels were assigned to the covered parcels. Units outside AOI coverage were classified using weighted POI kernel densities. The resulting urban functional classification was integrated with natural land-cover categories to construct the citywide EULUC map, which was subsequently clipped to the four-subdistrict study area.
2.4.2. POI Reclassification
POI and AOI records provide names, category labels, and geographic locations for identifying urban functions. Following GB 50137-2011 [62], the records were grouped into five urban functional categories: Residential (RE), Administration and Public Services (AP), Commercial and Business Facilities (CB), Industrial (IN), and Street and Transportation (ST). These five categories were used for AOI labeling and POI-based classification. Forest, shrubland, grassland, cropland, barren land, open water, and wetland were introduced separately from ESA WorldCover 2020.
2.4.3. POI Kernel Density Estimation
Kernel density estimation (KDE) offers the flexibility of estimating density at any arbitrary point without requiring a predefined grid size [63,64]. At any point i in space, the kernel density Pi is defined as the density at the center point and decreases as one moves outward. Densities are zero when distance equals R:
where Pi is the estimated POI density at location i, Dij is the distance between location i and POIj, and R is the search bandwidth. Only POIs within Dij < R contribute to the estimate. The factor 3/(πR2) normalizes the two-dimensional quartic kernel to unit integral. A bandwidth of 200 m was adopted with reference to the urban building-function identification study of Lin et al. [65].
2.4.4. Urban Function Classification
POI densities were weighted to account for differences in the typical area extent and public awareness of the represented activities. Category weights were adapted from the scheme of Xue et al. [66] to the five functional categories used in this study: Residential, 100; Administration and Public Services, 40; Commercial and Business Facilities, 20; Industrial, 70; and Street and Transportation, 100. For units outside AOI coverage, the weighted density share of each category was calculated using the following formula:
where i denotes one of the five POI categories and Fi is its weighted kernel-density sum within a spatial unit. A unit was assigned a single function when one category had a uniquely highest weighted density share of at least 50% [66,67,68]. When no category reached 50%, the unit was assigned a mixed function based on the two categories with the largest shares. If two categories each accounted for exactly 50%, the unit was assigned their corresponding mixed function. The density-share calculation was applicable only when the sum of the five weighted category densities was greater than zero. Units without POIs inside their boundaries could still receive nonzero kernel-density contributions from surrounding POIs within the 200 m bandwidth and were classified using the same criteria.
The urban functional classification was integrated with OSM road data and natural land-cover categories derived from ESA WorldCover 2020 to construct the citywide EULUC map, following the EULUC-China classification framework [28]. During integration, assigned urban functional categories took precedence over overlapping natural land-cover categories. Natural land-cover categories were retained in areas without an assigned urban function. Classification accuracy was evaluated using 365 reference samples, with reference labels established through the interpretation of high-resolution Google Earth imagery (https://www.google.com/earth/about/download/, accesed on 3 January 2025) and official land-use information for Zhoushan City in 2020. The resulting EULUC map was subsequently clipped to the four-subdistrict study area for storm surge risk assessment.
2.5. Vulnerability Assessment
Vulnerability was assessed by assigning relative sensitivity coefficients to the land-use and land-cover categories in the EULUC map. Table 3 lists the coefficients for single-function, mixed-function, and natural categories. Only categories present in the study-area EULUC map were used to construct the vulnerability layer. Coefficient selection and vulnerability-level assignment were treated as separate steps. First, coefficients were selected with reference to the source land-use vulnerability scheme [14] and adapted to the EULUC categories. The source scheme generally reported coefficient ranges for individual land-use categories, and its vulnerability-level labels did not consistently correspond to fixed numerical intervals. The source coefficients therefore informed the selection of values, while the source level labels were not adopted. Second, vulnerability levels were assigned using the numerical intervals defined for this study in Table 4. These intervals were 0.10 ≤ v ≤ 0.25 for Level IV, 0.25 < v ≤ 0.50 for Level III, 0.50 < v ≤ 0.75 for Level II, and 0.75 < v ≤ 1.00 for Level I. For example, the coefficient of 0.80 was assigned to Level I because it falls within the interval 0.75 < v ≤ 1.00.
Table 3.
Correspondence between EULUC types and vulnerability levels.
Table 4.
Risk matrix method for assessing storm surge induced flooding risk.
Among the single-function categories, Residential Land and Administration and Public Services were each assigned a coefficient of 1.00, while Commercial and Business Facilities and Industrial Areas were each assigned a coefficient of 0.80. All four categories were classified as Level I, representing extremely high relative vulnerability. These categories encompass residential communities, government offices, educational and healthcare facilities, commercial premises, and industrial infrastructure. Street and Transportation Infrastructure was assigned a coefficient of 0.70 and classified as Level II, representing high relative vulnerability. The coefficients represent relative sensitivity at the category level. Asset value, construction characteristics, and adaptive capacity may vary within each category.
For mixed-function zones, the vulnerability coefficient was calculated as the arithmetic mean of the coefficients of the two constituent categories. The mapped RE–AP category had a coefficient of 1.00, RE–CB and RE–IN each had a coefficient of 0.90, and CB–IN had a coefficient of 0.80. All four were classified as Level I. Grassland was assigned a coefficient of 0.40 and classified as Level III. Forest, shrubland, cropland, barren land, open water, and wetland were each assigned a coefficient of 0.10 and classified as Level IV. The coefficients were mapped to the EULUC categories to construct the spatial vulnerability layer. The resulting vulnerability levels were then combined with inundation hazard classes through the risk matrix.
2.6. Risk Assessment
By evaluating the hazard assessment and vulnerability of affected elements over the study area, the inundated region was divided into multiple SSF risk levels. A risk matrix, which is a semi-quantitative approach, was adopted in this study. A risk matrix consists of categories of hazard levels on one axis and vulnerability levels on the other, as illustrated in Table 4. By using the risk matrix, the degree of risk can be determined with limited quantitative data. This approach is particularly suited for data-scarce environments where full quantitative depth-damage functions are unavailable, yet decision-makers require spatially explicit risk zonation to guide differentiated intervention strategies.
Four risk levels (I–IV) were assigned using the hazard–vulnerability matrix in Table 4. At each mapped location, the risk level was determined by the intersection of its inundation-depth class and vulnerability class. Low hazard combined with low vulnerability produces low risk; extremely high hazard combined with medium vulnerability produces high risk; and extremely high hazard combined with high vulnerability produces extremely high risk.
3. Results
3.1. Hazard Assessment
Figure 4 shows the spatial distribution of the four hazard levels under the five typhoon scenarios. Inundation is concentrated near the coast under the 955 and 945 hPa scenarios and extends farther inland under the 935–915 hPa scenarios, affecting larger parts of the urban areas in the four subdistricts.
Figure 4.
Storm surge hazard level maps for the designed typhoon scenarios: (a) 915 hPa, (b) 925 hPa, (c) 935 hPa, (d) 945 hPa, (e) 955 hPa.
Figure 5a quantifies the classified inundation area, while Figure 5b shows the proportion assigned to each hazard level. The total area increases from 1.25 km2 at 955 hPa to 4.69 km2 at 945 hPa, 34.69 km2 at 935 hPa, 42.45 km2 at 925 hPa, and 47.90 km2 at 915 hPa. The largest absolute increase occurs between the 945 and 935 hPa scenarios, when the classified inundation area expands by approximately 30.00 km2. In comparison, the increase between 955 and 945 hPa is approximately 3.44 km2, with localized expansion landward of the Donggang dike. The low-elevation coastal zone (LECZ), defined here as coastal land below 10 m elevation within the study area, covers 59.14 km2. The inundated areas under the 955 and 915 hPa scenarios correspond to approximately 2.11% and 80.99% of the LECZ area, respectively. The composition of the classified inundation area also changes across the scenarios. At 955 hPa, low and medium hazard each account for approximately 34%. At 945 hPa, medium hazard is the largest category (41%), followed by low hazard (36%). At 935 hPa, medium hazard remains dominant (49%), while high hazard accounts for 28%. High hazard becomes the largest category at 925 and 915 hPa, accounting for 46% and 66%, respectively. Extremely high hazard accounts for approximately 4% at 915 hPa. The hazard-level percentages in Figure 5b are calculated relative to the total classified inundation area in each scenario.
Figure 5.
Storm surge inundation hazard under the five typhoon scenarios. (a) Inundated area by hazard level (km2). (b) Percentage of the total classified inundation area in each hazard level for each scenario.
Spatially, inundation under the 945 hPa scenario extends landward of the Donggang dike, while its mapped extent remains comparatively limited in Shenjiamen, Qiandao, and Lincheng. Under the 935 and 925 hPa scenarios, inundation expands into urban areas across the four subdistricts (Figure 4). Under the 915 hPa scenario, high and extremely high hazard together account for approximately 70% of the classified inundation area. Qiandao and Donggang contain extensive inundated areas, indicating that the larger flood extent is accompanied by an increase in the proportion of deeper inundation.
3.2. Exposure Assessment
The EULUC map comprises 16 categories, including five single-function urban categories, four mixed-function categories (RE–AP, RE–CB, RE–IN, and CB–IN), and seven natural land-cover categories (Figure 6). The citywide classification of the five urban functional categories achieved an overall accuracy of 87.40% and a Cohen’s kappa coefficient of 0.84 (Table S5).
Figure 6.
EULUC exposure map of the study area.
Spatial analysis reveals distinct and risk-relevant functional zone patterns. Residential land is concentrated in central Qiandao Subdistrict, eastern Lincheng Subdistrict, Donggang Subdistrict, and the coastal zone of Shenjiamen Subdistrict—all predominantly within the low-lying coastal plains, within coastal areas affected by simulated inundation in Section 3.1. Commercial and business facilities are interwoven with residential and administrative/public areas, with the core commercial district located at the junction of Lincheng and Qiandao Subdistricts. Administrative and public services are interspersed within residential and commercial zones. Industrial land is primarily situated in southwestern Lincheng, central Qiandao and Donggang, and northwestern Shenjiamen, near coastal and port areas. Donggang Subdistrict’s commercial zone lies landward of the dike, where simulated inundation expands under the 945 hPa scenario. Mixed-function zones, predominantly commercial-residential combinations, are concentrated in the city center. Shenjiamen itself exhibits a mixed commercial-residential character consistent with its role as a tourism and fishing port hub.
Natural and semi-natural land covers are mainly distributed in the inland portions of the study area. Forest occupies extensive areas around the hills, whereas urban functional zones are concentrated in the coastal plains (Figure 6). Cropland, grassland, shrubland, barren land, open water, and wetland are interspersed with the urban functional zones, forming a heterogeneous land-cover pattern.
3.3. Vulnerability Assessment
Based on the correspondence between EULUC types and their corresponding vulnerability coefficients in Table 3, we determined the vulnerability coefficients and levels for each EULUC type in the study area with respect to storm surge, as shown in Figure 7. The extremely high vulnerability zone covers approximately 38.72 km2 (30.1% of the study area) and is mainly present in residential, commercial, public-facility, and industrial areas, together with several mixed built-up classes. These EULUC types are concentrated at low elevations and are vulnerable to coastal flooding. The high vulnerability zone covers 7.09 km2 (5.5%) and consists primarily of street and transportation land (coefficient 0.70). This class is distributed along major road corridors and coastal access routes; some segments in the lowland areas of Shenjiamen Subdistrict are particularly exposed to coastal flooding. The medium vulnerability zone covers 1.80 km2 (1.4%) and is dominated by grassland. Relative to the built-up classes, this zone occupies a much smaller share of the study area and occurs mainly as scattered patches within or adjacent to the urban fringe. The low vulnerability zone covers 81.20 km2 (63.0%) and consists of natural and semi-natural land-cover types—forest, cropland, barren land, open water, shrubland, and wetland—which are comparatively less sensitive in the adopted screening classification. Patches of agricultural land occur near the coastline in Lincheng and Qiandao Subdistricts and on the landward side of the dike in northern Donggang Subdistrict.
Figure 7.
Spatial distribution of vulnerability in the study area: (a) vulnerability coefficient values, (b) vulnerability levels.
3.4. Risk Assessment
The hazard–vulnerability combinations in Table 4 produce four risk levels: extremely high, high, medium, and low. Figure 8 presents the spatial distribution of these risk levels across Lincheng, Qiandao, Donggang, and Shenjiamen Subdistricts under the five typhoon intensity scenarios, while Figure 9 summarizes the corresponding risk areas and their composition. Under the 955 hPa scenario, classified risk is largely confined to a small coastal area in eastern Donggang. At 945 hPa, the affected area expands locally within Donggang, with high and extremely high risk concentrated along the coastal urban zone. Under the 935 hPa scenario, risk areas extend along the southern coastal corridor, particularly across Shenjiamen and the southern parts of Qiandao, while additional risk patches emerge in Donggang and Lincheng. As central pressure decreases further to 925 and 915 hPa, the distribution of high and extremely high risk becomes more extensive, spreading across the densely developed areas of Lincheng and Qiandao and forming larger, more connected clusters in Donggang and Shenjiamen. Under the strongest scenario (915 hPa), high and extremely high risk dominate the inundated urban areas, particularly along the southern coastal belt and the central–eastern built-up zones, while medium- and low-risk areas occur as scattered patches. Overall, the risk distribution shifts from localized coastal exposure in Donggang under weaker scenarios to a broader pattern involving all four subdistricts under stronger typhoon conditions.
Figure 8.
Storm surge risk zonation maps for the five typhoon scenarios: (a) 915 hPa, (b) 925 hPa, (c) 935 hPa, (d) 945 hPa, (e) 955 hPa.
Figure 9.
Storm surge risk under the five typhoon scenarios. (a) Area by risk level (km2). (b) Percentage of the total area classified for risk in each risk level for each scenario.
Figure 9a shows that the total classified risk area increases from approximately 1.25 km2 at 955 hPa to 4.69 km2 at 945 hPa, 34.69 km2 at 935 hPa, 42.45 km2 at 925 hPa, and 47.90 km2 at 915 hPa. Figure 9b shows a concurrent change in risk composition. At 955 hPa, low risk is the largest category (approximately 34%), followed by medium risk (30%). High and medium risk together account for approximately 80% at 945 hPa and 69% at 935 hPa. At 925 hPa, high risk remains the largest category (36%), while extremely high risk accounts for 26%. Under the 915 hPa scenario, extremely high risk becomes the largest category (41%), followed by high risk (27%), medium risk (26%), and low risk (6%). Thus, the larger classified area under the stronger scenarios also contains a greater proportion of extremely high risk.
The comparison between Figure 5 and Figure 9 shows that hazard and risk have different category distributions. Under the 915 hPa scenario, extremely high hazard accounts for approximately 4% of the classified inundation area, whereas extremely high risk accounts for approximately 41% of the classified risk area. High hazard is the dominant hazard category, but extremely high risk is the dominant risk category.
Figure 10 shows differences among the four subdistricts. For each subdistrict, the percentages represent the area of each risk level relative to the total area of that subdistrict. Under the 915 hPa scenario, Qiandao has the largest proportion of extremely high risk (approximately 23%), compared with about 10–12% in the other three subdistricts. High risk is the largest category in Donggang, accounting for approximately 13%, whereas extremely high risk is the largest category in Shenjiamen and Lincheng, accounting for approximately 11% and 12%, respectively. At 925 hPa, high risk is the largest category in Donggang, Shenjiamen, and Qiandao. At 935 hPa, high risk is the largest category in all four subdistricts. The proportions decline substantially under the 945 and 955 hPa scenarios.
Figure 10.
Proportions of different storm surge risk level zones for the four subdistricts under five typhoon scenarios: (a) Donggang, (b) Shenjiamen, (c) Qiandao, (d) Lincheng.
4. Discussion
4.1. Multi-Source Geospatial Data for Exposure and Vulnerability Mapping
Land-cover products describe the physical surface but provide less information about the functions of urban parcels [28,69,70]. This distinction matters for storm surge assessment because residential, commercial, industrial, and public-service areas can occupy similar built-up surfaces while containing different exposed activities. Previous flood-mapping and coastal assessment studies have combined physical and socioeconomic information to characterize this exposure [12,71,72]. In the present study, EULUC supplies the functional categories to which the vulnerability coefficients are assigned [14].
POI-based classification uses the distribution of urban activities to identify functional zones [28,73], with road networks providing spatial units for aggregating these points [31]. AOI polygons complement these data by providing parcel boundaries and functional labels. Within the integrated workflow, AOIs subdivide road-defined units and supply functional information within covered parcels, while weighted POI densities support classification outside AOI coverage. The resulting functional distinctions have two roles in this assessment. First, categories assigned different vulnerability levels can produce different risk levels under the same hazard class. Second, categories assigned the same coefficient retain different functional labels. Commercial and industrial land both have a coefficient of 0.80, so their distinction does not change the matrix outcome under the same hazard class; it identifies the activities present within that risk zone. Functional classification therefore supports both the risk calculation and the interpretation of exposed urban activities.
4.2. Value and Positioning of the Semi-Quantitative Risk Matrix Approach
The risk matrix explains why the dominant risk category differs from the dominant hazard category. Under the 915 hPa scenario, extremely high hazard accounts for approximately 4% of the classified inundation area, whereas extremely high risk accounts for approximately 41% of the classified risk area (Figure 5 and Figure 9). Table 4 assigns extremely high risk to high hazard combined with extremely high vulnerability, as well as to extremely high hazard combined with high or extremely high vulnerability. Under high inundation hazard, areas with extremely high vulnerability are classified as extremely high risk.
This calculation combines ordinal depth and vulnerability classes. It complements coastal vulnerability indices [13] by retaining the spatial correspondence between simulated inundation and land-use functions. Quantitative loss assessments additionally require asset inventories and depth–damage relationships to estimate monetary consequences [74]. Access to such data can influence the feasibility and coverage of flood assessment [75]. The present study focuses on urban functional categories and their integration with inundation-depth classes to produce scenario-conditioned risk zones for identifying affected activities and prioritizing detailed assessment. Here, the matrix provides a common classification for comparing the tested scenarios and locating affected functional zones.
The coefficients enter the risk calculation through their assigned vulnerability levels. Values within the same interval therefore produce the same matrix outcome for a fixed hazard class, whereas values on opposite sides of a boundary can produce different outcomes. For example, coefficients of 0.74 and 0.76 fall into Levels II and I, respectively. Risk differences near these boundaries should be interpreted in light of the ordinal classification [76]. The four-level matrix provides a consistent basis for comparing the tested scenarios, while multidimensional extensions could incorporate additional criteria [77].
4.3. Implications for Coastal Risk Management
The subdistrict comparison identifies different spatial priorities. Under the 945 hPa scenario, mapped risk extends into urban land behind the Donggang dike, while under stronger scenarios it becomes more widespread across all four subdistricts. Qiandao has the largest plotted proportion of extremely high risk under the 915 hPa scenario (Figure 10). Together, these patterns indicate where local inspection and emergency planning should focus within each tested scenario.
Within these areas, functional categories help specify the management task. Residential areas and public-service facilities call for evacuation routes, emergency access, and continuity of essential services. Commercial and industrial areas require attention to asset protection and operational disruption. Transportation corridors connect these activities and are important for emergency mobility. Parcels assigned the same risk level can therefore require different actions according to their function.
Locations repeatedly mapped as high or extremely high risk can be prioritized for checking dike condition, crest elevations, and access routes. Site-level assessment can then combine the mapped inundation with local infrastructure records to examine protection requirements. This sequence connects the subdistrict-scale results to specific facilities and coastal segments without treating a single pressure scenario as a universal protection threshold.
4.4. Limitations and Future Research Directions
The reliability of the inundation assessment is influenced by terrain representation, coastal-defense data, and vertical referencing. The 30 m FABDEM, 30–50 m coastal mesh, and approximately 200 m spacing of surveyed dike elevations may not resolve narrow openings, small barriers, or local crest variations. Building-induced flow obstruction is also not explicitly represented, which may affect local flood pathways and inundation extent in developed areas [38,78]. In addition, the approximate MDT-based elevation conversion may retain residual offsets associated with differences between EGM2008 and the geoid reference underlying CNES-CLS18. Such offsets can influence calculated inundation depths, particularly in low-lying areas. Future work should improve the consistency of vertical references and incorporate more detailed terrain, building, and coastal-defense information.
Converting FVCOM outputs to a regular raster introduces additional uncertainty near dikes and narrow barriers. Marine nodes were excluded and land nodes with zero inundation depth were retained before interpolation. Even with this preprocessing, IDW can smooth local depth gradients and inundation boundaries. Clipping the raster to the triangular-mesh coverage limits its spatial extent without explicitly preserving hydraulic connectivity. The effect of this smoothing on the mapped inundation extent was not quantified. Specifically, no quantitative comparison was performed between the IDW-derived inundation raster and the wet-element footprint of the native FVCOM mesh. As a result, localized spurious inundation across dikes cannot be ruled out. In addition, coastal gauge comparisons evaluated coastal water levels and storm surges, while independent observations of urban flood extent, depth, and local overtopping were unavailable.
The EULUC classification depends on the coverage and attributes of the POI/AOI datasets, together with the KDE bandwidth, category weights, and classification threshold [65,66]. Uneven data coverage may affect the identification of urban functions, particularly where activity records are sparse or mixed uses occur within a single spatial unit. The citywide accuracy assessment evaluates the combined workflow, while the independent contribution of AOIs and sensitivity to the adopted parameters were not quantified. An expanded reference dataset within the four subdistricts, supported by building, population, and nighttime-light information, would strengthen local evaluation [79].
The vulnerability coefficients represent relative sensitivity at the land-use category level and do not resolve differences in asset value, construction characteristics, or adaptive capacity within each category. Arithmetic averaging for mixed-function zones also assumes equal contributions from their constituent functions. These choices affect vulnerability-level assignment and, through the ordinal risk matrix, the resulting risk classes. Future work should examine alternative weights based on functional area or asset composition and refine vulnerability assignments using local inventories and observed damage [80]. Incorporating social vulnerability and adaptive capacity would provide a broader representation of potential consequences [81]. A probabilistic storm framework would further extend the present scenario comparisons to estimates of flood occurrence probabilities and expected losses.
Four analyses are priorities for future work. First, a quantitative comparison between the IDW-derived inundation extent and the native FVCOM wet-element footprint would measure their spatial agreement and identify discrepancies near dikes. Second, an AOI ablation experiment would compare EULUC maps generated with and without AOI data under otherwise identical settings to assess how AOIs affect functional classification and subsequent risk zonation. Third, sensitivity tests would examine how IDW settings and raster resolution affect the mapped inundation extent, how KDE bandwidth, category weights, and the classification threshold affect EULUC mapping and subsequent risk zonation, and how alternative vulnerability coefficients affect the resulting risk classes. Fourth, validation against historical urban flood observations would compare simulated inundation patterns for documented typhoons with available satellite-derived flood extents, surveyed flood depths, and records of local dike overtopping.
5. Conclusions
This study developed an integrated, semi-quantitative framework for assessing storm surge flood risk in four subdistricts of Zhoushan, China. Points of interest, areas of interest, OpenStreetMap roads, and land-cover data were integrated to construct an Essential Urban Land Use/Cover (EULUC) map. Maximum inundation depths from FVCOM simulations were used to classify inundation hazard under five typhoon central-pressure scenarios. A hazard–vulnerability matrix combined these hazard classes with land-use vulnerability coefficients to delineate storm surge risk zones.
The total area classified for storm surge risk increased from 1.25 km2 under the 955 hPa scenario to 47.90 km2 under the 915 hPa scenario, with the largest increase occurring between 945 and 935 hPa, from 4.69 to 34.69 km2. The composition of the classified area also changed. At 925 hPa, high risk was the largest class (36%), while extremely high risk accounted for 26%. At 915 hPa, extremely high risk became the largest class, covering approximately 19.6 km2 (41%), followed by high risk at approximately 12.9 km2 (27%). Together, these two classes accounted for approximately 68% of the total area classified for risk under the 915 hPa scenario.
The dominant risk class differed among subdistricts. Under the 915 hPa scenario, high risk was the largest class in Donggang, whereas extremely high risk dominated in Shenjiamen and Lincheng. Qiandao had the largest share of extremely high-risk area relative to its total subdistrict area. The risk matrix also showed how high inundation hazard could result in extremely high risk where it coincided with extremely high land-use vulnerability. Within the same risk class, the EULUC map distinguished affected residential, public-service, commercial, industrial, transportation, and mixed-use areas, helping identify which urban functions may require priority attention. The framework supports scenario-based risk screening and helps prioritize locations for detailed assessment of coastal protection, evacuation access, and continuity of urban functions.
Supplementary Materials
The following supporting information can be downloaded at: https://www.mdpi.com/article/10.3390/w18222834/s1, Figure S1. Sketch of the combination (a) and separation (b) of the tracer control element (TCE) along a breakwater structure. The blue regions indicate the TCEs. Figure S2. Historical typhoon tracks and locations of the tide-gauge stations used for model evaluation. Tracks were obtained from the CMA best-track dataset. Figure S3. Simulated (blue) and observed (red) water levels and storm surges at the tide-gauge stations during three historical typhoons. Figure S4. Distribution of historical tropical cyclone minimum central pressure within 600 km of Zhoushan. Figure S5. Synthetic tropical cyclone tracks used in the Zhoushan simulations. Figure S6. Spatial envelopes of maximum inundation depth for five central-pressure scenarios: (a) 915 hPa, (b) 925 hPa, (c) 935 hPa, (d) 945 hPa, and (e) 955 hPa. Figure S7. Essential urban land use/cover (EULUC) classification map of Zhoushan City. Table S1. Tide-gauge locations and observation periods for the historical typhoon events. Table S2. Comparison of simulated and observed maximum total water levels and storm surges during three historical typhoon events. Table S3. Input parameters for the five synthetic typhoon intensity scenarios. Table S4. Class-specific road-buffer distances adopted for spatial unit delineation. Table S5. Confusion matrix for the five urban functional categories in Zhoushan City. Table S6. Source land-use vulnerability coefficients and corresponding vulnerability levels. References [36,45,52,53,55,56,57,61,82] are cited in the Supplementary Materials.
Author Contributions
B.C.: Conceptualization, Methodology, Software, Validation, Formal analysis, Investigation, Resources, Data curation, Writing—original draft, Writing—review and editing, Visualization. H.S.: Validation, Investigation, Writing—review and editing. W.F.: Resources, Investigation. Z.C.: Methodology, Software, Validation. X.L.: Methodology, Validation, Writing—review and editing. Z.Y.: Supervision, Project administration, Funding acquisition, Writing—review and editing. All authors have read and agreed to the published version of the manuscript.
Funding
This research was funded by the National Natural Science Foundation of China (grant numbers 42430407 and 12304502), the Guizhou Provincial Science and Technology Department (Major Project grant Qiankehe Zhongda [2026]019, General Project grant Qiankehe Yiban [2024]131, and grant BSH[2023]001), and the Postdoctoral Fund of POWERCHINA GUIYANG Engineering Corporation Limited (grant number YJBSXM260002).
Data Availability Statement
The data that support the findings of this study are available from the corresponding author upon reasonable request. The FVCOM code is publicly available through the FVCOM website (https://fvcom.smast.umassd.edu/). GEBCO bathymetry data are available at https://www.gebco.net/. Information on FABDEM topography is available at https://www.fathom.global/product/fabdem/ (accessed on 10 November 2026). ESA WorldCover data are available at https://esa-worldcover.org/. OpenStreetMap data are available at https://www.openstreetmap.org/. The 2020 POI records were obtained from the Amap Open Platform (https://lbs.amap.com/), and the 2020 AOI polygons were obtained through the Baidu Maps API (https://lbsyun.baidu.com/). Access and reuse are subject to the terms of the respective platforms. The citywide EULUC classification was clipped to the four-subdistrict boundary for this study. Observed water level data were provided by the Zhejiang Province Ocean and Fisheries Bureau and are available upon request with the permission of the bureau. Dike survey records were provided by the Second Surveying and Mapping Institute of Zhejiang Province and are available upon request with the permission of the institute.
Acknowledgments
We thank our colleagues at PowerChina Guiyang Engineering Corporation Limited for their assistance with data collection and model application. We acknowledge the European Space Agency for the Sentinel-2 imagery and WorldCover 2020 land-cover data, the China Meteorological Administration for the tropical cyclone best-track data, the European Centre for Medium-Range Weather Forecasts for the ERA5 reanalysis, the FABDEM team for the elevation data, and OpenStreetMap contributors for the road network data. We also thank the Zhejiang Province Ocean and Fisheries Bureau for providing the observed water levels and the Second Surveying and Mapping Institute of Zhejiang Province for providing the dike survey data. We thank the editor and the two anonymous reviewers for their constructive feedback, which helped improve the manuscript. Generative AI tools were used for language polishing and formatting. The authors reviewed and approved all AI-assisted content and take full responsibility for the accuracy and integrity of the work.
Conflicts of Interest
Author Bairu Chen; Han Shao, Weijia Feng and Xinyi Liu were employed by the company Research Institute of Engineering Safety Science, PowerChina Guiyang Engineering Corporation Limited. Author Zhou Yang was employed by the company Dongfeng Hydropower Plant, Guizhou Wujiang Hydropower Development Co., Ltd. The remaining authors declare that the research was conducted in the absence of any commercial or financial relationships that could be construed as a potential conflict of interest. The authors declare that this study received funding from Postdoctoral Fund of PowerChina Guiyang Engineering Corporation Limited. The funder was not involved in the study design, collection, analysis, interpretation of data, the writing of this article or the decision to submit it for publication.
References
- Muis, S.; Haigh, I.D.; Guimarães Nobre, G.; Aerts, J.C.J.H.; Ward, P.J. Influence of El Niño-Southern Oscillation on global coastal flooding. Earth’s Future 2018, 6, 1311–1322. [Google Scholar] [CrossRef] [Scilit]
- Wu, K.; Wang, C.; Wu, L.; Zhao, H.; Cao, J. Slowdown in landfalling tropical cyclone motion in south China. Geophys Res. Lett. 2022, 49, e2022GL100428. [Google Scholar] [CrossRef] [Scilit]
- Hauer, M.E.; Hardy, D.; Kulp, S.A.; Mueller, V.; Wrathall, D.J.; Clark, P.U. Assessing population exposure to coastal flooding due to sea level rise. Nat. Commun. 2021, 12, 6900. [Google Scholar] [CrossRef] [Scilit] [PubMed]
- Vousdoukas, M.I.; Mentaschi, L.; Hinkel, J.; Ward, P.J.; Mongelli, I.; Ciscar, J.-C.; Feyen, L. Economic motivation for raising coastal flood defenses in Europe. Nat. Commun. 2020, 11, 2119. [Google Scholar] [CrossRef] [Scilit] [PubMed]
- Mori, N.; Shimura, T. Tropical cyclone-induced coastal sea level projection and the adaptation to a changing climate. Camb. Prism. Coast. Futur. 2023, 1, e4. [Google Scholar] [CrossRef] [Scilit]
- Nicholls, R.J.; Lincke, D.; Hinkel, J.; Brown, S.; Vafeidis, A.T.; Meyssignac, B.; Hanson, S.E.; Merkens, J.-L.; Fang, J. A global analysis of subsidence, relative sea-level change and coastal flood exposure. Nat. Clim. Change 2021, 11, 338–342, Correction in Nat. Clim. Change 2021, 11, 634. [Google Scholar] [CrossRef] [Scilit]
- Granger, K. Quantifying storm tide risk in Cairns. Nat. Hazards 2003, 30, 165–185. [Google Scholar] [CrossRef] [Scilit]
- Shepard, C.C.; Agostini, V.N.; Gilmer, B.; Allen, T.; Stone, J.; Brooks, W.; Beck, M.W. Assessing future risk: Quantifying the effects of sea level rise on storm surge risk for the southern shores of Long Island, New York. Nat. Hazards 2012, 60, 727–745. [Google Scholar] [CrossRef] [Scilit]
- Shi, X.; Chen, B.; Liang, Y.; Zhang, B.; Ye, T. Inundation simulation of different return periods of storm surge based on a numerical model and observational data. Stoch. Environ. Res. Risk Assess. 2021, 35, 2093–2103. [Google Scholar] [CrossRef] [Scilit]
- Chu, D.; Zhang, J.; Wu, Y.; Jiao, X.; Qian, S. Sensitivities of modelling storm surge to bottom friction, wind drag coefficient, and meteorological product in the East China Sea. Estuar. Coast. Shelf Sci. 2019, 231, 106460. [Google Scholar] [CrossRef] [Scilit]
- Li, L.; Li, Z.; He, Z.; Yu, Z.; Ren, Y. Investigation of storm tides induced by super typhoon in macro-tidal Hangzhou Bay. Front. Mar. Sci. 2022, 9, 890285. [Google Scholar] [CrossRef] [Scilit]
- Wang, S.; Mu, L.; Qi, M.; Yu, Z.; Yao, Z.; Zhao, E. Quantitative risk assessment of storm surge using GIS techniques and open data: A case study of Daya Bay Zone, China. J. Environ. Manag. 2021, 289, 112514. [Google Scholar] [CrossRef] [Scilit] [PubMed]
- Tragaki, A.; Gallousi, C.; Karymbalis, E. Coastal hazard vulnerability assessment based on geomorphic, oceanographic and demographic parameters: The case of the Peloponnese (Southern Greece). Land 2018, 7, 56. [Google Scholar] [CrossRef] [Scilit]
- Wang, S.; Mu, L.; Yao, Z.; Gao, J.; Zhao, E.; Wang, L. Assessing and zoning of typhoon storm surge risk with a geographic information system (GIS) technique: A case study of the coastal area of Huizhou. Nat. Hazards Earth Syst. Sci. 2021, 21, 439–462. [Google Scholar] [CrossRef] [Scilit]
- Su, X.; Shao, W.; Liu, J.; Jiang, Y.; Wang, K. Dynamic assessment of the impact of flood disaster on economy and population under extreme rainstorm events. Remote Sens. 2021, 13, 3924. [Google Scholar] [CrossRef] [Scilit]
- Van de Voorde, T.; Jacquet, W.; Canters, F. Mapping form and function in urban areas: An approach based on urban metrics and continuous impervious surface data. Landsc. Urban Plan. 2011, 102, 143–155. [Google Scholar] [CrossRef] [Scilit]
- Wellmann, T.; Lausch, A.; Andersson, E.; Knapp, S.; Cortinovis, C.; Jache, J.; Scheuer, S.; Kremer, P.; Mascarenhas, A.; Kraemer, R.; et al. Remote sensing in urban planning: Contributions towards ecologically sound policies? Landsc. Urban Plan. 2020, 204, 103921. [Google Scholar] [CrossRef] [Scilit]
- Zanaga, D.; Van De Kerchove, R.; De Keersmaecker, W.; Souverijns, N.; Brockmann, C.; Quast, R.; Wevers, J.; Grosu, A.; Paccini, A.; Vergnaud, S.; et al. ESA WorldCover 10 m 2020 v100; ESA: Paris, France, 2021. [Google Scholar] [CrossRef]
- Hao, M.; Dong, X.; Jiang, D.; Yu, X.; Ding, F.; Zhuo, J. Land-use classification based on high-resolution remote sensing imagery and deep learning models. PLoS ONE 2024, 19, e0300473. [Google Scholar] [CrossRef] [Scilit] [PubMed]
- Yin, J.; Dong, J.; Hamm, N.A.S.; Li, Z.; Wang, J.; Xing, H.; Fu, P. Integrating remote sensing and geospatial big data for urban land use mapping: A review. Int. J. Appl. Earth Obs. Geoinf. 2021, 103, 102514. [Google Scholar] [CrossRef] [Scilit]
- Chang, S.; Wang, Z.; Mao, D.; Liu, F.; Lai, L.; Yu, H. Identifying urban functional areas in China’s Changchun City from Sentinel-2 images and social sensing data. Remote Sens. 2021, 13, 4512. [Google Scholar] [CrossRef] [Scilit]
- Chen, S.; Zhang, H.; Yang, H. Urban functional zone recognition integrating multisource geographic data. Remote Sens. 2021, 13, 4732. [Google Scholar] [CrossRef] [Scilit]
- Huang, C.; Xiao, C.; Rong, L. Integrating point-of-interest density and spatial heterogeneity to identify urban functional areas. Remote Sens. 2022, 14, 4201. [Google Scholar] [CrossRef] [Scilit]
- Xu, R.; Chen, Z.; Li, F.; Zhou, C. Identification of urban functional zones based on POI density and marginalized graph autoencoder. ISPRS Int. J. Geo-Inf. 2023, 12, 343. [Google Scholar] [CrossRef] [Scilit]
- Yu, L.; Qin, H.; Wei, W.; Ma, J.; Weng, Y.; Jiang, H.; Mu, L. Storm surge risk assessment based on LULC identification utilizing deep learning method and multi-source data fusion: A case study of Huizhou City. Remote Sens. 2025, 17, 657. [Google Scholar] [CrossRef] [Scilit]
- Ren, L.; Li, F.; Chen, B.; Chen, Q.; Ye, G.; Yang, X. China’s wealth capital stock mapping via machine learning methods. Remote Sens. 2023, 15, 689. [Google Scholar] [CrossRef] [Scilit]
- Kong, L.; Liu, Z.; Wu, J. A systematic review of big data-based urban sustainability research: State-of-the-science and future directions. J. Clean. Prod. 2020, 273, 123142. [Google Scholar] [CrossRef] [Scilit]
- Gong, P.; Chen, B.; Li, X.; Liu, H.; Wang, J.; Bai, Y.; Chen, J.; Chen, X.; Fang, L.; Feng, S.; et al. Mapping essential urban land use categories in China (EULUC-China): Preliminary results for 2018. Sci. Bull. 2020, 65, 182–187. [Google Scholar] [CrossRef] [Scilit] [PubMed]
- Heiden, U.; Heldens, W.; Roessner, S.; Segl, K.; Esch, T.; Mueller, A. Urban structure type characterization using hyperspectral remote sensing and height information. Landsc. Urban Plan. 2012, 105, 361–375. [Google Scholar] [CrossRef] [Scilit]
- Zhang, X.; Du, S. A linear Dirichlet mixture model for decomposing scenes: Application to analyzing urban functional zonings. Remote Sens. Environ. 2015, 169, 37–49. [Google Scholar] [CrossRef] [Scilit]
- Liu, X.; Long, Y. Automated identification and characterization of parcels with OpenStreetMap and points of interest. Environ. Plan. B Plan. Des. 2016, 43, 341–360. [Google Scholar] [CrossRef] [Scilit]
- Liu, T.; Chen, H.; Ren, J.; Zhang, L.; Chen, H.; Hong, R.; Li, C.; Cui, W.; Guo, W.; Wen, C. Urban functional zone classification via advanced multi-modal data fusion. Sustainability 2024, 16, 11145. [Google Scholar] [CrossRef] [Scilit]
- Izzo, S.; Prezioso, E.; Giampaolo, F.; Mele, V.; Di Somma, V.; Mei, G. Classification of urban functional zones through deep learning. Neural Comput. Appl. 2022, 34, 6973–6990. [Google Scholar] [CrossRef] [Scilit]
- Lv, Y.; Zheng, X.; Zhou, L.; Zhang, L. Decentralization and polycentricity: Spatial changes of employment in Beijing metropolitan area, China. Sustainability 2017, 9, 1880. [Google Scholar] [CrossRef] [Scilit]
- Xu, N.; Luo, J.; Wu, T.; Dong, W.; Liu, W.; Zhou, N. Identification and portrait of urban functional zones based on multisource heterogeneous data and ensemble learning. Remote Sens. 2021, 13, 373. [Google Scholar] [CrossRef] [Scilit]
- Lu, X.; Yu, H.; Ying, M.; Zhao, B.; Zhang, S.; Lin, L.; Bai, L.; Wan, R. Western North Pacific tropical cyclone database created by the China Meteorological Administration. Adv. Atmos. Sci. 2021, 38, 690–699. [Google Scholar] [CrossRef] [Scilit]
- Zhang, X.; Pan, D.; Chen, J.; Zhao, J.; Zhu, Q.; Huang, H. Evaluation of coastline changes under human intervention using multi-temporal high-resolution images: A case study of the Zhoushan Islands, China. Remote Sens. 2014, 6, 9930–9950. [Google Scholar] [CrossRef] [Scilit]
- Li, W.; Liu, B.; Hu, P.; He, Z.; Zou, J. Porous shallow water modeling for urban floods in the Zhoushan City, China. Front. Earth Sci. 2021, 9, 687311. [Google Scholar] [CrossRef] [Scilit]
- Zhao, S.; Liu, Z.; Wei, X.; Li, B.; Bai, Y. Intercomparison of empirical formulations of maximum wind radius in parametric tropical storm modeling over Zhoushan archipelago. Sustainability 2021, 13, 11673. [Google Scholar] [CrossRef] [Scilit]
- Sun, Z.; Zhong, S.; Wang, C.; Tu, W.; Ji, H. Simulation and analysis of storm surge at Zhoushan fishing port. Haiyang Xuebao 2020, 42, 136–143. [Google Scholar] [CrossRef]
- Figueiredo, R.; Rangel-Parra, R.; Bussi, G.; Ceresa, P.; Coccia, G.; Martina, M.L.V. A semi-quantitative multi-hazard risk assessment framework for European coastal urban areas. Geomat. Nat. Hazards Risk 2024, 15, 2378994. [Google Scholar] [CrossRef] [Scilit]
- Chen, B.; He, J.; He, Z.; Li, L.; Chen, Q.; Li, F.; Chu, D.; Cao, Z.; Yang, X. Potential impacts of storm surge-induced flooding based on refined exposure estimation: A case study in Zhoushan Island, China. Geomat. Nat. Hazards Risk 2023, 14, 2232080. [Google Scholar] [CrossRef] [Scilit]
- Mayer, L.; Jakobsson, M.; Allen, G.; Dorschel, B.; Falconer, R.; Ferrini, V.; Lamarche, G.; Snaith, H.; Weatherall, P. The Nippon Foundation—GEBCO Seabed 2030 Project: The quest to see the world’s oceans completely mapped by 2030. Geosciences 2018, 8, 63. [Google Scholar] [CrossRef] [Scilit]
- Hersbach, H.; Bell, B.; Berrisford, P.; Hirahara, S.; Horányi, A.; Muñoz-Sabater, J.; Nicolas, J.; Peubey, C.; Radu, R.; Schepers, D.; et al. The ERA5 global reanalysis. Q. J. R. Meteorol. Soc. 2020, 146, 1999–2049. [Google Scholar] [CrossRef] [Scilit]
- Egbert, G.D.; Erofeeva, S.Y. Efficient inverse modeling of barotropic ocean tides. J. Atmos. Ocean Technol. 2002, 19, 183–204. [Google Scholar] [CrossRef] [Scilit]
- Hawker, L.; Uhe, P.; Paulo, L.; Sosa, J.; Savage, J.; Sampson, C.; Neal, J. A 30 m global map of elevation with forests and buildings removed. Environ. Res. Lett. 2022, 17, 024016. [Google Scholar] [CrossRef] [Scilit]
- Mulet, S.; Rio, M.-H.; Etienne, H.; Artana, C.; Cancet, M.; Dibarboure, G.; Feng, H.; Husson, R.; Picot, N.; Provost, C.; et al. The new CNES-CLS18 global mean dynamic topography. Ocean Sci. 2021, 17, 789–808. [Google Scholar] [CrossRef] [Scilit]
- Amap. Amap Open Platform. POI Data for Zhoushan City. 2020. Available online: https://lbs.amap.com/ (accessed on 3 January 2025).
- Baidu, I. Baidu Maps Open Platform. AOI Data for Zhoushan City. 2020. Available online: https://lbsyun.baidu.com/ (accessed on 3 January 2025).
- OpenStreetMap Contributors. OpenStreetMap. OpenStreetMap Foundation. Available online: https://www.openstreetmap.org/ (accessed on 3 January 2025).
- Chen, C.; Beardsley, R.C.; Cowles, G.; Qi, J.; Lai, Z.; Gao, G.; Stuebe, D.; Liu, H.; Xu, Q.; Xue, P.; et al. An unstructured-grid, finite-volume community ocean model: FVCOM user manual. Sea Grant Coll Prog Mass Inst Technol 2012. [Google Scholar]
- Chen, C.; Qi, J.; Li, C.; Beardsley, R.C.; Lin, H.; Walker, R.; Gates, K. Complexity of the flooding/drying process in an estuarine tidal-creek salt-marsh system: An application of FVCOM. J. Geophys. Res. Ocean. 2008, 113, C07052. [Google Scholar] [CrossRef] [Scilit]
- Ge, J.; Chen, C.; Qi, J.; Ding, P.; Beardsley, R.C. A dike–groyne algorithm in a terrain-following coordinate ocean model (FVCOM): Development, validation and application. Ocean Model. 2012, 47, 26–40. [Google Scholar] [CrossRef] [Scilit]
- He, Z.; Tang, Y.; Xia, Y.; Chen, B.; Xu, J.; Yu, Z.; Li, L. Interaction impacts of tides, waves and winds on storm surge in a channel-island system: Observational and numerical study in Yangshan Harbor. Ocean Dyn. 2020, 70, 307–325. [Google Scholar] [CrossRef] [Scilit]
- Jelesnianski, C.P. A numerical calculation of storm tides induced by a tropical storm impinging on a continental shelf. Mon. Weather Rev. 1965, 93, 343–358. [Google Scholar] [CrossRef] [Scilit]
- Cheung, K.F.; Tang, L.; Donnelly, J.P.; Scileppi, E.M.; Liu, K.B.; Mao, X.Z.; Houston, S.H.; Murnane, R.J. Numerical modeling and field evidence of coastal overwash in southern New England from Hurricane Bob and implications for paleotempestology. J. Geophys. Res. 2007, 112, F03024. [Google Scholar] [CrossRef] [Scilit]
- Ministry of Natural Resources of the People’s Republic of China. Technical Directives for Risk Assessment and Zoning of Marine Disaster—Part 1: Storm Surge. HY/T 0273-2019. 2019. Available online: https://www.cgs.gov.cn/tzgg/tzgg/201912/t20191226_804811.html (accessed on 12 October 2026).
- Li, Y.; Fang, W.; Lin, W.; Ye, Y. Parameterization of synthetic tropical cyclones at various scales for probable maximum storm surge risk modeling. Mar. Sci. 2014, 38, 71–80. [Google Scholar]
- The MathWorks Inc. MATLAB. Version 2021a; The MathWorks Inc: Natick, MA, USA, 2021. [Google Scholar]
- QGIS Geographic Information System; Version 3.20.1; Open Source Geospatial Foundation Project; QGIS Development Team: Laax, Switzerland, 2021; Available online: https://qgis.org (accessed on 3 January 2025).
- Sun, J.; Wang, H.; Song, Z.; Lu, J.; Meng, P.; Qin, S. Mapping essential urban land use categories in Nanjing by integrating multi-source big data. Remote Sens. 2020, 12, 2386. [Google Scholar] [CrossRef] [Scilit]
- GB 50137-2011[S]; Ministry of Housing and Urban-Rural Development of the People’s Republic of China. Code for Classification of Urban Land Use and Planning Standards of Development Land. China Architecture & Building Press: Beijing, China, 2011.
- Chen, Y.-C. A tutorial on kernel density estimation and recent advances. Biostat. Epidemiol. 2017, 1, 161–187. [Google Scholar] [CrossRef] [Scilit]
- Terrell, G.R.; Scott, D.W. Variable kernel density estimation. Ann. Stat. 1992, 20, 1236–1265. [Google Scholar] [CrossRef] [Scilit]
- Lin, A.; Sun, X.; Wu, H.; Luo, W.; Wang, D.; Zhong, D.; Wang, Z.; Zhao, L.; Zhu, J. Identifying urban building function by integrating remote sensing imagery and POI data. IEEE J. Sel. Top. Appl. Earth Obs. Remote Sens. 2021, 14, 8864–8875. [Google Scholar] [CrossRef] [Scilit]
- Xue, B.; Zhao, B.Y.; Xiao, X.; Li, J.Z.; Xie, X.; Ren, W.X. A POI data-based study on urban functional areas of the resources-based city: A case study of Benxi, Liaoning. Hum. Geogr. 2020, 35, 81–90. [Google Scholar] [CrossRef]
- Hu, Y.; Han, Y. Identification of urban functional areas based on POI data: A case study of the Guangzhou economic and technological development zone. Sustainability 2019, 11, 1385. [Google Scholar] [CrossRef] [Scilit]
- Luo, S.; Liu, Y.; Du, M.; Gao, S.; Wang, P.; Liu, X. The influence of spatial grid division on the layout analysis of urban functional areas. ISPRS Int. J. Geo-Inf. 2021, 10, 189. [Google Scholar] [CrossRef] [Scilit]
- Karra, K.; Kontgis, C.; Statman-Weil, Z.; Mazzariello, J.C.; Mathis, M.; Brumby, S.P. Global land use/land cover with Sentinel 2 and deep learning. In Proceedings of the 2021 IEEE International Geoscience and Remote Sensing Symposium IGARSS, Brussels, Belgium, 11–16 July 2021; pp. 4704–4707. [Google Scholar] [CrossRef] [Scilit]
- Venter, Z.S.; Barton, D.N.; Chakraborty, T.; Simensen, T.; Singh, G. Global 10 m land use land cover datasets: A comparison of Dynamic World, World Cover and Esri Land Cover. Remote Sens. 2022, 14, 4101. [Google Scholar] [CrossRef] [Scilit]
- Keya, T.A.; Balakrishnan, S.S.; Solayappan, M.; Dheena Dhayalan, S.S.; Subramaniam, S.; An, L.J.; Leela, A.; Fernandez, K.; Kumar, P.; Lokeshmaran, A.; et al. Enhancing precision flood mapping: Pahang’s vulnerability unveiled. PLoS ONE 2024, 19, e0310435. [Google Scholar] [CrossRef] [Scilit] [PubMed]
- Posen, P.E.; Beraud, C.; Harper Jones, C.; Tyllianakis, E.; Joseph-Witzig, A.; St. Louis, A. Vulnerability of coastal infrastructure and communities to extreme storms and rising sea levels: An improved model for Grenada and its dependencies. Land 2023, 12, 1418. [Google Scholar] [CrossRef] [Scilit]
- Sun, Z.; Jiao, H.; Wu, H.; Peng, Z.; Liu, L. Block2vec: An approach for identifying urban functional regions by integrating sentence embedding model and points of interest. ISPRS Int. J. Geo-Inf. 2021, 10, 339. [Google Scholar] [CrossRef] [Scilit]
- Chen, B.; He, Z.; Li, L.; Chen, Q.; He, J.; Li, F.; Chu, D.; Cao, Z.; Yang, X. Comprehensive economic losses assessment of storm surge disasters using open data: A case study of Zhoushan, China. J. Water Clim. Change 2024, 15, 3647–3665. [Google Scholar] [CrossRef] [Scilit]
- Gouett-Hanna, C.; Oulahen, G.; Henstra, D.; Thistlethwaite, J. Flood risk assessment data access and equity in Metro Vancouver. Can. Water Resour. J. 2022, 47, 202–215. [Google Scholar] [CrossRef] [Scilit]
- Cox, L.A. What’s wrong with risk matrices? Risk Anal. 2008, 28, 497–512. [Google Scholar] [CrossRef] [Scilit] [PubMed]
- Li, J.; Wang, Y.; Chen, A.; Wang, G.; Yao, X.; Wang, T. Construction and empirical testing of comprehensive risk evaluation methods from a multi-dimensional risk matrix perspective: Taking specific types of natural disasters risk in China as an example. Nat. Hazards 2023, 117, 1245–1271. [Google Scholar] [CrossRef] [Scilit]
- Zandsalimi, Z.; Feizabadi, S.; Yazdi, J.; Salehi Neyshabouri, S.A.A. Evaluating the impact of digital elevation models on urban flood modeling: A comprehensive analysis of flood inundation, hazard mapping, and damage estimation. Water Resour. Manag. 2024, 38, 4243–4268. [Google Scholar] [CrossRef] [Scilit]
- Chen, Z.; Yu, B.; Yang, C.; Zhou, Y.; Yao, S.; Qian, X.; Wang, C.; Wu, B.; Wu, J. An extended time series (2000–2018) of global NPP-VIIRS-like nighttime light data from a cross-sensor calibration. Earth Syst. Sci. Data 2021, 13, 889–906. [Google Scholar] [CrossRef] [Scilit]
- Huizinga, J.; De Moel, H.; Szewczyk, W. Global Flood Depth-Damage Functions: Methodology and the Database with Guidelines; JRC Technical Report No. EUR 28552 EN; Publications Office of the European Union: Luxembourg, 2017. [Google Scholar]
- Salman, M.A.; Rakib, M.H.; Saha, S.C.; Haque, M.E.; Hossen, M.S. Cyclone vulnerability assessment of the central coast of Bangladesh: A comprehensive study utilizing FAHP and geospatial techniques. PLoS ONE 2025, 20, e0326965. [Google Scholar] [CrossRef] [Scilit] [PubMed]
- Chang, C.-H.; Shih, H.-J.; Chen, W.-B.; Su, W.-R.; Lin, L.-Y.; Yu, Y.-C.; Jang, J.-H. Hazard assessment of typhoon-driven storm waves in the nearshore waters of Taiwan. Water 2018, 10, 926. [Google Scholar]
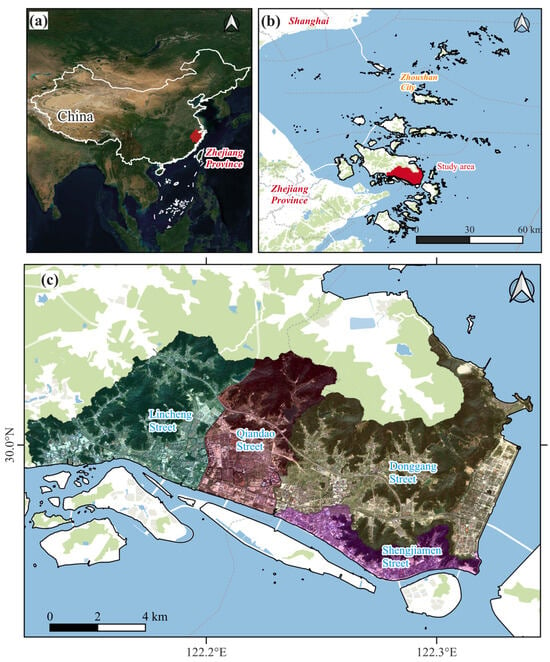
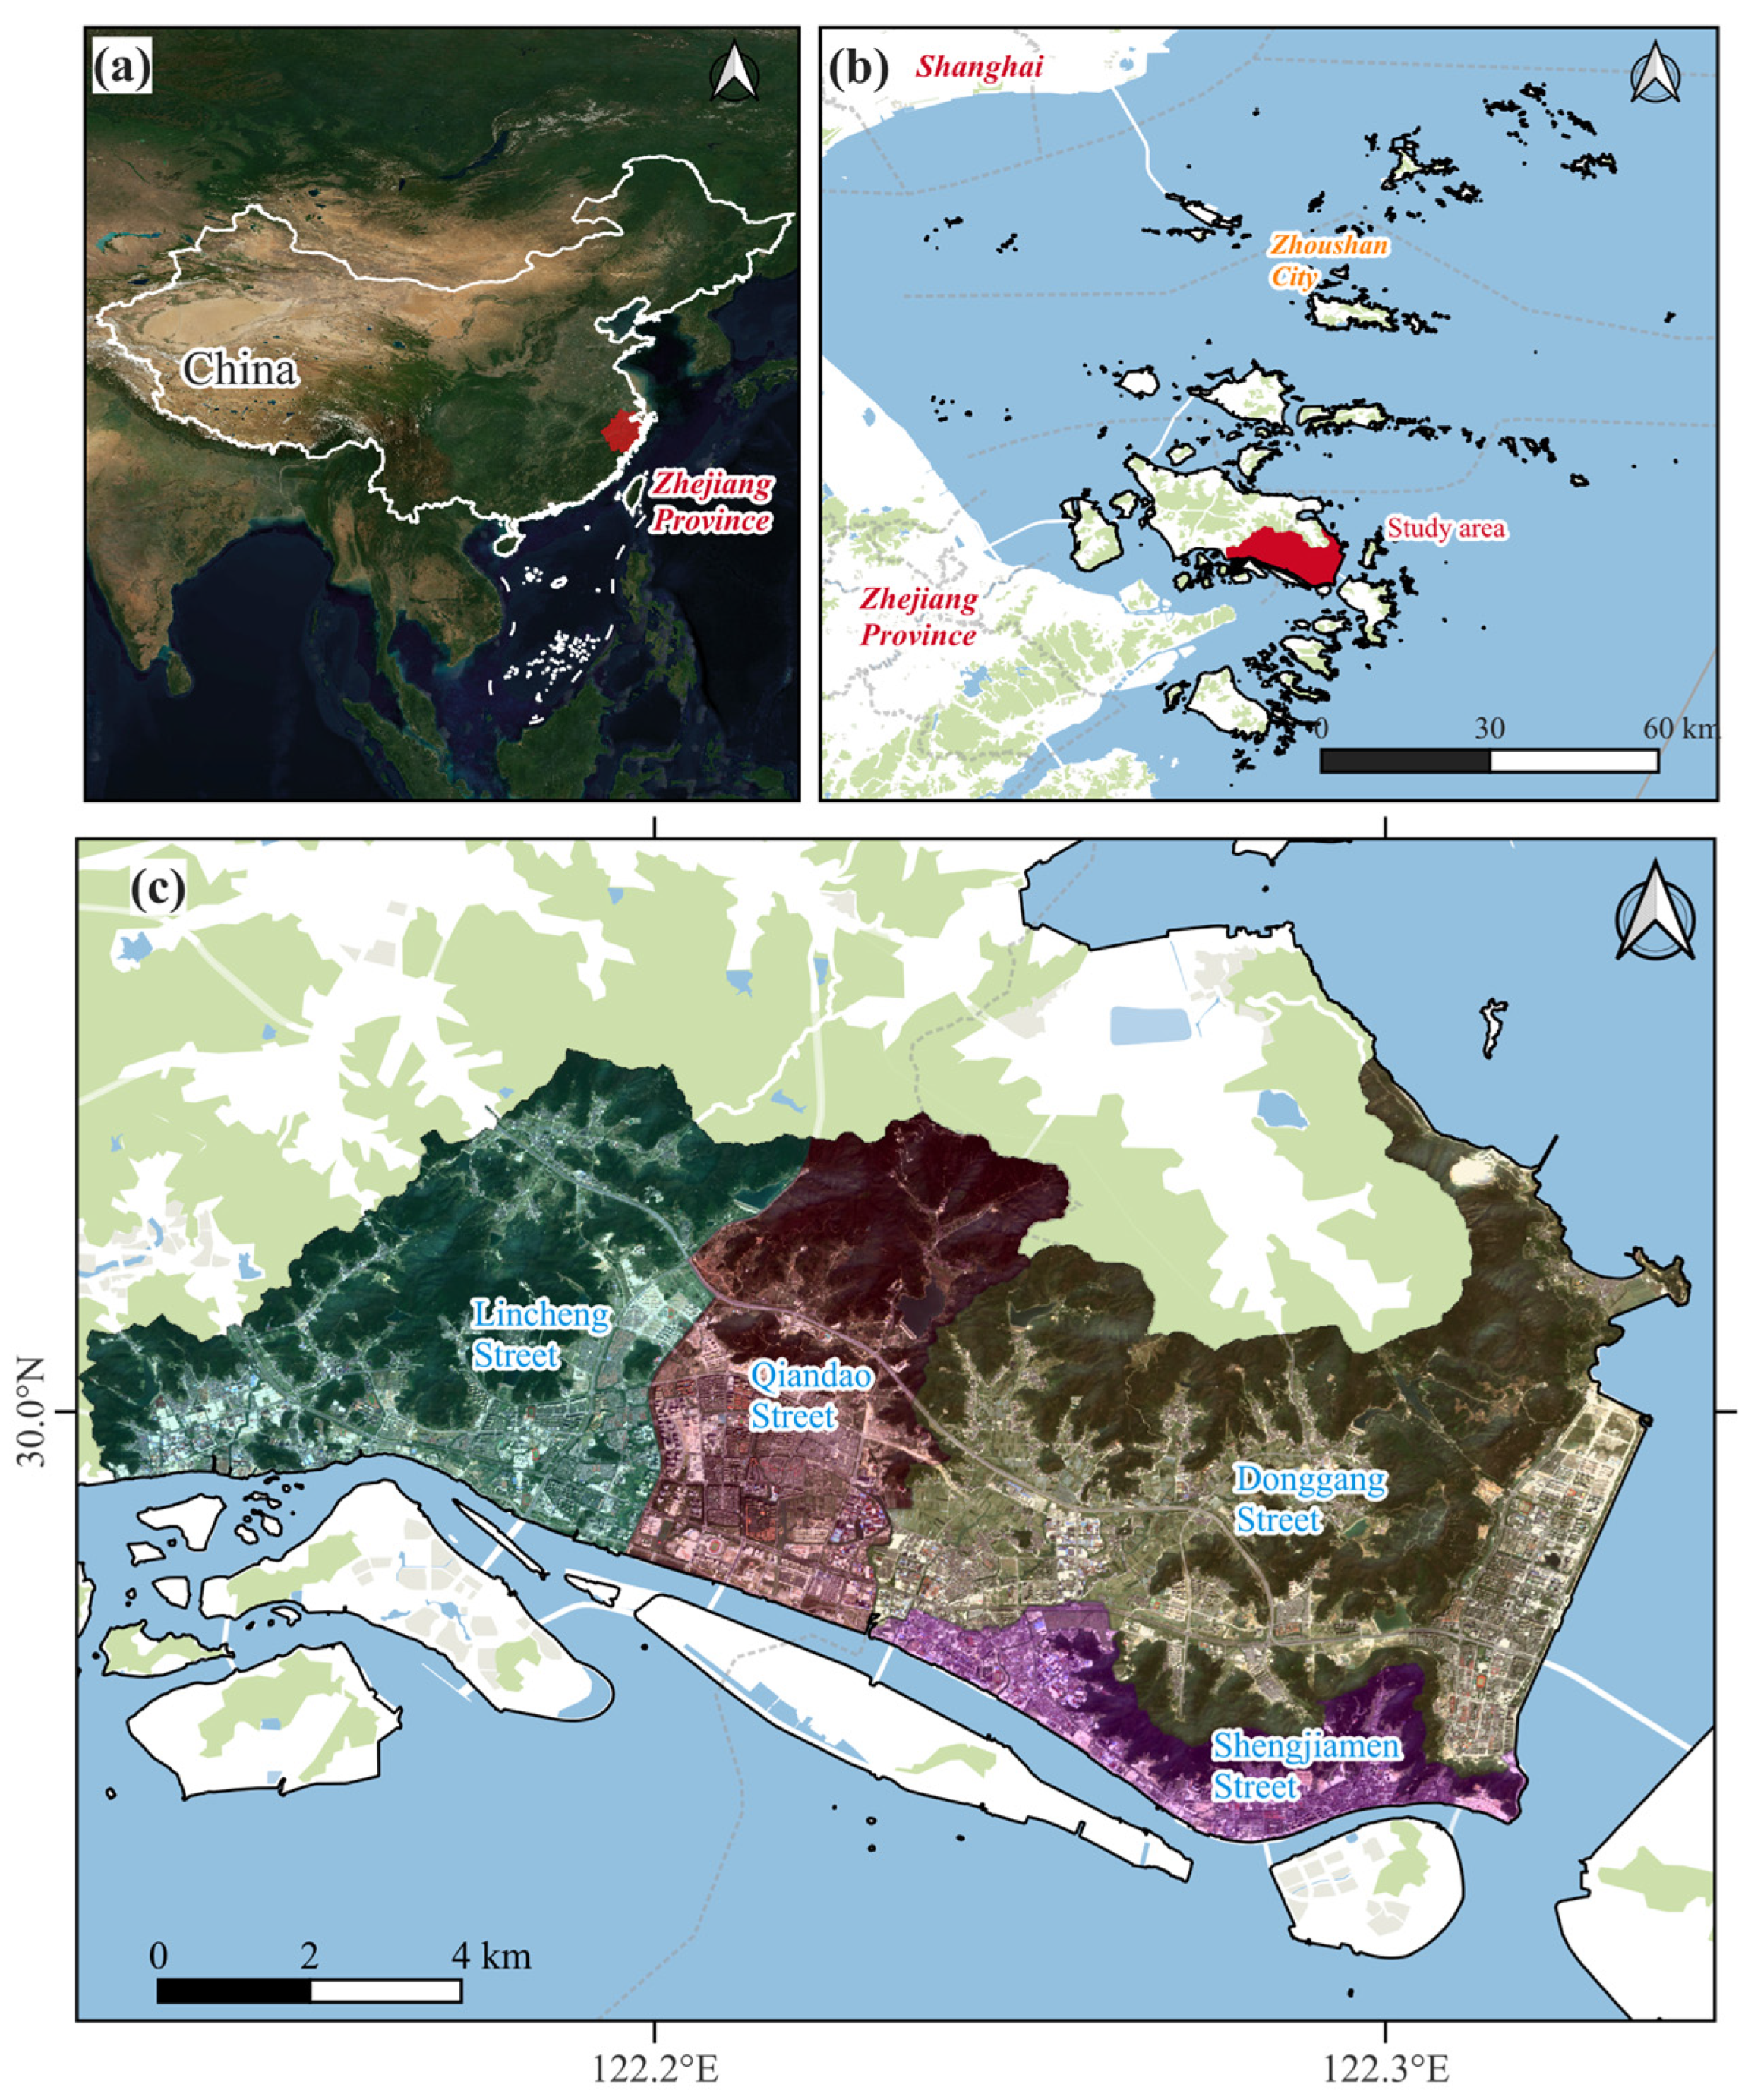
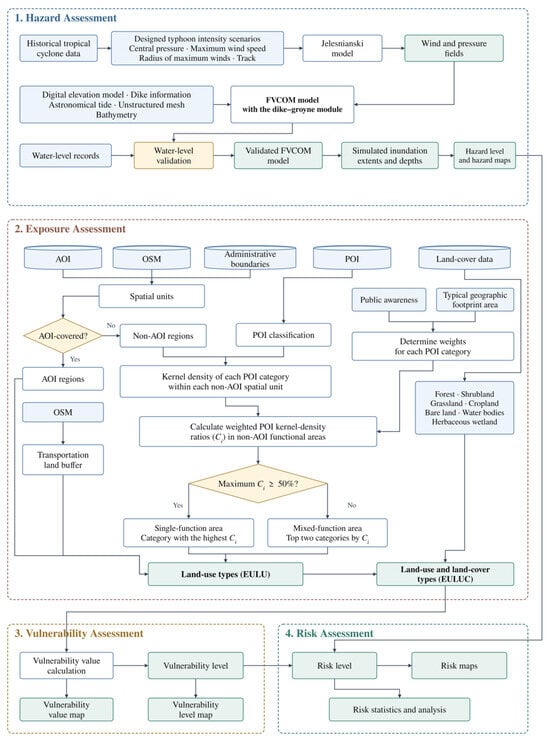
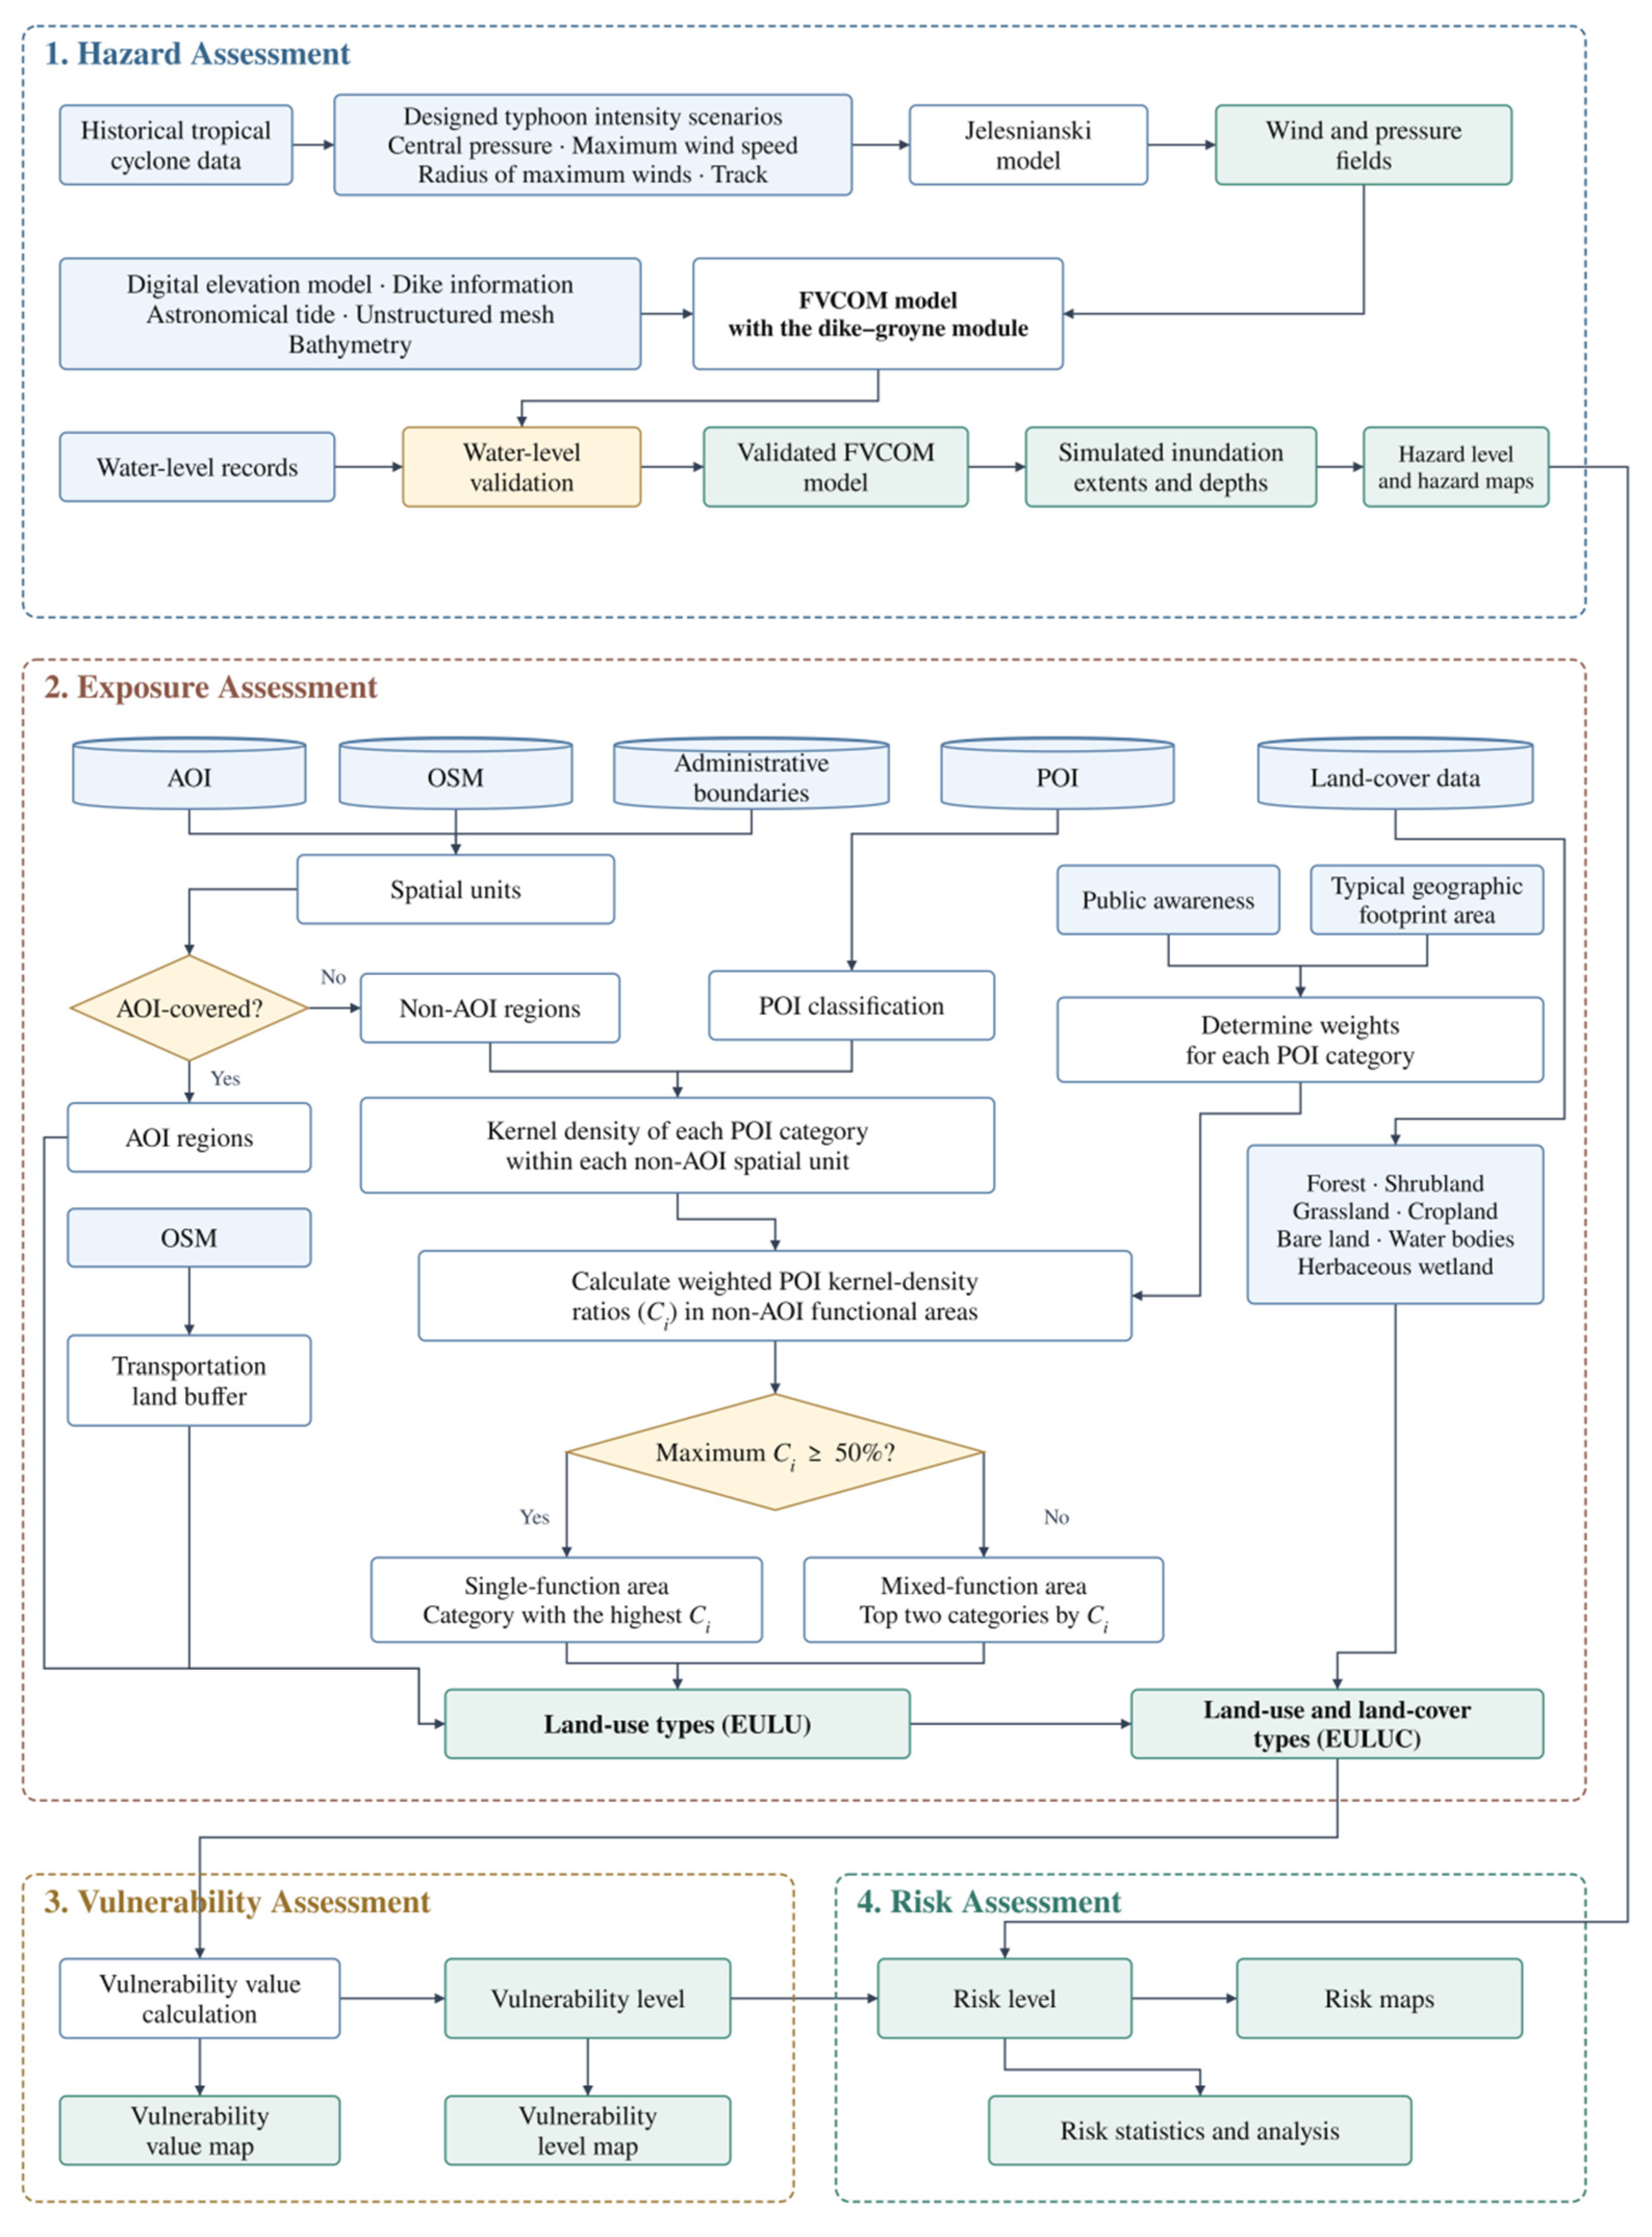
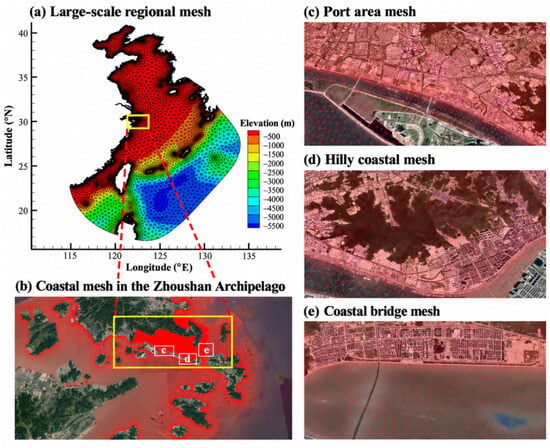
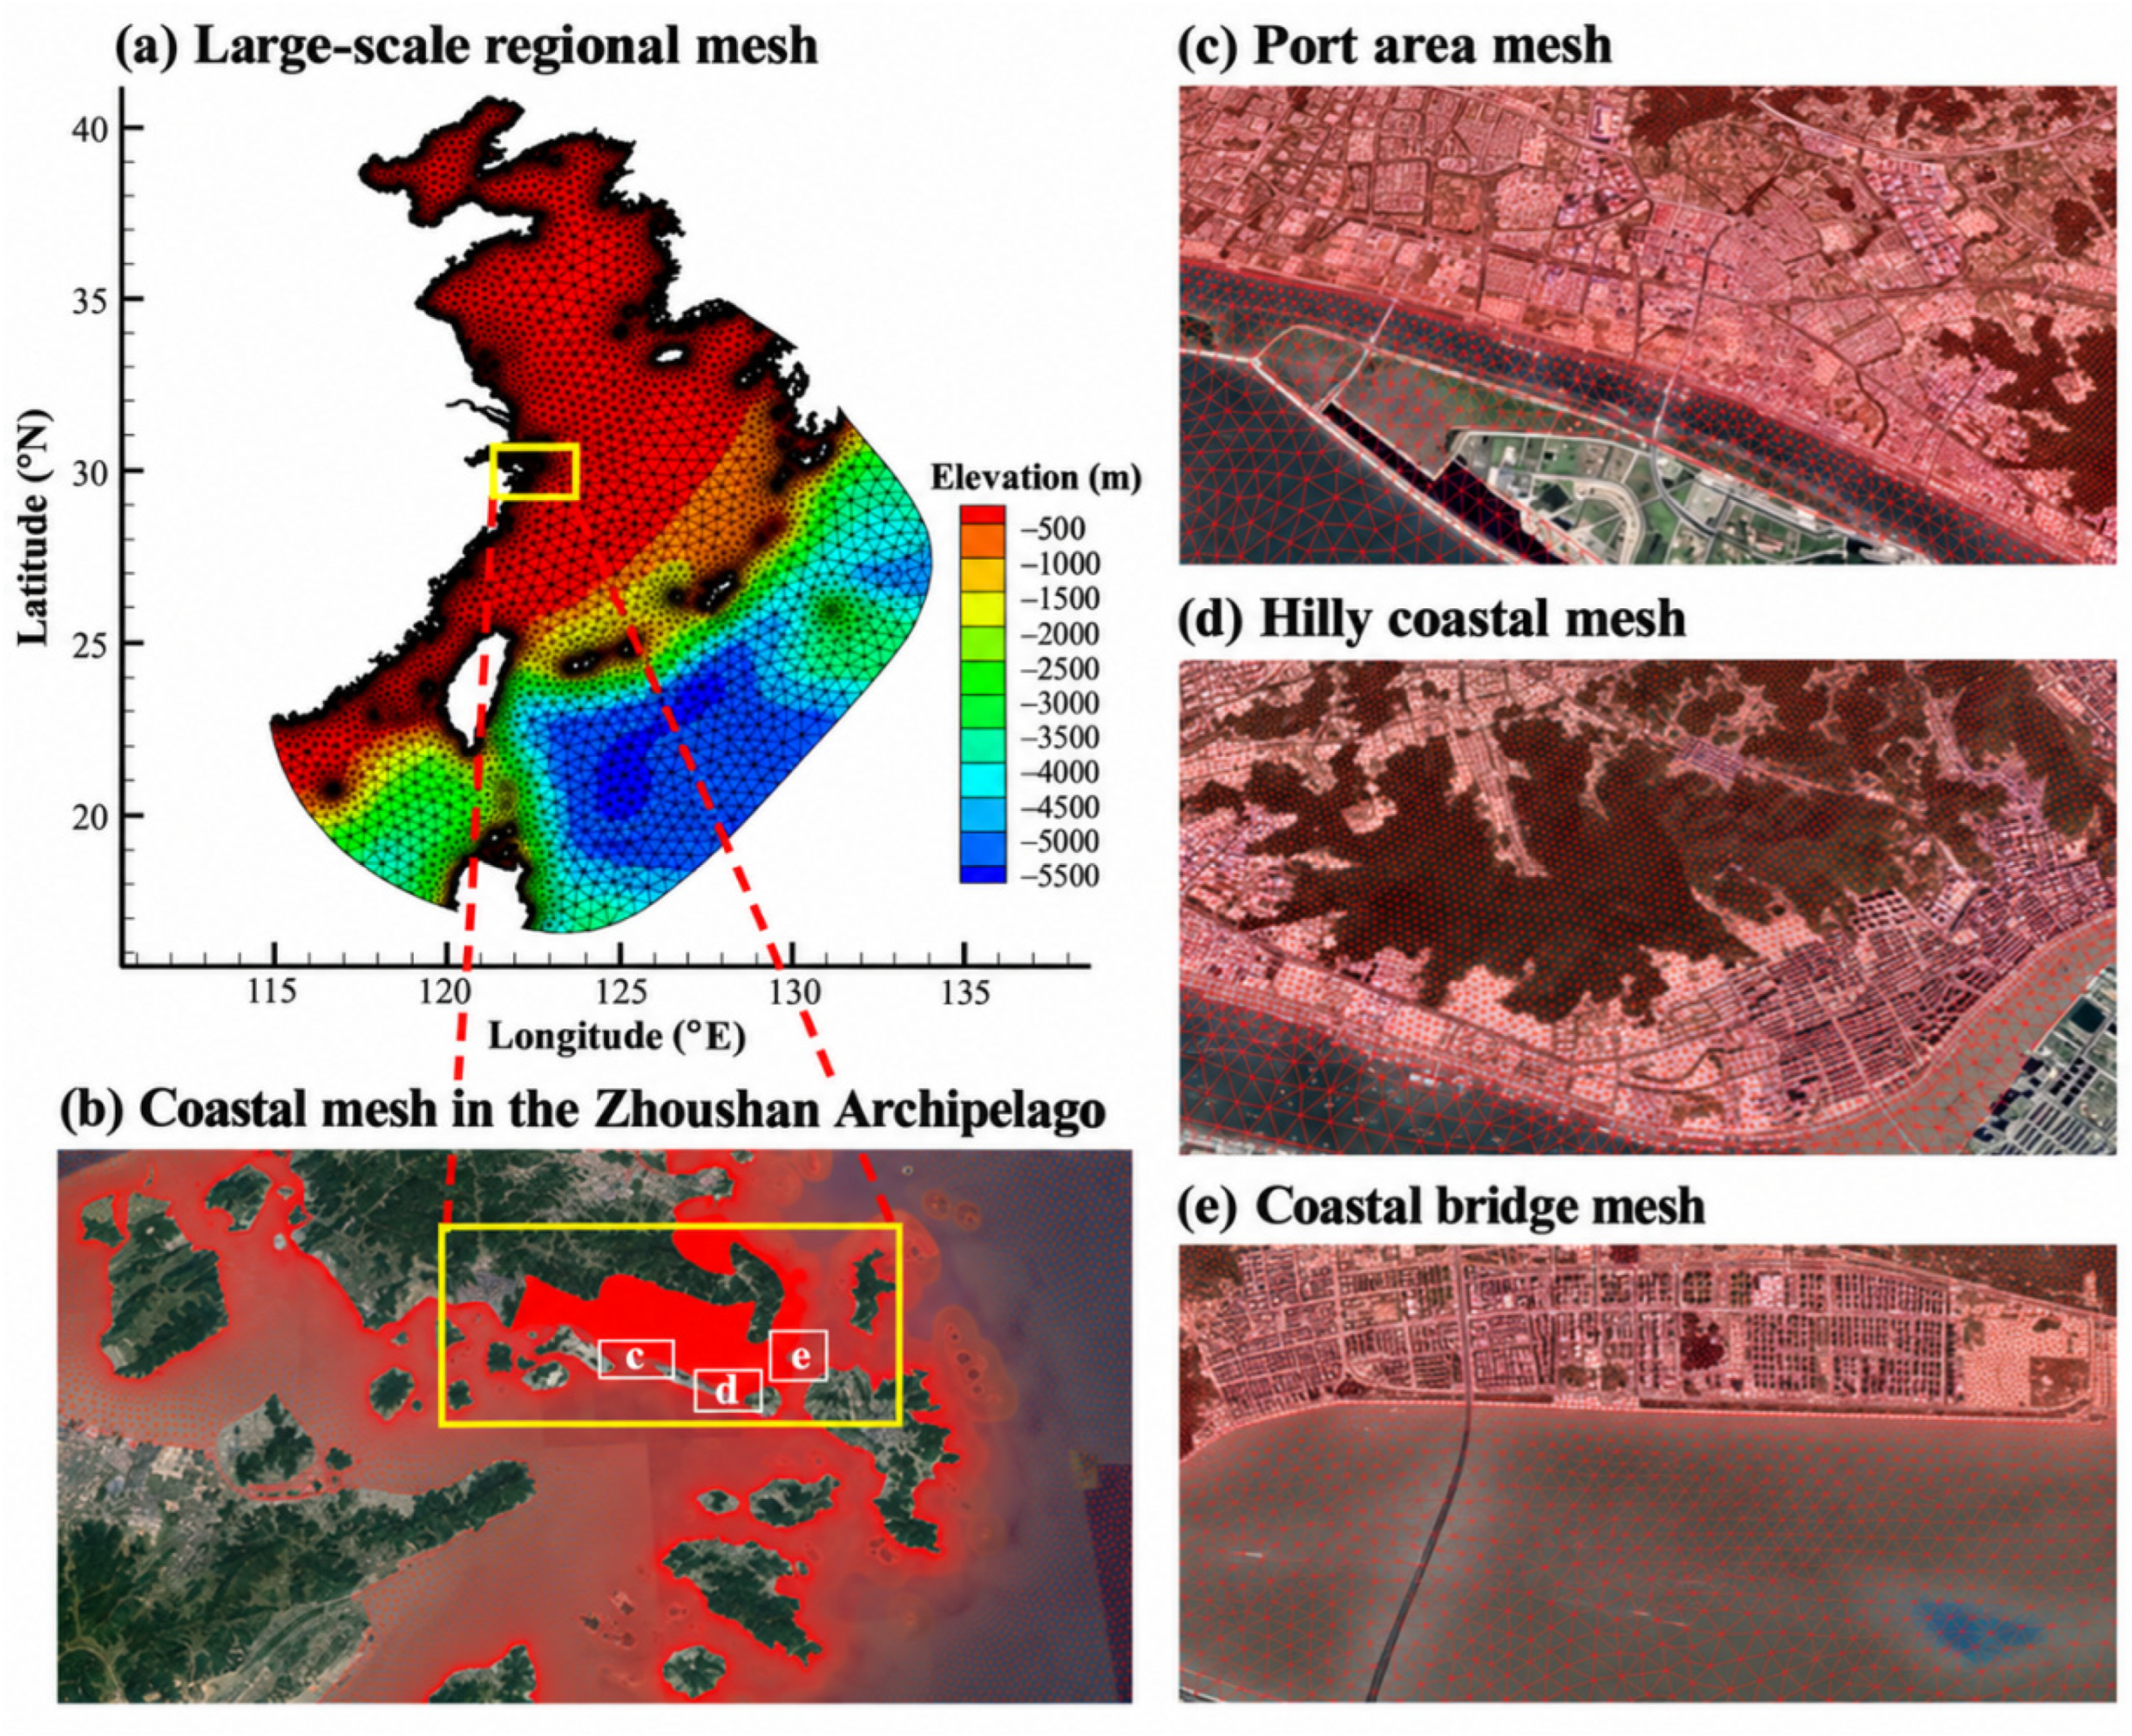
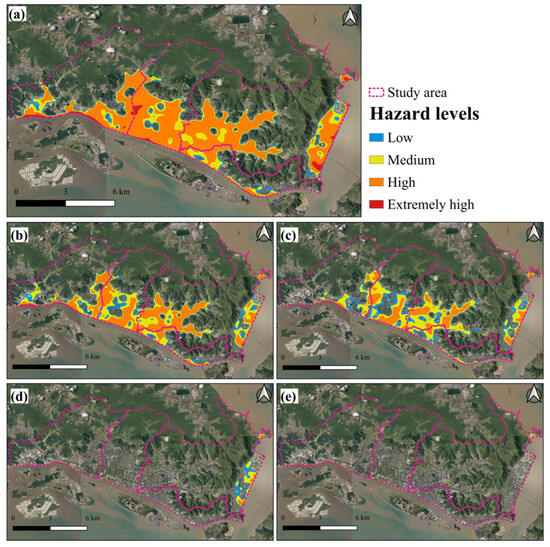
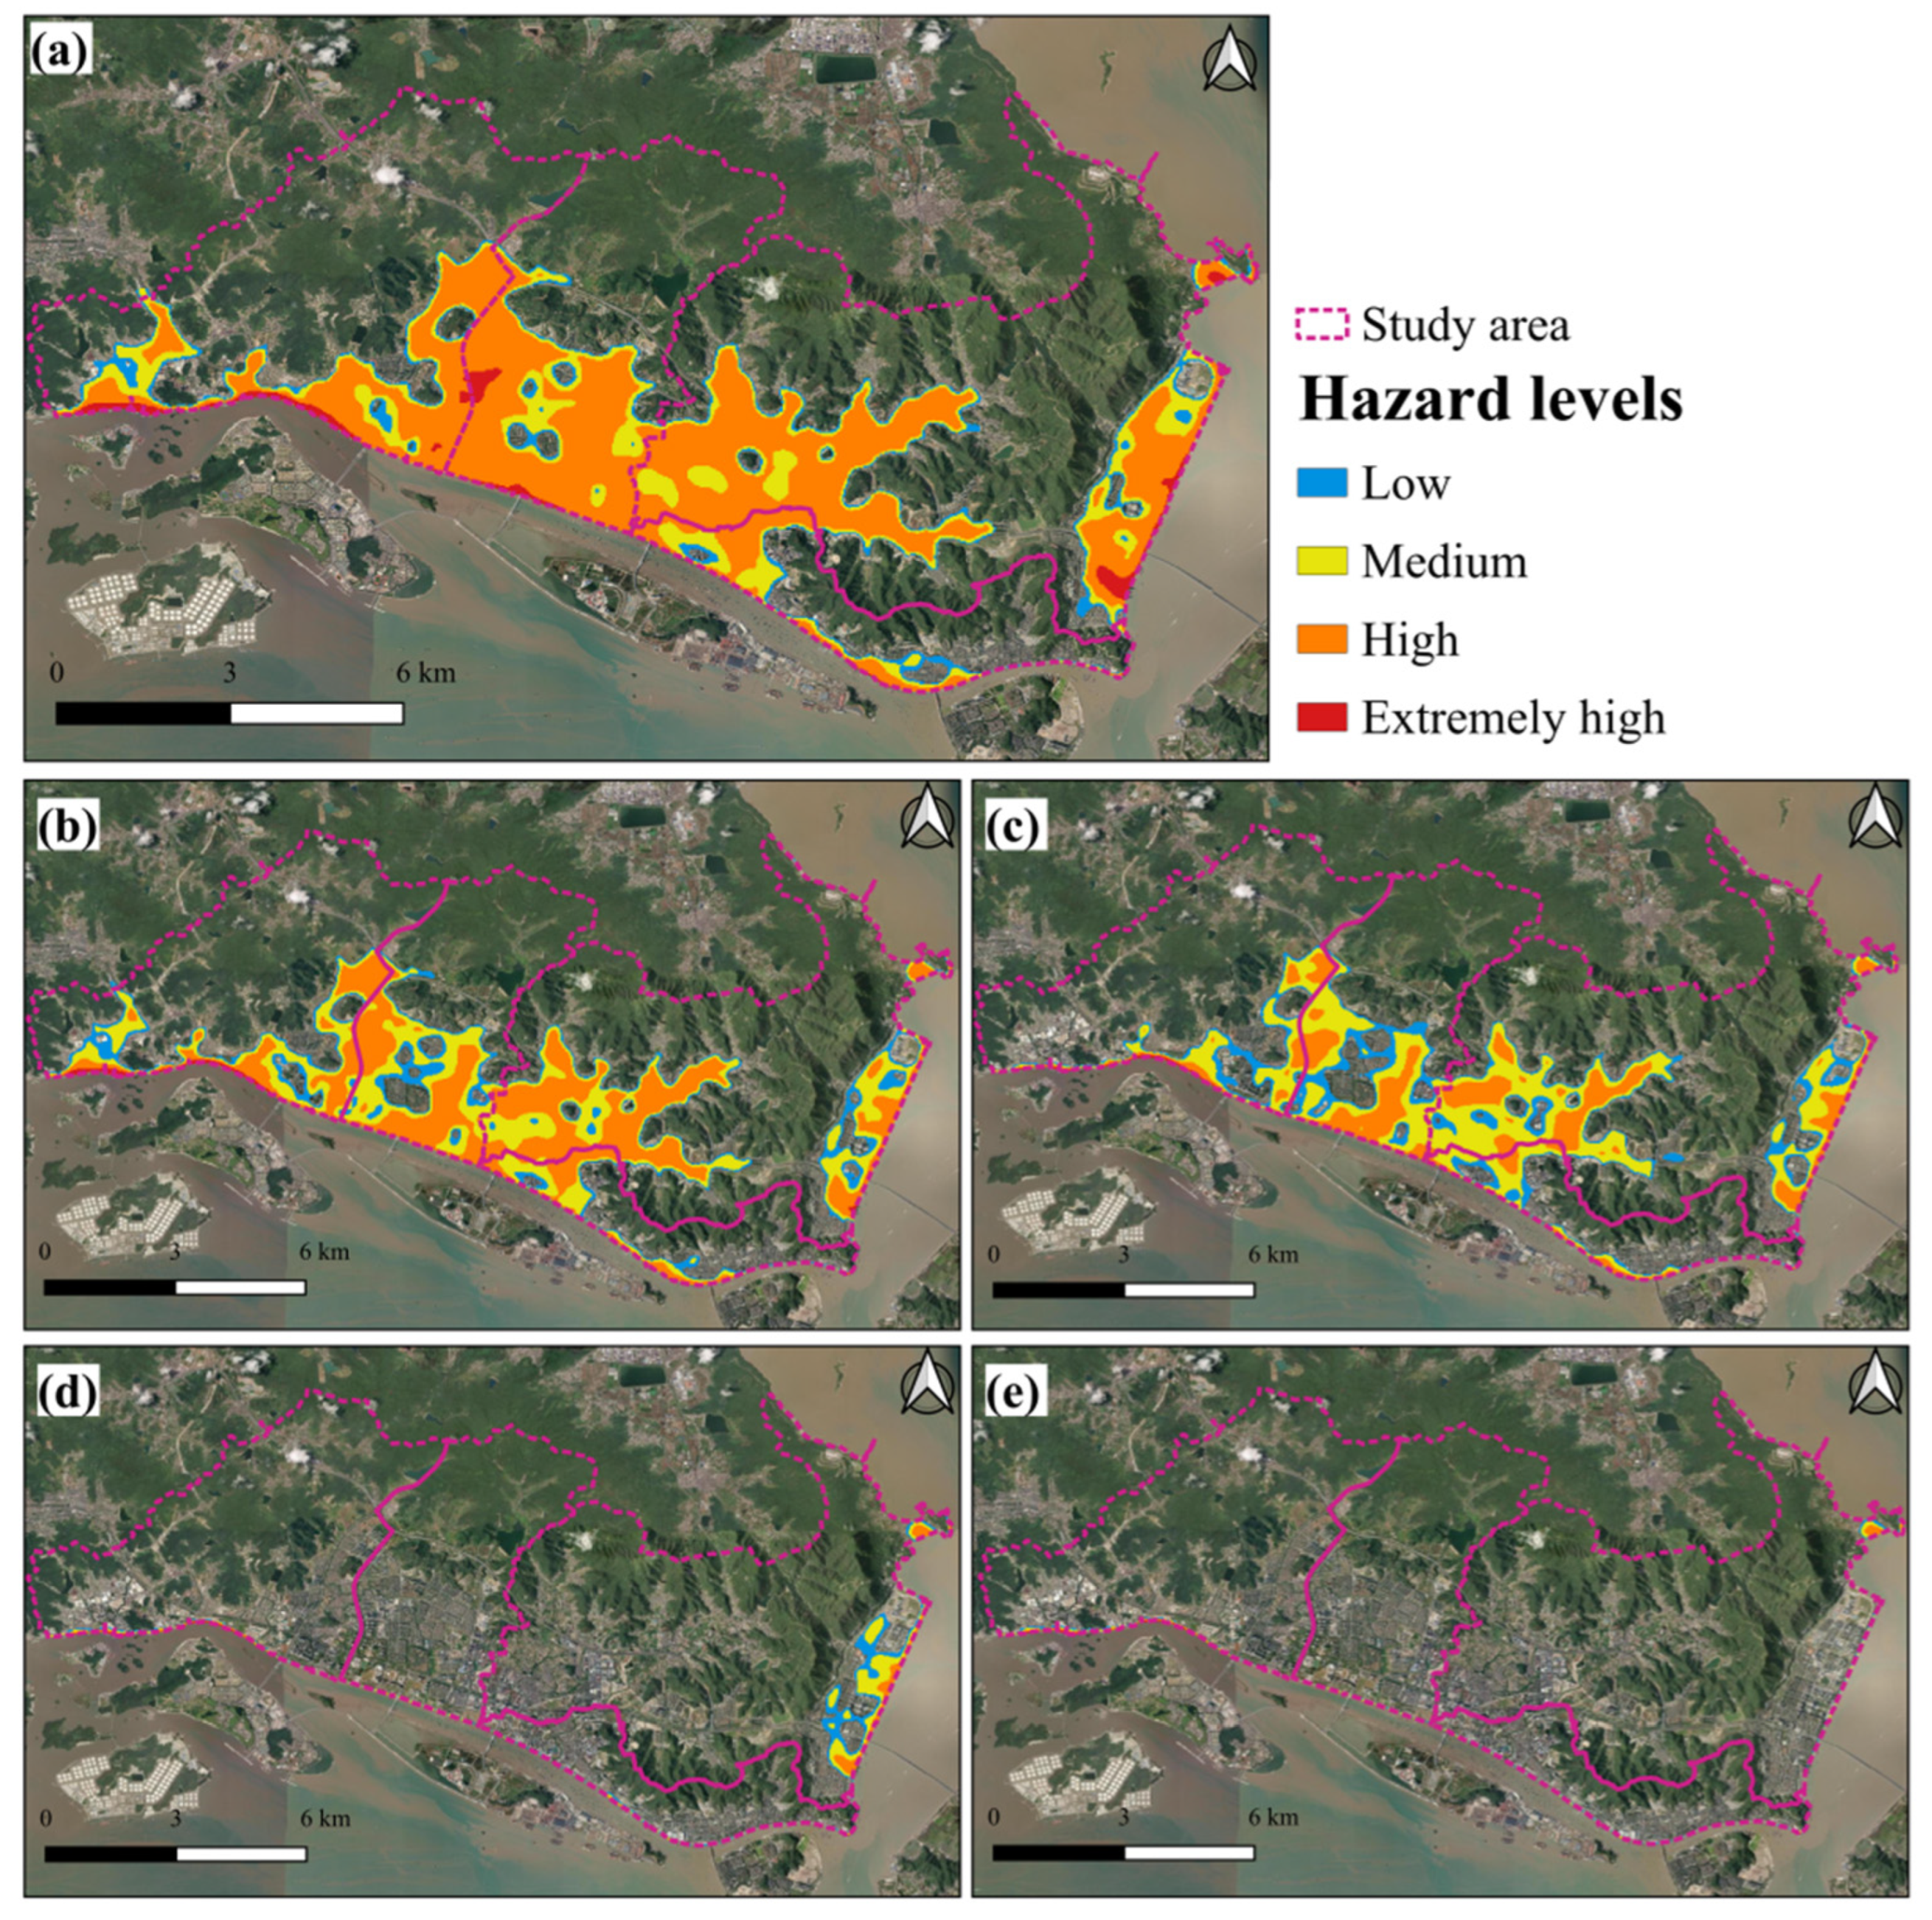
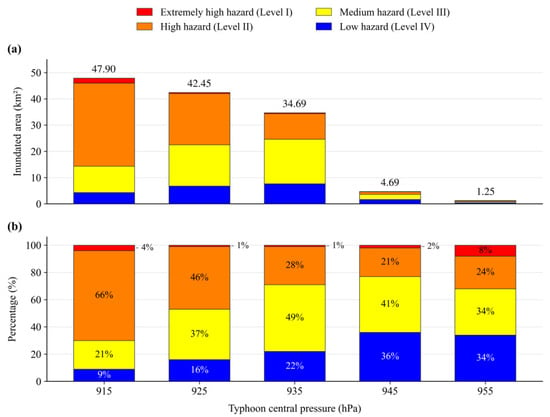
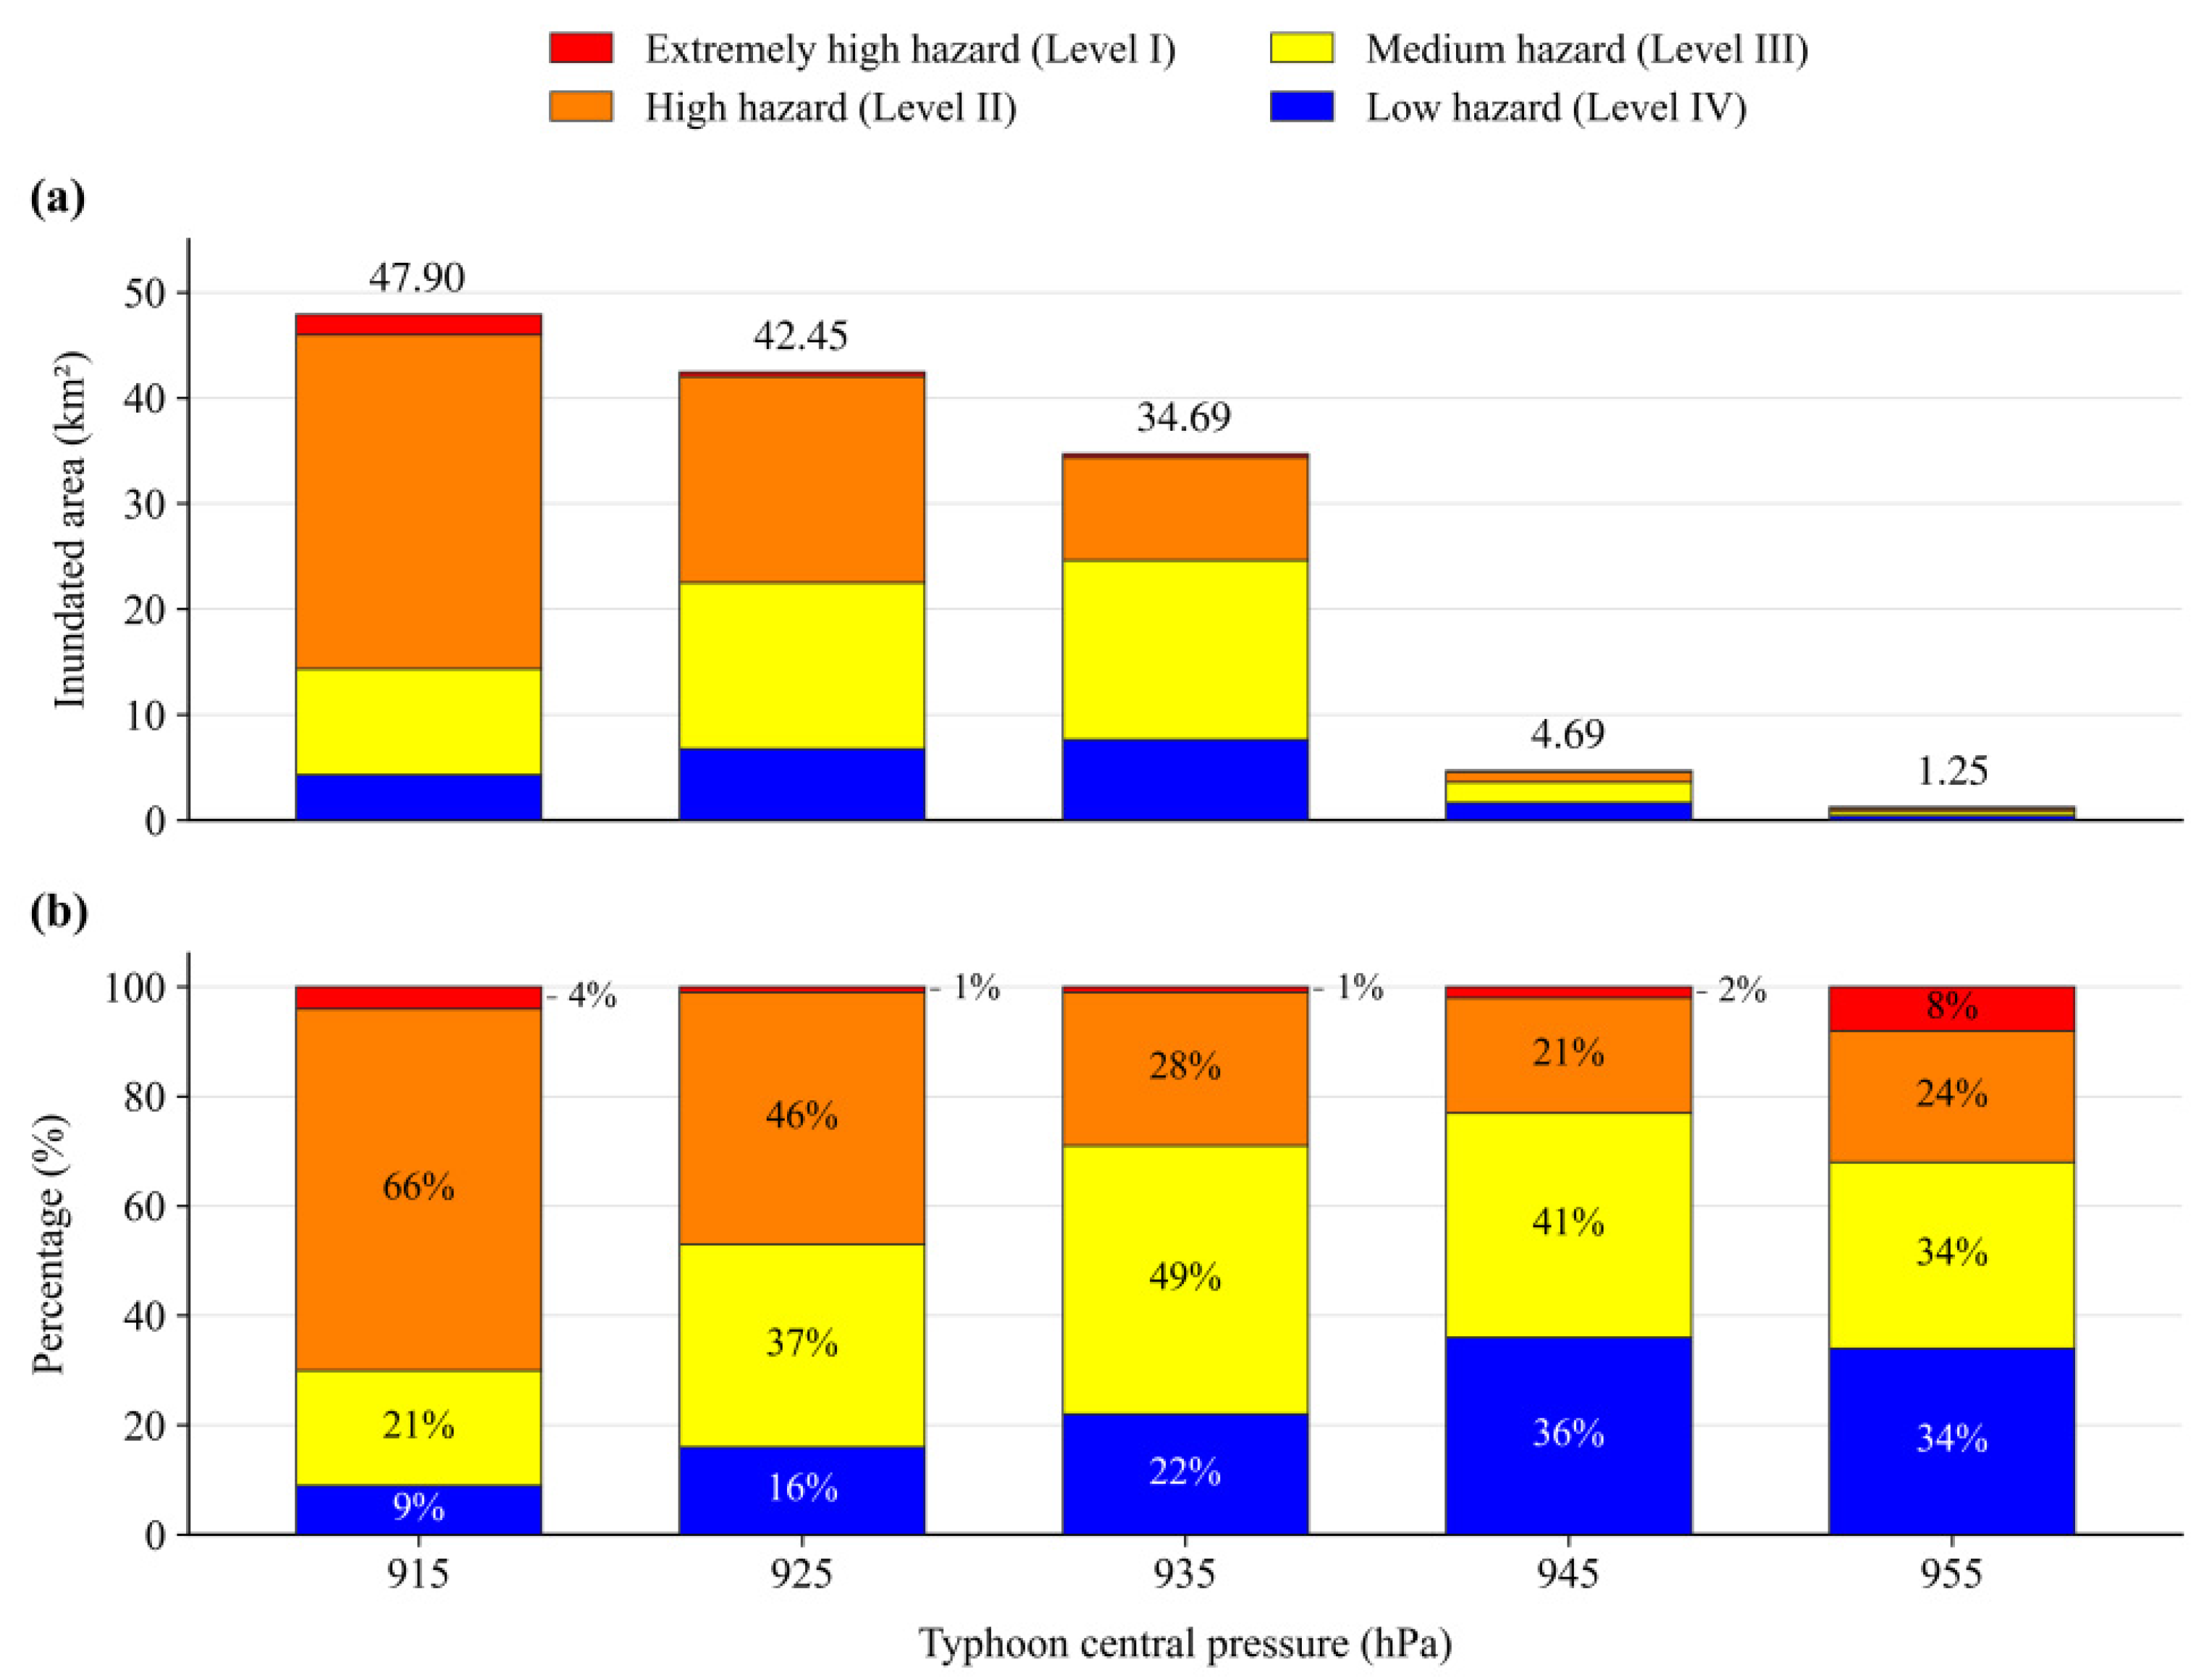
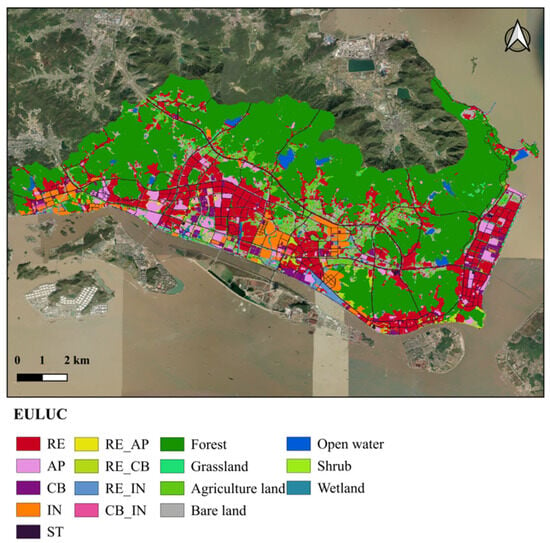
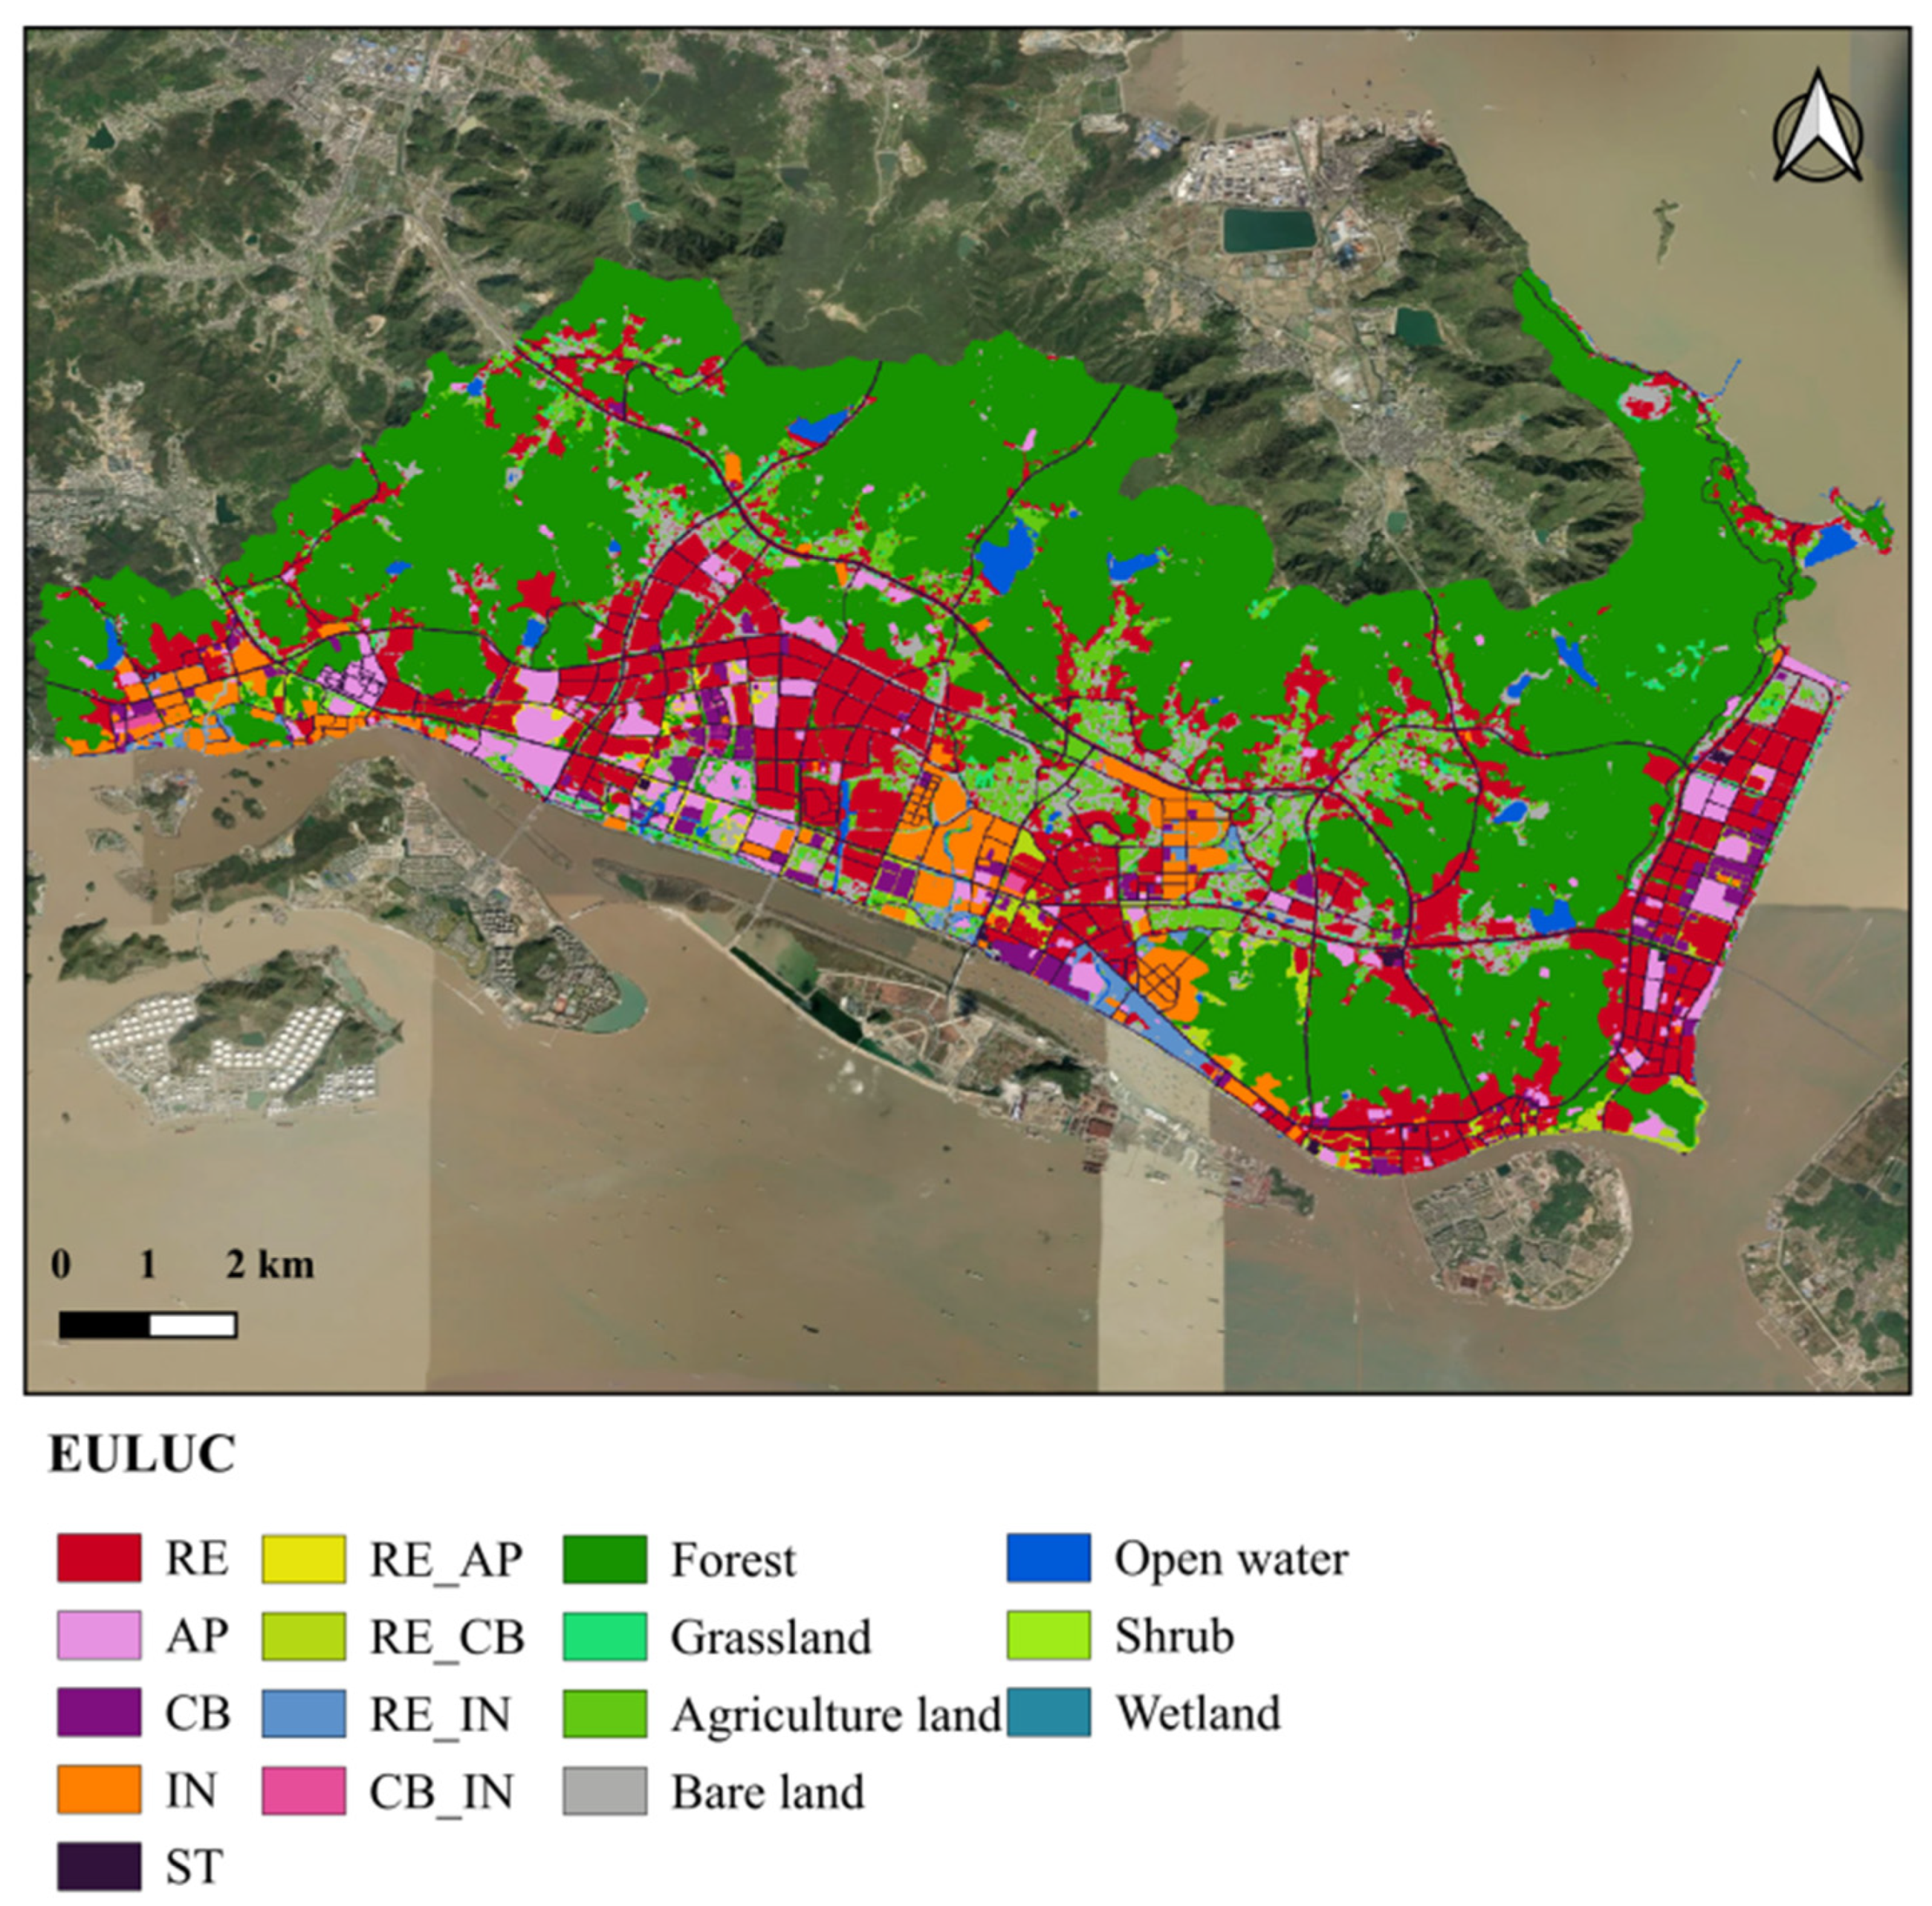
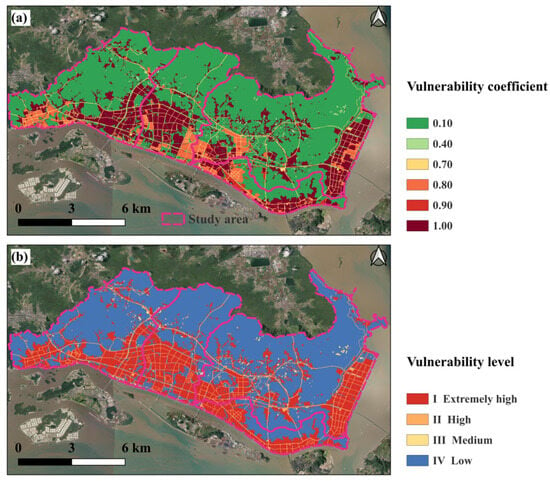
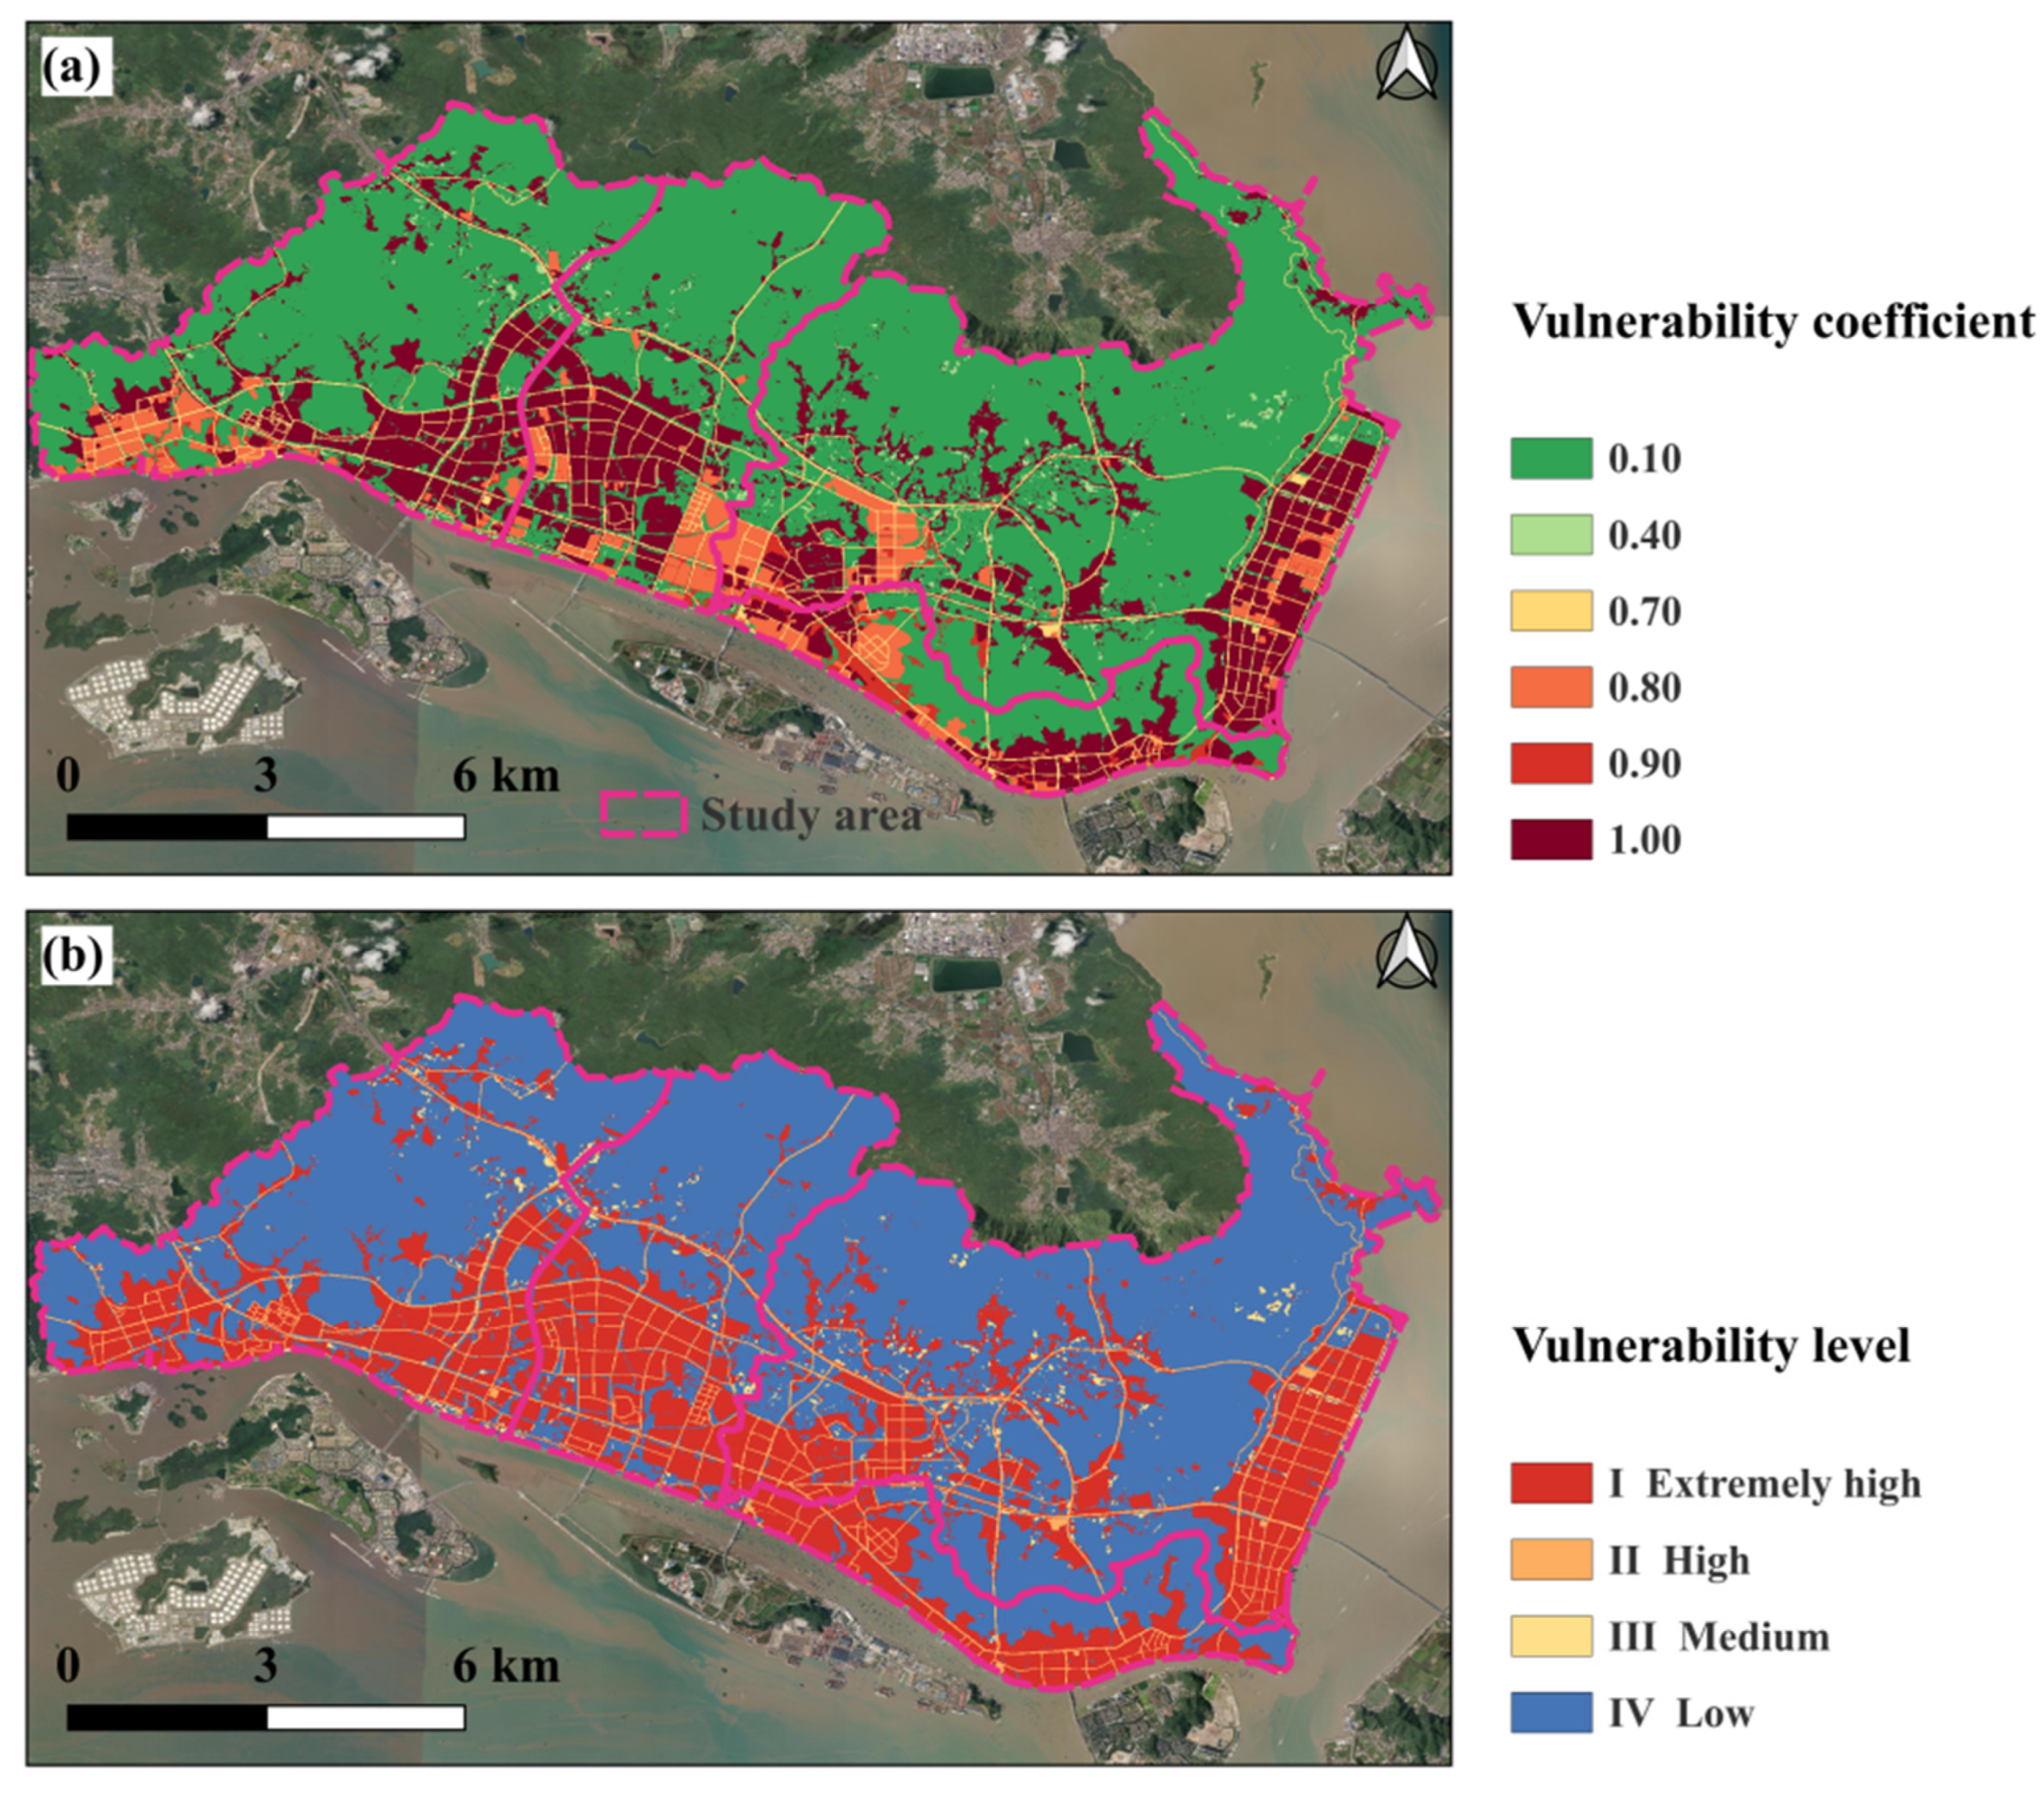
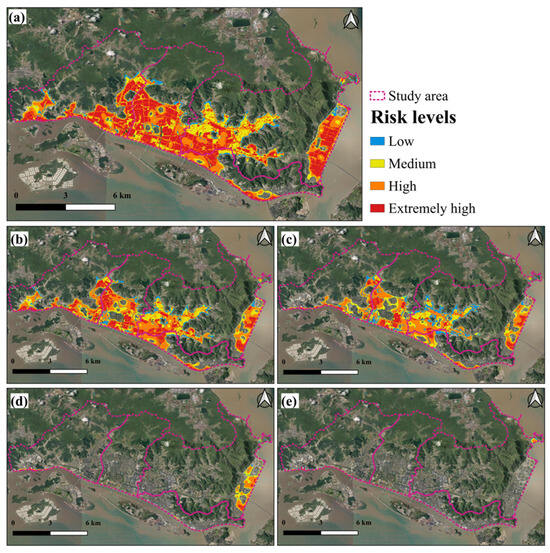
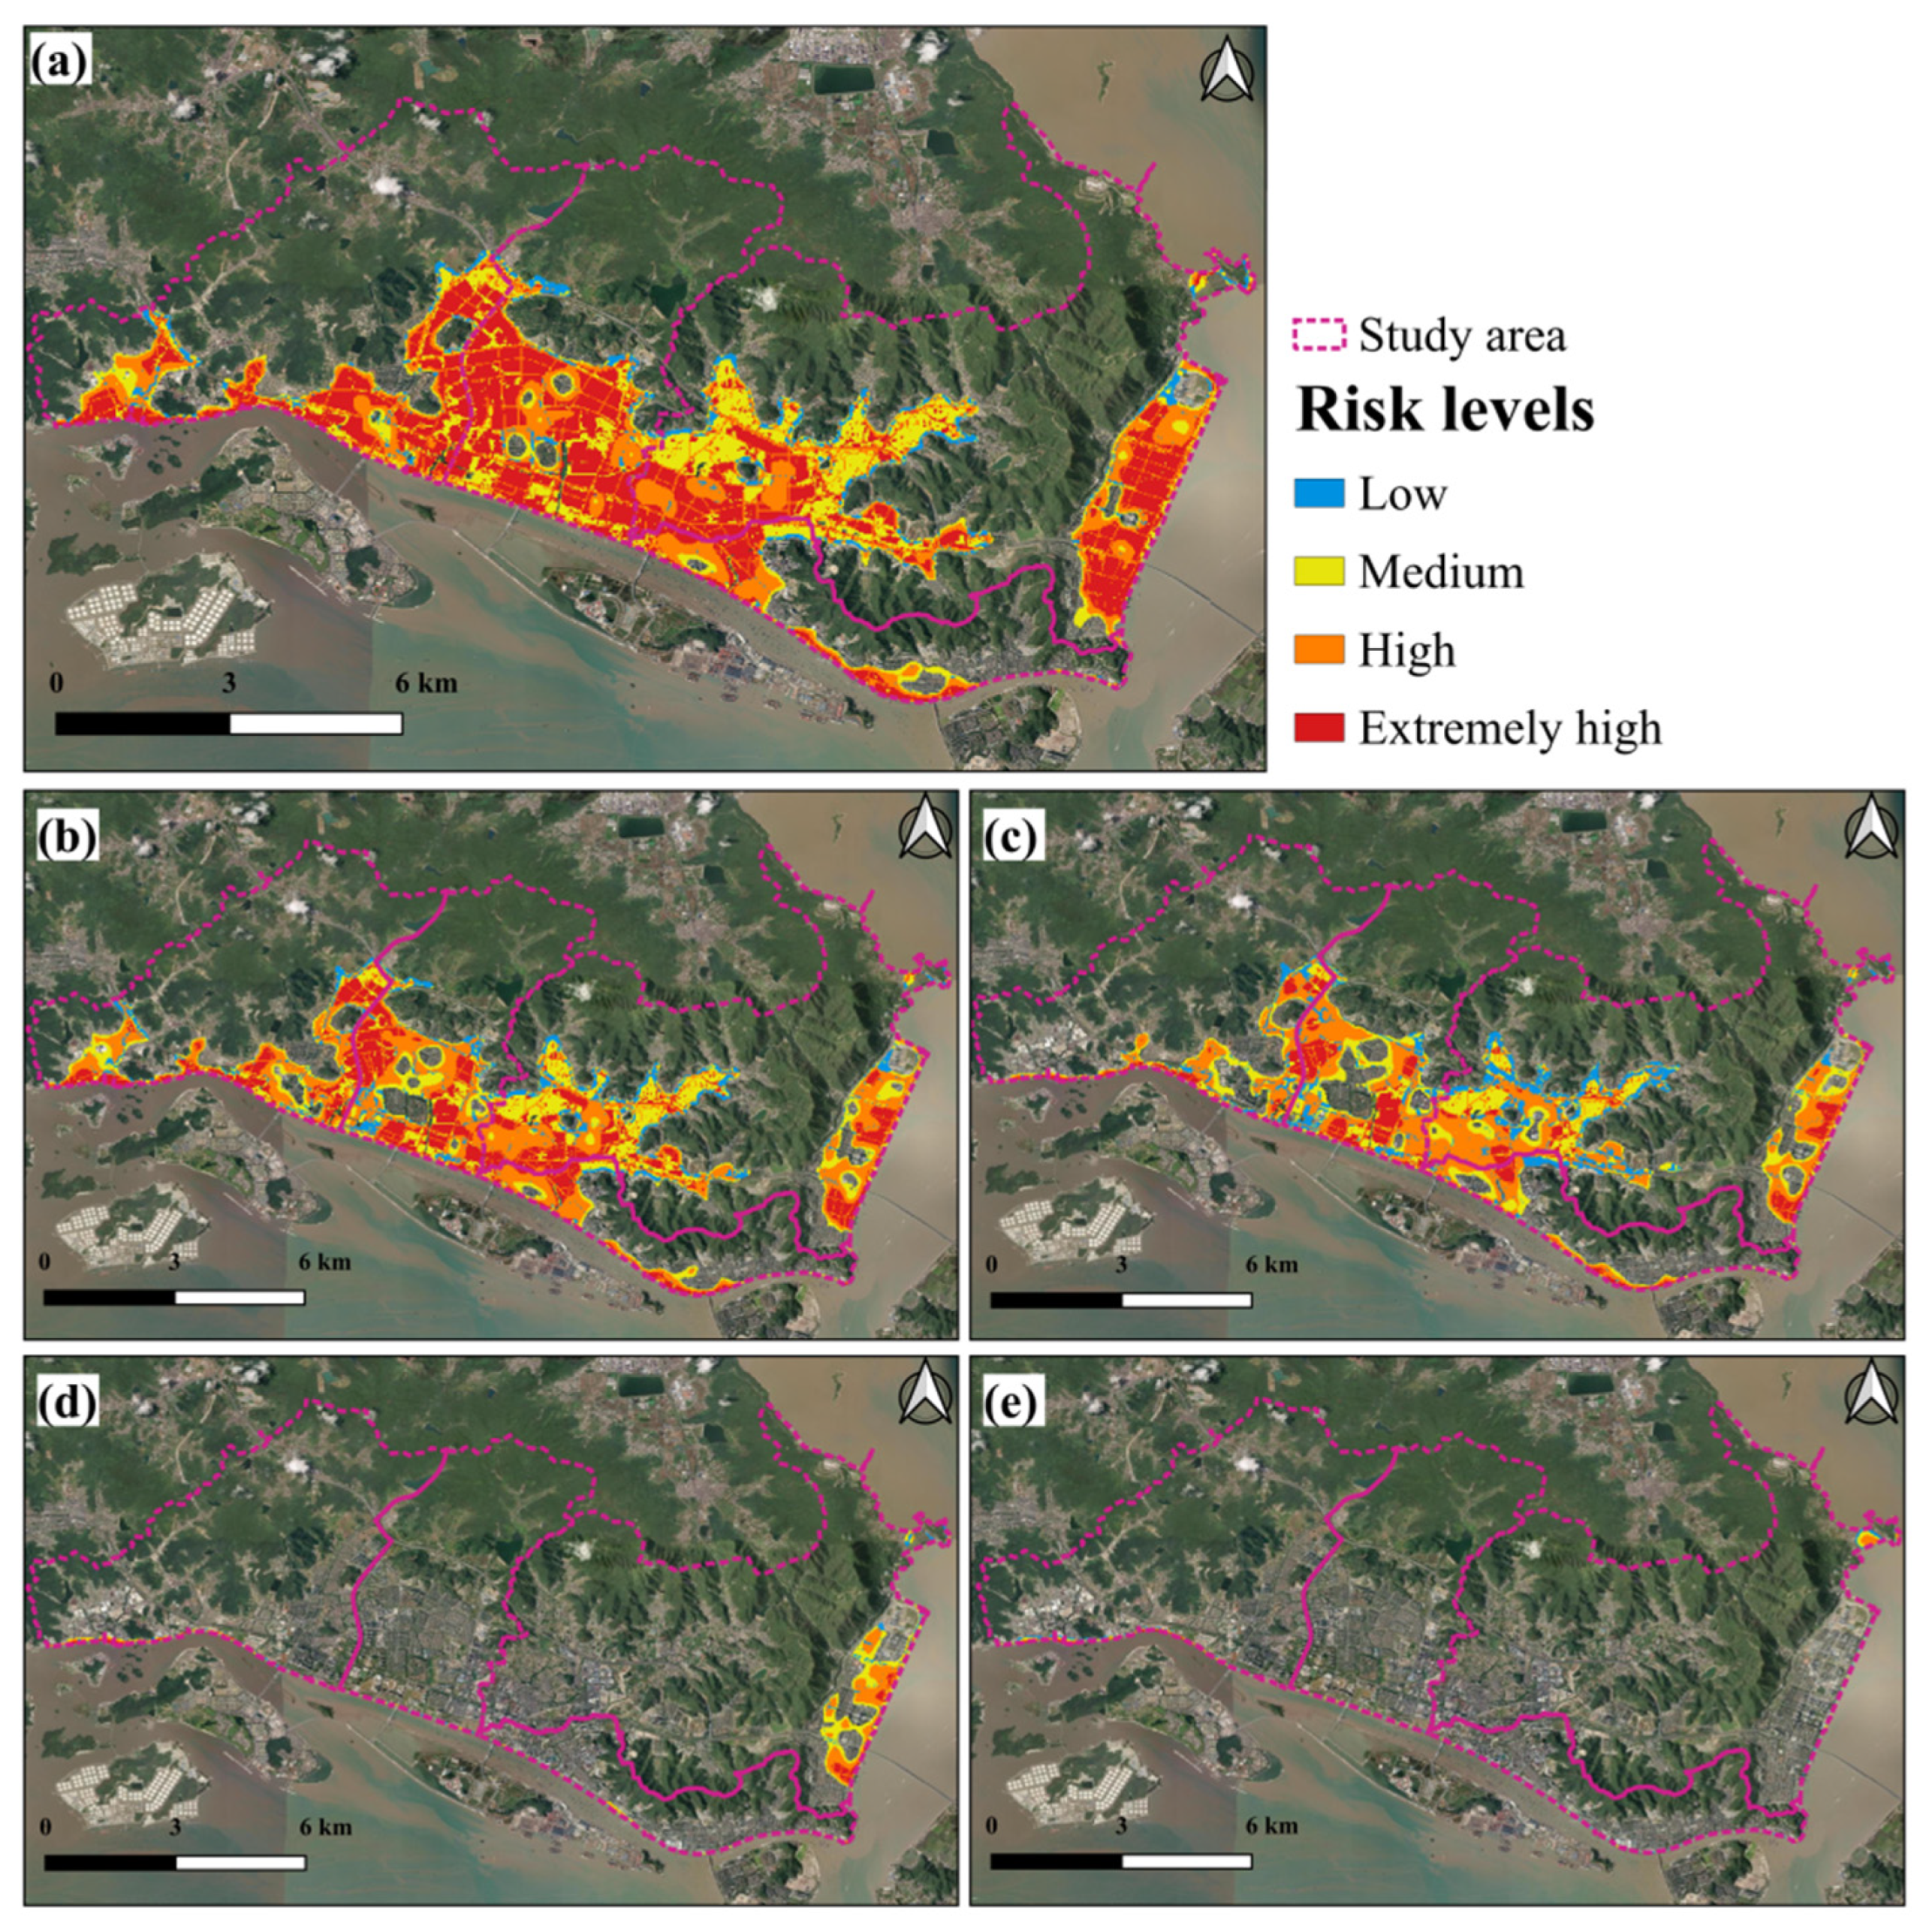
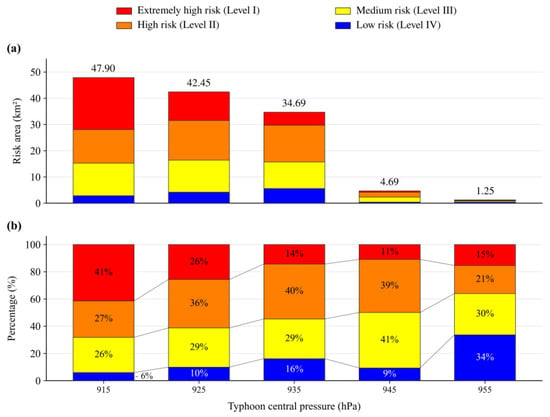
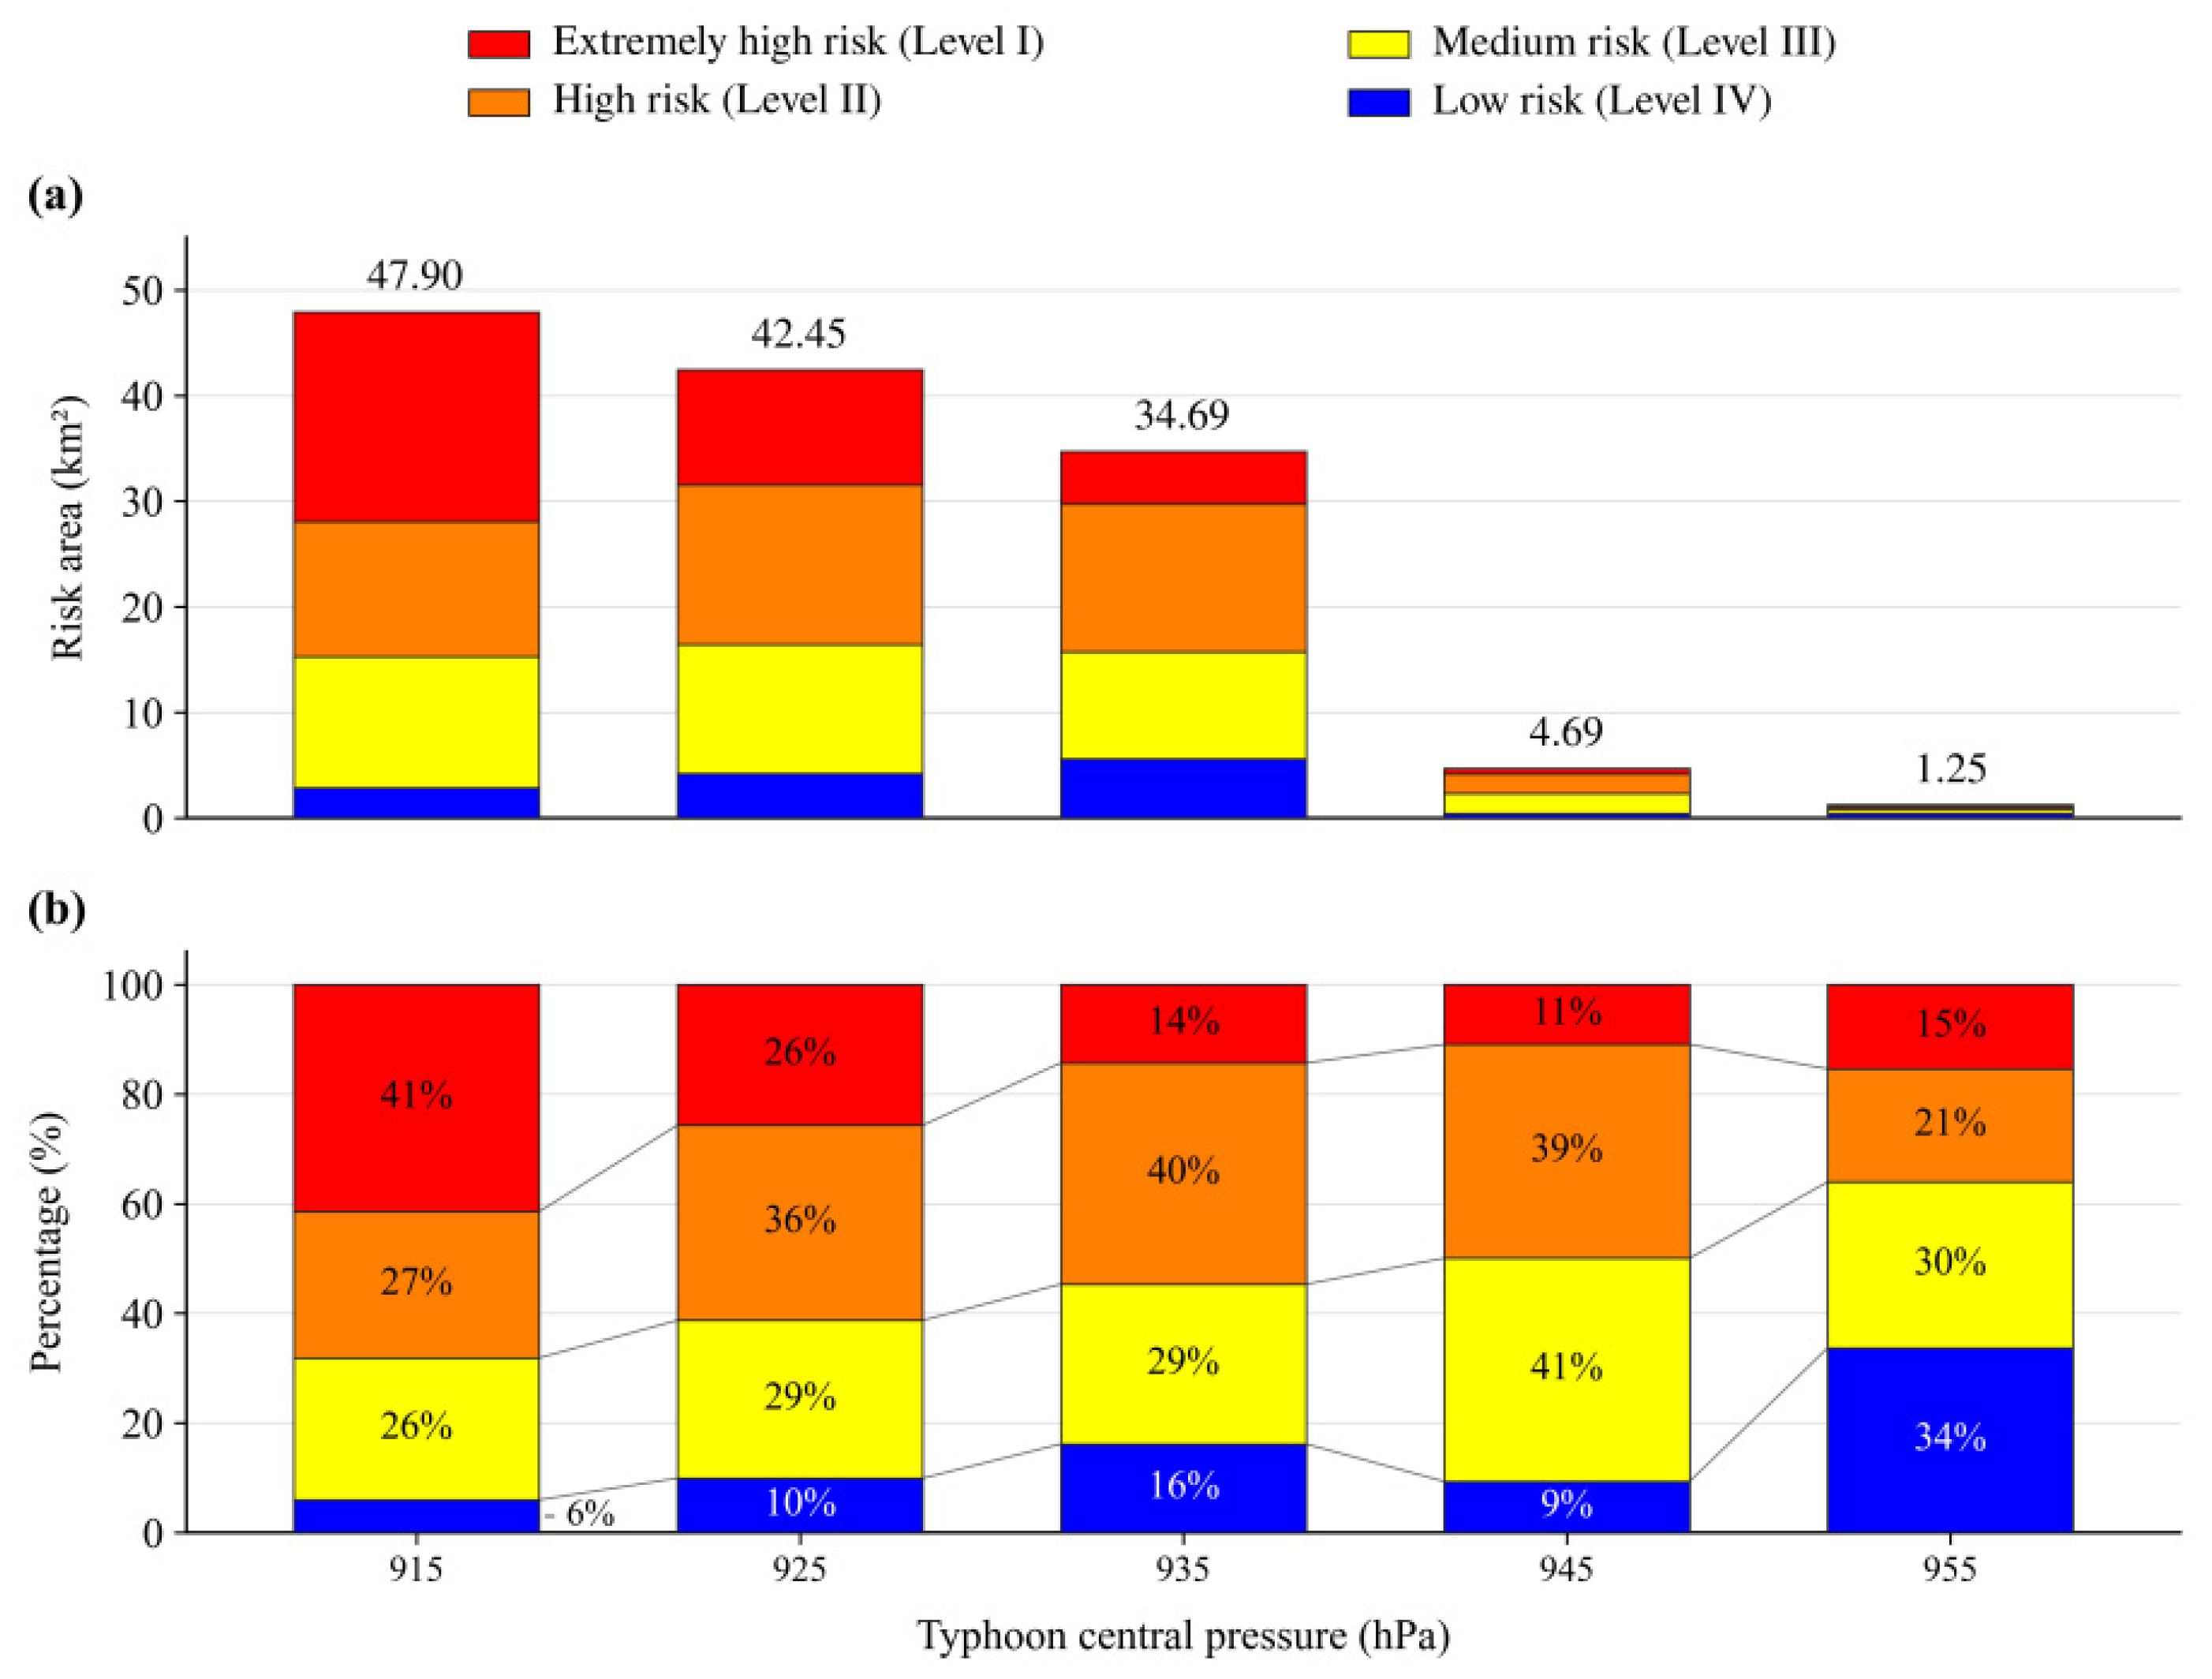
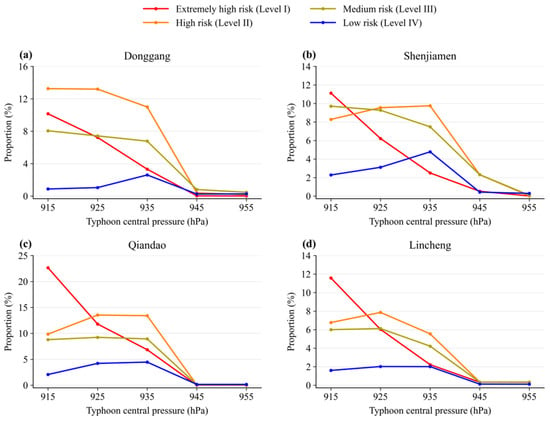
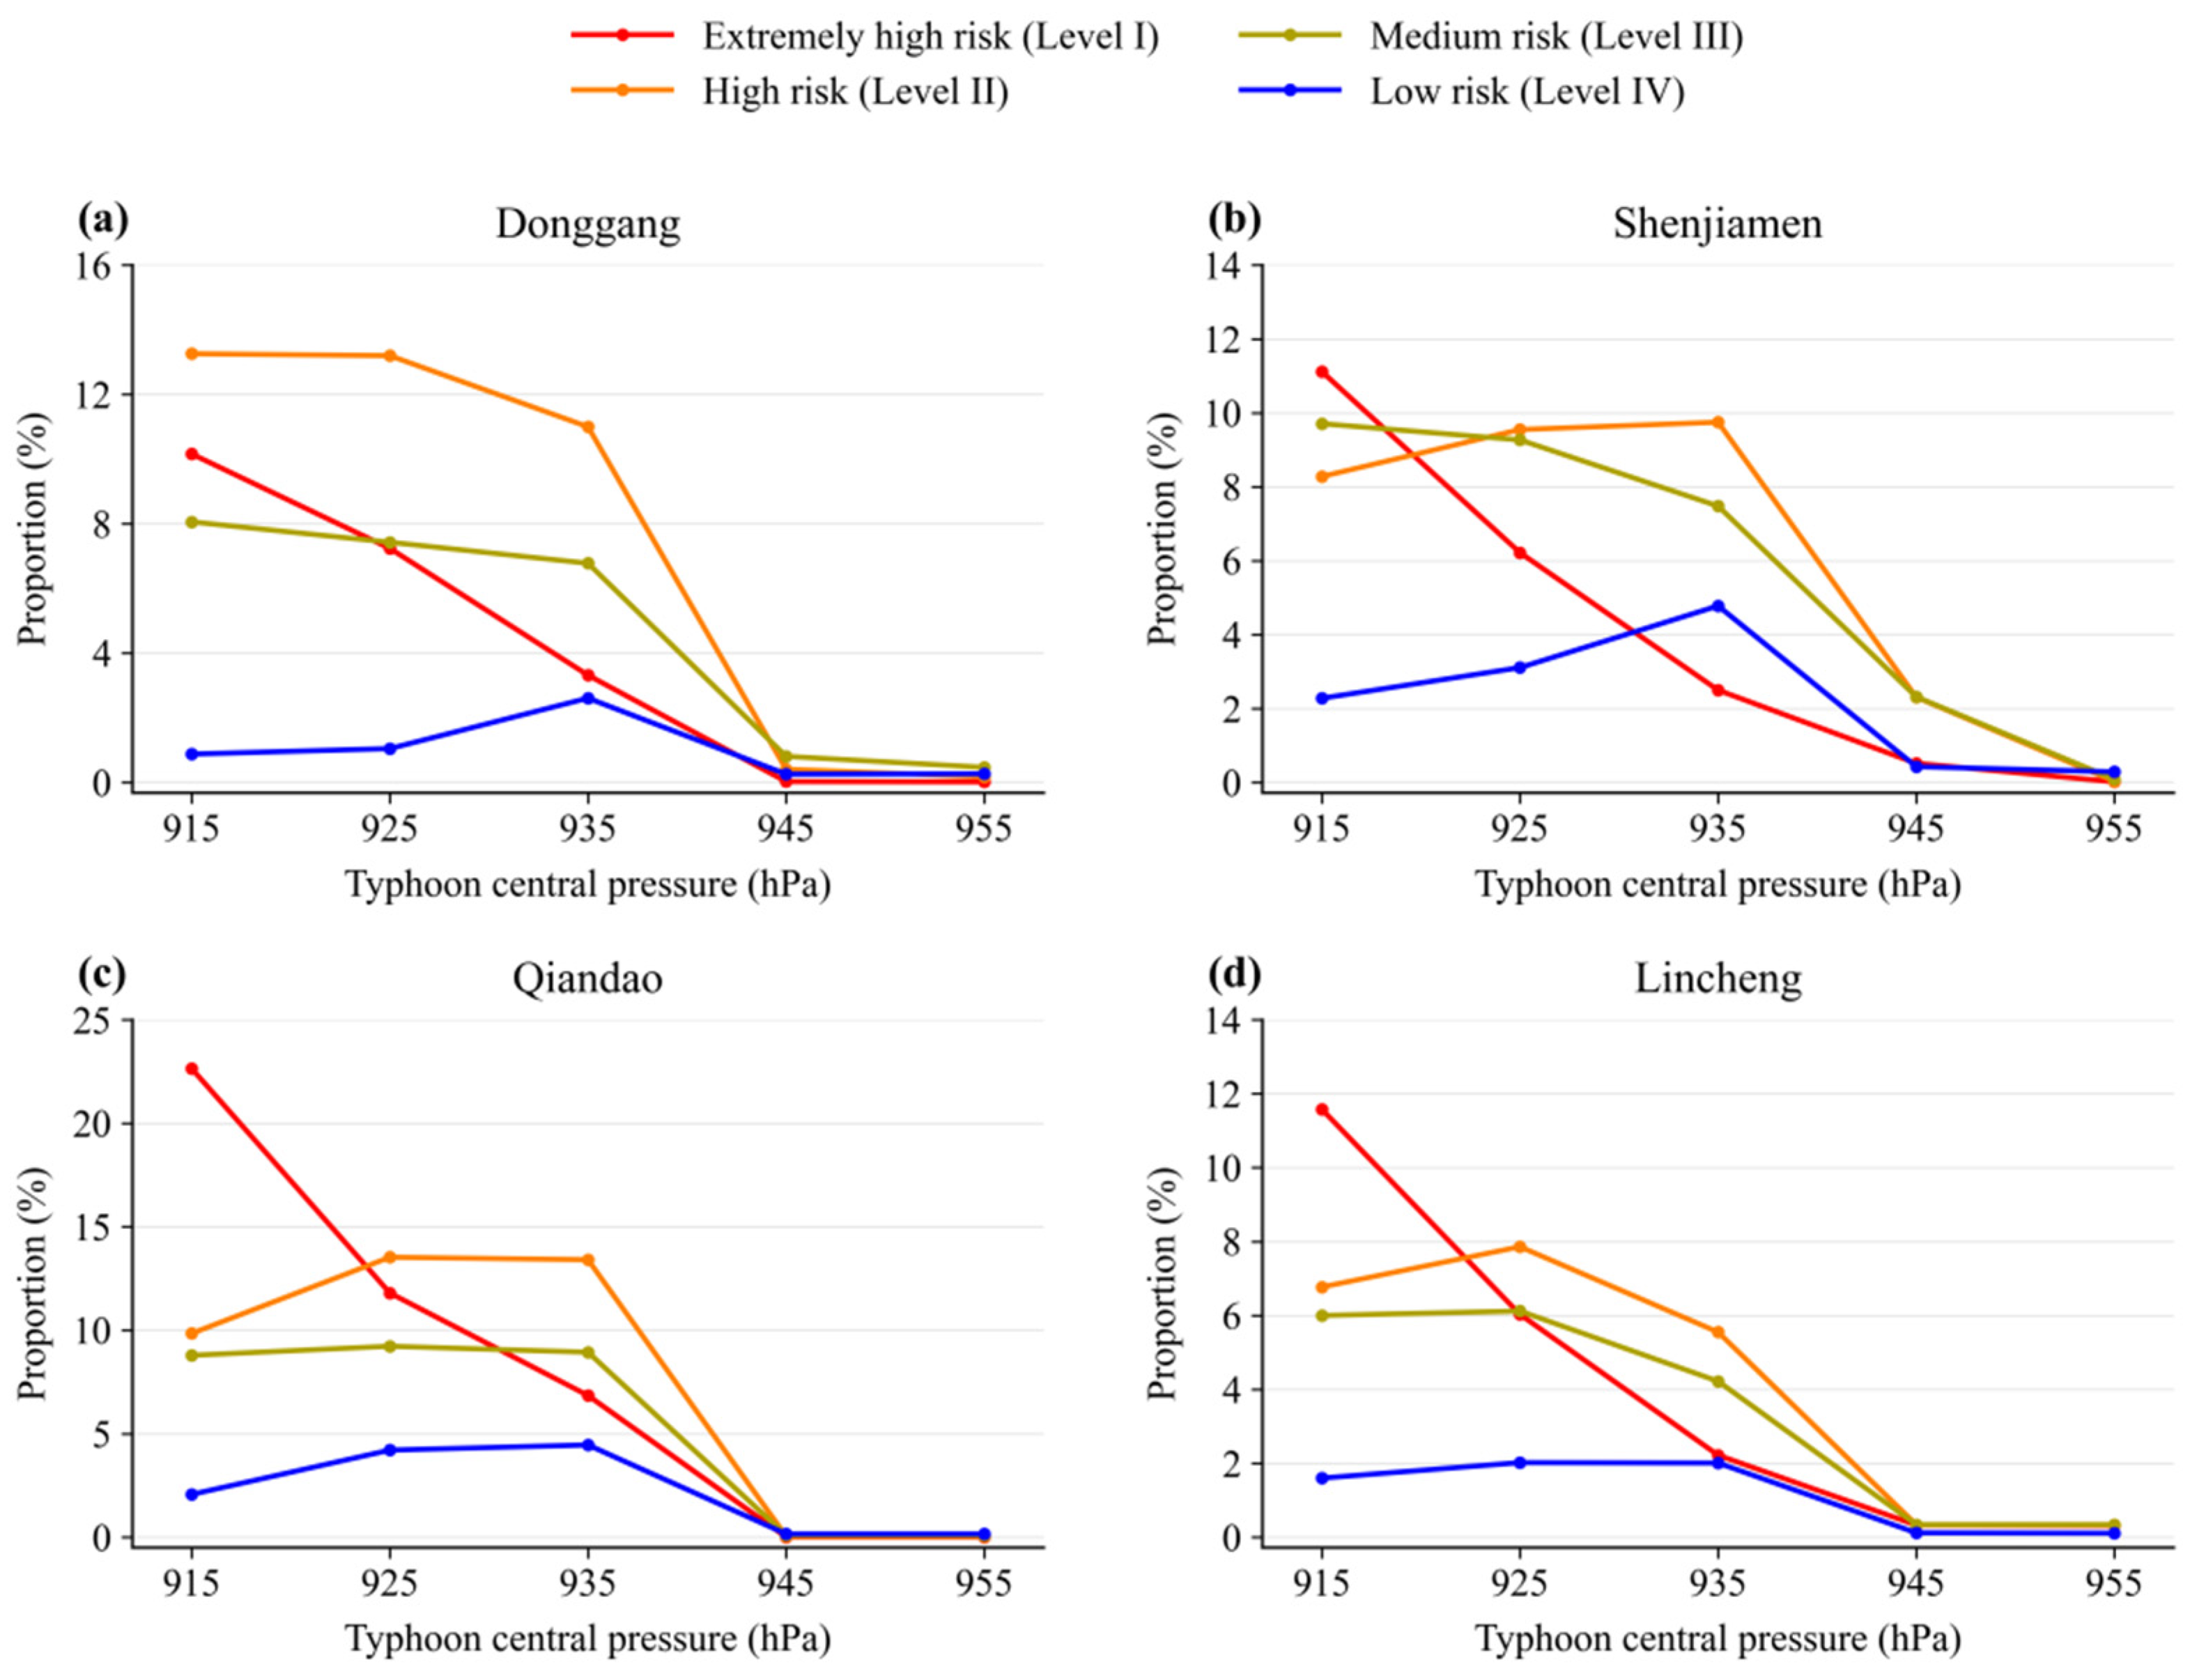

Disclaimer/Publisher’s Note: The statements, opinions and data contained in all publications are solely those of the individual author(s) and contributor(s) and not of MDPI and/or the editor(s). MDPI and/or the editor(s) disclaim responsibility for any injury to people or property resulting from any ideas, methods, instructions or products referred to in the content. |
© 2026 by the authors. Licensee MDPI, Basel, Switzerland. This article is an open access article distributed under the terms and conditions of the Creative Commons Attribution (CC BY) license.