


Abstract
Canal slope failures caused by freeze–thaw action frequently occur in cold regions. Most of the failures are closely associated with shear behaviors of slope soil. In this study, the shear behaviors of canal soil under freeze–thaw cycles (FTCs) are measured and analyzed. Then, a discrete element model is constructed and its accuracy is verified by experimental data. The mesostructural evolution of soil under different FTCs during the shear process is simulated. The results show that the FTCs lead to a significant degradation of peak stress and cohesive force of the soil. After five FTCs, the cohesive force decreases to 28.99 kPa. The internal friction angle shows a slight decreasing trend as the number of FTCs increases, and its value ranges from 9° to 16°. The simulated peak values agree well with the experimental data, with a maximum mean bias error (MBE) within 2.27% for samples when the FTCs range from zero to five. FTCs can promote the continuous propagation of microcracks within the soil, and the number of tensile cracks is greater than that of shear cracks. After five FTCs, the numbers of shear cracks, tensile cracks and total microcracks reach 1798, 6779, and 8577, respectively. The FTCs disrupt the original network of contact force chains, causing the number of particle contacts to decrease initially and then increase. The displacement of soil particles and the extent of the shear band during shearing increase significantly after FTCs. The findings of this study reveal the mesoscopic mechanism of shear degradation of canal slope soil under freeze–thaw conditions, and provide experimental evidence and numerical analysis methods for the stability evaluation of canal slopes in cold regions.
1. Introduction
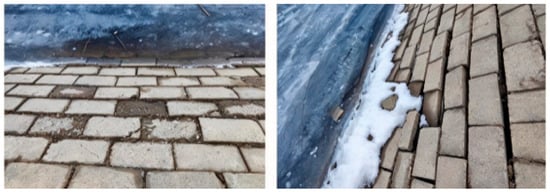
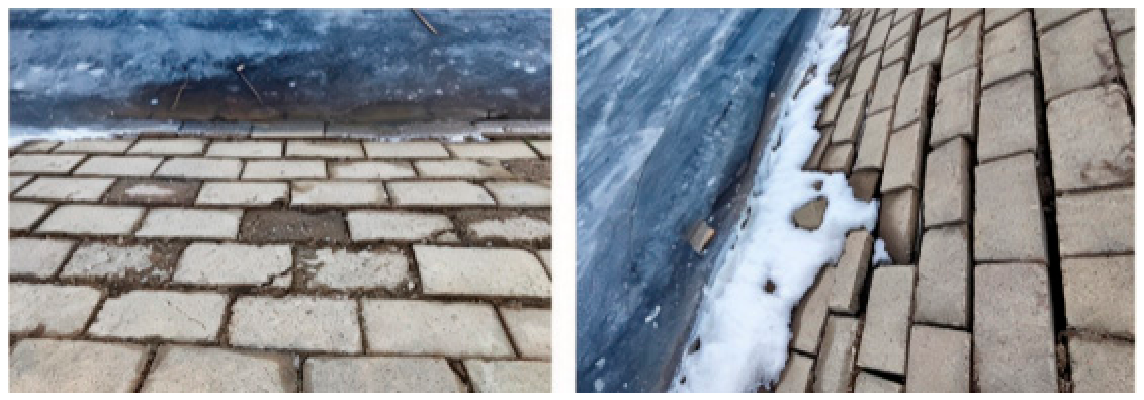
Cold regions account for 43% of China’s total land area and are mainly located in northeast and northwest regions [1]. Freeze–thaw action plays an important role in determining the service life and performance of hydraulic engineering projects [2,3]. As key water-conveying carriers, canals undertake multiple functions including water resource allocation and agricultural irrigation and serve as the core link between water sources and farmland. As one of China’s major grain-producing areas, this region has extensive irrigation canal systems [4]. However, canals in these areas suffer severe damage induced by freeze–thaw action, including frost heave and slope failure [5,6], as shown in Figure 1. Such damage not only reduces the water utilization coefficient, but also increases project operation costs [7].
Figure 1.
Damage to canal slopes caused by freeze–thaw action.
The shear behavior of soils under FTCs determines the stability and bearing capacity of the canal slopes. The changes in soil microstructure are the main factors affecting shear behavior [8,9,10]. Soil particles break along with the generation of microcracks under the action of frost heaving force [11]. Although some of the cracks are restored after thawing, the irreversible structural damage always exists [12]. More importantly, the thawing and infiltration of snow on the upper part of the canal slope during the initial thawing stage further degrades the shear strength [13,14]. Once the shear strength reaches a critical value, slope failure may occur. Moreover, the shear parameters including cohesive force and friction angle are the necessary parameters for assessing the stability of canals. For the above reasons, many scholars have focused on the shear behaviors of soil using experiments and numerical analysis [15,16,17]. Jiang et al. found that the cohesion and shear strength of soils decrease, whereas the internal friction angle increases after FTCs. However, the increase in the internal friction angle is small and generally less than 4° [18]. In addition, the stress–strain curves of the soil gradually change from strain-softening to strain-hardening, with an increasing number of FTCs [19]. Liu et al. reported a marked reduction in the unconfined compressive strength of soil, with a maximum decrease of 37% after the first freeze–thaw cycle [20]. Yan et al. measured the shear properties including stress–strain behavior, peak undrained shear strength, resilient modulus, cohesive force and internal friction angle of soils under FTCs, and found that the undrained shear strength, resilient modulus, and cohesive force basically showed a decreasing–steady–decreasing trend with increasing FTCs, and the dynamic evolution of soil microstructure is mainly responsible for such variations [21]. This and other experimental research provides reliable evidence to help engineers understand the damage mechanisms of canals. However, soil microstructure is not well reflected in these existing studies.
As Particle Flow Code (PFC) can explain the macroscopic mechanical behavior of soil from a mesoscopic level by simulating the movement and interaction of spherical particle aggregates, most scholars have investigated the development of microcracks of geomaterials using this method. Tang et al. found that the vertical expansion range of microcracks inside the soil–rock mixture gradually increases during shearing with the number of FTCs, while porosity first increases, then decreases followed by another increases again with the number of FTCs [22]. Liu et al. found that the number of tensile microcracks of sandstone dominated throughout the cyclic loading and unloading process, but with an increase in the number of FTCs, the percentage of shear microcracks increased [23]. Gou et al. simulated the mechanical behaviors and failure mechanisms of rock–concrete composite specimens. They suggested that the FTCs mainly generate tensile cracks, and the sensitivity to crack initiation increases with number of cycles. The percentage of shear cracks among all cracks gradually increases as the number of FTCs increases [24]. Feng et al. indicated that the energy value at the peak and the ratio of tensile cracks to shear cracks in rocks decrease with the number of FTCs for rocks. They also examined energy evolution and the growth of different types of microcracks during triaxial compression of freeze–thawed rock [25]. Li et al. investigated the damage mechanism of rocks combining multiscale simulation, and revealed that with the increase in the number of FTCs, the number of microcracks and pores within the rock gradually increase, and the rate of microcrack formation accelerates, leading to a significant decrease in static compression and splitting strength [26]. However, most relevant studies have been conducted on rocks or rock–soil mixtures. The structural characteristics of soil differ greatly from those of composite rock-soil materials, especially under FTCs. The freeze thaw action exerts a more significant destructive effect on the pore structure and particle arrangement of soil [27,28], particularly in canal slopes whose foundations are directly exposed to water. Periodic phase transformation and volume expansion of pore water within soil continuously squeeze and split soil particles and aggravate the development of internal microcracks [29,30].
Based on the above analysis, this study conducted a series of shear tests on the canal slope soil under FTCs. The variations in shear strength, cohesive force, and internal friction angle of soil were analyzed. Meanwhile, a numerical model was proposed and its accuracy was evaluated by experimental data. The shear behaviors including microcracks and force chains as well as particle displacement of soil under different FTCs were simulated. This study can not only reveal the deterioration mechanism of shear behavior for canal slope soil induced by FTCs but also provides an experimental basis and numerical methods for further evaluating the stability of canal slopes in cold regions.
2. Experimental Design and Numerical Analysis Method
2.1. Experimental Process
The soil was drilled from the canal slope of the main stream of the Heilongjiang River. The excavation depth ranged from 0 m to 1.5 m. According to the Standard for Geotechnical Testing Method (GB/T 50123-2019) [31] and the Engineering Classification Standards for Soil (GB/T 50145-2007) [32], the soil can be classified as low-liquid-limit clay; the properties of soil are listed in Table 1.
Table 1.
Basic physical parameters of test soil.
The density and water content of the samples were 1.60 g/cm3 and 22%, respectively, which are the same as the in situ conditions of the slope. The FTCs were conducted in an environment simulation laboratory that is capable of linearly controlling temperature. The freezing temperature and thawing temperature were −30 °C and 20 °C, respectively. According to the similarity criterion, the in situ air temperature variation process was simplified into five stages, including cooling stage I, a constant negative temperature stage, a heating stage, a constant positive temperature stage, and cooling stage II [33]. Considering that the internal condition of the soil generally stabilizes after 5 FTCs [34], the number of FTCs are set to 0, 1, 3 and 5, respectively. After the samples were subjected to the scheduled number of FTCs, the shear test was conducted with a direct shear apparatus. In this study, the quick shear method was used to obtain the shear strength parameters of the soil. The shear loading was applied immediately after vertical pressure was applied on the sample to ensure that the sample fails within 3–5min. Therefore, the shear rate was set to 2.4 mm/min during the shearing. The vertical pressures were 100 kPa, 200 kPa, 300 kPa and 400 kPa, respectively. When obvious fluctuations or a sharp decrease in shear stress are observed as shear strain increases during the shear process, repeat tests are required.
2.2. Numerical Analysis Method
Simulation of freeze–thaw process
The phase transition between ice and water during freeze–thaw cycles induces volume expansion and contraction of pore water, which disrupts the soil skeleton. Therefore, soil thermal properties are not required as input parameters, and the evolution of soil strength and microcracks under FTCs can be captured in PFC [35,36]. The soil particles are rearranged while the microcracks are generated and accumulated during the FTCs. Based on this, the soil matrix in the freeze–thaw process satisfies the following assumptions:
- (1)
- The samples are composed of soil particles and water particles.
- (2)
- The influence of pore water migration during FTCs is neglected. Only the volume expansion of water particles is considered, and all other particles are assumed to be rigid in the freezing process.
- (3)
- The temperature field within the sample is uniform.
The area of a single water particle at the onset of freezing can be calculated as
where S0 is the area of an individual water particle at the beginning of freezing; r0 is the radius of the water particle at the start of the first freeze–thaw cycle or at the end of the preceding cycle.
The expansion of pore water particle radius can be expressed using [37]
The pore ice pressure can be calculated using
where uv is the expansion amount of particle radius caused by pore water; Em, Vm and Ei, Vi are the elastic modulus and Poisson’s ratio of soil and ice, respectively; n is the soil porosity; pi is the ice pressure of soil mass; wu is the content of unfrozen water; T is the initial freezing temperature.
The area of frozen water particles can be expressed as
where ΔSw is area increment of water particles after freezing.
The temperature variation can be defined as
where T is temperature; t is the time.
The content of unfrozen water can be obtained using
The size of water particles during the FTCs is controlled by the unfrozen water content. When the temperature decreases, the unfrozen water content decreases while the proportion of frozen water increases. The unfrozen water content gradually increases, and water particles shrink along the same path during the thawing process. The variation in water particle size caused by ice–water phase change is reversible during the FTCs. To reflect the changes in soil structure under FTCs, neither equilibrium nor rearrangement of particles within the sample takes place after each freeze–thaw cycle.
Parallel-bond (PB) contact model
Considering that the samples are cemented by fine soil particles and exhibit distinct structural characteristics, the parallel-bonded contact model is adopted to simulate the cementation between particles. The parallel-bonded model was proposed by Potyondy and Cundall [38], and can characterize particle–particle and particle–wall contact interactions. Owing to the existence of parallel-bonded bonds, relative motion at contacts generates forces and moments within the soil matrix. Once bonds break, this model degenerates to the linear contact model. Bond failure modes are governed by shear and tensile strengths. Tensile failure occurs when the tensile force exceeds the tensile strength, whereas shear failure takes place when the shear force surpasses the shear strength.
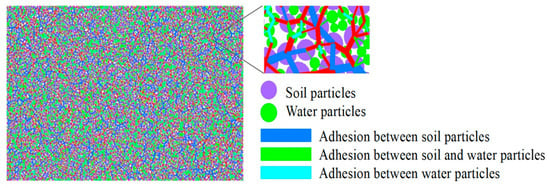
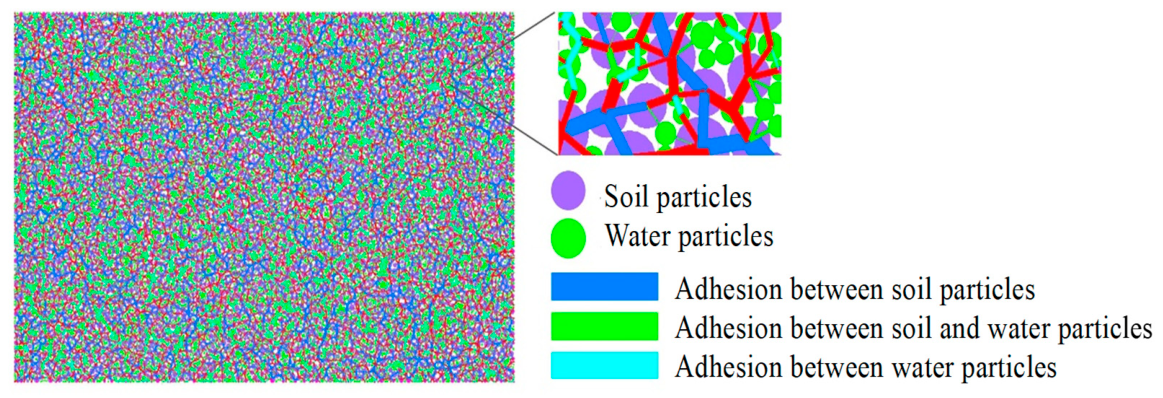
The height and the diameter of the numerical model are 40 mm and 61.8 mm, respectively. The minimum size of the water particles is 0.10 mm while the maximum size of the water particle is 0.16 mm. The minimum size and maximum size of the soil particles are 0.175 mm and 0.375 mm, respectively. The total number of water particles and soil particles generated in the model is 18,484. The soil density and moisture content are 1600 kg/m3 and 22%, respectively, while the water particle density is 1000 kg/m3. A schematic diagram of the generated model is shown in Figure 2. The numerical model consists of upper and lower shear boxes, and all shear box boundaries are simulated using rigid walls. The two side boundaries of the upper shear box remain fixed during the shear process, with both horizontal and vertical velocities set to zero and the rotation of the wall constrained. The normal load is controlled by the stress servo method. The boundaries of the lower shear box move horizontally at a constant velocity in the shear direction with zero vertical velocity, and their rotation is also constrained.
Figure 2.
Schematic diagram of numerical model.
2.3. Mesoscopic Parameter Calibration
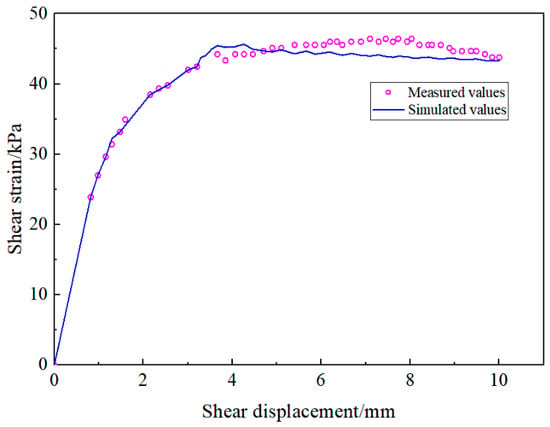
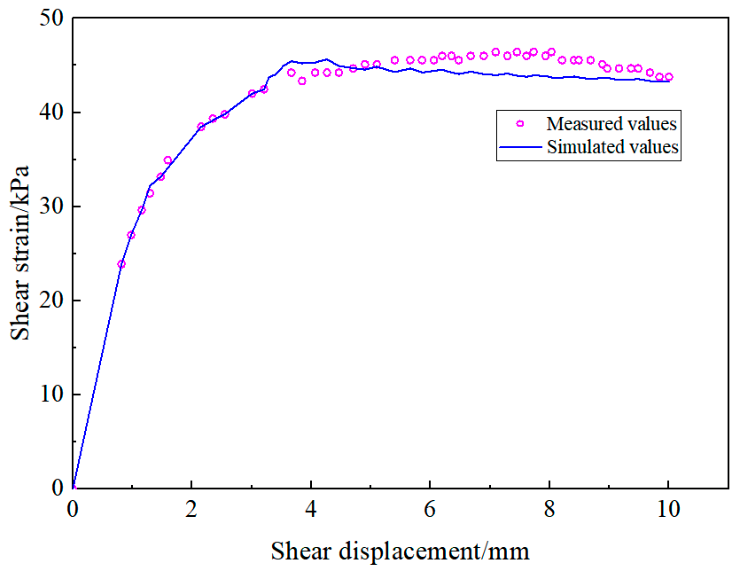
The trial-and-error method is adopted to calibrate the mesoscopic parameters of the model, and the macroscopic stress–strain curve is taken as the evaluation criterion for parameter rationality [33,34]. To avoid the development of microcracks outside the soil skeleton and ensure the accuracy of the numerical model, the tangential and normal strengths of parallel bonds at the contact points between water particles and between soil particles and water particles are appropriately increased during calibration [39,40]. The relationship between shear stress and shear displacement of the sample after 5 FTCs under a vertical pressure of 100 kPa is calculated. The comparison between measured values and simulated values can be found in Figure 3. The peak shear stresses from the measured and simulated results are 45 kPa and 47 kPa, respectively. Although the peak shear stresses occur at shear displacements of 4 mm and 6 mm in the simulated and measured curves, respectively, the two curves exhibit consistent variation trends during shearing. Overall, the numerical values agree well with the measured values, which indicates that the model is reliable. The required parameters of the numerical model are listed in Table 2.
Figure 3.
Comparison between measured values and simulated values.
Table 2.
Parallel-bonded contact model parameters.
3. Results and Analysis
3.1. Variation in Shear Strength
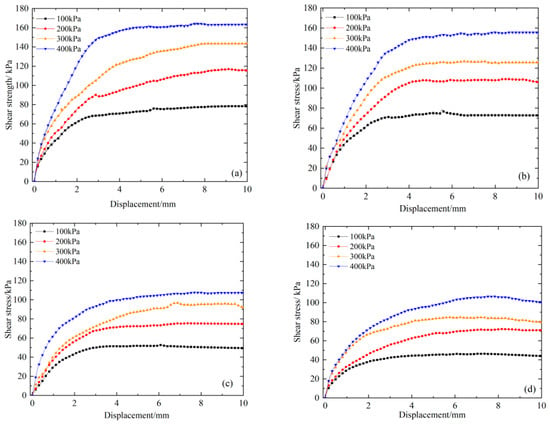
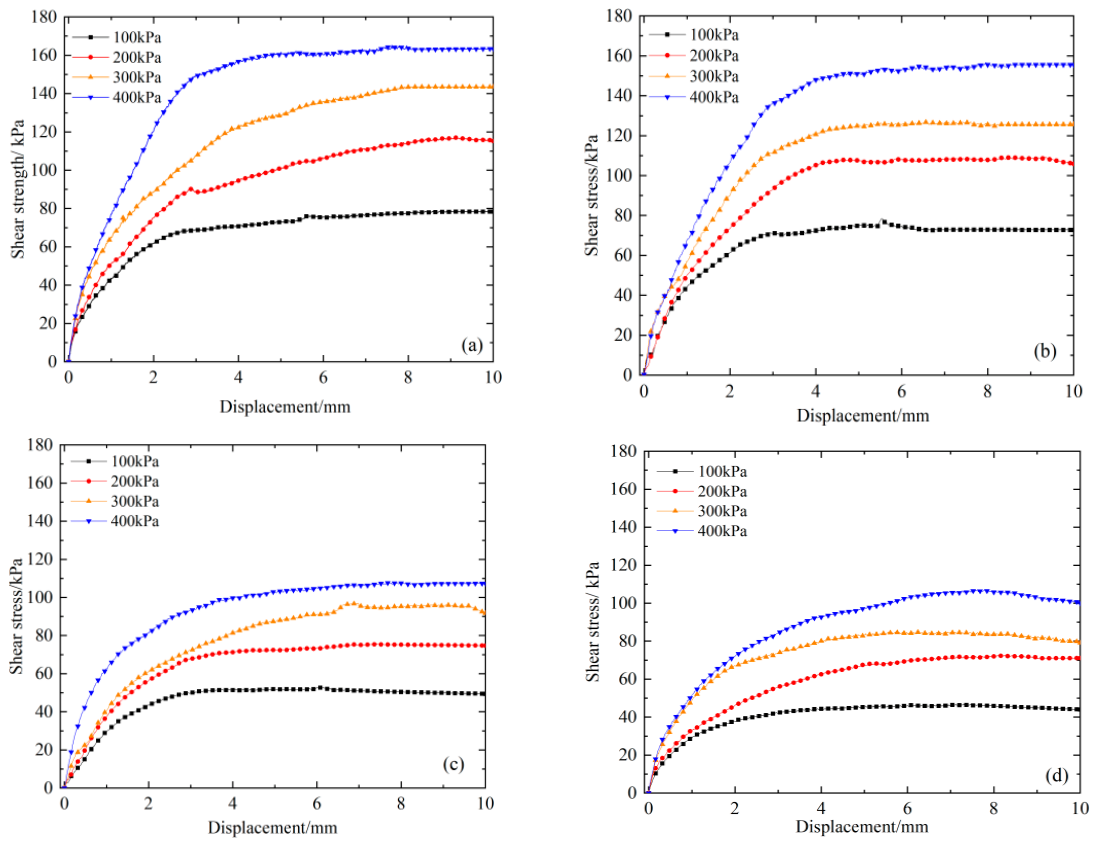
The relationships between shear stress and shear displacement of samples under different numbers of FTCs are shown in Figure 4. It can be seen that the shear stress increases with the vertical loading for the sample under the same number of FTCs. For samples not subjected to FTCs, the peak shear stresses corresponding to the vertical loads of 100 kPa, 200 kPa, 300 kPa and 400 kPa are 78.42 kPa, 116.05 kPa, 143.25 kPa and 163.32 kPa, respectively. This is mainly because the increased vertical load compacts soil particles and enhances the contact force and interlocking effect between particles. Finally, the frictional resistance on the shear plane is improved. Accordingly, a larger shear force is required to overcome interparticle friction and cementation, which macroscopically manifests that the shear strength of soil increases with rising vertical pressure. With an increasing number of FTCs, the peak shear stress of samples under the same vertical pressure gradually decreases. After one, three and five FTCs, the peak shear stress is 71.86 kPa, 51.15 kPa and 44.46 kPa, respectively, when the vertical pressure is 100 kPa. Similarly, those values are 100.03 kPa, 74.76 kPa and 70.82 kPa, respectively, when the vertical pressure is 200 kPa. This reflects that FTCs induce significant changes in the meso-structure of soil. Repeated frost heave and thawing of pore water destroy the original cementation bonds between soil particles, increase pores within the soil, and weaken the soil skeleton. Meanwhile, freeze–thaw action disturbs the contact state among particles and breaks some soil aggregates. Soil is more prone to relative slippage under the action of shear load, leading to a decrease in the shear strength. Consequently, the peak shear stress exhibits continuous degradation with the increasing number of FTCs.
Figure 4.
The stress–strain curves of samples under different FTCs. (a): FTCs = 0; (b): FTCs = 1; (c): FTCs = 3; (d) FTCs = 5.
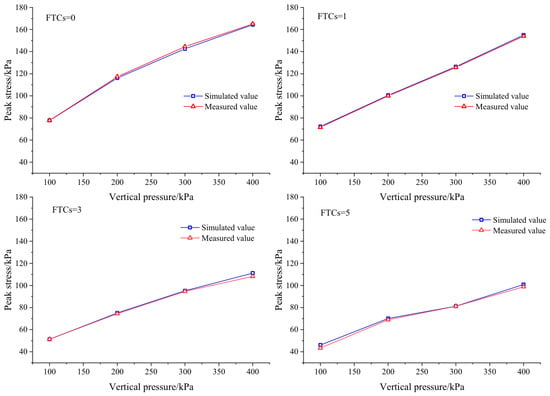
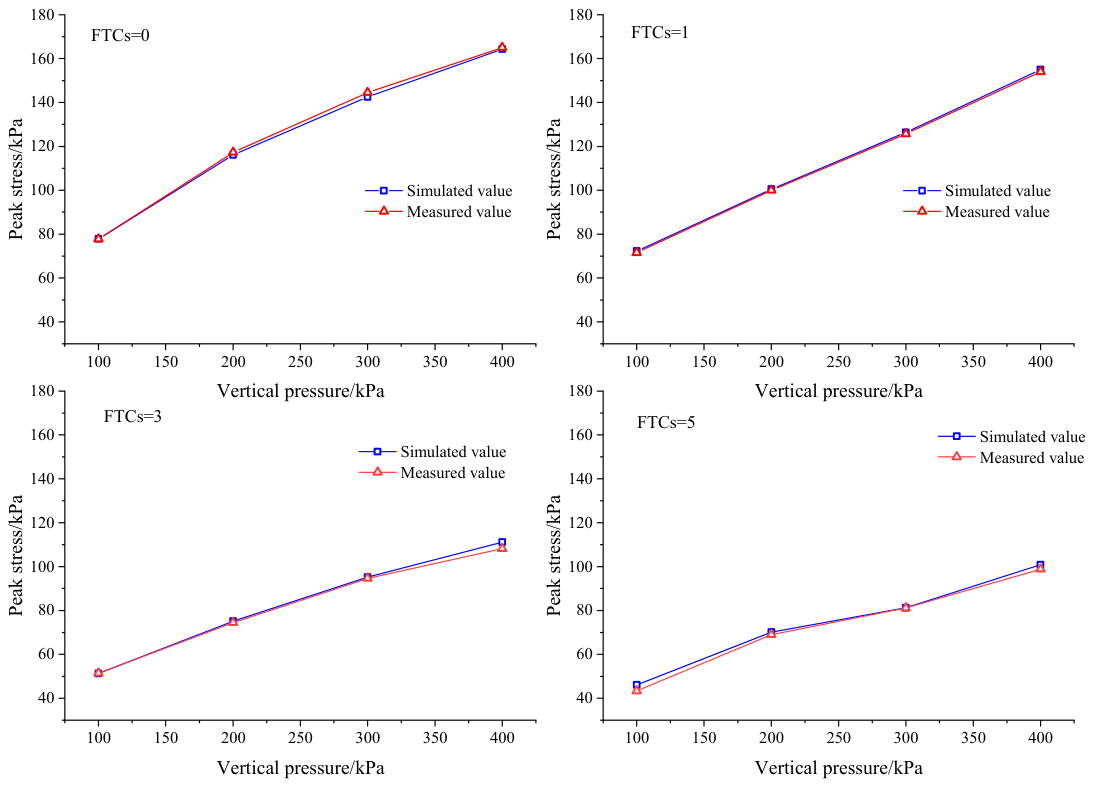
To further examine the performance of the model, the peak strength of all samples under the vertical loads of 100 kPa, 200 kPa, 300 kPa and 400 kPa after different numbers of FTCs were calculated. The mean bias error (MBE) was employed to evaluate the difference between simulated data and measured data. A smaller value of MBE indicates that the model is more accurate. The MBE can be calculated usin
where the Mi is the numerical results; Ei is the experimental results; n is the total number of data points.
As shown in Figure 5, the values of MBE for the samples subjected to zero, one, three and five FTCs are 0.32%, 1.19%, 1.76% and 2.27%, respectively. This further demonstrates the reliability of the numerical model.
Figure 5.
The shear strength of samples under different FTCs.
The relationship between peak stress and normal stress is established using peak stresses obtained under various normal stresses. The cohesive force and internal friction angle of the sample are determined from the Mohr–Coulomb strength criterion; they can be obtained using
where τ is the shear stress; σ is the normal stress; c is the cohesive force; φ is the internal friction angle.
τ = c + σ tanφ
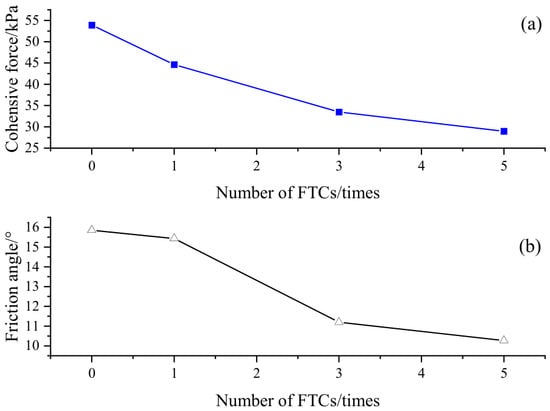
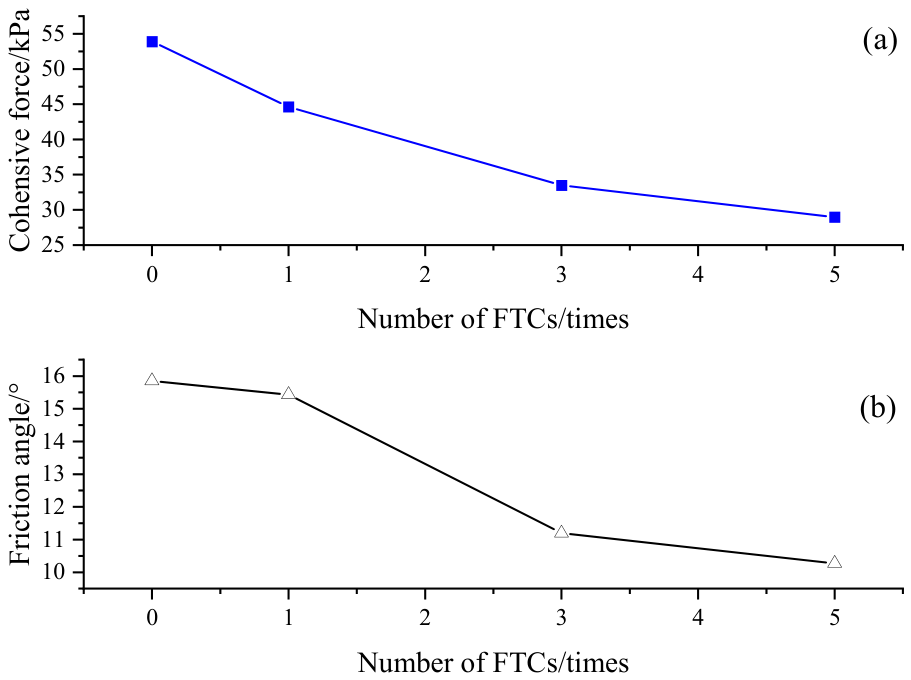
The variations in cohesive force and internal friction angle of samples under different FTCs are illustrated in Figure 6. It can be observed that the cohesive force gradually decreases with an increasing number of FTCs. A remarkable drop in cohesive force occurs after the first freeze–thaw action, followed by a slight further reduction as the number of FTCs continues to rise. When the number of FTCs reaches five, the cohesive force is 28.99 kPa. Cohesive force is mainly governed by the physicochemical properties of mineral particles in soil. After FTCs, volume expansion induced by water ice crystallization enlarges the distance and reduces the contact area between soil particles. Consequently, the van der Waals force and Coulomb force between the particles decrease significantly, and the cementing force is weakened. As the number of FTCs increases, the number of internal soil pores gradually stabilizes. For this reason, the cohesive force decreases and tends to be stable after repeated FTCs. Overall, the internal friction angle shows a decreasing trend with the increase in the number of FTCs, and its value ranges from 9° to 16°. The internal friction angle is primarily determined by the frictional effect generated by the sliding of soil particles. FTCs weaken the bonding capacity of particles and thicken the bound water film, which reduces the internal friction angle.
Figure 6.
The cohesive force and internal friction angle of samples under different numbers of FTCs. (a): Cohesive force; (b): Friction angle.
3.2. Microcrack Evolution Under FTCs
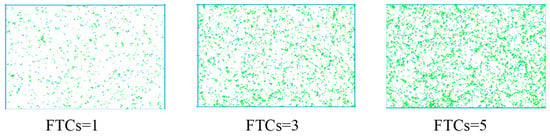
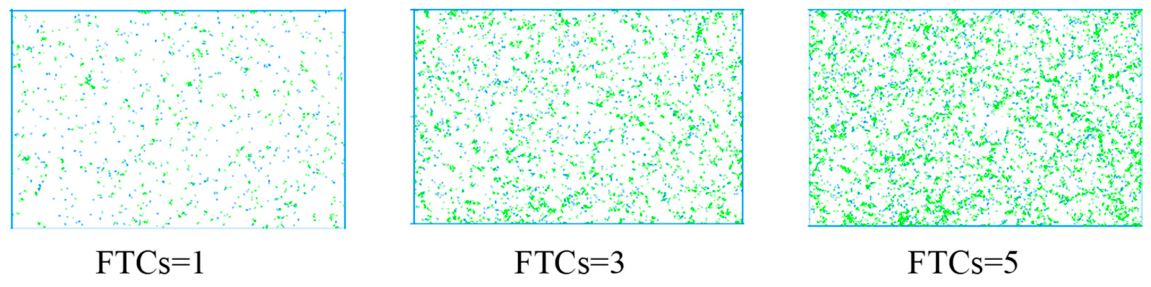
The evolution of microcracks within soil induced by FTCs is shown in Figure 7. It can be observed that the development of microcracks is strongly governed by the number of FTCs. Only sparse microcracks are identified and the contact damage between particles is limited after one freeze–thaw action. As the FTCs increase to three, interparticle bonds are progressively disrupted by repeated frost heave. Meanwhile, the number of microcracks increases markedly. These cracks propagate in a dispersed manner across the soil. When the number of FTCs reaches five, abundant microcracks are generated and merged. Crack density increases simultaneously. Cementation bonds between soil particles are persistently degraded by volumetric expansion and contraction induced by FTCs. The accumulated growth of microcracks gradually degrades the soil microstructure, which is recognized as the intrinsic factor for the deterioration in mechanical properties of soil subjected to FTCs.
Figure 7.
Microcrack evolution under different numbers of FTCs.
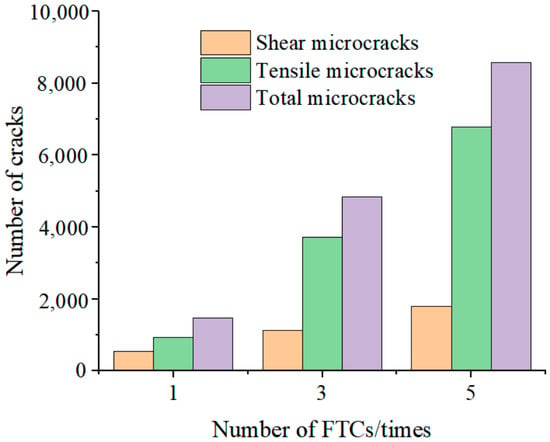
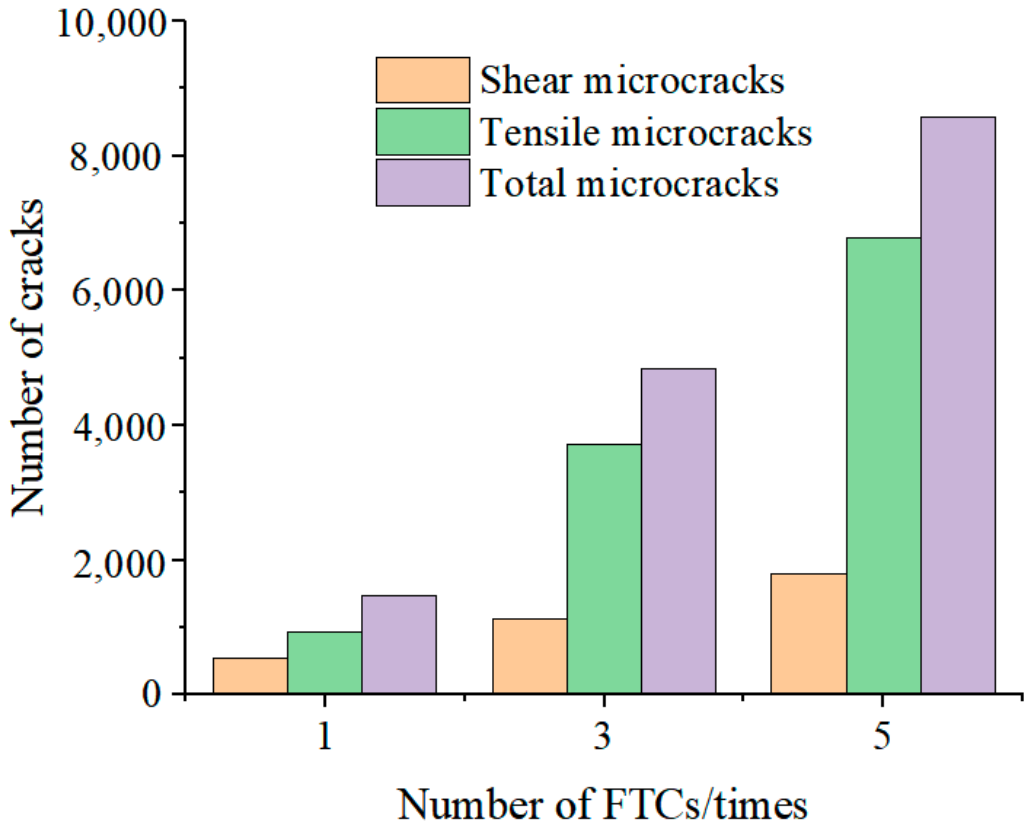
To further quantify the evolution of microcracks when the number of FTCs ranges from one to five, the numbers of shear microcracks, tensile microcracks and total microcracks are presented in Figure 8. Tensile microcracks occur between particles when the equivalent tensile stress on the bonded surface exceeds the bond tensile strength. Shear microcracks occur when the maximum tensile stress on the parallel bonds does not exceed their tensile strength and the calculated shear stress exceeds the shear strength of the parallel bonds, which follows the Mohr–Coulomb criterion. Clearly, the three types of microcracks increase with the number of FTCs. After one FTC, the number of shear microcracks, tensile microcracks and total microcracks is 543, 934 and 1477, respectively. When the number of FTCs reaches three and five, the number of microcracks is 1124, 3715, and 4839 and 1798, 6779, and 8577, respectively. Tensile microcracks are associated with tensile stresses generated at particle contacts by pore ice expansion during freezing, whereas shear microcracks are induced by relative particle sliding triggered by cyclic volumetric expansion and shrinkage during FTCs. In comparison, tensile microcracks dominate in quantity, which can be attributed to the fact that the tensile strength of interparticle bonds is much lower than their shear strength. Furthermore, tensile failure is preferentially activated under frost heave. The continuous development of both types of microcracks under FTCs demonstrates that the cementation strength between soil particles is markedly reduced by FTCs.
Figure 8.
Numbers of different types of microcracks in samples under FTCs.
3.3. Distribution of Contact Force Chain Under FTCs
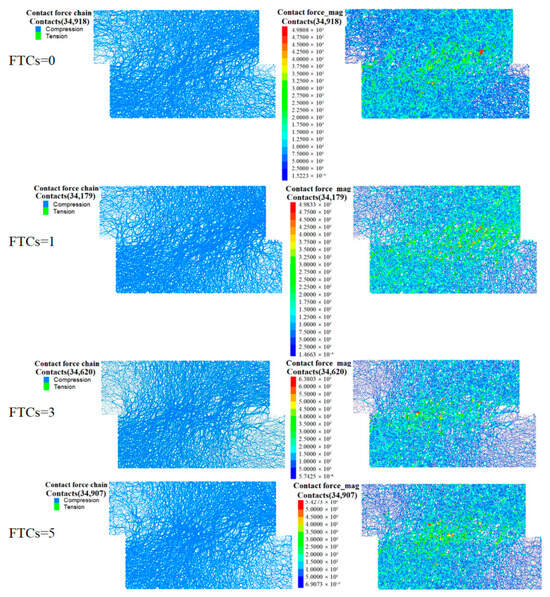
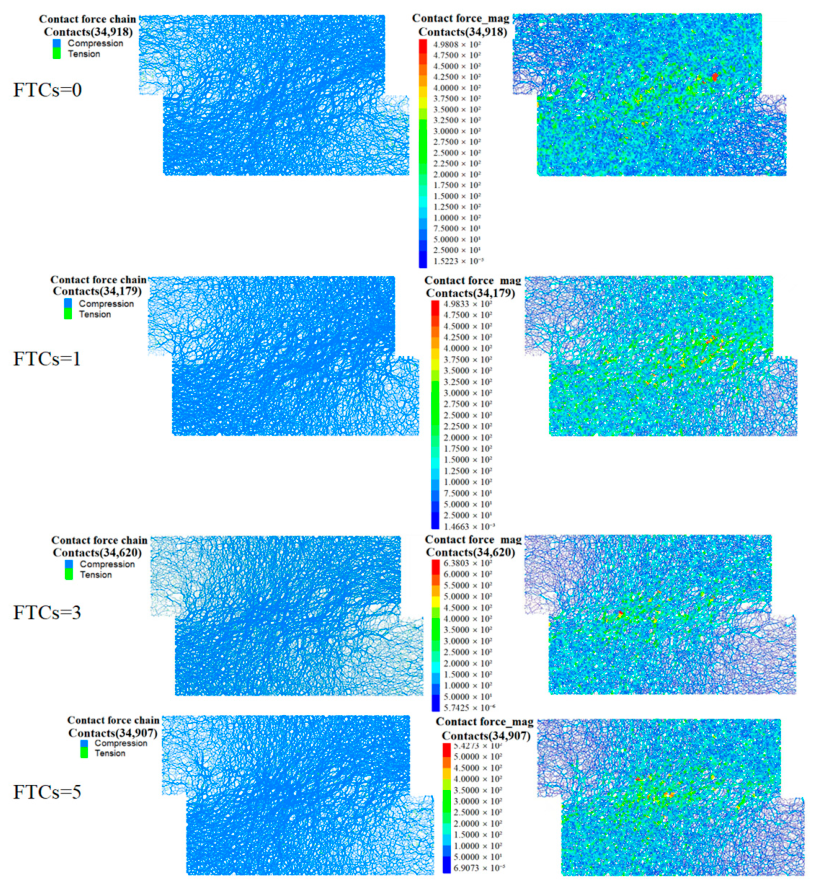
Figure 9 illustrates the contact force chains and contact force distributions of soil subjected to different numbers of FTCs. It can be observed that FTCs substantially change the contact states within soil, and the total number of contacts presents a trend of first decreasing and then increasing. The total number of contacts is 34,918 for the sample without FTCs. The distribution of force chains is uniform. Meanwhile, the force chains are primarily composed of compressive force chains, with a relatively low proportion of tensile force chains. After one FTC, the frost heaving of pore ice leads to a decrease in the cementation strength between soil particles, causing structural damage within the soil. The original bonds between particles experience local breakage, and the number of contacts decreases to 34,179. As the number of FTCs increases to three, repeated frost heaving and compression promote the rearrangement of soil particles, resulting in an increase in the number of contacts to 34,620. When the number of FTCs reaches five, the damage to the soil skeleton accumulates, and the distribution of force chains tends to become fragmented. FTCs cause the failure of particle cementation, and local stress concentration further induces the propagation of tensile microcracks. At this time, the number of contacts is 34,907. However, it is still lower than that of the sample without FTCs. The distribution of force chains characterizes the internal stress transfer pathways in soil. The bearing capacity of soil under shear load is controlled by a stable strong chain skeleton. As the shear displacement increases, microcracks generated by freeze–thaw action can induce buckling and breakage of the strong chain, resulting in a decrease in the bearing capacity of the soil. This phenomenon manifests as a decrease in the shear strength of soil under FTCs and also confirms the experimental results from a mesoscopic perspective.
Figure 9.
Distribution of contact force chains after shearing under different FTCs.
3.4. Evolution of Mesoscale Mechanical Properties During Shear Process Before and After FTCs
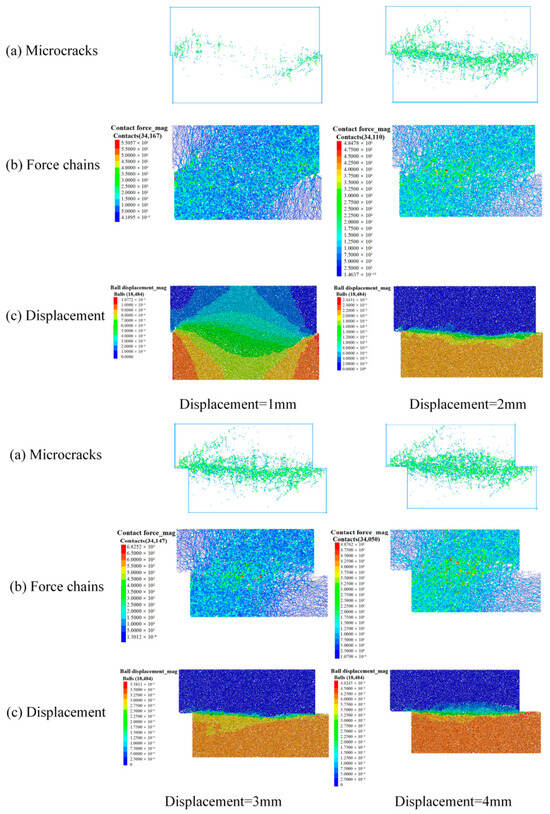
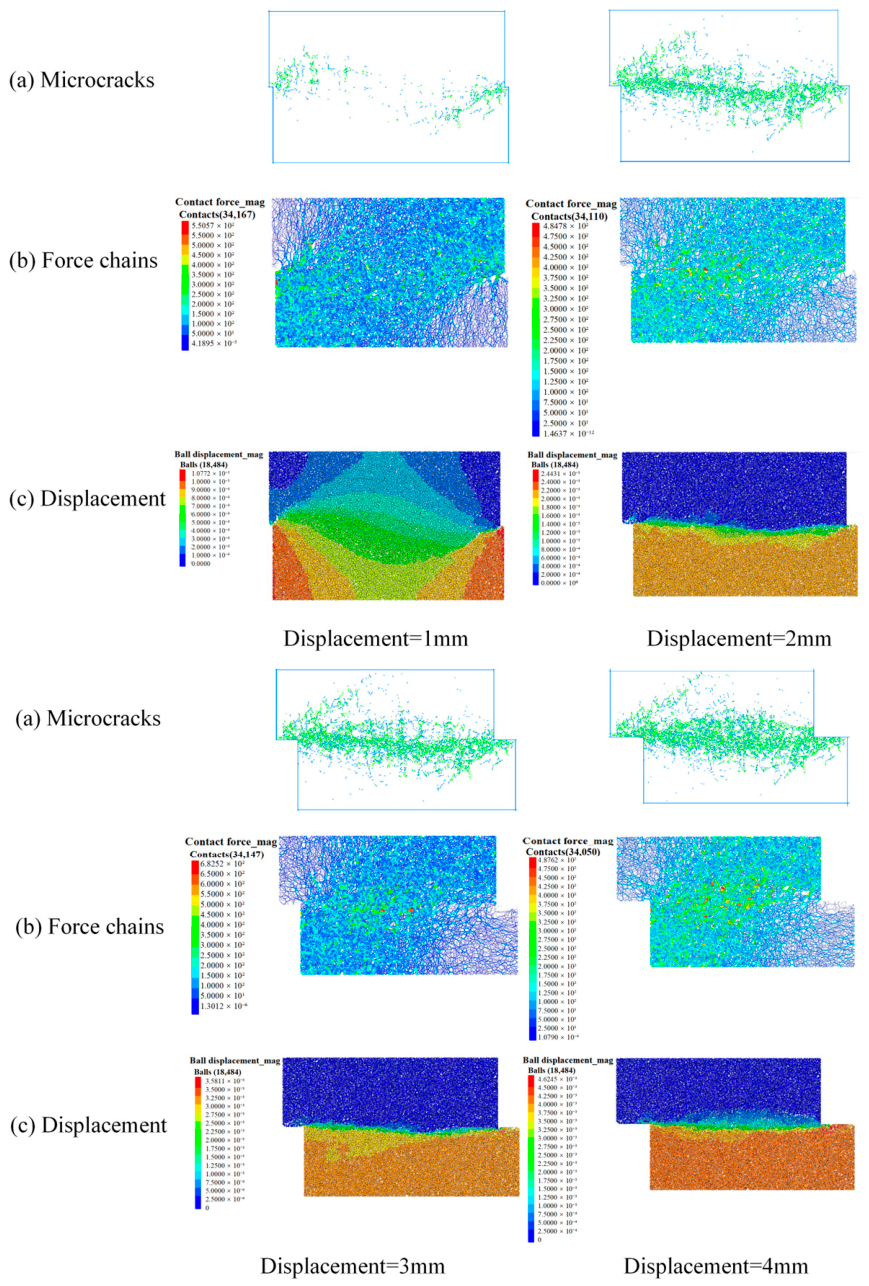
The sample without FTCs and the sample subjected to five FTCs are selected to illustrate the changes in soil mesostructure. Their microcracks, force chains, and particle displacements during direct shear tests are analyzed, as shown in Figure 10. It can be seen that there are only a small number of scattered microcracks inside the sample without FTCs when the shear displacement is 1 mm. The total number of particle contacts, maximum contact force and maximum displacement are 34,167, 550.57 N, and 1.07 × 10⁻³ m, respectively. The particles are compressed and no obvious shear band is formed at this time. When the shear displacement increases to 2 mm, the number of microcracks significantly increases, and the cracks gradually converge towards the middle of the sample. The number of contacts decreases to 34,110. As some contacts fail, the maximum contact force drops to 484.78 N. The maximum displacement of soil particles increases to 2.44 × 10⁻³ m. Meanwhile, the displacement begins to concentrate in the middle of the sample. Furthermore, the initial shape of the shear band gradually emerges, and slippage and dislocation start to occur between particles. A large number of microcracks are distributed in the middle of the sample, and the number of contacts is 34,147 at a shear displacement of 3 mm. The maximum contact force rises to 682.52 N, and the force chains shift toward both sides of the shear band. The maximum displacement increases to 3.581 × 10⁻³ m while the displacement concentration zone narrows further. When the shear displacement reaches 4 mm, microcracks fully penetrate and also form a complete macroscopic shear band. The number of contacts and the maximum contact force decrease to 34,050 and 487.62 N, respectively. Meanwhile, significant relative sliding occurs in the soil above and below the shear band. Obviously, the soil exhibits good structural integrity during the initial stage of shearing due to mutual compression. However, as the shear load increases, microcracks are induced when the local shear stress exceeds the bond strength of the particles. Subsequently, as the shear displacement continues to increase, microcracks continuously generate, propagate and connect. The force chain network undergoes continuous breakage and reorganization. The interparticle sliding friction gradually replaces the particle bonding effect, ultimately forming a concentrated shear failure zone. Therefore, from a mesoscopic perspective, soil shear failure essentially arises from the synergistic effects of microcrack accumulation and propagation, force chain reconstruction, and interparticle relative slippage.
Figure 10.
The distribution of microcracks, force chains and displacement for unfrozen–thawed sample.
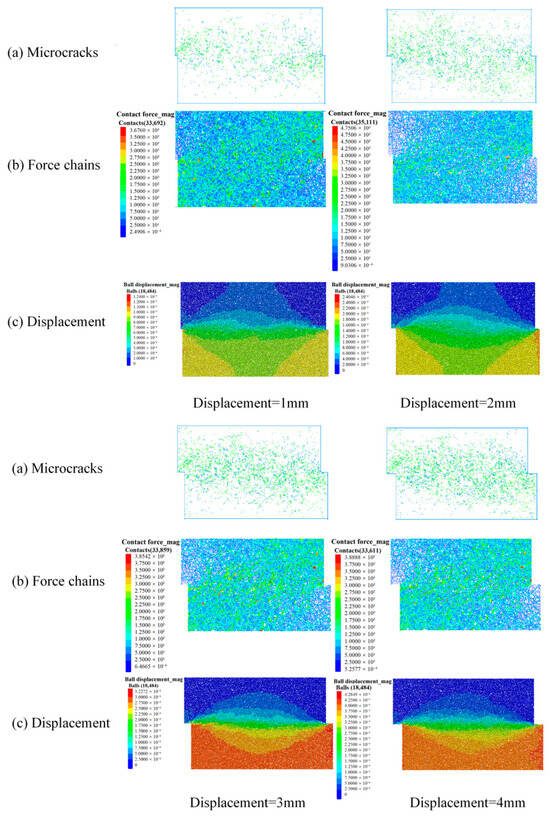
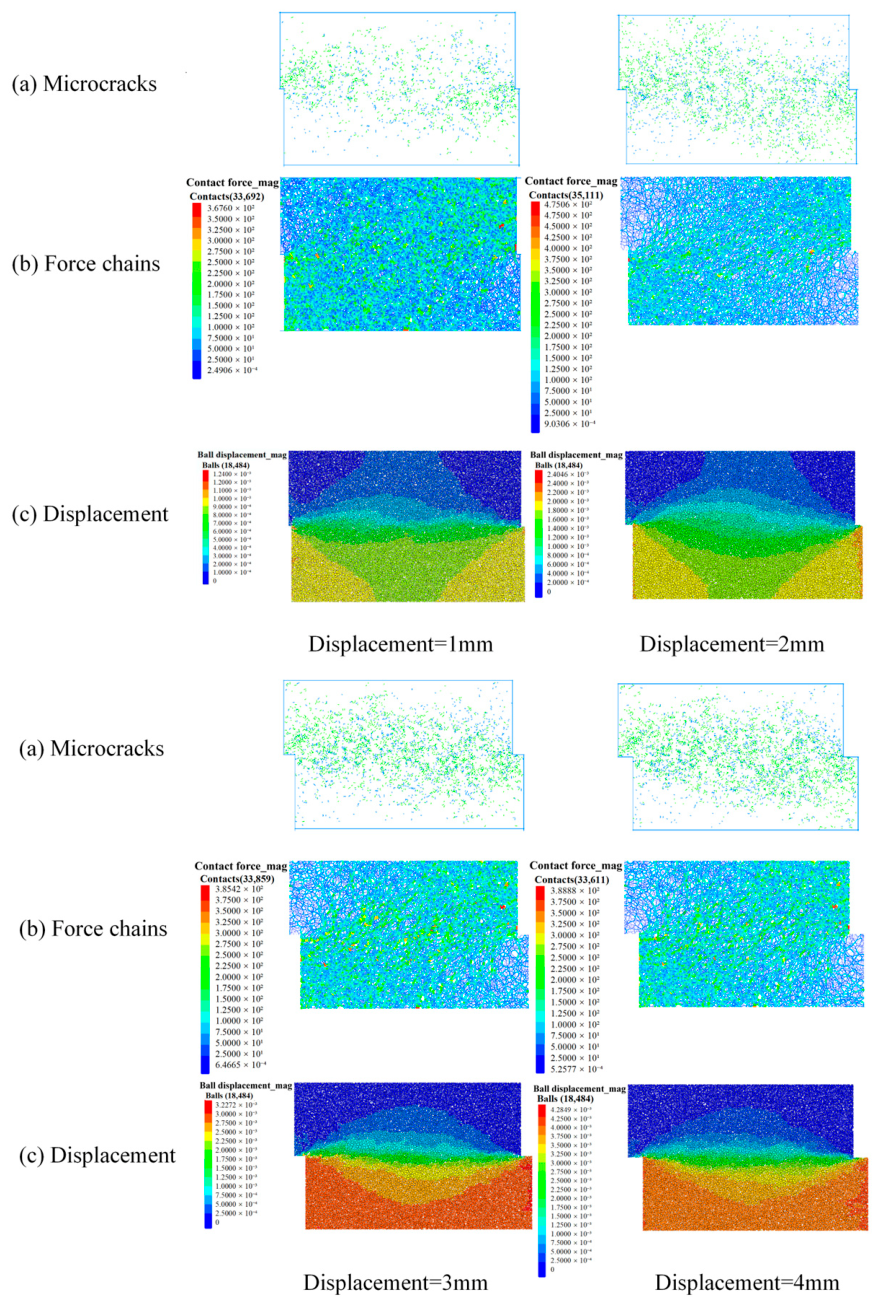
Compared to the sample without FTCs, the internal damage of the soil matrix significantly intensifies after five FTCs. As shown in Figure 11, microcrack development during shearing is significantly more extensive than in the sample without FTCs. A large number of microcracks are distributed in the sample when the shear displacement is 1 mm. At this time, the number of contacts is 33,692, which is about 1.40% lower than that of the unfrozen–thawed sample. As the shear displacement increases to 4 mm, the number of contacts decreases to 33,611. The maximum contact force ranges from 367.60 N to 388.88 N, which is also significantly lower than that of the unfrozen–thawed sample. The maximum displacement of particles ranges from 1.240 × 10⁻³ to 4.285 × 10⁻³ m. Evidently, the displacement of soil particles and the extent of the shear band after five FTCs are both greater than in the sample without FTCs at the same shear displacement. This phenomenon is primarily attributed to the formation of microcracks within the soil matrix due to the freezing of pore water. The existing damage further propagates under shear load, which weakens the integrity of the soil skeleton and reduces the bear capacity of the force chain. Therefore, microcrack development can be induced without requiring high shear stress.
Figure 11.
The distribution of microcracks, force chains and displacements of the sample after 5 FTCs.
4. Discussion
FTCs induce a variety of failures in canal slopes in cold regions [5,41]. The degradation in shear strength of slope soil is inevitable under FTCs, which further threatens the service life and performance of canals. The shear strength, as a key parameter for determining the slope stability, has drawn much attention from cold regional engineers [8]. Although many measures have been adopted, such as laying insulation boards [33], improving soil strength [42] and constructing retaining structures [43], slope damage still occurs. This study investigates the shear strength evolution of canal soil under FTCs, and a discrete element model is established and validated against experimental data. The distributions in microcracks, force chains and displacement during the shear process for the samples before and after FTCs are also revealed. The peak strength and cohesion of soil gradually decrease with FTCs. However, the internal friction angle shows a slight decreasing trend with the increase in the number of FTCs. The FTCs induce the evolution of microcracks in the soil. The number of tensile microcracks is larger than that of shear microcracks. After one FTC, the numbers of shear microcracks, tensile microcracks, and total cracks are 543, 934, and 1477, respectively. The number of cracks of the three categories increase to 1798, 6779, and 8577, respectively, after five FTCs. FTCs alter the distribution of contact force chains of the soil. The total number of contacts is 34,918 for the unfrozen–thawed sample. After five FTCs, the soil skeleton experiences cumulative damage. The displacement of soil particles becomes larger, and the development range of shear bands is broader under the same shear displacement.
The shear strength of the soil under FTCs is controlled by its microstructures. Thus, investigations into the variations in microcracks and force chains between particles can help us deeply understand canal slope failures. However, most existing studies have not comprehensively considered the changes in mechanical parameters and microcracks of soil under FTCs [44,45,46,47]. The shear bands within soil progressively develop as the number of FTCs rises. Freeze–thaw damage degrades cementation between soil particles, making internal particles prone to sliding and deforming under shear loads. When the number of FTCs is limited, external loads can be distributed and transferred through a large number of contacts between soil particles, thereby forming a relatively continuous force chain network. In spring, snowmelt infiltrates into cracks and creates a high-moisture layer within the slope, which triggers slope instability under self-weight. In this case, microcracks tend to form more easily within the soil. Therefore, when soil improvement measures are adopted to enhance slope stability, the selection of admixtures should not only consider the improvement of soil strength but also take into account that the incorporated admixtures can react with pore water to form binders and restrain the development of cracks.
This study also has limitations. Firstly, the degradation in shear strength of soil increases with the number of FTCs. However, the decrease in the early stage of the freeze–thaw process is more significant. Only five FTCs were performed in this study to characterize the evolution of shear parameters including peak strength, internal friction angle and cohesion. Further tests with more FTCs are required. Secondly, the slope failure is closely related to climatic conditions such as temperature and rainfall. The coupled effect of rainfall and freeze–thaw action is not considered. In addition, although the effects of particle interlocking and spatial force chains in the real three-dimensional sample are neglected, the two-dimensional model can adequately capture the key mechanical and damage characteristics of interest in this work. Meanwhile, this approach substantially reduces computational time, and thus, three-dimensional simulations were not performed. These issues will be investigated in our future work.
5. Conclusions
This paper combines direct shear tests and PFC discrete element simulations to reveal the shear degradation mechanism of canal slope soil in cold regions under FTCs. The main conclusions are summarized as follows:
- (1)
- The FTCs can cause a continuous decrease in the shear strength of soil. The cohesive force experiences significant degradation after the first freeze–thaw cycle. At five FTCs, the cohesive force drops to 28.99 kPa. The internal friction angle shows a decreasing trend with the increase in the number of FTCs.
- (2)
- The discrete element model established based on the parallel-bond model agrees well with the experimental results. When the number of FTCs ranges from 0 to 5, the maximum average deviation between the simulated peak strength and the experimental peak strength is only 2.27%, which indicates that the established model has high accuracy.
- (3)
- FTCs can trigger the development of microcracks in the soil. As the number of FTCs increases, the number of tensile cracks and shear cracks continues to rise. The contact force chains of the soil gradually break down, and the number of contacts exhibits a trend of decreasing first and then increasing. Soil subjected to FTCs exhibits significantly larger displacement and shear band ranges during the shear process compared to unfrozen–thawed soil.
Author Contributions
C.L.: Formal analysis, Writing—review & editing, Funding acquisition. P.L.: Methodology, Writing—review & editing. C.X.: Resources, Supervision, Writing—review & editing. A.S.: Resources, Writing—review & editing, Funding acquisition. H.J.: Funding acquisition, Writing—review & editing. M.W.: Resources, Validation. J.L.: Writing—review & editing. Q.T.: Writing—review & editing, Funding acquisition. X.Z.: Validation. S.S.: Writing—review & editing. All authors have read and agreed to the published version of the manuscript.
Funding
This work was supported by the Natural Science Foundation of Jiangsu Province (BK20250406), Shaanxi A&F Technology University Research Foundation (Grant No. ZK26-07, SJ2025-03, PT2024-001) and the Natural Science Foundation of Heilongjiang Province (ZD2023E007).
Data Availability Statement
The original contributions presented in this study are included in the article. Further inquiries can be directed to the corresponding authors.
Conflicts of Interest
Author Jie Liu was employed by the Northwest Engineering Corporation Limited. The remaining authors declare that the research was conducted in the absence of any commercial or financial relationships that could be construed as a potential conflict of interest.
References
- Chen, R.; Kang, E.; Wu, L.; Yang, J.; Ji, X.; Zhang, Z. Cold Regions in China. J. Glaciol. Geocryol. 2005, 4, 469–475. [Google Scholar]
- Wu, Q.; Tong, C. Hydraulic Engineering in Frozen Soil Regions. In Frozen Soil Engineering in Cold Regions; Springer: Singapore, 2026; pp. 505–574. [Google Scholar]
- Jiang, H.; Liu, C.; Wang, E.; Liu, X.; Ren, Z.; Han, H. Numerical Modelling of Thermal Stability for a Water Retaining Wall in Permafrost Regions. Therm. Sci. Eng. Prog. 2022, 36, 101494. [Google Scholar] [CrossRef] [Scilit]
- Wang, L.; Song, X. Engineering Geological Characteristics and Failures of Dispersive Clays in Northeast China. Bull. Eng. Geol. Environ. 2022, 81, 88. [Google Scholar] [CrossRef] [Scilit]
- Qiao, L.; Min, Y.; Sun, H.; Song, C.; Jiang, H.; Peng, Y.; Jin, W. Thermo-Hydro-Mechanical Evolution and Long-Term Stability of Canal Slopes Under Freeze–Thaw Cycles in Cold Regions. Water 2026, 18, 727. [Google Scholar] [CrossRef] [Scilit]
- Jiang, H.; Min, Y.; Niu, H.; Chen, Y.; Li, S.; Wang, E.; Fu, Q.; Liu, X.; Liu, C.; Niu, Y.; et al. Experimental Study on Microstructural and Mechanical Characteristics of Expansive Soil under Freeze–Thaw Actions. J. Mater. Civ. Eng. 2026, 38, 04026265. [Google Scholar] [CrossRef] [Scilit]
- Liu, Y.; Wang, Z.; Liu, X.; Wang, S. Review on the Impact of Freeze-Thaw Cycles on Mechanical Properties and Durability of Tunnel Lining Structures. KSCE J. Civ. Eng. 2026, 30, 100332. [Google Scholar] [CrossRef] [Scilit]
- Wang, E.; Zhou, T.; Jiang, H.; Liu, X.; Wu, C. Effects of Carbon Nanotubes Treatment on Engineering Properties of Sandy Fine-Grained Soils Subject to Freeze-Thaw Cycles. Res. Cold Arid Reg. 2025, 17, 383–392. [Google Scholar] [CrossRef] [Scilit]
- Sun, X.; Xu, S.; Tian, W.; Xu, L.; Yu, Q.; Li, X.; Wang, Q. Investigation of Water Migration in Expansive Soil under Unidirectional Freeze-Thaw Cycles. Cold Reg. Sci. Technol. 2026, 251, 105048. [Google Scholar] [CrossRef] [Scilit]
- Liu, Q.; Zhang, Z.; Xu, C.; Torgovkin, N.; Jin, D.; Zhang, S. Microscale Multifractal Characteristics of Fuping Loess in Seasonal Freeze–Thaw Environments: SEM Observations. J. Test. Eval. 2026, e20250508. [Google Scholar] [CrossRef] [Scilit]
- Zheng, S.-F.; Li, X.; Yang, Z.; Zhang, D.; Wang, M. A Novel Infrared Method for Segregation Frost Heaving Temperature Fields. Cold Reg. Sci. Technol. 2026, 247, 104887. [Google Scholar] [CrossRef] [Scilit]
- Zhang, M.; Wang, J.; Zang, Y.; Kong, X.; Tan, Y.; Feng, W. Effects of Dry–Wet and Freeze–Thaw Cycles on Loess Slopes Stabilized with Microbially Induced Calcite Precipitation. J. Cold Reg. Eng. 2026, 40, 04026052. [Google Scholar] [CrossRef] [Scilit]
- Gothberg, G.G. Effect of Snow Melt on Slope Stability. Bachelor’s Thesis, The University of Akron, Akron, OH, USA, 2026. [Google Scholar]
- Abdolvand, Y.; Sadeghiamirshahidi, M. Assessing Landslide Risk and Susceptibility in Michigan’s Upper Peninsula: A Case Study of the 2003 Rockland Incident. In Proceedings of the Geo-Congress 2026; American Society of Civil Engineers: Reston, VA, USA, 2026; pp. 60–69. [Google Scholar]
- Cedric, R.; Greg, S. Shear Strength-Temperature-Moisture Content Relationship of Warm Frozen Ground for Thaw Slump Stability Analysis. Cold Reg. Sci. Technol. 2026, 244, 104820. [Google Scholar] [CrossRef] [Scilit]
- Rahardjo, H.; Fredlund, D. Procedures for Slope Stability Analyses Involving Unsaturated Soils. In Developments in Deep Foundations and Ground Improvement Schemes; CRC Press: Boca Raton, FL, USA, 2026; pp. 33–56. [Google Scholar]
- Zhu, D.; Griffiths, D.; Fenton, G.A.; Huang, J.; Gao, Y. Reliability Analysis of Slopes under Slow Drawdown Conditions. Géotechnique 2026, 76, 835–841. [Google Scholar] [CrossRef] [Scilit]
- Jiang, H.; Han, H.; Liu, X.; Wang, E.; Fu, Q.; Luo, J. Effect of Repeated Freeze-Thaw Cycles on Mechanical Properties of Clay. Heliyon 2024, 10, e27261. [Google Scholar] [CrossRef] [Scilit]
- Zhang, W.; Ma, J.; Tang, L. Experimental Study on Shear Strength Characteristics of Sulfate Saline Soil in Ningxia Region under Long-Term Freeze-Thaw Cycles. Cold Reg. Sci. Technol. 2019, 160, 48–57. [Google Scholar] [CrossRef] [Scilit]
- Liu, X.; Wei, X.; Qin, H. Characterizing Compressive Strength of Compacted Saline Loess Subjected to Freeze–Thaw Cycling with Wave Velocity. Bull. Eng. Geol. Environ. 2022, 81, 168. [Google Scholar] [CrossRef] [Scilit]
- Han, Y.; Wang, Q.; Wang, N.; Wang, J.; Zhang, X.; Cheng, S.; Kong, Y. Effect of Freeze-Thaw Cycles on Shear Strength of Saline Soil. Cold Reg. Sci. Technol. 2018, 154, 42–53. [Google Scholar] [CrossRef] [Scilit]
- Tang, L.; Li, G.; Li, Z.; Jin, L.; Yang, G. Shear Properties and Pore Structure Characteristics of Soil–Rock Mixture under Freeze–Thaw Cycles. Bull. Eng. Geol. Environ. 2021, 80, 3233–3249, Correction in Bull. Eng. Geol. Environ. 2021, 80, 4195. [Google Scholar] [CrossRef] [Scilit]
- Liu, T.; Li, H.; Dong, L.; Cao, P. Mechanical Properties and Failure Mechanisms of Sandstone under Combined Action of Cyclic Loading and Freeze–Thaw. Appl. Sci. 2025, 15, 7942. [Google Scholar] [CrossRef] [Scilit]
- Gou, D.; Li, Y.; Hu, Y.; Zhou, Z.; Zhang, S.; Li, K.; Wang, K. Investigations on Mechanical Behaviors and Failure Mechanisms of Rock-Concrete Composite Specimens with Different Interface Inclinations Subjected to Freeze-Thaw Cycles and Uniaxial Compression. Eng. Fract. Mech. 2025, 322, 111196. [Google Scholar] [CrossRef] [Scilit]
- Feng, Q.; Xu, J.; Cai, C.; Liu, W.; Jin, J.; Han, W.; Qin, Z. Damage Constitutive Model and Meso-Failure Characteristics of Freeze–Thaw Rock under Triaxial Compression. Bull. Eng. Geol. Environ. 2024, 83, 112. [Google Scholar] [CrossRef] [Scilit]
- Li, T.; Tang, J.; Liu, W.; Sun, X.; Wang, H.; Lu, G. Research on Freeze–Thaw Cycle Rock Damage Combining Multiscale Simulation and Test Validation. Int. J. Geomech. 2025, 25, 04025198. [Google Scholar] [CrossRef] [Scilit]
- Qin, Y.; He, J.; Bai, Y.; Teng, H. Study on the Mechanism of Freeze–Thaw Cycling Effects on Soil Aggregate Stability and Pore Structure Evolution. Appl. Sci. 2026, 16, 2589. [Google Scholar] [CrossRef] [Scilit]
- Zhao, R.; Chang, H.; Yu, J.; Huang, D.; Yang, D.; Yang, H.; Zhou, L. The Influence of Freeze-Thaw Action and Particle Size Characteristics on the Shear Resistance of Black Soil. Sci. Rep. 2026, 16, 6176. [Google Scholar] [CrossRef] [Scilit]
- Chen, W.; Shi, C.; Yang, Q.; Fan, W.; Xu, H.; Yu, H. Experimental Study on Mechanical Properties of Hydrophobic Soil under Freeze-Thaw Cycles. Cold Reg. Sci. Technol. 2026, 248, 104913. [Google Scholar] [CrossRef] [Scilit]
- Li, B.; Zhu, Z.; Jia, W.; Cheng, Z.; Li, T. Impact Dynamic Mechanical Properties of Frozen-Soils with Different Moisture Contents Following Varying Numbers of Freeze-Thaw Cycle. Int. J. Damage Mech. 2026, 35, 201–223. [Google Scholar] [CrossRef] [Scilit]
- GB/T 50123-2019; Standard for Geotechnical Testing Method. Ministry of Housing and Urban Rural Development of the People’s Republic of China: Beijing, China, 2019.
- GB/T 50145-2007; The Engineering Classification Standards for Soil. Ministry of Housing and Urban Rural Development of the People’s Republic of China: Beijing, China, 2007.
- Jiang, H.; Liu, X.; Chen, Y.; Wang, E.; Fu, Q.; He, J.; Zhong, H. Model Test Investigation on Heat and Deformation Behaviors of Canal Slopes with Protective Layers Caused by Freeze-Thaw Action. Cold Reg. Sci. Technol. 2024, 228, 104338. [Google Scholar] [CrossRef] [Scilit]
- Sun, J.; Li, S.; Zhang, H.; Li, S.; Zou, B. Experimental Study on the Static and Dynamic Characteristics of Straw-Lime Reinforced Saline Soil under Freeze–Thaw Cycles. Sci. Rep. 2026, 16, 36928. [Google Scholar] [CrossRef] [Scilit]
- Zhou, Z.; Ding, H.; Gao, W.; Xu, L. Study on Mechanical Properties of Soil-Rock Mixture of Various Compactness Subjected to Freeze-Thaw Cycles. Sci. Cold Arid Reg. 2021, 13, 450–462. [Google Scholar]
- Sun, W.; Li, Y.; Wang, B.; Zhu, H.; Cui, H.; Liang, Q.; Li, N.; Shi, S. Study on Uniaxial Compression Mechanical Properties and Mesoscopic Damage Mechanism of Granite under Freeze-Thaw Cycles. Cold Reg. Sci. Technol. 2026, 253, 105158. [Google Scholar] [CrossRef] [Scilit]
- Liu, Q.-S.; Wang, Z.-W. Review of Numerical Modeling Based on Digital Image Processing for Rock Mechanics Applications. Chin. J. Rock Mech. Eng. 2020, 39, 3286. [Google Scholar]
- Potyondy, D.O.; Cundall, P.A. A Bonded-Particle Model for Rock. Int. J. Rock Mech. Min. Sci. 2004, 41, 1329–1364. [Google Scholar] [CrossRef] [Scilit]
- Liu, J.; Li, M.; Jiang, Y.; Cheng, J.; He, J.; Song, H.; Zheng, H. Microscopic Damage Evolution of Moraine Soils under Freeze-Thaw Cycles Based on PFC 2D Simulation. Earth Sci. 2025, 50, 4137–4154. [Google Scholar]
- Tang, L.; Li, Y.; Yu, Y.; Jin, L.; Gao, Z.; Jia, H.; Sun, Q.; Liu, C. Study on Strength Deterioration, Pore Structure Evolution and Particle Migration of Interface between Soil-Rock Mixture and Concrete under Freeze-Thaw Action. J. Glaciol. Geocryol. 2023, 45, 1047–1062. [Google Scholar]
- Jiang, H.; Niu, F.; Ma, Q.; Su, W.; Wang, E.; He, J. Numerical Analysis of Heat Transfer between Air inside and Outside the Tunnel Caused by Piston Action. Int. J. Therm. Sci. 2021, 170, 107164. [Google Scholar] [CrossRef] [Scilit]
- Han, J.; Jiang, Y. Use of Geosynthetics for Performance Enhancement of Earth Structures in Cold Regions. Sci. Cold Arid Reg. 2013, 5, 517–529. [Google Scholar] [CrossRef] [Scilit]
- Salgado, R. The Engineering of Foundations, Slopes and Retaining Structures; CRC Press: Boca Raton, FL, USA, 2022. [Google Scholar]
- Chang, D.; Liu, J. Review of the Influence of Freeze-Thaw Cycles on the Physical and Mechanical Properties of Soil. Sci. Cold Arid Reg. 2013, 5, 457–460. [Google Scholar] [CrossRef] [Scilit]
- Chen, L.; Li, K.; Song, G.; Zhang, D.; Liu, C. Effect of Freeze–Thaw Cycle on Physical and Mechanical Properties and Damage Characteristics of Sandstone. Sci. Rep. 2021, 11, 12315. [Google Scholar] [CrossRef] [Scilit]
- Tang, L.; Cong, S.; Geng, L.; Ling, X.; Gan, F. The Effect of Freeze-Thaw Cycling on the Mechanical Properties of Expansive Soils. Cold Reg. Sci. Technol. 2018, 145, 197–207. [Google Scholar] [CrossRef] [Scilit]
- Qiu, E.; He, Q.; Chen, Q.; Sun, X.; Zhang, R.; Qu, M.; Wan, X. Influence of Freeze–Thaw Cycles on Mechanical Properties of Moraine Soils. Transp. Geotech. 2023, 42, 101097. [Google Scholar] [CrossRef] [Scilit]

Disclaimer/Publisher’s Note: The statements, opinions and data contained in all publications are solely those of the individual author(s) and contributor(s) and not of MDPI and/or the editor(s). MDPI and/or the editor(s) disclaim responsibility for any injury to people or property resulting from any ideas, methods, instructions or products referred to in the content. |
© 2026 by the authors. Licensee MDPI, Basel, Switzerland. This article is an open access article distributed under the terms and conditions of the Creative Commons Attribution (CC BY) license.