


Abstract
Urban flood risk is increasingly exacerbated by climate change and rapid urbanization, rendering many existing urban stormwater drainage systems (USDSs) inadequate for effective flood mitigation. Given the long service life, rehabilitated USDS must accommodate multiple and evolving demands throughout the lifecycle. However, most existing optimization and sustainability assessment approaches primarily focus on hydraulic performance under future rainfalls, while overlooking broader engineering feasibility, operational constraints, and implementation-related demands. This study proposes an integrated optimization–evaluation–decision framework for USDS rehabilitation that accounts for multiple practical demands. An improved bi-objective optimization approach is first developed by incorporating topological diameter constraints and an enhanced polynomial mutation operator, which improves engineering feasibility and the coverage of rehabilitation solutions. On this basis, several rehabilitation demand quantization methods are proposed to measure performance and to characterize preference patterns across the solution set, considering economic efficiency, drainage capacity uniformity, constructability, etc. To support decision-making under competing demands, a Nash bargaining-based approach is introduced to coordinate trade-offs and identify a final implementable compromise scheme. Results demonstrate that the improved optimization approach enhanced solution quality by 15.4%, and captured a global optimal solution across multi-demands. Comparative analyses reveal that considering only single objectives or limited demands fails to reflect rehabilitation scheme performance over a lifecycle scale. Within the Nash bargaining framework, drainage capacity uniformity emerges as a key integrative indicator. The solution with the highest drainage capacity uniformity achieves the largest Nash product (8.37 × 10⁻²) and is therefore selected as the final rehabilitation scheme. The proposed framework enables the identification of engineering-feasible rehabilitation schemes under multi-demand conditions, offering decision support for USDS upgrading in complex urban environments.
1. Introduction
With the intensification of global climate change and urbanization, the frequency of extreme rainfall events has increased markedly, rendering urban flooding a critical public safety concern. Improving urban stormwater drainage capacity and resilience has thus emerged as a top priority in flood risk management and urban planning. The urban stormwater drainage system (USDS) serves as the backbone of urban drainage infrastructure, responsible for stormwater collection, conveyance, and temporary storage. However, the growing incidence of pluvial flooding has exposed the limitations of existing USDSs. Many systems suffer from low design standards [1], sediment accumulation [2], and structural failure [3], resulting in insufficient capacity to cope with extreme precipitation. Consequently, the rehabilitation of existing USDSs, including the replacement of aging pipes, is essential for strengthening urban flood resilience.
In practice, USDS rehabilitation is often limited by funding and construction constraints, making full-scale system reconstruction difficult. Thus, a central challenge in contemporary USDS rehabilitation is identifying and upgrading critical pipes under budget constraints to maximize flood mitigation benefits. Flood control performance is typically quantified using total flood volume (TFV) or its reduction [4,5], resilience indices [6,7], average flood duration [8], and flood damage costs [9,10]. TFV is the most widely used metric due to its intuitiveness and practical applicability [11,12,13].
Economic evaluation of rehabilitation projects primarily relies on short-term capital costs and life cycle costs (LCC). While capital cost considers only construction-phase expenditures [14], LCC accounts for construction capital, operations, and maintenance (O&M) costs. Since USDSs are long-lived infrastructures requiring ongoing inspection and renewal, O&M costs constitute an increasing share of total project costs during the whole life cycle. Hence, LCC offers a more accurate depiction of long-term economic implications and offers better-informed guidance for early-stage infrastructure decisions [15].
A trade-off exists between flood mitigation and cost, forming USDS rehabilitation as a multi-objective optimization (MOO) problem. The decision space for rehabilitation design is complex, constrained by ranges as well as structural and hydraulic interactions among variables [16]. Multi-Objective Evolutionary Algorithms (MOEAs) are widely applied in USDS design and rehabilitation, effectively exploring complex solution spaces and generating Pareto-optimal solutions. For instance, Lin et al. [17] applied the Borg evolutionary algorithm with an engineering-informed reduced search space for efficient USDS design. Ngamalieu-Nengoue et al. [18,19] used NSGA-II, optimizing both cost and flood damage via new storage tanks and pipe replacement in the rehabilitation process. Wu et al. [20] embedded USDS structural constraints within a tree-based data structure, proposing a more efficient method for USDS design. Seyedashraf [21] employed the Borg algorithm to generate an initial Pareto front for USDS optimization, using flood-related indicators such as TFV, flood duration, and flood damage, together with cost, as optimization objectives. To address the relatively sparse Pareto solution set, interpolation techniques and a Multi-Layer Perceptron (MLP) were further integrated to enrich the solution set, thereby supporting subsequent decision-making. To support phased adaptation to climate change, Creaco et al. [22] used a bi-objective genetic algorithm to optimize phased LID implementation, generating Pareto trade-off solutions between total installation and maintenance costs and the maximum flood volume across implementation phases.
Most current studies focus on the efficiency of rehabilitation scheme generation and on comparing the performance of schemes under different objectives with respect to flood mitigation and ecological effectiveness. However, systematic research addressing how final implementable schemes are selected and coordinated under multiple lifecycle demands remains limited [23]. In practice, USDS rehabilitation is not merely an optimization problem of flood control, but a complex decision-making process constrained by economic, climatic, hydraulic, and socio-technical factors.
Throughout their long service life, USDSs must satisfy diverse and evolving service requirements. These include short-term functional demands, such as drainage safety and flood control, as well as long-term considerations, including cost-effectiveness, social benefits, constructability, maintainability, and adaptability to future climate uncertainties. These multidimensional and sometimes conflicting requirements fundamentally shape rehabilitation decisions. Nevertheless, existing sustainability-oriented assessments primarily focus on green infrastructure and often regard future rainfall as the principal lifecycle consideration, thereby failing to adequately address the broader lifecycle demands involved in grey infrastructure rehabilitation. For instance, Zhang et al. [7] assessed the long-term service levels of optimized integrated grey-green infrastructure (IGGI) layouts under three future shared socio-economic pathways (SSPs), confirming the effectiveness of the proposed environmental sustainability indicator. Liu et al. [24] incorporated both reconstruction needs and multi-stage climate adaptability into IGGI optimization, and demonstrated that phased implementation strategies offer enhanced resilience to future extreme rainfall scenarios. Although these studies advance climate-responsive design, they predominantly treat future rainfall as the principal long-term driver, thereby overlooking other critical decision constraints. As long-serving underground infrastructure, USDS rehabilitation decisions are often irreversible once implemented, making comprehensive demand coordination essential for risk-informed decision-making.
Financial constraints are among the most critical challenges in sustainable urban flood management [25,26]. USDS rehabilitation requires substantial capital investment and is characterized by long payback periods. Consequently, short-term investment decisions can have persistent effects on flood resilience and economic burden [27,28]. With limited fiscal capacity, overinvestment may lead to resource inefficiencies, while underinvestment can undermine flood mitigation performance and environmental benefits. Introducing cost–benefit analysis helps evaluate the efficiency of fund utilization among rehabilitation schemes, enabling maximum performance gains achieved with minimal additional investment [29,30].
Beyond financial considerations, long-term reliability under climate uncertainty has emerged as a pivotal constraint. The shifting climate landscape has intensified extreme rainfall events—characterized by increased frequency, intensity, and duration—thereby rendering traditional design specifications inadequate and exacerbating urban flooding vulnerabilities [31,32,33,34]. Research incorporating future climate scenarios has largely addressed the optimization of green infrastructure [24,35], with comparatively limited consideration of grey infrastructure like USDSs. Given the long service life and limited post-construction flexibility of USDSs, rehabilitation decisions should move beyond reliance on historical climate and explicitly consider rainfall uncertainty to strengthen long-term climate adaptability [36].
In addition to external climatic uncertainties, the internal hydraulic configuration of USDS is also a crucial determinant of its overall drainage efficiency [37]. Over long-term operational periods, the emergence of hydraulic bottlenecks—stemming from the localized overloading of specific pipes—often induces a disproportionate spatial distribution of drainage capacity. Such imbalances result in flow restrictions and the wastage of potential detention space [38], ultimately triggering overflow and exacerbating long-term O&M challenges. Rehabilitation schemes should prioritize the identification and mitigation of bottlenecks. This is vital for ensuring equitable hydraulic loading and system robustness during extreme events.
Construction organization and social acceptance constraints further complicate rehabilitation decisions. As a typical public interest civil engineering project, USDS rehabilitation involves extensive excavation, heavy equipment operations, and temporary material stockpiling. If the spatial footprint is overly fragmented, the construction activities can disrupt residents’ daily lives. On one hand, such dispersion exacerbates traffic congestion and leads to noise and air pollution [39]. On the other hand, the presence of dense, parallel municipal pipelines may lead to interference, increasing public safety risks during excavation [40,41]. Therefore, managing the spatial concentration of construction activities helps mitigate social disruption and strike a viable balance between infrastructure renewal and residential life.
In summary, USDS rehabilitation constitutes a multifaceted risk management challenge that extends beyond conventional cost–flood trade-offs. Effective rehabilitation requires systematic coordination of investment efficiency, climate adaptability, hydraulic balance, and socio-technical feasibility. However, existing studies rarely provide an integrated decision-support framework capable of simultaneously addressing the above competing lifecycle demands and identifying implementable equilibrium solutions.
In light of these considerations, this study develops a full-process framework that bridges optimization with decision-making. The NSGA-II algorithm is employed to optimize the pipe diameters of the USDS with respect to TFV and LCC as the objectives. During the mutation stage of the optimization process, an improved hydraulic gradient-based mutation operator is proposed to prioritize critical overloaded pipes for rehabilitation, thereby maximizing system-wide improvements. Furthermore, several indicators are presented to quantify divergent economic, environmental, and managerial demands. Finally, Nash bargaining is utilized to resolve demand conflicts among stakeholders, thereby identifying an equilibrium scheme. By linking the cost–flood trade-off with demand coordination, this framework identifies both preference-specific optimal schemes and an optimal scheme that reconciles multiple demands.
2. Methods
The methodology of this study is illustrated in Figure 1. First, a hydraulic model of the study area is established to simulate the drainage and flooding processes of the USDS (Section 2.1 and Section 2.2). Based on the calibrated hydraulic model, a multi-objective optimization problem is then formulated to address the fundamental demands of USDS rehabilitation, namely flood mitigation and cost control (Section 2.3). The optimization framework is built upon the standard NSGA-II algorithm (ST), which serves as the baseline evolutionary solver. To ensure engineering and decision feasibility, a diameter constraint (DC) and an improved polynomial mutation (PLM) Operator are incorporated into the standard NSGA-II in Section 2.4. Specifically, building upon DC, the improved polynomial mutation operator (IO) is further developed to dynamically regulate mutation behavior based on hydraulic gradients. Both DC and IO are implemented under upstream adjustment (UA) and downstream adjustment (DA) strategies. The resulting schemes from these different approaches are then merged and subjected to re-non-dominated sorting to enhance the diversity, yielding a merged Pareto set (MP). Finally, to account for supplementary multi-dimensional demands during the rehabilitation decision-making, a Nash bargaining approach is employed to resolve objective conflicts and identify the optimal equilibrium solution (Section 2.5).
Figure 1.
The flowchart of the proposed methodology. Abbreviations: non-dominated sorting genetic algorithm II (NSGA-II); standard approach (ST); diameter-constrained approach (DC); improved polynomial mutation operator (IO); polynomial mutation (PLM); upstream adjustment (UA); downstream adjustment (DA); merged Pareto set (MP); Nash bargaining (NB). Compound labels represent combinations of the optimization approaches and adjustment strategies; for example, IO-UA denotes the improved-operator approach combined with upstream adjustment.
2.1. Study Area
The study area is situated in the Xiguan community of Beiyuan subdistrict, Tongzhou district, Beijing, China. Located within the core area of the Beijing municipal administrative center, the area is relatively low-lying and was developed at an early stage, resulting in high population density and extensive surface imperviousness. The mean annual precipitation in Tongzhou District is 735 mm. Due to outdated construction patterns and design standards, the existing drainage network has a drainage capacity corresponding to an approximately 3-year return period, falling short of the 10-year design return period required for this area under the Standard for Design of Outdoor Wastewater Engineering (GB 50014–2021) [42] and limiting its ability to accommodate more intense rainfall events. Pluvial flooding frequently occurs during the rainy season. Furthermore, the demographic composition is diverse, with a relatively large proportion of vulnerable groups, including elderly residents and children, which exacerbates safety risks during flooding events [43]. The spatial location, Digital Elevation Model (DEM) with a spatial resolution of 12.5 m, and land-use distribution of the study area are illustrated in Figure 2. Spanning approximately 136 ha, the area primarily consists of three land-use categories: buildings, paved surfaces, and grasslands. With its typical land use, development history, and drainage deficiencies, this study area serves as a representative case for USDS rehabilitation in similar communities.
Figure 2.
Location of the study area. (a) Regional location; (b) DEM and administrative divisions of Beijing; (c) detailed view of the USDS and land use.
2.2. Hydraulic Model
Flooding in the study area was simulated using the Storm Water Management Model (SWMM) developed by the US Environmental Protection Agency [44]. The basic data required for model development, including drainage network structure, topography, land use and monitoring data, were sourced from local management authorities in Tongzhou district.
According to the topography and spatial layout of the USDS, the area was subdivided into 203 sub-catchments by the Thiessen polygon method. The infiltration process was simulated using the Horton model, and flow routing within pipes was modeled by the dynamic wave method. The USDS spans a total length of 4.8 km and consists of 203 pipes, 203 manholes, and one outfall. Pipe diameters in the existing network range from 200 to 2600 mm, with a modal diameter of 1400 mm and a median diameter of 1200 mm. All pipes in the existing network have positive slopes, with pipe invert elevations decreasing along the drainage direction from upstream to downstream. Pipe slopes range from 4.23 × 10⁻⁶ to 0.565, with a standard deviation of 0.0518. The system has no pump stations or storage facilities. Details of the model configuration are shown in Figure 3a.
Figure 3.
USDS model and calibration and validation results: (a) USDS model; (b) rainfall on 29 July 2025 for calibration; (c) rainfall on 27 August 2025 for validation; (d) rainfall on 14 June 2025 for calibration.
One water-level monitoring device is installed within the study area. Monitoring observations from three rainfall events occurring on 14 June, 29 July, and 27 August 2025 were used for model calibration and validation [45,46]. The antecedent dry periods for these three events were 8, 7, and 9 days, respectively. Observed and simulated flows at the monitor (Figure 3a) are compared in Figure 3b–d; the calibrated hydraulic model parameters are summarized in Table 1. The Nash–Sutcliffe efficiency (NSE) (Equation (1)) values for the three events were 0.88, 0.86, and 0.82, and the corresponding mean square error (MSE) values were 0.03, 0.20, and 0.06, respectively. These results indicate good model performance and reliable representation of drainage behavior under different rainfall scenarios.
where and are the observed and simulated flow rates at time step t (m3 s−1), respectively; is the mean observed flow rate over the entire monitoring period (m3 s−1); and N is the total number of observations. An NSE value of 1 indicates perfect agreement between the observed and simulated results, whereas an NSE value of 0 indicates that the model predictions are as accurate as the mean of the observations. A negative NSE value indicates that the mean observed value provides a better prediction than the model.
Table 1.
Runoff generation and routing parameters of the hydraulic model.
2.3. Optimization Model
2.3.1. Problem Formulation
Consider the problem of designing a rehabilitation scheme for a USDS with n pipes and w manholes. Under the assumption that the existing spatial structure of the system remains unchanged, the drainage performance of the USDS is improved by adjusting the pipe diameters Di(i = 1,2,3,⋯,n). Accordingly, TFV (Equation (2)) and the Life Cycle Cost (LCC) of the rehabilitation project (Equation (3)) are defined as the objective functions for the multi-objective optimization model [47,48]. The basic constraints of the problem are defined in Equation (4), where pipe diameters are restricted to a discrete set of commercially available standard sizes A.
where Vj is the total overflow volume of the j-th manhole over the entire simulation period (m3); Qj,t represents the overflow rate at the j-th manhole at time step t (m3 s−1). The total simulation duration is set to 3 h, with simulation time step Δt set to 5 min and the total number of simulation time steps T taken as 36. The set A includes commercially available pipe diameters, ranging from 200 to 3500 mm, specifically 200, 250, 300, 350, 400, 450, 500, 600, 700, 800, 900, 1000, 1100, 1200, 1350, 1400, 1500, 1600, 1650, 1800, 2000, 2200, 2400, 2600, 2800, 3000, 3200 and 3500 mm.
subject to: Di ∈ A
LCC comprises the capital cost of pipe replacement (Capitalpipes) and the present value (PV) of operation and maintenance (O&M) costs (). The Capital cost is given in Equation (5), where Equation (6) restricts capital costs to replaced pipes, and Equation (7) defines the cost per unit length of drainage pipes. Equation (7) follows Liu et al. [49] and is derived by fitting the base cost indices for different pipe diameters from the Municipal Engineering Investment Estimation Index [50], the current national standard in China. Following Houle et al. [51], O&Mpipes is assumed to be 10% of Capitalpipes. This assumption has also been adopted for grey drainage infrastructure in recent studies conducted in China, including Wang et al. [52] and Liu et al. [53]. The present value of O&M costs is defined in Equation (8), with a discount rate of 2% [54] and a service life of 30 years [55,56].
where Li is the length of the i-th pipe (m); Di0 is the diameter of the i-th pipe before rehabilitation (mm); P(Di) is the capital cost per unit length of a drainage pipe with diameter Di(CNY m−1); t is the assumed service life (years); and b is the discount rate (%).
A 3-h synthetic rainfall with a 10-year return period is adopted as the optimization scenario [17,57]. This return period complies with the requirements for flood-prone areas in megacities and for upgrading drainage facilities specified in the Chinese Standard for design of outdoor wastewater engineering [42]. It effectively represents USDS performance under medium-to-high intensity rainfall conditions. Moreover, the 10-year return period lies at the interface between urban municipal drainage and regional flood control systems in China. This return period facilitates transactions across multi-level drainage–waterlogging–flood defense systems and avoids systemic decoupling [58,59,60]. The synthetic rainfall input is parameterized following the standard of rainstorm runoff calculation for urban storm drainage system planning and design [61], with the intensity–duration–frequency relationship and hyetograph shown in Equation (9) and Figure 4, respectively.
where P is the return period (year); t is the rainfall duration (min); and I is the rainfall intensity (mm min−1).
Figure 4.
Synthetic rainfall hyetograph with a 3 h duration.
2.3.2. Rehabilitation Scheme Optimization Based on NSGA-II
The formulated optimization problem above is a complex integer nonlinear programming problem that is hard to solve analytically. In practice, multi-objective heuristic and evolutionary algorithms have demonstrated strong capability in addressing such problems [23], including multi-objective particle swarm optimization (MOPSO) [62], multi-objective ant colony optimization (MOACO) [63], multi-objective simulated annealing (MOSA) [64], and the Non-dominated Sorting Genetic Algorithm II and III (NSGA-II and NSGA-III) [65,66]. Among these methods, NSGA-II has shown robust performance and has been widely applied to bi-objective optimization problems in urban drainage systems [36,67]. Given its proven effectiveness and suitability for the bi-objective structure considered here, NSGA-II is adopted to solve the proposed optimization problem. NSGA-II encompasses several key stages: population initialization, non-dominated sorting, crowding distance calculation, crossover, and mutation. The procedure for standard (ST) NSGA-II is shown by the black lines in Figure 5.
Figure 5.
Flowchart of NSGA-II.
Each rehabilitation scheme is regarded as an individual, with pipe diameters as decision variables. As pipe diameters are selected from a discrete set of commercial sizes, individuals are encoded using real–integer encoding. Correspondingly, simulated binary crossover (SBX) [68] and polynomial mutation (PLM) [69] are employed as the crossover and mutation operators, respectively. A population Ω = {D1,⋯,DK} with K rehabilitation schemes is considered, where and is the diameter of i-th pipe in scheme k. Under specific crossover probability, two parent schemes and are selected from Ω for SBX, as defined by the following equations:
where and are the post-crossover diameters of the i-th pipe in rehabilitation schemes D1 and D2, respectively; r is a random number uniformly distributed in the interval (0, 1); and is the spread factor with the distribution index set to 2 [70].
Similarly, the traditional PLM is applied to the offspring generated by crossover according to the specified mutation probability, following the equation:
where and are the upper and lower bounds of the diameter of pipe i, respectively, satisfying . is the diameter of pipe i in scheme D1 after mutation, and δq is the perturbation factor with the distribution index set to 20 [71].
Key NSGA-II parameters were determined through trial experiments, with population size, number of generations, crossover probability (pc), and mutation probability (pm) set to 100, 50, 0.9, and 0.5, respectively. The monotonic positive metric hypervolume (HV) [72,73] was employed to evaluate the convergence behavior under adopted parameter settings and to assess the quality of Pareto solutions. As shown in Figure S1, the HV value stabilizes after approximately 40 generations, beyond which no noticeable improvement is observed. Meanwhile, all solutions in the population converge to the Pareto front. These observations demonstrate that the algorithm achieves satisfactory convergence and maintains adequate solution diversity under the adopted parameter settings.
2.4. Decision Space Expansion for Fundamental USDS Rehabilitation Demands
2.4.1. Diameter Constraint to Meet Extreme Demand
Flood mitigation and cost represent the fundamental demands in USDS rehabilitation and decision-making. Due to constraints such as budget deficits or high concentrations of population and assets, some stakeholders may exhibit extreme preferences, either prioritizing cost minimization or seeking complete elimination of flooding. For large-scale rehabilitation problems, traditional optimization algorithms often produce poorly distributed Pareto fronts, which fail to meet these two types of extreme demands [12,74].
The current Chinese national standard, Standard for design of outdoor wastewater engineering [42], stipulates a non-decreasing diameter requirement along the flow direction. As shown in Equation (12), the diameter of the downstream pipe Di must meet or exceed the maximum diameter of its upstream set Β(Di). Violating this principle often results in downstream flow constriction, triggering backwater effects and overloading. From an optimization perspective, enforcing this constraint significantly enhances the effectiveness of rehabilitation schemes. By ensuring unimpeded flow conveyance, the system can achieve higher flood reduction volumes per unit of expenditure. Thus, integrating the diameter constraint is a dual-purpose strategy that concurrently serves the objectives of full flood elimination and stringent cost control.
Di ≥ Max{B(Di)}
Pipe diameter constraints are complex, and directly treating them as optimization constraints can hinder the identification of feasible solutions. In NSGA-II, crossover and mutation operators introduce random perturbations to maintain diversity, but do not consider diameter constraints. Consequently, upstream–downstream diameter relationships may be violated, increasing the number of infeasible solutions.
To address this, pipe diameters are checked and corrected after mutation. When upstream or downstream pipes of a manhole violate the constraint, one of two correction methods is applied: (1) upstream adjustment (UA), which randomly reduces upstream diameters to not exceed the downstream minimum; (2) downstream adjustment (DA), which randomly enlarges downstream diameters to be no smaller than the upstream maximum. The correction procedure is shown in Figure 6. The topological sorting (TopoSort) procedure is implemented following Kahn [75].
Figure 6.
Flowchart of the pipe diameter correction.
The upstream–downstream diameter-constrained (DC) optimization approach follows the standard NSGA-II workflow, with diameter checks introduced at critical steps, as indicated by the green dashed lines in Figure 5.
2.4.2. Improved PLM Considering Hydraulic Gradient
Section 2.4.1 proposes an optimization approach that satisfies the two fundamental demands of cost control and complete flood mitigation by incorporating DC. However, structural compliance does not always guarantee hydraulic adequacy. When a large number of upstream pipes contribute flow, compliance with upstream–downstream diameter constraints alone may be insufficient. In such cases, the overall pipe diameters of the USDS may remain too small; some pipes may operate under full load status but still fail to discharge runoff efficiently. This leads to upstream head accumulation, and the hydraulic gradient diverges from the geometric pipe slope, leading to pipe overload. These overloaded pipes restrict downstream conveyance and can still trigger overflows. Therefore, pipes in overload status should be prioritized for rehabilitation. Improving these critical links can enhance the overall drainage capacity of the USDS. The various operational statuses of the pipes are summarized in Table S1.
Figure 7 illustrates a pipe operating under overload status. For this pipe, the horizontal distance between the two adjacent manholes is m, and the elevation difference from upstream to downstream is Δs. The pipe slope angle is θ, where tanθ = Δs/m. Δh denotes the maximum water level difference between the upstream and downstream manholes observed during the simulation. The corresponding hydraulic gradient angle is θhyd, where tanθhyd = Δh/m. The difference between the hydraulic gradient angle and the pipe slope angle is defined as Δθ, expressed as Δθ = θhyd − θ, with Δθ ≥ 0. Normally, the hydraulic gradient is equal to the pipe slope, and Δθ equals zero. When the drainage capacity of the pipe is insufficient to discharge upstream inflow, the water level in the upstream manhole rises and θhyd increases. Therefore, Δθ is used to characterize the drainage capacity deficiency of a pipe. Based on this concept, the PLM operator is improved so that a higher mutation probability is assigned to pipes experiencing overload. Specifically, the original mutation probability pm is increased to (1 + tanΔθ)pm. The procedure of the improved PLM operator is shown in Figure 8. After applying the improved PLM operator, pipe diameters may undergo significant changes. So, the DC check and correction step is applied after the improved PLM operation to ensure operational feasibility. Similarly, the optimization approach using the improved PLM operator (Improved Operator, IO) is developed based on the standard NSGA-II (ST) framework. The improved PLM operator is introduced after the crossover step. The overall procedure is illustrated by the blue dotted line in Figure 5.
Figure 7.
Schematic of a drainage pipe.
Figure 8.
Flowchart of the improved PLM operator considering hydraulic gradient.
2.5. Rehabilitation Decision-Making Under Multi-Demand
By introducing additional constraints and improved operators, Section 2.4 addresses two fundamental demands: comprehensive flood mitigation and cost control. These enhancements expand the number of feasible rehabilitation schemes available for selection. However, USDS rehabilitation typically involves coordination among multiple stakeholders, including drainage authorities, urban planners, and financial decision-makers, etc. The objectives and priorities of these stakeholders often differ and even conflict. This section further considers additional demands that may arise during the rehabilitation decision-making. A multi-demand selection framework is proposed to identify an equilibrium solution that satisfies diverse stakeholder needs.
2.5.1. Marginal Cost
As USDS rehabilitation is primarily a public welfare endeavor funded by municipal budgets, economic efficiency plays a central role in comparing alternative rehabilitation schemes. Rational choice theory suggests that a decision is economically preferable when the marginal benefit per unit cost is maximized [76]. For the USDS rehabilitation problem, marginal cost (MC) is defined as the cost increase per unit TFV reduction. Lower MC values indicate superior cost-effectiveness, as less investment is required to achieve equivalent flood mitigation [29,77]. Accordingly, selecting schemes with lower MC ensures more efficient use of limited fiscal resources. In this study, MC is incorporated as a preference indicator to screen cost-effective optimal solutions. The MC for the k-th scheme is calculated as follows:
where TFV0 is the total flood volume before rehabilitation, with a value of 9.86 × 10³ m3; TFVk and LCCk represent the total flood volume and the Life Cycle Cost of the k-th rehabilitation scheme, respectively.
2.5.2. Future Climate Uncertainty
Given the decadal lifespan of urban drainage infrastructure, USDS rehabilitation must ensure long-term functionality under non-stationary future climates. This study evaluates the capacity of the rehabilitated system to mitigate flood volumes under projected extreme rainfall events.
The Coupled Model Intercomparison Project Phase 6 (CMIP6) adopts a matrix framework that combines Shared Socioeconomic Pathways (SSPs) and Representative Concentration Pathways (RCPs). This framework provides a basis for projecting future precipitation conditions. In this study, the SSP5–8.5 scenario is selected as an adverse climate scenario to evaluate the performance of the rehabilitated USDS against future rainfall uncertainty.
Consistent with the study area in central Beijing described by Zou et al. [78], the SSP5–8.5 rainfall projections derived therein are adopted as the rainfall input for this study. The temporal distribution of rainfall is characterized by the Beijing design storm pattern [61]. All rehabilitation schemes are simulated under the future climate scenario, and the scheme with the minimum total flood volume is identified to meet climate change adaptation demands. The rainfall intensity–duration–frequency relationship for the SSP5–8.5 scenario is given in Equation (14), and the corresponding rainfall hyetograph is shown in Figure 4. Under the SSP5-8.5 scenario, the design rainfall corresponds to a return period of 10 years, consistent with that adopted in the optimization.
The symbols in the above equation are defined identically to those in Equation (9).
2.5.3. Uniformity of Drainage Capacity
After rehabilitation, the USDS necessitates continuous inspection and maintenance, especially during the rainy season, to assess potential risks and detect overflow events. The relative water depth (RWD) of a pipe reflects the remaining drainage capacity of a pipe. A uniform distribution of RWD suggests the efficient use of USDS’s decentralized storage capacity, thereby mitigating localized overload and reducing the probability of surface flooding. The standard deviation σ is adopted to quantify the uniformity of pipe filling. A smaller σ indicates a more uniform distribution of drainage capacity. The corresponding formula is presented in Equations (15) and (16).
where hi is the maximum water depth in the i-th pipe (m); hi/Di is the RWD of the i-th pipe; and is the average RWD of all pipes in the USDS.
2.5.4. Spatial Concentration of Construction
In rehabilitation projects, on-site contractors generally prefer concentrated construction sites. In densely populated or high-traffic areas, dispersed construction increases management challenges and may disrupt local residents. To evaluate the spatial concentration of each rehabilitation scheme, an index γ (Equation (17)), is introduced. This metric is defined as the sum of Euclidean distances from each rehabilitated pipe to the scheme’s geometric center (Equations (18) and (19)). A higher γ value indicates more dispersed pipe distributions. Rehabilitation schemes with lower γ are preferred to improve construction efficiency and minimize social impacts.
where is the midpoint coordinate of pipe Di; Pcenter is the geometric center of all pipes to be rehabilitated; dE denotes the Euclidean distance between two points; and L is the spatial dimension, which is 2 for Euclidean distance.
2.5.5. Robustness Assessment via Dual-Space Clustering
Focusing exclusively on cost or drainage performance can neglect the synergy between system structure and performance. Due to parameter uncertainty, boundary condition errors, and model stochasticity, some schemes may perform optimally only under certain conditions, but lack structural soundness or generalizability [79]. Selecting such scenario-dependent “pseudo-optimal” solutions may lead to extreme or impractical decisions and increase risks. Scheme selection should instead focus on the overall system behavior, giving priority to solutions that show consistency across both design and performance characteristics. These schemes are more robust to model errors and external uncertainties. To this end, K-means clustering is applied to the Pareto solution set in both the decision space (physical rehabilitation design) and the objective space (flooding mitigation and cost). The intersection of the largest clusters in both spaces is used as the final solution set [80,81]. This method simultaneously accounts for USDS structure and rehabilitated performance, selecting solutions that are reliable and structurally representative across both spaces.
2.5.6. Objective Scoring via EWM-TOPSIS
Beyond the above demand-based strategies, an alternative approach focuses on the intrinsic statistical characteristics of the Pareto front to drive the final selection. This approach prioritizes data-driven insights over subjective weighting, thereby minimizing human interference in the decision-making. The Entropy Weight Method–Technique for Order Preference by Similarity to an Ideal Solution (EWM–TOPSIS) is a data-driven decision-making method commonly applied to Pareto solution selection [82,83]. By leveraging the EWM, the relative importance of TFV and LCC is derived directly from the variance of the data itself. TOPSIS subsequently ranks Pareto solutions by their relative closeness to the ideal solution, and the highest-ranked scheme is selected. By deriving preferences directly from the data, EWM–TOPSIS offers a transparent and reproducible perspective, significantly reducing subjective bias. The detailed calculation procedure for EWM–TOPSIS is provided in the Supplementary Materials. The detailed calculation procedure for EWM–TOPSIS is provided in Section S4 of the Supplementary Materials.
2.5.7. Multi-Demand Nash Bargaining for Final Selection
Candidate Pareto solutions perform differently across multiple demands. These demands often conflict, and explicit preference structures may not exist in practical decisions. As a result, a method that ensures fair trade-offs among multiple demands is needed. This study adopts Nash bargaining (NB) as a framework for selecting the final rehabilitation scheme from the Pareto set.
NB achieves balance among multiple demands by maximizing the Nash product (NP), defined as the product of utility gains for all stakeholders. Within the NB framework, no single demand is prioritized. Instead, each requirement attains the largest possible improvement relative to its minimum acceptable threshold, that is, the disagreement point. The resulting compromise solution is referred to as the Nash bargaining solution (NBS). Owing to these properties, NB is well suited to multi-objective infrastructure rehabilitation problems [84,85]. Nash bargaining has been applied to water allocation under scarcity [86] and multi-objective renewable energy community design [87]. These applications provide methodological precedent for using NB to coordinate competing demands in this study.
To implement NB, all solutions in the Pareto set P of size |P| are ranked under each requirement. For the h-th demand, each solution p ∈ P is assigned a rank rh(p) ∈ {1,⋯,|P|}. These demand-based ranks are then converted into cardinal utility values Uh(p) to overcome the limitations of purely ordinal information and to enable computation of the NP. The resulting NBS is defined as follows:
where Uh is the utility corresponding to the h-th (h = 1,2,⋯,6) decision demand, d is the disagreement point. Here, the utility at the disagreement point, Uh(d), is set to 0. A linear transformation [88,89] is used to convert ordinal rankings into cardinal utility values. The specific formulation is detailed as follows:
3. Results
3.1. NSGA-II Optimization Results Using Standard NSGA-II
Figure 9 shows the selection result of different stakeholders along the Pareto front produced by the standard NSGA-II (ST). In this study, the cost-optimal solution is defined as the Pareto solution with the lowest LCC, whereas the flood-optimal solution is defined as the solution with the minimum TFV, reflecting a performance-oriented or environmentally focused preference. These two solutions represent the boundary points of the Pareto front [35].
Figure 9.
Results of solution selection in ST: (a) marginal cost; (b) future climate uncertainty; (c) drainage capacity uniformity; (d) construction spatial concentration; (e) robustness assessment based on dual-space clustering; (f) EWM-TOPSIS.
The Pareto front obtained by ST comprises 15 solutions, with the cost-optimal solution at (4.66 × 10³ m3, 2.83 × 10⁷ CNY) and the flood-optimal solution at (9.50 × 10² m3, 8.41 × 10⁷ CNY). As upstream–downstream diameter constraints are not explicitly enforced, the ST solution set contains no feasible individuals that strictly satisfy constraints.
Under the marginal benefit demand, the locally optimal solutions occur at points where the slope of the Pareto front changes abruptly. Beyond these solutions, the front becomes flatter, indicating that additional expenditure yields rapidly diminishing reductions in TFV. Under the future uncertainty demand, the flood-optimal solution with the minimum TFV is selected. This selection reflects the expectation that such a scheme provides greater capacity reserves in critical sections of the drainage network, helping maintain system performance under more adverse future rainfall conditions.
For the demand for spatially concentrated construction, the locally optimal solution lies in the middle region of the Pareto front. Schemes with lower TFV generally require the rehabilitation of numerous pipes across the study area to substantially improve overall drainage capacity, resulting in a dispersed construction layout. Conversely, schemes with higher TFV mainly target bottleneck pipes and other critical locations. Although fewer pipes are rehabilitated, their spatial dispersion can also limit construction concentration.
EWM–TOPSIS selects a scheme within the compromise region of the Pareto front. Its integrated evaluation of LCC and TFV favors an overall balance between rehabilitation costs and flood mitigation performance, yielding a selection similar to that obtained under the spatial uniformity demand.
3.2. Comparison of USDS Rehabilitation Pareto Fronts Under Different Improved Optimization Approaches
To systematically evaluate the performance of the improved algorithms under constraint conditions, ST is used as the baseline for comparative analysis. Although the ST solution set does not strictly meet the pipe diameter constraints, comparisons with DC and IO reveal the effects of incorporating diameter constraints and operator improvements on optimization performance. Each of the five optimization approaches (ST, DC-UA, DC-DA, IO-UA, and IO-DA) was run independently 25 times. For each approach, the solution set from the run with the highest final HV was selected for the Pareto-front comparisons in Figure 10 and the subsequent analysis, since the best-performing front obtained across the independent runs is the one that would be carried forward to scheme selection.
Figure 10.
Pareto fronts of different optimization approaches and their reranking results. (a) MP-DA; (b) MP-UA; (c) MP.
In Figure 10a, the DC approach yielded a total of 23 solutions, representing a 53.3% increase compared with ST. Among these, 11 solutions were obtained under the downstream adjustment (DA) strategy (denoted as DC-DA). The corresponding flood-optimal solution is (0 m3, 1.07 × 10⁸ CNY), while the cost-optimal solution is (1.15 × 10³ m3, 8.82 × 10⁷ CNY). Under the upstream adjustment (UA) strategy (denoted as DC-UA), 12 solutions were obtained, ranging from a flood-optimal solution of (3.84 × 10³ m3, 2.29 × 10⁷ CNY) to a cost-optimal solution of (6.90 × 10³ m3, 1.15 × 10⁷ CNY). The introduction of pipe diameter constraints allows the Pareto front to extend toward both lower overflow and lower cost regions. Notably, a strictly zero-overflow solution is identified, and the minimum cost is reduced from 2.83 × 10⁷ CNY to 1.15 × 10⁷ CNY. Despite these improvements, no strong Pareto dominance is observed between the DC and ST fronts. Specifically, under the UA strategy, the solution sets of DC and ST are mutually non-dominated. In contrast, under the DA strategy, the DC solutions partially dominate ST. This occurs because the DC approach can identify critical pipes with mismatched diameters that are prone to overflow. In the DA strategy, enhancing downstream capacity effectively reduces flooding. By contrast, in the UA strategy, satisfying the diameter constraint requires reducing upstream pipe diameters. Although this reduces rehabilitation costs, it further weakens flood mitigation performance.
As shown in Figure 10b, the IO approach yields a total of 11 solutions, representing a more constrained set than DC. Specifically, 7 solutions are identified under the DA strategy (denoted as IO-DA). The corresponding flood-optimal solution is (0 m3, 1.09 × 10⁸ CNY), and the cost-optimal solution is (1.86 × 10³ m3, 8.54 × 10⁷ CNY). Under the UA strategy, 4 solutions are obtained (denoted as IO-UA), with the flood- and cost-optimal solutions recorded at (3.63 × 10³ m3, 1.89 × 10⁷ CNY) and (6.21 × 10³ m3, 1.15 × 10⁷ CNY), respectively. Compared with DC, the cost-optimal solution obtained by IO remains an identical minimum cost, whereas the associated TFV is reduced from 6.90 × 10³ m3 to 6.21 × 10³ m3. In both the UA and DA strategies, IO yields better cost- and benefit-optimal solutions than DC. However, the Pareto fronts of IO and DC intersect, and neither dominates the other. This behavior may be attributed to the improved operator, which enhances exploitation of DC solutions and prioritizes the modification of overflow-prone pipes. This accelerates convergence toward extreme regions, allowing better local refinements around existing DC solutions. However, this also reduces exploration of intermediate trade-off regions and decreases population diversity. Notably, due to enforced diameter correction, all solutions in both the IO and DC approaches strictly adhere to the constraints, with no violations occurring.
The three approaches exhibit complementary strengths across different objective regions. To leverage this complementarity and expand the set of viable solutions, the solution sets are merged and re-ranked using non-dominated sorting. Specifically, solutions from the IO and DC approaches were partitioned by strategy (UA and DA) and resorted to form merged Pareto sets, denoted as MP-UA and MP-DA, which are highlighted by boxes in Figure 10b and Figure 10a, respectively. MP-UA contains 6 solutions, while MP-DA contains 10 solutions. Subsequently, MP-UA, MP-DA, and the ST solutions are further merged and re-ranked using non-dominated sorting. The resulting final solution set is denoted as MP and is marked by black boxes in Figure 10c. The MP set comprises 28 solutions, including 12 solutions originating from ST.
The mean HV values for the various optimization approaches are summarized in Figure 11. Under both the UA and DA strategies, the solutions obtained by the IO method consistently outperform those of the DC method, with an average HV improvement of 8.72%. After merging and re-ranking the IO and DC solution sets, the overall solution quality is further improved by 0.58%. The final integrated MP solution set exhibits a 16.25% increase in HV relative to the ST baseline. The statistical significance of these performance differences was verified by Wilcoxon rank-sum [90,91] tests across the independent runs, with all three pairwise comparisons (DC-DA vs. IO-DA, DC-UA vs. IO-UA, and ST vs. MP) yielding p-values below 0.05. Overall, the integration of multiple extended NSGA-II approaches effectively identifies a more diverse and high-performing set of rehabilitation schemes, providing a broader solution space for subsequent scheme evaluation and decision-making.
Figure 11.
Comparison of HV for different optimization approaches.
3.3. Selection of Scheme Under Multi-Dimensional Demand Considerations
For comparison, the flooding and overload severity (Δθ) of the USDS before rehabilitation were simulated, as shown in Figure 12. According to different decision demands, the most suitable solutions were selected from four solution clusters: ST, MP-UA, MP-DA, and MP. For a given demand, the best solution identified from the MP cluster is referred to as the global optimal solution, whereas the solutions selected from the ST, MP-UA, and MP-DA clusters are regarded as local optimal solutions. The selection results are presented in Figure 13 and Table 2, and the corresponding pipe rehabilitation schemes are illustrated in Figure 14. As a non-parametric density estimation method, kernel density estimation (KDE) does not require assumptions about the underlying distribution and is capable of flexibly characterizing complex or even multimodal distributions. Consequently, it has been widely applied in flood-related research to visualize the spatial patterns of hydrological indicators [92,93]. To facilitate intuitive comparison of results, key indicators involved in Figure 12 and Figure 14, including TFV, overload severity, and diameter variation, were analyzed using KDE. In addition, for the clustering analysis, the optimal number of clusters was determined using the elbow method with the sum of squared error (SSE) and the silhouette coefficient (SC). The SSE and SC values for both the objective and decision spaces across varying cluster numbers are provided in Section S3 of the Supplementary Materials.
Figure 12.
Kernel density distributions of overflow (a) and overload (b) before rehabilitation.
Figure 13.
Selection results of different demand dimensions on the solution sets, where “global” represents the selection on MP, and “local” represents the selection on ST, MP-UA, and MP-DA. (a) marginal cost; (b) future climate uncertainty; (c) drainage capacity uniformity; (d) construction spatial concentration; (e) robustness assessment based on dual-space clustering; (f) EWM-TOPSIS.
Table 2.
Nash product of each solution in MP.
Figure 14.
Kernel density distributions of pipe diameter changes in optimal solutions. (a) diameter expansion; (b) diameter reduction.
For the drainage capacity uniformity demand, the global optimal solution is identical to the local optimal solution derived from the ST cluster. In the case of the dual-space robustness demand, the global optimal one lies within the ST cluster but does not coincide with its local optimal solution. However, for the other four demands, the global optimal solutions are all located outside the ST cluster. Specifically, for the future climate uncertainty demands, the global optimal solution coincides with the local optimal solution identified in the MP-DA cluster, while for the marginal cost and construction spatial concentration demand, the global optimal solution corresponds to the local optimum in the MP-UA cluster. Under both the dual-space clustering and EWM-TOPSIS, the global optimal solutions do not coincide with any local optima. These findings demonstrate that the solution set developed by integrating the diameter constraint, the improved operator, and solution set re-ranking can effectively address the limitations of the ST approach. This framework reveals globally optimal solutions that only emerge in the extended solution set, thereby offering more comprehensive decision options for diverse practical demands.
When applying the MC-based selection criterion, the local optimal solutions identified in each cluster consistently occur at locations where the Pareto front slope experiences a distinct change. After the knee point, additional investment leads to a rapid decline in the marginal overflow reduction achieved.
For the future climate uncertainty criterion, each cluster consistently identifies the flood-optimal solution characterized by the lowest TFV. This is because this criterion emphasizes overall system safety across potential extreme rainfall scenarios and therefore prioritizes the reduction of overflow. Such solutions generally involve enhanced redundancy in key drainage components, which helps preserve system stability as climate uncertainty increases.
Drainage capacity uniformity focuses on the spatial balance of conveyance capacity across the network, rather than the absolute minimization of overflow volume or cost. This demand therefore excludes solutions that excessively strengthen a single objective or localized nodes. Both the UA and DA strategies introduce strong directional enhancements. Although these targeted reinforcements are effective in improving flood control or cost efficiency, they tend to introduce spatial biases in drainage capacity, which undermines overall uniformity. As shown by Figure 12 and Figure 14 and the uniformity rankings in Table 2, solutions located in the low-flood region of the Pareto front generally depend on concentrated upgrades of a few critical bottleneck pipes. While such solutions are effective in flood mitigation, they tend to introduce strong spatial heterogeneity in drainage capacity. Conversely, solutions with high overflow volumes indicate inadequate system-wide capacity and are still unfavorable for uniformity. In contrast, the ST approach improves the overall performance through limited and coordinated adjustments at key pipes, thereby avoiding excessive capacity concentration. As a result, ST aligns more closely with the drainage capacity uniformity demand, and its locally optimal solution coincides with the global optimum.
For the construction spatial concentration demand, the local optimal solutions are located around the middle of each cluster, corresponding to moderate overflow levels rather than extreme values. Solutions with minimal overflow generally involve simultaneous upgrades of a large number of pipes across the study area to improve system-wide drainage performance, which inevitably leads to dispersed construction sites. In contrast, solutions associated with higher flooding typically target only a few critical bottleneck pipes. While the number of upgraded pipes is smaller, these bottlenecks are often geographically dispersed, again resulting in low construction concentration. In contrast, solutions located in the intermediate portion of the Pareto front strike a more balanced trade-off between flood mitigation and construction spatial concentration.
Compared with the criteria above, EWM-TOPSIS selects solutions situated in the compromise region for all four clusters. Its integrated evaluation framework prioritizes synergy, favoring solutions that objectively balance investment cost and flood mitigation effectiveness. As a result, solutions with extremely low cost or flooding are excluded in favor of overall performance.
Comparative analysis across demand scenarios shows that the proposed operator and merging–reranking strategy overcome the limitation of ST and identify optima for each demand globally. The optimal schemes identified for different demands demonstrate differentiated patterns in decision space or objective space, reflecting distinct trade-off preferences and pipe diameter configurations within the network. This divergence underscores the multidimensional and context-dependent nature of USDS rehabilitation decisions.
3.4. Selection of Final Scheme Based on NB
In Section 3.3, six optimal solutions were identified based on multiple demand dimensions, significantly reducing the candidate set to a manageable size with practical applicability. However, when decision preferences are ambiguous, selecting a final scheme from these candidates may still be challenging. To address this issue, the Nash Bargaining (NB) approach is introduced to reconcile different demands and derive a final consensus solution. The Nash Product (NP) values of all solutions are reported in Table 2. The NB-based evaluation indicates that the resulting Nash Bargaining Solution (NBS) coincides with the top-ranked solution under the drainage capacity uniformity criterion. This is because the NBS maximizes the product of utility gains across all demands, such that poor performance in any single demand leads to a substantial reduction in NP.
Drainage capacity uniformity is a system-scale metric that requires coordinated performance and is closely related to other demands, particularly future uncertainty and construction spatial concentration. Schemes with lower variance in relative water depth typically represent a spatially balanced capacity configuration. Such solutions generally improve system structure through distributed adjustments, avoiding excessive reinforcement of a few critical pipes. In contrast, solutions that excessively prioritize overflow reduction or cost minimization often introduce capacity imbalances, leading not only to inferior uniformity performance but also to adverse effects under other demands. Consequently, solutions with superior drainage capacity uniformity tend to exhibit more resilient overall performance across multiple demand dimensions [17].
4. Discussion
4.1. Decision Biases Induced by Neglecting Multiple Demands
A diverse set of alternatives for USDS rehabilitation is provided by MOO. Nevertheless, selecting solutions based solely on a single demand often fails to capture risks related to construction and operation. Ignoring any demand dimension can thus introduce bias into the optimization results, potentially undermining the practical efficacy of the optimized schemes.
In particular, disregarding marginal cost considerations prevents a proper assessment of the incremental investment required to achieve additional flood mitigation. As a result, stakeholders may continue to increase investment even when flood mitigation benefits diminish. Such solutions, while technically sound, are economically inefficient and may be unsuitable for rehabilitations subject to budget limitations or staged implementation.
Selecting a USDS rehabilitation scheme based solely on current design conditions, without accounting for future uncertainties, may yield schemes that perform well under historical rainfall but possess insufficient hydraulic reserve. Such schemes are prone to exposing systemic vulnerabilities under extreme events or altered land use. This is especially evident in the MP-UA set, which exhibits poor coverage in the low-overflow region, constraining options under high-safety demand scenarios.
From a system operation perspective, neglecting the spatial distribution of drainage capacity can result in solutions with acceptable total overflow but uneven hydraulic loading internally. In such systems, critical pipes may operate at full load or overload status, while others remain underutilized, increasing system sensitivity to spatially heterogenous rainfall [94]. Incorporating pipe RWD variance as a demand helps identify schemes with more balanced and resilient schemes.
Implementation feasibility is also crucial. Neglecting construction concentration may lead to numerous, spatially dispersed pipe replacements. While unit modifications are small, overall construction logistics become complex, raising management costs. Such solutions may lie near knee points in the objective space (e.g., solution #7 in Table 2) and may be preferentially selected when marginal cost dominates. Concentrated construction schemes, though not always optimal in cost or flood metrics, allow efficient management and better operational feasibility. Ignoring this demand may favor economically optimal but practically difficult schemes.
Moreover, evaluating schemes solely based on the objective function values from a single model implicitly assumes that these solutions reliably reflect the system’s true optimal configuration. For nonlinear systems like USDS, results inevitably are sensitive to model assumptions, parameter settings, and algorithmic randomness. Some schemes may appear to excel under specific computational conditions, yet lack applicability. Neglecting dual-space robustness can bias the decision toward such incidental solutions, whose performance may not persist under model perturbations. Deploying clustering-based robustness evaluation helps identify representative solutions by analyzing solution distributions in both decision and objective spaces. The approach captures recurring dominant patterns in the optimization process, enhancing stability under model uncertainty or external disturbances.
Finally, the absence of integrated multi-objective evaluation methods like EWM-TOPSIS renders the selection susceptible to inherent biases or empiricism. Given the differences in Pareto front density and shape across optimization approaches, a unified evaluation framework is essential. Without it, selected solutions may exhibit sensitivity to objective weighting, increasing decision uncertainty and transparency.
Existing studies on solution selection in multi-objective optimization of drainage network rehabilitation often do not explicitly consider the diversity of potential decision-making demands. Instead, they typically start directly from the two objective functions and only provide representative solutions, such as benefit maximization, cost minimization, and trade-off solutions [35,95,96]. In some studies, the selection process is further supported by subjective or objective multi-criteria decision-making methods. For example, approaches such as EWM–TOPSIS [82,83,97] or AHP–TOPSIS [98] are applied to rank candidate solutions. In these methods, weights are assigned to the objectives and the optimal solution is identified according to the aggregated evaluation score. However, these approaches generally rely on weighting strategies and often assume that decision-makers’ preferences can be adequately represented by fixed weights. In practice, the rehabilitation process involves multiple stakeholders with diverse and sometimes conflicting preferences. Consequently, the direct selection of solutions based solely on objective trade-offs or weighted evaluation may not fully capture the complexity and variability of real-world decision-making.
In conclusion, various demand-driven considerations impose constraints on rehabilitation schemes regarding economic efficiency, operational robustness, practical feasibility, etc. Neglecting any of these demands can lead to unforeseen risks in applications. This highlights, even more, the necessity of integrating a multi-demand perspective in the assessment of different optimization approaches and rehabilitation schemes.
Regarding practical implementation at larger spatial scales, model calibration and computational burden may present additional challenges. Differences in catchment and drainage network characteristics across areas may require differentiated model parameters, supported by representative rainfall and flow monitoring data. Furthermore, larger networks generally involve more model elements and rehabilitation decision variables, potentially increasing simulation and optimization runtimes and requiring greater computational resources.
4.2. Future Perspectives
The current research is tailored for community-scale USDS rehabilitation, offering a refined tool for localized decision-making. Nonetheless, the proposed method possesses scalability: by integrating larger-scale drainage zones, river channels, or pumping stations and adjusting model configurations accordingly, it can be extended to optimize drainage systems at the subdistrict, district, or even city scale.
In terms of optimization scenario design, TFV and LCC were adopted as core demands to formulate a bi-objective optimization model, with optimal solutions selected from the Pareto set according to varying decision demands. This approach helps balance drainage safety and economic feasibility. However, it also simplifies the complex trade-offs among multiple demands inherent in USDS rehabilitation. Future studies could build upon this framework by explicitly including the remaining six demands into a many-objective optimization framework. This would provide a more holistic decision-support system for USDS planning and rehabilitation decisions in complex urban hydrological environments. In addition, this study primarily focuses on the design and planning stages of USDS rehabilitation. It does not systematically examine the uncertainties and potential costs associated with the actual construction process, such as the demolition of existing structures, resident relocation, temporary traffic diversion, or other implementation-related challenges. Nor does it address detailed phased implementation strategies. Therefore, how to translate the identified optimal equilibrium design scheme into engineering practice remains an issue for further research.
Furthermore, the pipe construction cost function adopted in this study originates from the 2008 Municipal Engineering Investment Estimation Index [50]. This formula has not yet been updated, and its dated cost basis may introduce bias into the estimates. Future research could obtain and adopt updated pipe construction cost functions to further improve the accuracy of cost estimation. In addition, because of administrative restrictions, only one monitoring location in the study area was available for model validation. In future work, we will recommend that the drainage management department establish additional monitoring locations and collect more monitoring data for model validation to improve model accuracy.
5. Conclusions
In this study, the integration of pipe diameter correction and an improved PLM operator enabled strict constraints on upstream–downstream pipe diameter constraints in USDS rehabilitation schemes, thereby enhancing both the engineering practicality and solution diversity. On this basis, the demands of various stakeholders during the rehabilitation process were systematically analyzed, highlighting the diameter constraint (DC) and improved operator (IO) method’s advantages in improving solution diversity and multi-demand adaptability. Moreover, Nash bargaining was employed to achieve coordination among multiple demands, allowing the identification of representative and implementable final schemes under multi-demand conditions. The main findings are summarized as follows:
Optimization via the IO method and reranking Pareto sets across different approaches substantially improved solution diversity, increasing the number of Pareto solutions from 15 (ST) to 28 (MP) and enhancing the HV by 15.4%. This effectively addressed the limited extensibility of the ST approach and provided a more robust basis for rehabilitation scheme selection and decision-making.
Considering basic or only a single demand in USDS rehabilitation decisions fails to capture overall USDS rehabilitation scheme performance. Incorporating multiple criteria—including cost-effectiveness, future climate uncertainty, hydraulic capacity uniformity, and construction feasibility—facilitates the identification of trade-offs among schemes under multidimensional constraints, thereby avoiding extreme or scenario-dependent solutions and enhancing the applicability of schemes in complex real-world settings.
Within the multi-demand framework, the uniformity of drainage capacity emerged as a key comprehensive indicator of overall system performance and structural rationality. Solutions exhibiting more balanced drainage capacity distribution showed more stable system responses compared with optimal schemes for other demands. Accordingly, the solution with the highest drainage capacity uniformity was selected as the final Nash bargain solution, achieving an optimal compromise among multi-demands.
The proposed optimization–evaluation–decision framework offers a tool for USDS rehabilitation in the presence of multiple demands, providing guidance for urban flood management and drainage system upgrading.
Supplementary Materials
The following supporting information can be downloaded at: https://www.mdpi.com/article/10.3390/w18212770/s1, Section S1. Operational status of pipes in USDS, Table S1: Index of USDS status; Section S2. Convergence curve, Figure S1: Convergence curve of different optimization approaches. (a) Pareto front size; (b) HV value; Section S3. Determination of the optimal number of clusters; Section S4. Scheme Evaluation Based on the EWM–TOPSIS Method.
Author Contributions
Conceptualization, Y.T. and Z.W.; methodology, Z.W.; validation, Y.T., Z.W. and H.W.; formal analysis, Z.W.; investigation, C.D. and H.W.; resources, H.W.; data curation, C.D. and H.W.; writing—original draft preparation, Z.W.; writing—review and editing, Y.T., Z.W. and H.W.; visualization, Z.W.; supervision, H.W.; project administration, C.D.; funding acquisition, H.W. All authors have read and agreed to the published version of the manuscript.
Funding
This research was funded by the General Program of the National Natural Science Foundation of China (72373011).
Data Availability Statement
The original contributions presented in this study are included in the article/Supplementary Materials. Further inquiries can be directed to the corresponding author.
Conflicts of Interest
The authors declare no conflicts of interest.
References
- Deng, P. Analysis and Countermeasures of Urban Rainstorm Flooding. Water Wastewater Eng. 2011, 47, 37–40. (In Chinese) [Google Scholar] [CrossRef]
- Regueiro-Picallo, M.; Anta, J.; Naves, A.; Figueroa, A.; Rieckermann, J. Towards Urban Drainage Sediment Accumulation Monitoring Using Temperature Sensors. Environ. Sci. Water Res. Technol. 2023, 9, 3200–3212. [Google Scholar] [CrossRef] [Scilit]
- Yang, J.; Zayed, T.; Arimiyaw, D.; Nashat, M.; Liu, X.; Ibrahim, A. Structural Failure in Urban Sewer Pipelines: A Comprehensive Review from Analysis to Intervention Techniques. Tunn. Undergr. Space Technol. 2026, 167, 107027. [Google Scholar] [CrossRef] [Scilit]
- Lu, J.; Liu, J.; Yu, Y.; Liu, C.; Su, X. Network Structure Optimization Method for Urban Drainage Systems Considering Pipeline Redundancies. Int. J. Disaster Risk Sci. 2022, 13, 793–809. [Google Scholar] [CrossRef] [Scilit]
- Yazdi, J.; Lee, E.H.; Kim, J.H. Stochastic Multiobjective Optimization Model for Urban Drainage Network Rehabilitation. J. Water Resour. Plan. Manag. 2015, 141, 04014091. [Google Scholar] [CrossRef] [Scilit]
- Hesarkazzazi, S.; Hajibabaei, M.; Bakhshipour, A.E.; Dittmer, U.; Haghighi, A.; Sitzenfrei, R. Generation of Optimal (de)Centralized Layouts for Urban Drainage Systems: A Graph-Theory-Based Combinatorial Multi-Objective Optimization Framework. Sustain. Cities Soc. 2022, 81, 103827. [Google Scholar] [CrossRef] [Scilit]
- Zhang, Y.; Yin, H.; Liu, M.; Kong, F.; Xu, J. Evaluating the Effectiveness of Environmental Sustainability Indicators in Optimizing Green-Grey Infrastructure for Sustainable Stormwater Management. Water Res. 2025, 272, 122932. [Google Scholar] [CrossRef] [Scilit] [PubMed]
- Wang, M.; Sun, Y.; Sweetapple, C. Optimization of Storage Tank Locations in an Urban Stormwater Drainage System Using a Two-Stage Approach. J. Environ. Manag. 2017, 204, 31–38. [Google Scholar] [CrossRef] [Scilit] [PubMed]
- Barreto, W.; Vojinovic, Z.; Price, R.; Solomatine, D. Multiobjective Evolutionary Approach to Rehabilitation of Urban Drainage Systems. J. Water Resour. Plan. Manag. 2010, 136, 547–554. [Google Scholar] [CrossRef] [Scilit]
- Vojinovic, Z.; Sahlu, S.; Torres, A.S.; Seyoum, S.D.; Anvarifar, F.; Matungulu, H.; Barreto, W.; Savic, D.; Kapelan, Z. Multi-Objective Rehabilitation of Urban Drainage Systems under Uncertainties. J. Hydroinformatics 2014, 16, 1044–1061. [Google Scholar] [CrossRef] [Scilit]
- Feng, W.; Wang, C.; Lei, X.; Wang, H. A Simplified Modeling Approach for Optimization of Urban River Systems. J. Hydrol. 2023, 623, 129689. [Google Scholar] [CrossRef] [Scilit]
- Heydari Mofrad, H.; Yazdi, J. An Enhanced Multi-Objective Evolutionary Algorithm for the Rehabilitation of Urban Drainage Systems. Eng. Optim. 2022, 54, 349–367. [Google Scholar] [CrossRef] [Scilit]
- Yazdi, J.; Mohammadiun, S.; Sadiq, R.; Salehi Neyshabouri, S.A.A.; Alavi Gharahbagh, A. Assessment of Different MOEAs for Rehabilitation Evaluation of Urban Stormwater Drainage Systems—Case Study: Eastern Catchment of Tehran. J. Hydro-Environ. Res. 2018, 21, 76–85. [Google Scholar] [CrossRef] [Scilit]
- Dong, X.; Zeng, S.; Chen, J. A Spatial Multi-Objective Optimization Model for Sustainable Urban Wastewater System Layout Planning. Water Sci. Technol. 2012, 66, 267–274. [Google Scholar] [CrossRef] [Scilit] [PubMed]
- Huang, J.; James, W.; James, R. A Lifecycle Cost Based Design Optimization Model for Stormwater Management Systems. J. Water Manag. Model. 2005, 13, R223-03. [Google Scholar] [CrossRef] [Scilit]
- Wang, J.; Liu, J.; Mei, C.; Wang, H.; Lu, J. A Multi-Objective Optimization Model for Synergistic Effect Analysis of Integrated Green-Gray-Blue Drainage System in Urban Inundation Control. J. Hydrol. 2022, 609, 127725. [Google Scholar] [CrossRef] [Scilit]
- Lin, R.; Zheng, F.; Savic, D.; Zhang, Q.; Fang, X. Improving the Effectiveness of Multiobjective Optimization Design of Urban Drainage Systems. Water Resour. Res. 2020, 56, e2019WR026656. [Google Scholar] [CrossRef] [Scilit]
- Ngamalieu-Nengoue, U.A.; Iglesias-Rey, P.L.; Martínez-Solano, F.J.; Mora-Meliá, D.; Saldarriaga Valderrama, J.G. Urban Drainage Network Rehabilitation Considering Storm Tank Installation and Pipe Substitution. Water 2019, 11, 515. [Google Scholar] [CrossRef] [Scilit]
- Ngamalieu-Nengoue, U.A.; Martínez-Solano, F.J.; Iglesias-Rey, P.L.; Mora-Meliá, D. Multi-Objective Optimization for Urban Drainage or Sewer Networks Rehabilitation through Pipes Substitution and Storage Tanks Installation. Water 2019, 11, 935. [Google Scholar] [CrossRef] [Scilit]
- Wu, Y.; Zheng, S.; Liu, Q.; Dong, A.; Li, Q. Structural and Empirical Knowledge Driven Multi-Objective Evolutionary Algorithm for Urban Drainage System Design. Expert Syst. Appl. 2024, 249, 123461. [Google Scholar] [CrossRef] [Scilit]
- Seyedashraf, O. Enhancing Decision-Making in Sustainable Urban Drainage System Optimization: A Novel Framework for Sparse Pareto-Fronts. Water Resour. Manag. 2024, 38, 6157–6172. [Google Scholar] [CrossRef] [Scilit]
- Creaco, E.; Dada, A.; Grossi, G.; Todeschini, S. Phasing LID Implementation for Flood Mitigation in Urban Drainage Systems Considering Climate Change Scenarios and Using Genetic Algorithms. J. Water Resour. Plan. Manag. 2025, 151, 04025026. [Google Scholar] [CrossRef] [Scilit]
- Bista, A.; Paus, K.A.H.; Seifert-Dähnn, I. Multi-Objective Optimization of Nature-Based Solutions in Urban Stormwater Management: A Scoping Review. Environ. Modell. Softw. 2025, 194, 106659. [Google Scholar] [CrossRef] [Scilit]
- Liu, M.; Wang, Z.; Wang, M.; Li, X.; Zhang, Y.; Yang, B.; Lai, C. A Framework for Optimization and Assessment of Long-Term Urban Stormwater Management Scenarios under Climate Change and Performance Challenges. J. Environ. Manag. 2025, 390, 126298. [Google Scholar] [CrossRef] [Scilit] [PubMed]
- Marques, G.; Possantti, I.; Dalcin, A.P.; Daiello, J.; González, I.; Todeschini, F.; Goldenfum, J. An Integrated Hydro-Finance Approach towards Sustainable Urban Stormwater and Flood Control Management. J. Clean. Prod. 2024, 470, 143364. [Google Scholar] [CrossRef] [Scilit]
- Qiao, X.-J.; Kristoffersson, A.; Randrup, T.B. Challenges to Implementing Urban Sustainable Stormwater Management from a Governance Perspective: A Literature Review. J. Clean. Prod. 2018, 196, 943–952. [Google Scholar] [CrossRef] [Scilit]
- Liu, K.; Kinouchi, T.; Zhao, G.; Johnson, F.; Zhang, K. Cost-Effectiveness of Green Infrastructure under Climate Change: Model Parameterization, Uncertainty, and Sensitivity. J. Hydrol. 2025, 661, 133796. [Google Scholar] [CrossRef] [Scilit]
- Wang, R.; Brent, D.; Wu, H. Willingness to Pay for Ecosystem Benefits of Green Stormwater Infrastructure in Chinese Sponge Cities. J. Clean. Prod. 2022, 371, 133462. [Google Scholar] [CrossRef] [Scilit]
- Ye, C.; Gao, J.; Nachabe, M.; Charkhgard, H.; Zhang, Y.; Zhang, Q. Optimization of Green and Grey Infrastructure for Performance Enhancement of Urban Drainage System under Future Conditions. J. Environ. Manag. 2025, 376, 124518. [Google Scholar] [CrossRef] [Scilit] [PubMed]
- Sun, C.; Rao, Q.; Xiong, Z.; Liu, M.; Liu, Y.; Fan, C.; Li, J.; Keat Tan, S.; Wang, M.; Zhang, D. Optimized Resilience Coupled with Cost-Effectiveness for Grey and Green Infrastructure: A Case Study in a Historical and Cultural Area, Guangzhou, China. Ecol. Indic. 2024, 167, 112684. [Google Scholar] [CrossRef] [Scilit]
- Liu, W.; Zhang, X.; Feng, Q.; Engel, B.A. City-Scale Integrated Flood Risk Prediction under Future Climate Change and Urbanization Based on the Shared Socioeconomic Pathways (SSP) Scenarios. J. Hydrol. 2025, 655, 132971. [Google Scholar] [CrossRef] [Scilit]
- Karimi, H.; Sultan, M.; Yan, E.; Elhaddad, H.; Saleh, H.; Abdelmohsen, K.; Emil, M.K. Climate-Extreme Modeling Framework for Sustainable Flood Management in the Arabian Peninsula. J. Environ. Manag. 2025, 393, 127074. [Google Scholar] [CrossRef] [Scilit] [PubMed]
- Guo, C.; Tang, J.; Hong, J.; Lu, Q.; Wu, H.; Wei, R. Resilience Assessment of Urban Bus-Metro System to Floods under Future Climate Change. Transp. Res. Part D Transp. Environ. 2025, 148, 104925. [Google Scholar] [CrossRef] [Scilit]
- Chen, S.; Lin, J.; Wu, T.; Yuan, Z.; Cao, W. Assessing Flood and Waterlogging Vulnerability and Community Governance in Urban Villages in the Context of Climate Change: A Case Study of 89 Urban Villages in Shanghai. Sustain. Cities Soc. 2025, 126, 106377. [Google Scholar] [CrossRef] [Scilit]
- Li, W.; Jiang, R.; Wu, H.; Xie, J.; Zhao, Y.; Yang, M.; Li, F.; Lu, X. A New Spatial Optimization Layout Framework for Urban LID Facilities in Response to Climate Change Impacts. Sustain. Cities Soc. 2025, 131, 106686. [Google Scholar] [CrossRef] [Scilit]
- Eskandaripour, M.; Soltaninia, S. Optimal Low-Impact Development Facility Design in Urban Environments: A Multidimensional Optimization Approach Employing Slime Mould and Nondominated Sorting Genetic Algorithms. Urban Clim. 2024, 55, 101963. [Google Scholar] [CrossRef] [Scilit]
- Wu, J.; Liu, Z.; Liu, T.; Liu, W.; Liu, W.; Luo, H. Assessing Urban Pluvial Waterlogging Resilience Based on Sewer Congestion Risk and Climate Change Impacts. J. Hydrol. 2023, 626, 130230. [Google Scholar] [CrossRef] [Scilit]
- Zhou, J.; Pang, Y.; Wang, H.; Li, W.; Liu, J.; Luo, Z.; Shao, W.; Zhang, H. Sewage Network Operational Risks Based on InfoWorks ICM with Nodal Flow Diurnal Patterns under NPIs for COVID-19. Water Res. 2023, 246, 120708. [Google Scholar] [CrossRef] [Scilit] [PubMed]
- Matthews, J.C.; Allouche, E.N.; Sterling, R.L. Social Cost Impact Assessment of Pipeline Infrastructure Projects. Environ. Impact Assess. Rev. 2015, 50, 196–202. [Google Scholar] [CrossRef] [Scilit]
- Hojjati, A.; Jefferson, I.; Metje, N.; Rogers, C.D.F. Sustainability Assessment for Urban Underground Utility Infrastructure Projects. Proc. Inst. Civ. Eng. Eng. Sustain. 2018, 171, 68–80. [Google Scholar] [CrossRef] [Scilit]
- Liang, W.; Hu, J.; Zhang, L.; Guo, C.; Lin, W. Assessing and Classifying Risk of Pipeline Third-Party Interference Based on Fault Tree and SOM. Eng. Appl. Artif. Intell. 2012, 25, 594–608. [Google Scholar] [CrossRef] [Scilit]
- GB 50014–2021; Standard for Design of Outdoor Wastewater Engineering. China Planning Press: Beijing, China, 2021. (In Chinese)
- Zhang, H.; Liu, J.; Zhou, J.; Mei, C.; Wang, J.; Song, T. Quantitative Assessment of Exacerbating Effect on Urban Inundation When River Flood Encounters Heavy Rainfall in an Urbanized Watershed. Sci. China Technol. Sci. 2025, 68, 1920703. [Google Scholar] [CrossRef] [Scilit]
- U.S. Environmental Protection Agency; Rossman, L.A. Storm Water Management Model (SWMM). Available online: https://www.epa.gov/water-research/storm-water-management-model-swmm (accessed on 25 March 2024).
- Pastorek, J.; Fencl, M.; Bareš, V. Uncertainties in discharge predictions based on microwave link rainfall estimates in a small urban catchment. J. Hydrol. 2023, 617, 129051. [Google Scholar] [CrossRef] [Scilit]
- Hu, Y.; Scavia, D.; Kerkez, B. Are all data useful? Inferring causality to predict flows across sewer and drainage systems using directed information and boosted regression trees. Water Res. 2018, 145, 697–706. [Google Scholar] [CrossRef] [Scilit] [PubMed]
- Yang, W.; Li, M.; Bin, L.; Jiang, X.; Wang, H.; Ren, M.; Liang, H.; Liu, X.; Yan, L. An innovative urban drainage network pipe diameter optimization method based on an enhanced genetic algorithm and multi-stage disaster mitigation model. J. Hydrol. 2026, 674, 135558. [Google Scholar] [CrossRef] [Scilit]
- Liu, Y.; Wang, H.; Liu, P.; Liu, W.; Luo, X.; Liao, W.; Xu, H.; Zhou, C.; Kang, A.; Wang, D. An integrated design combining the layout, volume, and active control of detention ponds for urban drainage systems. J. Hydrol. 2025, 647, 132321. [Google Scholar] [CrossRef] [Scilit]
- Liu, S.; Yan, X. Water Supply and Drainage Network System, 4th ed.; China Architecture & Building Press: Beijing, China, 2020. [Google Scholar]
- Standard Quota Research Institute of the Ministry of Housing and Urban–Rural Development. Municipal Engineering Investment Estimation Index; Beijing China Planning Publishing House: Beijing, China, 2008; Volume 4. (In Chinese) [Google Scholar]
- Houle, J.J.; Roseen, R.M.; Ballestero, T.P.; Puls, T.A.; Sherrard, J. A Comparison of Maintenance Costs, Labor Demands, and System Performance for LID and Conventional Stormwater Management; ASCE: Reston, VA, USA, 2015; pp. 93–105. [Google Scholar] [CrossRef] [Scilit]
- Wang, M.; Liu, M.; Zhang, D.; Qi, J.; Fu, W.; Zhang, Y.; Rao, Q.; Bakhshipour, A.E.; Tan, S.K. Assessing and optimizing the hydrological performance of Grey-Green infrastructure systems in response to climate change and non-stationary time series. Water Res. 2023, 232, 119720. [Google Scholar] [CrossRef] [Scilit] [PubMed]
- Liu, M.; Lai, C.; Zhang, Y.; Chen, B.; Wang, M. Multi-objective optimisation of integrated grey-green infrastructure in response to climate change from a life cycle perspective. J. Clean. Prod. 2025, 498, 145162. [Google Scholar] [CrossRef] [Scilit]
- Dong, Y. Performance Assessment and Design of Ultra-High Performance Concrete (UHPC) Structures Incorporating Life-Cycle Cost and Environmental Impacts. Constr. Build. Mater. 2018, 167, 414–425. [Google Scholar] [CrossRef] [Scilit]
- Wang, Z.; Zhou, S.; Wang, M.; Zhang, D. Cost-Benefit Analysis of Low-Impact Development at Hectare Scale for Urban Stormwater Source Control in Response to Anticipated Climatic Change. J. Environ. Manag. 2020, 264, 110483. [Google Scholar] [CrossRef] [Scilit] [PubMed]
- Xu, C.; Hong, J.; Jia, H.; Liang, S.; Xu, T. Life Cycle Environmental and Economic Assessment of a LID-BMP Treatment Train System: A Case Study in China. J. Clean. Prod. 2017, 149, 227–237. [Google Scholar] [CrossRef] [Scilit]
- Roozbahani, A.; Roghani, B.; Nilsen, V.; Paus, K.A.H.; Rydningen, U. Optimization of Urban Stormwater Systems: A Multi-Criteria Approach to Sustainable and Cost-Effective LID Implementation. Water Sci. Technol. 2025, 91, 654–668. [Google Scholar] [CrossRef] [Scilit] [PubMed]
- Lan, Q.; Lin, K.; Huang, L.; Guo, W.; Guo, J. Cohesive relationship of design storm return period of two-stage urban drainage system in Shenzhen City. South-North Water Transf. Water Sci. Technol. 2023, 21, 522–530. (In Chinese) [Google Scholar] [CrossRef]
- Liu, Z.; Xiong, S.; Lei, Y.; Hu, H. Study on design standard matching between municipal drainage and water conservancy drainage in urban local flood control. Water Resour. Prot. 2022, 38, 125–132. (In Chinese) [Google Scholar] [CrossRef]
- Jiang, C. Comparison and Connection Study Between “Standard for Waterlogging Control” and “Technical Code for Urban Flooding Prevention and Control”. J. Munic. Technol. 2023, 41, 50–56. (In Chinese) [Google Scholar] [CrossRef]
- DB11/T 969-2016; Standard of Rainstorm Runoff Calculation for Urban Storm Drainage System Planning and Design. Beijing Municipal Institute of City Planning and Design: Beijing, China, 2017.
- Di, D.; Fang, H.; Zhang, Z.; Lin, K.; Liu, M.; Jia, H. Multi-Objective Optimization Framework for Enhancing the Sustainability and Resilience of Green-Grey Infrastructure: A Perspective Incorporating the Impact of Pipeline Siltation on Flood Simulation. J. Clean. Prod. 2026, 538, 147382. [Google Scholar] [CrossRef] [Scilit]
- Awadallah, M.A.; Makhadmeh, S.N.; Al-Betar, M.A.; Dalbah, L.M.; Al-Redhaei, A.; Kouka, S.; Enshassi, O.S. Multi-Objective Ant Colony Optimization: Review. Arch. Comput. Methods Eng. 2025, 32, 995–1037. [Google Scholar] [CrossRef] [Scilit]
- Cunha, M.; Marques, J. A New Multiobjective Simulated Annealing Algorithm—MOSA-GR: Application to the Optimal Design of Water Distribution Networks. Water Resour. Res. 2020, 56, e2019WR025852. [Google Scholar] [CrossRef] [Scilit]
- Deb, K.; Agrawal, S.; Pratap, A.; Meyarivan, T. A Fast Elitist Non-Dominated Sorting Genetic Algorithm for Multi-Objective Optimization: NSGA-II. In Parallel Problem Solving from Nature PPSN VI; Schoenauer, M., Deb, K., Rudolph, G., Yao, X., Lutton, E., Merelo, J.J., Schwefel, H.-P., Eds.; Springer: Berlin/Heidelberg, Germany, 2000; pp. 849–858. [Google Scholar]
- Deb, K.; Jain, H. An Evolutionary Many-Objective Optimization Algorithm Using Reference-Point-Based Nondominated Sorting Approach, Part I: Solving Problems with Box Constraints. IEEE Trans. Evol. Comput. 2014, 18, 577–601. [Google Scholar] [CrossRef] [Scilit]
- Wang, B.; Gong, Y.; Li, X.; Zhang, Y.; Li, Z. Multi-Objective Optimization of Urban Stormwater Systems. J. Environ. Manag. 2025, 386, 125671. [Google Scholar] [CrossRef] [Scilit] [PubMed]
- Pan, L.; Xu, W.; Li, L.; He, C.; Cheng, R. Adaptive Simulated Binary Crossover for Rotated Multi-Objective Optimization. Swarm Evol. Comput. 2021, 60, 100759. [Google Scholar] [CrossRef] [Scilit]
- Carles-Bou, J.L.; Galán, S.F. Self-Adaptive Polynomial Mutation in NSGA-II. Soft Comput. 2023, 27, 17711–17727. [Google Scholar] [CrossRef] [Scilit]
- Deb, K.; Agrawal, R.B. Others Simulated Binary Crossover for Continuous Search Space. Complex. Syst. 1995, 9, 115–148. [Google Scholar]
- Hamdan, M. The Distribution Index in Polynomial Mutation for Evolutionary Multiobjective Optimisation Algorithms: An Experimental Study. Proc. Int. Conf. Electron. Comput. Technol. 2012. [Google Scholar]
- Audet, C.; Bigeon, J.; Cartier, D.; Le Digabel, S.; Salomon, L. Performance Indicators in Multiobjective Optimization. Eur. J. Oper. Res. 2020, 292, 397–422. [Google Scholar] [CrossRef] [Scilit]
- Zitzler, E.; Deb, K.; Thiele, L. Comparison of Multiobjective Evolutionary Algorithms: Empirical Results. Evol. Comput. 2000, 8, 173–195. [Google Scholar] [CrossRef] [Scilit] [PubMed]
- Jiang, S.; Ong, Y.-S.; Zhang, J.; Feng, L. Consistencies and Contradictions of Performance Metrics in Multiobjective Optimization. IEEE Trans. Cybern. 2014, 44, 2391–2404. [Google Scholar] [CrossRef] [Scilit] [PubMed]
- Kahn, A.B. Topological Sorting of Large Networks. Commun. ACM 1962, 5, 558–562. [Google Scholar] [CrossRef] [Scilit]
- Satopaa, V.; Albrecht, J.; Irwin, D.; Raghavan, B. Finding a “Kneedle” in a Haystack: Detecting Knee Points in System Behavior. In Proceedings of the 2011 31st International Conference on Distributed Computing Systems Workshops; IEEE: Piscataway, NJ, USA, 2011; pp. 166–171. [Google Scholar]
- Yin, D.; Xu, T.; Li, K.; Leng, L.; Jia, H.; Sun, Z. Comprehensive Modelling and Cost-Benefit Optimization for Joint Regulation of Algae in Urban Water System. Environ. Pollut. 2022, 296, 118743. [Google Scholar] [CrossRef] [Scilit] [PubMed]
- Zou, J.; Chen, B.; Duan, C.; Wang, H. Assessing Economic Loss from Urban Waterlogging in Beijing under Climate Change Using a Hydraulic Model. Acs Sustain. Chem. Eng. 2024, 12, 13090–13105. [Google Scholar] [CrossRef] [Scilit]
- Wang, Q. Simulation and Reasearch of Control Algorithm for Drainage System Based on Reinforcement Learning. Master’s Thesis, Zhejiang University, Hangzhou, China, 2021. (In Chinese) [Google Scholar]
- Dumedah, G.; Berg, A.A.; Wineberg, M.; Collier, R. Selecting Model Parameter Sets from a Trade-off Surface Generated from the Non-Dominated Sorting Genetic Algorithm-II. Water Resour. Manag. 2010, 24, 4469–4489. [Google Scholar] [CrossRef] [Scilit]
- Kong, Y.; Mei, Y.; Wang, X.; Ben, Y. Solution Selection from a Pareto Optimal Set of Multi-Objective Reservoir Operation via Clustering Operation Processes and Objective Values. Water 2021, 13, 1046. [Google Scholar] [CrossRef] [Scilit]
- Luo, X.; Liu, P.; Cheng, Q.; Liu, W.; Zhou, C.; Zheng, Y.; Wang, D.; Cheng, L. Reinforcing Resilience for Integrated Design of Green and Grey Infrastructure with Real-Time Control Rules by Considering System Failures. J. Hydrol. 2024, 638, 131498. [Google Scholar] [CrossRef] [Scilit]
- Qiao, Y.; Hu, F.; Xiong, W.; Guo, Z.; Zhou, X.; Li, Y. Multi-Objective Optimization of Integrated Energy System Considering Installation Configuration. Energy 2023, 263, 125785. [Google Scholar] [CrossRef] [Scilit]
- Cha, C.; Park, H. ECS-NBS: Exact Computation of Sequential Nash Bargaining Solutions. IEEE Trans. Veh. Technol. 2022, 71, 13453–13457. [Google Scholar] [CrossRef] [Scilit]
- Shen, Y.; Ma, X.; Kou, G.; Rodríguez, R.M.; Zhan, J. Consensus Methods with Nash and Kalai–Smorodinsky Bargaining Game for Large-Scale Group Decision-Making. Eur. J. Oper. Res. 2025, 321, 865–883. [Google Scholar] [CrossRef] [Scilit]
- Degefu, D.M.; He, W.; Yuan, L.; Zhao, J.H. Water Allocation in Transboundary River Basins under Water Scarcity: A Cooperative Bargaining Approach. Water Resour. Manag. 2016, 30, 4451–4466. [Google Scholar] [CrossRef] [Scilit]
- Lorenti, G.; Lazzeroni, P.; Repetto, M. A Game Theory Approach to the Multi-Objective Design of Renewable Energy Communities. In Proceedings of the 2024 International Conference on Smart Energy Systems and Technologies (SEST), Torino, Italy, 10–12 September 2024; IEEE: Piscataway, NJ, USA, 2024; pp. 1–6. [Google Scholar] [CrossRef] [Scilit]
- Rezaei, J. Piecewise Linear Value Functions for Multi-Criteria Decision-Making. Expert Syst. Appl. 2018, 98, 43–56. [Google Scholar] [CrossRef] [Scilit]
- Cinelli, M.; Kadziński, M.; Gonzalez, M.; Słowiński, R. How to Support the Application of Multiple Criteria Decision Analysis? Let Us Start with a Comprehensive Taxonomy. Omega 2020, 96, 102261. [Google Scholar] [CrossRef] [Scilit] [PubMed]
- Jiang, S.; Li, H.; Guo, J.; Zhong, M.; Yang, S.; Kaiser, M.; Krasnogor, N. AREA: Adaptive Reference-set Based Evolutionary Algorithm for Multiobjective Optimisation. arXiv 2019, arXiv:1910.07491. [Google Scholar] [CrossRef] [Scilit]
- Yuan, Y.; Banzhaf, W. Expensive Multiobjective Evolutionary Optimization Assisted by Dominance Prediction. IEEE Trans. Evol. Comput. 2022, 26, 159–173. [Google Scholar] [CrossRef] [Scilit]
- Ding, Y.; Wang, H.; Liu, Y.; Chai, B.; Bin, C. The Spatial Overlay Effect of Urban Waterlogging Risk and Land Use Value. Sci. Total Environ. 2024, 947, 174290. [Google Scholar] [CrossRef] [Scilit] [PubMed]
- Li, W.; Jiang, R.; Wu, H.; Xie, J.; Zhao, Y.; Li, F.; Gan, T.Y. An Integrated Urban Flooding Risk Analysis Framework Leveraging Machine Learning Models: A Case Study of Xi’an, China. Int. J. Disaster Risk Reduct. 2024, 112, 104770. [Google Scholar] [CrossRef] [Scilit]
- Zheng, F.; Westra, S.; Leonard, M. Opposing Local Precipitation Extremes. Nat. Clim. Change 2015, 5, 389–390. [Google Scholar] [CrossRef] [Scilit]
- Seyedashraf, O.; Bottacin-Busolin, A.; Harou, J.J. Many-Objective Optimization of Sustainable Drainage Systems in Urban Areas with Different Surface Slopes. Water Resour. Manag. 2021, 35, 2449–2464. [Google Scholar] [CrossRef] [Scilit]
- Yang, J.; Zhang, Z.; Wang, Y.; Zhao, Z. Optimization of climate adaptability for low-impact development stormwater drainage systems based on CMIP6. Water Resour. Hydropower Eng. 2025, 56, 111. (In Chinese) [Google Scholar] [CrossRef]
- Ji, J.; Wang, D. Evaluation Analysis and Strategy Selection in Urban Flood Resilience Based on EWM-TOPSIS Method and Graph Model. J. Clean. Prod. 2023, 425, 138955. [Google Scholar] [CrossRef] [Scilit]
- Shehata, M.; Abdelnaeem, M.; Mokhiamar, O. Integrated Multiple Criteria Decision-Making Framework for Ranking Pareto Optimal Solutions of the Multiobjective Optimization Problem of Tuned Mass Dampers. Ocean Eng. 2023, 278, 114440. [Google Scholar] [CrossRef] [Scilit]
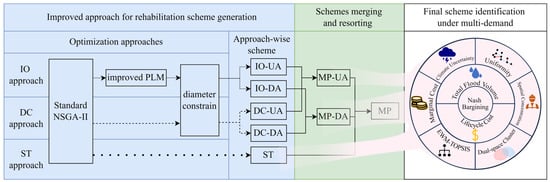
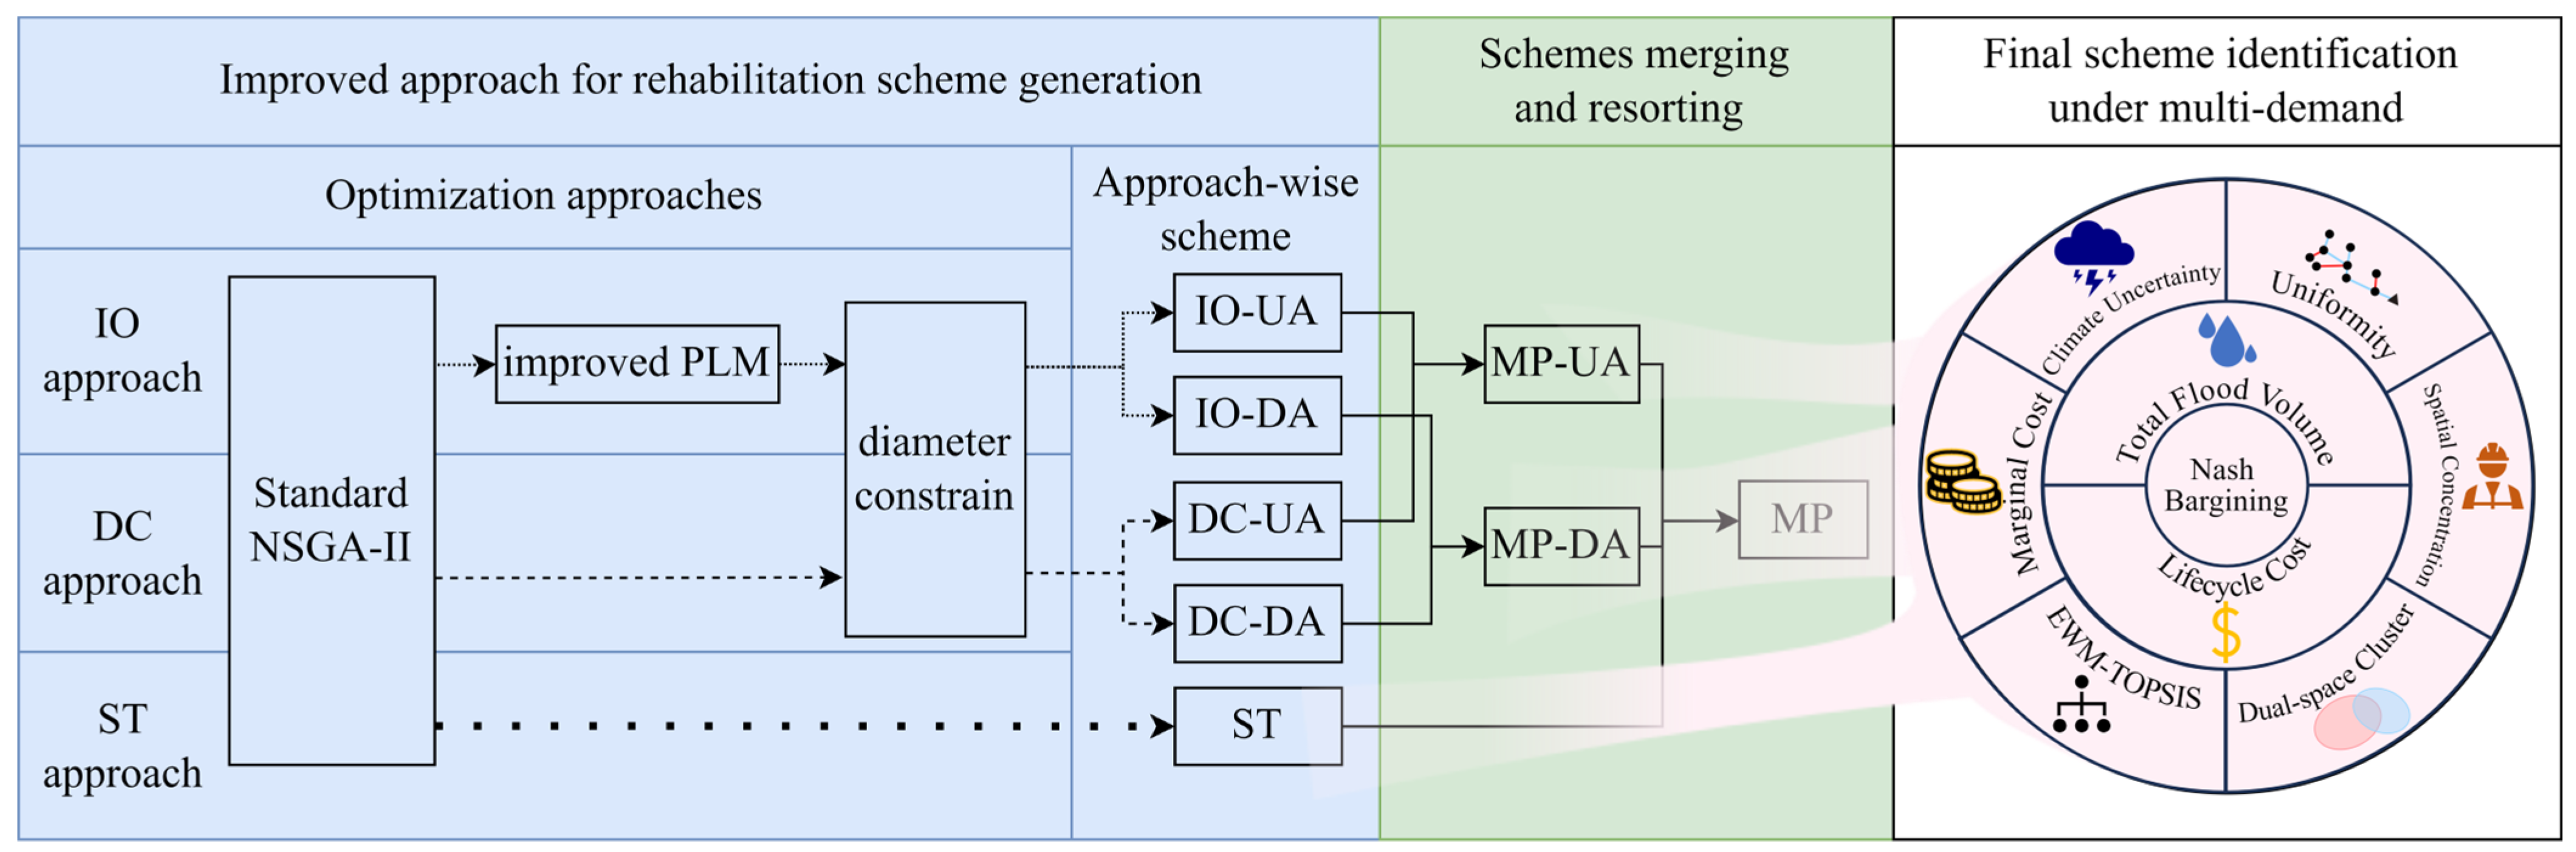
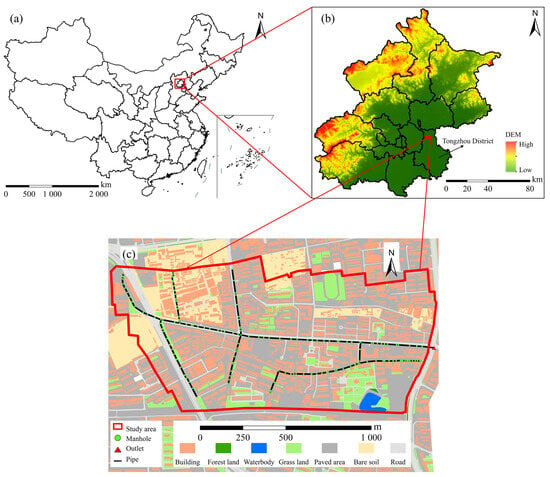
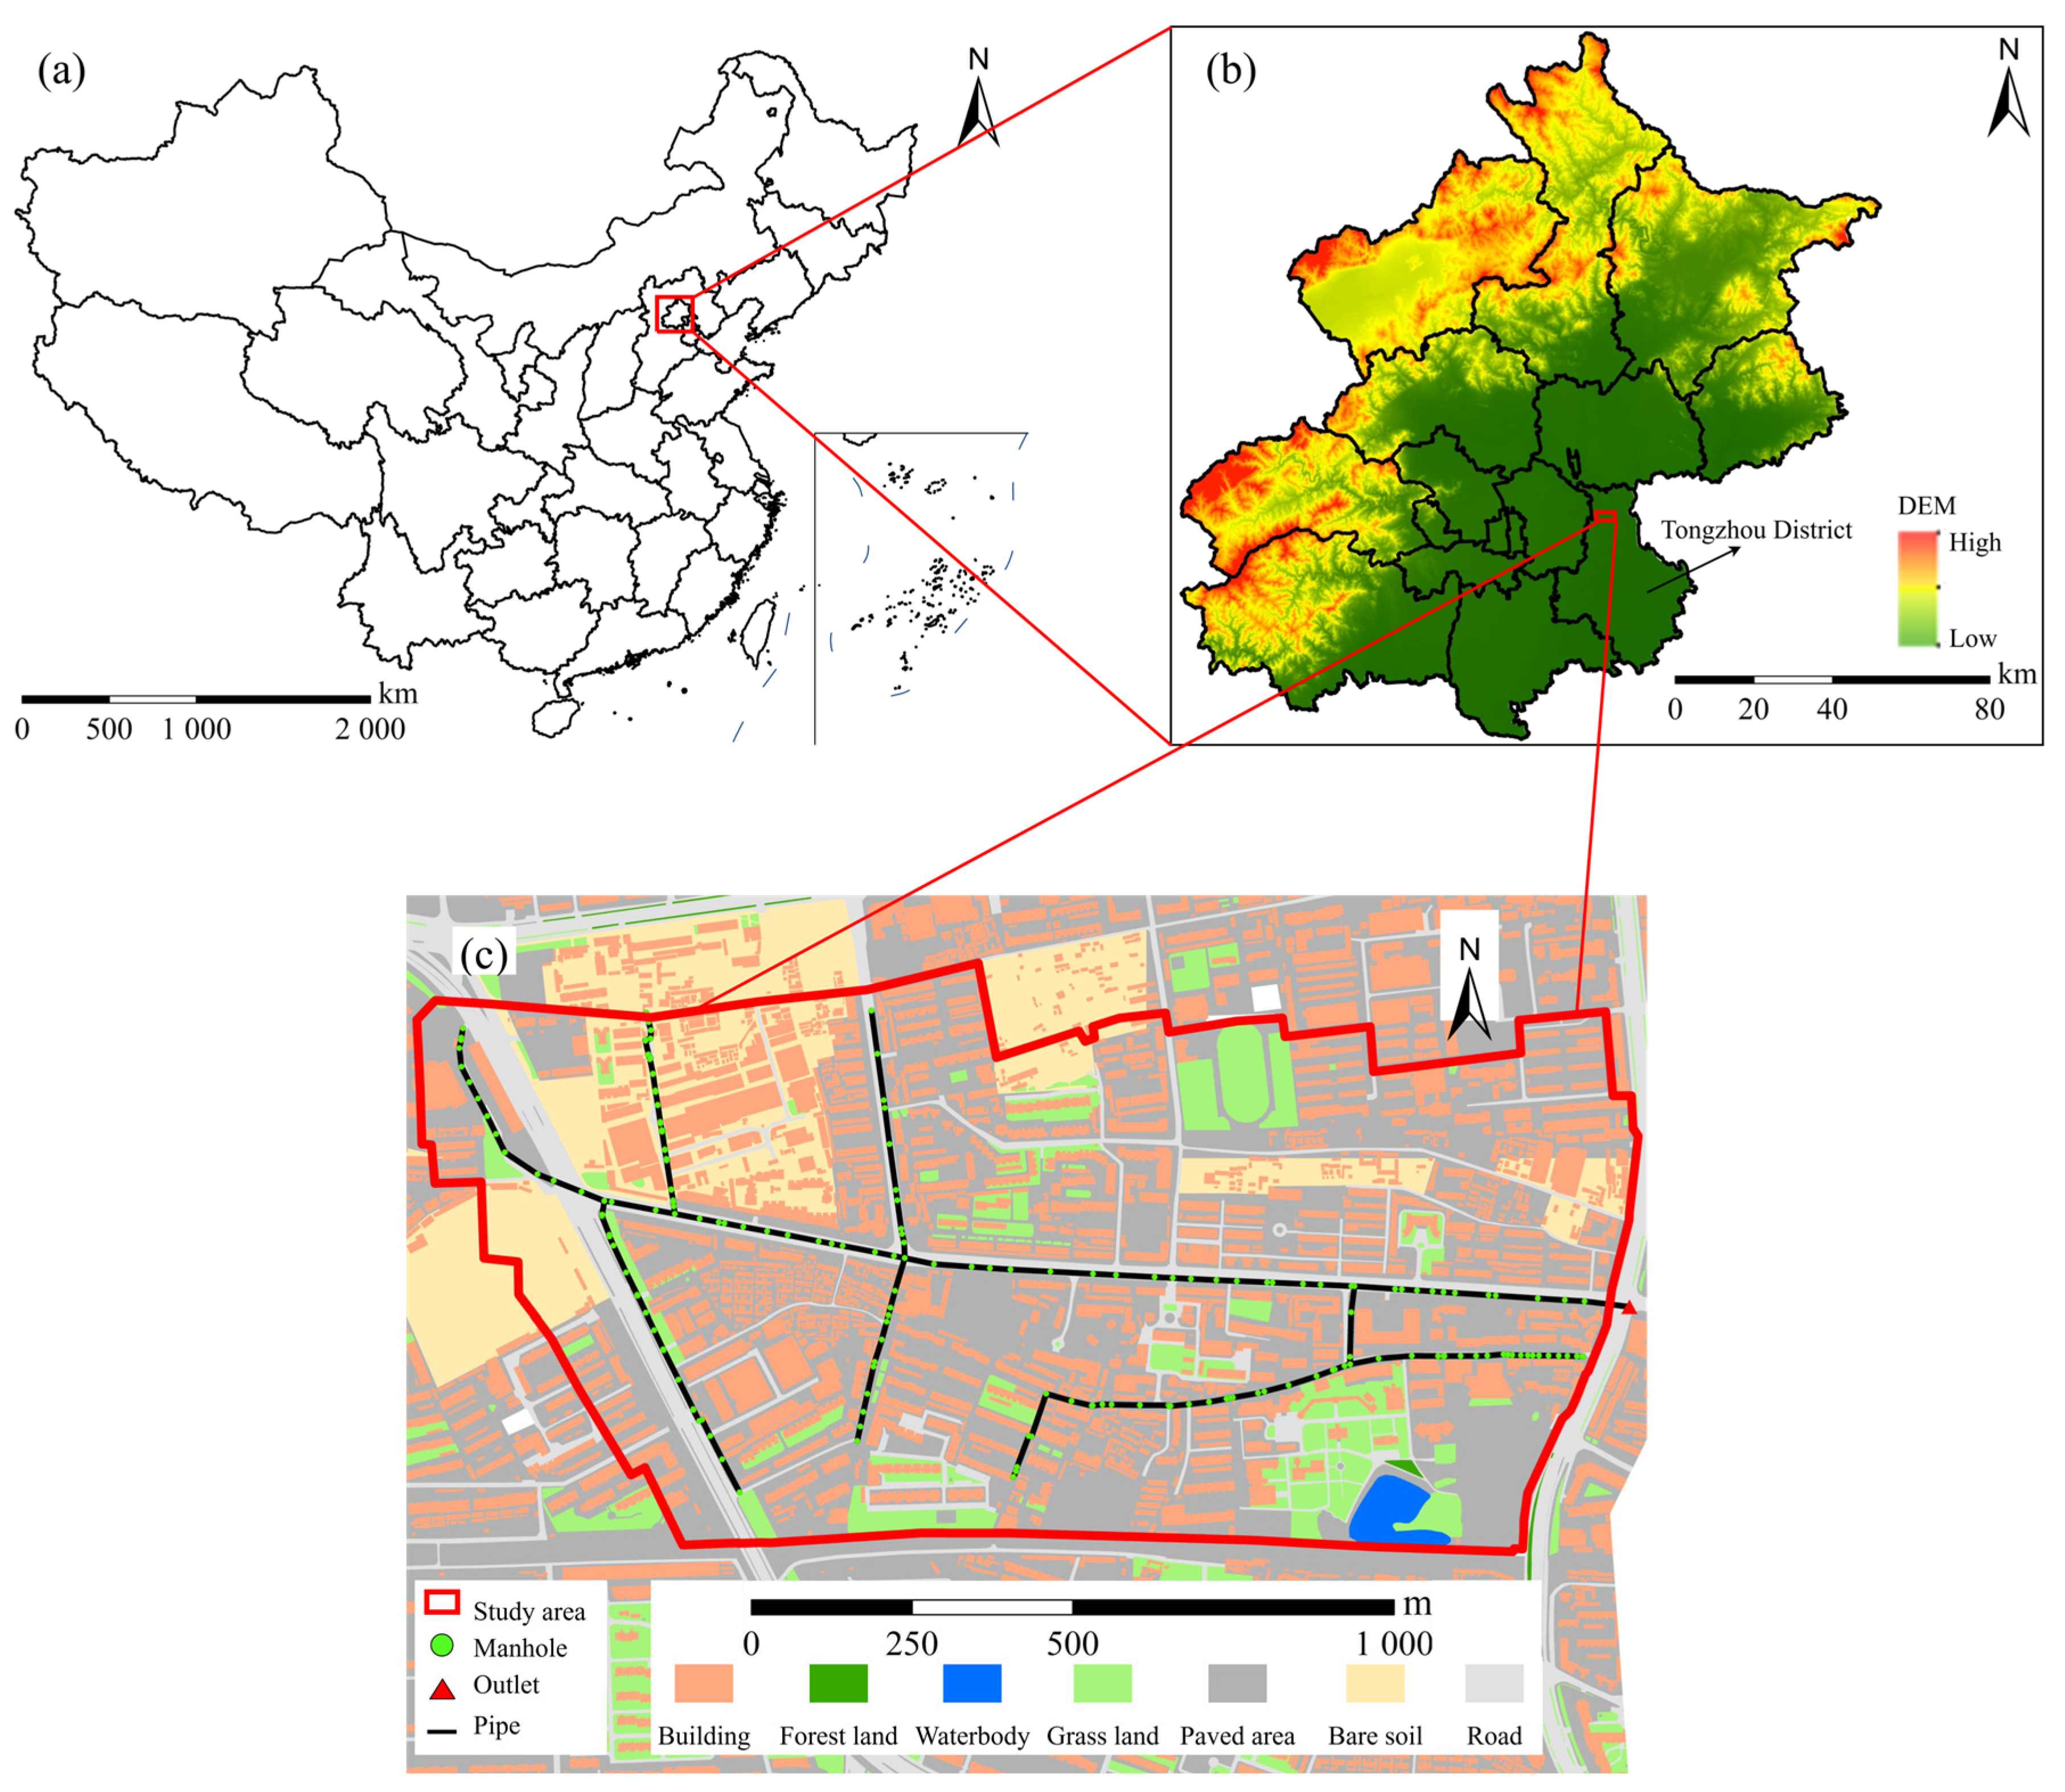
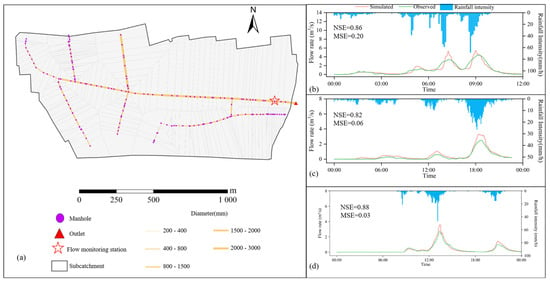
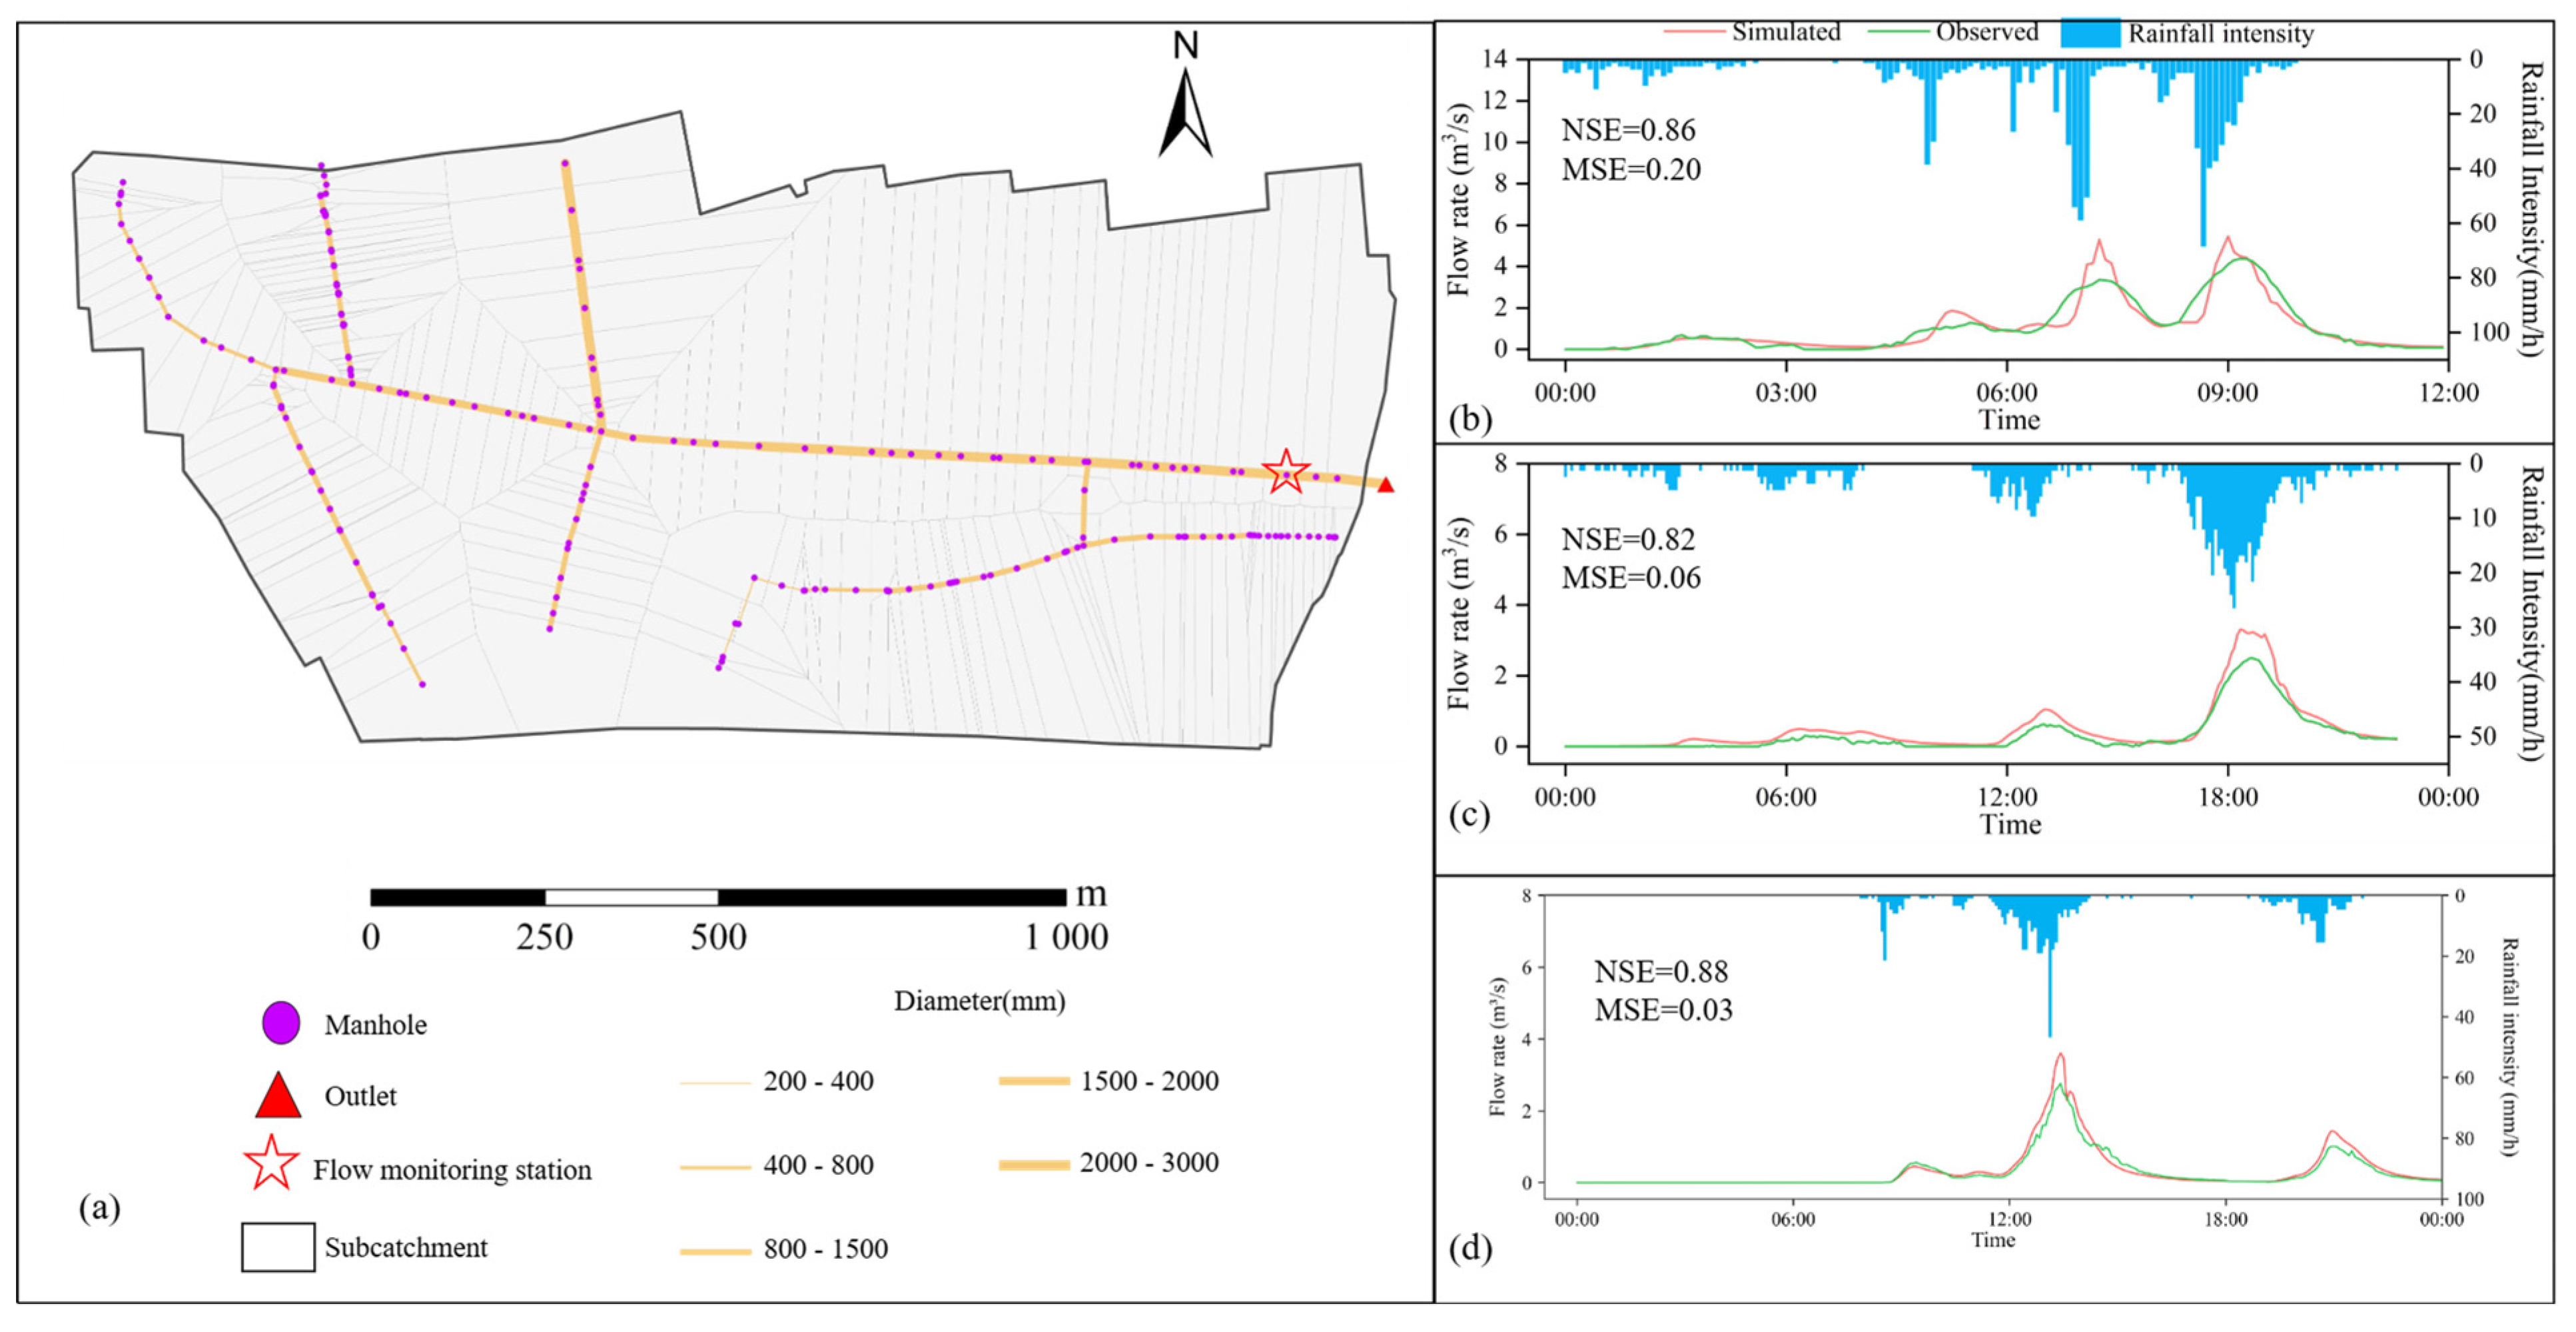
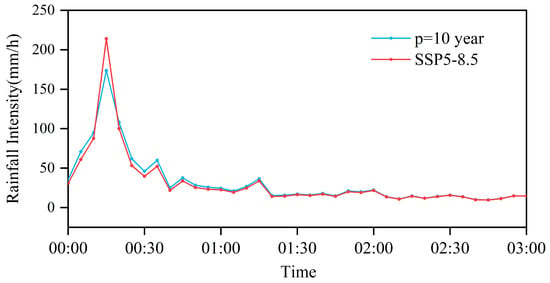
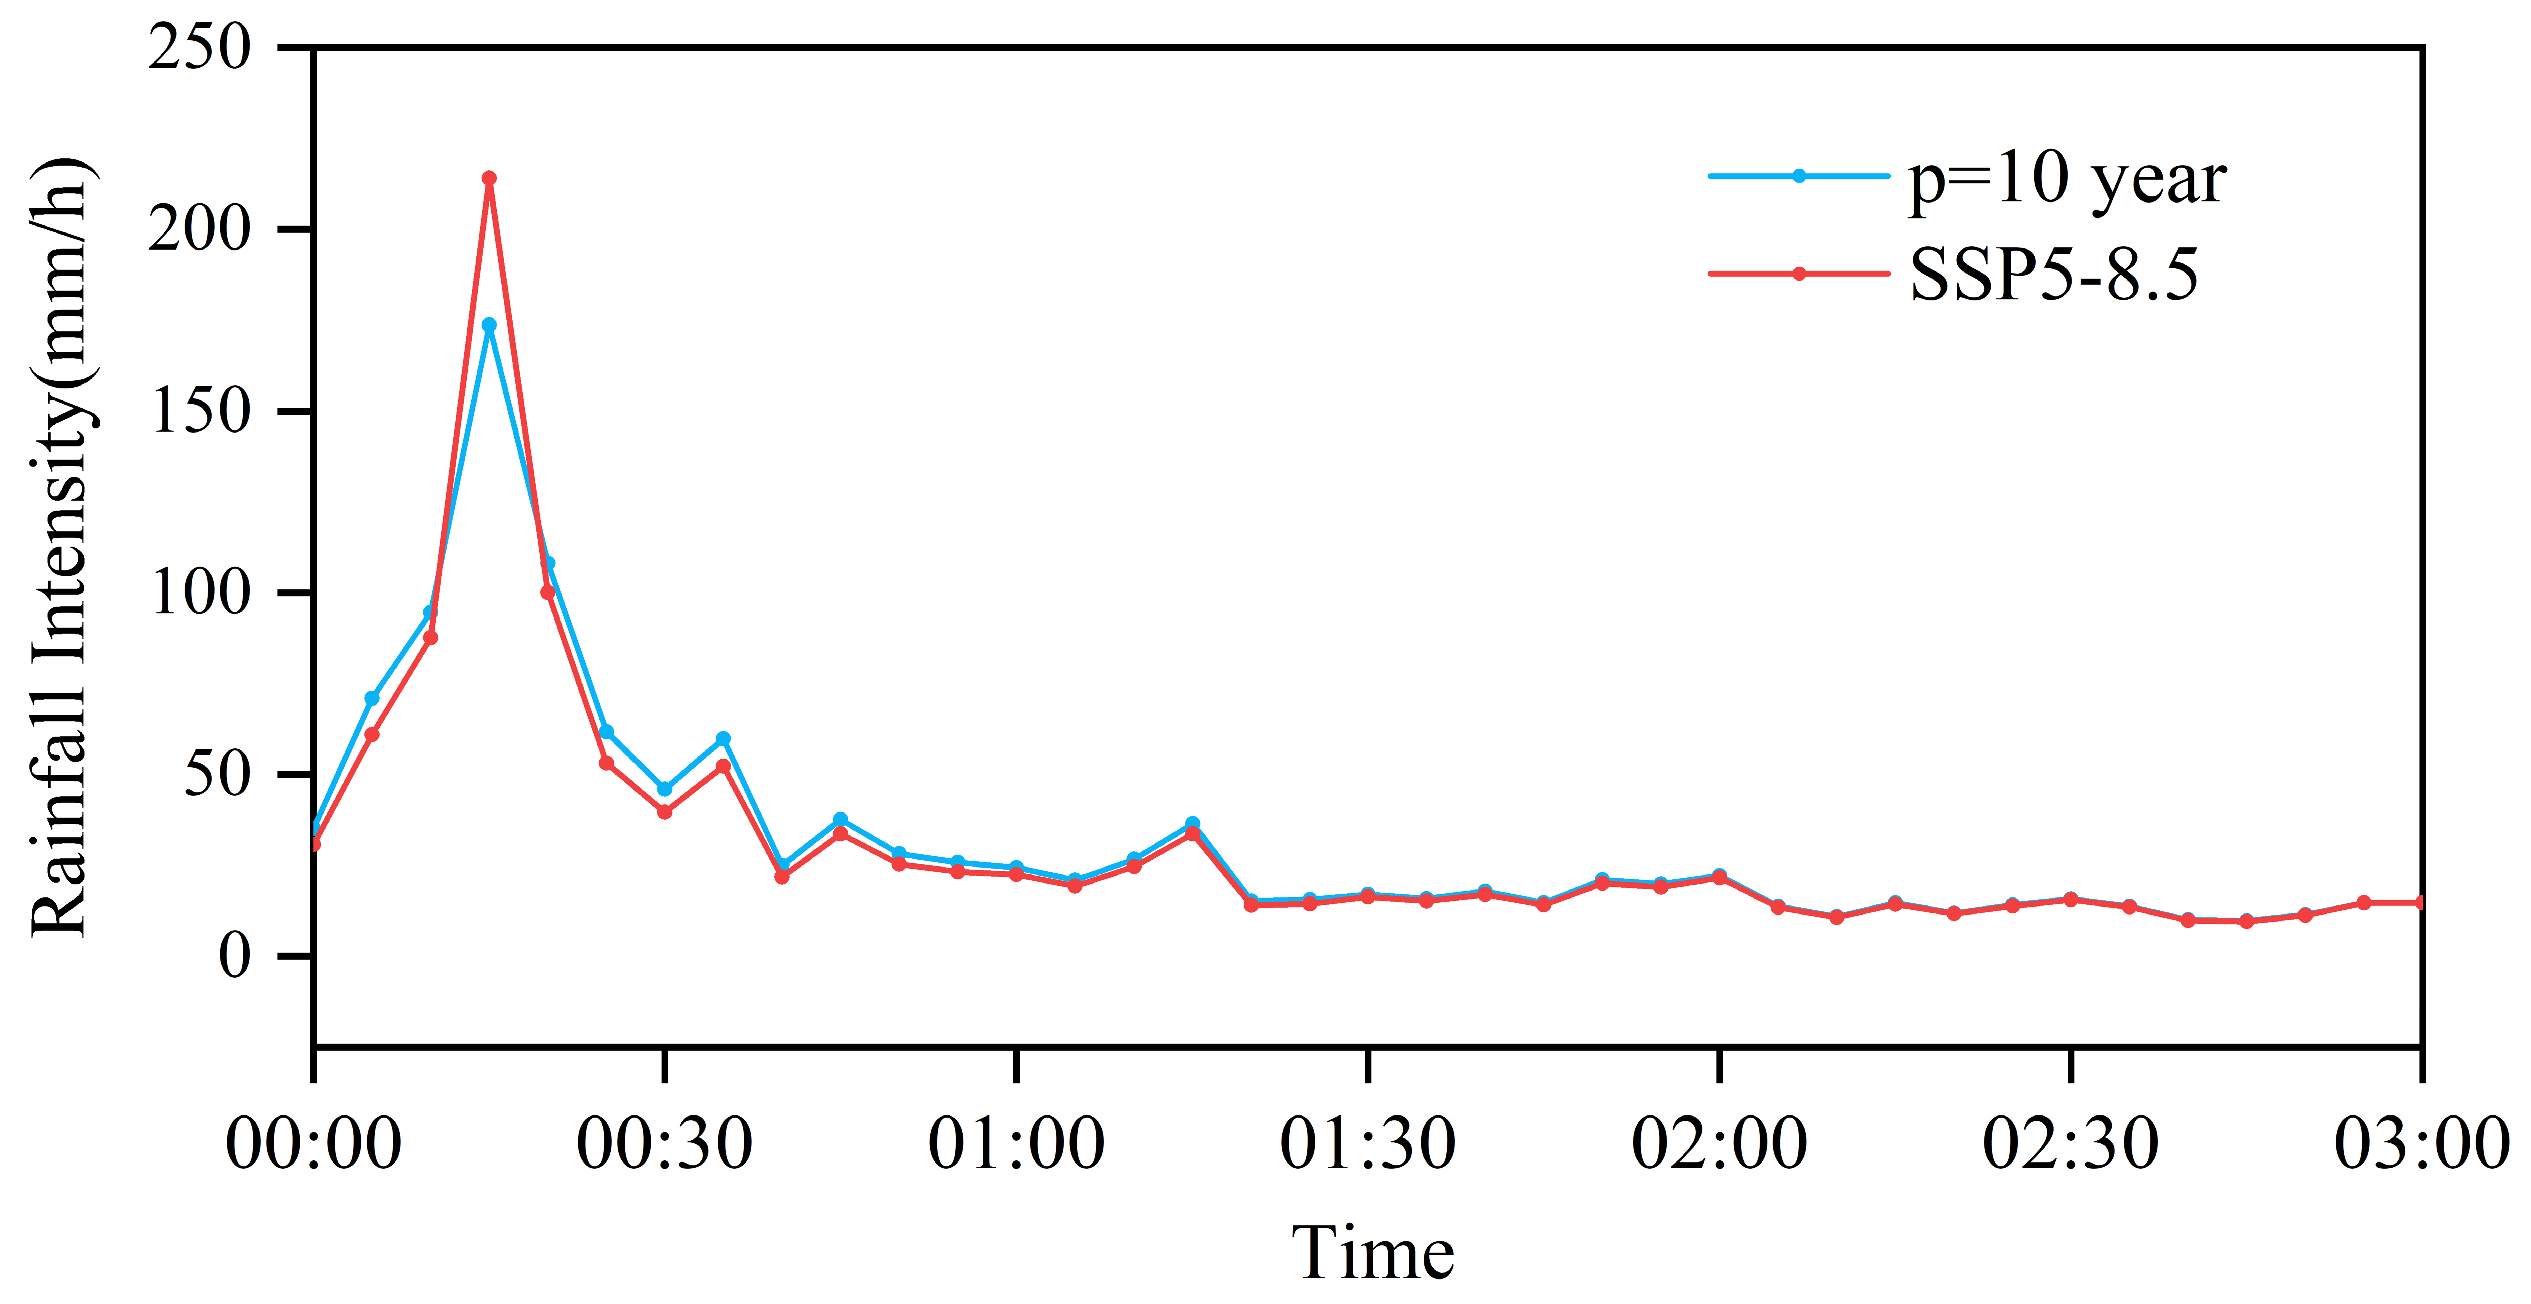
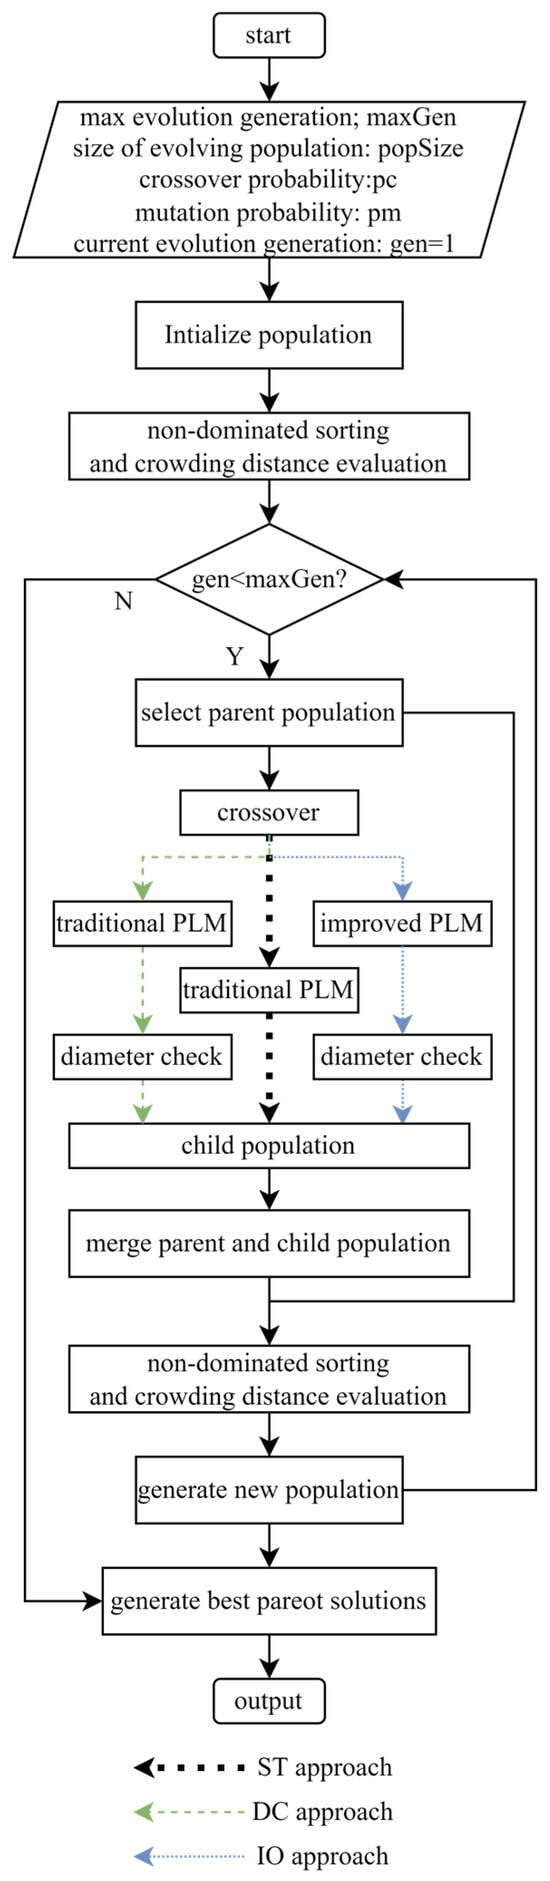
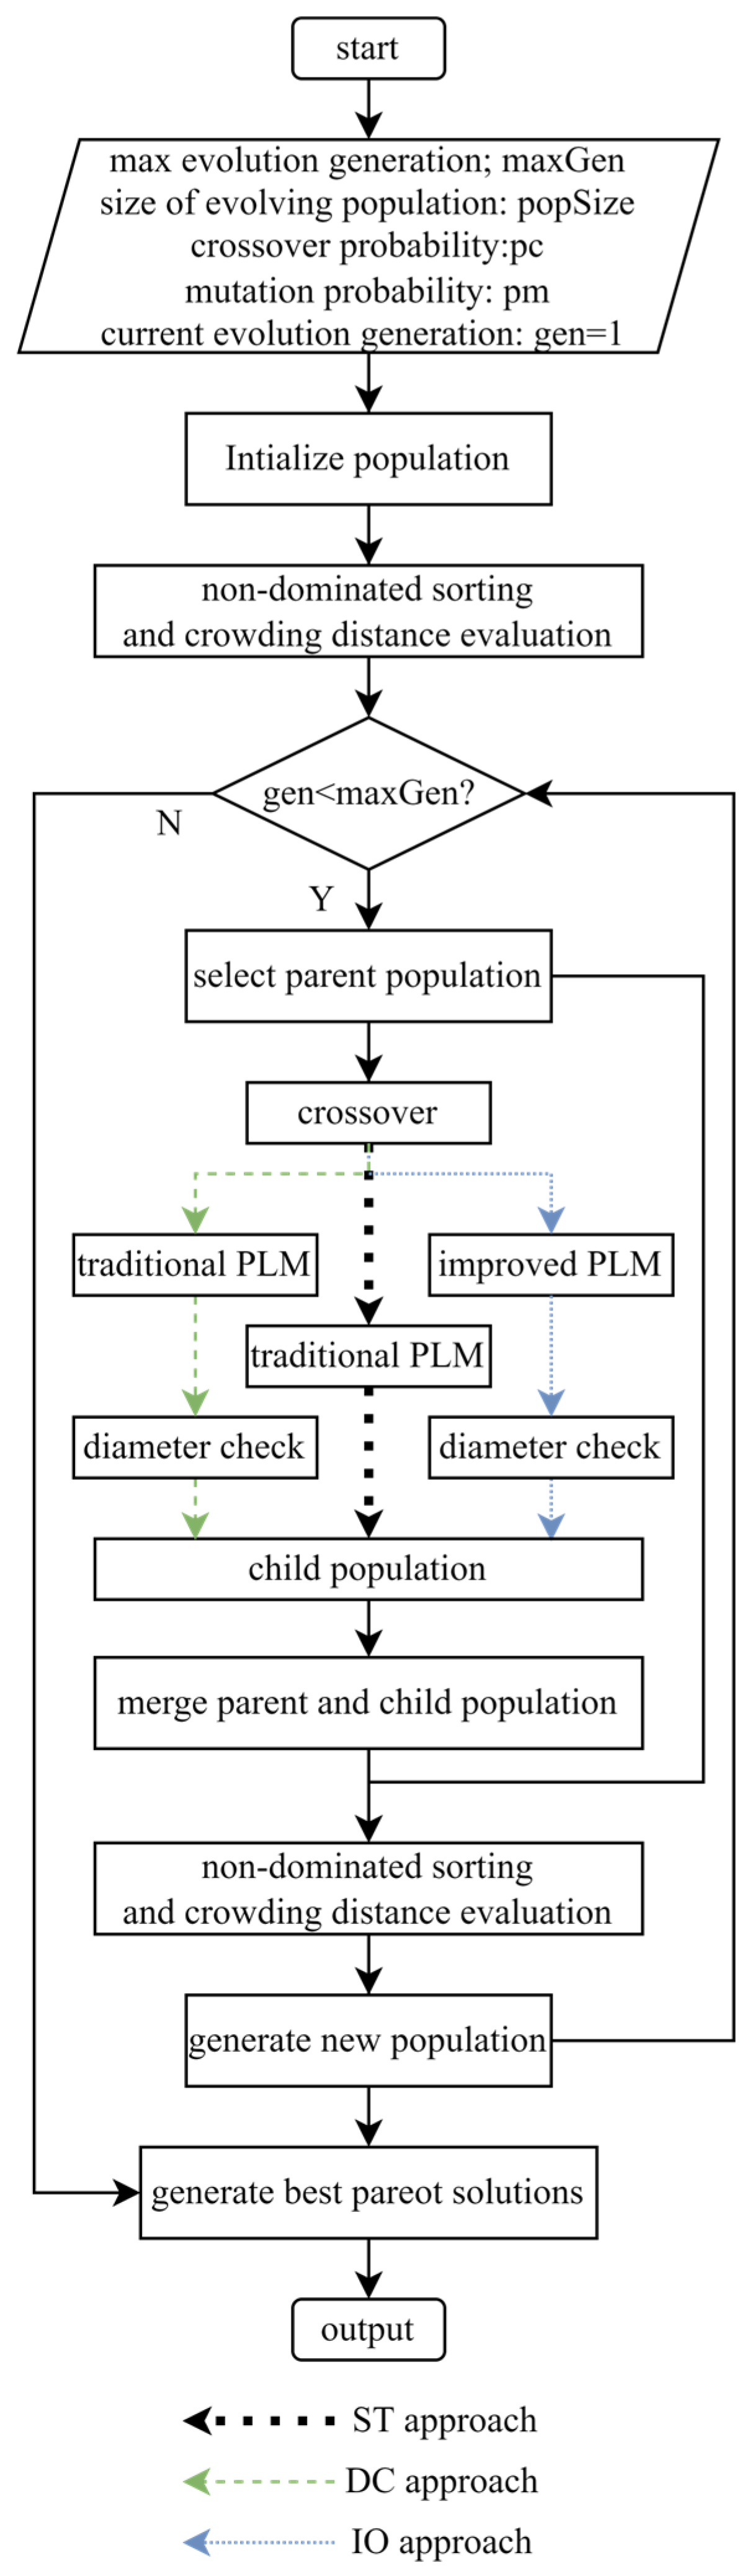
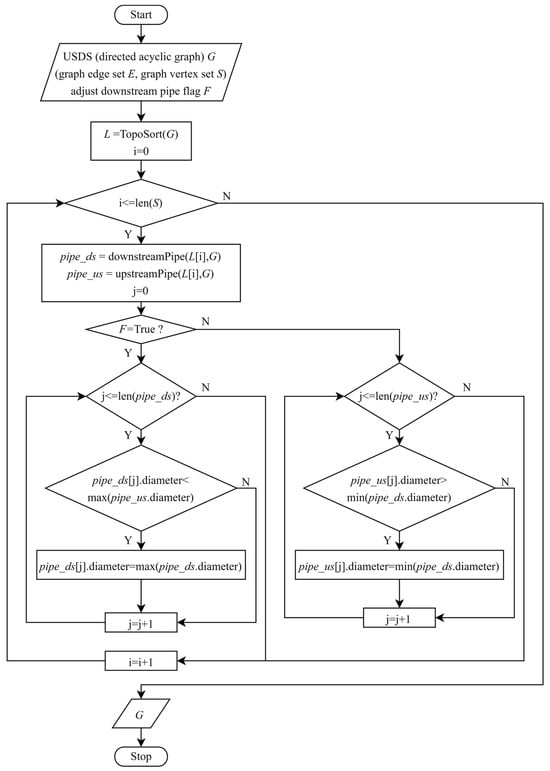
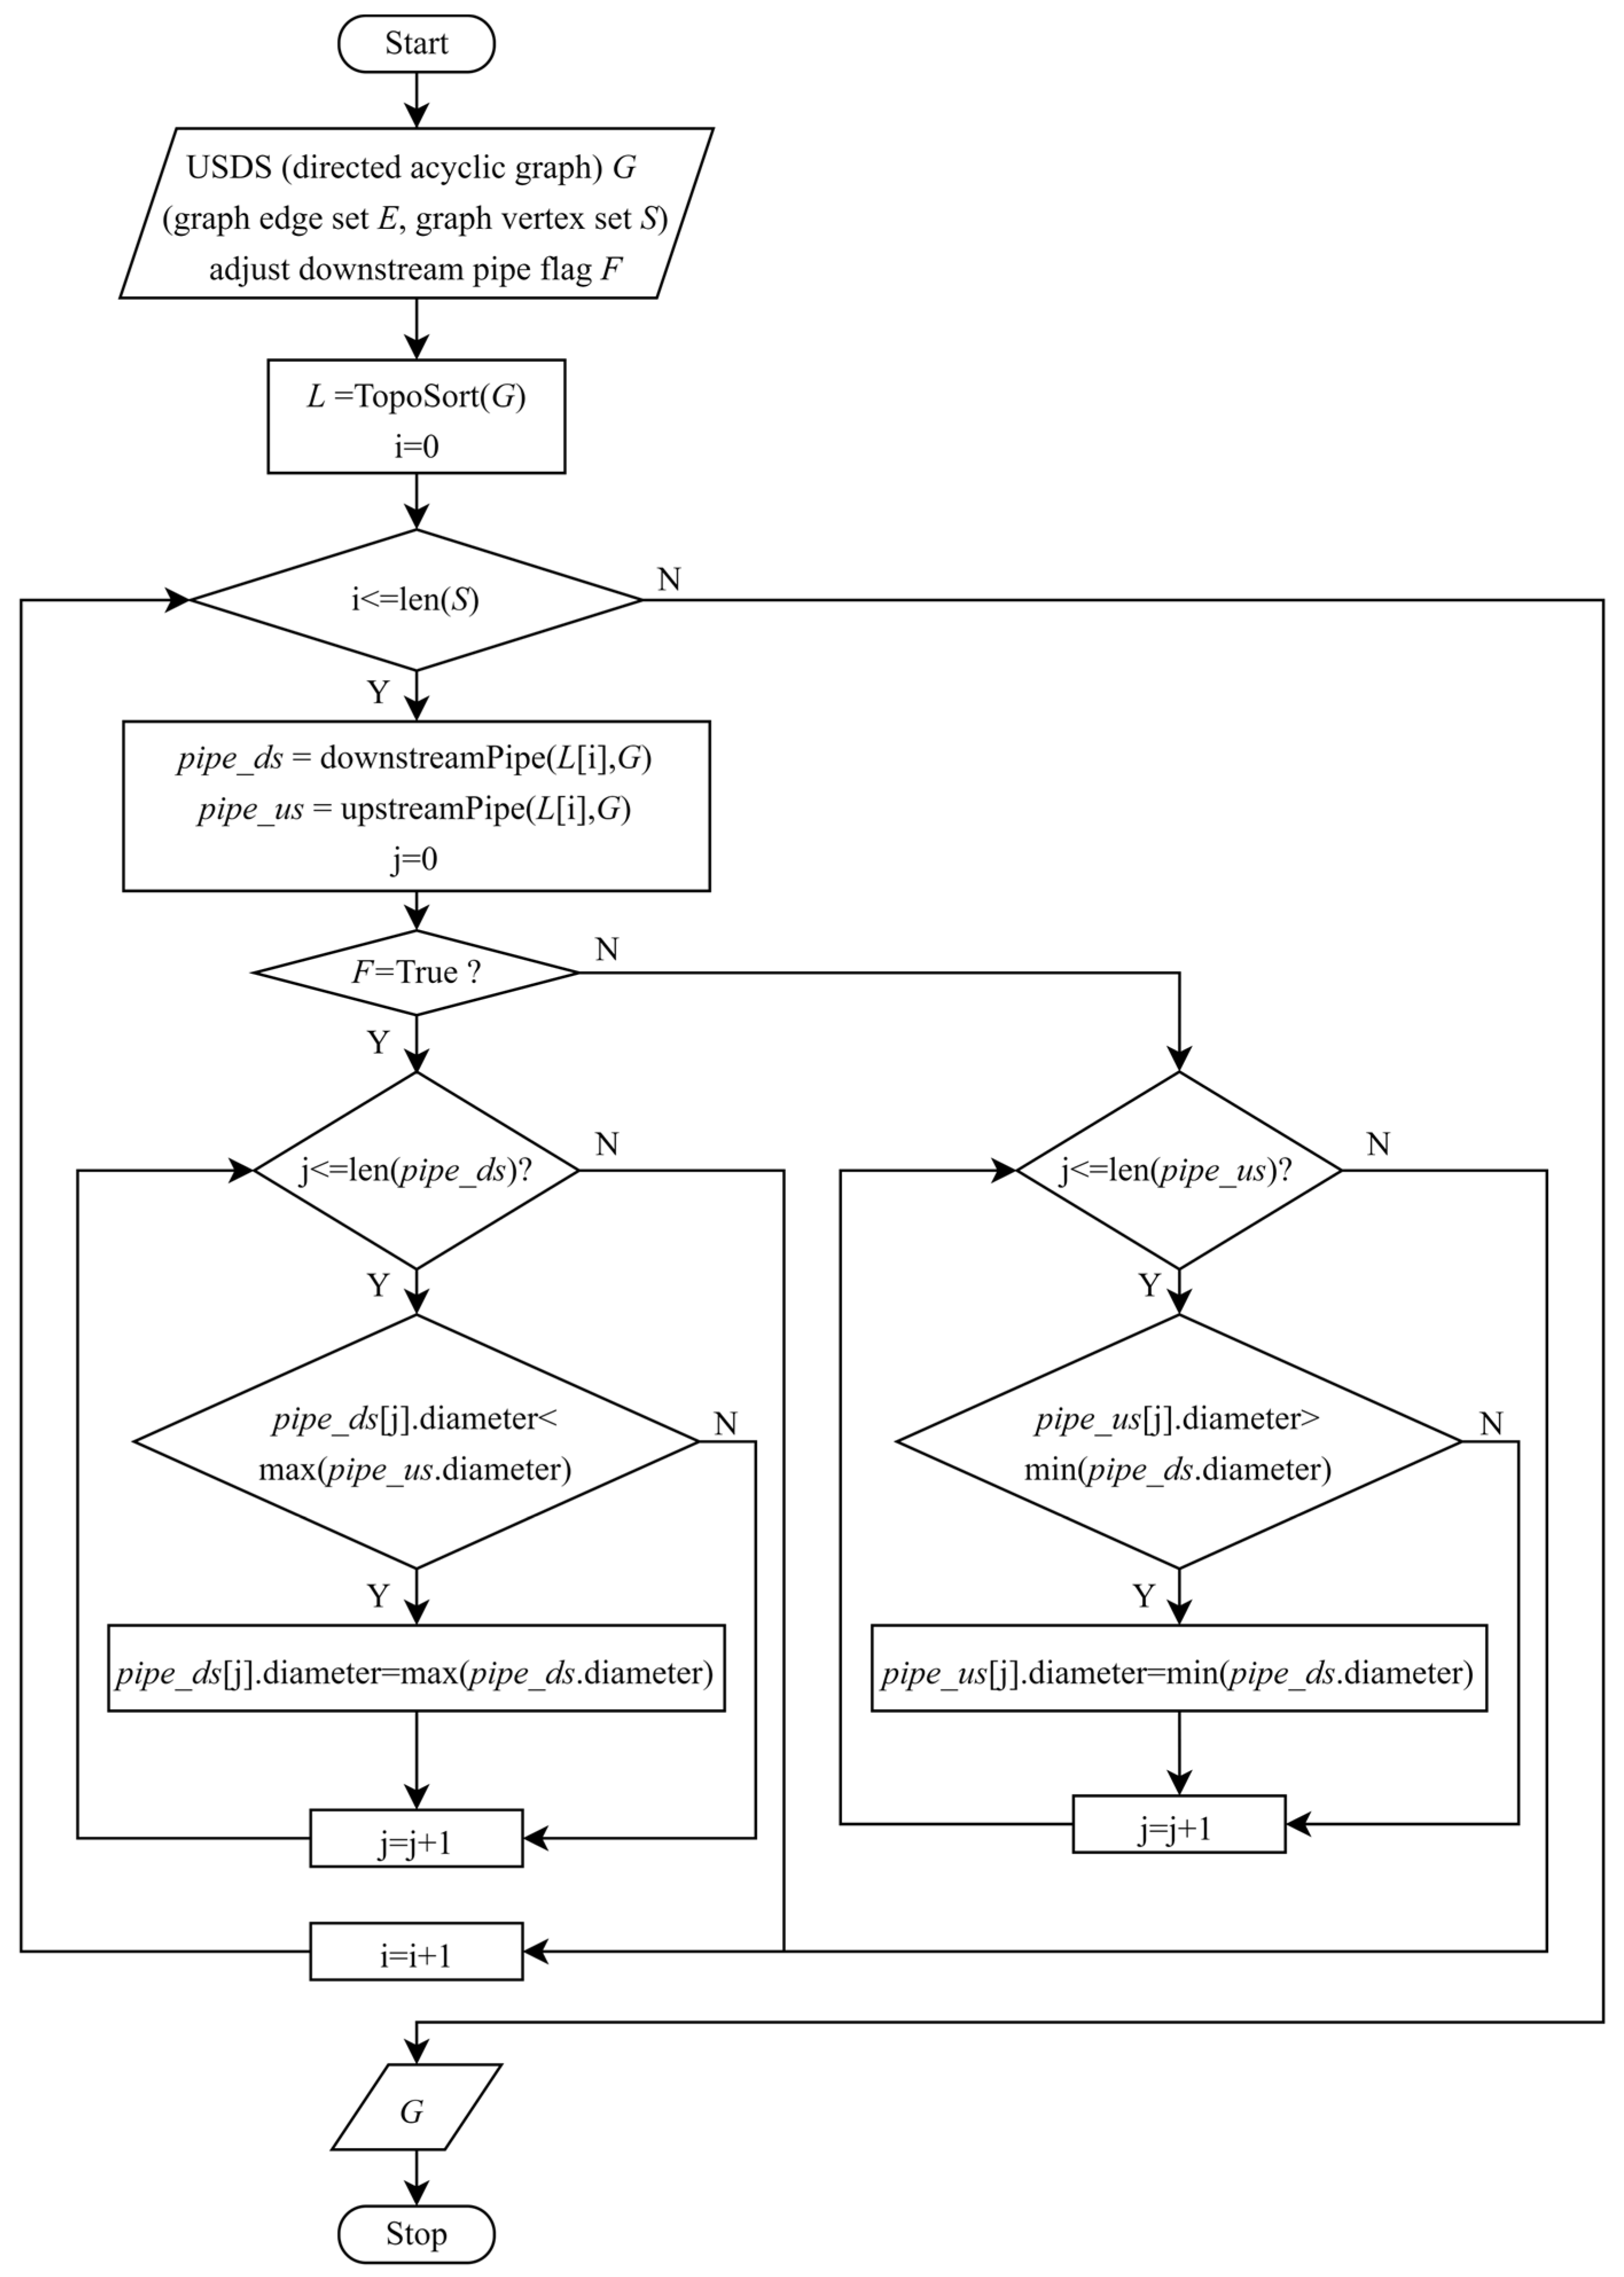
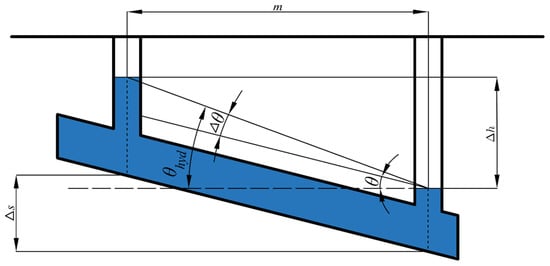
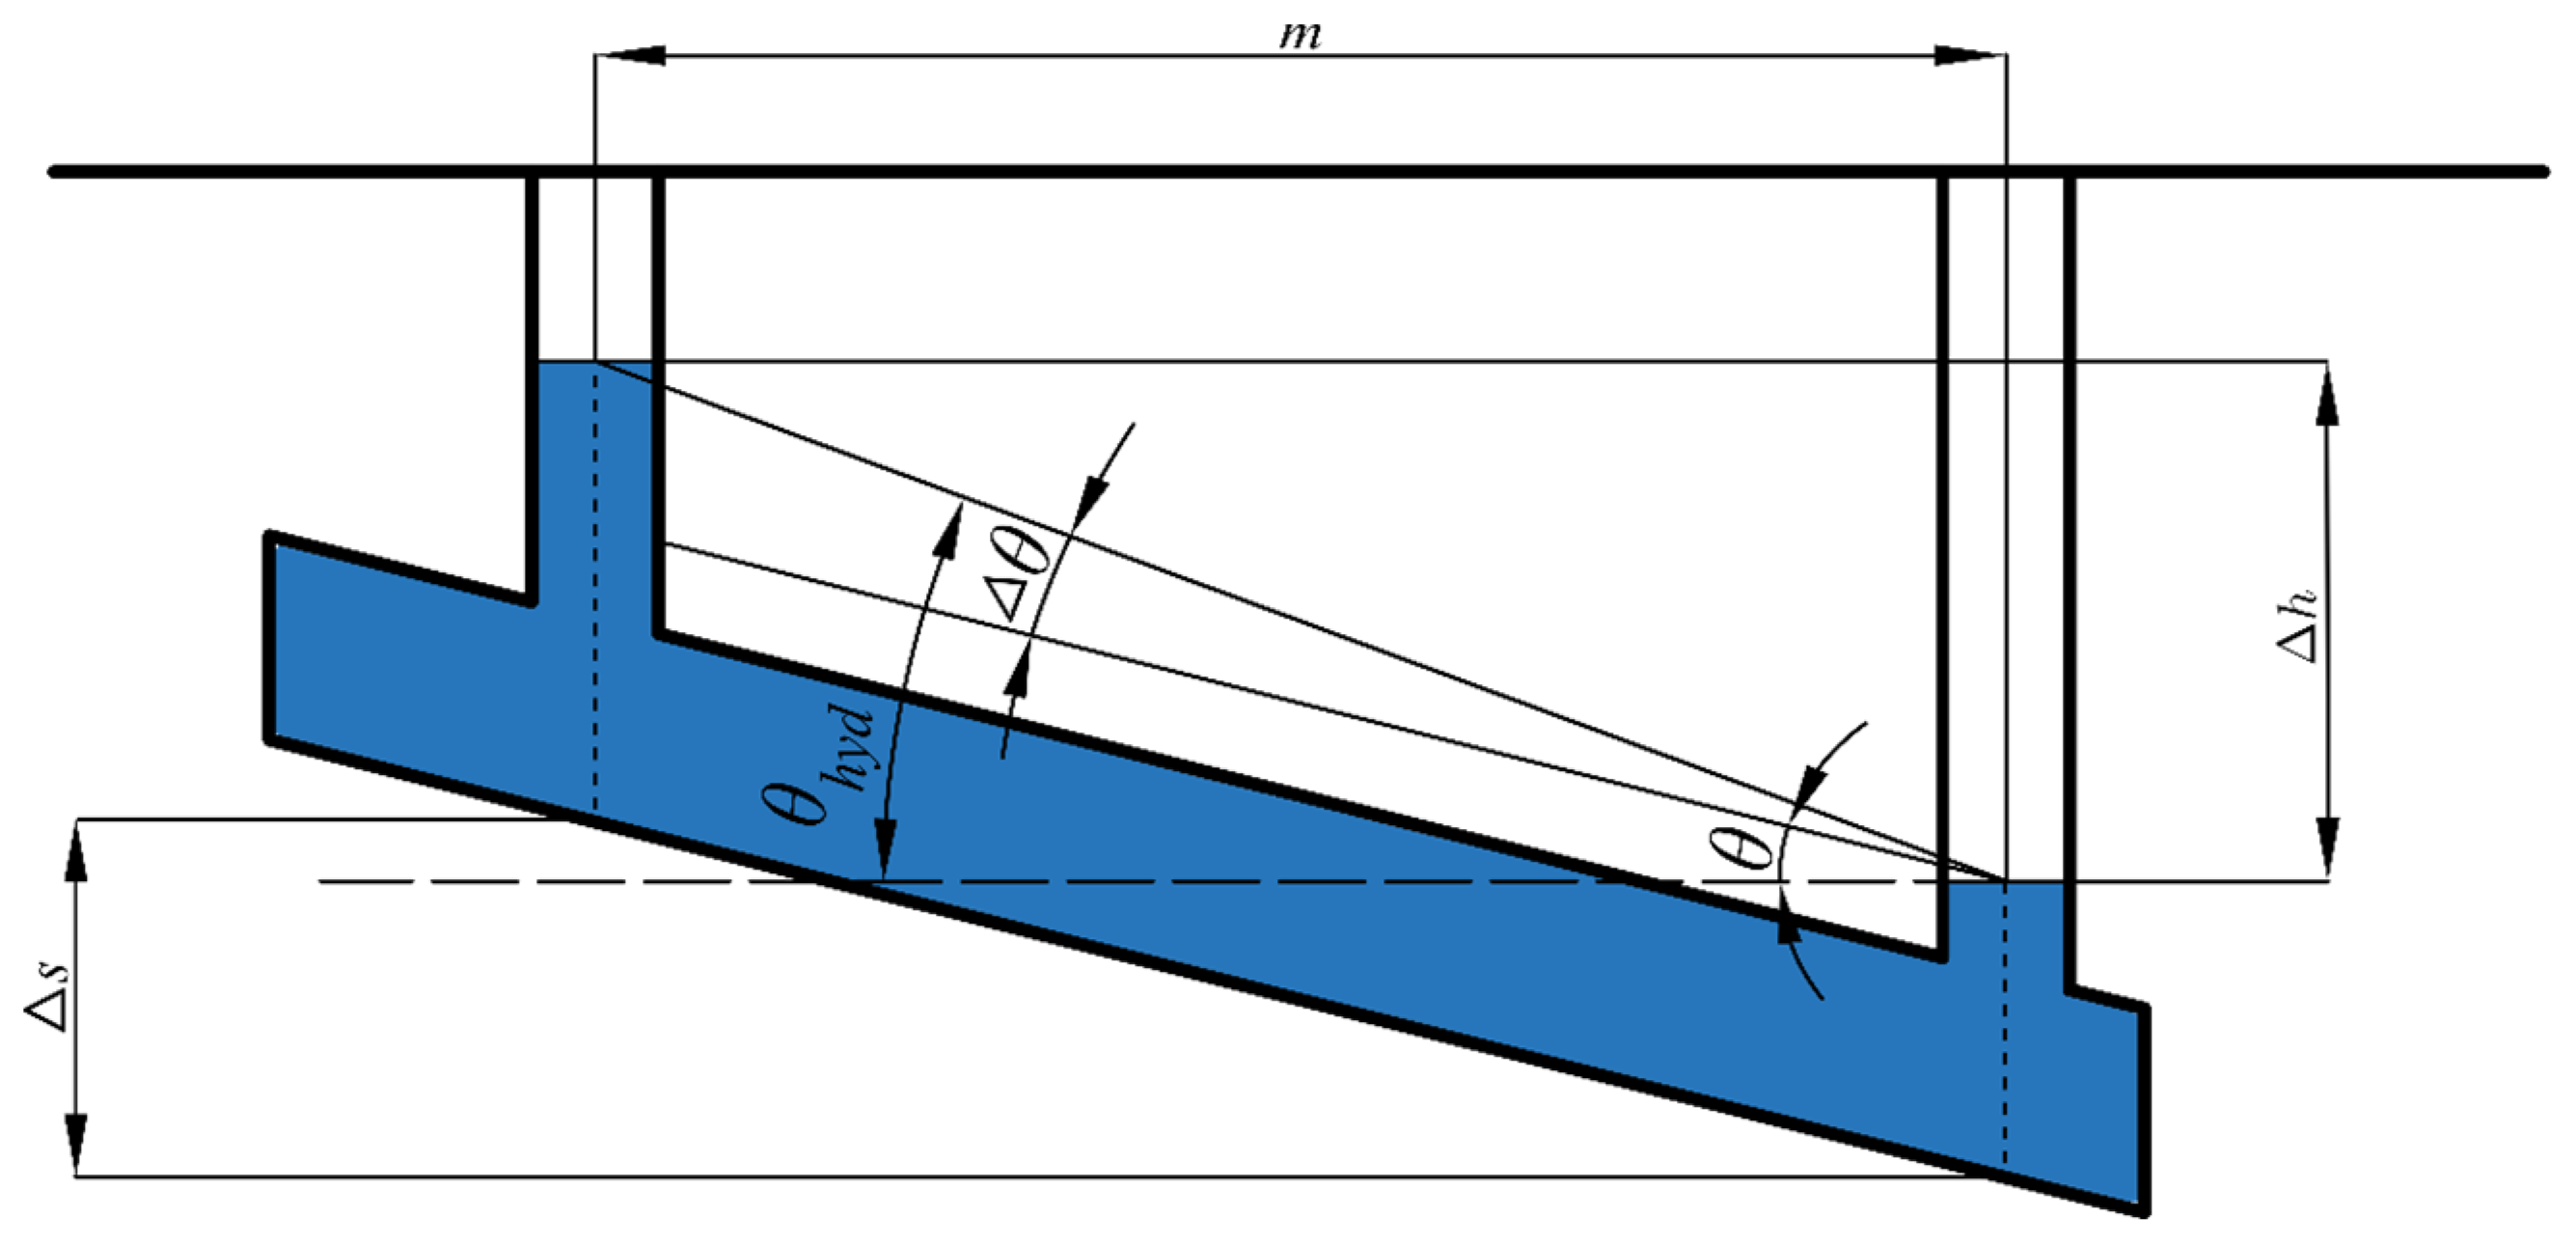
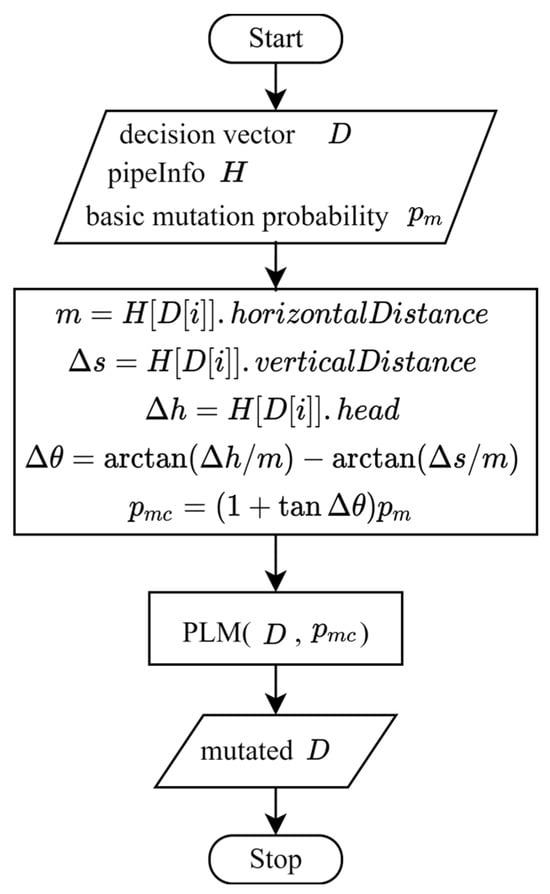
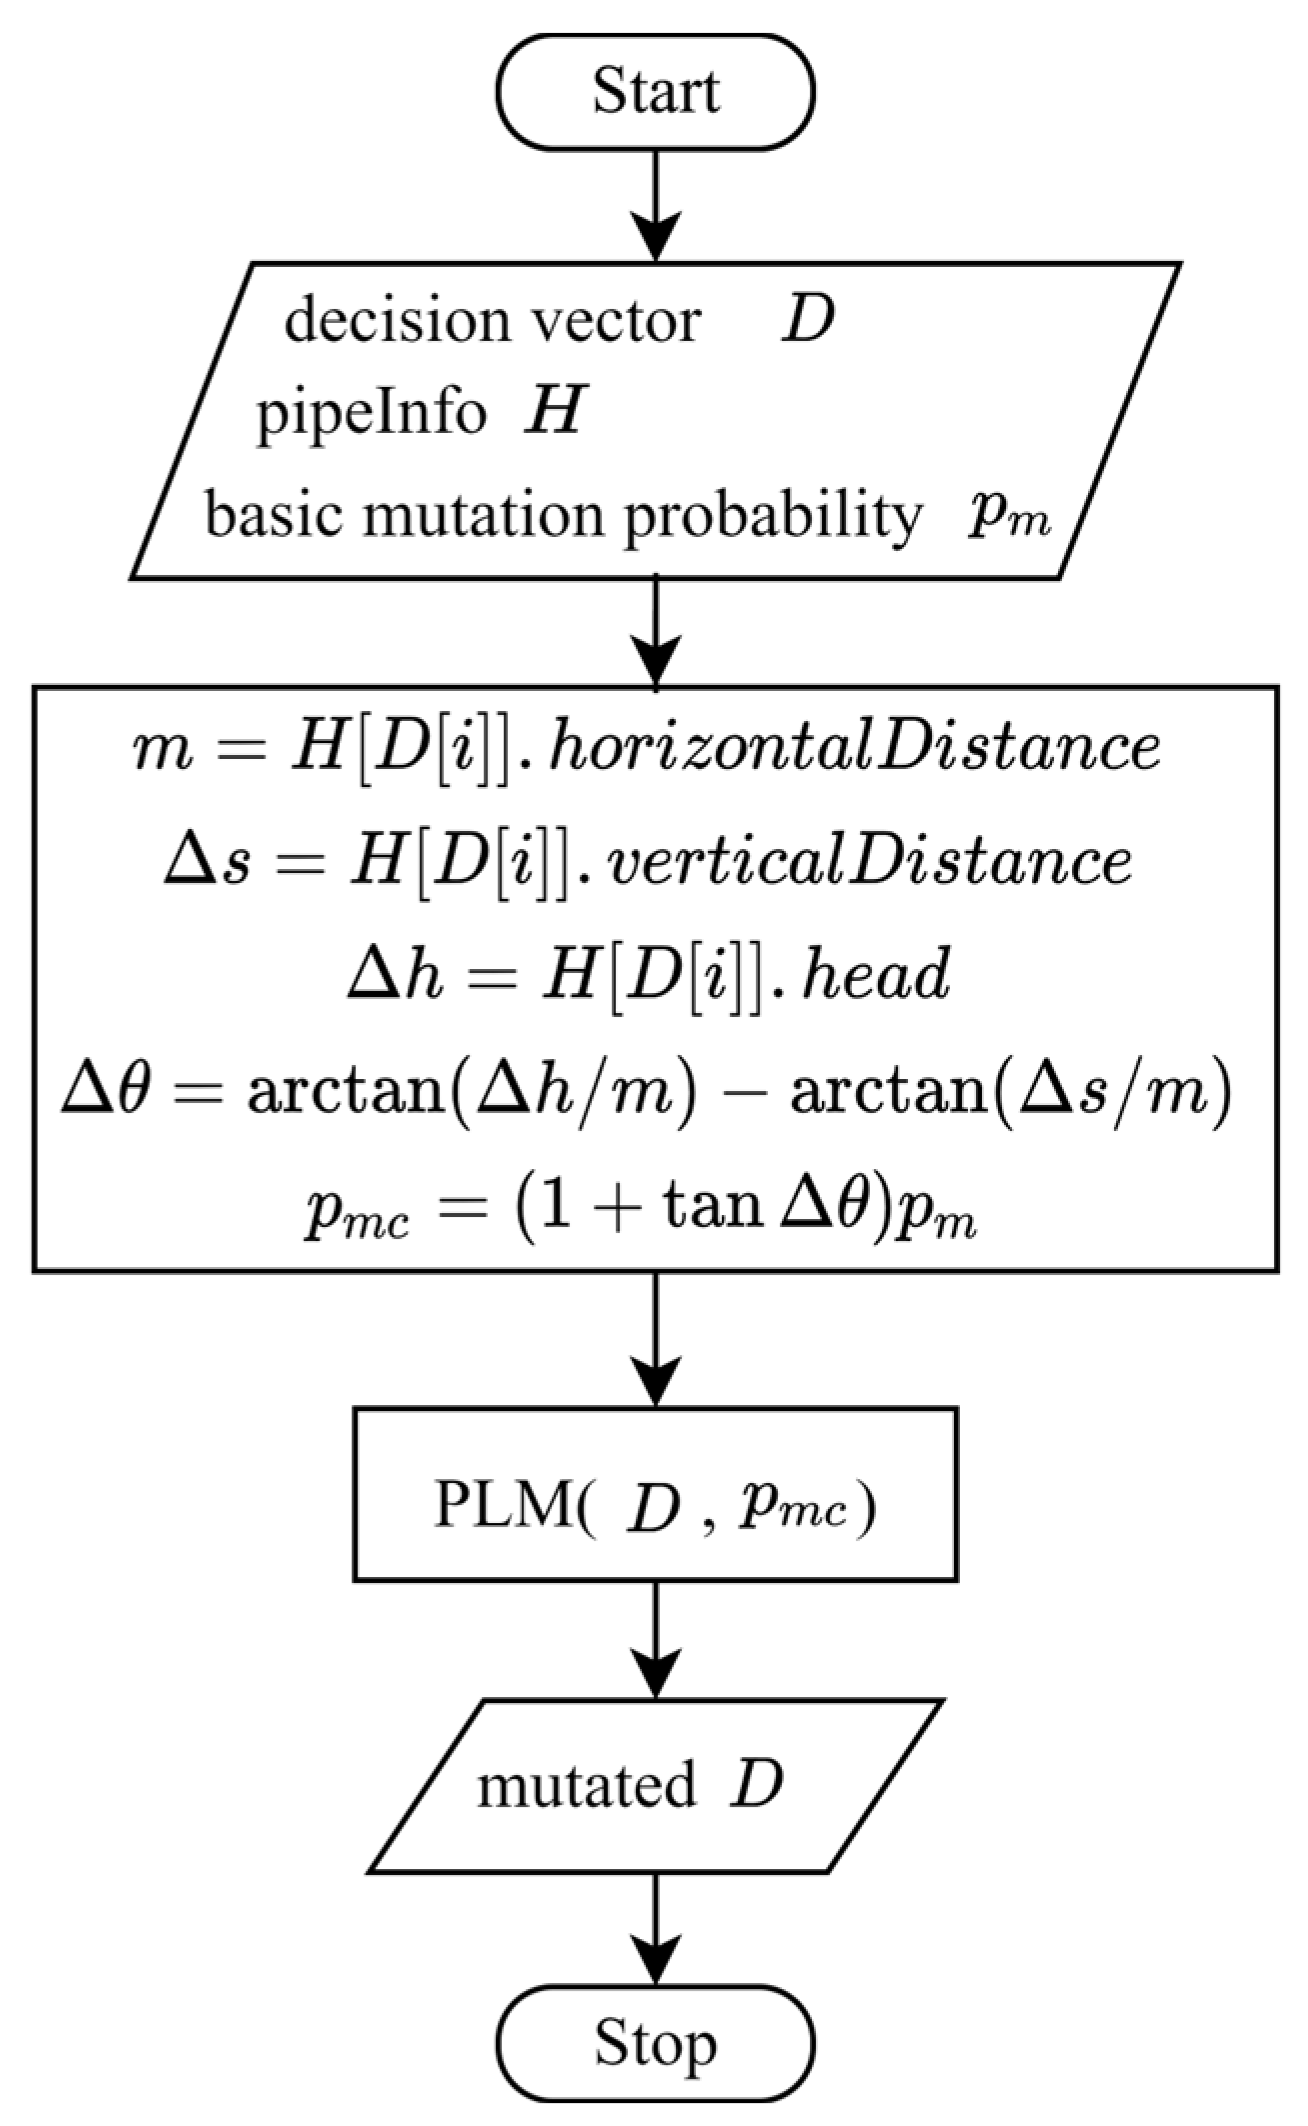
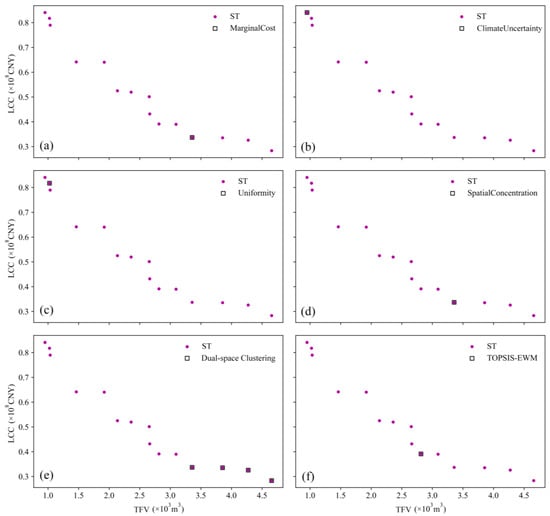
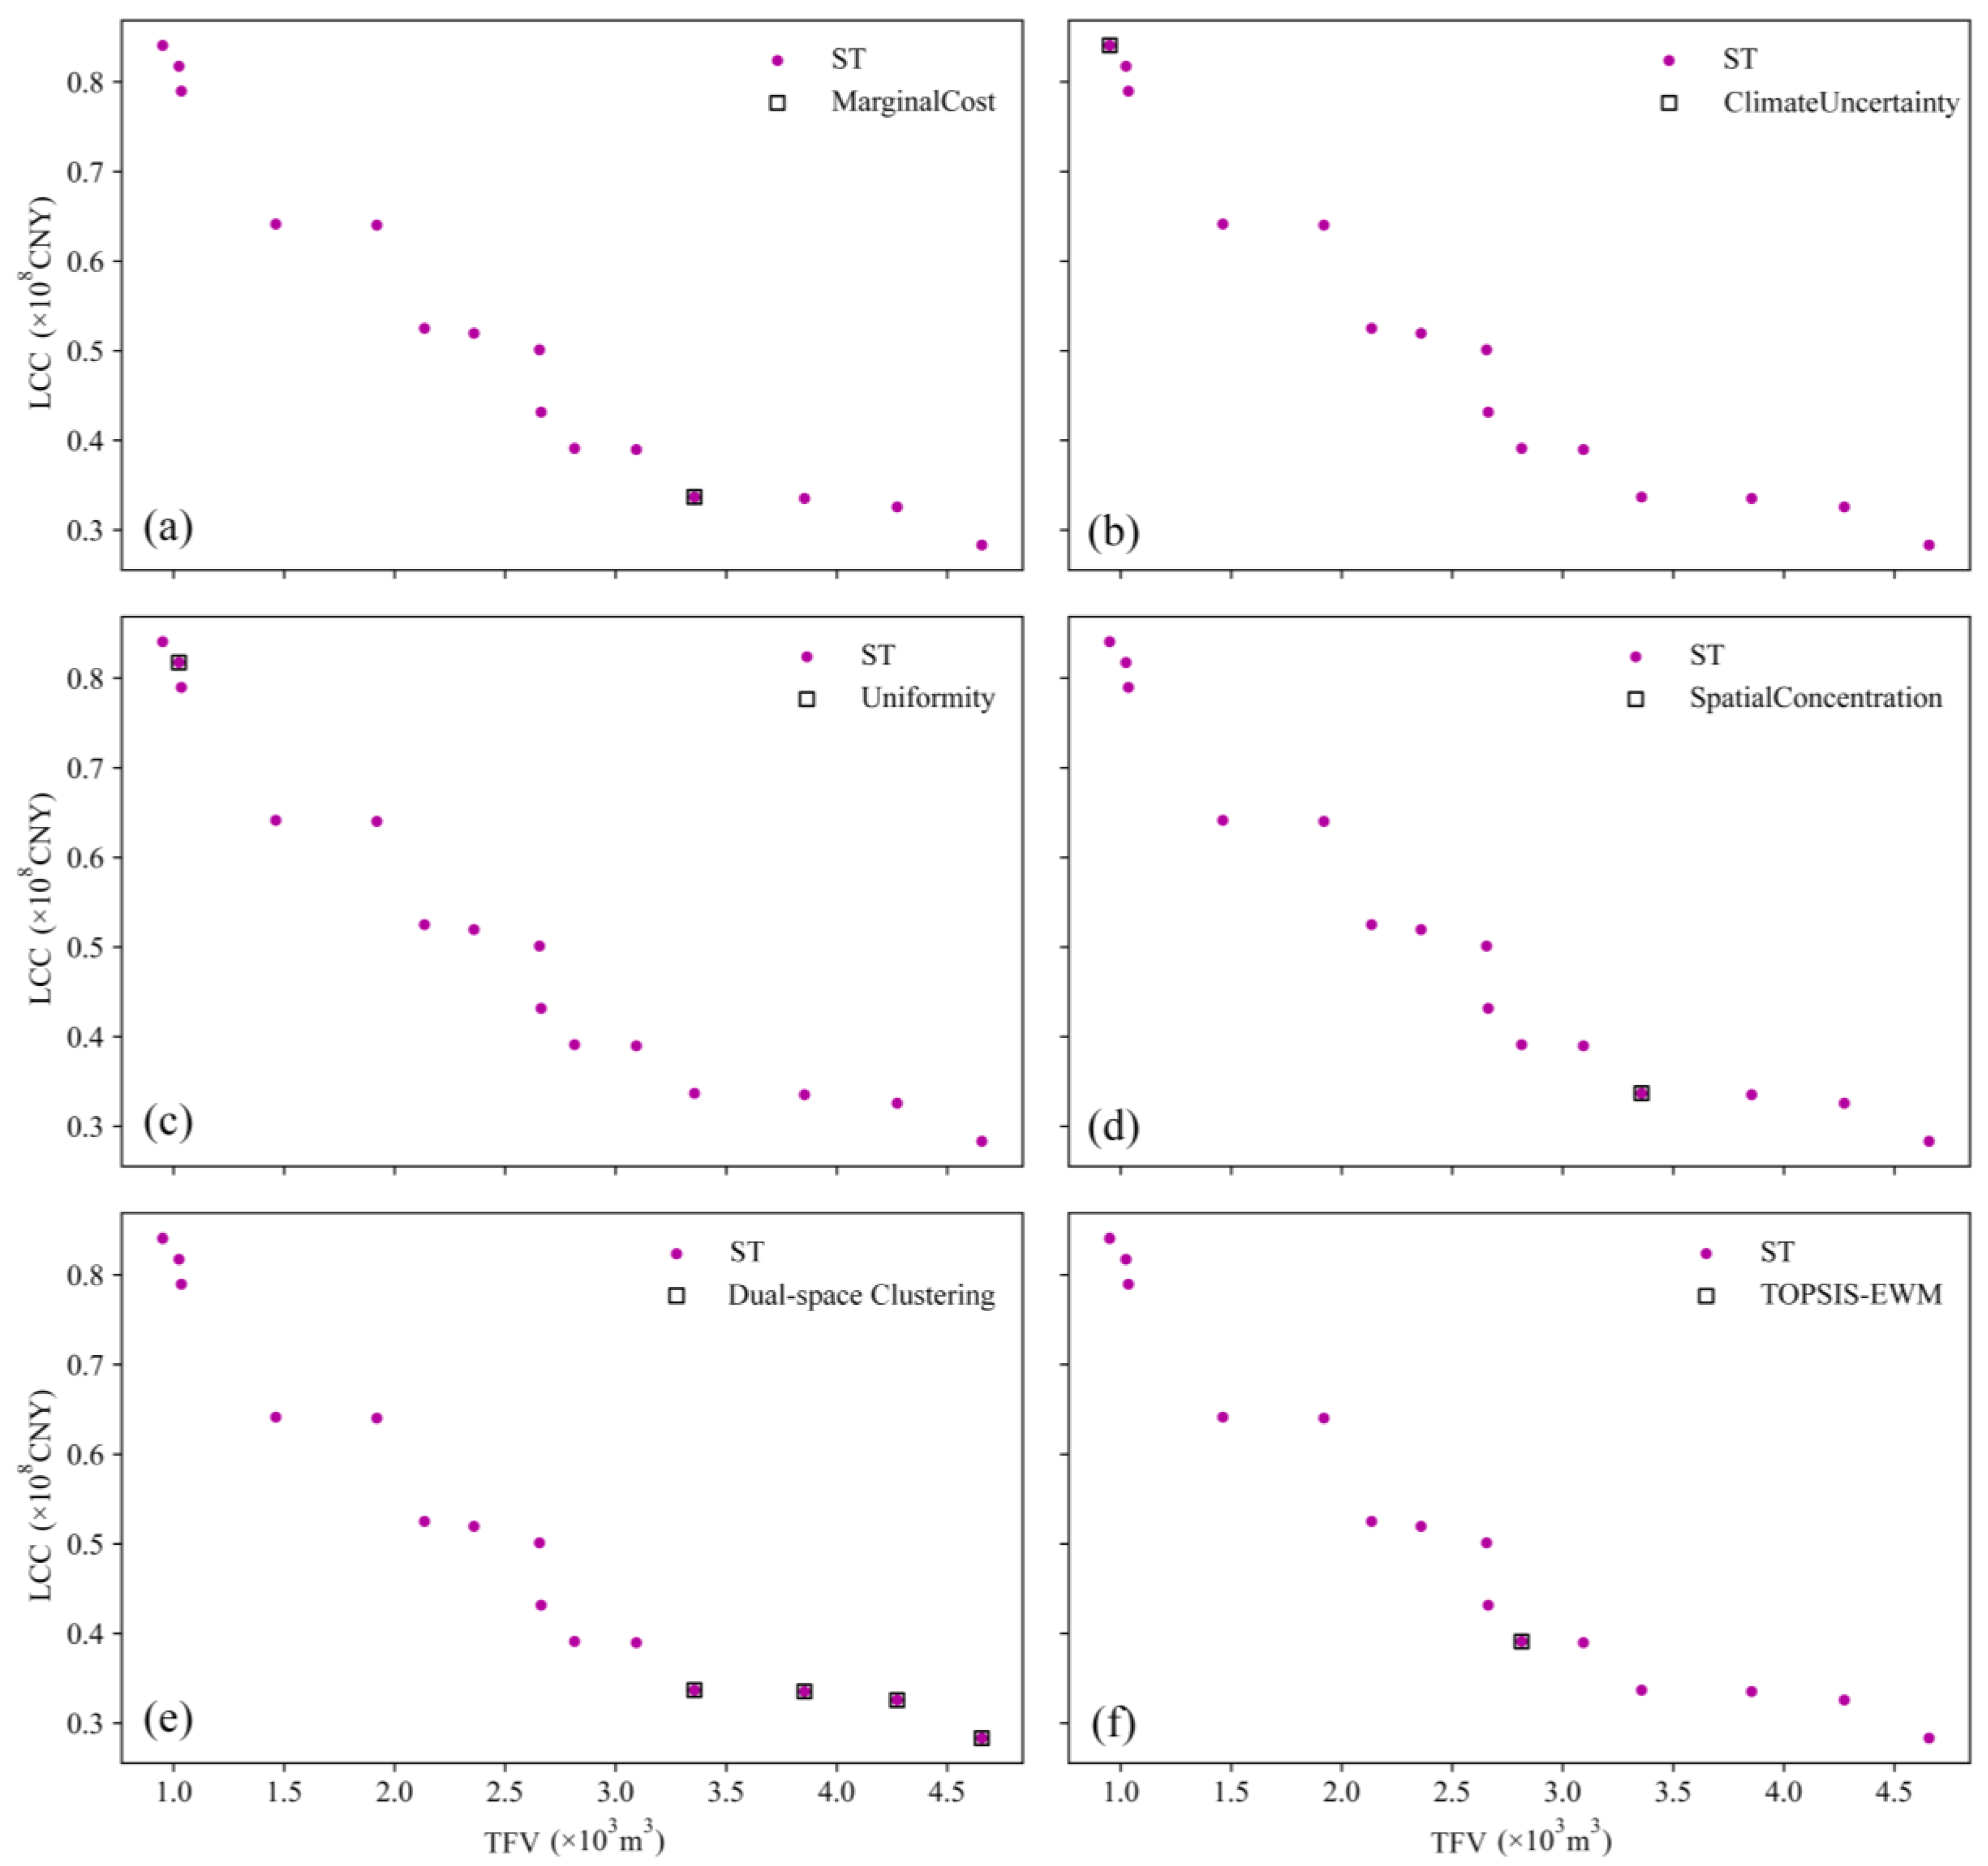
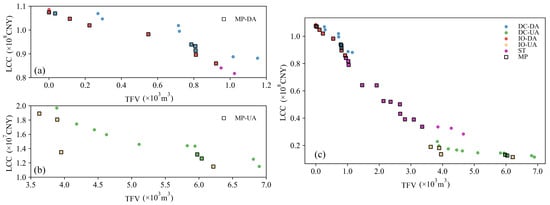
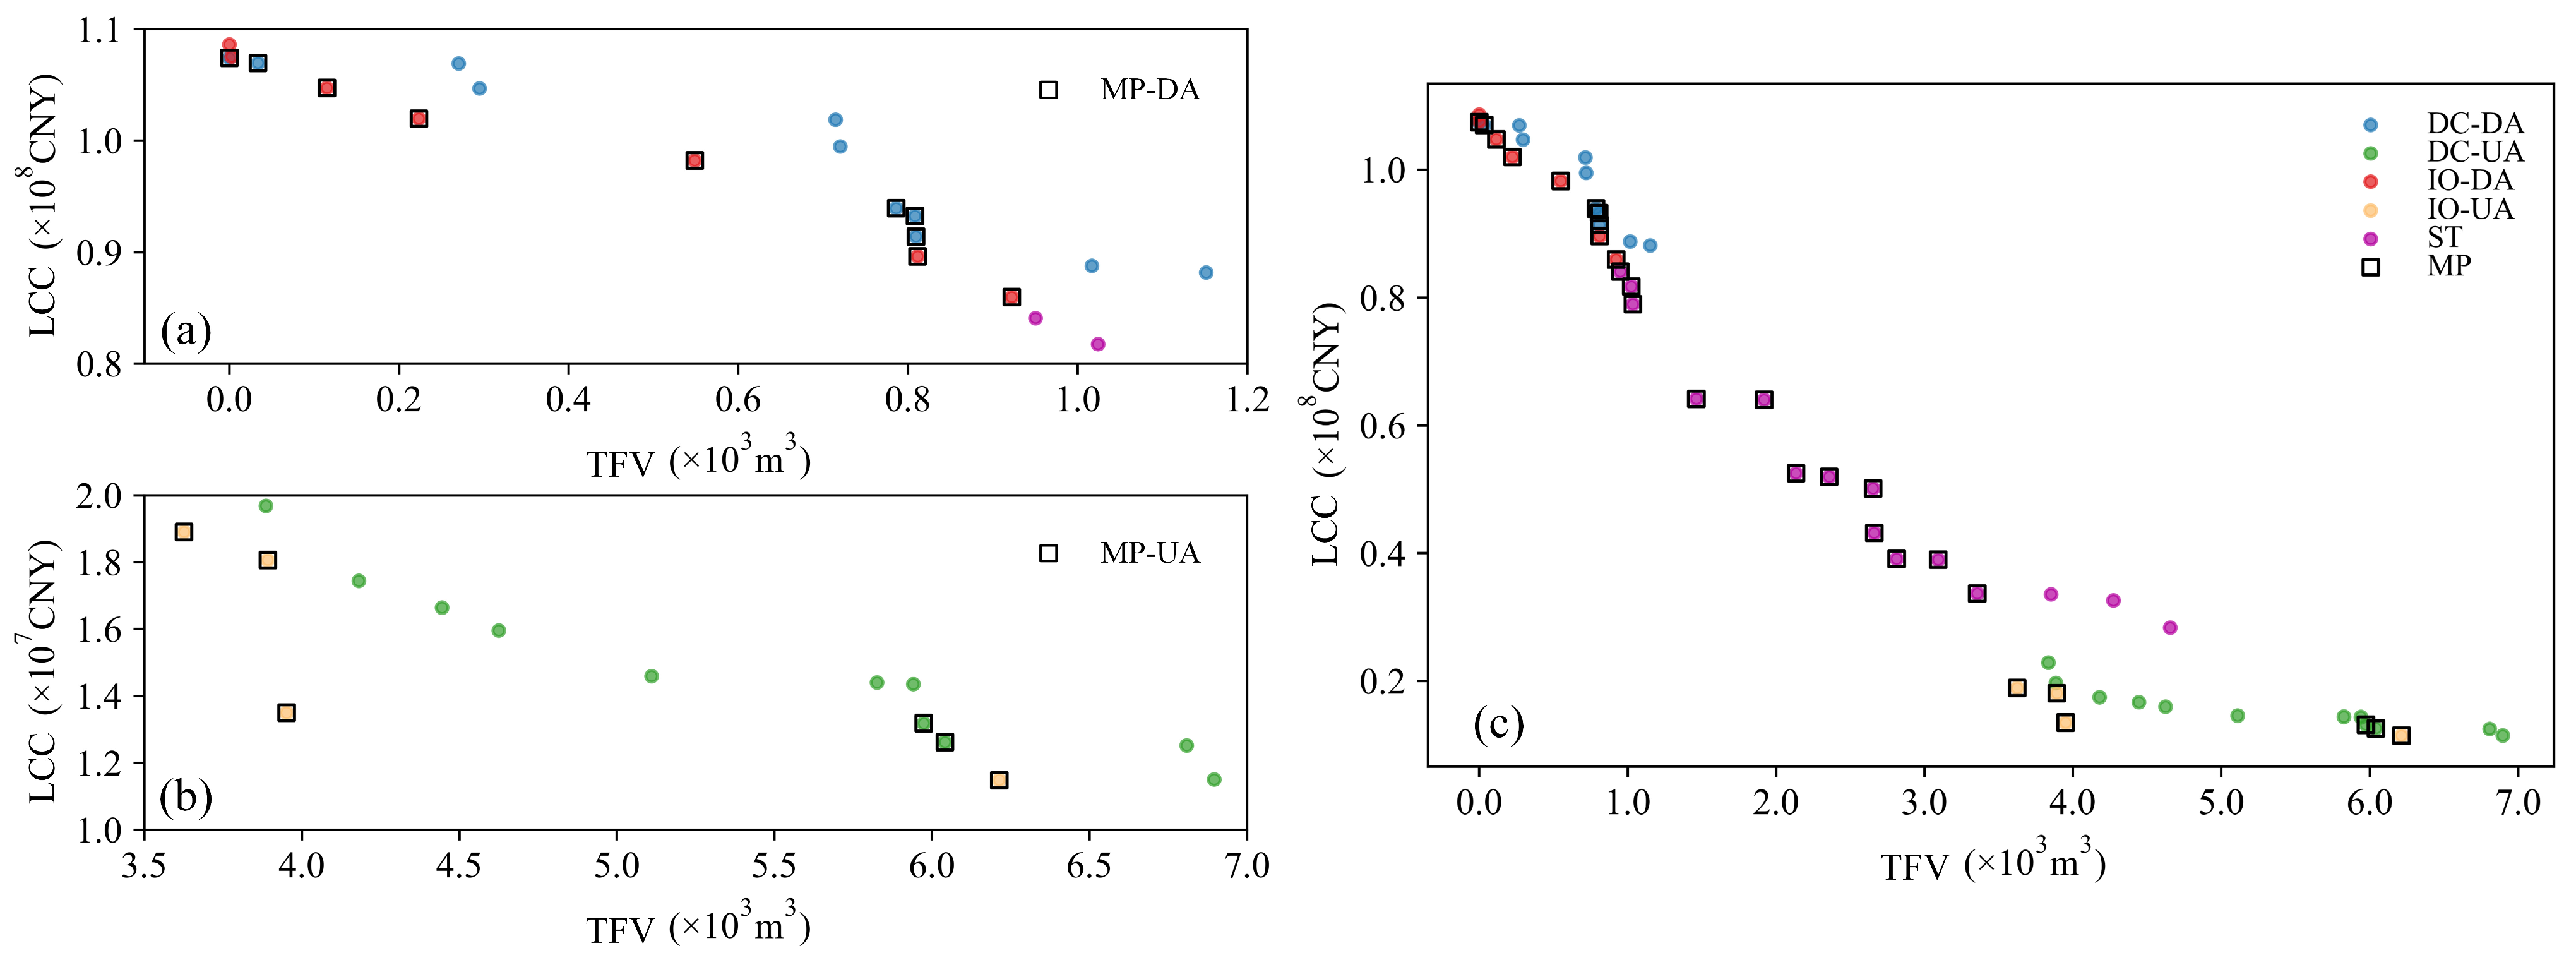
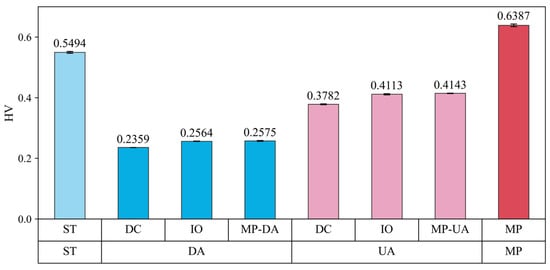
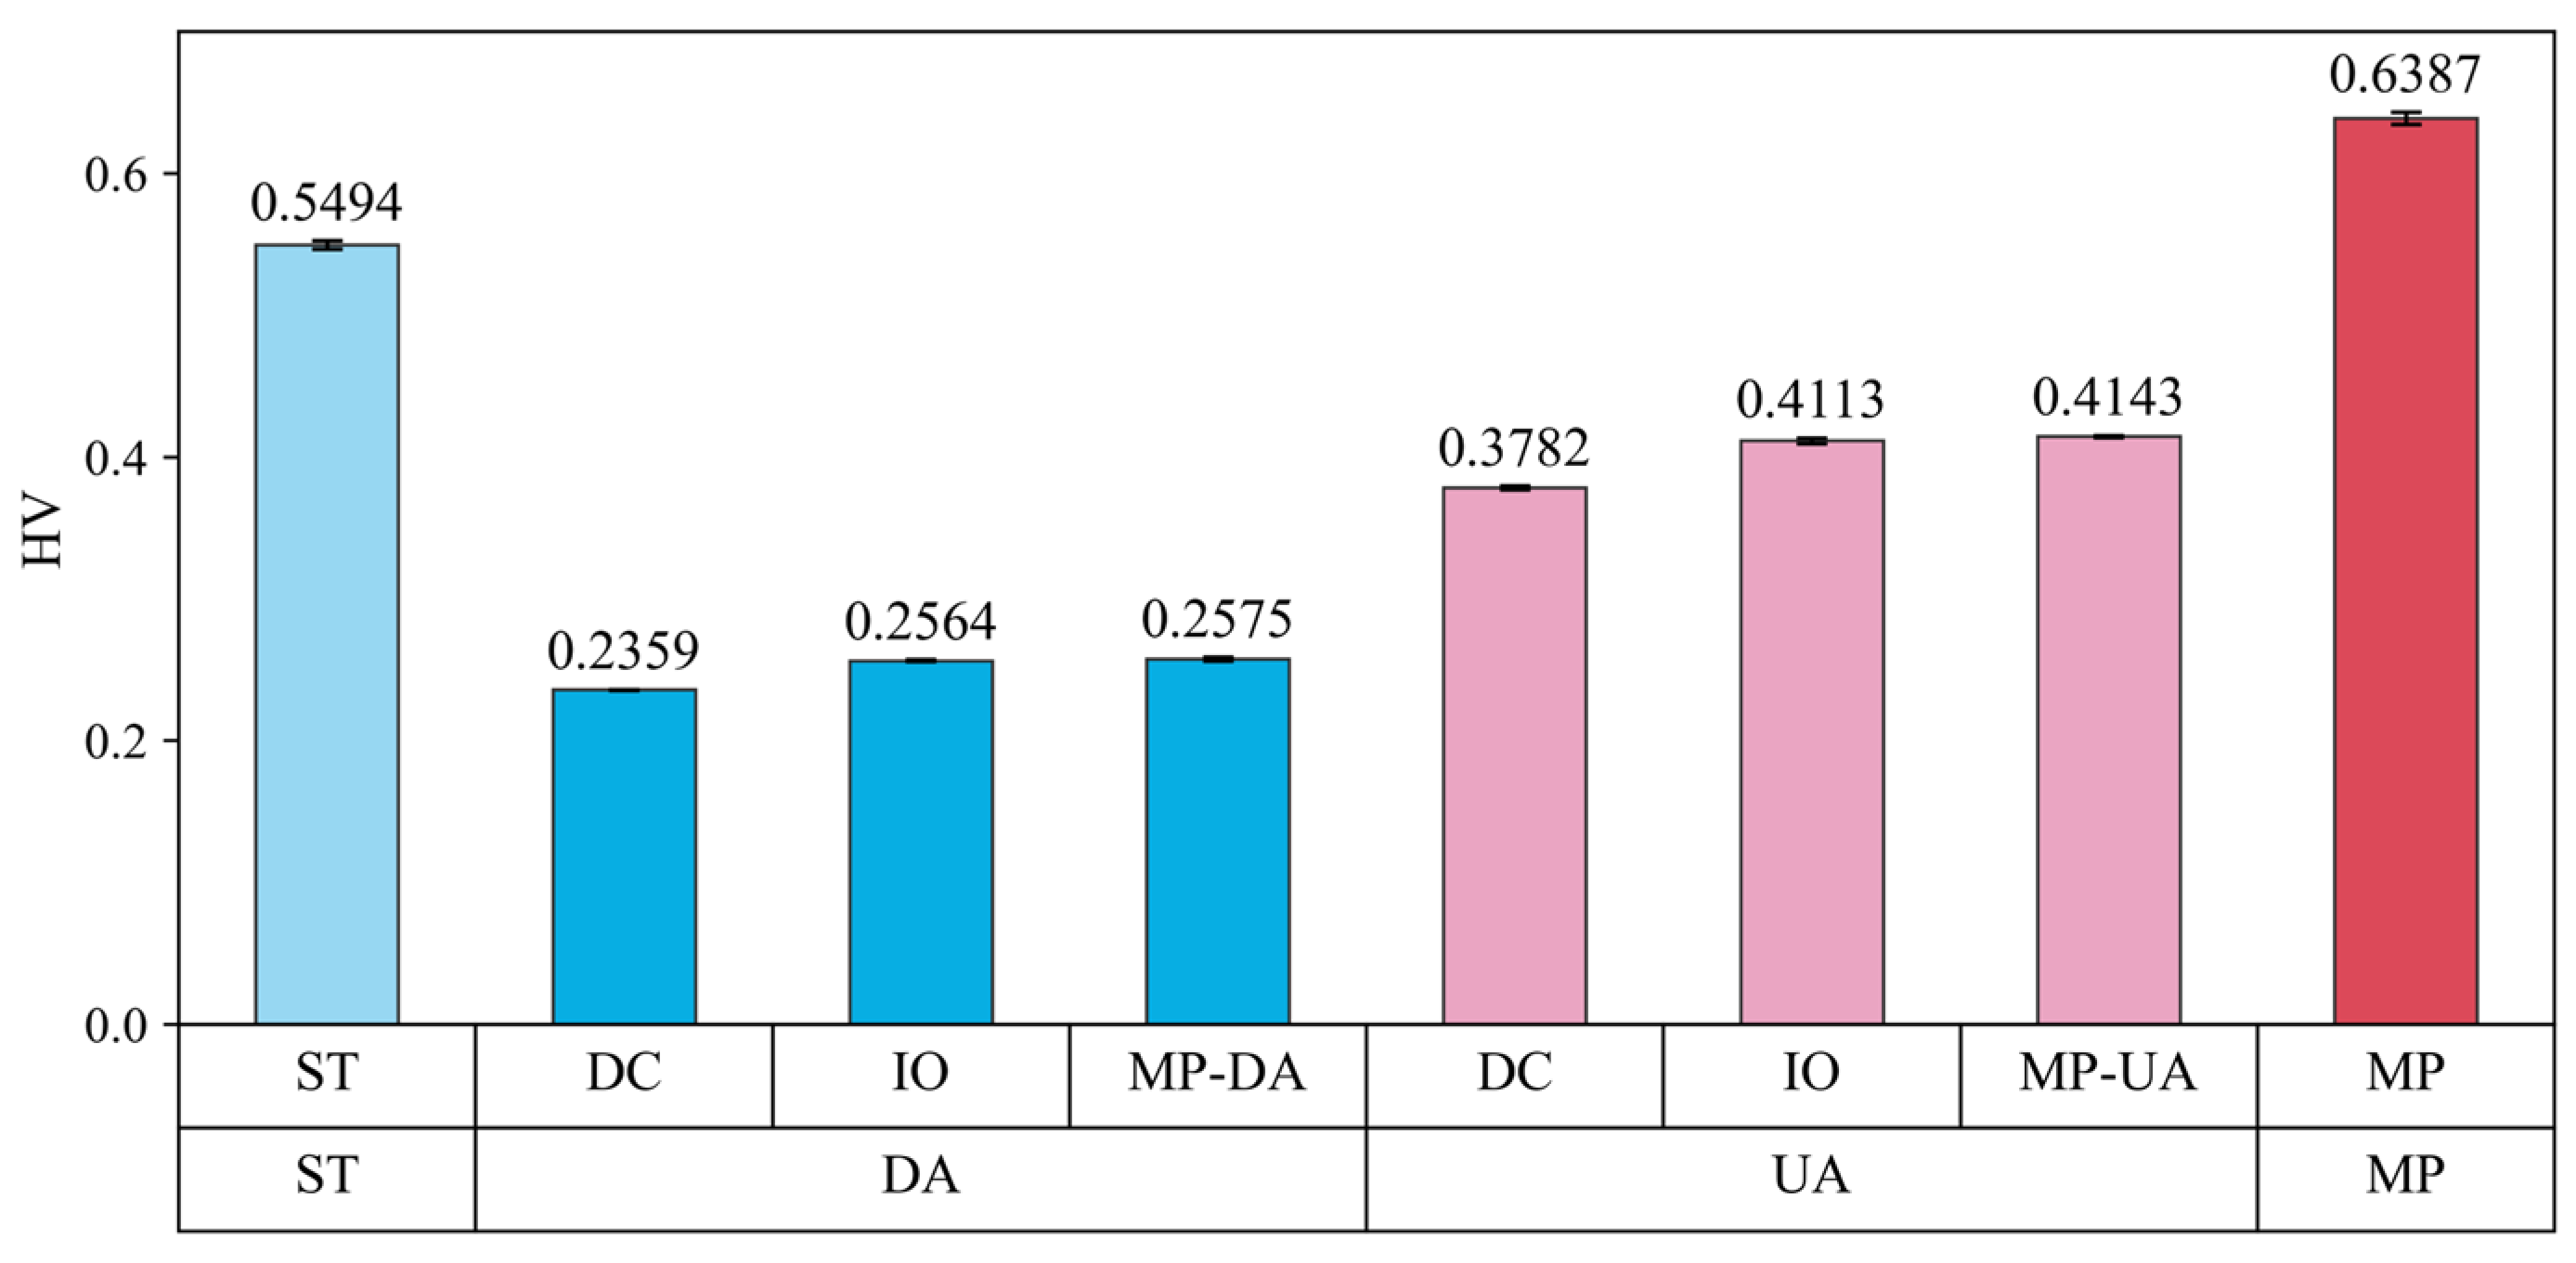
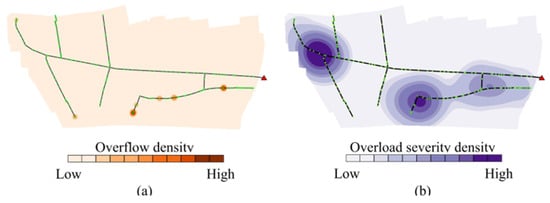
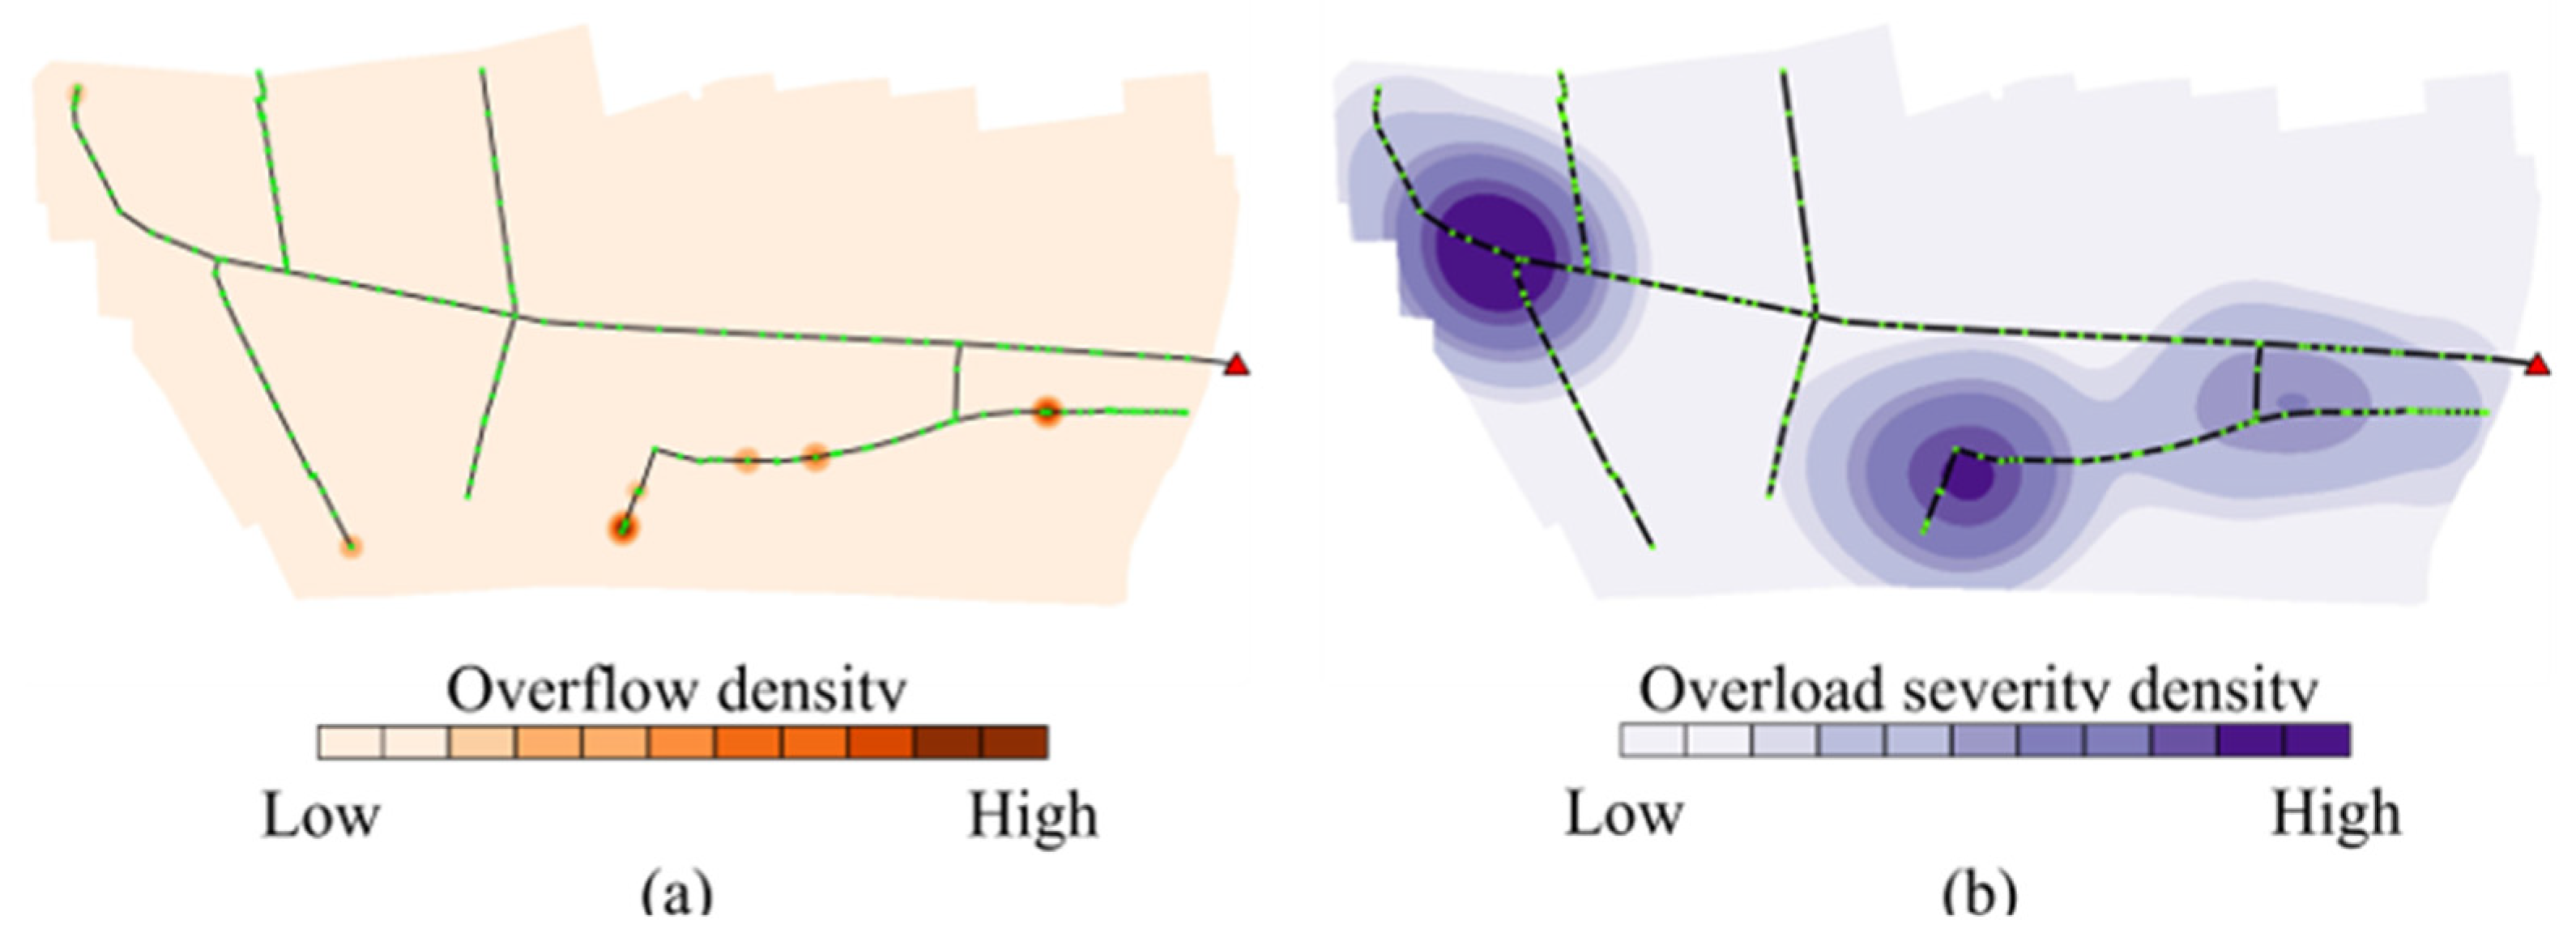
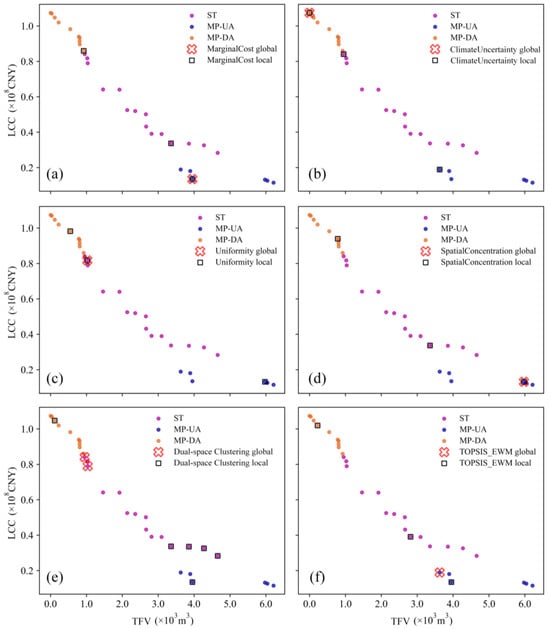
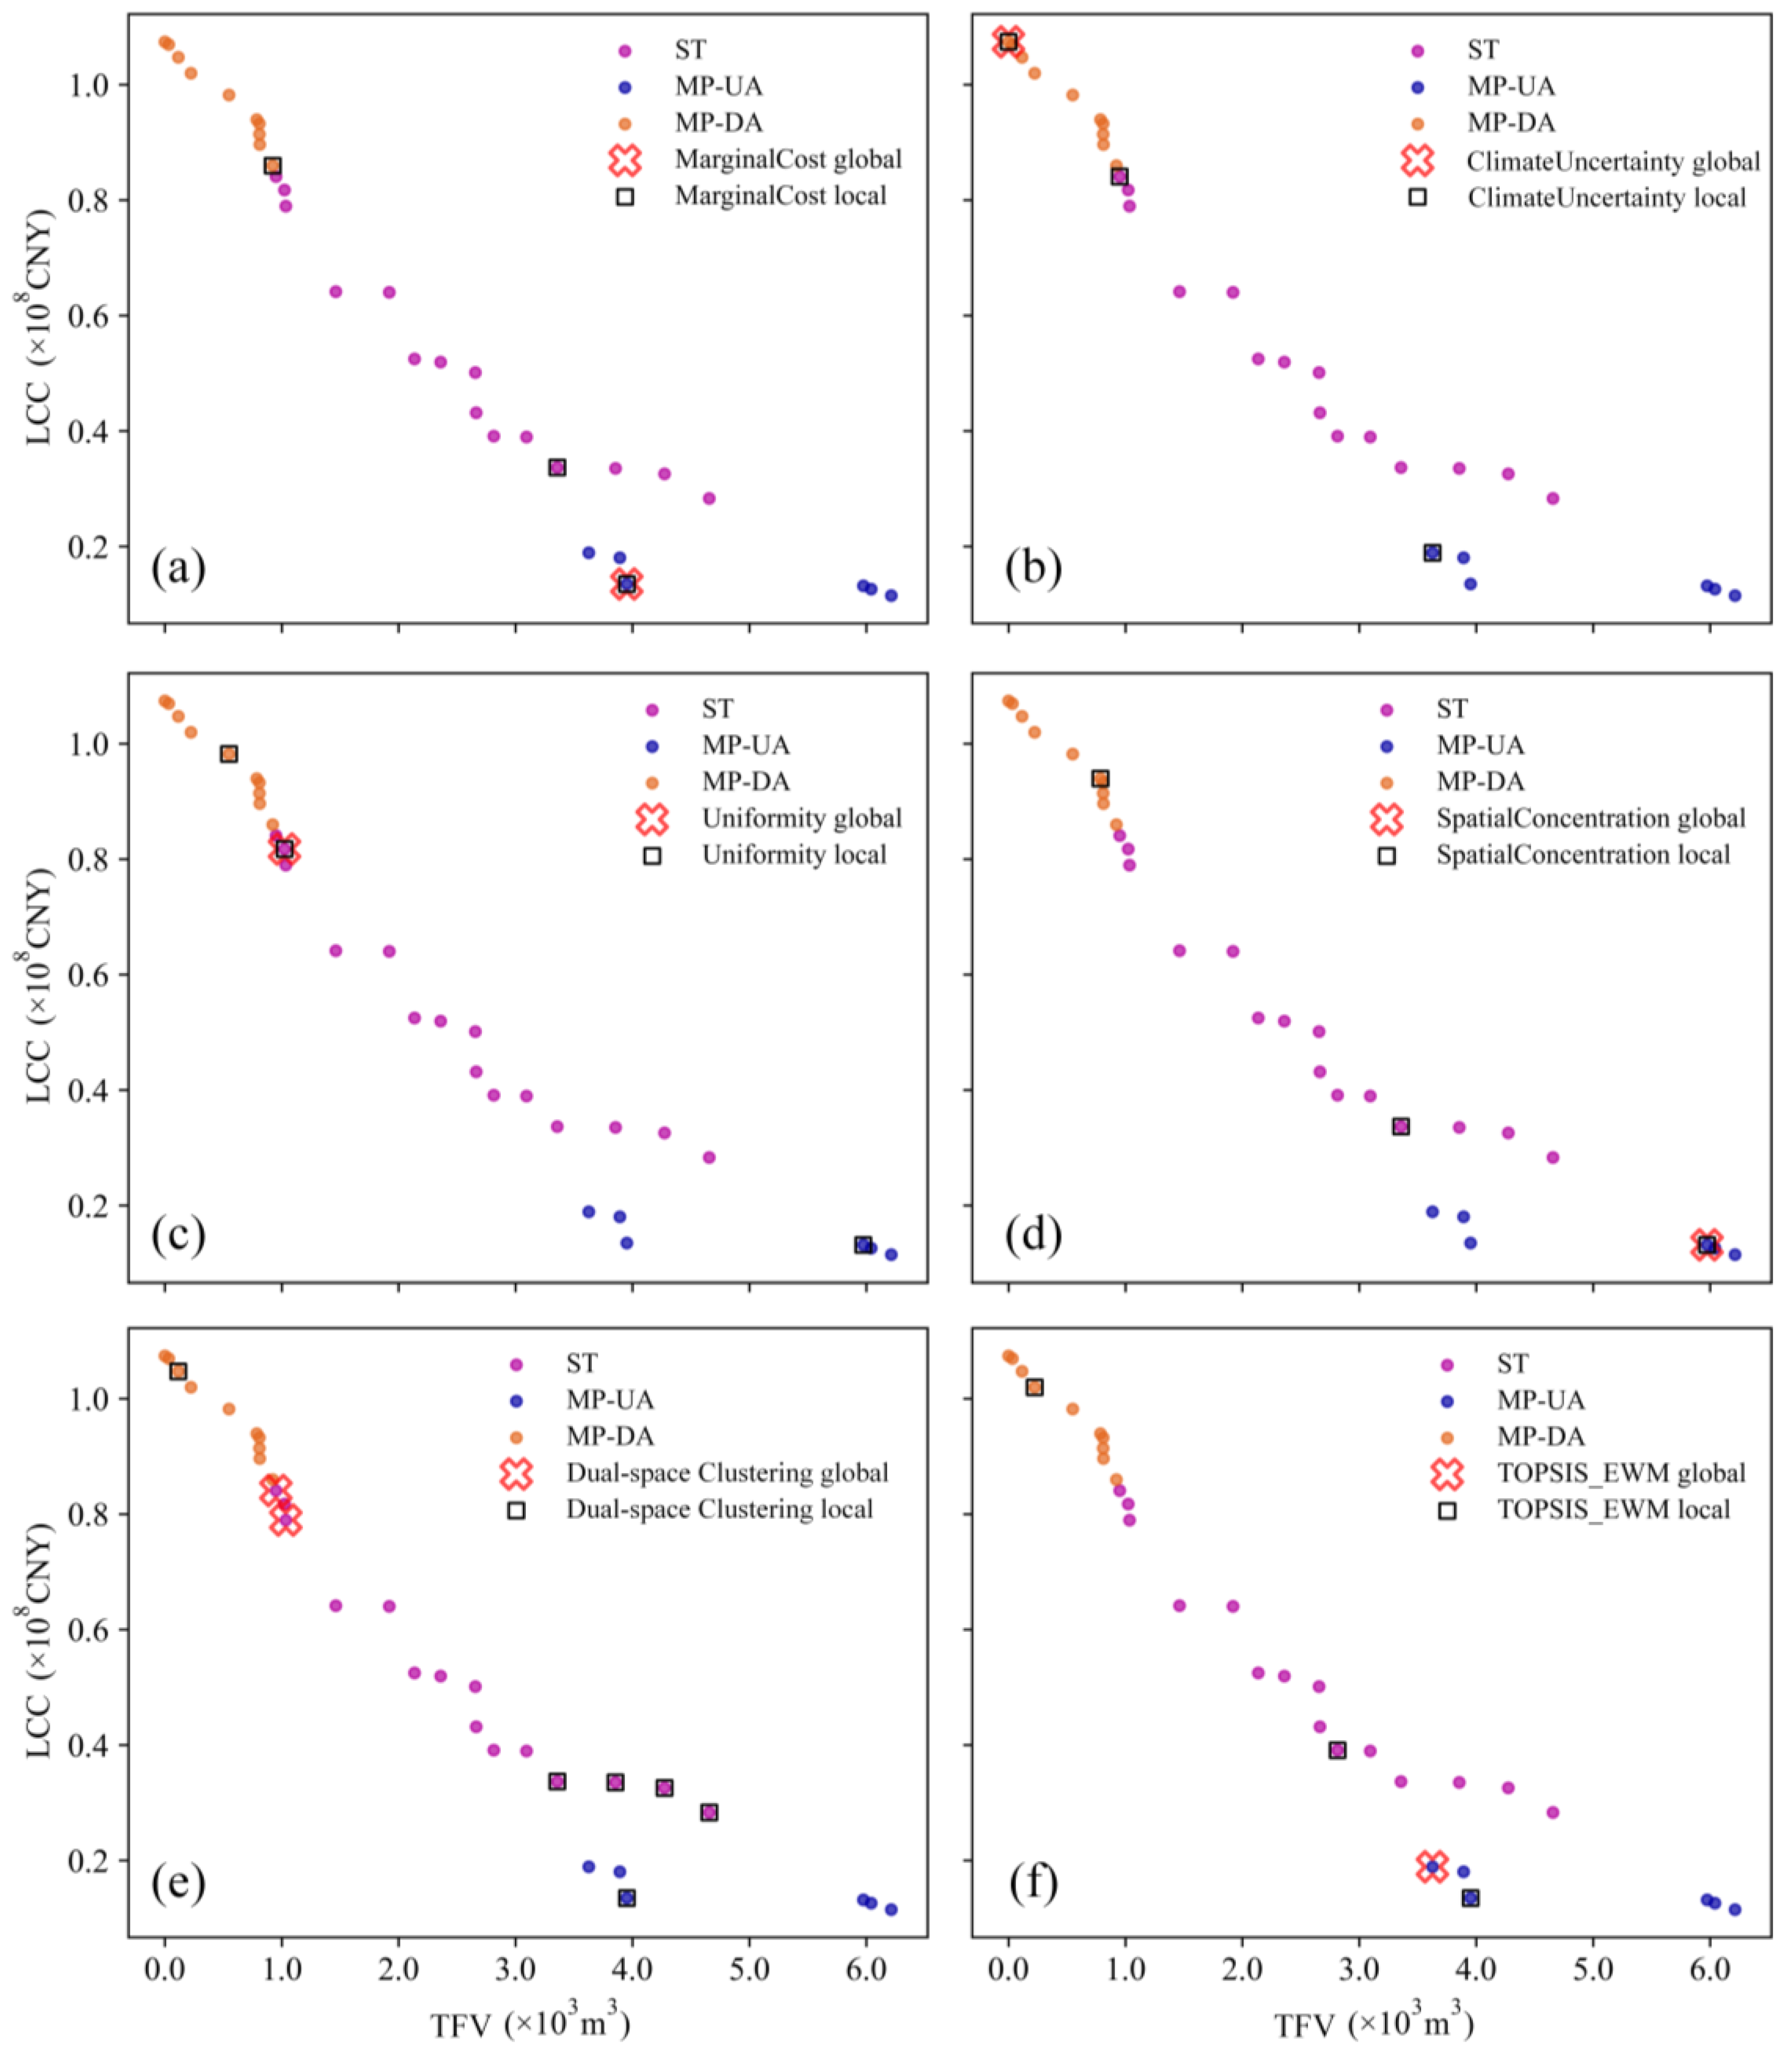
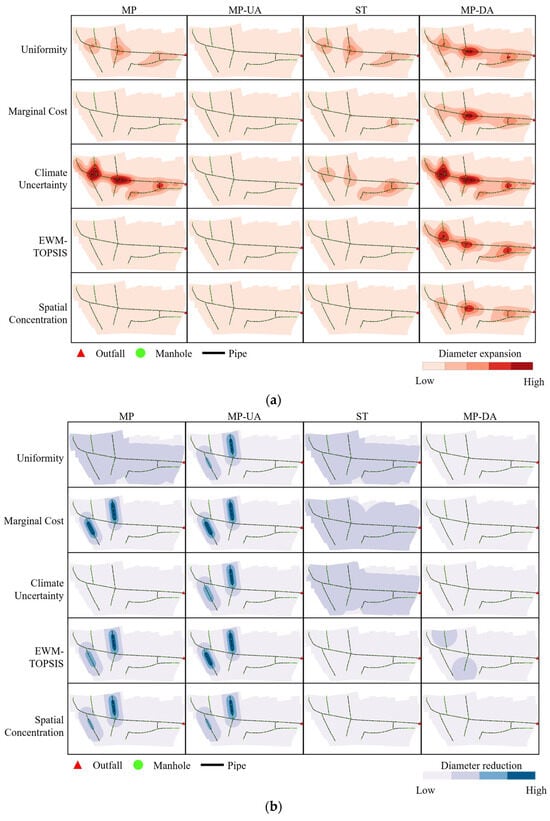
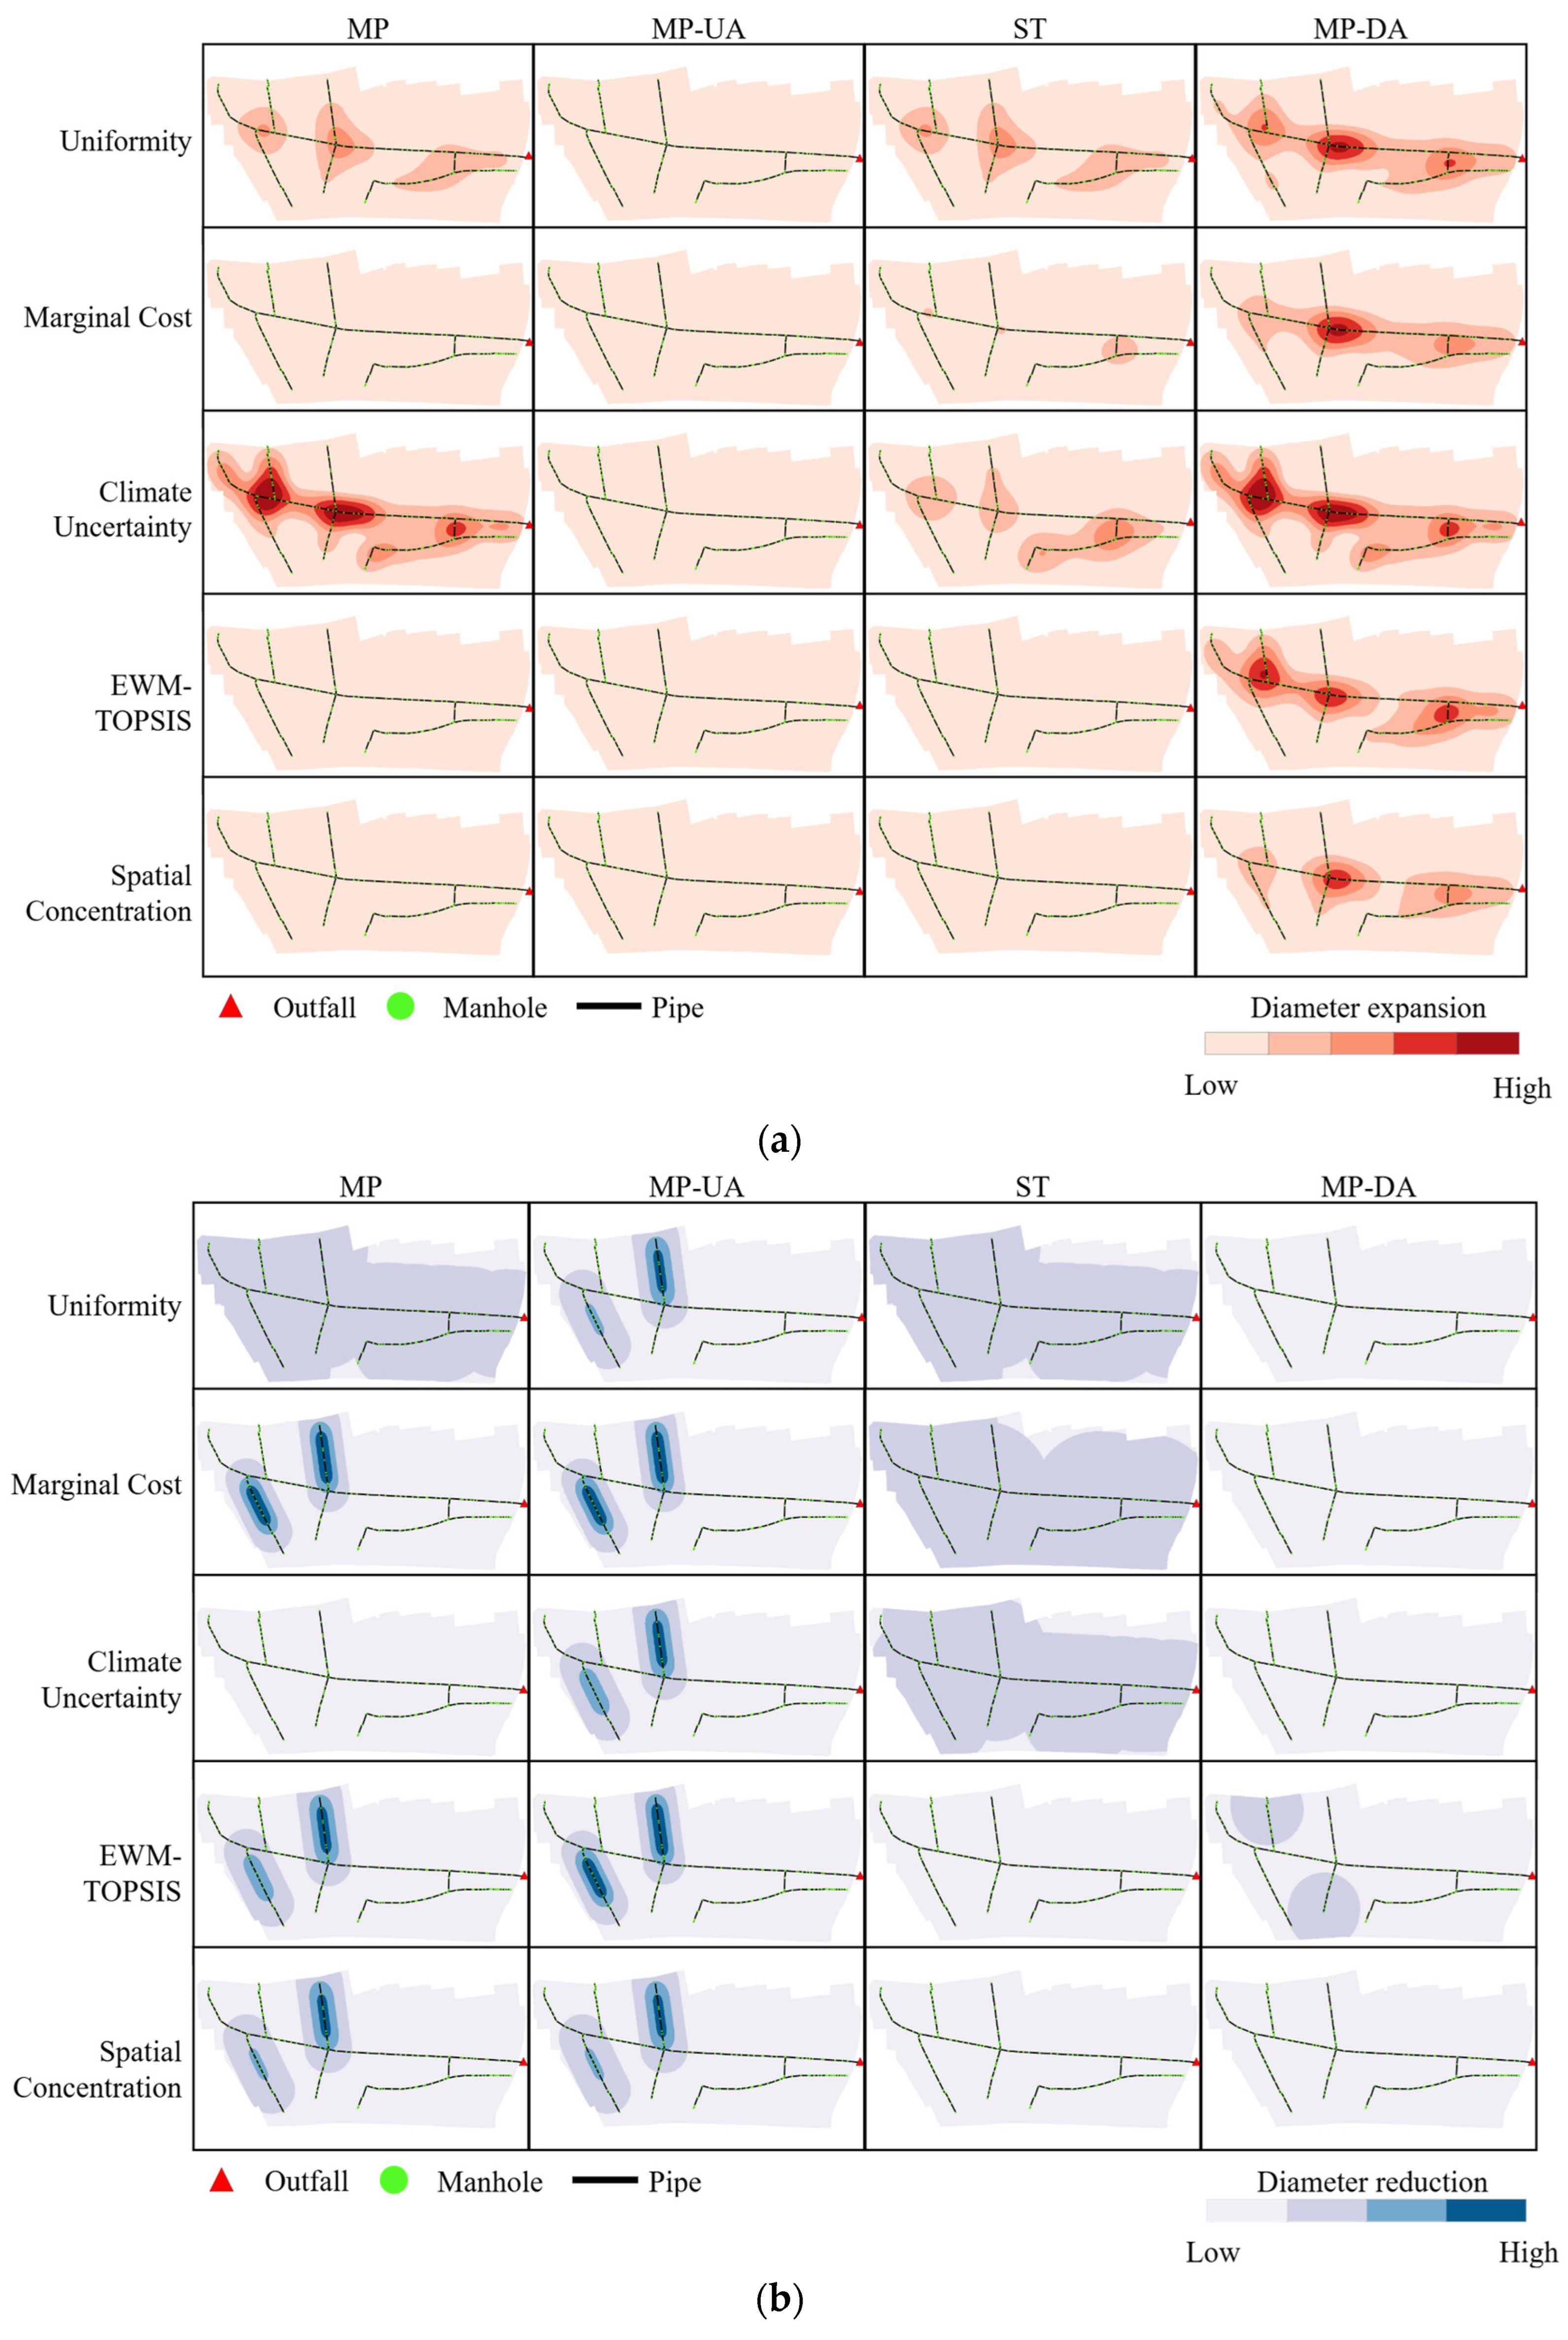

Disclaimer/Publisher’s Note: The statements, opinions and data contained in all publications are solely those of the individual author(s) and contributor(s) and not of MDPI and/or the editor(s). MDPI and/or the editor(s) disclaim responsibility for any injury to people or property resulting from any ideas, methods, instructions or products referred to in the content. |
© 2026 by the authors. Licensee MDPI, Basel, Switzerland. This article is an open access article distributed under the terms and conditions of the Creative Commons Attribution (CC BY) license.