


Abstract
Treated sewage effluent (TSE) is central to Saudi Arabia’s plans to expand irrigation, but assessments of Riyadh’s TSE have relied on period averages. This short-term screening evaluated how reliably three municipal wastewater treatment plants (WWTPs) in Riyadh met the national irrigation limits, using one month of daily operator analyses (April 2026) and two years of daily residual chlorine. Reliability was assessed with the coefficient of reliability, empirical exceedance frequencies and block bootstrapping. Monthly mean five-day biochemical oxygen demand (BOD5) and total suspended solids (TSS) met the restricted limits at all plants, but no plant met all restricted limits consistently, because the ammonia, turbidity and residual chlorine limits apply to both classes. None met the unrestricted BOD5 limit: monthly means were 13.7, 23.1 and 18.0 mg/L against 10 mg/L, with ≤1% probability of compliance. One plant did not nitrify (ammonium nitrogen 43.7 ± 2.2 mg/L) and had residual chlorine below 0.2 mg/L on 96% of days since October 2025, whereas the others kept residuals within 0.2–0.5 mg/L on 82–99% of days. Salinity (electrical conductivity 1.7–2.2 dS/m) restricts crops to moderately tolerant species. Nitrification, solids removal and chlorine control are the priority upgrades, and a full year of data is needed to confirm these findings.
1. Introduction
Water scarcity is the defining constraint on irrigation in arid regions, where low and erratic rainfall, high evaporative demand and negligible natural recharge limit conventional water resources [1]. In Saudi Arabia, irrigation of farms and urban landscapes has historically depended on non-renewable groundwater, while municipal supply relies increasingly on energy-intensive desalination [2]. Rapid urban growth has at the same time increased wastewater volumes, so that treated sewage effluent (TSE) has become a planned, comparatively stable source of irrigation water whose expansion is a stated objective of national water policy [3,4]. TSE also carries nitrogen and phosphorus that can partly replace mineral fertiliser, provided that nutrient loads are matched to crop demand [5,6].
The benefits of TSE reuse depend on whether the effluent reliably meets quality requirements set to protect public health, crops and soils [7,8]. International frameworks distinguish restricted irrigation (fodder, industrial and non-food crops, and landscapes with limited public contact) from unrestricted irrigation (food crops, including those eaten raw), with progressively stricter microbiological and physicochemical requirements [9,10,11]. Leafy and root vegetables eaten raw remain the highest-risk category [12,13]. For agronomic suitability, salinity, specific ion hazards and nutrient loads govern crop selection and soil management [5,14,15].
In Saudi Arabia, the Law of Treated Sewage Water and its Reuse (Royal Decree No. M/6, 1422 AH) and its Executive Regulations, now administered by the Ministry of Environment, Water and Agriculture (MEWA), define the treatment level required for each use and set limits for secondary-treated effluent used for restricted irrigation and for tertiary-treated effluent used for unrestricted irrigation, covering BOD5, total suspended solids (TSS), turbidity, ammonia, faecal coliforms, intestinal nematode eggs and residual chlorine [16]. Several of these limits, notably ammonia, turbidity and residual chlorine, apply to both reuse classes. BOD5 and TSS are limited as monthly averages (40 mg/L for restricted use; 10 mg/L for unrestricted use, with a 15 mg/L weekly average), and faecal coliforms for unrestricted use are limited to 2.2 MPN/100 mL on a weekly basis with a single-sample cap of 23 MPN/100 mL [16]. Because some limits apply to every sample and others to weekly or monthly averages, whether a plant is judged compliant depends on how often, and not only how far on average, its effluent departs from the limits; yet, daily monitoring records of Saudi plants are rarely analysed in this way. The suitability of these standards for national conditions has itself been debated [17].
Previous assessments of Riyadh’s TSE have reached broadly favourable conclusions. Al-Jasser [18] compared effluent from six Riyadh treatment plants with the national standards and found that all met the restricted-irrigation limits with minor violations, but none met the unrestricted limits, mainly because of faecal coliforms, with TSS and turbidity exceedances at some plants. Elfeky et al. [19] analysed 2013–2020 records from four Riyadh plants using multivariate statistics and composite water quality indices and concluded that the effluent was appropriate for irrigation. Comparable assessments elsewhere in the Kingdom have applied irrigation indices to TSE in the Al-Ahsa oasis [20], examined TSE for urban greening in Jeddah [21], and screened effluent from plants in several cities for agricultural reuse [22]. Similar index-based approaches have been used for effluent in Jordan [23] and drainage water in Al-Jouf [24].
These studies share a methodological limitation where they compare average effluent quality, or indices derived from averages, with limits that the regulation enforces on individual samples or on short averaging periods. A plant whose long-term mean meets a limit can still exceed it on a substantial fraction of days or in individual months, and it is the frequency of exceedance, not the long-term mean, that determines whether effluent can be supplied to unrestricted users. Reliability analysis addresses this directly by relating the variability of effluent quality to the probability of compliance and to the mean performance a plant must achieve to meet a limit with a given confidence [25,26]. To our knowledge, reliability analysis has not been applied to Saudi TSE, and the long-term reliability of disinfection, indicated by the residual chlorine, has not been reported for Riyadh’s plants.
This study therefore assessed three large municipal WWTPs in the city of Riyadh using the plants’ daily records, with four objectives: (i) to quantify treatment performance and compliance with the Saudi limits for restricted and unrestricted irrigation, using the averaging rules of the regulation; (ii) to estimate the probability of compliance and, for single-sample limits, the mean effluent quality needed for 95% compliance; (iii) to evaluate a two-year daily record of residual chlorine as an indicator of disinfection reliability; and (iv) to translate the results into allowable uses, crop choices under the observed salinity, and prioritised upgrades for extending TSE use to crop irrigation. Because the detailed effluent record covers one month, this study is a short-term reliability screening rather than a seasonal or long-term characterisation; the two-year chlorine record is its only long-term component.
2. Materials and Methods
2.1. Study Plants
The three plants are large municipal activated-sludge WWTPs serving Riyadh and are identified here as WWTP 1, WWTP 2 and WWTP 3. WWTP 1 and WWTP 2 are separate treatment units on the same site and receive wastewater from the same sewer catchment. WWTP 1 consists of two parallel, separately reported treatment trains (A and B) of 100,000 m3/d each. Their daily influent analyses were identical on 24 of 27 days, indicating a common influent sample, and their effluents were combined as a daily flow-weighted mean (no day had data for one train but not the other), because the trains share the influent and design; the results for each train are given in Table S1 and lead to the same conclusions. All plants operate biological reactors with anoxic and aerobic zones followed by tertiary treatment and chlorination. The average flows are given in Table 1; WWTP 1 and WWTP 2 operated at 103% and 102% of their design capacities. At WWTP 3, part of the flow received secondary treatment only, and an overflow bypass was recorded on some days. The effluent analysed is the final effluent sampled by the plant laboratory; whether samples were grab or composite samples, and the sampling time, were not documented in the records.
Table 1.
Characteristics of the three WWTPs during the study period (1–27 April 2026). Flows are means of the operator’s daily records.
2.2. Data Sources and Quality Control
Two datasets were used. The first comprised the plants’ daily laboratory analyses of influent and final effluent for April 2026 (1–27 April). The effluent parameters were pH, total dissolved solids (TDS), electrical conductivity (EC), turbidity, chemical oxygen demand (COD), BOD5, TSS, total Kjeldahl nitrogen (TKN), NH4–N, NO2–N, NO3–N, total organic carbon (TOC), PO4–P, phenol, fluoride, residual chlorine (recorded as free residual chlorine; the analytical method was not documented), faecal coliforms, intestinal nematode eggs and temperature; influent analyses included alkalinity. Mixed-liquor suspended solids (MLSS), sludge volume index (SVI) and dissolved oxygen (DO) in the anoxic and aerobic zones of each biological reactor were recorded on the same days. Analyses were performed by the plant laboratories following standard methods [27]; whether a nitrification inhibitor was used in the BOD5 test was not recorded. The second dataset comprised daily residual chlorine in the final effluent from 27 May 2024 to 28 April 2026 for WWTP 1 (both trains) and WWTP 3, and from 10 October 2025 for WWTP 2 (201 days). Records were screened for completeness and physical plausibility. Five entries at WWTP 3 (2.5, 3.5, 5.0, 5.0 and 20 mg/L) were excluded as transcription errors: all exceeded 2 mg/L, more than twice the highest other value recorded at any plant over two years (0.80 mg/L), which is implausible for a residual controlled near 0.2–0.5 mg/L. No other values were excluded. Faecal coliforms were recorded as values between 1.1 and 2.1 per 100 mL on all days at all plants. Because the enumeration method was not documented, the non-integer entries are inconsistent with colony counts, and <2.2 MPN/100 mL is the result reported by the five-tube MPN test when no tube is positive [27], these results were treated as left-censored (<2.2 per 100 mL) and were not analysed numerically.
2.3. Regulatory Limits and Compliance Assessment
Effluent quality was compared with the limits of the Executive Regulations for restricted (secondary-treated) and unrestricted (tertiary-treated) irrigation (Table 2) [16]. The regulation lists free chlorine at 0.5 mg/L in the table of maximum levels, with the proviso that it not be less than 0.2 mg/L where chlorine is used for disinfection; thus, compliance was assessed as a residual within 0.2–0.5 mg/L. The regulation expresses ammonia as NH3–N, and this was taken as total ammonia nitrogen; the quantity determined by standard methods [27] and reported here as NH4–N (at the observed pH and temperature, unionised NH3 was only 2.8–4.6% of the total. Compliance was assessed in two ways. First, daily compliance was calculated for every parameter as the percentage of days on which the daily value met the limit; for limits defined as averages (BOD5 and TSS in both classes, and faecal coliforms), this daily test is stricter than the regulation and was used only to describe variability. Second, the averaged limits were assessed as the regulation defines them: the mean of all daily values in the month (1–27 April) and the means of calendar weeks (Sunday–Saturday) were compared with the monthly and weekly limits. Faecal coliforms could be compared only qualitatively, because no recorded value reached 2.2 per 100 mL (Section 2.2). The regulation also limits boron and 17 trace elements, which were not included in the operator records.
Table 2.
Saudi limits for treated sewage effluent reused for irrigation, compiled from [16].
2.4. Reliability Analysis
For limits that apply to individual samples (turbidity and NH4–N), the coefficient of reliability (COR) of Niku et al. [25] was used. Assuming log-normally distributed effluent concentrations, the mean concentration mx that a plant must achieve so that a single-sample standard Xs is met with reliability (1 − α), that is, exceeded on no more than a fraction α of days, is
where V is the coefficient of variation of the daily concentrations (standard deviation divided by the mean), Z1−α is the standard normal variate with cumulative probability 1 − α (1.645 for 95% reliability), and mx and Xs have the same units [25,26]. A reliability of 95% was used, as in previous reliability analyses of WWTPs [25,26]; it is not specified in the Saudi regulation, and results for 90% and 99% are given in Table S2. A ratio of the observed mean to mx above 1 means that the limit would be exceeded on more than 5% of days. Because log-normality may not hold, the compliance probability implied by the moment-fitted log-normal distribution is reported next to the empirical percentage of compliant days, which requires no distributional assumption and is given with a block-bootstrap 95% confidence interval (Table S2); goodness of fit was checked with the Shapiro–Wilk test on log-transformed values. For the averaged BOD5 and TSS limits, the probability that a 30-day mean meets 10 mg/L and that a 7-day mean meets 15 mg/L was estimated by a circular block bootstrap of the daily values (block length 3 days, 10,000 resamples), which preserves short-term autocorrelation; 95% confidence intervals of the 30-day mean were taken from the 2.5th and 97.5th percentiles. All analyses were repeated for WWTP 3 without the three upset days. All reliability estimates assume that the variability observed in April 2026 is representative of other months.
mx = COR·Xs
COR = (V2 + 1)1/2·exp{−Z1−α·[ln(V2 + 1)]1/2}
2.5. Salinity Hazard, Crop Suitability and Nutrient Supply
Salinity hazard was classified from EC using the U.S. Salinity Laboratory classes [28] and the FAO degree of restriction guidelines [5]. To screen crop suitability, the soil saturation extract salinity (ECₑ) expected under long-term irrigation was approximated from the effluent salinity (ECw) following FAO Irrigation and Drainage Paper 29 as
which corresponds to a leaching fraction of about 15–20% under conventional irrigation [5]. This standard FAO-29 assumption was used because site-specific leaching fractions for Riyadh farms are not available; lower leaching would raise ECe and reduce the yields estimated below. The relative yield Y (%) was estimated with the threshold–slope model
using thresholds a from FAO-29 [5] and slopes b from Maas and Hoffman [29], which are consistent with FAO-29. The screening ignores existing soil salinity, salt distribution under drip irrigation and specific-ion (sodium, chloride, boron) toxicity, which could not be assessed. Nutrient supply was expressed as kg/ha delivered per 1000 mm of irrigation (1 mg/L = 10 kg/ha per 1000 mm), using total nitrogen (TKN + NO2–N + NO3–N) and PO4–P.
ECe = 1.5·ECw
Y = 100 − b (ECe − a)
2.6. Statistical Analysis
The results are reported as the mean ± standard deviation with ranges in parentheses. Removal efficiencies were calculated for each day from paired influent and effluent concentrations and then averaged. Seasonal differences in residual chlorine were tested on monthly means (months with at least 20 daily values; June–September vs. December–February) with the Mann–Whitney U test, since daily values are strongly autocorrelated, and the difference in means is reported with its Welch 95% confidence interval; with 6–8 months per season, only large differences can be detected.
2.7. Use of Generative AI
Generative AI (Claude Opus 5.5, Anthropic San Francisco, CA, USA) was used to assist with data analysis and statistics, language editing, reference formatting and the enhancement of plotting scripts for figures and tables. All activity data, emission factors and calculations were supplied or verified by the author, and every result reported was recomputed independently of the tool.
3. Results
3.1. Treatment Performance and Effluent Quality
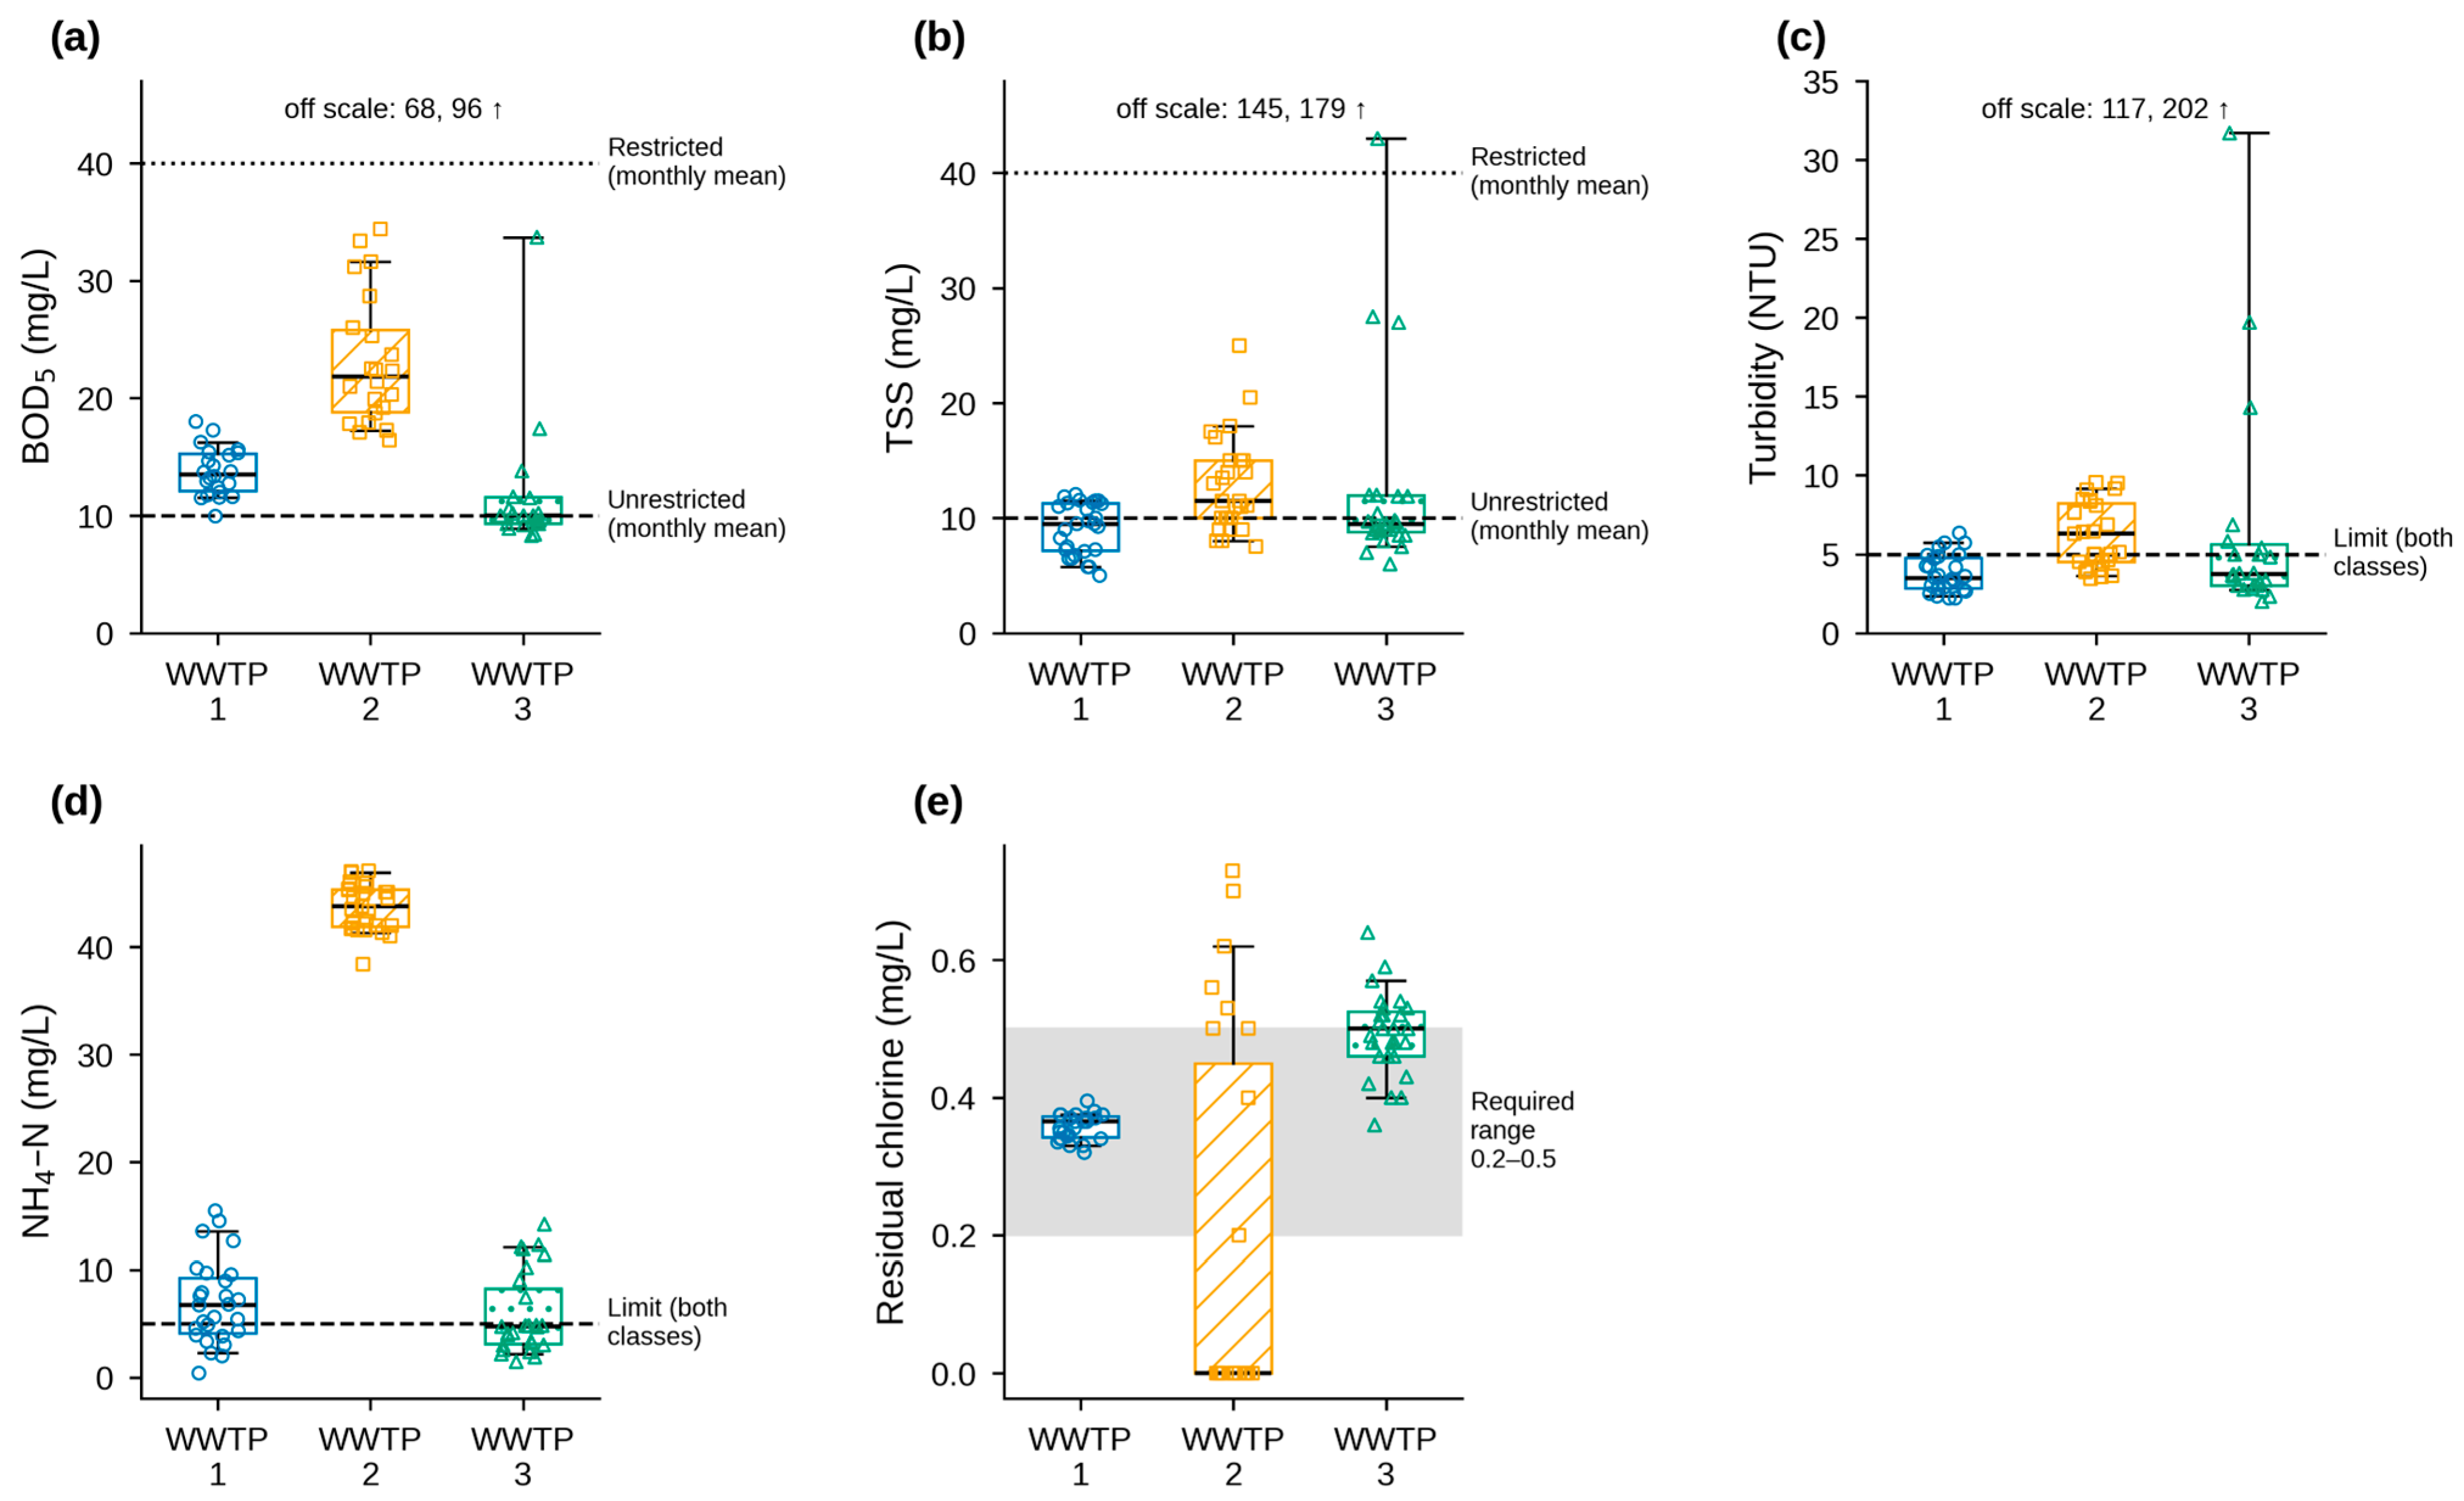
The influent strength was similar at the three plants (BOD5 349–406 mg/L, COD 566–626 mg/L, TKN 46.9–53.9 mg/L, alkalinity 279–283 mg/L as CaCO3), and all three removed organic matter and solids efficiently (Table 3). The mean BOD5 removal was 94.2–96.0%, COD removal was 92.7–94.8%, and TSS removal was 93.7–96.3%. The plants differed sharply in nitrogen removal. WWTP 1 and WWTP 3 removed 84.2% and 83.2% of influent NH4–N, whereas WWTP 2 removed none (−3.1 ± 4.7%; effluent NH4–N 43.7 ± 2.2 mg/L) and only 7.1% of TKN. Effluent NO3–N was low at all plants (0.16–0.47 mg/L), consistent with substantial denitrification at WWTP 1 and WWTP 3. Phosphate removal was 62.0–71.0%, leaving 1.7–2.2 mg/L PO4–P in the effluent.
Table 3.
Influent concentration and removal efficiency at the three WWTPs (April 2026), reported as influent mean and mean ± SD of daily removal.
Table 4.
Final effluent quality at the three WWTPs (April 2026), reported as mean ± SD and range in parentheses.
Figure 1.
Daily final effluent concentrations at the three WWTPs, April 2026: (a) BOD5, (b) TSS, (c) turbidity, (d) NH4–N, (e) residual chlorine. Boxes show the interquartile range and median, whiskers extend to the most extreme values within the 5th–95th percentiles, and symbols are individual days. Horizontal lines show the Saudi limits for restricted (dotted) and unrestricted (dashed) irrigation; for NH4–N and turbidity, the same limit applies to both classes, and the shaded band in (e) is the required residual chlorine range of 0.2–0.5 mg/L. Two values at WWTP 3 lie above the plotted range in each of (a–c), all on the upset days of 12 and 15 April: BOD5 68 and 96 mg/L, TSS 145 and 179 mg/L, and turbidity 117 and 202 NTU. Faecal coliforms are not plotted because all results were below 2.2 per 100 mL (Section 2.2).
3.2. Compliance with the Saudi Reuse Limits
All three plants met the restricted-irrigation limits for BOD5 and TSS on 89–100% of days, even when these were applied to daily values, and met them as monthly means (Table 5). No faecal coliform result reached 2.2 per 100 mL, nematode eggs were absent, and pH, NO3–N, fluoride and TDS met their limits on all days. Compliance with the limits that apply to both reuse classes was much lower. NH4–N met the 5 mg/L limit on 37% of days at WWTP 1, 70% at WWTP 3 and on no days at WWTP 2; turbidity met 5 NTU on 85%, 44% and 70% of days; and residual chlorine was within 0.2–0.5 mg/L on all days at WWTP 1, on 15% of days at WWTP 2 (below 0.2 mg/L on 67%) and on 59% of days at WWTP 3 (above 0.5 mg/L on 41%). Phenol exceeded 0.002 mg/L on 7–19% of days, with a maximum of 0.012 mg/L. Taking all limits together, WWTP 1 and WWTP 3 met every restricted limit on the same day on 30% of days (8 of 27) and WWTP 2 on none.
Table 5.
Percentage of days meeting the Saudi limits for restricted (R) and unrestricted (U) irrigation, with limits applied to daily values (April 2026). For parameters with a single limit, R and U are identical.
Against the unrestricted limits, the monthly mean BOD5 exceeded 10 mg/L at all plants (13.7, 23.1 and 18.0 mg/L), and only 0–55% of individual days were at or below 10 mg/L. Monthly mean TSS met the 10 mg/L limit at WWTP 1 (9.1 mg/L) but not at WWTP 2 (12.7 mg/L) or WWTP 3 (23.2 mg/L). The weekly mean BOD5 remained below 15 mg/L in all four weeks at WWTP 1 and in no weeks at WWTP 2; at WWTP 3, it exceeded 15 mg/L in the week that contained two upset days (32.2 mg/L). The weekly mean TSS was below 15 mg/L in all five weeks at WWTP 1, three of five at WWTP 2 and four of five at WWTP 3. No faecal coliform result reached 2.2 per 100 mL, so no exceedance of the microbiological criterion was recorded; because the method was not documented, this cannot be taken as demonstrated compliance.
3.3. Reliability of Meeting the Unrestricted Limits
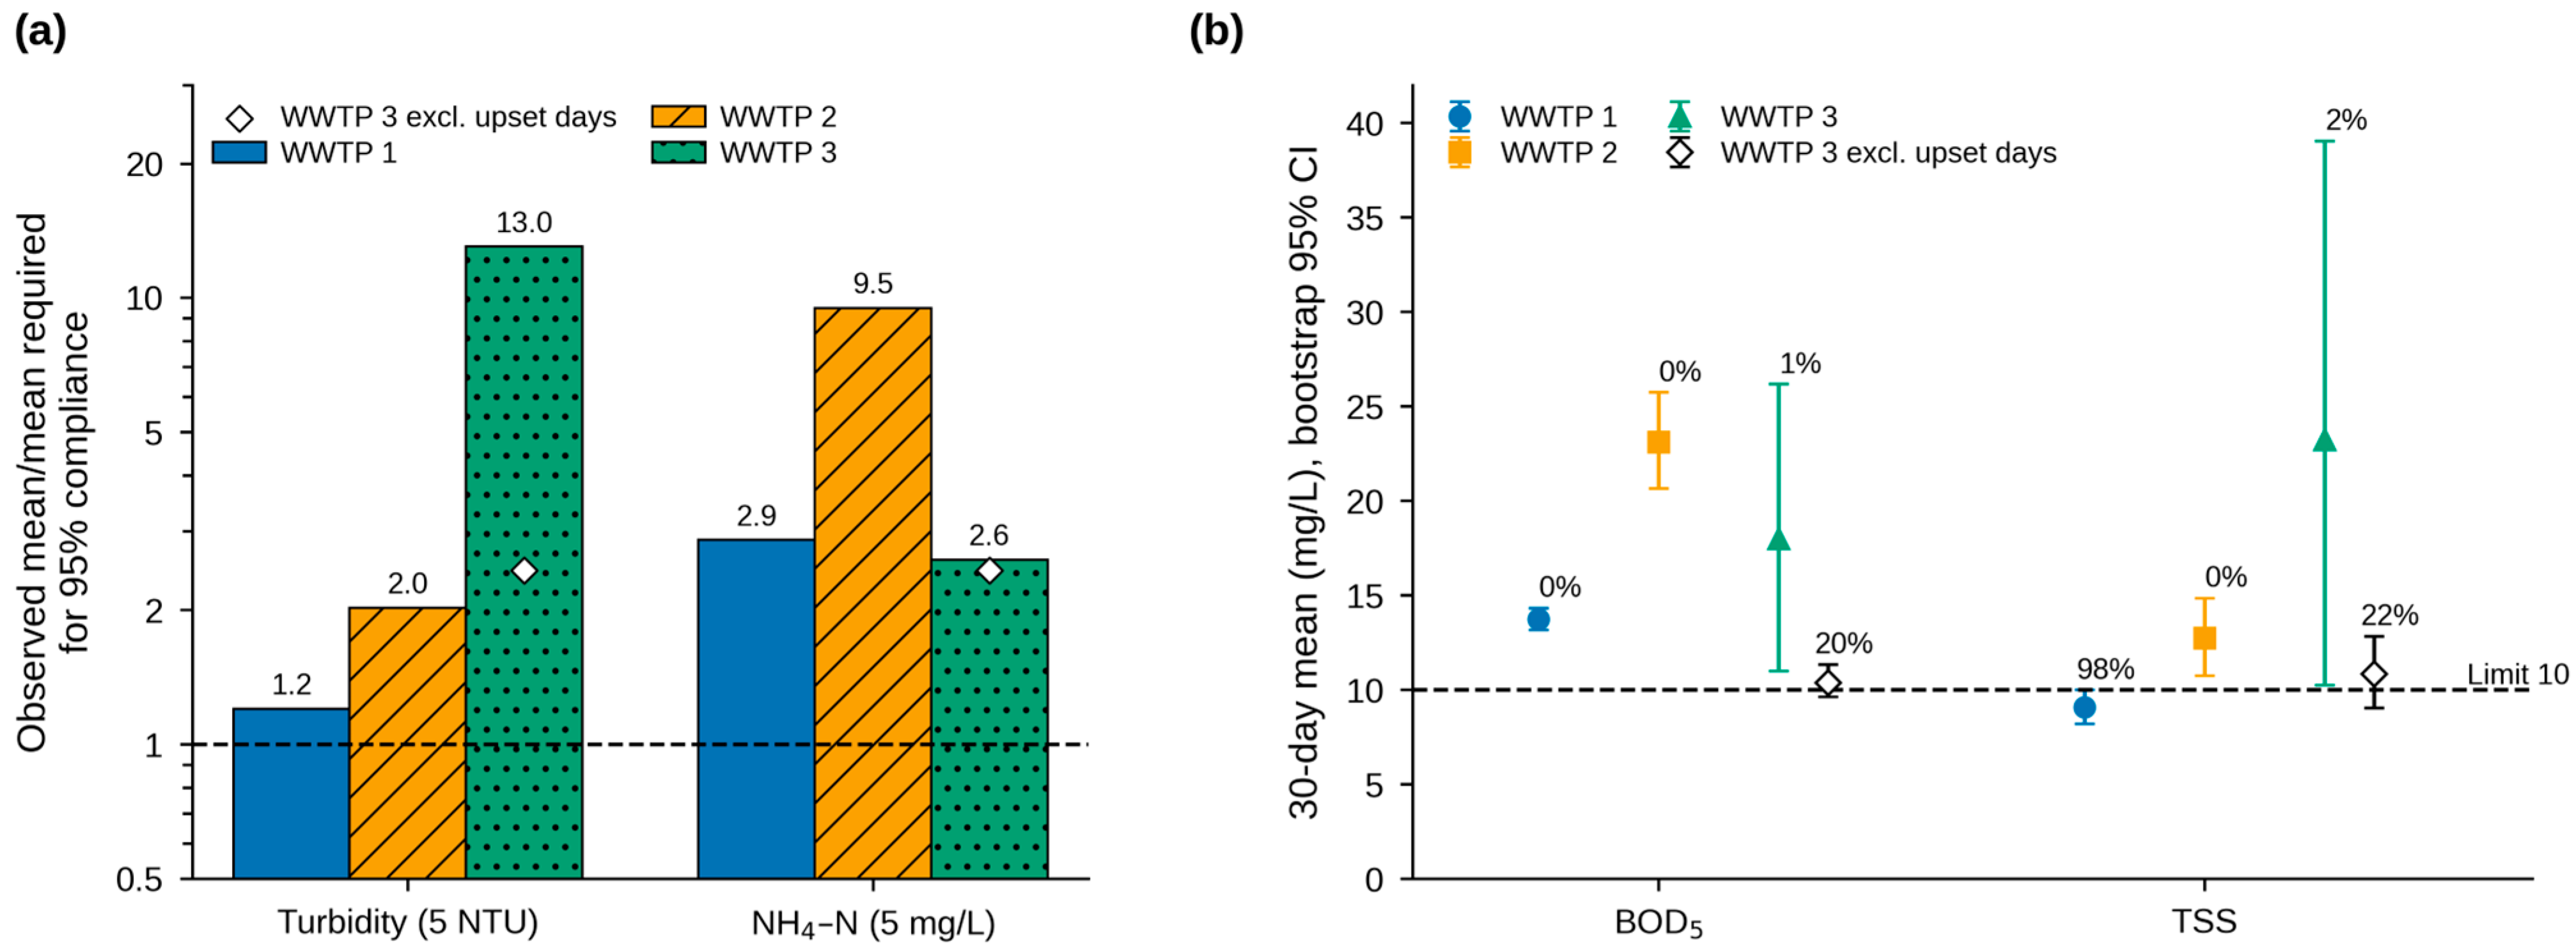
For the single-sample limits, the observed means exceeded the 95–reliability design means at every plant (Table 6, Figure 2a). For turbidity, the ratio of the observed to required mean was 1.2 at WWTP 1, 2.0 at WWTP 2 and 13.0 at WWTP 3; for NH4–N, it was 2.9, 9.5 and 2.6; at 90% reliability, all ratios were still above 1 (1.1–9.3; Table S2). The log-normal model reproduced the empirical compliance at WWTP 1 and for NH4–N at WWTP 2, but it underestimated compliance where occasional high values skewed the distribution, most strongly for turbidity at WWTP 3 (43% vs. 70% of days; Shapiro–Wilk test on log values p < 0.001, and p = 0.001 even without the upset days). The fitted probabilities in Table 6 should therefore be read alongside the observed percentages. Empirical compliance, which does not rely on the log-normal assumption, was below 95% in every case; its block-bootstrap 95% confidence interval (Table S2) excluded 95% compliance for NH4–N at all three plants and for turbidity at WWTP 2 and WWTP 3, but not for turbidity at WWTP 1. Without the upset days, the WWTP 3 ratios fell to 2.4 for turbidity and 2.4 for NH4–N, which are still well above 1.
Table 6.
Reliability of meeting the single-sample unrestricted-irrigation limits (turbidity 5 NTU, NH4–N 5 mg/L), April 2026. CV, coefficient of variation; COR, coefficient of reliability for 95% reliability (Equation (2)); mx, mean required for 95% compliance (Equation (1)); Ratio, observed mean/mx; P, compliance probability from the fitted log-normal distribution; Obs., observed percentage of compliant days.
Figure 2.
Reliability of meeting the unrestricted-irrigation limits, April 2026. (a) Ratio of the observed mean to the mean required for 95% compliance with the single-sample limits for turbidity (5 NTU) and NH4–N (5 mg/L), calculated with the coefficient of reliability [25]; ratios above 1 (dashed line) indicate exceedance on more than 5% of days (logarithmic scale). (b) Observed mean BOD5 and TSS with block-bootstrap 95% confidence intervals of the 30-day mean, compared with the 10 mg/L monthly mean limit; labels give the probability that a 30-day mean meets the limit. Open diamonds: WWTP 3 without the three upset days.
For the averaged limits, the bootstrap probability that a 30-day mean BOD5 meets 10 mg/L was 0% at WWTP 1 (95% CI of the 30-day mean 13.2–14.3 mg/L), 0% at WWTP 2 (20.7–25.7 mg/L) and 1% at WWTP 3 (11.0–26.2 mg/L), rising to 20% at WWTP 3 without the upset days (Table 7; Figure 2b). For TSS the probability was 98% at WWTP 1, 0% at WWTP 2 and 2% at WWTP 3 (22% without upsets). The 15 mg/L weekly BOD5 limit was met with 97% probability at WWTP 1, 0% at WWTP 2 and 47% at WWTP 3. Thus, WWTP 1 would reliably meet the unrestricted TSS requirement but not the BOD5 requirement, WWTP 2 meets neither, and WWTP 3 is close to both limits in normal operation but fails them when upsets occur. Analysed separately, the two trains of WWTP 1 gave the same conclusions (Table S1).
Table 7.
Reliability of meeting the averaged unrestricted-irrigation limits for BOD5 and TSS (monthly mean 10 mg/L; weekly mean 15 mg/L), April 2026: observed mean, block-bootstrap 95% CI of the 30-day mean, and probabilities that a 30-day mean is ≤10 mg/L and a 7-day mean is ≤15 mg/L.
3.4. Residual Chlorine over Two Years
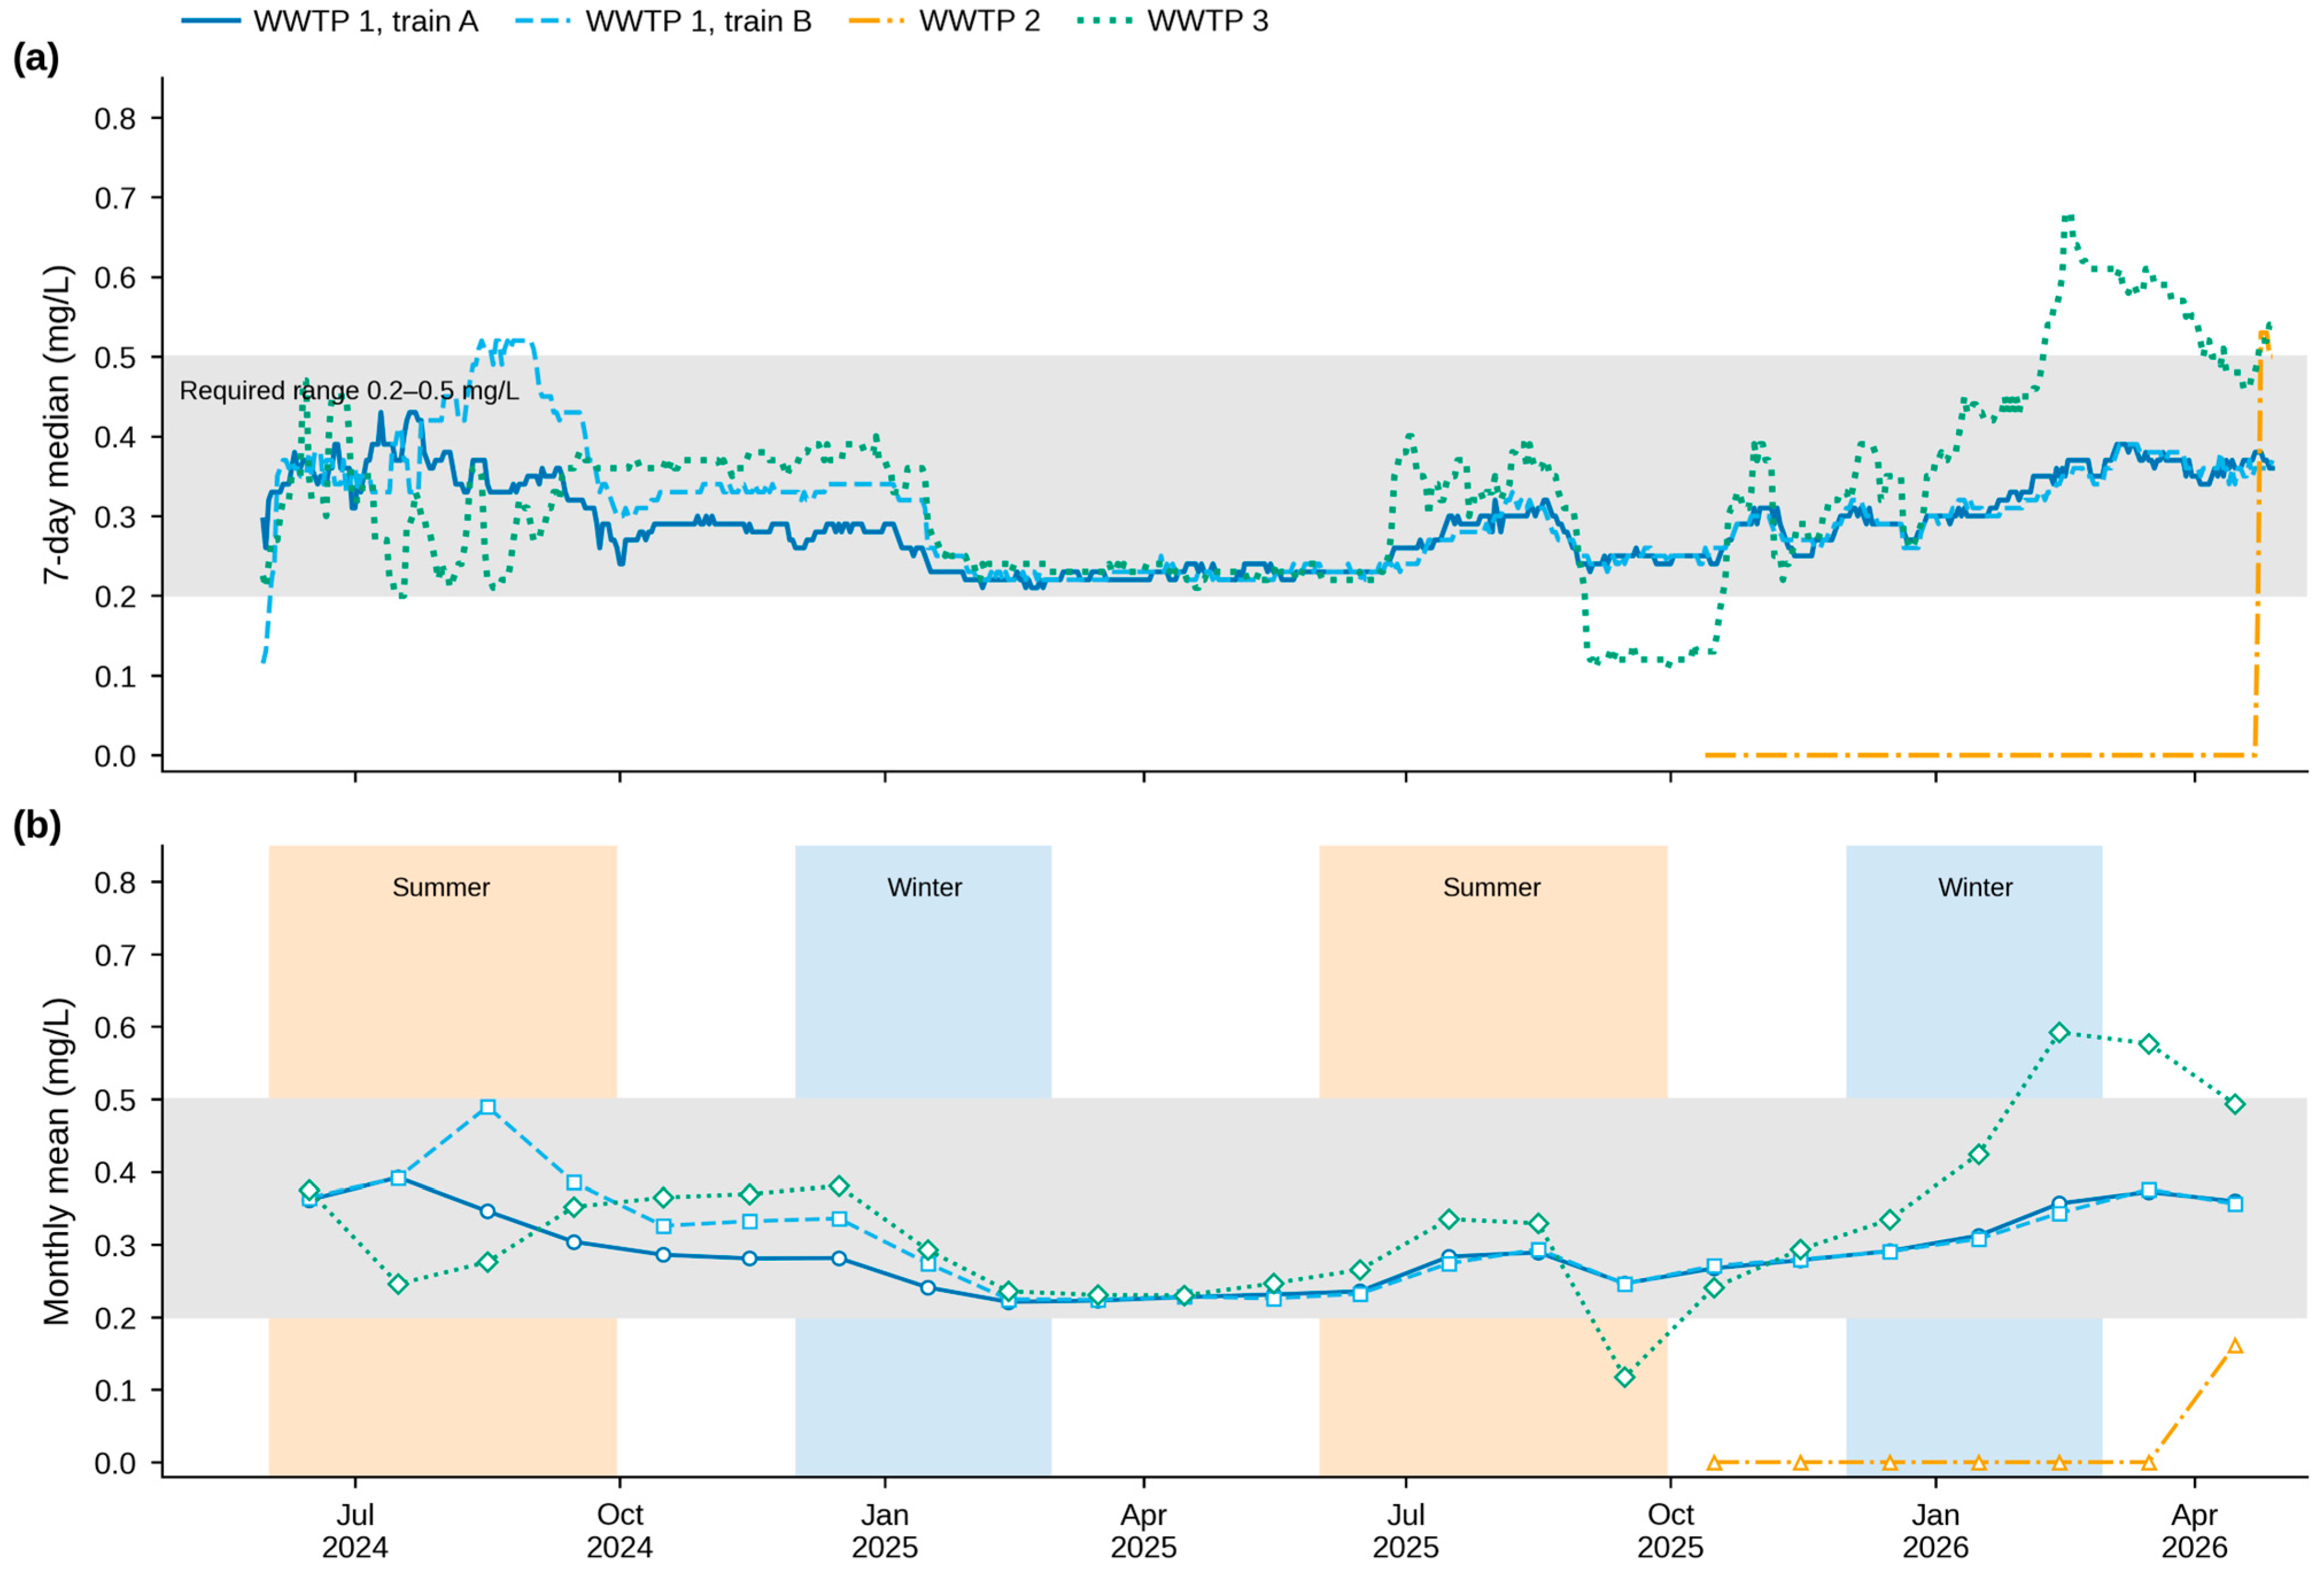
The two-year record shows marked differences in disinfection control between plants (Figure 3). At WWTP 1, the residual was within the required 0.2–0.5 mg/L range on 99.6% of 702 days in train A and 96.9% in train B (medians 0.28 and 0.30 mg/L), with most values between 0.22 and 0.40 mg/L. At WWTP 3, the residual was within range on 82.2% of 697 days (median 0.33 mg/L); it was below 0.2 mg/L on 7.9% of days, mainly during several weeks in September–October 2025 when the 7-day median fell to about 0.12 mg/L, and above 0.5 mg/L on 9.9% of days, mostly from February 2026 onwards. At WWTP 2, the residual was below 0.2 mg/L on 95.5% of 201 days between October 2025 and April 2026 (zero on 192 days) until chlorination resumed on about 20 April 2026; the reason for the absence of a residual was not documented in the records. Monthly mean residuals did not differ significantly between summer (June–September) and winter (December–February) at WWTP 1 (either train) or WWTP 3 (p = 0.23–0.49; Figure 3b). The differences were small (−0.09 to +0.04 mg/L), but with only 6–8 months per season, their 95% confidence intervals (−0.22 to +0.12 mg/L) do not exclude seasonal effects of practical size.
Figure 3.
Residual chlorine (recorded as free chlorine) in the final effluent of the three WWTPs, 27 May 2024 to 28 April 2026 (WWTP 2 from 10 October 2025): (a) 7-day rolling median of daily values; (b) monthly means (months with at least 20 daily values), with summer (June–September) shaded orange and winter (December–February) shaded blue. Line colors and styles identify the plants and trains (legend above panel (a)). The grey band in both panels is the required range of 0.2–0.5 mg/L [16]. Five entries above 2 mg/L (2.5–20 mg/L) at WWTP 3 were excluded (Section 2.2).
3.5. Salinity and Crop Suitability
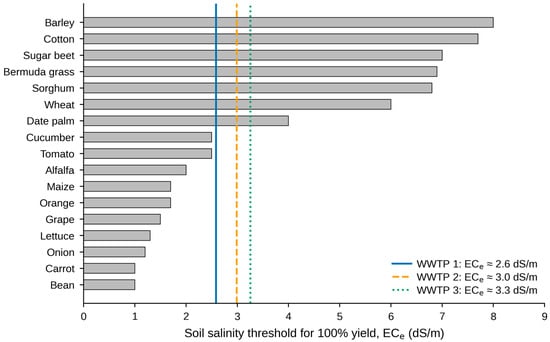
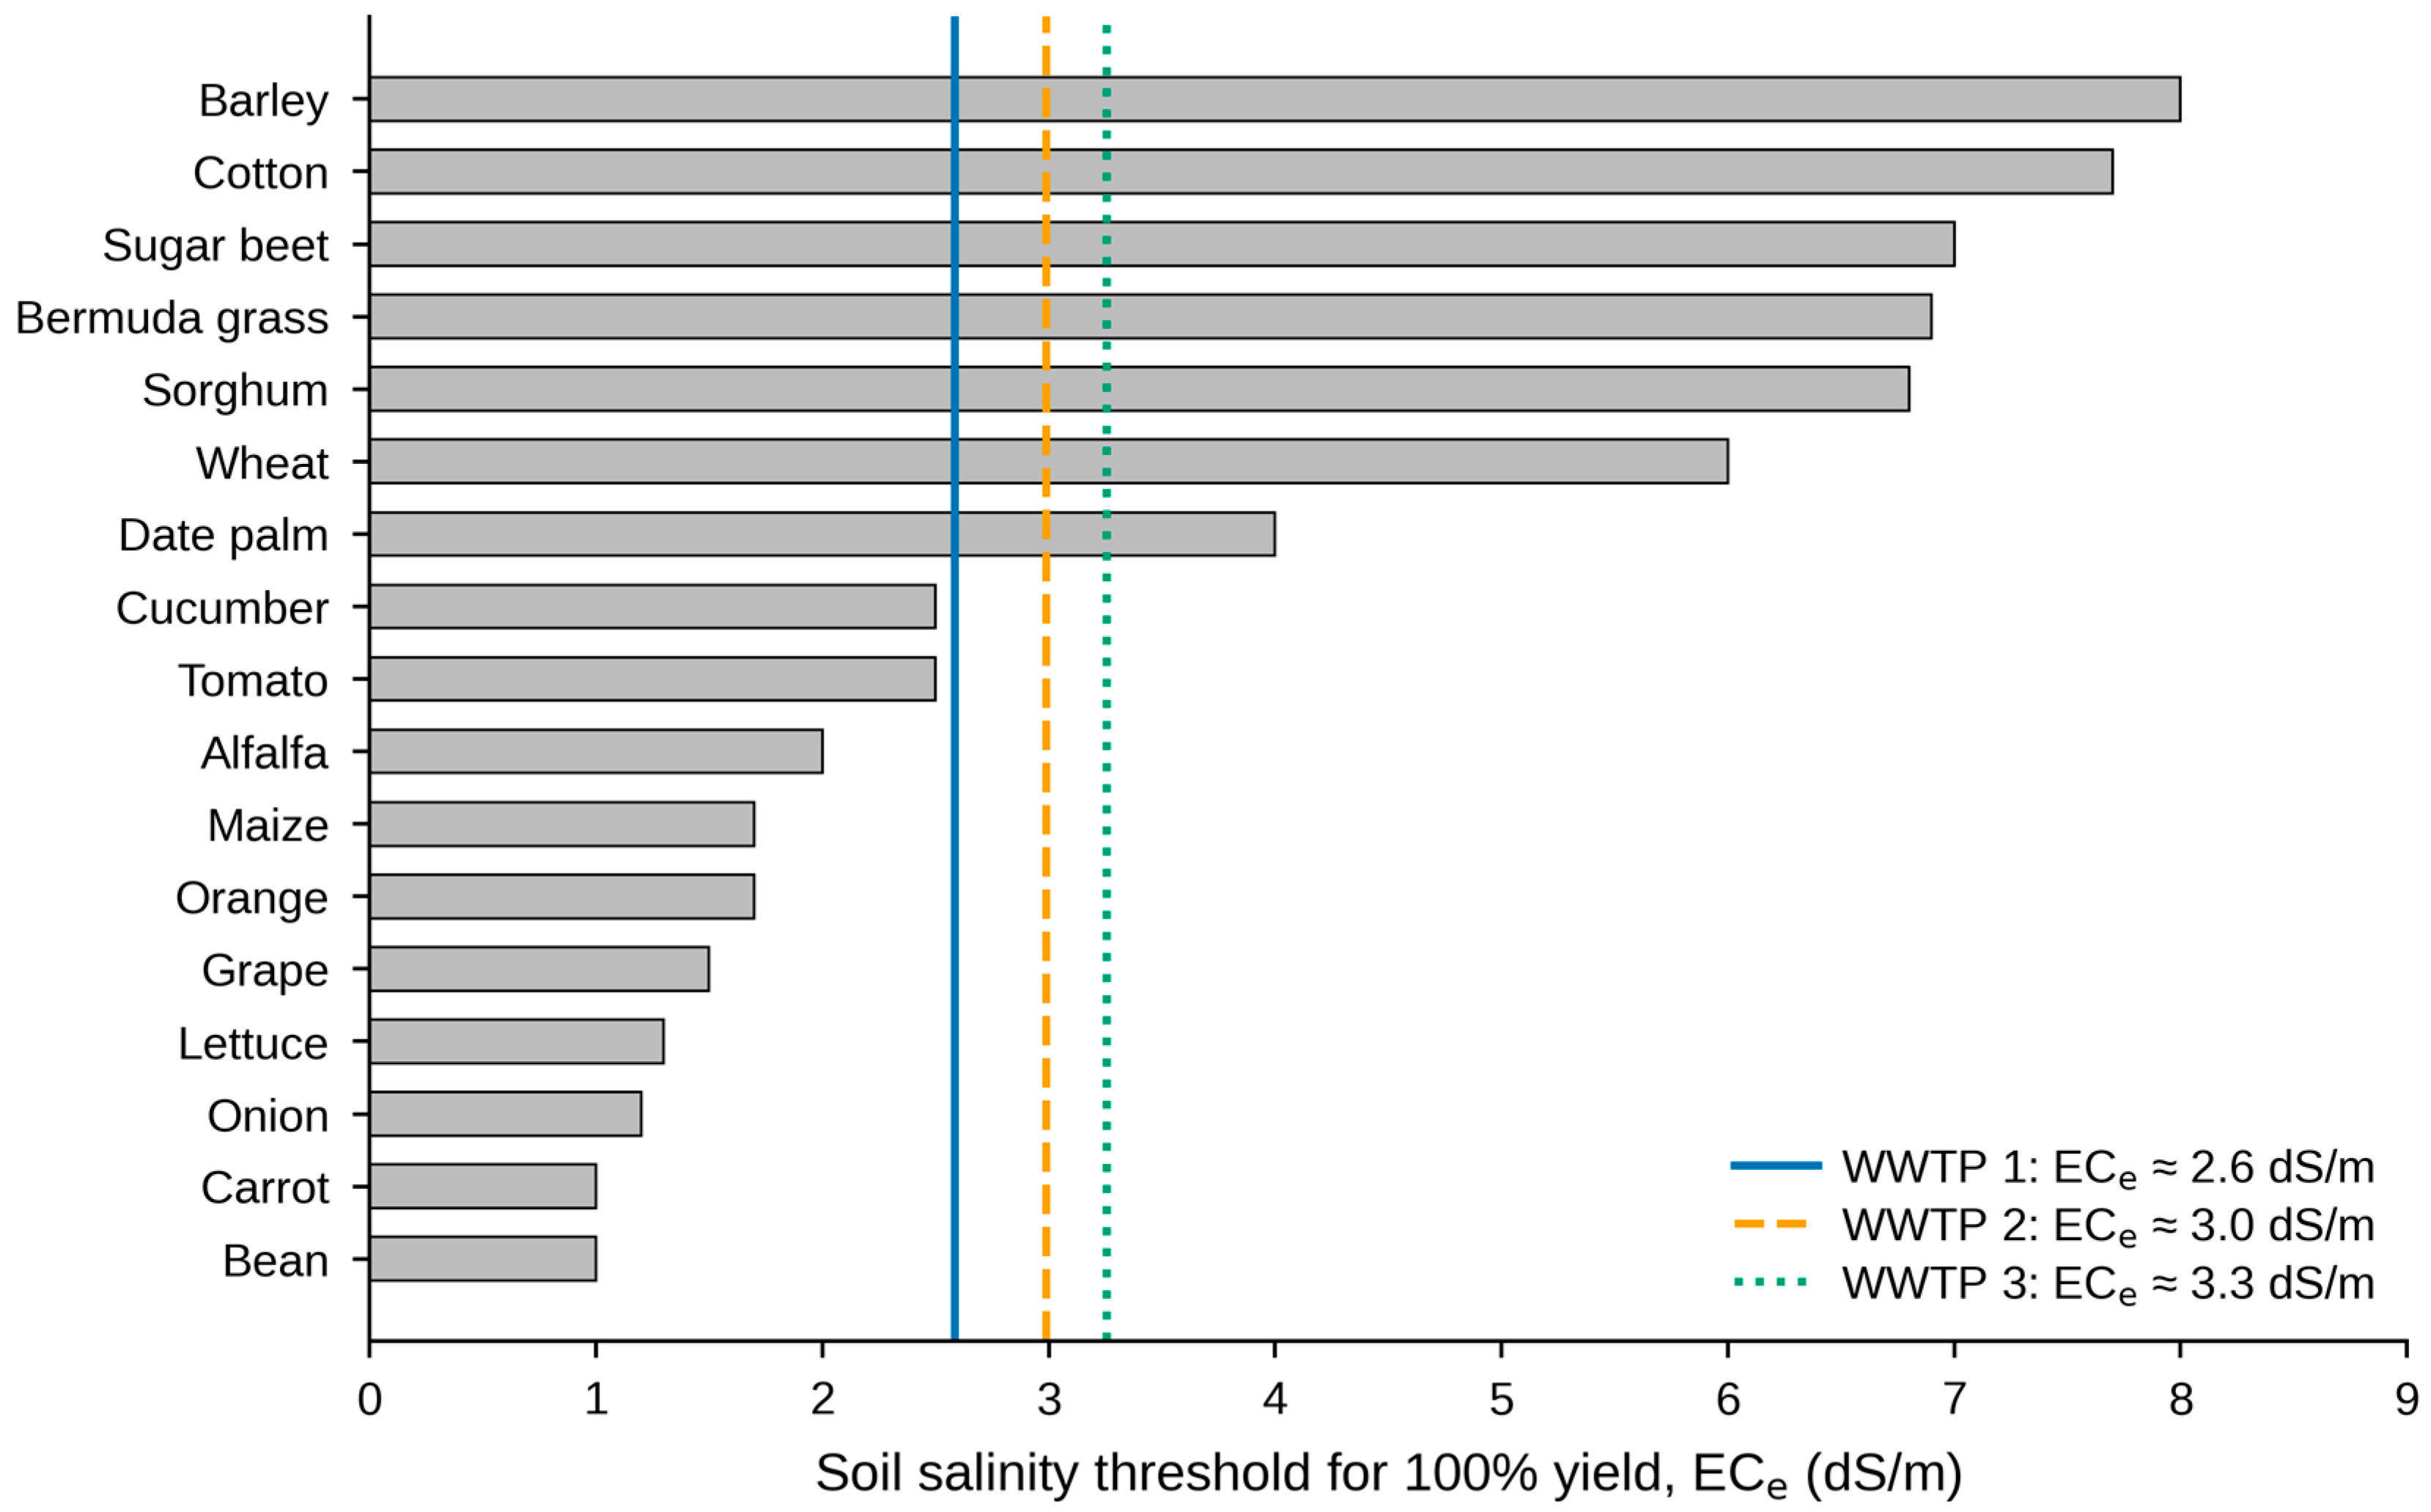
The effluent EC averaged 1.72 ± 0.13, 1.99 ± 0.08 and 2.17 ± 0.14 dS/m at WWTPs 1, 2 and 3 (TDS 1282, 1499 and 1658 mg/L; TDS/EC ratio 0.74–0.76). All three effluents fall in the high-salinity class C3 of the U.S. Salinity Laboratory scheme [28]. WWTP 3 exceeded the C3/C4 boundary of 2.25 dS/m on 6 of 27 days. All fall in the slight-to-moderate degree of restriction of FAO [5], and all values were below the 2500 mg/L TDS limit. Under long-term irrigation with a 15–20% leaching fraction, the expected root-zone salinity is about 2.6, 3.0 and 3.3 dS/m (Figure 4, Table 8). At these levels, date palm, wheat, sorghum, Bermuda grass, sugar beet, cotton and barley would be expected to give full yield; alfalfa (91–96%) and tomato (92–99%) small yield reductions; maize, citrus and grape moderate reductions (75–90%); and salt-sensitive vegetables such as lettuce, onion, carrot and bean substantial reductions (57–83%). These estimates address osmotic salinity only, citrus, grape and date palm are also sensitive to chloride, sodium or boron, which were not measured.
Figure 4.
Soil salinity thresholds for 100% yield (ECe) of selected crops [5] compared with the expected root-zone salinity under irrigation with effluent from each WWTP (ECe ≈ 1.5 ECw, leaching fraction 15–20%). Effluent EC: mean of daily values, 1–27 April 2026. Thresholds compiled from [5]; the figure is prepared for this study.
Table 8.
Expected relative yield (%) of selected crops under long-term irrigation with effluent from each WWTP, estimated with Equation (4) using thresholds a from FAO-29 [5] and slopes b from Maas and Hoffman [29]. Parameters compiled from [5,29], with relative yields calculated in this study.
3.6. Nutrient Supply
Total nitrogen averaged 8.2, 48.2 and 7.3 mg/L at WWTPs 1, 2 and 3, equivalent to 82, 482 and 73 kg N/ha for every 1000 mm of irrigation, and PO4–P averaged 1.9, 1.7 and 2.2 mg/L (19, 17 and 22 kg P/ha per 1000 mm), respectively. Effluent from WWTP 1 and WWTP 3 therefore supplies a useful fraction of the nitrogen demand of most field crops, whereas effluent from WWTP 2 would supply nitrogen in excess of the requirement of most crops at typical arid-zone irrigation depths and almost entirely as ammonium.
4. Discussion
4.1. Allowable Uses Under Current Performance
With respect to organic matter and suspended solids, all three plants produced effluent consistent with restricted irrigation: monthly mean BOD5 and TSS were far below 40 mg/L, daily values exceeded 40 mg/L only on upset days at WWTP 3, no faecal coliform result reached 2.2 per 100 mL, and nematode eggs were absent. This supports continued use of the effluent for fodder and pasture, industrial and bioenergy crops, cereals grown for grain, date palms and other trees, and urban landscapes [7,9,21]. Compliance with the restricted class is nevertheless incomplete, because the ammonia, turbidity and residual chlorine limits apply to both classes [16]. All limits were met together on only 30% of days at WWTP 1 and WWTP 3 and on no days at WWTP 2. The appropriateness of some Saudi limits, particularly for nitrogen, has been questioned [17], and this finding underlines the need for the regulator and operator to agree on how compliance is assessed in practice.
For unrestricted irrigation, none of the plants met the BOD5 requirement, and only WWTP 1 met the TSS requirement. The bootstrap analysis indicates that, for the April 2026 performance, a compliant monthly BOD5 mean is very unlikely at any plant and that WWTP 3 would approach the limits only if upsets were eliminated. This conclusion does not depend on BOD5 alone: even if part of the measured BOD5 were nitrogenous (Section 4.5), no plant would qualify, because every plant also exceeded the ammonia limit (on 30–100% of days) and the turbidity limit (on 15–56% of days). Food crops eaten raw, including leafy and root vegetables, should therefore not be irrigated with this effluent at present [12,13], and conditionally suitable food crops should be irrigated only by drip or subsurface drip that avoids wetting edible parts [9,31]. These conclusions rest on one month of detailed data, so they describe performance in April 2026 rather than year-round reliability; a full year of daily records would be needed to confirm them across seasons.
4.2. Causes of Non-Compliance
The absence of nitrification at WWTP 2 is the clearest single deficiency. WWTP 2 shares its site and sewer catchment with WWTP 1, and the influent composition, alkalinity, temperature, aerobic zone DO (2.59 mg/L) and MLSS (5869 mg/L) were similar at the two plants, yet WWTP 1 removed 84% of influent NH4–N, and WWTP 2 removed none. Both plants operated close to their design capacities (102–103%), so overloading relative to design does not explain the difference. Reactor volumes and solids retention times were not available, so the cause cannot be identified from the present data. Possible explanations include a solids retention time that is too short for nitrifiers (WWTP 2 treats a similar flow with four biological reactors, versus eight at WWTP 1), inhibition by industrial discharges (WWTP 2 had the highest effluent phenol and TOC), insufficient aeration in parts of the reactors not represented by the DO measurements, and operation for carbon removal only [30]. Effluent temperatures of 20–24 °C during the study were favourable for nitrification [30], so low temperature is unlikely to explain the deficit. Measuring the solids retention time and testing the influent for nitrification inhibition are the obvious first steps.
At WWTP 3, the median effluent quality was close to the unrestricted BOD5 and TSS limits (medians 10.0 and 9.5 mg/L), but the variability was high, driven by three upset days with sharply elevated solids and turbidity. The high SVI at WWTP 3 (189 mL/g) indicates poor sludge settleability, which may contribute to such solids excursions; shock loads of suspended solids have also been reported to disturb activated-sludge performance [32]. In addition, about 30% of the influent flow at WWTP 3 received secondary treatment only, and an overflow bypass was recorded on some days; thus, any blending of these streams with the tertiary effluent before reuse would further reduce reliability. Turbidity exceeded 5 NTU on 15–56% of days at all plants, indicating that tertiary solids removal is the second common constraint after nitrification.
Residual chlorine control differed sharply between plants. WWTP 1 maintained a residual within the required range on more than 96% of days over two years, showing that stable control is achievable at these plants. WWTP 3 had periods both below the 0.2 mg/L floor (September–October 2025) and above the 0.5 mg/L maximum (from February 2026), indicating dose control that is not tied to the regulatory range. At WWTP 2, the near absence of a residual for six months is a disinfection-reliability concern even though no faecal coliform result reached 2.2 per 100 mL on the days analysed, because the residual protects the effluent during storage and distribution [7,10]. In ammonia-rich effluent, applied chlorine forms chloramines, and free chlorine readings by colorimetric methods can include combined chlorine [33]. With 43.7 mg/L NH4–N at WWTP 2, a true free residual would require breakpoint dosing far above normal practice, so the residuals reported for WWTP 2 in late April 2026, and possibly part of those at the other plants, may represent combined chlorine. Because the measurement method was not documented, free and combined chlorine cannot be distinguished here; the conclusion for WWTP 2 therefore rests on the 192 days with zero residual, which show an absence of disinfectant whatever the method, and not on the positive readings of late April.
4.3. Pathways to Extending TSE Use to Crop Irrigation
The results point to a small number of plant-specific measures, summarised in Table 9. At WWTP 2, establishing nitrification, by increasing the sludge age or aerobic volume, or by adding reactor capacity, is the precondition for meeting the ammonia limit and for effective chlorination. It would also remove the excess ammonium supply (482 kg N/ha per 1000 mm) that would otherwise risk nitrate leaching below the root zone [5,9]. At all plants, improving secondary clarification and tertiary solids removal addresses turbidity, TSS and the particulate fraction of BOD5 together [30]. At WWTP 1 and WWTP 3, the high SVI suggests that sludge settleability should be investigated first. Controlling chlorine dose on the measured residual, with the 0.2–0.5 mg/L range as the control band, would bring disinfection into compliance at WWTP 2 and WWTP 3 [33]. Reliability-based targets can replace long-term averages as operational targets [26]. For example, for 95% compliance with the 5 NTU limit at its April variability, WWTP 1 would need a mean turbidity of no more than 3.2 NTU (Table 6) and WWTP 3, even without upsets, of no more than 2.0 NTU; the corresponding NH4–N targets are 2.3–2.4 mg/L at WWTP 1 and WWTP 3. Operators can track such targets with a running 30-day mean and coefficient of variation computed from routine daily data and should treat a rising coefficient of variation, which lowers mx, as an early warning even while the mean is still below the limit; for the averaged BOD5 and TSS limits, the bootstrap probabilities in Table 7 can be updated in the same way.
Table 9.
Priority measures for extending TSE use from restricted to unrestricted irrigation.
On the agricultural side, salinity is the main agronomic constraint for all three effluents. Crop choice should favour moderately tolerant to tolerant species. Leaching and adequate drainage are needed to keep root-zone salinity near the levels assumed in Table 8 [5,34]. Blending with lower-salinity water would widen the range of crops that can be grown without yield loss [5,14], but in Riyadh, the main lower-salinity sources are desalinated supply and limited fresh groundwater, both of which are in high demand for other uses [2], so blending is unlikely to be a general solution. Drip and subsurface drip irrigation reduce crop contamination and can be managed to limit salinity stress in the root zone [9,31,35]. Studies of TSE irrigation report acceptable crop yields for oilseeds [36] and quantify the soil chemical changes that require monitoring under vegetables [37]. Long-term irrigation with saline effluent also requires periodic monitoring of soil salinity and permeability [38]. Since major ions were not available, sodium and bicarbonate hazards could not be assessed here. Earlier work on Riyadh effluent reported sodium adsorption ratios classified as low hazard [18,19], but this should be confirmed with current data before sensitive crops are considered.
Moving these plants towards unrestricted reuse also requires monitoring that can demonstrate compliance. For each plant, we recommend: (i) daily 24 h flow-proportional composite samples of final effluent for BOD5 (with a nitrification inhibitor, reported as carbonaceous BOD5), TSS and NH4–N and daily measurement of turbidity and of free and total chlorine by the DPD method [27]; (ii) faecal coliforms or E. coli at least weekly by a documented method with its detection limit [27]; (iii) monthly major ions (Na, Ca, Mg, K, Cl, HCO3 and SO4), boron and the trace elements listed in the regulation [16]; (iv) helminth eggs and, where food crops are irrigated, periodic screening for pathogens beyond faecal indicators and for selected contaminants of emerging concern [9,10]; and (v) annual reporting of reliability statistics (monthly means, coefficients of variation and percentages of compliant days) alongside the regulatory averages. At least 12 months of such data would allow seasonal reliability to be established.
4.4. Comparison with Previous Assessments
Table 10 compares the present study with previous assessments of Riyadh effluent. Al-Jasser [18] found that faecal coliforms were the main reason that Riyadh plants did not meet the unrestricted limits. No faecal coliform result reported here reached 2.2 per 100 mL, but because the method was not documented, improvement since [18] cannot be inferred; on the present data, the binding constraints are nitrogen, BOD5 reliability and chlorine control. The conclusion of Elfeky et al. [19] that Riyadh’s effluent is appropriate for irrigation is consistent with our finding for restricted uses. The reliability analysis adds that average-based indices can mask how often unrestricted limits are exceeded. The EC observed here (1.7–2.2 dS/m) is similar to that reported for Riyadh effluent in 2013–2020 (1.74–2.42 dS/m) [19], indicating that salinity is a persistent feature of Riyadh’s TSE rather than a feature of the study period.
Table 10.
Comparison with previous assessments of Riyadh treated effluent.
4.5. Limitations
The most important limitation is the length of the record. The detailed effluent data cover one month (April 2026), so this study is a short-term screening: seasonal variation in treatment performance could not be assessed, the reliability estimates assume that April 2026 is representative of other months, and the two-year chlorine record cannot exclude moderate seasonal effects (Section 3.4). Second, the data are plant records; the author did not sample or analyse the effluent, and the sampling basis and analytical quality control could not be verified. Third, several methods were not documented, and each affects a specific result: (i) faecal coliforms were recorded only as non-integer values below 2.2 per 100 mL, so microbiological compliance could not be demonstrated, and no improvement over earlier studies is claimed; (ii) free and combined chlorine could not be distinguished, which affects the late-April readings at WWTP 2 but not the finding that no residual was present on 192 days; (iii) if no nitrification inhibitor was used, the BOD5 at WWTP 1 and WWTP 3, whose effluents come from nitrifying processes and contained 6.9 and 5.8 mg/L NH4–N, may include nitrogenous demand and overstate carbonaceous BOD5, although the unrestricted-irrigation conclusion is unchanged because the ammonia and turbidity limits were also exceeded; and (iv) the WWTP 3 flow imbalance affects only the description of that plant. Fourth, major ions, boron, trace elements, contaminants of emerging concern and pathogens other than faecal indicators were not available, so sodium, bicarbonate and specific-ion hazards and the chemical and wider microbiological risks to food crops were not assessed; the salinity results address osmotic effects only. Finally, the two trains of WWTP 1 were combined; their effluents were closely correlated for NH4–N and TKN (r = 0.99) but much less so for BOD5 (r = 0.07), TSS (0.84) and residual chlorine (0.32), although the train-level results lead to the same conclusions (Table S1), and the log-normal reliability model fitted poorly where upsets occurred, which is why empirical compliance is also reported.
5. Conclusions
Daily records from three large municipal WWTPs serving Riyadh, covering one month (April 2026), show that the effluent met the restricted-irrigation limits for BOD5 and TSS, although no plant met all restricted limits consistently because the ammonia, turbidity and residual chlorine limits apply to both classes, and that none of the plants reliably met the Saudi requirements for unrestricted irrigation during the study month; because the record is short, this is a screening result rather than a demonstration of long-term performance. Monthly mean BOD5 (13.7–23.1 mg/L) exceeded the 10 mg/L limit at all plants, with at most a 1% probability that a 30-day mean would comply. One plant did not nitrify and lacked a chlorine residual for six months, whereas the other plants maintained residuals within the required 0.2–0.5 mg/L on 82–99% of days over two years. Effluent salinity of 1.7–2.2 dS/m restricts crop choice to moderately tolerant and tolerant species. Extending TSE use to food crop irrigation in Riyadh therefore depends on establishing nitrification where it is absent, improving solids removal and sludge settleability, controlling chlorine within the regulatory range, and pairing these with salt-tolerant crops, leaching and drip irrigation. Reliability-based targets, rather than long-term means, should be used to judge readiness for unrestricted reuse, and at least a full year of daily records, with documented sampling and analytical methods, should be used to confirm these findings.
Supplementary Materials
The following supporting information can be downloaded at: https://www.mdpi.com/article/10.3390/w18212732/s1, Table S1: Effluent quality, compliance and reliability of the two trains of WWTP 1, April 2026 (mean ± SD, range in parentheses; n = 27 days, BOD5 n = 22); Table S2: Single-sample limits (turbidity 5 NTU; NH4–N 5 mg/L), April 2026: empirical compliance with block-bootstrap 95% confidence interval, empirical 95th percentile, and mean required for compliance (mx) and ratio of observed mean to mx at 90%, 95% and 99% reliability.
Funding
This research was funded by the Ongoing Research Funding Program (ORF-2026-529), King Saud University, Riyadh, Saudi Arabia.
Data Availability Statement
The daily monitoring data used in this study were provided by the treatment plant operator on a confidential basis and are not publicly available. Summary statistics supporting the findings are reported in the article and its Supplementary Materials. Further inquiries can be directed to the corresponding author.
Acknowledgments
The author thanks the operator of the treatment plants for providing the monitoring data. During the preparation of this manuscript, the author used Claude (Opus 5.5, Anthropic) for data analysis support, figure and table enhancement, and language editing. The author has reviewed and edited the output and takes full responsibility for the content of this publication.
Conflicts of Interest
The author declares no conflicts of interest. The funders had no role in the design of the study; in the collection, analyses, or interpretation of data; in the writing of the manuscript; or in the decision to publish the results.
Abbreviations
| BOD5 | five-day biochemical oxygen demand |
| COD | chemical oxygen demand |
| COR | coefficient of reliability |
| CV | coefficient of variation |
| DO | dissolved oxygen |
| DPD | N,N-diethyl-p-phenylenediamine |
| EC | electrical conductivity (ECw, water; ECe, soil saturation extract) |
| FAO | Food and Agriculture Organization of the United Nations |
| MEWA | Ministry of Environment, Water and Agriculture |
| MLSS | mixed-liquor suspended solids |
| MPN | most probable number |
| SVI | sludge volume index |
| TDS | total dissolved solids |
| TKN | total Kjeldahl nitrogen |
| TOC | total organic carbon |
| TSE | treated sewage effluent |
| TSS | total suspended solids |
| USSL | U.S. Salinity Laboratory |
| WWTP | wastewater treatment plant |
References
- Palma, P.; Tomaz, A. Agricultural Practices to Improve Irrigation Sustainability. Water 2024, 16, 817. [Google Scholar] [CrossRef] [Scilit]
- Suhail, M.; Faraj, T.K.; Ahmad, W.; Ravshanov, A.X.; Khan, M.N. Issues of Water Resources in Saudi Arabia: Past, Present, and Future. Sustainability 2024, 16, 4189. [Google Scholar] [CrossRef] [Scilit]
- Alhajri, M.F.; Jamil, R.; Abdalla, E.M.E.; Alqahtany, A.; Almazroua, S.; Al-Gehlani, W.A.G. Status of Wastewater Treatment and Reuse in Saudi Arabia and Its Forecasting for the Year 2035. Appl. Water Sci. 2025, 15, 167. [Google Scholar] [CrossRef] [Scilit]
- Haider, H.; Ghumman, A.R.; Al-Salamah, I.S.; Alharbi, A.; El-Ghoul, Y.; Martuza, M.A. A Strategic Approach to Sustainable Wastewater Management and Reuse in Saudi Arabia. Environ. Res. Commun. 2024, 6, 075009. [Google Scholar] [CrossRef] [Scilit]
- Ayers, R.S.; Westcot, D.W. Water Quality for Agriculture; FAO Irrigation and Drainage Paper 29 Rev. 1; FAO: Rome, Italy, 1985. [Google Scholar]
- Ofori, S.; Abebrese, D.K.; Růžičková, I.; Wanner, J. Reuse of Treated Wastewater for Crop Irrigation: Water Suitability, Fertilization Potential, and Impact on Selected Soil Physicochemical Properties. Water 2024, 16, 484. [Google Scholar] [CrossRef] [Scilit]
- Asano, T.; Burton, F.L.; Leverenz, H.L.; Tsuchihashi, R.; Tchobanoglous, G. Water Reuse: Issues, Technologies, and Applications; McGraw-Hill: New York, NY, USA, 2007. [Google Scholar]
- Avisar, D.; Ronen-Eliraz, G. Agricultural Irrigation with Effluent—What Should We Be Worried About? J. Basic Appl. Sci. 2019, 15, 32–39. [Google Scholar] [CrossRef] [Scilit]
- World Health Organization. WHO Guidelines for the Safe Use of Wastewater, Excreta and Greywater. Volume 2: Wastewater Use in Agriculture; WHO: Geneva, Switzerland, 2006. [Google Scholar]
- U.S. Environmental Protection Agency. 2012 Guidelines for Water Reuse; EPA/600/R-12/618; USEPA: Washington, DC, USA, 2012. [Google Scholar]
- Ritter, W.F. State Regulations and Guidelines for Wastewater Reuse for Irrigation in the U.S. Water 2021, 13, 2818. [Google Scholar] [CrossRef] [Scilit]
- Allende, A.; Monaghan, J. Irrigation Water Quality for Leafy Crops: A Perspective of Risks and Potential Solutions. Int. J. Environ. Res. Public Health 2015, 12, 7457–7477. [Google Scholar] [CrossRef] [Scilit]
- Reyes, G.A.; Suslow, T.V.; Chevez, Z.; Gerrity, D.; Leaman, S.; Davis, D.A. A Review of Reclaimed Water Use for Irrigation of Produce Crops and Food Safety Aspects in the United States. J. Food Prot. 2026, 89, 100824. [Google Scholar] [CrossRef] [Scilit]
- Zaman, M.; Shahid, S.A.; Heng, L. Irrigation Water Quality. In Guideline for Salinity Assessment, Mitigation and Adaptation Using Nuclear and Related Techniques; Springer: Cham, Switzerland, 2018; pp. 113–131. [Google Scholar] [CrossRef] [Scilit]
- Yerli, C.; Sahin, U. Quality Proficiency to Crop, Soil and Irrigation System of Recycled Wastewater from the Van/Edremit Wastewater Treatment Plant. Yuz. Yıl Univ. J. Agric. Sci. 2022, 32, 497–506. [Google Scholar] [CrossRef] [Scilit]
- Ministry of Water and Electricity. Executive Regulations of Law of Treated Sewage Water and Its Reuse Thereof (Law Issued by Royal Decree No. M/6 Dated 13/2/1422 AH); Ministry of Water and Electricity: Riyadh, Saudi Arabia, 2006; Available online: https://faolex.fao.org/docs/pdf/sau165261E.pdf (accessed on 1 October 2026).
- Aburizaiza, O.; Mahar, G. Standards of Wastewater Reuse/Disposal in KSA: Reconsideration. Int. J. Econ. Environ. Geol. 2017, 8, 56–65. [Google Scholar] [CrossRef] [Scilit]
- Al-Jasser, A.O. Saudi Wastewater Reuse Standards for Agricultural Irrigation: Riyadh Treatment Plants Effluent Compliance. J. King Saud Univ. Eng. Sci. 2011, 23, 1–8. [Google Scholar] [CrossRef] [Scilit]
- Elfeky, A.M.; Alfaisal, F.M.; El-Shafei, A. Analyzing Riyadh Treated Wastewater Parameters for Irrigation Suitability Through Multivariate Statistical Analysis and Water Quality Indices. Water 2025, 17, 709. [Google Scholar] [CrossRef] [Scilit]
- Badr, E.-S.A.; Tawfik, R.T.; Alomran, M.S. An Assessment of Irrigation Water Quality with Respect to the Reuse of Treated Wastewater in Al-Ahsa Oasis, Saudi Arabia. Water 2023, 15, 2488. [Google Scholar] [CrossRef] [Scilit]
- Aljeddani, G.S. Reusing Sewage Effluent in Greening Urban Areas: A Case Study of Southern Jeddah, Saudi Arabia. Sustainability 2023, 15, 645. [Google Scholar] [CrossRef] [Scilit]
- Neamatallah, A. Possibility of Using Sewage Effluent from Different Water Treatment Plants in Different Cities of Saudi Arabia for Agricultural Reuse. Int. J. Eng. Res. Technol. 2018, 7, 8–13. [Google Scholar] [CrossRef] [Scilit]
- Ibrahim, M. Effluent Quality Assessment of Selected Wastewater Treatment Plant in Jordan for Irrigation Purposes: Water Quality Index Approach. J. Ecol. Eng. 2019, 20, 206–216. [Google Scholar] [CrossRef] [Scilit]
- Alrowais, R.; Abdel-Daiem, M.M.; Maklad, M.A.; Ounaies, W.; Said, N. Hydrogeochemical and GIS-Integrated Evaluation of Drainage Water for Sustainable Irrigation Management in Al-Jouf, Saudi Arabia. Water 2026, 18, 78. [Google Scholar] [CrossRef] [Scilit]
- Niku, S.; Schroeder, E.D.; Samaniego, F.J. Performance of Activated Sludge Processes and Reliability-Based Design. J. Water Pollut. Control Fed. 1979, 51, 2841–2857. [Google Scholar]
- Oliveira, S.C.; von Sperling, M. Reliability Analysis of Wastewater Treatment Plants. Water Res. 2008, 42, 1182–1194. [Google Scholar] [CrossRef] [Scilit]
- Baird, R.B.; Eaton, A.D.; Rice, E.W. (Eds.) Standard Methods for the Examination of Water and Wastewater, 23rd ed.; American Public Health Association: Washington, DC, USA, 2017. [Google Scholar]
- Richards, L.A. (Ed.) Diagnosis and Improvement of Saline and Alkali Soils; Agriculture Handbook No. 60; United States Department of Agriculture: Washington, DC, USA, 1954. [Google Scholar]
- Maas, E.V.; Hoffman, G.J. Crop Salt Tolerance—Current Assessment. J. Irrig. Drain. Div. 1977, 103, 115–134. [Google Scholar] [CrossRef] [Scilit]
- Metcalf & Eddy; Tchobanoglous, G.; Stensel, H.D.; Tsuchihashi, R.; Burton, F. Wastewater Engineering: Treatment and Resource Recovery, 5th ed.; McGraw-Hill Education: New York, NY, USA, 2014. [Google Scholar]
- Qiu, Z.; Sun, M. Mechanisms of Impact on the Soil Environment of Drip Irrigation Applying Treated Sewage Effluent: A Review in China. Water Supply 2022, 22, 5785–5799. [Google Scholar] [CrossRef] [Scilit]
- He, L.; Tan, T.; Gao, Z.; Fan, L. The Shock Effect of Inorganic Suspended Solids in Surface Runoff on Wastewater Treatment Plant Performance. Int. J. Environ. Res. Public Health 2019, 16, 453. [Google Scholar] [CrossRef] [Scilit]
- Black & Veatch Corporation. White’s Handbook of Chlorination and Alternative Disinfectants, 5th ed.; John Wiley & Sons: Hoboken, NJ, USA, 2010. [Google Scholar]
- Javadi, A.; Mostafazadeh-Fard, B.; Shayannejad, M.; Mosaddeghi, M.R.; Ebrahimian, H. Soil Physical and Chemical Properties and Drain Water Quality as Affected by Irrigation and Leaching Managements. Soil Sci. Plant Nutr. 2019, 65, 321–331. [Google Scholar] [CrossRef] [Scilit]
- Hoogendijk, K.; Myburgh, P.A.; Howell, C.L.; Hoffman, J.E. Irrigation of Agricultural Crops with Municipal Wastewater—A Review. S. Afr. J. Enol. Vitic. 2023, 44, 31–54. [Google Scholar] [CrossRef] [Scilit]
- Dubey, R.; Bramhanand, P.; Raychaudhuri, M.; Singh, N.R.; Ajay, A.; Kumar, S. Effect of Wastewater Irrigation on Yield, Water Productivity and Economics of Sunflower and Toria Crop. J. Exp. Agric. Int. 2024, 46, 265–271. [Google Scholar] [CrossRef] [Scilit]
- Silva, W.R.D., Jr.; Sandri, D.; Figueiredo, C.C.D.; Pereira, R.M. Chemical Attributes of Soil Irrigated with Treated Sewage Effluent and Cultivated with Bell Pepper. Rev. Ambient. Água 2019, 14, e2341. [Google Scholar] [CrossRef] [Scilit]
- Sposito, G.; Oster, J.D.; Smith, C.J.; Assouline, S. Assessing Soil Permeability Impacts from Irrigation with Marginal-Quality Waters. CAB Rev. 2016, 1–7. [Google Scholar] [CrossRef] [Scilit]

Disclaimer/Publisher’s Note: The statements, opinions and data contained in all publications are solely those of the individual author(s) and contributor(s) and not of MDPI and/or the editor(s). MDPI and/or the editor(s) disclaim responsibility for any injury to people or property resulting from any ideas, methods, instructions or products referred to in the content. |
© 2026 by the author. Licensee MDPI, Basel, Switzerland. This article is an open access article distributed under the terms and conditions of the Creative Commons Attribution (CC BY) license.