


Abstract
In the Yellow River Delta, changes in the Yellow River’s main stream flow, groundwater exchange, and seasonal precipitation jointly regulate soil water and influence local hydrological processes. Understanding the sources of soil water is crucial for water resource management in this region. A total of 210 soil water samples were collected between August and October 2022 and analyzed for δ2H and δ18O. Subsequently, the contribution of each water source in the 10–100 cm soil profile was quantified using a five-source Bayesian mixture model. The results showed that the isotopic characteristics of the six types of water bodies were different, with surface water and tidal water having a higher degree of evaporation enrichment than precipitation and Yellow River water. The isotopic changes in soil water during the flood season and the post-flood season are mainly concentrated in the shallow and middle layers of the soil profile, while the changes in the deeper layers are relatively small. The Bayesian mixture model analysis results show that the Yellow River water is the main water source of the entire soil profile, with a contribution rate of 39.7–57.1%, followed by precipitation (23.5–37.2%), while the contribution rates of groundwater, local surface water and tides are relatively low. The probability of the Yellow River as the main water source ranges from 55.9% to 80.8% at different depths. These findings indicate that the Yellow River water source has a continuous impact on soil water at different depths in the Yellow River Delta, deepening understanding of soil water recharge processes and water source connections in the coastal delta.
1. Introduction
Coastal deltas are key interfaces for land–sea interaction, and their water exchange is jointly regulated by multiple factors, including river runoff, precipitation, groundwater, tidal intrusion, and intense evaporation. In this complex system, soil water occupies a central position, serving as a link between precipitation, surface water, groundwater, and vegetation water requirements, and exhibits rapid response characteristics to seasonal hydrological fluctuations. Soil water of this research refers to water held within soil pores, which can receive inputs from precipitation, surface water, and groundwater and be depleted through evaporation, plant uptake, and outflow. Compared to upland catchments, delta regions typically have low hydraulic gradients, shallow water tables, dense river networks and drainage systems, and extensive agricultural activities. These conditions collectively promote frequent mixing between different water bodies [1]. The Yellow River Delta is a typical river-controlled coastal delta in China. Its current hydrological conditions are affected not only by monsoon precipitation, but also by the combined effects of Yellow River runoff regulation, agricultural irrigation, and groundwater interaction. The aforementioned processes complicate the sources and redistribution mechanisms of soil moisture, making it difficult to clarify the proportional contributions of different water sources to the soil profile. Clarifying these relationships is of great importance for understanding the water cycle processes in this delta and supporting freshwater resource management and ecological sustainability.
Unlike river or groundwater, soil water does not simply reflect a single water source, but rather integrates recent precipitation, river input, pre-existing water storage, evaporation effects, and lateral recharge over different time scales. Isotopic studies of unsaturated soil water bodies have shown that soil water profiles preserve depth-dependent information related to infiltration, mixing, and transport processes, rather than presenting as a homogeneous reservoir [2,3]. Brooks et al. [4] showed that water retained in the soil and used by trees can be isotopically distinct from mobile water contributing to streamflow. A related review by Sprenger et al. [5] emphasizes that soil water and vadose zone water contain mixed water sources with different retention times, making them both sensitive to seasonal inputs and capable of recording past hydrological conditions. In summary, the unique hydrological isotopic fingerprint contained in the soil water of the Yellow River Delta has the potential to be identified and quantified. By comparing the isotopic composition of soil water in the Yellow River Delta region with potential water sources such as precipitation, water from the Yellow River main stream, local surface water, groundwater, and sea tides, the relative contribution of different water sources to soil water can be analyzed, revealing the replenishment, mixing, and redistribution processes occurring at different soil depths.
Hydrogen and oxygen stable isotopes are widely used to trace water sources and hydrological processes. Their compositions are expressed as δ2H and δ18O, which describe the deviations of the 2H/1H and 18O/16O ratios from Vienna Standard Mean Ocean Water. Water sources may differ in isotopic composition because of differences in moisture origin and the condensation and evaporation they have experienced [6,7]. Evaporation generally enriches the remaining water in heavy isotopes and produces a δ2H–δ18O relationship with a lower slope than the meteoric water line. When liquid waters mix without significant fractionation, the mixture retains the combined isotopic signatures of its sources in proportion to their contributions. These differences allow δ2H and δ18O to be used to estimate water source contributions. For example, Zhao and Li [8] used stable hydrogen and oxygen isotopes to investigate evaporation, replenishment, and water source dynamics in the lower reaches of the Yellow River. Their results showed that Yellow River water retains identifiable isotopic characteristics during downstream transport. Similar methods have been successfully applied to the Red River, Mun River, Mekong Delta, and other large river basins to identify seasonal variations and water source composition [9,10,11,12]. At the watershed scale, isotopic observations have been used to assess groundwater recharge and runoff formation mechanisms in multiple watersheds, where seasonal precipitation and evaporative enrichment significantly control isotopic variations [13,14,15]. At the profile scale, soil water isotope distributions preserve information on infiltration, evaporation, mixing, and unsaturated zone water storage, facilitating a more refined analysis of recharge processes [16]. Current research indicates that stable isotopes are well suited for tracing the migration and transformation of water among multiple components in hydrological systems.
Despite the progress made, several unresolved scientific questions remain regarding river-controlled coastal deltas. Currently, most isotopic studies of the Yellow River Delta focus on the evolution of river water, groundwater, or regional hydrogeochemical processes [17,18], while relatively little attention is paid to the relative importance of multiple water sources within soil profiles. What remains unclear is whether the contributions of the Yellow River, precipitation, groundwater, local surface water, and tides to soil water are roughly equal, or whether a dominant water source always exists at different depth levels.
This study combines stable hydrogen and oxygen isotopes with a Bayesian mixture model [19] to explore the sources and distribution of soil moisture in the Yellow River Delta. Six types of water samples were collected during the flood season and post-flood season of 2022, including precipitation, Yellow River water, other local surface water, groundwater, tidal water, and soil water. The research objectives include: (1) analyzing the variation patterns of isotopic characteristics of major water bodies; (2) assessing the vertical variation characteristics of soil water isotopic composition within a 10–100 cm soil profile; and (3) quantitatively evaluating the relative contributions of different water sources to soil moisture based on a five-source Bayesian mixing model. By quantifying the proportion of water source contributions throughout the soil profile, this study provides new evidence for understanding the distribution pattern of soil moisture in the Yellow River Delta.
2. Study Area
2.1. Study Area Description
The Yellow River Delta is located at the confluence of the Yellow River, the Bohai Sea, and Laizhou Bay, and is one of China’s major river deltas. The modern Yellow River Delta was formed after the lower reaches of the Yellow River changed course and flowed into the Bohai Sea in 1855. Since then, the large amount of sediment carried by the river has driven the rapid silting-up of the delta and the frequent migration of the shoreline [20,21]. Coastal processes such as waves, tides, and storm surges influence shoreline morphology, but river water and sediment supply is the dominant factor controlling delta formation and evolution. This region has a warm temperate semi-humid continental monsoon climate, with an average annual temperature of 11.7–12.6 °C and an average annual precipitation of approximately 530–630 mm, of which nearly 70% is concentrated in summer [22]. Potential evapotranspiration exceeds precipitation, indicating a long-term water deficit in the region. Seasonal variations are distinct: spring is windy and relatively dry, summer is warm and humid, autumn precipitation decreases rapidly, and winter is cold and dry.
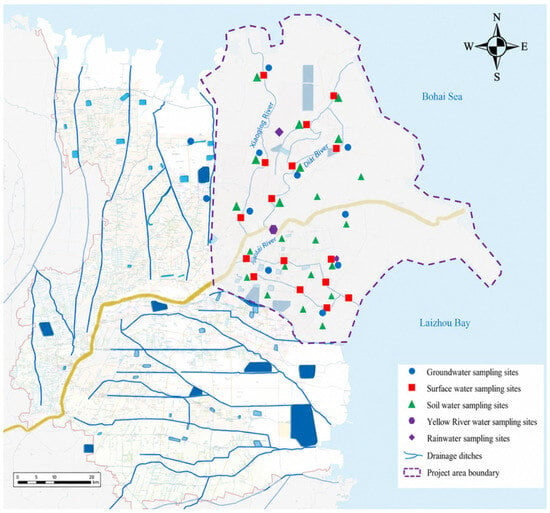
The study area covers the modern Yellow River Delta (118°07′–119°18′ E, 37°20′–38°12′ N), with Ninghai in Kenli County as its apex, extending from the mouth of the Taoer River in the north to the mouth of a tributary river in the south (see Figure 1). The total area is approximately 5400 km2, of which approximately 5200 km2 is located within Dongying City, and its administrative divisions include Dongying District, Kenli District, Hekou District, and Lijin County.
Figure 1.
Distribution of the drainage network and sampling sites for different water types.
2.2. Sampling Design and Collection
Sampling was conducted in three representative sub-basins: the Yongfeng River Basin and Xiaodao River Basin on the south bank of the Yellow River, and the Shenxiangou Basin on the north bank of the Yellow River. These areas encompass various typical hydrological environments, including the Yellow River channel, farmland, coastal lowlands, and areas influenced by shallow groundwater, reflecting diverse representative hydrogeological conditions of the delta [23]. Field surveys were conducted in two phases, in August and October 2022, corresponding to the flood season and post-flood season hydrological phases, respectively. Considering that the isotopic composition of individual rainfall events varies with rainfall type, atmospheric conditions, and water vapor transport processes, precipitation samples were collected after each rainfall event during the study period [24].
Soil water samples were collected by depth interval using a soil auger. Samples from each interval were placed in separate resealable plastic bags labeled with the sampling site and depth interval. Soil water was extracted from the collected soil samples by vacuum condensation distillation. Groundwater sampling was conducted after purging each well using a submersible pump to remove stagnant water and improve the representativeness of aquifer water, following the general rationale of purged groundwater sampling protocols [25]. All water samples were collected in 100 mL high density polyethylene bottles, which were rinsed three times with sample water before filling. Bottles were tightly sealed with Parafilm to minimize evaporation and gas exchange during transport. Samples were stored in a cooled container and transported to the laboratory for analysis. Electrical conductivity (EC) of the source waters was measured in situ during sampling using a Hach portable meter. Additional field information, including GPS location, vegetation type, soil conditions, and weather conditions, was documented during sampling.
After laboratory testing, 275 sets of valid δ2H and δ18O data were obtained, including 9 precipitation samples, 2 Yellow River water samples, 36 surface water samples, 15 groundwater samples, 3 tidal water samples, and 210 soil water samples.
3. Materials and Methods
3.1. Laboratory Analysis
Hydrogen and oxygen isotope ratios were measured using a Picarro L2130-i (Picarro Inc., Santa Clara, CA, USA) cavity ring-down spectroscopy analyzer. Laser-based spectroscopy has been widely used for high-precision δ2H and δ18O measurements of liquid water samples [26]. Quality control was performed by analysing one laboratory standard and one blind sample after every five field samples, following the general principle that repeated standards and check samples are required for reliable laser spectroscopic isotope measurements [27].
Isotopic compositions are reported in delta notation (δ, ‰) relative to Vienna Standard Mean Ocean Water, following recommended stable isotope reporting conventions [28]:
where R is the heavy-to-light-isotope ratio of the sample relative to the reference material. d-excess was calculated as:
δ(‰) = (Rsample/Rstandard − 1) × 1000
d-excess = δ2H − 8 × δ18O
d-excess is a second-order isotope parameter that is commonly used to evaluate non-equilibrium fractionation, moisture source conditions, and evaporation related modification of water isotopes [29].
3.2. Isotopic Characterization and Seasonal Comparison
First, the interrelationships among precipitation, Yellow River water, other surface waters, groundwater, tidal water, and soil water were explored using a dual-isotope (δ2H–δ18O) relationship diagram. Subsequently, the δ2H, δ18O, and d-excess values of various water bodies were statistically summarized to compare the isotopic variability of different water bodies and identify signals of evaporation and mixing processes.
Based on nine precipitation samples collected during field surveys in August and October 2022, precipitation isotope curves were obtained using ordinary least squares regression. Since these observations represent single precipitation events rather than long-term monitoring results, this fitted regression line is referred to as the study period precipitation curve.
Differences in soil water isotope variations during the flood season and post-flood season were assessed by comparing the mean values of δ2H, δ18O, and d-excess at 10 cm depth intervals during the August and October surveys. The differences between October and August values for each depth layer were calculated to characterize the direction and magnitude of isotope shifts during different hydrological stages.
3.3. Bayesian Isotope Mixing Model
The contribution of soil water sources was estimated using the Bayesian mixture model MixSIAR. Five potential endmembers were considered: precipitation, Yellow River water, other surface water, groundwater, and tidal water. The Yellow River water endmember represents the contribution of soil water corresponding to the isotopic composition of the collected Yellow River water samples. Soil water was defined as a mixed water body using δ2H and δ18O as tracers. Independent models were fitted at 10 cm depth intervals between 10 and 100 cm. The mixture model was based on the isotopic mass balance principle. For soil water sample i and isotopic tracer j, the isotopic composition of the mixed water body can be expressed as:
where yij is the observed isotope value of the mixture, pik is the proportional contribution of source k, μjk represents the isotope distribution of that source, and εij is the residual error term. Five sources (K = 5) and two isotope tracers (δ2H and δ18O) were included. No isotope offset was applied because mixing among liquid water sources was treated as conservative.
The model estimates source proportions by comparing the observed soil water isotope values with those expected from different combinations of the five sources. Source proportions are constrained to be non-negative and sum to one. Under the Bayesian isotope mixing model, the likelihood of the observed isotope data is combined with the prior distribution of source proportions to obtain their posterior distribution. Markov chain Monte Carlo sampling is used to approximate this distribution, from which posterior means and credible intervals can be calculated.
Independent models were fitted to each of the 10–100 cm depth layers. Samples collected at the same depth in August and October were analyzed together. The model estimation results represent the proportion of water source contribution during the study period, rather than the independent cases in August and October. The isotope composition of each end-member was described using the mean and standard deviation calculated from the corrected field dataset. Sample sizes were 9 for precipitation, 2 for Yellow River, 36 for other surface water, 15 for groundwater, and 3 for tidal water.
A Dirichlet(1, 1, 1, 1, 1) prior was used for the five source proportions, giving each source the same prior expected contribution. Source isotope distributions were described by their measured means and standard deviations. This included the variation observed in the two Yellow River samples and three tidal samples. These small sample sizes may not capture the full spatial and temporal variation in either source. The posterior contributions therefore describe uncertainty under the measured source distributions and the selected prior. Sensitivity to alternative prior concentrations and source distributions was not tested. A residual error term was included to account for variation in soil water isotope values not explained by the source mixture. Finally, the model was run using the standard MCMC settings of MixSIAR, and its convergence was assessed using the Gelman–Rubin diagnostic index () and effective sample size (ESS). The values for the calibrated dataset ranged from 1.0005 to 1.0175, with a minimum ESS of 440. The values for all monitored parameters did not exceed 1.05, indicating good model convergence.
3.4. End-Member Separability and Mixing Space Diagnostics
To assess end-member coverage and water source separability, a mixed space diagnosis was conducted based on the principles of isotope mixing polygons and end-member uncertainty analysis [30,31,32]. As a supplementary diagnostic tool to MixSIAR analysis, the isotope mixing space is examined to determine whether the selected endmembers adequately cover the soil water sample and to assess the degree of isotope separation between different water sources. Source centroids were calculated from the corrected pooled dataset using the mean δ2H and δ18O values of each end-member. Mixing spatial geometry features can provide information on endmember coverage and model identifiability [33]. The normalized centroid distance between each endmember pair is calculated using the following formula:
where Dij is the standardized distance between source centroids i and j, and are the mean isotope values of source i (the same applies to source j), and and are the pooled standard deviations of all source observations for δ2H and δ18O, respectively.
To clarify the internal variability of the water source, the standardized centroid distance is used to assess the degree of separation between endmembers, and the water source separation index (SSIij) is introduced. This index is defined as the standardized centroid distance divided by the mean of the isotopic dispersion within the two water sources. A higher SSI value indicates a clearer separation between the two water sources relative to their respective internal variability; a lower value indicates a greater degree of overlap and higher uncertainty in water source identification. The specific calculation formula is as follows:
where Wi and Wj are the mean standardized within source dispersions of sources i and j.
Convex hull analysis was used to assess whether soil water samples fell within the isotopic space represented by the measured water sources. Two convex hulls were constructed: one based on all individual water source observations, and the other based on the centroids of five water sources. The number and proportion of soil water samples located within each convex hull were counted for the entire dataset and for each soil depth.
Source contributions were calculated from the posterior samples generated by MixSIAR. For example, the measured δ2H and δ18O values of soil water at 10 cm depth were analyzed together with the isotope means and standard deviations of the five potential sources. MCMC sampling generated posterior combinations of source proportions, with each combination containing five non-negative proportions that summed to one. The Yellow River water proportion was extracted from each retained posterior sample and averaged across all retained samples. This posterior mean was 0.571, corresponding to a contribution of 57.1%. The contributions of the other sources were calculated in the same way.
4. Results
4.1. Isotopic Characteristics of Different Water Bodies
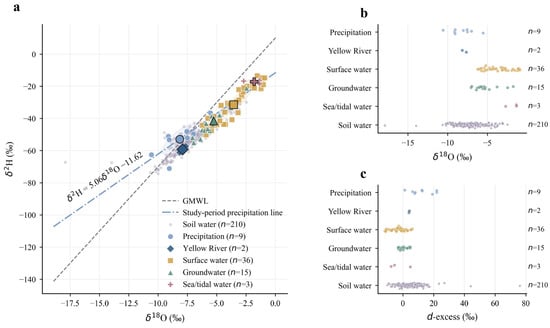
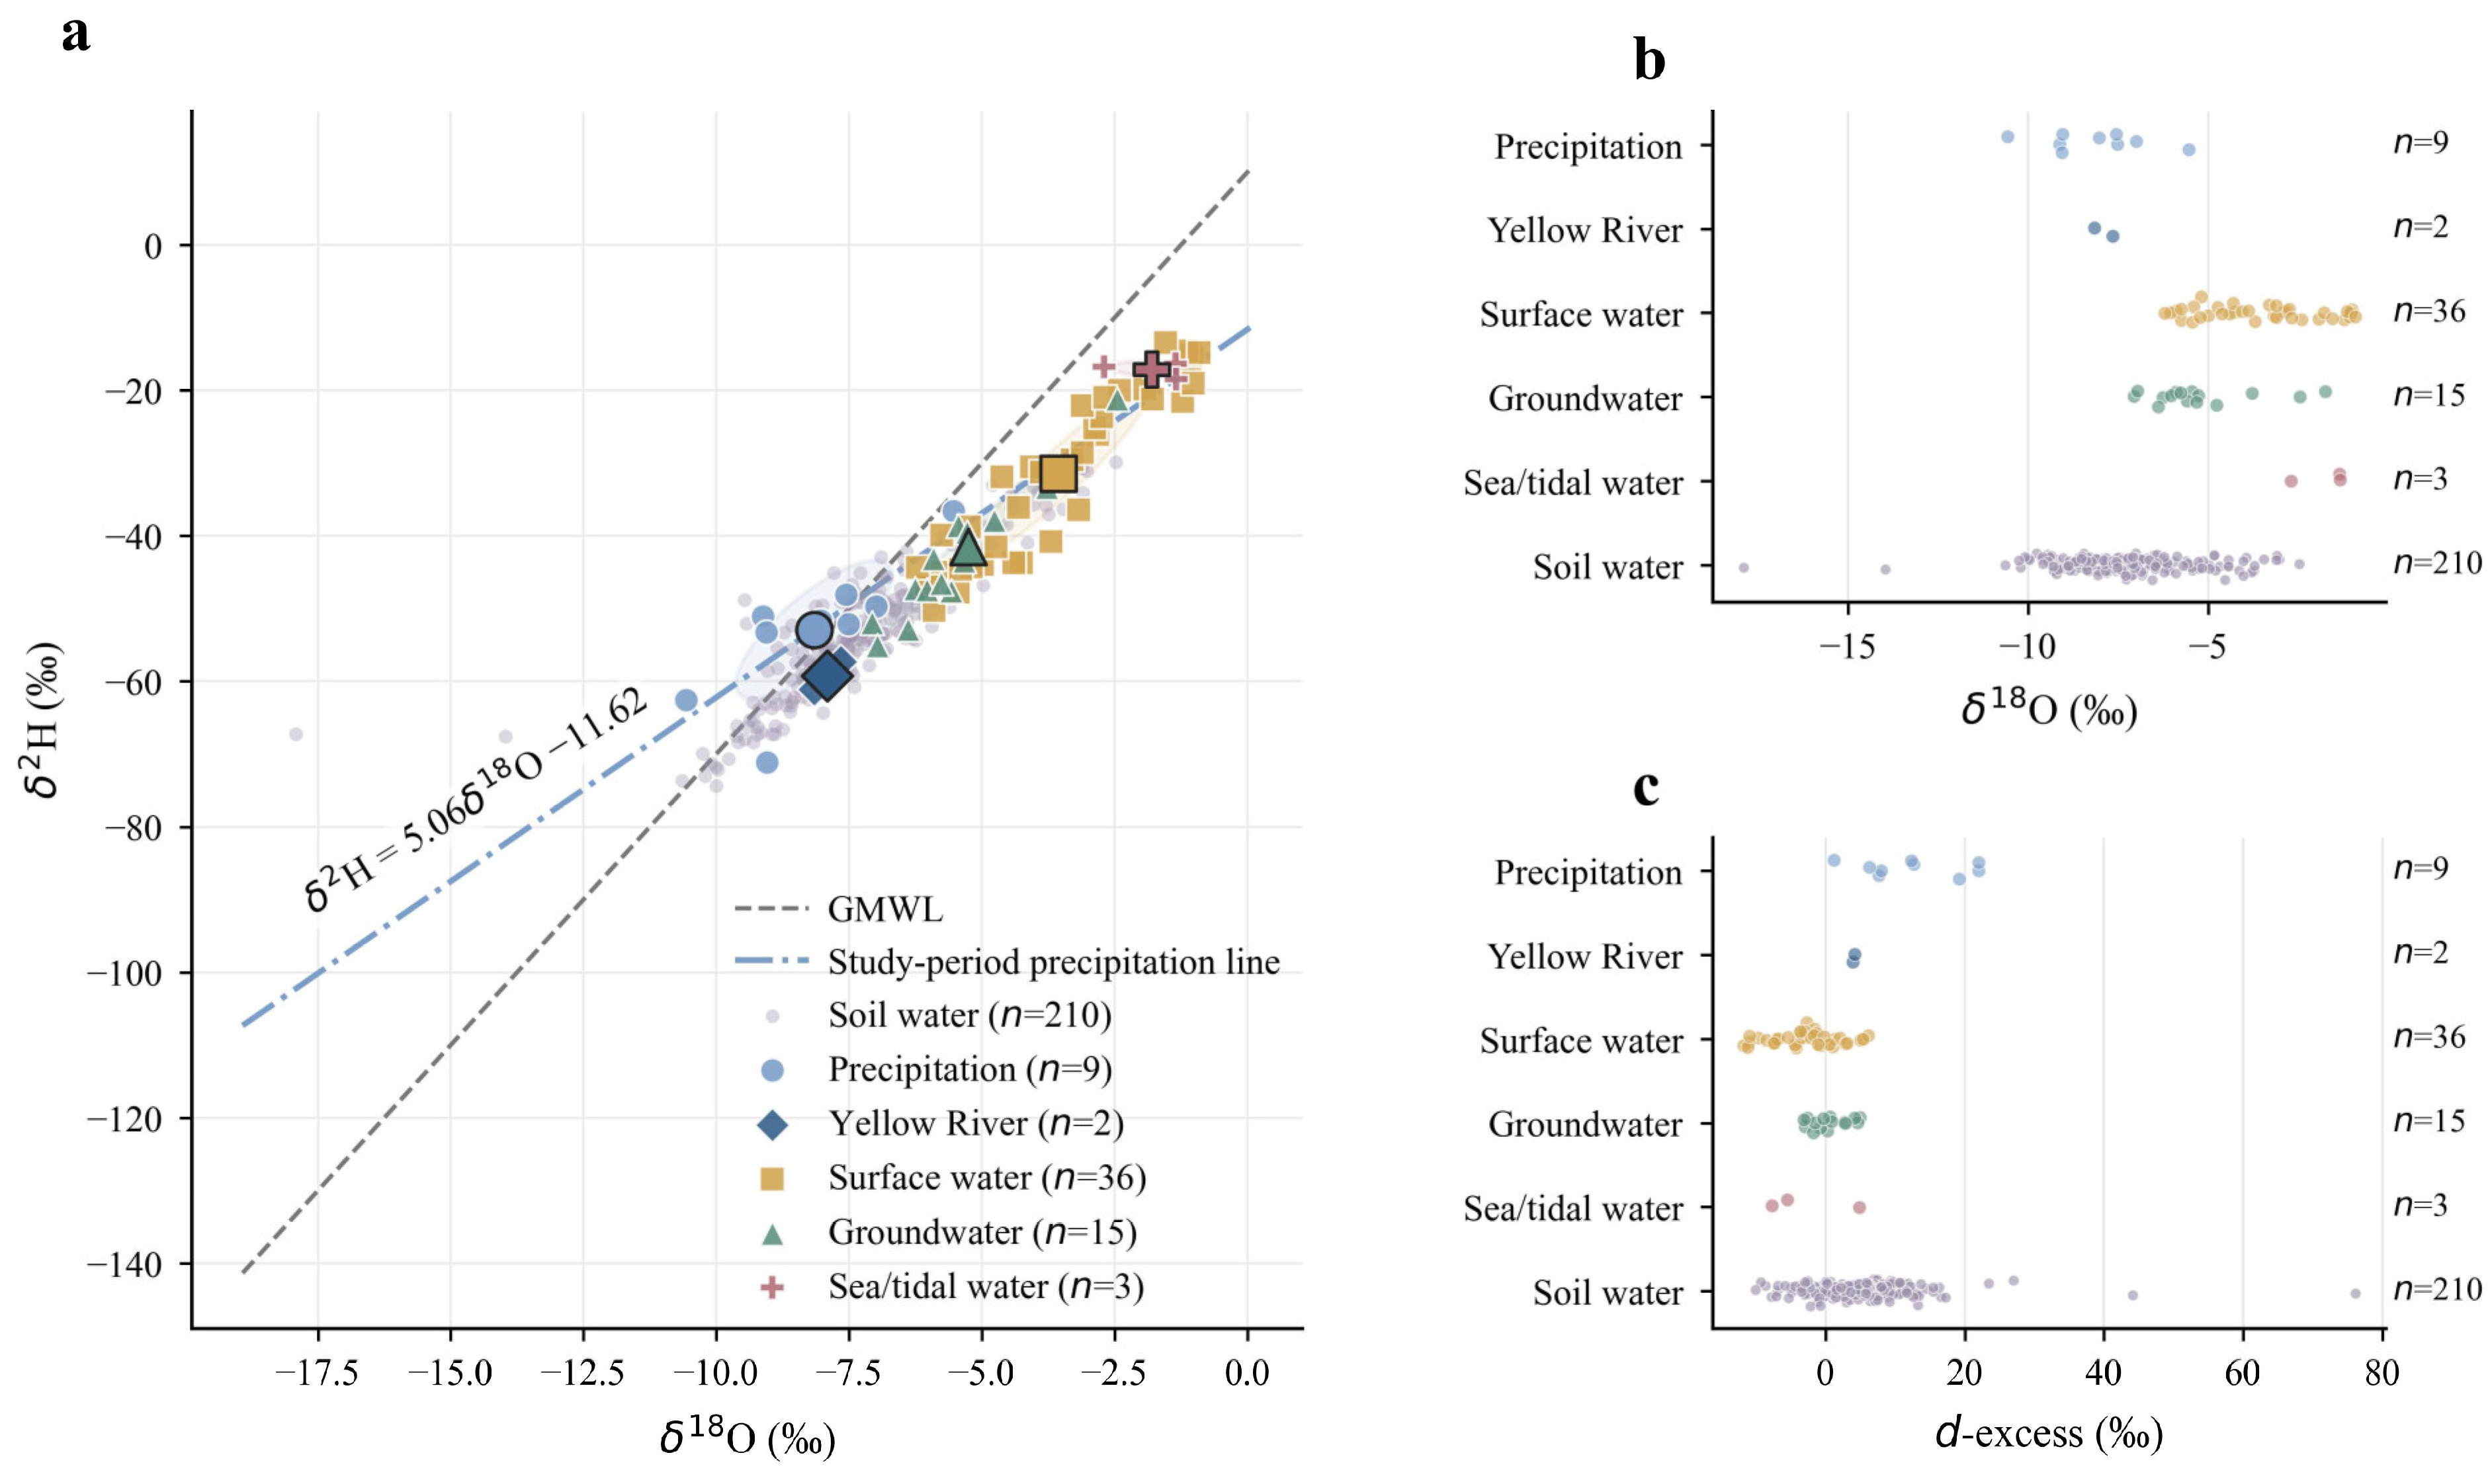
The six water body types generally show some separation in the δ2H–δ18O diagram, but there is some overlap between precipitation, Yellow River water, groundwater, and soil water (Figure 2). Precipitation and Yellow River water are relatively depleted in isotope values, while surface water and tidal water are relatively enriched. Surface water exhibits the widest isotopic variation, while Yellow River water has a more concentrated isotopic distribution. Groundwater isotopes generally fall between those of Yellow River water and surface water, with tidal water showing the highest isotopic values. A statistical summary of each water body type is shown in Table 1.
Figure 2.
Dual isotope characteristics of water groups in the Yellow River Delta, GMWL: Global Meteoric Water Line. (a) δ2H–δ18O relationships. (b,c) Mean δ2H and δ18O values for each water type.
Table 1.
Statistics of hydrogen and oxygen isotopes for different water groups in the Yellow River Delta.
Table 1 shows significant differences in d-excess among the various water sources. Precipitation d-excess remains positive, indicating minimal evaporation alteration after rainfall. Surface water d-excess values are significantly low, indicating strong evaporation. The Yellow River’s d-excess is close to 4‰, while groundwater falls between precipitation and surface water. Tidal water exhibits a large d-excess variation, possibly reflecting the mixing and changes between seawater and freshwater sources. Although these differences still partially overlap on the δ2H–δ18O diagram, they generally support the rationality of the selected endmembers.
Regression analysis was performed on δ2H and δ18O values from nine precipitation events collected during the field survey to establish atmospheric precipitation lines for the observation period in the study area and analyze the stable isotopic characteristics of precipitation. The resulting precipitation lines for the study period are as follows and the slope and intercept of this line are both lower than the Global Meteoric Water Line:
δ2H = 5.06δ18O − 11.62 (R2 = 0.61)
The 0.61 R2 value indicates scatter around the fitted precipitation line. Differences in moisture origin, condensation conditions, and below-cloud evaporation among precipitation events may have contributed to this variability. With only nine precipitation samples collected over a short observation period, the fitted relationship should be interpreted as a description of the sampled precipitation rather than a long-term local meteoric water line.
4.2. Seasonal and Vertical Variations in Soil Water Isotopes
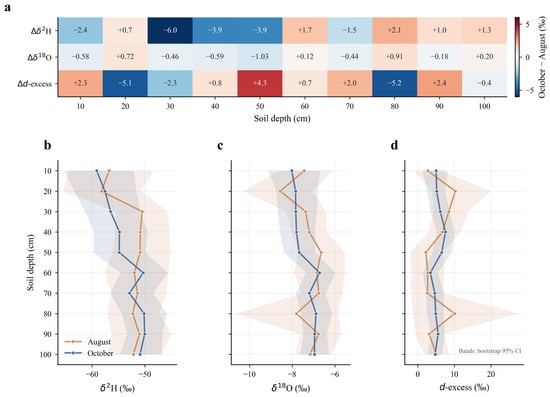
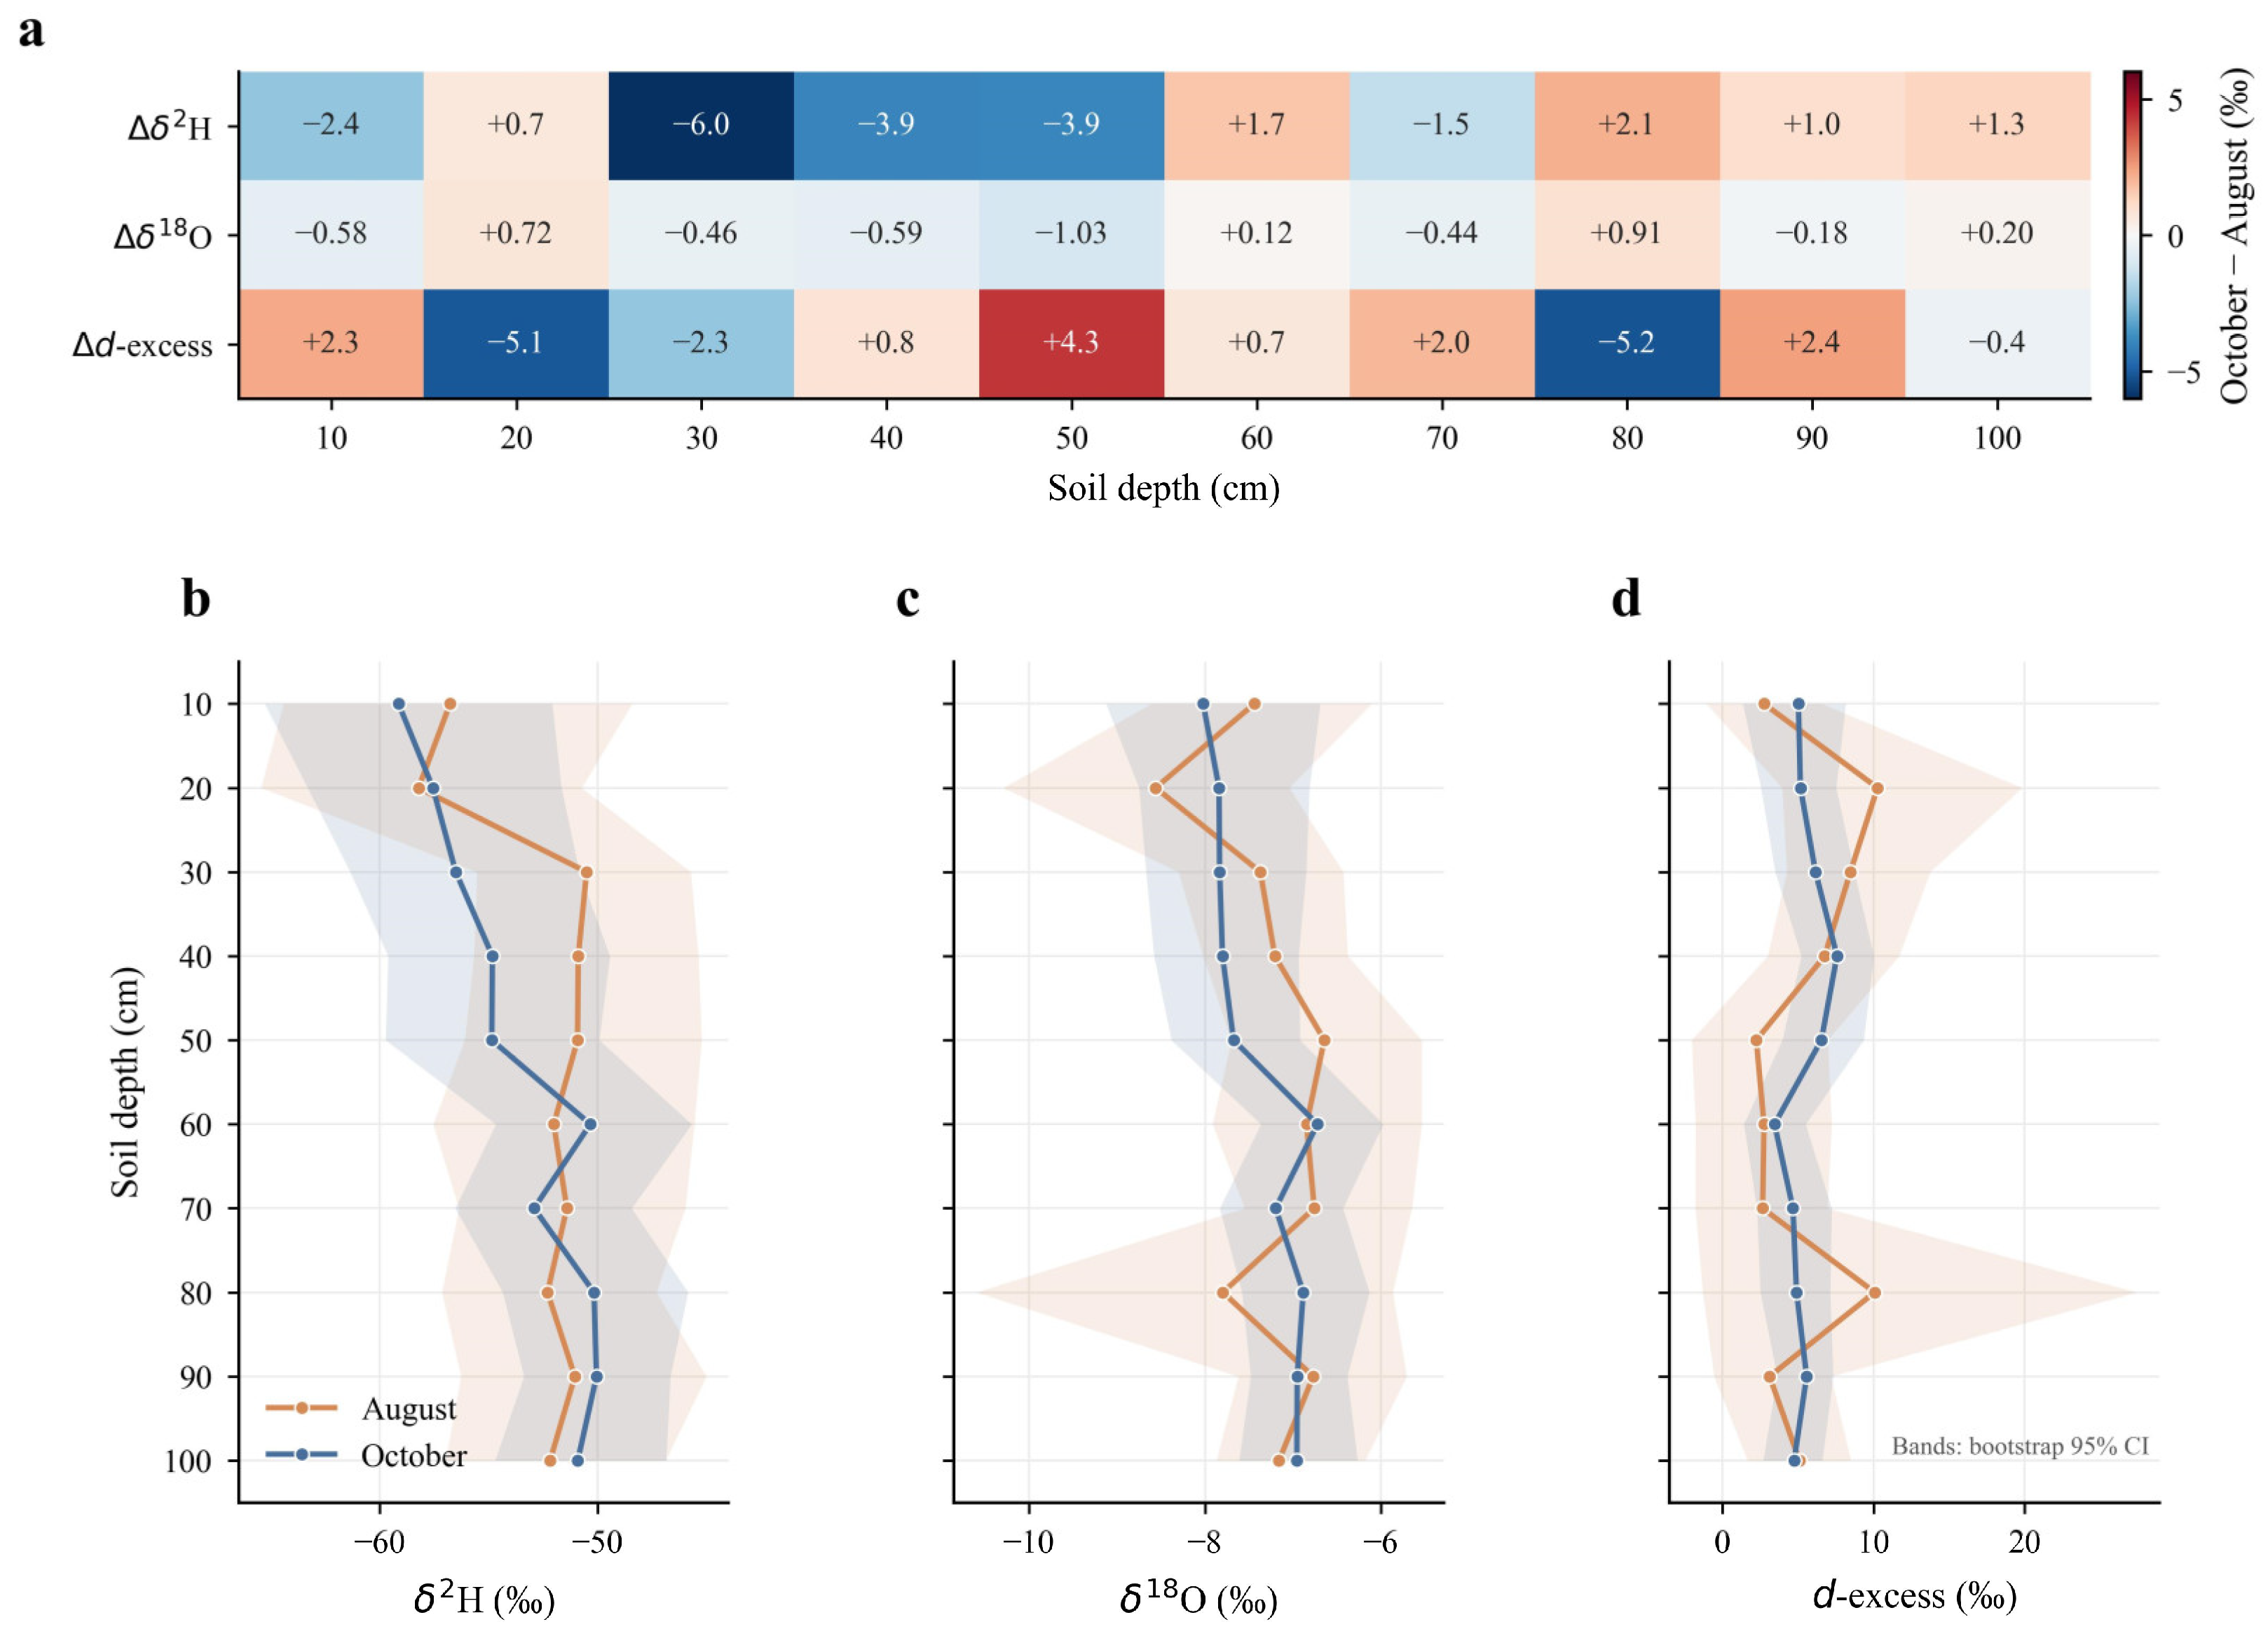
The variations in soil water isotopes during the flood season and post-flood season are not uniform across the soil profile (see Figure 3). Compared to the flood season, soil water in the post-flood season exhibits greater depletion at the 10 cm depth and in the 30–50 cm layer. Below 60 cm, the differences decrease and the directions become inconsistent. The maximum variation in δ2H occurs at 30 cm, while δ18O shows a roughly similar vertical variation pattern. D-excess does not show a clear depth variation trend. Therefore, the variations during the flood season and post-flood season are mainly concentrated in the shallow and middle layers of the soil profile.
Figure 3.
Seasonal and vertical variations in soil water isotopes. (a) October minus August differences. (b–d) Soil water isotope profiles for the August and October surveys. Shaded areas show bootstrap 95% confidence intervals.
The overall vertical profile morphology of the two hydrological phases was generally similar, but local profiles showed differences, as shown in Figure 3b–d. Neither δ2H nor δ18O exhibited a monotonic change with depth. The mean value of δ2H generally tended to be more positive with increasing depth, indicating a decrease in depletion, but this trend was deviated from in the intermediate layers. δ18O and d-excess also showed similar irregular profile morphologies, suggesting differences in moisture composition between different soil layers. Recent water inputs may have a greater impact on the upper and middle soil layers, while deeper soil layers retain more early stored moisture.
4.3. Source Contributions to Soil Water
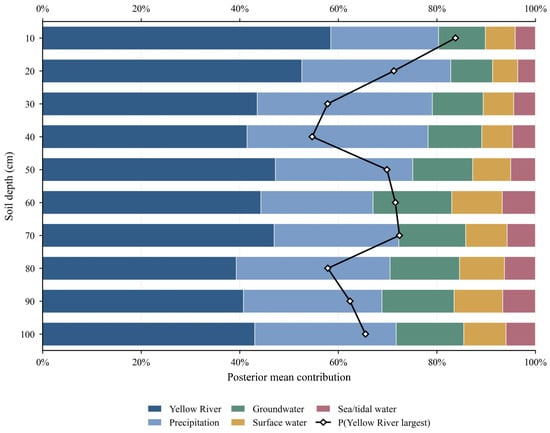
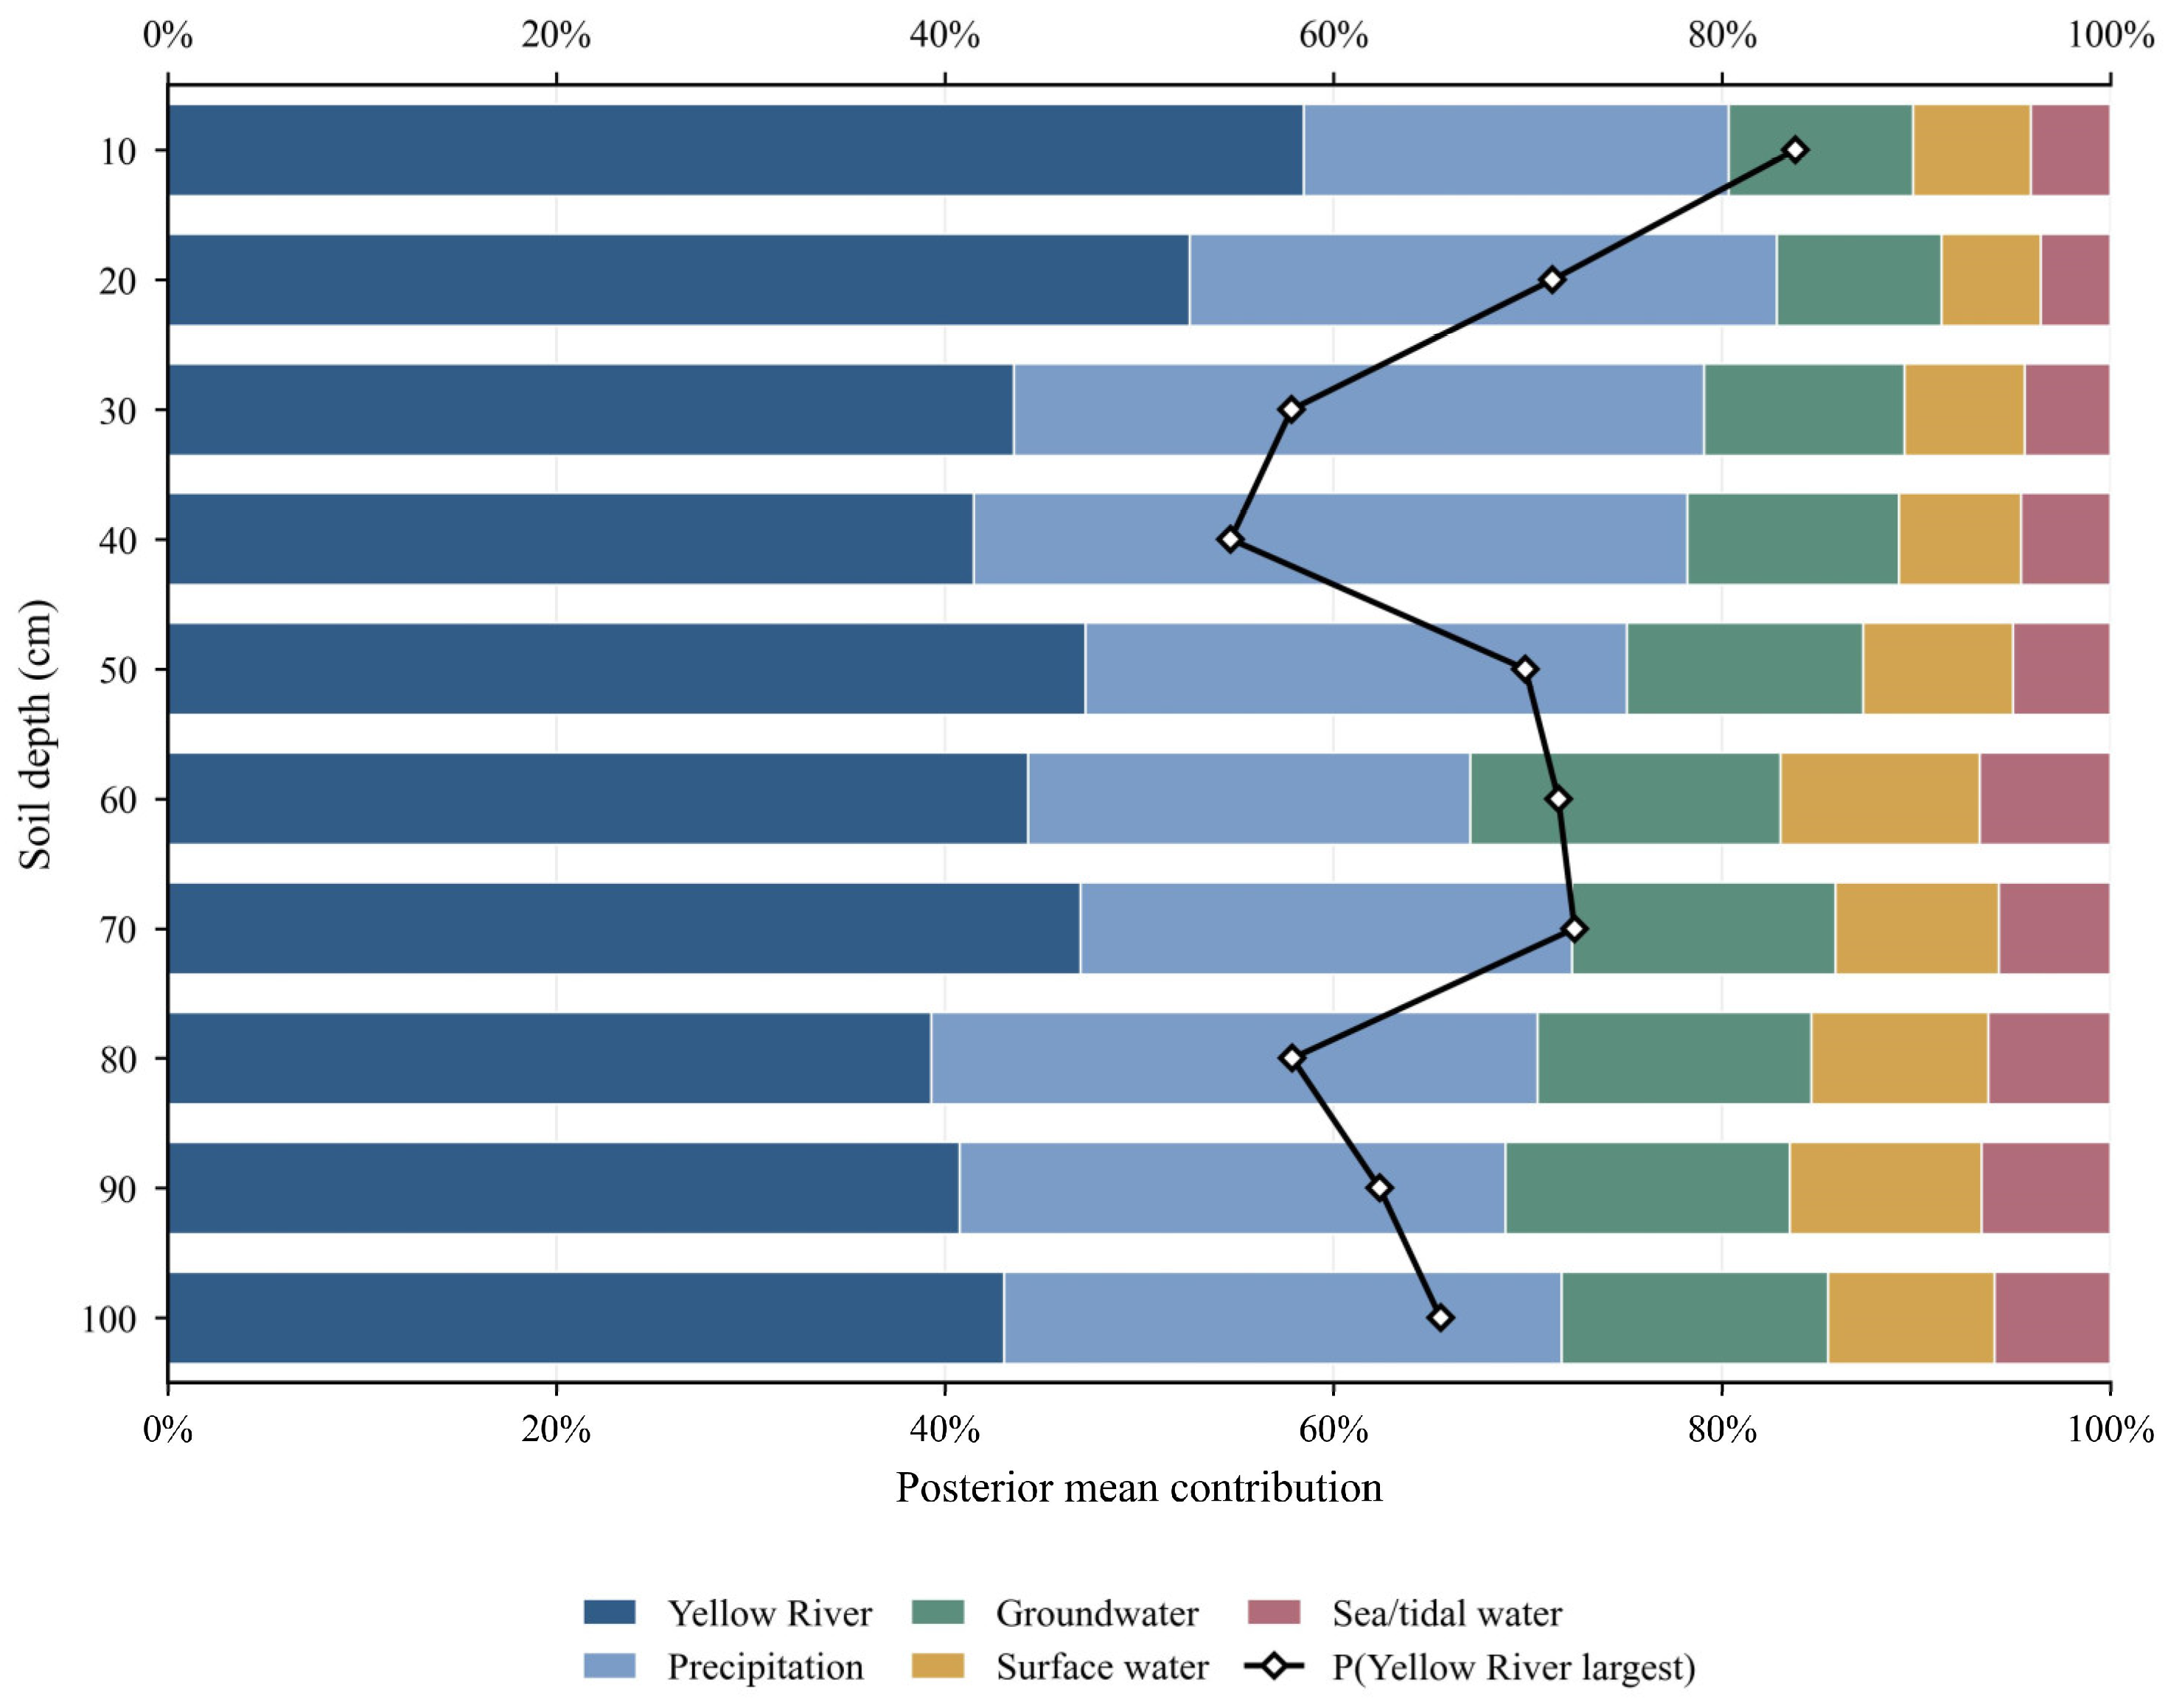
Based on the results estimated using the Bayesian mixture model, the Yellow River water dominates the shallow soil profile. Its posterior mean contribution rate reaches 57.1% at 10 cm and 52.1% at 20 cm (see Figure 4). Precipitation is the second largest water source, accounting for 23.5% and 30.7% at depths of 10 cm and 20 cm, respectively. The contribution rates of other water sources are relatively small. This pattern weakens in the middle layer of the profile. At depths of 30 cm and 40 cm, the contribution of Yellow River water decreased to 43.7% and 41.8%, respectively, while precipitation increased to 35.8% and 37.2%, with the difference between the two water sources being much smaller than in the shallow layer. At 50 cm, the contribution of Yellow River water rebounded to 47.6%, but decreased to 42.8% at 60 cm. The proportion of groundwater and other local surface water near 60 cm was also slightly higher than that in the surface layer. Below 70 cm, Yellow River water remained dominant, but its contribution fluctuated between 39.7% and 46.6%. Precipitation contributed 25.8–31.6%, while groundwater increased to 13.3–14.8%. Other surface water and tidal water remained low-contribution components throughout the deep profile.
Figure 4.
Bayesian estimates of water source contributions to soil water; P means Probability that Yellow River water is the largest source.
Throughout the 10–100 cm profile, the ranking of water sources remained relatively consistent. The Yellow River contributed 39.7–57.1%, followed by precipitation at 23.5–37.2%. Groundwater accounted for 8.4–15.2%, other surface water for 5.4–10.6%, and tidal water for 3.4–6.8%. The posterior probability that the Yellow River was the largest contributing water source ranged from 55.9% to 80.8%. While the Yellow River ranked first at all depths, the confidence level of this ranking varied across the profile. Some water source groups overlap in isotopic space, reducing the accuracy of water source separation. Therefore, it is more appropriate to interpret the contribution percentage as a Bayesian estimate of the relative importance of water sources. Overall, considering these uncertainties, it can still be assumed that Yellow River water and precipitation constitute the main components of the soil water mixture in the study area, while the other three water sources contribute relatively little.
5. Discussion
5.1. Isotopic Signatures and Evaporation Effects
The slope and intercept of the precipitation line during the study period were both lower than the global atmospheric water line, reflecting the influence of local meteorological conditions and precipitation events on the isotopic composition of precipitation in the study area. Similar deviations from the atmospheric water line have been reported in other semi-arid and monsoon-affected regions, where sub-cloud evaporation and seasonal atmospheric conditions alter the original isotopic composition of precipitation [34,35]. Although this dataset only covers nine precipitation events and cannot represent the long-term local atmospheric water line, the fitted relationship is consistent with the expected isotopic characteristics during the study period and can serve as a reference for interpreting the isotopic composition of other water bodies.
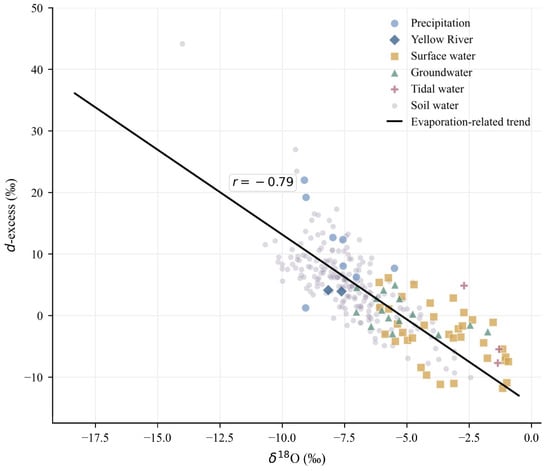
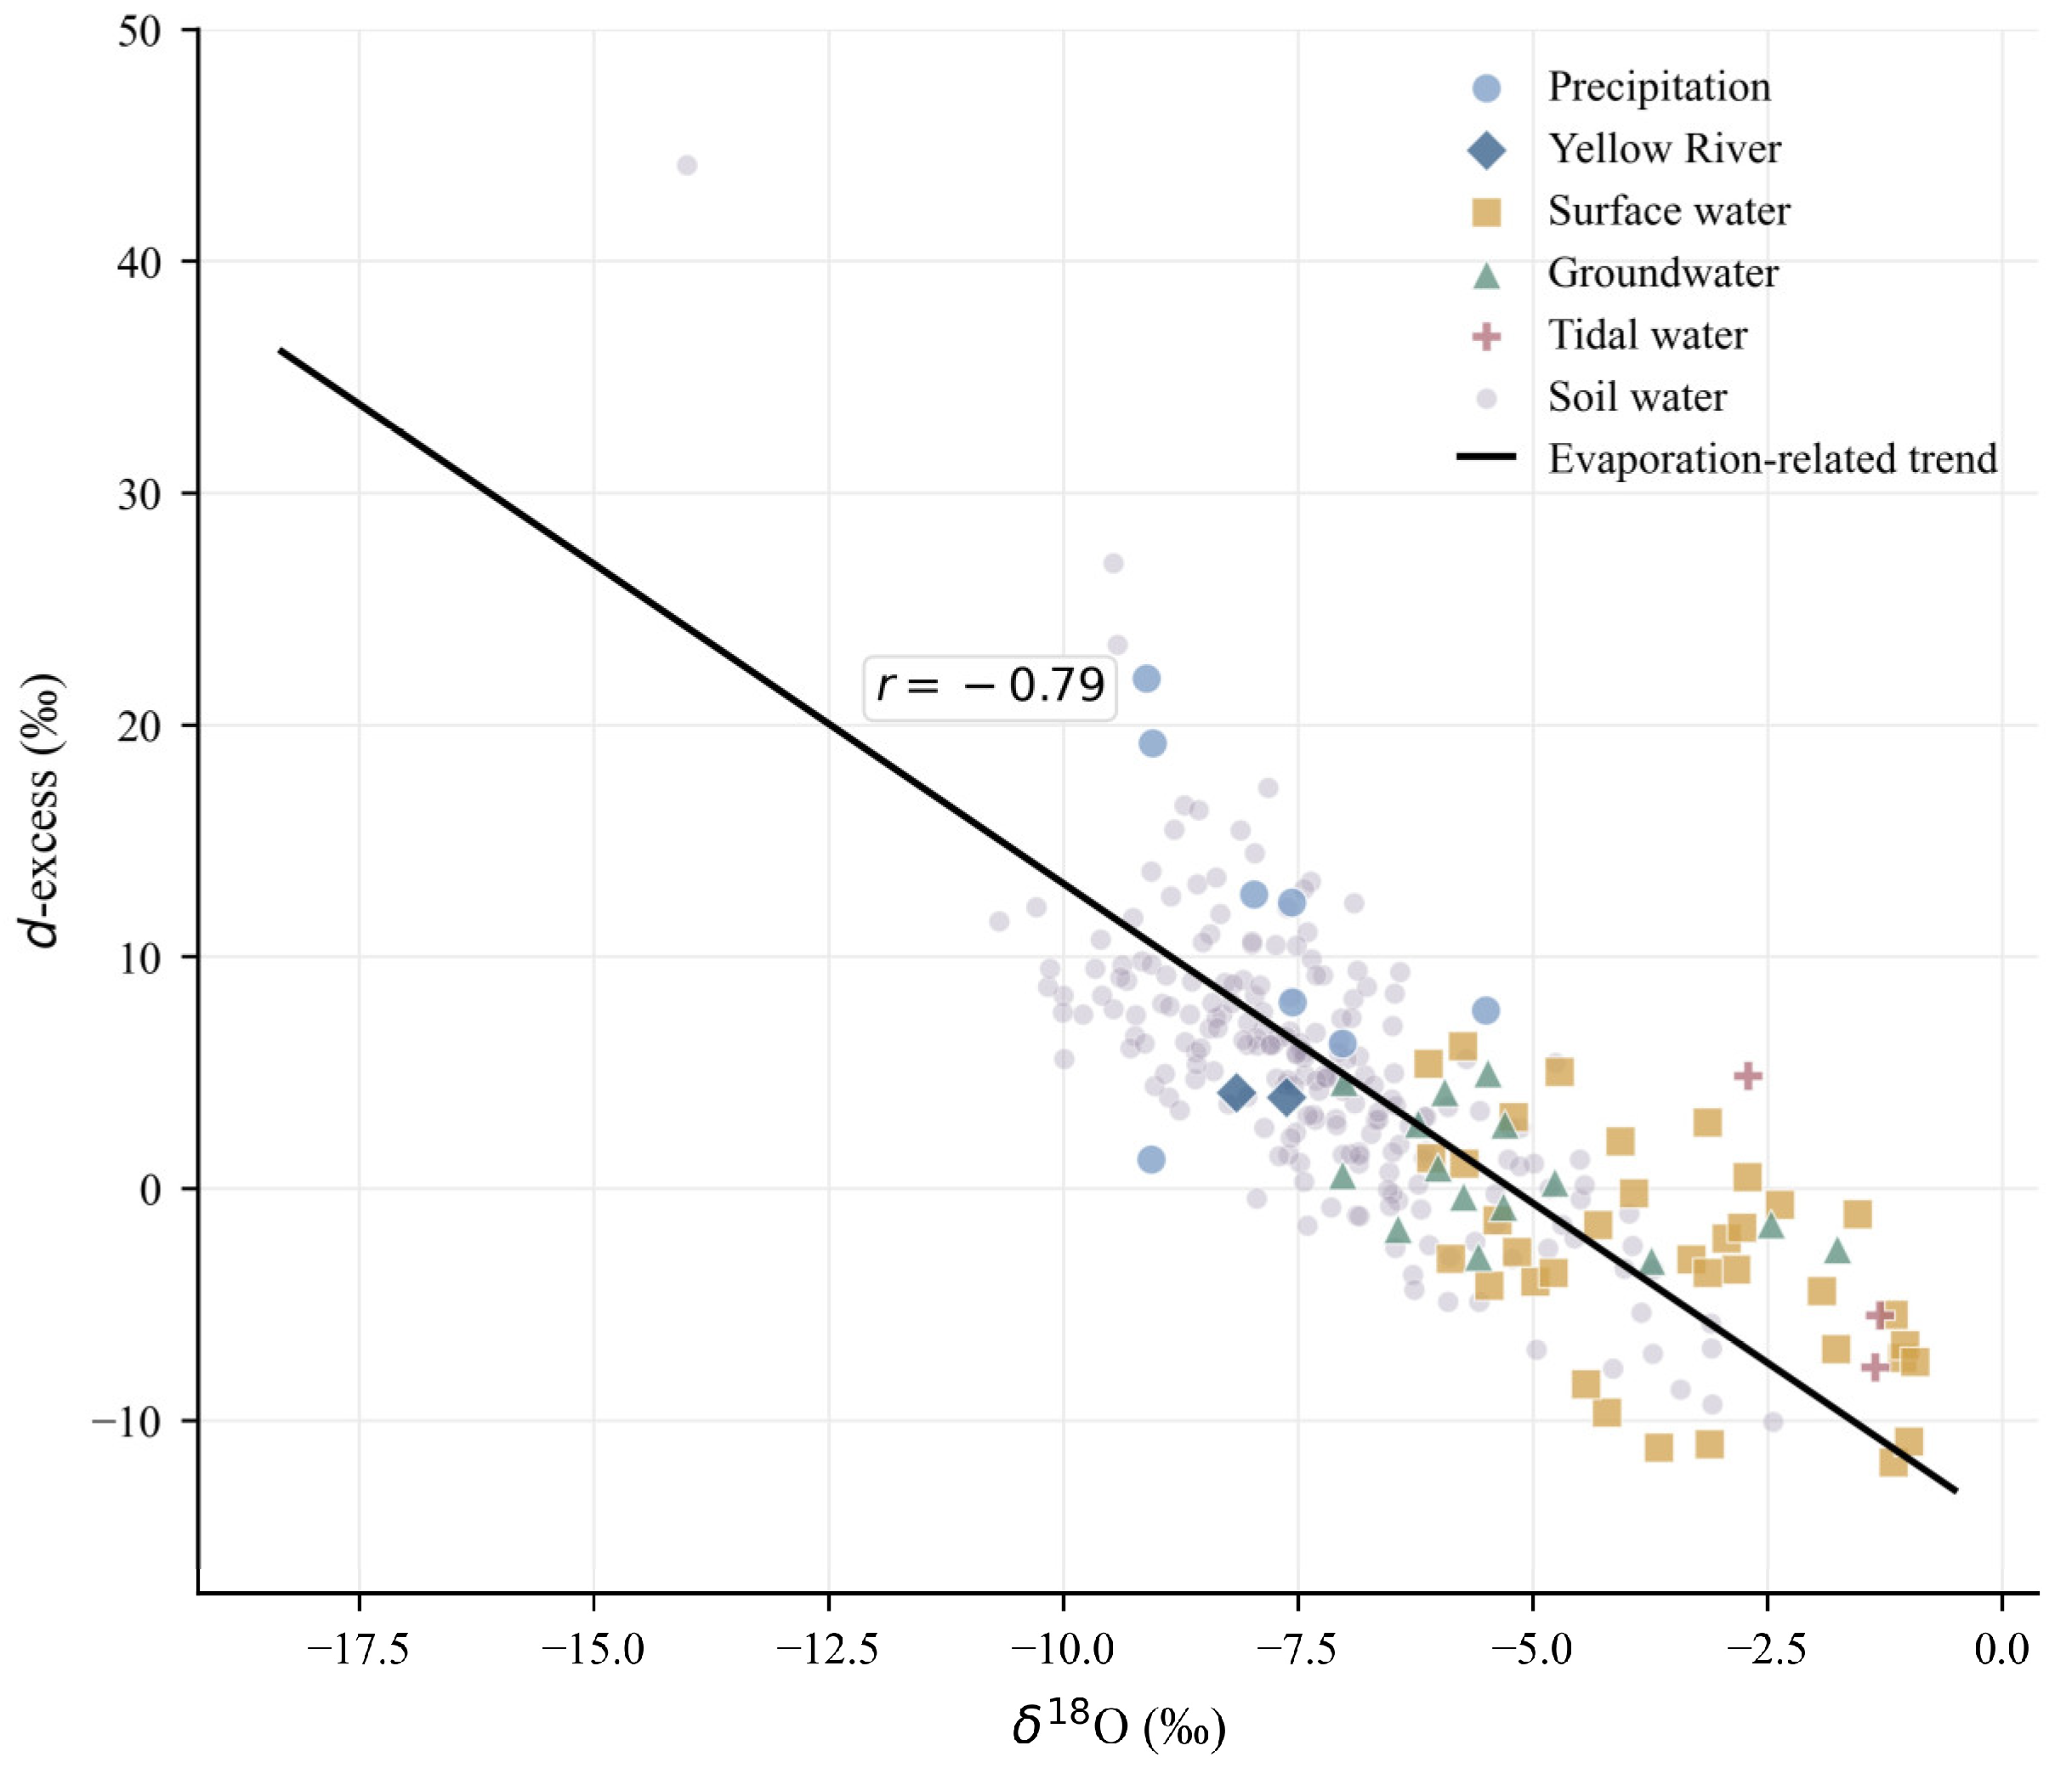
In contrast, the Yellow River endmembers remained in an isotope depleted state, while most surface water and tidal water exhibited enriched isotopic compositions and lower d-excess values. This contrast indicates that the water bodies underwent varying degrees of evaporative alteration after entering the Yellow River Delta soil. Water bodies in rivers, drainage ditches, ponds, and coastal wetlands typically have longer retention times and greater open-surface evaporation areas than flowing river water, leading to isotope enrichment before sampling [11,12]. This process is more clearly shown in the δ18O–d-excess relationship (Figure 5): precipitation is generally located in a relatively depleted area with high d-excess, while Yellow River water, although also showing δ18O depletion, has a significantly lower d-excess than precipitation. This suggests that Yellow River water cannot be simply considered as unaltered input, but rather has undergone long-distance transport, channel retention, and evaporation effects after entering the delta’s water network and irrigation and drainage system. Surface water and tidal water showed a further shift toward δ18O enrichment and lower d-excess values. This pattern suggests that evaporation from open water bodies, together with mixing with coastal water, jointly enhanced the isotopic enrichment.
Figure 5.
δ18O–d-excess relationship of different water groups in the Yellow River Delta.
Soil water is mainly distributed among Yellow River water, precipitation, groundwater, and surface water, without being significantly close to the tidal endmember. This distribution indicates that although evaporation processes affect the isotopic composition of various water bodies in the study area, the 10–100 cm soil water does not simply inherit the most enriched surface water or tidal signals. Instead, soil water is closer to the mixing region controlled by terrestrial freshwater and shallow groundwater, suggesting that its isotopic composition is mainly influenced by Yellow River water, precipitation, and shallow groundwater, and undergoes further mixing and redistribution within the soil profile. This finding also corroborates the MixSIAR results, which indicate that Yellow River water and precipitation are the two main contributing endmembers of soil water, while the contribution of tidal water is relatively small.
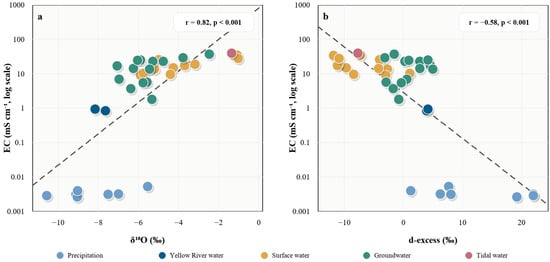
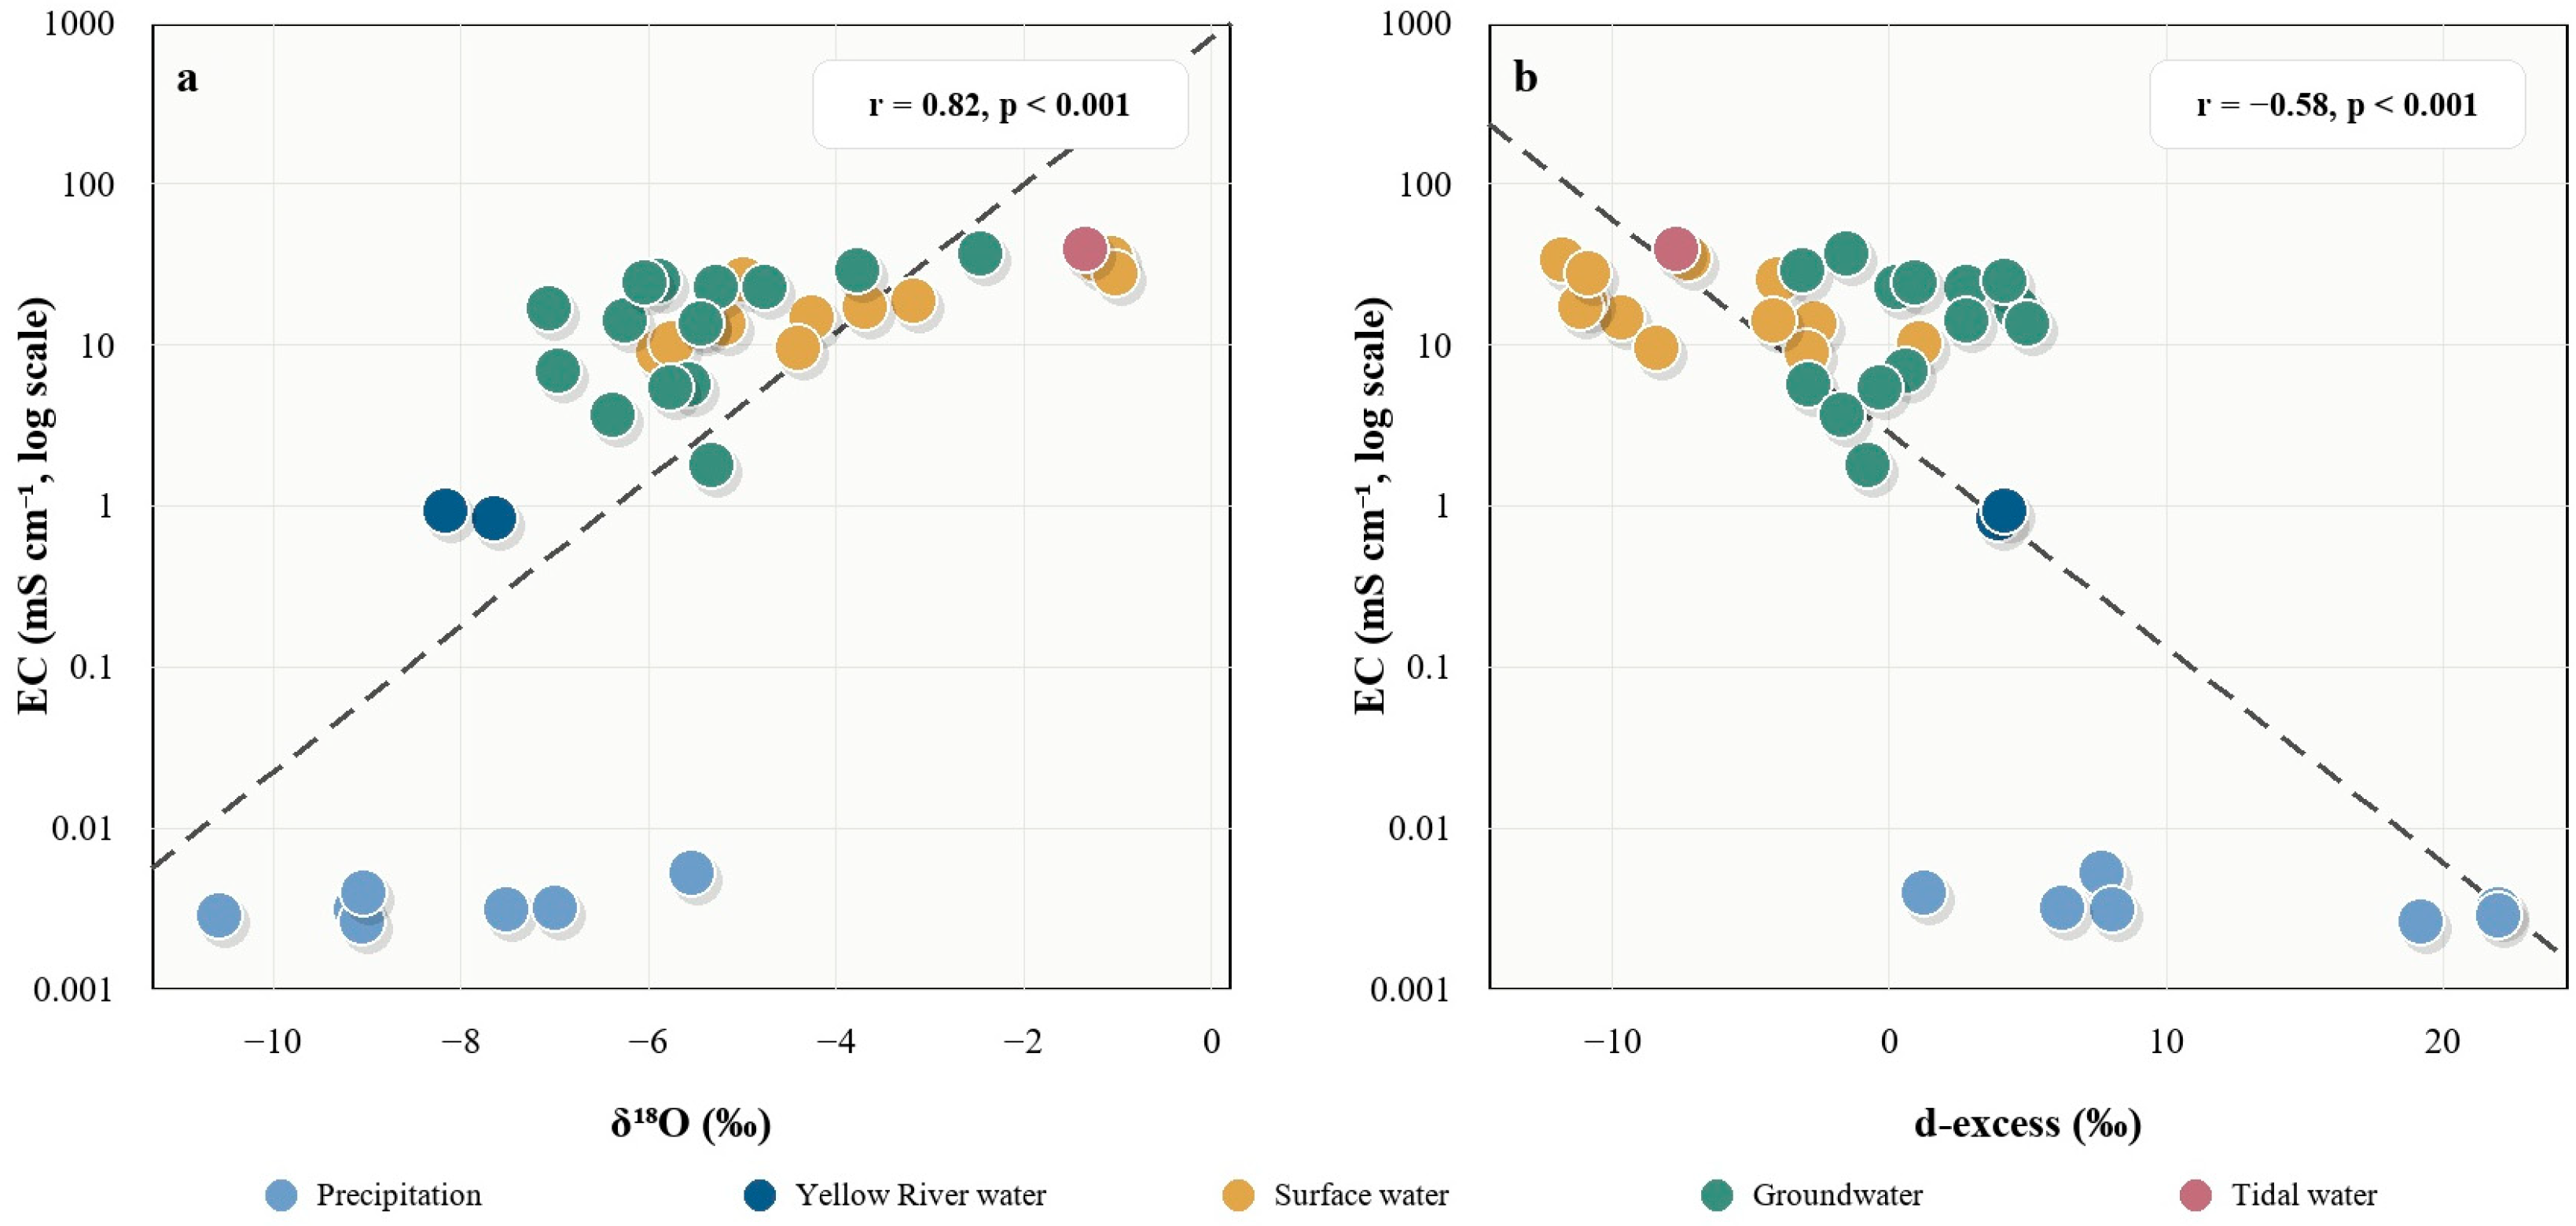
To further examine whether isotope enrichment is accompanied by water chemical concentration, this paper compares the EC of source water samples with δ18O and d-excess, respectively (Figure 6). The results show that EC is significantly positively correlated with δ18O (R = 0.82, p < 0.001) and negatively correlated with d-excess (R = −0.58, p < 0.001), indicating that increased solute concentration in source water in the study area is usually accompanied by heavy isotope enrichment and decreased d-excess. Specifically, the precipitation samples are located in areas with low EC, relatively depleted δ18O, and high d-excess, reflecting their low solute background and relatively independent isotopic characteristics as atmospheric input endmembers. The EC of the Yellow River water is also at a low level, and δ18O is relatively depleted, indicating that the Yellow River water still maintains a relatively clear terrestrial freshwater signal during the study period. In contrast, other surface water, groundwater, and tidal water were generally distributed in the higher EC range. These waters were also characterized by δ18O enrichment and lower d-excess values. This pattern suggests varying degrees of evaporative concentration, retention related mixing, and local redistribution after the water entered deltaic river networks, ditches, ponds, shallow groundwater systems, or coastal environments. Surface water and groundwater showed substantial overlap in the figure. This indicates similarities in both isotopic composition and solute background, consistent with the low separability of the “other surface water–groundwater” pair in the endmember analysis. Overall, the δ18O enrichment and d-excess reduction appear to reflect the evaporation and retention processes experienced by deltaic water bodies prior to sampling.
Figure 6.
Relationships between electrical conductivity and isotope indicators in source waters. (a) Relationship between EC and δ18O. (b) Relationship between EC and d-excess. The r values denote Pearson correlation coefficients.
5.2. Mixing Space Diagnostics and Source Separation
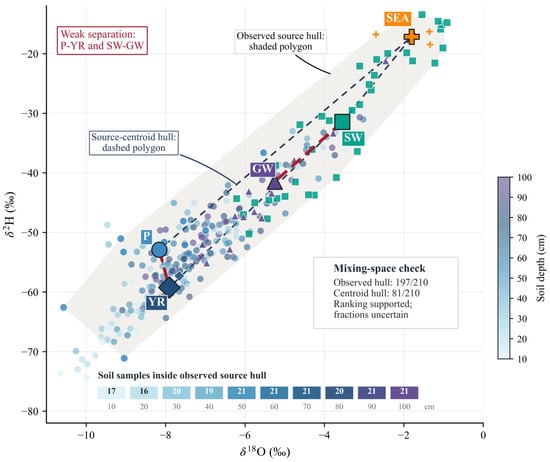
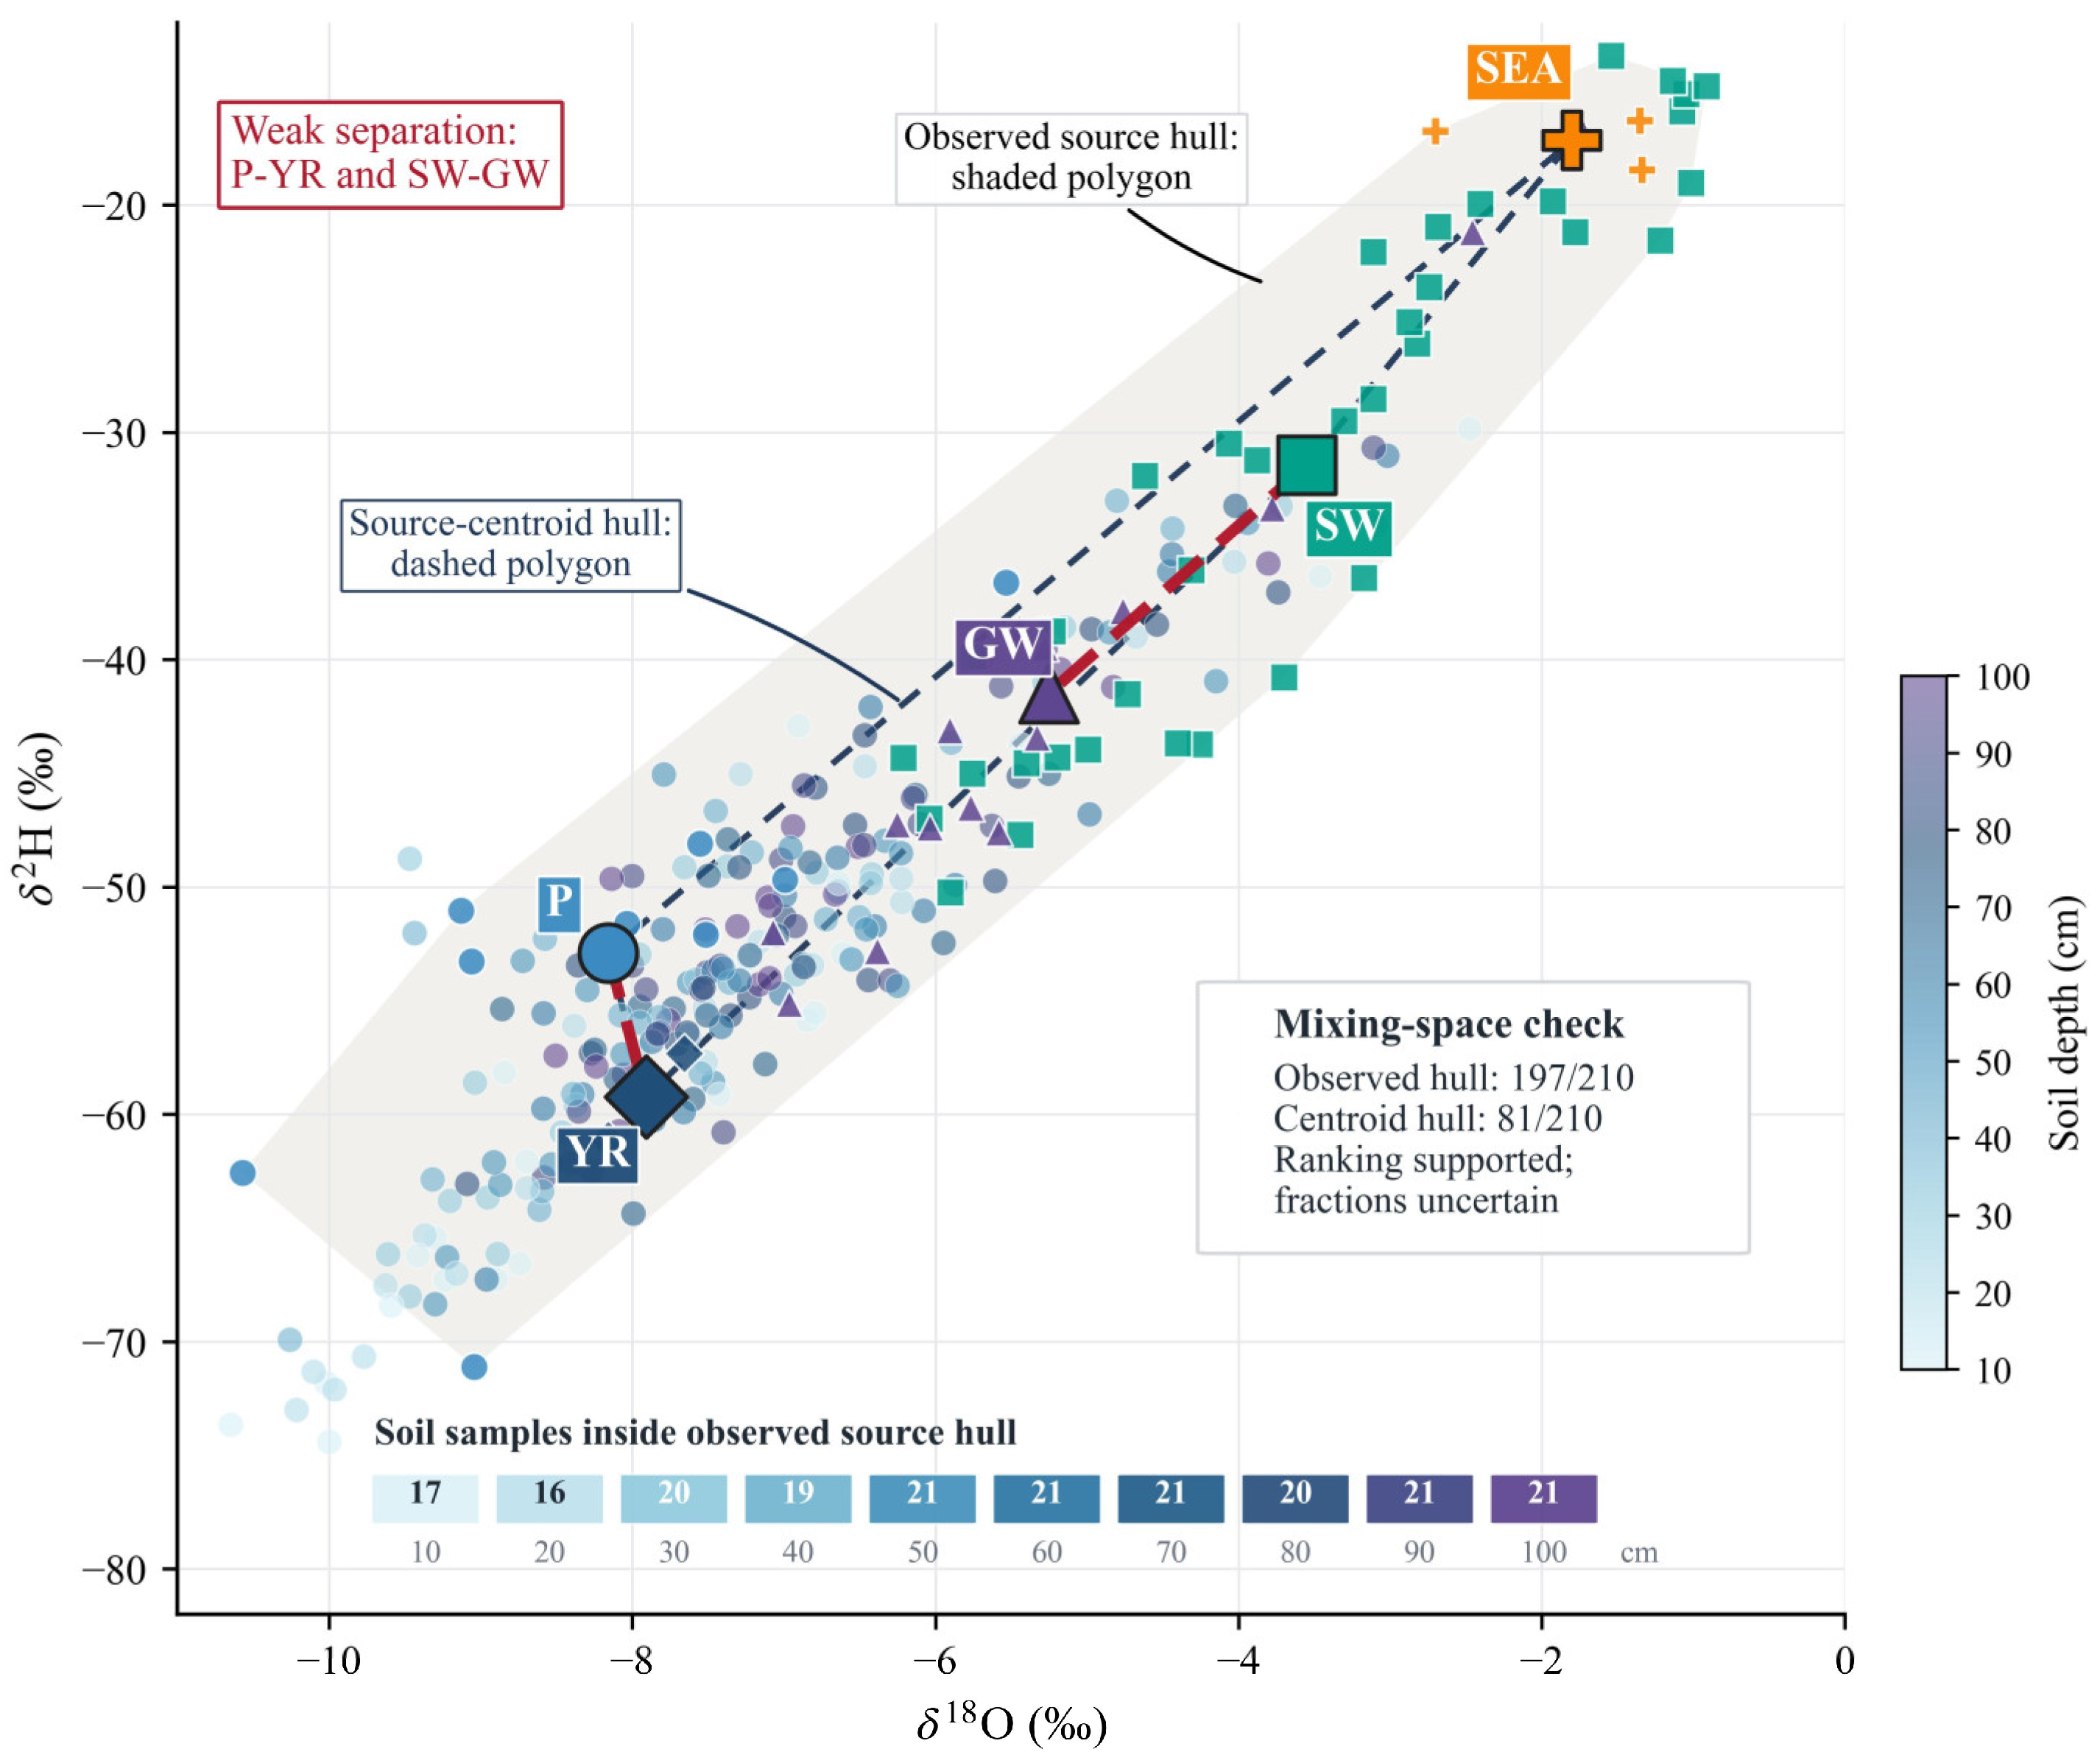
The δ2H–δ18O mixing space diagnosis showed that the five types of source water endmembers provided good overall coverage of soil water samples (Figure 7). The observation source convex hull, composed of all measured endmember samples, covered 197 out of 210 soil water samples, accounting for 93.8%. In contrast, the centroid convex hull, composed only of the mean values of the five types of endmembers, covered only 81 soil water samples, accounting for 38.6%. The difference between the two indicates that the isotopic variability within the endmembers has a significant impact on the mixing space range. Using only the endmember mean values to determine the mixing space may underestimate the coverage capacity of the measured water sources on soil water samples. By depth, mid- and deep soil water samples were more stably located within the observation source convex hull. At depths of 10 cm and 20 cm, 17/21 and 16/21 samples, respectively, were located within the observation source convex hull, increasing to 20/21 at 30 cm and 19/21 at 40 cm; the layers from 50 to 100 cm were completely or almost completely covered by the observation source space. This pattern suggests that the isotopic composition of mid- to deep soil water is more easily explained by measured end-member combinations, while the shallow soil water exhibits greater dispersion and records stronger short-term precipitation inputs, surface evaporation, and local redistribution effects. Of the 13 soil water samples outside the observed source hull, 12 occurred at depths of 10–40 cm, indicating that the mismatch was concentrated in the upper soil profile. Potential causes of this pattern include evaporative modification of soil water and source isotope variability not fully captured by the sampling.
Figure 7.
End-member separability and isotope mixing space diagnostics for the pooled MixSIAR model.
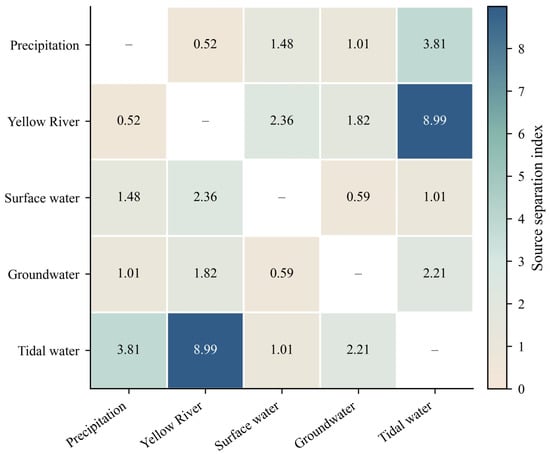
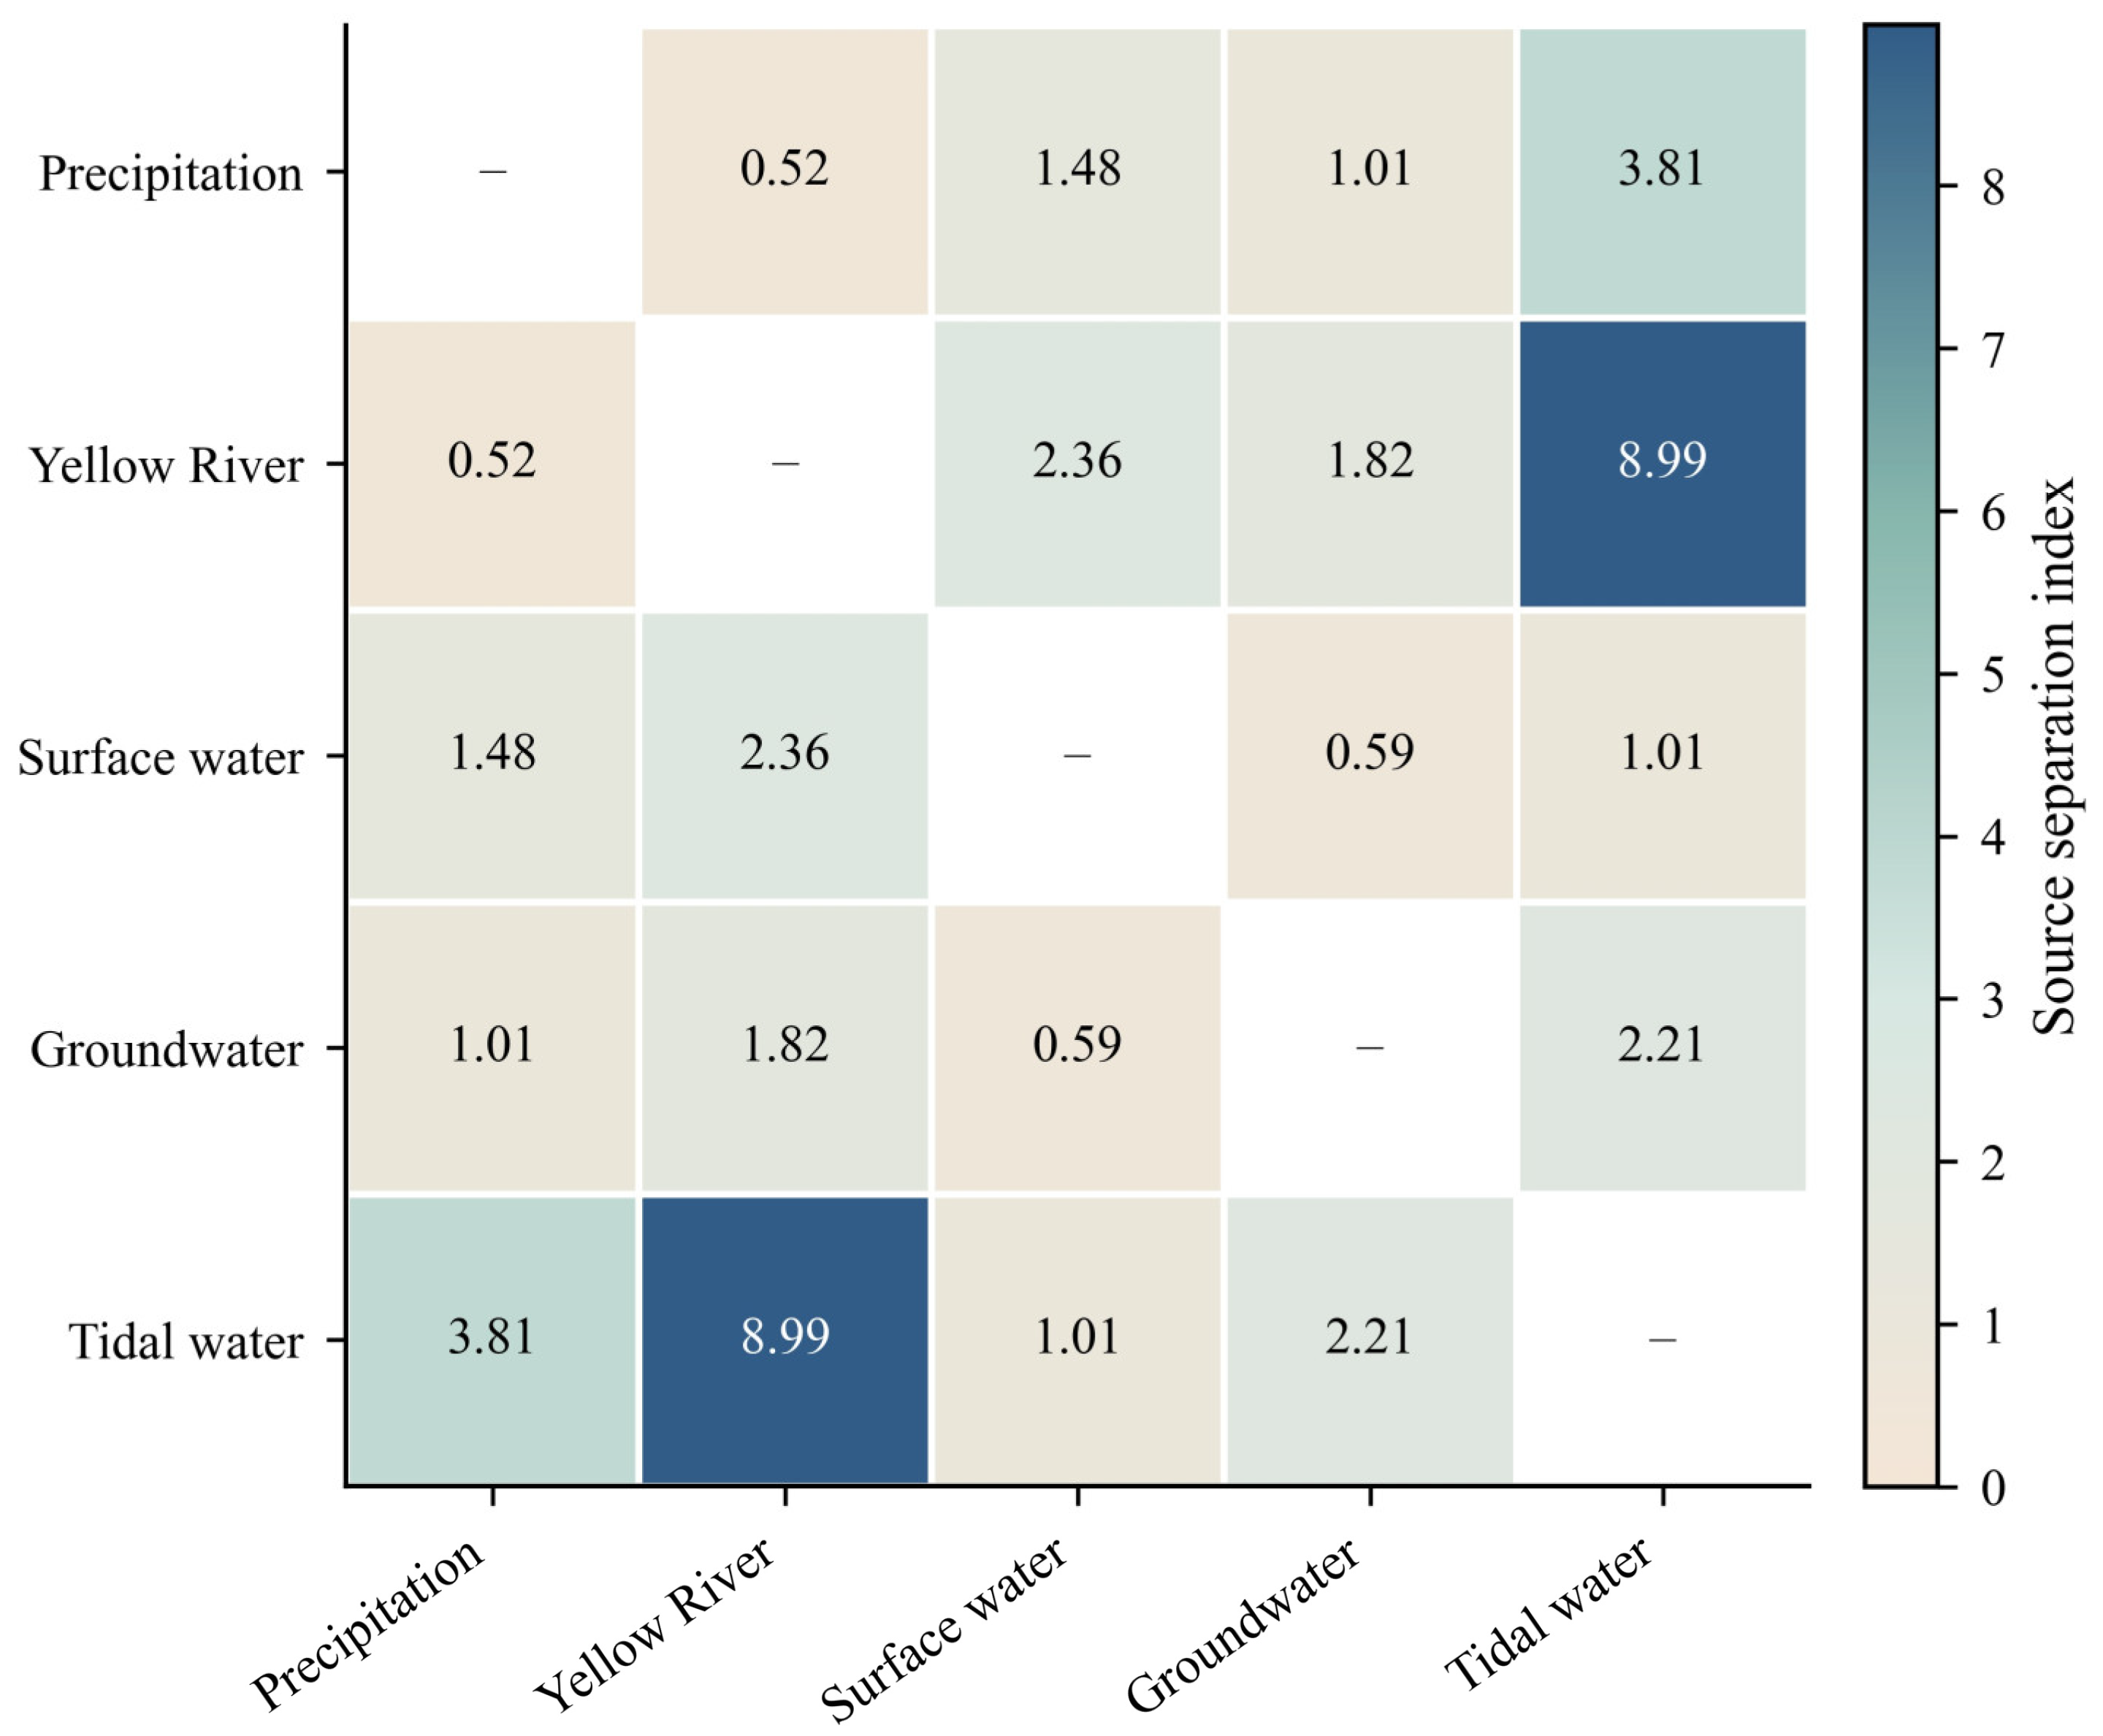
While the endmember coverage is generally good, significant differences remain in the distinguishability between different water sources. To further determine whether different water sources are easily distinguishable in terms of isotopic composition, this paper calculates the normalized centroid distance and SSI between each pair of endmembers in the five categories (see Figure 8). The weakest separation is between precipitation and Yellow River water, with a normalized centroid distance of 0.46 and an SSI value of 0.52. The separation between other surface water and groundwater is also weak, with a normalized centroid distance of 1.01 and an SSI value of 0.59. These two groups are the only water source combinations with SSI values below 1.0, indicating a high degree of overlap in the δ2H–δ18O space, which is the main source of uncertainty in the source resolution of the mixture model. In contrast, tidal water is located at the enriched end of the isotopic space and is clearly separated from precipitation and Yellow River water, with an SSI value of 8.99 for precipitation tidal water and 3.81 for Yellow River water tidal water. The SSI values of the remaining source pairs ranged from 1.01 to 2.36, indicating that they had a moderate to strong degree of separation relative to the isotopic variability within the endmembers.
Figure 8.
Pairwise SSI among the five water source end-members. Lower values indicate greater source overlap.
Overall, the MixSIAR diagnostics supports the use of five types of endmembers for soil water source analysis, but also indicates that the model results need to be interpreted probabilistically. The measured endmember convex hulls cover the vast majority of soil water samples, suggesting that the source water body settings are generally reasonable; however, significant isotopic overlap exists between precipitation and Yellow River water, and between surface water and groundwater, limiting the model’s accurate differentiation of these water sources. Therefore, the MixSIAR results are more suitable for determining the importance ranking and relative contribution pattern of different water sources to soil water, rather than being interpreted as a strict water flux segmentation.
5.3. Yellow River Water Control on Soil Water
Across the combined dataset from the two sampling campaigns, the Yellow River water end-member had the highest posterior mean contribution at every sampled depth, ranging from 39.7% to 57.1%. This profile wide pattern supports an important Yellow River-associated component in soil water during the study period. The isotope evidence identifies a source signature shared across depths, and possible pathways include lateral seepage from the Yellow River channel, infiltration of diverted river water during irrigation, and exchange with shallow groundwater containing river-derived water. Canal seepage and irrigation–drainage exchanges have been documented in irrigation districts along the lower Yellow River [36,37], providing a regional basis for considering these pathways. The irrigation and drainage systems of the lower Yellow River deliver diverted Yellow River water to fields and replenish shallow groundwater via canal seepage [37]. These processes help explain why isotopic signals originating from the Yellow River main stream can still be detected in soil profiles far from the main channel.
Groundwater contributes to soil water throughout the entire profile, but its proportion is consistently lower than that of Yellow River water. This pattern indicates that while groundwater is not the dominant source of soil water, it reflects a continuous hydraulic connection and water exchange between groundwater and soil water. In the low-lying coastal environment of the Yellow River Delta, shallow groundwater is closely associated with river seepage, irrigation return water, precipitation infiltration, and lateral groundwater flow. These exchanges allow river-originating water to enter groundwater and contribute to soil water, thus preserving some of the isotopic signal of Yellow River water in the soil–groundwater system. Related research by Huang and Pang [38] also supports this view. Their study found that in regulated arid river basins, water diversion and river recharge alter the isotopic composition of groundwater and strengthen the hydrological connection between surface water and shallow aquifers.
5.4. Soil Water Redistribution at Different Hydrological Stages
The most significant isotopic variations were observed in the upper and middle layers of the soil profile during the two hydrological phases of the flood season and post-flood season, while the variations in layers below 60 cm were much smaller between the two sampling periods. Therefore, recent meteorological conditions have a stronger impact on shallow soil water; water stored in deeper layers responds less to short-term changes and maintains a more stable isotopic composition.
The differences between the two sampling campaigns did not decrease steadily with depth. Pronounced isotope shifts occurred at 10 cm and within the 30–50 cm layer. Near the surface, changes in precipitation inputs and evaporation offer plausible explanations for the observed shifts. The changes at 30–50 cm suggest that the variation in soil water composition extended into the middle profile. Infiltration followed by redistribution may account for this pattern, with differences in soil texture and pore structure affecting where incoming water was retained and mixed with pre-existing soil water.
Below 60 cm, isotope differences between the two campaigns were smaller, suggesting a more stable water composition that may reflect greater mixing with pre-existing soil water. Similar vertical patterns have been studied in soil water isotope research, where recent inputs are more clearly visible near the surface, while deeper layers contain water accumulated over longer timescales [39,40]. Therefore, the two campaigns revealed greater isotope variation in the upper half of the profile, while the pooled mixing estimates identified the Yellow River water end-member as the largest mean contributor across all sampled depths.
6. Conclusions
This study analyzed the soil water composition of a 10–100 cm soil profile in the Yellow River Delta using 275 effective δ2H and δ18O measurements from precipitation, Yellow River water, other surface water, groundwater, tidal water, and soil water. The six water bodies exhibited distinct isotopic characteristics. Precipitation and Yellow River water were isotopically more depleted than local surface water and tidal water. The slope and intercept of the precipitation line during the study period were both lower than the global average water line, indicating that evaporation led to variations in soil isotopic composition during this period.
Soil water isotope profiles showed significant depth dependence and hydrological stage specific variations. Compared to the flood season, soil water levels decreased significantly in the 10 cm and 30–50 cm depths during the post-flood season, while variations below 60 cm were smaller and more irregular. This depth pattern suggests that seasonal reorganization of soil water was concentrated in the upper half of the 1 m profile, rather than being transmitted evenly to deeper soil layers.
This study used a Bayesian mixture model to identify soil water sources in the 10–100 cm soil profile of the Yellow River Delta. Yellow River water was the primary source of soil water in this profile. The posterior mean contribution of Yellow River water ranged from 39.7% to 57.1%, followed by precipitation, with a contribution rate of 23.5% to 37.2%. Groundwater, other surface water, and seawater/tidal water contributed relatively little.
Overall, the inflow from the Yellow River main stream has a continuous impact on the soil profile of the Yellow River Delta. Since the isotopic mixing model identifies the contribution of water sources rather than physical flow paths, future research should combine isotopic measurements with soil moisture content, groundwater level, and hydraulic observations to more comprehensively reveal the delta’s replenishment mechanism and the water exchange processes during different hydrological stages from the flood season to the post-flood season.
Author Contributions
Conceptualization, Y.B.; methodology, C.Z., Y.B. and W.D.; software, C.Z.; validation, C.Z., Y.B., W.D., Q.M. and P.H.; formal analysis, C.Z.; investigation, Y.B., W.D. and Q.M.; data curation, Y.B.; writing—original draft preparation, C.Z.; writing—review and editing, C.Z., Y.B., W.D. and P.H.; supervision, Y.B. and Q.M.; funding acquisition, C.Z., Y.B. and W.D. All authors have read and agreed to the published version of the manuscript.
Funding
This research was supported by the National Key Research and Development Program of China (No. 2024YFC3211304); the China Geological Survey, the Observation, Monitoring and Evaluation of Natural Resources in the Yellow River Basin (No. DD202607102709); the China Geological Survey, Hydrogeological and Water Resources Survey of the Shandong Peninsula (No. DD202605102203). The authors are grateful to the editors and anonymous reviewers for their insightful comments and suggestions.
Data Availability Statement
Restrictions apply to the datasets. The datasets presented in this article are not readily available because the data are part of an ongoing study. Requests to access the datasets should be directed to geobayinji@163.com.
Conflicts of Interest
The authors declare that they have no known competing financial interests or personal relationships that could have appeared to influence the work reported in this paper.
References
- Sawyer, A.H.; Edmonds, D.A.; Knights, D. Surface water-groundwater connectivity in deltaic distributary channel networks. Geophys. Res. Lett. 2015, 42, 10299–10306. [Google Scholar] [CrossRef] [Scilit]
- Lee, K.S.; Kim, J.M.; Lee, D.R.; Kim, Y.; Lee, D. Analysis of water movement through an unsaturated soil zone in Jeju Island, Korea using stable oxygen and hydrogen isotopes. J. Hydrol. 2007, 345, 199–211. [Google Scholar] [CrossRef] [Scilit]
- Sprenger, M.; Volkmann, T.H.M.; Blume, T.; Weiler, M. Estimating flow and transport parameters in the unsaturated zone with pore water stable isotopes. Hydrol. Earth Syst. Sci. 2015, 19, 2617–2635. [Google Scholar] [CrossRef] [Scilit]
- Brooks, J.R.; Barnard, H.R.; Coulombe, R.; McDonnell, J.J. Ecohydrologic separation of water between trees and streams in a Mediterranean climate. Nat. Geosci. 2010, 3, 100–104. [Google Scholar] [CrossRef] [Scilit]
- Sprenger, M.; Stumpp, C.; Weiler, M.; Aeschbach, W.; Allen, S.T.; Benettin, P.; Dubbert, M.; Hartmann, A.; Hrachowitz, M.; Kirchner, J.W.; et al. The demographics of water: A review of water ages in the critical zone. Rev. Geophys. 2019, 57, 800–834. [Google Scholar] [CrossRef] [Scilit]
- Craig, H. Isotopic variations in meteoric waters. Science 1961, 133, 1702–1703. [Google Scholar] [CrossRef] [Scilit] [PubMed]
- Gat, J.R. Oxygen and hydrogen isotopes in the hydrologic cycle. Annu. Rev. Earth Planet. Sci. 1996, 24, 225–262. [Google Scholar] [CrossRef] [Scilit]
- Zhao, X.; Li, F. Isotope evidence for quantifying river evaporation and recharge processes in the lower reaches of the Yellow River. Environ. Earth Sci. 2017, 76, 123. [Google Scholar] [CrossRef] [Scilit]
- Trinh, D.A.; Luu, M.T.N.; Le, Q.T.P. Use of stable isotopes to understand run-off generation processes in the Red River. Hydrol. Process. 2017, 31, 3827–3843. [Google Scholar] [CrossRef] [Scilit]
- Le Duy, N.; Heidbüchel, I.; Meyer, H.; Merz, B.; Apel, H. What controls the stable isotope composition of precipitation in the Mekong Delta? A model-based statistical approach. Hydrol. Earth Syst. Sci. 2018, 22, 1239–1262. [Google Scholar] [CrossRef] [Scilit]
- Yang, K.; Han, G. Controls over hydrogen and oxygen isotopes of surface water and groundwater in the Mun River catchment, northeast Thailand: Implications for the water cycle. Hydrogeol. J. 2020, 28, 1021–1036. [Google Scholar] [CrossRef] [Scilit]
- Ren, X.; Li, P.; He, X.; Zhang, Q. Tracing the sources and evaporation fate of surface water and groundwater using stable isotopes of hydrogen and oxygen. Sci. Total Environ. 2024, 931, 172708. [Google Scholar] [CrossRef] [Scilit] [PubMed]
- Wang, L.; Liu, W.; Xu, Z.; Zhang, J. Water sources and recharge mechanisms of the Yarlung Zangbo River in the Tibetan Plateau: Constraints from hydrogen and oxygen stable isotopes. J. Hydrol. 2022, 614, 128585. [Google Scholar] [CrossRef] [Scilit]
- Hamidi, M.D.; Gröcke, D.R.; Joshi, S.K.; Greenwell, H.C. Investigating groundwater recharge using hydrogen and oxygen stable isotopes in Kabul city, a semi-arid region. J. Hydrol. 2023, 626, 130187. [Google Scholar] [CrossRef] [Scilit]
- Chen, H.; Li, J.; Zhao, C.; Wang, C.; Hao, W.; Meng, L.; Huang, T.; Yang, H.; Zhao, K.; Yu, Z.; et al. Seasonal and spatial variations of water recharging in the Yangtze River using hydrogen and oxygen stable isotopes. J. Hydrol. 2024, 639, 131563. [Google Scholar] [CrossRef] [Scilit]
- Stumpp, C.; Brüggemann, N.; Wingate, L. Stable isotope approaches in vadose zone research. Vadose Zone J. 2018, 17, 1–7. [Google Scholar] [CrossRef] [Scilit]
- Zhang, Y.; Li, F.; Zhao, G.; Li, J.; Ouyang, Z. An attempt to evaluate the recharge source and extent using hydrogeochemistry and stable isotopes in North Henan Plain, China. Environ. Monit. Assess. 2014, 186, 5185–5197. [Google Scholar] [CrossRef] [Scilit] [PubMed]
- Zhi, C.; Cao, W.; Zhang, Z.; Li, Z.; Ren, Y. Hydrogeochemical characteristics and processes of shallow groundwater in the Yellow River Delta, China. Water 2021, 13, 534. [Google Scholar] [CrossRef] [Scilit]
- Stock, B.C.; Jackson, A.L.; Ward, E.J.; Parnell, A.C.; Phillips, D.L.; Semmens, B.X. Analyzing mixing systems using a new generation of Bayesian tracer mixing models. PeerJ 2018, 6, e5096. [Google Scholar] [CrossRef] [Scilit] [PubMed]
- Kong, D.; Miao, C.; Borthwick, A.G.L.; Duan, Q.; Liu, H.; Sun, Q.; Ye, A.; Di, Z.; Gong, W. Evolution of the Yellow River Delta and its relationship with runoff and sediment load from 1983 to 2011. J. Hydrol. 2015, 520, 157–167. [Google Scholar] [CrossRef] [Scilit]
- Wang, H.; Wu, X.; Bi, N.; Li, S.; Yuan, P.; Wang, A.; Syvitski, J.P.M.; Saito, Y.; Yang, Z.; Liu, S.; et al. Impacts of the dam-orientated water-sediment regulation scheme on the lower reaches and delta of the Yellow River (Huanghe): A review. Glob. Planet. Change 2017, 157, 93–113. [Google Scholar] [CrossRef] [Scilit]
- Niu, B.; Zhang, Z.; Yu, X.; Li, X.; Wang, Z.; Loáiciga, H.A.; Peng, S. Regime shift of the hydroclimate-vegetation system in the Yellow River Delta of China from 1982 through 2015. Environ. Res. Lett. 2020, 15, 024017. [Google Scholar] [CrossRef] [Scilit]
- Lu, Q.; Kang, L.; Shao, H.; Zhao, Z.; Chen, Q.; Bi, X.; Shi, P. Investigating marsh sediment dynamics and its driving factors in Yellow River Delta for wetland restoration. Ecol. Eng. 2016, 90, 307–313. [Google Scholar] [CrossRef] [Scilit]
- Aggarwal, P.K.; Romatschke, U.; Araguas-Araguas, L.; Belachew, D.; Longstaffe, F.J.; Berg, P.; Schumacher, C.; Funk, A. Proportions of convective and stratiform precipitation revealed in water isotope ratios. Nat. Geosci. 2016, 9, 624–629. [Google Scholar] [CrossRef] [Scilit]
- Gomo, M.; Vermeulen, D. An investigative comparison of purging and non-purging groundwater sampling methods in Karoo aquifer monitoring wells. J. Afr. Earth Sci. 2015, 103, 81–88. [Google Scholar] [CrossRef] [Scilit]
- Lis, G.P.; Wassenaar, L.I.; Hendry, M.J. High-precision laser spectroscopy D/H and 18O/16O measurements of microliter natural water samples. Anal. Chem. 2008, 80, 287–293. [Google Scholar] [CrossRef] [Scilit] [PubMed]
- Penna, D.; Stenni, B.; Šanda, M.; Wrede, S.; Bogaard, T.A.; Michelini, M.; Fischer, B.M.C.; Gobbi, A.; Mantese, N.; Zuecco, G.; et al. Evaluation of between-sample memory effects in the analysis of δ2H and δ18O of water samples measured by laser spectroscopes. Hydrol. Earth Syst. Sci. 2012, 16, 3925–3933. [Google Scholar] [CrossRef] [Scilit]
- Coplen, T.B. Guidelines and recommended terms for expression of stable-isotope-ratio and gas-ratio measurement results. Rapid Commun. Mass Spectrom. 2011, 25, 2538–2560. [Google Scholar] [CrossRef] [Scilit] [PubMed]
- Pfahl, S.; Sodemann, H. What controls deuterium excess in global precipitation? Clim. Past 2014, 10, 771–781. [Google Scholar] [CrossRef] [Scilit]
- Smith, J.A.; Mazumder, D.; Suthers, I.M.; Taylor, M.D. To fit or not to fit: Evaluating stable isotope mixing models using simulated mixing polygons. Methods Ecol. Evol. 2013, 4, 612–618. [Google Scholar] [CrossRef] [Scilit]
- Bansah, S.; Ali, G. Evaluating the effects of tracer choice and end-member definitions on hydrograph separation results across nested, seasonally cold watersheds. Water Resour. Res. 2017, 53, 8851–8871. [Google Scholar] [CrossRef] [Scilit]
- Ward, E.J.; Semmens, B.X.; Schindler, D.E. Including source uncertainty and prior information in the analysis of stable isotope mixing models. Environ. Sci. Technol. 2010, 44, 4645–4650. [Google Scholar] [CrossRef] [Scilit] [PubMed]
- Rossman, S.; Ostrom, P.H.; Gordon, F.; Zipkin, E.F. Beyond carbon and nitrogen: Guidelines for estimating three-dimensional isotopic niche space. Ecol. Evol. 2016, 6, 2405–2413. [Google Scholar] [CrossRef] [Scilit] [PubMed]
- Dansgaard, W. Stable isotopes in precipitation. Tellus 1964, 16, 436–468. [Google Scholar] [CrossRef] [Scilit]
- Xia, Z.; Welker, J.M.; Winnick, M.J. The seasonality of deuterium excess in non-polar precipitation. Glob. Biogeochem. Cycles 2022, 36, e2021GB007245. [Google Scholar] [CrossRef] [Scilit]
- Liu, L.; Luo, Y.; He, C.; Lai, J.; Li, X. Roles of the combined irrigation, drainage, and storage of the canal network in improving water reuse in the irrigation districts along the lower Yellow River, China. J. Hydrol. 2010, 391, 157–174. [Google Scholar] [CrossRef] [Scilit]
- Wang, P. Research on an evaluation index system for high-quality development of modern irrigation districts in the lower Yellow River Basin. Water Resour. Dev. Res. 2021, 21, 52–56. (In Chinese) [Google Scholar] [CrossRef]
- Huang, T.; Pang, Z. Changes in groundwater induced by water diversion in the Lower Tarim River, Xinjiang Uygur, NW China: Evidence from environmental isotopes and water chemistry. J. Hydrol. 2010, 387, 188–201. [Google Scholar] [CrossRef] [Scilit]
- Koeniger, P.; Gaj, M.; Beyer, M.; Himmelsbach, T. Review on soil water isotope-based groundwater recharge estimations. Hydrol. Process. 2016, 30, 2817–2834. [Google Scholar] [CrossRef] [Scilit]
- Sprenger, M.; Leistert, H.; Gimbel, K.; Weiler, M. Illuminating hydrological processes at the soil-vegetation-atmosphere interface with water stable isotopes. Rev. Geophys. 2016, 54, 674–704. [Google Scholar] [CrossRef] [Scilit]

Disclaimer/Publisher’s Note: The statements, opinions and data contained in all publications are solely those of the individual author(s) and contributor(s) and not of MDPI and/or the editor(s). MDPI and/or the editor(s) disclaim responsibility for any injury to people or property resulting from any ideas, methods, instructions or products referred to in the content. |
© 2026 by the authors. Licensee MDPI, Basel, Switzerland. This article is an open access article distributed under the terms and conditions of the Creative Commons Attribution (CC BY) license.