


Abstract
The Sanjiang Plain supports globally important freshwater marsh ecosystems, yet intensive agricultural reclamation has caused extensive wetland loss and fragmentation. The role of substrate heterogeneity in wetland-type differentiation remains poorly understood. This study investigated the Eighty-Five-Two Farm in the Sanjiang Plain, Northeast China, using portable drilling and profile surveys to characterize substrate properties to a depth of 5 m. A four-category indicator framework covering physical–hydrological, nutrient–biogenic, mineral–geochemical, and chemical–redox properties was established. GIS-based spatial analysis and the GeoDetector model were used to identify substrate factors associated with wetland-type differentiation and quantify their depth-dependent explanatory power and interactions. Substrate configuration exhibited relatively strong explanatory power (q = 0.485). Factor importance varied with depth: grain-size variables were strongest in the upper layers; pH, TiO2, and MnO were strongest at 1 m; and organic matter, Na2O, and SiO2 remained influential at 5 m. Upper-layer grain-size patterns are consistent with texture-related infiltration and drainage, while broad 1-m and heterogeneous 5-m interactions indicate depth-specific coupling among substrate properties. Interaction analysis showed that many factor pairs had greater explanatory power than individual factors, with nonlinear enhancement in some pairs. Interactions were broadest at 1 m and strong but heterogeneous at 5 m. These results indicate that wetland-type differentiation was associated with depth-dependent coupling among substrate structure, hydrological conditions, nutrient retention, and mineral–geochemical processes. These findings support incorporating substrate conditions into wetland restoration planning and may inform the identification of suitable restoration areas and target wetland types for degraded wetlands in the Sanjiang Plain.
1. Introduction
Wetlands are ecological transition zones formed through interactions between terrestrial and aquatic ecosystems. They provide essential services, including water conservation, climate regulation, nutrient cycling, and biodiversity maintenance [1]. However, climate change and intensive human activities have caused widespread wetland loss and degradation over the past several centuries [2,3]. These changes have fragmented wetland ecosystems and weakened their ecological functions, affecting greenhouse gas fluxes, flood regulation, water storage, and biodiversity conservation [4,5]. Wetland conservation and restoration have therefore become integral to global environmental governance. The United Nations Decade on Ecosystem Restoration (2021–2030) identifies wetlands as a priority, while Target 2 of the Kunming–Montreal Global Biodiversity Framework calls for at least 30% of degraded terrestrial, inland water, coastal, and marine ecosystems to be under effective restoration by 2030 [6,7]. In this context, understanding wetland development and restoring degraded wetlands in the Sanjiang Plain are essential for regional ecological stability. Such research also has broader implications for the sustainable management of wetland ecosystems.
Wetland formation and development are driven by long-term interactions among geomorphic, hydrological, climatic, biological, and anthropogenic processes. Their spatially and temporally variable coupling creates diverse wetland environments [8,9]. Various wetland classification systems have been developed to support wetland identification, conservation, and management. The Ramsar classification system primarily uses biophysical characteristics, vegetation and hydrological characteristics [10]. The Cowardin system is based on a hierarchical ecological framework [11]. The Hydrogeomorphic Classification System (HGM) emphasizes water sources, hydrological processes, and ecological functions [8]. The Canadian Wetland Classification System (CWCS) describes wetlands by class, form, and type [12]. China’s national standard for wetland classification (GB/T 24708-2009) adopts a three-level hierarchy of type, form, and function and recognizes 42 wetland types [13]. However, existing classification systems and studies of wetland evolution have focused mainly on surface hydrology, vegetation communities, climate change, land use, and landscape patterns [14,15,16,17,18]. In contrast, relatively limited attention has been paid to the substrate, which provides the material basis for wetland development, particularly its vertical heterogeneity and its relationship to wetland-type differentiation. This gap is especially relevant in lowland wetlands such as the Sanjiang Plain, where sedimentary environments, groundwater processes, and agricultural reclamation have interacted over long periods, jointly shaping complex wetland environments [19]. Even where surface characteristics appear similar, the stratigraphic structure and physicochemical properties of the subsurface substrate may differ substantially, and the relationships between these differences and wetland development and type differentiation remain unclear. Examining wetland-type development from the perspective of substrate heterogeneity may therefore provide a new scientific basis for the type-specific restoration of degraded wetlands.
The substrate refers to surface lithospheric materials exposed on terrestrial surfaces or beneath water bodies. These materials support the development and maintenance of natural resources such as forests, grasslands, and water bodies (Overall Plan for Establishing the Natural Resources Survey and Monitoring System [20]). The substrate connects surface ecological processes with subsurface geological processes. Its physical properties directly regulate water infiltration and retention, while its chemical environment controls biogeochemical cycling [21]. Substrate heterogeneity is shaped by climate, geology, and habitat-forming processes. It reflects spatial differences in resources arising from long-term geological evolution and environmental change and is therefore important for ecological conservation and restoration [4,22]. Heterogeneity in substrate structure and properties records regional geological evolution and provides a basis for wetland formation and differentiation. Substrate heterogeneity is commonly assessed using structural characteristics or two-dimensional, three-dimensional, or fractal metrics [22,23]. Sensitivity analyses and controlled experiments are also widely used. Previous studies have examined its effects on vegetation recovery, wetland restoration, soil carbon cycling, moisture transport, biodiversity, and clonal plant growth [24,25,26,27,28,29]. However, few studies have investigated how substrate heterogeneity controls the formation and long-term stability of different wetland types [30,31].
GeoDetector is a statistical method developed by Wang et al. to identify spatial differentiation and its driving factors [32]. It is based on spatial correspondence between a geographical phenomenon and its potential drivers. A factor has greater explanatory power when its spatial pattern closely matches that of the phenomenon under investigation [33]. Unlike conventional correlation and regression methods, GeoDetector does not require linear relationships between variables. It can also quantify the explanatory power of individual factors and their interactions [34]. GeoDetector has been widely applied in physical geography, ecology, land-use research, public health, and resource and environmental assessment [35,36,37,38]. Applications include identifying the drivers of air pollution, traditional settlement patterns, vegetation dynamics, desertification, soil-property differentiation, and watershed-scale changes in the normalized difference vegetation index (NDVI) [39,40,41,42]. Wetland-type development is strongly spatially heterogeneous, and different wetland types are often associated with distinct substrate combinations and vertical structures. Such patterns cannot be fully explained by any single factor. GeoDetector was therefore used in this study to quantify how substrate conditions drive wetland-type development from the perspective of spatial heterogeneity.
The Sanjiang Plain was formed by alluvial deposition from the Songhua, Heilongjiang, and Ussuri rivers. It contains one of the world’s largest concentrations of freshwater marsh wetlands and is both an important wetland ecological region and a major commercial grain-producing area [43]. Since the 1950s, large-scale agricultural reclamation has transformed natural wetland landscapes into cropland-dominated mosaics [44]. China has strengthened wetland conservation and management in the Sanjiang Plain since joining the Ramsar Convention in 1992. Nevertheless, wetland fragmentation and disrupted hydrological connectivity caused by long-term agricultural development remain severe at local scales [45]. Farm 852 is located in the central Sanjiang Plain and has experienced extensive wetland conversion to farmland. Long-term agricultural reclamation, mechanized cultivation, and drainage and irrigation projects have strongly altered the landscape. Apart from large protected wetlands, only isolated small wetlands remain to support local hydrological regulation [46]. At the same time, wetland drainage has exposed extensive areas of ground substrate. This provides favorable conditions for shallow drilling, profile observations, and substrate-property analyses. Farm 852 is therefore a representative area for investigating wetland degradation and persistence under intensive human disturbance. It is also well suited for examining how substrate heterogeneity affects wetland-type development and potential restoration pathways. Such research is important for the sustainable development of regional ecosystems.
This study focused on Farm 852 in the Sanjiang Plain and extended the investigation of wetland-type development from surface hydrology, vegetation, and land use to the substrate and its vertical structure. Specifically, the study addressed four questions: (1) What is the spatial distribution of substrate configurations at Farm 852? (2) How do individual substrate factors and their vertical properties affect wetland-type differentiation? (3) How do substrate structure and physicochemical properties differ among wetland types? (4) How can substrate heterogeneity inform the conservation and restoration of degraded wetlands? By addressing these questions, this study advances understanding of the subsurface conditions associated with wetland-type differentiation and highlights the relevance of vertical substrate heterogeneity to wetland assessment and management. The findings also provide a scientific basis for incorporating substrate conditions into type-specific conservation and spatially targeted restoration planning in intensively cultivated regions.
2. Study Area and Data
2.1. Study Area
The study area is located at Farm 852 in Baoqing County, Shuangyashan City, Heilongjiang Province (Figure 1). It covers approximately 518.39 km2 and lies between the southern margin of the central Sanjiang Plain and the northern foothills of the Wanda Mountains. The terrain slopes gently from south to north. The region has a mid-temperate continental monsoon climate. Its well-developed drainage network is dominated by the Naoli River and its tributaries, which provide essential hydrological support for the remaining wetlands. The area is extensively covered by unconsolidated Quaternary terrestrial sediments. These sediments transition from residual–colluvial substrates in the hills to alluvial–lacustrine and floodplain alluvial–proluvial deposits in the plains. This spatial variation in substrate conditions provides an important material basis for wetland-type differentiation.
Figure 1.
Location of the study area and distribution sampling sites. The administrative boundaries are based on the officially approved standard map dataset of the Ministry of Natural Resources of China. Map review number: GS(2024)0650.
Farm 852 is a major agricultural reclamation area in the Beidahuang region, where wetland conversion to cropland has been extensive. Over the past 40 years, a cumulative area of 26.08 km2 of wetlands has been converted to other land uses. The southeastern part of the study area retains a landscape dominated by forests and hilly ecological buffers associated with the Wanda Mountains. By contrast, the northwestern and central plains have become major agricultural production areas dominated by maize, soybean, and rice cultivation.
The remaining wetlands cover approximately 5.27 km2 and comprise three main types: inland mudflats, swampy meadows, and forest swamps. Inland mudflats are the dominant type, covering approximately 4.32 km2 and accounting for 82% of the total wetland area. They occur mainly along the land–water ecotones surrounding the Hamatong River and Hamatong Reservoir. Swampy meadows cover approximately 0.90 km2 and are concentrated on the northern floodplains and in low-lying moist areas. Forest swamps cover approximately 0.06 km2 and occur sporadically in intermontane areas south of the reservoir.
2.2. Data Sources and Sample Collection
Data on wetland types and their spatial distribution were obtained from China’s Third National Land Survey. All spatial datasets were standardized to a common coordinate system, reprojected, and clipped to the study-area boundary. GIS-based spatial analyses were then conducted to delineate substrate configurations, overlay wetland types, and perform GeoDetector modeling. Data on the vertical structure and physicochemical properties of the substrate were obtained through field surveys and laboratory analyses.
2.2.1. Portable Drilling Survey
The portable drilling rig was used to investigate substrate properties from the surface to a depth of 5 m. Sampling locations were selected based on mapping-unit type, soil parent material, geological origin, and field accessibility. A grid-based design was used to ensure a relatively even spatial distribution. The sampling density was one site per 4 km2. A total of 156 boreholes were drilled, and 684 soil samples were collected. Each borehole was treated as one independent field sampling location, whereas samples collected at different depths within the same borehole were treated as repeated depth-specific observations. Six boreholes were located within the currently mapped wetland boundaries, whereas the remaining 150 boreholes were located outside the mapped wetlands. The outside-wetland boreholes were retained for substrate mapping and the spatial estimation of substrate properties in unsampled areas. Substrate color, texture, stratification, moisture conditions, Fe–Mn mottling, and other characteristic depositional features were recorded at different depths. Samples were collected at the surface (0 m) and at depths of 1, 2, and 5 m. Each sample weighed at least 1200g. Samples for bulk-density determination were collected using cutting rings, whereas the remaining samples were obtained by transversely sectioning the cylindrical cores at the predefined depth intervals with a knife. The separated samples were immediately sealed and labeled.
2.2.2. Survey of Artificial Profiles
Excavated profiles clearly reveal the vertical depositional structure of the substrate. Based on wetland-type representativeness, geomorphic setting, and field feasibility, three representative profiles were selected. These profiles represented a swampy meadow, forest swamp, and inland mudflat and were designated BWD01, BWD02, and BWD03, respectively. The three excavated soil profiles were not included in the total number of boreholes. Their measurements were used only for site-level descriptive comparisons and were not included in the GeoDetector analysis. The surveys were conducted during the low-water period in areas without visible surface ponding. The excavation points were selected to avoid extensive surface ponding, although localized standing water was present at the forest swamp site. Each profile trench was 2 m long, 1 m wide, and 2 m deep. Excavation was terminated when bedrock or the groundwater table was reached. After the profile was trimmed, the sun-facing wall was selected for profile description. Sampling intervals were fixed at 10 cm. Because excavation exposed the substrate as a vertical wall, all samples were collected using stainless-steel cutting rings to minimize mixing between adjacent soil layers.
2.2.3. Sample Collection and Pretreatment
Sample collection, preservation, and transport followed the Specification for Land Quality Geochemical Assessment (DZ/T 0295-2016) [47]. Before samples were collected from the drill cores, the outer material was removed with a stainless-steel scraper to avoid disturbance and contamination. Each composite sample consisted of one primary sample and three subsamples. At least 1 kg was collected for chemical analysis and 200 g for physical-property analysis. The samples were naturally air-dried, and plant roots, gravel, and other impurities were removed. They were then ground, sieved, bottled, sealed, and sent to the laboratory for analysis. Core-ring samples from the excavated profiles were oven-dried before laboratory analysis.
3. Methodology
3.1. Study Process
This study established a four-stage technical framework comprising data acquisition, indicator system construction, driving-factor identification, and profile-based process analysis (Figure 2). Some schematic illustrations in this figure were generated using generative artificial intelligence (AI) to aid visualization of the study workflow. First, substrate samples were collected from depths of 0–5 m using a portable drilling rig and from depths of 0–2 m through excavated profile surveys. Laboratory analyses were then conducted to establish a substrate property database. The analytical methods, standard references, instruments, and detection limits are listed in Appendix A (Table A1). A substrate indicator system was developed across four dimensions: physical–hydrological, nutrient–biological, mineral–geochemical, and chemical–redox properties. Key indicators included grain-size composition, nutrient conditions, mineral composition, and the redox environment.
Figure 2.
Four-stage technical workflow of this study.
GIS-based spatial overlay analysis and the GeoDetector model were used to identify key substrate factors associated with the spatial differentiation of wetland types. The factor detector quantified the explanatory power of individual factors at different depths, while the interaction detector assessed how the joint explanatory power of pairs of factors differed from that of each factor considered individually. Representative profiles of the three wetland types were further compared in terms of substrate stratification, physicochemical properties, and hydrogeochemical processes. This analysis clarified the controls of substrate configuration, water retention, nutrient accumulation, and redox conditions on wetland-type development. Finally, the mechanisms by which substrate heterogeneity drives wetland-type differentiation were examined. The findings provide a theoretical basis for the type-specific conservation and targeted restoration of degraded wetlands.
3.2. Substrate Indicator System
Based on the regional geological setting, wetland development conditions, and ecological functions, we established a substrate indicator system consisting of 20 indicators across four dimensions (Table 1). These indicators were used as the independent-variable dataset in the GeoDetector model. The system characterizes ground substrate properties from four dimensions: physical–hydrological, nutrient–biological, mineral–geochemical, and chemical–redox properties.
Table 1.
Indicator system for wetland substrate characteristics.
Physical–hydrological indicators mainly describe the particle-size composition, compaction, and pore structure of the substrate. These properties determine water infiltration, retention, and vertical transport. Nutrient–biological indicators characterize the capacity of the substrate to support plant growth and wetland primary productivity. They also reflect organic matter accumulation and nutrient retention. Mineral–geochemical indicators characterize the mineral composition of the substrate, differences in parent materials, and weathering and migration processes. Chemical–redox indicators mainly reflect the acid–base conditions and redox state within the substrate.
3.3. GeoDetector Model
GeoDetector is a statistical method based on the theory of spatially stratified heterogeneity [32]. It can identify the spatial differentiation of geographical phenomena and their driving factors. It can also reveal interactions among multiple factors. This method does not require linear relationships between variables and is well suited to categorical variables. It is therefore suitable for examining the relationships between substrate factors, such as substrate type, and the spatial distribution of wetland types. This study employed the factor detector and interaction detector, with each wetland class represented by a separate binary indicator response variable.
3.3.1. Data Preprocessing and Factor Detection
At each depth, numerical substrate indicators were interpolated using inverse distance weighting in the projected coordinate system and generated on a common 30 m × 30 m grid. Each numerical indicator was then discretized into six natural-break classes using consistent thresholds across depths, whereas substrate configuration was retained as a categorical variable and was neither interpolated nor reclassified. The resulting layers were overlaid with the substrate-configuration and wetland-type maps. Grid cells with valid data within the mapped wetland area were retained, and each record in the GeoDetector input table represented one grid cell rather than one borehole or soil sample. For cross-depth comparison, the same 497 common grid cells were retained at all four depths. The complete unit-level analysis dataset has been provided in the Supplementary Table S1.
Because wetland type is a nominal variable, a separate binary indicator response variable was constructed for each wetland class. For wetland class a, the indicator variable Ya was assigned a value of 1 when a grid cell belonged to class a and 0 otherwise. The factor detector was then used to quantify the explanatory power of each substrate factor for each wetland class. For wetland class a and substrate factor X, the class-specific q-value was calculated as:
where qa(X) denotes the explanatory power of substrate factor X for wetland class a; N is the total number of grid cells; h denotes a stratum of factor X; Nh is the number of grid cells in stratum h; σ2(h,a) is the variance of the binary indicator variable for wetland class a within stratum h; and σa2 is the overall variance of this binary indicator variable. Because the response variable is binary, σa2 equals pa × (1 − pa), where pa is the proportion of grid cells belonging to wetland class a. The qa(X) value ranges from 0 to 1, with higher values indicating greater spatial explanatory power of factor X for the distribution of wetland class a.
To summarize the explanatory power of factor X across the three wetland classes, the class-specific q-values were combined using the overall variance of each binary response as the weight:
where qa(X), qb(X), and qc(X) are the q-values of substrate factor X for three wetland types. The corresponding variance terms are derived from the binary indicator variables and are used as weights to combine the three class-specific q-values. Higher qmulti(X) values indicate greater spatial explanatory power for the wetland class. The same class-specific and variance-weighted procedures were used for the interaction detector described.
3.3.2. Interaction Detection
Wetland-type development is generally influenced by multiple substrate factors, which may act synergistically. We therefore used the interaction detector to quantify the joint explanatory power of any two substrate factors for the spatial differentiation of wetland types.
Specifically, the q-values of two individual factors, Xi and Xj, were first calculated. The two factors were then spatially overlaid to generate a new stratum, Xi∩Xj, for which the q-value was also calculated. The interaction type was determined by comparing q(Xi), q(Xj) and q(Xi∩Xj). If the q-value after interaction was higher than that of either individual factor, the two factors were considered to have an enhancing interaction. If q(Xi∩Xj) exceeded the sum of q(Xi) and q(Xj), the interaction was classified as nonlinear enhancement. Interaction detection helps clarify the multifactor coupling mechanisms through which substrate heterogeneity influences wetland-type development.
3.3.3. Calculation of the Chemical Index of Alteration
The Chemical Index of Alteration (CIA) was calculated to characterize the degree of chemical weathering following Nesbitt and Young [48] and McLennan [49]. Because the CIA is based on molar proportions, the concentrations of Al2O3, CaO, Na2O, K2O, and P2O5 were converted from mass percentages to molar amounts using their respective molecular weights. The CIA was then calculated as:
4. Results
4.1. Identification of Substrate Factors Driving Wetland-Type Development
The GeoDetector results showed that the spatial differentiation of wetland types at Farm 852 in the Sanjiang Plain was not dominated by any single surface factor. Instead, it was jointly controlled by multiple substrate factors and their depth-dependent properties (Figure 3). Overall, the explanatory power of the substrate factors varied with depth. Substrate configuration (X4) showed relatively high and stable explanatory power, with q = 0.485 at all depths. Although it did not have the highest q-value at every depth, it acted as a stable structural factor and was therefore identified as a principal substrate factor controlling the spatial differentiation of wetland types. This result highlights the important constraints imposed by depositional sequences, soil-layer combinations, and vertical structure for wetland-type differentiation within the analyzed spatial units.
Figure 3.
Explanatory power of and vertical variations in substrate factors for wetland-type development at different depths.
In terms of factor categories, physical–hydrological factors provided strong explanatory power, particularly in the topsoil and 1-m layers. Grain-size factors showed the strongest explanatory power in the topsoil and at 1 m, with q-values of 0.421 and 0.546 for Clay (X1), 0.456 and 0.495 for Sand (X3), and 0.414 and 0.434 for Silt (X2), respectively. Their explanatory power declined at 2 m, particularly for Sand and Silt. At 5 m, Clay remained relatively influential (q = 0.405), whereas Silt showed weak explanatory power (q = 0.101). Thus, grain-size effects were stronger in the upper layers but became more variable with depth. BD (X5) consistently showed weak explanatory power (q = 0.029–0.033).
The nutrient–biological factors showed heterogeneous depth patterns rather than a monotonic increase with depth. The influence of OM (X6) increased from 0.107 in the topsoil to 0.537 at 5 m, making it one of the strongest factors in the deepest layer. TC (X7) remained moderate from the topsoil to 2 m (q = 0.282–0.330) but declined to 0.071 at 5 m. TN (X8) peaked at 5 m, while P2O5 (X9) showed relatively high values at 1 and 5 m. Thus, nutrient-related explanatory power varied among indicators, with organic matter and total nitrogen being most influential at 5 m. Mineral–geochemical and chemical–redox factors showed strong depth-specific variation. The 1-m layer had the highest individual q-values, particularly for pH (X20), TiO2 (X12), and MnO (X18). CaO (X15), MgO (X16), and Se (X19) also reached their maximum values at this depth. At 2 m, SiO2 (X10), pH, and K2O (X13) showed moderate explanatory power. At 5 m, Na2O (X14) and SiO2 (X10) were the most influential. Overall, these factors exhibited depth-specific rather than uniform vertical effects. These results suggest that deep organic matter and nutrient conditions are associated with wetland-type development.
The dominant combinations of factors also varied among depths. The topsoil was mainly controlled by the combined influence of substrate configuration and grain-size composition. Thus, at the ground-surface scale, wetland types were primarily constrained by soil texture, permeability, water-holding capacity, and surface ponding conditions. At 1 m, physical factors remained influential, particularly Clay, Sand, and Configuration, while pH, TiO2, MnO, Se, CaO, and MgO also showed relatively high explanatory power. This layer therefore displayed the strongest combined influence of physical, chemical, and mineral–geochemical factors. At 2 m, most factors showed moderate or low explanatory power compared with the other depths. It showed a more moderate and factor-specific pattern. TC, SiO2, pH, and K2O were the leading variable-specific factors. At 5 m, OM, Na2O, Clay and TN showed relatively high explanatory power. These results suggest that deeper organic-matter accumulation and mineral–geochemical properties contributed substantially to wetland-type differentiation at 5 m, although the responses remained factor-specific rather than uniformly increasing with depth.
4.2. Interaction Effects Among Substrate Drivers
The interaction detector revealed that many combinations of substrate factors showed greater explanatory power than individual factors, although the strength and distribution of interactions varied among depths (Figure 4). The interaction q-values were most broadly distributed at 1 m, whereas the 5 m layer showed strong but more heterogeneous interactions. For most factor pairs, q(Xi∩Xj) exceeded the q-value of either factor alone, indicating bivariate or nonlinear enhancement. Wetland-type development was therefore associated with coupled substrate properties rather than any single surface factor.
Figure 4.
Geodetector-based interactions among wetland substrate factors at different depths.
Physical–hydrological factors interacted with all three other factor groups at all depths. Grain-size composition and substrate structure regulate pore geometry, permeability, and water-storage capacity, thereby favoring prolonged waterlogging and the development of reducing conditions. Substrate configuration interacted strongly with other factors at multiple depths and served as a key link between surface hydrological processes and subsurface material composition. In the topsoil, relatively high interaction values were concentrated mainly in pairs involving grain-size composition and substrate configuration. At 1 m, high interaction values extended more broadly across the physical, nutrient, mineral–geochemical, and chemical factor groups. Substrate configuration was involved in several relatively strong interactions and may represent an important structural link between surface hydrological processes and subsurface material composition. Bulk density (X5) did not show a uniformly strong interaction pattern across the four depths.
The interaction patterns are consistent with the potential coupling of substrate texture, vertical structure, water retention, organic-matter accumulation, and geochemical processes. Fine-grained materials and specific substrate configurations may reduce drainage and prolong water-substrate contact, thereby favoring organic-matter accumulation and redox transformation. These conditions may also influence the mobility and redistribution of mineral elements. These process-based interpretations provide a possible explanation for the observed statistical associations.
Interaction patterns varied markedly with depth. In the surface layer, relatively high q-values were concentrated mainly among interactions involving the first several physical-structural factors, together with selected cross-group interactions. At 1 m, high-q values were distributed across a larger proportion of the interaction matrix, indicating the broadest interaction enhancement among the four depths. At 2 m, the matrix was generally lighter, with fewer high-q cells and several localized hotspots; therefore, this layer did not show the strongest or most extensive interaction enhancement. At 5 m, the interaction matrix displayed strong contrasts and several high-q bands across different factor groups, indicating complex and spatially heterogeneous coupling among deep substrate properties.
Overall, the interaction analysis showed that vertical substrate heterogeneity may affect wetland-type differentiation through depth-dependent coupling among physical structure, hydrological conditions, nutrient retention, and mineral–geochemical processes. The upper substrate layers were more strongly associated with interactions involving grain size and substrate configuration, the 1 m layer showed the broadest cross-group coupling, the 2 m layer showed comparatively moderate and localized interactions, and the 5 m layer showed complex interactions among deep substrate and geochemical factors. Evaluations of wetland hydrological restoration potential should therefore consider both surface and subsurface conditions rather than surface soil properties alone.
4.3. Effects of Key Drivers on Wetland-Type Development
4.3.1. Spatial Distribution of Substrate Configurations
The factor detector identified substrate configuration as a key driver of wetland-type development. Based on field observations and geological data, 12 substrate units were delineated according to geomorphic setting, depositional origin, and material composition (Figure 5). The substrate configurations exhibited clear geomorphic zonation. The southeastern hills were dominated by eluvial hill-soil–bedrock configurations. The central terraces consisted mainly of alluvial–diluvial terrace-soil, with local eluvial terrace-soil and basalt. Alluvial–diluvial flood plain deposits occurred along rivers and around the reservoir, whereas fine-grained alluvial–lacustrine plain-soil covered much of the northwestern plain. Overall, the substrate transitioned northwestward from erosional to depositional landforms and from shallow, coarse-grained materials to thick, fine-grained deposits.
Figure 5.
Spatial distribution and geomorphic differentiation of substrate configurations in the study area.
The hill category covered 13,024.19 ha and comprised five configurations: eluvial hill-soil and granite, eluvial hill-soil and diorite, eluvial hill-soil and sandstone, eluvial hill-soil and phyllonite, and eluvial hill-soil and granulite. Their distribution was controlled mainly by bedrock lithology and slope erosion. The terrace category covered 3494.76 ha and included alluvial–diluvial terrace–glacial gravel, alluvial–diluvial terrace-soil, and eluvial terrace-soil and basalt. Alluvial–diluvial terrace-soil was the dominant configuration. The flood plain category covered 9412.78 ha. With increasing distance from the river channel, the substrate graded from alluvial–diluvial flood plain-gravel to alluvial–diluvial flood plain-soil and sand and then to alluvial–diluvial flood plain-soil. The latter was the most extensive flood plain configuration. The plain category was covered by alluvial–lacustrine plain-soil. It covered 23,189.32 ha and was the largest substrate configuration unit in the study area.
4.3.2. Relationships Between Substrate Configurations and Wetland Types
The remaining wetlands were treated as remnants that persisted under intensive human disturbance. Their distribution was analyzed to assess the implications of substrate configuration for wetland restoration potential. Spatial overlay analysis showed that the remaining wetlands occurred mainly within mapped Water units and on alluvial–diluvial floodplain substrates (Table 2). Within the Water units, inland mudflats covered 277.82 ha, highlighting their close association with river and lake level fluctuations and periodic inundation and exposure. The remaining terrestrial wetlands covered 249.32 ha and occurred predominantly on alluvial–diluvial flood plain-soil and alluvial–diluvial flood plain-soil and sand. This pattern indicates that wetland persistence is closely associated with floodplain depositional environments and hydrological connectivity.
Table 2.
Areas of wetland types under different substrate configurations and waterbody units.
Swampy meadows dominated the wetlands on alluvial–diluvial flood plain-soil, covering 51.37 ha and accounting for 81.68% of the wetland area on this substrate. This substrate consisted mainly of fine-grained silt and clay with high water-retention capacity, favoring organic matter accumulation and the persistence of wetland herbaceous communities. In contrast, inland mudflats dominated the wetlands on alluvial–diluvial flood plain-soil and sand. They covered 142.36 ha and accounted for 76.61% of the wetland area on this substrate. The high permeability of the sandy fraction limits long-term water and organic matter retention. This creates intermittent inundation and frequent wet–dry cycles that favor inland mudflats and seasonal wetlands.
Forest swamps persisted only as scattered patches. Forest swamp was the only wetland type identified on eluvial hill-soil and millerite. Eluvial deposits on gentle hillslopes and footslopes are underlain by dense metamorphic bedrock. The convergence of precipitation and hillslope runoff can therefore produce shallow perched water and reducing soil conditions. These conditions favor woody plants tolerant of waterlogging, acidity, and low nutrient availability.
Only 0.60 ha of wetland remained on alluvial–lacustrine plain-soil, all of which was classified as inland mudflat. This does not indicate that the substrate is inherently unsuitable for wetland development. Instead, it likely reflects wetland degradation under intensive agricultural modification. Alluvial–lacustrine plain-soil formed in former lake and lakeshore depositional environments. It is typically characterized by fine-grained sediments, low relief, and high potential water-retention capacity, which are favorable for marsh development. However, the flat terrain also facilitates artificial drainage and agricultural development, resulting in more intensive human disturbance.
4.4. Site-Level Comparisons of Three Wetland Substrate Profiles
4.4.1. Characteristics of the Swampy Meadow Profile
The swampy meadow site was located on a floodplain within the plain unit. No surface water was observed during the survey. The vegetation was dominated by meadow-marsh species, including sedges (Carex spp.) and Calamagrostis angustifolia (Figure 6). The profile consisted mainly of silty sediments, with a small sandy fraction in the deepest layer. A dark, loosely structured peaty layer occurred at the surface. It was underlain by a grayish-white gleyed subsoil with local rust-colored mottles, indicating prolonged oxygen-depleted and reducing conditions. Below approximately 1.2 m, a bluish-black water-saturated layer gradually merged with the overlying sediments. The profile stratification records a transition from fluvial silt deposition to finer marsh deposits.
Figure 6.
Substrate characteristics of and vertical variations in swampy meadow profile (BWD01).
The particle-size data were concentrated near the silt end-member. Bulk density was generally lower than in the other two wetland profiles. The organic matter and dense root network produced a relatively loose surface layer. Below 0.6 m, bulk density gradually increased and stabilized at approximately 1.5 g cm−3. A depth of 1 m marked a major geochemical transition. Below this depth, CIA increased, whereas SiO2/Al2O3 decreased. These changes indicate enhanced leaching of base cations and relative enrichment of aluminous clay minerals. The fine-grained, low-permeability layer may prolong water–substrate contact and influence vertical element transport. SiO2/Al2O3 was generally higher than in the other two wetland profiles. This may reflect the input of allochthonous siliceous detritus or the accumulation of biogenic silica from herbaceous vegetation.
Fe2O3/MnO varied markedly with depth, indicating that Fe and Mn mobilization and reprecipitation were affected by water-table fluctuations and alternating redox conditions. Profile pH ranged from 5.6 to 6.4 and was weakly acidic, with the lowest values in the middle layer. This pattern may be associated with organic acid accumulation from plant-residue decomposition and leaching under persistently wet conditions.
OM, TC, and N peaked at approximately 0.4 m. High plant productivity and persistent moisture jointly limited organic matter decomposition, forming a shallow carbon-rich layer characterized by low bulk density and high organic matter content. Below 0.6 m, these nutrient indicators declined markedly and then remained relatively stable. In contrast, P2O5 gradually increased with depth, possibly because of adsorption by fine-grained minerals and phosphorus redistribution through water movement. Overall, fine-grained sediments and low-permeability layers provided the physical basis for water retention. Vegetation inputs, seasonal water-table fluctuations, and alternating redox conditions jointly regulated organic matter accumulation and element transport.
4.4.2. Characteristics of the Forest Swamp Profile
The forest swamp site was located on a structurally denuded hill mantled by residual–colluvial deposits. The vegetation was dominated by broadleaf trees and shrubs (Figure 7). Microtopographic and moisture gradients caused the forest swamp to occur as isolated, island-like patches. The profile consisted of residual–colluvial deposits. A distinct peat–humus layer containing partially decomposed plant residues occurred at the surface. It was underlain by a gleyed topsoil and a gleyed subsoil, which were predominantly gray and blue-gray. A persistently high water table maintained reducing conditions, while periodic water-table fluctuations produced alternating redox conditions. These processes formed prominent rust-colored mottles and Fe–Mn concretions. The deepest layer consisted of dense clayey silt, and no bedrock was encountered. This fine-grained layer reduced downward water movement and helped maintain shallow saturation.
Figure 7.
Substrate characteristics of and vertical variations in forest swamp profile (BWD02).
The particle-size data were concentrated near the silt and clay end-members, with only trace amounts of sand in the deeper layers. This vertical pattern may reflect episodic hillslope runoff and the redistribution of fine particles. Bulk density generally increased with depth, although marked fluctuations occurred. This pattern indicates greater compaction in the deeper substrate. The dense silt–clay deposits had a fine pore network and low permeability, which promoted water retention and provided a hydrological basis for the persistence of the forest swamp.
CIA ranged from approximately 63 to 70, indicating weaker chemical weathering than in the other two wetland profiles. SiO2/Al2O3 varied markedly with depth, reflecting differences in material composition among sedimentary layers. Fe2O3/MnO peaked at 0.6 m, after which its variability generally decreased with depth. This pattern may be related to localized redox interfaces and the differential adsorption and precipitation of Fe and Mn by clay minerals. Profile pH ranged from 6.6 to 7.1 and was generally near neutral.
OM, TC, and N were relatively high within the upper 0–0.3 m and generally decreased with depth. This pattern indicates that litter and root residues were the main sources of surface organic matter. The vertical variation in P2O5 may reflect the combined effects of adsorption by fine-grained minerals, redox-driven Fe–Mn mobilization, and differences in sedimentary stratification. Overall, the fine-grained, low-permeability substrate and a persistently shallow water table jointly maintained water-saturated conditions. Vegetation inputs and redox dynamics further regulated organic matter accumulation and nutrient transport.
4.4.3. Characteristics of the Inland Mudflat Profile
The inland mudflat site was located on a low floodplain formed by alluvial–diluvial deposits. The vegetation was dominated by wetland herbs, including reeds and sedges (Figure 8). Only a thin organic muck layer occurred at the surface. This indicates limited potential for persistent peat accumulation and a strong influence of flood pulses and sediment deposition. The underlying gleyed silt contained abundant orange-red mottles and Fe–Mn concretions. Anoxic conditions during inundation promoted Fe and Mn mobilization, whereas water-level decline or short-term exposure caused local oxidation and reprecipitation. The middle layer consisted of reduced silty clay loam. Below approximately 1.5 m, water-saturated silty clay reflected the combined effects of water-table fluctuations and deep water retention. Particle-size data were concentrated near the silt and clay end-members. Bulk density varied between approximately 1.2 and 1.7 g cm−3. The fine pore structure of the deep silty clay reduced vertical drainage and helped maintain local saturation.
Figure 8.
Substrate characteristics of and vertical variations in inland mudflat profile (BWD03).
Several geochemical indicators changed abruptly at approximately 1.1 m. CIA was relatively high, ranging from 70 to 90. This suggests that the sediment source area had undergone strong chemical weathering and leaching. Because the profile was located on a floodplain, the high CIA may have been partly inherited from upstream source materials rather than produced entirely by in situ pedogenesis. SiO2/Al2O3 changed concurrently near this depth, indicating a shift in sediment composition or mineral provenance. Fe2O3/MnO varied markedly with depth and peaked at approximately 1.1 m. This pattern corresponded to the Fe–Mn mottles and concretions observed in the profile. It indicates repeated Fe and Mn mobilization, enrichment, and reprecipitation under alternating redox conditions. Fe2O3/MnO may therefore indicate water-table fluctuations and the positions of redox interfaces. Profile pH ranged from approximately 6.2 to 6.6 and was weakly acidic, but less acidic than the swampy meadow profile. Its vertical variation reflected the combined effects of cyclic inundation and exposure, redox-driven Fe–Mn redistribution, and fine-grained mineral deposition.
OM, TC, and N were relatively enriched in the upper and middle profile and peaked at approximately 0.6 m. This pattern reflects the combined effects of plant-residue inputs, flood-derived sediment deposition, and organic matter preservation under reducing conditions. P2O5 varied markedly in the deeper layers and showed a local peak at approximately 1.7 m. This may be related to adsorption by fine-grained clay minerals or changes in sediment provenance. Overall, the inland mudflat profile was controlled primarily by cyclic inundation and exposure and by flood-driven sedimentation. Water-table fluctuations regulated redox transitions and nutrient redistribution.
4.4.4. Integrated Comparison of the Three Wetland Profiles and Their Hydrological Controls
All three wetland profiles were dominated by fine-grained sediments, including silt and clayey silt, with small amounts of sand in some layers. These fine-grained substrates have low permeability and high water-retention capacity. They restrict vertical drainage, prolong water–substrate contact, and maintain shallow saturated conditions. These features suggest a common sedimentary and hydrological context among the three surveyed sites. Previous studies in the Sanjiang Plain have also shown that hydrological gradients defined by water level and soil moisture strongly influence the spatial distribution of dominant wetland plants [50]. Within the surveyed profiles, site-specific geomorphic settings, depositional environments, and vertical substrate structures may further regulate water-level fluctuations, leaching intensity, redox conditions, and elemental migration. These processes may, in turn, contribute to differences in vegetation establishment and organic matter accumulation among the three investigated sites.
The three wetland types were controlled by distinct hydrological regimes. The forest swamp profile was characterized by an aerated surface layer and persistently saturated deeper layers. These conditions favored woody vegetation and gleying. The inland mudflat was controlled primarily by flood pulses. Periodic inundation and exposure caused pronounced redox oscillations and Fe–Mn redistribution. Frequent hydrodynamic disturbance also promoted surface-sediment reworking and organic matter oxidation. The swampy meadow occurred on low, flat terrain with poor drainage and prolonged water retention. Persistent wetness and oxygen limitation suppressed organic matter decomposition and promoted carbon and nutrient accumulation in the surface layer. These conditions sustained a community dominated by hydrophytic herbaceous plants.
5. Discussion
5.1. Hydrological and Hydrogeochemical Controls of Substrate Heterogeneity on Wetland-Type Development
The spatial differentiation of wetland types at Farm 852 was not controlled by a single substrate property or depth. Instead, it resulted from the combined effects of substrate configuration, grain-size composition, organic matter and nutrient conditions, mineral composition, and the redox environment [9]. Substrate configuration establishes the spatial framework, whereas grain size and bulk density regulate hydrological processes. Organic matter, carbon, and nitrogen support ecosystem functions, while mineral composition and redox conditions govern stability at depth. Substrate configuration does not directly determine wetland type. Rather, it creates favorable or restrictive wetland habitats by regulating hydrological processes. The geomorphic setting, depositional sequence, lithology, and vertical structure of each configuration determine substrate permeability, water-storage capacity, and groundwater flow. These hydrological boundaries subsequently affect shallow groundwater depth, waterlogging duration, vegetation establishment, and organic matter accumulation. Previous studies have also identified shallow groundwater depth and integrated surface water–groundwater regulation as important controls on wetland functions in the Sanjiang Plain [51].
The interaction detector showed that many factor pairs had greater explanatory power than the corresponding individual factors, and nonlinear enhancement was identified for some pairs based on comparisons with their individual q-values. This indicates that wetland-type development cannot be fully explained by a single indicator. Instead, substrate hydrological functions may reflect interactions among multiple properties. The strength of these interactions varied with depth: high-q interactions were most broadly distributed at 1 m, generally moderate and localized at 2 m, and strong but heterogeneous at 5 m. Clay, silt, and sand contents were involved in relatively strong interactions with substrate configuration, particularly in the upper layers, and may contribute to the regulation of pore structure, hydraulic conductivity, and water-retention time.
Hydrological processes may link the physical properties of the substrate with nutrient cycling and redox reactions. Low-permeability substrates and persistent waterlogging promote anoxic, reducing conditions. These conditions can suppress aerobic decomposition and favor the preservation of organic matter, total carbon, and total nitrogen. Organic acids released during decomposition may alter pH and contribute to the reductive mobilization of Fe and Mn and their reprecipitation at oxic interfaces. The resulting feedback among water retention, reducing conditions, organic matter preservation, and elemental migration may contribute to the substrate conditions associated with wetland-type differentiation. Research in the Xingkai Lake wetlands similarly found that drainage-induced declines in water level and soil moisture significantly altered soil–plant carbon pools. This finding further suggests that hydrological changes can affect wetland functions through biogeochemical processes [52].
The explanatory power and interaction patterns of the substrate factors also varied with depth. At the surface, interactions involving grain-size composition and substrate configuration were relatively prominent, consistent with the influence of surface texture and pore structure on infiltration and drainage [29]. Rainfall infiltration, evapotranspiration, overland flow, and root activity may directly affect this layer. However, bulk density showed low individual explanatory power and did not exhibit a strong interaction pattern across depths. The 1 m layer may represent a transition zone with strong cross-group interactions. The interaction heatmap showed the broadest distribution of high interaction values at this depth. Rust mottles and Fe–Mn concretions were frequently observed at this depth in the surveyed profiles, potentially indicating repeated redox oscillations. Several physicochemical indicators also fluctuated sharply near this depth. These patterns may reflect the combined effects of hydrological variability and spatially heterogeneous geochemical conditions.
At 2 m, substrate configuration remained relatively influential, whereas TC, SiO2, pH, K2O, and clay content showed moderate explanatory power. Interaction strengths were generally moderate, with several localized high-q cells. This pattern suggests a more heterogeneous interaction structure rather than a uniformly strong hydrogeochemical interface. At 5 m, organic matter and Na2O showed the highest explanatory power, while clay content, TN, P2O5, and SiO2 also remained relatively influential. Interactions at this depth were strong but heterogeneous, involving factors from several groups. Deep clay and silt deposited in paleolake and paleochannel environments may contribute to water retention and locally reducing conditions. The deep substrate may therefore provide an important boundary condition for wetland hydrological persistence and hydrogeochemical conditions. Previous studies have also shown that water-level fluctuations and inundation duration can strongly influence the spatial distribution and community structure of wetland vegetation [53].
5.2. Recommendations for Type-Specific Wetland Restoration Based on Substrate Heterogeneity
Wetland-type development depends not only on surface soil properties and current hydrological conditions but also on deeper sedimentary structures, material composition, and geochemical environments. Following decades of agricultural reclamation, the remaining wetlands are largely remnant patches preserved under favorable substrate conditions. Their current distribution therefore does not fully represent the natural potential for wetland development. Restoration priorities should not be determined solely by land-use type or remaining wetland area. Instead, suitability assessments should integrate substrate conditions, hydrological restoration potential, and the intensity of human disturbance. This framework would support zoned conservation, type-specific restoration, and depth-stratified monitoring [54]. It may also help reduce potential mismatches between restoration targets and local substrate conditions.
The vertical heterogeneity of the substrate indicates that restoration surveys and monitoring should extend beyond surface soils. Geomorphic setting, depositional origin, grain-size composition, and vertical structure should be incorporated into the delineation of conservation areas and restoration suitability assessments [55,56]. Areas with continuous fine-grained deposits, high water-retention capacity, and suitable groundwater conditions may be prioritized for restoration. However, substrate suitability alone does not guarantee restoration feasibility. Restoration priorities should also consider water availability, surface water–groundwater connectivity, drainage infrastructure, land-use conflicts, and implementation costs. At the site level, these factors can inform the selection of restoration targets and measures, such as water-level regulation, ditch blocking, microtopographic reconstruction, and vegetation restoration [57].
Alluvial–diluvial floodplain soil and alluvial–lacustrine plain soil contain abundant fine-grained sediments and have high water-retention capacity. Where water supply is adequate and drainage can be controlled, these units may be prioritized for the conservation and restoration of swampy meadows. Although few wetlands remain on alluvial–lacustrine plain soil, this likely reflects wetland loss caused by long-term drainage and agricultural development rather than low restoration potential. Restoration should focus on re-establishing a shallow groundwater regime. Ditch expansion, deep tillage, and engineering excavation should be restricted to protect subsurface fine-grained water-retaining layers. In areas with intensive agricultural use or limited potential for hydrological recovery, phased cropland conversion, ditch-water-level regulation, and buffer-zone establishment could reduce land-use conflicts.
Previous research has identified hydrological connectivity and water-retention time as key criteria for assessing floodplain wetland health and setting restoration priorities [58]. Alluvial–diluvial floodplain soil–sand is more likely to support inland mudflats. Restoration in these areas should therefore aim to recover natural water-level fluctuations and floodplain connectivity. Improving river–floodplain connectivity, optimizing water-level management, and limiting shoreline hardening would help maintain the dynamic processes and habitat diversity of mudflat–marsh transition zones. Forest swamp conservation should focus on microtopography, the surface humus layer, and localized perched-water conditions. Buffer zones may be established around remnant patches, while drainage, land leveling, and forest-soil disturbance should be minimized. In degraded patches, hydrological conditions should be restored before promoting the natural recovery of water-tolerant woody plants. Large-scale vegetation reconstruction should be avoided until suitable hydrological conditions have been re-established.
More broadly, this study shows how vertical substrate information can improve wetland restoration planning. In other countries with comparable lowland or floodplain settings, mapping substrate configuration and depth profiles together with groundwater conditions and hydrological connectivity can help identify sites suitable for conservation or rewetting and select realistic target wetland types [5,59]. These data can also inform site-specific measures such as ditch blocking, floodplain reconnection, and microtopographic reconstruction where they fit local water regimes [60].
5.3. Limitations and Future Perspectives
Several limitations should be acknowledged. First, the current wetland pattern reflects the legacy effects of long-term agricultural reclamation and drainage. The observed relationships between substrate configuration and wetland type therefore represent wetland persistence and restoration potential under current disturbance rather than a complete reconstruction of pre-reclamation conditions. Future studies should integrate historical remote-sensing data and expand borehole and profile sampling across different geomorphic and substrate units to improve spatial representativeness.
Second, this study focused on substrates within the upper 5 m. The results identify the major shallow substrate controls on wetland development but do not fully capture deeper groundwater systems or the temporal variability of hydrogeochemical processes. Moreover, GeoDetector quantifies spatial associations rather than direct causal relationships. The proposed mechanisms therefore require further validation. Future research should include continuous monitoring of groundwater levels, inundation duration, soil moisture, and redox conditions. Hydrological restoration experiments should also be conducted across different substrate units to evaluate the effectiveness of managed water replenishment, ditch blocking, and vegetation restoration.
6. Conclusions
The spatial differentiation of wetland types at Farm 852 in the Sanjiang Plain was not controlled by a single surface factor. Instead, it was associated with multiple substrate properties and their depth-dependent combinations. Substrate configuration showed a stable explanatory value across depths (q = 0.485) and ranked highest at 0 and 2 m, whereas pH and organic matter ranked highest at 1 and 5 m, respectively. Near-surface patterns were associated mainly with grain-size composition and substrate configuration, while bulk density showed consistently low explanatory power. The 1 m layer showed the broadest cross-group interactions, the 2 m layer showed moderate and localized interactions, and the 5 m layer showed strong but heterogeneous interactions, with organic matter and Na2O among the most influential factors. Many factor pairs had greater explanatory power than individual factors, with nonlinear enhancement in some pairs. These results suggest depth-dependent coupling among substrate structure, hydrological conditions, nutrient retention, and mineral–geochemical processes.
Twelve substrate units were identified in the study area. Substrate conditions transitioned from erosional hills in the southeast to depositional plains in the northwest. Vertically, shallow coarse-grained materials gave way to thick fine-grained deposits. Under intensive agricultural disturbance, the remaining terrestrial wetlands persisted mainly on alluvial–diluvial floodplain soil and alluvial–diluvial floodplain soil–sand. The former primarily supported swampy meadows, whereas the latter mainly supported inland mudflats. Forest swamps remained only as scattered patches. Few wetlands persisted on alluvial–lacustrine plain soil. This pattern primarily reflects wetland loss caused by long-term drainage and agricultural development and does not negate the restoration potential of this substrate.
The three surveyed wetland profiles were dominated by fine-grained sediments, particularly silt. Their low permeability and high water-retention capacity were associated with near-surface saturation in the surveyed profiles. Differences in geomorphic setting and substrate structure produced distinct hydrological regimes. Forest swamps combined seasonal surface aeration with persistent saturation at depth. Inland mudflats were controlled mainly by flood pulses and periodic inundation and exposure. Swampy meadows were characterized by poor drainage and surface organic matter accumulation. These profile-based observations describe the surveyed sites. Restoration of degraded wetlands should therefore integrate substrate suitability, hydrological restoration potential, and the intensity of anthropogenic disturbance. Zoned conservation, type-specific restoration, and depth-stratified monitoring could improve alignment between restoration targets and substrate–hydrological conditions. Geomorphic setting, depositional origin, grain-size composition, vertical structure, and hydrological connectivity can guide restoration zoning and the selection of target wetland types.
Supplementary Materials
The following supporting information can be downloaded at: https://www.mdpi.com/article/10.3390/w18212701/s1, Table S1: Complete unit-level analysis dataset.
Author Contributions
Conceptualization, X.L. (Xinyao Li) and X.L. (Xiangxi Lv); methodology, X.L. (Xinyao Li) and Z.C.; software, X.L. (Xinyao Li) and X.L. (Xiangxi Lv); validation, X.L. (Xiangxi Lv) and J.W.; formal analysis, X.L. (Xinyao Li) and Z.C.; investigation, X.L. (Xinyao Li) and X.L. (Xiangxi Lv); resources, X.L. (Xinyao Li) and X.L. (Xiangxi Lv); data curation, Z.C. and X.L. (Xiangxi Lv); writing—original draft preparation, X.L. (Xinyao Li) and X.L. (Xiangxi Lv); writing—review and editing, Z.C. and J.W.; visualization, X.L. (Xinyao Li) and J.W.; supervision, X.L. (Xiangxi Lv); project administration, X.L. (Xinyao Li); funding acquisition, X.L. (Xinyao Li). All authors have read and agreed to the published version of the manuscript.
Funding
This research was funded by the funding project of Northeast Geological S&T Innovation Center of China Geological Survey (No.QCJJ2024-45) and the China Geological Survey project, grant number DD20242039.
Data Availability Statement
The Third National Land Survey data and study-area base-map data used in this study were obtained from public sources. The original soil analytical data generated through field sampling and laboratory measurements are not publicly available but may be obtained from the corresponding author upon request, subject to approval by the authors’ institution.
Acknowledgments
During the preparation of this manuscript, the authors used ChatGPT Images 2.0 (OpenAI) to generate selected schematic illustrations in Figure 2 for the visual presentation of the study workflow. These AI-generated elements served solely as conceptual visual aids. They do not constitute field records, measured data, or research results and were not used as analytical inputs or as evidence supporting the study conclusions. The authors reviewed and edited the generated content and take full responsibility for the content of this publication.
Conflicts of Interest
The authors declare no conflicts of interest.
Appendix A
Appendix A summarizes the analytical methods used to characterize the substrate properties, together with the corresponding standard references, instruments, model information, and method detection limits. The analytical methods and equipment listed in Table A1 were used for the measurements reported in this study. An em dash (—) indicates that a method detection limit was not applicable.
Table A1.
Analytical methods, method references, instruments, and method detection limits for substrate properties.
References
- Maltby, E.; Acreman, M. Ecosystem services of wetlands: Pathfinder for a new paradigm. Hydrol. Sci. J. 2011, 56, 1341–1359. [Google Scholar] [CrossRef] [Scilit]
- Fluet-Chouinard, E.; Stocker, B.; Zhang, Z.; Malhotra, A.; Melton, J.; Poulter, B.; Kaplan, J.; Goldewijk, K.; Siebert, S.; Minayeva, T.; et al. Extensive global wetland loss over the past three centuries. Nature 2023, 614, 281–286. [Google Scholar] [CrossRef] [Scilit]
- Zhang, X.; Liu, L.; Zhao, T.; Wang, J.; Liu, W.; Chen, X. Global annual wetland dataset at 30 m with a fine classification system from 2000 to 2022. Sci. Data 2024, 11, 310. [Google Scholar] [CrossRef] [Scilit]
- Davidson, N. How much wetland has the world lost? Long-term and recent trends in global wetland area. Mar. Freshw. Res. 2014, 65, 934–941. [Google Scholar] [CrossRef] [Scilit]
- Zedler, J.; Kercher, S. Wetland resources: Status, trends, ecosystem services, and restorability. Annu. Rev. Environ. Resour. 2005, 30, 39–74. [Google Scholar] [CrossRef] [Scilit]
- Fischer, J.; Riechers, M.; Loos, J.; Martin-Lopez, B.; Temperton, V. Making the UN Decade on Ecosystem Restoration a Social-Ecological Endeavour. Trends Ecol. Evol. 2021, 36, 20–28. [Google Scholar] [CrossRef] [Scilit]
- Bell-James, J.; Foster, R.; Shumway, N.; Lovelock, C.; Villarreal-Rosas, J.; Brown, C.; Andradi-Brown, D.; Saunders, M.; Waltham, N.; Fitzsimons, J. The Global Biodiversity Framework’s ecosystem restoration target requires more clarity and careful legal interpretation. Nat. Ecol. Evol. 2024, 8, 840–841. [Google Scholar] [CrossRef] [Scilit]
- Brinson, M.M. A Hydrogeomorphic Classification for Wetlands; Technical Report WRP-DE-4; U.S. Army Engineer Waterways Experiment Station: Vicksburg, MS, USA, 1993. [Google Scholar]
- Mitsch, W.J.; Gosselink, J.G. Wetlands, 5th ed.; John Wiley & Sons: Hoboken, NJ, USA, 2015. [Google Scholar]
- Ramsar Convention Secretariat. The Ramsar Convention Manual: A Guide to the Convention on Wetlands (Ramsar, Iran, 1971), 6th ed.; Ramsar Convention Secretariat: Gland, Switzerland, 2013. [Google Scholar]
- Cowardin, L.M.; Golet, F.C. US Fish and Wildlife Service 1979 wetland classification: A review. Vegetatio 1995, 118, 139–152. [Google Scholar] [CrossRef] [Scilit]
- Rubec, C. The Canadian Wetland Classification System. In The Wetland Book; Finlayson, C.M., Everard, M., Irvine, K., McInnes, R.J., Middleton, B.A., van Dam, A.A., Davidson, N.C., Eds.; Springer: Dordrecht, The Netherlands, 2016; pp. 1–5. [Google Scholar]
- Standard’s GB/T 24708-2009; Wetland Classification. Standards Press of China: Beijing, China, 2009.
- Goyal, M.; Rakkasagi, S.; Surampalli, R.; Zhang, T.; Erumalla, S.; Gupta, A.; Dubey, S.; U-tapao, C. Enhancing sustainable development through Spatiotemporal analysis of Ramsar wetland sites in South Asia. Technol. Soc. 2024, 79, 102723. [Google Scholar] [CrossRef] [Scilit]
- Li, C.; Lei, W.; Huang, Y.; Hu, W. Analysis of the influence of climate change on wetland evolution and its driving process from an integrated perspective of landscape connectivity and fragmentation. J. Environ. Manag. 2025, 389, 126155. [Google Scholar] [CrossRef] [Scilit]
- Zhang, Z.; Yao, Q.; Xu, Q.; Jiang, M.; Zhu, T. Hydrological and palynological evidence of wetland evolution on the Sanjiang Plain (NE China) in response to the Holocene East Asia summer monsoon. Catena 2021, 203, 105332. [Google Scholar] [CrossRef] [Scilit]
- Yang, F.; Deng, W.; Zhang, H.; Yuan, Q. Natural-human interactions impact wetland pattern evolution in different environment conditions in arid regions. J. Environ. Manag. 2025, 392, 126901. [Google Scholar] [CrossRef] [Scilit]
- Mahdian, M.; Noori, R.; Salamattalab, M.; Heggy, E.; Bateni, S.; Nohegar, A.; Hosseinzadeh, M.; Siadatmousavi, S.; Fadaei, M.; Abolfathi, S. Anzali Wetland Crisis: Unraveling the Decline of Iran’s Ecological Gem. J. Geophys. Res.-Atmos. 2024, 129, e2023JD039538. [Google Scholar] [CrossRef] [Scilit]
- Shi, S.; Chang, Y.; Wang, G.; Li, Z.; Hu, Y.; Liu, M.; Li, Y.; Li, B.; Zong, M.; Huang, W. Planning for the wetland restoration potential based on the viability of the seed bank and the landuse change trajectory in the Sanjiang Plain of China. Sci. Total Environ. 2020, 733, 139208. [Google Scholar] [CrossRef] [Scilit]
- Ministry of Natural Resources of the People’s Republic of China. Overall Plan for Establishing the Natural Resources Survey and Monitoring System (No. 15 [2020]); Ministry of Natural Resources: Beijing, China, 2020. Available online: https://www.gov.cn/zhengce/zhengceku/2020-01/18/content_5470398.htm (accessed on 20 April 2026).
- Vasilas, B.L. Wetland Soils: Genesis, Hydrology, Landscapes, and Classification, Second Edition Edited by J. Vepraskas Michael and B. Craft Christopher. CRC Press/Taylor & Francis Group, 6000 Broken Sound Pkwy. NW, Suite 300, Boca Raton, FL 33487. 2016. 508 p. $136. ISBN 978-1-4398-9698-3. Soil Sci. Soc. Am. J. 2017, 81, 425. [Google Scholar] [CrossRef] [Scilit]
- Stein, A.; Gerstner, K.; Kreft, H. Environmental heterogeneity as a universal driver of species richness across taxa, biomes and spatial scales. Ecol. Lett. 2014, 17, 866–880. [Google Scholar] [CrossRef] [Scilit]
- Heidrich, L.; Bae, S.; Levick, S.; Seibold, S.; Weisser, W.; Krzystek, P.; Magdon, P.; Nauss, T.; Schall, P.; Serebryanyk, A.; et al. Heterogeneity-diversity relationships differ between and within trophic levels in temperate forests. Nat. Ecol. Evol. 2020, 4, 1204–1212. [Google Scholar] [CrossRef] [Scilit]
- Boyero, L. The quantification of local substrate heterogeneity in streams and its significance for macroinvertebrate assemblages. Hydrobiologia 2003, 499, 161–168. [Google Scholar] [CrossRef] [Scilit]
- Milesi, S.; Dolédec, S.; Melo, A. Substrate heterogeneity influences the trait composition of stream insect communities: An experimental in situ study. Freshw. Sci. 2016, 35, 1321–1329. [Google Scholar] [CrossRef] [Scilit]
- Wang, T.; Yang, L.; Shao, R.; Hu, J.; Liu, C.; Yu, D. Clonal performance of Scirpus yagara in multiple levels of substrate heterogeneity and submergence. J. Plant Ecol. 2021, 14, 805–815. [Google Scholar] [CrossRef] [Scilit]
- Chakrawal, A.; Herrmann, A.; Koestel, J.; Jarsjö, J.; Nunan, N.; Kätterer, T.; Manzoni, S. Dynamic upscaling of decomposition kinetics for carbon cycling models. Geosci. Model Dev. 2020, 13, 1399–1429. [Google Scholar] [CrossRef] [Scilit]
- Salugin, A.; Balkushkin, R. Vertical Moisture Transfer Investigation in Lysimeters Based on Substrate Texture Heterogeneity. Eurasian Soil Sci. 2023, 56, 1955–1962. [Google Scholar] [CrossRef] [Scilit]
- Doherty, J.; Zedler, J. Increasing substrate heterogeneity as a bet-hedging strategy for restoring wetland vegetation. Restor. Ecol. 2015, 23, 15–25. [Google Scholar] [CrossRef] [Scilit]
- Schuster, L.; Taillardat, P.; Macreadie, P.; Malerba, M. Freshwater wetland restoration and conservation are long-term natural climate solutions. Sci. Total Environ. 2024, 922, 171218. [Google Scholar] [CrossRef] [Scilit]
- Temmink, R.; Lamers, L.; Angelini, C.; Bouma, T.; Fritz, C.; van de Koppel, J.; Lexmond, R.; Rietkerk, M.; Silliman, B.; Joosten, H.; et al. Recovering wetland biogeomorphic feedbacks to restore the world’s biotic carbon hotspots. Science 2022, 376, eabn1479. [Google Scholar] [CrossRef] [Scilit]
- Wang, J.; Li, X.; Christakos, G.; Liao, Y.; Zhang, T.; Gu, X.; Zheng, X. Geographical Detectors-Based Health Risk Assessment and its Application in the Neural Tube Defects Study of the Heshun Region, China. Int. J. Geogr. Inf. Sci. 2010, 24, 107–127. [Google Scholar] [CrossRef] [Scilit]
- Wang, J.; Zhang, T.; Fu, B. A measure of spatial stratified heterogeneity. Ecol. Indic. 2016, 67, 250–256. [Google Scholar] [CrossRef] [Scilit]
- Song, Y.; Wang, J.; Ge, Y.; Xu, C. An optimal parameters-based geographical detector model enhances geographic characteristics of explanatory variables for spatial heterogeneity analysis: Cases with different types of spatial data. GISci. Remote Sens. 2020, 57, 593–610. [Google Scholar] [CrossRef] [Scilit]
- Xiao, W.; Huang, E.; Li, C.; Li, H. Investigating the spatial distribution and influencing factors of traditional villages in Qiandongnan based on ArcGIS and geodetector. Sci. Rep. 2025, 15, 5786. [Google Scholar] [CrossRef] [Scilit]
- Sun, D.; Shi, S.; Wen, H.; Xu, J.; Zhou, X.; Wu, J. A hybrid optimization method of factor screening predicated on GeoDetector and Random Forest for Landslide Susceptibility Mapping. Geomorphology 2021, 379, 107623. [Google Scholar] [CrossRef] [Scilit]
- Ren, Z.; Tian, Z.; Wei, H.; Liu, Y.; Yu, Y. Spatiotemporal evolution and driving mechanisms of vegetation in the Yellow River Basin, China during 2000–2020. Ecol. Indic. 2022, 138, 108832. [Google Scholar] [CrossRef] [Scilit]
- Zhang, L.; Fang, C.; Zhao, R.; Zhu, C.; Guan, J. Spatial-temporal evolution and driving force analysis of eco-quality in urban agglomerations in China. Sci. Total Environ. 2023, 866, 161465. [Google Scholar] [CrossRef] [Scilit]
- Zhao, R.; Zhan, L.; Yao, M.; Yang, L. A geographically weighted regression model augmented by Geodetector analysis and principal component analysis for the spatial distribution of PM2.5. Sustain. Cities Soc. 2020, 56, 102106. [Google Scholar] [CrossRef] [Scilit]
- Zhu, L.; Meng, J.; Zhu, L. Applying Geodetector to disentangle the contributions of natural and anthropogenic factors to NDVI variations in the middle reaches of the Heihe River Basin. Ecol. Indic. 2020, 117, 106545. [Google Scholar] [CrossRef] [Scilit]
- Guo, B.; Wei, C.; Yu, Y.; Liu, Y.; Li, J.; Meng, C.; Cai, Y. The dominant influencing factors of desertification changes in the source region of Yellow River: Climate change or human activity? Sci. Total Environ. 2022, 813, 152512. [Google Scholar] [CrossRef] [Scilit]
- Guo, B.; Yang, F.; Fan, Y.; Zang, W. The dominant driving factors of rocky desertification and their variations in typical mountainous karst areas of southwest China in the context of global change. Catena 2023, 220, 106674. [Google Scholar] [CrossRef] [Scilit]
- Yan, F.; Zhang, S.; Liu, X.; Yu, L.; Chen, D.; Yang, J.; Yang, C.; Bu, K.; Chang, L. Monitoring spatiotemporal changes of marshes in the Sanjiang Plain, China. Ecol. Eng. 2017, 104, 184–194. [Google Scholar] [CrossRef] [Scilit]
- Mao, D.; Wang, M.; Wang, Y.; Jiang, M.; Yuan, W.; Luo, L.; Feng, K.; Wang, D.; Xiang, H.; Ren, Y.; et al. The trajectory of wetland change in China between 1980 and 2020: Hidden losses and restoration effects. Sci. Bull. 2025, 70, 587–596. [Google Scholar] [CrossRef] [Scilit]
- Song, K.; Wang, Z.; Du, J.; Liu, L.; Zeng, L.; Ren, C. Wetland Degradation: Its Driving Forces and Environmental Impacts in the Sanjiang Plain, China. Environ. Manag. 2014, 54, 255–271. [Google Scholar] [CrossRef] [Scilit]
- Luo, C.; Fu, X.; Zeng, X.; Cao, H.; Wang, J.; Ni, H.; Qu, Y.; Liu, Y. Responses of remnant wetlands in the Sanjiang Plain to farming-landscape patterns. Ecol. Indic. 2022, 135, 108542. [Google Scholar] [CrossRef] [Scilit]
- Standard’s DZ/T 0295-2016; Specification of Land Quality Geochemical Assessment. Geological Publishing House: Beijing, China, 2016.
- Nesbitt, H.W.; Young, G.M. Early Proterozoic climates and plate motions inferred from major element chemistry of lutites. Nature 1982, 299, 715–717. [Google Scholar] [CrossRef] [Scilit]
- McLennan, S.M. Weathering and global denudation. J. Geol. 1993, 101, 295–303. [Google Scholar] [CrossRef] [Scilit]
- Yan, D.; Luan, Z.; Xu, D.; Xue, Y.; Shi, D. Modeling the Spatial Distribution of Three Typical Dominant Wetland Vegetation Species’ Response to the Hydrological Gradient in a Ramsar Wetland, Honghe National Nature Reserve, Northeast China. Water 2020, 12, 2041. [Google Scholar] [CrossRef] [Scilit]
- Wang, X.; Zhang, G.; Xu, Y. Groundwater and Surface Water Availability via a Joint Simulation with a Double Control of Water Quantity and Ecologically Ideal Shallow Groundwater Depth: A Case Study on the Sanjiang Plain, Northeast China. Water 2016, 8, 396. [Google Scholar] [CrossRef] [Scilit]
- Wang, W.; Sheng, L.; Yu, X.; Zhang, J.; Su, P.; Zou, Y. Soil-Plant Carbon Pool Variations Subjected to Agricultural Drainage in Xingkai Lake Wetlands. Water 2025, 17, 125. [Google Scholar] [CrossRef] [Scilit]
- Zhu, Z.; Wang, H.; Yang, Z.; Huai, W.; Huang, D.; Chen, X. Landscape Pattern Changes of Aquatic Vegetation Communities and Their Response to Hydrological Processes in Poyang Lake, China. Water 2024, 16, 1482. [Google Scholar] [CrossRef] [Scilit]
- Ballantine, K.; Schneider, R.; Groffman, P.; Lehmann, J. Soil Properties and Vegetative Development in Four Restored Freshwater Depressional Wetlands. Soil Sci. Soc. Am. J. 2012, 76, 1482–1495. [Google Scholar] [CrossRef] [Scilit]
- Van Deventer, H.; Nel, J.; Maherry, A.; Mbona, N. Using the landform tool to calculate landforms for hydrogeomorphic wetland classification at a country-wide scale. S. Afr. Geogr. J. 2016, 98, 138–153. [Google Scholar] [CrossRef] [Scilit]
- Diefenderfer, H.; Sinks, I.; Zimmerman, S.; Cullinan, V.; Borde, A. Designing topographic heterogeneity for tidal wetland restoration. Ecol. Eng. 2018, 123, 212–225. [Google Scholar] [CrossRef] [Scilit]
- Bruland, G.; Richardson, C. Hydrologic, edaphic, and vegetative responses to microtopographic reestablishment in a restored wetland. Restor. Ecol. 2005, 13, 515–523. [Google Scholar] [CrossRef] [Scilit]
- Singh, M.; Sinha, R. Integrating Hydrological Connectivity in a Process-Response Framework for Restoration and Monitoring Prioritisation of Floodplain Wetlands in the Ramganga Basin, India. Water 2022, 14, 3520. [Google Scholar] [CrossRef] [Scilit]
- Meng, B.; Liu, J.-L.; Bao, K.; Sun, B. Methodologies and Management Framework for Restoration of Wetland Hydrologic Connectivity: A Synthesis. Integr. Environ. Assess. Manag. 2020, 16, 438–451. [Google Scholar] [CrossRef] [Scilit]
- Galatowitsch, S.; Bohnen, J. Long-Term Recovery of a Restored Palustrine Wetland: The Role of Monitoring and Adaptive Management. Wetlands 2021, 41, 80. [Google Scholar] [CrossRef] [Scilit]
- Standard’s GB/T 19077-2016; Particle Size Analysis—Laser Diffraction Methods. Standards Press of China: Beijing, China, 2016.
- Standard’s GB/T 50123-2019; Standard for Geotechnical Testing Method. China Planning Press: Beijing, China, 2019.
- Standard’s DZ/T 0279-2016; Analysis Methods for Regional Geochemical Sample. Standards Press of China: Beijing, China, 2016.
- Standard’s GB/T 19145-2022; Determination of Total Organic Carbon in Sedimentary Rock. Standards Press of China: Beijing, China, 2022.
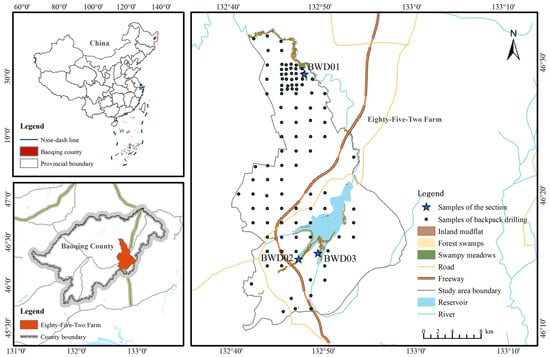
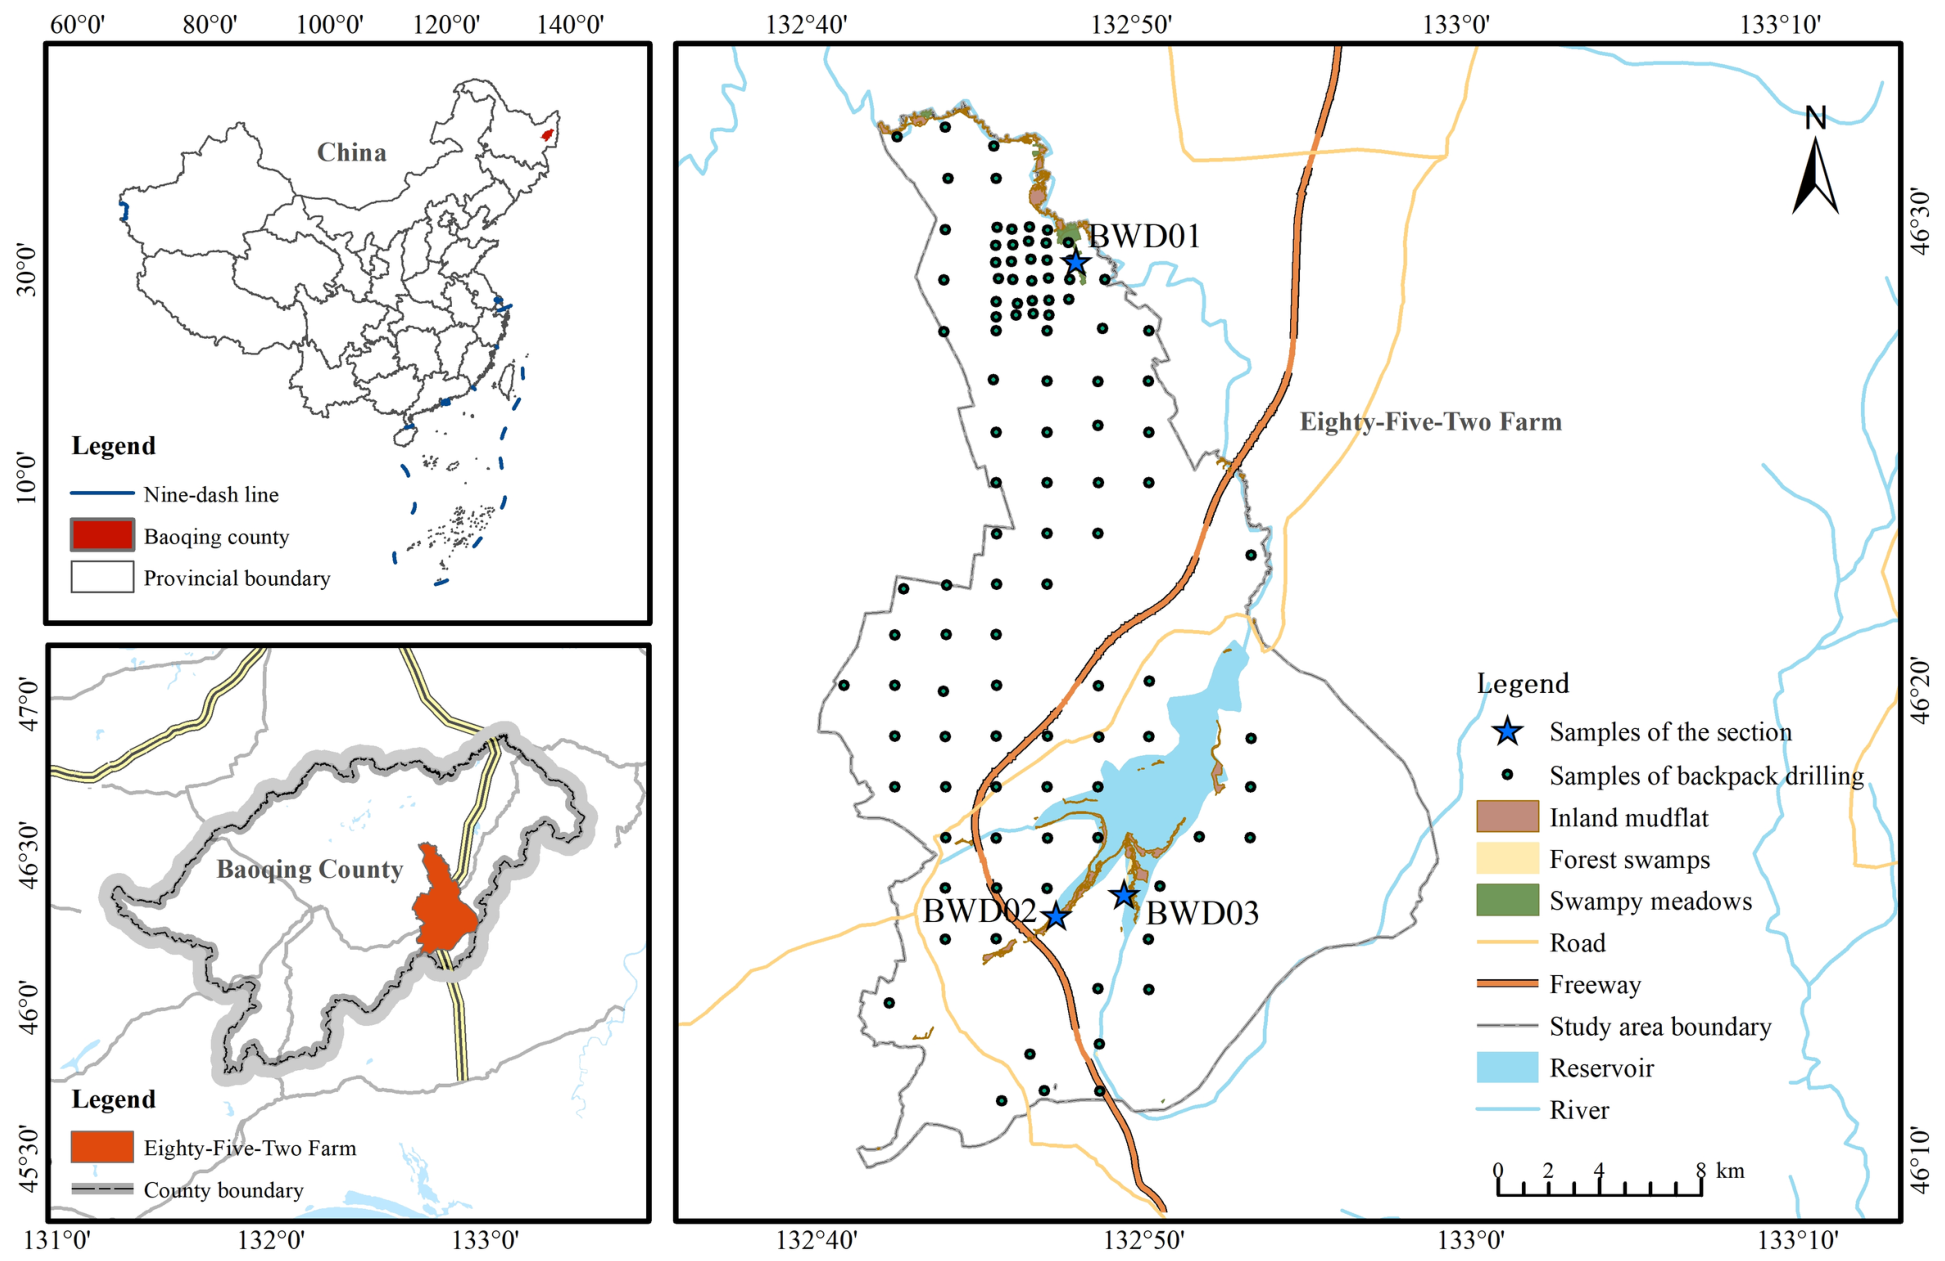
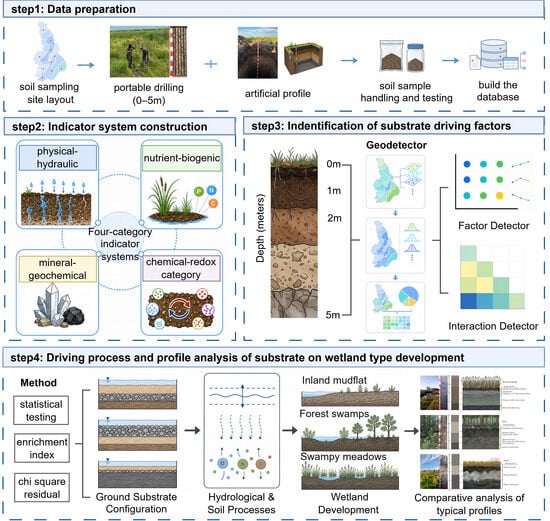
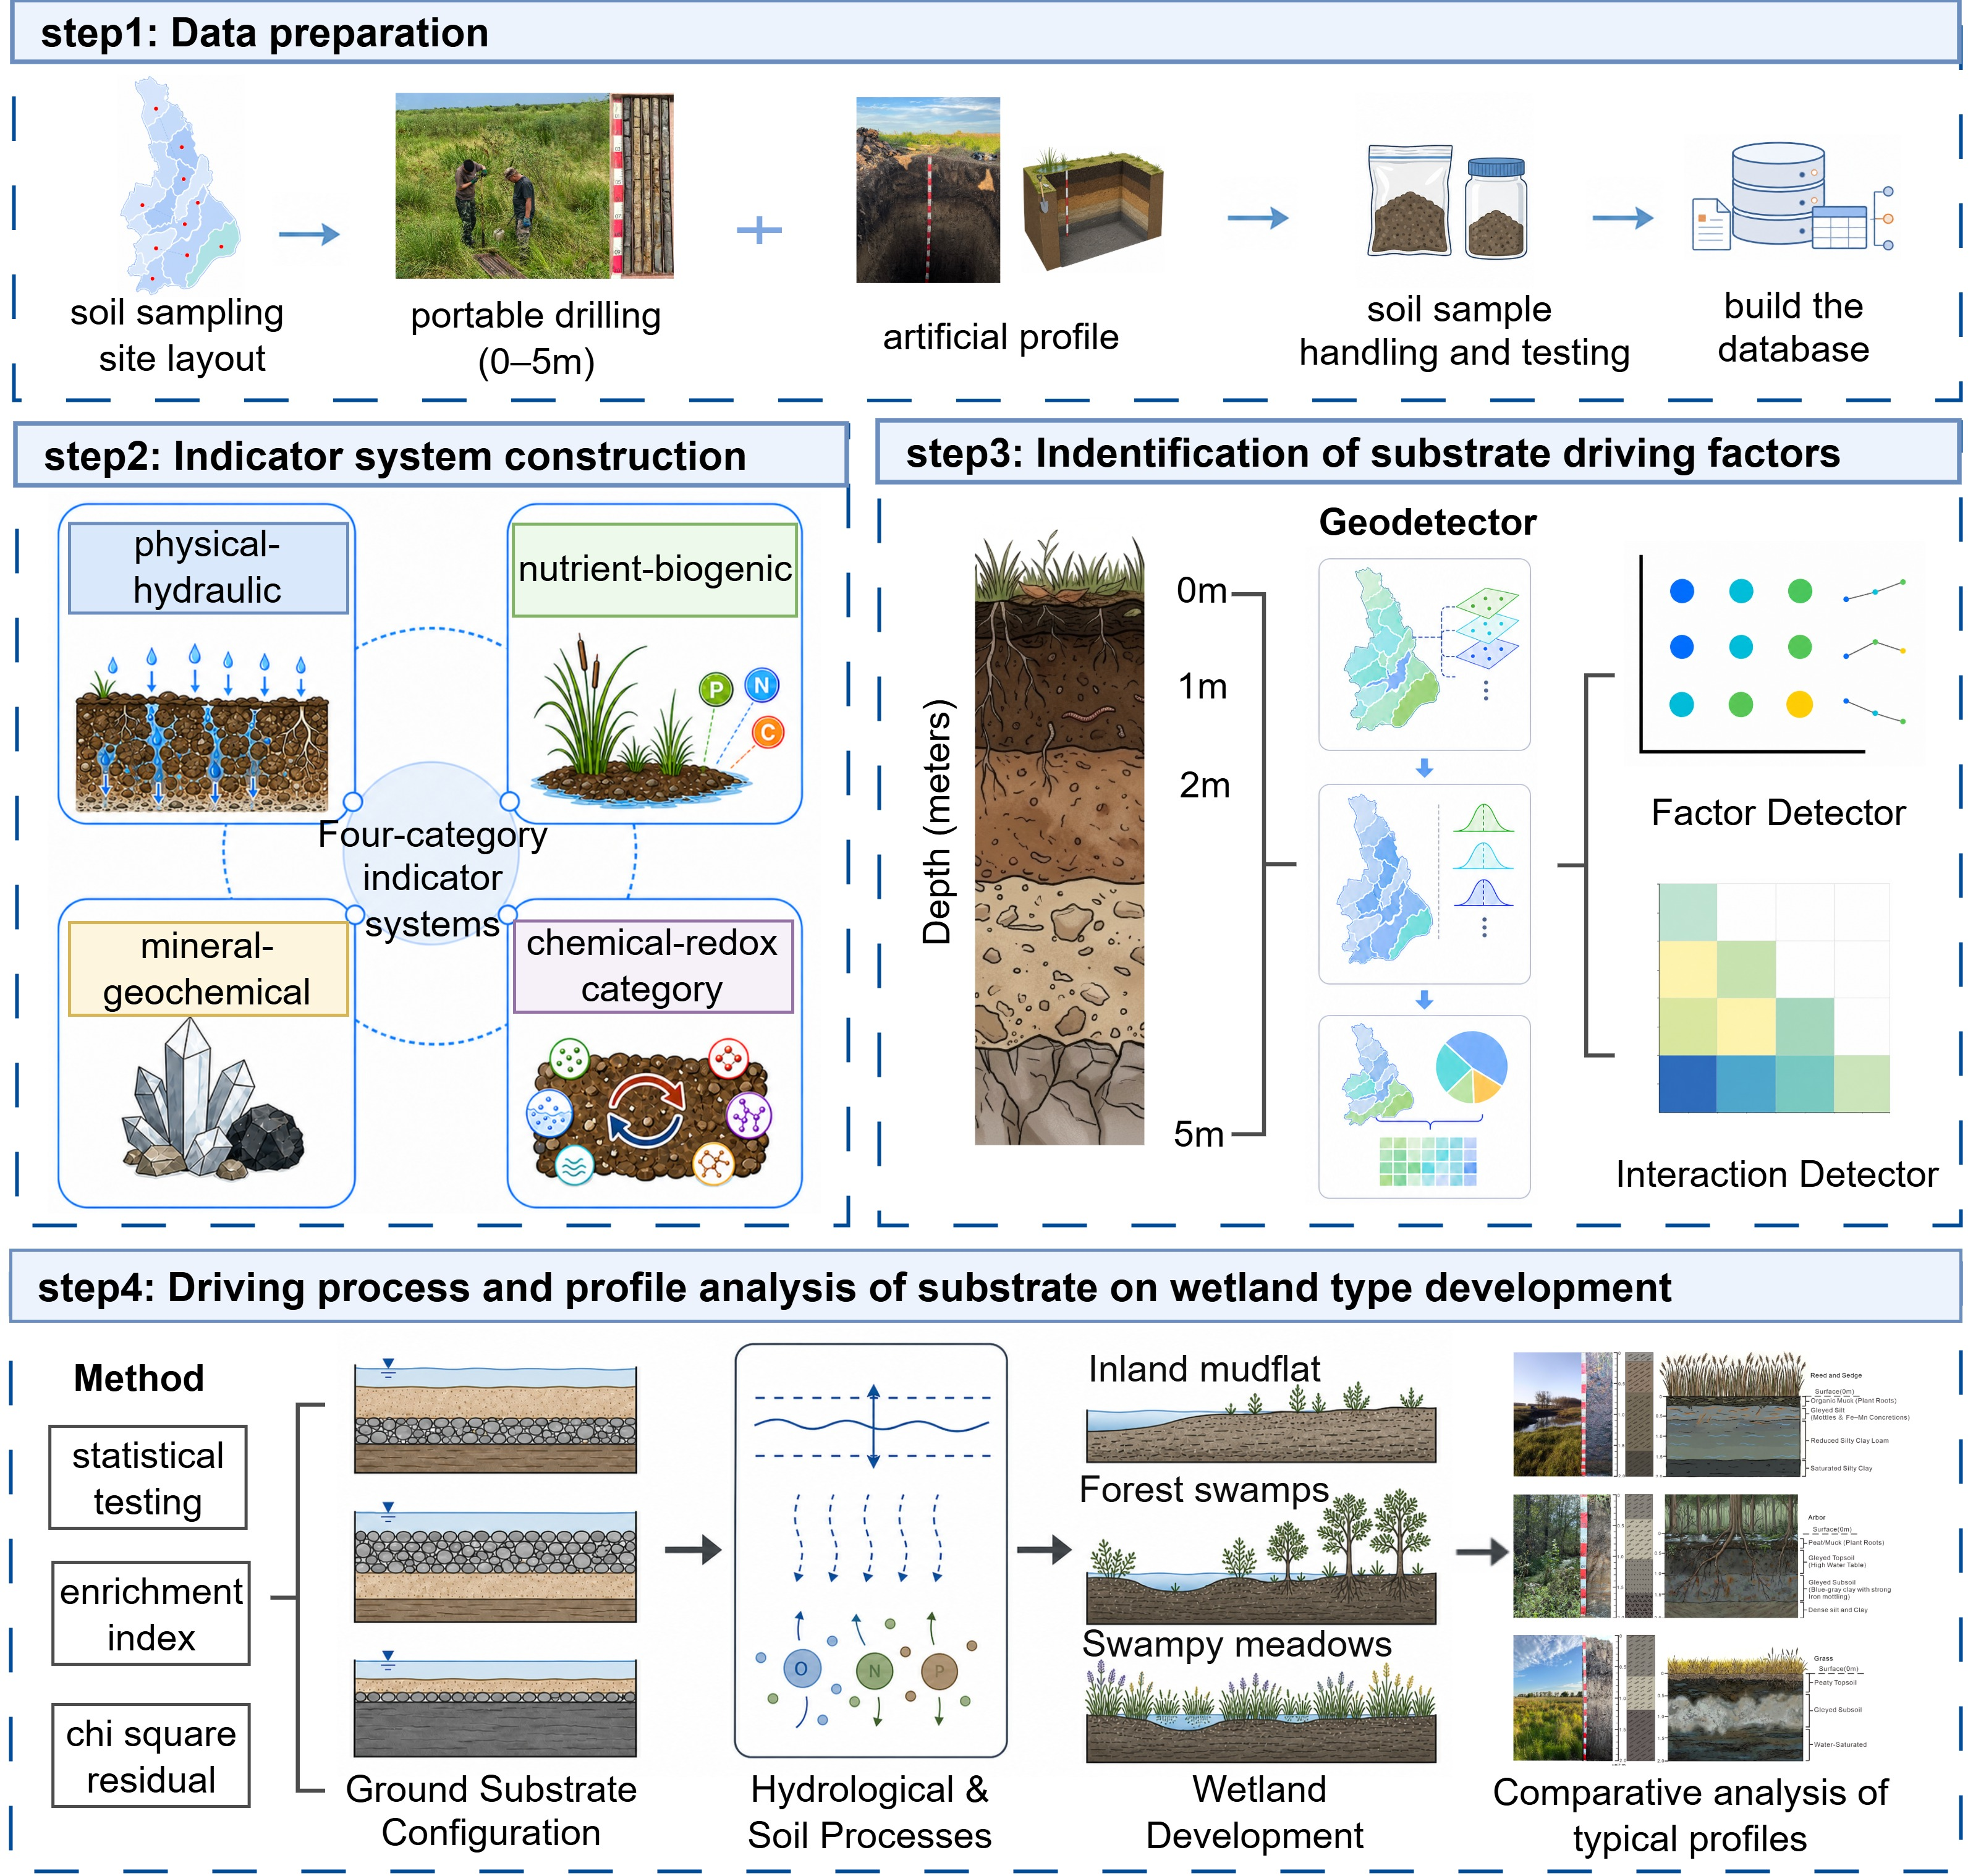
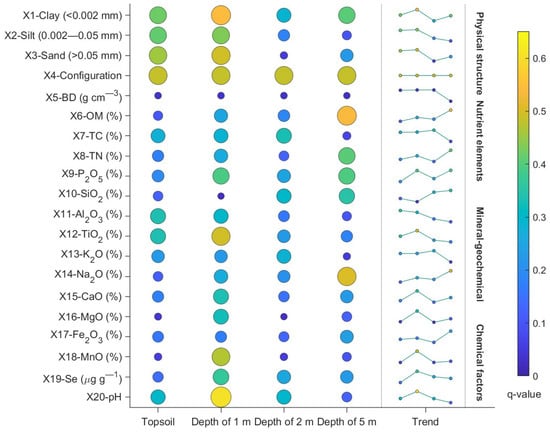
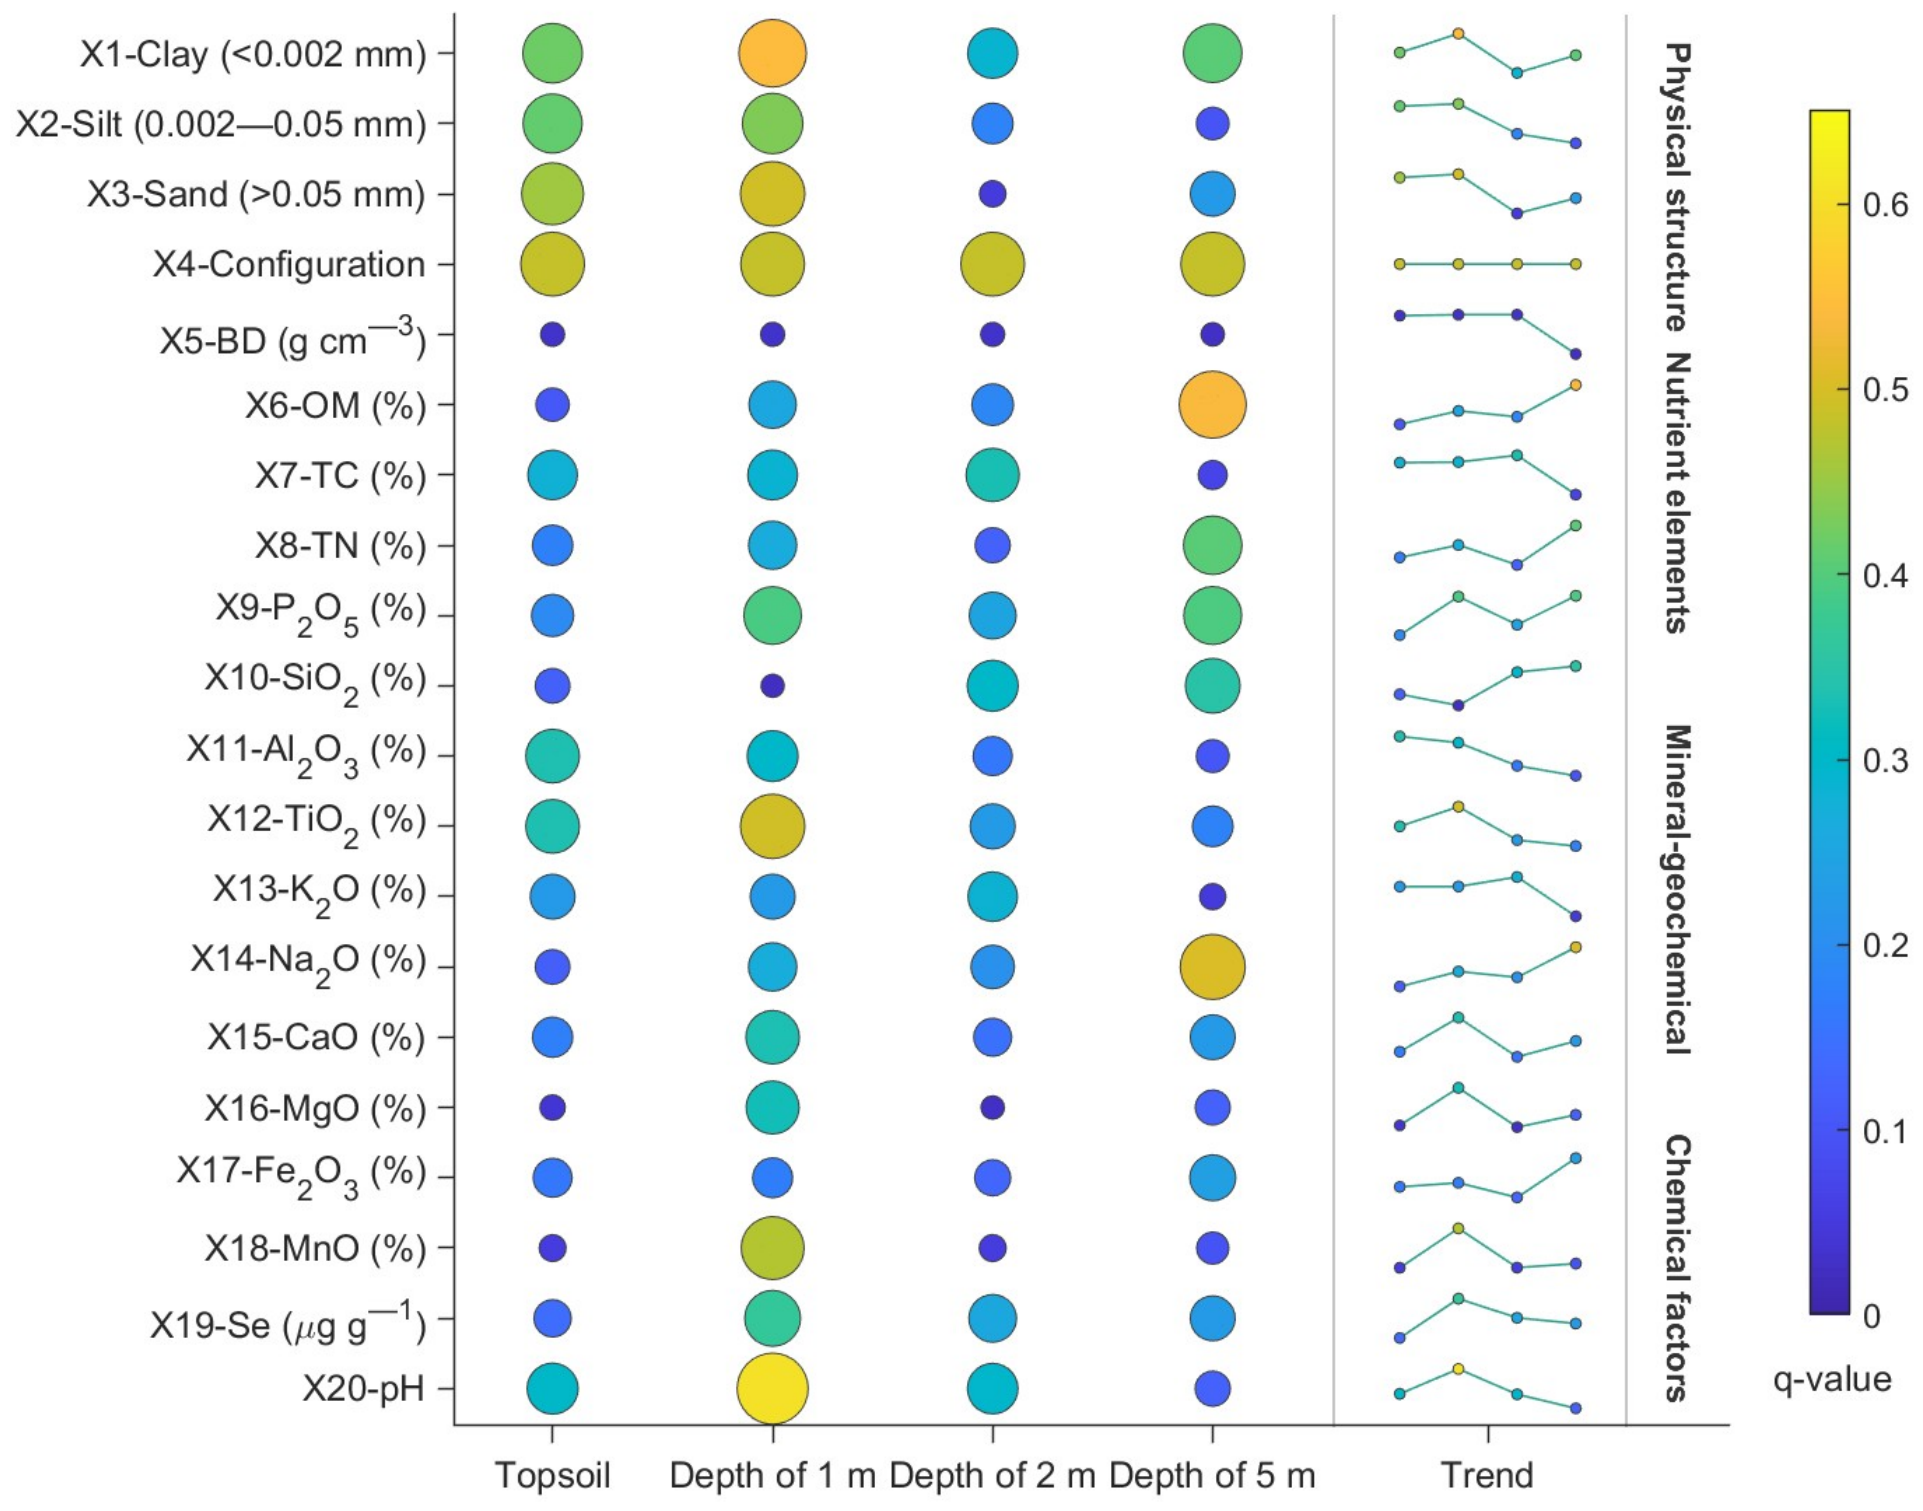
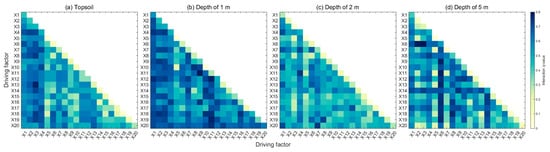
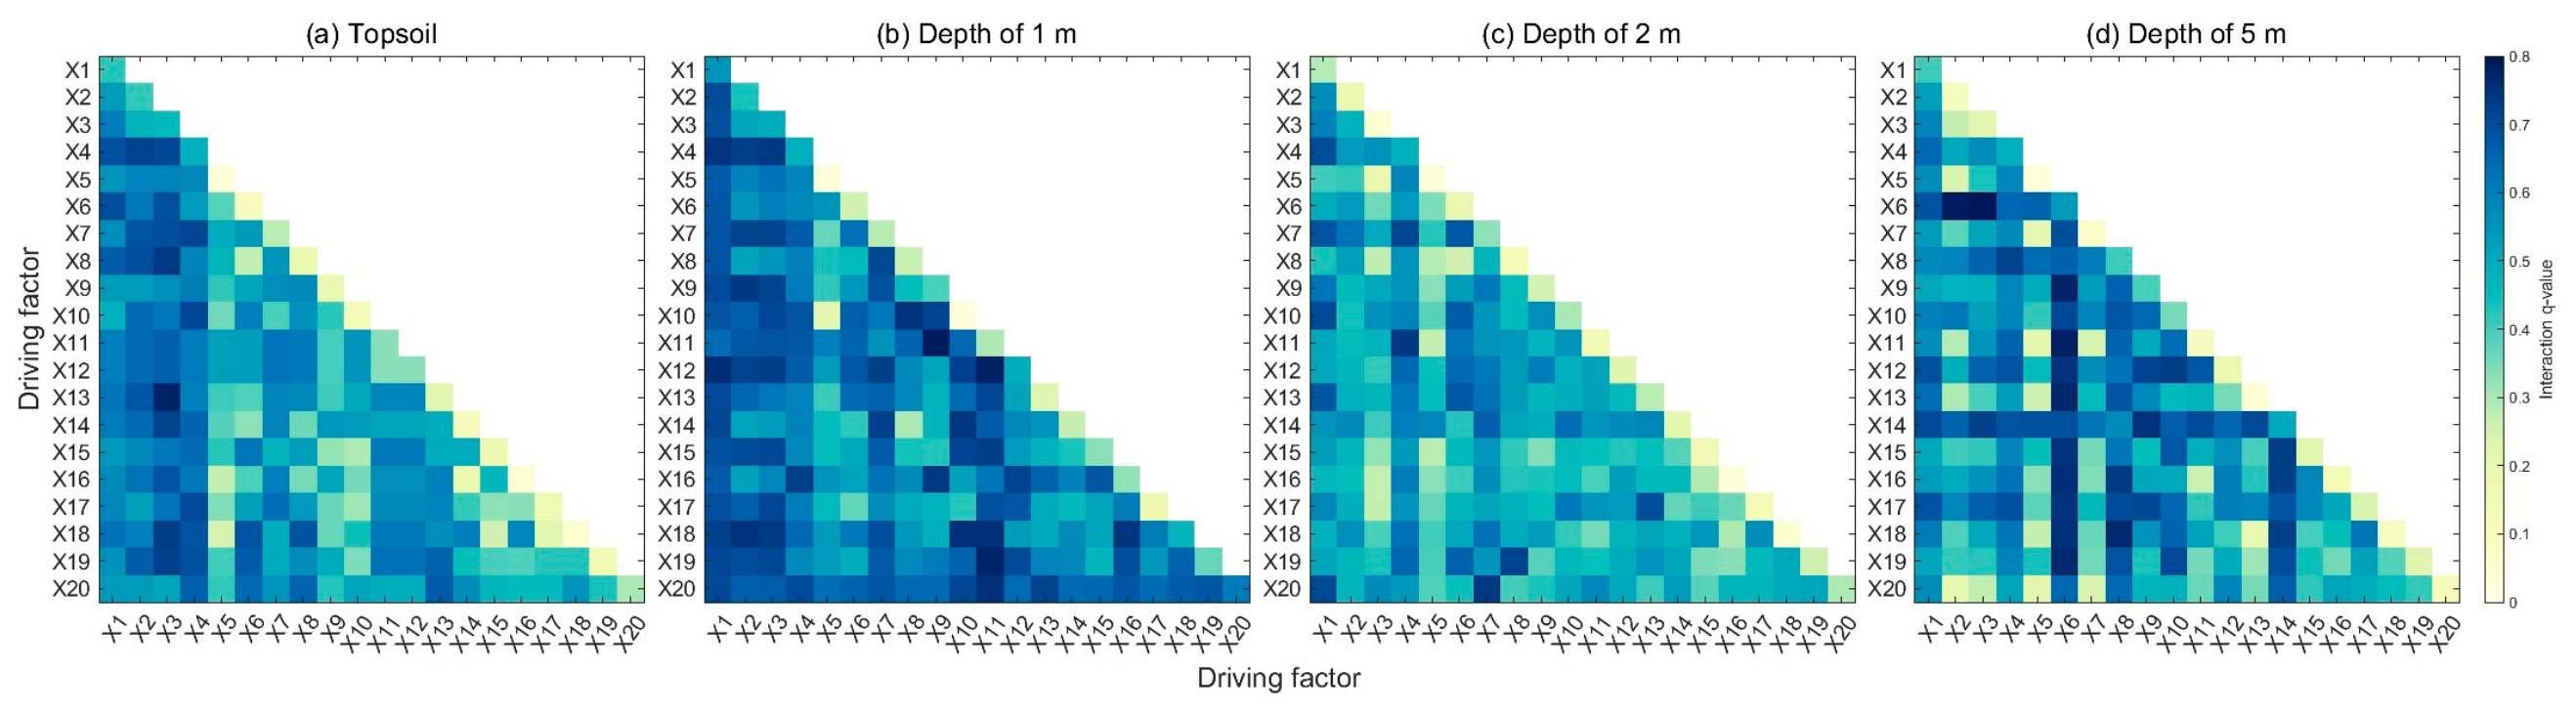
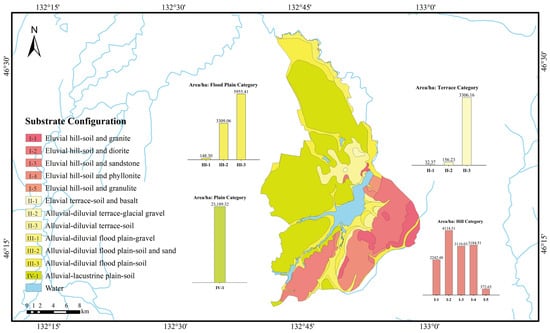
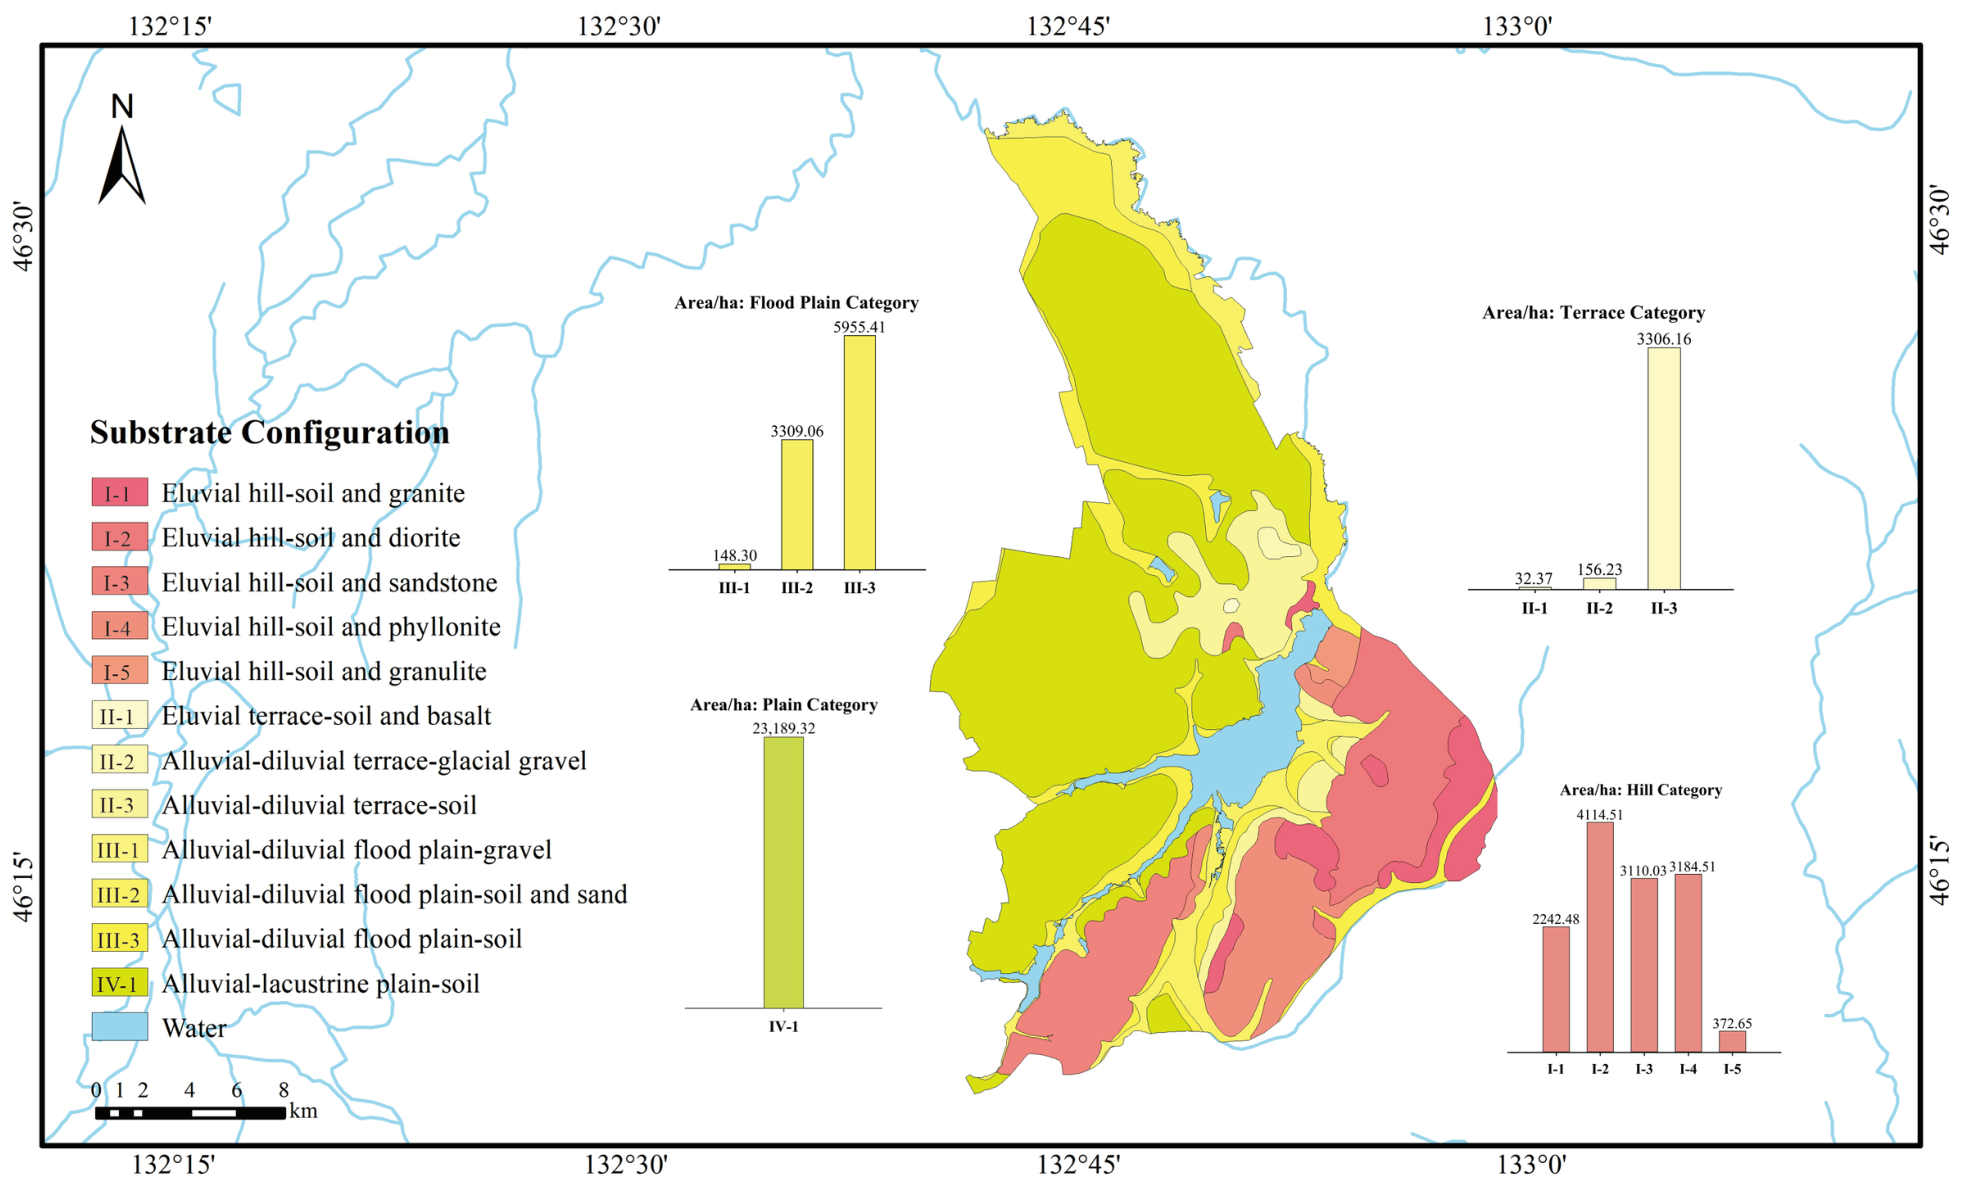
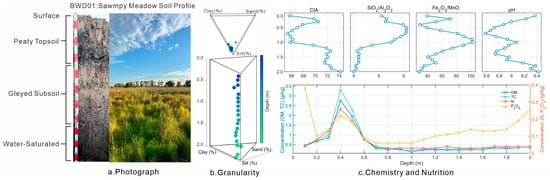
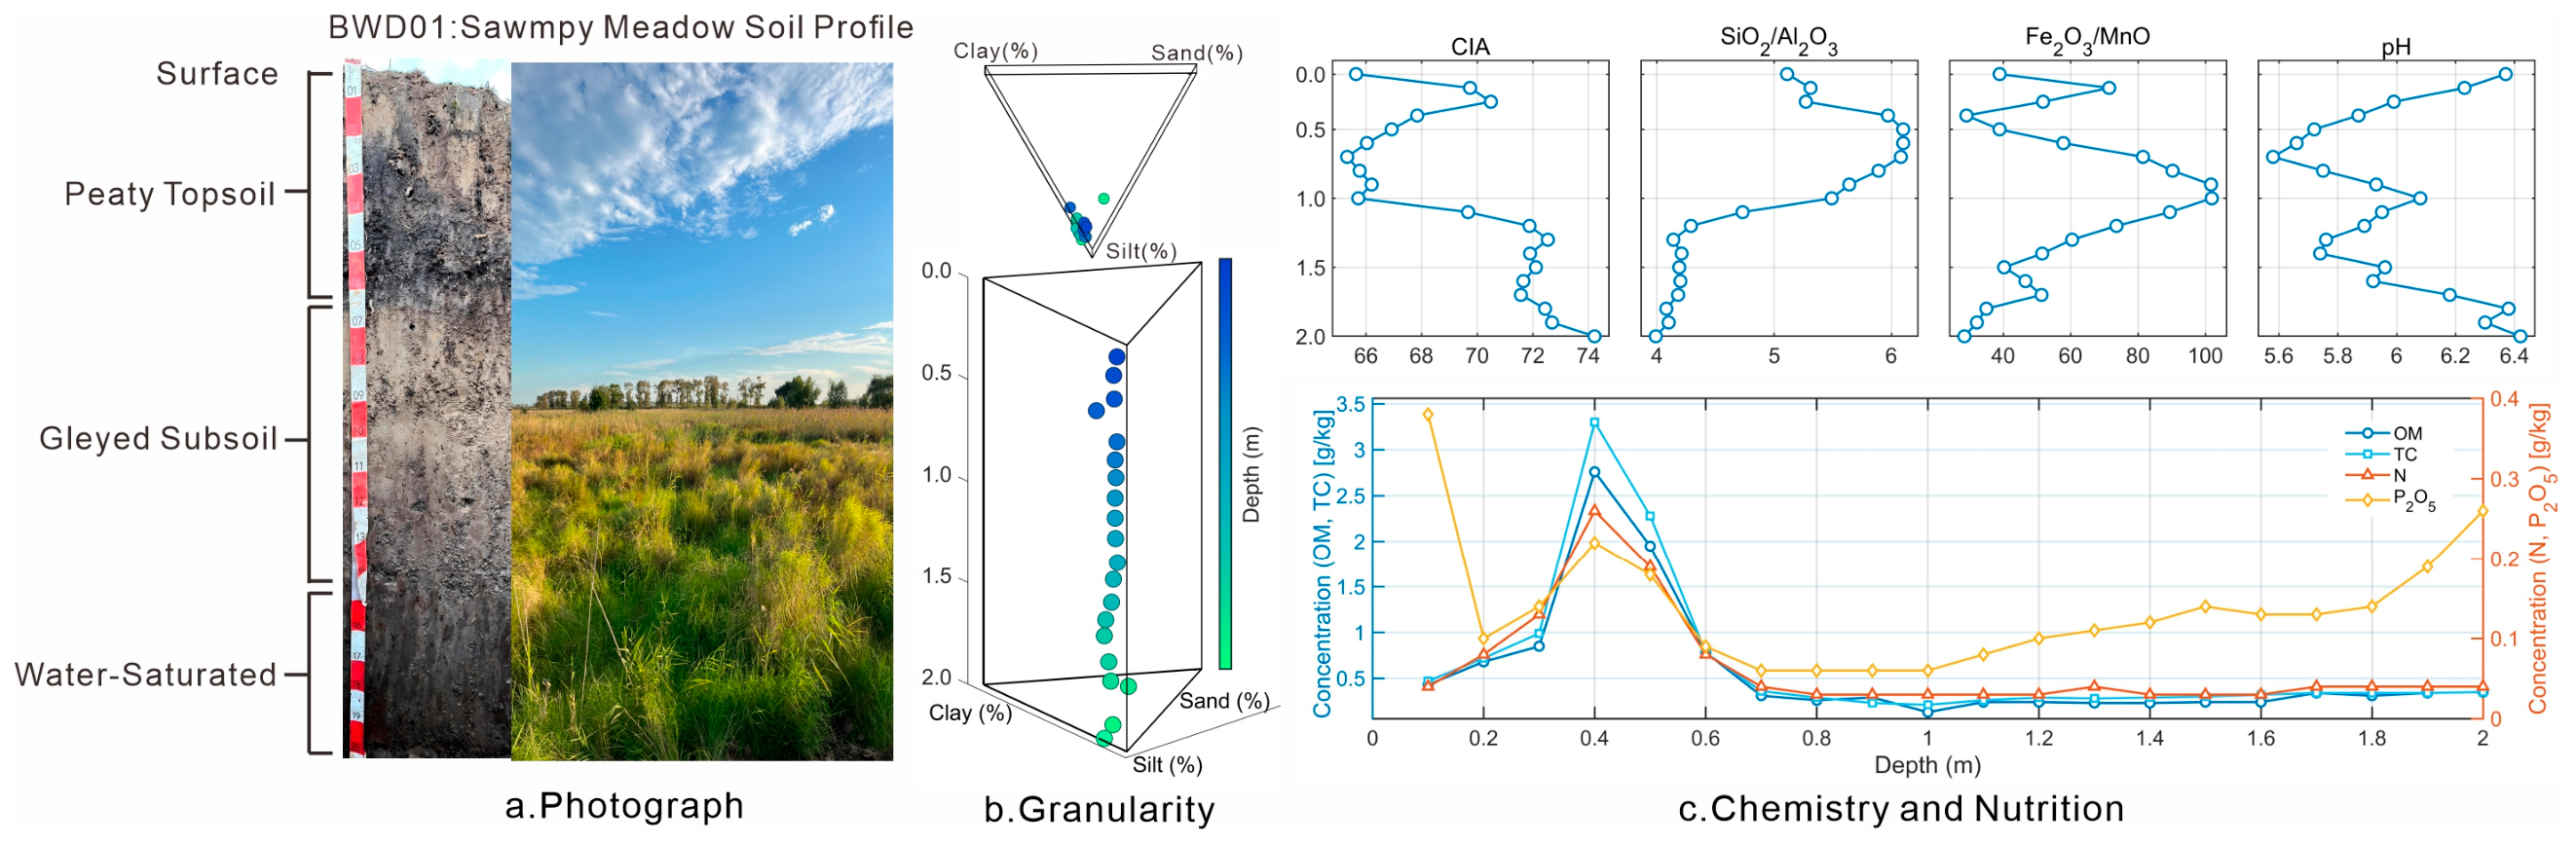
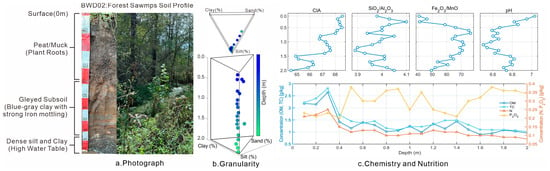
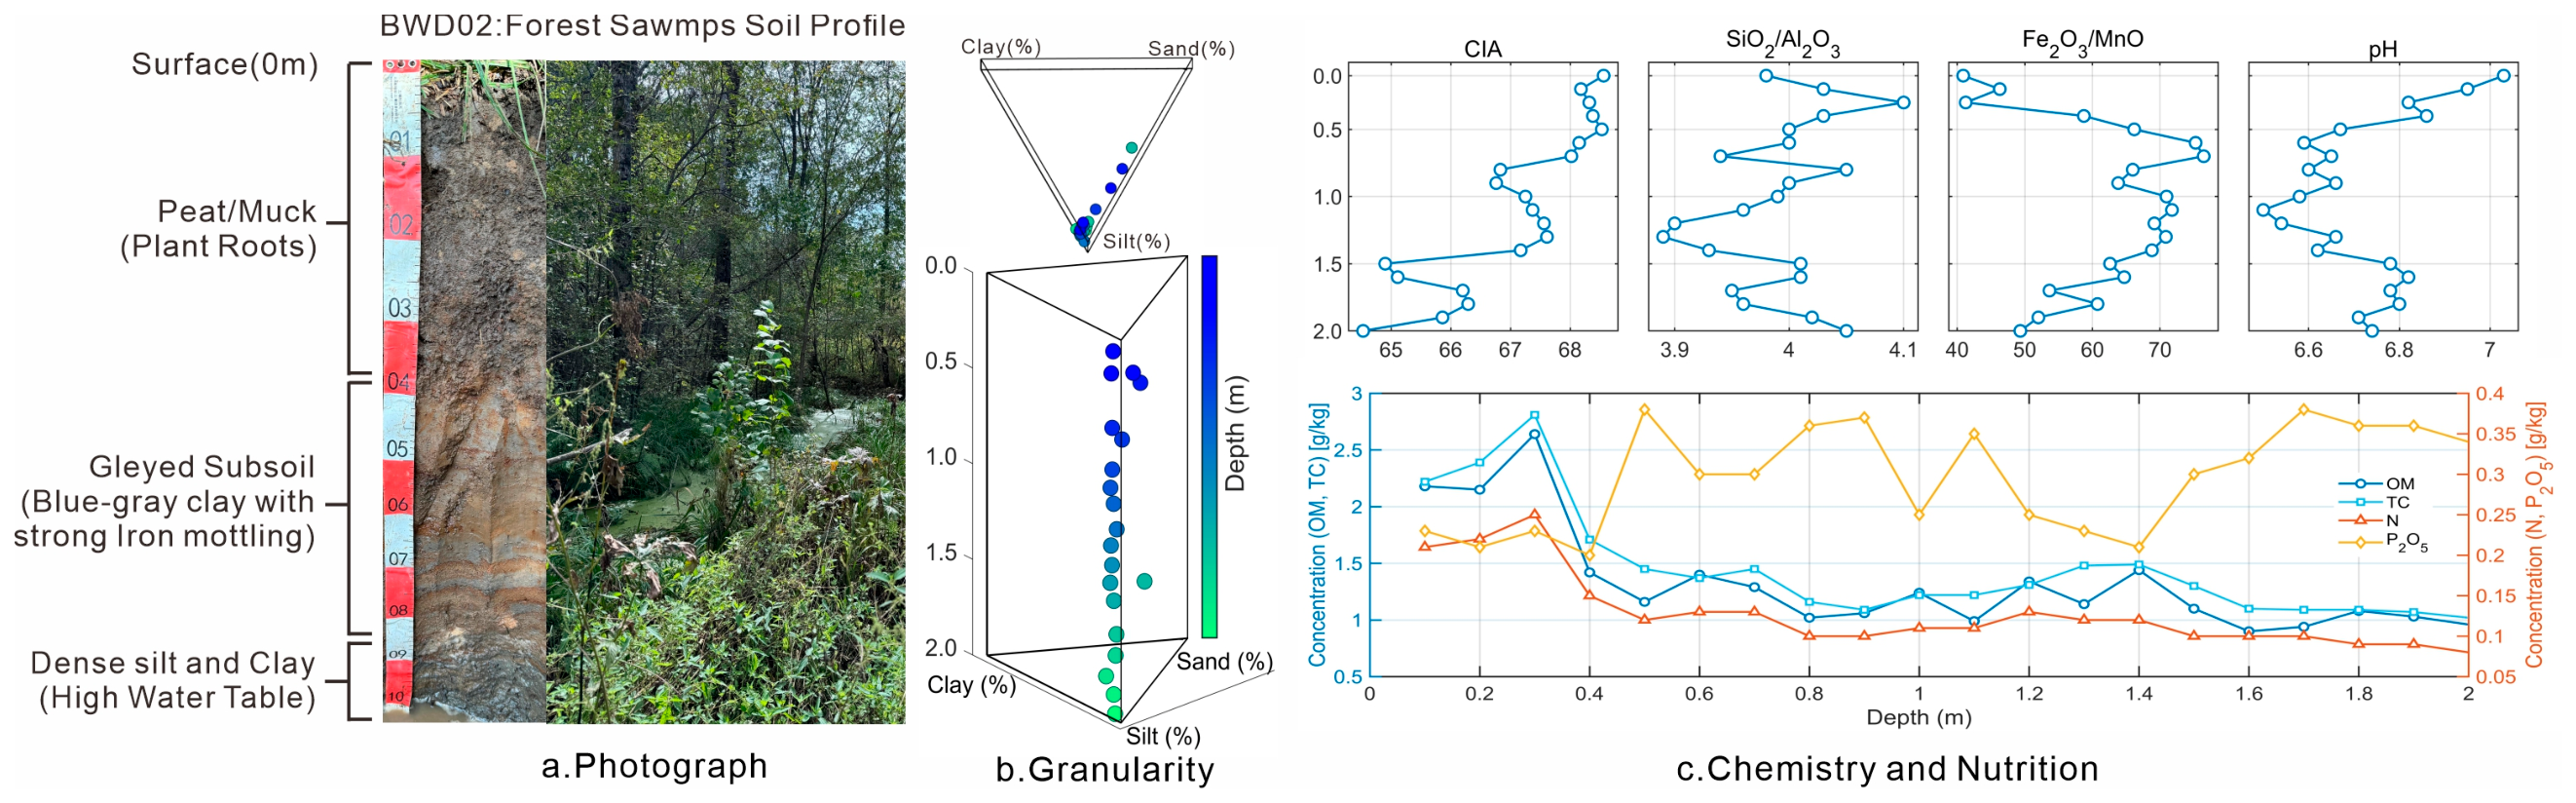
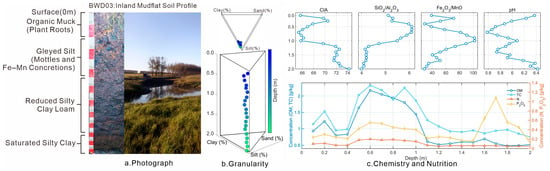
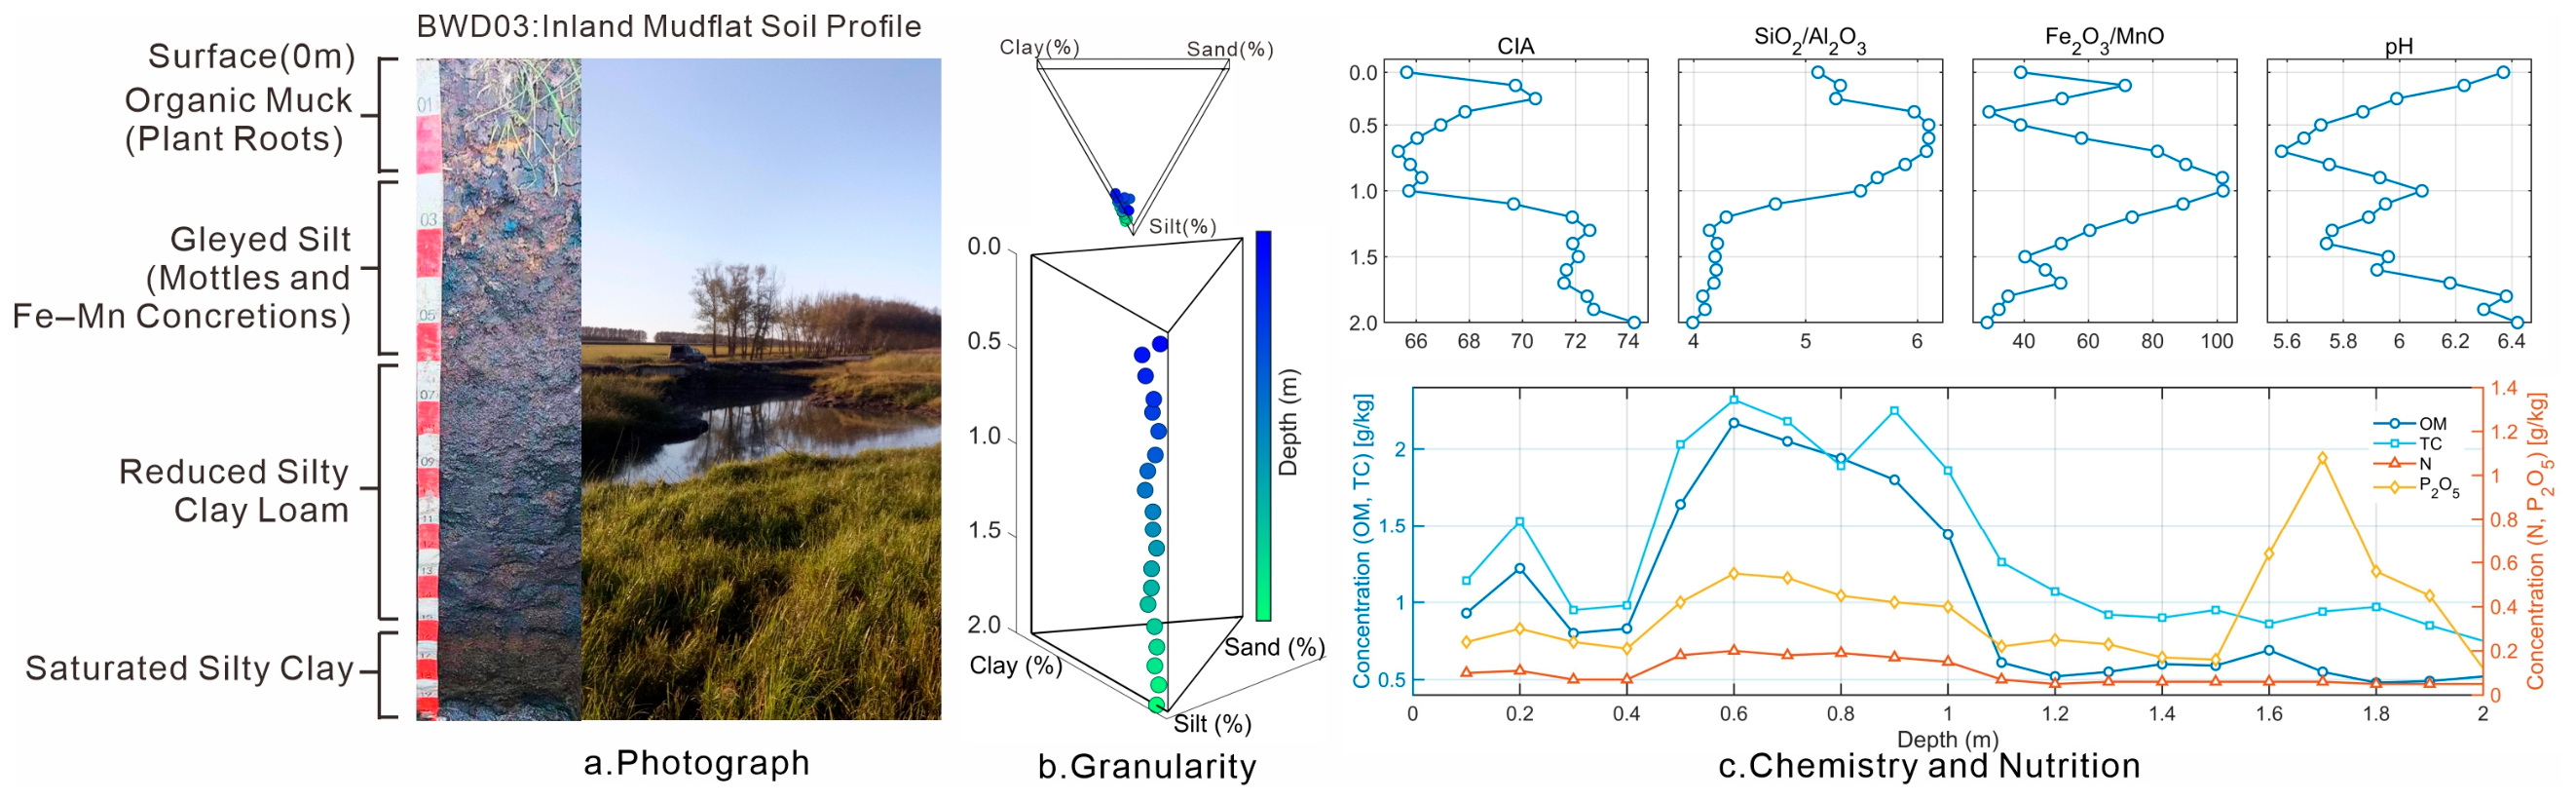

Disclaimer/Publisher’s Note: The statements, opinions and data contained in all publications are solely those of the individual author(s) and contributor(s) and not of MDPI and/or the editor(s). MDPI and/or the editor(s) disclaim responsibility for any injury to people or property resulting from any ideas, methods, instructions or products referred to in the content. |
© 2026 by the authors. Licensee MDPI, Basel, Switzerland. This article is an open access article distributed under the terms and conditions of the Creative Commons Attribution (CC BY) license.