


Abstract
To address diaphragm stress concentration and poor delivery stability in conventional diaphragm pumps, this study investigates an opposed balance pump equipped with a radial balance device. A dynamic mesh technique based on user-defined function (UDF) was integrated with a fluid–structure interaction framework, a spring-based smoothing model, and a local remeshing criterion to synchronize computational-domain motion with diaphragm deformation under large-deformation conditions. Numerical simulations were combined with particle image velocimetry (PIV) measurements around the umbrella valve to experimentally characterize local velocity distributions and vortex evolution. Six operating conditions from 0.2Q to 1.2Q were examined to characterize the coupled evolution of diaphragm stress, total deformation, and internal flow. The results show that the maximum equivalent stress and total deformation vary nonlinearly with flow rate. The diaphragm exhibits the most favorable mechanical-to-fluid load ratio and the most stable response at 0.6Q–0.8Q. Symmetrical radial flow channels and the radial balance device regulate internal flow organization and facilitate fluid load redistribution by improving pressure uniformity and reducing asymmetric hydraulic loading, thereby decreasing both the maximum diaphragm stress and its fluctuation amplitude. Vortex evolution and pressure pulsation are identified as the primary hydrodynamic mechanisms causing alternating diaphragm loads. This study provides a theoretical basis for radial balance structure optimization, diaphragm load regulation, and the development of highly stable diaphragm pumping systems with improved hydraulic stability.
1. Introduction
Driven by the rapid development of modern agriculture, intelligent production systems have increasingly integrated fluid transport, energy management, automation control, and agricultural product processing technologies. Previous studies have demonstrated that hydraulic systems, intelligent control strategies, energy utilization methods, and agricultural processing technologies play important roles in improving the efficiency and sustainability of modern agricultural engineering systems [1,2,3,4,5,6,7,8,9]. With increasing demands for fluid transport stability, medium cleanliness, and flow-control accuracy in agricultural irrigation, drainage and water conveyance, facility agriculture, water treatment, healthcare, and precision metering, small pumps have been increasingly applied in low-flow and high-stability transport systems. Previous studies on submersible drainage pumps, heat pump systems for environmental control in livestock and poultry facilities, and double-suction pumps have demonstrated that pumps and fluid transport equipment are widely used in agricultural production, water resource regulation, and facility environmental control [10,11,12,13,14,15]. In addition, irrigation uniformity, droplet size distribution, and axis-switching behavior of non-circular nozzle jets have been shown to influence jet breakup, velocity distribution, and hydraulic performance [16,17]. Studies on flow stabilization in pressure-regulating devices, optimization of aerated impact sprinklers, and pressure regulation technologies for irrigation pipelines further indicate that local flow-channel structures and pressure-control strategies significantly affect flow-field stability [18,19,20]. Moreover, optimization studies on fixed water-dispersion devices in impact sprinklers and micro-sized water turbines for hose reel irrigators have shown that structural optimization of hydraulic components can improve flow-field stability and reduce hydraulic losses [21,22]. These studies provide an important basis for further revealing the velocity distribution, pressure fluctuation characteristics, and vortex evolution within the pump chamber, valve orifice, and local flow passages of diaphragm pumps. The operational performance of such systems depends not only on flow rate, head, and structural dimensions, but also on internal flow-field uniformity, pressure stability, and energy conversion efficiency. Therefore, research on flow-field organization, structural optimization, and operational stability is of great significance for improving the transport efficiency and operational reliability of diaphragm pumps in water treatment systems and agricultural applications.
Key components of agricultural equipment are frequently subjected to complex operating conditions involving fluid excitation, inertial forces, multiphase interactions, and coupled structural loads, which may significantly influence their operational stability and reliability. Previous studies have demonstrated that computational fluid dynamics (CFD), discrete element method (DEM), and coupled numerical approaches provide effective tools for analyzing flow characteristics, particle motion, and structural responses in agricultural equipment. Tang et al. [23] investigated the impact forces generated by water jets on the drive spoon of a large cannon irrigation sprinkler through theoretical analysis, CFD numerical simulation, and experimental validation, demonstrating that hydraulic impact loads significantly affect structural stress distribution, equipment stability, and service life. Li et al. [24] optimized the hydraulic performance of a water dispersion needle sprinkler using RF-NSGA II combined with CFD analysis and revealed that flow-field distribution, jet characteristics, and energy dissipation characteristics are closely related to hydraulic performance and structural parameters.
Studies on disc-type furrow openers, precision seeder suction nozzles, and combine harvester chassis have further shown that soil resistance, airflow disturbance, and structurally coupled loads can affect the structural response of agricultural equipment [25,26,27]. Zhang et al. [28] reported that soil penetration resistance, tillage depth, and operating speed significantly affect the deformation and fatigue damage of subsoiling shovels. Wu [29] employed CFD methods to analyze the flow characteristics of submersible mixers in anaerobic digesters and demonstrated that operating conditions and material properties significantly affect velocity distribution and mixing performance. Hu et al. [30] combined CFD simulation with field experiments to optimize spray cooling fan structures, showing that flow-field distribution and energy transport characteristics are closely associated with equipment performance. Chen et al. [31] established a validated CFD model for a micro-plant factory and demonstrated that spatial airflow distribution plays an important role in environmental control and system stability.
Moreover, multiphase coupling methods have been widely used to analyze particle–fluid interactions and dynamic responses in agricultural machinery. Ding et al. [32] applied DEM–CFD coupling technology to investigate the cleaning performance of rice combine harvesters and revealed the influence of particle motion and airflow distribution on separation efficiency. Wei et al. [33] analyzed the inertial force balance of oscillating sieve components in rice combine harvesters and demonstrated that reciprocating motion-induced inertial forces can cause vibration responses and affect mechanical stability. Ni et al. [34] employed CFD simulations to investigate internal flow characteristics in greenhouse tomato seedlings, demonstrating the applicability of CFD methods for analyzing internal flow distribution in agricultural biological systems. El–Emam et al. [35] investigated the performance of aero-type cyclone separators with different spiral inlet configurations using a CFD–DEM coupled model, demonstrating that particle–fluid interactions, vortex characteristics, and flow-field organization significantly influence separation performance and hydraulic behavior.
These studies indicate that the operational performance of agricultural equipment is not only governed by structural strength but also strongly affected by fluid-induced loading, local flow characteristics, particle–fluid interactions, and coupled dynamic responses. Similar mechanisms exist in diaphragm pumps, where periodic diaphragm deformation, valve impact, and pump-chamber pressure fluctuations generate complex fluid-induced loads and structural responses during long-term operation.
In recent years, research on pump equipment has gradually shifted from conventional macroscopic performance evaluation to comprehensive analysis of internal flow mechanisms, energy dissipation, vortex structures, and unsteady pressure fluctuations. Ji et al. [36,37] revealed the energy-transfer and dissipation mechanisms inside a multi-stage pump impeller based on energy balance theory, providing insights into the relationship between hydraulic losses and internal flow structures. Chang et al. [38,39] demonstrated that inlet disturbance and wall roughness can significantly modify internal flow patterns, vortex evolution, and energy-loss distribution in pumps. Furthermore, optimization studies based on the energy balance equation and NSGA-II algorithm have indicated that energy-loss analysis can provide an effective approach for hydraulic performance improvement and structural optimization [40]. Studies on nonlinear pressure pulsation and local roughness effects have further shown that geometric disturbances can influence pump-system stability by altering flow separation, vortex development, and unsteady pressure characteristics [41]. Li et al. [42] investigated the influence of blade tip clearance on vortex dynamics and energy loss in a submersible slurry pump and demonstrated that local geometric variations significantly affect vortex evolution and hydraulic energy dissipation. Therefore, analyses involving velocity fields, pressure fields, turbulence characteristics, and pressure-pulsation spectra are essential for revealing the coupling relationship between internal flow behavior and structural responses in advanced pump systems.
In addition to transient flow characteristics and energy dissipation, the long-term operational reliability of pump systems is strongly influenced by component degradation, wear, particle erosion, and multiphase flow-induced damage. Ranawat et al. [43] investigated the influence of wear ring clearance variations on centrifugal pump performance under different eccentricity conditions and demonstrated that geometric degradation of key components significantly alters hydraulic characteristics. Gu et al. [44] employed coupled dynamic mesh and multi-reference frame computational fluid dynamics (CFD) simulations to analyze the effects of seal wear on sealing performance, revealing the interaction between structural degradation and internal flow behavior. Dong et al. [45] investigated the erosion characteristics of centrifugal pumps operating under high-sediment water conditions and provided theoretical and experimental guidance for coating material selection under severe sediment erosion environments.
Furthermore, CFD-based particle transport models and multiphase flow simulation methods have been widely applied to predict erosion mechanisms and evaluate hydraulic component reliability. Khan R. et al. [46] combined actual failure evidence with validated CFD–DPM modeling to establish a direct correlation between physical degradation and predicted erosion behavior. Zhao et al. [47] investigated sediment erosion in pump–turbines using the Euler–Lagrange numerical approach and systematically analyzed erosion distribution patterns and associated mechanisms along the flow passage. El–Emam et al. [48] employed an advanced CFD–DEM framework to quantify the effects of coupling strategies on slurry flow behavior and erosion prediction within pump components. Studies considering particle morphology, slurry concentration, and complex operating conditions further demonstrated that particle characteristics and multiphase flow regimes significantly influence surface damage and hydraulic performance of slurry pumps [49,50]. Pan et al. [51] investigated erosion characteristics of a double-suction pump–turbine model under different operating modes and highlighted the importance of multiphase flow analysis for predicting long-term degradation of hydraulic components. These studies indicate that pump reliability is governed not only by instantaneous hydraulic performance but also by the coupled effects of flow instability, structural degradation, particle-induced erosion, and multiphase interactions. However, most existing studies have mainly focused on rigid hydraulic components, such as centrifugal pumps, slurry pumps, and pump–turbines, while the dynamic response mechanisms of flexible diaphragm structures under continuously varying hydraulic loading remain insufficiently understood.
Diaphragm pumps rely on periodic reciprocating deformation of the diaphragm to change the pump-chamber volume. Owing to their compact structure, good sealing performance, strong medium isolation, and suitability for clean low-flow transport, they have considerable application potential in water treatment, medical testing, precision metering, and small-scale agricultural fluid transport systems. Lu et al. [52] proposed a high-pressure and high-flow-rate piezoelectric ultrasonic micro pump, which improved micro pump output performance. Menéndez et al. [53] established a three-dimensional unsteady fluid–structure interaction model for the check valve of a diaphragm volumetric pump and showed that valve stability is closely related to pressure-supply conditions and fluid loading. Previous studies have analyzed the deformation, fluctuation, and flow characteristics of diaphragm pumps from numerical and experimental perspectives, further indicating that diaphragm pump performance is jointly affected by driving parameters, valve response, and unsteady flow in the pump chamber [54,55].
In addition to diaphragm deformation and valve dynamics, the internal hydraulic behavior of diaphragm pumps, including velocity redistribution, vortex evolution, and pressure fluctuation, plays an important role in determining transport stability and energy dissipation. Previous studies on fluid machinery have demonstrated that unsteady flow characteristics and pressure fluctuations are strongly associated with local geometric structures and operating conditions. Cai et al. [56] investigated unsteady flow behavior in fluid equipment using detached eddy simulation (DES) and revealed the influence of complex flow structures on downstream hydraulic characteristics. Furthermore, particle image velocimetry (PIV), as an effective flow visualization technique, has been widely applied to measure velocity distributions and validate numerical simulations of hydraulic systems [57,58]. Recently, Brazhenko et al. [59] developed a transparent model of a semi-direct acting water solenoid valve to directly visualize diaphragm displacement and applied the measured deformation data in CFD analysis. Their results demonstrated that diaphragm motion is closely coupled with pressure distribution and internal flow-field evolution, highlighting the importance of integrating experimental visualization with numerical simulation for accurately characterizing diaphragm dynamic responses.
The fluid–structure interaction method can simultaneously describe fluid pressure loads, structural deformation responses, and the feedback relationship between them, making it an effective approach for investigating diaphragm dynamic characteristics. Han et al. [60,61] studied the bolt optimization of diaphragm pump check-valve end covers and the dynamic characteristics of diaphragm pumps in slurry transportation, showing that the stress state of the connecting structure and valve hysteresis affect the transport stability of diaphragm pumps. Peng et al. [62] analyzed the internal flow characteristics of a four-way opposed diaphragm pump and revealed the influence of valve structure on vortex distribution and flow-field stability. Huang et al. [63,64] and Ling et al. [65] further demonstrated, from the perspectives of valved piezoelectric pumps, suction valves of large-scale diaphragm pumps, and mixed-flow waterjet pumps, that the coupling between fluid excitation and structural response significantly affects the operational stability of pump equipment. Thus, static strength analysis or single flow-field analysis alone is insufficient to accurately characterize the dynamic response of diaphragm pumps under actual service conditions. Fluid–structure interaction and dynamic mesh methods should be combined to analyze interactions among diaphragm deformation, valve opening and closing, pump-chamber pressure, and fluid excitation.
Overall, substantial progress has been made in the optimization of agricultural fluid transport components, load and fatigue analysis of agricultural equipment, unsteady flow analysis in pumps, energy-dissipation evaluation, and fluid–structure interaction analysis of diaphragm pumps. However, the dynamic response mechanism of opposed balance pumps remains insufficiently understood. Conventional diaphragm pumps are prone to alternating diaphragm stress, uneven pump-chamber pressure distribution, valve hysteresis, local vortex dissipation, and pressure pulsation, which may lead to diaphragm fatigue failure, localized stress concentration in the pump body, and reduced transport stability. Opposed balance diaphragm structures are expected to improve the stress state and power transmission path on both sides of the diaphragm; however, their effects on diaphragm mechanical response, internal flow-field uniformity, and pressure-pulsation characteristics require further clarification. Therefore, this study takes a specific type of opposed balance pump as the research object and employs dynamic mesh UDF technology combined with fluid–structure interaction methods to analyze the stress, deformation, and strain distribution of the diaphragm under different flow-rate conditions. Furthermore, conventional diaphragm pumps and opposed balance pumps are compared in terms of velocity field, pressure field, turbulence characteristics, and pressure-pulsation spectra, aiming to reveal how the opposed balance structure improves diaphragm stress and flow-field stability.
2. Research Objects
2.1. Basic Technical Parameters of the Pump
During long-term operation, conventional diaphragm pumps are susceptible to diaphragm fatigue, rupture, deformation, and even cracking. These failures are mainly attributed to localized stress concentration in the pump body, which results from alternating stresses acting on the diaphragm and non-uniform pressure distribution in the flow channels. Such defects not only compromise operational stability but also increase maintenance costs and potential safety risks. The opposed balance pump proposed in this study is an improved design developed to overcome the stress–strain limitations of conventional diaphragm pumps. By optimizing the internal structure and incorporating a radial balance device, the proposed pump aims to improve the stress distribution and flow-field characteristics within the pump while reducing the strain level of key components. The main technical parameters of the opposed balance pump are summarized in Table 1. The structure of the opposed balance pump is shown in Figure 1.
Table 1.
Main technical parameters of the opposed balance pump.
Figure 1.
Structure of the opposed balance pump.
In the comparative analysis between the conventional diaphragm pump and the counterbalanced pump, the key parameters, including diaphragm geometry, nitrile rubber material properties, eccentric wheel driving stroke (e.g.), diaphragm displacement amplitude), inlet and outlet pressure boundary conditions, rotational speed, turbulence model, time step, and mesh generation strategy, were maintained consistent to ensure a reliable comparison. The only differences between the two models were the flow-channel configuration and the implementation of the radial balancing device.
2.2. Analysis of Stress–Strain Characteristics
To accurately obtain the stress and strain data of the key components of the pump, a three-dimensional solid model of the opposed balance pump was established using ANSYS Workbench 2022 R1 finite element analysis software. After mesh generation, boundary conditions consistent with the actual operating conditions, including inlet pressure, outlet pressure, and reciprocating diaphragm loading, were applied. Static and dynamic simulations were then performed to obtain the stress contours, strain contours, and stress–strain curves of critical components, such as the pump body and diaphragm.
This study adopts a partitioned fluid–structure interaction (FSI) framework coupled with user-defined functions (UDFs) to implement dynamic mesh control. The transient pressure loads acting on the diaphragm surface are first obtained by solving the Navier–Stokes equations in the fluid domain using Fluent. These fluid-induced pressure loads are subsequently transferred to the structural solver through the fluid–structure interface. The structural solver then calculates the deformation and displacement responses of the diaphragm under the combined effects of mechanical driving loads and fluid pressure loads. The calculated diaphragm wall displacement is subsequently transferred back to the fluid domain, completing one FSI iteration. The partitioned approach maintains the modularity of the fluid and structural solvers while providing improved computational efficiency and convergence performance. In addition, the UDF accurately reproduces the actual motion trajectory of the cam-eccentric wheel mechanism, thereby satisfying the requirements for simulating the large-deformation reciprocating motion of the diaphragm.
The displacement transfer process is achieved through the fluid–structure interaction interface. The kinematic compatibility condition ensures consistency between the displacements of the fluid-side and structural-side boundaries at the interface. Specifically, the structural solver calculates the nodal displacement of the diaphragm wall and transfers this information to the corresponding fluid-wall boundary, allowing the fluid-domain wall nodes to move synchronously with the diaphragm. Meanwhile, the mechanical equilibrium condition ensures that the fluid pressure loads acting on the interface are accurately transmitted to the diaphragm structure, enabling bidirectional exchange of load information between the fluid and structural domains. At each time step, the dynamic mesh of the fluid domain is updated to accommodate the diaphragm deformation. Within a time step of 0.001 s, the spring-based smoothing algorithm is first employed to adjust the positions of the internal fluid mesh nodes. When the large deformation of the diaphragm causes the mesh quality to deteriorate below the predefined threshold, the local remeshing module is automatically activated to regenerate highly distorted mesh regions. This adaptive dynamic mesh strategy ensures the reliability of the fluid mesh under large-deformation conditions and enables accurate representation of the diaphragm deformation at each time step.
3. Analysis of Fluid–Structure Interaction Characteristics
3.1. Basic Theories and Methods
Fluid–structure interaction (FSI) refers to a multiphysics coupling process involving fluid dynamics and structural mechanics. It describes the interaction between a deformable or moving structure and the surrounding or internal fluid flow, which may exhibit either stable or oscillatory behavior. When the flowing fluid interacts with the solid structure, the fluid-induced forces generate stress and strain in the structure, thereby causing deformation. The deformation magnitude is mainly governed by the fluid pressure, flow velocity, and intrinsic material properties of the structure, while the relationships among the various forces involved in FSI are illustrated in Figure 2.
Figure 2.
Relationships among various forces in fluid–structure interaction.
Fluid–structure interaction analysis is commonly conducted using two numerical strategies: the monolithic method and the partitioned method. In the monolithic method, the fluid and structural domains are integrated into a single coupled system, and the governing equations are solved simultaneously. By contrast, the partitioned method formulates separate governing equations for the fluid and structural domains and solves them sequentially according to a prescribed coupling procedure. In this framework, computational fluid dynamics is adopted to solve the Navier–Stokes equations and characterize the fluid flow, while structural dynamics is used to predict the mechanical response of the solid domain. The interaction between the two physical fields is achieved through the transfer of displacement, velocity, pressure, and force information across the fluid–structure interface. Owing to its modular solution framework, the partitioned method preserves the relative independence of the fluid and structural solvers, while offering lower computational complexity, faster convergence, and reduced computational cost. Therefore, it has become a widely adopted strategy for FSI analysis.
In the partitioned approach, the fluid flow is described by the continuity equation and the Navier–Stokes equations, which can be written as follows:
where t represents time; ui represents the velocity of the fluid element in a xi certain direction; p represents the pressure exerted on the fluid element; fi represents the source term of the force acting on the element.
The motion of the solid domain is governed by Newton’s second law and can be expressed as follows:
where di is the displacement of the solid micro-element in the xi direction; ρ is the density of the solid domain; c is the damping coefficient; σij is the stress tensor; and Fi denotes the external force acting on the solid micro-element in the xi direction.
In addition, at the fluid–structure interface, the governing equations of the coupled system must satisfy both displacement compatibility and stress equilibrium conditions, which can be expressed as follows:
In the formula, ui and σij are the displacement and stress of the solid domain and fluid domain at the fluid–structure interaction interface, respectively; nj is the normal vector of the fluid–structure interaction interface; the superscript f represents the fluid field, and s represents the solid structure field.
In this study, the maximum total deformation of the diaphragm was approximately 0.526 mm, representing a relatively small geometric variation compared with the characteristic dimensions of the pump cavity. The flow within the pump cavity is primarily driven by the periodic volumetric compression induced by the eccentric wheel, together with the opening and closing dynamics of the umbrella valve. In comparison, the geometric variations in the fluid domain resulting from diaphragm deformation exert only a secondary influence on the instantaneous pressure field and the evolution of vortical structures within the pump cavity. Therefore, the modulation of the flow field by diaphragm deformation is considered to be substantially weaker than the dominant effects associated with the eccentric-wheel volumetric drive and valve opening and closing. Accordingly, the adopted unidirectional fluid–structure coupling scheme is sufficient to capture the dominant physical mechanisms governing the flow characteristics investigated in this study.
In the present study, the diaphragm undergoes large deformation during cyclic reciprocating motion, resulting in continuous displacement of the fluid–structure interface. Therefore, the mathematical treatment of the interface should satisfy both kinematic compatibility and mechanical equilibrium. The displacement continuity condition ensures consistent deformation between the fluid and structural domains at the interface, whereas the stress equilibrium condition maintains the balance between the fluid-induced traction and the structural restoring force. These interface conditions are derived from the fundamental principles of displacement compatibility and momentum conservation in fluid–structure coupled systems, providing a theoretical basis for accurate load transfer across the interface under large deformation conditions.
Since the diaphragm undergoes cyclic deformation during operation, the geometry of the computational fluid domain continuously evolves with time. Therefore, the fluid mesh must be dynamically updated according to the displacement of the fluid–structure interface. In this study, the dynamic mesh technique was employed to accommodate the moving interface. The spring-based smoothing algorithm adjusts the positions of internal mesh nodes according to the interface deformation, while local remeshing is activated when the mesh quality deteriorates below the prescribed criterion due to large deformation. This approach maintains mesh integrity during large-amplitude deformation and ensures accurate transfer of transient fluid pressure loads from the fluid domain to the diaphragm structure through the fluid–structure interface.
The total load acting on the diaphragm consists of two components: the mechanical driving load generated by the eccentric wheel-slider mechanism and the fluid-induced load caused by the pressure variation within the pump chamber. In this study, the load contribution ratio is defined based on the relative proportion of the peak load during one complete operating cycle rather than the time-averaged load.
For the unidirectional FSI simulation, the peak mechanical load Fm is obtained from the reaction force applied by the mechanical driving boundary on the structural domain. The peak fluid-induced load Ff is calculated by integrating the transient fluid pressure acting on the diaphragm surface. The total peak load is defined as:
Accordingly, the mechanical load contribution ratio Rm and fluid-induced load contribution ratio Rf are calculated as:
The calculated results indicate that the mechanical load contribution ratio reaches 68% under the 0.2Q condition, whereas the fluid-induced load contribution ratio increases to 43% and 58% under the 0.6Q and 1.2Q conditions, respectively. This quantitative evaluation provides a direct comparison of the relative contributions of mechanical and hydraulic excitations under different operating conditions. The results demonstrate the transition of the dominant excitation mechanism from primarily mechanical loading at low flow rates to an increasing influence of hydraulic loading at higher flow rates, providing additional support for the identified operating characteristics in the 0.6Q–0.8Q range.
3.2. Fluid–Structure Interaction Calculation Settings
Transient simulations of the fluid domain in the opposed balance pump were conducted using ANSYS Fluent. The shear stress transport SST k-ω turbulence model was employed to describe the turbulent flow, while the SIMPLEC algorithm was used for pressure-velocity coupling. The transient time step was set to 0.001 s, and the maximum number of iterations for each time step was set to 20.
The solid-domain model of the opposed balance pump and its mesh are presented in Figure 3. An adaptive tetrahedral meshing strategy was applied to discretize the solid domain using ANSYS Meshing. The resulting mesh contained 452,515 nodes and 210,015 elements, with an average mesh quality of 0.7921. Since this value is higher than the mesh-quality criterion of 0.7 generally required for fluid–structure interaction simulations, the generated mesh was considered suitable for the subsequent coupled analysis.
Figure 3.
Structure and mesh diagram of solid domain. (a) Solid domain model. (b) Solid domain mesh.
The solid-domain material was assigned as structural steel, and the corresponding constraints were imposed, including standard gravity, centrifugal force induced by the rotational speed, and cylindrical supports generated by the bearing components. The axial displacement of the rotor components was also constrained, as illustrated in Figure 3. To ensure consistency with the transient calculation of the fluid domain in ANSYS Fluent, the time step was determined based on a motor shaft rotation increment of 3°. Accordingly, the time step was set to 0.001 s, and the total simulation duration was set to 1 s, corresponding to 10 revolutions of the solid domain.
3.3. Correlation Between Internal Flow-Field Characteristics and Structural Mechanical Response
3.3.1. Flow-Induced Excitation Characteristics and Diaphragm Mechanical Response
The internal pressure field of the opposed balance pump shows significant periodic fluctuations, with a fluctuation pattern strongly synchronized with the cam rotation cycle. At the characteristic phase of 300°, alternating high- and low-pressure regions are observed in pump chamber sections P1, P2, and P3 [62]. The pressure is not uniformly distributed within the flow field but tends to concentrate near the edge of the fluid–structure interaction interface. When the diaphragm undergoes the compression stroke, the overall pressure in the flow field increases to its maximum value. Meanwhile, local high-pressure regions are formed near the opening area of the umbrella valve, and the pressure gradually decreases along the flow direction, forming a clear pressure-gradient distribution.
The velocity contours, pressure contours, and streamline diagrams of the opposed balance pump are displayed in Figure 4 and Figure 5. The velocity field also presents a clear periodic distribution. During the cam pushing stroke, the fluid is compressed and accelerated, and the maximum velocity is mainly observed in the flow-channel region near the umbrella valve opening. During the return stroke, the fluid velocity decreases significantly, accompanied by local backflow in the pump chamber. The vortex structures formed inside the chamber strongly affect the local flow characteristics. Specifically, the vortex core exhibits relatively low velocity and weak flow motion, whereas a sharp velocity gradient appears near the vortex edge. When the vortex deflects toward the left side, a stagnation and deceleration region is generated on the left side of the chamber, while high-velocity flow is maintained on the right side, thereby further aggravating the non-uniform distribution of the flow field. The resulting periodic pressure and velocity fluctuations are transmitted to the diaphragm through the fluid–structure interface and act as additional hydraulic excitation. Therefore, the diaphragm experiences a coupled mechanical response under the combined effects of mechanical reciprocating excitation and fluid-induced excitation. The variation in these excitation components with operating flow rate provides the physical basis for the nonlinear stress and deformation response discussed in the following section. The radial balance device regulates internal flow distribution, improves pressure-field uniformity, and reduces asymmetric hydraulic loading and local flow disturbances. From the perspective of fluid mechanics, the hydraulic load acting on the diaphragm is determined not only by the magnitude of the pressure but also by its spatial distribution over the fluid–structure interface. The resultant fluid force can be expressed as:
where Ff represents the resultant hydraulic force acting on the diaphragm, p represents the local pressure distribution over the fluid–structure interface, A denotes the integration area of the diaphragm surface, and n represents the normal vector of the interface surface. According to Eq, the hydraulic loading acting on the diaphragm is determined not only by the magnitude of the pressure but also by its spatial distribution over the fluid–structure interface. Therefore, even when the overall hydraulic force remains nearly unchanged, non-uniform pressure distribution may generate asymmetric hydraulic loading and localized stress concentration.
Figure 4.
Velocity contours and streamline diagrams of opposed balance pumps [62]. (a) Velocity distribution of P1 Plane. (b) Velocity distribution of P2 Plane. (c) Velocity distribution of P3 Plane. (d) Overall streamline distribution of the opposed balance pump. (e) Streamline cloud diagram of the outlet of the opposed balance pump. (f) Streamline cloud diagram of the inlet of the opposed balance pump.
Figure 5.
Pressure contours of opposed balance pumps [62]. (a) Pressure distribution of P1 Plane. (b) Pressure distribution of P2 Plane. (c) Pressure distribution of P3 Plane.
The radial balancing device modifies the internal flow-path configuration and promotes a more symmetric radial flow distribution within the pump chamber. From the perspective of momentum redistribution, conventional diaphragm pumps predominantly introduce fluid momentum from one side of the pump chamber, which can generate an asymmetric momentum field and localized hydraulic impact on the diaphragm. In contrast, the symmetric radial flow passages associated with the radial balancing device redistribute the incoming flow momentum in multiple radial directions. This redistribution weakens the dominance of the unidirectional momentum input and mitigates asymmetric flow deflection and vortex development near the diaphragm surface. Consequently, the hydraulic loading imposed on different regions of the diaphragm can be redistributed more uniformly.
From the perspective of pressure-field reconstruction, the radial balancing device changes the internal flow-path topology and consequently modifies the local velocity gradients, flow separation, and recirculation characteristics within the pump chamber. According to the Navier–Stokes equations, the spatial variation in fluid velocity and momentum transport is closely associated with the distribution of pressure gradients. The modified radial flow passages can mitigate localized high-velocity regions and asymmetric flow structures, thereby reducing the spatial non-uniformity of the pressure field acting on the diaphragm surface. As a result, the pressure distribution over the wetted surface becomes more balanced, which provides a direct fluid-mechanical basis for the redistribution of the hydraulic load.
The resulting modification of the pressure distribution directly affects the surface integral of the hydraulic load. In particular, localized high-pressure regions can produce concentrated surface tractions on the diaphragm. Even when the variation in the resultant hydraulic force is relatively small, an asymmetric pressure distribution may still generate an uneven load distribution and contribute to eccentric deformation and localized stress concentration. Therefore, the effect of the radial balancing device is not limited to reducing the overall hydraulic force. More importantly, it reconstructs the spatial distribution of the diaphragm-surface pressure field (p(x,y,z)), reduces localized pressure peaks and asymmetric pressure components, and redistributes the hydraulic loading over the wetted surface. This redistribution weakens the tendency for localized hydraulic loading and eccentric deformation, thereby alleviating stress concentration near the diaphragm edge.
In addition to modifying the pressure distribution, the radial balancing device also affects the temporal characteristics of the hydraulic excitation. The redistribution of flow momentum and suppression of asymmetric vortex structures can mitigate local pressure fluctuations associated with unsteady flow development. Consequently, the amplitude of the alternating hydraulic load acting on the diaphragm can be reduced over a reciprocating cycle. The resulting reduction in the magnitude and spatial non-uniformity of the alternating hydraulic loading contributes to the observed changes in the dynamic stress and deformation responses of the diaphragm under different operating conditions.
Overall, the physical mechanism of the radial balancing device can therefore be understood as a coupled process involving flow-momentum redistribution, pressure-field reconstruction, and hydraulic-load redistribution. The symmetric radial flow passages modify the internal flow structure, which subsequently alters the spatial and temporal characteristics of the pressure field acting on the diaphragm. These changes in hydraulic loading ultimately affect the magnitude and spatial distribution of the diaphragm stress and deformation responses. This mechanism provides a fluid-mechanical interpretation of the differences in diaphragm loading characteristics observed between the conventional and radially balanced configurations.
The regulation of fluid-induced load distribution through structural optimization has also been demonstrated in previous hydraulic systems. Ge et al. [66] reported that flow-field control strategies based on structural optimization can effectively modify local flow characteristics and regulate the spatial distribution of hydrodynamic forces. This concept provides a theoretical reference for understanding the load-regulation mechanism of the radial balance device proposed in this study.
Similarly, the radial balance structure does not simply reduce the overall hydraulic force acting on the diaphragm. Instead, it regulates internal flow organization by modifying the flow-path configuration, improving pressure uniformity, and redistributing local momentum transport. Consequently, asymmetric hydraulic loading and localized hydraulic impact on the diaphragm are reduced, thereby alleviating stress concentration and improving mechanical stability.
These effects can potentially decrease additional hydraulic losses associated with vortex development, flow separation, and pressure fluctuation, thereby enhancing operational stability. The improved flow-field uniformity reduces irreversible energy dissipation caused by non-uniform velocity gradients and unstable vortex structures, which may contribute to improving the conversion of mechanical input energy into useful hydraulic energy. However, quantitative comparison of hydraulic losses between the opposed balance pump and conventional diaphragm pumps requires further experimental investigation. Further measurements of pump head, shaft power, and efficiency curves under different operating conditions are required to quantitatively characterize the hydraulic performance and energy conversion characteristics of the pump system.
The pressure-pulsation characteristics of hydraulic systems are generally governed by the coupled effects of flow instability, structural motion, and, under specific conditions, cavitation-related phenomena. Ge et al. [67] reported that temperature, Reynolds number, and cavitation number can influence hydrodynamic cavitation intensity and shedding behavior, indicating that thermodynamic conditions may further affect transient pressure fluctuations by modifying unsteady flow structures. In the present study, the pressure-pulsation variation over 0.2Q–1.2Q is mainly attributed to vortex evolution, local hydraulic impact, and umbrella-valve motion based on the single-phase FSI analysis. Cavitation-related effects were not considered and may be further investigated under broader operating conditions.
However, it should be noted that the present fluid–structure interaction framework primarily focuses on the short-term dynamic response of the diaphragm under hydraulic and mechanical excitation. For elastomeric diaphragm materials, long-term service performance may also be influenced by environmental factors, such as temperature variation, chemical exposure, and stress-assisted material degradation. These factors can modify the intrinsic material properties, including stiffness, elasticity, and fatigue resistance, thereby affecting the long-term durability of the diaphragm. For elastomeric diaphragm materials, long-term service performance may also be influenced by environmental factors, such as temperature variation, chemical exposure, and stress-assisted material degradation. These factors can modify the intrinsic material properties, including stiffness, elasticity, and fatigue resistance, thereby affecting the long-term durability of the diaphragm. Moreover, quantitative fatigue-life prediction requires additional experimental fatigue parameters, including S-N characteristics, cyclic constitutive behavior, and realistic loading spectra. Therefore, although the present study provides important insights into diaphragm stress distribution and fatigue-risk-related loading characteristics, establishing a comprehensive durability evaluation framework considering fatigue damage evolution and long-term service behavior requires further investigation.
In the current study, the diaphragm material is assumed to maintain constant mechanical properties during the simulation process, and temperature-dependent material degradation and chemical aging effects are not explicitly considered. Therefore, the obtained results mainly describe the relationship between flow-induced load redistribution and instantaneous diaphragm mechanical response. A comprehensive thermo-mechanical-chemical coupling framework, incorporating temperature-dependent constitutive models, chemical degradation mechanisms, and fatigue damage evolution, will be considered in future studies to further evaluate the long-term reliability and failure behavior of diaphragm pumps under complex operating conditions.
To evaluate the mechanical response of the diaphragm in the opposed balance pump under different flow conditions, 0.2Q, 0.4Q, 0.6Q, 0.8Q, 1.0Q, and 1.2Q were selected. The selected operating conditions were determined based on the typical operating characteristics of the opposed balance pump and were intended to cover low-load, normal operating, and overload states. The range from 0.2Q to 1.2Q enables a comprehensive evaluation of diaphragm mechanical behavior under different hydraulic excitation levels. Specifically, the 0.2Q condition represents a low-flow operating state with relatively weak hydraulic excitation, whereas the 1.2Q condition represents an overload condition beyond the rated flow rate, where intensified flow fluctuation and hydraulic impact may increase the fluid-induced loading on the diaphragm. It should be noted that this study mainly focuses on fluid–structure interaction characteristics and diaphragm mechanical response rather than cavitation performance. Therefore, the 0.2Q condition is used to represent a low hydraulic excitation state instead of a cavitation inception condition. The influence of NPSH-related cavitation phenomena requires further investigation under different suction conditions. Fluid–structure interaction simulations were conducted to analyze the stress–strain behavior of the diaphragm under the combined action of mechanical reciprocating motion and fluid-induced loads. Based on the one-way fluid–structure interaction calculations performed for each design condition, the maximum equivalent stress and maximum total deformation at different flow rates were obtained, as listed in Table 2. The maximum equivalent stress denotes the peak equivalent stress in the solid-domain model during the coupled calculation, while the average equivalent stress refers to the spatially averaged equivalent stress at the instant when the peak value occurs. The maximum total deformation and strain were evaluated using the same procedure.
Table 2.
Results of maximum equivalent stress and maximum total deformation of the diaphragm under different flow conditions.
Under various operating conditions, both the maximum equivalent stress and total deformation of the diaphragm show a nonlinear increase with increasing flow rate. Compared with the 0.2Q condition, the stress amplitude and total deformation under the 1.2Q condition increase by 2.07% and 2.33%, respectively. At the partload flow condition of 0.2Q, the mechanical driving force contributes approximately 68% of the total load, while the fluid-induced load remains relatively uniform and low in magnitude. Consequently, the diaphragm response is dominated by periodic elastic deformation. During one operating cycle, one primary stress peak of 22.014 MPa and one secondary stress peak of 11.224 MPa are observed, and the stress fluctuation remains within 15%. When the flow rate increases to 0.6Q, the contribution of the fluid-induced load rises to 43%, and local vortical structures are generated in the pump chamber, producing an additional deformation of 0.08 mm on the upstream surface of the diaphragm. The mechanical driving force and fluid-induced load interact synergistically, causing the peak stress to increase by 0.036% compared with that under the 0.2Q condition.
In this study, the phase difference is defined as the difference in cam angle between the peak diaphragm maximum principal stress and the peak hydraulic pressure in the pump chamber during one operating cycle. The calculation procedure is described as follows: the time-history data over a complete cam rotation cycle under the rated operating condition (1.0Q) are extracted. The cam angles corresponding to the maximum pump chamber pressure and the maximum diaphragm equivalent stress are then identified, and the angular difference between these two peak locations is calculated. Based on this method, a phase shift of approximately 15° is obtained.
For the multi-condition simulations, the extracted phase difference provides an intuitive indication of the asynchronous interaction between mechanical excitation and hydraulic excitation, and helps explain the occurrence of multiple stress peaks in the diaphragm response. Under the 1.2Q overload condition, the total diaphragm deformation is considered to consist of two superimposed components: (i) a periodic reciprocating deformation component that is synchronized with the cam rotational cycle, and (ii) a non-periodic high-frequency vibration component induced by valve impact, vortex shedding, and pressure pulsation. The value of 32% represents the estimated contribution of the non-periodic deformation amplitude to the total diaphragm deformation amplitude under this operating condition.
In future work, the complete time histories of diaphragm stress, chamber pressure, and deformation will be further analyzed. Fast Fourier transform (FFT) will be applied to obtain the corresponding frequency spectra, enabling clearer identification of periodic and aperiodic components. This improvement will provide a more comprehensive visualization of the phase difference calculation procedure and allow quantitative evaluation of the relative contributions of periodic and non-periodic deformation components.
At the design flow rate of 1.0Q, the sinusoidal driving force generated by the cam-linkage mechanism acts synergistically with the hydraulic pulsation, causing the composite load on the diaphragm to exhibit clear periodic characteristics. The phase difference between the primary stress peak of 22.157 MPa and the hydraulic pressure peak of 11.365 MPa remains stable at 15°. As a result of the fluid–structure interaction effect, the total deformation reaches 0.514 mm. When the flow rate further increases to the overload condition of 1.2Q, the contribution of the fluid-induced load increases to 58%, and the hydraulic impact induces local stress concentration in the diaphragm. The equivalent stress near the pump head reaches 22.459 MPa, which is 1.36% higher than that under the design condition. In addition, the fluid excitation force triggers high-frequency vibration of the diaphragm, leading to a total deformation of 0.526 mm, with non-periodic deformation accounting for 32%.
As illustrated in Figure 6, comparative analysis indicates that when the flow rate exceeds 0.8Q, fluid-induced loads gradually dominate the mechanical response of the diaphragm. Their coupling with the mechanical driving force results in three characteristic peaks in the stress-time curve, corresponding to hydraulic impact at the end of the suction stroke, mechanical compression during the middle stage of the discharge stroke, and the water hammer effect caused by umbrella-valve closure. This response is markedly different from the mechanically dominated stress behavior observed under partload flow conditions. The results further reveal that the opposed balance pump achieves a favorable mechanical-to-fluid load ratio of approximately 11:9 within the operating range of 0.6Q–0.8Q. The identification of this favorable operating range was based on a comprehensive evaluation of diaphragm stress, total deformation, and the relative contribution of mechanical and fluid-induced excitation rather than an independent optimization algorithm. Within this range, the diaphragm exhibits stable mechanical performance due to the balanced interaction between hydraulic loading and mechanical excitation. In this range, the diaphragm exhibits the most stable overall mechanical performance, which provides a theoretical basis for determining the safe operating range of the pump unit.
Figure 6.
Variations in diaphragm stress, maximum deformation and strain under various flow conditions.
3.3.2. Nonlinear Coupling Mechanism Between Hydraulic Excitation and Diaphragm Response
The nonlinear variation in diaphragm stress and deformation with flow rate is closely related to the transition of the dominant excitation mechanism in the coupled excitation system of the diaphragm. During the operation of the opposed balance pump, the diaphragm is subjected to two types of dynamic excitation: the periodic mechanical excitation generated by the cam-linkage mechanism and the hydraulic excitation induced by internal flow fluctuations. Therefore, the diaphragm response can be interpreted within a nonlinear dynamic framework as a forced vibration system subjected to coupled mechanical and hydraulic excitations:
where M, C, and K(x) represent the mass, damping, and nonlinear stiffness characteristics of the diaphragm system, respectively. Fm(t) represents the mechanical excitation generated by the reciprocating driving mechanism, while Ff(t) denotes the fluid-induced excitation transferred from the internal flow field.
The mechanical excitation remains relatively stable because it is mainly determined by the cam rotation characteristics. In contrast, the hydraulic excitation exhibits stronger nonlinear characteristics due to the combined effects of flow acceleration, vortex evolution, pressure pulsation, and valve impact. According to the momentum transfer relationship, the characteristic fluid-induced excitation can be related to the dynamic pressure term:
where ρ is the fluid density, v is the local flow velocity, and Ac represents the effective loading area. Since the flow velocity increases with increasing flow rate, the fluid-induced excitation does not increase linearly but exhibits nonlinear amplification under high-flow conditions.
At low flow rates, the hydraulic excitation remains relatively weak, and the diaphragm response is primarily controlled by the periodic mechanical excitation. Under this condition, the stress and deformation distributions exhibit stable periodic characteristics. With increasing flow rate, the enhancement of vortex structures and pressure fluctuations introduces additional hydraulic excitation, resulting in an increasing contribution of fluid-induced loading to the total diaphragm response.
This transition is consistent with the load contribution obtained from the fluid–structure interaction analysis. Under the low-flow condition of 0.2Q, the mechanical excitation contributes approximately 68% of the total load, indicating that the diaphragm response is mainly governed by the reciprocating driving mechanism. As the flow rate increases to 0.6Q, the contribution of fluid-induced loading increases, accounting for approximately 43% of the total load. At this stage, the interaction between hydraulic excitation and mechanical excitation becomes increasingly significant, and the diaphragm response gradually deviates from a purely mechanically dominated behavior. Under the overload condition of 1.2Q, the contribution of fluid-induced loading further increases to approximately 58%, indicating a gradual shift toward a fluid-dominated excitation regime. Therefore, the nonlinear variation in diaphragm stress and deformation is associated not only with the increase in hydraulic loading magnitude but also with the redistribution of excitation contributions during different operating conditions.
A transition region of the dominant excitation mechanism is identified around 0.8Q. When the flow rate is below this condition, mechanical excitation dominates the diaphragm dynamic response, and the hydraulic load mainly acts as a secondary disturbance. However, when the flow rate exceeds 0.8Q, the rapid increase in fluid-induced excitation caused by intensified vortex evolution, valve impact, and pressure pulsation gradually changes the response characteristics of the diaphragm. The coupling between mechanical excitation and hydraulic excitation leads to nonlinear variations in stress and deformation rather than a simple proportional increase with flow rate. Although the change in the maximum stress magnitude remains relatively limited under different operating conditions, the underlying response characteristics are significantly modified due to the increasing contribution of fluid-induced excitation. Therefore, the nonlinear behavior is mainly reflected in the transition of excitation dominance and the redistribution of dynamic loading characteristics, rather than an abrupt increase in stress amplitude.
This nonlinear coupling mechanism explains the observed variation in maximum equivalent stress and total deformation under different operating conditions. The nonlinear response is therefore attributed not only to the increase in hydraulic loading magnitude but also to the gradual redistribution of excitation contributions between mechanical and hydraulic loading. With increasing flow rate, the increasing influence of fluid-induced excitation modifies the dynamic loading characteristics of the diaphragm, resulting in nonlinear stress and deformation responses rather than a purely flow-rate-dependent variation.
3.4. Fluid–Structure Interaction Mechanism of Spatial Distribution of Diaphragm Stress Deformation
The stress distribution characteristics of the diaphragm are closely associated with the spatial distribution of fluid-induced loads transferred through the fluid–structure interface. According to the fluid–structure interaction mechanism, local pressure variations in the flow field are converted into distributed surface tractions acting on the diaphragm through the interface, thereby affecting its stress and deformation responses. Therefore, the stress concentration behavior within the diaphragm is determined not only by the overall magnitude of the fluid-induced loading but also by the spatial uniformity of the transferred interface loads.
Figure 7 presents the equivalent stress variation in the diaphragm in the opposed balance pump during one operating cycle under the design condition. The equivalent stress exhibits clear periodic fluctuations throughout the cycle, reflecting the periodic mechanical response of the diaphragm under coupled loading. Spatially, the stress distribution is highly non-uniform, with stress mainly concentrated near the diaphragm edge. The equivalent stress gradually decreases from the edge toward the center, while the central region maintains a relatively uniform stress distribution.
Figure 7.
Maximum equivalent stress and deformation diagram under design conditions. (a) Maximum equivalent stress. (b) Maximum total deformation.
The regions with relatively high equivalent stress are mainly concentrated along the connection edge between the diaphragm and the pump body, with the maximum stress appearing at the corner of the diaphragm edge. This phenomenon can be attributed to two main factors. First, during the reciprocating motion of the diaphragm, the edge region is subjected to stronger tensile and compressive loads, resulting in a higher local stress level. Second, the connection region contains geometric discontinuities and is continuously exposed to alternating loads during long-term operation. Consequently, stress concentration is more likely to occur in this region and is difficult to effectively release through material deformation. In contrast, low-stress regions are mainly observed in the central and near-central radial areas of the diaphragm. This is possibly because the central region undergoes relatively small displacement during diaphragm motion and experiences a more uniform stress distribution, resulting in lower material deformation and, therefore, lower equivalent stress.
The equivalent stress varies only slightly within a single cycle. Therefore, to examine the effect of operating parameters on the equivalent stress distribution, the diaphragm stress distribution of the opposed balance pump at the final time instant under different conditions was compared, as shown in Figure 8. The results show that the equivalent stress distributions under different conditions are highly consistent with that under the reference condition. Although the operating parameters significantly affect the internal flow field of the opposed balance pump, the resulting pressure fluctuations have only a limited influence on the equivalent stress distribution of the diaphragm. Further comparison indicates that, with increasing inlet-outlet pressure difference, the high-stress region in the central diaphragm area gradually expands, and the stress concentration at the diaphragm-pump body connection becomes more pronounced. When the pressure difference is relatively small, the diaphragm deformation is limited, and the tensile and bending loads remain low, leading to a relatively low stress level. As the pressure difference increases, the diaphragm deformation is enhanced; consequently, excessive stretching increases the stress in the central region, while the constrained edge connection region exhibits more severe stress concentration.
Figure 8.
The equivalent stress distribution at different times under design condition. (a) Distribution of equivalent stress in the diaphragm at t = 1/4T. (b) Distribution of equivalent stress in the diaphragm at t = 2/4T. (c) Distribution of equivalent stress in the diaphragm at t = 3/4T. (d) Distribution of equivalent stress in the diaphragm at t = 4/4T.
The high-pressure region in the pump chamber is mainly concentrated near the edge of the fluid–structure interface, continuously imposing reciprocating tensile and compressive loads on the diaphragm edge. Meanwhile, geometric discontinuities in this region further promote local stress concentration. Under the coupled action of fluid pressure pulsation and mechanical reciprocating motion, the concentrated stress is difficult to release through material deformation alone. In contrast, the near-central radial region of the diaphragm experiences relatively stable flow-field pressure and small reciprocating displacement. Therefore, this region exhibits a more uniform stress state and lower material deformation, forming a low-stress distribution zone across the central area. The deformation and strain distribution of the diaphragm under different flow conditions, as shown in Figure 9, further demonstrate the coupling relationship between flow-field parameters and structural deformation. The inlet-outlet pressure difference is small, and the fluid-induced impact load is relatively weak at 0.2Q. Consequently, the maximum deformation of the diaphragm is mainly concentrated in the central region. The strain exhibits a center-dominant distribution, with higher strain in the central area and lower strain near the edge. The overall strain level is low, indicating a relatively smooth dynamic load response of the structure.
Figure 9.
Changes in diaphragm deformation and strain of opposed balance pump structure under different flow conditions. (a) Diaphragm deformation diagram under 0.2Q flow condition. (b) Diaphragm strain diagram under 0.2Q flow condition. (c) Diaphragm deformation diagram under 0.4Q flow condition. (d) Diaphragm strain diagram under 0.4Q flow condition. (e) Diaphragm deformation diagram under 0.6Q flow condition. (f) Diaphragm strain diagram under 0.6Q flow condition. (g) Diaphragm deformation diagram under 0.8Q flow condition. (h) Diaphragm strain diagram under 0.8Q flow condition. (i) Diaphragm deformation diagram under 1.0Q flow condition. (j) Diaphragm strain diagram under 1.0Q flow condition. (k) Diaphragm deformation diagram under 1.2Q flow condition. (l) Diaphragm strain diagram under 1.2Q flow condition.
Figure 9 and Figure 10 respectively illustrate the diaphragm deformation and strain contours, as well as the quantitative deformation and strain data under different flow conditions. As shown in Figure 9a,b, the diaphragm exhibits relatively small overall deformation under the 0.2Q condition. The maximum deformation is mainly concentrated in the central region, whereas the edge deformation remains mild. The corresponding strain distribution shows a center-dominant pattern, with higher strain in the central region and lower strain near the edge. The low overall strain level indicates that the diaphragm is subjected to a weak dynamic load under partload flow conditions, thereby maintaining a relatively stable mechanical state. When the flow rate increases to 0.4Q, as shown in Figure 9c,d, the central deformation of the diaphragm increases significantly, and the deformation profile displays a distinct drum-shaped characteristic. The deformation gradient between the edge and the center becomes more pronounced, while the strain distribution range expands, with the high-strain region extending from the center toward the edge. The maximum strain increases by approximately 30% compared with that under the 0.2Q condition, suggesting that the diaphragm begins to bear a moderate periodic load and that local strain concentration should be considered.
Figure 10.
Distributions of diaphragm deformation magnitude and strain under different flow rates.
As shown in Figure 9e,f, the diaphragm deformation further increases under the 0.6Q condition, and the maximum deformation in the central region reaches approximately 2.5 times that under the 0.2Q condition. The deformation pattern presents an asymmetric distribution, which may be related to flow-field pressure fluctuations caused by the eccentric motion of the rotor. The strain distribution forms an annular high-strain zone located in the transition region between the diaphragm and the pump body. Compared with the 0.4Q condition, the strain increases by approximately 25%, indicating that this transition region may serve as a potential fatigue-sensitive area. When the flow rate increases to 0.8Q, as shown in Figure 9g,h, the overall diaphragm deformation exhibits more evident periodic fluctuations. The central deformation approaches the design limit, while local wrinkling appears near the edge region. Meanwhile, the annular high-strain zone in the transition region further expands, and the maximum strain increases by approximately 20% compared with the 0.6Q condition. The significantly increased strain variation rate suggests that the diaphragm undergoes a more complex mechanical response under high-frequency dynamic loading.
As shown in Figure 9i,j, the diaphragm deformation reaches the maximum design value under the design flow condition of 1.0Q. The central deformation is approximately four times that under the 0.2Q condition, and the deformation profile exhibits a symmetric parabolic shape. Slight stress concentration appears at the diaphragm-pump body connection. The strain distribution shows a double-peak feature in the central and transition regions, with the maximum strain increasing by approximately 15% compared with that under the 0.8Q condition. Meanwhile, the strain fluctuation frequency remains consistent with the rotor speed. These results indicate that the diaphragm maintains a stable working state under the design condition, although cumulative fatigue damage in the transition region should still be monitored. When the flow rate further increases to the overload condition of 1.2Q, as shown in Figure 9k,l, the central deformation exceeds the design threshold, and pronounced overstretching occurs near the edge region. The local deformation gradient exceeds the material yield limit, while the strain in the transition region increases sharply by approximately 40% compared with the 1.0Q condition. The emergence of local plastic strain characteristics indicates that the diaphragm has entered an unsafe operating state, and long-term operation under this condition may accelerate premature diaphragm failure.
Comprehensive analysis shows that the opposed balance pump exhibits superior dynamic characteristics under design flow conditions of 0.6Q–0.8Q, with uniform deformation and strain distribution within the allowable range of the material. The material properties of the diaphragm used in the structural analysis are summarized in Table 3. However, under partload flow conditions (<0.4Q), the diaphragm utilization rate is insufficient, while under overload flow conditions (>1.0Q), there is a significant structural risk.
Table 3.
Material properties of the diaphragm.
4. Structural Optimization Mechanisms for Fluid–Structure Interaction Characteristics
4.1. Effect of Symmetrical Radial Flow Channels on Fluid-Load Distribution
As shown in Figure 11, compared with the conventional diaphragm pump, the opposed balance pump employs a composite configuration consisting of symmetrical radial flow channels and a radial balance device. This configuration improves the fluid–structure interaction characteristics of the pump by optimizing the flow-channel layout, fluid-load distribution, and power-transmission path. In the conventional diaphragm pump, the single-sided inlet and outlet flow channels cause the incoming fluid to impinge on the pump chamber wall and diaphragm predominantly from one direction. At flow-channel bends and regions with abrupt cross-sectional variations, rapid changes in flow velocity, local pressure accumulation, and flow separation are readily induced, resulting in the formation of low-velocity stagnation zones and vortical structures. Consequently, the diaphragm is subjected to pronounced asymmetric fluid-induced loads, which promote eccentric deformation and local stress concentration. By contrast, the symmetrical radial flow channels allow the fluid to enter the pump chamber relatively uniformly from multiple directions, thereby redistributing fluid momentum, dispersing localized fluid impact loads, and reducing flow-field bias. As a result, the fluid–structure interaction load environment of the diaphragm is substantially improved.
Figure 11.
Symmetrical radial flow channels of the opposed balance pump.
4.2. Effect of the Radial Balance Device on the Mechanical Response of the Diaphragm
In terms of the diaphragm stress response, the mechanical driving force in the conventional diaphragm pump is transmitted primarily in the axial direction through the connecting rod, while the diaphragm is continuously subjected to unilateral fluid pressure. The combined action of the mechanical driving force and asymmetric fluid-induced loads promotes eccentric diaphragm deformation, resulting in pronounced stress concentration at the connection between the diaphragm and the connecting rod, as well as in the constrained edge region where the diaphragm contacts the pump body. By contrast, the opposed balance pump employs a radial balance device to dynamically regulate the fluid forces acting on both sides of the diaphragm. This configuration improves the balance of the fluid-induced loads, thereby suppressing eccentric deformation and alleviating stress concentration near the diaphragm edge.
As shown in Figure 12, the high-stress regions in the conventional diaphragm pump are mainly distributed in the central connection region between the diaphragm and the connecting rod and in the annular contact region between the diaphragm edge and the pump body. In the opposed balance pump, however, the high-stress region is largely confined to the central connection region, while the stress level near the diaphragm edge is markedly reduced. The simulation results show that the maximum equivalent stress of the diaphragm decreases from 10.931 MPa in the conventional diaphragm pump to 4.252 MPa in the opposed balance pump, corresponding to a reduction of approximately 60.8%. These results demonstrate that the radial balance device effectively suppresses diaphragm stress concentration and substantially improves the overall stress distribution.
Figure 12.
Cloud diagram of diaphragm stress distribution in the opposed balance pump under design conditions. (a) Contour plot of strain. (b) Maximum shear stress.
4.3. Effect of the Power-Transmission Path on Alternating Loads
From the perspective of the power-transmission path, the load in the conventional diaphragm pump is transmitted from the motor and reducer to the connecting rod and diaphragm through the cam mechanism. Consequently, the connection between the connecting rod and the diaphragm is required to withstand a highly concentrated mechanical load. Under the combined action of the mechanical driving force and hydraulic pulsation, pronounced local stress concentration is readily induced around the connecting-rod pin bore and in the central connection region of the diaphragm.
As shown in Figure 13, the opposed balance pump incorporates a radial balance device between the cam mechanism and the diaphragm. This device transfers part of the radial fluid-induced load directly to the pump body, thereby reducing the concentrated load acting on the connection between the connecting rod and the diaphragm. Moreover, the optimized power-transmission path weakens the local superposition of the mechanical load and hydraulic pulsation load within the diaphragm. The stress fluctuation amplitude during one reciprocating cycle decreases from 8.778 MPa in the conventional diaphragm pump to 4.252 MPa in the opposed balance pump. These results demonstrate that the radial balance device effectively suppresses the periodic alternating stress in the diaphragm and reduces the risk of fatigue damage during long-term operation.
Figure 13.
Power transmission path of the opposed balance pump.
In summary, the symmetrical radial flow channels, radial balance device, and optimized power-transmission path collectively improve the fluid–structure interaction characteristics of the opposed balance pump. Specifically, the symmetrical radial flow channels optimize the fluid-flow path and redistribute the fluid-induced loads within the pump chamber, while the radial balance device dynamically regulates the fluid forces acting on both sides of the diaphragm. Meanwhile, the optimized power-transmission path reduces the concentrated load acting on the connection between the connecting rod and the diaphragm. Through their synergistic effects, these structural features effectively suppress eccentric diaphragm deformation, alleviate local stress concentration, and reduce periodic stress fluctuations, thereby improving the mechanical stability and fatigue resistance of the diaphragm.
5. Experimental Verification of Fluid–Structure Interaction Characteristics of the Opposed Balance Pump Based on Umbrella Valve Flow-Field Analysis
To validate the local flow-field characteristics predicted by the fluid–structure interaction analysis of the opposed balance pump, PIV measurements of the flow field around the umbrella valve were compared with the corresponding numerical results. The analysis focused on the effects of umbrella valve opening on the local flow-field distribution, vortex evolution and pulsating-flow characteristics, the relationship between the flow field near the valve edge and diaphragm stress concentration, and the effects of the structural parameters of the umbrella-valve membrane on the local flow field. On this basis, the flow mechanisms revealed by the numerical simulations and their relationship with the mechanical response of the diaphragm were further examined. Conventional optical PIV provides a non-intrusive means of resolving velocity distributions and vortex evolution in optically accessible flow regions and is therefore suitable for the present measurements around the umbrella valve. Nevertheless, its measurement capability can be affected by optical accessibility, light scattering, refraction, and phase-interface interference, particularly in complex multiphase flows. In this regard, Ge et al. [68] developed a synchrotron X-ray-based particle image velocimetry technique capable of resolving multiphase streamflow while simultaneously obtaining velocity and void-fraction information. Compared with conventional optical PIV, X-ray-based PIV offers advantages for optically opaque or strongly scattering multiphase systems and provides enhanced capability for investigating internal flow structures under optically inaccessible conditions. In the present study, conventional PIV was selected because the primary objective was to characterize velocity distributions, vortex evolution, and local flow-field disturbances around the optically accessible umbrella-valve region. The consistency between the measured flow patterns and the numerical predictions provides experimental support for the identified flow mechanisms, while X-ray-based PIV provides a promising approach for future investigation of more complex multiphase flow systems. It should be noted that the PIV measurements in this study were mainly conducted around the umbrella valve region to characterize the transient flow characteristics, including velocity distribution and vortex evolution associated with hydraulic excitation generation. The objective of the PIV experiment was to validate the local flow-field behavior rather than directly measure diaphragm deformation. The accuracy of PIV measurements may be influenced by temporal resolution, spatial resolution, and image-processing procedures. In this study, the acquisition frequency, interrogation window size, and correlation parameters were appropriately selected to ensure reliable reconstruction of the transient velocity field and capture the main flow evolution characteristics during umbrella valve operation. Since the present study mainly focuses on the coupling mechanism between fluid-induced loading and diaphragm mechanical response, the diaphragm stress, deformation, and strain characteristics were evaluated through the fluid–structure interaction analysis. Direct experimental measurement of diaphragm surface strain was not included in the current work. Future studies will combine optical deformation measurement techniques with FSI simulations to achieve direct experimental validation of diaphragm deformation and strain responses. The schematic of the PIV experimental setup for the umbrella valve is shown in Figure 14.
Figure 14.
Schematic of the PIV experimental setup for the umbrella valve.
5.1. Effect of Umbrella Valve Opening on the Local Flow-Field Distribution Within the Pump
As shown in Figure 15, the internal pressure and velocity fields of the opposed balance pump show pronounced periodic fluctuations. The pressure is mainly concentrated near the edge of the fluid–structure interface, while a localized high-pressure region is readily formed near the umbrella valve opening. The peak velocity is primarily distributed in the flow channel close to the valve orifice. In addition, vortex structures in the pump chamber further enhance the non-uniformity of the flow field, accompanied by local backflow and sharp velocity-gradient variations. Experimental results for the umbrella valve opening demonstrate that, under constant-flow conditions, the valve opening increases approximately linearly with the driving voltage, resulting in a wider extreme velocity range. The velocity gradient in the valve-orifice region is significantly higher than that in the central region, which agrees well with the numerical simulation result that the parallel flow channel near the umbrella valve opening is the main peak-velocity region. As the inlet and outlet pressures vary, the flow-field morphology gradually changes from an approximately axisymmetric distribution to an asymmetric distribution. Under low-pressure conditions, the streamlines show obvious bending and vortex formation, corresponding to the velocity attenuation, local backflow, and vortex deflection observed during the return phase of the pump chamber. The localized high-pressure region near the valve orifice also verifies the pressure distribution pattern in which pressure accumulation occurs near the umbrella valve opening and gradually decreases along the flow direction. Furthermore, flow-field tests under different structural orientations show that when the flow direction is orthogonal to the valve-disc structure, the abrupt velocity variation near the valve edge and the recirculation-zone morphology become more pronounced. These results indicate that the geometric characteristics of the umbrella valve play an important role in inducing the non-uniform flow-field distribution inside the pump, which is consistent with the FSI simulation conclusion that vortex deflection intensifies flow-field non-uniformity.
Figure 15.
Flow-field distribution of the umbrella valve under a constant flow rate and different pressure conditions [62]. (a) 1-12-0-3. (b) 1-30-0-3.
5.2. Vortex Evolution and Flow-Pulsation Characteristics Around the Umbrella Valve
Non-uniform and periodically varying pressure and velocity fields within the pump chamber act on the diaphragm as fluid-induced loads. Their superposition with the mechanical reciprocating load causes the diaphragm stress and deformation to exhibit pronounced periodic fluctuations. As the flow rate increases, the contribution of the fluid-induced load to the total diaphragm load gradually increases. Hydraulic impact and transient pressure fluctuations associated with the opening and closing of the umbrella valve further alter the stress state of the diaphragm, resulting in multiple characteristic peaks in the stress-time curve.
As shown in Figure 16, the PIV results reveal pronounced vortex formation and evolution near the umbrella-valve orifice. With increasing flow rate, both the vortex intensity and spatial extent increase, thereby enhancing unsteady disturbances in the local flow field and generating sustained periodic fluid excitation. These experimental observations provide flow-field evidence supporting the numerically predicted mechanism by which fluid pulsations induce the alternating mechanical response of the diaphragm.
Figure 16.
Flow-field distribution of the umbrella valve under different operating conditions [62]. (a) 1-12-0-1. (b) 1-12-0-3. (c) 1-12-90-1. (d) 1-12-0-6. (e) 1-12-90-1. (f) 1-12-90-6.
With a further increase in flow rate, the vortices exhibit greater spatial displacement, accompanied by the formation of additional small-scale secondary vortices. Consequently, the local flow field becomes increasingly disordered, and the hydraulic impact is intensified. This trend is consistent with the numerical results showing an increased contribution of fluid-induced loads and more pronounced fluctuations in the mechanical response of the diaphragm under high-flow-rate conditions. Moreover, vortex displacement and secondary-vortex formation alter the local flow direction and fluid-load distribution, thereby providing a flow-mechanism explanation for the multiple characteristic peaks observed in the diaphragm stress-time curve when the flow rate exceeds 0.8Q.
5.3. Experimental Validation of Umbrella-Valve Vortex Effects on Diaphragm Stress Concentration
The diaphragm edge is susceptible to stress concentration because of high-pressure flow-field impact and geometric discontinuities. The diaphragm structural parameters and pump body configuration can both regulate the FSI matching characteristics. Symmetrical radial flow channels and the radial balance device effectively disperse fluid-induced impact loads and reduce alternating stress amplitudes. As shown in Figure 17, flow-field experiments at the umbrella valve edge confirm that sharp velocity and pressure variations occur near the valve edge due to flow-channel contraction and boundary-layer separation. This edge impact is transmitted to the diaphragm edge region, which supports the simulation conclusion that the diaphragm edge is prone to alternating fluid-induced loads and stress concentration. Comparative experiments on standard and thickened diaphragms demonstrate that diaphragm stiffness strongly influences vortex generation scale, flow-field disturbance intensity, and structural dynamic response. The high-stiffness thickened diaphragm suppresses vortex evolution and weakens pressure pulsations, confirming that rational matching of diaphragm structural parameters and pump body configuration can optimize the FSI load environment, reduce diaphragm alternating stress amplitude, and mitigate fatigue damage.
Figure 17.
Flow-field distribution of the umbrella valve under different operating conditions [62]. (a) 1-12-0-1. (b) 1-12-0-3.
5.4. Experimental Verification of the Influence of Diaphragm Structural Parameters on Vortex Evolution and Pump Dynamic Characteristics
Fluid–structure interaction simulations indicate that the opposed balance pump exhibits favorable mechanical performance within the flow-rate range of 0.6Q–0.8Q. The identification of this operating range was based on a comprehensive evaluation of diaphragm stress, deformation, and the relative contribution of mechanical and fluid-induced excitation rather than an independent optimization algorithm. Within this range, the diaphragm exhibits stable mechanical performance with balanced hydraulic and mechanical loading characteristics, characterized by a favorable mechanical-to-fluid load ratio, uniform diaphragm stress–strain distribution, and high operational stability. At low flow rates, the diaphragm response is dominated by mechanical driving forces, leading to insufficient diaphragm utilization. In contrast, under excessive flow-rate conditions, vortex distortion and strong fluid-induced impact loads increase the risk of structural failure. As shown in Figure 18, the umbrella valve vortex experiments show that, at medium flow rates, the vortex intensity is moderate, the flow field maintains good axisymmetry, and the pressure disturbance amplitude remains low, resulting in stable and controllable fluid-induced impact loads. This agrees well with the load-matching characteristics of the favorable operating range of 0.6Q–0.8Q. Under low-flow-rate conditions, the small umbrella valve opening, weak flow-field disturbance, and low contribution of fluid-induced loads correspond to the simulation results for 0.2Q–0.4Q, where the diaphragm is mechanically dominated and not fully utilized. When the flow rate exceeds 1.0Q, the system enters an overload state, accompanied by severe vortex distortion, a sharp increase in pipeline pressure loss, and enhanced asymmetric flow-field disturbance. These experimental observations reproduce the simulated high-flow-rate risk characteristics, including increased diaphragm stress concentration, excessive deformation, local plastic strain, and potential premature failure under long-term operation.
Figure 18.
Flow-field distributions of the standard and thickened diaphragms under different operating conditions [62]. (a) 1-12-0-1. (b) 2-12-0-1.
In summary, the umbrella valve, as the core component for unidirectional flow control in the opposed balance pump, exhibits characteristic opening response behavior, edge flow-field effects, vortex evolution patterns, and structural stiffness sensitivity. These features are confirmed by PIV flow-field experiments and further support the numerical simulation results concerning the internal flow-field distribution, diaphragm FSI response, optimal operating-condition matching, and structural configuration optimization mechanism. The good agreement between the simulation and experimental results demonstrates that the flow-field regulation behavior of the umbrella valve plays a critical role in determining the overall FSI matching state, diaphragm mechanical performance, and safe operating range of the opposed balance pump.
6. Conclusions
In this study, a one-way fluid–structure interaction method was adopted to systematically analyze the mechanical response of the diaphragm in an opposed balance pump under different flow-rate conditions. Six representative operating conditions, including 0.2Q, 0.4Q, 0.6Q, 0.8Q, 1.0Q, and 1.2Q, were considered in the numerical simulations. The internal flow-field characteristics of the conventional diaphragm pump and the opposed balance pump were comparatively investigated. The main findings are as follows:
- The mechanical response analysis of the diaphragm in the opposed balance pump indicates that both the maximum equivalent stress and total deformation increase nonlinearly with increasing flow rate. Compared with the 0.2Q condition, the stress amplitude and deformation under the 1.2Q condition increase by 2.07% and 2.33%, respectively. The flow rate strongly influences the dominant loading mode and stress–strain behavior of the diaphragm. At 0.2Q, the diaphragm response is dominated by the mechanical driving force, which accounts for 68% of the total load, resulting in periodic elastic deformation with limited stress fluctuation. At 0.6Q, the contribution of the fluid-induced load increases to 43%, and its interaction with the mechanical driving force causes additional deformation on the upstream surface. Under the design condition of 1.0Q, the mechanical driving force and hydraulic pulsation act synergistically, leading to a clearly periodic composite load, with a stable phase difference of 15° between the primary stress peak and the hydraulic pressure peak. Under the overload condition of 1.2Q, the contribution of the fluid-induced load further increases to 58%, causing local stress concentration and high-frequency diaphragm vibration, while non-periodic deformation accounts for 32%.
- In terms of equivalent stress distribution, geometric discontinuities and alternating loads make the diaphragm edge connection region prone to stress concentration, while the central region maintains a relatively low and uniform stress level. Although the operating parameters markedly affect the internal flow field, they exert only a limited influence on the overall equivalent stress distribution pattern. With increasing inlet–outlet pressure difference, the high-stress region in the diaphragm center expands, and edge stress concentration becomes more pronounced.
- The total deformation and strain analysis indicated that increasing flow rate significantly enhanced the central deformation of the diaphragm and caused the strain distribution to evolve from a center-dominant pattern to a bimodal pattern with peaks in the central and transition regions. At 0.2Q, the deformation and strain remained low and stable. At 0.4Q, the central deformation increased, and the strain region extended toward the edge. At 0.6Q, asymmetric deformation occurred, accompanied by the formation of an annular high-strain zone in the transition region. At 0.8Q, the deformation approached the design limit, and local wrinkling appeared near the edge. At 1.0Q, the deformation reached the design value, with the strain fluctuation frequency consistent with the rotor speed. At 1.2Q, the deformation exceeded the design threshold, and the transition-region strain increased sharply, accompanied by local plastic strain.
- The opposed balance pump exhibits the most stable diaphragm mechanical performance within the operating range of 0.6Q–0.8Q, where the mechanical-to-fluid load ratio reaches an optimal value of approximately 55:45. The symmetrical radial flow channels and optimized radial balance device effectively regulate internal flow organization and improve flow-field uniformity. Compared with the conventional pump, the low-velocity region decreases from 12.7% to 3.2%, while the velocity uniformity is improved by more than 60% and the maximum velocity gradient is reduced by 61.8%, thereby reducing hydraulic impact and energy loss. These results demonstrate that the radial balance structure improves diaphragm mechanical stability through fluid-induced load redistribution and provides guidance for structural optimization of opposed balance pumps. Future studies will further consider thermo-mechanical-chemical coupling effects, including temperature-dependent material degradation, chemical aging, and fatigue damage evolution, to improve the prediction of long-term diaphragm durability under complex operating conditions.
Author Contributions
Conceptualization, L.X. and H.C. (Hao Chang); methodology, H.C. (Hao Chang); formal analysis, L.X. and H.C. (Han Chai); investigation, L.X. and H.C. (Han Chai); data curation, L.X. and Z.Z.; writing—original draft preparation, L.X.; writing—review and editing, J.M. and Z.Z.; visualization, J.M.; supervision, G.P. All authors have read and agreed to the published version of the manuscript.
Funding
The work was sponsored by the National Natural Science Foundation of China (Grant No.52409114) and Shandong Province Key Research and Development Program (2024TSGC0620).
Data Availability Statement
The original contributions presented in this study are included in the article. Further inquiries can be directed to the corresponding author.
Conflicts of Interest
Author Jie Mei was employed by the company Liuzhou Suanwang Pump Manufacturing Co., Ltd. The remaining authors declare that the research was conducted in the absence of any commercial or financial relationships that could be construed as a potential conflict of interest.
Abbreviations
The following abbreviations are used in this manuscript:
| CFD | Computational Fluid Dynamics |
| PIV | Particle Image Velocimetry |
| UDF | User-Defined Function |
| FSI | Fluid–Structure Interaction |
References
- Li, D.; Qu, J.; Mo, Y.; Zhu, Q.; Zhu, D. Sizing Optimization of a Stand-Alone Multi-Energy Complementary Water Pumping System for Hose-Drawn Traveler in Typical Regions of China. Agriculture 2025, 15, 90. [Google Scholar] [CrossRef] [Scilit]
- Wu, X.; Di, M.; Tan, M.; Liu, H. Optimal Design of Photovoltaic Irrigation System with Different Nozzle Numbers. Appl. Eng. Agric. 2022, 38, 1079–1088. [Google Scholar] [CrossRef] [Scilit]
- Lin, L.; Duan, Y.; Aziz, T.; Shami, A.; Al-Asmari, F.; Mohamed, R.A.E.H.; Cui, H. Design of a peristaltic pump-based feeding device for achieving continuous production in food 3D printing. Innov. Food Sci. Emerg. Technol. 2025, 99, 104845. [Google Scholar] [CrossRef] [Scilit]
- Li, C.; Wu, J.; Pan, X.; Dou, H.; Zhao, X.; Gao, Y.; Yang, S.; Zhai, C. Design and Experiment of a Breakpoint Continuous Spraying System for Automatic-Guidance Boom Sprayers. Agriculture 2024, 14, 2203. [Google Scholar] [CrossRef] [Scilit]
- Zhang, R.; Cheng, Z.; Liang, Y.; Hu, X.; Shen, T.; Li, Y.; Han, Z.; Zhang, X.; Zou, X. A Novel Strategy for Accelerating Pumpable Ice Slurry Production with Ozone Micro-Nano Bubbles and Extending the Shelf Life of Larimichthys polyactis. Foods 2023, 12, 2206. [Google Scholar] [CrossRef] [Scilit] [PubMed]
- Hussain, A.; Kausar, T.; Aslam, J.; Quddoos, M.Y. Physical and Rheological Studies of Biscuits Developed with Different Replacement Levels of Pumpkin (Cucurbita maxima) Peel, Flesh, and Seed Powders. Foods 2023, 12, 3610. [Google Scholar]
- Tan, M.; Chen, C.; Fu, X.; Cui, F.J.; Zhang, H.B.; Ye, P.P.; Zhang, W.; Shu, X.Q.; Shi, J.C.; Chen, Z.W. Roasting treatments affect physicochemical, aroma and nutritional quality of oil. Food Compos. Anal. 2022, 114, 104806. [Google Scholar]
- Tan, M.; Zhang, H.B.; Ye, P.P.; Cui, F.J.; Chen, C.; Zhou, T.L.; Shi, J.C.; Zhang, W.; Shu, X.Q.; Chen, Z.W. Distinguishing strong, mellow and light fragrant rapeseed oils in China using physicochemical, nutritional and aroma profiles. Food Meas. Charact. 2023, 17, 1717–1728. [Google Scholar] [CrossRef] [Scilit]
- Xu, B.; Feng, M.; Chitrakar, B.; Wei, B.; Wang, B.; Zhou, C.; Ma, H.; Wang, B.; Chang, L.; Ren, G.; et al. Selection of drying techniques for Pingyin rose on the basis of physicochemical properties and volatile compounds retention. Food Chem. X 2022, 15, 100419. [Google Scholar]
- Rakibuzzaman, M.; Islam, M.D.; Zhou, L.; Iqbal, A.K.M.P. Numerical simulation of solid-liquid two-phase flow analysis of submersible drainage pumps. Irrig. Drain. 2025, 74, 2279–2294. [Google Scholar] [CrossRef] [Scilit]
- Han, Z.; Wang, K.; Dai, L.; Li, K.; Wang, X. Recent application of heat pump systems for environmental control in livestock facilities: A review. Agriculture 2024, 14, 2309. [Google Scholar] [CrossRef] [Scilit]
- Wang, Z.; Chen, Y.; Rakibuzzaman, M.; Agarwal, R.; Zhou, L. Numerical and experimental investigations of a double-suction pump with a middle spacer and a staggered impeller. Irrig. Drain. 2025, 74, 944–956. [Google Scholar] [CrossRef] [Scilit]
- Xu, M.; Wang, Z.; Niu, X.; Wang, Z.; Zou, W.; Zhai, C.; Li, S. Design and Research of Soil Disinfection Pesticide Application Control System Based on PSO-PID Algorithm. Agriculture 2026, 16, 481. [Google Scholar] [CrossRef] [Scilit]
- Li, H.; Li, C.; Chai, J.; Wang, L.; Yang, Z.; Yuan, Y.; Cheng, S. Design and Experimental Validation of a Weeding Device Integrating Weed Stem Damage and Targeted Herbicide Application. Agronomy 2026, 16, 151. [Google Scholar] [CrossRef] [Scilit]
- Yang, H.; Ran, Y.; Zhang, L.; Liu, D.; Jiang, Q.; Sun, Q. Effect of different kill-green and drying technology on the drying characteristics, bioactivities and volatile profile of Chrysanthemum morifolium leaves. Ind. Crops Prod. 2026, 239, 122554. [Google Scholar] [CrossRef] [Scilit]
- Song, X.; Li, H.; Chen, C.; Xia, H.; Zhang, Z.; Tang, P. Design and Experimental Testing of a Control System for a Solid-Fertilizer-Dissolving Device Based on Fuzzy PID. Agriculture 2022, 12, 1382. [Google Scholar] [CrossRef] [Scilit]
- Hua, L.; Li, H.; Jiang, Y. Axis-switching behavior of liquid jets issued from non-circular nozzles under low-intermediate pressure. Appl. Eng. Agric. 2021, 37, 367–378. [Google Scholar] [CrossRef] [Scilit]
- Chen, C.; Zhao, Y.; Liu, J.; Zhao, Y.; Hussain, Z.; Xie, R. Numerical simulation of the flow field stabilization of a pressure-regulating device. Agriculture 2024, 14, 1873. [Google Scholar] [CrossRef] [Scilit]
- Qureshi, W.A.; Xiang, Q.; Tunio, M.H.; Qureshi, J.A.; Mosha, A.H.; Gao, J.; Elsherbiny, O. Optimization of inner flow dynamics in aeration impact sprinklers through CFD simulation, theoretical analysis, and experimental validation of stabilizer design for enhanced hydraulic performance. Agric. Water Manag. 2025, 312, 109463. [Google Scholar] [CrossRef] [Scilit]
- Yang, F.; Li, H.; Jiang, Y. A review of pressure regulation technologies for irrigation pipeline systems. Agriculture 2025, 15, 1528. [Google Scholar] [CrossRef] [Scilit]
- Chen, R.; Li, H.; Wang, J.; Chen, C. Effects of Plate Structure and Nozzle Diameter on Hydraulic Performance of Fixed Spray Plate Sprinklers at Low Working Pressures. Trans. ASABE 2021, 64, 231–242. [Google Scholar] [CrossRef] [Scilit]
- Pan, X.; Jiang, Y.; Li, H.; Zhou, X. Hydraulic performance of the rotational damping sprinkler: Analysis of the force acting on diffuser tooth I. Irrig. Drain. 2024, 73, 29. [Google Scholar] [CrossRef] [Scilit]
- Tang, P.; Li, H.; Issaka, Z.; Chen, C. Impact Forces on the Drive Spoon of a Large Cannon Irrigation Sprinkler: Simple Theory, CFD Numerical Simulation and Validation. Biosyst. Eng. 2017, 159, 1–9. [Google Scholar] [CrossRef] [Scilit]
- Li, H.; Pan, X.; Jiang, Y.; Zhou, X. Optimising and Analysis of the Hydraulic Performance of a Water Dispersion Needle Sprinkler Using RF-NSGA II and CFD. Biosyst. Eng. 2025, 254, 104113. [Google Scholar] [CrossRef] [Scilit]
- Ahmad, F.; Qiu, B.; Ding, Q.; Ding, W.; Khan, Z.M.; Shoaib, M.; Chandio, F.A.; Rahim, A.; Khaliq, A. Discrete element method simulation of disc type furrow openers in paddy soil. Int. J. Agric. Biol. Eng. 2020, 13, 103–110. [Google Scholar] [CrossRef] [Scilit]
- Liao, C.; Chen, J.; Geng, F.; Tang, X. Airflow basin structure numerical optimisation analysis and suction nozzle characteristics experimental study of vacuum-vibration tray precision seeder. J. Agric. Eng. 2022, 53, 1294. [Google Scholar] [CrossRef] [Scilit]
- Chai, X.; Hu, J.; Ma, T.; Liu, P.; Shi, M.; Zhu, L.; Zhang, M.; Xu, L. Construction and characteristic analysis of dynamic stress coupling simulation models for the attitude-adjustable chassis of a combine harvester. Agronomy 2024, 14, 1874. [Google Scholar] [CrossRef] [Scilit]
- Zhang, B.; Bai, T.; Wu, G.; Wang, H.; Zhu, Q.; Zhang, G.; Meng, Z.; Wen, C. Fatigue analysis of shovel body based on tractor subsoiling operation measured data. Agriculture 2024, 14, 1604. [Google Scholar] [CrossRef] [Scilit]
- Wu, B. CFD Study of Submersible Mixers in Anaerobic Digesters. Trans. ASABE 2017, 60, 275–282. [Google Scholar] [CrossRef] [Scilit]
- Hu, Y.; Chen, Y.; Wei, W.; Hu, Z.; Li, P. Optimization Design of Spray Cooling Fan Based on CFD Simulation and Field Experiment for Horticultural Crops. Agriculture 2021, 11, 566. [Google Scholar] [CrossRef] [Scilit]
- Chen, X.; Hou, T.; Liu, S.; Guo, Y.; Hu, J.; Xu, G.; Ma, G.; Liu, W. Design of a Micro-Plant Factory Using a Validated CFD Model. Agriculture 2024, 14, 2227. [Google Scholar] [CrossRef] [Scilit]
- Ding, B.; Liang, Z.; Qi, Y.; Ye, Z.; Zhou, J. Improving Cleaning Performance of Rice Combine Harvesters by DEM–CFD Coupling Technology. Agriculture 2022, 12, 1457. [Google Scholar] [CrossRef] [Scilit]
- Wei, C.; Xu, L.; Wang, J.; Li, Y. Inertial Force Balance and ADAMS Simulation of the Oscillating Sieve and Return Pan of a Rice Combine Harvester. Int. J. Agric. Biol. Eng. 2018, 11, 129–137. [Google Scholar] [CrossRef] [Scilit]
- Ni, J.; Dong, J.; Ullah, I.; Mao, H. CFD Simulation of Sucrose Flow Field in the Stem of Greenhouse Tomato Seedling. Int. J. Agric. Biol. Eng. 2022, 15, 111–115. [Google Scholar] [CrossRef] [Scilit]
- El–Emam, M.A.; Zhou, L.; Omara, A.I. Predicting the performance of aero-type cyclone separators with different spiral inlets under macroscopic bio-granular flow using CFD–DEM modelling. Biosyst. Eng. 2023, 233, 125–150. [Google Scholar] [CrossRef] [Scilit]
- Ji, G.; Chang, H.; He, H.; Peng, G.; Zhou, L.; Shi, W.; Huang, R. The investigation of flow mechanism and energy dissipation in multi-stage pump impeller based on energy balance theory. Energy 2026, 344, 140105. [Google Scholar] [CrossRef] [Scilit]
- Ji, G.; Chang, H.; Wang, Z.; Ji, Y.; Shi, W.; Peng, G. Energy-loss decomposition and efficiency optimization of volute splitters in centrifugal pumps via a diagnosis-informed design framework. Energy Convers. Manag. 2026, 369, 122056. [Google Scholar] [CrossRef] [Scilit]
- Chang, H.; Tang, G.; Zhou, L.; Peng, G.; Shi, W.; Huang, R. Investigation of energy dissipation mechanisms and unsteady flow characteristics of a cooling pump based on sweeping jet inflow. Energy Convers. Manag. 2026, 351, 120959. [Google Scholar] [CrossRef] [Scilit]
- Chang, H.; Wang, Z.; Peng, G.; Shi, W.; Lin, R.; Zhou, L. Role of wall roughness on energy dissipation and vortex dynamics in self-priming centrifugal pump: A study via entropy generation and Liutex vortex identification. Energy 2025, 337, 138733. [Google Scholar] [CrossRef] [Scilit]
- Chang, H.; Yang, J.; Wang, Z.; Peng, G.; Lin, R.; Lou, Y.; Shi, W.; Zhou, L. Efficiency optimization of energy storage centrifugal pump by using energy balance equation and non-dominated sorting genetic algorithms-II. J. Energy Storage 2025, 114, 115817. [Google Scholar] [CrossRef] [Scilit]
- Chang, H.; Wang, Z.; Peng, G.; Zhou, L.; Shi, W. A comprehensive assessment of energy loss and nonlinear pressure pulsations caused by local roughness in self-priming pump. Appl. Therm. Eng. 2026, 295, 130685. [Google Scholar] [CrossRef] [Scilit]
- Li, X.; Wang, Z.; Chang, H.; Zhou, L.; Huang, R.; Shi, W.; Peng, G. Impact of blade tip clearance on vortex dynamics and energy loss in submersible slurry pumps. Phys. Fluids 2026, 38, 057120. [Google Scholar] [CrossRef] [Scilit]
- Ranawat, N.S.; Miglani, A.; Kankar, P.K. Performance of centrifugal pump over a range of composite wear ring clearance. J. Braz. Soc. Mech. Sci. Eng. 2022, 44, 524. [Google Scholar] [CrossRef] [Scilit]
- Gu, Y.; Yang, A.; Bian, J.; Shariff, A.M.; Stephen, C.; Wang, Q.; Cheng, L. Investigation of energy performance and unsteady flow characteristics of a multi-stage centrifugal pump under various seal wear conditions for renewable energy pumping systems. Renew. Energy 2025, 256, 123998. [Google Scholar] [CrossRef] [Scilit]
- Dong, M.; Hong, S.; Han, Y.; Si, Q.; Hu, X. Erosion-induced wear and failure analysis of protective coatings in centrifugal pumps operating in southern Xinjiang’s sediment-rich water. Powder Technol. 2026, 476, 122428. [Google Scholar] [CrossRef] [Scilit]
- Khan, R.; Ahmad, M.; Ali, S.; Qahtani, F.; Talha, T.; Alqaed, S.; Mustafa, J.; Safdar, S.O. Failure analysis of a centrifugal pump impeller in erosive flow conditions. Eng. Fail. Anal. 2026, 187, 110584. [Google Scholar] [CrossRef] [Scilit]
- Zhao, Z.; Shi, J.; Zhong, Q.; Luo, Y.; Qian, Z. Sediment erosion on the runner of a pump turbine in turbine mode. J. Energy Storage 2026, 141, 119273. [Google Scholar] [CrossRef] [Scilit]
- El-Emam, M.A.; Yasser, E.; Shi, W.; Zhou, L. Characterization of particle-liquid two-phase flow for predicting wear evolution in a slurry centrifugal pump using CFD-DEM/CGDEM simulations. Powder Technol. 2025, 470, 122040. [Google Scholar] [CrossRef] [Scilit]
- Yasser, E.; Zhou, L.; El-Emam, M.A. Failure mechanism analysis of erosion in centrifugal pumps attributed to particle morphology: A coupled CFD-DEM-ANN approach. Eng. Fail. Anal. 2025, 181, 109957. [Google Scholar] [CrossRef] [Scilit]
- Wang, Y.; Wang, X.; Chen, J.; Li, G.; Liu, H.; Xiong, W. Numerical simulation of the influence of mixed sand on erosion characteristics of centrifugal pump. Eng. Comput. 2022, 39, 2053–2080. [Google Scholar] [CrossRef] [Scilit]
- Pan, J.; Pan, Y.; Liu, Q.; Yang, S.; Tao, R.; Zhu, D.; Xiao, R. FED evaluation in a small double-suction reversible pump turbine considering sediment erosion. J. Energy Storage 2024, 76, 109549. [Google Scholar] [CrossRef] [Scilit]
- Lu, F.; Zhou, Y.; Qiao, G.; Zhu, J.; Gong, G.; Yang, H.; Han, D. A high-pressure, high-flow piezoelectric ultrasonic micropump with a novel diaphragm check valve. Sens. Actuators A Phys. 2026, 402, 117582. [Google Scholar] [CrossRef] [Scilit]
- Menéndez-Blanco, A.; Fernández Oro, J.M.; Meana-Fernández, A. Unsteady three-dimensional modeling of the fluid-structure interaction in the check valves of diaphragm volumetric pumps. J. Fluids Struct. 2019, 90, 432–449. [Google Scholar] [CrossRef] [Scilit]
- Wu, S.; Wei, X. A new integrated numerical modeling approach toward piston diaphragm pump simulation: Three-dimensional model simplification and characteristic analysis. Adv. Mech. Eng. 2019, 11, 1687814019845955. [Google Scholar] [CrossRef] [Scilit]
- Yang, S.D.; Shi, Y.C.; Pan, X.W.; Liu, Y.S. Theoretical and experimental study on flow characteristics of a diaphragm pump for urea-SCR systems. Int. J. Automot. Technol. 2019, 20, 835–844. [Google Scholar] [CrossRef] [Scilit]
- Cai, J.-C.; Chen, H.-J.; Brazhenko, V.; Gu, Y.-H. Study of the Hydrodynamic Unsteady Flow Inside a Centrifugal Fan and Its Downstream Pipe Using Detached Eddy Simulation. Sustainability 2021, 13, 5113. [Google Scholar] [CrossRef] [Scilit]
- Brazhenko, V.; Qiu, Y.; Mochalin, I.; Zhu, G.; Cai, J.-C.; Wang, D. Study of Hydraulic Oil Filtration Process from Solid Admixtures Using Rotating Perforated Cylinder. Taiwan Inst. Chem. Eng. 2022, 141, 104578. [Google Scholar] [CrossRef] [Scilit]
- Brazhenko, V.; Mochalin, I.; Cai, J.-C. DIY-PIV System for Poiseuille Flow Investigation in Undergraduate Fluid Mechanics Course. Int. Mech. Eng. Educ. 2024, 53, 1–18. [Google Scholar] [CrossRef] [Scilit]
- Brazhenko, V.; Cai, J.-C.; Fang, Y. Utilizing a Transparent Model of a Semi-Direct Acting Water Solenoid Valve to Visualize Diaphragm Displacement and Apply Resulting Data for CFD Analysis. Water 2024, 16, 3385. [Google Scholar] [CrossRef] [Scilit]
- Han, S.; Wang, J.; Li, X.; Xie, T.; Li, Y.; Kang, Y. Optimization design of bolts for check valve end cover of diaphragm pump based on fluid-structure interaction. J. Drain. Irrig. Mach. Eng. 2025, 43, 463–469. [Google Scholar]
- Han, S.; Shen, Z.; Li, Y.; Xie, T. Dynamic characteristics and valve hysteresis of diaphragm pump in slurry transportation. J. Drain. Irrig. Mach. Eng. 2025, 43, 558–564. [Google Scholar]
- Peng, G.; Chai, H.; Liu, C.; Zhao, K.; Zhang, J.; Chang, H. Numerical and experimental analysis of internal flow characteristics of four-way opposing diaphragm pump. Water 2025, 17, 3094. [Google Scholar] [CrossRef] [Scilit]
- Huang, Z.; Ren, L.; Liu, J.; Chen, S.; Qian, Z.; Wu, J.; Li, Y.; Ren, L. Numerical investigation of fluid-structure interaction in valved piezoelectric pump by offset in solid meshes. Phys. Fluids 2025, 37, 022039. [Google Scholar] [CrossRef] [Scilit]
- Pan, X.W.; Pan, Z.Y.; Huang, D.; Shen, Z.H. Fluid structure interaction dynamic analysis of a mixed-flow waterjet pump. IOP Conf. Ser. Mater. Sci. Eng. 2013, 52, 072013. [Google Scholar] [CrossRef] [Scilit]
- Ling, X.Q.; Zhang, W.; Chen, Y. Numerical simulation of suction valve internal flow field of large-scale diaphragm pump fluid end based on ADINA. Adv. Mater. Res. 2013, 706–708, 1458–1461. [Google Scholar] [CrossRef] [Scilit]
- Ge, M.; Sun, C.; Zhang, G.; Coutier-Delgosha, O.; Fan, D. Combined suppression effects on hydrodynamic cavitation performance in Venturi-type reactor for process intensification. Ultrason. Sonochem. 2022, 86, 106035. [Google Scholar] [CrossRef] [Scilit] [PubMed]
- Ge, M.; Zhang, G.; Petkovšek, M.; Long, K.; Coutier-Delgosha, O. Intensity and regimes changing of hydrodynamic cavitation considering temperature effects. Clean. Prod. 2022, 338, 130470. [Google Scholar] [CrossRef] [Scilit]
- Ge, M.; Sun, C.; Zhang, X.; Coutier-Delgosha, O.; Zhang, G. Synchrotron X-ray based particle image velocimetry to measure multiphase streamflow and densitometry. Radiat. Phys. Chem. 2022, 200, 110395. [Google Scholar] [CrossRef] [Scilit]
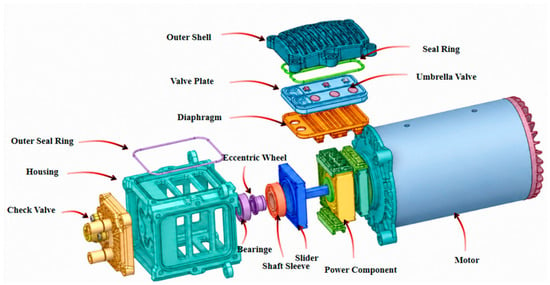
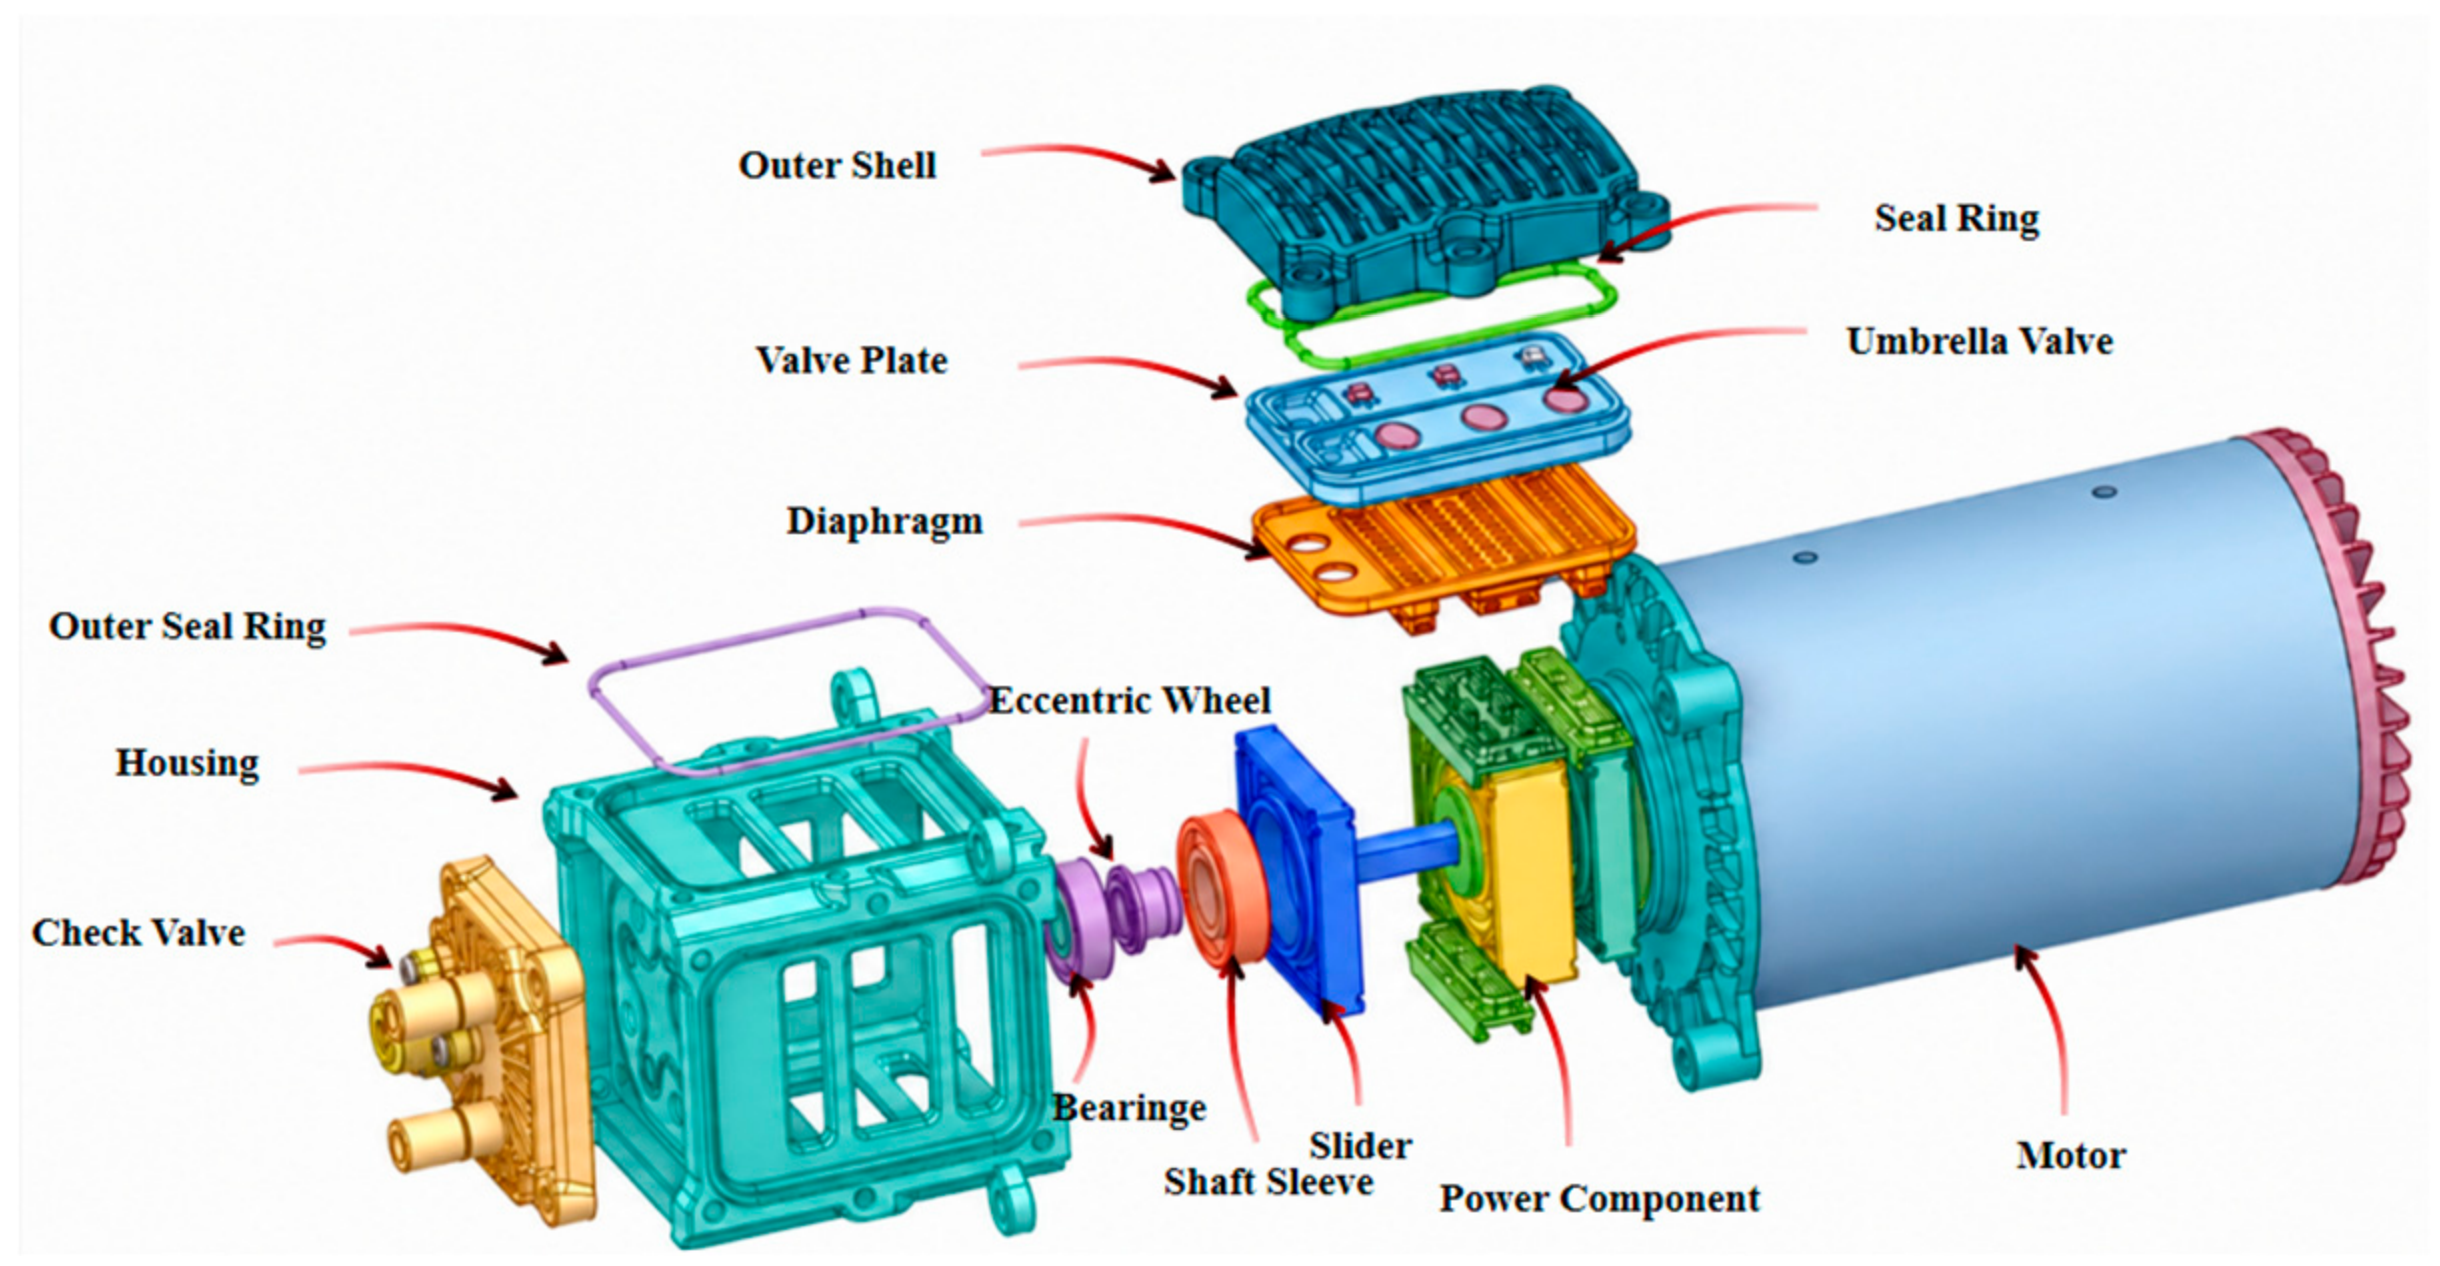
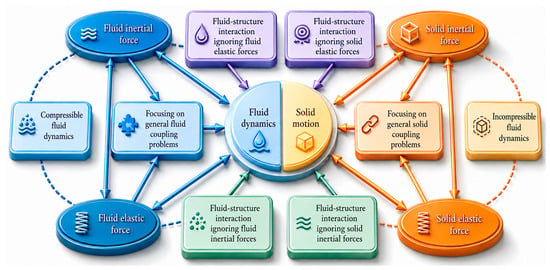
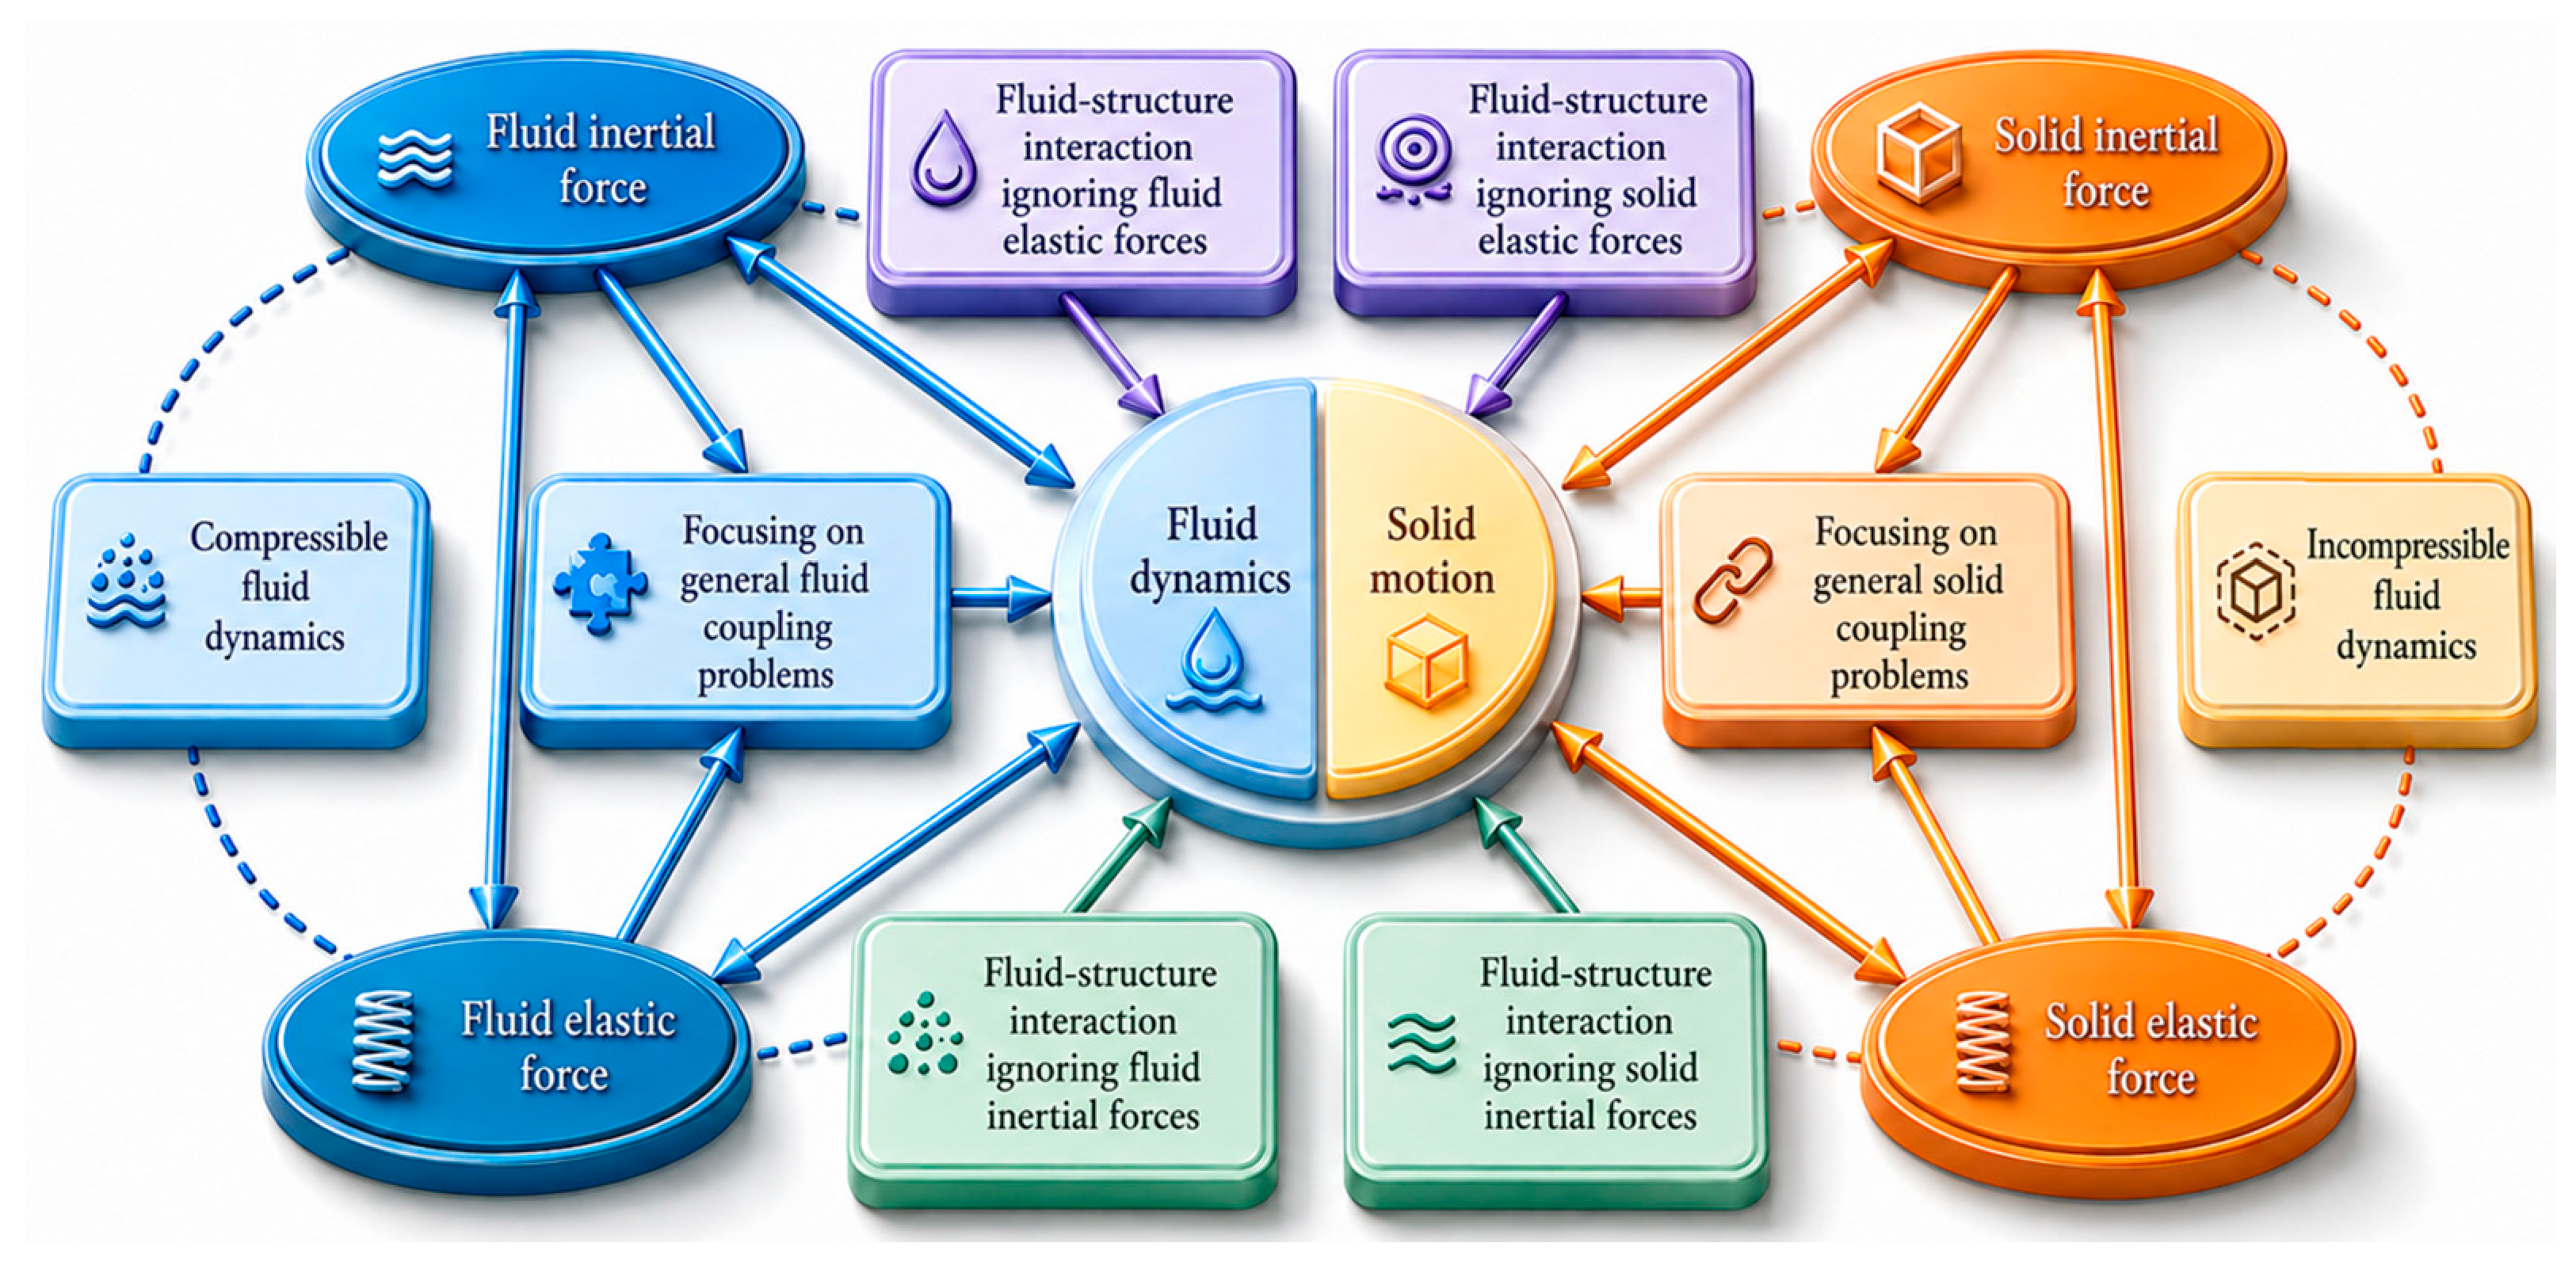
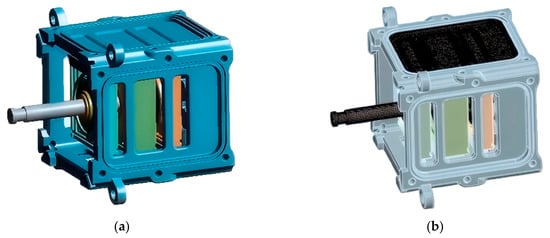
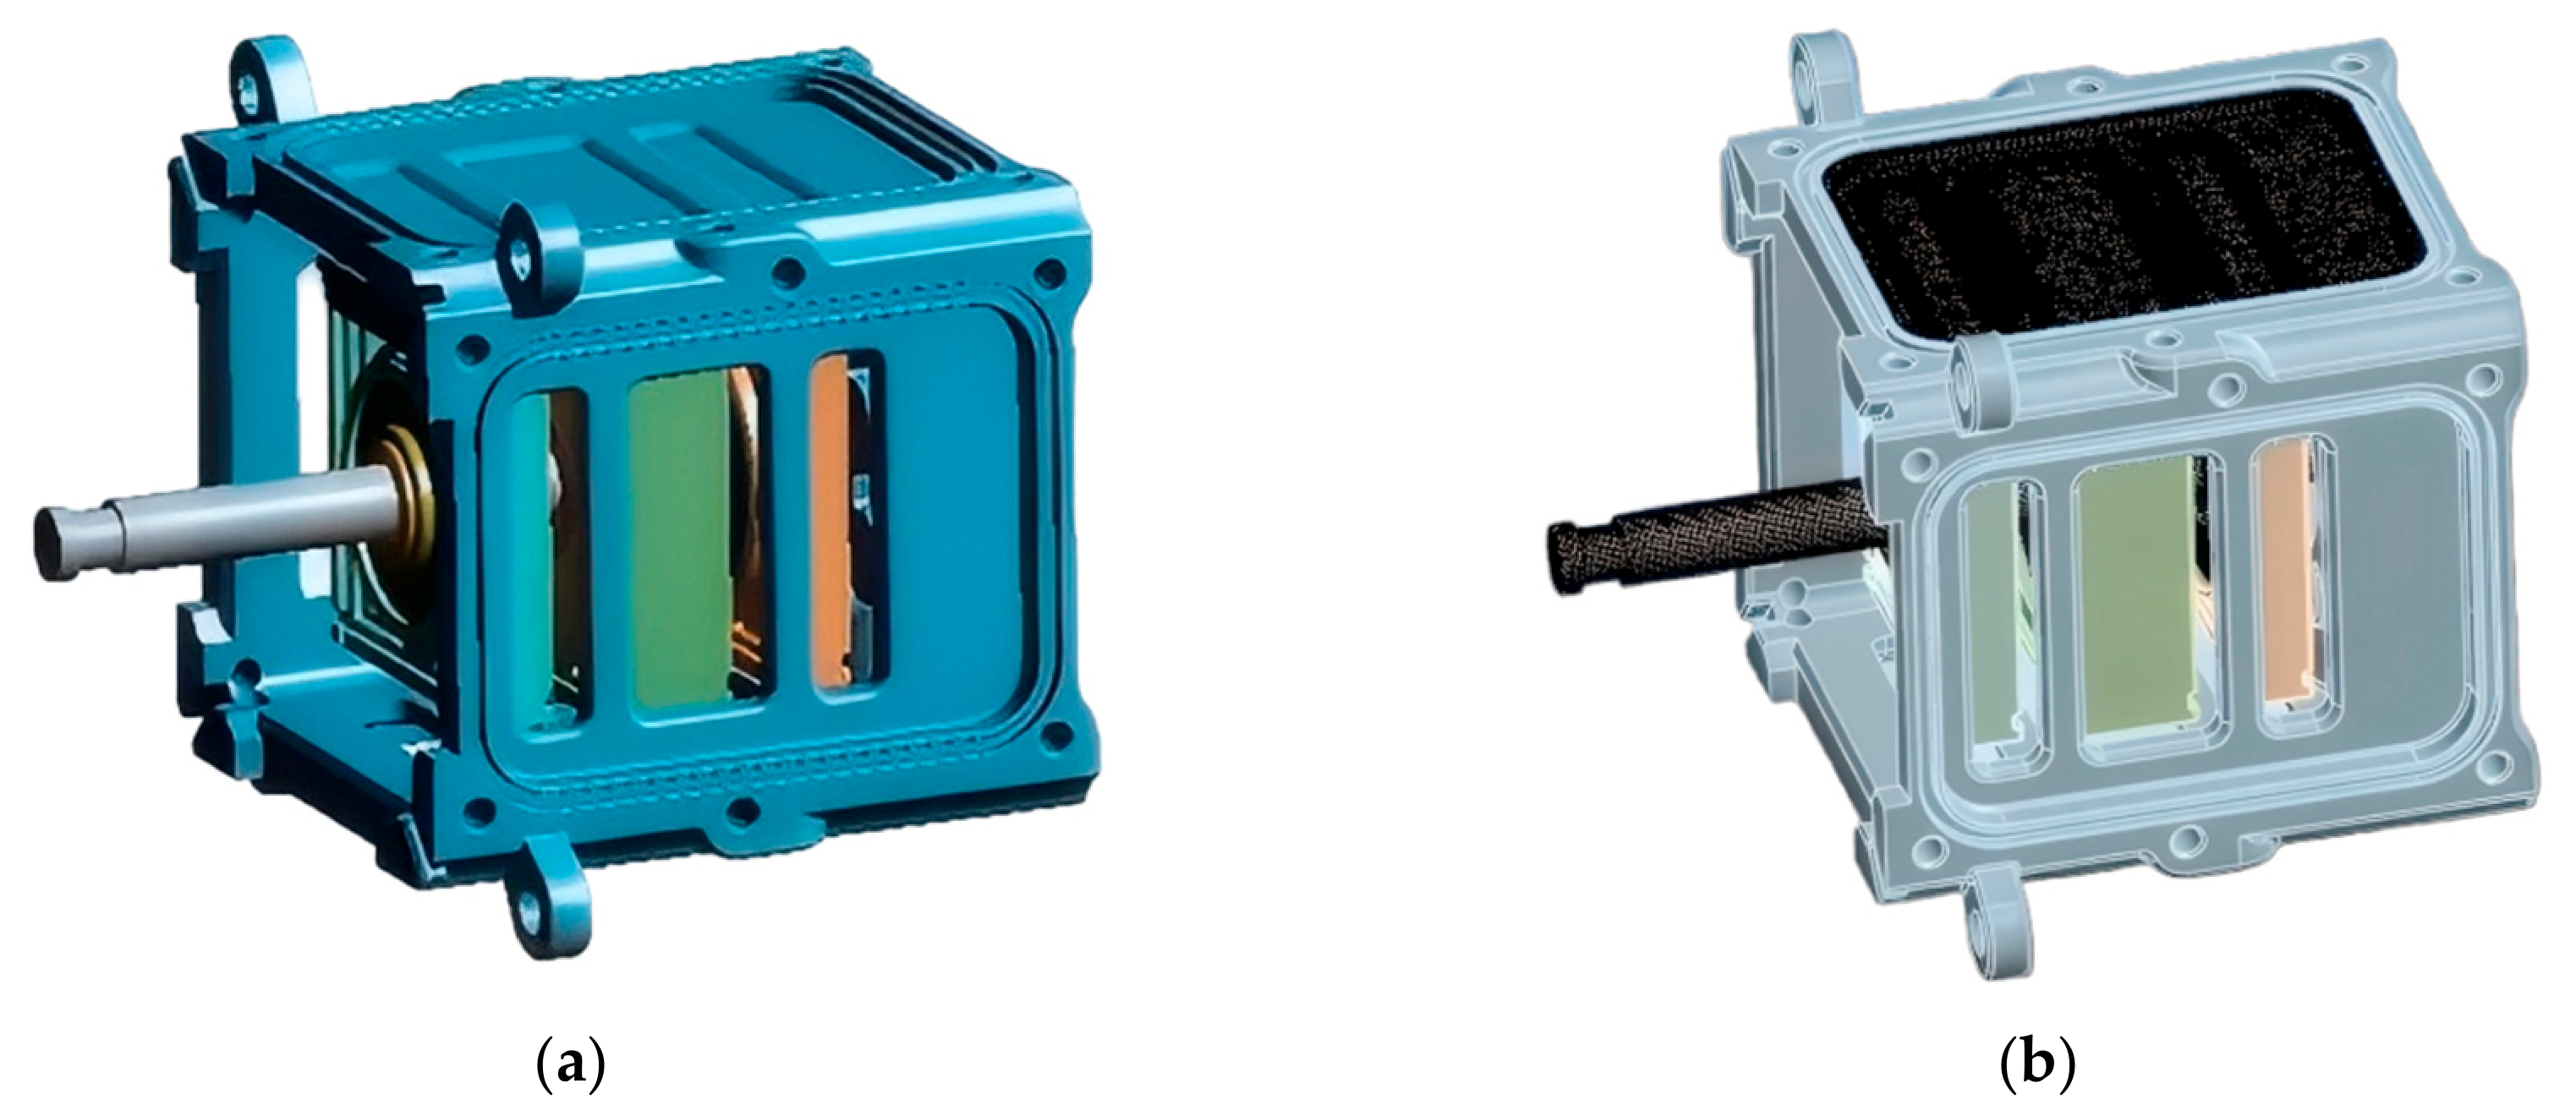
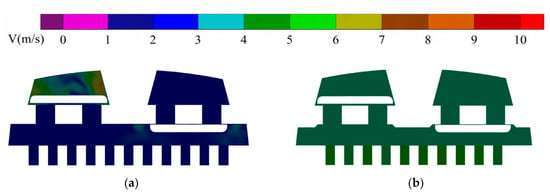
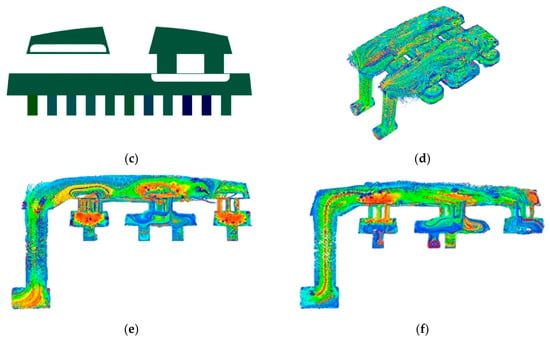
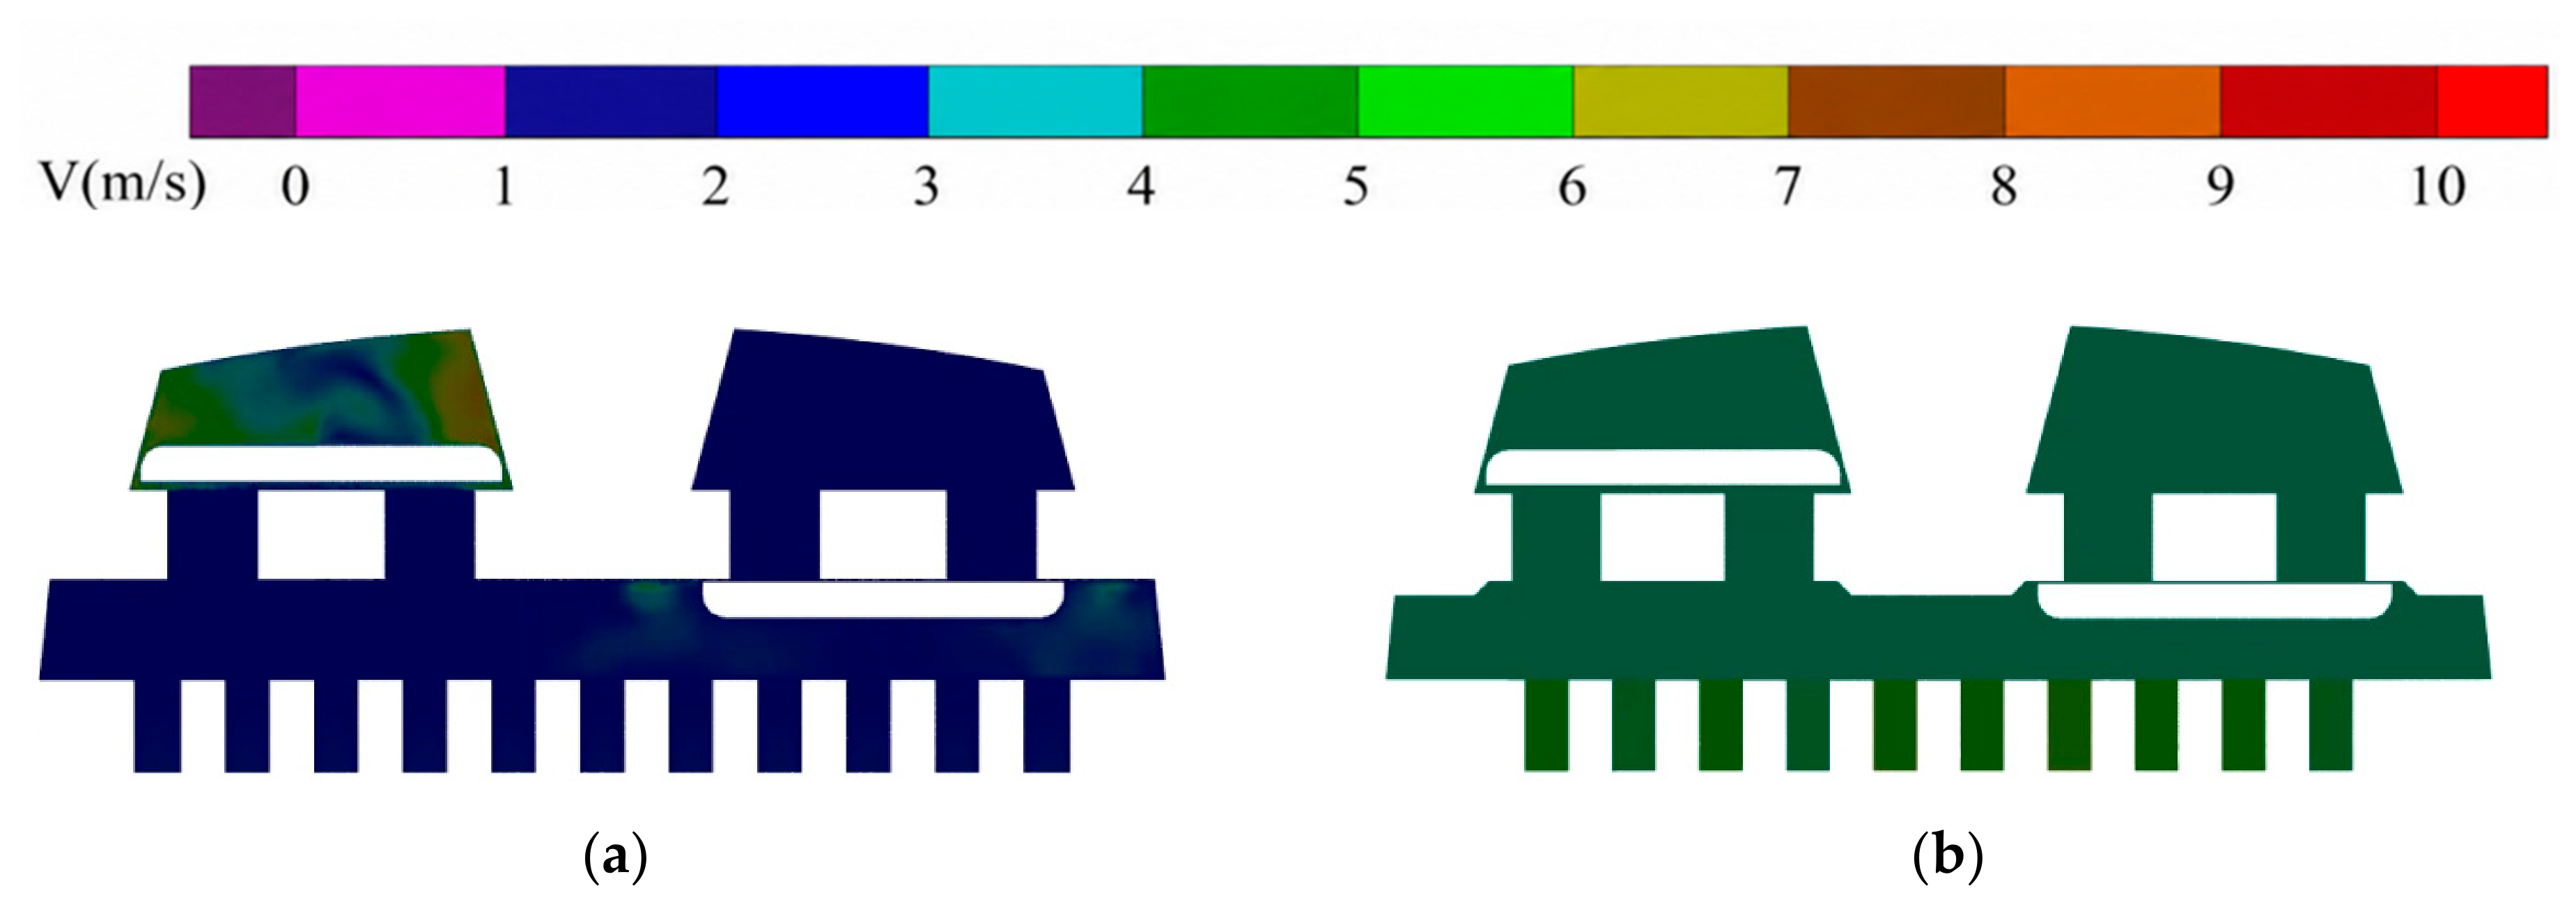
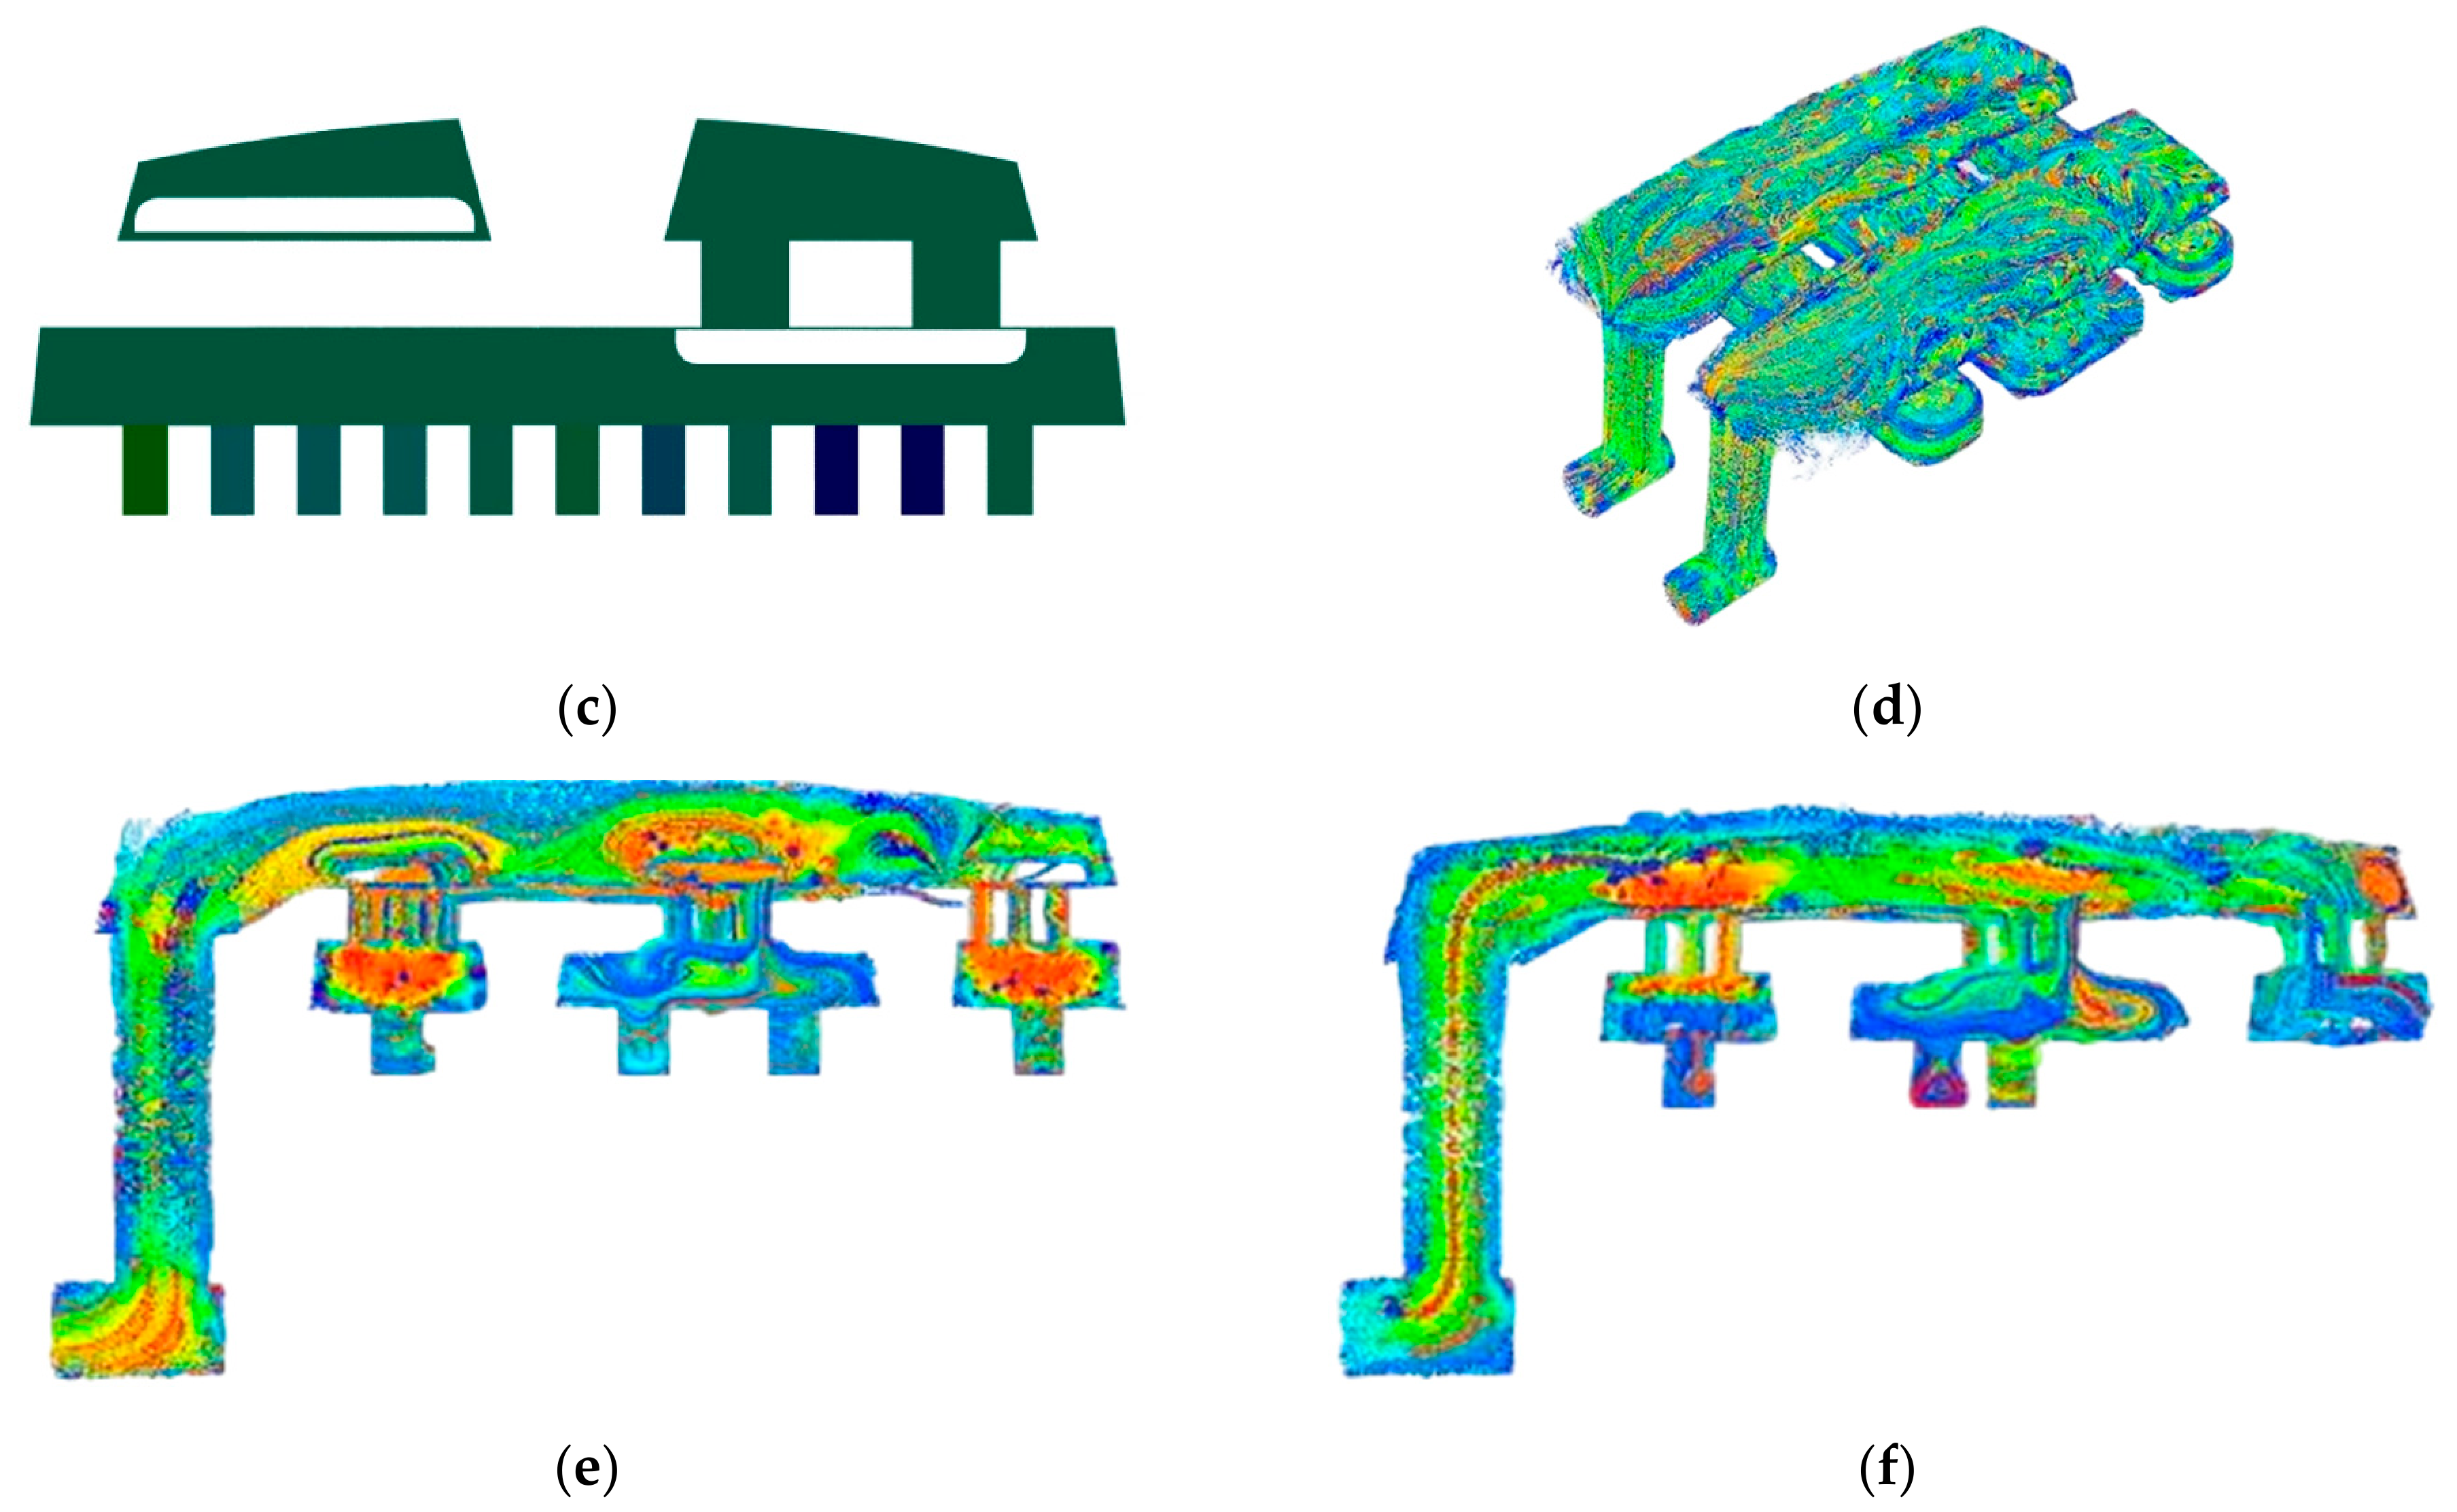
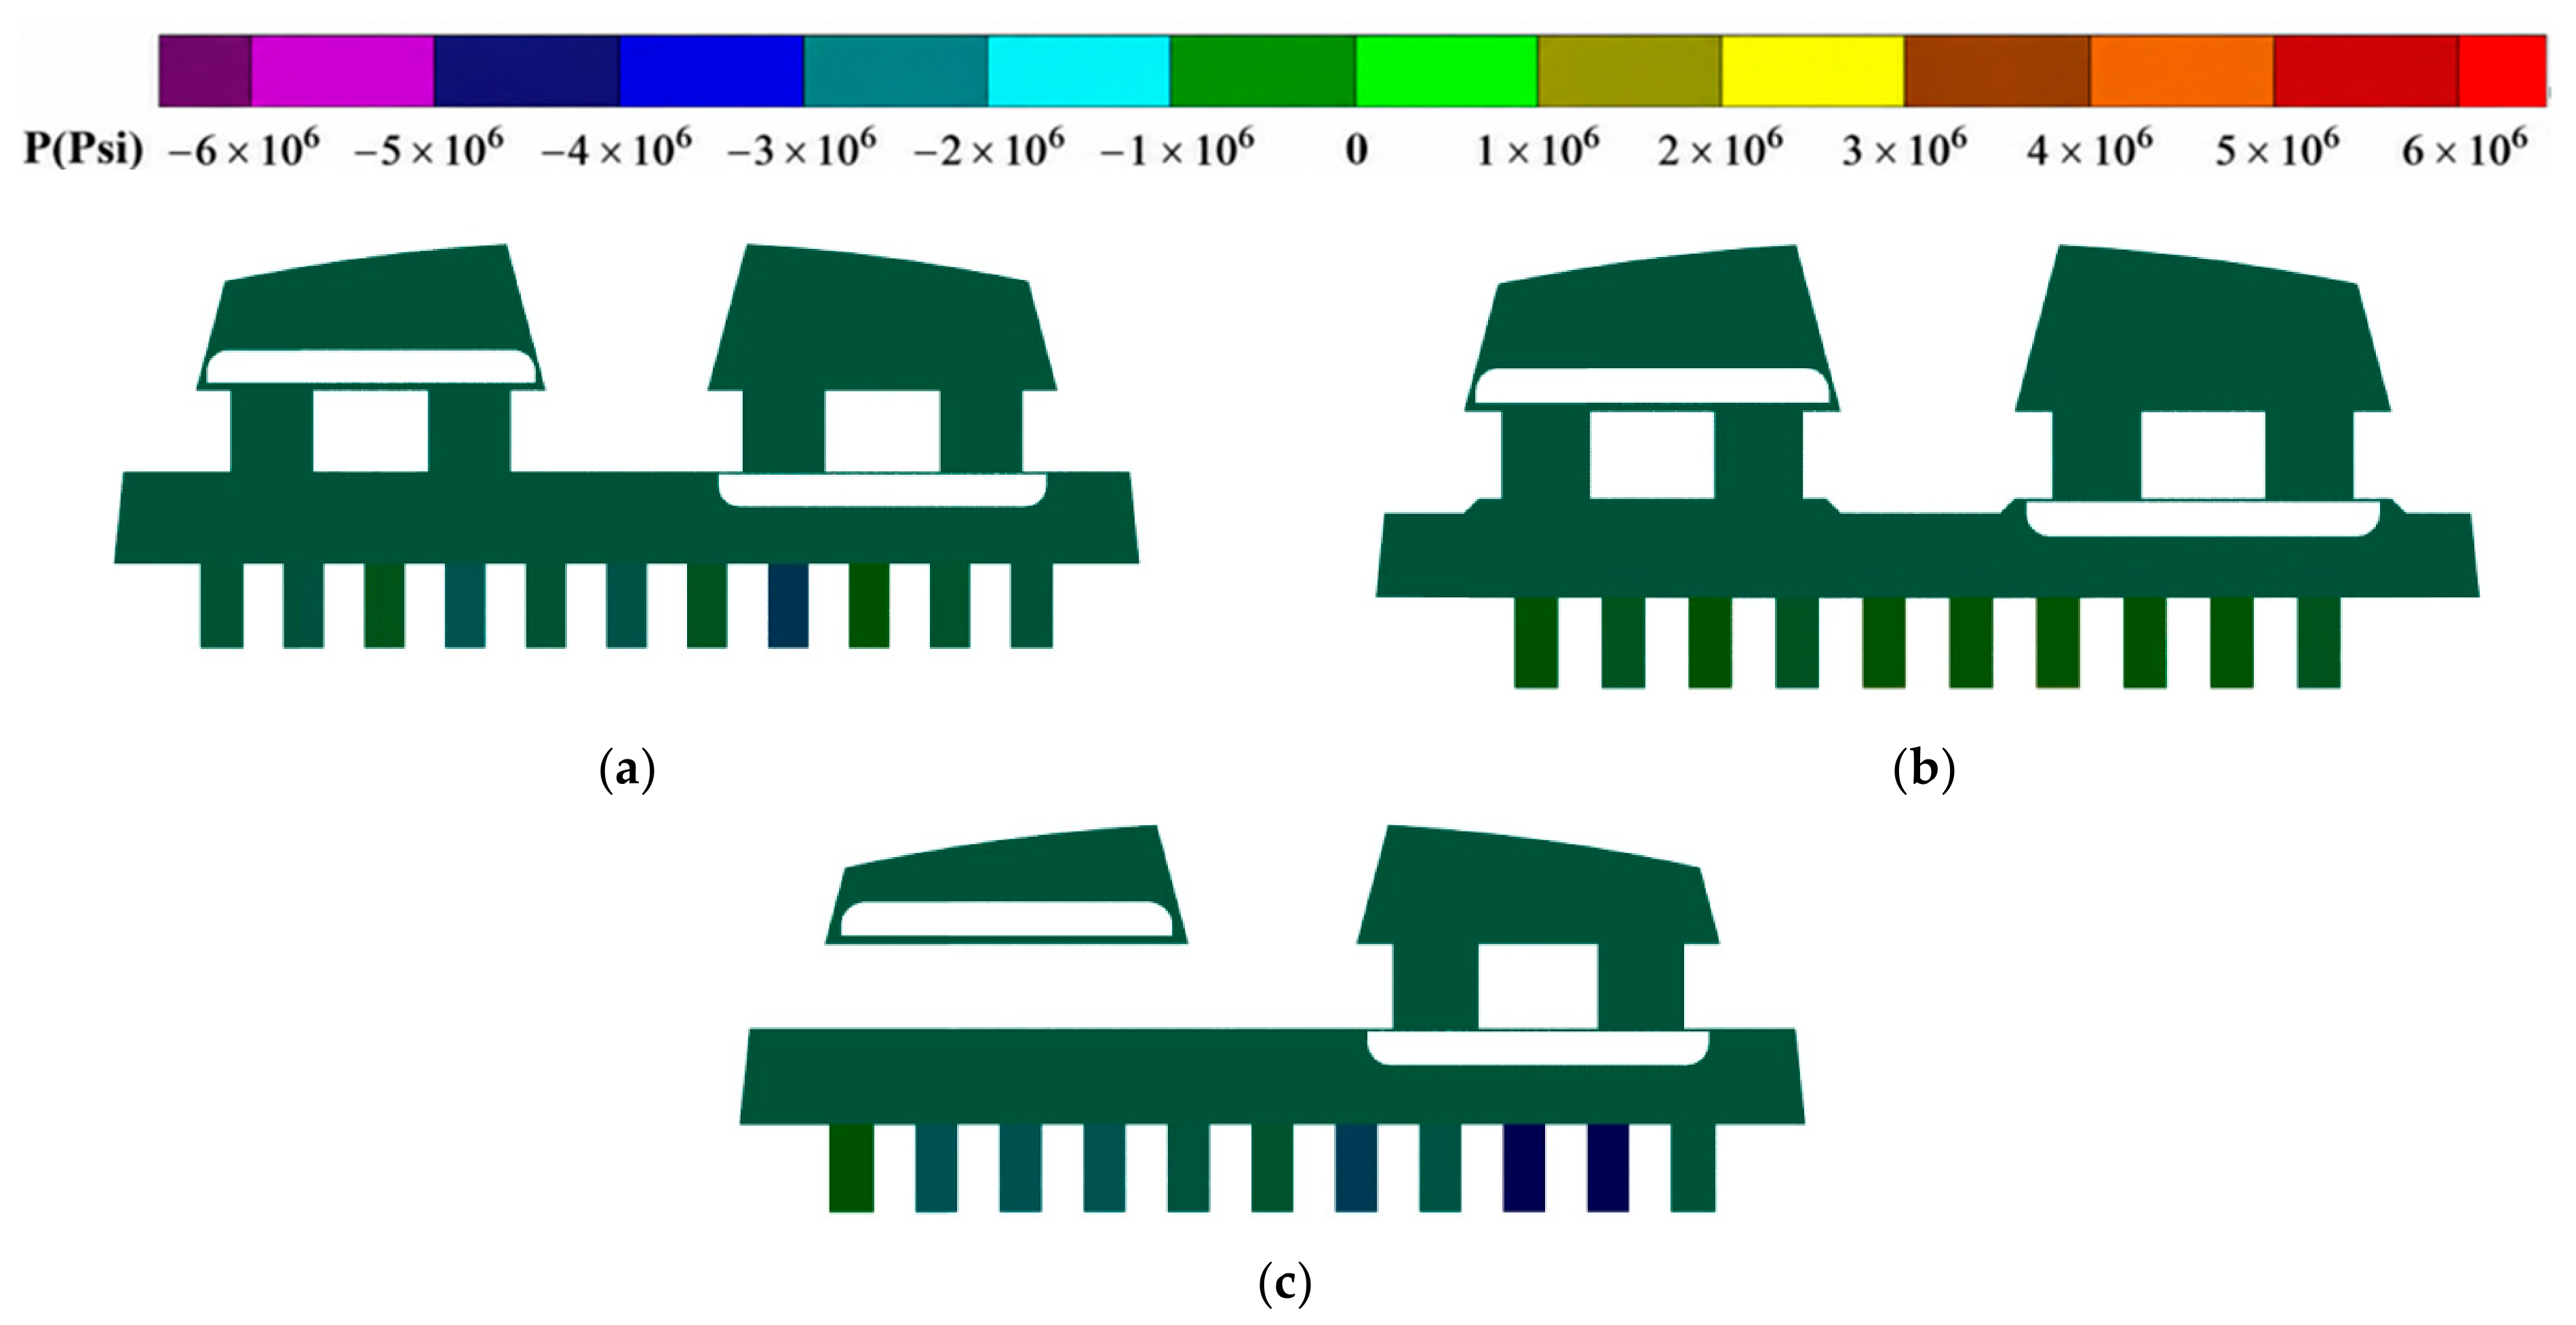
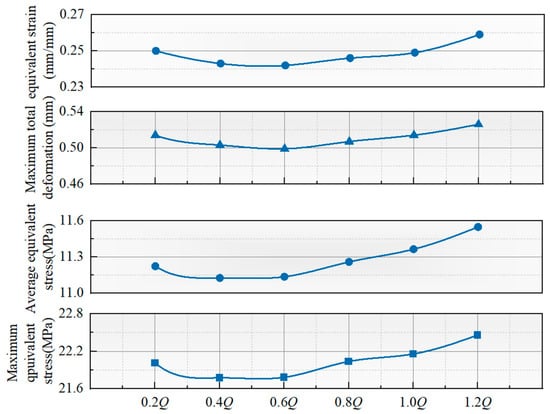
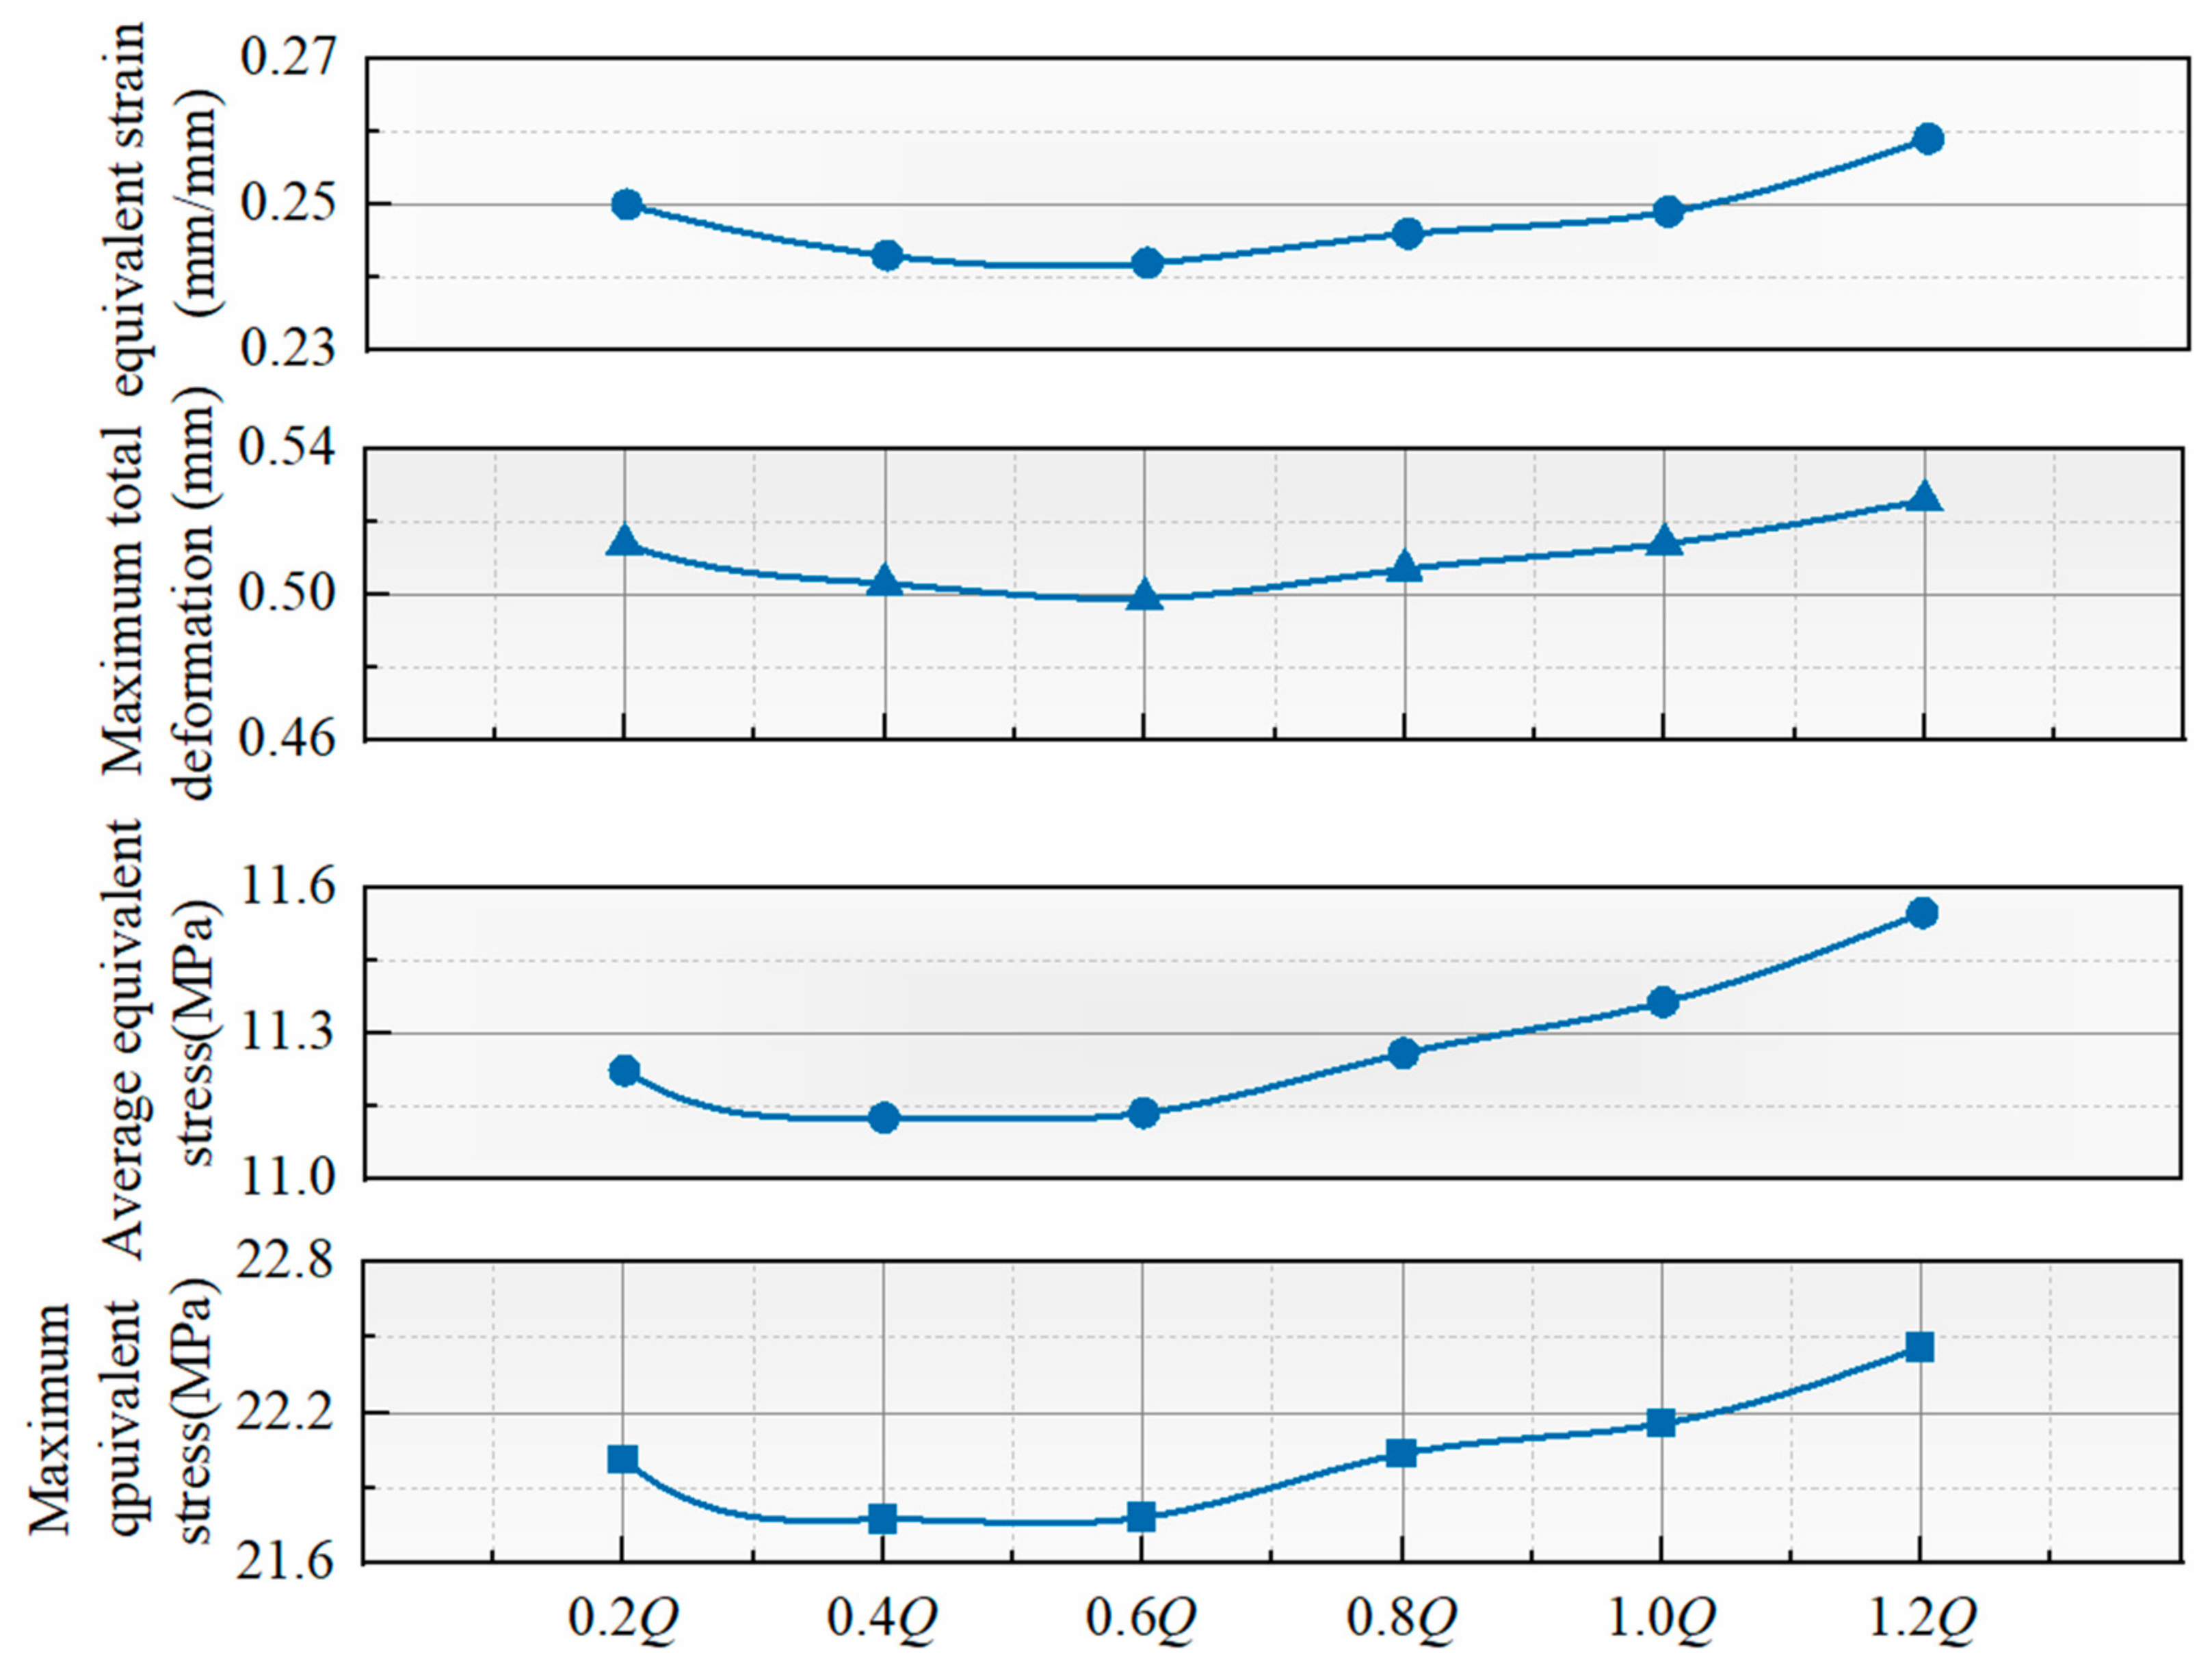
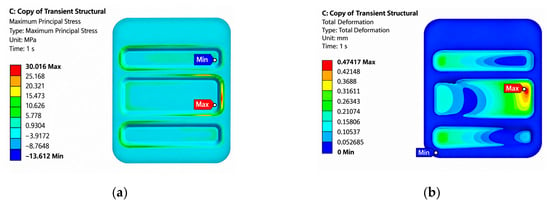
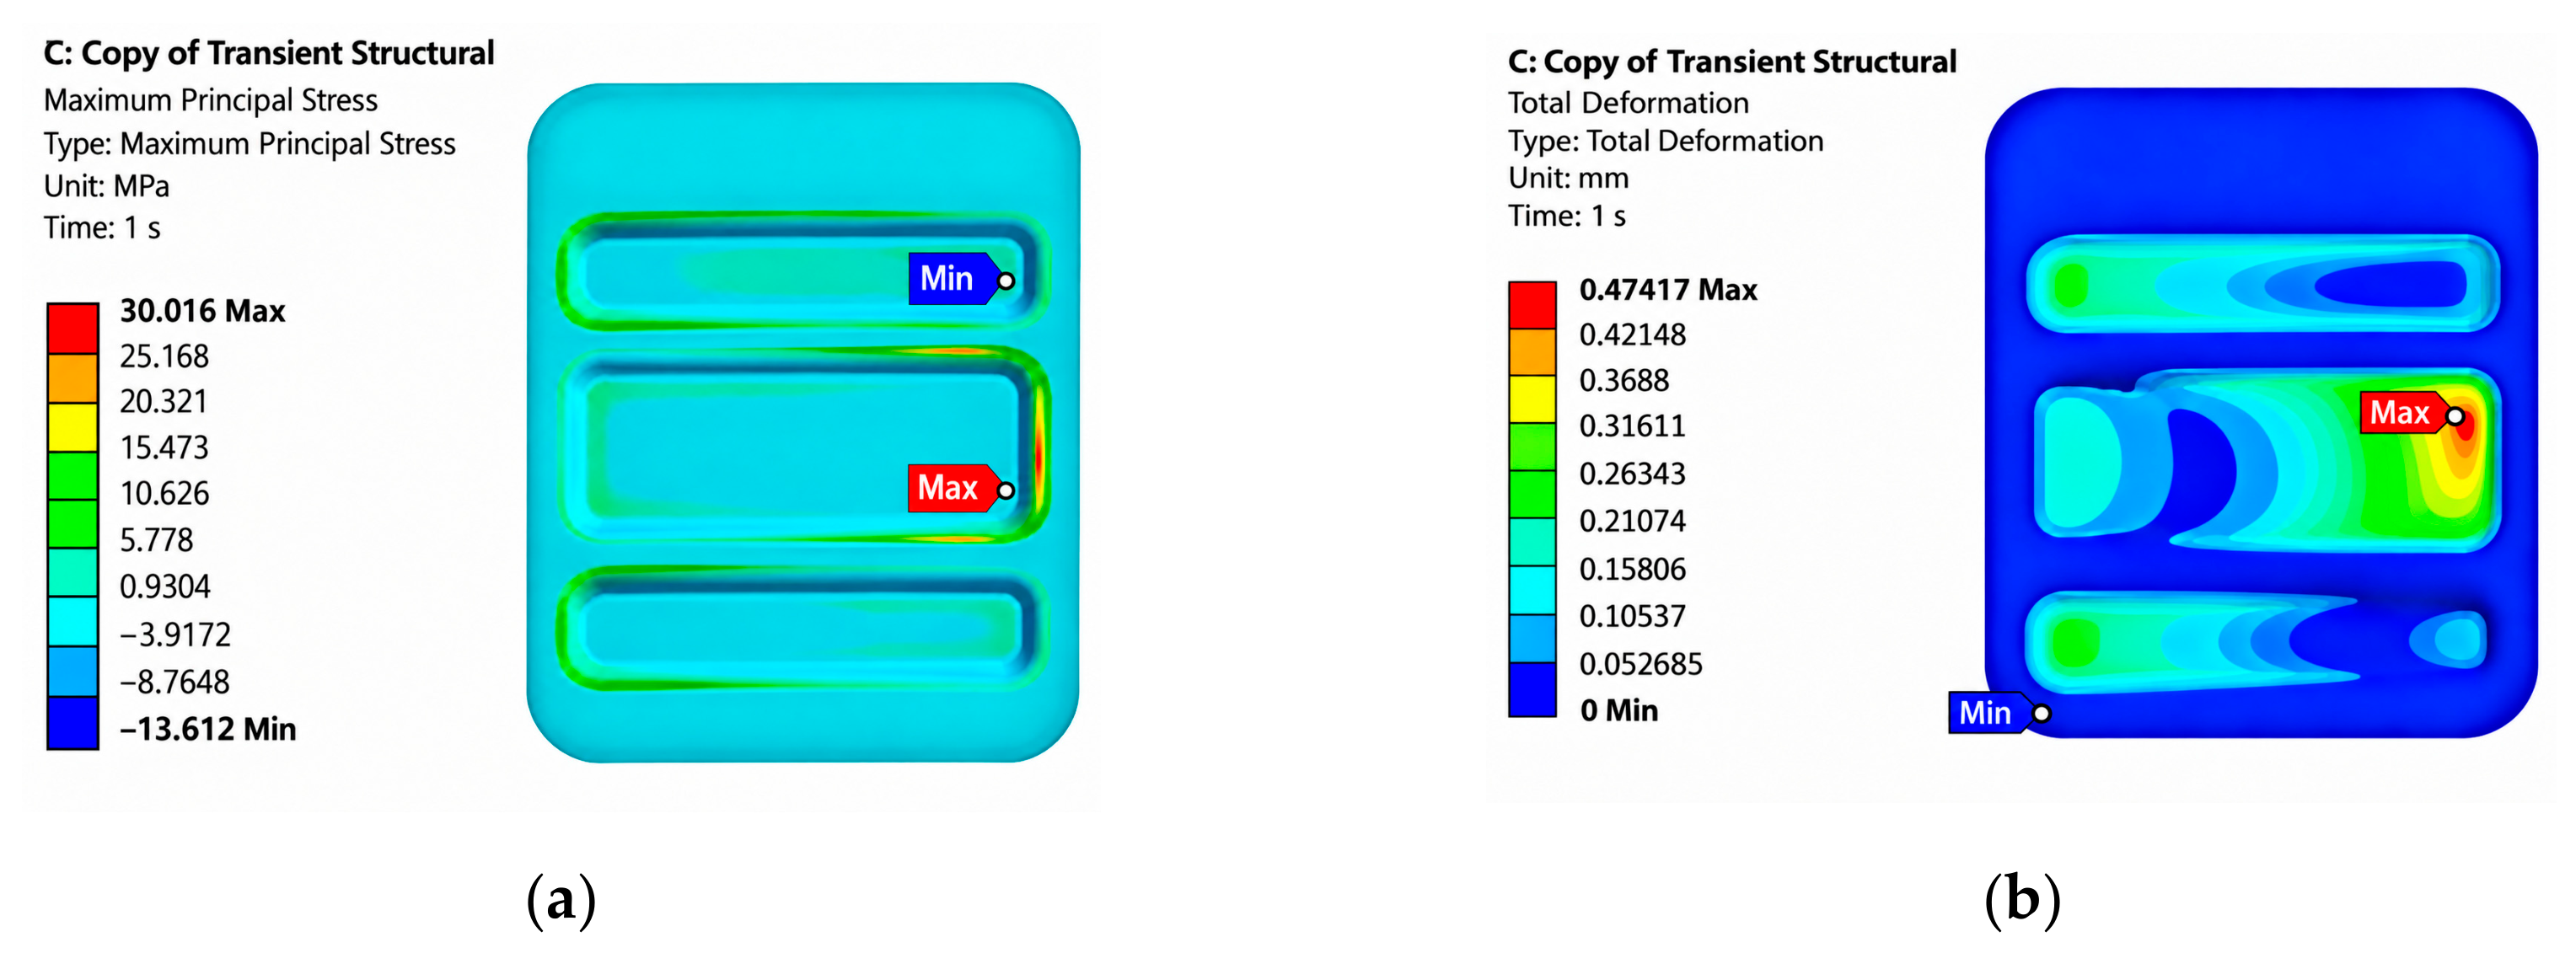
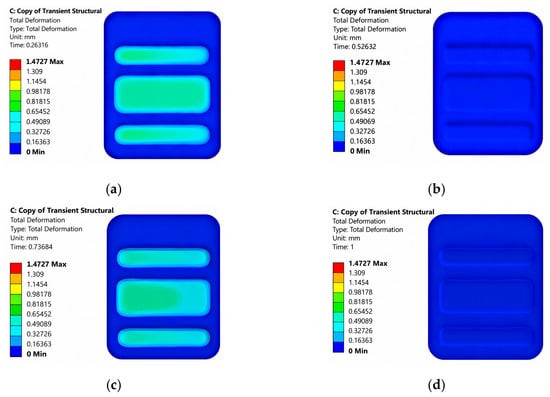
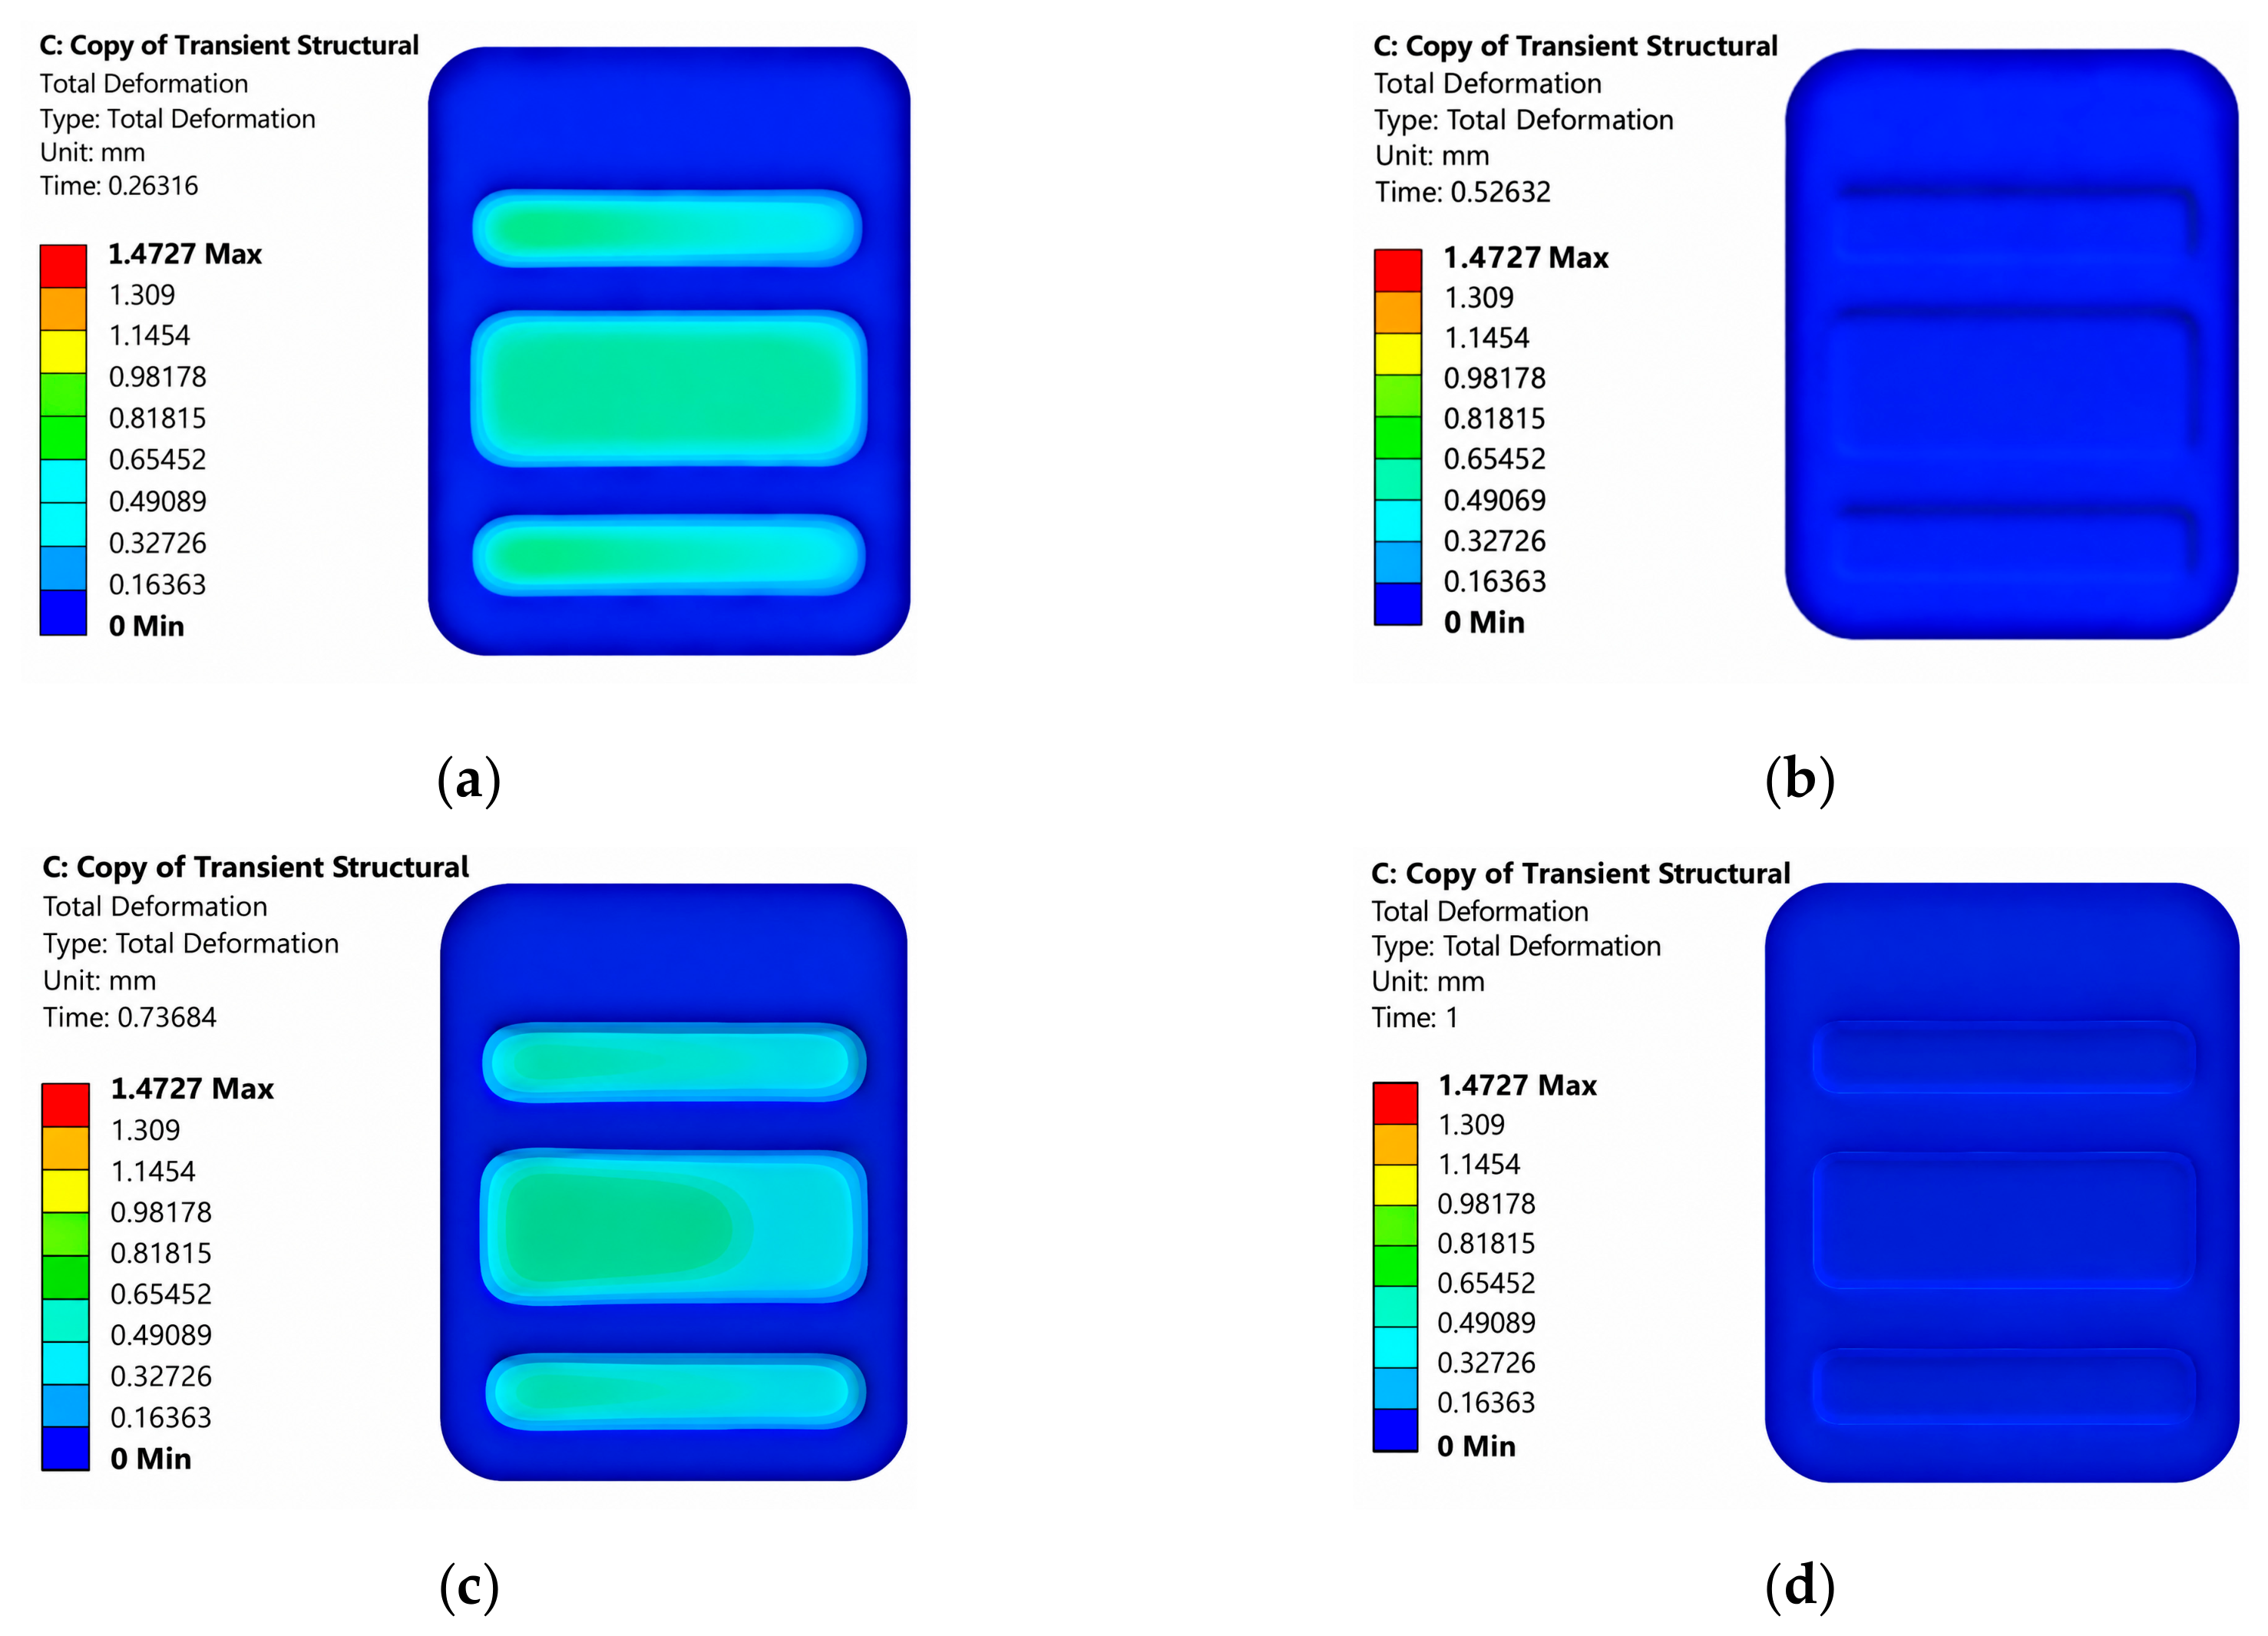
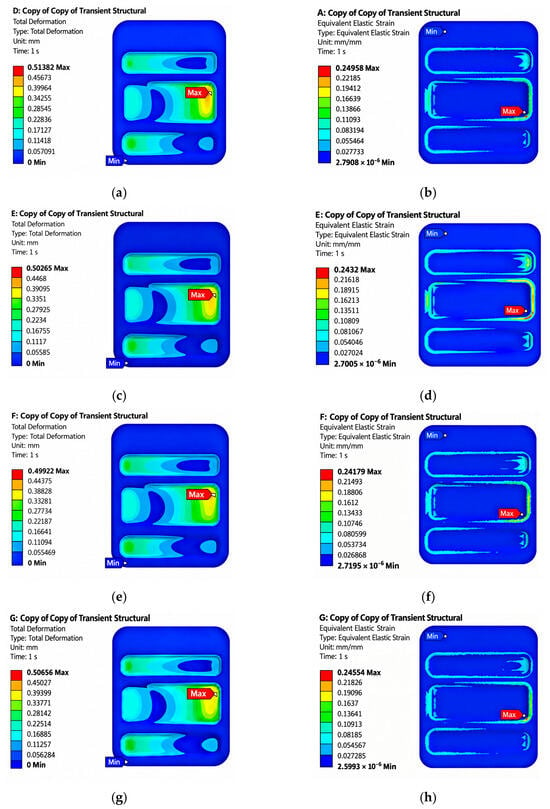
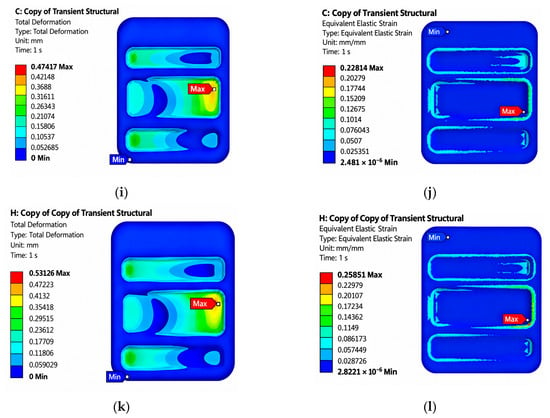
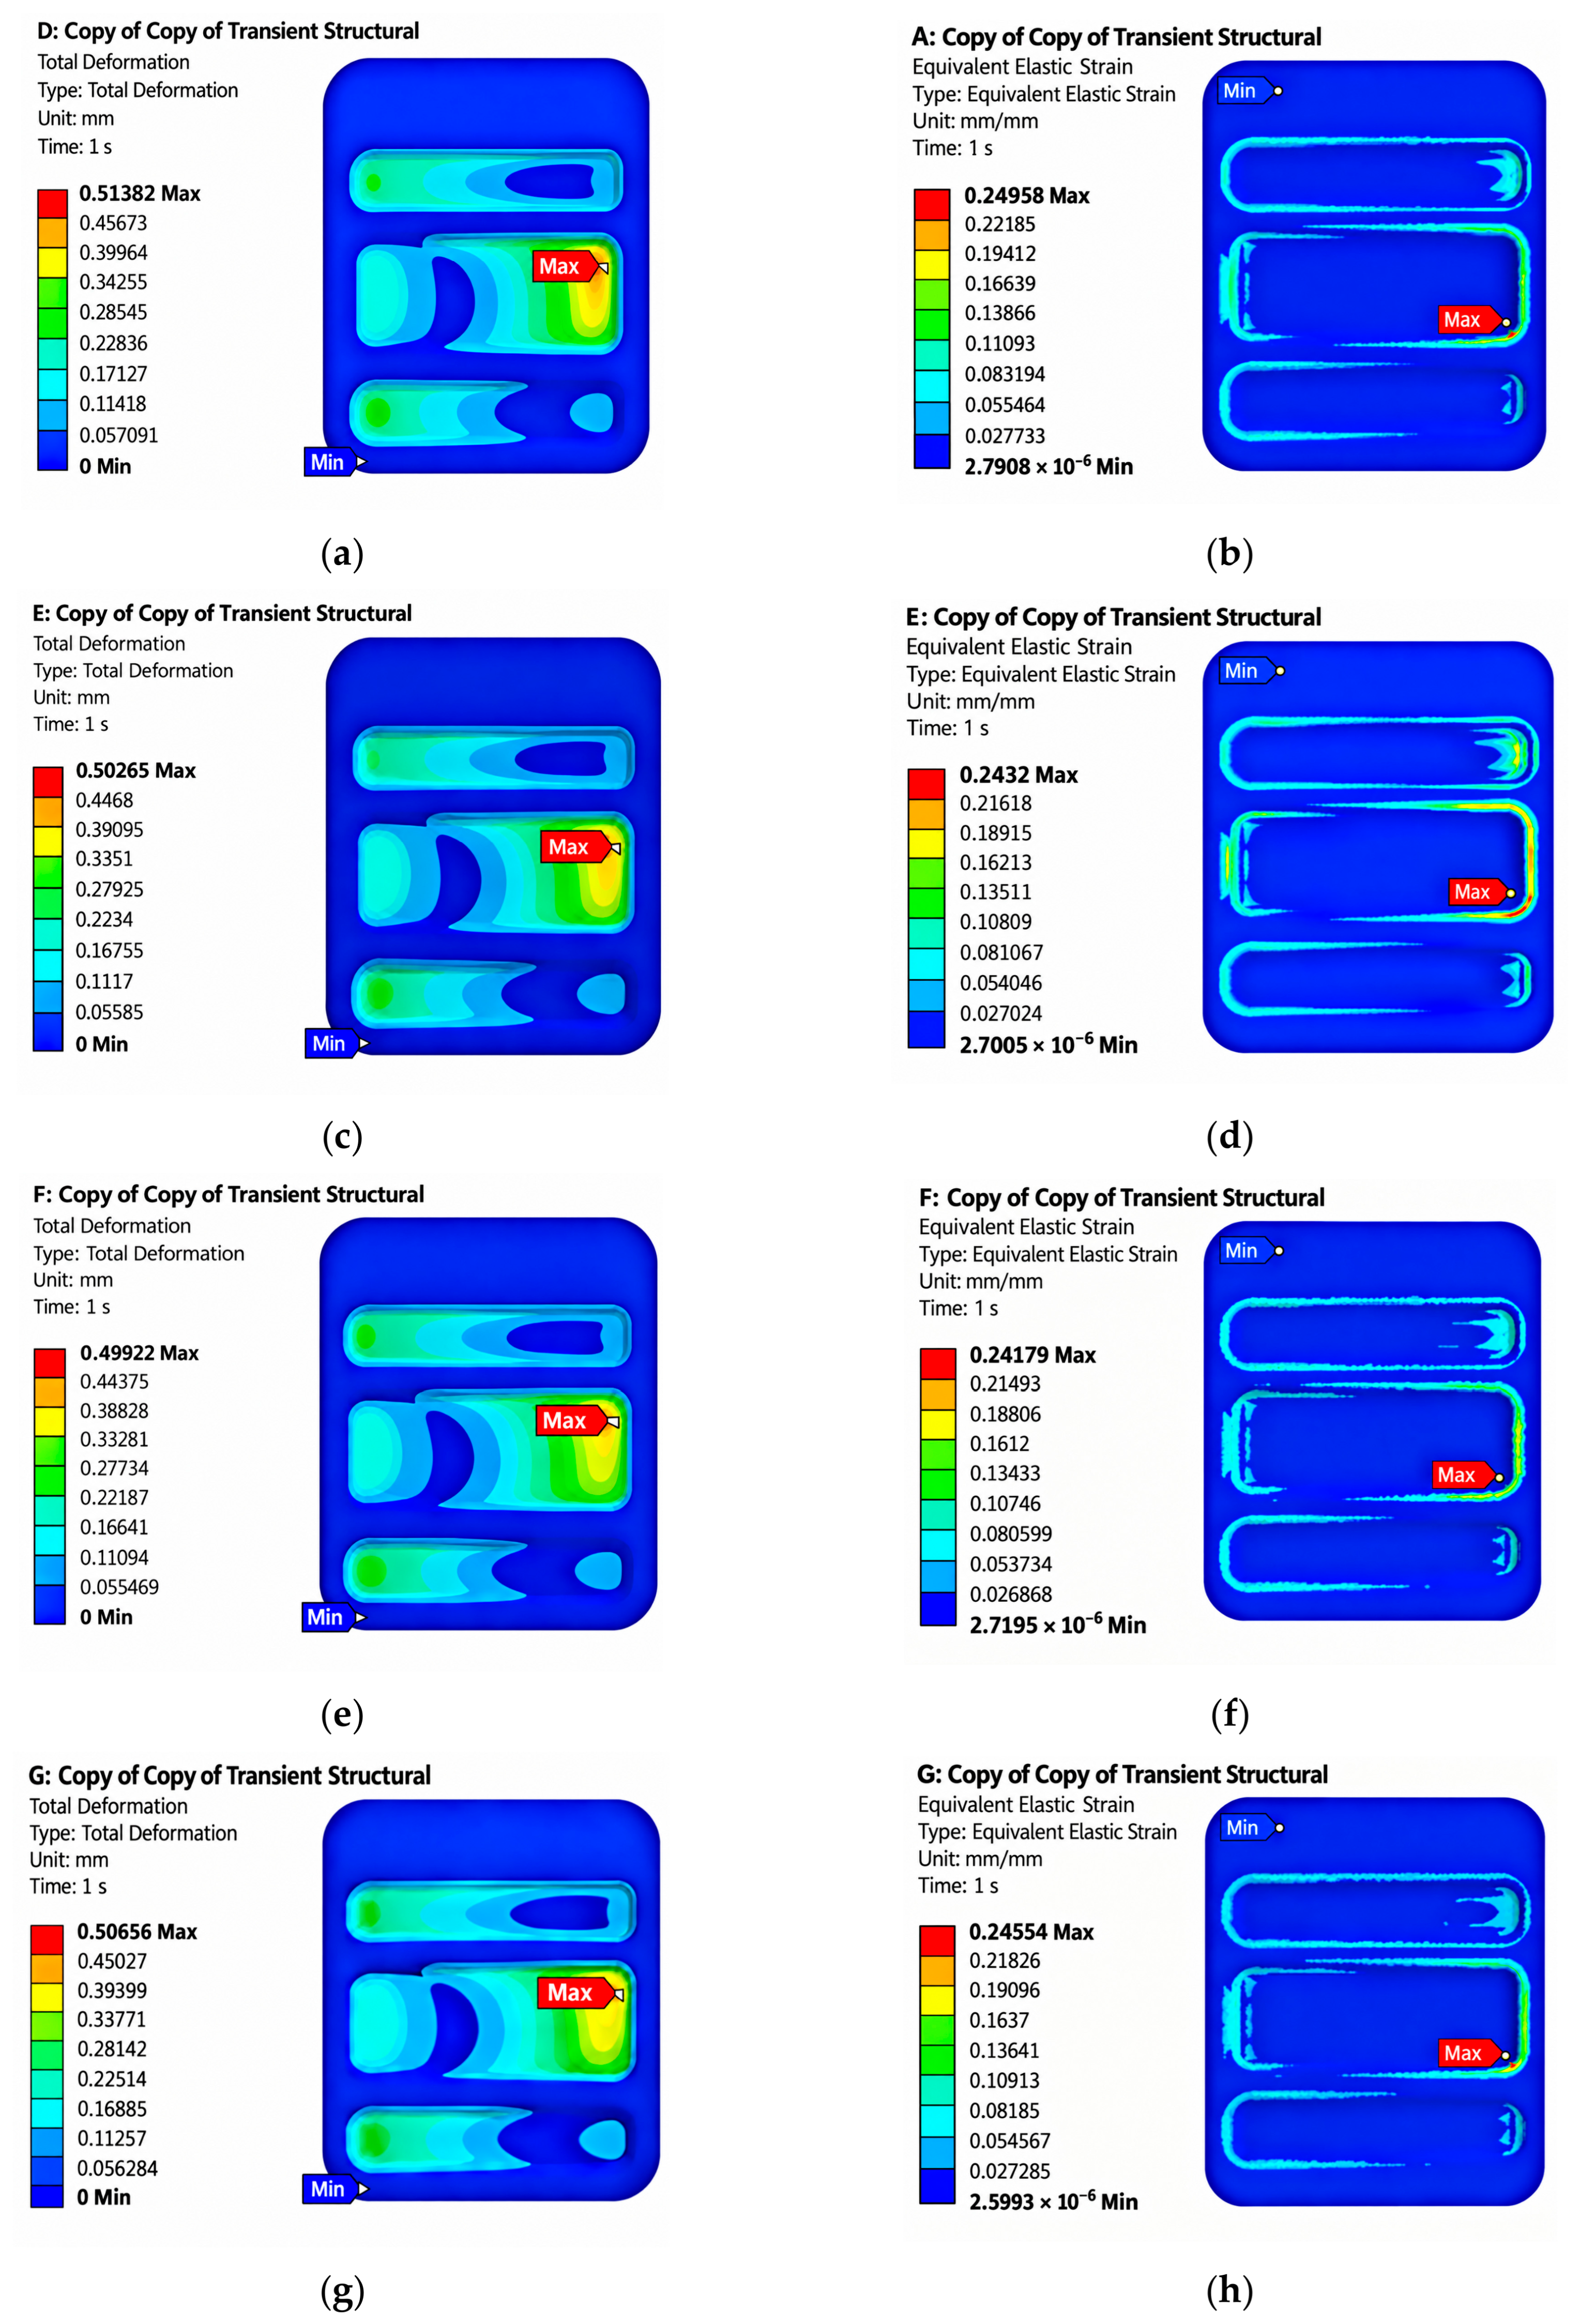
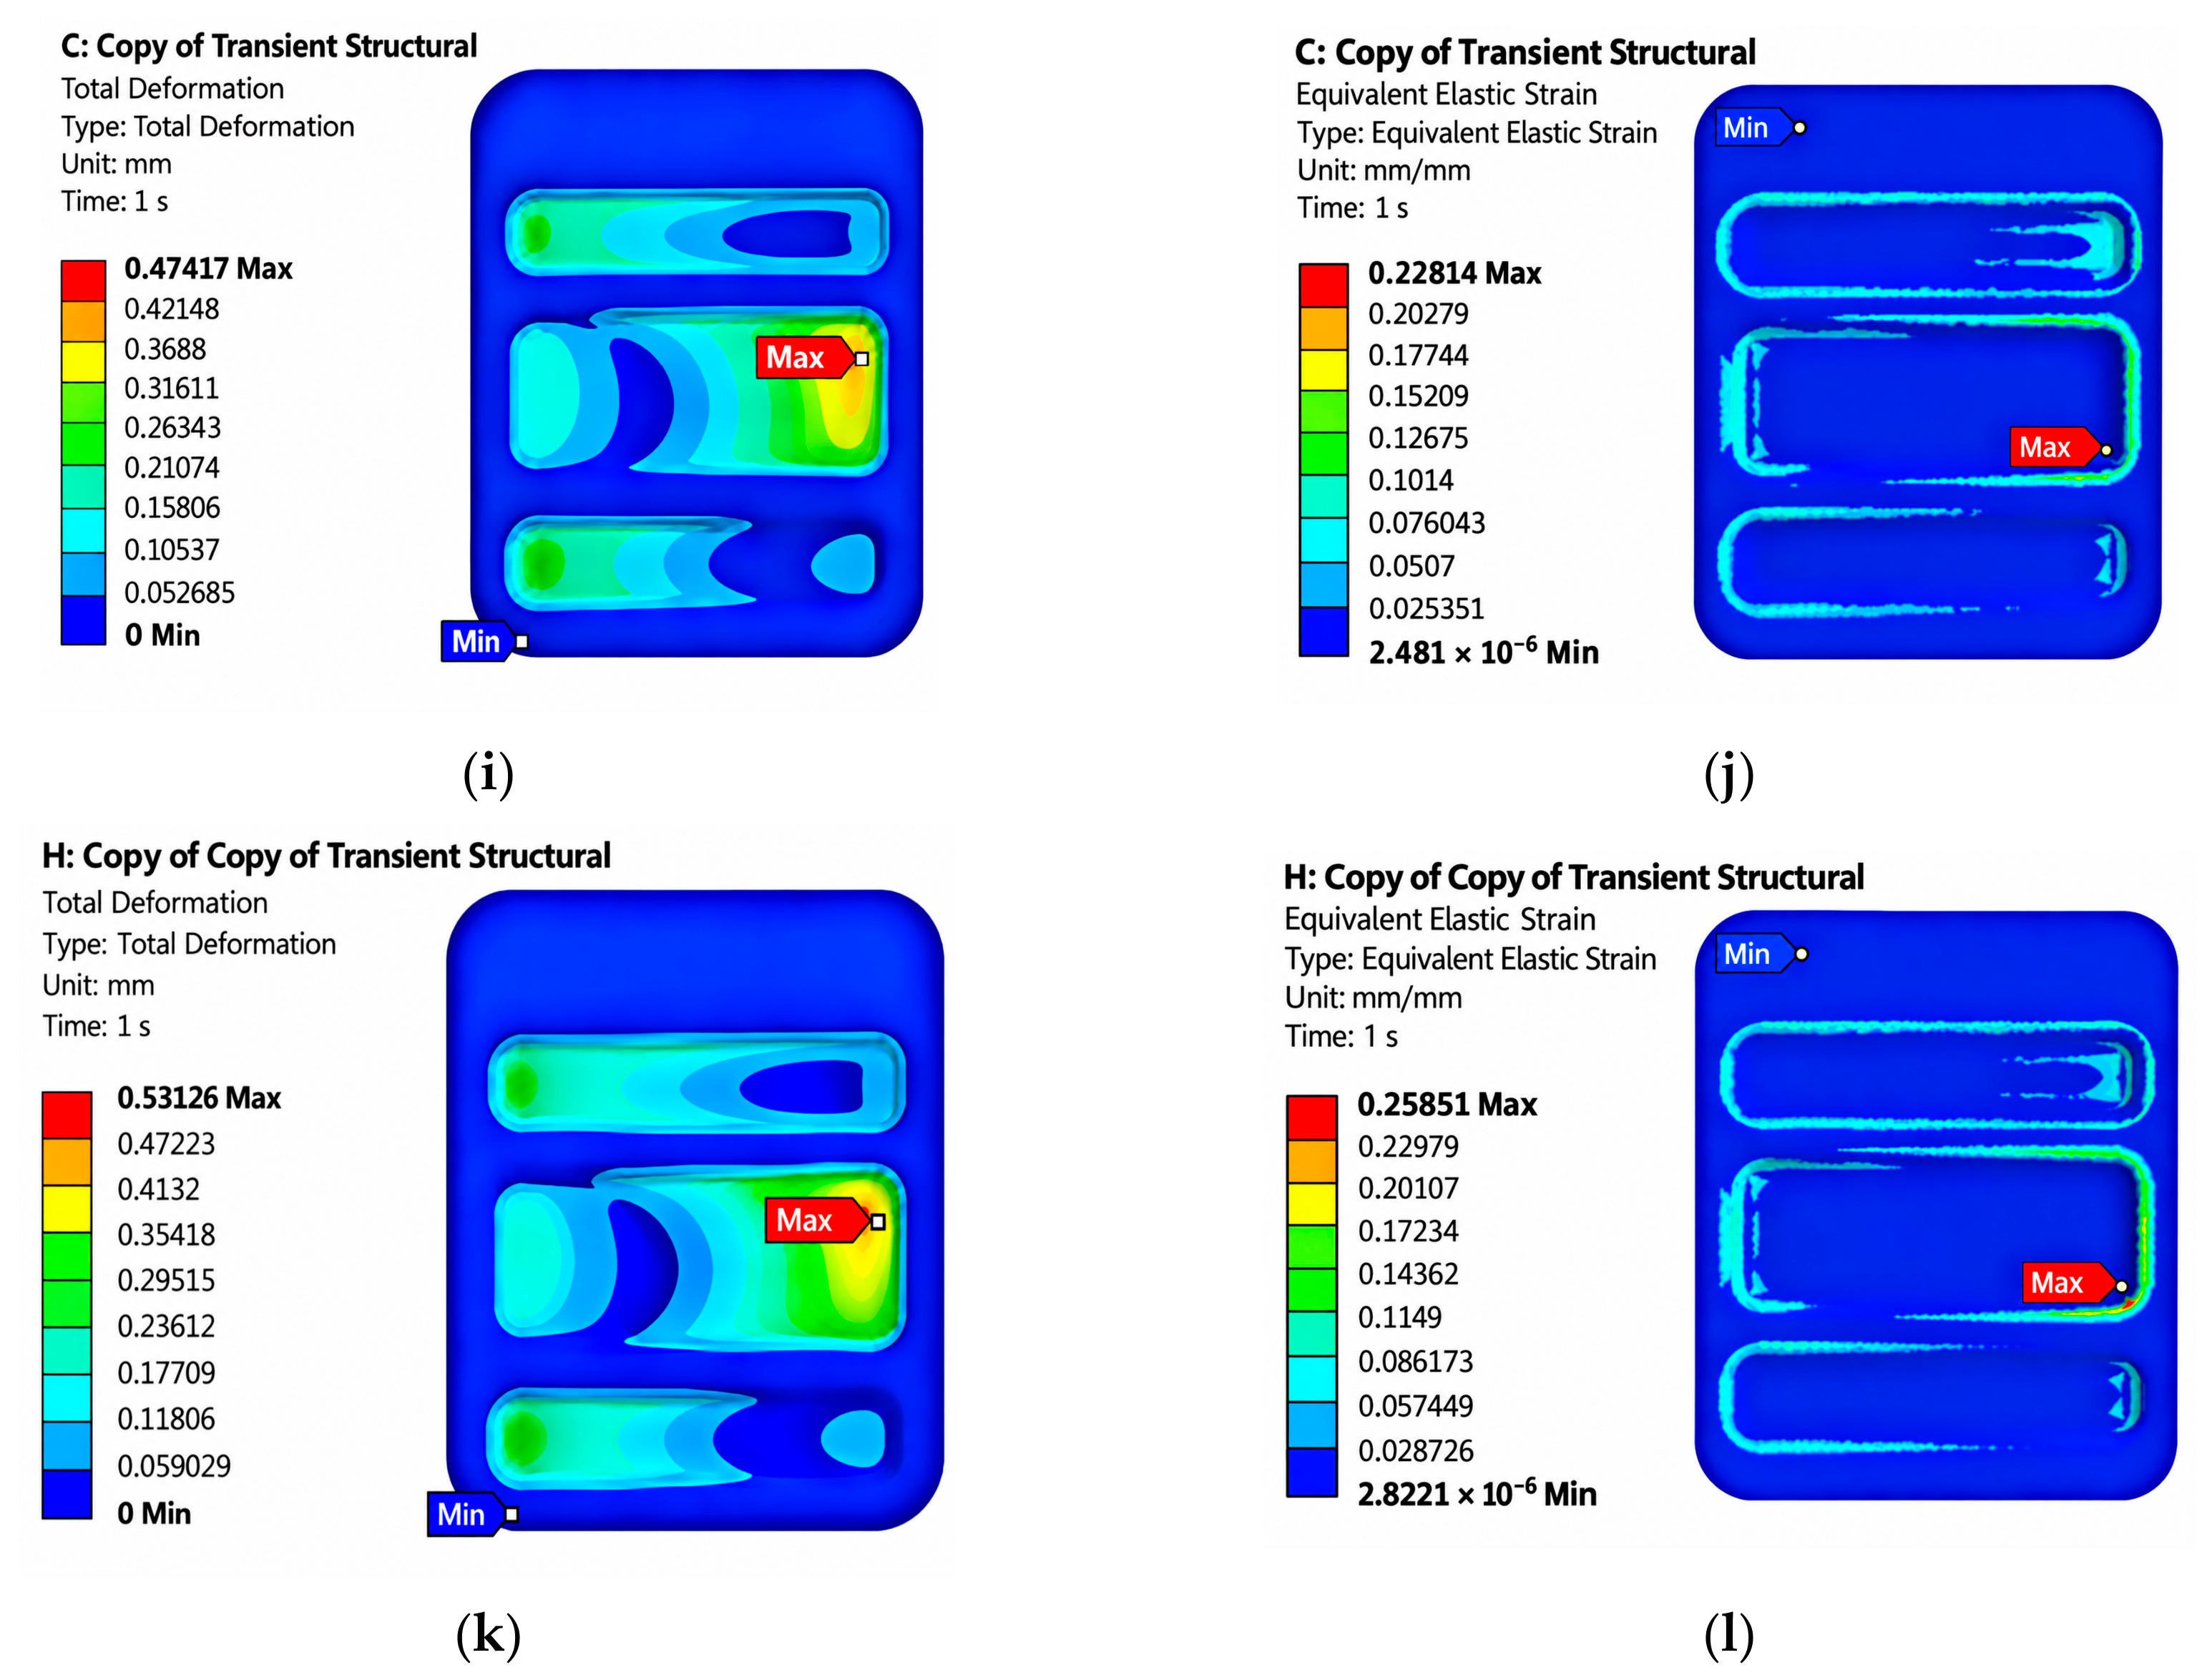
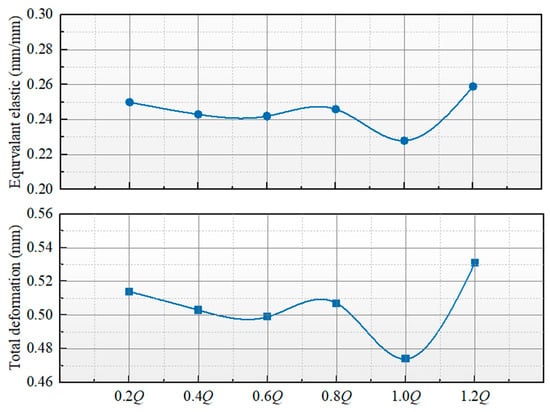
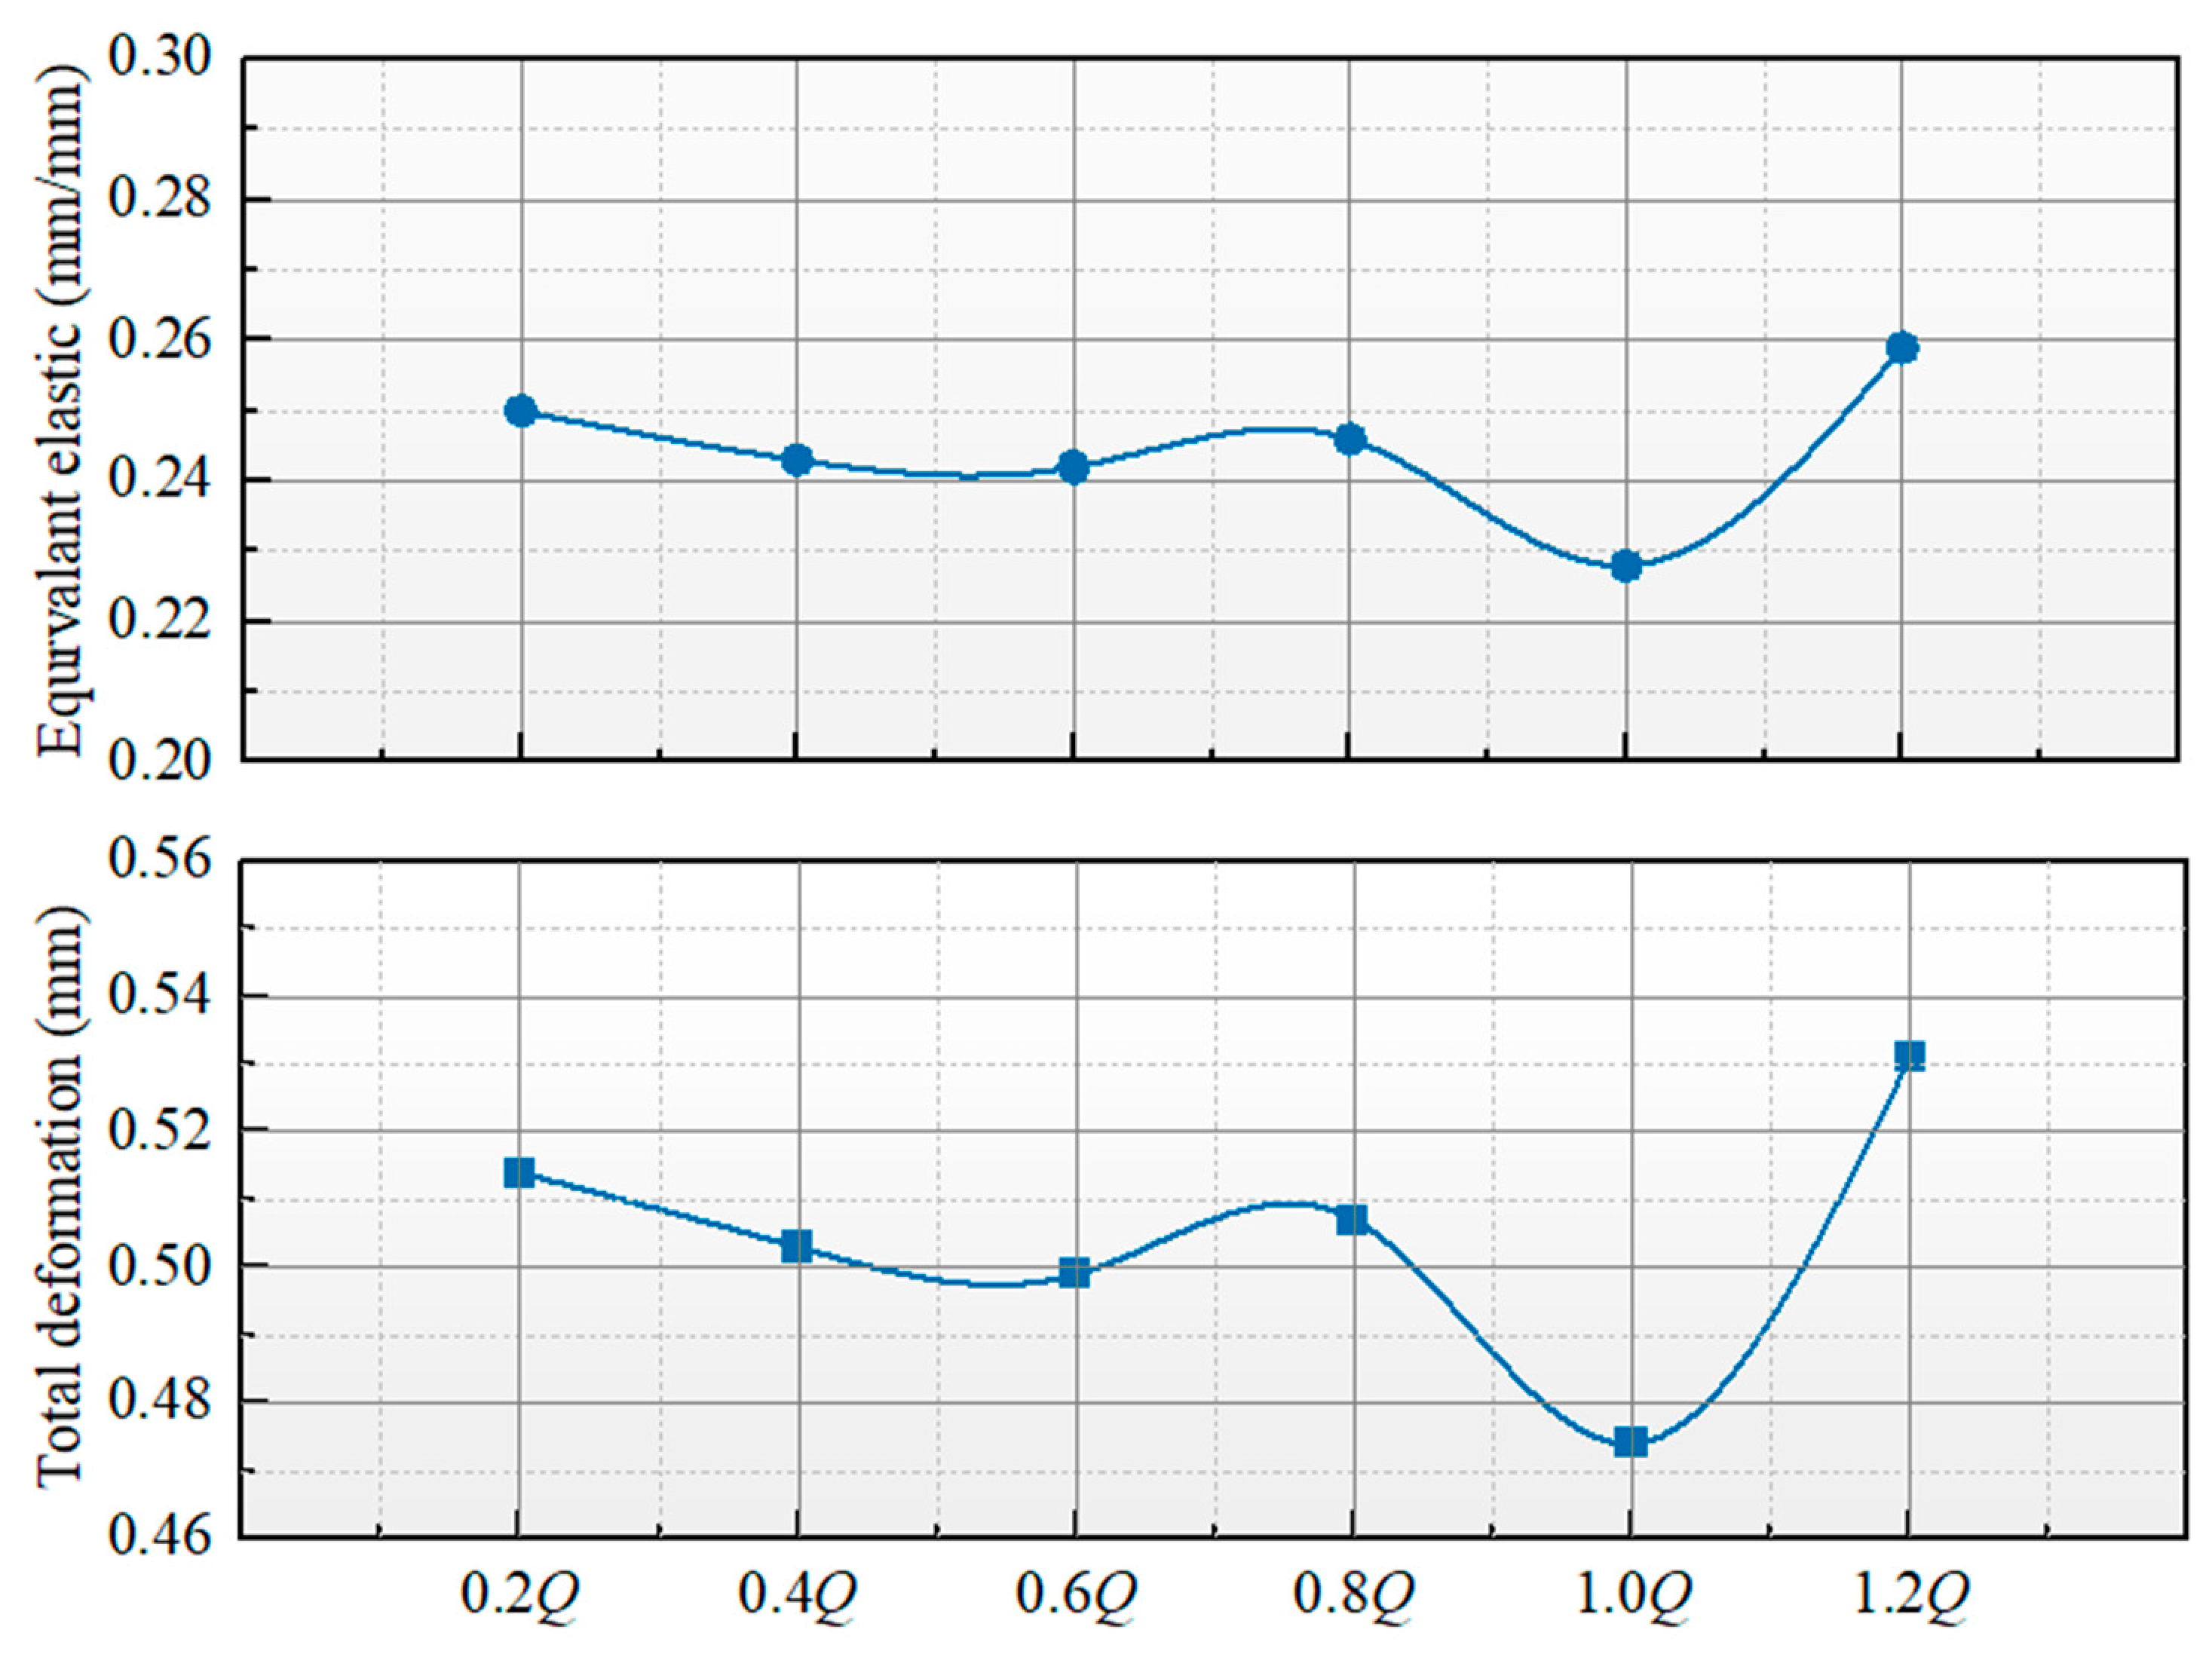
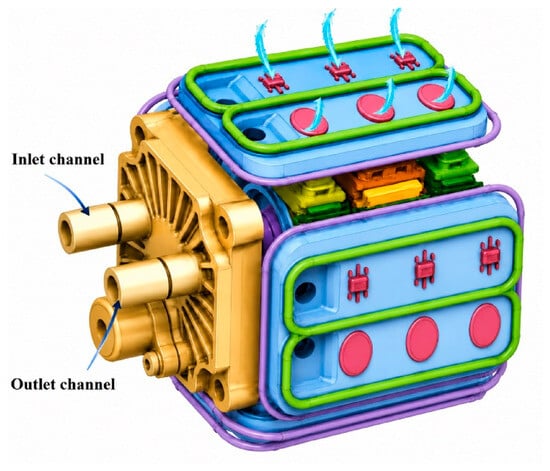
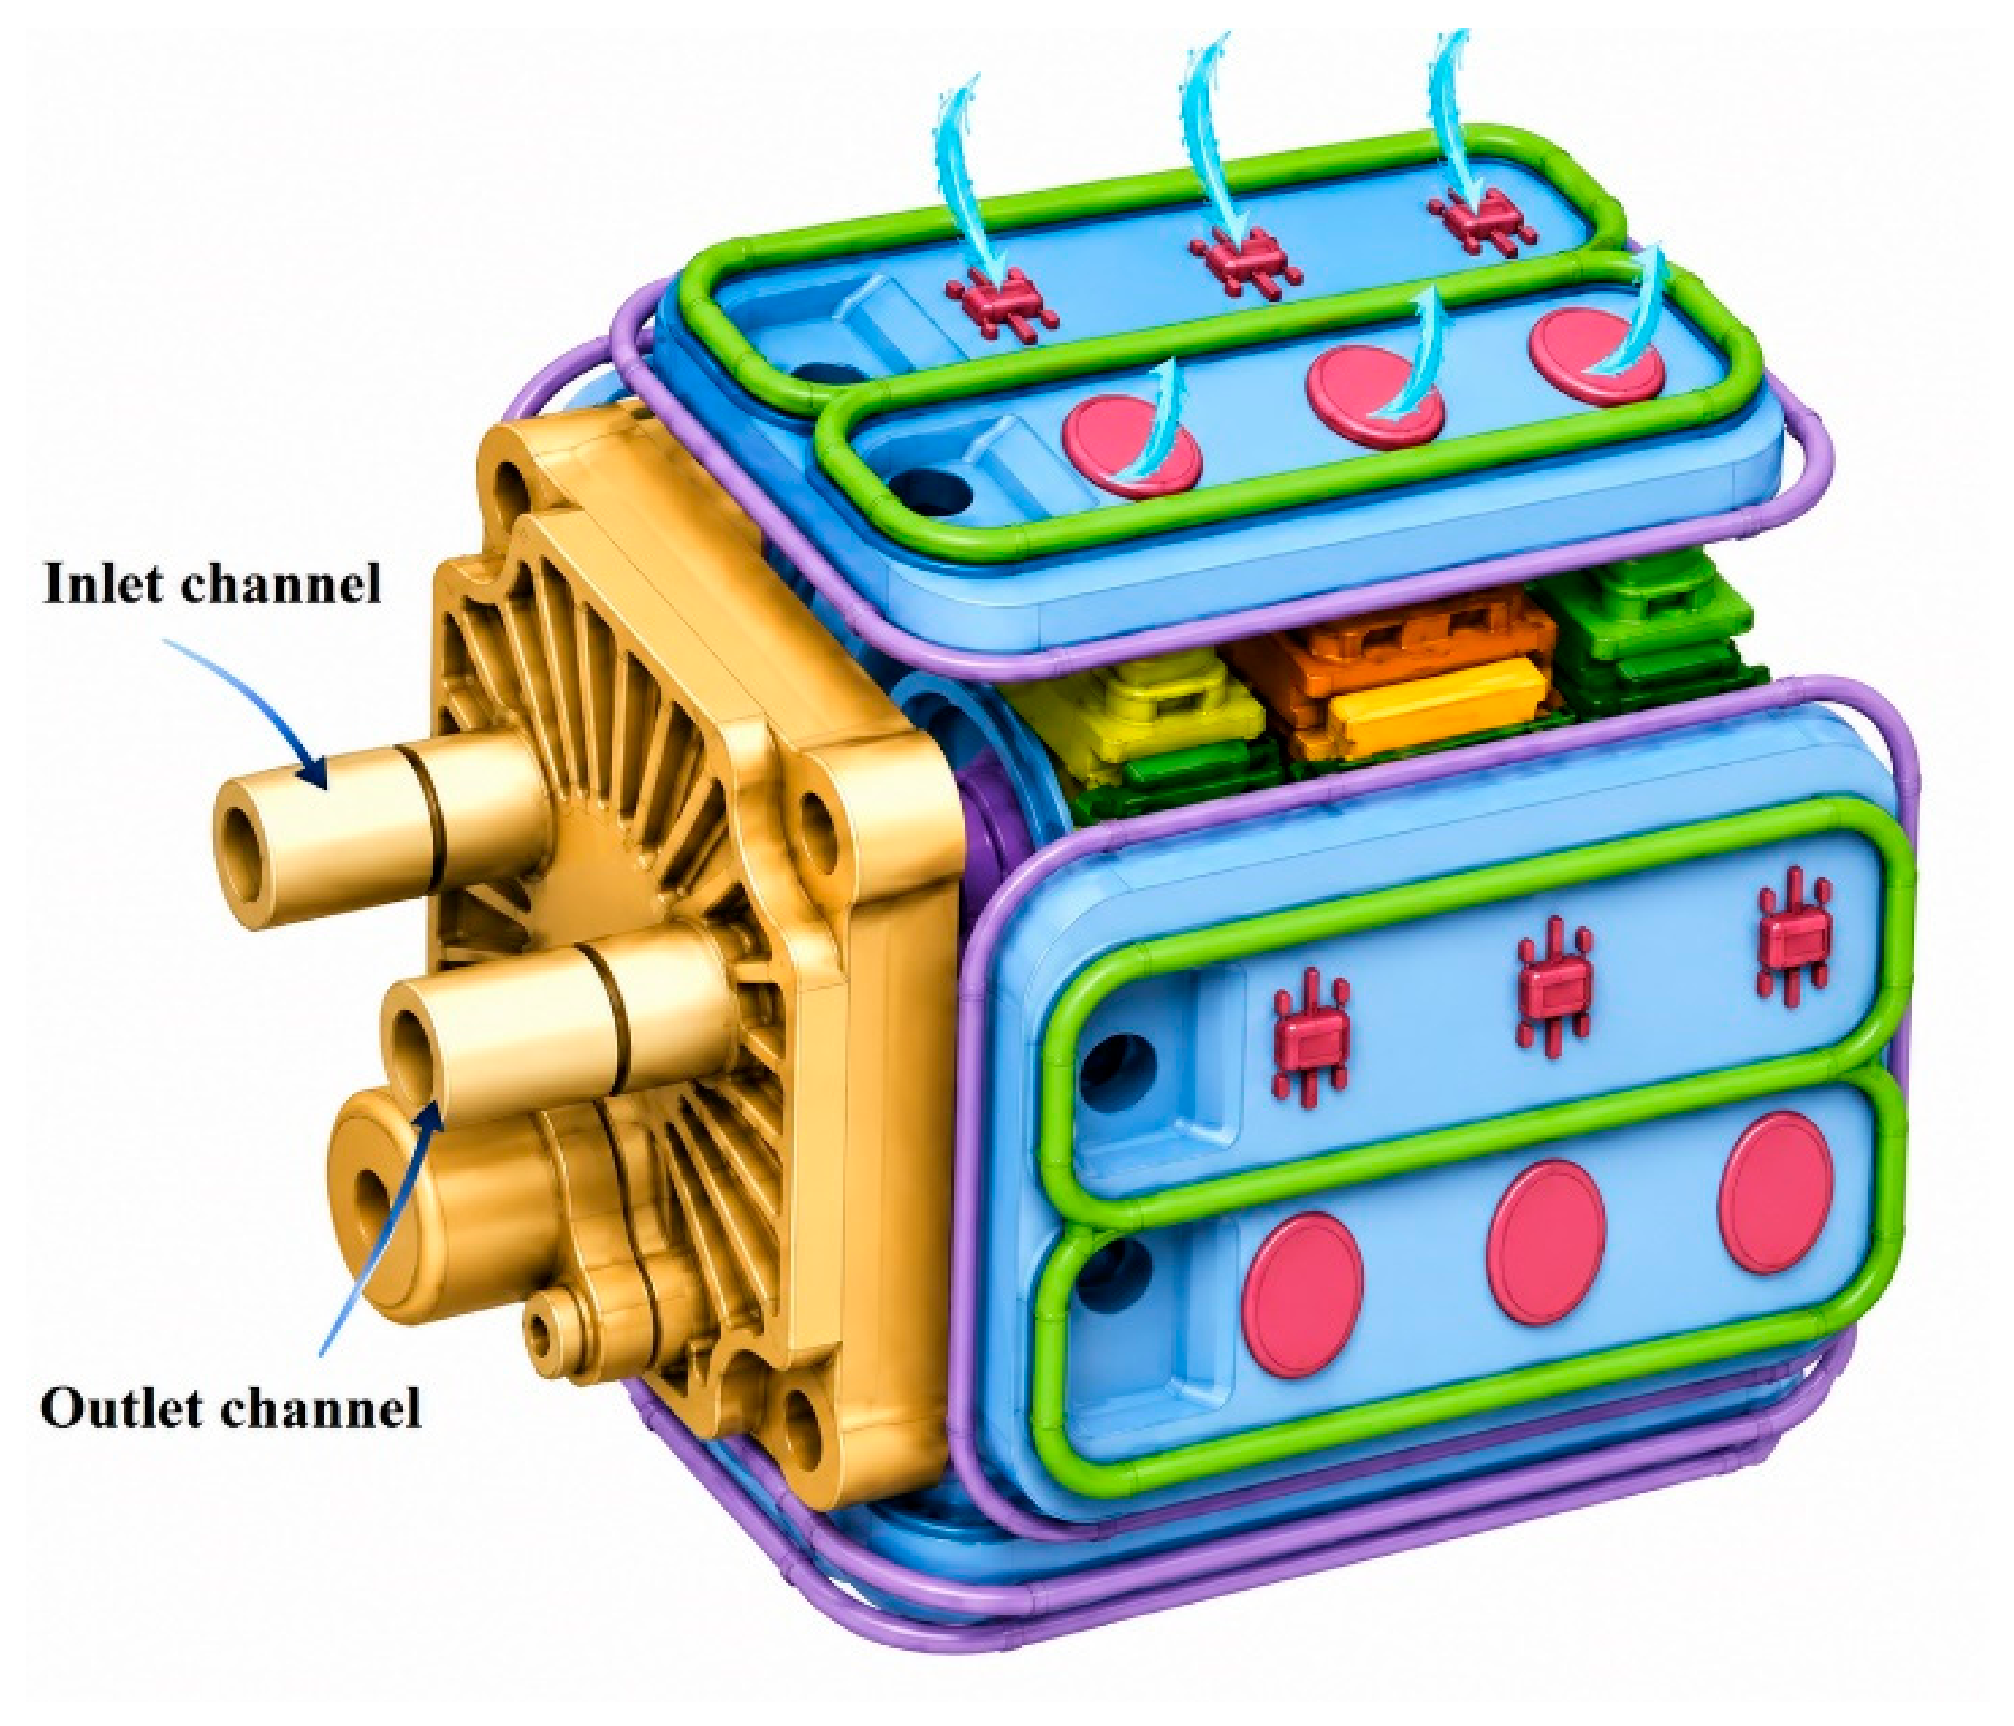
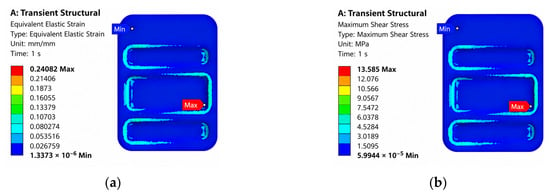
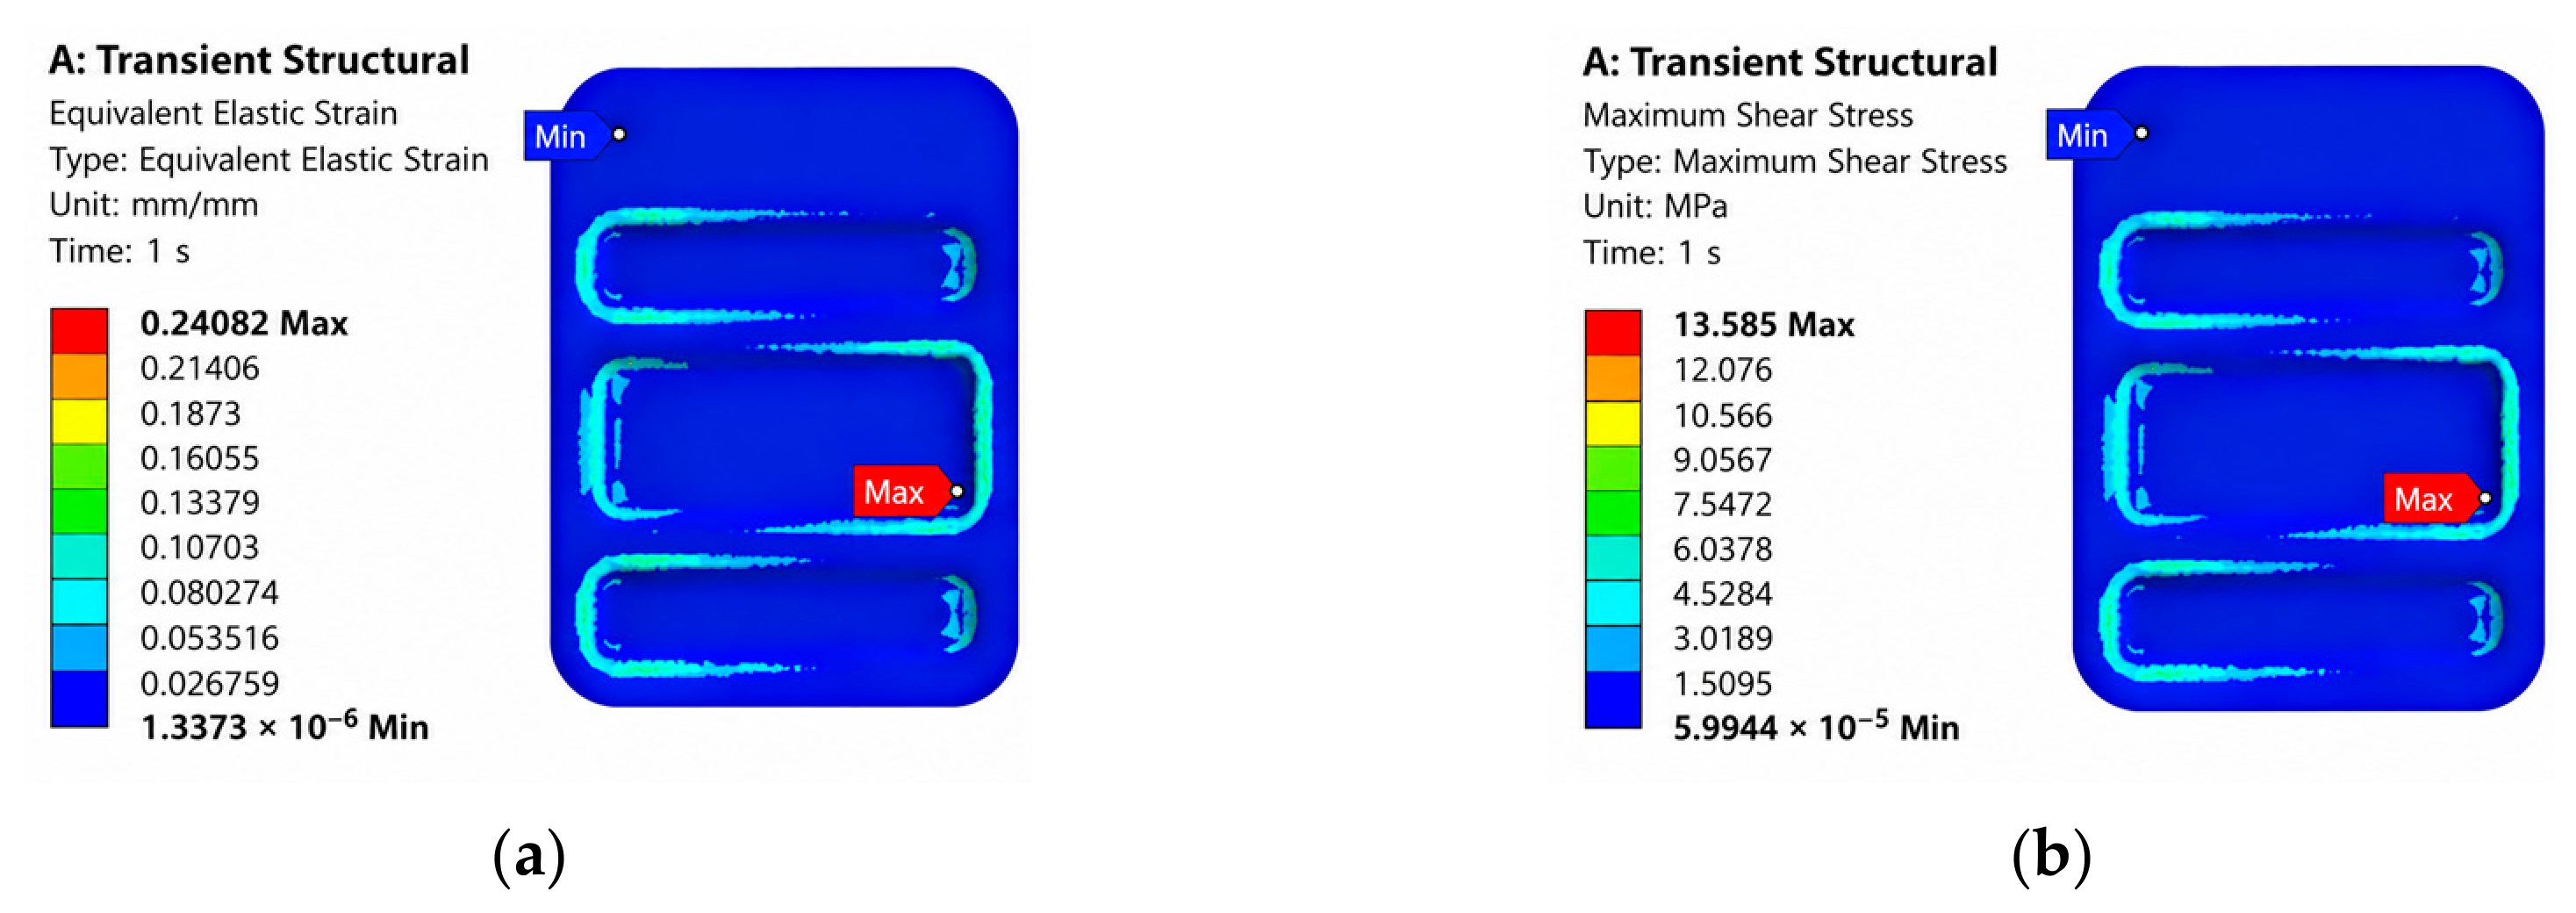
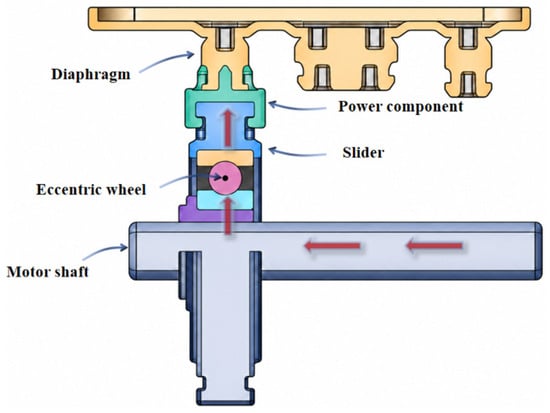
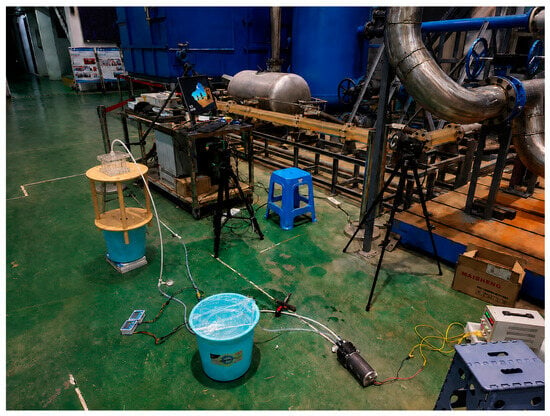
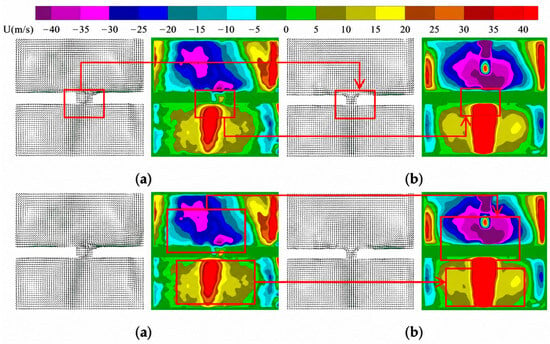
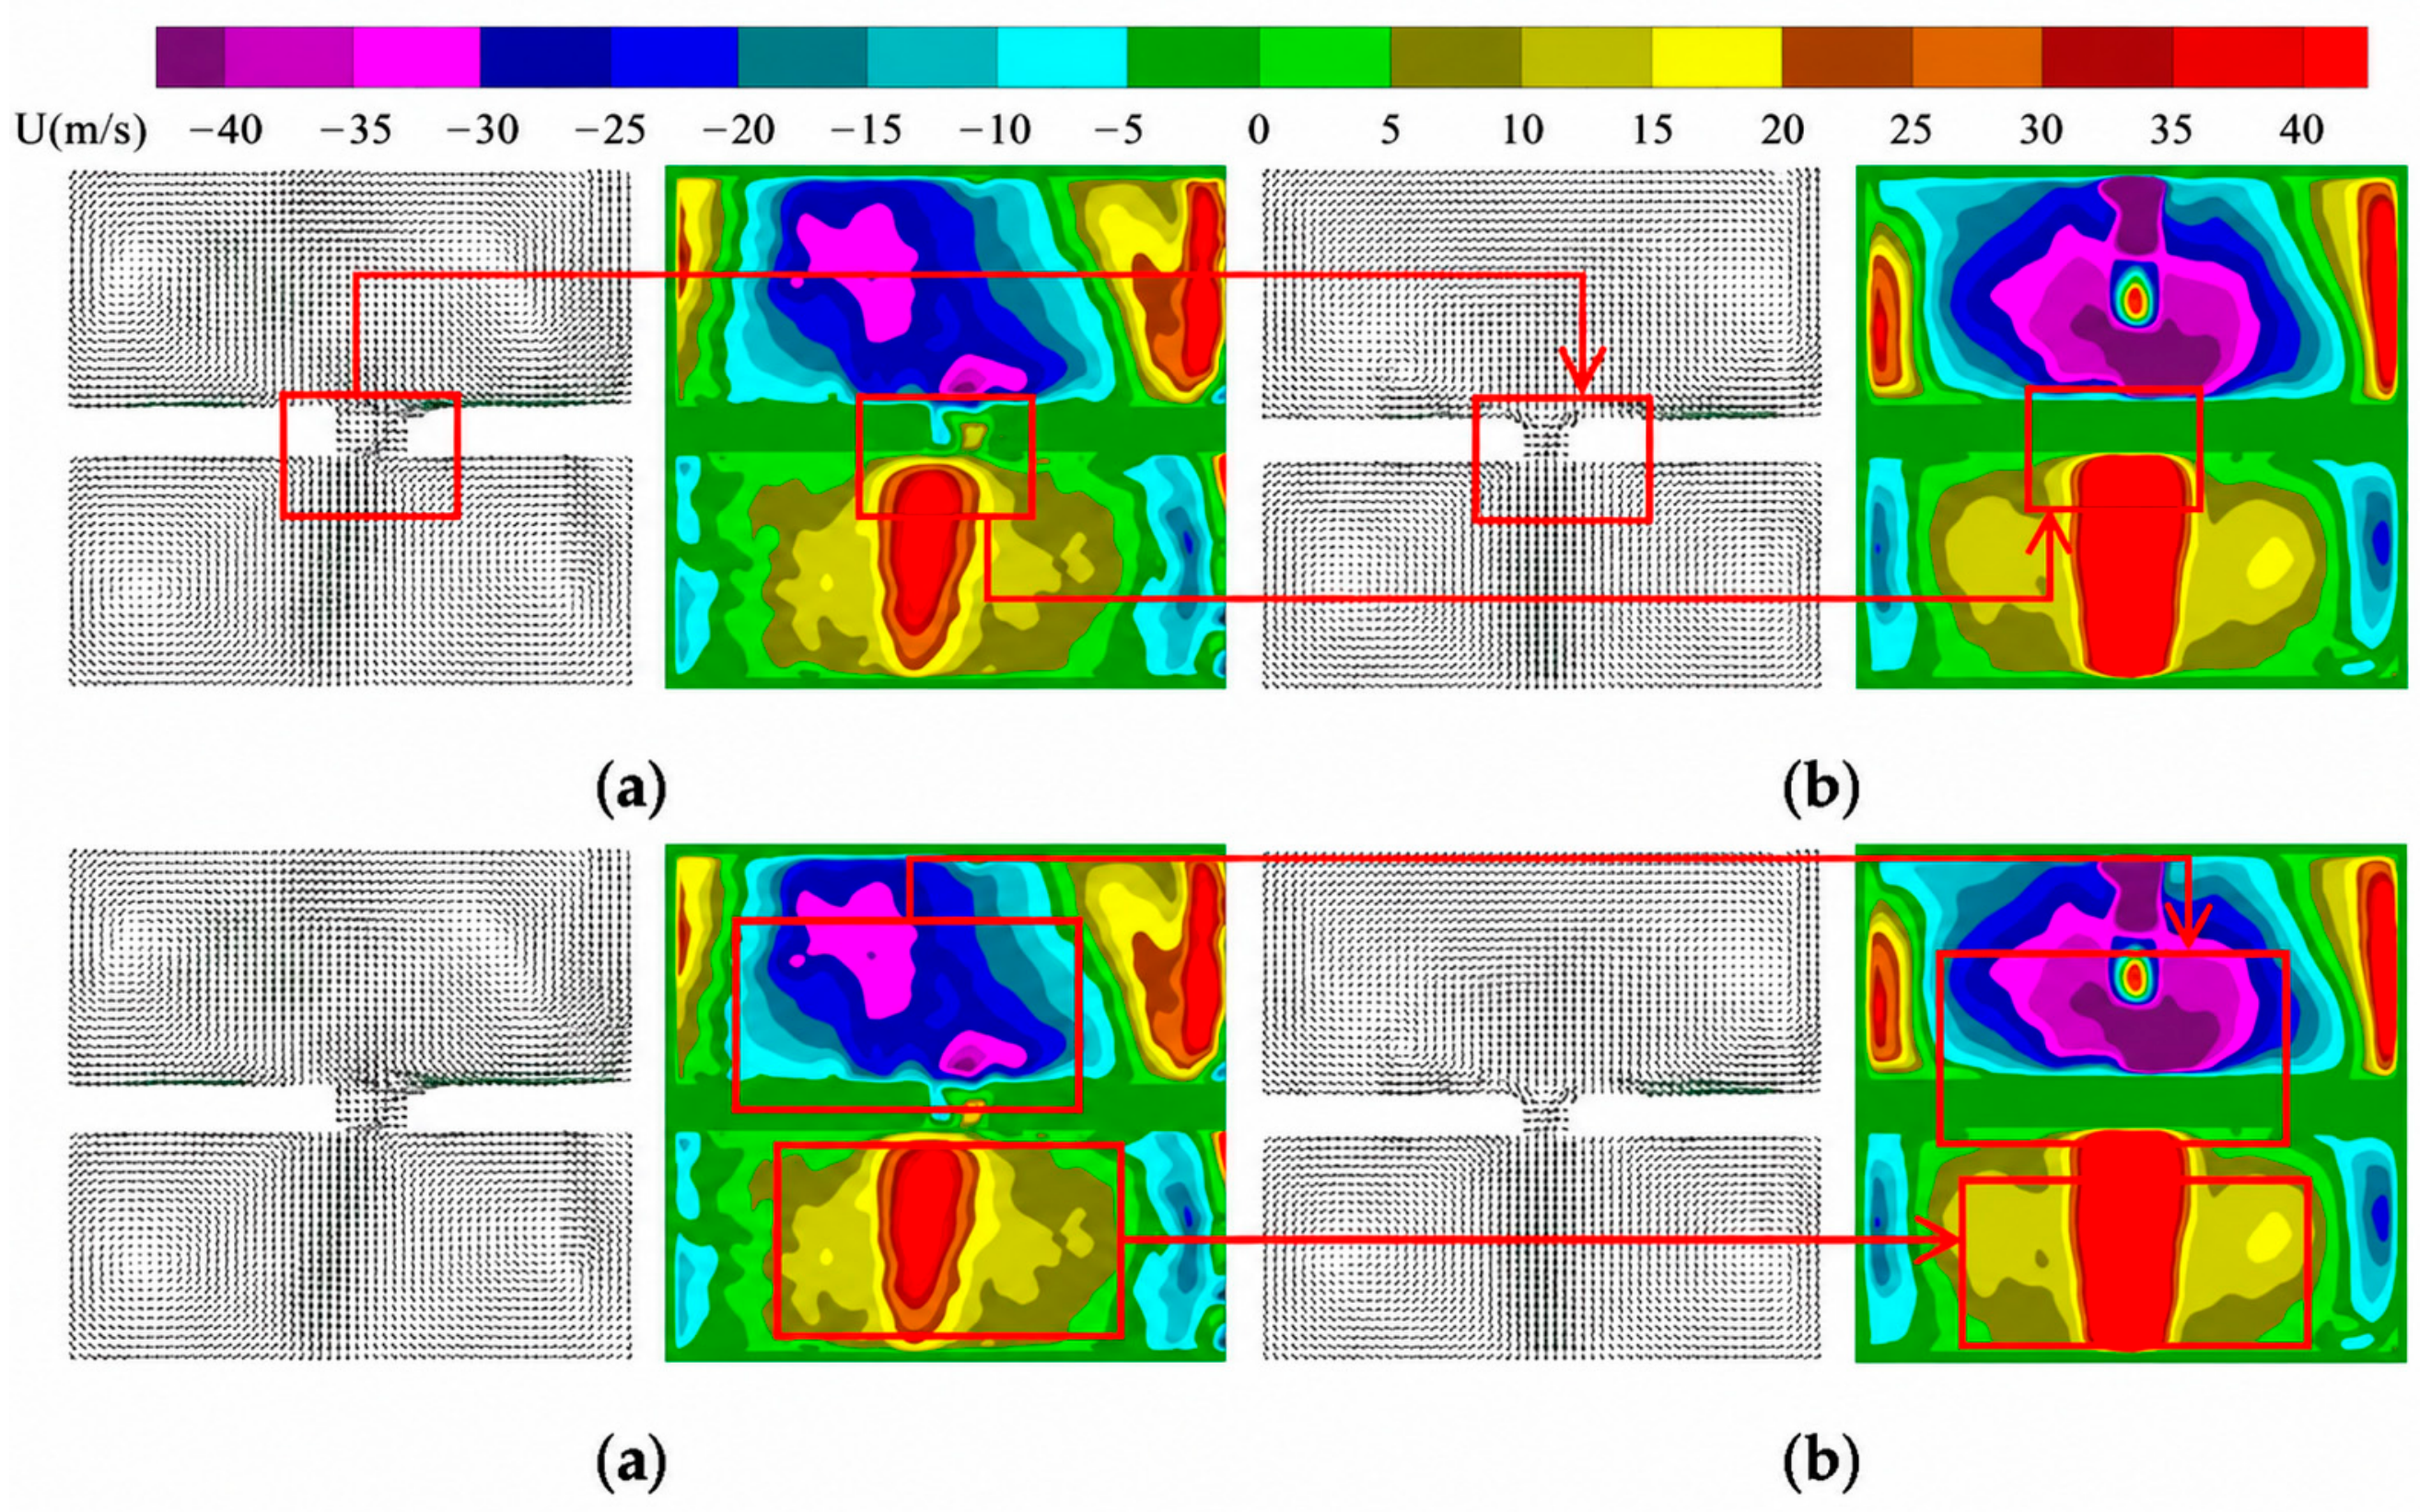
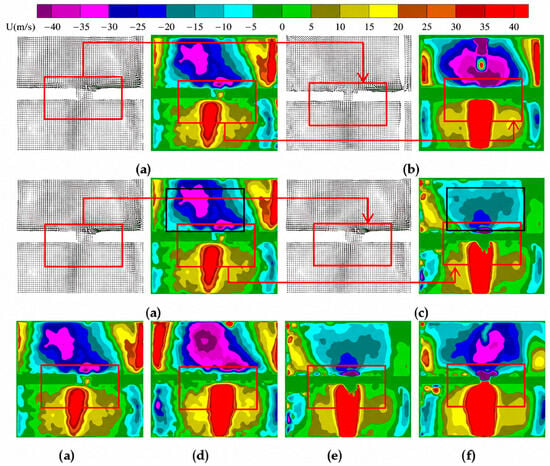
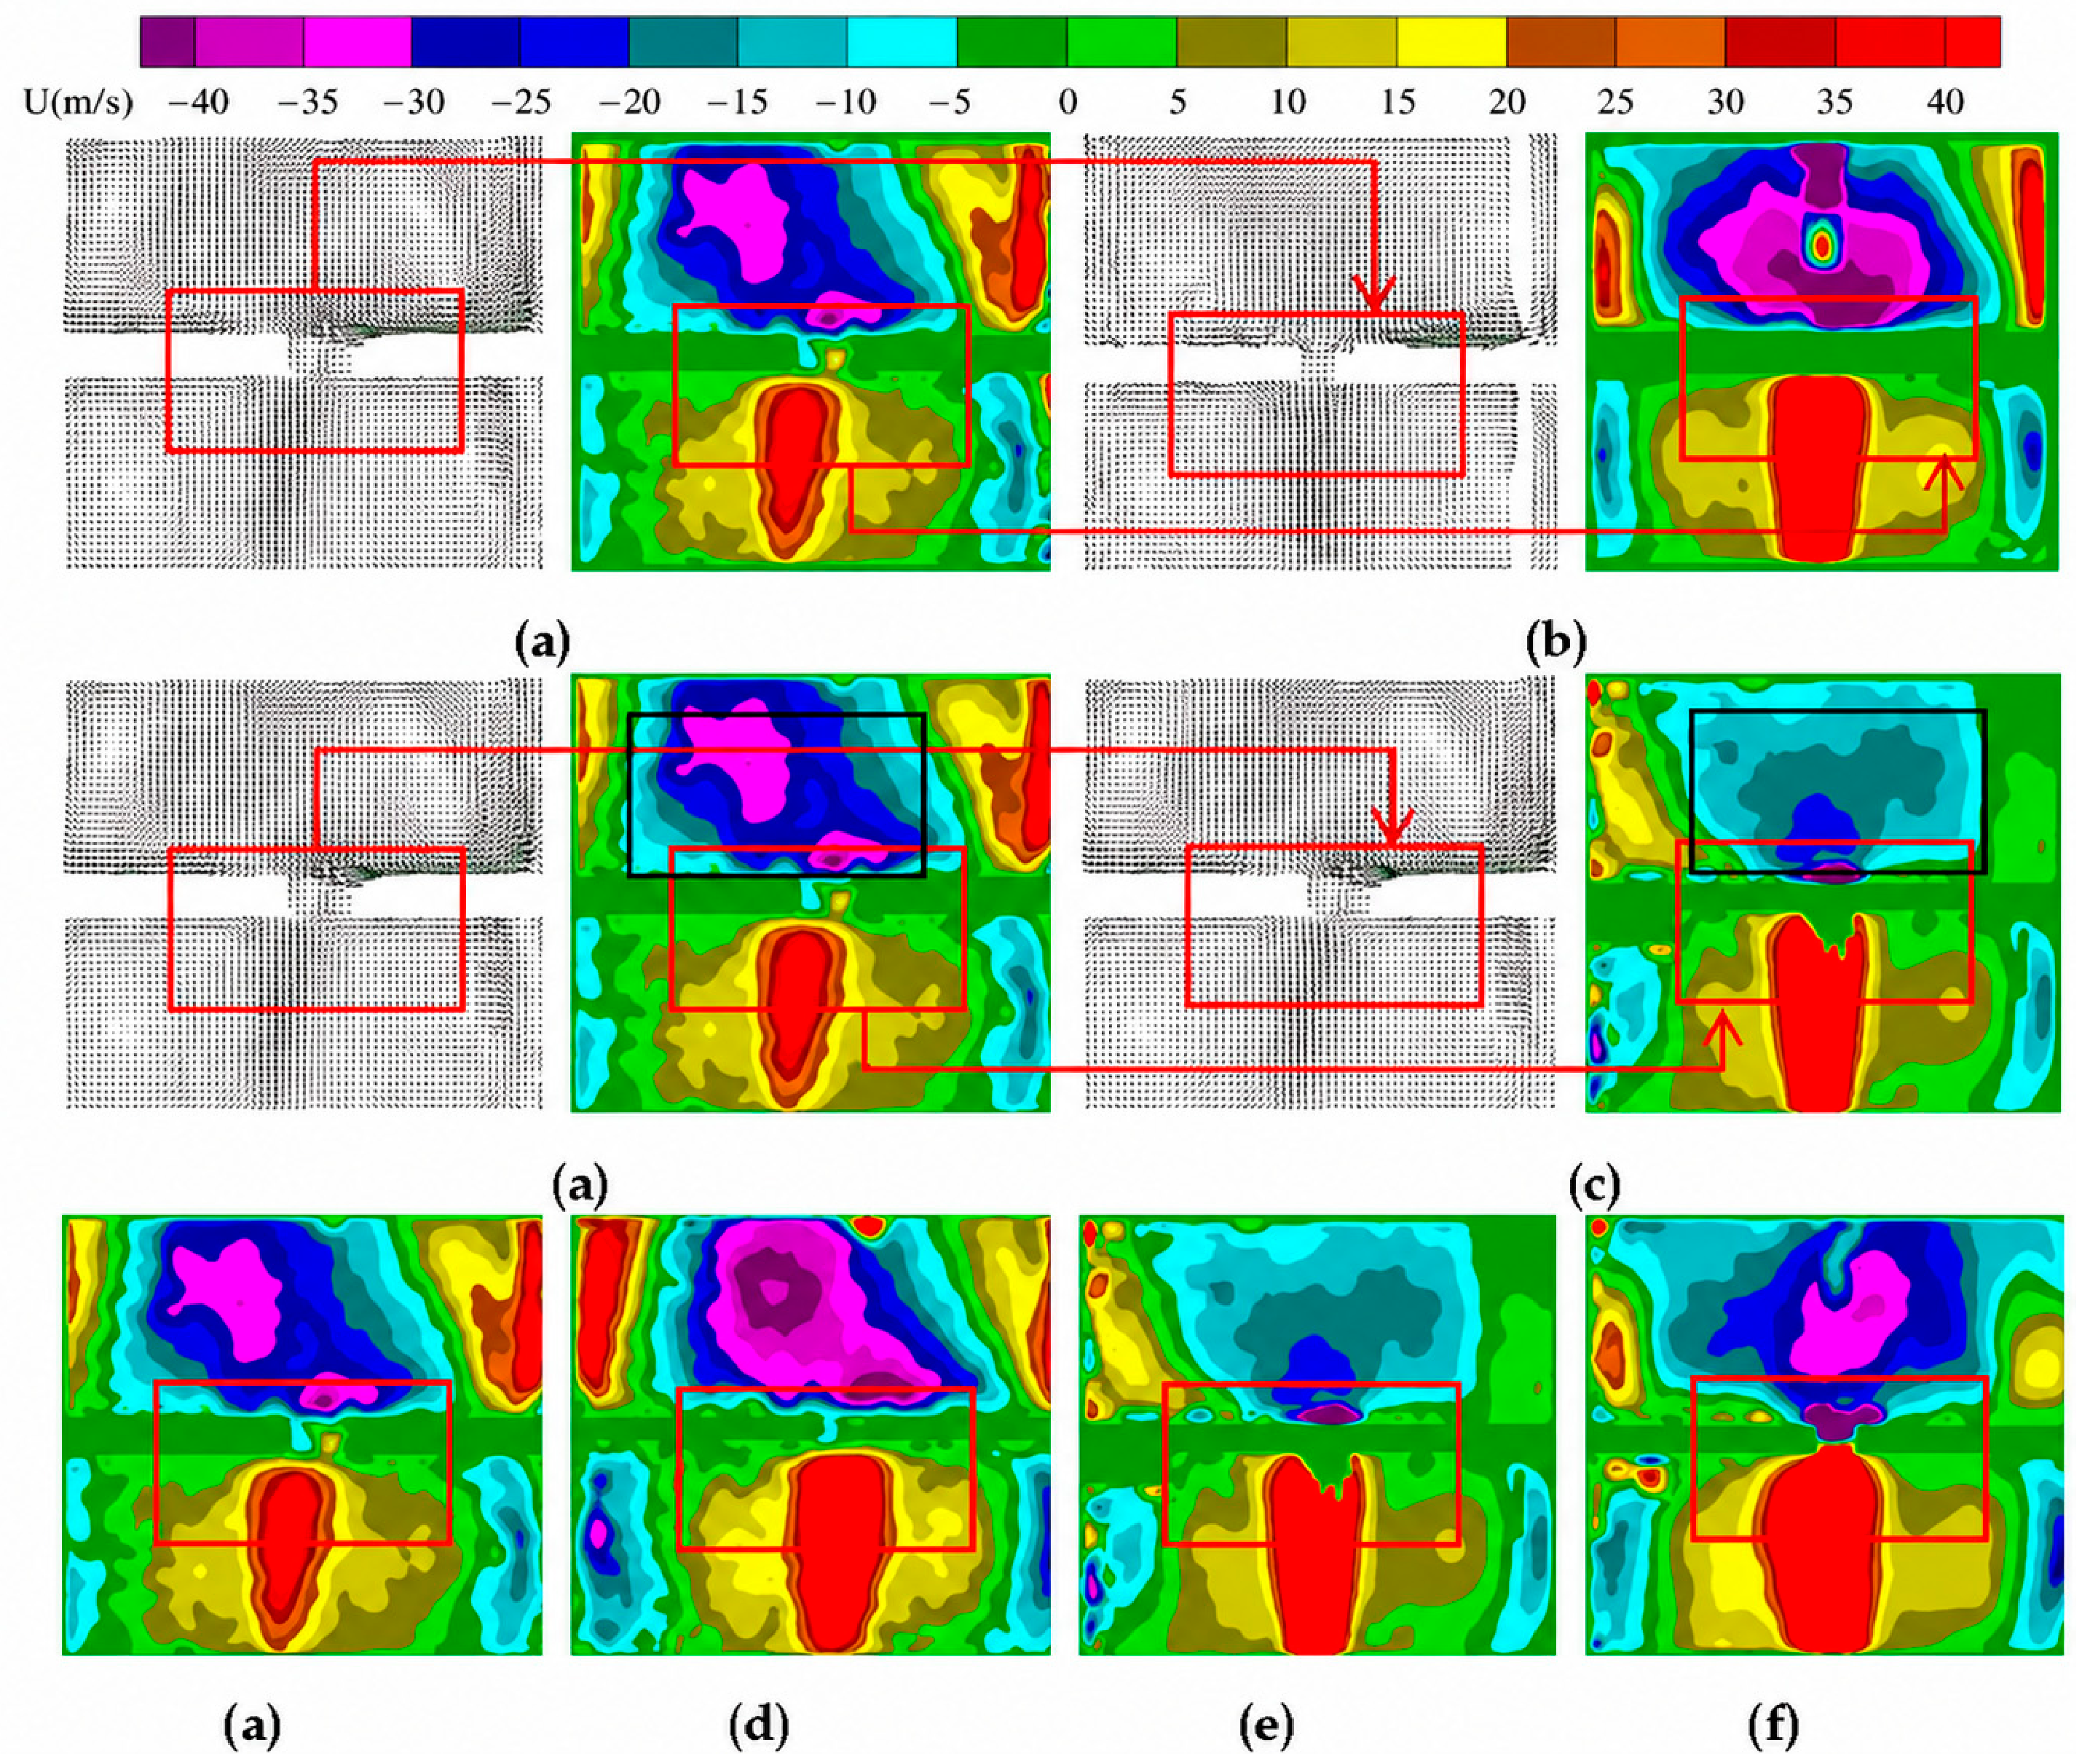
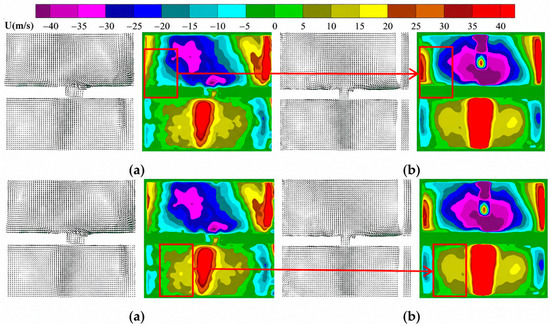
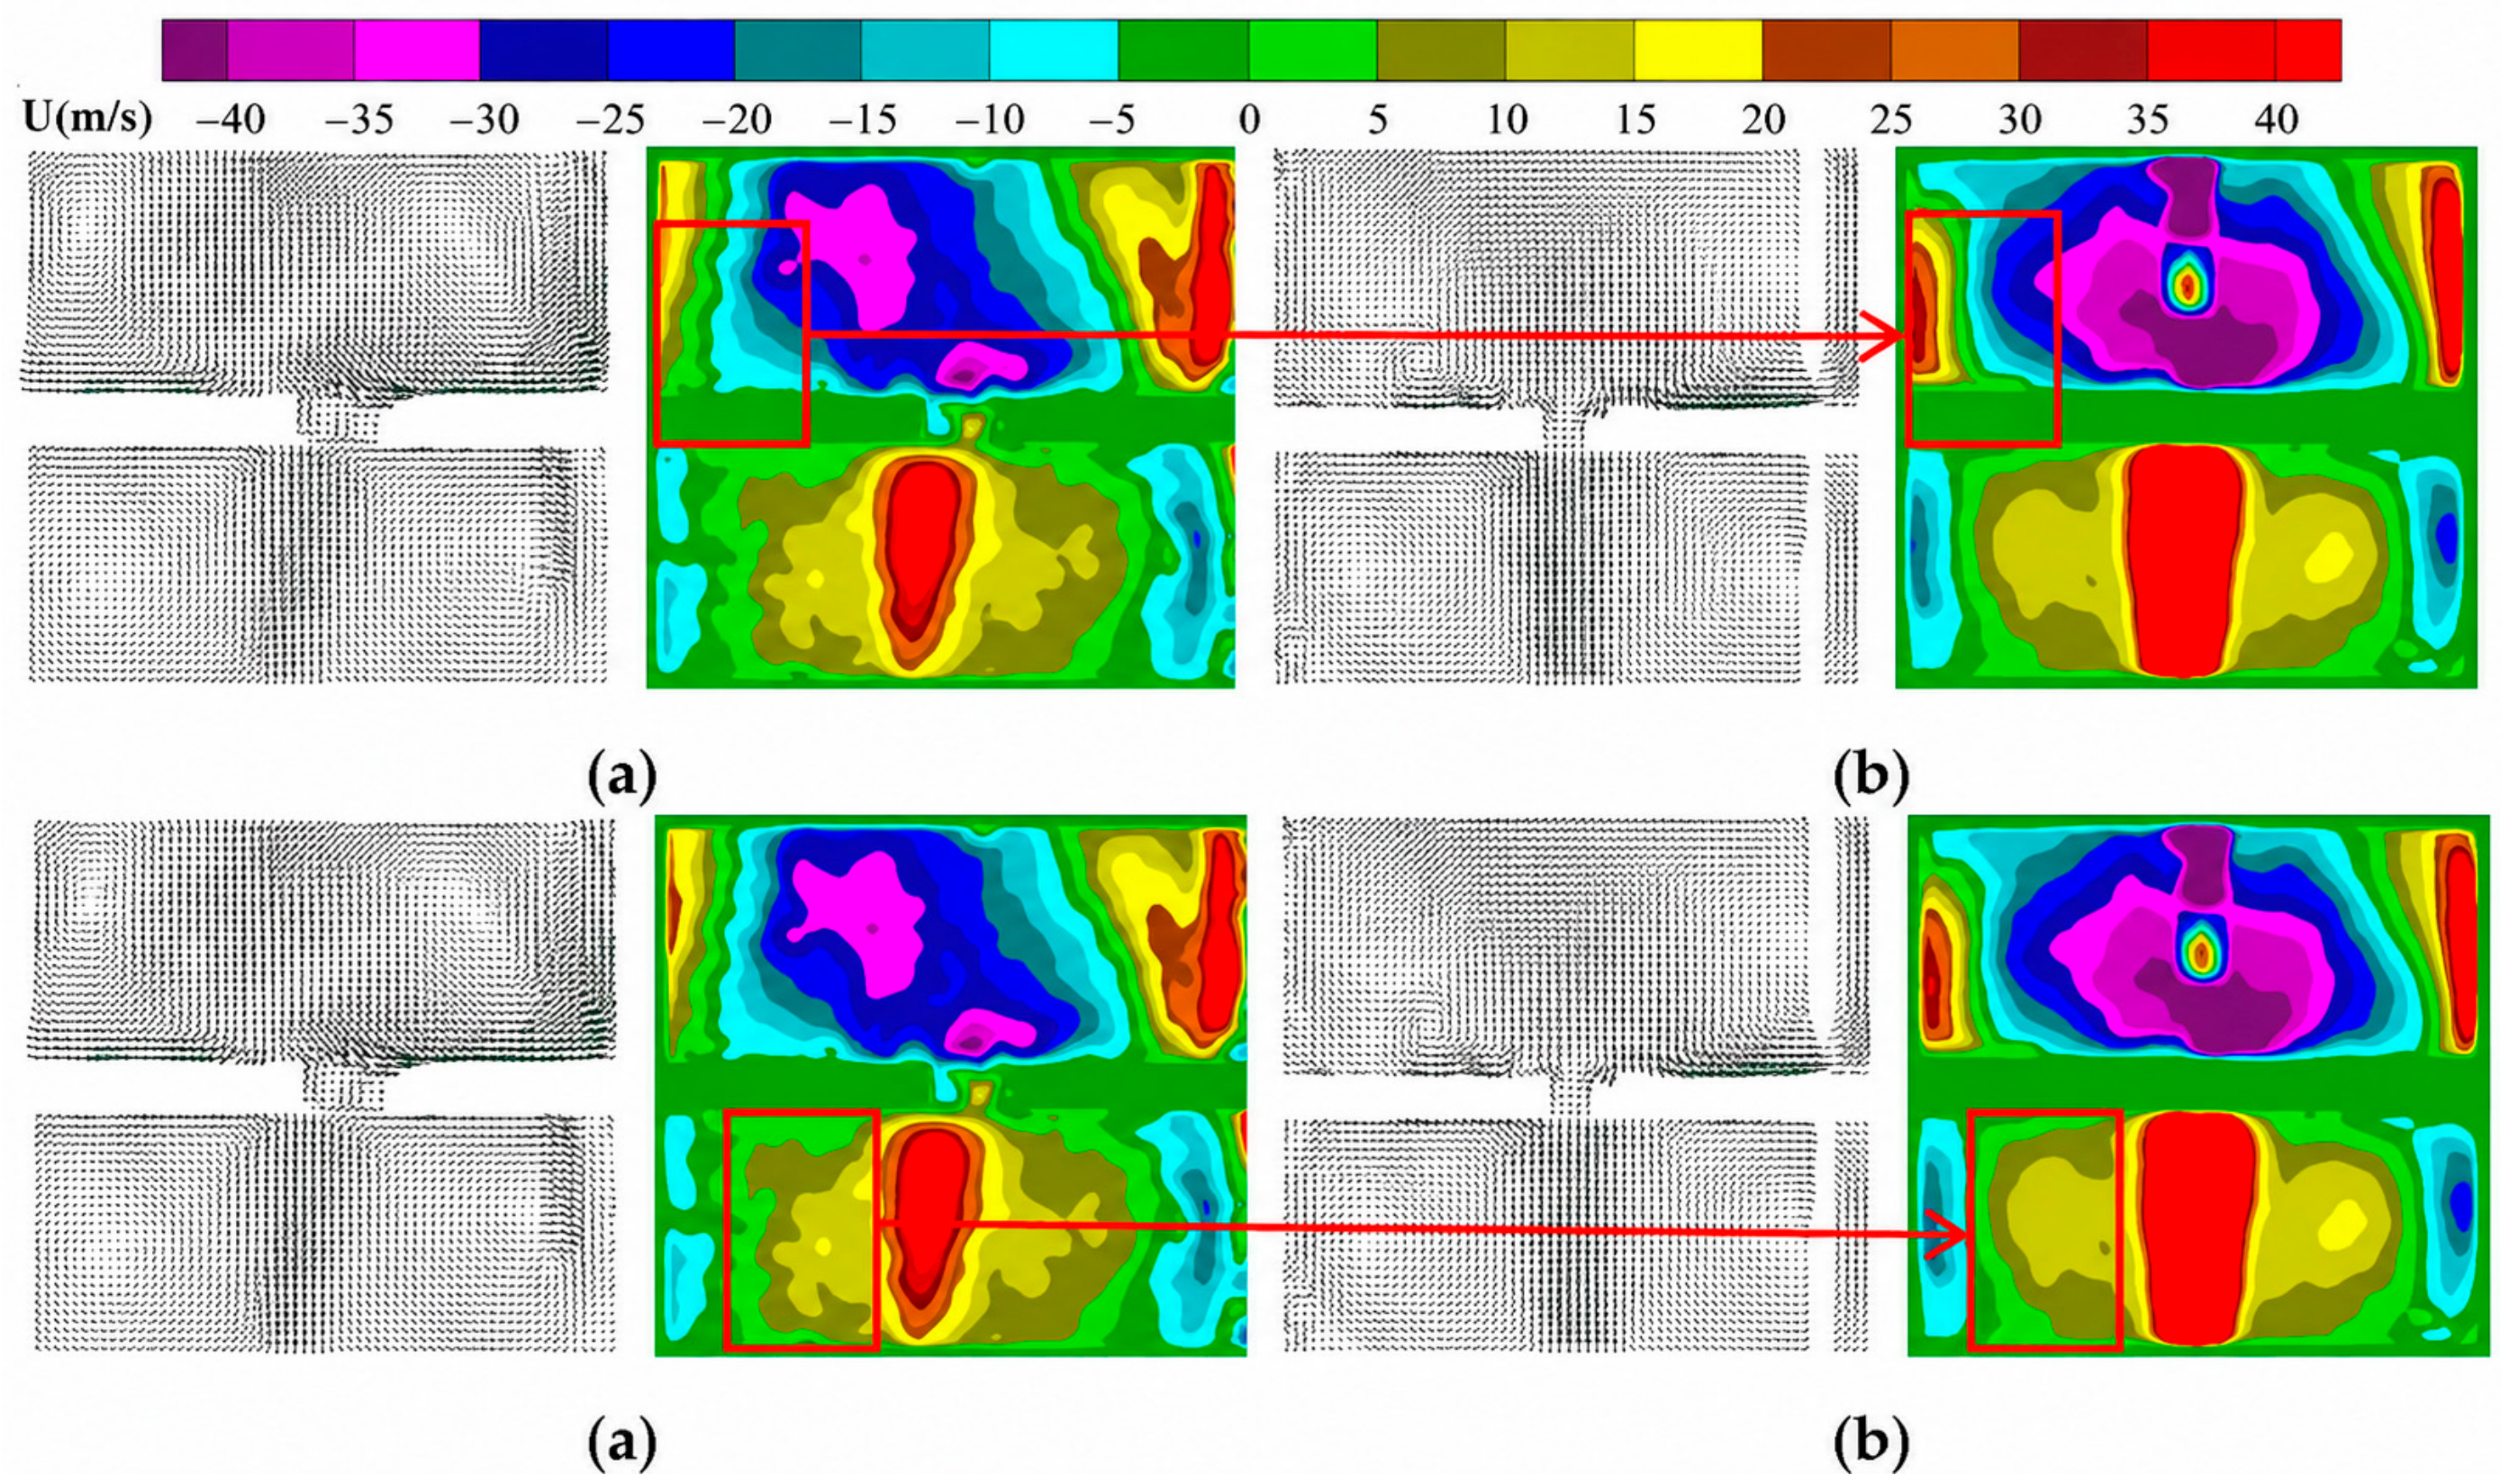
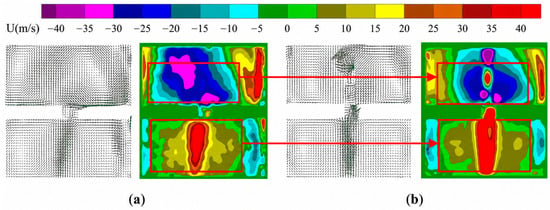
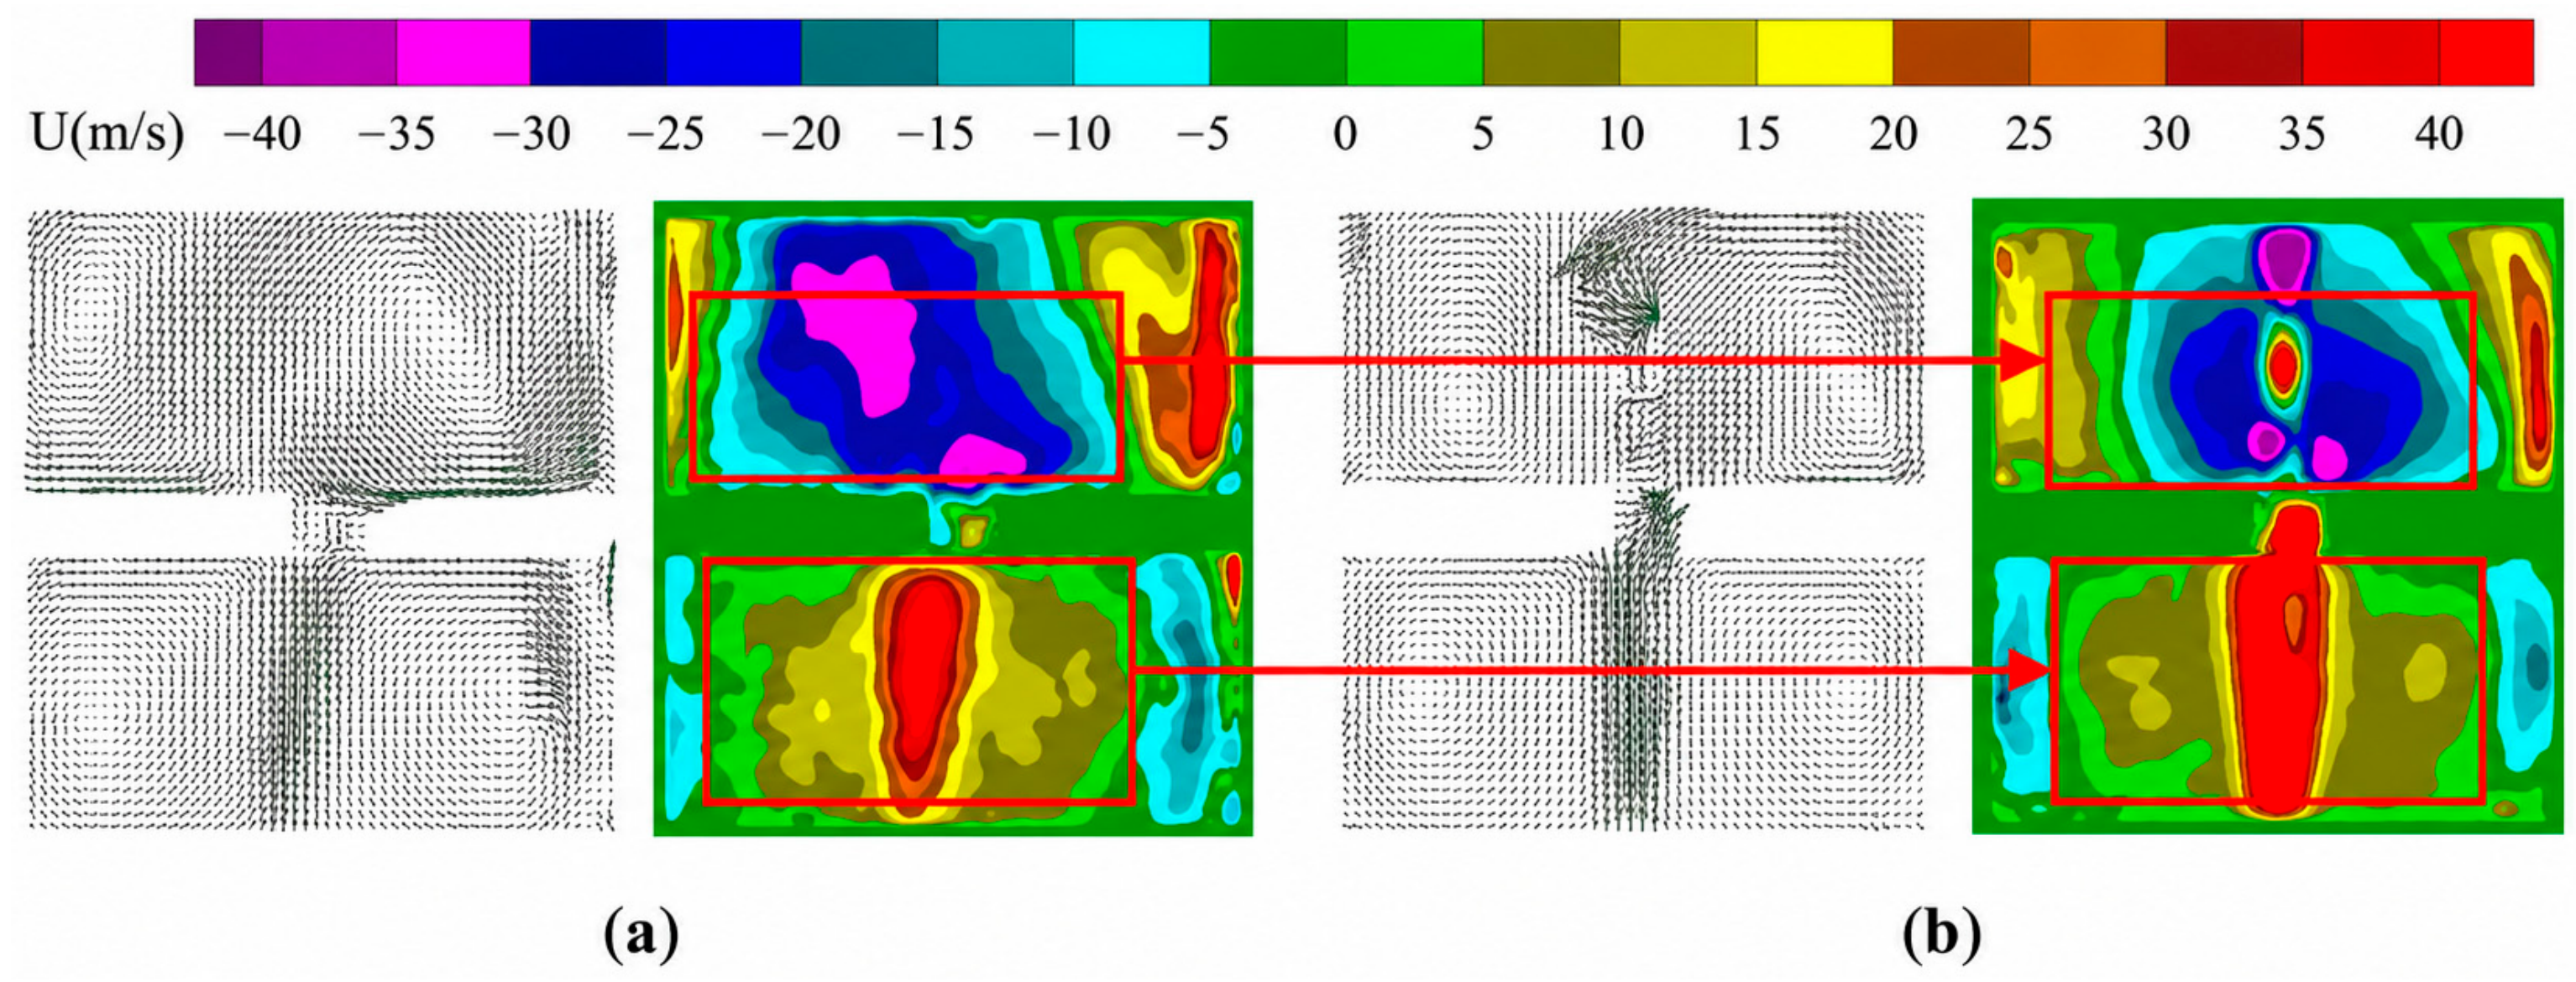

Disclaimer/Publisher’s Note: The statements, opinions and data contained in all publications are solely those of the individual author(s) and contributor(s) and not of MDPI and/or the editor(s). MDPI and/or the editor(s) disclaim responsibility for any injury to people or property resulting from any ideas, methods, instructions or products referred to in the content. |
© 2026 by the authors. Licensee MDPI, Basel, Switzerland. This article is an open access article distributed under the terms and conditions of the Creative Commons Attribution (CC BY) license.