


Abstract
Volcanic aquifers are globally important groundwater resources, but their pronounced heterogeneity arising from lava emplacement, volcanic facies, structural features, and differential weathering makes hydrogeological characterization challenging. In many developing regions, limited field data further constrain aquifer characterization, increasing uncertainty in groundwater development and management. This challenge is evident in the Gilgel Gibe Catchment, where increasing groundwater demand and limited hydrogeological information require improved understanding of aquifer properties and productivity. This study characterized the aquifer systems of the Gilgel Gibe catchment primarily through lithological log and pumping test interpretations, supported by spring discharge measurements. A total of 30 deep boreholes were analyzed using pumping test data, including 14 with suitable recovery test data. Lithostratigraphic logs were integrated with diagnostic plots to identify aquifer conditions and select appropriate analytical solutions. The aquifer system is predominantly confined, followed by leaky-confined and locally unconfined conditions, interpreted using the Theis, Hantush-Jacob, and Neuman methods, respectively. Estimated transmissivity ranges from 3.9 × 10⁻⁶ to 1.3 × 10⁻² m2/s, while spring discharges varied from 0.002 to 5 L/s. The Setema, Upper, Middle, and Lower Basalt, and Trachyte flows form low to moderately productive, fracture-controlled aquifers. The Lower Pyroclastic deposits and stratified tuffs form low-productivity aquifers due to the predominance of tuffs, while rhyolite exhibits low productivity due to the predominance of massive lava layers. Alluvial deposits form shallow aquifers dominated by intergranular porosity, underlain mainly by low-permeability tuffaceous materials. These findings provide a hydrogeological basis for guiding groundwater exploration, supporting well-field development, and informing sustainable groundwater management in volcanic terrains.
1. Introduction
Aquifer characterization broadly involves evaluating the three-dimensional structure, hydraulic and transport properties, and geochemistry of aquifers [1]. However, physical aquifer characterization usually focuses on describing the three-dimensional lithohydrological structure of aquifers and estimating their hydraulic properties. It is essential for cost-effective groundwater development, providing key hydrogeological information for optimal well siting and design while reducing the risk of low yield [2,3]. By identifying transmissive units and their spatial variability, aquifer characterization supports efficient investment and informs long-term groundwater management, allocation, and protection [2]. Aquifer characterization also underpins groundwater modelling [4,5], as model reliability depends on the validity of the conceptual framework and the accuracy of hydraulic parameter inputs.
Volcanic aquifers are globally important groundwater resources, providing reliable, often abundant, and generally good-quality groundwater [6]. However, they are complex systems in which hydraulic properties are governed by the emplacement and cooling history of lava flows and are subsequently modified by weathering and hydrothermal alteration [7]. During emplacement, rapid cooling of the lava exterior forms a vesicular, brecciated, scoriaceous, clinker or smooth, undulating surface with a ropy appearance based on the type of lava flows, while thermal contraction develops fractures and joints [8]. The interior cools more slowly, forming dense massive lava with locally developed cooling fractures [6]. Development of clinker or scoriaceous materials at the top forms a highly permeable layer with permeability similar to coarse gravel, while the massive lava core has low permeability [8]. Weathering may enhance or reduce aquifer permeability depending on the nature of the parent material and the degree of weathering. It may enhance permeability by enlarging and connecting existing pores and fractures through mineral dissolution [9]. However, in volcanic aquifers where groundwater flow is primarily controlled by cooling fractures, weathering generally reduces permeability by filling or clogging fractures with secondary minerals [6,7,8].
Volcanic aquifers are particularly widespread across central, western, southwestern, and eastern Ethiopia, where groundwater occurrence and flow are strongly influenced by fracturing, faults, and interflow zones within the volcanic sequences and weathering [10,11,12]. The Gilgel Gibe catchment comprises a multilayered volcanic aquifer system developed within three major volcanic successions, each consisting of multiple lava flow units [13]. The Lower Volcanic Flows comprise Lower Basalt flows and Lower Pyroclastic units, the Middle Volcanic Flows consist of Middle Basalt flows and trachyte, and the Upper Volcanic Flows comprise Upper Basalt flows, rhyolite, and Upper Pyroclastic units [13,14]. Rifting following upper volcanic activity resulted in structural depressions around the Asendabo and Jimma areas. The Setema Basalt, the youngest volcanic unit, was emplaced after the rifting event [13,15,16]. Quaternary deposits also occur locally within valleys and topographic depressions.
The volcanic terrain is characterized by primary structures, including columnar joints in basalts and flow banding in trachytes and rhyolites, and major ENE–WSW-trending normal fault systems that may influence groundwater flow and hydraulic connectivity by providing preferential pathways and locally offsetting volcanic aquifer units [13]. The older volcanic units formed through fissural eruptions, producing extensive lava flows and dykes, where fractures and permeable contacts between successive lava flows provide pathways for groundwater flow. However, the youngest unit, Setema Basalt, formed through central volcanism and comprises thick lava flows, vesicular and scoriaceous basalt that provide potential groundwater storage and flow [13,17].
Current understanding of Tertiary volcanic aquifers, particularly those hosted by basalt and andesite, indicates that cooling-related fractures play a significant role in controlling aquifer permeability [6,7]. Although fractures control groundwater flow, their nature and origin in the Gilgel Gibe volcanic terrain remain poorly defined. While regional studies indicate that tectonic fracturing associated with the development of the Main Ethiopian Rift (MER) significantly influenced groundwater flow [13,18]. Together with cooling fractures of lava, flow contacts, vesicular and scoriaceous zones, and interlayered tuffs, pyroclastics, volcanic ash, and paleosoils, these features likely control groundwater occurrence and movement [13,14,19].
Weathering has affected all volcanic units, with surface weathering profiles particularly developed in the exposed volcanic rocks [15,20]. Relatively pronounced weathering and paleosoils are mainly observed in the older Lower Basalt and Trachyte units, while varying degrees of weathering occur in the other lithologic units [13,15]. Such weathering may reduce permeability depending on the degree of weathering. The presence of localized columnar jointing within the basaltic unit, particularly in the lower catchment, may enhance vertical hydraulic connectivity [14,21]. The pyroclastic flow deposits are dominated by ignimbrites and tuffs with variable degrees of consolidation, which may reduce primary porosity [14].
However, a detailed hydrogeological model of the catchment is still lacking. The spatial extent of the heterogeneous volcanic units and the distribution and development of secondary permeability, including fractures, weathered zones, vesicular and scoriaceous horizons, and flow contacts, remain insufficiently characterized. Lack of comprehensive hydrogeological information has contributed to costly deep-well failures, including the abandonment of 165 m and 187 m wells at Jimma University and a 250 m well at Dimtu due to low yields. Limited hydrogeological data, such as transmissivity and hydraulic conductivity, constrain groundwater flow and solute-transport modeling. Previous studies have investigated the regional geology and hydrogeology [13,14,15,16,21,22]. However, these studies were largely regional in scope and relied on a limited number of boreholes, specifically within the Gilgel Gibe catchment. The local geological and hydrological studies concentrated in and around Jimma city [23,24,25]. Tadesse [23] characterized the aquifer system of the Jimma area as comprising alluvial sediments underlain by volcanic rocks, while Kitessa [25] emphasized aquifer characterization and hydraulic parameter estimation.
In recent years, the availability of borehole data has increased substantially due to intensified groundwater development driven by growing demand. These boreholes provide valuable lithological data, time-drawdowns, and groundwater levels, although water strikes are poorly documented. These data offer the potential for applying analytical models to pumping test analysis to better understand the potential and productivity of aquifer systems in this data-scarce region. Integrated analysis of borehole-log data and pumping test responses supports the derivation of reliable hydraulic parameters, thereby enabling characterization of aquifer systems [26]. Diagnostic plots combined with lithological data help identify aquifer characteristics and flow regimes, guide analytical model selection, and estimate hydraulic parameters [27,28,29]. Although multiple methods are available, single-well pumping tests are most commonly employed in the region due to data availability [25,28]. Pumping tests provide a reliable means of characterizing aquifer systems, with diagnostic plots aiding in the interpretation of groundwater flow regimes and guiding the selection of appropriate analytical models [30].
Within this context, the present study aims to provide a comprehensive physical characterization of the aquifer systems in the Gilgel Gibe catchment by integrating lithologic information from well logs with pumping test analyses, supplemented by field observations and spring discharge measurements. This integrated approach provides useful information for groundwater resource planning, sustainable aquifer management, well-field development, and long-term water security strategies in the catchment.
2. Materials and Methods
2.1. Location of the Study Area
Figure 1 shows the location of the Gilgel Gibe catchment within Ethiopia and its regional setting in northeastern Africa.
Figure 1.
Location of the study area: (a) Gilgel Gibe catchment within Ethiopia and the surrounding region; (b) topography, major towns, road network, perennial rivers and reservoir of the catchment.
Covering an area of approximately 5145 km2, the catchment experiences a humid tropical climate, with a mean annual rainfall of about 1546 mm and an average annual temperature of approximately 19 °C. The landscape is characterized by a pronounced topographic gradient, with elevations ranging from 1080 to 3329 m above sea level. This diverse terrain comprises elevated plateaus and highlands that transition through moderately to steeply sloping hillsides into deeply incised V-shaped valleys and lowland plains. The resulting geomorphic complexity exerts a fundamental control on surface runoff, groundwater recharge and discharge processes, and the heterogeneity of aquifer systems.
Regional geological investigations in southwestern Ethiopia began in the early 1970s, with Kazmin [17] and Davidson et al. [31] documenting the dominance of Tertiary volcanic rocks related to the Ethiopian Flood Basalt Province. Merla et al. [32] classified the Gilgel Gibe area within the Jimma Volcanic Province, comprising mainly Oligocene–Miocene rhyolite, trachyte, and basalt, with Miocene–Pliocene Wollega basalts and minor acidic tuffs in the northeast. Mengesha et al. [33] further subdivided the succession into Late Eocene–Late Oligocene Jimma Volcanics, Oligocene–Miocene Makonnen Basalts, and Miocene–Pliocene Nazret Series, with the Jimma Volcanics comprising lower basaltic flows and upper silicic units of trachyte, rhyolite, and tuff. Despite these advances, the lithological classifications remained relatively generalized for detailed catchment-scale interpretation.
Recent investigations in southwestern Ethiopia indicate that the Gilgel Gibe catchment is predominantly covered by Tertiary volcanic formations, ranging from pre-Oligocene to Pliocene in age. The volcanic succession comprises pre-Oligocene Lower Tertiary volcanic units, including basalt and pyroclastic flows, overlain by Oligocene Middle Tertiary volcanic sequences of Middle Basalt and trachyte flows. These are further overlain by younger Miocene–Pliocene volcanic formations comprising Upper Basalt flows, rhyolite, pyroclastic materials, and the Setema Basalt [13,20,34]. Quaternary stratified tuffs and alluvial deposits occur locally in the lowlands and along major river valleys [13]. The spatial distribution, degree of fracturing, structural setting, and lithological variability of these geological units play a key role in aquifer development by controlling groundwater occurrence, flow pathways, and hydraulic properties within the catchment. The presence of interlayered paleosoils, tuffs, pyroclastic deposits, and volcanic ash promotes groundwater retention while restricting vertical flow and hydraulic connectivity [14,21,22]. Similarly, weathering of palaeosurfaces at the tops of older volcanic flows, particularly within the lower to middle flow sequences, likely reduced the original permeability [20,34]. The alternation of these low-permeability horizons with cooling-induced fractured lava flow layers forms vertically heterogeneous volcanic aquifers. The catchment receives substantial annual recharge, estimated at 181–442 mm [35], with higher recharge occurring in the upper catchment, particularly around Dedo, Sembo, Seka, Jimma, Setema, and Semodo (Figure 1), where most tributaries to the main river originate [35,36].
2.2. Data Collection and Analysis
To characterize the aquifer system of the catchment, a combination of field survey, desk-based review of existing documents, interpretation of borehole logs, and pumping test analysis was carried out. A systematic survey was undertaken to gain an integrated understanding of the aquifer system, accompanied by a series of field campaigns conducted between 2022 and 2024 across several localities within the catchment. The field survey involved observation of geological exposures, including quarry sites, river valley outcrops, natural rock outcrops, road-cut sections, clay brick production sites, and well drilling activities.
Available documents related to well inventory, groundwater chemistry, drilling logs, and pumping test data were mainly collected from the Jimma Zone Water and Energy Office and supplemented by additional data obtained from district offices in Dedo, Omonada, Sekoru, Dimtu, Serbo, and Yebu (Figure 1). Furthermore, relevant documents and maps regarding the geology and hydrogeology of the region were collected from the Geological Survey of Ethiopia (GSE), currently called the Geological Institute of Ethiopia (GIE). Relevant hydrogeological information, such as groundwater levels, was additionally obtained through interviews and consultations with hand-dug well owners and local experts working in Water and Energy offices at the district level. During the desk review, the most recent geological maps of the study region by Haro et al. [13], Alemu [15], and Zenebe et al. [16] were identified, digitized, mosaicked, and clipped to the catchment boundary.
A total of 82 borehole (BH) records were available and collected, although some contained incomplete information. Borehole records lacking GPS coordinates were flagged and subsequently located using GPS during field campaigns. Boreholes with lithological logs and pumping test records were prioritized to support aquifer classification and estimation of hydraulic parameters. Of 82 BHs, seven are situated outside the catchment but in proximity to its boundary; these were used only to provide supplementary information on the lateral continuity of geological units. Of the 75 BHs located within the catchment, only 30 contained both lithological logs and pumping test datasets, whereas the remaining 45 included lithological logs only. Wells with pumping test data have both drawdowns during pumping and residual drawdowns during recovery. Pumping durations varied between 13 and 72 h, while recovery periods ranged from 1 to 7 h across different boreholes.
Pumping test analyses were conducted using data from sparsely distributed water supply boreholes intersecting multiple permeable and semi-permeable layers. Due to the lack of nearby observation wells, single-well pumping test approaches were applied. All productive intervals were jointly screened and tested under the assumption of an equivalent single-layer aquifer, in which the effective transmissivity represents the cumulative hydraulic contributions of the individual permeable layers. This approach is commonly applied in heterogeneous volcanic aquifer systems [27,28]. However, in addition to the inability to resolve the hydraulic properties of individual layers, this assumption may also force aquifer units of different types (unconfined, confined, or leaky) to be treated as a single hydraulic system, propagating uncertainty.
Lithological profiles of the boreholes were constructed using Strater 5 software by integrating well log information with corresponding casing and screen configurations. Static Water Level (SWL) and Dynamic Water Level (DWL) were superimposed on the lithological and well casing columns to illustrate the hydraulic response of aquifer units during pumping. This integrated representation, together with diagnostic plots, facilitated the identification of aquifer conditions and flow regimes, provided insights into the storage and permeability characteristics of the hydrogeological units, and supported the selection of appropriate analytical models for pumping test interpretation.
A diagnostic plot represents drawdown and its logarithmic derivative plotted against time on a log–log or semi-log scale [30]. It has been widely recognized as an effective tool for interpreting aquifer–well system behavior, as they enable evaluation of hydraulic responses and provides insight into aquifer properties and boundary conditions. Specifically, diagnostic plots facilitate the identification of wellbore storage and skin effects, detection of recharge or constant-head boundaries, and differentiation between radial and linear flow regimes. In this study, diagnostic plots were generated using AQTESOLV-Pro 4.5 software [37] to characterize groundwater flow behavior and identify aquifer conditions, providing a basis for selecting appropriate analytical models for pumping test interpretation. Combined with well log data and SWL conditions, these analyses enabled the classification of aquifers as confined, leaky-confined, or unconfined. The corresponding analytical solutions were then applied to estimate transmissivity (T).
2.3. Pumping Test Interpretations
Pumping test analysis is widely used to estimate field-scale transmissivity (T), Storativity (S), and hydraulic conductivity (K), providing more representative hydraulic properties than laboratory tests [30,38]. Although conventional analytical solutions assume homogeneous and isotropic conditions, they provide practical and widely accepted estimates of equivalent aquifer properties [39]. This method requires relatively simple data, is easy to apply, and is particularly valuable in geologically complex volcanic aquifer systems [28]. However, in single-well pumping tests, only transmissivity can be reliably estimated in practice. S estimation is sensitive to uncertainty in effective well radius [40], while the noisy drawdown measurements and limited water-strike data in this study constrain estimation of K as well. Pumping test analysis was conducted using AQTSOLV-Pro 4.5 [37], applying analytical models that were selected based on the aquifer type and groundwater flow regime identified through diagnostic plots and lithologic-log interpretation. Specifically, the Theis solution [41] was applied to confined aquifers, the Hantush–Jacob solution [42] was applied to leaky-confined aquifers, and the Neuman solution [43] was applied to unconfined aquifers. These pumping test interpretation methods are widely used in Ethiopian volcanic aquifers and are well documented in both published literature and unpublished well design reports.
The Theis solution is an analytical method used to estimate transmissivity (T) and storativity (S) of confined aquifers from pumping test data under both constant and variable discharge, with variable discharge incorporated through superposition [41]. The solution assumes radial flow toward a fully penetrating well in a homogeneous, isotropic, confined aquifer of infinite extent. The drawdown, s, at a radial distance r from the pumping well at time t is expressed by Equation (1), while the dimensionless parameter u is defined by Equation (2).
Q is the constant pumping rate; W(u) is the exponential integral well function; T is transmissivity, and S is storativity.
Observed drawdown data were analyzed by matching them to the Theis type curve using AQTSOLV-Pro 4.5, with interpretation restricted to pumping periods during which the diagnostic plots indicated predominantly radial flow conditions, to estimate transmissivity. Under these conditions, the Theis method provides reliable transmissivity estimates for confined aquifers and serves as the theoretical foundation for several simplified analytical solutions. However, its applicability is limited in heterogeneous, fractured, leaky, or unconfined aquifers, and the results may be influenced by wellbore storage, partial penetration, and boundary effects.
AQTESOLV-Pro 4.5 supports both visual and automatic curve-matching methods for pumping test interpretation [37]. The automatic curve-matching approach uses the entire dataset, including early-time data influenced by wellbore storage effects. While this approach ensures fully reproducible results, it may introduce errors in parameter estimation. In contrast, visual curve matching allows the analyst to focus on data corresponding to periods of ideal radial flow, potentially producing more accurate parameter estimates. This method leverages expert judgment but is inherently subjective and relies on analyst experience. For this study, we applied visual curve matching to achieve more reliable results.
The Theis residual drawdown (recovery) method was applied to analyze post-pumping water level recovery data following the cessation of pumping. This approach is based on the principle that aquifer recovery follows the same transient flow behavior as drawdown and allows estimation of aquifer transmissivity by evaluating residual drawdown as a function of time since pumping stopped [41]. The method is less sensitive to short-term pumping rate fluctuations and wellbore storage effects, making it particularly useful where pumping data are noisy or operational conditions are variable.
Pumping test data from leaky confined aquifers were interpreted using the Hantush–Jacob analytical solution [42]. This solution extends the classical Theis confined-aquifer model [41] by accounting for vertical leakage through a semi-permeable confining layer, while assuming negligible storage within the aquitard. The analysis is based on the assumptions of radial flow toward a fully penetrating well in a homogeneous, isotropic aquifer of infinite lateral extent.
Pumping test data from unconfined aquifers were analyzed using the Neuman solution [43]. Unlike simpler analytical approaches such as Theis [41] or Cooper and Jacob [44], the Neuman [43] method explicitly incorporates the effects of delayed yield and partial well penetration. The solution modifies the classical drawdown formulation by accounting for the transient storage behavior of the unsaturated zone above the groundwater table, thereby providing a more realistic representation of aquifer response under pumping conditions.
The Neuman approach involves solving a system of partial differential equations describing groundwater flow in both the saturated and unsaturated zones, subject to appropriate initial and boundary conditions. Application of this method enables the estimation of transmissivity (T) from the available pumping test data.
For pumping test datasets whose diagnostic plots showed considerable deviation from ideal radial flow, indicating alternative flow regimes such as linear, bilinear, or spherical flow, the suitability of analytical solutions developed for such conditions, including those of Barker [45] and Gringarten and Witherspoon [46], was evaluated. However, due to their limited curve-matching performance, the Theis, Hantush–Jacob, and Neuman solutions remained in use, with parameter estimation restricted to the interval of the curves exhibiting a radial flow regime.
Based on the estimated transmissivity, along with the specific capacity of aquifers and spring discharges, the aquifer systems of the catchment were characterized and mapped. Transmissivity and specific capacity are widely applied indicators for evaluating aquifer potentiality and well productivity [47]. Wells in the study area were characterized based on the established ranges of transmissivity and specific capacity presented in Table 1.
Table 1.
Potentiality and productivity of wells based on transmissivity and specific capacity values [47,48,49].
3. Results and Discussions
3.1. Hydrogeological Setting of the Gilgel Gibe Catchment
Figure 2a presents the surficial geological setting of the Gilgel Gibe catchment, showing the distribution of surface geological units and the fault system, together with the locations of boreholes, springs, streams, rivers, and the reservoir. Lower Basalt flows are exposed in the Gilgel Gibe River valley, extending from the reservoir to the main outlet. Outcrops of the same rock are also exposed in the Bulbul area. Lower pyroclastic deposits cover the Gilgel Gibe reservoir area, while Middle Basalt flows occur northwest of Jimma city and north of Dimtu. Trachyte flows dominate the upstream part of the catchment, extending across Dedo, Jimma, and Sarbo. Upper Basalt flows cover much of the mountainous and plateau areas of the lower catchment and the Dedo highlands. Quaternary alluvial deposits are cover the main river valleys and depressed areas.
Figure 2.
Geological map compiled from Haro et al. [13], Zenebe et al. [16], and Alemu [15] described in stratigraphic order, and the locations of wells with log data and pumping test data. (a) surficial geologic map; (b) cross-sectional view along A–A′; and (c) cross-sectional view along B–B′.
Figure 2b illustrates a cross-sectional profile along the dotted line A–A′ across the upstream catchment, extending from the Mana to the Dedo Highlands and dissected by a river valley. The profile traverses the Middle Basalt flow, locally overlain by alluvial deposits along the valley floor and by Trachyte to the south. Along the profile, major hydrogeological features, including springs, streams, rivers, and boreholes, reflect the hydrogeological characteristics of the volcanic formations. Alluvial sediments are prominently developed along the Gibe River and its tributaries within the Jimma City lowland. The Mana and Dedo Highlands are characterized by relatively flat plateau surfaces that function as major groundwater recharge zones, whereas the Jimma City lowland represents a predominantly groundwater discharge area. However, surface runoff generated in the highlands may reach the adjacent lowland areas and locally contribute to groundwater recharge [35].
Similarly, Figure 2c illustrates a cross-sectional profile along B–B′, intersecting mainly lower pyroclastics underlain by Lower Basalt flows and overlain by trachyte and Upper Basalt in the north, and rhyolite in the south, while crossing major hydraulic features, including Gilgel Gibe I Reservoir. The reservoir area is characterized by distinct geomorphological settings. The northern margin, within the Upper Basalt terrain of the Tiro Afeta area, exhibits slopes that transition from steep gradients to gentler inclinations toward the reservoir. Piezometric heads measured in hand-dug wells along the northern margin are shallow, typically less than 5 m below ground surface, indicating a generally shallow groundwater table that likely contributes to the reservoir for the majority of the year. In contrast, the southern margin is characterized by low-lying plateau areas of lower pyroclastics and rhyolite in the Gudeta Bula and Bosso localities. Their relatively low permeability likely limits hydraulic interaction with the reservoir, resulting in a comparatively minor seasonal contribution to reservoir recharge.
3.2. Geological and Lithologic Interpretations: Insight from Field Observations
Extensive field observations revealed the presence of highly heterogeneous geological units across the catchment. Massive basaltic bedrock is exposed in the Bulbul area, extending northeastward from the Bulbul River gauging station toward Dimtu (Figure 3a). Massive basalt exposures along the northeastern bank of the Bulbul River support the presence of the Lower Basalt flow (Figure 3a). Fractured basalt and a 1–1.5 m thick overlying black clay layer are exposed in the Bulbul–Dimtu quarry (Figure 3b). The lithological log of BH62 (250 m deep) in Dimtu indicates alternating basalt, tuff, and ignimbrite in the upper 80 m, underlain predominantly by basalt. These observations suggest that the basalt flow extends northward toward Dimtu. BH62 was ultimately abandoned due to insufficient yield, likely resulting from the dominance of low permeability of the massive basalt and welded tuff units [14].
Figure 3.
Rock exposures: (a) Naturally exposed basaltic rock along the Bulbul River; (b) quarry exposure of fractured basalt situated between Asendabo and Dimtu; (c) quarry exposure of pyroclastics on the flank of Abba Jifar Mountain; and (d) road-cut exposure revealing a clay soil profile developed over a weathered basalt.
In the Asendabo area, mainly toward Deneba, in the proximity of the reservoir, pyroclastic deposits are prominently exposed. Pyroclastic fallout in the area seems to be lithic tuff that contains fragments of various sizes, ranging from sand to cobble. Road cuts along the Asendabo–Omonada road exposed these deposits, while unconsolidated sediments containing rock fragments at Galley Crosses suggest the potential presence of localized shallow aquifers. However, the area was mapped as older volcanic rocks of lower pyroclastic units, which are characterized by low permeability due to consolidation [13]. Several quarry sites around Jimma City, particularly along Aba Jifar Mountain, expose pyroclastic deposits, including tuff ranging from loose to well-lithified, as well as volcanic rocks with fine to coarse-grained textures (Figure 3c). The presence of hand-dug wells and springs indicates shallow groundwater within these unconsolidated and pyroclastic materials, suggesting localized perched aquifers overlying the bedrock.
Along the Jimma–Dedo road, construction cuts exposed thick clay-rich soils with distinct pedogenic horizons, but no bedrock was exposed. Along the Dedo–Chida road (Figure 3d) and Jimma–Yebu route, the soil profiles were relatively thinner and developed on weathered basalt. Shallow hand-dug wells suggest that the underlying weathered basalt forms a shallow aquifer in these areas.
Well drilling activities were also observed during the field campaign, specifically two deep wells, one located in Seka Chekorsa district (BH12) and the second located near Jimma city in the Bore area. The T3WDH truck-mounted hydraulic rig was employed for borehole drilling using the mud-rotary method, in which a rotating drill bit and circulating drilling fluid facilitate penetration and continuous removal of cuttings. This type of drilling machine has been used for most boreholes, with possible downhole sample mixing requiring cautious interpretation. During drilling, cuttings were systematically sampled at 2 m depth intervals by placing a small pan-type container beneath the returning fluid stream at the discharge point. For further characterization, the samples were organized in a systematic array, preserving the depth sequence and allowing clear correlation between depth and lithology. The BH12 lithologic samples consist of alternating clay, gravel, basalt, and sandy-silty formations. The gravel-rich intervals, particularly the gravel–clay layer where groundwater was encountered at 65 m, form productive unconfined aquifers, while the massive basalt at 92–106 m acts as a semi-confining unit. Deeper alternating layers of coarse and fine sand, silt, and highly weathered sand form a heterogeneous multilayer aquifer system, with coarse sands providing higher permeability and finer sediments locally acting as aquitards. Drilling observations from the Bore deep borehole indicate that weathered, fractured, and scoriaceous basalt form aquifer zones, while massive basalt acts as an aquitard and locally produces artesian conditions. The nearby Gilgel Gibe River may act as a constant head boundary, which can be evaluated using pumping test diagnostic plots.
3.3. Lithological Interpretation Based on Borehole Log Data and Field Geology
Qualitative interpretation of the borehole log data, together with field geological verification, was conducted well by well. A summary of the interpretation for each lithological unit/aquifer is presented in Table 2.
Table 2.
Geological time, lithological units, and descriptions.
Lithological profiles from randomly selected boreholes across different geological units are described in the following section. The profiles illustrate lithological variations with depth, together with the corresponding screened and blind casing intervals. Screened sections generally correspond to permeable strata intended for groundwater inflow, typically comprising sand, gravel, and fractured volcanic rocks, including basalt, trachyte, ignimbrite, and rhyolite. Blind casing intervals generally correspond to non-productive or low-permeability formations, such as clay and massive or slightly fractured bedrock. SWL and DWL were superimposed on lithological logs and well-screen configurations to support the interpretation of aquifer conditions.
Figure 4a shows the lithologic profile of BH22 drilled in an alluvial setting which exhibits a 50 m thick alluvial shallow aquifer. This unit is underlain by volcanic ash and clay layers extending to depths of 76 m and 94 m, respectively, which overlie a 16 m thick rhyolitic tuff. These layers, together with alluvial deposits, are isolated by blind casing. The water-bearing zones occur between depths of 110 and 180 m, where screened intervals intersect fractured basalt and fractured ignimbrite. The interlayered volcanic ash, clay, and tuff layers may act as aquitards, restricting vertical groundwater flow and locally confining the aquifer.
Figure 4.
Stratigraphic columns and well-construction layouts of boreholes located in different geological settings: (a) BH22 in alluvial deposits; (b) BH09 in Setema Basalt; (c) BH67 in Upper Basalt flows; and (d) BH25 in Middle Basalt flows.
Most borehole logs situated in this lithologic unit indicate that the aquifer system of alluvial deposits is underlain by volcanic rocks that consist of multiple layers, with low-permeability tuffs forming most of the sequence, while fractured basalt and ignimbrite layers act as the primary water-bearing zones in most boreholes. Fractured trachyte and rhyolite layers encountered at greater depths in boreholes BH22, BH23, and BH24 also function as aquifer units. The permeable horizons are compartmentalized by consolidated tuff, clay, massive basalt, and ignimbrite intervals and isolated by blind casing. The predominance of low-permeability lithologies, together with the limited thickness of fractured volcanic horizons, suggests generally low aquifer productivity.
Borehole BH09 (Figure 4b), drilled to 175 m in Seka Chekorsa near the upper Gilgel Gibe River, intersects interlayered basalt and ignimbrite layers with variable degrees of weathering and fracturing. Fractured basalt and ignimbrite constitute the primary aquifer zones, while weathered intervals provide secondary water-bearing zones. Basaltic lava dominates the upper profile, with ignimbrite occurring at greater depths. The artesian condition and highest yield among the Tertiary volcanic wells (23 L/s) likely reflect semi-confining weathered basalt horizons and regional groundwater flow through fractures and lithological contacts. Fault systems traversing the area (Figure 2) may also have enhanced borehole productivity. In contrast, BH07, drilled in a sequence dominated by massive ignimbrite with multiple paleosoil layers, is unproductive, yielding only about 1 L/s. This low yield indicates the presence of locally developed low-permeability zones within the geologic setting, reflecting high spatial heterogeneity of the aquifer system.
The dominance of fractured basalt and ignimbrite, together with pumice and scoriaceous basalt and the proximity to geological contacts and faults, contributes to relatively high groundwater productivity [12,50,51]. Most artesian wells in the study region occur in this setting; of the five wells drilled in this geologic setting, BH02, BH09, and BH19 are artesian, highlighting the confined aquifer system.
BH67, drilled to 150 m, provides a representative lithological profile of the Upper Basalt unit in the lower catchment (Figure 4c). The relatively thick massive lava layers observed in this geological setting, particularly in the lower catchment around Sekoru, likely limit aquifer storage capacity. However, BH47, drilled to 220 m at Geraru in Mencho, intersects an atypical sequence of sandstone and ignimbrite, with sandstone forming the main aquifer and fractured and weathered ignimbrite providing additional water-bearing zones, while clay and siltstone act as aquitards, reflecting spatial and vertical heterogeneity.
Borehole logs from the Upper Basalt flows indicate that fractured basalt forms the main water-bearing zones, whereas thick, massive basalt layers restrict groundwater flow and act as confining units, resulting in multilayered confined aquifer systems. Occasional tuff, clay, and paleosoil intercalations provide matrix porosity in some boreholes but have low permeability.
As shown in Figure 4d, BH18, drilled to 165 m at the Kito site, intersects a multilayered lithostratigraphic sequence. The upper 26 m comprises alluvial deposits forming a shallow aquifer, but this interval is isolated by blind casing. The underlying weathered and massive basalt layers, together with an intercalated clay layer, form aquitard units. Deeper fractured and weathered basalt layers, compartmentalized by massive lava flows and intercalated clay layers, constitute the aquifer system. BH18 has a yield of 1 L/s, likely due to the limited thickness of fractured intervals and the predominance of low-permeability weathered zones. BH16 and BH17, located near BH18, exhibit broadly similar lithological sequences. In contrast, BH25, drilled to 260 m at the Kera site, intersects predominantly fractured and weathered basalt with intercalated clay. Massive basalt layers compartmentalize the fractured and weathered basalt aquifer system, suggesting confined conditions.
BH26 and BH27 intersect sandstone, siltstone, and lithic fragments interlayered with massive and fractured basalt. These lithological variations indicate greater vertical heterogeneity than that of Upper Basalt, resulting in highly variable productivity. Fractured basalt forms the main aquifer, while pyroclastic deposits and weathered basalt provide additional permeability. Although clay intercalations occur, they are generally thinner and less frequent than those in alluvial settings. Sporadic tuffaceous layers also occur, while the predominance of massive basalt limits overall productivity and commonly separates shallow and deeper aquifers.
Deep wells in the Lower Basalt flow are scarce, and available studies indicate a heterogeneous sequence of basaltic flows interbedded with ignimbrite, paleosoil and tuff horizons [52]. Pyroclastics and locally developed alluvial deposits are also occasionally encountered near the surface. Massive basalt commonly alternates with fractured basalt and weathered layers, forming vertically variable permeability. Fractured basalt forms the main aquifer system, with weathered basalt and fractured ignimbrite providing secondary aquifers, whereas massive basalt, paleosoil, and tuff layers locally act as aquitards. Overall, groundwater occurrence is controlled primarily by fracturing and weathering of basalt in the deeper sections, resulting in vertically compartmentalized aquifer systems. In the shallow subsurface, fractured ignimbrite, pyroclastic deposits, unconsolidated tuff, and alluvial deposits locally provide additional groundwater-bearing horizons.
Generally, borehole logs reveal vertically heterogeneous volcanic sequences comprising multilayered aquifer systems separated by aquitards, where groundwater occurrence and flow are primarily controlled by fractured lavas, while weathered zones and pyroclastic deposits may act as secondary aquifers. This compartmentalized aquifer system, consisting of interlayered materials exhibiting matrix porosity, may facilitate lateral flow from individual water-bearing layers toward pumping wells and result in convergent radial flow, providing a conceptual basis for applying analytical aquifer models where their assumptions are reasonably satisfied.
3.4. Transmissivity Results from the Pumping Test
Before applying analytical solutions to interpret the pumping test data, diagnostic plots were first developed to identify the dominant flow regimes governing the aquifer response. Constructing these plots provided an essential preliminary step, allowing early recognition of wellbore-storage effects, transitions in flow geometry, and the onset of formation-controlled characteristics, thereby guiding the selection of appropriate analytical models for subsequent parameter estimation.
3.4.1. Diagnostic Plots
The log–log diagnostic plots of randomly selected wells (Figure 5) show a clear progression of flow regimes that helps characterize both the well response and the aquifer system. Figure 5a presents the diagnostic plot of the pumping test conducted at BH02. During the early time (approximately 1–5 min), the response is dominated by wellbore storage, as evidenced by the rapid increase in drawdown and a positively trending derivative; data from this interval are therefore unsuitable for transmissivity estimation. This stage is followed by a transition period (about 5–20 min), characterized by curvature in the drawdown curve and a hump in the derivative, reflecting near-wellbore effects such as skin and local heterogeneity. The subsequent intermediate phase (approximately 20–200 min) is marked by a gently decreasing derivative and a smooth increase in drawdown, indicative of a transition to formation-controlled radial flow with influence from heterogeneity. At intermediate to late time (200–100 min), the response evolves toward a dominant radial flow, suggesting the influence of only weak or distant hydraulic boundaries. The diagnostic plots indicate confined-aquifer behaviour, and the Theis model was therefore considered appropriate for parameter estimation. The intermediate- to late-time response provides the most reliable interval for estimating transmissivity.
Figure 5.
Log-log diagnostic plots of time versus drawdown (blue diamonds) and its derivative (red crosses) for selected boreholes: (a) BH02, (b) BH07, (c) BH09, and (d) BH18.
Figure 5b presents the log–log diagnostic plot for BH07 and demonstrates a relatively smooth and continuously increasing DD response suggesting a general radial flow condition. During the first 2 min, both DD and its derivative rise sharply, indicating that the response is dominated by wellbore-storage effects. From 2 to 50 min, the DD continues to increase while the derivative stabilizes, reflecting radial flow conditions. Between 50 and 100 min, the derivative begins to rise together with DD, suggesting the influence of a localized high-permeability feature. This is followed by a prolonged interval from roughly 100 to 700 min in which the derivative becomes flat again, consistent with stable radial flow that aligns well with the Theis solution. At a late time, the derivative exhibits an upward trend, indicating the presence of a contribution from single fracture opening. Similarly, the diagnostic plot for BH09 (Figure 5c) shows an early-time wellbore-storage effect, followed by a transition to formation-controlled flow and, at intermediate to late times, stable radial flow under confined conditions. This interval provides the most reliable basis for estimating transmissivity using the Theis model. The subsequent increase in the derivative at late time may indicate boundary effects or delayed recharge.
Figure 5d presents the diagnostic plot for BH18, showing a three-stage aquifer response. Early-time data (1–10 min) indicate wellbore storage, followed by a transitional period (10–100 min) as flow evolves toward formation-controlled radial flow. At intermediate to late times (≥100 min), the stable derivative indicates established radial flow under confined conditions, providing a suitable basis for estimating transmissivity using the Theis solution.
Diagnostic analyses were similarly performed for the remaining boreholes, and the lithological profiles together with SWL and DWL conditions were concurrently evaluated to determine the prevailing aquifer type and to select the most appropriate analytical model for pumping test interpretation. The integrated assessment of the diagnostic plots indicates that approximately 60% of the boreholes exhibit responses resembling confined-aquifer conditions, suggesting the use of the Theis model; about 37% show responses indicative of leaky confined conditions, supporting the Hantush–Jacob model; and approximately 3% display responses resembling unconfined conditions, for which the Neuman model may be appropriate.
Most pumping wells in the complex volcanic aquifer systems of Ethiopia exhibit mixed diagnostic plot responses characterized by short duration, formation-controlled radial flow conditions, for which specific analytical models have been selected and applied [25,28]. The mixed hydraulic responses are attributed to the presence of multiple stratified layers intersected by well screens, resulting from alternating lava flows that form aquifers and aquitards. In addition, the responses may be influenced by leakage from perched aquifers, interaction with impermeable or recharge boundaries, linear flow conditions associated with fracture zones, or a combination of these factors [28,53,54]. Drilling and well design factors, such as borehole storage, skin effects, poor well completion, improper selection of pumping position, inadequate monitoring of discharge rate, and partial penetration of the aquifer, can significantly alter natural groundwater flow [3,27,55,56]. Attempts were made to apply analytical models that account for the effects of fractures, boundaries, and other aquifer heterogeneities. However, because these models provided poor curve matches to the observed pumping test data, the interpretation was restricted to segments of the drawdown curve exhibiting radial flow, where conventional analytical solutions are considered more reliable.
3.4.2. Pumping Test Interpretation
Using the analytical models selected based on the diagnostic plot evaluation, the pumping and recovery tests were analyzed for each well. Recovery analysis was conducted for pumping wells that achieved at least 80% recovery of the initial static water level [57]. After carefully evaluating the consistency of the recovery data and transmissivity values, we retained only recovery tests with recovery values above 77%. Boreholes exhibiting anomalous recovery-derived parameters that were inconsistent with pumping-test results and the known aquifer characteristics were excluded, as these discrepancies were likely attributable to measurement errors or poor data quality. Figure 6 illustrates representative type-curve matches from pumping and recovery test analyses. Figure 6a,c show Theis type-curve matches for confined aquifers, whereas Figure 6e presents a Hantush–Jacob type-curve match for a leaky confined aquifer. Figure 6b,d,f show the corresponding Theis recovery type-curve matches.
Figure 6.
Interpretation of pumping and recovery tests for selected boreholes, showing observed drawdowns (blue diamonds) and fitted analytical model curves (red lines): (a) pumping test for BH02; (b) recovery test for BH02; (c) pumping test for BH07; (d) recovery test for BH07; (e) pumping test for BH15; and (f) recovery test for BH15.
The transmissivity of the aquifer system, estimated from pumping tests in wells BH02 and BH07, is 4.3 × 10⁻⁴–1.2 × 10⁻⁵ m2/s, respectively, indicating substantial spatial variability (Figure 6a,c). Although both wells are completed within the Setema Basalt formation, differences in lithology, the degree of weathering, and cooling fracture development likely account for the observed variability in transmissivity. These results demonstrate considerable hydraulic heterogeneity even within the same geological unit. Similarly, BH09, also completed in the Setema Basalt, exhibited a substantially higher transmissivity value of 1.5 × 10⁻³ m2/s, based on Theis pumping test analysis (Table 3), further confirming the pronounced spatial heterogeneity of the aquifer system.
Table 3.
Summary of pumping test results of wells drilled in different geological settings of the study area.
The Theis recovery method was applied to analyze residual drawdown following the cessation of pumping. The corresponding recovery type-curve matches for wells BH02 and BH07 are shown in Figure 6b and Figure 6d, respectively. The recovery test analysis yielded transmissivity values of 4.2 × 10⁻⁴ m2/s for BH02 and 1.3 × 10⁻⁵ m2/s for BH07, which closely agree with the pumping test estimates of 4.3 × 10⁻⁴ and 1.2 × 10⁻⁵ m2/s, respectively, demonstrating the consistency of the estimated hydraulic parameters.
In contrast, BH15, drilled through Quaternary alluvial deposits and screened in the underlying fractured basalt, exhibited leaky confined aquifer behavior, suggesting hydraulic leakage from the overlying alluvial deposits. Consequently, the Hantush–Jacob method was applied, yielding a transmissivity of 2.8 × 10⁻⁵ m2/s, whereas the Theis recovery analysis produced a transmissivity of 9.8 × 10⁻⁵ m2/s (Figure 6e,f). The higher transmissivity estimated from the recovery test relative to the pumping test is likely attributable to well-loss effects, such as well-skin resistance, which can cause pumping test analyses to underestimate aquifer transmissivity.
In many cases, recovery tests better represent the intrinsic aquifer response because they are less influenced by well losses and pumping-induced disturbances. However, residual drawdown data are often given limited emphasis during pumping tests, and the recovery period allowed is frequently insufficient for water levels to fully rebound and reflect the regional aquifer response. In some cases, transmissivity estimated from recovery data is lower than that derived from pumping tests, primarily as a result of incomplete water-level recovery, the influence of aquifer boundaries, and external stresses such as nearby pumping.
The results of the pumping and recovery tests, obtained following the same procedure, along with key aquifer characteristics and observed pumping responses, are summarized in Table 3. Recovery analysis was performed for all available recovery datasets using Theis recovery matching curve analysis. However, results from boreholes with incomplete recovery data or recovery curves that deviated substantially from the expected response are not presented.
Pumping test interpretation indicates that boreholes within the alluvial deposits exhibit relatively low productivity. Estimated transmissivity values vary between 2.8 × 10⁻⁵ and 4.1 × 10⁻⁴ m2/s, yielding an average of 2.0 × 10⁻⁴ m2/s. Recovery test analysis of the two wells with suitable data, BH15 and BH20, yielded transmissivity values of 9.7 × 10⁻⁵ and 8.1 × 10⁻⁵ m2/s, respectively. Both pumping and recovery test results yield transmissivity values that fall within the low groundwater potential range [47]. However, BH23 exhibits a particularly low transmissivity value, indicating very low groundwater potential at this location. Similarly, the specific capacity of the wells within this unit ranges from 0.01 to 0.46 L/s/m, with an average of 0.16 L/s/m, within the typical low productivity range [47], further confirming the aquifer’s low productivity. Although the boreholes were drilled within alluvial settings, they were designed to intercept the underlying volcanic aquifers. Consequently, the transmissivity results primarily characterize the deeper Tertiary volcanic units, including tuffs, ignimbrites, basalts, trachytes, and rhyolites, targeted by the screened intervals, as illustrated by BH22 in Figure 4a.
Due to the lack of pumping-test data from shallow boreholes targeting the alluvial deposits, their hydraulic parameters could not be specifically evaluated in this study. However, previous studies from the region indicate relatively higher aquifer productivity. The transmissivity values for the Quaternary aquifer system of Lake Tana range from 2.7 × 10⁻⁵ to 2.1 × 10⁻¹ m2/s, indicating relatively high aquifer productivity [28]. Shallow aquifers within the alluvial deposits are considered relatively permeable [58]. However, their hydraulic properties remain insufficiently characterized and require further investigation using field-based methods such as slug tests, similar to those applied by Yenehun et al. [59], to obtain more reliable estimates of hydraulic parameters.
The pumping test results show that the transmissivity of Setema Basalt ranges from 1.2 × 10⁻⁵ to 2.9 × 10⁻³ m2/s, with an average of 9.9 × 10⁻⁴ m2/s. Similarly, recovery test analysis yielded transmissivity values ranging from 1.2 × 10⁻⁶ to 2.5 × 10⁻³ m2/s, indicating low to moderately high aquifer transmissivity. Of the five wells located within this geologic unit, B02, BH08, and BH09 exhibit moderately high transmissivity, whereas BH07 and BH19 are characterized by low transmissivity. The lower transmissivity is attributed to the dominance of massive rock units acting as aquitards, interlayered with low-permeability tuffs and paleosoils. However, these wells do not represent the entire Setema Basalt, as their location is aligned near the contact area with other geological units (Trachyte and Middle basalt). The specific capacity varies between 0.02 and 2.67 L/s/m, with an average value of 0.98 L/s/m, which falls within the moderate-productivity range of 0.5–5 L/s/m, supporting the interpretation that the aquifer system has moderate productivity.
Groundwater productivity in the Setema Basalt is enhanced by fracturing, the presence of pumice and scoriaceous basalt, and the proximity of wells to structural and lithologic contacts [50,59]. Artesian conditions observed in BH2, BH9, and BH19 further indicate relatively high storage and transmissivity in this area. However, because these wells are situated near contacts where the Setema Basalt overlies the Middle Basalt or trachyte flows, the pumping test results may not fully represent the hydraulic properties of the Setema Basalt. Thus, the real transmissivity is likely slightly lower than the estimated values from wells concentrated near lithological contacts and dense fault zones.
Pumping test data from wells drilled in the Upper Basalt flows (Table 3) indicate transmissivity values ranging from 9.3 × 10⁻⁵ to 1.4 × 10⁻³ m2/s, with an average of 4.0 × 10⁻⁴ m2/s during pumping; BH46, with reliable residual drawdown data, yielded 1.7 × 10⁻⁴ m2/s during recovery. The specific capacity ranges from 0.02 to 0.58 L/s/m, reflecting very low to moderate productivity. Two additional boreholes (BH60 and BH61) were drilled in the lower pyroclastic setting, near an area mapped as an Upper Basalt flow, and intersected basaltic layers with varying degrees of fracturing, likely representing the Upper Basalt unit. Pumping test analysis yielded transmissivity values of 9.8 × 10⁻⁵ and 1.9 × 10⁻³ m2/s for BH60 and BH61, respectively. Recovery test analysis produced a transmissivity of 7.4 × 10⁻⁴ m2/s for BH61. However, the recovery data for BH60 was incomplete and not considered for interpretation. These values are consistent with the hydraulic characteristics of the low to moderately productive Upper Basalt aquifer, rather than those typically expected for the lower pyroclastics, which are generally less productive [14]. Similarly, BH42 and BH43 were drilled in areas mapped as trachyte flows; however, their lithologic logs are dominated by weathered and fractured basalt, indicating the dominance of Upper Basalt flows. The transmissivity values of these wells are 9.1 × 10⁻⁴ and 2.6 × 10⁻⁴ m2/s for BH42 and BH43, respectively. Recovery test analysis yielded a transmissivity of 5 × 10⁻⁴ m2/s for BH43. However, the residual drawdown data for BH42 were incomplete and therefore unsuitable for reliable interpretation. The results from BH42 and BH43 are consistent with the low to moderate productivity of the Upper Basalt flows, as the borehole lithology is predominantly basaltic.
Boreholes tapping the Middle Basalt flow exhibit transmissivity values estimated from pumping tests that range from 3.9 × 10⁻⁶ to 7.6 × 10⁻⁴ m2/s, with an average value of 2.7 × 10⁻⁴ m2/s. Recovery test analysis yielded transmissivity values ranging from 1.2 × 10⁻⁶ to 4.6 × 10⁻⁴ m2/s. Similarly, the specific capacity of the wells ranges from 0.01 to 1.54 L/s/m. Generally, the estimated hydraulic parameters indicate that the Middle Basalt aquifer system ranges from very low to moderate productivity and potential [49].
The only borehole completed in the lithological contacts between the Lower Basalt and upper basalt flows (BH80) exhibits unusually high hydraulic properties. The transmissivity is 1.3 × 10⁻² m2/s, indicating a highly productive aquifer. However, the diagnostic plot suggests the influence of a hydraulic boundary and flow dominated by a single fracture rather than a uniformly permeable basalt matrix. The very low drawdown observed during the pumping test further confirms the presence of highly transmissive, fracture-controlled flow conditions at this location. Given that these results are derived from a single well influenced by localized structural features, using BH80 alone to characterize the hydraulic property of the Lower Basalt flow would be misleading. Similarly, well BH21, drilled within the Lower Basalt flow, intersects a lithologic sequence composed entirely of weathered and fractured ignimbrite, likely derived from pyroclastic deposits. The estimated transmissivity value is 5.4 × 10⁻⁴ m2/s from the pumping test. The hydraulic parameter indicates that the ignimbrite aquifer is moderately productive. Welded ignimbrite and associated pyroclastic deposits, extending from the Central Ethiopian volcanics and overlying the Lower Basalt flow in the downstream part of the catchment, particularly toward the southeast, may enhance the productivity of this localized aquifer system [16].
BH53, drilled within a rhyolitic flow setting, exhibits transmissivity values of 2.6 × 10⁻⁵ m2/s from a pumping test and 6.9 × 10⁻⁶ m2/s from a recovery test. These results are consistent with the generally low transmissivity characteristic of rhyolitic aquifers. Trachyte, stratified tuff, and alluvial units lack deep boreholes, and the available wells were not designed to target these units. Consequently, spring discharge observations and lithologic logs were used to support their hydrogeologic characterization.
3.5. Observed Spring Discharge
Table 4 summarizes spring discharges recorded during the field campaign and supplemented with records from the Jimma Zone Water and Mineral Office. The spatial distribution of springs across the different geological units is shown in Figure 3a, while Table 4 presents, for each geological setting, the number of springs inventoried and the corresponding minimum, maximum, and average discharge rates, thereby highlighting the relative groundwater productivity of each geological unit.
Table 4.
Observed spring discharges across various geologic settings.
Because the measurements were based on one-time observations and were not collected consistently across all springs during the same season, they may not support robust comparisons among springs. However, they provide valuable supplementary information for aquifer characterization.
Field measurements from four springs within the alluvial setting indicate discharge rates ranging from 0.29 to 1.00 L/s, with a mean value of 0.53 L/s. Most of these springs are perennial, sustained by upland recharge that drains toward the low-lying alluvial deposits. Springs within the Setema Basalt exhibit the highest discharge among all hydrogeological units, ranging from 1 to 5 L/s, with a mean value of 3.33 L/s. This is likely attributed to high recharge in the area, driven by substantial rainfall, as well as the presence of fractures and geological structures that enhance groundwater flow toward discharge points [50]. One spring each within the stratified tuff and rhyolite flows shows discharge values of 0.41 and 3.0 L/s, respectively. Discharge from ten springs located in the Upper Basalt flows ranges from 0.12 to 0.40 L/s, with an average of 0.27 L/s. Compared to springs in the alluvial deposits and Setema Basalt, these lower values are likely due to the Upper Basalt flow forming highland peaks and plateaus, which enhance rapid groundwater drainage. In fact, the water level observed in most wells located in Upper Basalt flows is deep, while no spring discharge was recorded from this geological unit. Eight spring sources identified within the Lower Basalt flows show minimum and maximum discharges of 0.09 and 1.86 L/s, respectively, with an average of 0.66 L/s. A total of 32 springs within the trachyte flow exhibit discharge rates ranging from 0.002 to 1.75 L/s, with an average of 0.29 L/s.
In addition, gauged sub-catchments draining parts of the volcanic terrain provide insights into groundwater potential and flow systems. The Bidru Awana gauging station, which drains a small stream within the Upper Basalt aquifer of the Asendabo area, has an observed annual discharge of 0.41 m3/s and a baseflow index (BFI) of 56%, indicating relatively low groundwater potential. The Seka gauging station, draining the Setema basaltic terrain, records an annual discharge of 4.77 m3/s and a BFI of 77%, indicating relatively high groundwater productivity. Similarly, the Bulbul gauging station, draining trachyte and Lower Basalt flows, records an annual discharge of 8.52 m3/s and a BFI of 76%, reflecting a productive groundwater system. The Asendabo gauging station records the highest annual discharge (43.59 m3/s), with a BFI of 74%; however, its tributaries drain diverse geological settings, including alluvial deposits and volcanic rocks covering more than 60% of the catchment, indicating the overall productivity of the catchment aquifer system. The locations of the gauging stations are shown in Figure 1, while the delineated sub-catchments and detailed baseflow analysis are presented in Tufa et al. [35].
Spring discharge observations, together with the evaluated hydraulic properties, indicate that the aquifer system within the catchment exhibits low to moderate productivity. Based on the results from interpreting 30 boreholes’ pumping test analyses transmissivity varies between 3.9 × 10⁻⁶ and 1.3 × 10⁻² m2/s, whereas recovery tests conducted on pumping wells with reliable recovery data and meeting the minimum acceptable recovery percentage yielded transmissivity values ranging from 1.2 × 10⁻⁶ to 2.5 × 10⁻³ m2/s. Similarly, the specific capacity of the wells ranges from 0.008 to 4.68 L/s/m. These variations in the hydraulic parameters demonstrate that the aquifer system of the catchment is highly heterogeneous, with aquifer productivity ranging from low to moderate. Low groundwater productivity is associated with localized compacted tuff, paleosoil, and clay layers interbedded between less-fractured lava flows, while high productivity is observed in highly fractured lava flows dominated by porous ash, pumice, and brecciated basalt.
In the upstream catchment, where boreholes BH08, BH09, BH02, and BH19 are located, high fault density enhances groundwater recharge and flow, resulting in high borehole productivity and spring discharge. Likewise, the downstream rhyolitic aquifer exhibits moderate spring discharge (up to 3 L/s) despite its inherently low permeability, likely due to enhanced fault and fracture connectivity. In contrast, alluvial aquifers in areas of lower fault density exhibit lower spring discharge (up to 1 L/s), indicating that limited structural enhancement constrains groundwater productivity. Based on lithologic characteristics, flow regimes interpreted from diagnostic plots, hydraulic properties derived from pumping tests, and observed spring discharges, the aquifer system of the catchment was characterized and mapped as shown in Figure 7.
Figure 7.
Map showing geological units and aquifer types in the catchment (T: Transmissivity and SC: Specific capacity).
The estimated hydraulic parameters indicate that the aquifer system has generally low to moderate groundwater productivity. However, the estimated groundwater recharge across the catchment is relatively high, ranging from 181 to 411 mm/year based on the baseflow separation method and from 209 to 442 mm/year based on the soil moisture balance method [35]. These recharge estimates suggest that groundwater resources are adequately replenished to sustain long-term groundwater availability.
In the Gilgel Gibe catchment and the broader regional area of southwestern Ethiopia, research on the evaluation of hydraulic parameters remains limited. Kitessa [25] reported that the transmissivity of the Jimma area aquifer system (part of the upper Gilgel Gibe) ranges from 2.8 × 10⁻⁶ to 1.6 × 10⁻³ m2/s. Transmissivity and specific capacity values obtained for the studied Tertiary volcanic aquifers fall well within the broad range reported across Ethiopia.
In the Lake Tana Basin, transmissivity of Tertiary basalts ranges from 4.4 × 10⁻⁶ to 1.0 × 10⁻² m2/s, whereas that of the Quaternary aquifer system varies from 2.7 × 10⁻⁵ to 2.1 × 10⁻¹ m2/s, indicating a general increase in transmissivity with younger volcanic formations [28]. Similarly, Walraevens et al. [60] reported transmissivity values ranging from 1.4 × 10⁻³ to 1.2 × 10⁻² m2/s for the shallow fractured Quaternary basalt aquifer in the same region, further highlighting the high aquifer productivity associated with younger volcanic units. Studies in the Upper Blue Nile Basin reported transmissivity values ranging from 1.3 × 10⁻⁴ to 4.5 × 10⁻² m2/s for volcanic aquifers, particularly in multilayered unconfined–confined basaltic systems characterized by interconnected fractures and weathered flow tops [11]. The considerably higher maximum transmissivity reflects the strong hydraulic heterogeneity of these volcanic aquifers and the occurrence of localized highly productive zones. In contrast, the Gilgel Gibe aquifer system is characterized predominantly by low to moderate transmissivity, suggesting generally lower aquifer productivity.
Pumping tests conducted in both shallow and deep volcanic aquifer systems of Mount Meru, Tanzania, comprising fractured and weathered basalts interbedded with pyroclastic deposits, yielded transmissivity values ranging from 3.5 × 10⁻⁶ to 9.1 × 10⁻³ m2/s [60], which closely align with the range obtained in the present study. The transmissivity values of the Tertiary volcanic aquifers in the Gilgel Gibe catchment are consistent with those reported for comparable Tertiary volcanic aquifer systems elsewhere in Ethiopia and the East African Rift, indicating broadly similar hydraulic characteristics.
However, other studies have shown that localized aquifer systems comprising thick alluvial deposits with favorable textural and depositional characteristics, hydraulically connected to highly fractured volcanic rocks, exhibit substantially higher transmissivity. In the Upper Awash Basin, an aquifer system consisting of up to 30 m of alluvial deposits overlying fractured and weathered basalt exhibited transmissivity values ranging from 1.7 × 10⁻³ to 3.2 × 10⁻² m2/s [29]. Similarly, the Raya Valley aquifer system, comprising up to 200 m of alluvial deposits underlain by fractured basalt, yielded transmissivity values of 1.4 × 10⁻³–2.6 × 10⁻² m2/s [61]. Even higher transmissivity values (6.1 × 10⁻³ to 7.3 × 10⁻² m2/s) were reported from the Meki–Alemtena area of central Ethiopia, where the predominance of highly permeable pumice deposits, together with overlying alluvial sediments and variably weathered and fractured ignimbrite, creates exceptionally favorable groundwater flow conditions [62].
Shallow unconfined aquifers developed within volcanic, alluvio-colluvial, and lacustrine deposits in Ethiopia generally exhibit moderate transmissivity values ranging from 3.1 × 10⁻⁴ to 1.6 × 10⁻³ m2/s [11]. Although pumping test data are unavailable for boreholes tapping the shallow unconfined alluvial aquifers in the Gilgel Gibe catchment, the widespread occurrence of hand-dug wells, shallow wells, and perennial springs used for domestic water supply suggests that these aquifers are moderately productive. Their productivity is likely enhanced by the relatively high primary porosity and permeability of unconsolidated sediments despite their limited saturated thickness.
4. Conclusions
The Gilgel Gibe catchment is underlain by a highly heterogeneous volcanic and alluvial deposit sequence that gives rise to very low to moderately productive aquifer systems. The Tertiary volcanic units, Setema Basalt, rhyolite, Upper Pyroclastic, Upper Basalt, Middle Basalt, trachyte, Lower Pyroclastic, and Lower Basalt, form a multilayered volcanic aquifer system. Groundwater occurrence and movement are controlled by synformational features, such as vesicles, scoriaceous zones, and volcanic-flow contacts, as well as secondary structures, including faults, fractures, and weathered zones. Interlayered pyroclastic deposits and volcanic ash also provide secondary aquifers, enhancing groundwater storage and movement through pores within the formation matrix. Tuffs, clay, paleosoils, and massive basalt layers commonly act as aquitards; however, depending on their degree of consolidation, tuffs, clay, and paleosoils may permit lateral groundwater movement toward wells, enhancing productivity, and vertical leakage to underlying aquifers, resulting in locally leaky aquifer conditions.
Lithological logs indicate that fractured lava flows, mainly basalt, trachyte, and rhyolite, together with scoriaceous flow tops, fractured ignimbrite, and weathered zones, form the principal aquifer systems. Diagnostic plots from time-drawdown data indicate that well responses are influenced by borehole storage, leakage or recharge, linear flow through fractures, and no-flow boundary effects. Pumping test interpretation focused on the radial flow interval yields transmissivity values of 3.9 × 10⁻⁶–1.3 × 10⁻² m2/s, and the corresponding specific capacity varies between 0.01 and 4.68 L/s/m, confirming the high heterogeneity of the aquifer system. Spring discharges range from 0.002 to 5 L/s, with perennial flow supported by the long rainy season and short dry period. Productive wells are mainly associated with younger Setema Basalt flows and lithological contact zones.
Although pumping test data are lacking, lithological evidence suggests low permeability in the Lower Pyroclastic, stratified tuff, and rhyolite units, while the alluvial setting comprises a shallow aquifer of porous materials overlying predominantly tuffaceous, low-permeability layers, resulting in a low-productivity aquifer system. Integrating lithological profiles, diagnostic plots, pumping-test results, and spring-discharge data indicates that the Setema Basalt, Upper Basalt, trachyte, Middle Basalt, and Lower Basalt form low- to moderately productive volcanic aquifers that are predominantly confined and locally leaky, with unconfined conditions occurring locally, collectively defining the groundwater system of the Gilgel Gibe catchment.
Author Contributions
Conceptualization, F.G.T., F.F.F. and K.W.; methodology, F.G.T. and K.W.; software, F.G.T., A.B.K., A.Y. and K.W.; validation, F.G.T., F.F.F., A.B.K., W.M.K., S.K.D., A.Y. and K.W.; formal analysis, F.G.T. and K.W.; investigation, F.G.T. and K.W.; resources, F.G.T., T.H. and K.W. data curation, F.G.T., A.B.K. and W.M.K.; writing—original draft preparation, F.G.T.; writing—review and editing, F.G.T., K.W., T.H., F.F.F. and A.Y.; visualization, F.G.T., A.B.K., S.K.D., F.F.F., A.Y. and K.W.; supervision, K.W., T.H. and F.F.F.; project administration, T.H. and K.W.; funding acquisition, F.G.T., T.H. and K.W. All authors have read and agreed to the published version of the manuscript.
Funding
F.G.T. received funding from the Network for Advancement of Sustainable Capacity in Education and Research in Ethiopia (NASCERE) project and the Special Research Fund (BOF) for the exceptional extension of a PhD trajectory that was delayed due to COVID-19, from Ghent University for research stays at Ghent University to do this research. S.K.D. received funding from the NASCERE project and the Global Minds fund from Ghent University for research stays at Ghent University to do this research. A.B.K. received funding from the Special Research Fund (BOF) from Ghent University.
Data Availability Statement
The raw data supporting the conclusions of this article will be made available by the authors on request.
Acknowledgments
The authors would like to thank the Network for Advancement of Sustainable Capacity in Education and Research in Ethiopia (NASCERE) project from the Federal Democratic Republic of Ethiopia Ministry of Education and concluded with Jimma University and Ghent University, for providing funds during this study. The authors also acknowledge Ghent University and Jimma University for providing resources and material support for the study.
Conflicts of Interest
The authors declare no conflicts of interest.
References
- Maliva, R.G. Aquifer Characterization Techniques; Springer Hydrogeology Series; Springer: Cham, Switzerland, 2016. [Google Scholar] [CrossRef] [Scilit]
- Freeze, R.A.; Cherry, J.A. Groundwater; Prentice-Hall: Englewood Cliffs, NJ, USA, 1979. [Google Scholar]
- Fetter, J.C. Applied Hydrogeology, 4th ed.; Prentice Hall: Upper Saddle River, NJ, USA, 2001. [Google Scholar]
- Poeter, E.; Gaylord, D.R. Influence of aquifer heterogeneity on contaminant transport at the Hanford site. Groundwater 1990, 28, 900–909. [Google Scholar] [CrossRef] [Scilit]
- de Marsily, G.; Delay, F.; Gonçalvès, J.; Renard, P.; Teles, V.; Violette, S. Dealing with spatial heterogeneity. Hydrogeol. J. 2005, 13, 161–183. [Google Scholar] [CrossRef] [Scilit]
- Baud, B.; Lachassagne, P.; Dumont, M.; Toulier, A.; Hendrayana, H.; Fadillah, A.; Dorfliger, N. Andesitic aquifers—Hydrogeological conceptual models and insights relevant to applied hydrogeology. Hydrogeol. J. 2024, 32, 1259–1286. [Google Scholar] [CrossRef] [Scilit]
- Lachassagne, P.; Aunay, B.; Frissant, N.; Guilbert, M.; Malard, A. High-resolution conceptual hydrogeological model of complex basaltic volcanic islands: A Mayotte, Comoros, case study. Terra Nova 2014, 26, 307–321. [Google Scholar] [CrossRef] [Scilit]
- Miller, J.A. Ground Water Atlas of the United States: Introduction and National Summary; U.S. Geological Survey: Reston, VA, USA, 1999; Volume 730-A. [Google Scholar] [CrossRef] [Scilit]
- Worthington, S.R.H.; Davies, G.J.; Alexander, E.C., Jr. Enhancement of bedrock permeability by weathering. Earth-Sci. Rev. 2016, 160, 188–202. [Google Scholar] [CrossRef] [Scilit]
- Kebede, S. Groundwater in Ethiopia: Features, Numbers and Opportunities; Springer: Cham, Switzerland, 2012. [Google Scholar]
- Ayenew, T.; Demlie, M.; Wohnlich, S. Hydrogeological framework and occurrence of groundwater in the Ethiopian aquifers. J. Afr. Earth Sci. 2008, 52, 97–113. [Google Scholar] [CrossRef] [Scilit]
- Fenta, M.C.; Anteneh, Z.L.; Szanyi, J.; Walker, D. Hydrogeological framework of the volcanic aquifers and groundwater quality in Dangila Town and the surrounding area, Northwest Ethiopia. Groundw. Sustain. Dev. 2020, 11, 100408. [Google Scholar] [CrossRef] [Scilit]
- Haro, W.; Asamnew, B.; Daba, B.; Fekadu, B.; Edris, M. Geology, Geochemistry, and Gravity Survey of Jima Area; Geological Survey of Ethiopia: Addis Ababa, Ethiopia, 2012. [Google Scholar]
- Agezew, T.; Sima, J. Hydrogeological and Hydrochemical Maps of Jima NB 37–1 Sheet; AQUATEST as, Prague; Czech Geological Survey: Brno, Czechia, 2015. [Google Scholar]
- Alemu, T. Geology of the Arjo Area: Memoir 23; Geological Survey of Ethiopia: Addis Ababa, Ethiopia, 2014. [Google Scholar]
- Zenebe, B.; Agonafir, M.; Taye, M.; Meskerem, T.; Endeis, M.; Bekele, M.; Burusa, G. Geology Geochemistry and Gravity Survey of the Hosaena Area; GSE: Addis Ababa, Ethiopia, 2012. [Google Scholar]
- Kazmin, V. Geology of Ethiopia: Explanatory Note to Geological Map of Ethiopia, 1:2,000,000; Ministry of Mines, Geological Survey of Ethiopia: Addis Ababa, Ethiopia, 1972. [Google Scholar]
- Corti, G. Continental rift evolution: From rift initiation to incipient break-up in the Main Ethiopian Rift, East Africa. Earth-Sci. Rev. 2009, 96, 1–53. [Google Scholar] [CrossRef] [Scilit]
- Kebede, A.B.; Tufa, F.G.; Kitessa, W.M.; Gudeta, B.G.; Debela, S.K.; Reybrouck, J.V.; Yenehun, A.; Feyessa, F.F.; Hermans, T.; Walraevens, K. Hydrogeochemical Processes and Water Quality Assessment in Volcanic Aquifers of the Gilgel Gibe and Upper Dhidhessa Catchments, Southwestern Ethiopia. Water 2026, 18, 1872. [Google Scholar] [CrossRef] [Scilit]
- Van Daele, K. Characterization of Geological Materials, Their Weathering Products and Their Relationship with Soils in the Gilgel Gibe Catchment, SW Ethiopia. Master’s Thesis, Ghent University, Ghent, Belgium, 2011. [Google Scholar]
- Tilahun, K.; Šíma, J. Hydrogeological and Hydrochemical Maps of Hosaina NB 37-2: Explanatory Notes; Aquatest a.s.: Prague, Czech Republic, 2013; 194p. [Google Scholar]
- Gurumu, Z.Y.; Ayalew, A. Integrated Hydrogeological and Hydrochemical Map and Report of Arjo Map Sheet (NC37-13); Geological Survey of Ethiopia: Addis Ababa, Ethiopia, 2007. [Google Scholar]
- Tadesse, N. Hydrogeology of Jimma Area. Master’s Thesis, Addis Ababa University, Addis Ababa, Ethiopia, 1994. [Google Scholar]
- Habtamu, M.; Garo, T.; Chemeda, Y.C. Engineering Geological Investigation of Jimma Town for Engineering Practice. Ethiop. J. Sci. Sustain. Dev. 2022, 9, 39–53. [Google Scholar] [CrossRef]
- Kitessa, W.M. Hydrogeological Analysis of a Volcanic Aquifer System in the Jimma Area, Ethiopia. Ph.D. Thesis, Faculty of Sciences, Ghent University, Ghent, Belgium, 2025. [Google Scholar]
- Fernandes, A.J.; Rudolph, D.L. The Influence of Cenozoic Tectonics on the Groundwater-Production Capacity of Fractured Zones: A Case Study in São Paulo, Brazil. Hydrogeol. J. 2001, 9, 151–167. [Google Scholar] [CrossRef] [Scilit]
- Kruseman, G.P.; de Ridder, N.A. Analysis and Evaluation of Pumping Test Data; Bulletin No. 11; International Institute for Land Reclamation and Improvement (ILRI): Wageningen, The Netherlands, 1970; 200p. [Google Scholar]
- Nigate, F.; Yenehun, A.; Belay, A.S.; Asmamaw, D.K.; Walraevens, K. Application of Pumping Tests to Estimate Hydraulic Parameters of Volcanic Aquifers in Lake Tana Basin, Ethiopia. Water 2024, 17, 9. [Google Scholar] [CrossRef] [Scilit]
- Muauz, A.; Behailu, B.; Bediru, H. Application of surface geophysical investigations and pumping test data analysis for better characterization of aquifer hydraulic parameters, Upper Awash Sub-Basin, Central Ethiopia. J. Hydrol. Reg. Stud. 2024, 55, 101933. [Google Scholar] [CrossRef] [Scilit]
- Renard, P.; Glenz, D.; Mejias, M. Understanding diagnostic plots for well-test interpretation. Hydrogeol. J. 2009, 17, 589–600. [Google Scholar] [CrossRef] [Scilit]
- Davidson, A.; Moore, J.M.; Davies, J.C.; Shifferaw, A.; Degeffu, A.; Guassa, A.M.; Gelatta, W.M.; Hintsa, N. Preliminary Report on the Geology and Geochemistry of Parts of Gemu Gofa, Kefa, and Ilubabor Provinces, Ethiopia; Imperial Ethiopian Government, Ministry of Mines and Power, Omo River Project, Preliminary Report 2; Ethiopian Institute of Geological Surveys (EIGS): Addis Ababa, Ethiopia, 1976; 28p. [Google Scholar]
- Merla, G.; Abbate, E.; Azzaroli, A.; Bruni, P.; Canuti, P.; Fazzuoli, M.; Tacconi, P. A Geological Map of Ethiopia & Somalia (1973) 1: 2,000,000: And Comment with a Map of Major Landforms; University of Florence: Florence, Italy, 1979. [Google Scholar]
- Mengesha, T.; Chernet, T.; Haro, W. Explanation of the Geological Map of Ethiopia; Geological Survey of Ethiopia: Addis Ababa, Ethiopia, 1996. [Google Scholar]
- Regassa, A.; Van Daele, K.; De Paepe, P.; Dumon, M.; Deckers, J.; Asrat, A.; Van Ranst, E. Characterizing weathering intensity and trends of geological materials in the Gilgel Gibe catchment, southwestern Ethiopia. J. Afr. Earth Sci. 2014, 99, 568–580. [Google Scholar] [CrossRef] [Scilit]
- Tufa, F.G.; Feyissa, F.F.; Kebede, A.B.; Gudeta, B.G.; Kitessa, W.M.; Debela, S.K.; Tumsa, B.C.; Yenehun, A.; Van Camp, M.; Walraevens, K. Estimation of groundwater recharge in a volcanic aquifer system using soil moisture balance and baseflow separation methods: The case of gilgel gibe catchment, Ethiopia. Hydrology 2024, 11, 109. [Google Scholar] [CrossRef] [Scilit]
- Kebede, A.B.; Tufa, F.G.; Kitessa, W.M.; Gudeta, B.G.; Debela, S.K.; Yenehun, A.; Feyessa, F.F.; Hermans, T.; Walraevens, K. Estimation of groundwater recharge in the volcanic aquifers in a tropical climate, southwestern Ethiopia: Insights from water table fluctuation and chloride mass balance methods. Water 2025, 17, 3043. [Google Scholar] [CrossRef] [Scilit]
- Duffield, G.M. AQTESOLV for Windows Version 4.5 User’s Guide; HydroSOLVE, Inc.: Reston, VA, USA, 2007. [Google Scholar]
- Illman, W.A.; Zhu, J.; Craig, A.J.; Yin, D. Comparison of aquifer characterization approaches through steady state groundwater model validation: A controlled laboratory sandbox study. Water Resour. Res. 2010, 46. [Google Scholar] [CrossRef] [Scilit]
- Schneider, C.L.; Attinger, S. Beyond Thiem: A new method for interpreting large scale pumping tests in heterogeneous aquifers. Water Resour. Res. 2008, 44. [Google Scholar] [CrossRef] [Scilit]
- Heidari, M.; Ghiassi, K.; Mehnert, E. Analysis of pumping tests: Significance of well diameter, partial penetration, and noise 1. JAWRA J. Am. Water Resour. Assoc. 1999, 35, 333–347. [Google Scholar] [CrossRef] [Scilit]
- Theis, C.V. The relation between the lowering of the piezometric surface and the rate and duration of discharge of a well using ground-water storage. Eos Trans. Am. Geophys. Union 1935, 16, 519–524. [Google Scholar] [CrossRef] [Scilit]
- Hantush, M.S.; Jacob, C.E. Non-steady radial flow in an infinite leaky aquifer. Eos Trans. Am. Geophys. Union 1955, 36, 95–100. [Google Scholar] [CrossRef] [Scilit]
- Neuman, S.P. Theory of flow in unconfined aquifers considering delayed response of the water table. Water Resour. Res. 1972, 8, 1031–1045. [Google Scholar] [CrossRef] [Scilit]
- Cooper, H.H., Jr.; Jacob, C.E. A generalized graphical method for evaluating formation constants and summarizing well-field history. Eos Trans. Am. Geophys. Union 1946, 27, 526–534. [Google Scholar] [CrossRef] [Scilit]
- Barker, J.A. A generalized radial flow model for hydraulic tests in fractured rock. Water Resour. Res. 1988, 24, 1796–1804. [Google Scholar] [CrossRef] [Scilit]
- Gringarten, A.C.; Witherspoon, P.A. A method of analyzing pump test data from fractured aquifers. In Percolation Through Fissured Rock. In Proceedings of the Symposium on Percolation through Fissured Rock, Stuttgart, Germany, 18–21 September 1972; Deutsche Gesellschaft für Erd- und Grundbau: Stuttgart, Germany, 1972; pp. 148–171. [Google Scholar]
- MacDonald, A.M.; Davies, J. A Brief Review of Groundwater for Rural Water Supply in Sub-Saharan Africa; Technical Report WC/00/33; British Geological Survey (BGS): Keyworth, Nottingham, UK, 2000. [Google Scholar]
- Ayalew, A.; Tafesse, N.T.; Hagos, M.; Matende, K.N. Characteristics and Productivity of Volcanic Rock Aquifers in the Upper Part of Blue Nile Basin, Ethiopia. Univers. J. Geosci. 2019, 7, 69–82. [Google Scholar] [CrossRef] [Scilit]
- Sen, Z. Applied Hydrogeology for Scientists and Engineers; CRC Press: Boca Raton, FL, USA, 2017. [Google Scholar]
- Mihret, B.; Wuletaw, A. The impact of geological structures on groundwater potential assessment in volcanic rocks in the Borena Sayint district, northwestern Ethiopian Plateau: A review. Hydrol. Earth Syst. Sci. 2025, 29, 2951–2959. [Google Scholar] [CrossRef] [Scilit]
- Mechal, A.; Birk, S.; Dietzel, M.; Leis, A.; Winkler, G.; Mogessie, A.; Kebede, S. Groundwater flow dynamics in the complex aquifer system of Gidabo River Basin (Ethiopian Rift): A multi-proxy approach. Hydrogeol. J. 2017, 25, 519–538. [Google Scholar] [CrossRef] [Scilit]
- Ethiopian Electric Power Corporation (EEPCO). Gilgel Gibe Hydroelectric Project: Final Report on the Project Implementation; EEPCO: Addis Ababa, Ethiopia, 2004. [Google Scholar]
- Scanlon, B.R.; Healy, R.W.; Cook, P.G. Choosing appropriate techniques for quantifying groundwater recharge. Hydrogeol. J. 2002, 10, 18–39. [Google Scholar] [CrossRef] [Scilit]
- Winter, T.C. Relation of streams, lakes, and wetlands to groundwater flow systems. Hydrogeol. J. 1999, 7, 28–45. [Google Scholar] [CrossRef] [Scilit]
- Al Farrah, N.; Van Camp, M.; Walraevens, K. Deducing transmissivity from specific capacity in the heterogeneous upper aquifer system of Jifarah Plain, NW-Libya. J. Afr. Earth Sci. 2013, 85, 12–21. [Google Scholar] [CrossRef] [Scilit]
- Moench, A.F. Double-porosity models for a fissured groundwater reservoir with fracture skin. Water Resour. Res. 1984, 20, 831–846. [Google Scholar] [CrossRef] [Scilit]
- Aitchison-Earl, P.; Smith, M. Aquifer Test Guidelines; Environment Canterbury: Christchurch, New Zealand, 2008. [Google Scholar]
- Gebru, H.; Gebreyohannes, T.; Hagos, E.; Perilli, N. Hydrogeological Assessment and Steady-State Groundwater Flow Modeling for Groundwater Management in the Golina River Sub-Basin, Northern Ethiopia, Using MODFLOW 6. Water 2025, 17, 949. [Google Scholar] [CrossRef] [Scilit]
- Yenehun, A.; Nigate, F.; Belay, A.S.; Dessie, M.; Birhanu, A.; Azeze, M.; Adgo, E.; Nyssen, J.; Walraevens, K. Groundwater Aquifer Characterization and Potential Assessment of the Shallow Aquifers in the Volcanic Highlands of Northwestern Ethiopia. Water 2026, 18, 1968. [Google Scholar] [CrossRef] [Scilit]
- Walraevens, K.; Bennett, G.; Alfarrah, N.; Gebreyohannes, T.; Berhane, G.; Hagos, M.; Hussien, A.; Nigate, F.; Belay, A.S.; Birhanu, A.; et al. Assessing the potential of volcanic and sedimentary rock aquifers in Africa: Emphasizing transmissivity, water quality, and recharge as key evaluation metrics. Water 2025, 17, 109. [Google Scholar] [CrossRef] [Scilit]
- Salih, S.; Gebreslassie, T.; Asfaw, A.; Demlie, M. Determination of hydraulic properties from geoelectrical parameters in Raya Valley aquifer, Northern Ethiopia. J. Hydrol. Reg. Stud. 2025, 62, 103002. [Google Scholar] [CrossRef] [Scilit]
- Mehammed, E.A.; Bamnew, M.S.; Tafere, T.A.; Feyisa, M.T.; Abdulkadir, Y.A. Geophysical insights into groundwater aquifer characterization in a geologically complex region: A case study from the Meki–Alemtena area, central Ethiopia. Sci. Rep. 2026, 16, 13957. [Google Scholar] [CrossRef] [Scilit] [PubMed]
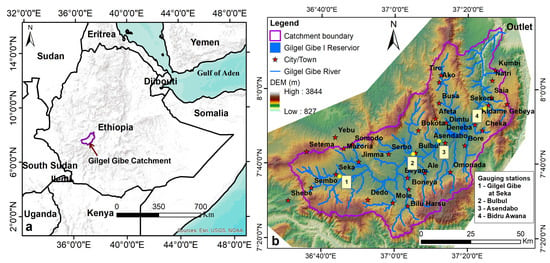
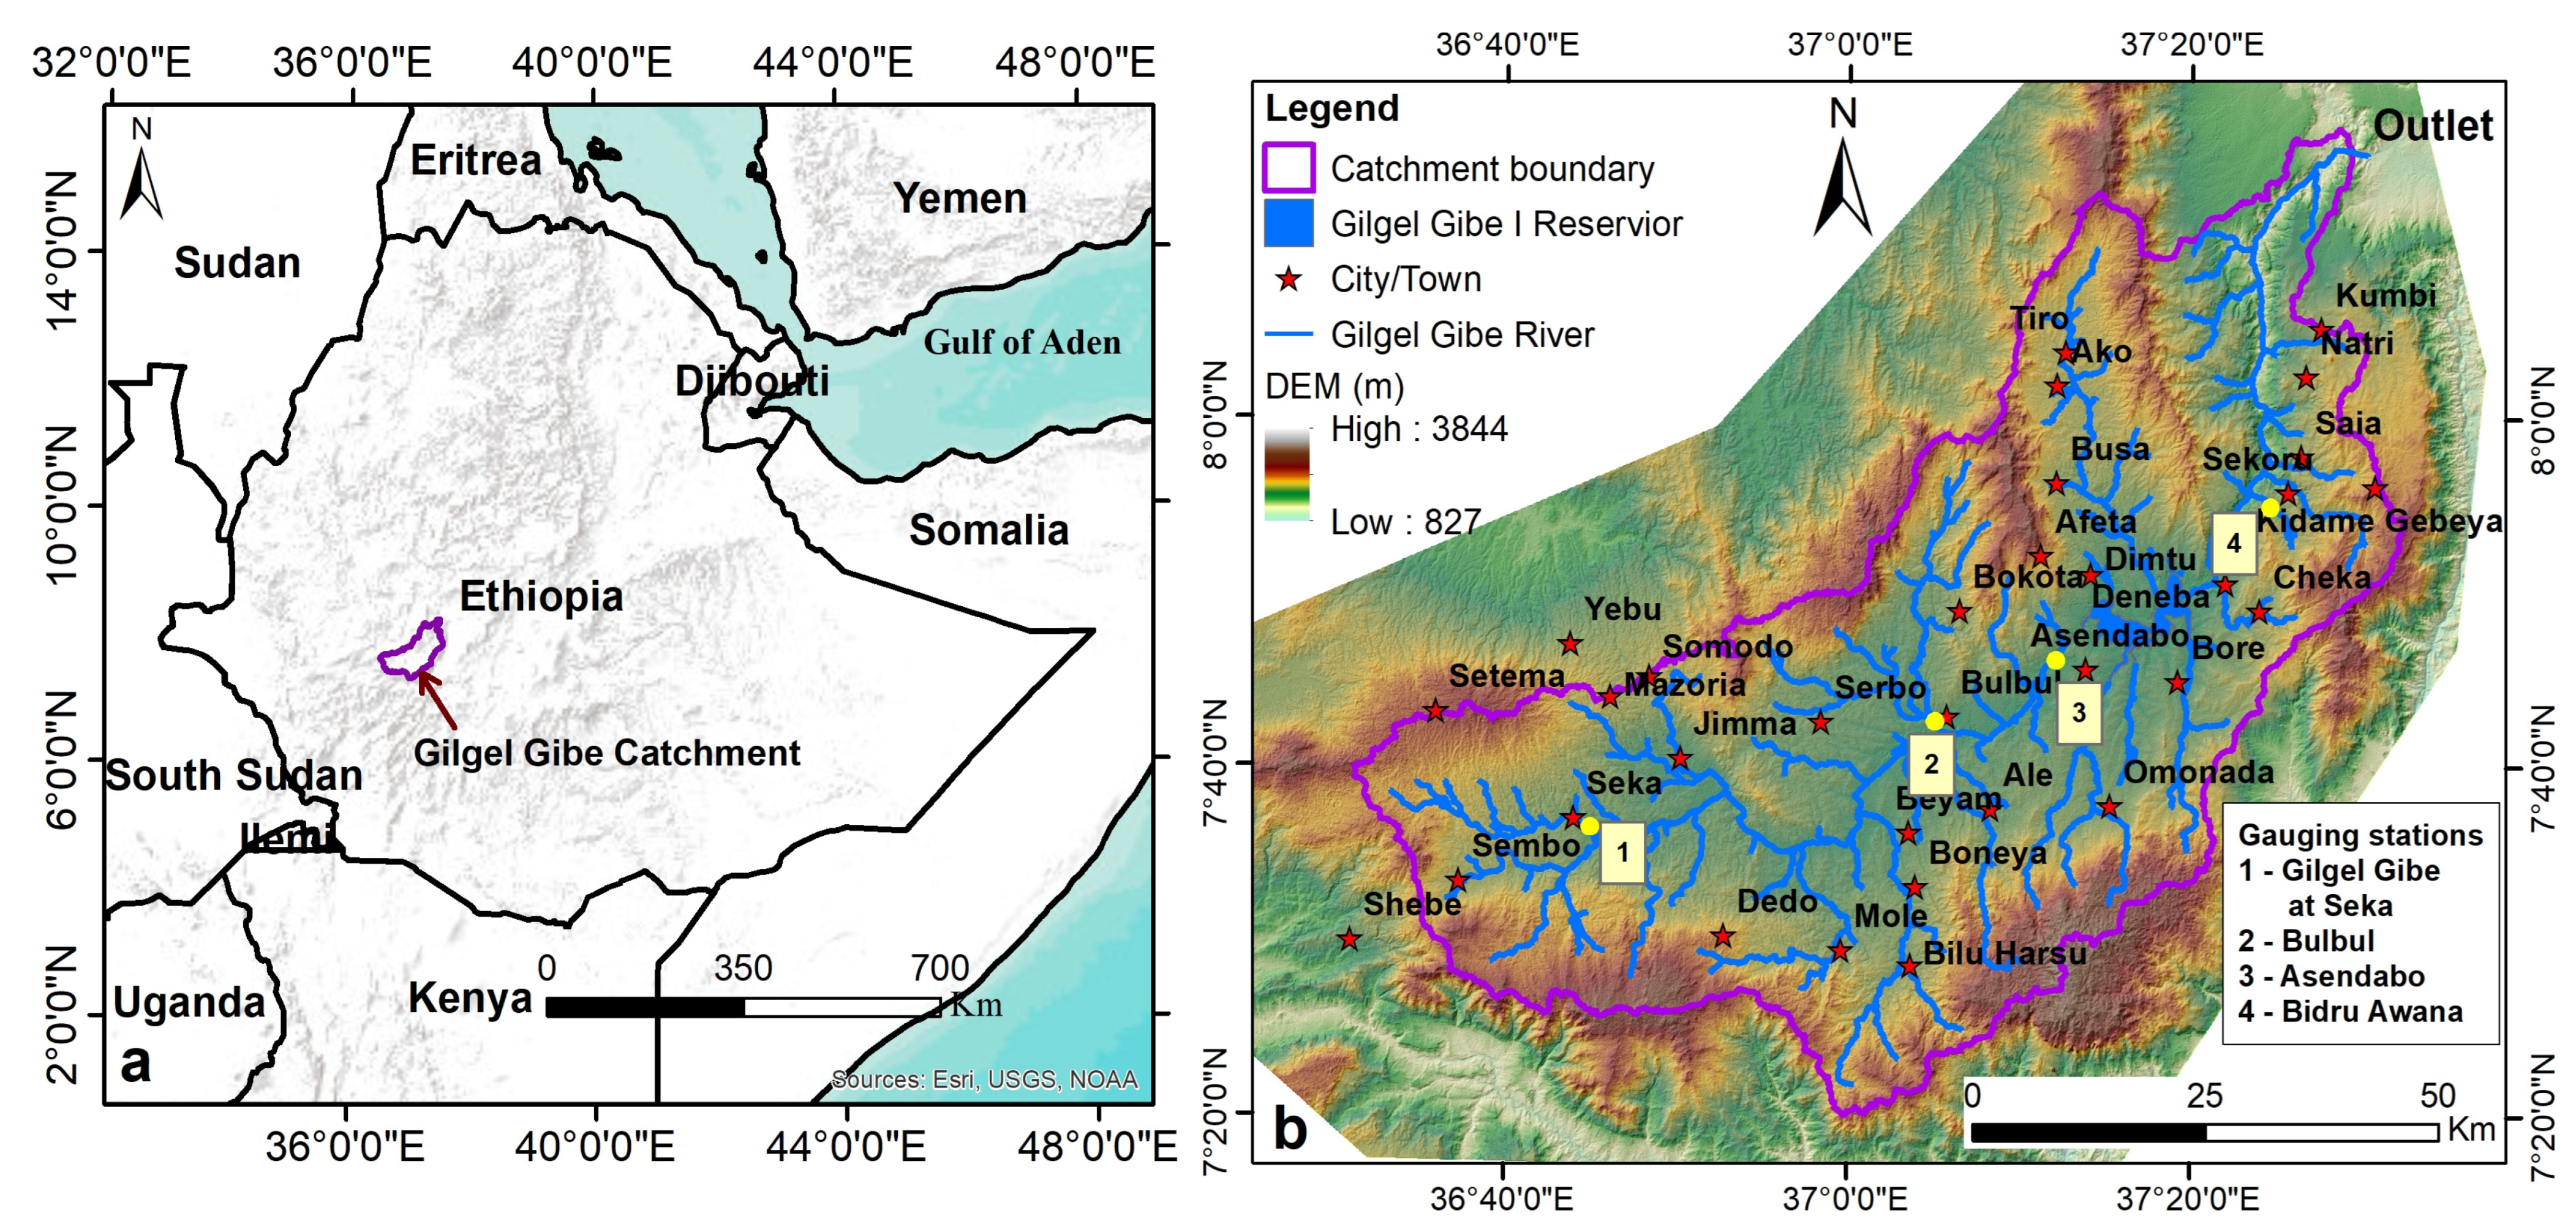
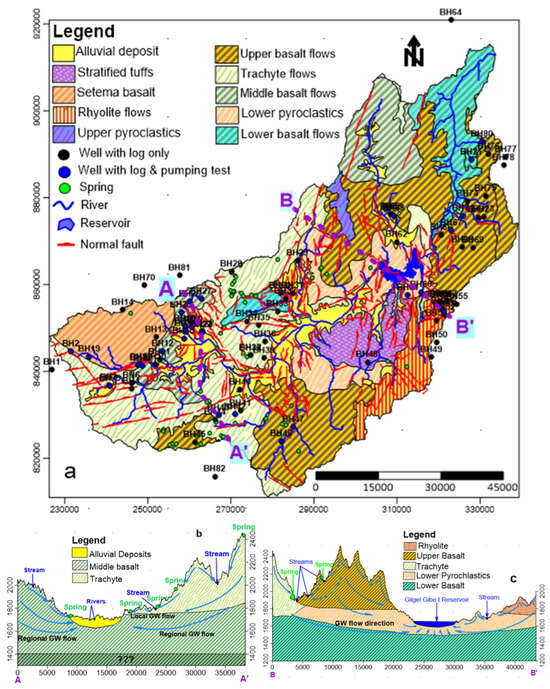
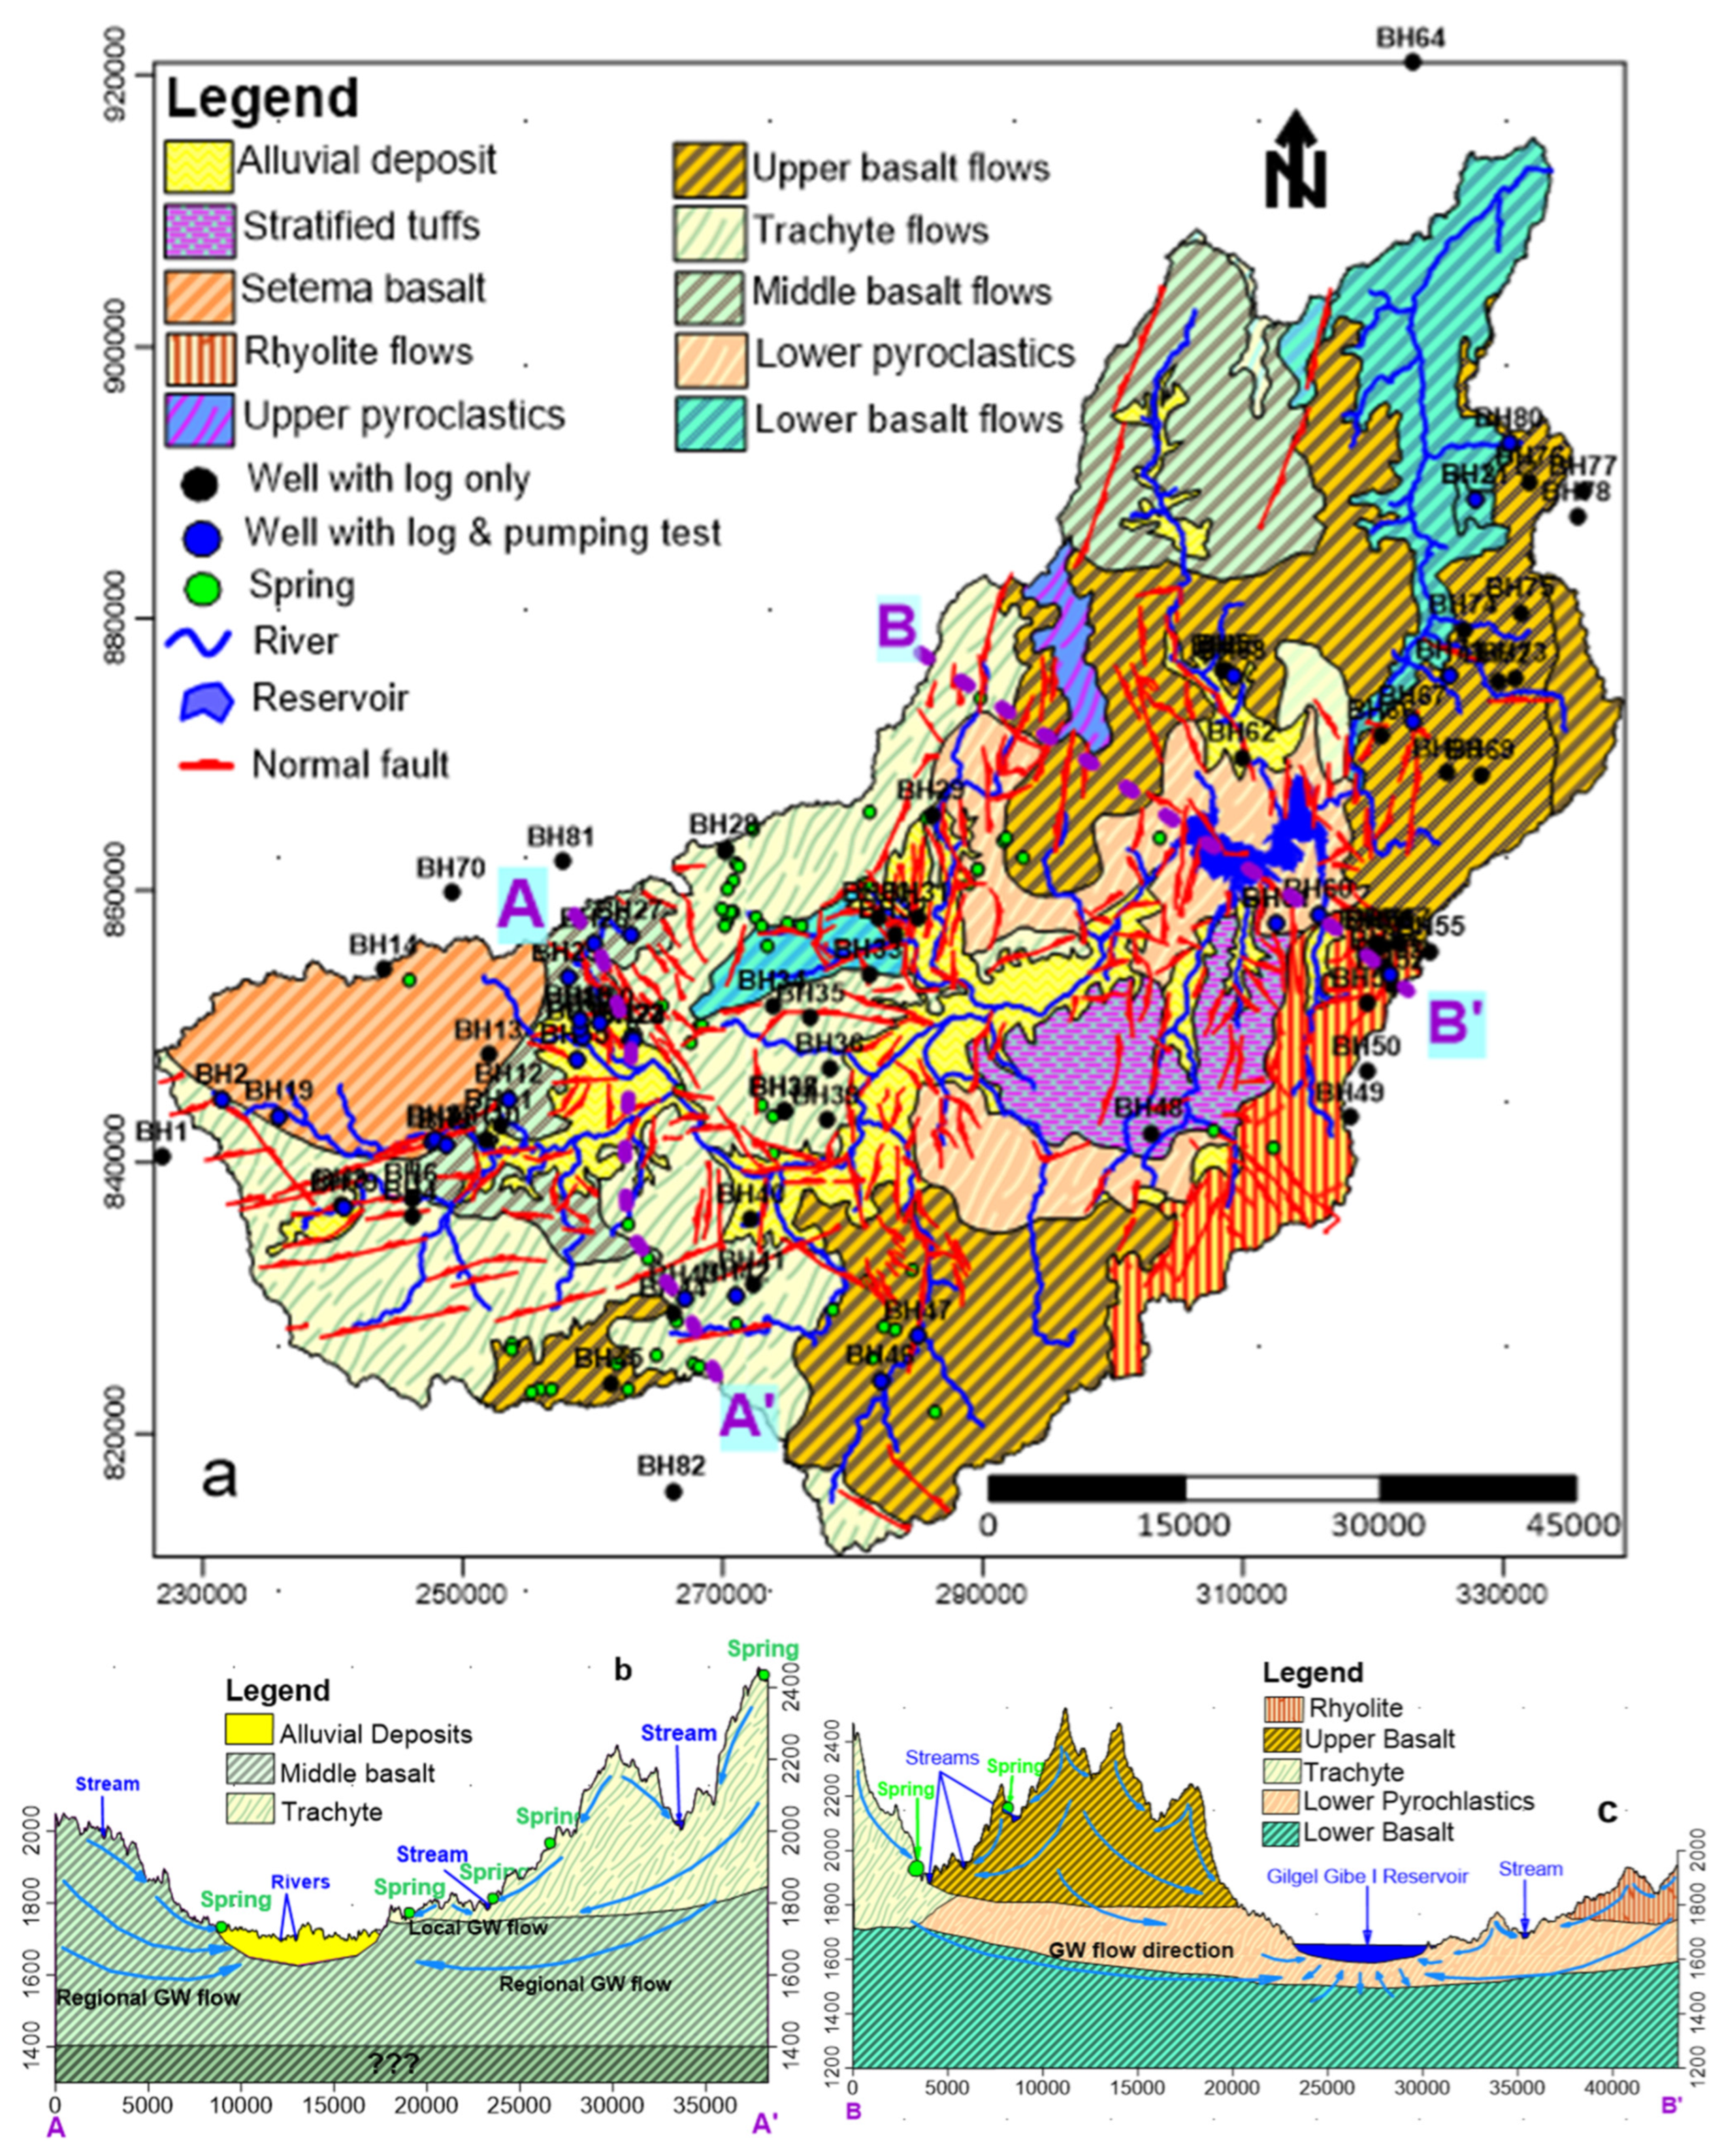
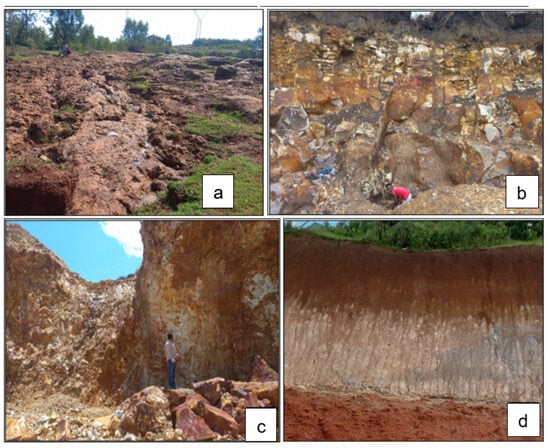
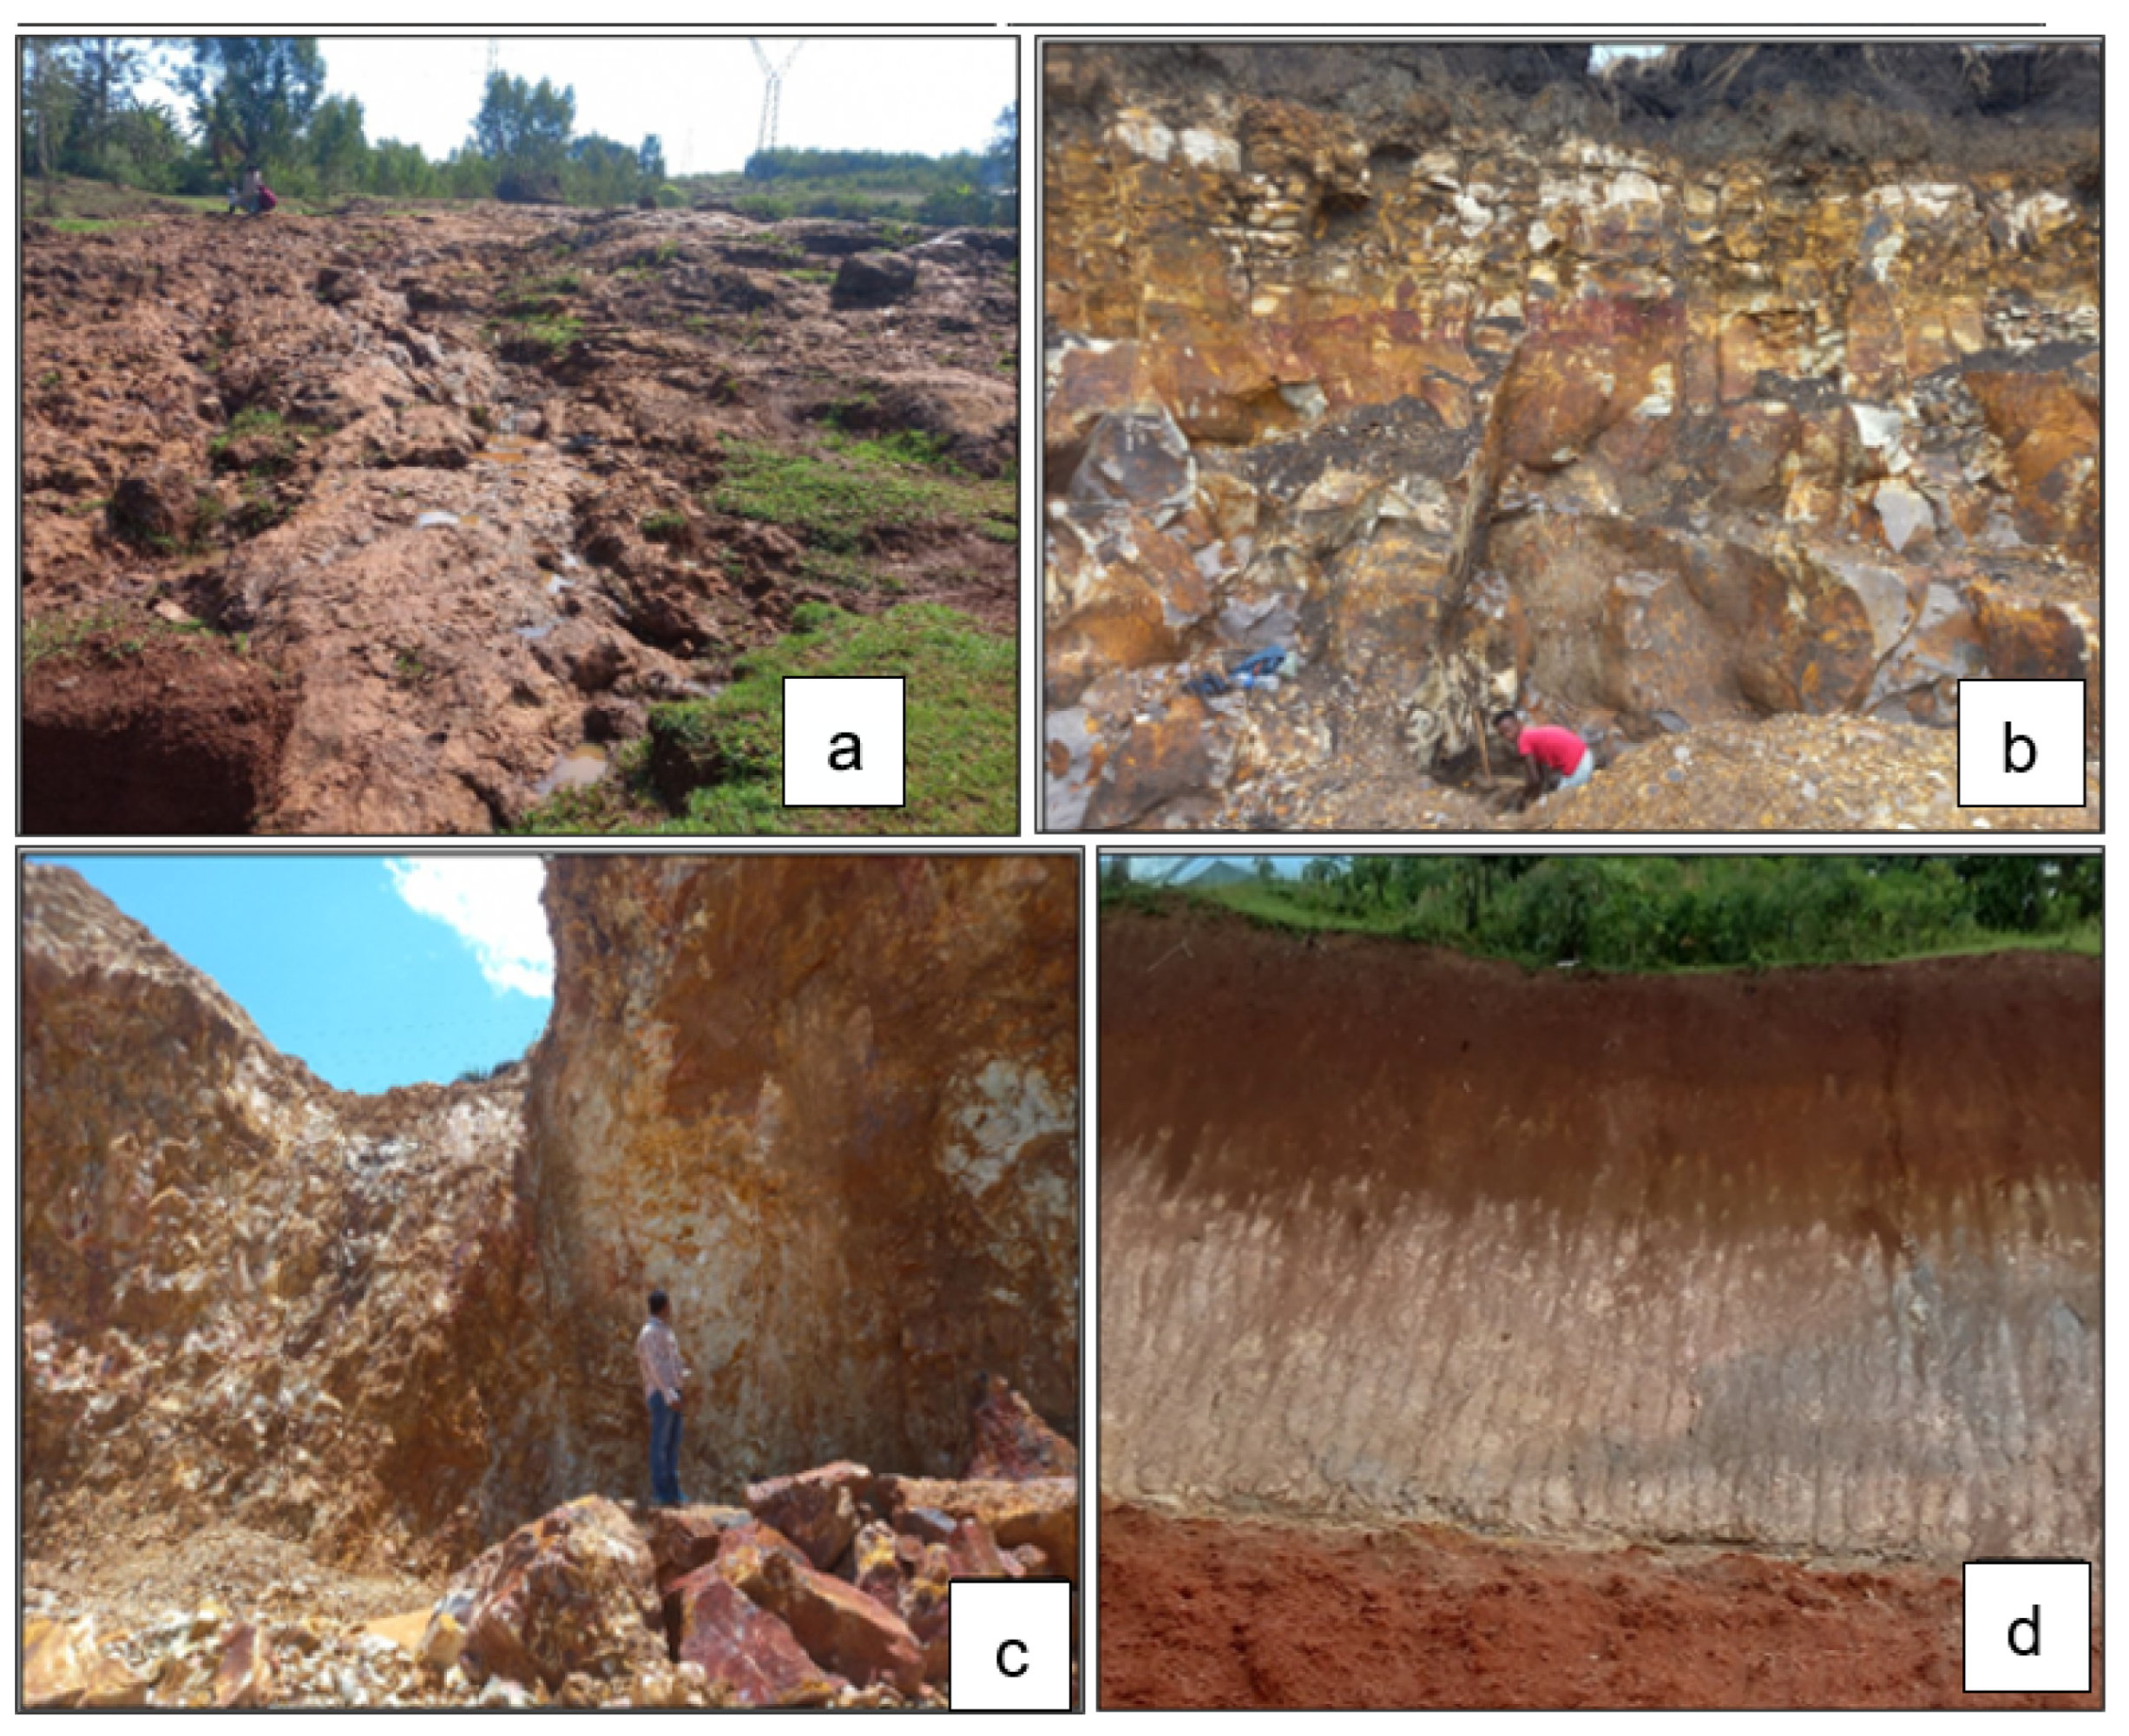
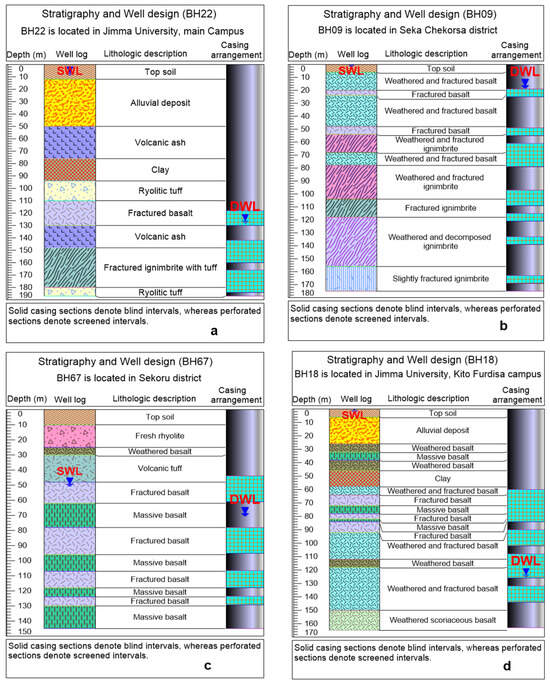
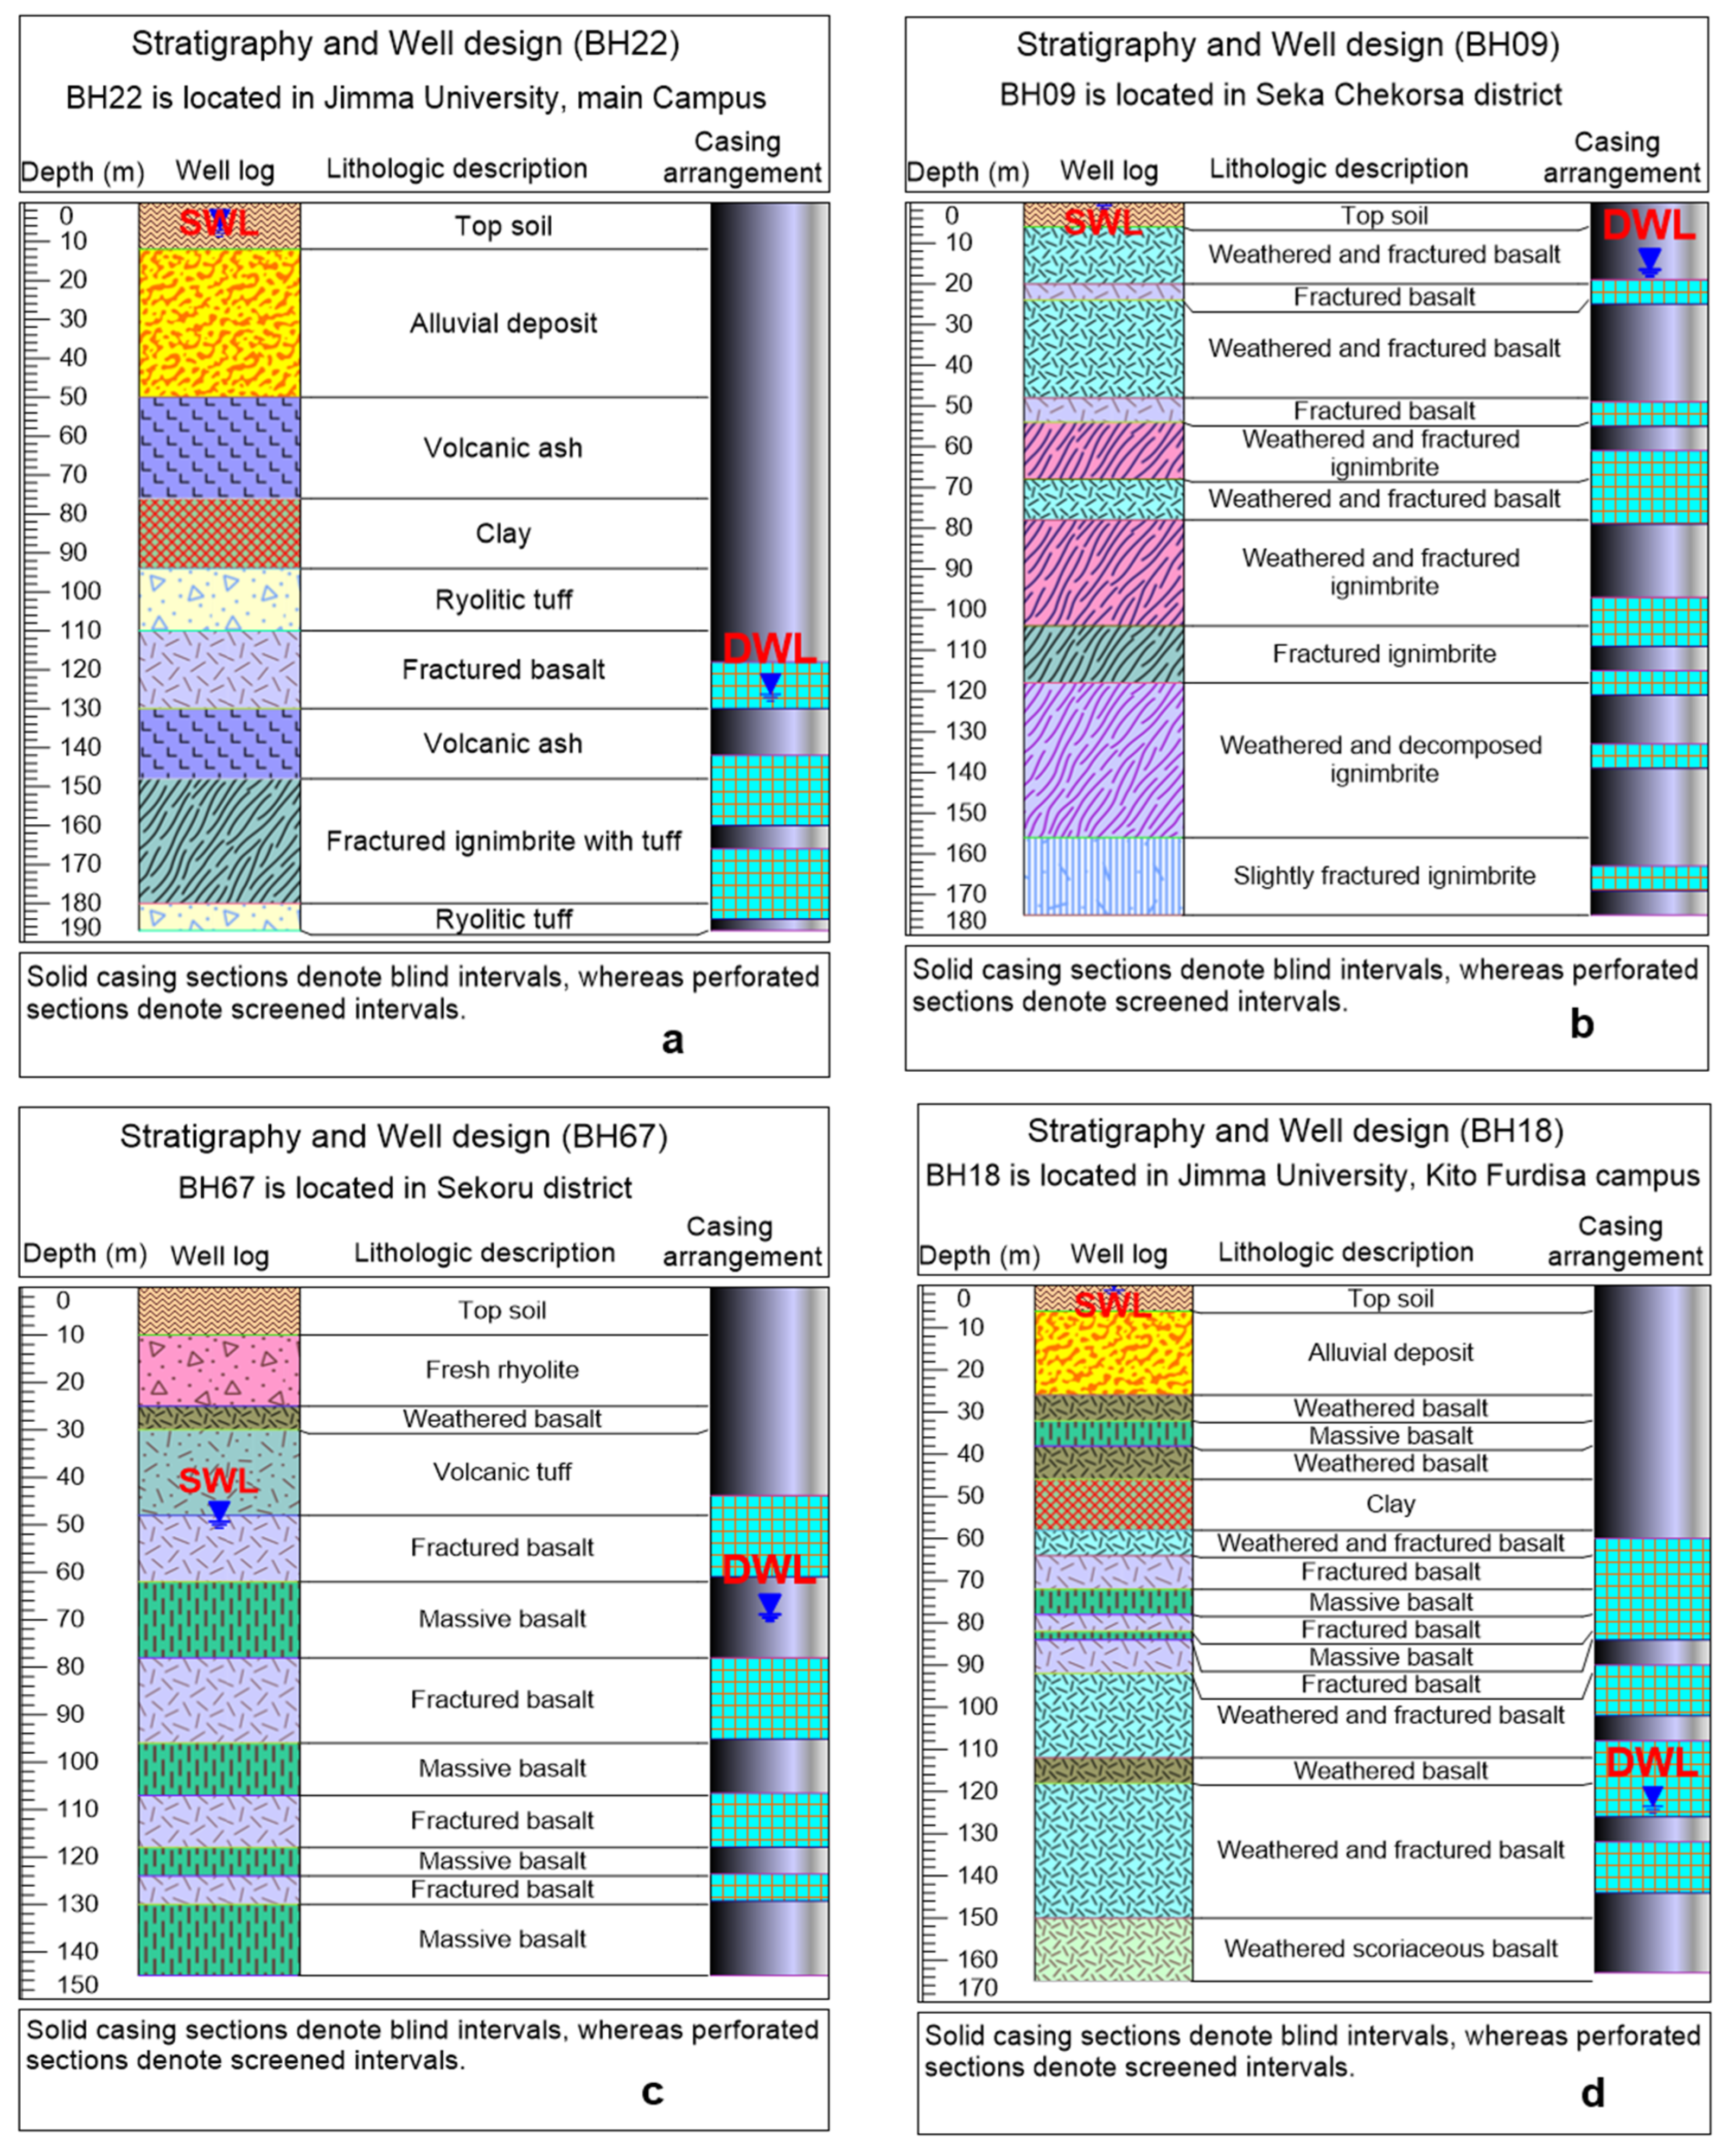
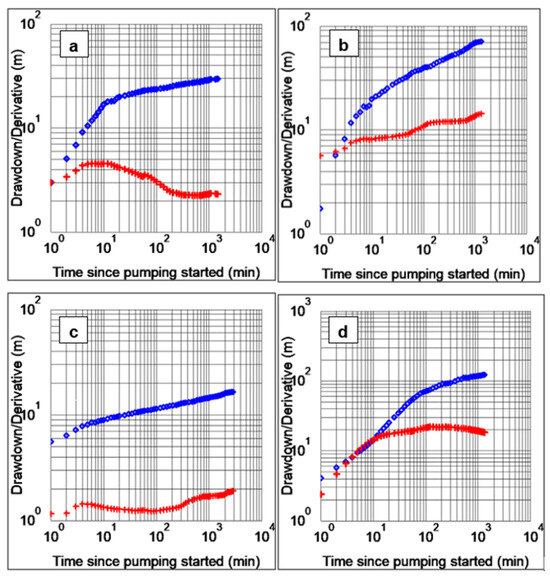
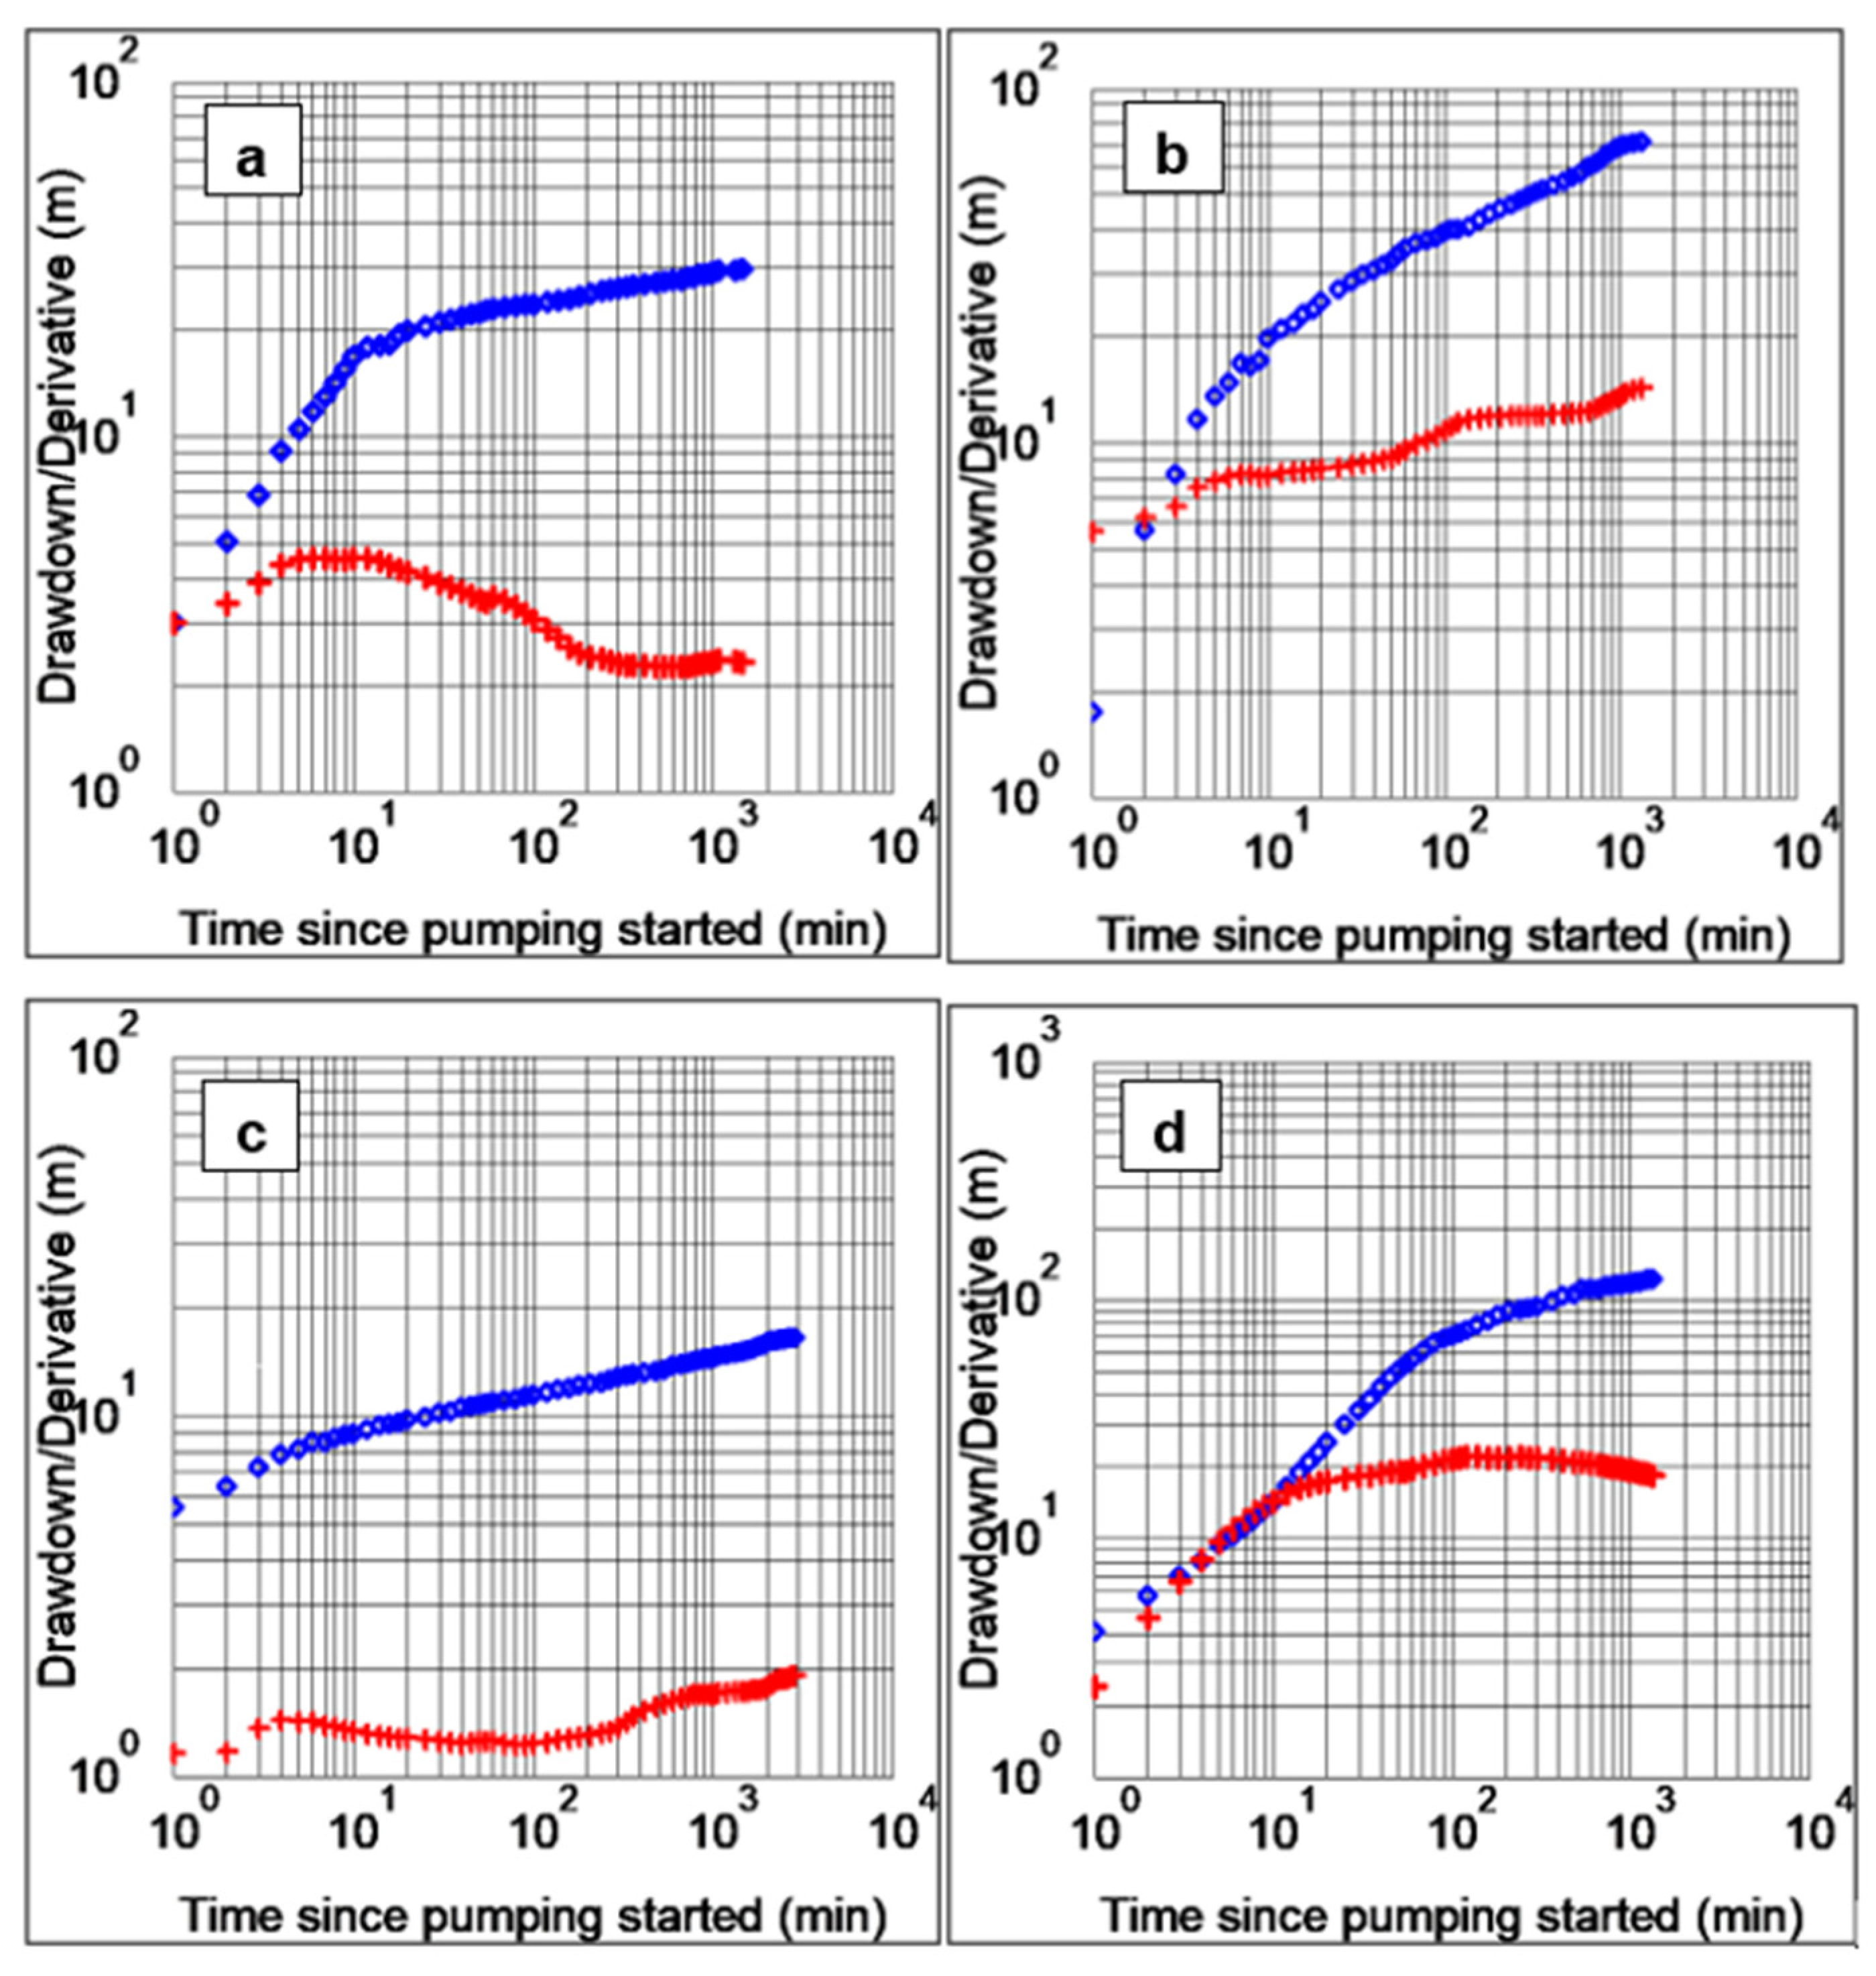
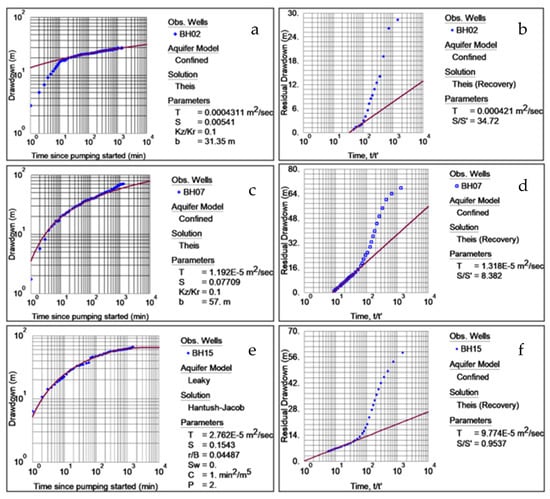
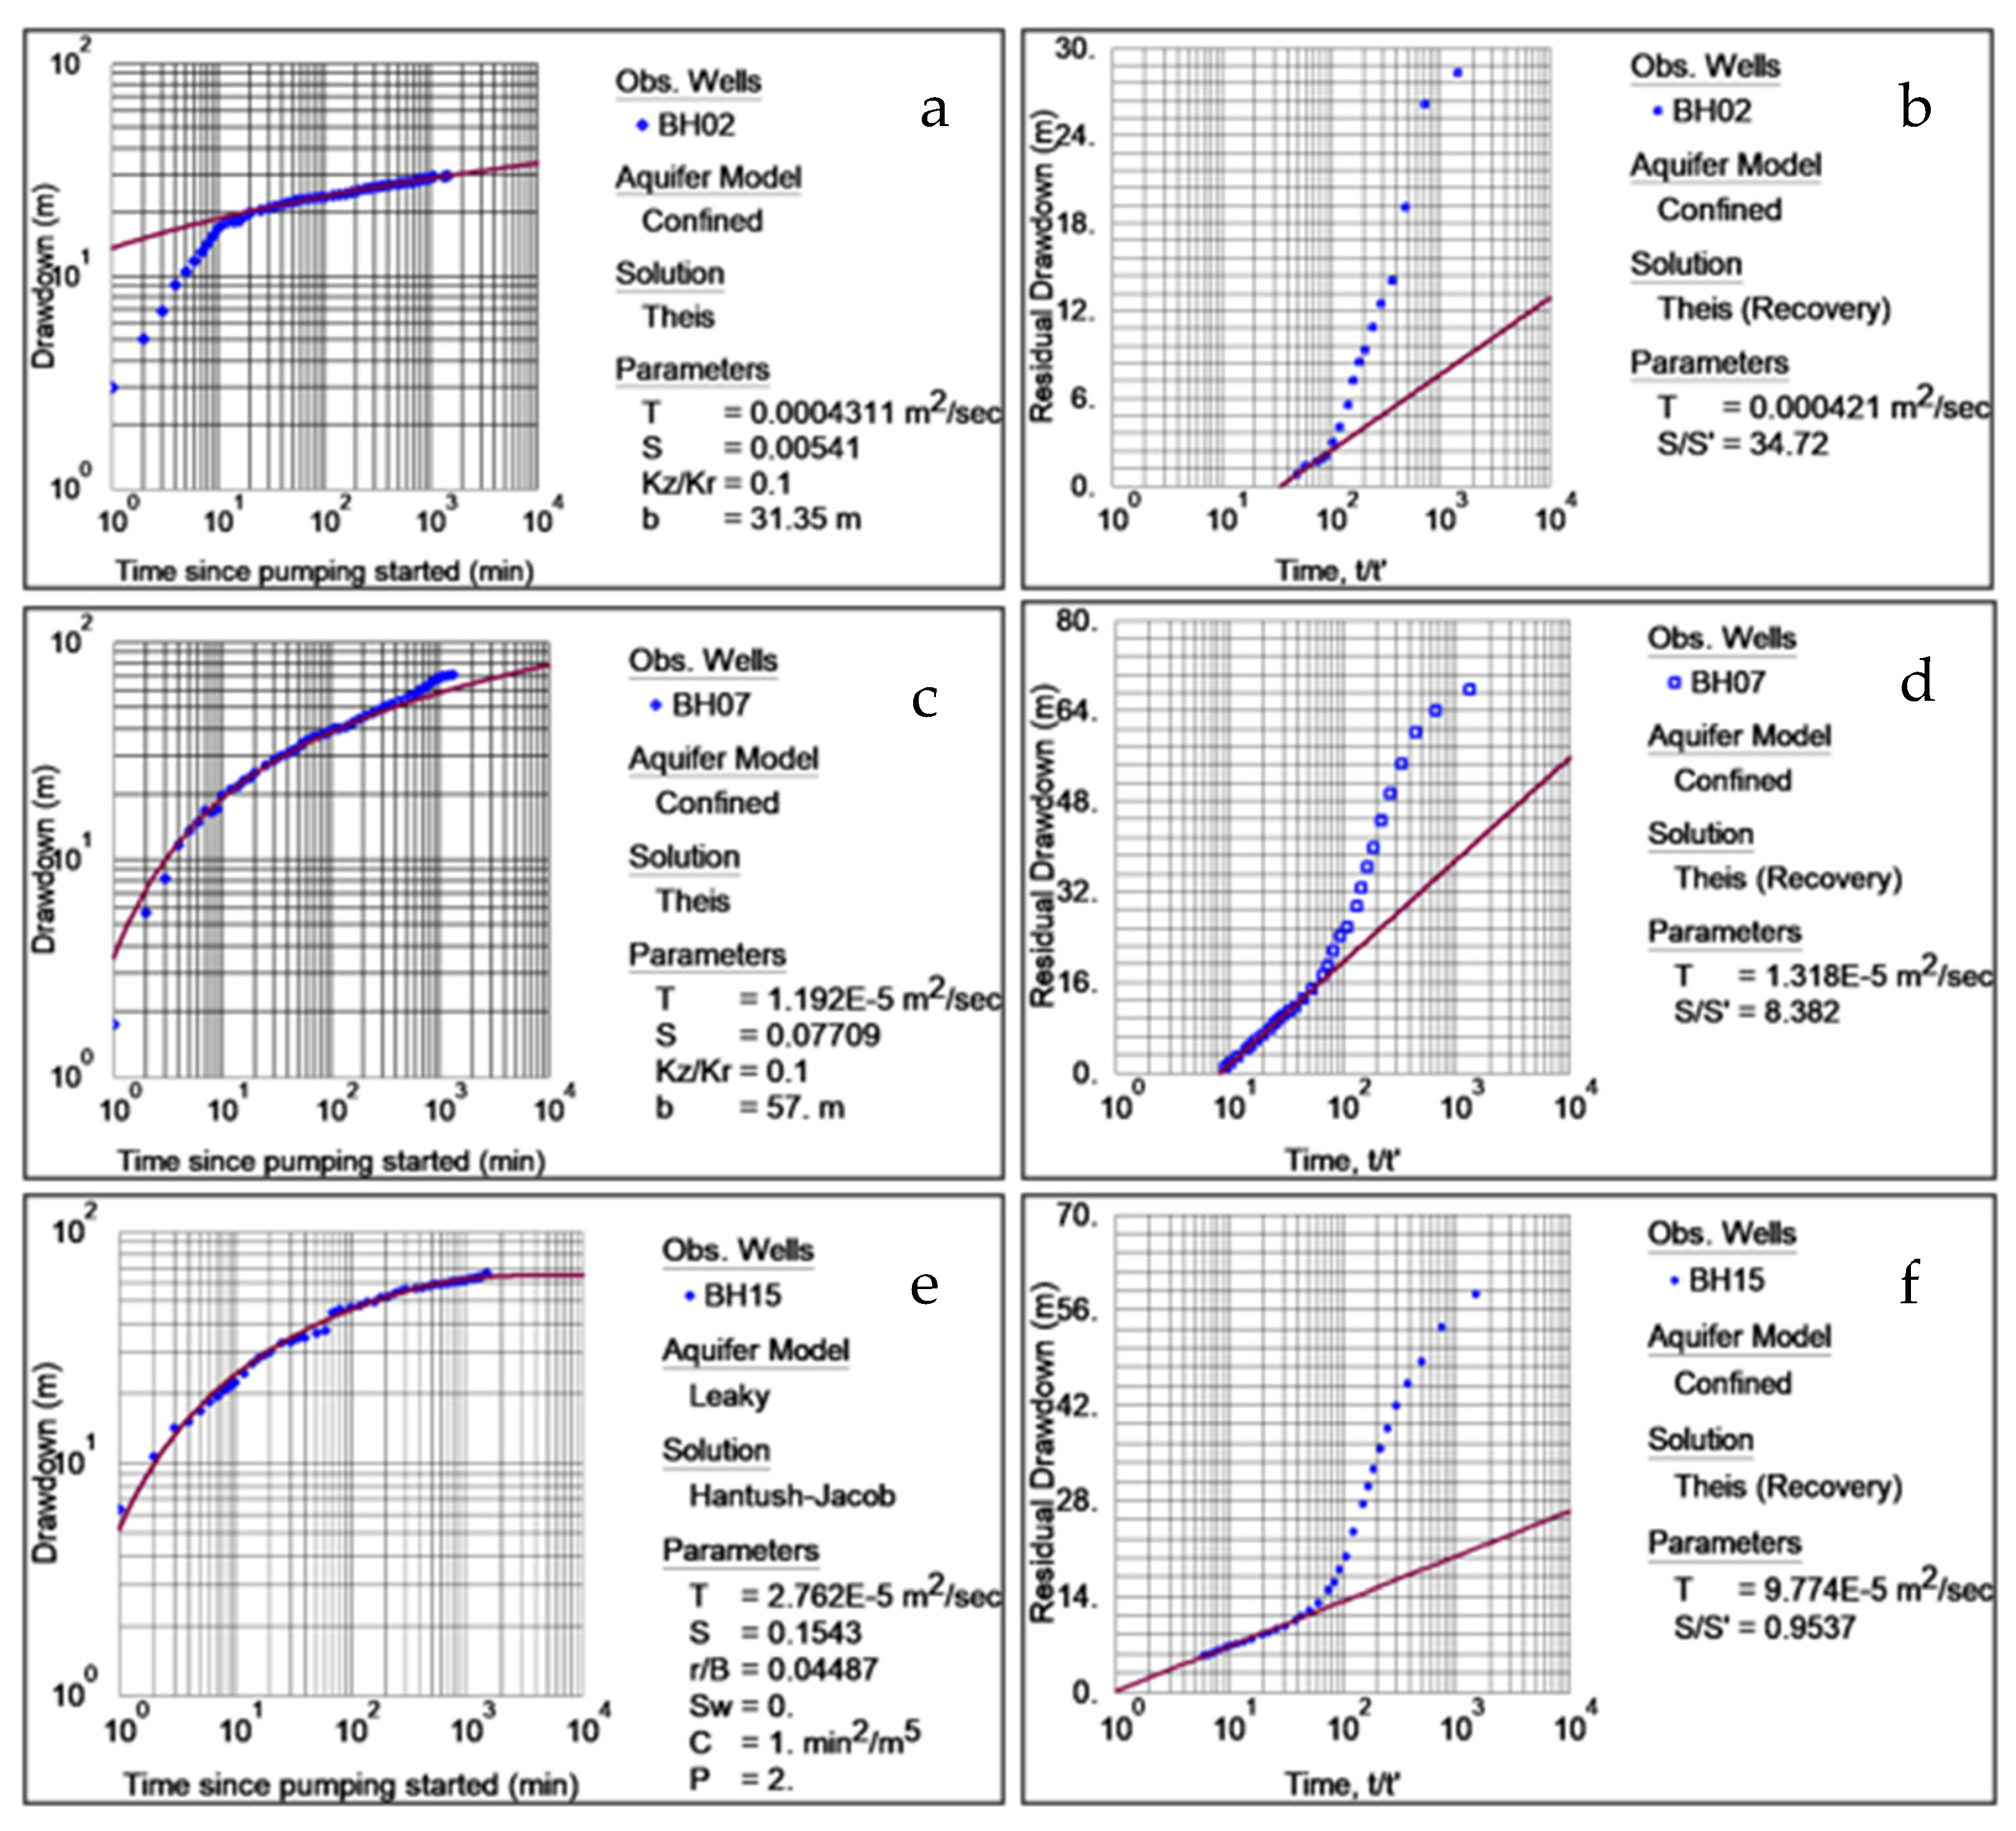
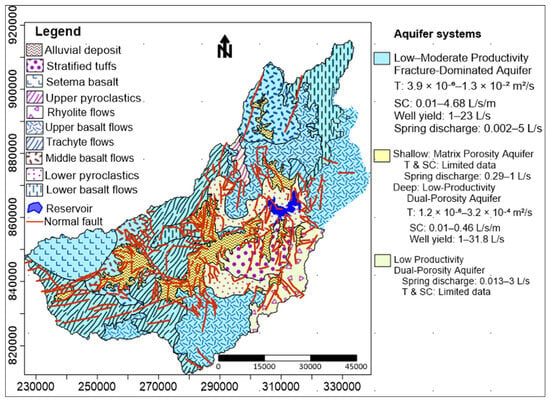
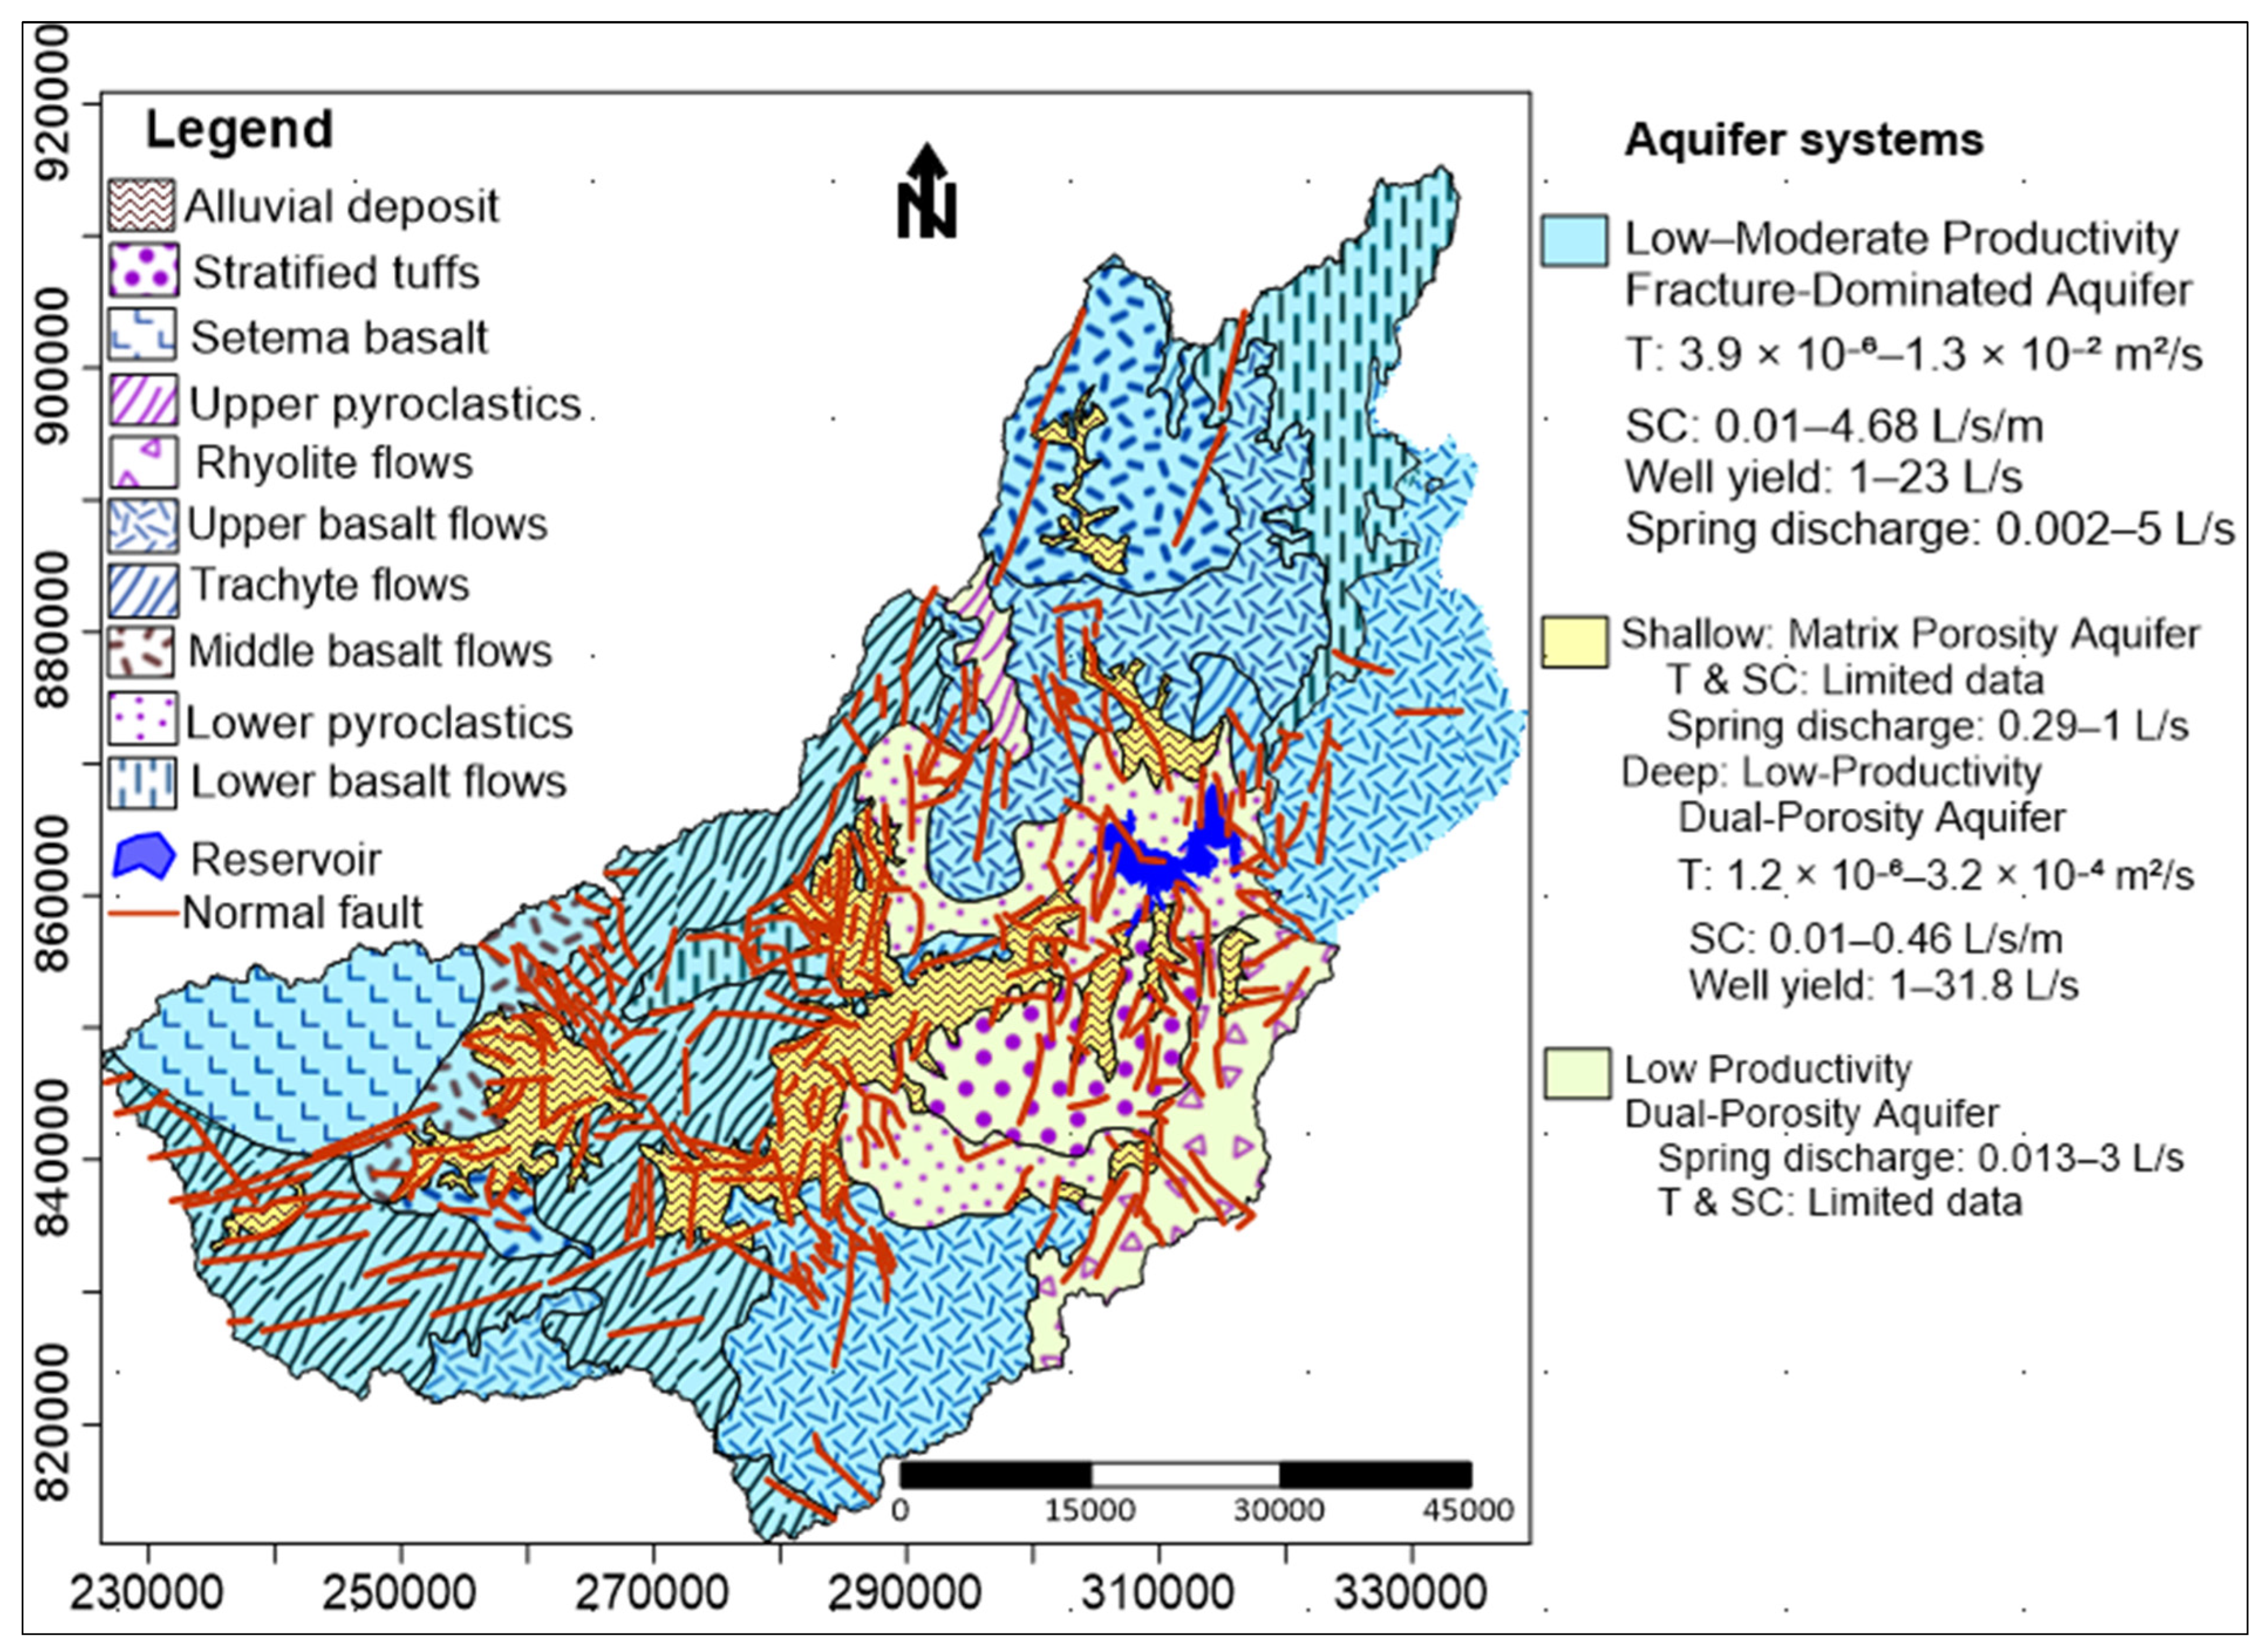

Disclaimer/Publisher’s Note: The statements, opinions and data contained in all publications are solely those of the individual author(s) and contributor(s) and not of MDPI and/or the editor(s). MDPI and/or the editor(s) disclaim responsibility for any injury to people or property resulting from any ideas, methods, instructions or products referred to in the content. |
© 2026 by the authors. Licensee MDPI, Basel, Switzerland. This article is an open access article distributed under the terms and conditions of the Creative Commons Attribution (CC BY) license.