


Abstract
Differences in the dissolution kinetics between dolomite and limestone constrain both the understanding of regional carbon cycling and the precision of speleothem-based paleoclimate reconstructions. To elucidate the mechanisms by which hydrogeochemical processes in a dolomite cave regulate dissolved inorganic carbon isotopes (δ13C-DIC), this study analyzed hydrochemical parameters and δ13C-DIC of five hydrological flow types, coupled with soil and cave CO2 and their isotopic compositions, based on monitoring data from 2019 to 2025 at Mahuang Cave (dolomite) in southwestern China, and compared them with six limestone caves. The results show that the hydrochemistry of Mahuang Cave is of the Ca·Mg-HCO3 type, with major ions exhibiting higher concentrations in the warm season and lower in the cold season, while δ13C-DIC is lighter in the rainy season and heavier in the dry season. On the interannual scale, δ13C-DIC shows only a weak correlation with ENSO phase variability, suggesting that the direct modulation of ENSO signals on the cave system is relatively limited. Water–rock–gas interactions and hydrological flow paths regulate the spatial gradient of δ13C-DIC (approximately 2.7‰): rapid fracture flow transmits light carbon signals of soil CO2 in an open system, slow matrix flow enriches heavy isotopes through enhanced prior calcite precipitation (PCP) in a near-closed system, and the underground river exhibits decoupling between Sr/Ca and δ13C-DIC due to multi-source mixing. Compared with limestone caves, Mahuang Cave is characterized by high soil CO2, low cave CO2, and heavier δ13C-DIC, which is attributed to the slow dissolution of dolomite, inhibited CO2 transport through thick overlying strata, and limited degassing due to low cave temperature. This study provides empirical evidence for understanding carbon cycling mechanisms in dolomite regions and emphasizes the need to account for lithological constraints.
1. Introduction
Chemical weathering of carbonate rocks constitutes a major carbon sink in the global carbon cycle, with karst regions contributing significantly [1,2]. Cave drip water links surface climate with subsurface sedimentary records [3], and its DIC concentration and δ13C-DIC are key proxies for tracing carbon sources and reconstructing paleoenvironments [4,5,6]. The hydrogeochemical processes and driving mechanisms of carbon isotope fractionation in limestone karst systems have been relatively well elucidated [7,8,9,10]. However, due to the presence of Mg2+ and slower dissolution kinetics, dolomite exhibits water–rock interaction (WRI) pathways, ion release patterns, and saturation state evolution that differ from those of limestone [11,12], rendering the pathways of DIC production and consumption more complex [4,8,13,14] and introducing additional uncertainties into carbon flux estimation and speleothem-based paleoclimate interpretation [2,6]. Therefore, investigating the mechanisms controlling δ13C-DIC in dolomite caves is an essential step toward understanding and refining karst carbon cycle models.
In recent years, significant progress has been made in understanding the hydrogeochemistry and carbon transport in karst caves. Long-term monitoring has confirmed that surface vegetation restoration can increase ecosystem carbon flux, leading to higher DIC concentrations and more negative δ13C-DIC values in drip water [15]. Soil CO2, as the initial carbon source for drip water δ13C-DIC, has its supply flux modulated by regional surface environmental conditions: at the seasonal scale, elevated soil CO2 concentrations in summer enhance carbonate dissolution and transmit more negative δ13C-DIC signals to drip water [16,17]. At the interannual scale, it is sensitive to regional climate variability (e.g., large-scale climate models such as ENSO [18,19]). Different hydrological pathways and flow rates not only affect WRI time, degassing efficiency, and the magnitude of isotope fractionation [20], but also give rise to differences in paleoclimate signals preserved in speleothems [21]. Fast drip flow responds rapidly but undergoes incomplete dissolution, whereas slow drip flow experiences prolonged WRI, yet mixing effects in the vadose zone can induce signal lags [7]. Conventional studies generally hold that fast-drip water has more negative δ13C values and slow-drip water more positive δ13C values. However, monitoring at Furong Cave has revealed that when “old carbon” from bedrock dissolution dominates, fast drip water can exhibit elevated δ13C-DIC values, while slow drip water may instead show more negative values due to mixing with soil organic carbon [22]. Before reaching the cave floor, karst water may undergo PCP when it becomes supersaturated with respect to calcite, particularly if pCO2 changes along its flow path or in the cave environment. Cave ventilation enhances CO2 degassing and PCP intensity by lowering cave-air pCO2, thereby collectively modulating the δ13C-DIC signals of drip water [23]. Under low pCO2 conditions in winter, rapid degassing leads to significantly more positive δ13C-DIC; consequently, speleothems primarily record winter information during ventilation periods and summer information during stagnation periods [18,24].
The Mg/Ca and Sr/Ca ratios are sensitive to hydrological changes and serve as effective proxies for identifying PCP, and indicating wet and dry conditions [25]. WRI jointly controls these ratios [26], PCP processes [14], and overlying lithology [27]. During PCP, Ca2+ preferentially partitions into the solid phase, leaving the residual water enriched in Mg/Ca and Sr/Ca. Long-term observations from Furong Cave [28,29], Shihua Cave [30], Jiguan Cave [31], Shawan Cave [8], and Shijiangjun Cave [32] consistently show that drip water Mg/Ca increases during the dry season and decreases during the rainy season. In addition, the involvement of exogenous acids (H2SO4, HNO3) in carbonate dissolution introduces non-atmospheric inorganic carbon, thereby affecting the δ13C-DIC signal [33,34].
In summary, modern cave monitoring integrated with isotopic tracing has advanced our understanding of the carbon cycle. Nevertheless, most studies have focused on single-site monitoring in limestone caves, and comparative research on the complex hydrological flow paths in dolomite caves remains scarce. In particular, the mechanisms regulating drip water δ13C-DIC under different flow paths are still poorly understood. Mahuang Cave, a branch of the Shuanghe Cave system (the world’s longest dolomite cave) in southwestern China, encompasses five hydrological flow types (vadose zone flow, percolation flow, shaft-fissure mixed flow, seasonally transitional subcutaneous flow, and underground river flow), making it an ideal site for addressing the above research gaps. Therefore, the core scientific question addressed in this study is the following: What are the hydrogeochemical mechanisms regulating drip water δ13C-DIC in dolomite caves? More specifically, how do soil CO2 input, WRI, degassing, and PCP collectively shape the spatiotemporal variability of δ13C-DIC under different hydrological flow paths? Drawing on continuous multi-parameter monitoring data from 2019 to 2025, this study overcomes the limitations of previous research and reveals the distinct characteristics of the mechanisms controlling drip water δ13C-DIC in dolomite caves.
To address these core scientific questions, this study was organized into three components: (1) identifying cave hydrological flow path types and analyzing the spatiotemporal variations in water chemistry; (2) resolving the mechanisms regulating δ13C-DIC under different hydrological flow paths, with emphasis on the roles of soil CO2 input, WRI, degassing, and PCP, while also evaluating the potential influence of interannual regional climate variability (e.g., in the context of ENSO); and (3) comparing with six limestone caves to highlight the distinctiveness of the drip water δ13C-DIC signal in dolomite caves. These findings will provide a modern-process foundation for understanding the mechanisms controlling drip water δ13C-DIC in dolomite caves and for interpreting stalagmite paleoclimate records.
2. Study Area Site Description
The field observation site is located at the Shuanghe Cave National Geopark in Wenquan Town, Suiyang County, Guizhou Province, southwestern China (107°02′30″ E–107°25′00″ E, 28°08′00″ N–28°20′00″ N; Figure 1a). Shuanghe Cave is currently the longest dolomite cave in Asia and the world, with a surveyed length of 439.7 km as of October 2025. The exposed strata in this region are dominated by the Middle–Upper Cambrian Loushanguan Formation (Є2–3ls) and the Lower Ordovician Tongzi Formation (O1t), with the main lithologies consisting of platform-evaporite dolomite and dolomitic limestone, commonly interbedded with gypsum layers and abundant celestite [35].
Figure 1.
(a) Location of Guizhou Province in southwestern China. (b) Hydrogeology of the Shuanghe Cave area and the location of Mahuang Cave; Stratigraphic codes: Cambrian (Є): Є2–3—Middle–Upper Series; Є2–3ls—Loushanguan Formation; Є2–3ls2—Second Member of the Loushanguan Formation; Є2–3ls3—Third Member of the Loushanguan Formation; the lithology is mainly platform-facies evaporitic thick-bedded dolomite and dolomitic limestone, with gypsum-bearing strata. Ordovician (O): O1m—Lower Series Meitan Formation; O1t+h—Lower Series Tongzi Formation and Honghuayuan Formation; O2+3—Middle–Upper Series; mainly dark gray to grayish-black medium- to thick-bedded dolomitic limestone and dolomite, intercalated with limestone and bioclastic rocks. Silurian (S): S1—Lower Series; S2sh—Middle Series Shiniulan Group; predominantly grayish-black carbonaceous shale and silty shale. (c) Overlying soil monitoring sites. (d) Cave passage of Mahuang Cave and monitoring locations. Symbols indicate monitoring parameters and sampling points, respectively. Abbreviations: T, temperature; RH, relative humidity; Pa, atmospheric pressure; Ws, wind speed; El, elevation.
This study focuses on Mahuang Cave (Figure 1b), the most important first-order branch of the Shuanghe system. It is 1188 m long, with an average width of 13 m and height of 9 m (Figure 1d), and its entrance is at an elevation of 720 m a.s.l. Mahuang Cave is a typical horizontal, single-entrance natural cave; its passage characteristics have been described in detail by Xiong et al. [36,37]. The region has a typical subtropical monsoon climate, with a mean annual temperature of 15.5 °C and mean annual precipitation of 1210 mm, more than 80% of which falls between April and September. The vegetation above the cave is predominantly C3 natural vegetation, with relatively thick soil cover (>100 cm), while C4 crops are mainly corn and sorghum.
3. Materials and Methods
3.1. Field Monitoring
From the cave near section to the deep zone, five drip water monitoring sites (#1, #2, #3, #4, and #6) and one underground river site (#5) were established (Figure 1d, Table 1), along with three overlying soil monitoring sites (S1, Cultivated land; S2, shrubland; S3, shrub-grassland) (Figure 1c). Cave ceiling thicknesses are given as reference values [38].
Table 1.
Summary of cave water monitoring sites in Mahuang Cave.
From January 2019 to December 2025, monthly field monitoring and water sampling were conducted. Water temperature (Tw), electrical conductivity (EC), pH, and dissolved oxygen (DO) were measured in situ using a Multi-3430 multiparameter water quality meter (model 2FD470, WTW, Munich, Germany), with measurement ranges of −5.0 to 105.0 °C, 0 to 2000 μS·cm−1, and −2 to 20, respectively. The probes were calibrated with standard solutions before measurement, and each reading took approximately 5 min. HCO3− concentration was determined on site by titration using an Aquamerck alkalinity kit (Merck, Darmstadt, Germany), with a precision of 0.1 mmol/L. Drip rates at the five drip sites were measured three consecutive times using the volumetric cylinder–stopwatch method and averaged (mL/min). Water samples were filtered through 0.22 μm membrane filters and promptly transferred into 50 mL polyethylene bottles. For cation analysis, samples were acidified with 1:1 HNO3 to pH < 2 to maintain ion activity; for δ13C-DIC analysis, two drops of HgCl2 were added. All sample bottles were filled without headspace, sealed with Parafilm, and stored at 4 °C until laboratory analysis. Methods for measuring cave microclimatic parameters (temperature and humidity), soil/cave air CO2 concentrations, and their carbon isotopic compositions have been detailed in Xiong et al. [37].
Due to the COVID-19 pandemic, monitoring was interrupted for a total of six months (February and March 2020; February and October 2021; March and September 2022). In addition, δ13C data for certain months were missing owing to instrumental failures. Meteorological data outside the cave were obtained from the Suiyang County Meteorological Station and from a weather service website (https://www.qweather.com/, accessed on 8 January 2026).
3.2. Laboratory Analyses
Water sample analyses and carbon isotope measurements were completed at the State Key Laboratory of Environmental Geochemistry, Institute of Geochemistry, Chinese Academy of Sciences.
(1) Water chemistry analysis: One duplicate sample was analyzed for every ten samples. Cations (Ca2+, Mg2+, Sr2+) were determined using a VISTA MPX inductively coupled plasma optical emission spectrometer (ICP-OES, Varian, Walnut Creek, CA, USA), with a spectral coverage of 175–785 nm, a resolution of 0.009 nm, and a detection limit of 0.001 mg/L. The relative standard deviation (RSD) was better than 2%.
(2) δ13C-CO2 (soil/cave air) measurement: Air samples in sampling bags were connected to a vacuum extraction system (pressure < 10−3 mbar), and CO2 was cryogenically collected using a liquid nitrogen cold trap to remove non-condensable gases. The purified CO2 was then transferred into sample tubes and measured using a MAT 252 gas isotope ratio mass spectrometer (Finnigan MAT, Bremen, Germany). A dual-inlet mode was employed, with at least 8 comparison measurements per analysis. The instrument has a resolution of 200, a mass range of 1–150 amu, and a precision better than 0.15‰. Results are reported relative to the Vienna Pee Dee Belemnite (VPDB) standard.
(3) δ13C-DIC (cave water) measurement: A 50 mL water sample was placed in a reaction flask (vacuum < 10−2 mbar), to which 2–3 mL of anhydrous phosphoric acid (concentration ≥ 99%) was added. The mixture was allowed to react at room temperature for 2 h to convert DIC into CO2. The evolved gas was passed through an −80 °C cold trap to remove water vapor, and CO2 was then cryogenically trapped in a −196 °C liquid-nitrogen cold trap. The vaporized CO2 was introduced into the MAT 252 mass spectrometer for measurement, with a precision of ≤0.15‰, and results are reported relative to the VPDB standard.
3.3. Characterization of DIC
DIC typically exists in three inorganic species: carbonic acid (H2CO3, including dissolved CO2(aq)), bicarbonate (HCO3−), and carbonate (CO32−), with their speciation mainly controlled by pH. In natural waters with pH values between 7 and 9, HCO3− generally accounts for more than 90% of total DIC [2]. Given that the mean pH of the water samples in this study is 8.39, HCO3− is the dominant DIC species. Accordingly, we use the measured HCO3− concentration as a proxy for DIC, a practice adopted in previous studies [33,39].
This study identified six samples with pH > 10 (June 2021). Under such high pH conditions, the contribution of CO32− to total DIC is non-negligible. To address this, we used the PHREEQC program to calculate total DIC and the major carbon-bearing species (HCO3−, CO32−, CaCO3, MgCO3, and CO2(aq)) for these six samples. The results showed that HCO3− accounted for 29.7% of total DIC on average, whereas CO32− accounted for 38.2% on average (Table S1, Supplementary Materials). However, these six high-pH data points represent only 1.3% of all valid water chemistry samples (n = 466) and occurred in a single month (June 2021), with no recurrence before or after the monitoring period. As such, they represent an isolated hydrological event that does not affect the seasonal patterns or statistical results derived from the long-term monitoring. Accordingly, measured HCO3− concentrations were retained as a proxy for DIC for these six samples.
3.4. Calculation of Precipitation Anomaly in Percentage
The precipitation anomaly in percentage (PA) is the deviation of precipitation during a given period from the climatic mean for the same period. For analytical convenience, following the Grades of meteorological drought (GB/T 20481-2017), a PA ≤ −40% at the annual scale is classified as “severe drought” and is designated as an extreme drought year in this study; when −40% < PA ≤ −15%, it is classified as “mild to moderate drought” and is designated as a drought year. Correspondingly, wetter conditions are defined as 15% < PA < 40% for a wet year, and PA ≥ 40% for an extreme wet year. The PA is calculated as:
where PA is the precipitation anomaly percentage (%), P is the precipitation during a given period, and is the climatic mean precipitation for the same period (mm).
3.5. Calculation of the Carbonate Equilibrium Model
The calcite saturation index (SIc) is a key indicator of the saturation state of ions in water and reflects whether the water is saturated with respect to calcite, thereby indicating the tendency for calcite dissolution or precipitation: SIc > 0 indicates a saturated state, whereas SIc < 0 indicates an undersaturated (dissolving) state. The partial pressure of CO2 in drip water (pCO2(w)) reflects the degree of degassing at the water-air interface. The SIc and pCO2(w) were calculated using the PHREEQC program (version 3.4.0; U.S. Geological Survey), with the following equations:
where lg denotes the base-10 common logarithm, [Ca2+] and [CO32−] are the ion activities in water, and Kc is the equilibrium constant for calcite dissolution in water [40].
where [H+] and [HCO3−] are ion activities in water (mol/L), and k1 and kh are the first dissociation constant of H2CO3 and Henry’s law constant, respectively.
3.6. Selection of PCP Proxy Model
Two main types of models are commonly used to identify PCP: linear models based on single-element ratios (Mg/Ca or Sr/Ca), and slope-threshold methods based on the logarithmic ratio of two elements (ln(Sr/Ca) vs. ln(Mg/Ca)). The slope-threshold method requires that the partition coefficients of Mg and Sr remain constant over time. However, in cave environments, these partition coefficients are influenced not only by temperature but also by multiple factors, including calcite growth rate, initial fluid composition, and crystal structure [14,41], making the constant-coefficient assumption difficult to satisfy in complex karst systems.
In Mahuang Cave, the mean annual temperature variation from 2019 to 2025 is only about 1.5 °C, suggesting that the effect of temperature on partition coefficients is limited [42]. Nevertheless, the slope-threshold method is more sensitive to variations in initial water chemistry and flow paths, which limits its applicability in this study area. In contrast, the linear relationship between Mg/Ca and Sr/Ca is clearly responsive to WRI and PCP processes and has been widely validated in cave studies across diverse climatic settings worldwide [43,44]. Therefore, this study adopts the linear Mg/Ca–Sr/Ca relationship as the proxy for identifying PCP.
3.7. Identification of ENSO Event Conditions
This study identifies El Niño–Southern Oscillation (ENSO) events using the Niño 3.4 region (120° W–170° W, 5° N–5° S) sea surface temperature (SST) anomalies and the Southern Oscillation Index (SOI), obtained from the U.S. National Centers for Environmental Prediction (NCEP) via the data access website (https://www.cpc.ncep.noaa.gov/data/indices/, accessed on 23 January 2026), with the goal of providing a climatic context for the interannual variability of δ13C-DIC during the monitoring period. Following the Identification method for El Niño/La Niña events (GB/T 33666-2017), an ENSO event is identified when the SST anomalies in the Niño 3.4 region persist for at least five consecutive months at or above ±0.5 °C (≥0.5 °C for El Niño, ≤−0.5 °C for La Niña), and is further validated by concurrent SOI anomalies (negative for El Niño, positive for La Niña).
3.8. Statistical Analyses
Pearson correlation analysis was used to assess linear correlations between δ13C-DIC and environmental parameters, with 95% confidence intervals reported for each correlation coefficient. To account for serial dependence in monthly time-series data, autocorrelation function (ACF) analysis (max lag = 24 months) was performed to extract the first-order autocorrelation coefficient (r1) for each variable, and cross-correlation function (CCF) analysis (max lag = ±12 months) was applied to identify optimal lag times between δ13C-DIC and each environmental parameter. Effective sample sizes (N_eff) were calculated as N_eff = N × (1 − r1,X × r1,Y)/(1 + r1,X × r1,Y) to adjust significance tests for serial autocorrelation. Bonferroni correction was applied for multiple comparisons (m = 7, α = 0.05/7 ≈ 0.0071). Regression diagnostics included the Durbin–Watson statistic, studentized residuals, and variance inflation factors (VIF). Relevant data analysis was performed using Origin 2021 and IBM SPSS Statistics 25.
4. Results
4.1. Environmental Conditions Outside Mahuang Cave
Statistical analysis of meteorological parameters in the study area from 2019 to 2025 (Figure 2c) shows that monthly mean air temperatures ranged from 3.7 to 27.4 °C, with an overall mean of 15.9 °C. Annual mean temperatures were 15.1, 15.6, 16.0, 15.9, 16.1, 16.4, and 16.1 °C, respectively, indicating a warming trend. Temperatures began to rise markedly in March each year, with the highest values occurring in August and the lowest in February of the following year. Monthly precipitation ranged from 0 to 412.8 mm, with a monthly mean of 73.6 mm. Annual total precipitation amounts were 1069.8, 1421.4, 752.2, 224.4, 664.0, 1113.7, and 938.0 mm, respectively, with a mean annual total of 883 mm, of which 79.1% fell between April and September, reflecting the typical mid-subtropical climate pattern of concurrent high temperature and rainfall.
Figure 2.
Drip sites in Mahuang Cave and meteorological variations. (a) Slow drip sites #1, #2, and #6. (b) Fast drip sites #3 and #4; (c) Air temperature and precipitation (cyan bars indicate months with concentrated rainfall). ED, D, N, W, and EW denote dry–wet year categories, corresponding to extreme drought, drought, normal, wet, and extreme wet years, respectively.
Based on the PA (Equation (1)), the years were classified as follows: 2022 (−75%) was an extreme drought year; 2023 (−25%) was a drought year; 2021 (−14.8%) and 2025 (6%) were normal years; 2019 (21%) and 2024 (26%) were wet years; and 2020 (61%) was an extreme wet year (with a single-month precipitation of 412.8 mm in September, approximately twice the total annual precipitation of 2022).
4.2. Hydrological Dynamics and Classification of Drip Water Types
During the monitoring period, the five drip sites exhibited pronounced spatial differences in discharge rates (Figure 2a,b). Sites #1, #2, and #6 showed low and stable discharge rates, ranging from 0.01 to 0.29 mL/s, with mean values of 0.07–0.09 mL/s. Site #3 exhibited considerable variability (0.2–20 mL/s, mean 4.05 mL/s), with a trickle flow during the dry season and pulsed-surge flow during the rainy season. Site #4 showed the most extreme variability (0.03–90 mL/s, mean 7.92 mL/s), even ceasing flow during the dry season (e.g., September–October 2019), while producing extreme peaks driven by rainstorms during the rainy season (e.g., 76.67 mL/s in October 2020; 90 mL/s in April 2024), reflecting a typical seasonal transition response.
Based on the response characteristics of drip water to rainfall [45], the five drip sites were classified into four hydrological types (Figure 3): Vadose zone flow type (#1, #2)—low discharge with moderate coefficient of variation, modulated by storage in the thick vadose zone through pore and fracture media. Percolation flow type (#6)—the most stable discharge (lowest CV), reflecting slow percolation through fine pores and micro-fractures. Shaft-fracture mixed flow type (#3)—a multiple-flow-path system composed of fast shaft conduits and slow fracture networks, with conduit flow during the rainy season and fracture seepage during the dry season. Seasonally transitional subcutaneous flow type (#4)—extreme discharge variability, characterized by wall seepage or even cessation during the dry season and storm pulse responses during the rainy season, serving as a typical indicator of rapid transmission and transient storage in the epikarst zone. Overall, discharge at all sites was higher in the rainy season than in the dry season, but the amplitude of the response and the lag time varied with the hydrological pathway.
Figure 3.
Hydrological types of drip water in Mahuang Cave are classified following the method of Smart and Friedrich (1987) [45].
4.3. Spatiotemporal Characteristics and Types of Hydrochemical Ions
Hydrochemical ion concentrations in Mahuang Cave exhibited pronounced seasonal fluctuations (Figure 4). Ca2+ and HCO3− showed a pattern of higher concentrations in the warm season and lower in the cold season (Ca2+ summer–autumn mean: 46.19–47.44 mg/L; winter–spring mean: 43.80–45.08 mg/L; HCO3− peak of 317.73 mg/L in summer and trough of 122.04 mg/L in winter), reflecting that the warm season, with higher temperatures and increased rainfall, enhances soil CO2 input and intensifies carbonate dissolution, whereas the cold season shows the opposite trend. Mg2+ exhibited a seasonal increase, with a peak occurring in winter (15.83 mg/L). Na+ concentrations are anomalously high in spring (up to 2.66 mg/L, approximately twice those of the other seasons), while the spring mean of SO42− is the highest of the four seasons (20.12 mg/L) but with limited amplitude, indicating that the spring “initial flushing effect” leached soluble surface salts and sulfides accumulated during the preceding dry season [46,47]. In contrast, K+, Cl−, and NO3− do not exhibit spring enrichment comparable to that of Na+, which mainly arises from differences in their storage locations and transport pathways within the epikarst: K+ is subject to double buffering by growing-season vegetation uptake and clay mineral adsorption, Cl− has diffuse sources and limited net accumulation, and NO3− is regulated by multiple processes including source mixing (chemical fertilizer, soil nitrogen, manure, and atmospheric deposition), nitrification–denitrification, and plant uptake.
Figure 4.
Interannual variations in hydrochemical ions from 2019 to 2025. (a) Rainfall; (b) Ca2+; (c) Mg2+; (d) Sr2+; (e) Na+; (f) K+; (g) HCO3−; (h) Cl−; (i) SO42−; (j) NO3−.
On the interannual scale, concentrations remained generally stable, except for an abrupt change from March to June 2024, characterized by a sharp rise followed by a steep decline. In March–April, Na+ concentrations first showed anomalously high values (reaching 16.28 and 15.86 mg/L), followed by a transient peak in HCO3− at sites #5 and #6 in April (258.79 and 317.73 mg/L). In May–June, Ca2+ and Mg2+ dropped precipitously: Ca2+ fell sharply from 53.96 mg/L in April to 13.22 mg/L (a 75.7% decrease), while Mg2+ synchronously dropped to a low range of 0.34–3.77 mg/L.
This abrupt change can be attributed to the cumulative effects of soil CO2 and solute storage in the vadose zone resulting from two consecutive dry years (224.4 mm in 2022, 664 mm in 2023) [48]. The precipitation events in March–April 2024 triggered layered leaching. In the initial stage, infiltrating water first flushed readily soluble salts (e.g., NaCl and nitrates) that had accumulated on the rock and soil surfaces, driving a sharp increase in Na+ [49]. Subsequently, the water continued to percolate downward, dissolving high-concentration CO2 stored in the vadose zone and forming highly corrosive carbonic acid, which caused a transient HCO3− peak at sites #5 and #6. By May–June, sustained heavy rainfall triggered a flow-regime shift and piston-flow flushing, whereby newly infiltrated low-mineralization rainwater displaced the previously stored high-mineralization “old water” [10,50], resulting in an abrupt decline in Ca2+ and Mg2+. Notably, the precipitation amounts during this period (20.2–198.4 mm) were not the highest recorded in the study period, suggesting that the temporal distribution of rainfall and the antecedent hydrological state (vadose zone moisture conditions and solute storage) exert greater control over hydrochemical responses than the total precipitation amount alone [51,52].
Ion concentrations showed pronounced spatial heterogeneity (Table 2). Among cations, Ca2+ ranged from 40.39 to 48.48 mg/L, decreasing from #1 to #5 with a slight rebound at #6. Mg2+ was highest at #6 (22.66 mg/L, approximately twice that of #3), with the largest standard deviation (6.18), indicating a significant contribution from dolomite dissolution. Sr2+ was lowest at #1 and #3 and highest at #6 (1.36 mg/L), suggesting PCP occurrence. Na+ showed little spatial variation and remained at relatively low concentrations across all sites (1.53–1.79 mg/L), while K+ was highest at #6 (2.28 mg/L) and lowest at #1 (0.83 mg/L).
Table 2.
Spatial characteristics of hydrochemical parameters at monitoring sites (2019–2025).
Among anions, HCO3− ranged from 2.77 to 3.45 mmol/L, with the highest value at #6 and the lowest at #4. Sites #1 and #2 exhibited elevated Cl− (4.90 mg/L) and NO3− (22.39 mg/L), likely indicating the strongest influence from agricultural activities. Site #6 had the highest SO42− concentration (42.96 mg/L), which is 2.5 to 3.6 times that of the other sites, reflecting sulfuric-acid-driven dissolution. NO3− showed a marked decreasing trend from #1 to #6, likely constrained by agricultural nitrogen inputs.
Piper diagram analysis (Figure 5) indicates that the hydrochemical type of Mahuang Cave water is Ca·Mg-HCO3. Cations are dominated by Ca2+ (61.3%) and Mg2+ (32.7%), while among anions, HCO3− is the overwhelmingly dominant species, accounting for 91.57% of total anion equivalents.
Figure 5.
Piper diagram of hydrochemical types in Mahuang Cave.
4.4. Spatiotemporal Characteristics of Hydrochemical Parameters and Elemental Ratios
The main physicochemical parameters of Mahuang Cave water are shown in Table 2 and Figure 6b–e. Tw ranged from 5.2 to 19.9 °C (mean 13.5 °C), with higher values in summer and lower in winter, and increased progressively from #1 to #6 (13.02–14.81 °C), with #6 showing the smallest variation (CV = 10%), indicating the most thermally stable environment. The pH ranged from 7.15 to 10.75 (mean 8.39), indicating weakly alkaline conditions, with slightly higher values in winter–spring than in summer–autumn and relatively small spatial variation. EC ranged from 222 to 509 μS/cm, with values in the order of summer > spring ≈ autumn > winter, highest at #6 (389.12 μS/cm) and lowest at #5 (291.66 μS/cm). DO averaged 9.14–9.52 mg/L, with higher values in winter and lower in summer, showing no significant differences among sites. At the interannual scale, these parameters remained generally stable; however, several anomalies warrant attention, including sharp increases in EC in spring and summer 2019 (509 μS/cm at site #3 in April and 480 μS/cm at site #2 in August), a pH < 7.5 in September 2025, and pH values > 10 in June 2021. Notably, the six monitoring sites recorded exceptionally high pH values (10.31–10.75) in June 2021, with precursor pH elevations (9.24–9.74) already observed in May of the same year, suggesting a regional hydrological event. This anomaly was most likely caused by the “piston-flow effect” triggered by sustained rainfall during the Meiyu (plum rain) season, whereby high-pH “old water” was displaced en masse by infiltrating rainfall. The anomaly occurred only in the June 2021 monitoring event (n = 6, accounting for 1.3% of all valid samples) and did not recur thereafter, representing an isolated event that did not affect the overall seasonal pattern.
Figure 6.
Variations in major physicochemical parameters from 2019 to 2025. (a) Rainfall and air temperature; (b) cave water temperature; (c) pH; (d) electrical conductivity (EC); (e) dissolved oxygen (DO); (f) saturation index of calcite (SIc); (g) partial pressure of CO2 in drip water (pCO2(w)); (h) Mg/Ca molar ratio; (i) 100 × Sr/Ca molar ratio.
SIc and pCO2(w) exhibited a typical inverse relationship (Figure 6f,g). SIc ranged from 0.54 to 0.76 (all >0, n = 462), indicating that the water was generally supersaturated with respect to calcite; negative values were also observed (minimum SIc = −0.42, n = 6), suggesting localized episodes of undersaturation. SIc varied in phase with pH (Figure 6c). The negative logarithm of pCO2(w) ranged from −3.13 to −3.31, with small differences among sites, indicating relatively uniform CO2 partial pressure in the water.
The Mg/Ca ratio (Figure 6h) was higher in winter (0.584) and lower in summer (0.536), with higher values in dry years and lower in wet years. Spatially, it increased progressively from #1 (0.45) to #6 (0.8), with #2 (0.6) and #5 (0.54) at intermediate levels, and #3 (0.41) and #4 (0.45) relatively lower; #4 exhibited the largest variation (CV = 28%).
The 100 × Sr/Ca ratio (Figure 6i) also showed higher values in winter (0.973) and lower values in summer (0.768), but its peaks and troughs did not correspond to dry/wet year classifications, and its interannual variation was irregular. Spatially, #5 (1.42) and #6 (1.4) had significantly higher values than the other sites, while #1 (0.47) and #3 (0.5) had the lowest values. #5 and #6 showed the smallest variation (CV = 51–57%), whereas the remaining sites exhibited larger variability (CV = 87–126%).
Overall, the concomitant increase in Mg/Ca and Sr/Ca indicates enhanced water–rock interaction, while their decoupling suggests contributions from different mineral end-members (e.g., preferential dissolution of dolomite vs. calcite).
4.5. Spatiotemporal Characteristics of Soil–Cave–Water Carbon Isotopes Under Interannual Climate Variability
During the monitoring period, the regional climate exhibited pronounced interannual variability. As a background reference, ENSO underwent a phase transition from a weak El Niño (2019) to a triple La Niña (summer 2020, spring 2021, autumn 2022), then to a moderate El Niño (May 2023–April 2024), and subsequently returned to La Niña conditions (Figure 7b), accompanied by interannual fluctuations in precipitation and temperature (Figure 7a).
Figure 7.
(a) Air temperature and precipitation; (b) ENSO events (El Niño and La Niña phases are indicated by light yellow and light blue shading, respectively); (c–g) Soil and cave CO2, DIC concentrations, and their δ13C values.
Soil air CO2 concentrations (Figure 7c) were highest at S3 (16,089 ppmv), followed by S1 (10,932 ppmv) and S2 (10,531 ppmv), with overall higher values in the rainy season and lower in the dry season. Soil δ13C-CO2 exhibited an inverse pattern (Figure 7d), with ranges of −26.57‰ to −13.17‰ at S1, −26.89‰ to −17.23‰ at S2, and −26.57‰ to −15.71‰ at S3, and mean values of −21.21‰, −23.79‰, and −23.25‰, respectively.
Cave air CO2 (318–974 ppmv) followed a similar seasonal pattern to soil CO2 but at significantly lower absolute concentrations, with seasonal means of 710 ppmv in summer, 539 ppmv in autumn, 489 ppmv in spring, and 392 ppmv in winter (Figure 7e), and showed a slight increase from the entrance to the interior (near cave section, 526 ppmv; transition zone, 542 ppmv; deep zone, 547 ppmv). Cave δ13C-CO2 (Figure 7f) was lightest in summer (−16.57‰) and heaviest in winter (−10.82‰). Spatially, it became progressively lighter from the entrance toward the interior: #2 (−13.51‰) > #3 (−13.54‰) > #6 (−13.88‰).
Cave water δ13C-DIC ranged from −13.66‰ to −2.14‰, with a mean of −9.1‰, showing a pattern of lighter values in the rainy season and heavier values in the dry season, with interannual fluctuations following precipitation variations (Figure 7g): mean values were lighter in the wet year of 2019 (−9.60‰) and the extreme wet year of 2020 (−10.08‰), increased to −8.97‰ in the normal year of 2021, reached their heaviest in the extreme drought year of 2022 (−8.21‰) and remained heavy in the drought year of 2023 (−8.24‰), then rebounded to −9.12‰ in the wet year of 2024 and stabilized at −8.70‰ in the normal year of 2025, showing an overall negative correlation with precipitation. Spatially, δ13C-DIC was lightest at #3 (−10.63‰), followed by #1 (−9.66‰), then #4 (−8.69‰), #2 (−8.53‰), and the underground river #5 (−8.43‰), with the heaviest value at #6 (−7.92‰). The mean δ13C-DIC varied by approximately 2.7‰ across sites due to differences in hydrological pathways and WRI, with the largest variations observed at #4 and #5 (CV = 34–35%).
4.6. Time-Series Characteristics, Cross-Correlation, and Regression Analysis Results
ACF analysis revealed significant first-order autocorrelation for all variables (Table S2, Supplementary Materials): δ13C-DIC (r1 = 0.687), temperature (0.807), rainfall (0.453), soil CO2 (0.626), cave CO2 (0.684), and Niño 3.4 SST (0.956) (all p < 0.001). Based on these values, N_eff ranged from 16.1 (SST–δ13C-DIC) to 43.1 (soil δ13C-CO2–δ13C-DIC) (Table S3, Supplementary Materials).
CCF analysis indicated that temperature, rainfall, soil CO2, cave CO2, soil δ13C-CO2, and cave δ13C-CO2 all achieved their maximum correlation with δ13C-DIC at lag 0 months (Table S3; Table 3), indicating a response time of less than one month and reflecting a sub-monthly geochemical response of the cave system. Niño 3.4 SST peaked at lag +5 months (r = −0.282), but this value fell below the 95% confidence interval (±2SE ≈ 0.234) and was not statistically significant. This result suggests that the ENSO signal is substantially attenuated and buffered during transmission through the atmosphere-hydrology-karst system, exerting only a weak direct influence on dripwater cave δ13C.
Table 3.
Summary of Pearson correlation coefficients, cross-correlation lags, and regression diagnostics between δ13C-DIC and environmental parameters.
Pearson correlation analysis (Table 3) showed that δ13C-DIC was significantly negatively correlated with temperature (r = −0.747, n = 78), rainfall (r = −0.649, n = 78), soil CO2 (r = −0.742, n = 78), and cave CO2 (r = −0.823, n = 78) (all p < 0.001, Bonferroni-corrected α = 0.05/7 = 0.0071), and significantly positively correlated with soil δ13C-CO2 (r = 0.396, n = 77) and cave δ13C-CO2 (r = 0.794, n = 77). Niño 3.4 SST showed no significant correlation with δ13C-DIC (r = 0.002, p = 0.984).
Regression diagnostics (Table S4, Supplementary Materials; Table 3) showed Durbin–Watson statistics ranging from 0.521 to 1.312, maximum studentized residuals < 3, and VIF = 1.000. Cave CO2 was the strongest predictor (R2 = 0.678), whereas Niño 3.4 SST had near-zero explanatory power (R2 ≈ 0).
5. Discussion
5.1. Influence of Interannual Hydroclimatic Variability on δ13C in Soil–Cave–Drip Water
The δ13C-DIC is a sensitive geochemical indicator of carbon cycling in karst systems, with its initial value primarily inherited from soil CO2 after dissolution fractionation [53]. Because overlying vegetation uses different photosynthetic pathways, the theoretical δ13C-CO2 values of soil CO2 derived from decomposing plant residues differ significantly (C3 plants: ~−27‰; C4 plants: ~−13‰), and this signal can be transmitted to the cave via infiltrating water [54].
The δ13C-DIC variations measured at Mahuang Cave reveal a sensitivity to interannual hydroclimatic variability in the region. While ENSO was included in the analysis as a background framework for interannual climate variability, this study places greater emphasis on how precipitation/temperature changes driven by ENSO phases propagate to the drip water δ13C-DIC signal via soil CO2 input, infiltration recharge, and PCP processes. During El Niño phases, regional moisture increased; enhanced plant productivity and soil microbial activity elevated soil CO2 production, while abundant precipitation inhibited the diffusion of soil CO2 into the atmosphere, thereby increasing the concentration of CO2 dissolved in infiltrating water. This, in turn, promoted rapid carbonate dissolution and transported DIC enriched in light carbon (12C) into cave water, resulting in more negative δ13C-DIC values [55,56]. During the maximum precipitation event in September 2020 (412.8 mm), the δ13C-DIC value at site #3 reached its lowest value over the seven-year monitoring period (−13.66‰). During La Niña phases, reduced precipitation not only lowered soil CO2 production but also prolonged the residence time of drip water in the vadose zone, driving PCP, during which light carbon (12C) was preferentially partitioned into the solid phase, leaving the residual water enriched in 13C [10,57]. During the triple La Niña period, δ13C-DIC values at sites #4 and #5 were significantly enriched (ranging from −3.3‰ to −2.19‰), approximately 4.5‰ heavier than the multi-year mean.
The correlation and cross-correlation analyses (Table 3; Figure 8; Tables S2–S4, Supplementary Materials) indicate that the seasonal variations in δ13C-DIC are primarily regulated by the interplay of soil CO2 input, rainfall recharge, and cave CO2 degassing inhibition. Rising temperatures and increased precipitation promote soil microbial activity, leading to elevated soil CO2 concentrations; the 12C-enriched soil CO2 then enters karst water, thereby reducing drip water δ13C-DIC [9,55]. The high cave CO2 concentration in summer (710 ppmv) inhibits degassing, preserving light isotopes and resulting in more negative δ13C-DIC; the opposite occurs in winter, with enhanced degassing leading to more positive values. This interpretation is further supported by regression analyses (Table 3): cave CO2 concentration (R2 = 0.678) and cave δ13C-CO2 (R2 = 0.63) were the strongest predictors of δ13C-DIC, confirming the central role of the “degassing inhibition” effect in controlling the carbon isotopic composition of cave water. The moderate explanatory power of temperature (R2 = 0.557) and rainfall (R2 = 0.421) reflects the transmission of surface climate signals to the cave system through soil CO2 production and infiltration processes. In contrast, the negligible explanatory power of Niño 3.4 SST (R2 ≈ 0) further indicates that the ENSO signal is substantially attenuated during passage through the atmosphere-hydrology-karst system, with a direct influence on cave δ13C-DIC that can be considered negligible. These findings are consistent with observations from Ernesto Cave in Italy [3] and Qianfo Cave in China [58].
Figure 8.
Correlations between δ13C-DIC and monitoring parameters. Sample sizes (N) are identical to those reported in Table 3.
It should be noted, however, that the observation window (2019–2025) spans only seven years, which is relatively short for robust ENSO attribution. The 2022–2023 dry years and the 2024 piston-flow event may have introduced hydrological memory effects and extreme anomalies that could obscure the pure ENSO signal. The significant correlations observed at lag 0 months do not necessarily imply causation; they may partly reflect seasonal cycles. Therefore, the associations documented here should be interpreted as correlative evidence rather than definitive causal attribution. Our results suggest—rather than confirm—that cave systems have the potential to record interannual climate variability; longer time-series data and process-based modeling are needed to disentangle the relative contributions of ENSO forcing, local hydrological processes, and cave-specific internal dynamics.
5.2. Control of Water–Rock–Gas Interactions on δ13C-DIC
Water–rock–gas interactions constitute the core mechanism regulating cave drip water δ13C-DIC, with SIc and pCO2(w) serving as the key coupled variables that control mineral phase equilibrium and the driving force for CO2 exchange at the gas–liquid interface, jointly determining the direction and magnitude of spatiotemporal variations in δ13C-DIC. High pCO2(w) in water indicates that more CO2 is dissolved, promoting the formation of H2CO3 and driving the reaction CO2(g) + H2O(l) + CaCO3(s) ⇌ Ca2+(l) + 2HCO3−(l) to the right, leading to increased Ca2+ and HCO3− concentrations and decreased SIc. Conversely, when CO2-rich drip water enters the cave, if the cave air CO2 partial pressure is lower than that of the water, CO2 degassing occurs, pCO2(w) decreases, pH increases, and the reaction shifts to the left, driving the water toward calcite supersaturation and increasing SIc [24].
In Mahuang Cave, SIc ranged from 0.54 to 0.76 (all >0, n = 462), indicating supersaturation with respect to calcite and favoring calcite precipitation [50]; negative SIc values (n = 6) were attributed to dilution effects from heavy rainfall [47]. Seasonal mean SIc decreased in the order: spring (0.76) > winter (0.67) > summer (0.64) > autumn (0.62), suggesting that summer and autumn were jointly modulated by precipitation dilution and degassing competition [59]. Spatially, slow drip sites (#1, #2, #6) exhibited higher and more stable SIc (mean 0.68–0.71, CV = 37–41%), whereas fast drip sites (#3, #4) and the underground river (#5) showed lower and more variable SIc (mean 0.54–0.63, CV = 51–55%). This pattern is consistent with observations from Golgotha Cave [60] and further reveals the heterogeneity of hydrological pathways in the vadose zone [10]. pCO2(w) was higher and more variable in summer (range −6.64 to −2.78, CV = 21%), attributed to vigorous soil respiration and rapid infiltration that inhibited degassing [9], while it was lower and more stable in winter (range −2.95 to −3.99, CV = 6%) due to weaker biological activity, longer residence time, and enhanced ventilation that facilitated CO2 evasion [50].
The intensity and mode of water–rock–gas synergy, as reflected by the above SIc and pCO2(w) dynamics, are ultimately manifested in the systematic coupling between the [Ca2++Mg2+]/[HCO3−] equivalent ratio and δ13C-DIC. As shown in Figure 9, the evolutionary trajectories of these two variables exhibit a continuous distribution from the lower left to the upper right, clearly indicating a gradient transition from open to near-closed conditions along vadose-zone flow paths.
Figure 9.
Relationship between the [Ca2++Mg2+]/[HCO3−] equivalent ratio and δ13C-DIC. Circular scatter points of different colors (#1–#6) represent different monitoring water sites, and the background color bands represent different isotopic fractionation endmembers.
(I) In the open system, soil CO2 (δ13C ≈ −22.8‰) is continuously supplied to infiltrating water, pCO2(w) remains relatively stable, and DIC is primarily controlled by equilibrium fractionation between CO2(aq) and HCO3− (+9‰, [61]), yielding a theoretical lower limit of drip water δ13C-DIC of approximately −13.8‰. The measured δ13C-DIC values at fast drip sites during the rainy season in Mahuang Cave (e.g., #3 = −13.66‰, #4 = −13.44‰) are close to this theoretical minimum, indicating that their DIC is predominantly inherited from the soil end-member and that fractionation is primarily controlled by dissolution kinetics.
(II) In the near-closed system, the longer flow paths and extended residence time of drip water in the vadose zone restrict CO2 supply, allowing significant PCP to occur before the water reaches the cave or at the early stage of entry. This process reduces Ca2+ and Mg2+ concentrations, while preferentially incorporating light 12C into the calcite lattice, leaving the residual DIC enriched in heavy 13C [10]. Once the drip water enters the cave, if pCO2(air) < pCO2(w), CO2 degassing occurs, and 12C-CO2, with its faster diffusion rate, preferentially escapes, further increasing the δ13C-DIC of the remaining water. Therefore, CO2 degassing is the primary driver of heavy δ13C-DIC in the closed system, whereas PCP indirectly facilitates this process by prolonging water–air contact time and increasing calcite supersaturation. This interpretation has been corroborated by monitoring studies in other caves [47,62].
Theoretical calculations further validate this inference. Soil CO2 (δ13C ≈ −22.8‰), after Rayleigh diffusion fractionation (+4.4‰, [54]), yields a δ13C value of –18.4‰; following water–rock equilibrium fractionation (+9‰, [61]), the theoretical δ13C-DIC is calculated as −9.4‰, which is in excellent agreement with the measured mean δ13C-DIC in Mahuang Cave (−9.1‰). Moreover, the difference between the measured mean (−9.1‰) and the theoretical lower limit of direct dissolution (−13.8‰) is +4.7‰, which is consistent with the diffusion fractionation factor (+4.4‰). Furthermore, the mean cave air δ13C-CO2 in Mahuang Cave is −13.64‰, and that of atmospheric CO2 is −10.88‰ [37]. If the water were to reach equilibrium with these two CO2 sources, the theoretical δ13C-DIC values would be −4.64‰ and −1.88‰, respectively. Thus, the measured δ13C-DIC values are in close agreement with the theoretical value calculated from the diffusion-fractionated soil CO2 end-member, and, together with the fact that they are significantly higher than the theoretical lower limit of the open system, this confirms that the combined effects of CO2 degassing and PCP in the closed system are the dominant mechanisms driving the marked enrichment of heavy δ13C-DIC. In addition, Figure 9 shows that the mean [Ca2++Mg2+]/[HCO3−] equivalent ratio is 1.19 (> 1.0), providing clear evidence for significant PCP occurrence in Mahuang Cave.
5.3. Element Ratios as Indicators of PCP and Their Relationship with δ13C Fractionation
The Mg/Ca and Sr/Ca ratios are effective proxies for tracing PCP intensity. During PCP, Ca2+ preferentially enters the calcite lattice, while Mg2+ and Sr2+ remain in the liquid phase because their partition coefficients are far smaller than that of Ca2+, leading to synchronous increases in Mg/Ca and Sr/Ca in the residual water. Specifically, Sr2+, owing to its larger ionic radius relative to Ca2+, causes lattice distortion upon incorporation and thus has difficulty replacing Ca2+; Mg2+, although smaller than Ca2+ in ionic radius, has a high hydration energy, dehydrates with difficulty, and has a coordination preference that does not fully match the calcite lattice, so it is likewise not readily incorporated into the lattice [14].
Data from Mahuang Cave (Figure 10) show that (a) Ca2+ shows no significant correlation with Mg/Ca (R = −0.06, p > 0.05), whereas (c) Ca2+ shows a significant negative correlation with 100 × Sr/Ca (R = −0.52, p < 0.05), indicating that Ca2+ input from wall-rock dissolution and consumption by PCP are approximately balanced, while Sr2+ accumulates in the liquid phase due to its much lower partition coefficient compared to Ca2+ [14]. (b) Mg2+ shows a significant positive correlation with Mg/Ca (R = 0.86), and (d) Sr2+ also shows a significant positive correlation with 100 × Sr/Ca (R = 0.77), confirming that PCP is the common mechanism driving the increase in both ratios [8,14]. Notably, the correlation strength for Sr (R = 0.77) is slightly lower than that for Mg (R = 0.86), suggesting that PCP is not the sole controlling factor for Sr/Ca [63]. This may be related to external Sr inputs (e.g., dust deposition, silicate weathering) or incongruent dissolution of dolomite [44].
Figure 10.
Correlations of Ca2+, Mg2+, and Sr2+ concentrations with Mg/Ca and 100 × Sr/Ca. (a) Ca2+ vs. Mg/Ca; (b) Mg2+ vs. Mg/Ca; (c) Ca2+ vs. 100 × Sr/Ca; (d) Sr2+ vs. 100 × Sr/Ca. The black solid lines represent linear regression fits.
Climatic differences between dry and wet years significantly modulated PCP intensity and its covariance characteristics (Figure 11): (a) The overall data fit shows a weak positive correlation between Mg/Ca and Sr/Ca (slope = 0.04, R = 0.26, p < 0.05), reflecting that PCP acts as a common mechanism driving the concomitant increase in both ratios [14,64]. (b) In wet years (2019–2020, 2024), the Mg/Ca–Sr/Ca correlation was weak (R = 0.2), indicating that rapid runoff shortened residence time and limited PCP development, resulting in reduced covariance between the two ratios and clustering of data points in the low-ratio range [65]. (c) In dry years (2022–2023), the correlation was significantly enhanced (R = 0.65), with the slope nearly doubling (slope = 0.07), indicating that precipitation deficit prolonged WRI through slow baseflow, allowing PCP to develop fully and resulting in highly synchronous enrichment of Mg2+ and Sr2+ with a strong linear covariance [8].
Figure 11.
Relationship between Mg/Ca and Sr/Ca ratios: (a) all data; (b) wet years (2019–2020, 2024); (c) dry years (2022–2023). Regression lines and correlation coefficients are shown for each panel. The black solid lines represent linear regression fits.
The fractionation effect of PCP on δ13C-DIC was further modulated by the spatial differentiation of hydrological pathways (Figure 12): (a, b) Overall data show weak positive correlations among the three variables, but pronounced spatial differentiation exists among sites. Site #6 (percolation flow) exhibited high Mg/Ca (0.81), high Sr/Ca (1.4), and heavy δ13C-DIC (−7.92‰), indicating well-developed PCP under closed-system conditions. Site #3 (shaft flow) showed low ratios (0.42, 0.49) and light δ13C-DIC (−10.64‰), reflecting weak PCP and dominant inheritance of soil CO2 signals. Sites #1 and #2 (matrix flow) displayed intermediate characteristics. Site #4 (subcutaneous flow) exhibited the greatest variability, reflecting the influence of seasonal flow-regime transitions. Notably, site #5 (underground river), despite its high Sr/Ca (1.43), had relatively low δ13C-DIC (−8.45‰), showing decoupling between the two proxies. This suggests that its elevated Sr/Ca originated from dissolution of deep Sr-bearing minerals rather than from PCP dominance, indicating that Sr/Ca alone is not a reliable proxy for PCP. Comparison between winter and summer further revealed that (c, e) in summer, the data points for each site were more dispersed, with reduced covariance and lighter δ13C, whereas (d, f) in winter, covariance was enhanced and δ13C was heavier, highlighting the control of hydrological pathway differences on isotope fractionation.
Figure 12.
Relationships between δ13C-DIC and Mg/Ca and Sr/Ca. (a,b) All data; (c,e) summer; (d,f) winter.
5.4. Spatial Differentiation of δ13C-DIC Under Different Hydrological Pathways
The karst critical zone is governed by lithology, fractures, and hydrological heterogeneity [66], with percolation generally exhibiting mixing behavior [67,68] and forming spatial differentiation between high- and low-flow subsystems [43,69]. As shown in Figure 13, the surface environment dominates the initial solute input, while the aquifer modulates PCP intensity through differences in flow paths and residence times, ultimately manifesting as three types of δ13C-DIC spatial differentiation in Mahuang Cave: fast, slow, and mixed flow.
Figure 13.
Conceptual diagram of the karst critical zone in Mahuang Cave. Units in the table: discharge (mL/s); Ca2+, Mg2+and HCO3− (mmol/L); Mg/Ca and 100 × Sr/Ca ratios (mol/mol); δ13C-DIC (‰). Orange arrows represent warm air, dark blue arrows represent cold air, and light blue arrows represent the flow direction of the subterranean river. S1–S3 and #1–#6 denote soil and cave monitoring sites, respectively. (a) Wet season and (b) dry season schematic diagrams of hydrological pathways at drip sites, redrawn based on the conceptual framework of refs. [19,66]. The letter “w” (water phase) denotes the water-filled portion of the aquifer; “g” (gas phase) represents the ventilated air space; the rectangular box indicates the assumed reservoir boundary; the horizontal line represents the water table; blue arrows indicate flow direction, with arrow thickness representing relative flow velocity; horizontal black arrows represent lateral flow or lateral recharge/discharge; vertical double-headed black arrows denote water level fluctuations or water mixing; curved (rotational) arrows indicate the mixing and circulation between new and old water within the reservoir. Note: Site #5, which is an underground river, is not included in this drip site conceptual model. The table summarizes the response characteristics of hydrochemical processes.
(I) Fast flow paths efficiently transmit soil CO2 signals. Site #3, located in the high-flow subsystem and dominated by shaft–fracture preferential flow, exhibited the highest drip rate (4.05 mL/s) and the lowest Ca2+ (1.18 mmol/L), HCO3− (2.81 mmol/L), and Mg/Ca (0.41), along with the lightest δ13C-DIC (−10.63‰), indicating incomplete carbonate dissolution and typical open-system characteristics. Site #4, a seasonal subcutaneous flow, exhibited a high drip rate (7.92 mL/s) with extreme variability (CV = 205%) and was the most sensitive to external climate forcing: during the rainy season, it responded rapidly to precipitation with lighter δ13C-DIC, whereas during the dry season, reduced recharge—or even cessation of flow—enhanced PCP and shifted isotopes toward heavier values.
(II) Slow flow paths, combined with PCP effects, drive isotope enrichment. Sites #1, #2, and #6, located in the low-flow subsystem and dominated by matrix seepage, exhibited drip rates of only 0.07–0.09 mL/s, with prolonged residence time in the vadose zone and sufficient WRI. Among them, site #6 showed the highest Ca2+, Mg2+, and HCO3− concentrations, as well as the highest Mg/Ca (0.8), 100 × Sr/Ca (1.4), and δ13C-DIC (−7.92‰), indicating that the seepage path involved dolomite dissolution, and the continuous accumulation of PCP effects along the upstream path resulted in heavy δ13C-DIC [41,60,64].
(III) Mixed flow did not exhibit isotope enrichment effects. Site #5, an underground river that receives recharge from #4 and a deep waterfall, is characterized by multi-source mixing [68]. Although it had the highest 100 × Sr/Ca (1.43), its δ13C-DIC (−8.43‰) was heavier than most drip sites but still lighter than that of #6. The progressive enrichment effect observed in Furong Cave, where “pool water δ13C-DIC is approximately 2‰ heavier than drip water” [17], was not observed here. This is because the waterfall, carrying a lighter isotopic signal (estimated −10‰ to −11‰), mixed with the heavier signal from #4 (−8.69‰), lowering the overall mean. In addition, the gentle flow regime of the underground river reduced CO2 degassing efficiency, suppressing δ13C enrichment [56], and preventing its δ13C from reaching the heavy values observed at #6, where intense PCP occurred. Furthermore, the underground river at site #5 receives inputs of exogenous acids (H2SO4, HNO3) from overlying agricultural activities, which further complicates the isotopic signals [33] and leads to decoupling between Sr/Ca and δ13C-DIC.
In summary, the spatial differentiation of δ13C-DIC in Mahuang Cave indicates that, under the heterogeneous conditions of the karst critical zone, fast, slow, and mixed flow modify δ13C signals through distinct pathways. Therefore, the interpretation of this proxy should be site-specific.
5.5. Differences in Carbon Cycling Between Dolomite and Limestone Caves and Their Implications
To further reveal the differences in carbon cycling between dolomite and limestone caves, we selected six limestone caves (Shawan Cave, Liangfeng Cave, Furong Cave, Xueyu Cave, Qianfo Cave, and Jiguan Cave) from the monsoon region of China for comparison, following the principles of cave intercomparison [70]. The comparison parameters include cave temperature and humidity, soil and cave CO2 concentrations and their δ13C values, and drip water DIC-δ13C (Table 4).
Table 4.
Comparison of cave characteristics and carbon-related parameters between Mahuang Cave (dolomite) and six typical limestone caves.
Comparative analysis shows that the soil δ13C-CO2 in Mahuang Cave (−22.75‰) is close to that of Shawan Cave (−21.34‰) and Liangfeng Cave (−22.42‰), all falling within the C3 plant range, indicating similar sources of soil organic matter. However, carbon isotopic fractionation during transport from soil to cave is evident: the soil CO2 concentration in Mahuang Cave (12,517 ppmv) is substantially higher than that in Liangfeng Cave (5575 ppmv), Furong Cave (4233 ppmv), and Jiguan Cave (2499 ppmv), primarily due to the accumulation effect of the thick soil layer (>100 cm). Nevertheless, this high soil CO2 does not translate into high cave CO2, with an annual mean of only 538 ppmv, which is far lower than those of Furong Cave (1284 ppmv), Jiguan Cave (1269 ppmv), and Xueyu Cave (≥2000 ppmv). The cave δ13C-CO2 (−13.64‰) is significantly more positive than that of Furong Cave (−18.5‰), Xueyu Cave (−21.05‰), and Shawan Cave (−21.78‰), indicating that downward transport of biogenic soil CO2 is inhibited and atmospheric CO2 contribution is dominant [37]. More notably, the mean δ13C-DIC in Mahuang Cave (−8.98‰) is approximately 2‰ heavier than that in Liangfeng Cave (−10.18‰), Xueyu Cave (−10.83‰), Jiguan Cave (−10.76‰), and Furong Cave (−11.1‰), suggesting that lithology, dissolution kinetics, and cave microenvironments exert control over carbon isotope evolution.
Differences in mineral dissolution kinetics are the primary constraint. Under experimental conditions, the initial dissolution rate of dolomite is 3 to 60 times slower than that of limestone [11]. Limestone dissolution is concentrated along fractures and enlarged along flow paths, resulting in uneven pore distribution; dolomite, by contrast, undergoes diffusive leaching throughout the rock mass, with dissolution morphologies tending toward dispersed crystalline pores and solution vugs, and relatively uniform water-bearing properties [83,84]. Incongruent dissolution of dolomite and calcite further influences hydrochemical characteristics. At the early stage of infiltration, ion release ratios are close to stoichiometric proportions; as WRI proceeds, PCP preferentially removes Ca2+, while Mg2+ continues to accumulate due to its higher lattice energy and slower dissolution rate, leading to an increase in Mg/Ca with prolonged residence time [41,64]. In relatively closed systems, the early stage of incongruent dolomite dissolution may result in relatively lower Sr/Ca, contrasting with the PCP-driven increase in Mg/Ca [85]; however, in open systems or environments with significant PCP, sustained CO2 degassing drives preferential calcite precipitation, with Ca2+ being largely removed, allowing Mg/Ca and Sr/Ca to increase synchronously [19]. In Mahuang Cave, site #3 (fast fracture flow) exhibits low Mg/Ca and Sr/Ca, whereas site #6 shows high Mg/Ca (0.81) and 100 × Sr/Ca (1.4), indicating the superposition of dolomite dissolution and significant PCP along the slow matrix flow path.
Cave structure, microclimate, and anthropogenic activities further modulate the carbon cycle. The thick soil layer (>100 cm) and thick ceiling (80–130 m) of Mahuang Cave, combined with the dense dolomite structure, significantly limit vertical CO2 diffusion and convective exchange, in sharp contrast to Shawan Cave (thin soil, thin ceiling) [72]. The cave temperature in Mahuang Cave (14.2 °C) is lower than the surface temperature; this lower temperature increases CO2 solubility in water, thereby inhibiting drip-water degassing and retaining more CO2 as DIC in the water. In contrast, the higher cave temperatures at Furong Cave (17.5 °C) and Xueyu Cave (17.2 °C) promote stronger degassing, resulting in higher cave CO2 concentrations and more complex isotopic fractionation. In addition, anthropogenic disturbances in show caves such as Furong Cave and Xueyu Cave may increase CO2 fluxes, a distinction that should be made from lithological effects.
Karst carbon cycling is characterized by pronounced spatial heterogeneity. The comparison reveals that Mahuang Cave exhibits a pattern of “high soil CO2—low cave CO2—heavier δ13C-DIC.” Extrapolating the carbon isotope and hydrochemical evolution models established in limestone areas directly to dolomite areas may obscure the control of lithology on carbon cycling pathways. These findings suggest that future research on karst carbon cycling should pay attention to the following controlling factors: (1) lithological differences and their corresponding dissolution kinetic mechanisms; (2) the barrier effect of soil–ceiling structure on vertical CO2 transport; (3) the modulation of degassing–dissolution equilibrium by cave microclimate; and (4) potential disturbances of cave carbon cycling by tourism activities. Only by examining carbon cycling processes under the multi-dimensional constraints of lithology, structure, and microclimate can the regional representativeness and mechanistic transferability of karst carbon cycling studies be enhanced. Owing to the scarcity of long-term monitoring data for dolomite caves and the lack of consistency in monitoring parameters, this study could not perform a cross-regional comparison of dolomite caves. Future research should therefore select representative dolomite caves for systematic comparison.
6. Conclusions
(1) Temperature and precipitation are the primary factors controlling the seasonal and interannual variations in cave water chemistry and δ13C-DIC. As a background framework for interannual climate variability, ENSO regulates regional hydrothermal conditions, thereby indirectly influencing soil CO2 input efficiency and drip water residence time, and in turn modulating cave water chemical composition, cave air CO2, and the carbon components of DIC in water. Major ion concentrations show higher values in the warm season and lower in the cold season, while δ13C-DIC is significantly lighter during El Niño and markedly heavier during La Niña, exhibiting a certain interannual correspondence with ENSO phase changes. This reflects potential linkages among surface ecological processes, the soil carbon pool, and drip water responses. These results indicate that the groundwater system is highly sensitive to climate change, with antecedent hydrological conditions exerting significant control over subsequent hydrochemical response patterns, and that cave systems have the potential to record interannual-scale climate variability.
(2) The δ13C-DIC in Mahuang Cave is jointly regulated by water–rock–gas interactions and PCP and exhibits spatial differentiation under different hydrological pathways. Fast fracture flow, with short residence times, efficiently transmits light carbon signals from soil CO2 in an open system. In contrast, slow matrix flow, characterized by sufficient WRI and enhanced PCP, exhibits significantly heavier isotopic signatures resulting from the combined effects of CO2 degassing and PCP in a closed system, forming an isotopic spatial gradient of “fast–open to slow–closed.” The multi-source mixing in the underground river leads to decoupling between Sr/Ca and δ13C, cautioning that high Sr/Ca alone is not a definitive indicator of PCP. These hydrological findings provide a mechanistic constraint framework for the paleoclimatic interpretation of speleothem δ13C.
(3) In contrast to limestone caves, the carbon isotope responses in Mahuang Cave exhibit distinct differences, characterized by a “high soil CO2—low cave CO2—heavier δ13C-DIC” pattern. These differences arise from the slow dissolution kinetics of the dolomite mineral phase, the inhibition of vertical CO2 transport by the thick ceiling, and the limited degassing in the low-temperature cave environment. Therefore, when using cave carbon isotopes and hydrochemical parameters to interpret karst carbon cycling processes, lithological differences should be fully considered, and observation models established in limestone areas should not be directly extrapolated to dolomite areas. The spatial generality of this study’s findings still needs to be validated with additional monitoring data from dolomite caves.
Supplementary Materials
The following supporting information can be downloaded at: https://www.mdpi.com/article/10.3390/w18202522/s1, Table S1: PHREEQC-calculated DIC speciation for the six high-pH samples (June 2021); Table S2: First-order autocorrelation coefficients (r1) and Box–Pierce Q statistics for all time series; Table S3: Summary of Pearson correlation coefficients, effective sample sizes, and cross-correlation lags between δ13C-DIC and environmental parameters; Table S4: Regression diagnostics for δ13C-DIC against each environmental parameter; Raw dataset (xlsx); PHREEQC input file (zip).
Author Contributions
Conceptualization, methodology, validation, Y.X.; software, Y.X. and X.W.; formal analysis, Y.X.; investigation, data curation, Y.X., X.W., W.Z., H.W., Y.B. and M.A.; writing—original draft preparation, Y.X.; resources, Z.Z.; writing—review and editing, Y.X. and Z.Z.; project administration, funding acquisition, Y.X. and Z.Z. All authors have read and agreed to the published version of the manuscript.
Funding
This research was funded by the Academic New Seedling Fund Project of Guizhou Normal University (QianShi Xinmiao [2021] B02); the Guizhou Provincial Science and Technology Foundation (Qian Ke He Ping Tai YWZ [2025]001); the Guizhou Provincial Central Government-Guided Local Science and Technology Development Fund Project (Qian Ke He Zhong Yin Di [2025] 031); the Guizhou Provincial Key Technology R&D Program ([2023] General 218).
Data Availability Statement
The original contributions presented in this study are included in the article and Supplementary Materials. Further inquiries can be directed to the corresponding author.
Acknowledgments
We sincerely thank all the staff of Shuanghe Cave National Geopark for their help in sampling campaigns conducted in the Mahuang Cave.
Conflicts of Interest
The authors declare no conflicts of interest.
Abbreviations
The following abbreviations are used in this manuscript:
| TW | Water temperature |
| EC | Electrical conductivity |
| DO | Dissolved oxygen |
| DIC | Dissolved inorganic carbon |
| δ13C | Stable carbon isotopes |
| WRI | Water–rock interaction |
| PCP | Prior calcite precipitation |
| PA | Precipitation anomaly in percentage |
| ENSO | El Niño–Southern Oscillation |
| SIc | Calcite saturation index |
| pCO2(w) | Partial pressure of CO2 in drip water |
References
- Jia, B.; Zhou, G. Estimation of Global Karst Carbon Sink from 1950s to 2050s Using Response Surface Methodology. Geo-Spat. Inf. Sci. 2023, 27, 1254–1271. [Google Scholar] [CrossRef] [Scilit]
- Zeng, S.; Liu, Z.; Kaufmann, G. Sensitivity of the Global Carbonate Weathering Carbon-Sink Flux to Climate and Land-Use Changes. Nat. Commun. 2019, 10, 5749. [Google Scholar] [CrossRef] [Scilit]
- Frisia, S.; Fairchild, I.J.; Fohlmeister, J.; Miorandi, R.; Spötl, C.; Borsato, A. Carbon Mass-Balance Modelling and Carbon Isotope Exchange Processes in Dynamic Caves. Geochim. Cosmochim. Acta 2011, 75, 380–400. [Google Scholar] [CrossRef] [Scilit]
- Mickler, P.J.; Carlson, P.; Banner, J.L.; Breecker, D.O.; Stern, L.; Guilfoyle, A. Quantifying Carbon Isotope Disequilibrium during In-Cave Evolution of Drip Water along Discreet Flow Paths. Geochim. Cosmochim. Acta 2019, 244, 182–196. [Google Scholar] [CrossRef] [Scilit]
- Dreybrodt, W.; Romanov, D. The Evolution of 13C and 18O Isotope Composition of DIC in a Calcite Depositing Film of Water with Isotope Exchange between the DIC and a CO2 Containing Atmosphere, and Simultaneous Evaporation of the Water. Implication to Climate Proxies from Stalagmites: A Theoretical Model. Geochim. Cosmochim. Acta 2016, 195, 323–338. [Google Scholar] [CrossRef] [Scilit]
- McDermott, F. Palaeo-Climate Reconstruction from Stable Isotope Variations in Speleothems: A Review. Quat. Sci. Rev. 2004, 23, 901–918. [Google Scholar] [CrossRef] [Scilit]
- Chapman, R.G.; Laffan, S.; McDonough, L.K.; Markowska, M.; Baker, A. Spatiotemporal Variation in Cave Percolation Waters: A Functional Approach. J. Hydrol. 2024, 631, 130784. [Google Scholar] [CrossRef] [Scilit]
- Lyu, Y.; Luo, W.; Wang, Y.; Zeng, G.; Chen, J.; Wang, S. Response of Drip Water Mg/Ca and Sr/Ca Variations in Ventilated Caves to Hydroclimate. Sci. Total Environ. 2023, 874, 162626. [Google Scholar] [CrossRef] [Scilit]
- Li, J.-Y.; Li, T.-Y. Seasonal and Annual Changes in Soil/Cave Air pCO2 and the δ13CDIC of Cave Drip Water in Response to Changes in Temperature and Rainfall. Appl. Geochem. 2018, 93, 94–101. [Google Scholar] [CrossRef] [Scilit]
- Pu, J.; Wang, A.; Yin, J.; Shen, L.; Sun, Y.; Yuan, D.; Zhao, H. Processes Controlling Dripwater Hydrochemistry Variations in Xueyu Cave, SW China: Implications for Speleothem Palaeoclimate Signal Interpretations. Boreas 2015, 44, 603–617. [Google Scholar] [CrossRef] [Scilit]
- Liu, Z.; Yuan, D.; Dreybrodt, W. Comparative Study of Dissolution Rate-Determining Mechanisms of Limestone and Dolomite. Environ. Geol. 2005, 49, 274–279. [Google Scholar] [CrossRef] [Scilit]
- Morse, J.W.; Arvidson, R.S. The Dissolution Kinetics of Major Sedimentary Carbonate Minerals. Earth-Sci. Rev. 2002, 58, 51–84. [Google Scholar] [CrossRef] [Scilit]
- Chen, C.; Zhong, H.; Wang, X.; Ning, M.; Wang, X.; Ge, Y.; Wang, H.; Tang, R.; Hou, M. Thermodynamic and Kinetic Studies of Dolomite Formation: A Review. Minerals 2023, 13, 1479. [Google Scholar] [CrossRef] [Scilit]
- Wassenburg, J.A.; Riechelmann, S.; Schröder-Ritzrau, A.; Riechelmann, D.F.C.; Richter, D.K.; Immenhauser, A.; Terente, M.; Constantin, S.; Hachenberg, A.; Hansen, M.; et al. Calcite Mg and Sr Partition Coefficients in Cave Environments: Implications for Interpreting Prior Calcite Precipitation in Speleothems. Geochim. Cosmochim. Acta 2020, 269, 581–596. [Google Scholar] [CrossRef] [Scilit]
- Wang, X.G.; Ye, Z.M.; Yang, Y. Transport and Transformation of Dissolved Inorganic Carbon from Cave Systems to a Surface Watershed: A Case Study from Jiguan Cave and the Yi River Headwater, Central China. Appl. Geochem. 2026, 208, 107009. [Google Scholar] [CrossRef] [Scilit]
- Kost, O.; González, L.S.; Rodríguez, R.L.; Sliwinski, J.; Endres, L.; Haghipour, N.; Stoll, H. Relationship of Seasonal Variations in Drip Water δ13CDIC, δ18O, and Trace Elements with Surface and Physical Cave Conditions of La Vallina Cave, NW Spain. Hydrol. Earth Syst. Sci. 2023, 27, 2227–2255. [Google Scholar] [CrossRef] [Scilit]
- Li, T.; Li, H.; Xiang, X.; Kou, T.; Li, J.; Zhou, F.; Chen, H.; Peng, L. Transportation Characteristics of δ13C in the Plants-Soil-Bedrock-Cave System in Chongqing Karst Area. Sci. China Earth Sci. 2012, 55, 685–694. [Google Scholar] [CrossRef] [Scilit]
- Lyu, Y.; Luo, W.; Wang, Y.; Zeng, G.; Wang, Y.; Cheng, A.; Zhang, L.; Chen, J.; Cai, X.; Zhang, R.; et al. Impacts of Cave Ventilation on Drip Water δ13CDIC and Its Paleoclimate Implication. Quat. Int. 2020, 547, 7–21. [Google Scholar] [CrossRef] [Scilit]
- Zhang, H.; Zhou, Z.; Dong, H.; Yan, L.; Ding, S.; Huang, J.; Gong, X.; Su, D. Seasonal Variations of Cave Dripwater Hydrogeochemical Parameters and δ13CDIC in the Subtropical Monsoon Region and Links to Regional Hydroclimate. Sci. Total Environ. 2023, 881, 163509. [Google Scholar] [CrossRef] [Scilit]
- Oster, J.L.; Montañez, I.P.; Kelley, N.P. Response of a Modern Cave System to Large Seasonal Precipitation Variability. Geochim. Cosmochim. Acta 2012, 91, 92–108. [Google Scholar] [CrossRef] [Scilit]
- Baldini, J.U.L.; McDermott, F.; Fairchild, I.J. Spatial Variability in Cave Drip Water Hydrochemistry: Implications for Stalagmite Paleoclimate Records. Chem. Geol. 2006, 235, 390–404. [Google Scholar] [CrossRef] [Scilit]
- Li, J.-Y.; Li, T.-Y.; Li, H.-C.; Spötl, C.; Chen, C.-J.; Zhang, J.; Wu, Y.; Li, H.-Y.; Jin, Y.; Zhao, M.; et al. The Influence of Hydrogeology and Carbon Sources on Speleothem δ13C Based on Long-Term Monitoring in Furong Cave, Southwest China. Chem. Geol. 2024, 662, 122210. [Google Scholar] [CrossRef] [Scilit]
- Lambert, W.J.; Aharon, P. Controls on Dissolved Inorganic Carbon and δ13C in Cave Waters from DeSoto Caverns: Implications for Speleothem δ13C Assessments. Geochim. Cosmochim. Acta 2011, 75, 753–768. [Google Scholar] [CrossRef] [Scilit]
- Lyu, Y.; Luo, W.; Zeng, G.; Wang, Y.; Chen, J.; Wang, S. The Effect of Cave Ventilation on Carbon and Oxygen Isotopic Fractionation between Calcite and Drip Water. Sci. Total Environ. 2024, 915, 169967. [Google Scholar] [CrossRef] [Scilit]
- Zhai, X.; Zhang, J.; Chen, X.; Chen, J.; Gao, K.; Liang, Y.; Shao, Q.; Wang, Y.; Kong, X.; Zhao, K. Middle to Late Holocene Hydroclimate Variability Revealed by Multi-Proxy Stalagmite Records from Jinfo Cave, Central-West China. Palaeogeogr. Palaeoclimatol. Palaeoecol. 2024, 642, 112151. [Google Scholar] [CrossRef] [Scilit]
- Cheng, K.; Wang, Q.; Liu, S.; Liu, Y.; Yang, Y.; Zhan, C.; Zhou, H. Different Response of Trace Elements in the Drip-Water of Kaiyuan Cave on Shandong Peninsula (Coastal North China) to Hydroclimatic Changes from 2012 to 2014. J. Hydrol. 2022, 608, 127616. [Google Scholar] [CrossRef] [Scilit]
- Chen, R.; Xue, S.; Zhang, H.; Griffiths, M.; Zhou, Y.; Liu, X.; Zhu, Z.; Chen, L.; Guo, W.; Wu, S.; et al. Using Speleothem 87Sr/86Sr Variations Tracking the Controls on Trace Element (Sr-Mg) Compositions. Glob. Planet. Change 2025, 252, 104872. [Google Scholar] [CrossRef] [Scilit]
- Wang, C.-Y.; Li, J.-Y.; Chen, C.-J.; Zhang, J.; Wu, Y.; Li, T.-Y. Hydroclimatic Heterogeneity in Southwest China Revealed from Trace Elements of a Medieval-to-Modern Stalagmite. Quat. Int. 2026, 763, 110204. [Google Scholar] [CrossRef] [Scilit]
- Zhang, J.; Li, T.-Y. Seasonal and Interannual Variations of Hydrochemical Characteristics and Stable Isotopic Compositions of Drip Waters in Furong Cave, Southwest China Based on 12 Years’ Monitoring. J. Hydrol. 2019, 572, 40–50. [Google Scholar] [CrossRef] [Scilit]
- Ban, F.; Baker, A.; Marjo, C.E.; Duan, W.; Li, X.; Han, J.; Coleborn, K.; Akter, R.; Tan, M.; Nagra, G. An Optimized Chronology for a Stalagmite Using Seasonal Trace Element Cycles from Shihua Cave, Beijing, North China. Sci. Rep. 2018, 8, 4551. [Google Scholar] [CrossRef] [Scilit]
- Fu, X.; Yang, Y.; Zhao, J.; Li, Y.; Chen, X.; Ye, Z.; Li, M.; Lin, J.; Xu, Y. Decadal Transport of Trace Elements in a Cave System Based on 16 Years Monitoring Data: Implications for Paleoclimate Reconstruction. Appl. Geochem. 2025, 187, 106413. [Google Scholar] [CrossRef] [Scilit]
- Zhang, Y.C.; Hu, Y.D.; Hu, D.Y.; Zhao, M.; Wang, D.C.; Huang, Z.Z.; Fan, H.D.; Zhao, L.; Li, D.Y. Variation Patterns of Mg/Ca and Sr/Ca in Dolomite Cave Drip Water and Their Association with Prior Calcite Precipitation (PCP) Processes. Bull. Mineral. Petrol. Geochem. 2026, 45, 1747–1759. [Google Scholar] [CrossRef] [Scilit]
- Huang, Y.; Zhou, Z.; Gong, X.; Ding, S.; Dong, H.; Xiong, Y.; Wang, X.; Zhang, Y.; Wang, J. Characteristics of δ13CDIC Temporal Variations of Underground Rivers in Mahuang Cave, Guizhou, and Its Significance to the Carbon Cycle, 2018–2022. Environ. Chem. 2026, 45, 663–675. [Google Scholar]
- Gong, X.; Zhou, Z.; Su, D.; Dong, H.; Yan, L.; Ding, S.; Wang, X.; Zhang, Y. Sulfur-Oxygen Isotope Analysis of SO42− Sources in Cave Dripwater and Their Influence on the Karst Carbon Cycle. Environ. Res. 2024, 240, 117508. [Google Scholar] [CrossRef] [Scilit]
- Li, P.; He, W.; Qian, Z.; Bottazzi, J. Study on Shuanghe Cave Geopark; Guizhou Renmin Press: Guiyang, China, 2008. [Google Scholar]
- Xiong, Y.; Zhou, Z.; Ding, S.; Zhang, H.; Huang, J.; Gong, X.; Su, D. Spatiotemporal Variation Characteristics and Influencing Factors of Karst Cave Microclimate Environments: A Case Study in Shuanghe Cave, Guizhou Province, China. Atmosphere 2023, 14, 813. [Google Scholar] [CrossRef] [Scilit]
- Xiong, Y.; Zhou, Z.; Huang, Y.; Ding, S.; Wang, X.; Wang, J.; Zhang, W.; Wei, H. CO2 Dynamics and Transport Mechanisms Across Atmosphere-Soil-Cave Interfaces in Karst Critical Zones. Geosciences 2025, 15, 376. [Google Scholar] [CrossRef] [Scilit]
- Tang, Y. Characteristics of Vertical CO2 Migration and Response of Carbon Source and Sink in Karst Key Zone: A Case Study in Mahuang Branch of Shuanghe Cave System, Guizhou. Master’s Thesis, Guizhou Normal University, Guiyang, China, 2020. [Google Scholar] [CrossRef]
- Appelo, C.A.J.; Postma, D. Geochemistry, Groundwater and Pollution, 2nd ed.; Balkema: Leiden, The Netherlands, 2005. [Google Scholar]
- Langmuir, D. The Geochemistry of Some Carbonate Ground Waters in Central Pennsylvania. Geochim. Cosmochim. Acta 1971, 35, 1023–1045. [Google Scholar] [CrossRef] [Scilit]
- Sinclair, D.J.; Banner, J.L.; Taylor, F.W.; Partin, J.; Jenson, J.; Mylroie, J.; Goddard, E.; Quinn, T.; Jocson, J.; Miklavič, B. Magnesium and Strontium Systematics in Tropical Speleothems from the Western Pacific. Chem. Geol. 2012, 294, 1–17. [Google Scholar] [CrossRef] [Scilit]
- Day, C.C.; Henderson, G.M. Controls on Trace-Element Partitioning in Cave-Analogue Calcite. Geochim. Cosmochim. Acta 2013, 120, 612–627. [Google Scholar] [CrossRef] [Scilit]
- Tadros, C.V.; Treble, P.C.; Baker, A.; Fairchild, I.; Hankin, S.; Roach, R.; Markowska, M.; McDonald, J. ENSO–Cave Drip Water Hydrochemical Relationship: A 7-Year Dataset from South-Eastern Australia. Hydrol. Earth Syst. Sci. 2016, 20, 4625–4640. [Google Scholar] [CrossRef] [Scilit]
- Fairchild, I.J.; Treble, P.C. Trace Elements in Speleothems as Recorders of Environmental Change. Quat. Sci. Rev. 2009, 28, 449–468. [Google Scholar] [CrossRef] [Scilit]
- Smart, P.L.; Friederich, H. Water Movement and Storage in the Unsaturated Zone of a Maturely Karstified Carbonate Aquifer, Mendip Hills, England. In Proceedings of the 2nd Conference on Environmental Problems in Karst Terrains; National Water Well Association: Dublin, OH, USA, 1987; pp. 59–87. [Google Scholar]
- Lin, Y.; Helmreich, B.; Ho, Y.-W.; Fang, J.K.-H.; Luo, C.; Wang, Y. Multi-Contaminants in Road Runoff of a Compact City: Characteristics, Interactions, and Ecological Risks. Water Res. 2025, 292, 125260. [Google Scholar] [CrossRef] [Scilit]
- Lyu, X.; Li, Y.; Xiong, K. Hydrogeochemical Response of Cave Drips to Precipitation during Rainfall in a Karst Desertification Region: A Case Study of Shijiangjun Cave, South China. Int. J. Environ. Res. Public Health 2022, 19, 15830. [Google Scholar] [CrossRef] [Scilit]
- Liu, C.; Yang, J.; Nie, Y.; Chen, H.; Fu, Z. Hydrochemical Responses of Stormflow to Extreme Rainfall during Dry Season in a Typical Karst Catchment of Northwest Guangxi Province, China. Earth Environ. 2015, 43, 386–394. [Google Scholar] [CrossRef]
- Cao, L.; Cheng, Q.; Wang, S.; Xu, S.; He, Q.; Li, Y.; Peng, T.; Wang, S. Hydrological and Geochemical Responses to Agricultural Activities in a Karst Catchment: Insights from Spatiotemporal Dynamics and Source Apportionment. Water 2025, 17, 3264. [Google Scholar] [CrossRef] [Scilit]
- Pu, J.; Yuan, D.; Zhao, H.; Shen, L. Hydrochemical and PCO2 Variations of a Cave Stream in a Subtropical Karst Area, Chongqing, SW China: Piston Effects, Dilution Effects, Soil CO2 and Buffer Effects. Environ. Earth Sci. 2013, 71, 4039–4049. [Google Scholar] [CrossRef] [Scilit]
- Huang, L.; Zhu, H.; Hao, Q.; Xiao, Y.; Liang, H.; Xu, Z.; Zhi, C.; Hu, X. Seasonal Controls, Recharge Thresholds, and Hydrological Memory in Karst Groundwater Dynamics Revealed by Interpretable Deep Learning. J. Hydrol. 2026, 677, 135898. [Google Scholar] [CrossRef] [Scilit]
- Li, X.; Wang, Y.; Shu, L.; Wang, Y.; Tong, F.; Han, J.; Shu, W.; Li, D.; Wen, J. The Controlling Factors of the Karst Water Hydrochemistry in a Karst Basin of Southwestern China. Environ. Earth Sci. 2021, 80, 793. [Google Scholar] [CrossRef] [Scilit]
- Bergel, S.J.; Carlson, P.E.; Larson, T.E.; Wood, C.T.; Johnson, K.R.; Banner, J.L.; Breecker, D.O. Constraining the Subsoil Carbon Source to Cave-Air CO2 and Speleothem Calcite in Central Texas. Geochim. Cosmochim. Acta 2017, 217, 112–127. [Google Scholar] [CrossRef] [Scilit]
- Cerling, T.E.; Solomon, D.K.; Quade, J.; Bowman, J.R. On the Isotopic Composition of Carbon in Soil Carbon Dioxide. Geochim. Cosmochim. Acta 1991, 55, 3403–3405. [Google Scholar] [CrossRef] [Scilit]
- Li, Y.D.; Yang, Y.; Jiang, X.Y.; Zhao, J.Y.; Sun, Z.; Shi, X.; Tian, N.; Yang, Y.Y.; Li, J.C.; Duan, J.W. The Transport Mechanism of Carbon Isotopes Based on 10 Years of Cave Monitoring: Implications for Paleoclimate Reconstruction. J. Hydrol. 2021, 592, 125841. [Google Scholar] [CrossRef] [Scilit]
- Fairchild, I.J.; Tuckwell, G.W.; Baker, A.; Tooth, A.F. Modelling of Dripwater Hydrology and Hydrogeochemistry in a Weakly Karstified Aquifer (Bath, UK): Implications for Climate Change Studies. J. Hydrol. 2006, 321, 213–231. [Google Scholar] [CrossRef] [Scilit]
- Baldini, J.U.L.; McDermott, F.; Hoffmann, D.L.; Richards, D.A.; Clipson, N. Very High-Frequency and Seasonal Cave Atmosphere PCO2 Variability: Implications for Stalagmite Growth and Oxygen Isotope-Based Paleoclimate Records. Earth Planet. Sci. Lett. 2008, 272, 118–129. [Google Scholar] [CrossRef] [Scilit]
- Guang, K.; Li, Y.; Tian, Y.; Wu, Y.; Li, T.; Wang, H.; Chen, C. Transportation Characteristics of Stable Carbon Isotope in the Overlying Soil-Drips-Modern Calcites of Qianfo Cave in Central Hunan. Quat. Sci. 2023, 43, 1328–1342. [Google Scholar] [CrossRef]
- Liu, X.; Yang, Y.; Peng, T.; Zhao, J.; Ren, X.; Zhang, Y.; Nie, X.; Li, J.; Ling, X.; Zhang, Z. Response and Control Factors of Groundwater to Extreme Weather, Jiguan Cave, Henan Province, China. Environ. Sci. 2015, 36, 1582–1589. [Google Scholar] [CrossRef]
- Treble, P.C.; Fairchild, I.J.; Griffiths, A.; Baker, A.; Meredith, K.T.; Wood, A.; McGuire, E. Impacts of Cave Air Ventilation and In-Cave Prior Calcite Precipitation on Golgotha Cave Dripwater Chemistry, Southwest Australia. Quat. Sci. Rev. 2015, 127, 61–72. [Google Scholar] [CrossRef] [Scilit]
- Deines, P.; Langmuir, D.; Harmon, R.S. Stable Carbon Isotope Ratios and the Existence of a Gas Phase in the Evolution of Carbonate Ground Waters. Geochim. Cosmochim. Acta 1974, 38, 1147–1164. [Google Scholar] [CrossRef] [Scilit]
- Tognarelli, A.; Zanchetta, G.; Regattieri, E.; Isola, I.; Drysdale, R.N.; Bini, M.; Hellstrom, J.C. Wavelet Analysis of δ18O and δ13C Time-Series from a Holocene Speleothem Record from Corchia Cave (Central Italy): Insights for the Recurrence of Dry-Wet Periods in the Central Mediterranean. Ital. J. Geosci. 2018, 137, 128–137. [Google Scholar] [CrossRef] [Scilit]
- Stoll, H.M.; Day, C.; Lechleitner, F.; Kost, O.; Endres, L.; Sliwinski, J.; Pérez-Mejías, C.; Cheng, H.; Scholz, D. Distinguishing the Combined Vegetation and Soil Component of δ13C Variation in Speleothem Records from Subsequent Degassing and Prior Calcite Precipitation Effects. Clim. Past 2023, 19, 2423–2444. [Google Scholar] [CrossRef] [Scilit]
- Wong, C.I.; Banner, J.L.; Musgrove, M. Seasonal Dripwater Mg/Ca and Sr/Ca Variations Driven by Cave Ventilation: Implications for and Modeling of Speleothem Paleoclimate Records. Geochim. Cosmochim. Acta 2011, 75, 3514–3529. [Google Scholar] [CrossRef] [Scilit]
- Chen, C.-J.; Li, T.-Y. Geochemical Characteristics of Cave Drip Water Respond to ENSO Based on a 6-Year Monitoring Work in Yangkou Cave, Southwest China. J. Hydrol. 2018, 561, 896–907. [Google Scholar] [CrossRef] [Scilit]
- Tooth, A.F.; Fairchild, I.J. Soil and Karst Aquifer Hydrological Controls on the Geochemical Evolution of Speleothem-Forming Drip Waters, Crag Cave, Southwest Ireland. J. Hydrol. 2003, 273, 51–68. [Google Scholar] [CrossRef] [Scilit]
- Worthington, S.R.H.; Davies, G.J.; Alexander, E.C., Jr. Enhancement of Bedrock Permeability by Weathering. Earth-Sci. Rev. 2016, 160, 188–202. [Google Scholar] [CrossRef] [Scilit]
- Markowska, M.; Baker, A.; Treble, P.C.; Andersen, M.S.; Hankin, S.; Jex, C.N.; Tadros, C.V.; Roach, R. Unsaturated Zone Hydrology and Cave Drip Discharge Water Response: Implications for Speleothem Paleoclimate Record Variability. J. Hydrol. 2015, 529, 662–675. [Google Scholar] [CrossRef] [Scilit]
- Hartmann, A.; Baker, A. Modelling Karst Vadose Zone Hydrology and Its Relevance for Paleoclimate Reconstruction. Earth-Sci. Rev. 2017, 172, 178–192. [Google Scholar] [CrossRef] [Scilit]
- Tian, Y.; Guang, K.; Li, J.; Zhu, S.; Tian, L.; Li, Y.; Gao, Y.; Rao, Z. Cave Monitoring in the Monsoon Region of China and Its Paleoclimatic Implications. J. Cave Karst Stud. 2024, 86, 57–73. [Google Scholar] [CrossRef] [Scilit]
- Wang, Y.; Luo, W.; Zeng, G.; Wang, Y.; Yang, H.; Wang, M.; Zhang, L.; Cai, X.; Chen, J.; Cheng, A.; et al. High 222Rn Concentrations and Dynamics in Shawan Cave, Southwest China. J. Environ. Radioact. 2019, 199, 16–24. [Google Scholar] [CrossRef] [Scilit]
- Wang, M.; Luo, W.; Wang, Y.; Zeng, G.; Lyu, Y.; Chen, J.; Cai, X.; Zhang, L.; Cheng, A.; Wang, S. Soil CO2 Cycle Models in Karst Critical Zone: A Case Study of the Soil–Cave System. Catena 2025, 249, 108710. [Google Scholar] [CrossRef] [Scilit]
- Wu, X.; Pan, M.; Yin, J.; Cao, J. Characteristics of the Cave Environment and Seasonal Variation in the Modern Calcite Deposition Rate in Liangfeng Cave, SW China. Carbonates Evaporites 2025, 40, 21. [Google Scholar] [CrossRef] [Scilit]
- Wu, X.; Pan, M.; Yin, J.; Zhang, M.; Cao, J. Hydrogeochemical Responses of Cave Drip Water to the Local Climate in the Liangfeng Cave, Southwest China. Hydrol. Res. 2022, 53, 945–957. [Google Scholar] [CrossRef] [Scilit]
- Wu, X.; Pan, M.; Zhang, M.; Cao, J. Seasonal Variation in the Total Alkalinity and δ13CDIC Values of Cave Drip Water in a Ventilated Cave in Response to the Regional Climatology, Southwest China. Appl. Geochem. 2021, 135, 105115. [Google Scholar] [CrossRef] [Scilit]
- Ding, M.; Wu, X.; Cao, J.; Hu, X.; Pan, M.; Huang, F.; Ren, M. Characteristics and Influencing Factors of Vertical Carbon Migration in the Cave System of Liangfeng Cave in Guilin. Carsologica Sin. 2021, 40, 600–607. [Google Scholar]
- Li, H.-C.; Lee, Z.-H.; Wan, N.-J.; Shen, C.-C.; Li, T.-Y.; Yuan, D.-X.; Chen, Y.-H. The δ18O and δ13C Records in an Aragonite Stalagmite from Furong Cave, Chongqing, China: A 2000-Year Record of Monsoonal Climate. J. Asian Earth Sci. 2011, 40, 1121–1130. [Google Scholar] [CrossRef] [Scilit]
- Cao, M.; Jiang, Y.; He, Q.; Yin, J.; Yang, Y.; Li, T. Review and Prospect of Modern Monitoring and Paleoclimate Research in Xueyu Cave Group, Fengdu, Chongqing. Carsologica Sin. 2022, 41, 414–428. [Google Scholar] [CrossRef]
- Cao, M.; Lei, J.; He, Q.; Zeng, Z.; Lü, X.; Jiang, Y. Rainfall-Driven and Hydrologically-Controlled Variations in Cave CO2 Sources and Dynamics: Evidence from Monitoring Soil CO2, Stream Flow and Cave CO2. J. Hydrol. 2021, 595, 126060. [Google Scholar] [CrossRef] [Scilit]
- Zeng, Z.; Jiang, Y.-J.; Lu, X.-F.; Zeng, S.-B.; Hu, L.-C.; Lei, J.-Q. Spatial and Temporal Variation Characteristics of Drip Water Hydrogeochemistry in the Xueyu Cave of Chongqing and Its Implications for Environmental Research. Environ. Sci. 2018, 39, 2641–2650. [Google Scholar] [CrossRef]
- Li, Y.; Yang, Y.; Wang, X.; Luo, W.; Zhao, J.; Sun, Z.; Ye, Z.; Chen, X.; Shi, X.; Xu, Y.; et al. Sources and Transport of CO2 in the Karst System of Jiguan Cave, Funiu Mountains, China. Sci. Total Environ. 2024, 918, 170507. [Google Scholar] [CrossRef] [Scilit]
- Liang, S.; Yang, Y.; Zhang, N.; Sun, Z.; Zhang, P.; Tian, N.; Ling, X.; Ren, X. Analysis of Temporal and Spatial Variations in Trace Element Migration in Karst Critical Zone: An Example of Jiguan Cave, Henan. Environ. Sci. 2017, 38, 4130–4140. [Google Scholar] [CrossRef]
- Song, H.; Huang, S. Carbonate and Karst. Miner. Petrol. 1988, 8, 9–18. [Google Scholar] [CrossRef]
- Liu, Z. Field Experimental Research on the Corrosion Kinetics of Limestone and Dolomite in Allogenic Water—Case from Yaoshan Mt., Guilin. Carsologica Sin. 2000, 19, 3–6. [Google Scholar] [CrossRef]
- Roberts, M.S.; Smart, P.L.; Baker, A. Annual Trace Element Variations in a Holocene Speleothem. Earth Planet. Sci. Lett. 1998, 154, 237–246. [Google Scholar] [CrossRef] [Scilit]
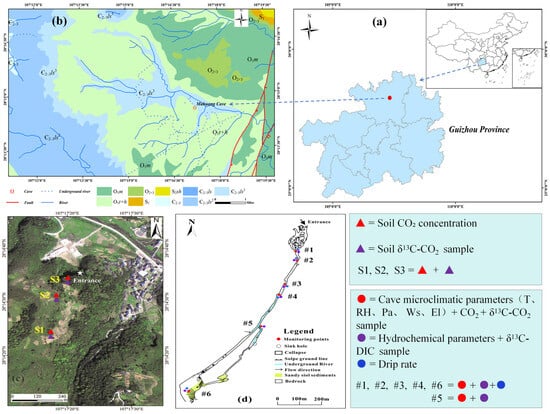
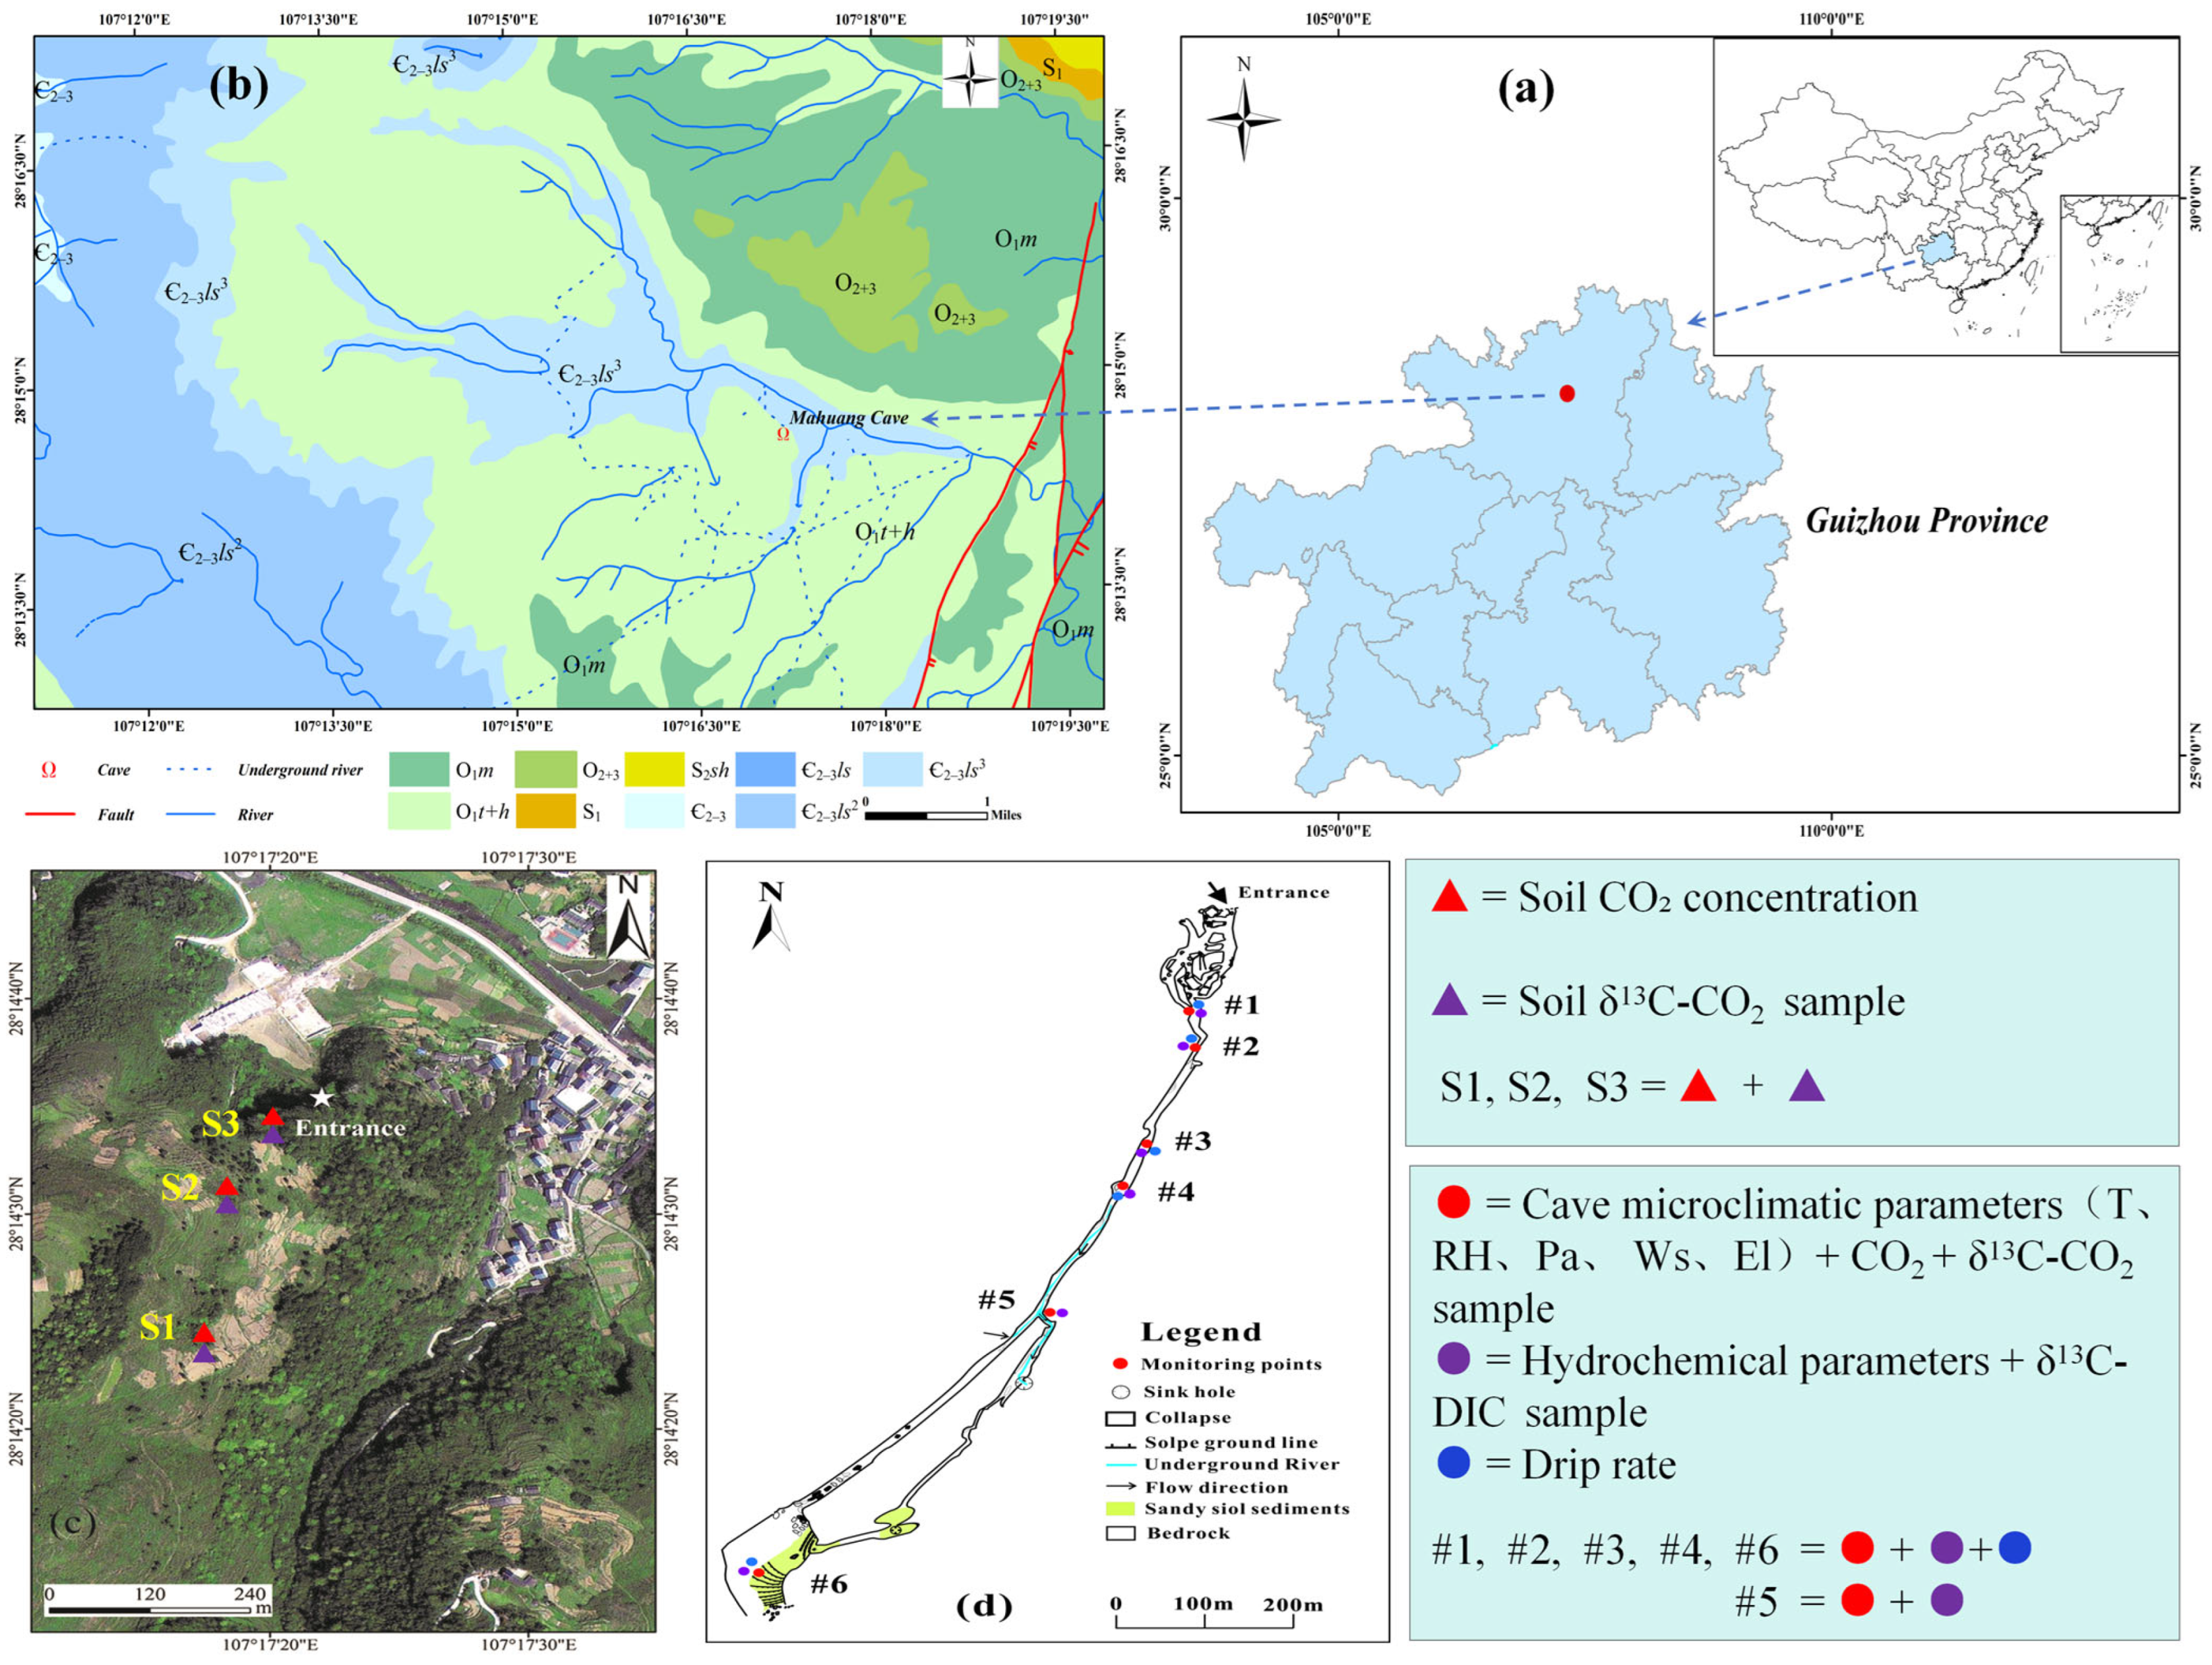
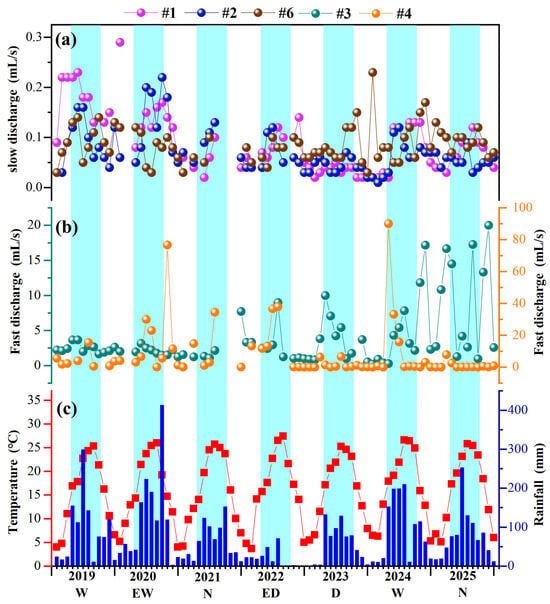
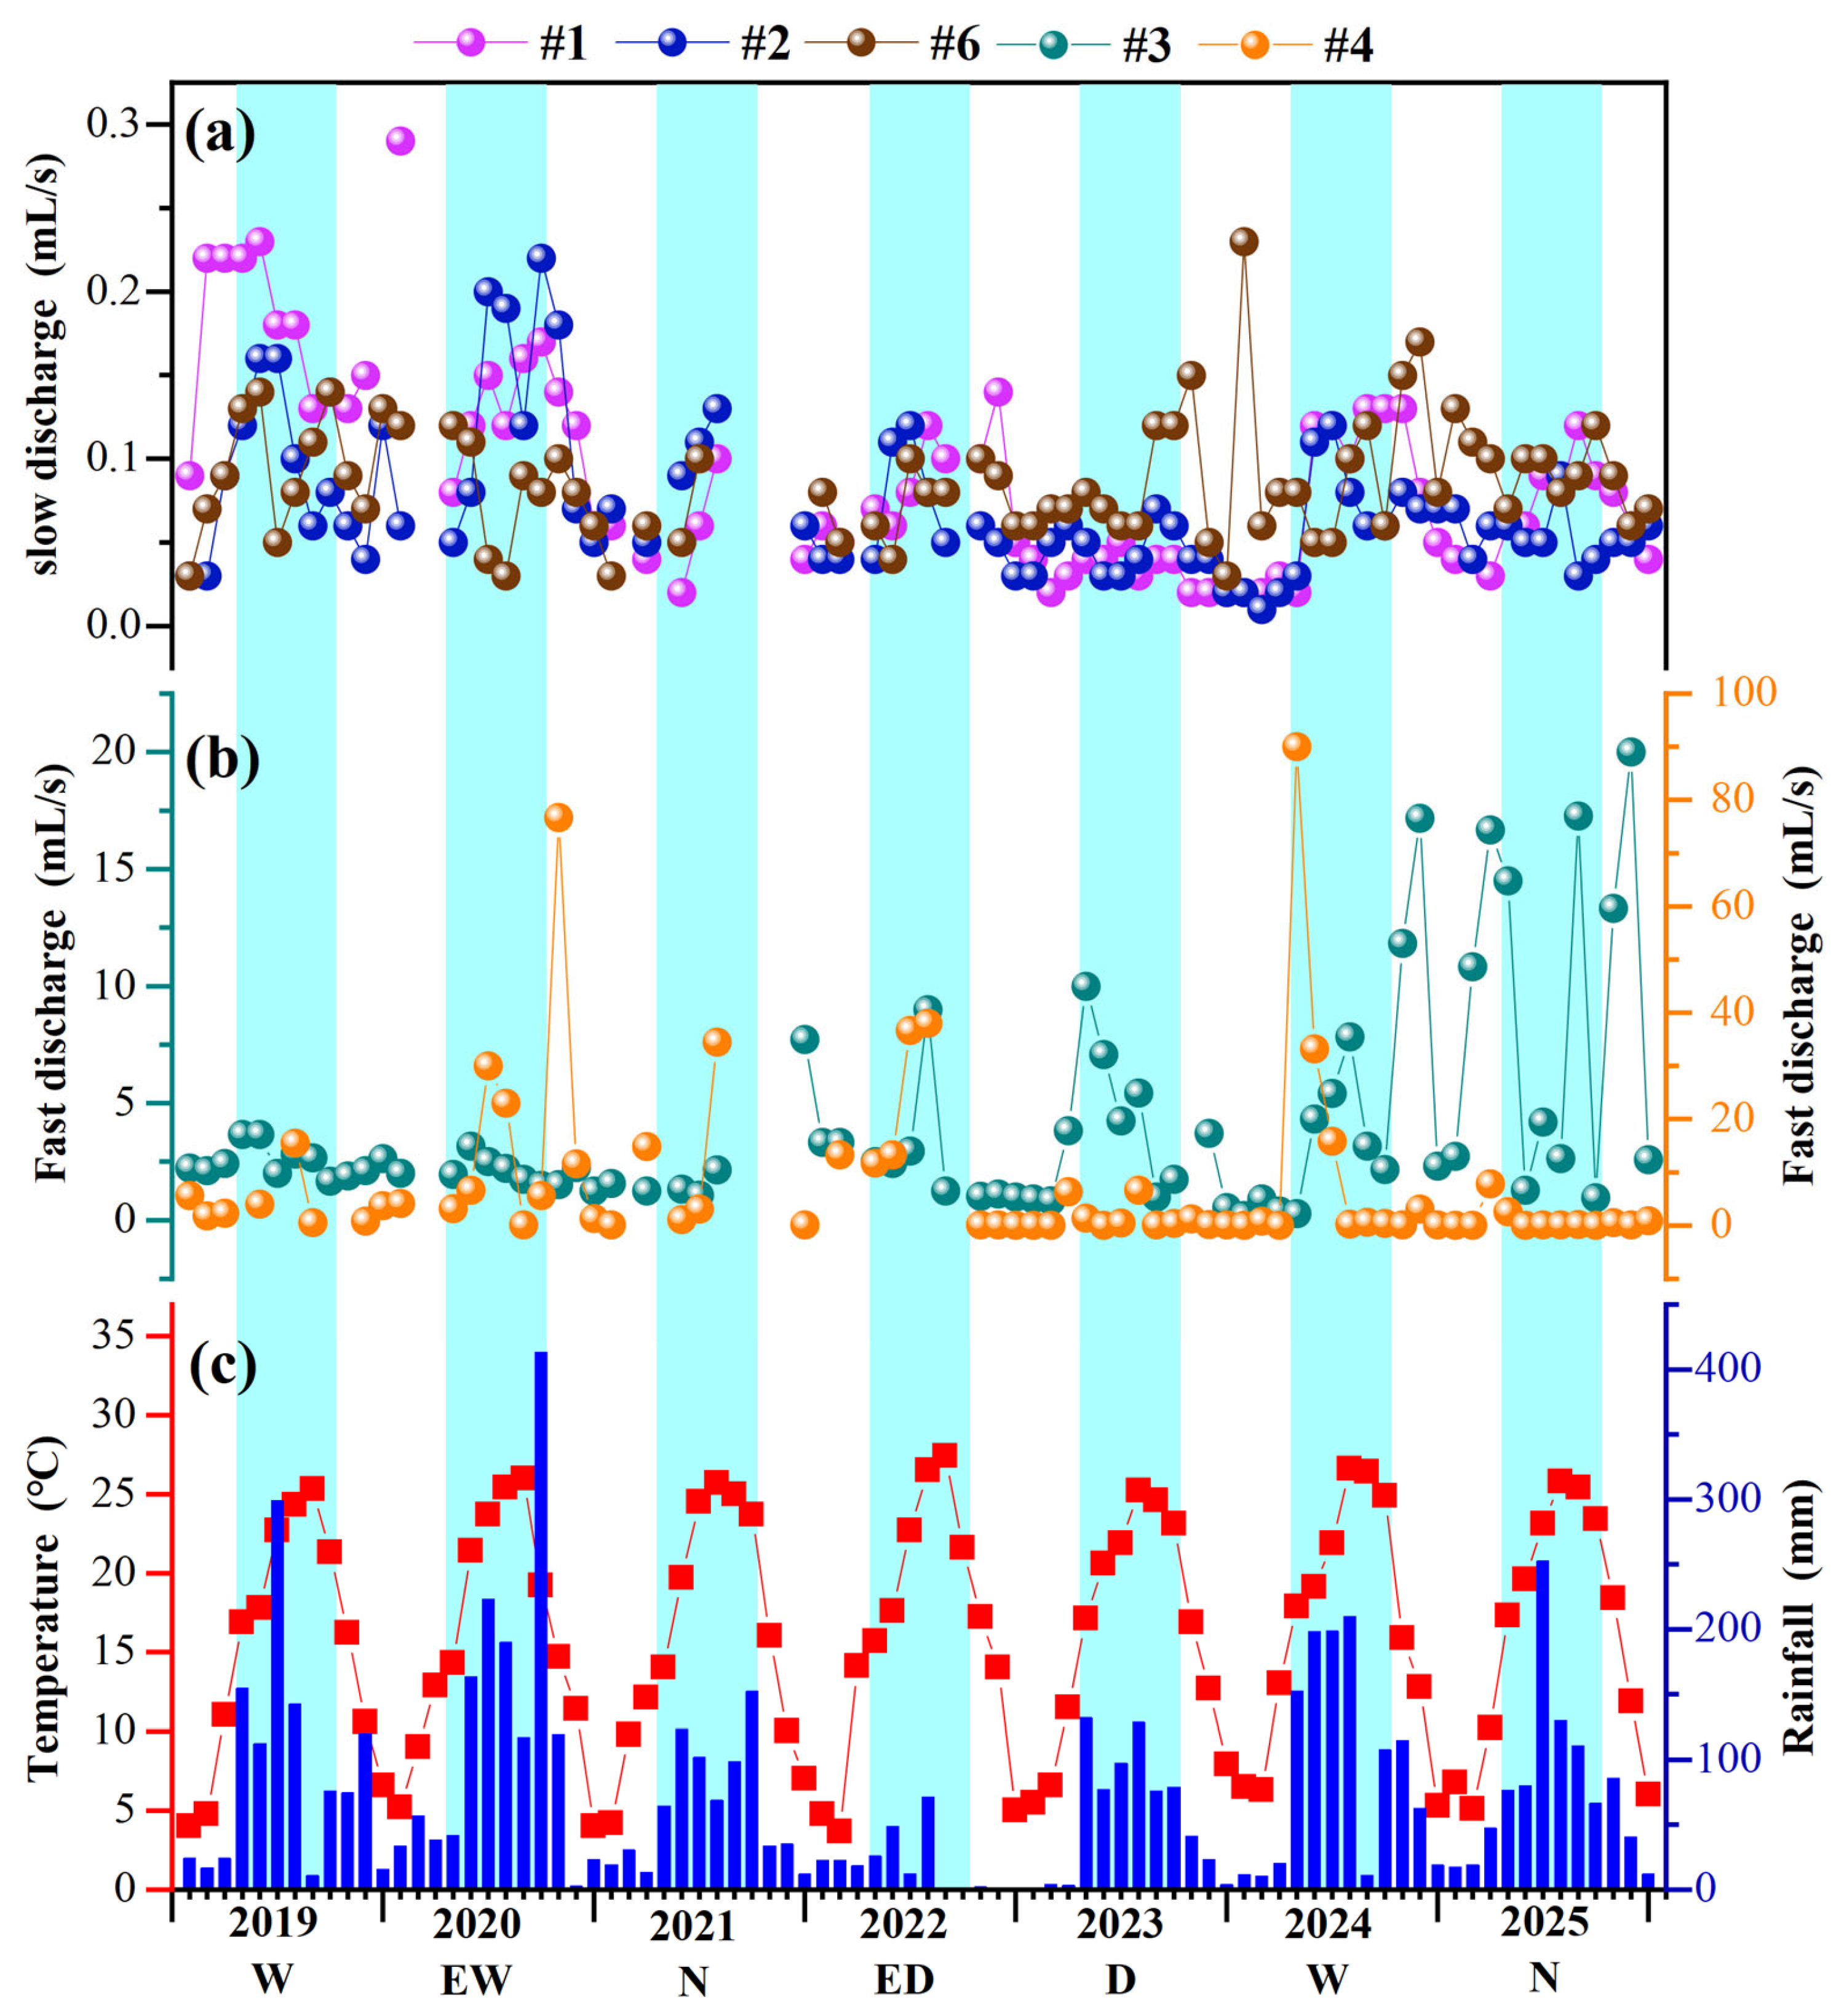
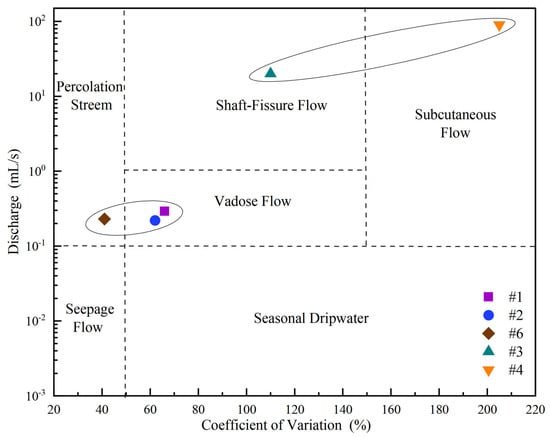
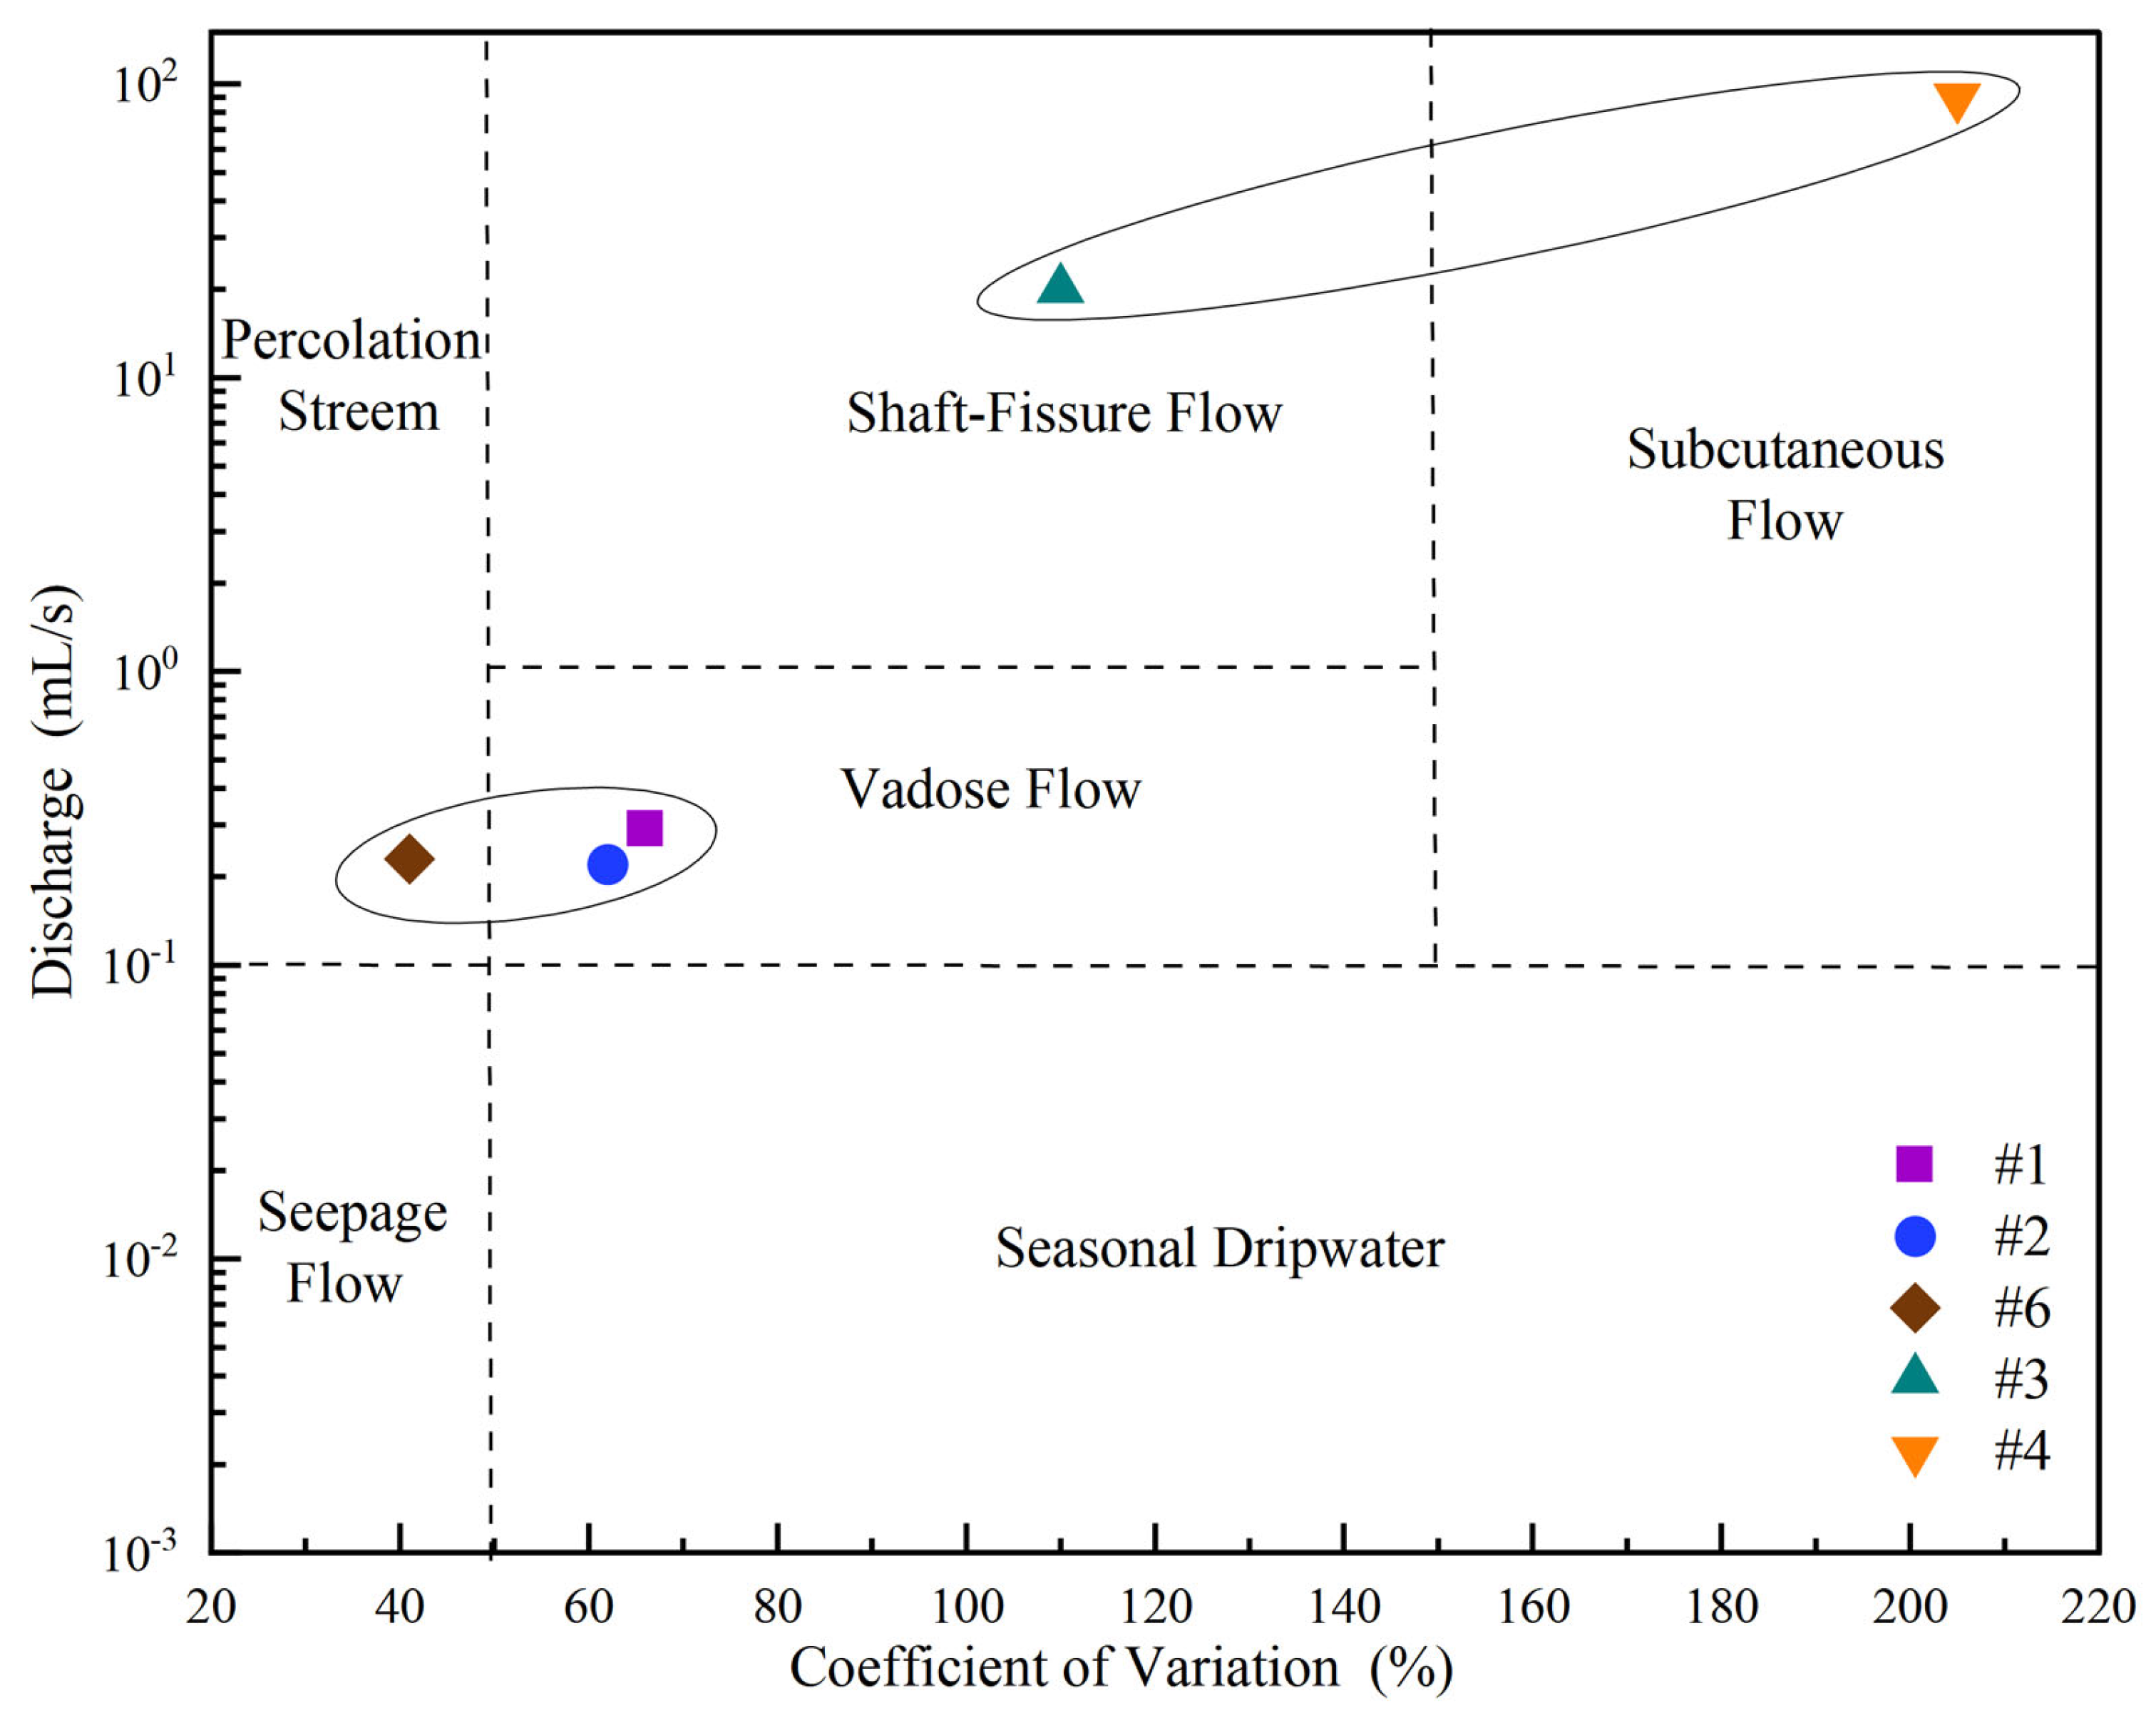
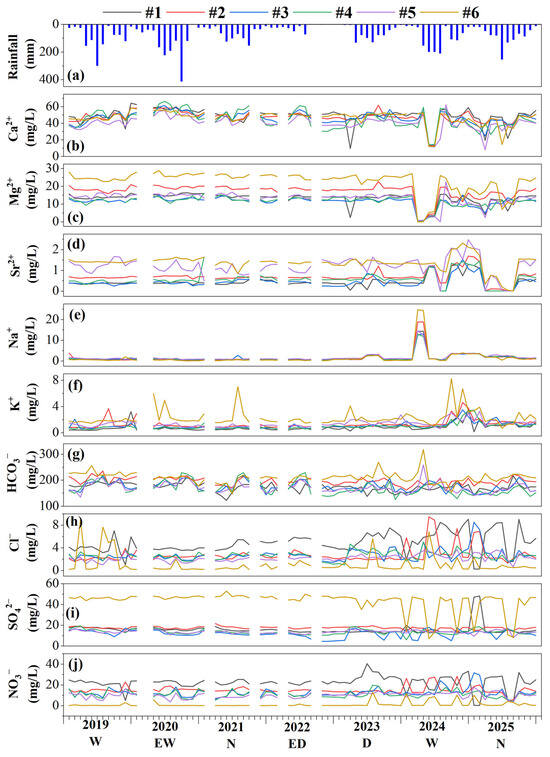
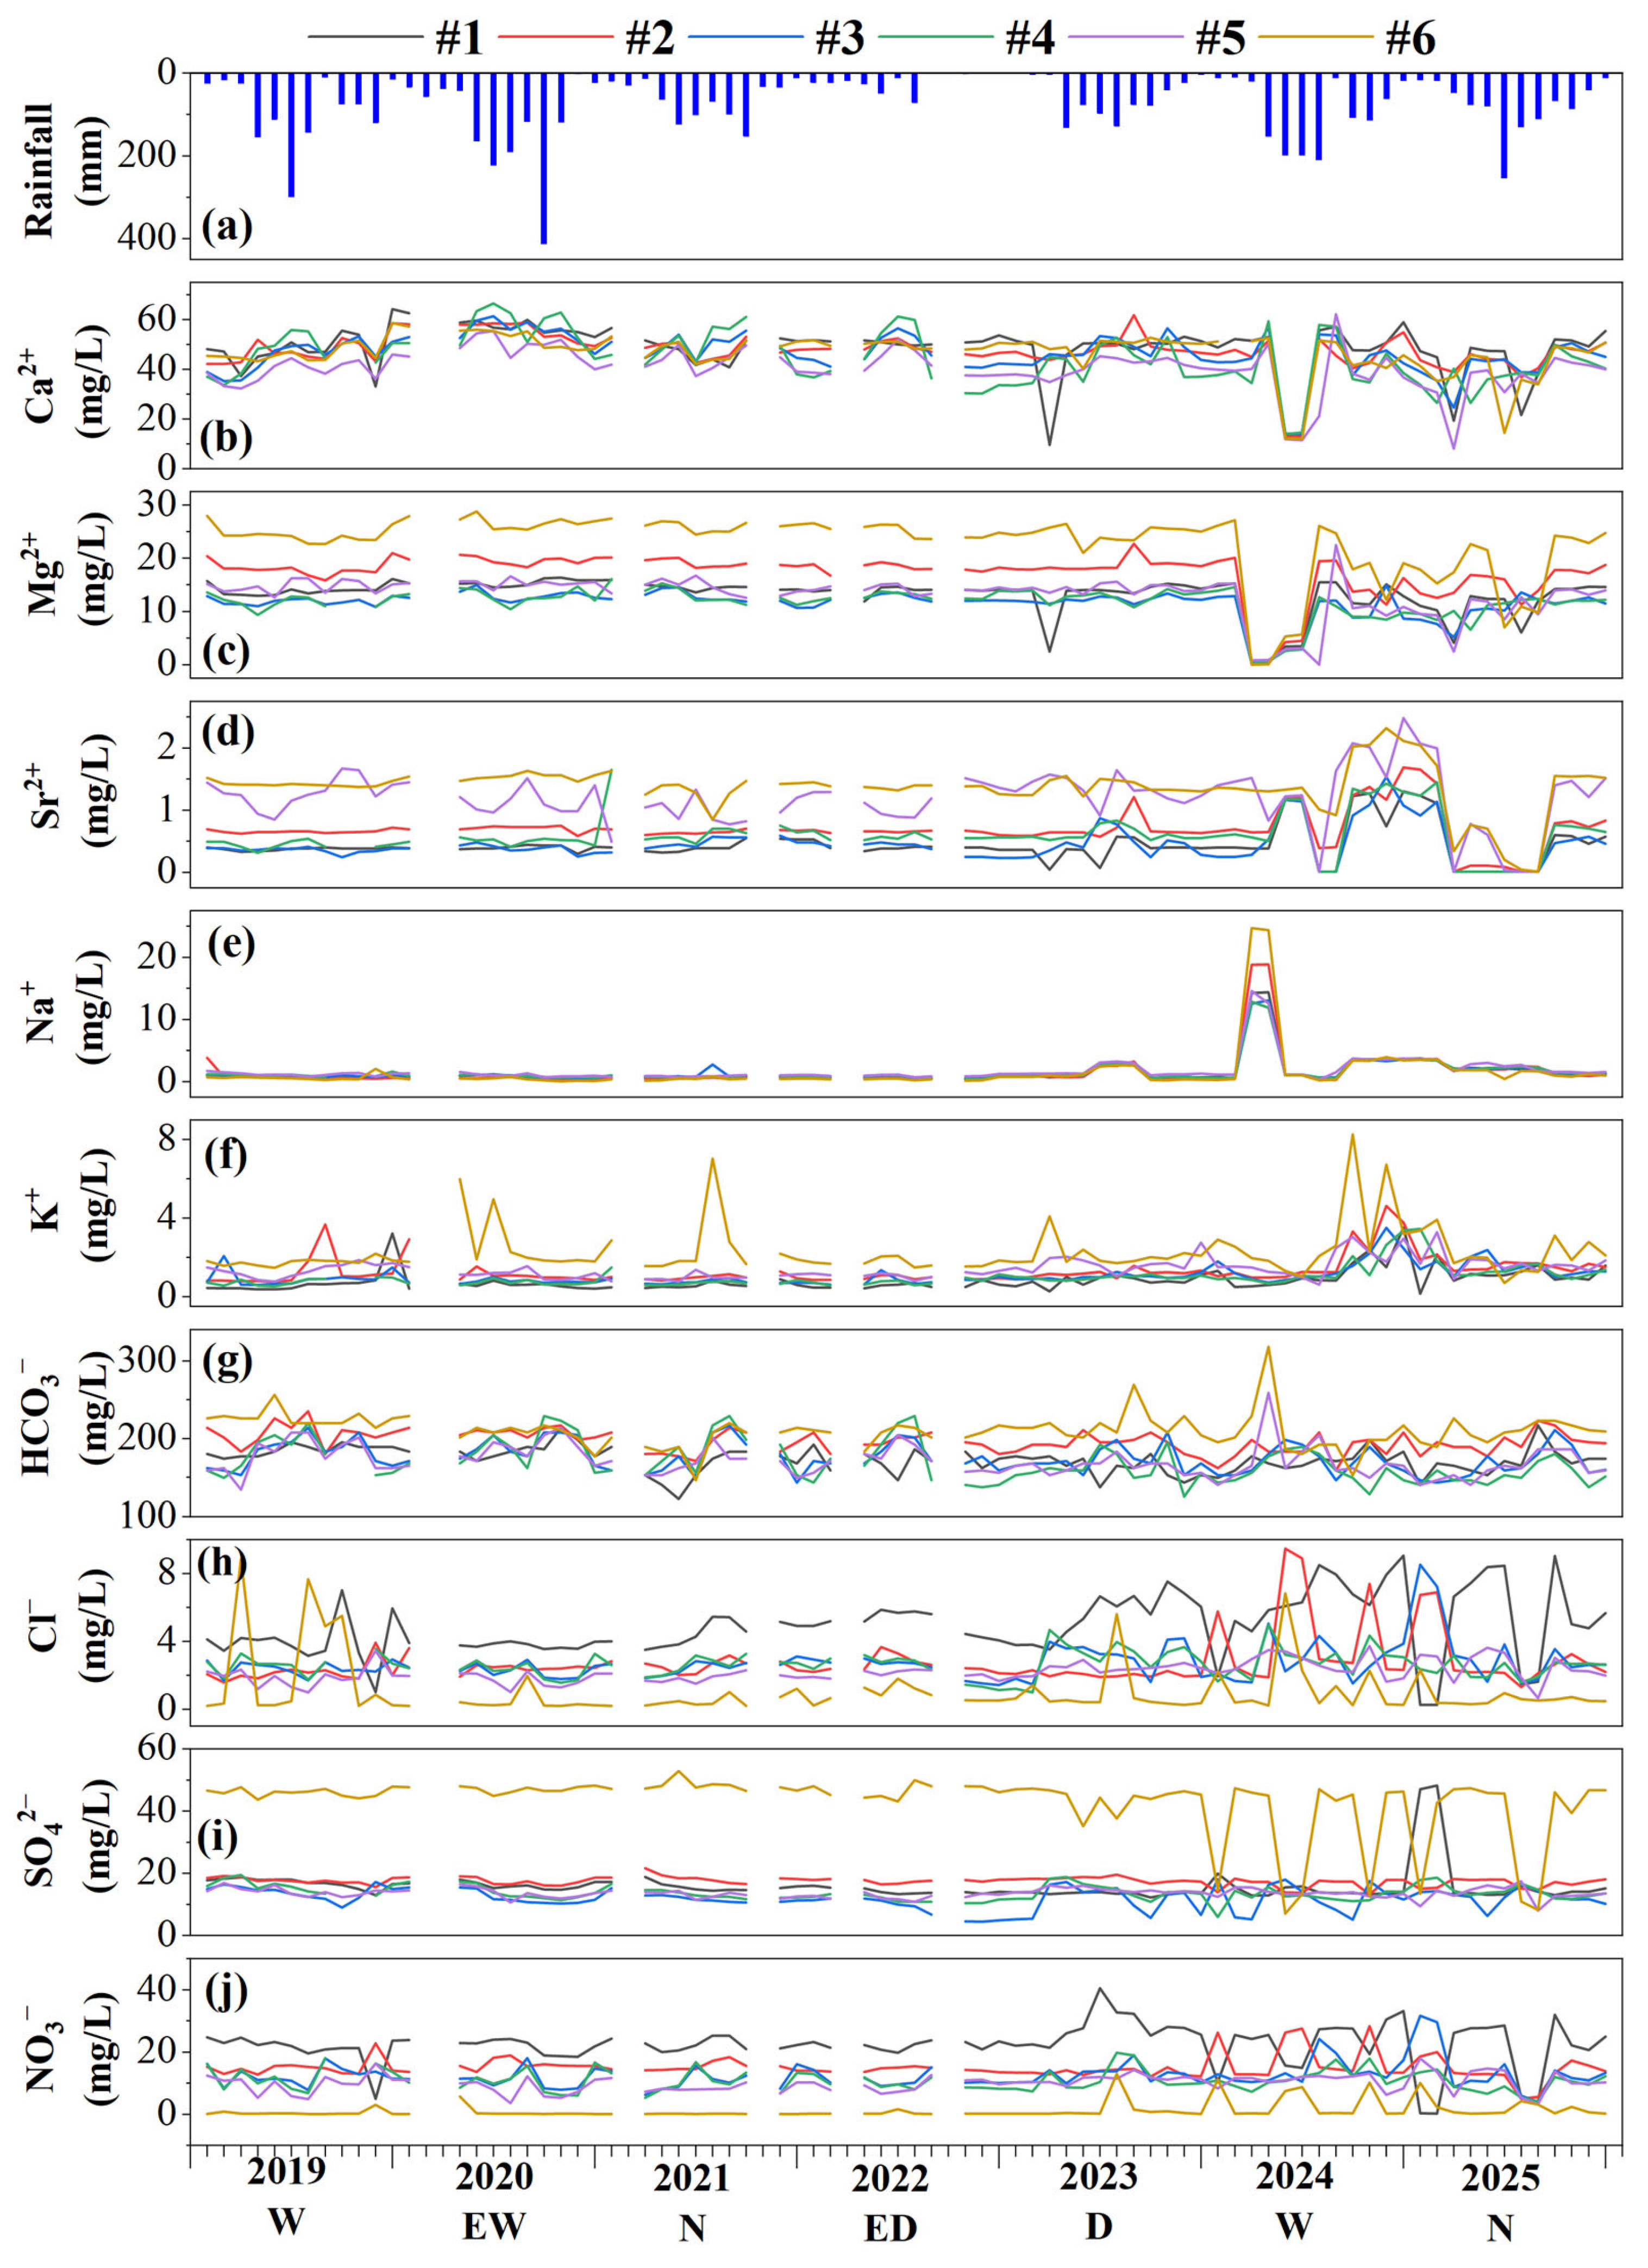
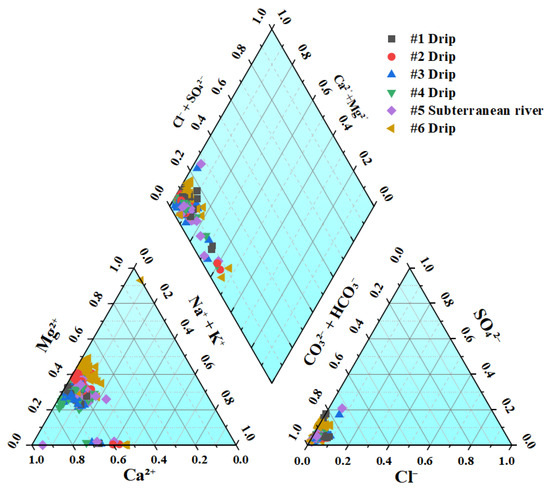
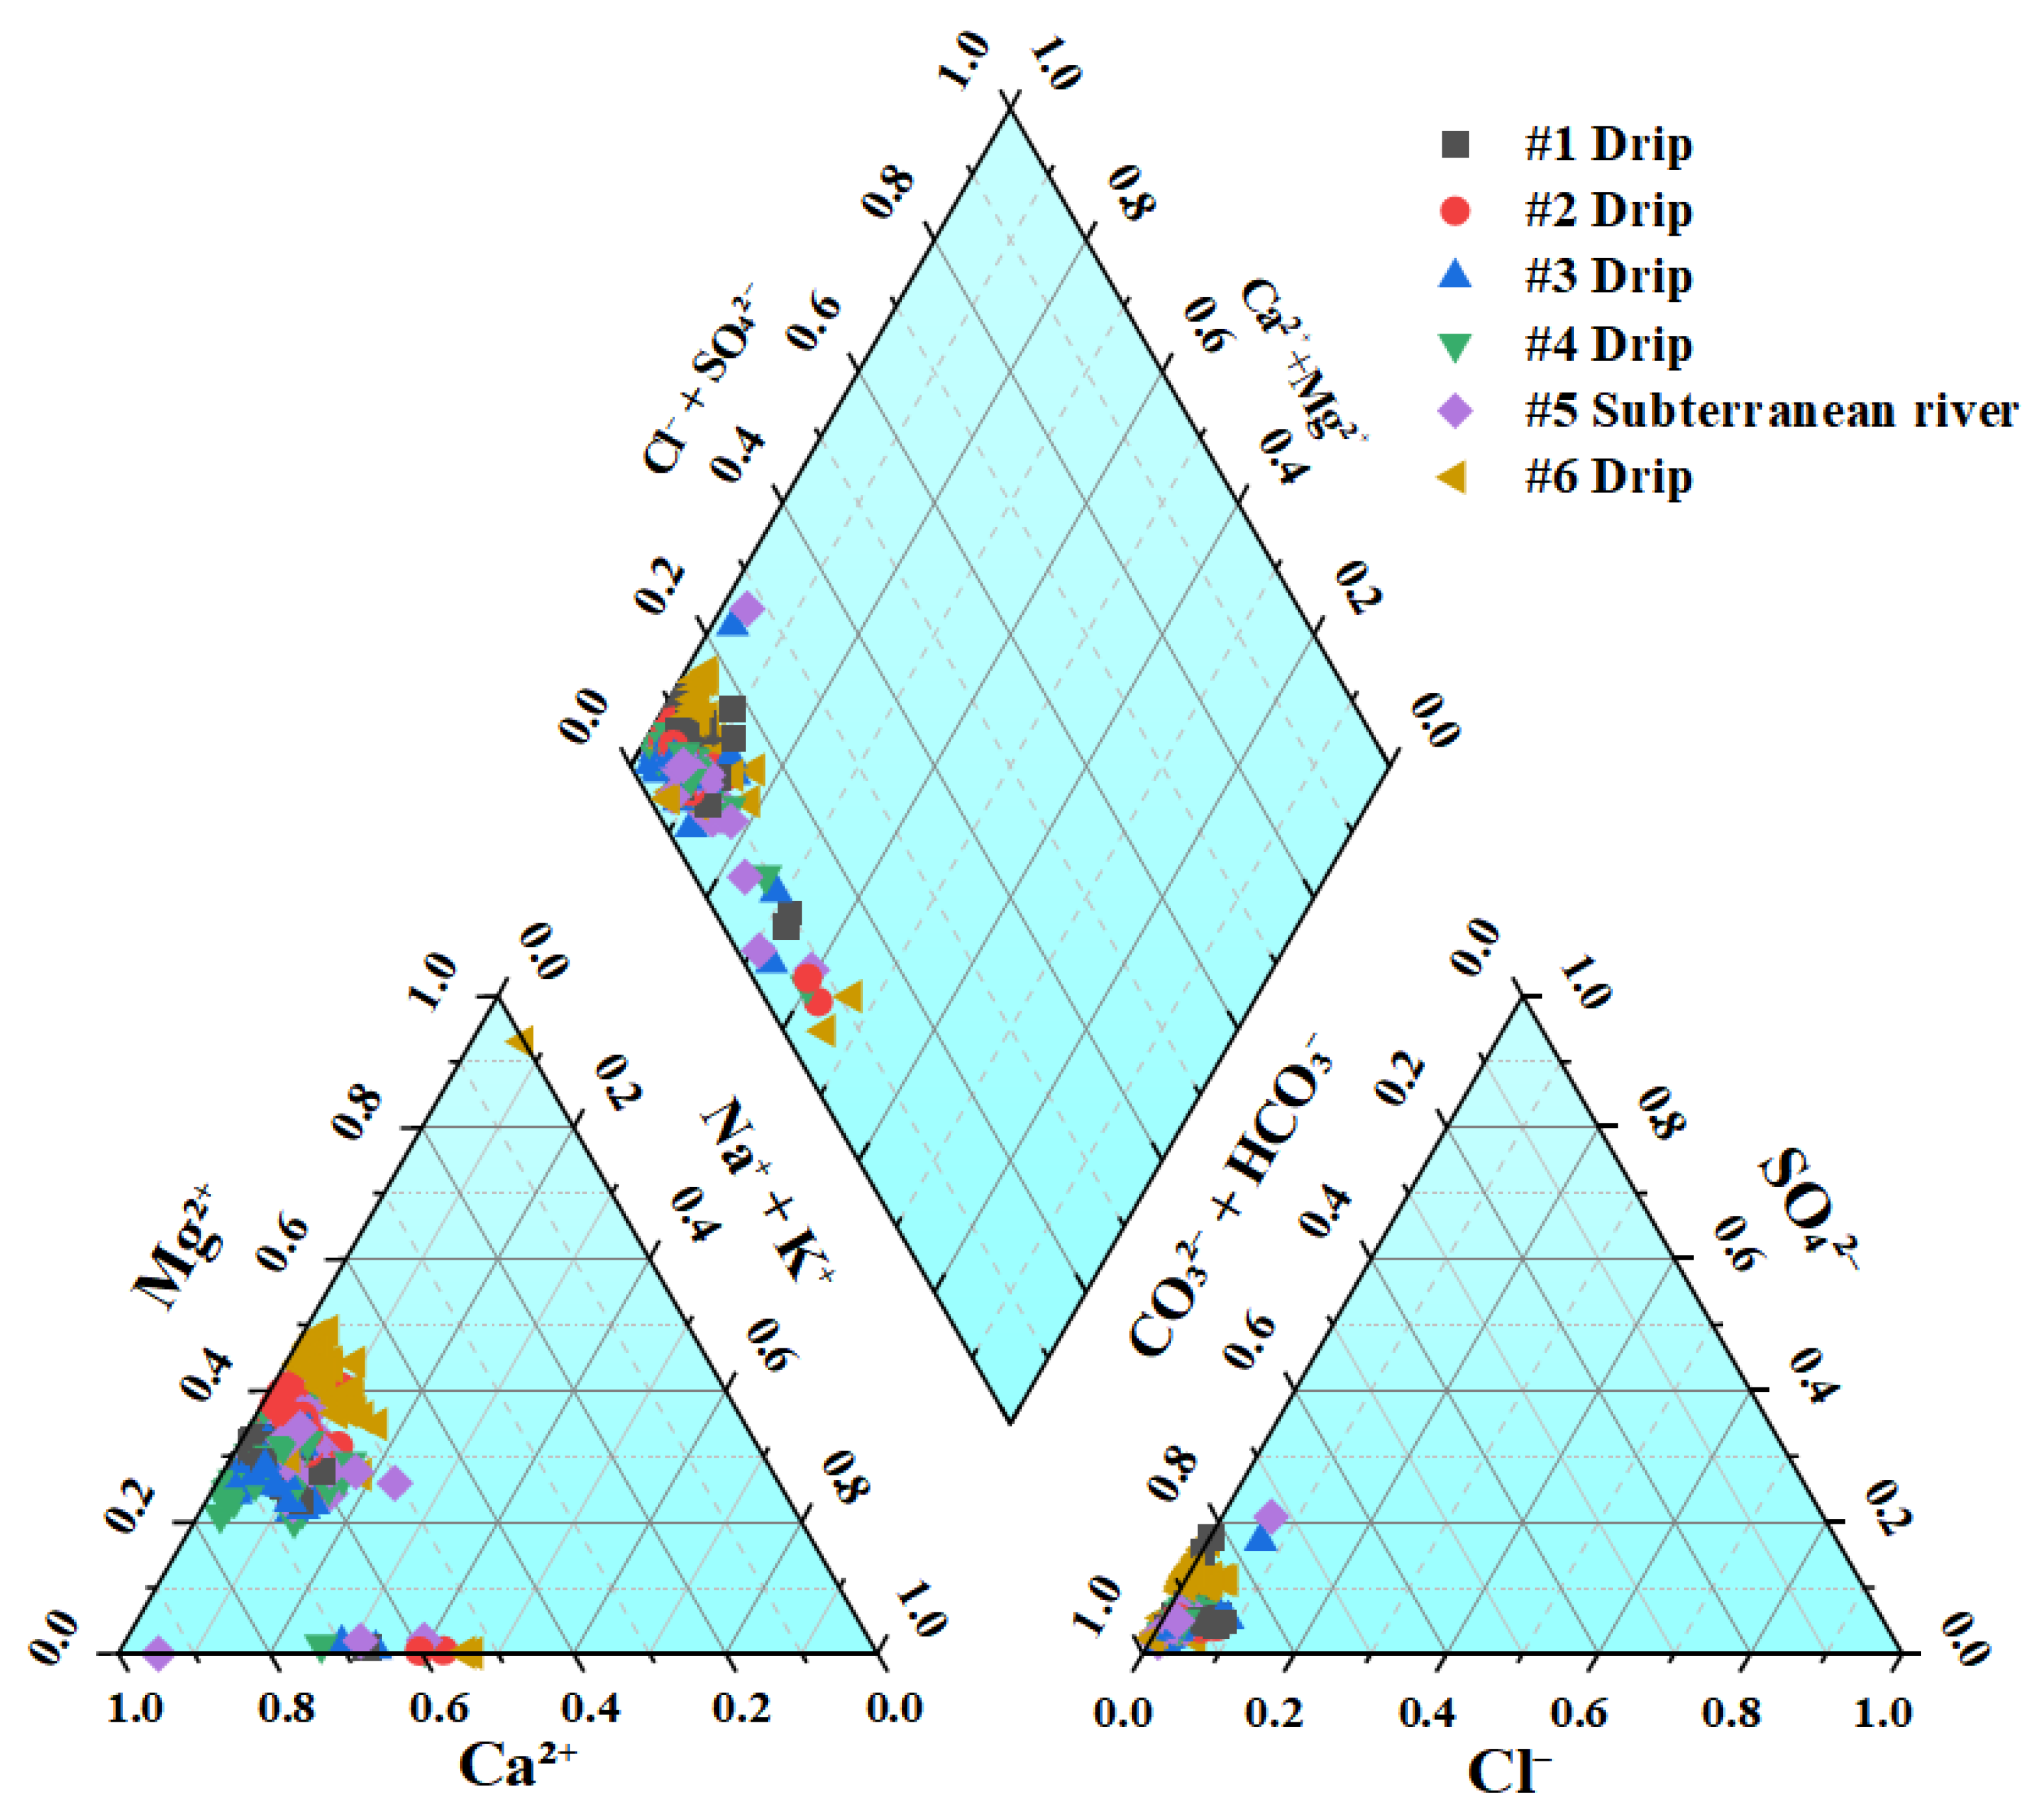
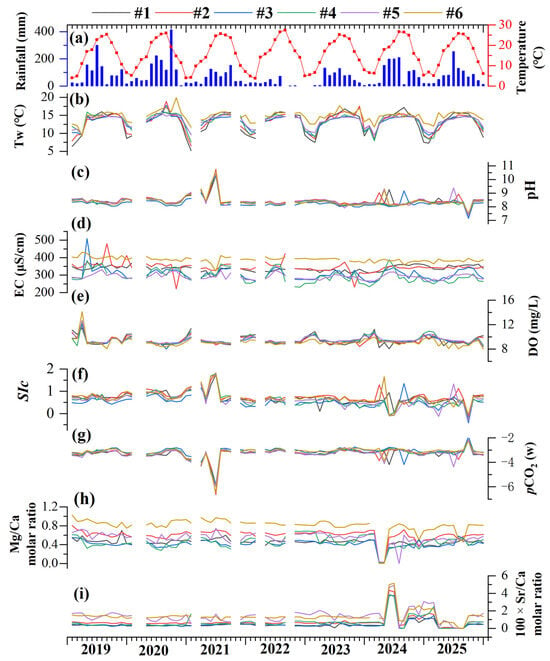
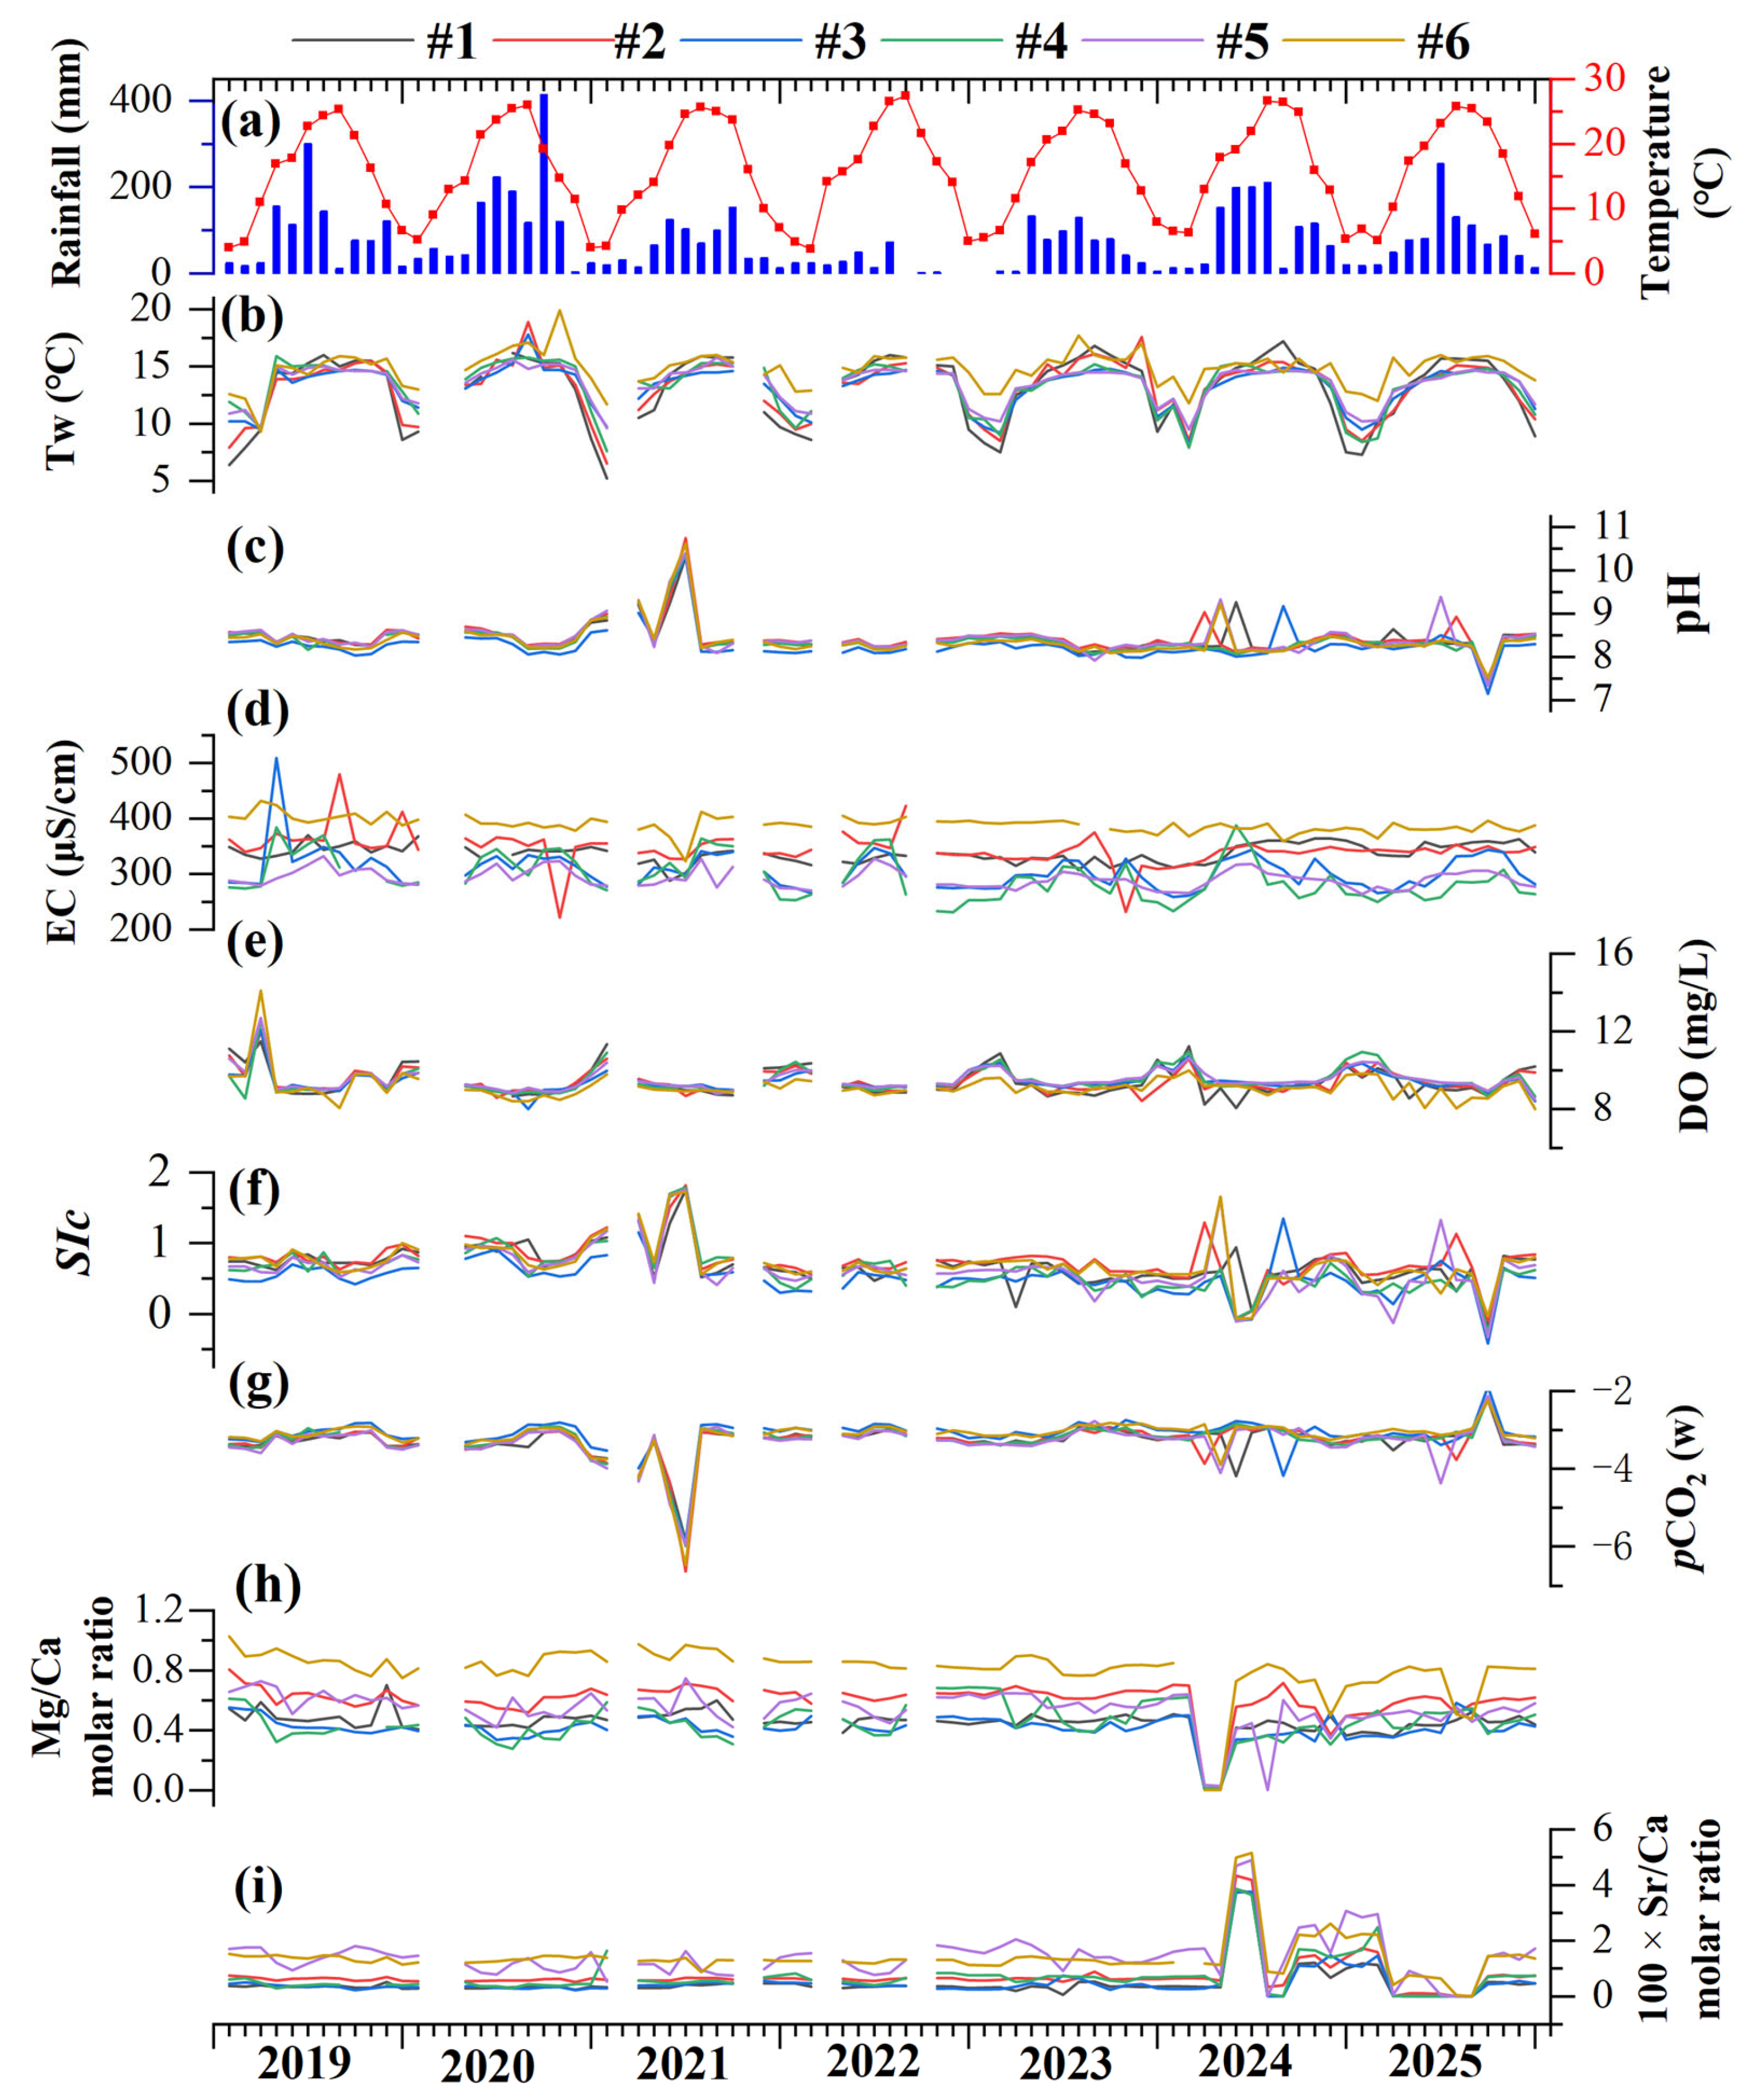
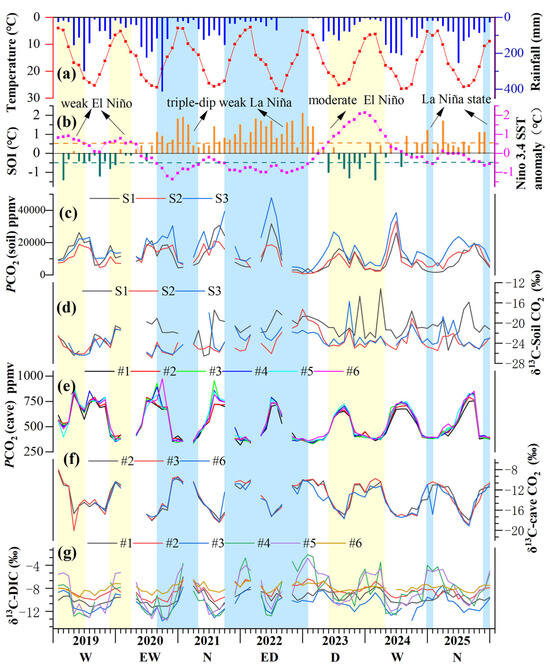
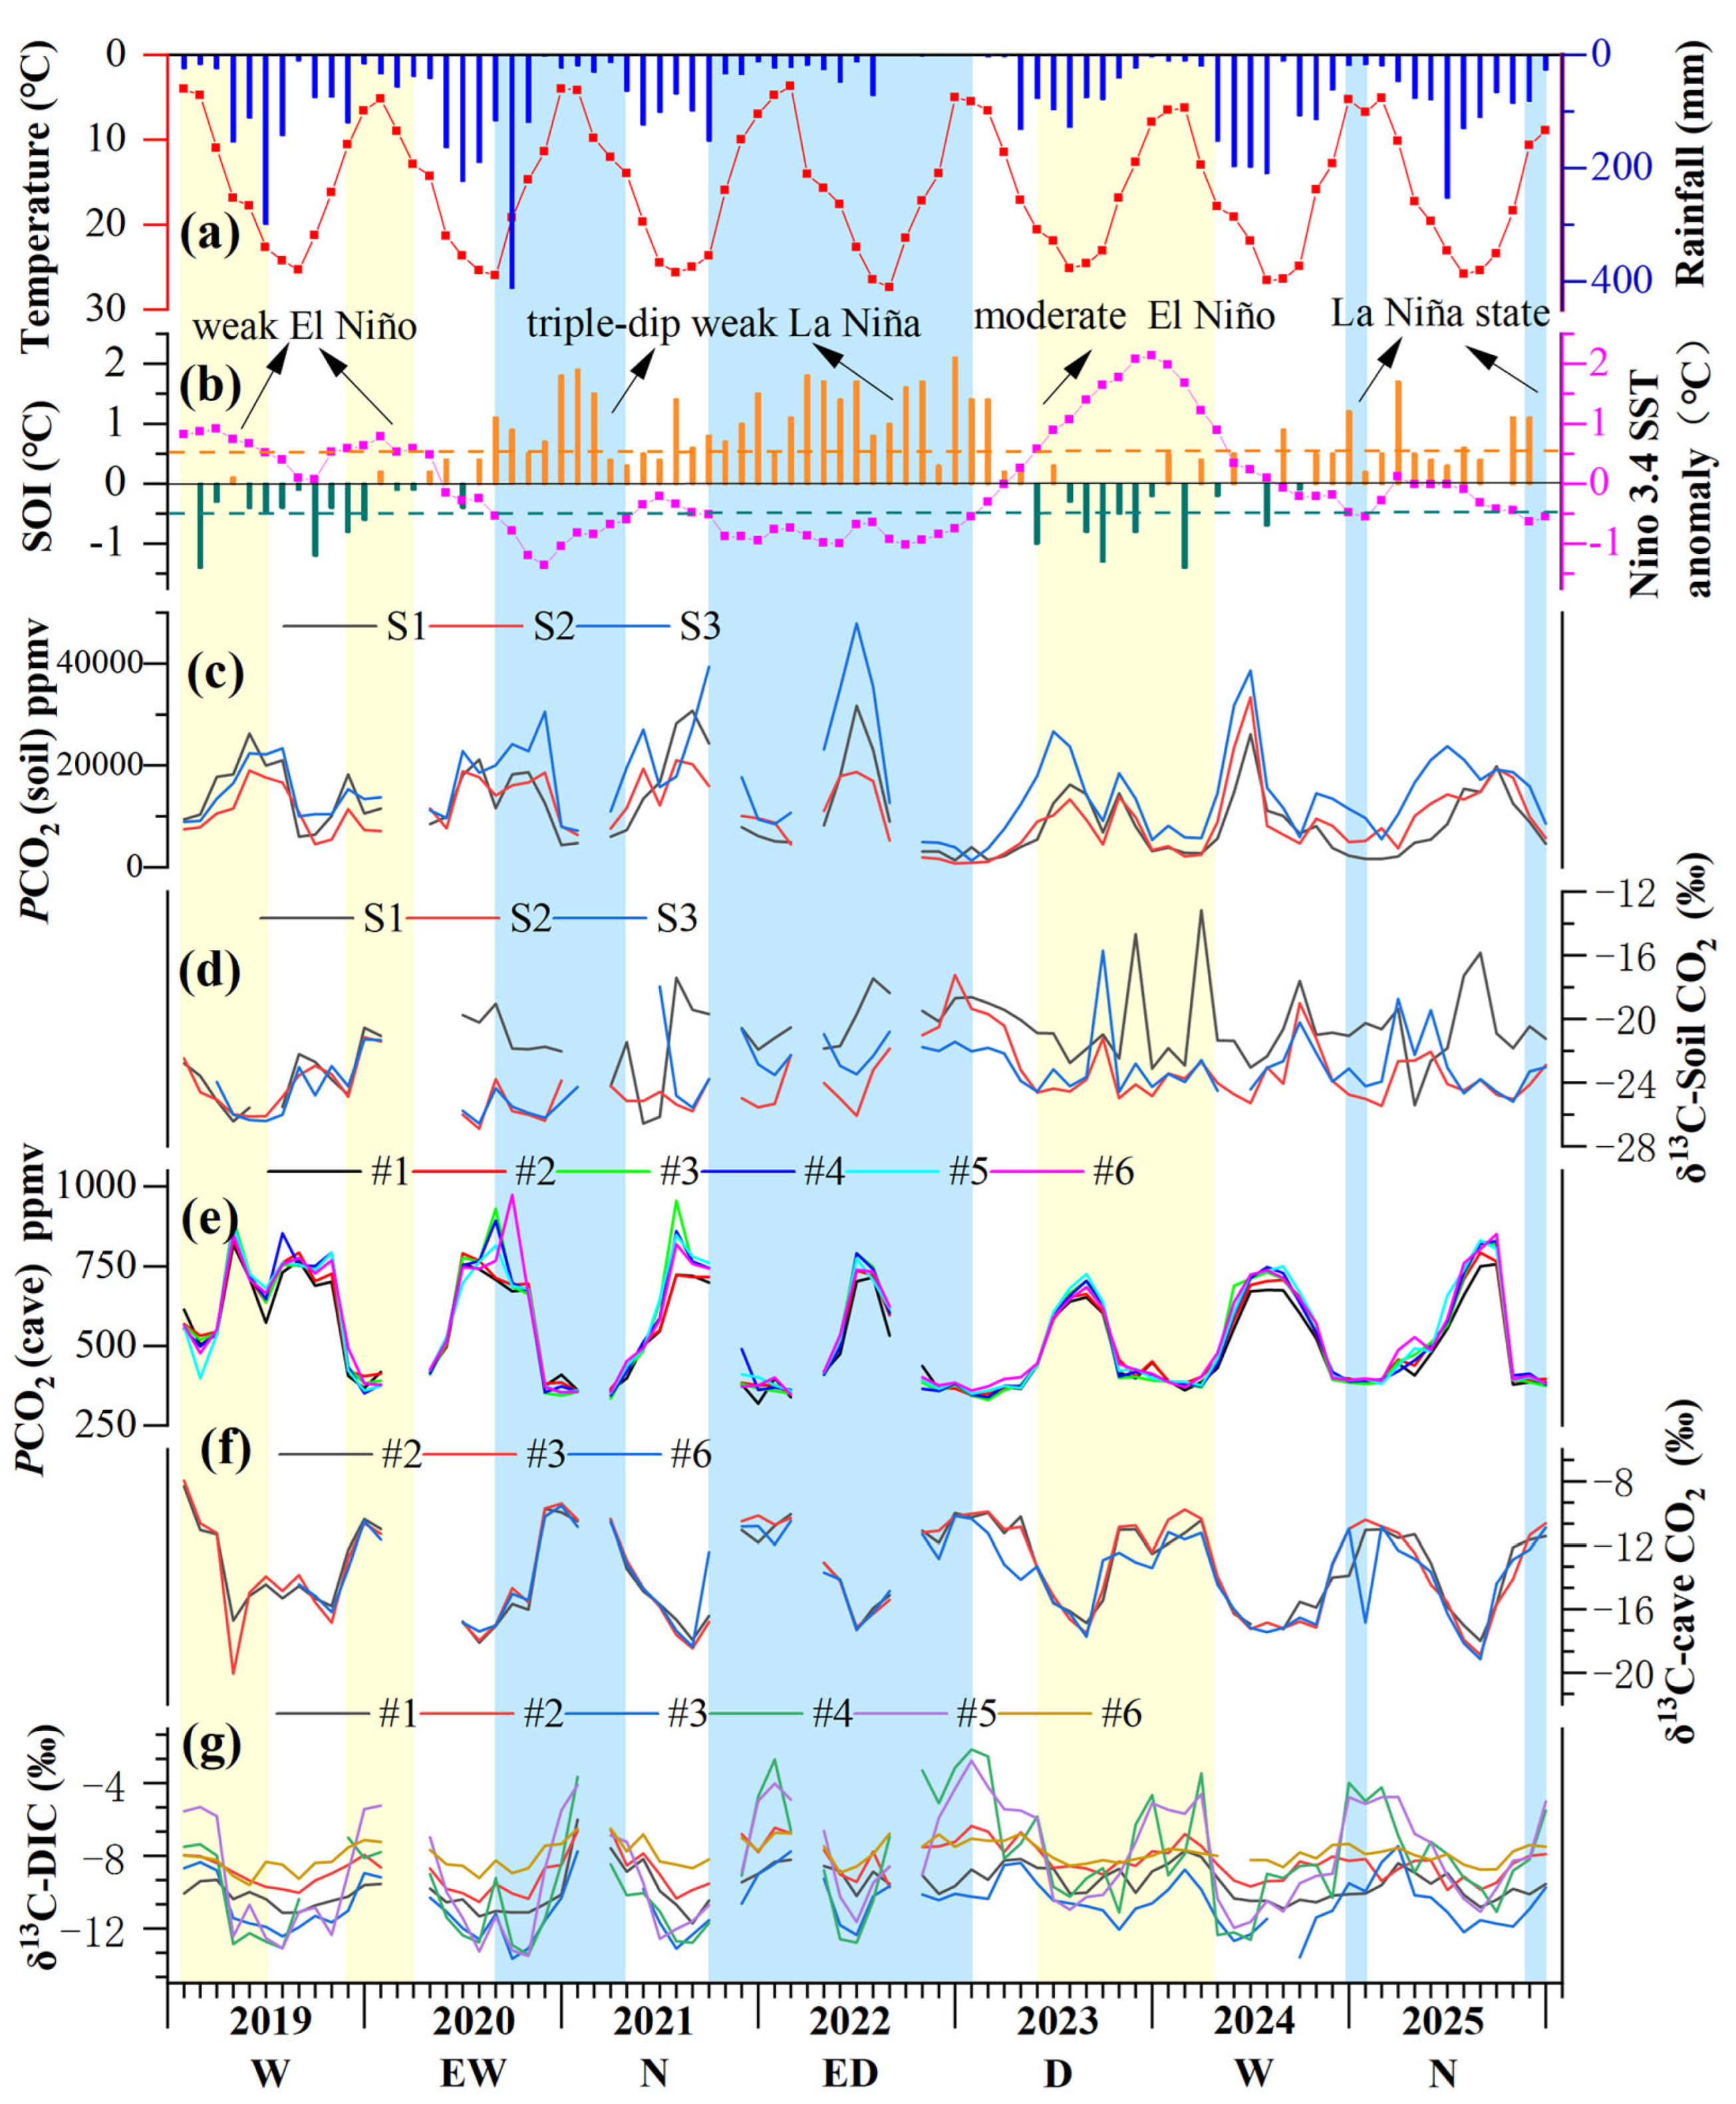
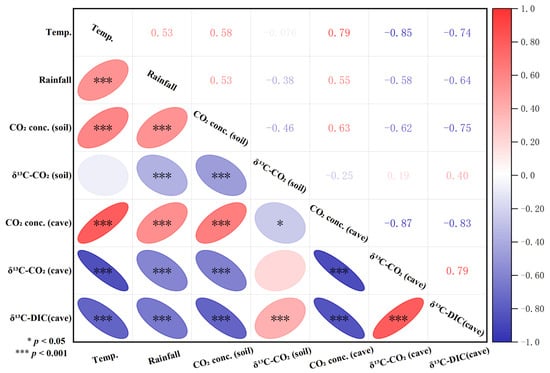
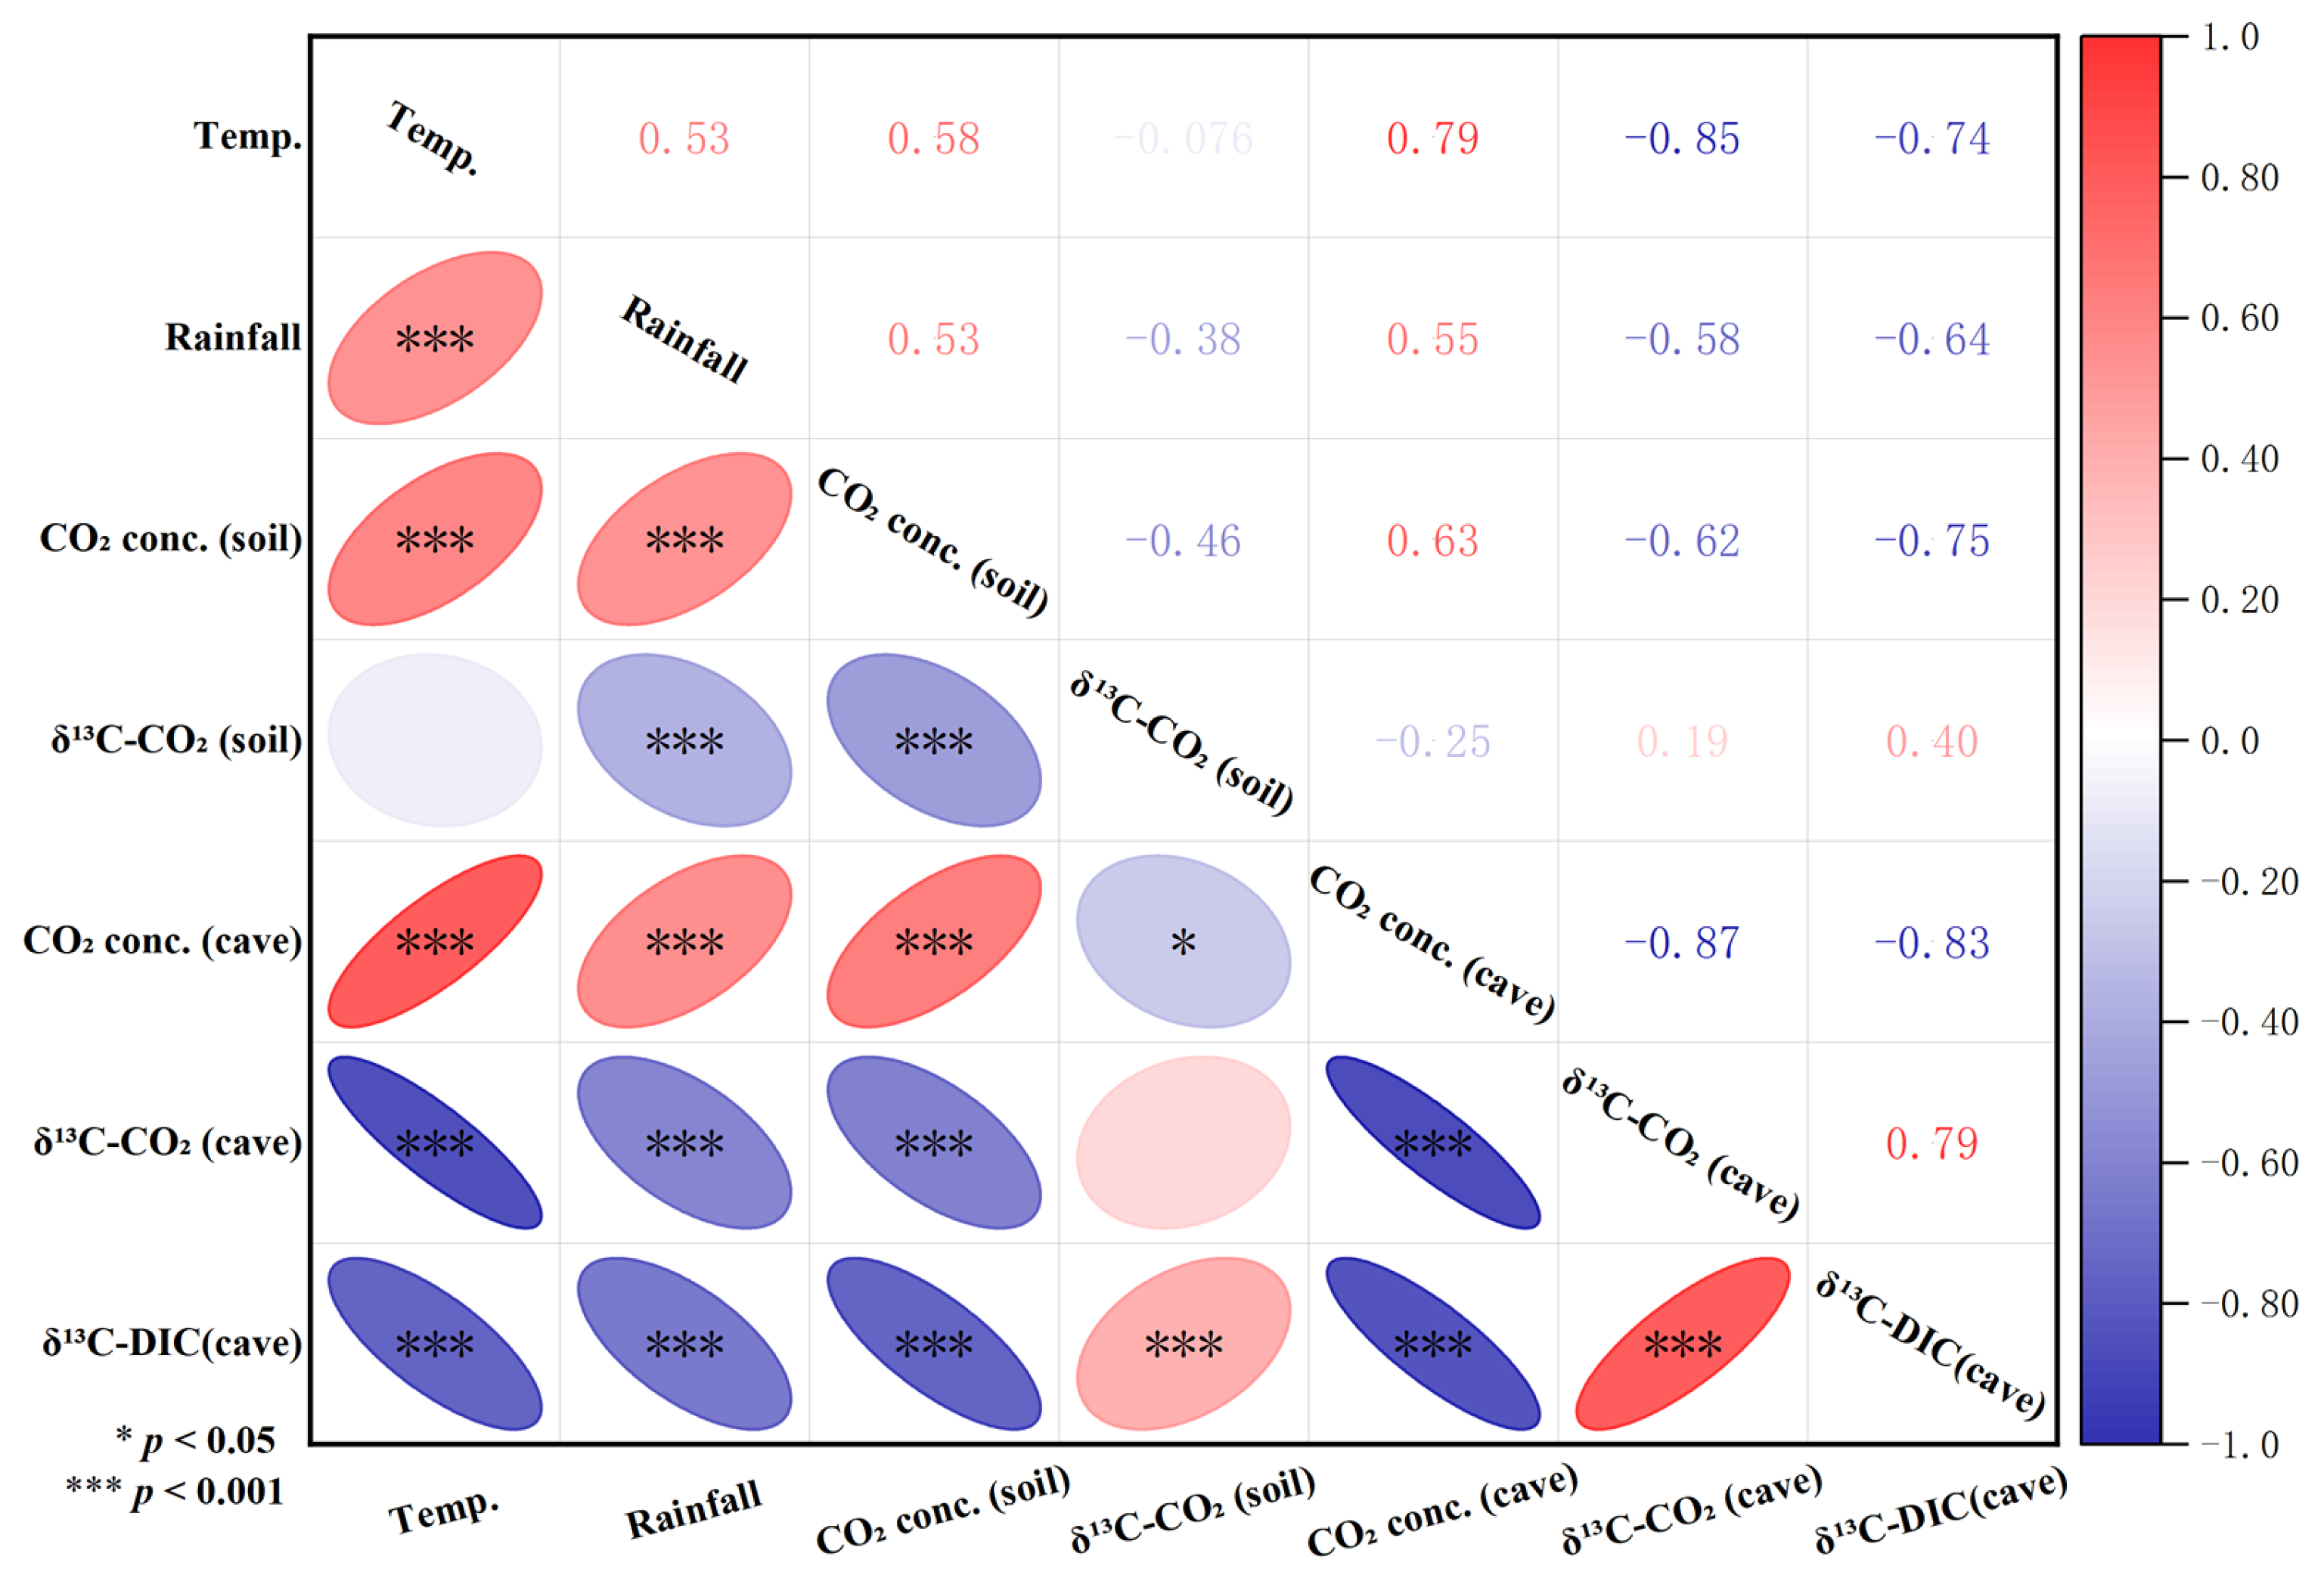
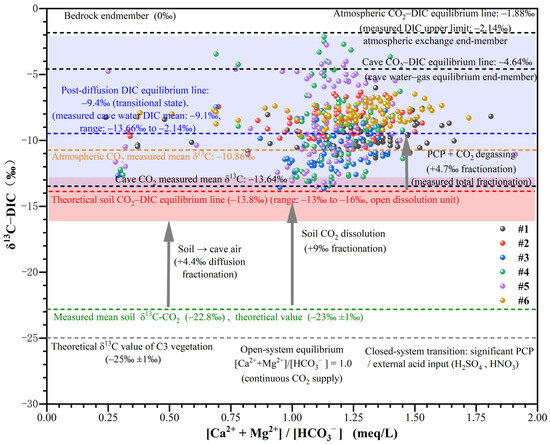
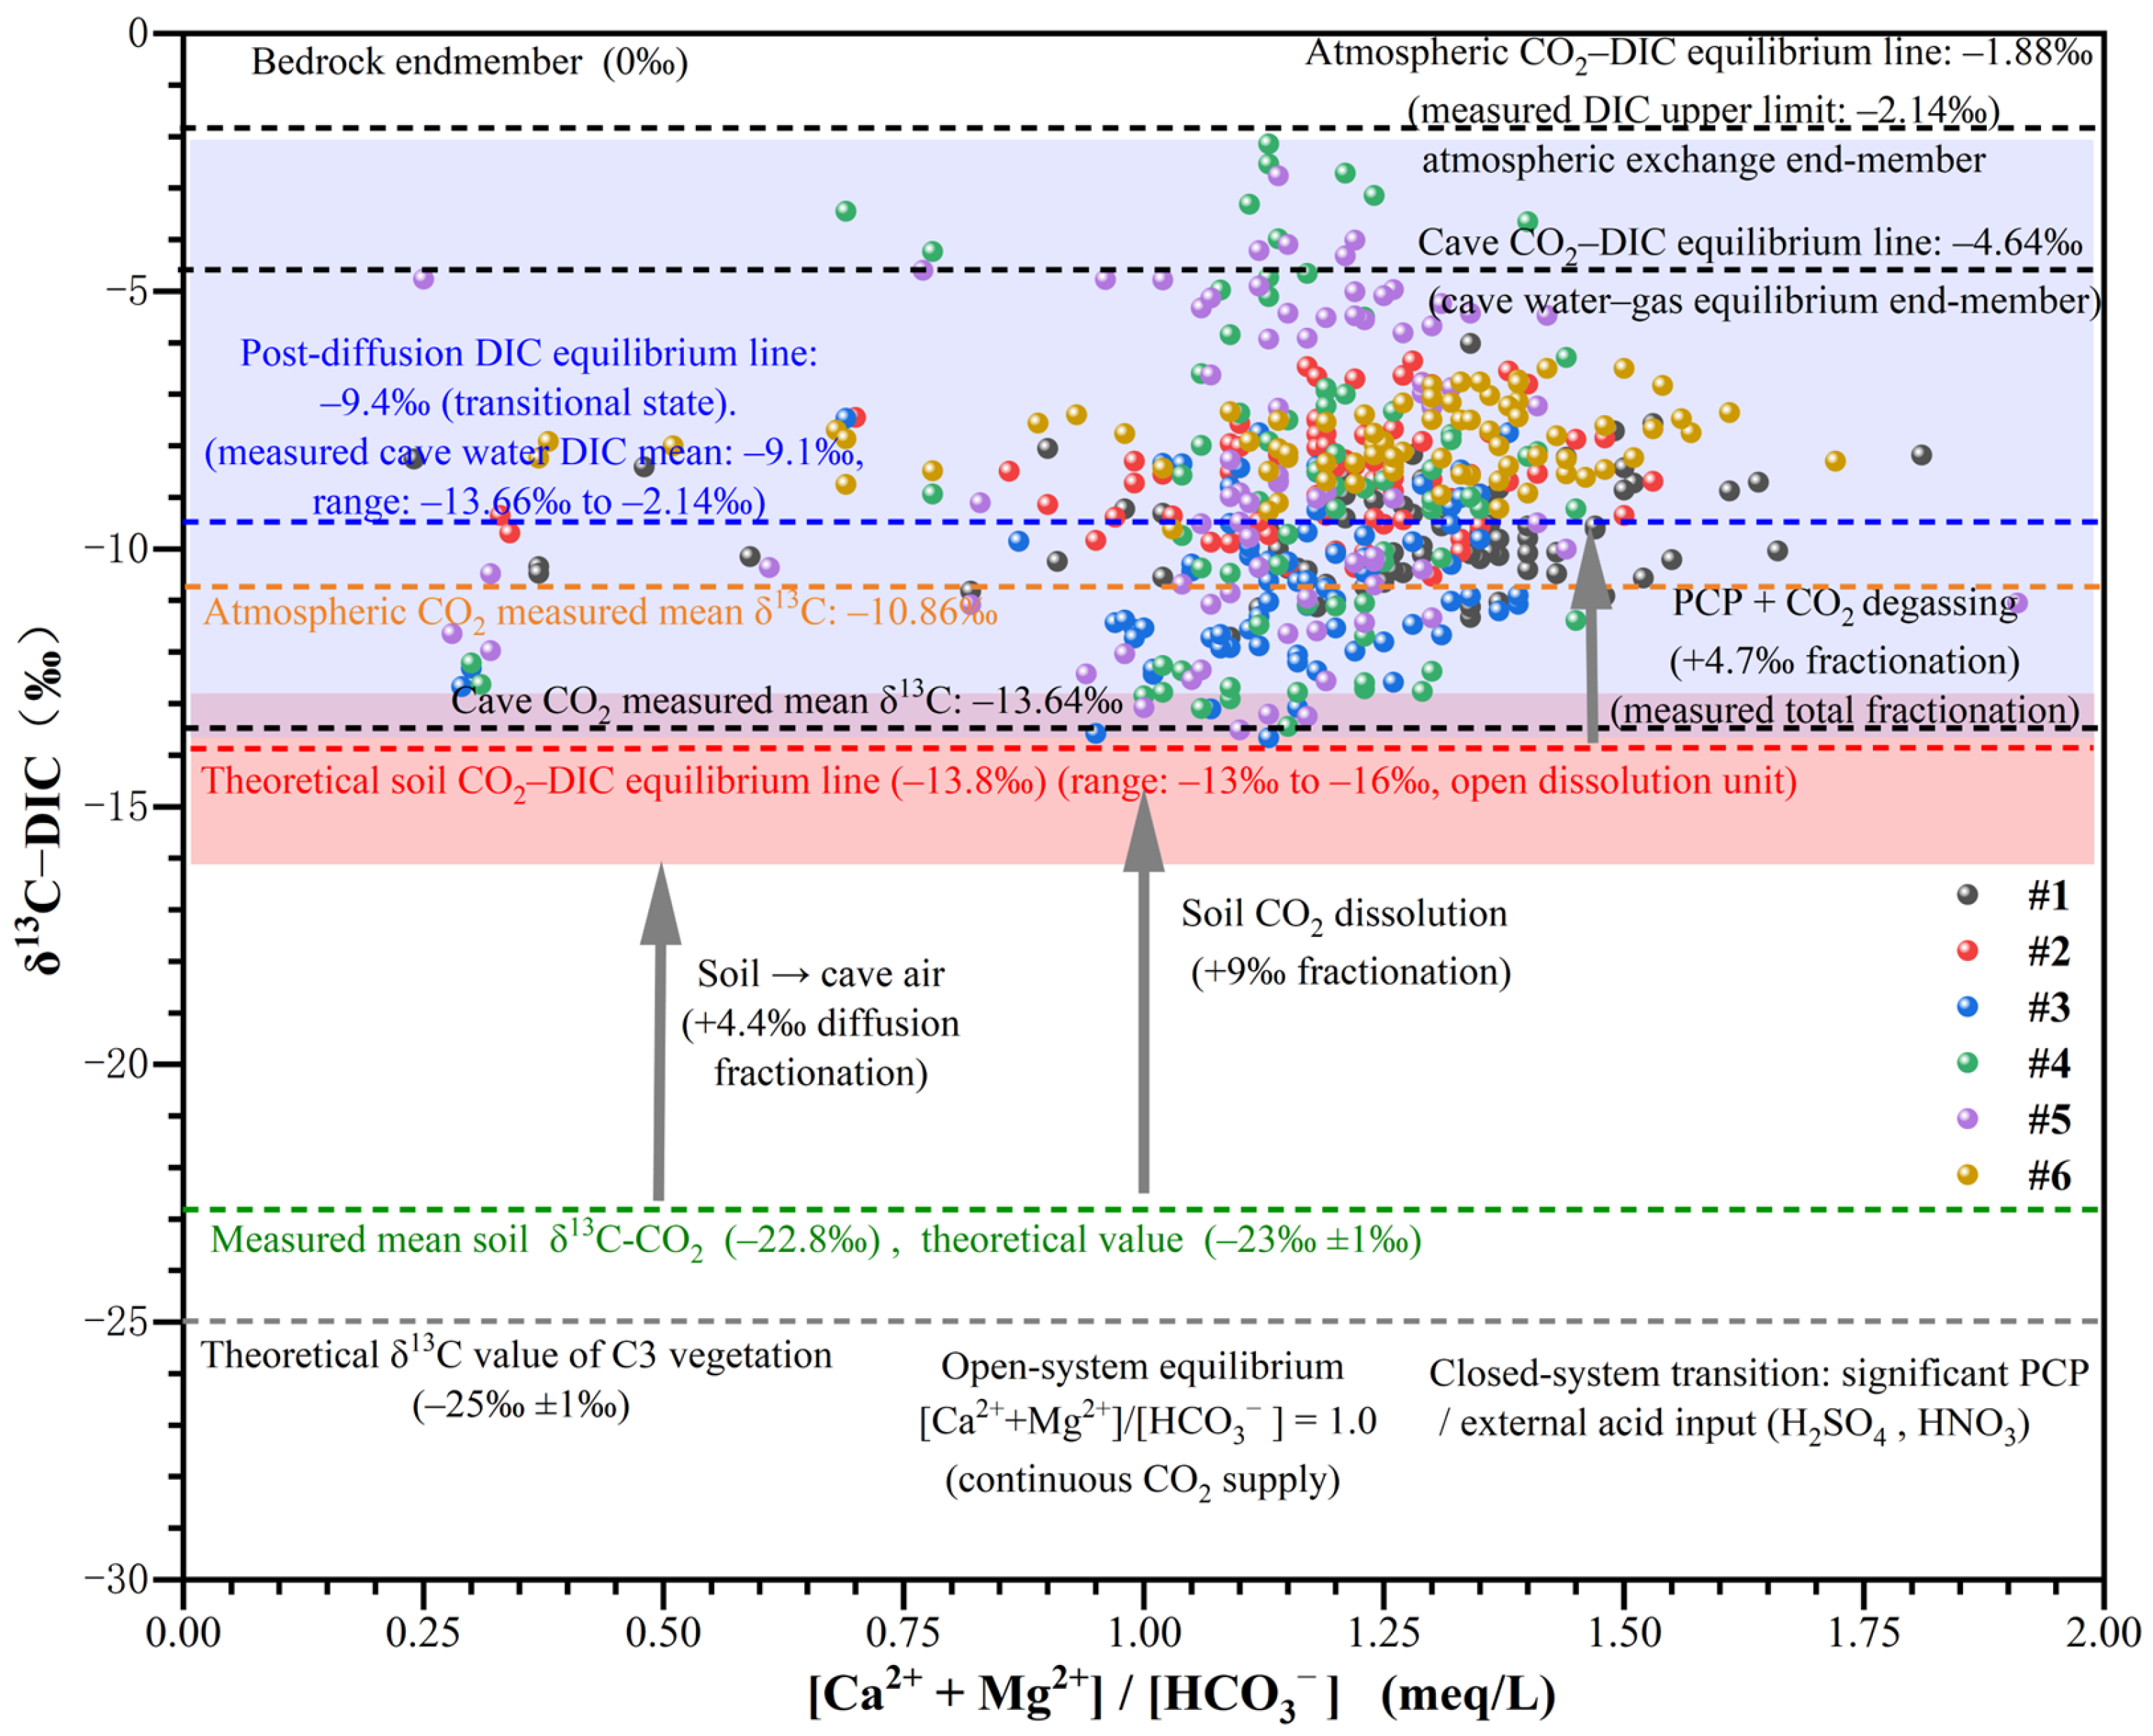
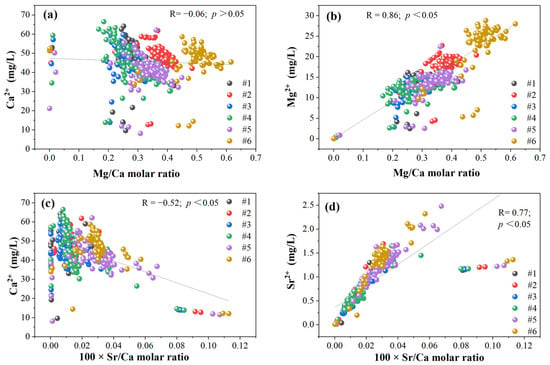
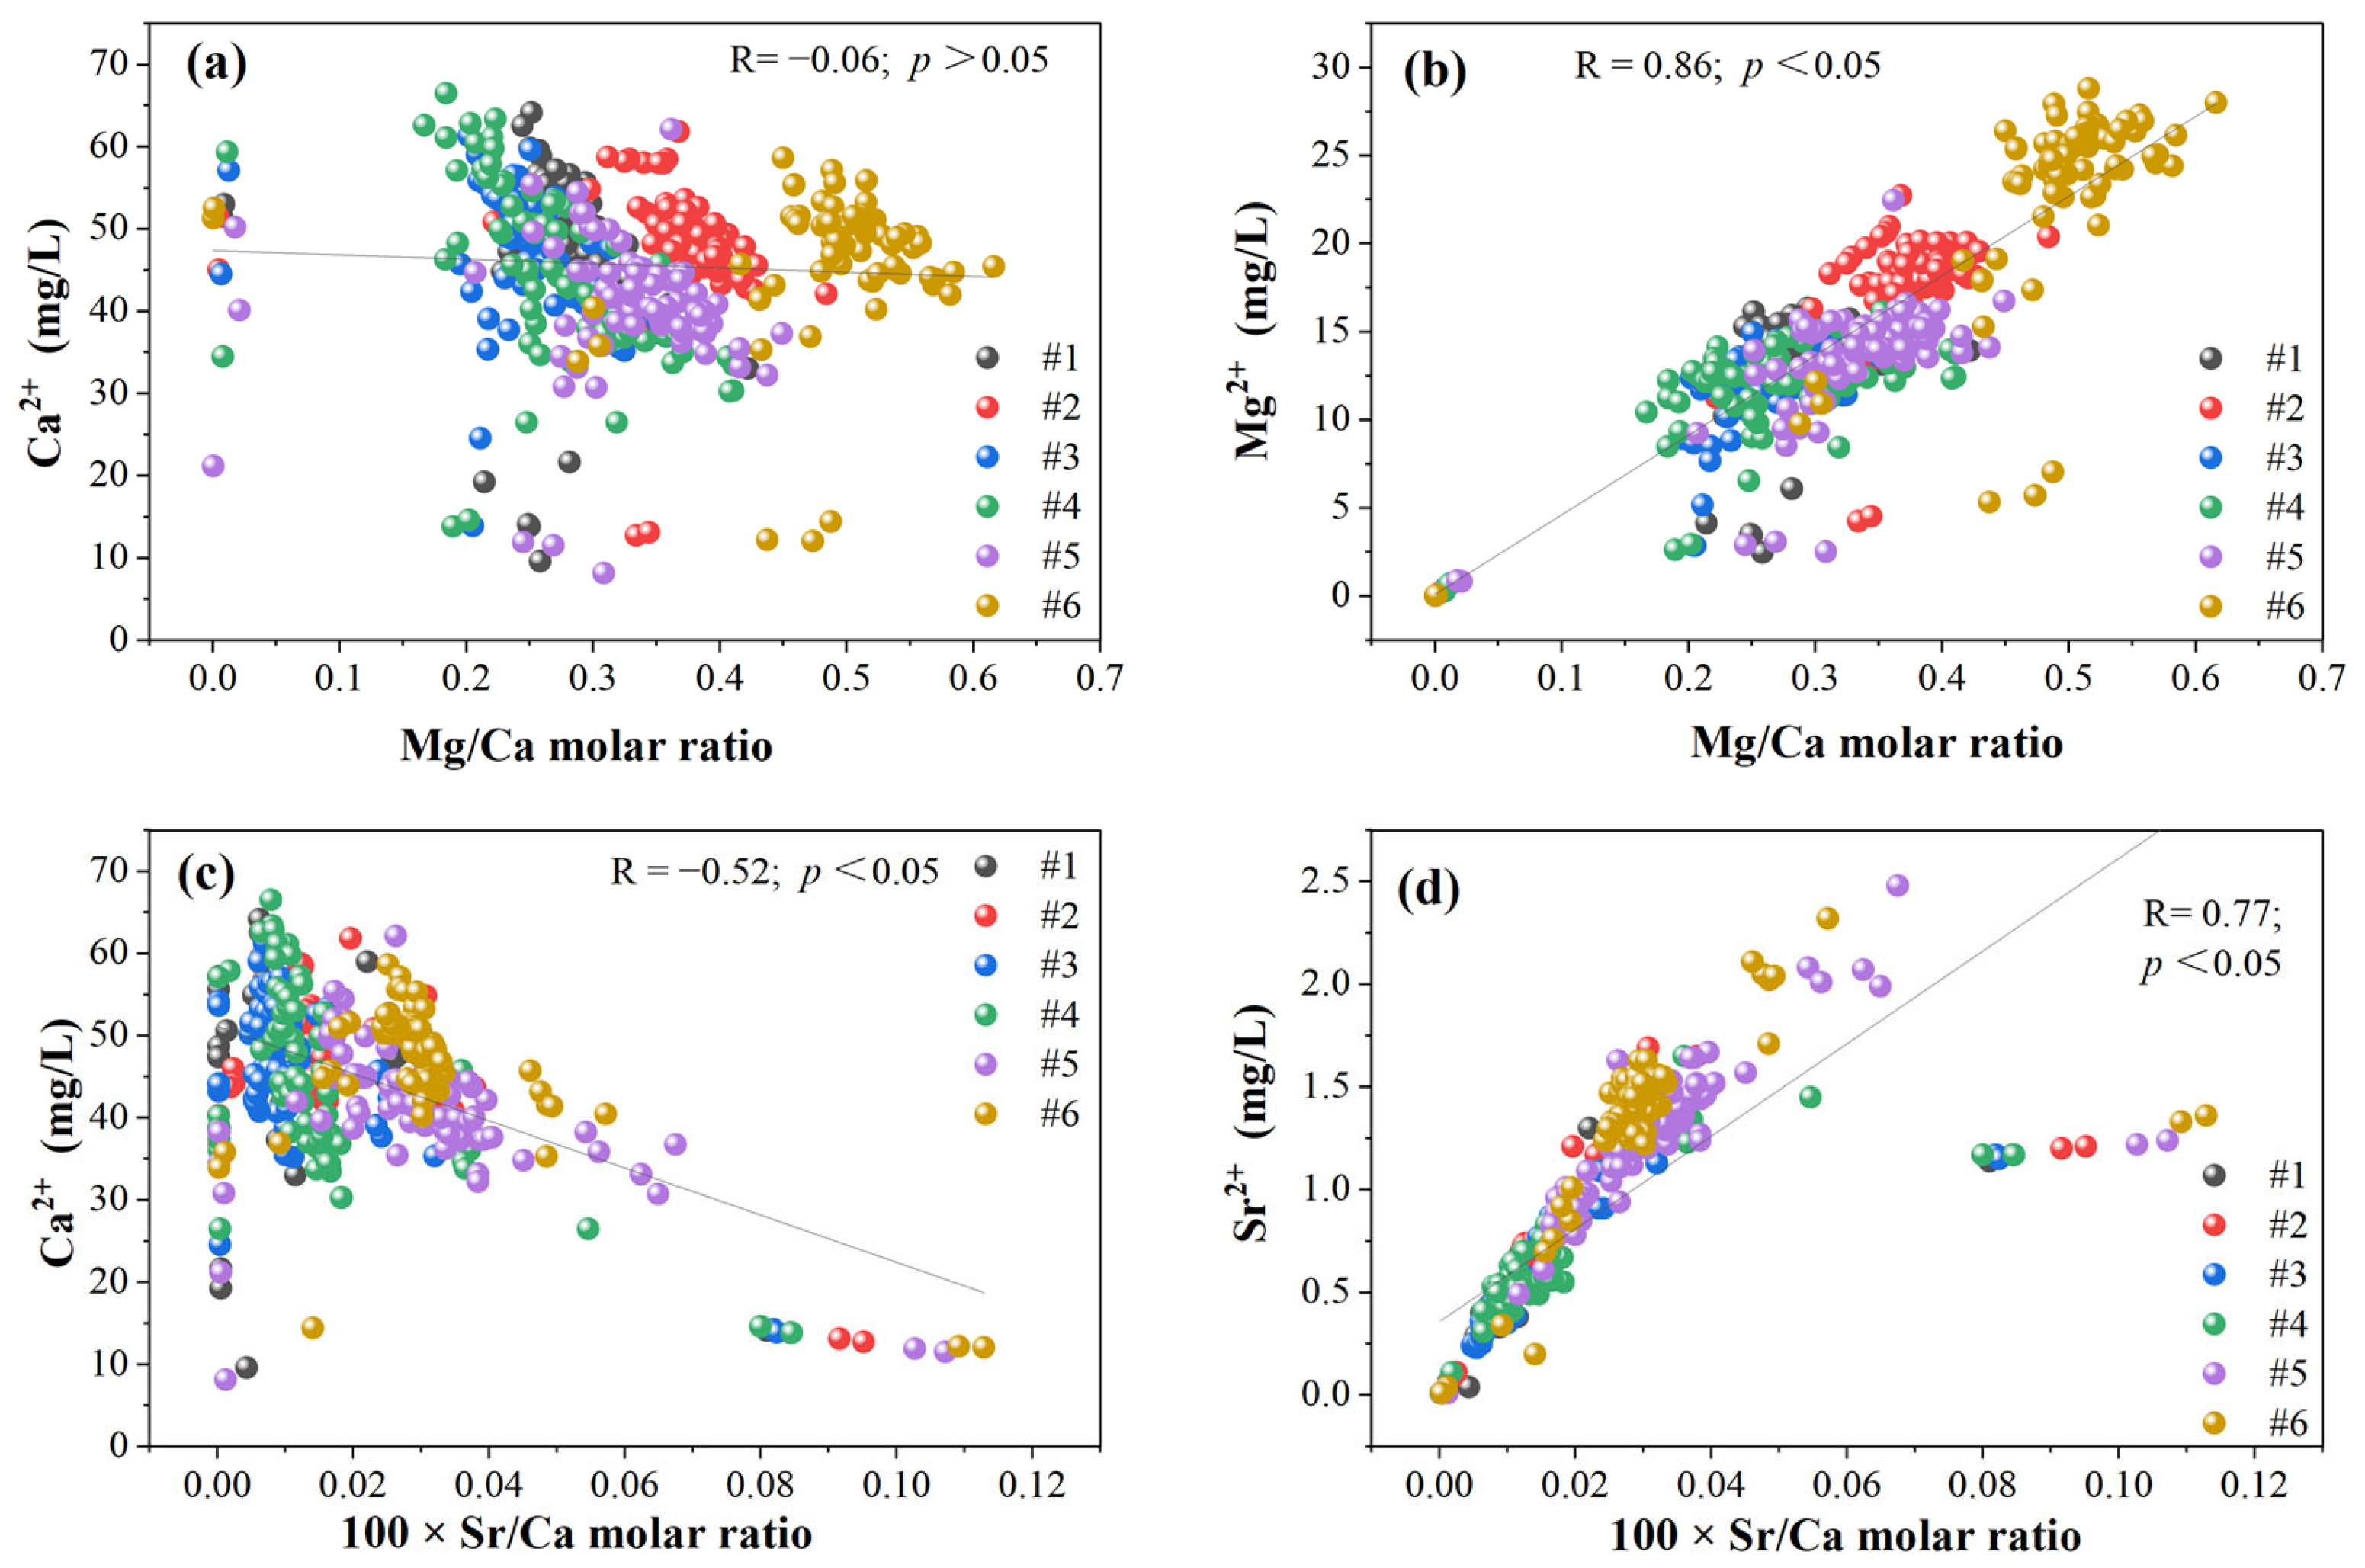
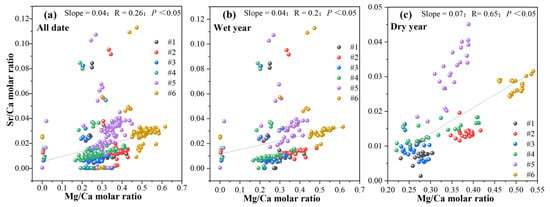
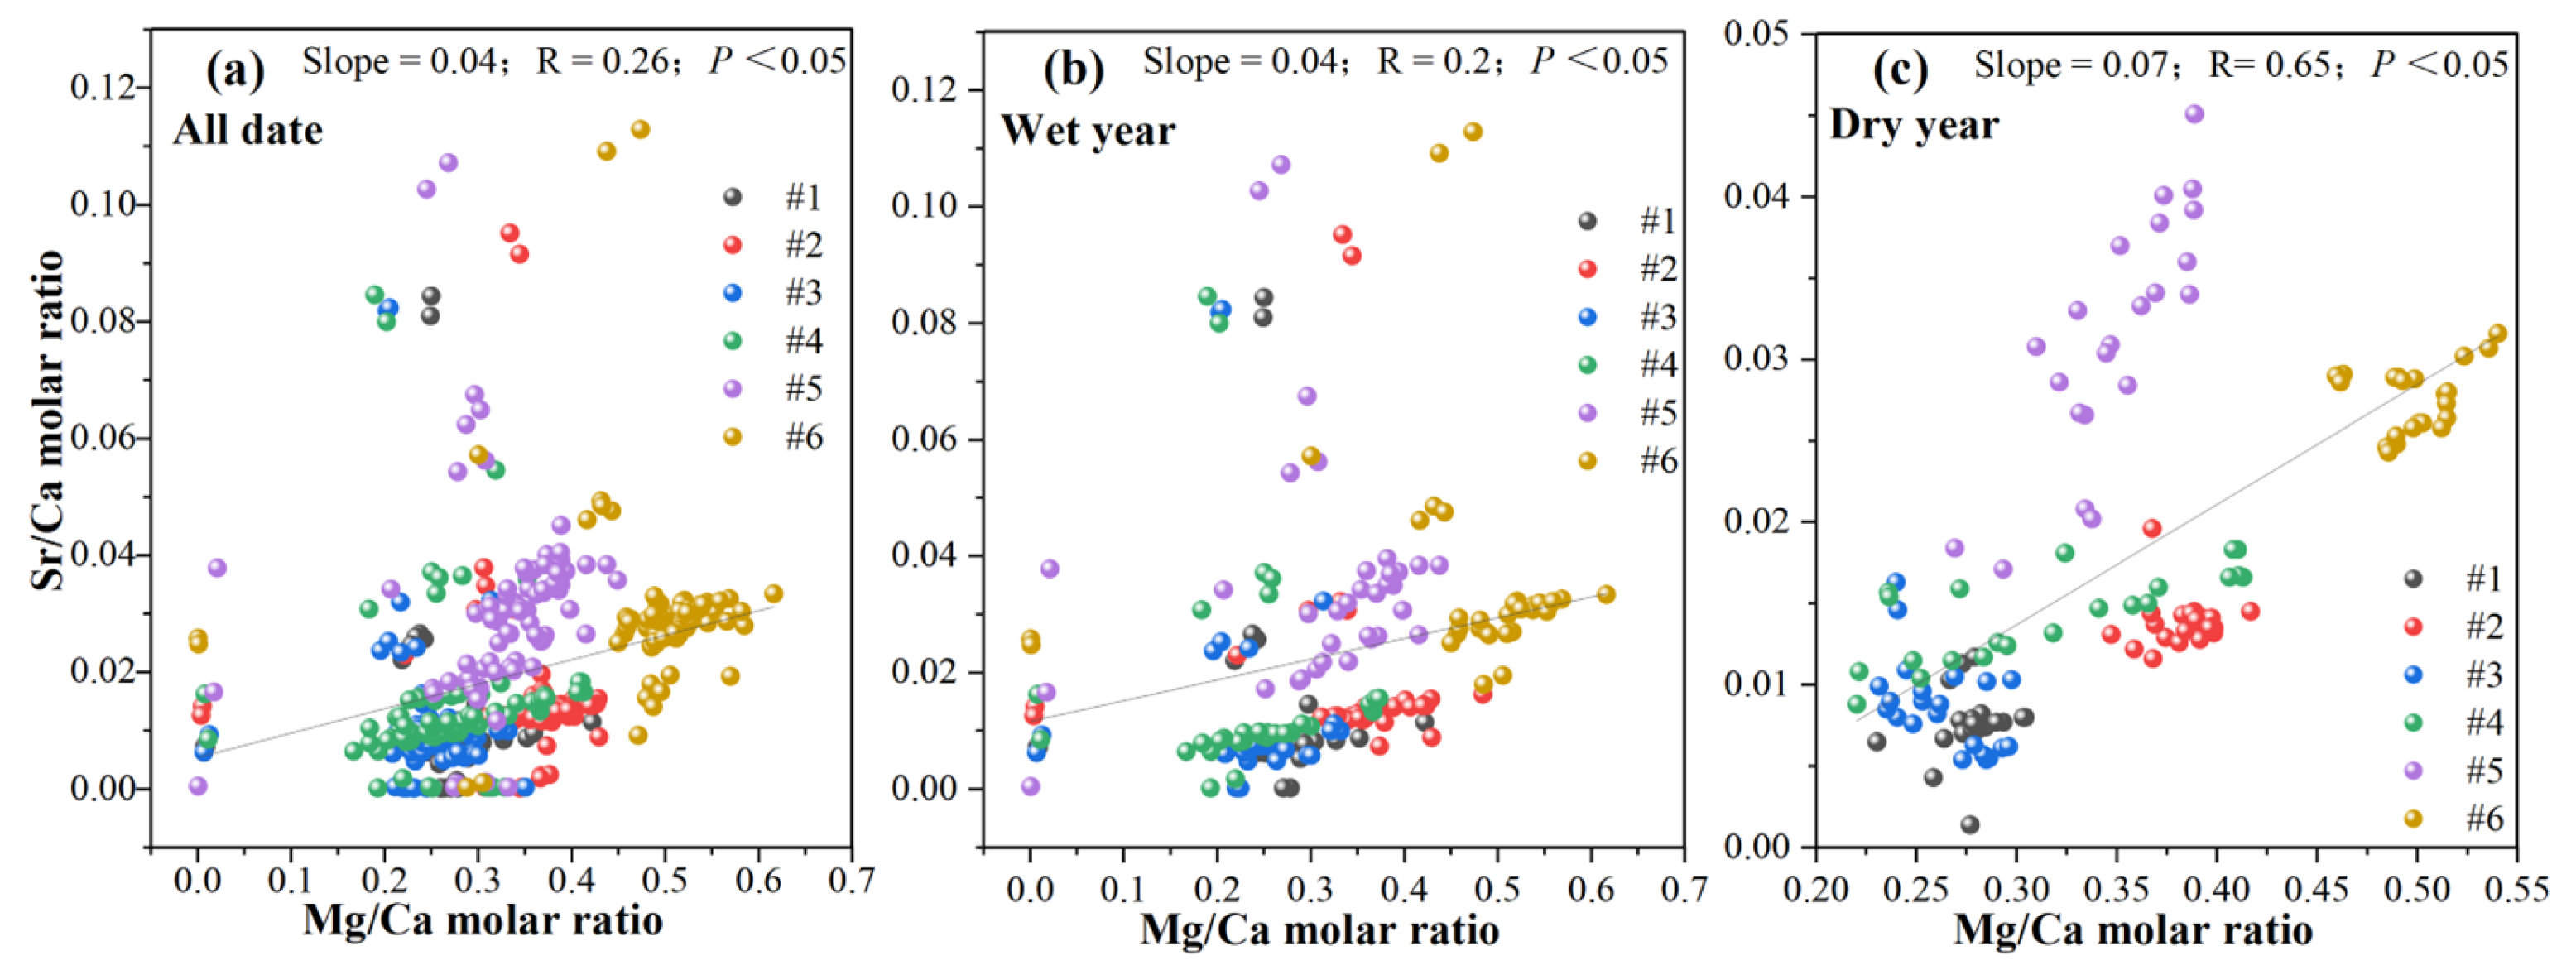
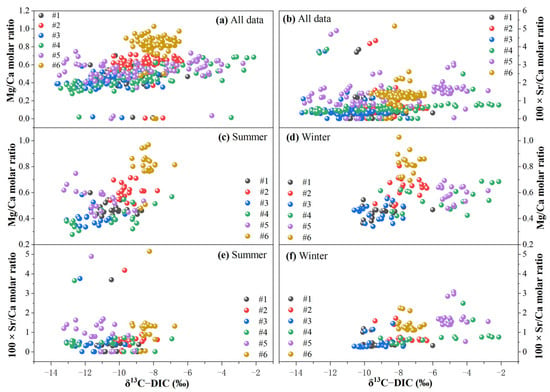
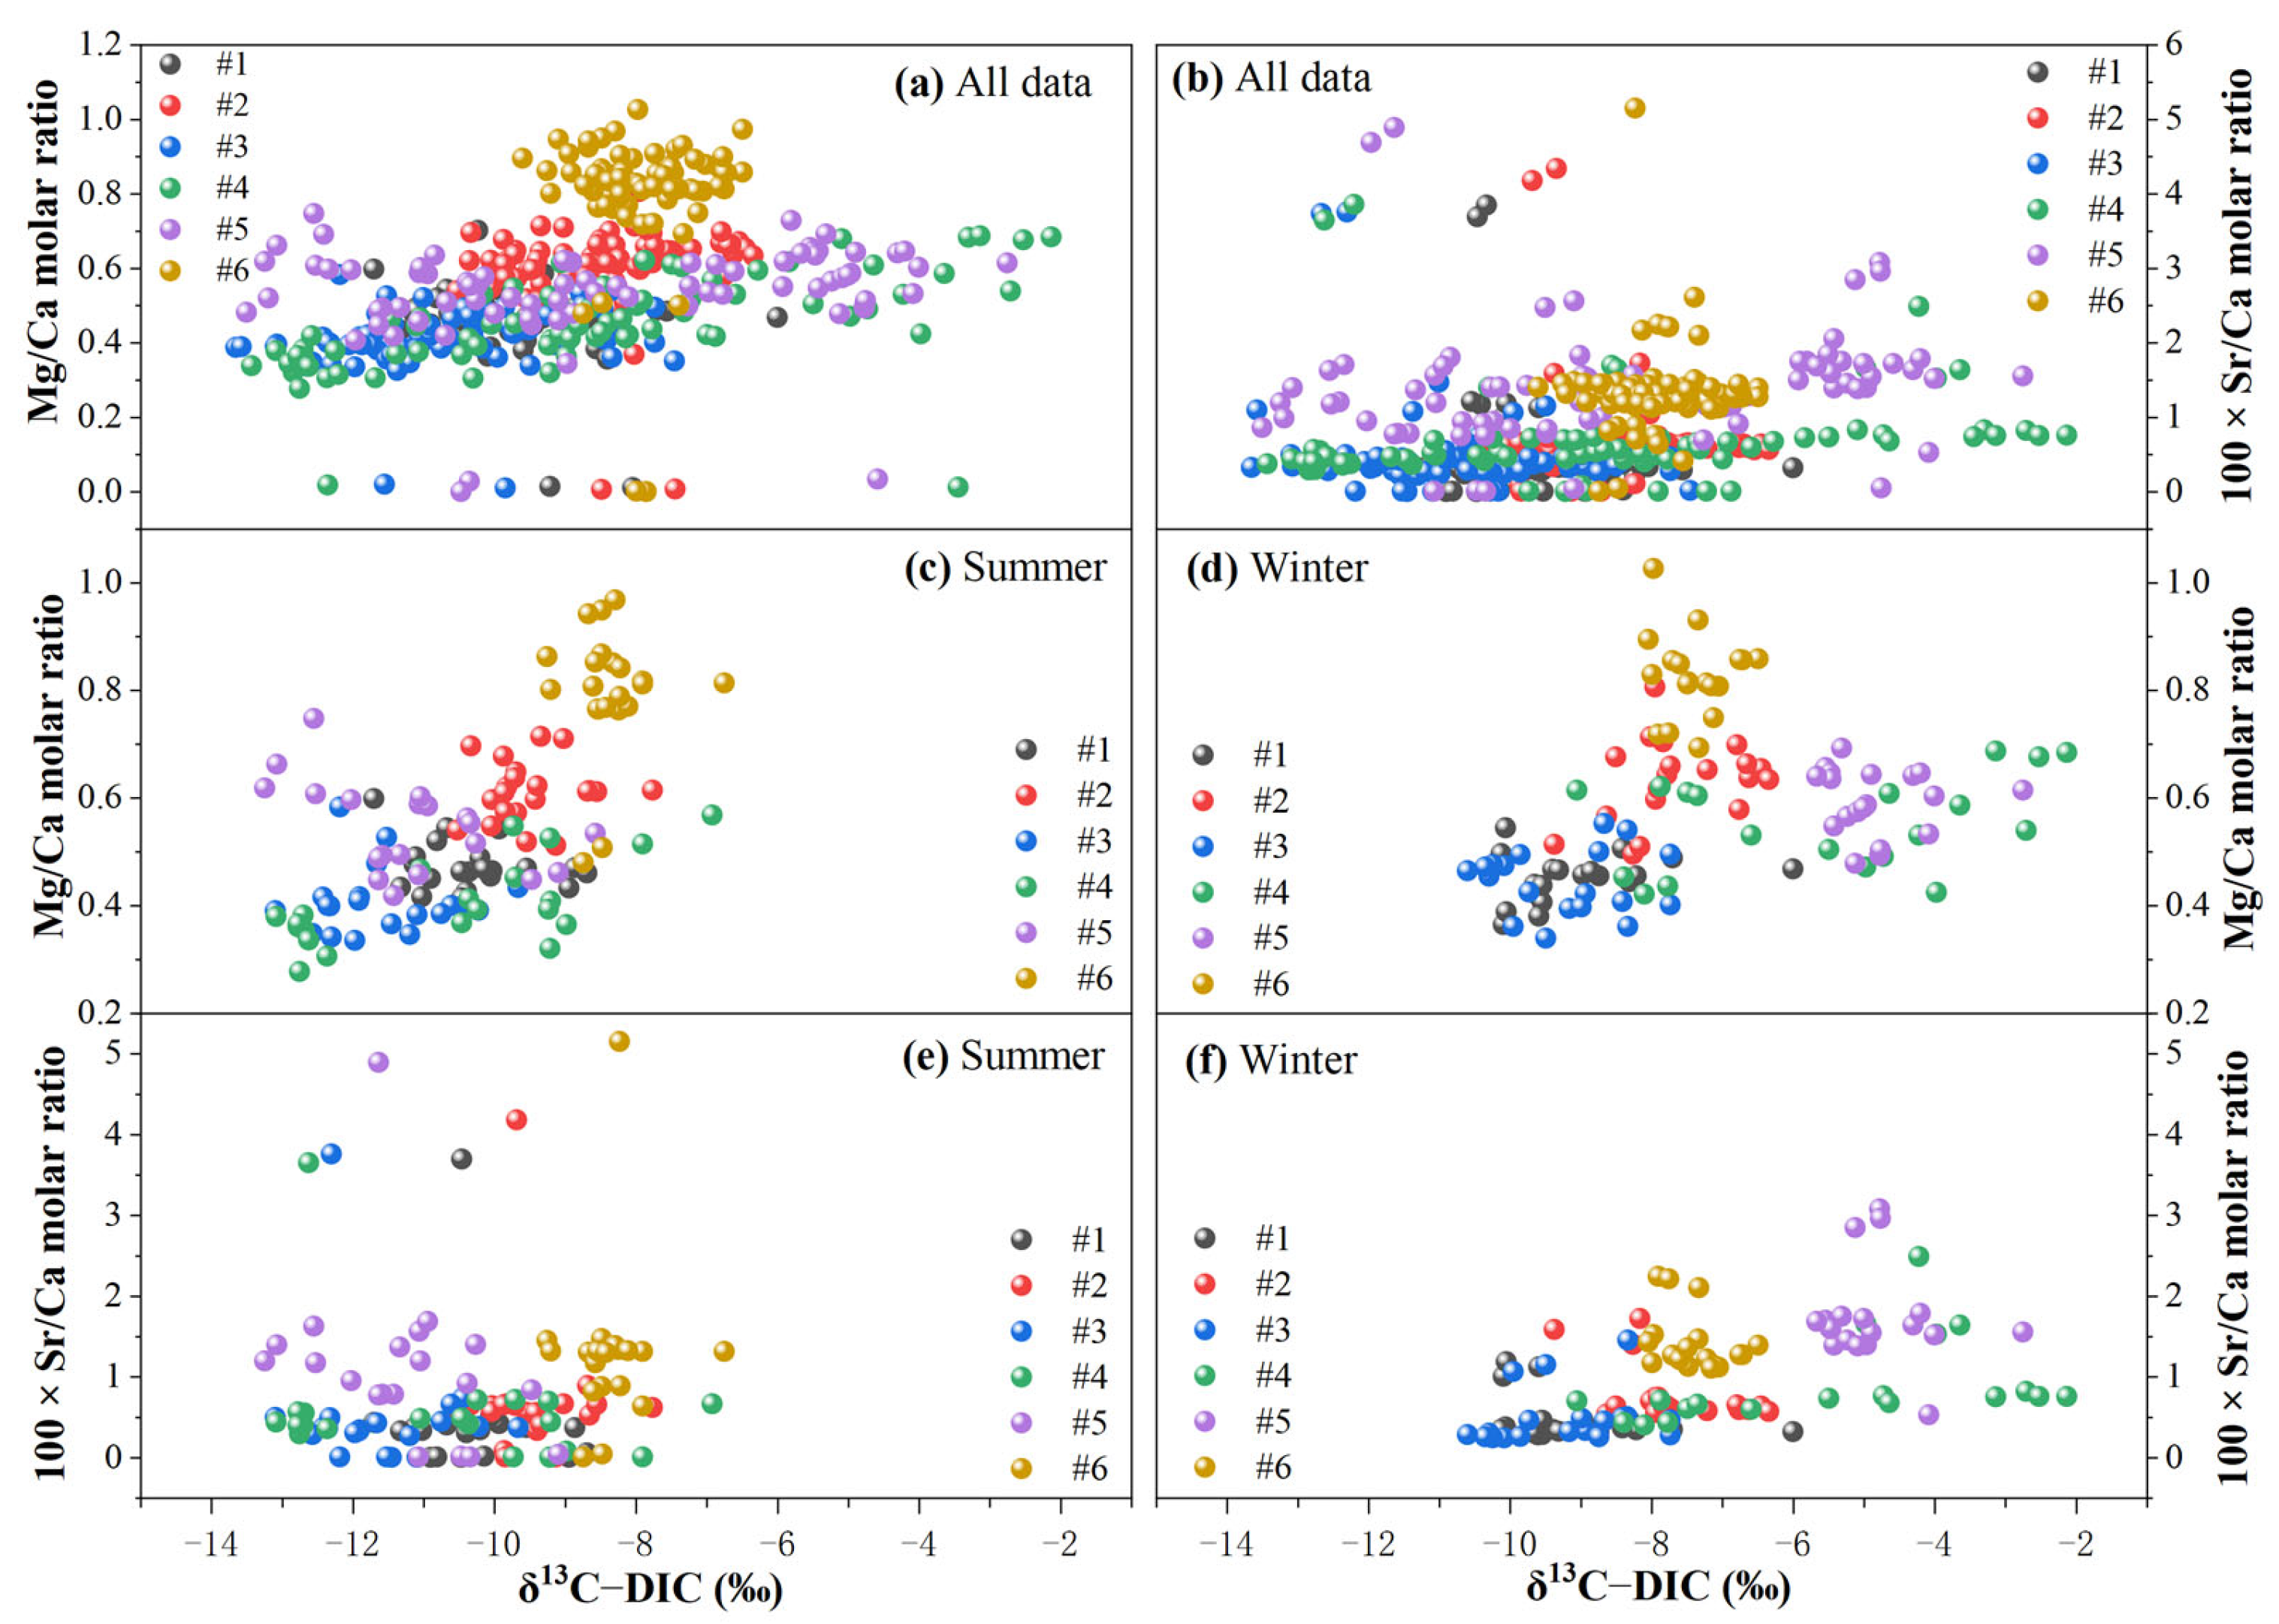
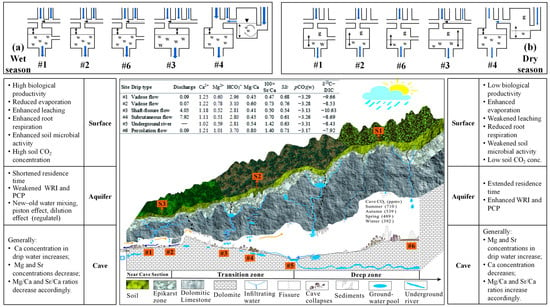
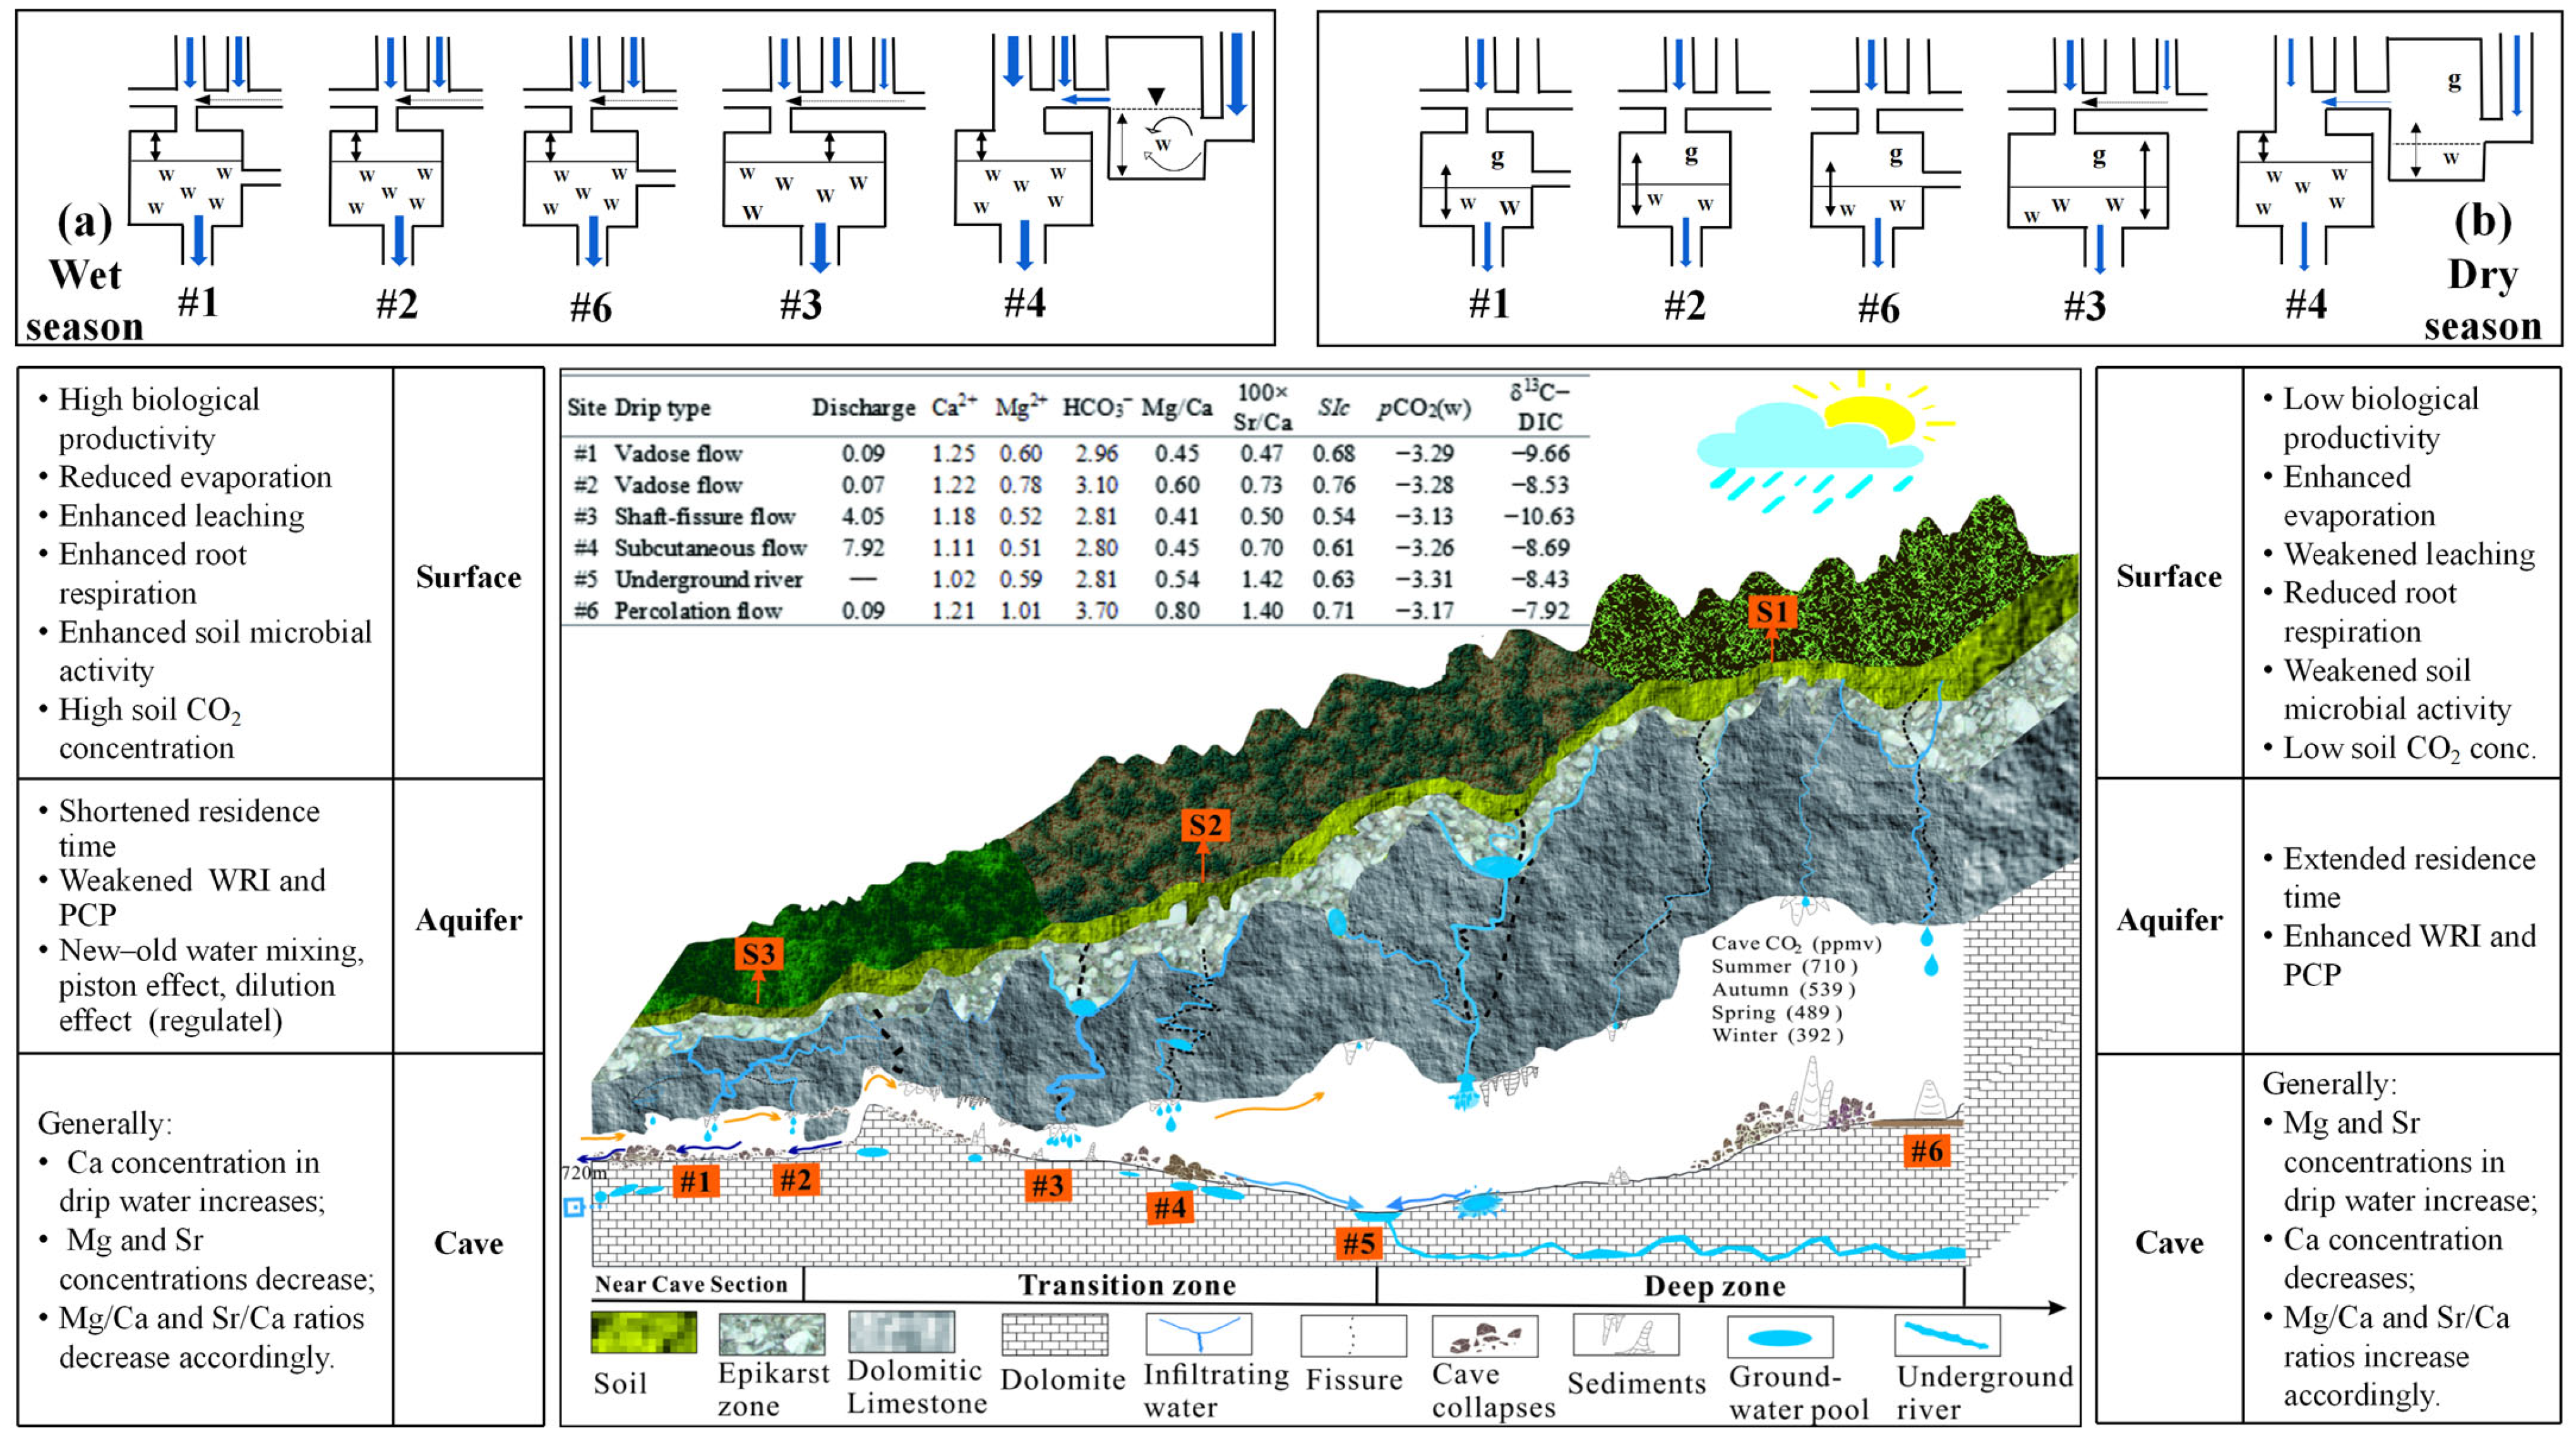

Disclaimer/Publisher’s Note: The statements, opinions and data contained in all publications are solely those of the individual author(s) and contributor(s) and not of MDPI and/or the editor(s). MDPI and/or the editor(s) disclaim responsibility for any injury to people or property resulting from any ideas, methods, instructions or products referred to in the content. |
© 2026 by the authors. Licensee MDPI, Basel, Switzerland. This article is an open access article distributed under the terms and conditions of the Creative Commons Attribution (CC BY) license.